quality of democracy: a comparative study - diva...
TRANSCRIPT

The first IPSA-ECPR Joint Conference; Whatever Happened to North-South?
Sao Paulo 2011-02-16 - 2011-02-19. Paper accepted by the panel: Challenges and Transformations in the
Qualities of Democracies: A Comparative Perspective I
Quality of Democracy: A Comparative Study
John Högström Department of Social Sciences,
Mid Sweden University, Östersund, Sweden [email protected]

Introduction A common view is that one of the main goals for countries should be to be democracies. However, countries should not be satisfied when they had achieved democratic status. One of the subsequent goals should be to establish a high degree of the quality of democracy. Of course this goal also applies to well establish democracies. For the legitimacy of a democratic system it can be seen that a high degree of quality of democracy is important, and a low degree of quality of democracy can be seen as a serious democratic problem. For example political participation through voting can be seen as a cornerstone in a democratic system. If voter turnout is low the legitimacy of the election and the democratic system can come into question. According to that, this study will compare and explain the variation of the quality of democracy in the stable democracies in the world.1 A total of four dimensions of the quality of democracy will be included; participation, competition, equality, and rule of law. An index will be constructed which includes those four dimensions of the quality of democracy. To explain the variation in the quality of democracy an explanatory model will be developed. The result from the study will answer if there are cultural factors, historical factors, political institutional factors, physical factors or socioeconomic factors or a mix of these factors which can explain the variation of the quality of democracy in the world’s democratic countries. Earlier research hadn’t agreed on one definition of the quality of democracy (see e.g. Altman and Pérez-Liñán 2002, Diamond and Morlino 2005, Lijphart 1999 and Stålfors 2008) and they hadn’t used the same dimensions and indicators when they had measured the quality of democracy. This is supported by Andreev (2005, 4) who stated that: “students of democracy have not been very rigorous when selecting and combining various indicators of how to measure the QoD.” On that basis it is difficult to compare the different research results concerning the quality of democracy when different definitions and measurements have been used in the various studies; also a limited number of countries had been included in previous research. This study will not focus on some particular democracies as for instance well-established democracies or democracies in some specific region. The study will focus on all stable democracies in the world. The main purpose of the present study should therefore be seen as seeking to provide a contribution to explaining the variation of the quality of democracy in the stable democracies in the world. However to fulfill the main purpose I will work with two sub purposes. The first is to develop an explanatory model for the quality of democracy. The second is to develop an index which measures the quality of democracy.
Theoretical Framework A number of researchers have previously discussed and measured the quality of democracy. However in this study I will not review previous findings concerning the quality of democracy. (For findings of previous research concerning the quality of democracy see for example the studies mentioned above.)
Defining the quality of democracy Of course, it is important to define the objective of the study. With regard to the definition of the quality of democracy earlier researchers had used different definitions of the object; some of these definitions are narrow where others are broader. For example Lijphart (1993, 149) defined the quality of democracy as: “The term “quality” refers to the degree to which a system meets such democratic norms as representativeness, accountability, equality and participation.” Diamond and Morlino (2005, xi) defined the quality of democracy as: “we
1 Stable democracies are defined as countries which have been democratic during a cohesive ten-year period.

consider a quality democracy to be one that provides its citizens a high degree of freedom, political equality, and popular control over public policies and policy makers through the legitimate and lawful functioning of stable institutions.” In this study quality of democracy is about legitimacy and democratic norms. Accordingly, in this study I define quality of democracy as: By quality of democracy is meant the level of legitimacy in a democratic system in factors of democratic norms as participation, competition, equality and rule of law. According to the definition, the quality of democracy can be seen as a measurement on how well or bad democratic countries perform in democratic norms.
A model for explaining the variation in the quality of democracy What can explain the variation in the quality of democracy? Earlier research in the field hadn’t used any joint explanatory model for explaining the variation in the quality of democracy. Therefore it is necessary to develop a theoretical model for explaining the variation in the quality of democracy. Because of the lack of an explanatory model for explaining the variation in the quality of democracy I will depart from explanatory models which have previously been used in research concerning democratization, democratic performance, models of democracy and public policy when I develop an explanatory model for the quality of democracy. Roller (2005, 79) presented an explanatory model for comparative research on democracy. The model was developed from three studies on comparative research on democracy; Powell (1982), Putnam (1993) and Lijphart (1999). Figure 1.1 shows the explanatory model.
The explanatory model consists of socio-economic modernity, political institutions, and socio-cultural factors. Roller (2005, 78-80) concluded that the arrangement of democratic institutions was of central importance. This was also found in Powell (1982), Putnam (1993) and Lijpharts (1999) studies. However in Putnam (1993) socio-economic and socio-cultural factors were also considered important and central for the political performance. I found it relevant to depart from Rollers explanatory model on political performance when I develop the explanatory model for the quality of democracy. However I will make some changes compared with Rollers model, and for example I will add in more factors to the explanatory model for the quality of democracy. Below follows a discussion and a presentation regarding the explanatory model for the quality of democracy.
Political institution factors As previously mentioned some earlier research concerning models of democracy and democratic performance had departed from political institutions. For example Arend Lijphart (1999) departs from institutions when he characterized the two different models of democracies; consensus democracies and majoritarian democracies. Lijphart used two
3
4
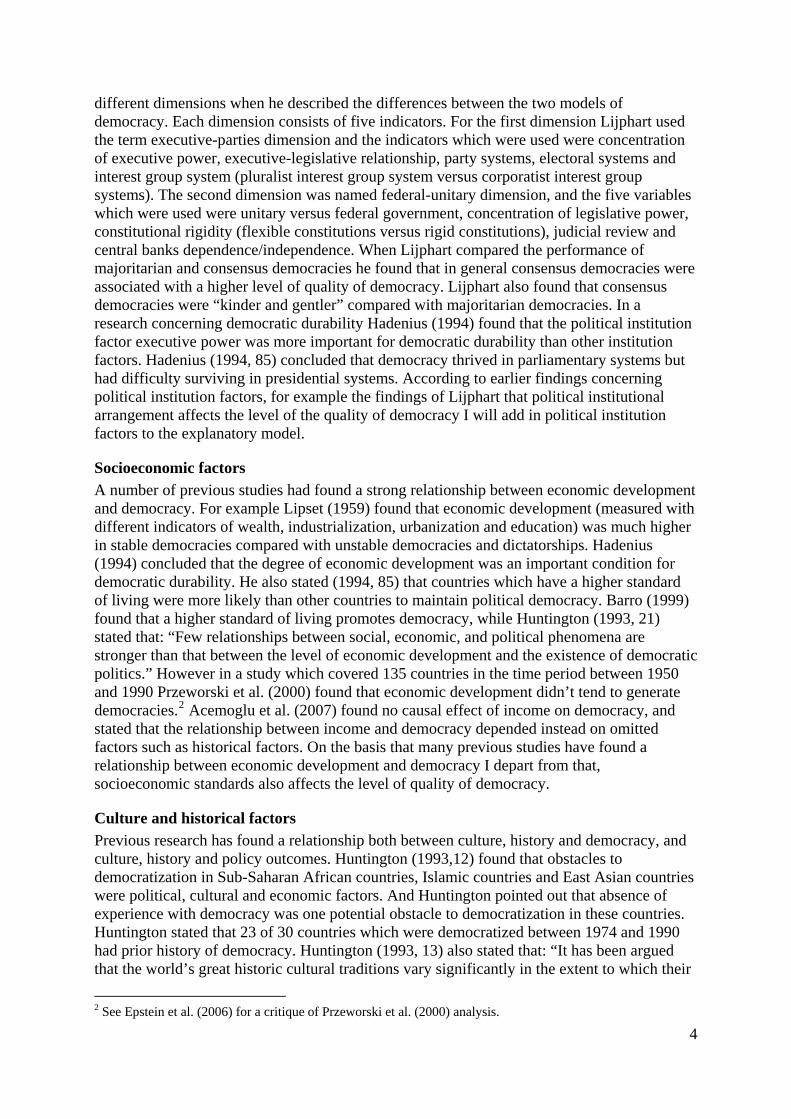
different dimensions when he described the differences between the two models of democracy. Each dimension consists of five indicators. For the first dimension Lijphart used the term executive-parties dimension and the indicators which were used were concentration of executive power, executive-legislative relationship, party systems, electoral systems and interest group system (pluralist interest group system versus corporatist interest group systems). The second dimension was named federal-unitary dimension, and the five variables which were used were unitary versus federal government, concentration of legislative power, constitutional rigidity (flexible constitutions versus rigid constitutions), judicial review and central banks dependence/independence. When Lijphart compared the performance of majoritarian and consensus democracies he found that in general consensus democracies were associated with a higher level of quality of democracy. Lijphart also found that consensus democracies were “kinder and gentler” compared with majoritarian democracies. In a research concerning democratic durability Hadenius (1994) found that the political institution factor executive power was more important for democratic durability than other institution factors. Hadenius (1994, 85) concluded that democracy thrived in parliamentary systems but had difficulty surviving in presidential systems. According to earlier findings concerning political institution factors, for example the findings of Lijphart that political institutional arrangement affects the level of the quality of democracy I will add in political institution factors to the explanatory model.
Socioeconomic factors A number of previous studies had found a strong relationship between economic development and democracy. For example Lipset (1959) found that economic development (measured with different indicators of wealth, industrialization, urbanization and education) was much higher in stable democracies compared with unstable democracies and dictatorships. Hadenius (1994) concluded that the degree of economic development was an important condition for democratic durability. He also stated (1994, 85) that countries which have a higher standard of living were more likely than other countries to maintain political democracy. Barro (1999) found that a higher standard of living promotes democracy, while Huntington (1993, 21) stated that: “Few relationships between social, economic, and political phenomena are stronger than that between the level of economic development and the existence of democratic politics.” However in a study which covered 135 countries in the time period between 1950 and 1990 Przeworski et al. (2000) found that economic development didn’t tend to generate democracies.2 Acemoglu et al. (2007) found no causal effect of income on democracy, and stated that the relationship between income and democracy depended instead on omitted factors such as historical factors. On the basis that many previous studies have found a relationship between economic development and democracy I depart from that, socioeconomic standards also affects the level of quality of democracy.
Culture and historical factors Previous research has found a relationship both between culture, history and democracy, and culture, history and policy outcomes. Huntington (1993,12) found that obstacles to democratization in Sub-Saharan African countries, Islamic countries and East Asian countries were political, cultural and economic factors. And Huntington pointed out that absence of experience with democracy was one potential obstacle to democratization in these countries. Huntington stated that 23 of 30 countries which were democratized between 1974 and 1990 had prior history of democracy. Huntington (1993, 13) also stated that: “It has been argued that the world’s great historic cultural traditions vary significantly in the extent to which their
2 See Epstein et al. (2006) for a critique of Przeworski et al. (2000) analysis.

5
attitudes, values, beliefs, and related behavior patterns are conducive to the development of democracy.” Castles (1993) stated that factors such as culture and history are important when explaining the variation in policy outcomes. When Castles (1993) and others explored the pattern of policy outcomes in 18 Western democracies they identified different types of families of nations. Castles (1993, 329) idea behind the concept families of nations was that nations should not be treated as single cases in comparative research, but instead as a part of patterned interrelationships of families of nations. The concept families of nations was defined in terms of shared geographical, linguistic, cultural and/or historical attributes leading to distinctive patterns of public policy outcomes (Castles 1993, xiii). Castles (1993) identified five different families of nations in the Western democracies; English-speaking family, Scandinavian family, Continental Western European family, Southern European family, and the special cases Switzerland and Japan in a fifth group of family. These five families of nations were showed to have different policy outcomes. When Roller examined the effectiveness of Western Democracies in policy areas (fourteen indicators) she grouped the countries as Castles (1993, 1998a) proposes, into five families of nations. Roller (2005, 194) found statistically significant evidence that there were differences between families of nations regarding policy outcomes. Roller (2005, 218) concluded that: “Since this “families of nations” concept is primarily a proxy for cultural differences, one can draw the conclusion that cultural differences that influence politicians, citizens, policies, and political institutions, play a central role in questions of performance.” Some earlier research had suggested that religion is an important determinant of democracy, indeed Huntington (1993, 4) concluded that there had been a strong association between religion and democratization. Huntington found that most of the Protestant countries in the world had already become democracies in the early 1970s. Later on, in the third wave of democratization (1970s-1980s) many Catholic countries became democracies and Catholic countries such as Portugal, Spain, Mexico, Chile, Poland and Hungary went on to become democracies (Huntington 1993, 4). Barro (1999) found a negative relationship between democracy and Muslim and non-religious countries even when he controlled for the standard of living. Hadenius (1992) found that Christianity and Protestantism had a positive effect on the level of democracy. The result was still statistically significant even when Hadenius controlled for socioeconomic factors. Concerning eventual diffusion effects on democracy and democratization (the level of democracy in one country interacts with the neighboring countries level of democracy); Huntington (1993, 7) concluded that there had been a snowballing effect of democratization. Huntington stated that, in the early 1990s in Eastern Europe there was a snowballing effect of democratization. Also Teorell (2010, 99) found that neighbor diffusion was related to democratization. According to the observations mentioned above it can be seen as relevant to investigate if culture and history also affects the level of the quality of democracy.
Physical factors In the book Size and Democracy (1973) the authors Dahl and Tufte raised the question: “is “democracy” related in any way to “size”?” In general Dahl and Tufte found no empirical support that democracy was related to size and they (Dahl and Tufte, 1973, 138) concluded that: “No single type or size of unit is optimal for achieving the twin goals of citizen effectiveness and system capacity.” However, Diamond (1999) found that small countries were to a higher extent democracies than larger countries. For example; when the third wave of democratization began in 1974 about half of the very small countries (with a population of less than a million) were democracies, whereas in the same time period only 23% of the larger countries were democracies (Diamond 1999, 117). Diamond (1999) also found that in the beginning of 1998 close to 75% of the small countries were formally democracies compared

with less than 60% of the larger countries. Anckar (2008) investigated the impact of physical variables on the degree of democracy. In bivariate regressions Anckar found that the degree of democracy was higher in smaller countries than in larger countries. However when Anckar (2008, 454) controlled for other variables he found that the explanatory values of physical factors were clearly outweighed by socioeconomic development and religion.3 Especially influenced by Dahl and Tufte I will investigate if the quality of democracy is related in any way to size. According to that I add in physical factors in the explanatory model. From the observations mentioned above the explanatory model for explaining the variation in the quality of democracy has been developed.
As Figure 1.2 shows the independent variables I will use in the research consist of five sets of variables: political institutions variables, socioeconomic variables, historical variables, cultural variables and physical variables. From the explanatory model shown above five related hypotheses are drawn. The hypotheses I suggest are as follows: H1: Political institutional factors affect the level of the quality of democracy H2: Socioeconomic factors affect the level of the quality of democracy H3: Historical factors affect the level of the quality of democracy H4: Cultural factors affect the level of the quality of democracy H5: Physical factors affect the level of the quality of democracy The hypotheses will be tested through quantitative empirical analyses. Considerations will be taken into account for both explanatory power and level of significance when the hypotheses are confirmed or rejected. According to the first sub purpose of this study which was to develop an explanatory model for the quality of democracy this can’t be seen as fulfilled before the theoretical explanatory model is tested with empirical analyses.
Methodological Framework
Measuring democracy in this study From my point of view a negative aspect with an approach which uses a limited number of democratic countries (cases) is that the result can’t be generalized to all kinds of democracies in the world. For example if the study only included OECD countries it can’t be used to
6
3 For a further discussion concerning size and democracy see for example Anckar, D 2004, 2010, Hadenius 1992 and Teorell 2010.

7
measure the effect for economic development on quality of democracy. In this research my ambition is to include as many democracies as possible, and for example not to include only industrialized democracies. A decision has to be taken concerning which countries in the world are democracies and which countries are not. There exist several different indexes which measure democracy; for example Freedom House, Polity IV and the Economist Intelligence Unit´s index of democracy.4 From earlier research (for example Hadenius and Teorell (2005) and Munck and Verkuilen (2002)) it can be concluded that all democracy indexes have some weaknesses. Since this study will deal with all stable democracies in the world it is important that the democracy index which will be used will include countries with a small population (microstates). It is also important that the index which will be used in this study has been being produced for a long period of time.5 After comparing different democracy indexes I have found Freedom House index to be the index which fulfils the criteria mentioned above in the best way. According to that I’ve decided to use Freedom House index for classifying countries as democracies or not, and for classifying countries as old or new democracies.
Selection of cases and methodological considerations In this research I will use Freedom House definition of a free country as a definition for democracy. The definition is as follows: “A free country is one where there is broad scope for open political competition, a climate of respect for civil liberties, significant independent civic life, and independent media.” According to that Freedom House definition for free countries is used for rating the world's countries as democracies or non-democracies. Thus, countries are classified as democracies if they are rated as free by Freedom House index, and as non-democratic if they are rated as partly free or not free by Freedom House. Freedom House survey which covers 2009 (Freedom in the World 2010), 89 of 194 countries are rated as free countries. Accordingly, these countries should be included in this study; however I demarcate my selection to include those nations that are stable democracies that have been democratic during a cohesive ten-year period until 2009, in other words democratic continuously since 2000 or earlier. That means that the study can consist of a total of 84 countries. However, in total only 77 of the 84 countries which could be included in this research have values for all four dimensions of the quality of democracy. Therefore the index construction is based on these 77 countries.6
4 See Hadenius and Teorell (2005) and Munck and Verkuilen (2002) for a detailed discussion and comparison concerning different democracy indexes. See Bollen (1990) for a discussion concerning conceptual and measurement problems with measures of democracy. 5 This is to control countries democratic status over the ten past years, and for the operationalisation of the independent variable old-new democracies. 6 Freedom House annual surveys of countries' democratic status are used for controlling countries' democratic status over the past ten years. The following 10 democratic countries didn’t pass the demarcation (in brackets the year since countries continuously were rated as free): Antigua and Barbuda (2004), Argentina (2003), Brazil (2002), Guyana (2006), Indonesia (2005), Peru (2001), Serbia (2003), Trinidad and Tobago (2005), Ukraine (2005) and Montenegro (2009). Accordingly, when this demarcation is used, the survey consists of 79 democratic countries. However there are some borderline cases: Argentina, Brazil, Lesotho, Peru and Serbia. Argentina slipped from free to partly free in Freedom House surveys cover 2002 and 2003. Freedom House score on political rights and civil liberties for Argentina were 3-3 for both 2002 and 2003. Accordingly close to be rated as free (average 2.5). Both before and afterward Argentina was rated as free. Brazil had been rated as free since 2002. Brazil were rated as partly free in 2001 (3, 3) and 2000 (3, 3). Peru had been rated as free continuously since 2001. Peru was rated as partly free in 2000 (3, 3). Serbia is a difficult case. Serbia was before 2003 named Yugoslavia (former Yugoslavia). In 2000 (4, 4) and 2001 (3, 3) Yugoslavia was rated as partly free. In 2002 Yugoslavia was rated as free. From 2003 to 2006 the country was named Serbia and Montenegro and was rated as free from 2003 to 2006. In June 2006 Montenegro was an independent state and after Montenegro was made an independent state Serbia has been rated as free (2006-2009). Lesotho had been rated as free

Dimensions of the quality of democracy In this study I will work with four dimensions of the quality of democracy. These four dimensions are measured with a total of five indicators. Figure 1.3 shows an overview of the dimensions and indicators which are included in this study.
At the top of Figure 1.3 the four dimensions of the quality of democracy are shown, and below them the indicators which measure the different dimensions are shown. As Figure 1.3 shows the political participation dimension is measured with the indicator voter turnout. Political participation through voting can be seen as a cornerstone in a democratic system. If voter turnout is low the legitimacy of the election can come into question. A low voter turnout may also indicate a lack of political participation of certain groups of people. Accordingly voter turnout can be seen as a very important indicator of the quality of democracy. The second dimension political competition is measured by party competition. In the book The Global Resurgence of Democracy Diamond stated (1993, 96) that: “Democracy is, by its nature, a system of institutionalized competition for power. Without competition and conflict, there is no democracy.” Altman and Pérez-Liñán (2002) stated that effective competition is one of the key dimensions of the quality of democracy. Competition between parties can be seen as a cornerstone in a democratic system and a weak opposition can be seen as a democratic problem. According to these examples political competition can be seen as a very important indicator of the quality of democracy. The equality dimension is measured with two indicators; one elected body and one unelected body. The motivation for measuring the equality dimension with one elected body and one unelected body is that it is interesting to investigate if the people, the political parties (which elect the parliaments members) as well as the political leaders (which elect the governments’ members) in the countries give priority to gender equality in national politics. The indicator of the elected body is women’s representation in parliaments (lower house) and the indicator for the unelected body is women’s representation in governments. Without the active participation of women and the incorporation of women’s perspective at all levels of decision-making, the goals of equality, development and peace cannot be achieved (Beijing Platform for Action, Fourth World Conference on Women, 1995). In a representative democratic
8
between 2002 and 2008, and in 2000 and 2001 Lesotho were rated as partly free (4, 4). In 2009 Lesotho slightly slipped to partly free (3, 3). In the study I will for example use a set of dummy variables of geographic regions and see if regions have some explanatory power on the variation on quality of democracy. From this aspect it can be seen as important that each region consist of a number of countries when the regressions are employed. For example the regions Africa, Oceania, Scandinavia and South America consist of few countries which are included in the research so it should be positive to include more countries. Another reason to include more countries is that the opportunity to make generalization and conclusions from the results of the research increases if the study consists of a greater number of countries. Following from this I have decided to include the borderline cases Argentina, Brazil, Lesotho, Peru and Serbia.

9
system it is important that men and women are politically represented in the same proportions and on equal terms. A parliament seat and a government post can be viewed as two of the most powerful political positions of decision-making and therefore women’s political representation in parliaments and in governments can be seen as very important indicators of the quality of democracy. Lastly, the fourth dimension; rule of law is measured by the indicator, level of corruption. In a democratic system all citizens should be fairly and equitably treated by public officials. In a system where corruption occurs all citizens are not treated fairly and equitably by public officials, and therefore levels of corruption can be seen as a very important indicator of the quality of democracy.
Index construction for this study An important question for this study is how to combine the four dimensions and five indicators of quality of democracy into a summary measure (index). Another important question which must be dealt with concerning the index construction is the weightings of the different dimensions. Within this study, a well-founded question is if political participation, political competition, equality and rule of law are equally important dimensions of the quality of democracy or are one or several of them more important than the others? However I haven’t found any theoretical argument that one or several of the dimensions should be considered more important for the quality of the democracy than the other dimensions. Accordingly I will treat the four different dimensions as equally important dimensions of the quality of democracy and therefore the four dimensions are weighted equally. However as the equality dimension is measured with two indicators and the other dimensions are measured with one indicator, to avoid overestimation of the equality dimension I will weight that dimension.7 Therefore each indicator of the equality dimension; women’s representation in parliaments and women’s representation in governments are down weighted to half of their original values.8 For the validity of the index construction I will consider several different summary measurements. I will depart from three different summary measurements of the quality of democracy; ranks, factor scores and the average of the standardized scores (Z-scores). The first measurement departs from each country’s rank of the four dimensions. Each country’s rank on the four dimensions are summed and divided by four. The index will vary between 1 and 77 where low numbers show countries with a high degree of the quality of democracy and high numbers indicate a low degree of the quality of democracy. In the second summary measurement I will use factor scores for each country of the four dimensions of the quality of democracy. To create the factor scores I ran a factor analysis. The third measurement I shall consider is the average value of the four dimensions of the quality of democracy ((political participation+ political competition+ equality+ rule of law)/4). The four dimensions of the quality of democracy are not all measured in the same scales. Therefore it is necessary to standardize each dimension when measuring the average of the dimensions. Accordingly I have standardized the dimensions, so each dimension has a mean of 0 and a standard deviation of 1. In the last two measurements, factor scores and average high values indicate a high level of quality of democracy and low values indicate a low level of quality of
7 Pearson’s correlation between women’s representation in parliaments and women’s representation in governments is .66. 8 Both indicators are measured in percentages and therefore the down weighting will be calculated as follows: the sum of the percentage of women’s representation in parliaments and the percentage of women’s representation in governments divided by two. For example, Canada has a female representation of 22.1% in parliament and 29.7% in government in 2009. This gives a value of 25.9% female representation for Canada ((22.1 + 29.7) /2 = 25.9).
10
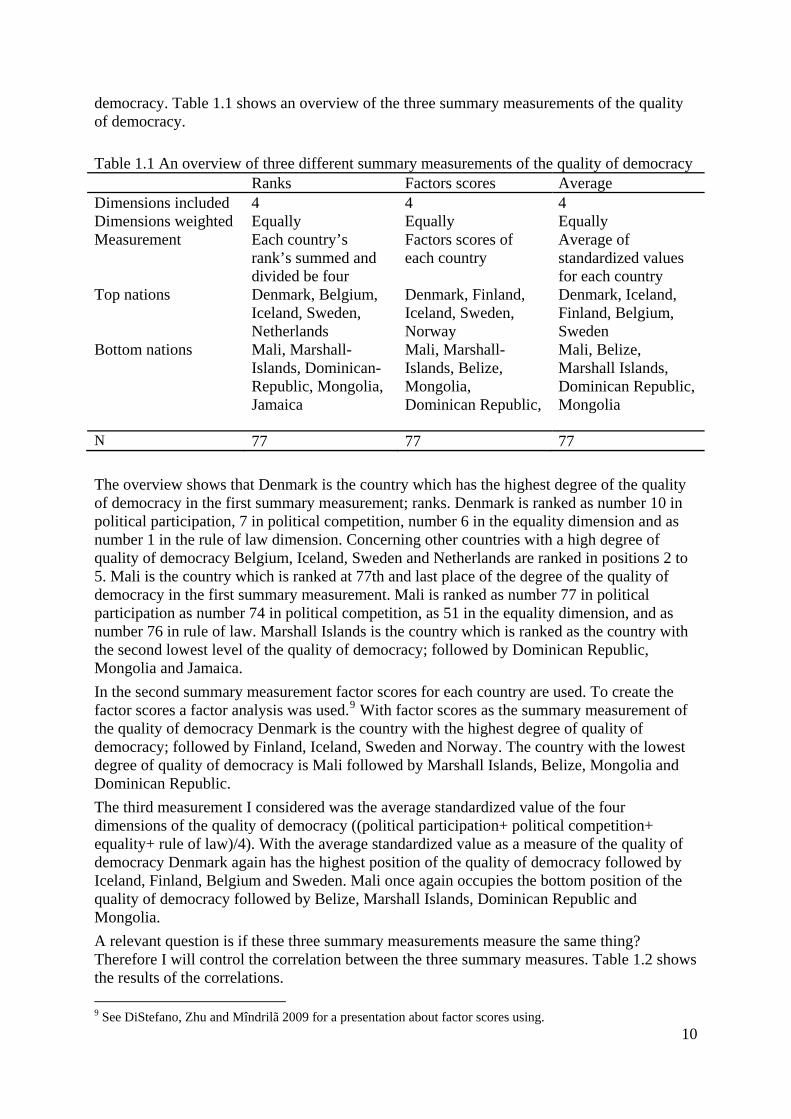
democracy. Table 1.1 shows an overview of the three summary measurements of the quality of democracy. Table 1.1 An overview of three different summary measurements of the quality of democracy Ranks Factors scores Average Dimensions included 4 4 4 Dimensions weighted Equally Equally Equally Measurement Each country’s
rank’s summed and divided be four
Factors scores of each country
Average of standardized values for each country
Top nations Denmark, Belgium, Iceland, Sweden, Netherlands
Denmark, Finland, Iceland, Sweden, Norway
Denmark, Iceland, Finland, Belgium, Sweden
Bottom nations Mali, Marshall- Islands, Dominican- Republic, Mongolia, Jamaica
Mali, Marshall- Islands, Belize, Mongolia, Dominican Republic,
Mali, Belize, Marshall Islands, Dominican Republic, Mongolia
N 77 77 77 The overview shows that Denmark is the country which has the highest degree of the quality of democracy in the first summary measurement; ranks. Denmark is ranked as number 10 in political participation, 7 in political competition, number 6 in the equality dimension and as number 1 in the rule of law dimension. Concerning other countries with a high degree of quality of democracy Belgium, Iceland, Sweden and Netherlands are ranked in positions 2 to 5. Mali is the country which is ranked at 77th and last place of the degree of the quality of democracy in the first summary measurement. Mali is ranked as number 77 in political participation as number 74 in political competition, as 51 in the equality dimension, and as number 76 in rule of law. Marshall Islands is the country which is ranked as the country with the second lowest level of the quality of democracy; followed by Dominican Republic, Mongolia and Jamaica. In the second summary measurement factor scores for each country are used. To create the factor scores a factor analysis was used.9 With factor scores as the summary measurement of the quality of democracy Denmark is the country with the highest degree of quality of democracy; followed by Finland, Iceland, Sweden and Norway. The country with the lowest degree of quality of democracy is Mali followed by Marshall Islands, Belize, Mongolia and Dominican Republic. The third measurement I considered was the average standardized value of the four dimensions of the quality of democracy ((political participation+ political competition+ equality+ rule of law)/4). With the average standardized value as a measure of the quality of democracy Denmark again has the highest position of the quality of democracy followed by Iceland, Finland, Belgium and Sweden. Mali once again occupies the bottom position of the quality of democracy followed by Belize, Marshall Islands, Dominican Republic and Mongolia. A relevant question is if these three summary measurements measure the same thing? Therefore I will control the correlation between the three summary measures. Table 1.2 shows the results of the correlations. 9 See DiStefano, Zhu and Mîndrilã 2009 for a presentation about factor scores using.
11
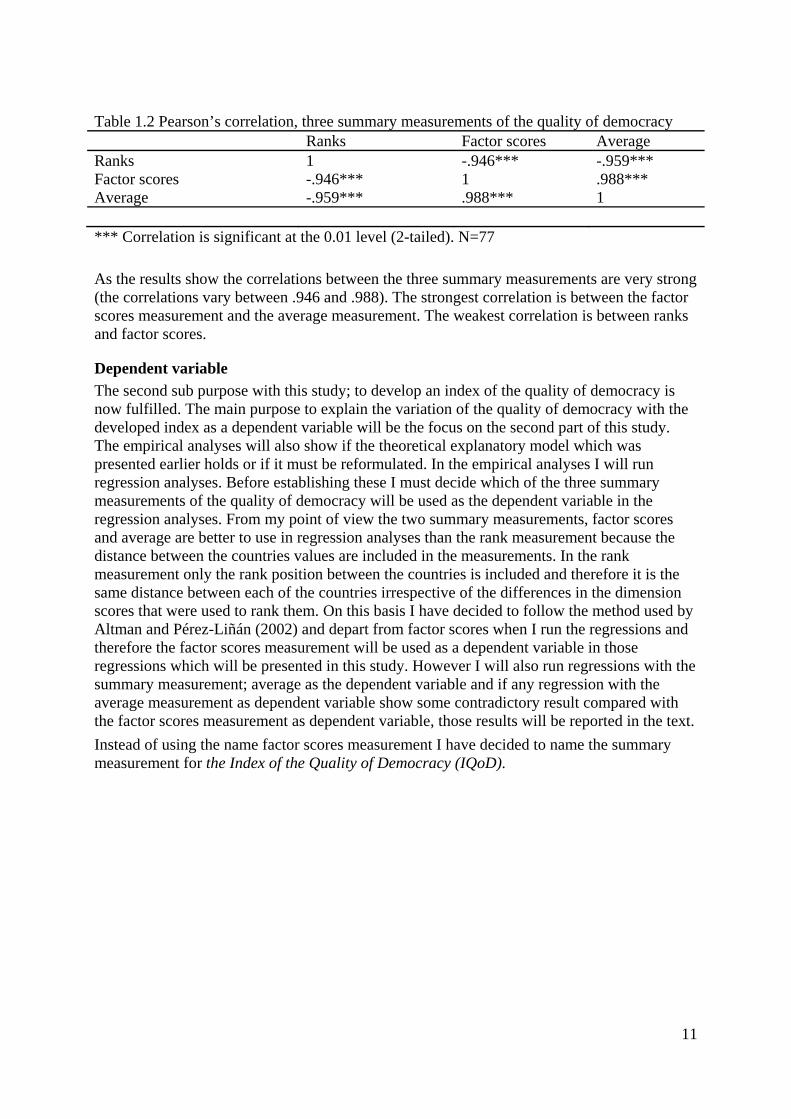
Table 1.2 Pearson’s correlation, three summary measurements of the quality of democracy Ranks Factor scores Average Ranks 1 -.946*** -.959*** Factor scores -.946*** 1 .988*** Average -.959*** .988*** 1 *** Correlation is significant at the 0.01 level (2-tailed). N=77 As the results show the correlations between the three summary measurements are very strong (the correlations vary between .946 and .988). The strongest correlation is between the factor scores measurement and the average measurement. The weakest correlation is between ranks and factor scores.
Dependent variable The second sub purpose with this study; to develop an index of the quality of democracy is now fulfilled. The main purpose to explain the variation of the quality of democracy with the developed index as a dependent variable will be the focus on the second part of this study. The empirical analyses will also show if the theoretical explanatory model which was presented earlier holds or if it must be reformulated. In the empirical analyses I will run regression analyses. Before establishing these I must decide which of the three summary measurements of the quality of democracy will be used as the dependent variable in the regression analyses. From my point of view the two summary measurements, factor scores and average are better to use in regression analyses than the rank measurement because the distance between the countries values are included in the measurements. In the rank measurement only the rank position between the countries is included and therefore it is the same distance between each of the countries irrespective of the differences in the dimension scores that were used to rank them. On this basis I have decided to follow the method used by Altman and Pérez-Liñán (2002) and depart from factor scores when I run the regressions and therefore the factor scores measurement will be used as a dependent variable in those regressions which will be presented in this study. However I will also run regressions with the summary measurement; average as the dependent variable and if any regression with the average measurement as dependent variable show some contradictory result compared with the factor scores measurement as dependent variable, those results will be reported in the text. Instead of using the name factor scores measurement I have decided to name the summary measurement for the Index of the Quality of Democracy (IQoD).

12
Independent variables Table 1.3 shows an overview of the independent variables which are included in this study. Table 1.3 An overview of the independent variables included in the study Physical variables Culture
variables Socioeconomic variables
Historical variables
Political institution variables
Population, Area, Density
Geographic region, Dominating religion
GDP/capita, Literacy
Old-new democracies, Degree of democracy
Electoral system, District magnitude, Disproportionality, Effective numbers of parties, Unicameralism, Territorial organization, Executive power
Three physical variables, two culture variables, two socioeconomic variables, two historical variables and seven political institutions variables are included as independent variables. Below operationalisation and measurement of the independent variables which will be used in the study are introduced.
Physical variables I will consider three physical variables: population, area and density. The measurement of size of population is the total population in each country and the size of population is measured in millions of people. Countries area of territory is measured in square kilometer (km²). Population density (population concentration) is measured in number of people per square kilometers of territory. It is expected that smaller countries will have a higher degree of the quality of democracy.
Culture variables Culture and cultural attitudes are phenomena which are difficult to capture in quantitative form. Even if the phenomenon is difficult to capture I still see it as important to include a measurement of culture and cultural attitudes in quantitative studies, and one way to capture cultural differences in quantitative form is to use dummy variables. In this study I will consider two independent variables to capture the eventual cultural differences concerning the quality of democracy. The two culture variables are geographic region and dominating religion. Concerning the variable geographic region I depart from Castles (1993, 1998a) concept families of nations. I theorize that shared geographical and cultural attributes are leading to distinctive patterns of the quality of democracy. This phenomenon can be seen as a diffusion effect, one country’s level of the quality of democracy interacts with its neighboring countries level of the quality of democracy. However, the selection of cases in this study are not the same as in Castles (1993, 1998a), and therefore I can’t follow his grouping of nations. Instead I will divide the world into different region categories. Previous comparative research has suggested different ways to divide the world into different region categories. For example Paxton and Kunovich (2003) used six regional categories in their study; Eastern Europe, South America, Asia, other nonwestern countries, western industrialized countries, and Scandinavian countries. Tripp and Kang (2008) used eight region dummies; Africa, Americas,

13
her regions.
Asia, Eastern Europe and the former Soviet Union, Middle East, Pacific, Scandinavia and Western Europe. In this research I will also use eight different region categories and the categories are similar with Tripp and Kangs’ (2008) grouping. When compared with Tripp and Kang (2008) I have made two major alterations. The category Americas are divided into two categories; South America and North & Central America, and the category Middle East is included with the category Asia. The region categories in this research are Scandinavia, Western Europe, Eastern Europe, Africa, Asia, South America, North & Central America and Oceania. In the analyses, the regions are measured through eight dummy variables. The region Scandinavia is used as a reference category.10 It is expected that the region Scandinavia has a higher degree of the quality of democracy compared with otThe independent variable dominating religion is divided into four different categories: 1) Countries that do not have any dominating religion 2) Countries with Protestantism as the dominating religion 3) Countries with Catholicism as the dominating religion 4) Countries with a dominating religion other than Protestantism or Catholicism. These categories are then applied in regression models in four different dummies, where the dummy for Protestantism is used as the reference category. Dominating religion is determined if 50% or more of the population in a country belongs to that religion. Other dominating religions, for example Islam, Judaism, Shintoism/Buddhism and Hinduism, are the dominating religion in just a few democratic countries. To avoid making the regressions too complex, I have combined these countries into one category. It is expected that countries with Protestantism as the dominating religion will have a higher degree of the quality of democracy.
Socioeconomic variables I will apply two socioeconomic variables: GDP/capita and literacy. GDP/capita is measured in 1000 of US dollars. Literacy is measured in the percentage of the total population which has the ability to read and write at a specified age. It is expected that a high level of GDP/capita and a high level of literacy are associated with a higher degree of quality of democracy. Therefore it is expected that the coefficients for GDP/capita and literacy will be positive.
Historical variables Two historical variables are included; length of democratic experience and degree of democracy. To control if the length of time of democratic experience has some statistical relationship with the variation in quality of democracy, I will adopt a wide classification of old and new democracies from Samuel P. Huntington’s concepts of waves of democratization described in his book The Third Wave: Democratization in the Late Twentieth Century (1991). I classify old democracies as those countries that are included in the two first democratization waves (1828-1974) and, accordingly, are democratized before 1974. New democracies are classified as those countries democratized during the third democratization wave and later (1974 onwards). This independent variable is applied in the regression analyses as a dummy variable where new democracies are given the value 0 and old democracies are given the value 1. It is expected that old democracies will have a higher degree of the quality of democracy compared with new democracies. The second historical variable handles the degree of democracy. Data from Freedom House will be used and the variable consists of a combined average rating for political rights and civil liberties. The variable ranges from 1 to 2.5 where 1 indicates the highest level of democracy. It is expected that countries with a higher degree of democracy are associated with a higher level of the quality of democracy.
10 In this study Scandinavia equals the Nordic countries; Sweden, Norway, Finland, Denmark and Iceland.

14
Political institutional variables I will depart from seven political institution variables. The independent variable electoral system is divided into three categories: proportional systems, mixed systems and majority systems (FPTP, AV, TRS).11 In the analyses, electoral systems are measured with three dummy variables, and proportional systems are used as a baseline variable. It is expected that countries which use proportional electoral system will have a higher degree of the quality of democracy. The variable district magnitude will be measured through the average district magnitude in each country. It is expected that countries with a larger average district magnitude will have higher degree of the quality of democracy, and therefore it is expected that the coefficient will be positive. The least squares index (Gallagher’s index) will be used when the disproportionality of the electoral rules are measured. It is expected that countries with a low level of disproportionality have a higher degree of the quality of democracy. The least squares index increases when disproportionality increases and therefore it’s expected that the coefficient for disproportionality will be negative. Party systems will be measured through Laakso-Taagepera index: effective number of parliamentary parties. It is expected that a larger number of parliamentary parties will be associated with a higher level of quality of democracy, and therefore it is expected that the coefficient for party system will be positive. To identify if divided power has an effect on the quality of democracy, I will apply three different sets of dummies for controlling the eventual effect that divided power has on the quality of democracy. I will apply a dummy variable for unicameralism. Where the countries which have one chamber (unicameralism) are coded 1 and those countries which have two chambers (bicameralism) are coded 0. I expect that countries with unicameralism will have a higher degree of the quality of democracy and therefore it is expected that the coefficient will be positive. The independent variable territorial organization is divided into three categories: federal systems, intermediate forms, and unitary systems. The three categories are applied in the regressions with three dummies, and unitary systems are used as a baseline variable. It is expected that unitary countries will have higher degrees of the quality of democracy. The independent variable executive power is divided into three categories: parliamentary system, semi-presidential system and presidential system. These three categories are applied in the regressions with three dummy variables and parliamentary system is used as a baseline variable. It is expected that parliamentary countries will have a higher level of the quality of democracy.
Data sources and measurements The study is a cross-section analysis. Concerning the measurements of the indicators of the quality of democracy; voter turnout is measured by the percentage of those registered on the electoral list who cast a vote (number voted/number registered) in parliamentary elections (lower house in countries with a bicameral parliament). Party competition is measured by the percentage of seats held by parties other than the largest party in parliament (lower house in countries with a bicameral parliament). Data for voter turnout and party competition is from the latest parliamentary election (with available data) in each country. Data for voter turnout and party competition are collected from several different data sources (see reference section). Women’s representation in parliaments is measured by the percentage of women’s representation in countries' parliaments (lower house in countries with a bicameral parliament). Women’s representation in governments is measured by the percentage of women’s representation in countries' governments. The corruption index is bounded between -2.5 and +2.5 where low values indicate a higher level of corruption and high values indicate
11 SNTV (Single Non-Transferable Vote) which Vanuatu uses as electoral system is coded as majority system.

15
a lower level of corruption. Data for women’s representation in parliaments, women’s representation in governments and for corruption are from 2009. Data for women’s representation in parliaments and governments are collected from Inter-Parliamentary Union. Data for corruption is collected from the Control of Corruption Index (World Bank). The independent variables are measured in 2008. For information about the data sources for the independent variables see reference section.
Method/Statistical analyses This research is based on comparison, and I will use quantitative empirical analyses when I examine the variation in quality of democracy in the world’s democracies. Simple (bivariate) and multivariate regressions analyses are chosen as statistical tools for explaining the variation in quality of democracy. Concerning the regression models I will use the ordinary least of squares (OLS) method when I run the estimations. The empirical analyses will start with simple regressions and controlling if there are some statistically significant relationships between the dependent variable and the independent variables. A p value < 0.10 will be accepted as statistically significant evidence in the regressions. The independent variables which have statistically significant relationship with the dependent variable will then be applied in multivariate analyses. The multivariate regressions will depart from the independent variable which achieved the highest statistical significance and highest explanatory power in simple regressions. To control the robustness of the results I will check for multicollinearity, outliers and heteroskedasticity. Controlling the regression models for eventually multicollinearity will be done with VIF-statistic and checking the internal correlation between the independent variables. Controlling for outliers will be done with plots and boxplots. Cook’s distance measure and Q-Q plots will be used to detect influential observations, and for controlling distributions and residuals statistics. Kolmogorov-Smirnovs test will be used for controlling the models for eventually heteroskedasticity.
Results
Simple regressions The results from the simple regressions (not shown in this paper) show that the coefficients for the three physical variables population size, area and density are insignificant. According to that none of the physical variables have a statistically significant relationship with the Index of the Quality of Democracy (IQoD).12 The culture variables, geographic region and dominating religion are shown to be statistically associated with the IQoD. Concerning the region dummies, as expected Scandinavia is shown to be the region which has the highest degree of the quality of democracy this is followed by Western Europe and South America. Asia is the region which has the lowest degree of the quality of democracy followed by North and Central America and Africa. The results for the dominating religion dummies indicate that Protestantism as the dominating religion had the highest degree in the IQoD which is as expected. Also for the two socioeconomic variables; GDP/capita and literacy the results indicate that the two variables have a statistically significant relationship with the IQoD. The coefficients for the two socioeconomic variables also have the expected sign which indicates that a higher GDP/capita and a higher literacy rate are positively associated with the IQoD. Concerning the historical variables, old-new democracies and degree of democracy both are shown to be statistically associated with the IQoD. The coefficients for the two variables have
12 I also considered the possibility for a curvilinear relationship between the IQoD index and the physical variables. However the relationships were also statistically insignificant with the physical variables transformed.

16
the expected signs. The result indicates that: old democracies have a higher degree of the IQoD compared with new democracies. A high degree of democracy is positively related with IQoD. Four of the seven political institution variables which are included as independent variables in the study achieve a statistically significant relationship with the dependent variable IQoD. The results indicate that proportional electoral system, low level of electoral disproportionality and a larger number of effective parliamentary parties are positively related with the IQoD. The results also show that parliamentary systems have higher levels of quality of democracy when compared with semi-presidential and presidential system. Lastly, the result shows that the variables district magnitude, unicameralism and territorial organization have no statistically significant relationship with the IQoD.
Multivariate regressions When summing up the results from the simple regressions it shows that 10 independent variables achieved a statistical relationship with the dependent variable; IQoD. These 10 variables consist of two culture variables, two socioeconomic variables, two historical variables and four political institution variables. The simple regressions indicate that four of the five groups of independent variables affect the level of the quality of democracy and it was the physical variables which were shown to not affect the quality of democracy. The next step will be to run multivariate regressions which will consist of the independent variables which achieved a statistical relationship with the IQoD in simple regressions. Many of the independent variables are operationalized as dummy variables and with only 77 cases it is not possible to enter all these variables in a limited number of multivariate regressions because of the decreasing of degrees of freedom when more variables are included in the models. Therefore I will use seven different models for controlling the relationships between the independent variables and the dependent variable; IQoD. The multivariate models will depart from the culture variable geographic region which was the independent variable which achieved the highest statistical significance and the highest explanatory power in simple regressions. In the first models the other groups of factors will be added in when the region dummies hold constant. In the last models the region dummies will be dropped and the models will consist of the other factors which were significant in the simple regressions. The multivariate regressions were checked with VIF statistics for controlling eventual problems with multicollinearity. The models didn’t indicate any problem with multicollinearity.13 The models were also checked with Kolmogorov-Smirnovs test for controlling eventual problems with heteroskedasticity. Kolmogorov-Smirnovs test didn’t indicate any problem with heteroskedasticity.14 Table 1.4 displays the results from the seven different multivariate models.
13 The highest VIF-value for a scale variable was 2.498 and for a dummy variable 6.692. 14 In model 3 the Kolmogorov-Smirnovs test was significant at the .05 level. When controlling residuals statistics it shows that Marshall Islands was the country which differs most from the expected values. Therefore I ran the regression (model 3) again with Marshall Islands excluded. With Marshall Islands excluded from model 3 the Kolmogorov-Smirnovs test showed to be insignificant at the .20 level. Other change with Marshall Islands excluded was that the adjusted R² increased with 3.2 percentage points. Due to the fact that the coefficients in the original model 3 didn’t changed in a high extent in the model with Marshall Islands excluded; it can be establish that the original model didn’t show any serious problem with heteroskedasticity. Therefore I decided to report the original model 3 below. In the other six models Kolmogorov-Smirnovs test were insignificant.
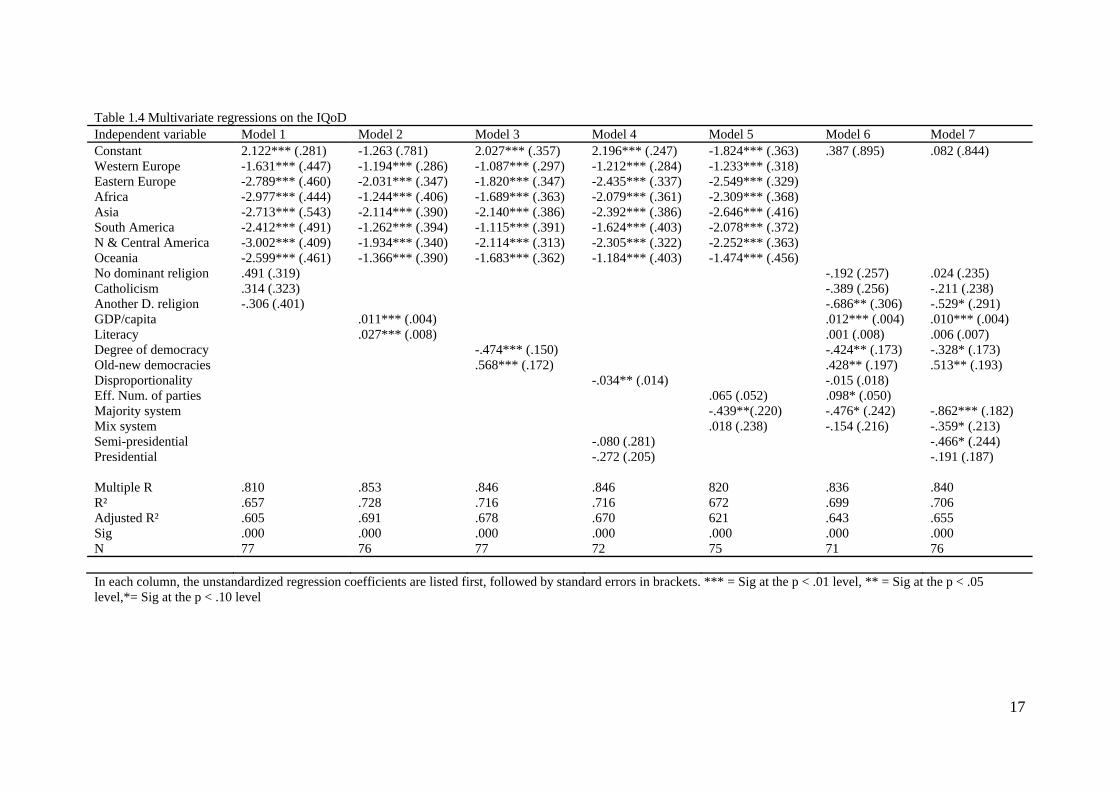
Table 1.4 Multivariate regressions on the IQoD Independent variable Model 1 Model 2 Model 3 Model 4 Model 5 Model 6 Model 7 Constant 2.122*** (.281) -1.263 (.781) 2.027*** (.357) 2.196*** (.247) -1.824*** (.363) .387 (.895) .082 (.844) Western Europe -1.631*** (.447) -1.194*** (.286) -1.087*** (.297) -1.212*** (.284) -1.233*** (.318) Eastern Europe -2.789*** (.460) -2.031*** (.347) -1.820*** (.347) -2.435*** (.337) -2.549*** (.329) Africa -2.977*** (.444) -1.244*** (.406) -1.689*** (.363) -2.079*** (.361) -2.309*** (.368) Asia -2.713*** (.543) -2.114*** (.390) -2.140*** (.386) -2.392*** (.386) -2.646*** (.416) South America -2.412*** (.491) -1.262*** (.394) -1.115*** (.391) -1.624*** (.403) -2.078*** (.372) N & Central America -3.002*** (.409) -1.934*** (.340) -2.114*** (.313) -2.305*** (.322) -2.252*** (.363) Oceania -2.599*** (.461) -1.366*** (.390) -1.683*** (.362) -1.184*** (.403) -1.474*** (.456) No dominant religion .491 (.319) -.192 (.257) .024 (.235) Catholicism .314 (.323) -.389 (.256) -.211 (.238) Another D. religion -.306 (.401) -.686** (.306) -.529* (.291) GDP/capita .011*** (.004) .012*** (.004) .010*** (.004) Literacy .027*** (.008) .001 (.008) .006 (.007) Degree of democracy -.474*** (.150) -.424** (.173) -.328* (.173) Old-new democracies .568*** (.172) .428** (.197) .513** (.193) Disproportionality -.034** (.014) -.015 (.018) Eff. Num. of parties .065 (.052) .098* (.050) Majority system -.439**(.220) -.476* (.242) -.862*** (.182) Mix system .018 (.238) -.154 (.216) -.359* (.213) Semi-presidential -.080 (.281) -.466* (.244) Presidential -.272 (.205) -.191 (.187) Multiple R .810 .853 .846 .846 820 .836 .840 R² .657 .728 .716 .716 672 .699 .706 Adjusted R² .605 .691 .678 .670 621 .643 .655 Sig .000 .000 .000 .000 .000 .000 .000 N 77 76 77 72 75 71 76 In each column, the unstandardized regression coefficients are listed first, followed by standard errors in brackets. *** = Sig at the p < .01 level, ** = Sig at the p < .05 level,*= Sig at the p < .10 level
17
18
As Table 1.4 shows the first model consists of the culture variable geographic region which was the independent variable that achieved the highest statistical significance and the highest explanatory power in simple regressions and the other culture variable dominating religion. The model explains 60.5% of the variation in the dependent variable IQoD. All coefficients for the regions dummies are highly significant. The coefficients for the region dummies are also negative which indicates that Scandinavia has a positive impact on the IQoD compared with other regions even when controlling for dominating religion. None of the dominating religion dummies achieved a statistical relationship with the IQoD when controlling for geographic region. In the second model the two socioeconomic variables GDP/capita and literacy are added together with the region dummies. The second model explains 69.1% of the variation in the IQoD. All of the region dummies are still statistically significant and negative. The coefficients for GDP/capita and literacy are statistically significant and positive which indicate that a higher GDP/capita and a higher literacy rate are positively associated with the IQoD even when controlling for geographic region. Model 3 consists of the region dummies and the two historical variables; old-new democracies and degree of democracy. The model explains 67.8% of the variation. The coefficients for the region dummies are statistically significant with the expected negative sign. The coefficient for the degree of democracy is statistically significant and, as expected, the coefficient is negative this indicates that countries with a higher level of democracy are associated with a higher level of quality of democracy. Also the variable old-new democracies is shown to be statistically related with the IQoD and as expected the coefficient is positive which indicates that old democracies are associated with higher levels of quality of democracy when compared with new democracies. The next step will be to control the political institutions variables relationship with the IQoD when the region dummies hold constant. To avoid too many variables in each model the political institution variables will be added with the region dummies in two different models. Model 4 consists of the region dummies, disproportionality and the executive dummies. Model 5 consists of the region dummies, the electoral system dummies and the effective numbers of parliamentary parties. The fourth model explains 67.0% of the variation in the IQoD. The results in model 4 show that all coefficients for the region dummies are still statistically significant and negative, which is as expected. The political institution variable disproportionality is also statistically related to the IQoD and the sign of the coefficient is as expected negative which indicates that a lower level of disproportionality is associated with a higher level of the IQoD. The two executive power dummies semi-presidential system and presidential system are not statistically related with the IQoD when controlling for geographic region and disproportionality. Model 5 explains 62.1% of the variation. The region dummies are still statistically related to the IQoD and the coefficients are negative. The coefficient for majority system is statistically significant and negative which indicates that majority electoral system is associated with a lower level of the IQoD compared with proportional electoral system. The coefficient for the other electoral system dummy, mix system is highly insignificant. The variable, effective number of parties is not statistically related with the IQoD. In model 6 and 7 the region dummies are dropped and in these two models the cultural variable dominating religion, socioeconomic, historical and political institution variables are added together and their relationship with the IQoD will be controlled for. Model 6 consists of the dominating religion dummies, the two socioeconomic variables GDP/capita and literacy, the two historical variables degree of democracy and new-old democracies, the three political institution variables; electoral system, disproportionality and the effective number of parties. Model 6 explains 64.3% of the variation. The dummy variable; dominating religion other than

19
Protestantism or Catholicism is statistically significant and the coefficient is as expected negative. The results indicate that countries with another dominating religion are associated with lower level of the IQoD compared with countries which have Protestantism as dominating religion when controlling for the other variables included in model six. The dummy variables for no dominating religion and Catholicism as dominating religion are negative as expected but they are insignificant. The coefficient for GDP/capita is statistically significant and the coefficient is as expected positive. The other socioeconomic variable; literacy is shown to be highly insignificant. Concerning the two historical variables, old-new democracies and degree of democracy both achieve a statistical relationship with the IQoD and the directions of the sign are as expected (positive and negative respectively). The political institution variable the effective number of parties is statistically significant (.10 level) and as expected the coefficient is positive. The coefficient for majority system is statistically significant (.10 level) and the coefficient is as expected negative. The coefficient for the other electoral system dummy mix system is highly insignificant. The variable disproportionality is statistically insignificant in model 6. Finally, model 7 consists of the dominating religion dummies, the two socioeconomic variables, the two historical variables and the two political institution variables, electoral system and executive power. The model explains 65.5% of the variation in the dependent variable. For the dominating religion dummies the results in model 7 are almost the same as in model 6; the dummy variable dominating religion other than Protestantism or Catholicism is statistically significant (.10 level) and the other two dummies are not. Also for the two socioeconomic variables the results in model 7 are almost the same as in model 6; GDP/capita is statistically related to the IQoD and literacy is not. The two historical variables old-new democracies and degree of democracy are still statistically related to the IQoD and the signs are in the expected direction. Both of the electoral dummies, majority system and mix system are statistically related with the IQoD. The coefficients are negative which indicates that majority and mix systems are associated with lower levels of quality of democracy compared with proportional system when controlling for dominating religion, socioeconomic variables, historical variables and executive power. The dummy for semi-presidential system is statistically significant and the coefficient is negative which indicates that semi-presidential systems are associated with lower levels of the IQoD when compared with parliamentary systems when controlling for dominating religion, socioeconomic variables, historical variables and electoral system. The coefficient for the other executive dummy presidential system is negative but the coefficient is insignificant.
Conclusions In this study an index which consists of four dimensions of the quality of democracy was created. The Index of the Quality of Democracy (IQoD) was then used as a dependent variable. An explanatory model for explaining the variation in the quality of democracy was developed. Five groups of variables were included in the explanatory model; physical variables, culture variables, socioeconomic variables, historical variables and political institution variables. The results show that culture variables, socioeconomic variables, historical variables and political institution variables affect the quality of democracy, and the physical variables do not. The statistical models explain between 60.5% and 69.1% percent of the variation in the quality of democracy. However, the findings show that some variables perform better than others in explaining the variation of the quality of democracy in the stable democracies in the world. Concerning explanatory power the culture variable geographic region seems to outperform the other variables, and the geographic regions relationship with the IQoD seems to be robust in this

20
study. Both in simple regressions and in several multivariate regressions when controlling for dominating religion, socioeconomic, historical and political institution variables the region dummies were highly statistically significant. Accordingly the results indicate that geographic region is an important determinant of the IQoD. The findings show that Scandinavia has a higher level of quality of democracy in comparison to other regions. It can be concluded that shared geographical and cultural attributes lead to distinctive patterns of the quality of democracy. Accordingly, the phenomenon can be seen as a diffusion effect, one country’s level of the quality of democracy interacts with its neighboring countries’ levels of the quality of democracy. Turning to the other culture variable; dominating religion it was statistically related with the IQoD in simple regression and the result showed that Protestantism as the dominating religion was associated with higher levels of quality of democracy. When controlling for geographic region the relationship between the dominating religion dummy variables and the IQoD no longer attained statistical significance. However, when controlling for socioeconomic, historical and political institution variables, dominating religions other than Protestantism or Catholicism seem to have a negative impact on the IQoD. The findings also indicate that the relationship between the historical variables old-new democracies, degree of democracy and the quality of democracy index are shown to be robust. Old democracies are associated with higher levels of quality of democracy when compared with new democracies and countries with a higher level of democracy are associated with a higher level of quality of democracy. The findings were robust even when controlling for culture variables, socioeconomic variables and political institution variables. Accordingly, historical factors such as degree of democracy and length of democracy performance are important determinants of the IQoD. The socioeconomic variable GDP/capita is also shown to be statistically related with the IQoD. A higher GDP/capita seems to have a positive effect on the IQoD even after controlling for culture variables, historical variables, political institution variables and other socioeconomic variable (literacy). According to that, GDP/capita is shown to be an important determinant of the IQoD. The other socioeconomic variable, literacy was shown to be statistically related with the quality of democracy when controlling for GDP/capita and geographic region. The result indicates that higher literacy rates are positively associated with the IQoD. However this statistical relationship ceases to appear when controlling for dominating religion, historical and political institution variables. Concerning the political institutions variables relationship with the IQoD, the results show that the relationship is not as robust as expected. Variables which are statistically related with the IQoD in some multivariate models are statistically insignificant in other multivariate models. Concerning explanatory power on the quality of democracy the findings indicate that culture, socioeconomic and historical factors outperform political institutions factors. According to that, one important conclusion is that researchers should not focus as intensively on only political institutions variables as for example Lijphart (1999) did when explaining the variation in the quality of democracy. However there is some empirical support for the political institutions effect on the IQoD. The results indicate that majority and mix electoral systems are negatively related with the IQoD compared with proportional systems, and especially majority systems seem to have a negative impact on the quality of democracy. There is also some empirical evidence which indicates that low electoral disproportionality is positively related with the IQoD. And a higher level of the effective number of parliamentary parties’ also seems to be positively related with the IQoD. Regarding executive power, it seems that predominantly semi-presidential systems are associated with lower levels of the IQoD.

Lastly, the results in this study showed that none of the physical variables were statistically related to the IQoD. Accordingly, the physical variables seem not to affect the level of quality of democracy; the theoretical explanatory model for the quality of democracy which was presented earlier in the study has to be reformulated.
As Figure 1.4 shows the final explanatory model for explaining the variation in the quality of democracy consists of cultural variables, socioeconomic variables, historical variables and political institutions variables. The empirical analyses in the study show that it is highly relevant to include these four groups of factors in an explanatory model for the quality of democracy.
References Acemoglu, Daron, Simon Johnson, James A. Robinson and Pierre Yared. 2007. “Reevaluating the Modernization Hypothesis”. Journal of Monetary Economics. 56 (8). 1043-58. Altman, David and Aníbal, Pérez-Liñán. 2002. “Assessing the Quality of Democracy: Freedom, Competitiveness and Participation in Eighteen Latin American Countries”. Democratization. 9:2: 85-100. Anckar, Carsten. 2008. “Size, Islandness, and Democracy: A Global Comparison”. International Political Science Review. 29:4: 433-59. Anckar, Dag. 2004. “Direct Democracy in Microstates and Small Island States”. World Development. 32:2: 379-90. Anckar, Dag. 2010. “Small Is Democratic, But Who is Small?” Arts and Social Sciences Journal. Volume 2010: ASSJ-2. Andreev, Svetlozar A. 2005. Conceptual Definitions and Measurement Indicators of the Quality of Democracy: An Overview. EUI Working papers. RSCAS No.2005/05. Barro, Robert J. 1999. “Determinants of Democracy”. The Journal of Political Economy. 107:6: 158-83. Bollen, Kenneth. A. 1990. “Political Democracy: Conceptual and Measurement Traps”. Studies in Comparative International Development. 25:1: 7-24. Castles, Francis G., ed. 1993. Families of Nations: Patterns of Public Policy in Western Democracies. Dartmouth. Castles, Francis G. 1998. Comparative Public Policy: Patterns of Post-war Transformation. Edward Elger, Cheltenham, UK. Dahl, Robert A. and Edward R. Tufte. 1973. Size and Democracy. Stanford University Press, Stanford.
21

22
Diamond, Larry. 1993. “Three Paradoxes of Democracy”. In Diamond, Larry and Mark F. Platter, eds. The Global Resurgence of Democracy. John Hopkins University Press, Baltimore and London. 95-107. Diamond, Larry. 1999. Developing Democracy: Toward Consolidation. The Johns Hopkins University Press, Baltimore and London. Diamond, Larry and Leonardo Morlino, eds. 2005. Assessing the Quality of Democracy. The Johns Hopkins University Press, Baltimore. DiStefano, Christine, Min Zhu and Diana Mîndrilã. 2009. Understanding and Using Factor Scores: Considerations for the Applied Researcher. Practical Assessment, Research & Evaluation. 14:20. Epstein, David L., Robert Bates, Jack Goldstone, Ida Kristensen and Sharyn O’Halloran. 2006. “Democratic Transitions.” American Journal of Political Science. 50:3: 551-69. Fourth World Conference on Women Action for Equality, Development and Peace 4-15 September 1995 - Beijing, China. Hadenius, Axel. 1992. Democracy and Development. Cambridge University Press. Hadenius, Axel. 1994. “The Duration of Democracy: Institutional vs Socio-economic Factors”, in: David Beetham, ed. Defining and Measuring Democracy. SAGE Publications: London, Thousand Oaks, New Delhi. 63-88. Hadenius, Axel and Jan Teorell. 2005. “Assessing Alternative Indices of Democracy”. Concepts and Methods Working Papers 6. IPSA. Huntington, Samuel P. 1991. The Third Wave: Democratization in the Late Twentieth Century. University of Oklahoma Press, USA. Huntington, Samuel P. 1993. “Democracy’s Third Wave”. In: Larry Diamond and Mark F. Platter, eds. The Global Resurgence of Democracy. John Hopkins University Press, Baltimore and London. 3-25. Lijphart, Arend. 1993. “Constitutional Choices for New Democracies”, in: Larry Diamond and Mark F. Platter, eds. The Global Resurgence of Democracy. John Hopkins University Press, Baltimore and London. 146-58. Lijphart, Arend. 1999. Patterns of Democracy: Government Forms and Performance in Thirty-Six Countries. New Haven and London, Yale University Press. Lipset, Seymour Martin. 1959. “Some Social Requisites of Democracy: Economic Development and Political Legitimacy”. American Political Science Review 53: 69-105. Paxton, Pamela, and Sheri Kunovich. 2003. “Women’s Political Representation: The Importance of Ideology.” Social Forces 82 (1): 87-114. Powell, G. Bingham, Jr. 1982. Contemporary Democracies: Participation, Stability and Violence. Cambridge, MA: Harvard University Press. Przeworski, Adam, Michael E. Alvarez, José Antonio Cheibub and Fernando Limongi. 2000. Democracy and Development: Political Institutions and Well-Being in the World, 1950-1990. University of Cambridge, Cambridge, United Kingdom. Putnam, Robert D., with Robert Leonardi and Raffaella Y. Nanetti. 1993. Making Democracy Work: Civic Traditions in Modern Italy. Princeton, NJ: Princeton University Press. Munck, Gerardo L, Jay Verkuilen. 2002. “Conceptualizing and Measuring Democracy: Evaluating Alternative Indices”. Comparative Politics Studies. 35:1: 5-34.

23
Stålfors, Sebastian. 2008. Political Institutions and Government Performance: Central and Eastern Europe in a Comparative Perspective. Örebro Studies in Political Science 20. Örebro University. Roller, Edeltraud. 2005. The Performance of Democracies: Political Institutions and Public Policy. Oxford University Press. Teorell, Jan. 2010. Determinants of Democratization: Explaining Regime Change in the World, 1972-2006. Cambridge University Press. Tripp, Aili Mari, and Alice Kang. 2008. “The Global Impact of Quotas: On the Fast Track to Increased Female Legislative Representation.” Comparative Political Studies 41:3: 338-61.
Sources that have been used for the dependent variables and the independent variables Area, Dominating religion, Literacy: Central Intelligence Agency – The World Factbook 2008, CIA https://www.cia.gov/library/publications/the-world-factbook (accessed June 26, 2009) Bicameralism/Unicameralism, District magnitude, Executive power, Territorial organization: Lundell, K. and L. Karvonen. 2010. A Comparative Data Set on Political Institutions. Department of Political Science, Åbo Akademi University. Control of Corruption Index: The World Bank Group: Worldwide Governance Indicators http://info.worldbank.org/governance/wgi/mc_countries.asp (accessed December 20, 2010) Degree of democracy: Freedom House: Freedom in the World http://www.freedomhouse.org/template.cfm?page=549&year=2010 (accessed November 30, 2010) Disproportionality-Least squares index (LSq): http://www.tcd.ie/Political_Science/staff/michael_gallagher/ElSystems/index.php http://www.tcd.ie/Political_Science/staff/michael_gallagher/ElSystems/Docts/ElectionIndices.pdf (accessed December 15, 2010). Lundell, K. and L. Karvonen. 2010. A Comparative Data Set on Political Institutions. Department of Political Science, Åbo Akademi University. Electoral systems: Lundell, K. and L. Karvonen. 2010. A Comparative Data Set on Political Institutions. Department of Political Science, Åbo Akademi University. Reynolds Andrew, Reilly Ben, Ellis Andrew, (eds). Electoral System Design: The New International IDEA Handbook. International IDEA Stockholm, Sweden 2005. GDP/capita: National Accounts Main Aggregates Database (Year 2008) http://unstats.un.org/unsd/snaama/selbasicFast.asp (accessed December 12, 2010)

24
Geographic region: Central Intelligence Agency – The World Factbook 2008, CIA (https://www.cia.gov/library/publications/the-world-factbook) (accessed June 26, 2009) Lundell, K. 2007. Data Bank 1975-2005. Department of Political Science, Åbo Akademi University. Old-New democracies: Own measurement, data used from Freedom House. Freedom House: Freedom in the World http://www.freedomhouse.org (accessed June 26, 2009) Party Competition: IFES electionguide.org http://www.electionguide.org / (accessed December 16, 2010) Inter-Parliamentary Union: Parline database on national parliaments http://www.ipu.org/parline-e/parlinesearch.asp (accessed December 16, 2010) Population: Population 2008, International Data Base (IDB) http://www.census.gov/ipc/www/idb/ranks.php (accessed June 26, 2009) The effective number of parties at the parliamentary or legislative level: http://www.tcd.ie/Political_Science/staff/michael_gallagher/ElSystems/index.php http://www.tcd.ie/Political_Science/staff/michael_gallagher/ElSystems/Docts/ElectionIndices.pdf (accessed December 15, 2010). Lundell, K. and L. Karvonen. 2010. A Comparative Data Set on Political Institutions. Department of Political Science, Åbo Akademi University. Voter turnout: IFES electionguide.org http://www.electionguide.org / (accessed December 16, 2010) International IDEA http://www.idea.int/vt/country_view.cfm?CountryCode (accessed December 16, 2010) Inter-Parliamentary Union: Parline database on national parliaments http://www.ipu.org/parline-e/parlinesearch.asp (accessed December 16, 2010) Women’s representation in parliaments: Inter-Parliamentary Union: Parline database http://www.ipu.org/pdf/publications/wmnmap10_en.pdf (accessed June 2, 2010) Women’s representation in governments: Inter-Parliamentary Union: Parline database http://www.ipu.org/pdf/publications/wmnmap10_en.pdf (accessed June 2, 2010) Figures for Mauritius and Suriname are from 2008: http://www.ipu.org/pdf/publications/wmnmap08_en.pdf (accessed June 2, 2010)