patterns of democracy arend lijphart
TRANSCRIPT
1 Contents
Preface ix
1 Introduction 1
2 The Westminster Model of Democracy 9
3 The Consensus Model of Democracy 31
4 Thirty-Six Democracies 48
5 Party Systems: Two-Party and Multiparty Patterns 62
6 Cabinets: Concentration Versus Sharing of Executive Power 90
7 Executive-Legislative Relations: Patterns of Dominance and Balance of Power 116
8 Electoral Systems: Majority and Plurality Methods Versus Proportional Representation 143
9 Interest Groups: Pluralism Versus Corporatism 171
10 Division of Power: The Federal-Unitary and Centralized-Decentralized Contrasts 185
11 Parliaments and Congresses: Concentration Versus Division of Legislative Power 200
12 Constitutions:1unendmentProceduresand Judicial Review 216
viii CONTENTS
13 Central Banks: Independence Versus Dependence 232
14 The Two-Dimensional Conceptual Map of Democracy 243
15 Macro-Economic Management and the Control of Violence: Does Consensus Democracy Make a Difference?
16 The Quality of Democracy and a "Kinder, Gentler"
258
Democracy: Consensus Democracy Makes a Difference 275
17 Conclusions and Reco=endations 301
Appendix A. Two Dimensions and Ten Basic Variables, 1945-96 and 1971-96 311
Appendix B. Alternative Measure of Multipartism, Cabinet Composition, and Disproportionality, 1945-96 and 1971-96
References
Index
315
317
341
Preface
My book Democracies, published in 1984, was a comparative study of twenty-one democracies in the period 1945-80. Its most important findings were (1) that the main institutional rules and practices of modern democracies-such as the organization and operation of executives, legislatures, party systems, electoral systems, and the relationships between central and lower-level governments-can all be measured on scales from majoritarianism at one end to consensus on the other, (2) that these institutional characteristics form two distinct clusters, and (3) that, based on this dichotomous clustering, a twodimensional "conceptual map" of democracy can be drawn on which each of the democracies can be located. My original plan for a second edition was to reinforce this theoretical framework and the empirical findings mainly by means of an update to the mid-1990s-an almcst 50 percent increase in the total time span-with only a few additional corrections and adjustments.
When I began work on the revision, how6ver, I realized that it offered me a great opportunity for much more drastic improvements. I decided to add not just the updated materials but also fifteen new countries, new operationalizations of the institutional variables, two completely new institutional variables, an attempt to gauge the stability of the countries' positions on the conceptual map, and an analysis of the performance of the
! i'
i
x PREFACE
different types of democracy with regard to a large number of public policies. As a result, while Patterns of Democracy grew out of Democracies, it has become an entirely new book rather than a second edition.
For those readers who are familiar with Democracies, let me describe the principal changes in Patterns of Democracy in somewhat greater detail:
1. Patterns of Democracy covers thirty-six countries-fifteen more than the twenty-one countries of Democracies. This new set of thirty-six countries is not just numerically larger but considerably more diverse. The original twenty-one democracies were all industrialized nations and, with one exception (Japan), Western countries. The fifteen new countries include four European nations (Spain, Portugal, Greece, and Malta), but the other eleven-almost one-third of the total of thirty-six-are developing countries in Latin America, the Caribbean, Africa, Asia, and the Pacific. This greater diversity provides a critical test of the two-dimensional pattern found in Democracies. A minor change from Democracies is that I dropped the French Fourth Republic (1946-58) because it lasted only twelve years-in contrast with the minimum of almost twenty years of democracy for all other cases; in this book, "France" means the Fifth Republic from 1958 on.
Z. In Democracies, I analyzed the twenty-one democracies from their first national elections in or soon after 1945 until the end of 1980. Patterns of Democracy extends this period until the middle of 1996. For the original countries (except France), the starting-point is still the second half of the 1940s; for the others, the analysis begins with their first elections upon the achievement of independence or the resumption of democracy-ranging from 1953 (Costa Rica) to 1977 (India, Papua New Guinea, and Spain).
3. The two new institutions analyzed in Patterns of Democracy are interest groups and central banks (Chapters 9 and 13). Two other variables that were discussed prominently in Democ-
PREFACE xi
racies and given chapters of their own-the issue dimensions of partisan conflict and referendums-are "demoted" in Patterns of Democracy. I now discuss them more briefly in Chapters 5 and lZ, and I have dropped the issue dimensions as one of the five elements of the first cluster of characteristics because, unlike all the other variables, it is not an institutional characteristic. The first cluster still consists of five variables, however, because the interest group system is now added to it. The second cluster is expanded from three to five elements: I split the variable of constitutional rigidity versus flexibility into two separate variables-the difficulty of constitutional amendment and the strength of judicial review-and I added the variable of central bank independence.
4. I critically reviewed the operationalization of all of the institutional characteristics, and I found that almost all could be, and should be, iroproved. My overriding objective was to maximize the validity of my quantitative indicators-that is, to capture the "reality" of the political phenomena, which are often difficult to quantify, as closely as possible. One frequent problem was that I was faced with two alternative operationalizations that appeared to be equally justified. In such cases, I consistently chose to "split the difference" by combining or averaging the alternatives instead of more or less arbitrarily picking one instead of the other. In the end, only the operationalization of the party system variable-in terms of the effective number of parliamentary parties-survived almost (but not completely) in'.act from Democracies. All of the others were modified to a signlficant extent.
5. In Democracies, I placed my democracies on the conceptual map of democracy on the baSis of their average institutional practices in the thirty to thirty-five years under consideration; I did not raise the question of how much change may have occurred over time. Chapter 14 of Patterns of Democracy does look into this matter by dividing the approximately fifty years from 1945 to 1996 into separate periods of1945-70 and 1971-96 and
xli PREFACE
by showing how much-or how little-twenty-six of the democracies (those with a sufficient number of years in the first period) shifted their positions on the conceptual map from the first to the second period.
6. Perhaps the most important new subject covered in Pattems of Democracy is the "so what?" question: does the type of democracy make a difference for public policy and for the effectiveness of government? Chapter 15 investigates the relationship between the degree of consensus democracy and how successful governments are in their macroeconomic management (such as economic growth and the control of inflation and unemployment) and the control of violence. Chapter 16 looks at several indicators of the quality of democracy (such as women's representation, equality, and voter participation) and the records of the governments with regard to welfare policies, environmental protection, criminal justice, and economic aid to developing countries.
7. I began Democracies with sketches of British and New Zealand politics as illustrative examples of the Westminster model of democracy and similar brief accounts of Swiss and Belgian democracy as examples of the consensus model. Pattems of Democracy updates these four sketches and adds Barbados and the European Union as two further examples of the respective models.
8. Democracies presented the relationships between the different variables by means of tables with cross-tabulations. In Pattems of Democracy, I generally use scattergrams that show these relationships and the positions of each of the thirty-six democracies in a much clearer, more accurate, and visually more attractive fashion.
9. Pattems of Democracy adds an appendix with the values on all ten institutional variables and the two overall majoritarian-consensus dimensions for the entire period 1945-
96 and for the shorter period 1971-96. The ready availability of these basic data as part of the book should facilitate replications
PREFACE xiii
that other scholars may want to perform as well as the use of these data for further research.
It would have been impossible for me to analyze the thirtysix countries covered inPattems of Democracy without the help of a host of scholarly advisers-and almost impossible without the invention of email! I am extremely grateful for all of the facts and interpretations contributed by my advisers and for their unfailingly prompt responses to my numerous queries.
On the Latin American democracies, I received invaluable assistance from Octavio Amorim Neto, John M. Carey, Brian F. Crisp, Michael J. Coppedge, Jonathan Hartlyn, Gary Hoskin, Mark P. Jones, J. Ray Kennedy, Scott Mainwaring, and Matthew S. Shugart. Ralph R. Premdas was a key consultant on the Caribbean democracies, together with Edward M. Dew, Neville R. Francis, Percy C. Hintzen, and Fragano S. Ledgister. Pradeep K. Chhibber and Ashutosh Varshney helped me solve a number of puzzles in the politics of India. With regard to some of the small and underanalyzed countries, I was particularly dependent on the willingness of area and country experts to provide facts and explanations: John D. Holm, Bryce Kunimoto, Shaheen Mozaffar, and Andrew S. Reynolds on Botswana; John C. Lane on Malta; Hansraj Mathur and Larry W. Bowman on Mauritius; and Ralph Premdas (again) as well as Ben Reilly and Ron May on Papua New Guinea.
Nathaniel L. Beck, Susanne Lohmann, Sylvia Maxfield, Pierre 1.. Siklos, and Steven B. Webb advised me on central banks; Miriam A. Golden, Stephan Haggard, Neil J. Mitchell, Daniel R. Nielson, Adam Przeworski, and Alan Siaroff on interest groups; and Martin Shapiro and Alec Stone on judicial review. On other countries and subjects I benefited from the help and suggestions of John S. Ambler, Matthew A. Baum, Peter J. Bowman, Thomas C. Bruneau, Gary W. Cox, Markus M. 1.. Crepaz, Robert G. Cushing, Robert A. Dahl, Larry Diamond, Panayote E. Dimitras, Giuseppe Di Palma, James N. Druckman,
xiv PREFACE
Svante O. Ersson, Bernard Grofinan, Arnold J. Heidenheimer, Charles O. Jones, Ellis S. Krauss, Samuel H. Kernell, Michael Laver, Thomas C. Lundberg, Malcolm Mackerras, Peter Mair, Jane Mansbridge, Marc F. Plattner, G. Bingham Powell, Jr., Steven R. Reed, Manfred G. Schmidt, Kaare Strom, Wilfried Swenden, Rein Taagepera, Paul V. Warwick, and Demet Yalcin.
In October 1997, I gave an intensive two-week seminar, largely based on draft materials for Patterns of Democracy, at the Institute for Advanced Studies in Vienna; I am grateful for the many helpful co=ents I received from Josef Melchior, Bernhard Kittel, and the graduate students who participated in the seminar sessions. In April and May 1998, I gave similar lectures and seminars at several universities in New Zealand: the University of Canterbury in Christchurch, the University of Auckland, Victoria University of Wellington, and the University of Waikato in Hamilton. Here, too, I benefited from many useful reactions, and I want to thank Peter Aimer, Jonathan Boston, John Henderson, Martin Holland, Keith Jackson, Raymond Miller, Nigel S. Roberts, and Jack Vowles in particular.
James N. Druckman expertly executed the factor analysis reported in Chapter 14. Ian Budge, Hans Keman, and Jaap Woldendorp provided me with their new data on cabinet formation before these were published. Several other scholars also generously shared their not yet published or only partly published data with me: data on the composition of federal chambers from Alfred Stepan and Wilfried Swenden's Federal Databank; data on the distance between gove=ents and voters collected by John D. Huber and G. Bingham Powell, Jr.; and Christopher J. Anderson and Christine A. Guillory's data on satisfaction with democracy. Last, but certainly not least, I am very grateful for the work of my research assistants Nastaran Afari, Risa A. Brooks, Linda L. Christian, and Stephen M. Swindle.
CHAPTER 1
Introduction
There are many ways in which, in principle, a democracy can be organized and run; in practice, too, modern . democracies exhibit a variety of formal gove=ental institutions, like legislatures and courts, as well as political party and interest group systems. However, clear patterns and regularities appear when these institutions are examined from the perspective of how majoritarian or how consensual their rules and practices are. The majoritarianism-consensus contrast arises from the most basic and literal definition of democracy-gove=ent by the people or, in representative democracy, gove=ent by the representatives of the people-and from President Abraham Lincoln's famous further stipulation that democracy means government not only bybut also for the people-that is, gove=ent in accordance with the people's preferences.'
Defining democracy as "government by and for the people" raises a fundamental question: who will do the governing and to whose interests should the gove=ent be responsive when the people are in disagreement and have divergent preferences?
1. As Clifford D. May (1987) points out, credit for this definition should probably go to Daniel Webster instead of Lincoln. Webster gave an address in 1830-thirty-three years before Lincoln's Gettysburg address-m which he spoke of a "people's government, made for the people, made by the people, and answerable to the people."
2 INTRODUCTION
One answer to this dile=a is: the majority of the people. This is the essence of the majoritarian model of democracy. The majoritarian answer is simple and straightforward and has great appeal because gove=ent by the majority and in accordance with the majority's wishes obviously comes closer to the democratic ideal of "gove=ent by and for the people" than government by and responsive to a minority.
The alternative answer to the dile=a is: as many people as possible. This is the crux of the consensus model. It does not differ from the majoritarian model in accepting that majority rule is better than minority rule, but it accepts majority rule only as a minimum requlrement: instead of being satisfied with narrow decision-making majorities, it seeks to maximize the size of these majorities. Its rules and institutions aim at broad participation in gove=ent and broad agreement on the policies that the gove=ent should pursue. The majoritl)rian model concentrates political power in the hands of a bare majority-and often even merely a plurality instead of a majority, as Chapter 2 will show-whereas the consensus model tries to share, disperse, and limit power in a variety of ways. A closely related difference is that the majoritarian model of democracy is exclusive, competitive, and adversarial, whereas the consensus model is characterized by inclusiveness, bargaining, and compromise; for this reason, consensus democracy could also be termed "negotiation democracy" (Kaiser 1997, 434).
Ten differences with regard to the most important democratic institutions and rules can be deduced from the majoritarian and consensus principles. Because the majoritarian characteristics are derived from the same principle and hence are logically connected, one could also expect them to occur together in the real world; the same applies to the consensus characteristics. All ten variables could therefore be expected to be closely related. Previous research has largely confirmed these expectations-with one major exception: the variables cluster in two clearly separate dimensions (Lijphart 1984, 211-22; 1997a,
INTRODUCTION 3
196-201). The first dimension groups five characteristics of the arrangement of executive power, the party and electoral systems, and interest groups. For brevity's sake, I shall refer to this first dimension as the executives-parties dimension. Since most of the five differences on the second dimension are co=only associated with the contrast between federalism and unitary gove=ent-a matter to which I shall return shortly-I shall call this second dimension the federal-unitary dimension.
The ten differences are formulated below in terms of dichot-0mous contrasts between the majoritarian and consensus models, but they are all variables on which particular countries may be at either end of the continuum or anywhere in between. The majoritarian characteristic is listed first in each case. The five differences on the executives-parties dimension are as follows:
. 1. Concentration of executive power in single-party majority cabinets versus executive power-sharing in broad multiparty coalitions.
2. Executive-legislative relationships in which the executive is dominant versus executive-legislative balance of power.
3. Two-party versus multiparty systems. 4. Majoritarian and disproportional electoral systems ver
sus proportional representation. 5. Pluralist interest group systems with free-for-all com
petition among groups versus coordinated and "corporatist" interest group systems aimed at compromise and concertation.
The five differences on the federal-unitary dimension are the following:
1. Unitary and centralized gove=ent versus federal and decentralized gove=ent.
2. Concentration of legislative power in a unicameral legislature versus division of legislative power between two equally strong but differently constituted houses.
i'
t'l ",,1
4 INTRODUCTION
3. Flexible constitutions that can be amended by simple majorities versus rigid constitutions that can be changed only by extraordinary majorities.
4. Systems in which legislatures have the final word on the constitutionality of their own legislation versus systems in which laws are subject to a judicial review of their constitutionality by supreme or constitutional courts.
5. Central banks that are dependent on the executive versus independent central banks.
One plausible explanation of this two-dimensional pattern is suggested by theorists offederalism like Ivo D. Duchacek (1970),
Daniel J. Elazar (1968), Carl J. Friedrich (1950, 189-221), and K. C. Wheare (1946). These scholars maintain that federalism has primary and secondary meanings. Its primary definition is: a guaranteed division of power between the central government and regional governments. The secondary characteristics are strong bicameralism, a rigid constitution, and strong judicial review. Their argument is that the guarantee of a federal division of power can work well only if (1) both the guarantee and the exact lines of the division of power are clearly stated in the constitution and this guarantee cannot be changed unilaterally at either the central or regional level-hence the need for a rigid constitution, (2) there is a neutral arbiter who can resolve .conflicts concerning the division of power between the two levels of government-hence the need for judicial review, and (3) there is a federal chamber in the national legislature in which the regions have strong representation-hence the need for strong bicameralism; moreover, (4) the main purpose of federalism is to promote and protect a decentralized system of gove=ent. These federalist characteristics can be found in the first four variables of the second dimension. As stated earlier, this dimension is therefore called the federal-unitary dimension.
The federalist explanation is not entirely satisfactory, however, for two reasons. One problem is that, although it can ex-
INTRODUCTION 5
plain the clustering of the four variables in one dimension, it does not explain why this dimension should be so clearly distinct from the other dimension. Second, it cannot explain why the variable of central bank independence is part of the federal-unitary dimension. A more persuasive explanation of the two-dimensional pattern is the distinction between "collective agency" and "shared responsibility" on one hand and divided agencies and responsibilities on the other suggested by Robert E. Goodin (1996, 331).2 These are both forms of diffusion of power, but the first dimension of consensus democracy with its multiparty face-to-face interactions within cabinets, legislatures, legislative committees, and concertation meetings between gove=ents and interest groups has a close fit with the collective-responsibility form. In contrast, both the four fed.eralist characteristics and the role of central banks fit the format of diffusion by means of institutional separation: division of power between separate federal and state institutions, two separate chambers in the legislature, and separate and independent high courts and central banks. Viewed from this perspective, the first dimension could also be labeled the jointresponsibility or joint-power dimension and the second the divided-responsibility or divided-power dimension. However, although these labels would be more accurate and theoretically more meaningful, my originallabels-"executives-parties" and "federal-unitary" -have the great advantage that they are easier to remember, and I shall therefore keep using them throughout this book.
The distinction between two basic types of democracy, majoritarian and consensus, is by no means a novel invention in political science. In fact, I borrowed these two terms from Robert G. Dixon, Jr. (1968, 10). Hans Hattenhauer and Werner Kaltefleiter (1986) also contrast the "majority principle" with
2. A similar distinction. made by George'Tsebelis (1995, 302), is that betwe8+l "institutional veto players," located in different institutions, and "partisan veto players" like the parties within a government coalition.
•.•. 1
6 INTRODUCTION
consensus, andJiirg Steiner (1971) juxtaposes "the principles of majority and proportionality." G. Bingham Powell (1982) distinguishes between majoritarian and broadly "representational" forms of democracy and, in later work, between two "visions of liberal democracy": the Majority Control and the Proportionate Influence visions (Huber and Powell 1994). Similar contrasts have been drawn by Robert A. Dahl (1956)-"populistic" versus "Madisonian" democracy; William H. Riker (1982)-"populism" versus "liberalism"; Jane Mansbridge (1980)-"adversary" versus "unitary" democracy; and S. E. Finer (1975)-"adversary politics" versus centrist and coalitional politics.
Nevertheless, there is a surprisingly strong and persistent tendency in political science to equate democracy solely with majoritarian democracy and to fail to recognize consensus democracy as an alternative and equally legitimate type. A particularly clear example can be found in Stephanie Lawson's (1993, 192-93) argument that a strong political opposition is "the sine qua non of contemporary democracy" and that its prime purpose is "to become the gove=ent." This view is based on the majoritarian assumption that democracy entails a two-party system (or possibly two opposing blocs of parties) that alternate in government; it fails to take into account that gove=ents in more consensual multiparty systems tend to be coalitions and that a change in government in these systems usually means only a partial change in the party composition of the government-instead of the opposition "becoming" the government.
The frequent use of the "turnover" test in order to determine whether a democracy has become stable and consolidated betrays the same majoritarian assumption. Samuel P. Huntington (1991, 266-67) even proposes a "two-turnover test," according to which "a democracy may be viewed as consolidated if the party or group that takes power in the initial election at the time of transition [to democracy] loses a subsequent election and turns over power to those election winners, and if those election winners then peacefully turn over power to the winners of a
INTRODUCTION 7
later election." Of the twenty long-term democracies analyzed in this book, all of which are undoubtedly stable and consolidated democratic systems, no fewer than four-Germany, Luxembourg, the Netherlands, and Switzerland-fail even the oneturnover test during the half-century from the late 1940s to 1996, that is, they experienced many cabinet changes but never a complete turnover, and eight -the same four countries plus Belgium, Finland, Israel, and Italy-fail the two-turnover test.
This book will show that pure or almost pure majoritarian democracies are actually qnite rare-limited to the United Kingdom, New Zealand (until 1996), and the former British colonies in the Caribbean (but only with regard to the executives-parties dimension). Most democracies have significant or even predominantly consensual traits. Moreover, as this book shows, consensus democracy may be considered more democratic than majoritarian democracy in most respects.
The ten contrasting characteristics of the two models of democracy, briefly listed above, are described in a preliminary fashion and exemplified by means of sketches of relatively pure cases of majoritarian democracy-the United Kingdom, New Zealand, and Barbados-and of relatively pure cases of consensus democracy-Switzerland, Belgium, and the European Union-in Chapters 2 and 3. The thirty-six empirical cases of democracy, including the five just mentioned [but not the European Union), that were selected for the comparative analysis are systematically introduced in Chapter 4. The ten institutional variables are then analyzed in greater depth in the nine chapters that comprise the bulk of this book (Chapters 5 to 13). Chapter 14 suromarizes the results and places the thirty-six democracies on a two-dimensional "conceptual map" of democracy; it also analyzes shifts on this map over time and shows that most countries occupy stable positions on the map. Chapters 15 and 16 ask the "so what?" question: does the type of democracy make a difference, especially with regard to effective economic policymaking and the quality of democracy? These chapters show that
8 INTRODUCTION
there are only small differences with regard to governing effectiveness but that consensus systems tend to score significantly higher on a wide array of indicators of democratic quality. Chapter 17 concludes with a look at the policy implications of the book's findings for democratizing and newly democratic countries.
~t!-
CHAPTER 2
The Westminster Model of Democracy
In this book I use the term Westminster model interchangeably with majoritarian model to refer to a general model of democracy. It may also be used more narrowly to denote the main characteristics of British parliamentary and gove=ental institutions (Wilson 1994; Mahler 1997)-the Parliament of the United Kingdom meets in the Palace of Westminster in London. The British version of the Westminster model is both the original and the best-known example of this model. It is also widely admired. Richard Rose (1974, 131J points out that, "with confidence born of continental isolation, Americans have come to assume that their institutions-the Presidency, Congress and the Supreme Court-are the prototype of what shonld be adopted elsewhere." But American political scientists, especially those in the field of comparative politics, have tended to hold the British system of gove=ent in at least equally high esteem (Kavanagh 1974).
One famous political scientist who fervently admired the Westminster model was President Woodrow Wilson. In his early writings he went so far as to urge the abolition of presidential government and the adoption of British-style parliamentary gove=ent in the United States. Such views have also been held by many other non-British observers of British politics, and many features of the Westminster model have been exported to
10 WESTMINSTER MODEL
other countries: Canada, Australia, New Zealand, and most of Britam's former colonies in Asia, Africa, and the Caribbean when they became independent. Wilson (1884, 33) referred to parliamentary gove=ent in accordance with the Westminster model as "the world's fashion."
The ten interrelated elements of the Westminster or majoritarian model are illustrated by features of three democracies that closely approximate this model and can be regarded as the majoritarian prototypes: the United Kingdom, New Zealand, and Barbados. Britam, where the Westminster model originated, is clearly the first and most obvious example to use. In many respects, however, New Zealand is an even better example-at least until its sharp turn away from majoritarianism in October 1996. The third example-Barbados-is also an almost perfect prototype of the Westminster model, although only as far as the first (executives-parties) dimension of the majoritarianconsensus contrast is concerned. In the following discussion of the ten majoritarian characteristics in the three countries, I emphasize not only their conformity with the general model but also occasional deviations from the model, as well as various other qualifications that need to be made.
The Westminster Model in the United Kingdom
1. Concentration of executive power in one-party and baremajority cabinets. The most powerful organ of British government is the cabinet. It is normally composed of members of the party that has the majority of seats in the House of Co=ons, and the minority is not included. Coalition cabinets are rare. Because in the British two-party system the two principal parties are of approximately equal strength, the party that wins the elections usually represents no more than a narrow majority, and the minority is relatively large. Hence the British one-party and bare-majority cabinet is the perfect embodiment of the principle of majority rule: it wields vast amounts of political power
WESTMINSTER MODEL 11
to rule as the representative of and in the interest of a majority that is not of overwhelming proportions. A large minority is excluded from power and condemned to the role of opposition.
Especially since 1945, there have been few exceptions to the British norm of one-party majority cabinets. David Butler (1978, 112) writes that "clear-cut single-party gove=ent has been much less prevalent than many would suppose," but most of the deviations from the norm-coalitions of two or more parties or minority cabinets-occurred from 1918 to 1945. The most recent instance of a coalition cabinet was the 1940-45 wartime coalition formed by the Conservatives, who had a parliamentary majority, with the Labour and Liberal parties, under Conservative Prime Minister Winston Churchill. The only instances of minority cabinets in the postwar period were two minority Labour cabinets in the 1970s. In the parliamentary election of February 1974, the Labour party won a plurality but not a majority of the seats and formed a minority gove=ent dependent on all other parties not uniting to defeat it. New elections were held that October and Labour won an outright, albeit narrow, majority of the seats; but this majority was eroded by defections and byelection defeats, and the Labour cabinet agam became a minority cabinet in 1976. It regamed a temporary legislative majority in 1977 as a result of the pact it negotiated with the thirteen Liberals in the House of Co=ons: the Liberals agreed to support the cabinet in exchange for consultation on legislative proposals before their submission to Parliament. No Liberals entered the cabinet, however, and the cabinet therefore continued as a minority instead of a true coalition cabinet. The so-called Lab-Lib pact lasted until 1978, and in 1979 Labour Prime Minister James Callaghan'S minority cabinet was brought down by a vote of no confidence in the House of Co=ons.
2. Cabinet dominance. The United Kingdom has a parliamentary system of government, which means that the cabinet is dependent on the confidence of Parliament. In theory, because the House of Co=ons can vote a cabinet out of office, it
':.j ~
12 WESTMINSTER MODEL
"controls" the cabinet. In reality, the relationship is reversed. Because the cabinet is composed of the leaders of a cohesive majority party in the House of Co=ons, it is normally backed by the majority in the House ofCo=ons, and it can confidently count on staying in office and getting its legislative proposals approved. The cabinet is clearly dominant vis-it-vis Parliaroent.
Because strong cabinet leadership depends on majority support in the House of Co=ons and on the cohesiveness of the majority party, cabinets lose some of their predominant position when either or both of these conditions are absent. Especially during the periods of minority gove=ent in the 1970s, there was a significant increase in the frequency of parliaroentary defeats of important cabinet proposals. This even caused a change in the traditional view that cabinets must resign or dissolve the House of Co=ons and call for new elections if they suffer a defeat on either a parliaroentary vote of no confidence or a major bill of central importance to the cabinet. The new unwritten rule is that only an explicit vote of no confidence necessitates resignation or new elections. The normalcy of cabinet dominance was largely restored in the 1980s under the strong leadership of Conservative Prime Minister Margaret Thatcher.
Both the normal and the deviant situations show that it is the disciplined two-party system rather than the parliaroentary system that gives rise to executive dominance. In multiparty parliamentary systems, cabinets-which are often coalition cabinetstend to be much less dominant (Peters 1997). Because of the concentration of power in a dominant cabinet, former cabinet minister Lord Hailsharo (1978, 127) has called the British system of gove=ent an "elective dictatorship.'"
1. In presidential systems of government, in which the presidential executive cannot normally be removed by the legislature (except by impeachment), the same variation in the degree of executive dominance can occur, depending on exactly how governmental powers are separated. In the United States, president and Congress can be said to be in a rough balance of power, but presidents in France and in some of the Latin American countries are considerably more powerful. Guillermo O'Donnell (1994, 59-60) has proposed the term "delega-
WESTMINSTER MODEL 13
3. Two-party system. British politics is dominated by two large parties: the Conservative party and the Labour party. Other parties also contest elections and win seats in the House of Commons-in particular the Liberals and, after their merger with the Social Democratic party in the late 1980s, the Liberal Democrats-but they are not large enough to be overall victors. The bulk of the seats are captured by the two major parties, and they form the cabinets: the Labour party from 1945 to 1951, 1964 to 1970, 1974 to 1979, and from 1997 on, and the Conservatives from 1951 to 1964, 1970 to 1974, and in the long stretch from 1979 to 1997. The hegemony of these two parties was especially pronounced between 1950 and 1970: jointly they never won less than 87.5 percent of the votes and 98 percent of the seats in the House of Co=ons in the seven elections held in this period.
.The interwar years were a transitional period during which the Labour party replaced the Liberals as one of the two big parties, and in the 1945 election, the Labour and Conservative parties together won about 85 percent of the votes and 92.5 percent of the seats. Their support declined considerably after 1970: their joint share of the popular vote ranged from only 70 percent (in 1983) to less than 81 percent (in 1979), but they continued to win a minimum of 93 percent of the seats, except in 1997, when their joint seat share fell to about 88.5 percent. The Liberals were the main beneficiaries. In ailiance with the Social Democratic party, they even won more than 25 percent of the vote on one occasion (in the 1983 election) but, until 1997, never more than fourteen seats by themselves and twenty-three seats in alliance with the Social Democrats. In the 1997 election, however, the Liberal Democrats captured a surprising forty-six seats with about 17 percent of the vote.
tive democracy"-akin to Hailsham's "elective dictatorship"-for systems with directly elected and dominant presidents; in such "strongly majoritarian" systems, "whoever wins election to the presidency is thereby entitled to govern as he or she sees fit, constrained only by the hard facts of existing power relations and by a constitutionally limited term of office."
14 WESTMINSTER MODEL
A corollary trait of two-party systems is that they tend to be one-dimensional party systems; that is, the programs and policies of the main parties usually differ from each other mainly with regard to just one dimension, that of socioeconomic issues. This is clearly the case for the British two-party system. The principal politically significant difference that divides the Conservative and Labour parties is disagreement about socioeconomic policies: on the left-right spectrum, Labour represents the left-of-center and the Conservative party the right-of-center preferences. This difference is also reflected in the pattern of voters' support for the parties in parliamentary elections: working-class voters tend to cast their ballots for Labour candidates and middle-class voters tend to support Conservative candidates. The Liberals and Liberal Democrats can also be placed easily on the socioeconomic dimension: they occupy a center position.
There are other differences, of course, but they are much less salient and do not have a major effect on the composition of the House of Commons and the cabinet. For instance, the ProtestantCatholic difference in Northern Ireland is the overwhelmingly dominant difference separating the parties and their supporters, but Northern Ireland contains less than 3 percent of the population of the United Kingdom, and such religious differences are no longer politically relevant in the British part of the United Kingdom (England, Scotland, and Wales). Ethnic differences explain the persistence of the Scottish National party and the Welsh nationalists, but these parties never manage to win more than a handful of seats. The only slight exception to the onedimensionality of the British party system is that a foreign-policy issue-British membership in the European Community-has frequently been a source of division both within and between the Conservative and Labour parties.
4. Majoritarian and disproportional system of elections. The House of Commons is a large legislative body with a membership that has ranged from 625 in 1950 to 659 in 1997. The mem-
WESTMINSTER MODEL 15
bers are elected in single-member districts according to the plurality method, which in Britain is usually referred to as the "first past the post" system: the candidate with the majority vote or, if there is no majority, with the largest minority vote wins.
This system tends to produce highly disproportional results. For instance, the Labour party won an absolute parliamentary majority of 319 out of 635 seats with only 39.3 percent of the vote in the October 1974 elections, whereas the Liberals won only 13 seats with 18.6 percent of the vote-almost half the Labour vote. In the five elections since then, from 1979 to 1997, the winning party has won clear majorities of seats with never more than 44 percent of the vote. All of these majorities have been what Douglas W. Rae (1967, 74) aptly calls "manufactured majorities"-majorities that are artificially created by the electoral system out of mere pluralities of the vote. In fact, all the winning parties since 1945 have won with the benefit of such manufactured majorities. It may therefore be more accurate to call the United Kingdom a plnralitarian democracy instead of a majoritarian democracy. The disproportionality of the plurality method can even produce an overall winner who has failed to win a plurality of the votes: the Conservatives won a clear seat majority in the 1951 election not just with less than a majority of the votes but also with fewer votes than the Labour party had received.
The disproportional electoral system has been particularly disadvantageous to the Liberals and Liberal Democrats, who have therefore long been in favor of introducing some form of proportional representation (PR). But because plurality has greatly benefited the Conservatives and Labour, these two major parties have remained committed to the old disproportional method. Nevertheless, there are some signs of movement in the direction of PRo For one thing, PR was adopted for all elections in Northern Ireland (with the exception of elections to the House of Commons) after the outbreak of Protestant-Catholic strife in the early 1970s. For another, soon after Labour's elec-
16 WESTMINSTER MODEL
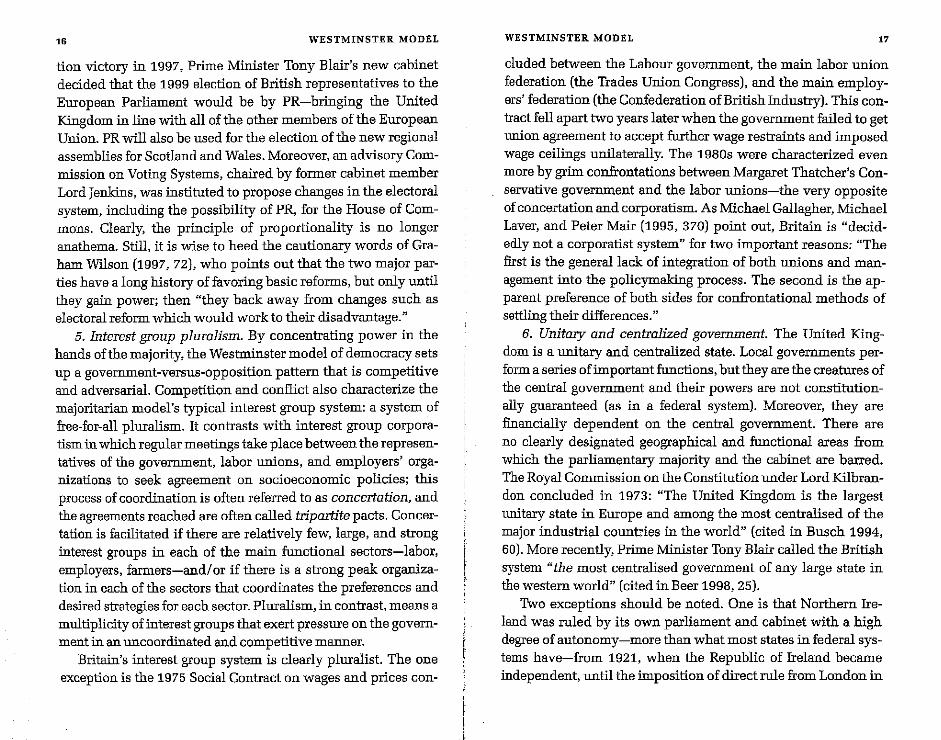
tion victory in 1997, Prime Minister Tony Blair's new cabinet decided that the 1999 election of British representatives to the European Parliament would be by PR-bringing the United Kingdom in line with all of the other members of the European Union. PR will also be used for the election of the new regional assemblies for Scotland and Wales. Moreover, an advisory Commission on Voting Systems, chaired by former cabinet member Lord Jenkins, was instituted to propose changes in the electoral system, including the possibility of PR, for the House of Commons. Clearly, the principle of proportionality is no longer anathema. Still, it is wise to heed the cautionary words of Graham Wilson (1997, 72), who points out that the two major parties have a long history of favoring basic reforms, but only until they gain power; then "they back away from changes such as electoral reform which would work to their disadvantage."
5. Interest group pluralism. By concentrating power in the hands of the majority, the Westminster model of democracy sets up a government-versus-opposition pattern that is competitive and adversarial. Competition and conflict also characterize the majoritarian model's typical interest group system: a system of free-far-all pluralism. It contrasts with interest group corporatism in which regular meetings take place between the representatives of the government, labor unions, and employers' organizations to seek agreement on socioeconomic policies; this process of coordination is often referred to as concertation, and the agreements reached are often called tripartite pacts. Concertation is facilitated if there are relatively few, large, and strong ioterest groups io each of the main functional sectors-labor, employers, farmers-and! or if there is a strong peak organization io each of the sectors that coordinates the preferences and desired strategies for each sector. Pluralism, in contrast, means a multiplicity of ioterest groups that exert pressure on the government in an uncoordinated and competitive manner.
Britain's interest group system is clearly pluralist. The one exception is the 1975 Social Contract on wages and prices con-
WESTMINSTER MODEL 17
cluded between the Labour government, the main labor union federation (the Trades Union Congress), and the main employers' federation (the Confederation of British Industry). This contract fell apart two years later when the government failed to get union agreement to accept further wage restraints and imposed wage ceilings unilaterally. The 1980s were characterized even more by grim confrontations between Margaret Thatcher's Conservative government and the labor unions-the very opposite of concertation and corporatism. As Michael Gallagher, Michael Laver, and Peter Mair (1995, 370) point out, Britain is "decidedly not a corporatist system" for two important reasons: "The first is the general lack of integration of both unions and management into the policymakiog process. The second is the apparent preference of both sides for confrontational methods of settliog their differences."
6. Unitary and centralized government. The United Kingdom is a unitary and centralized state. Local governments perform a series of important functions, but they are the creatures of the central government and their powers are not constitutionally guaranteed (as in a federal system). Moreover, they are financially dependent on the central government. There are no clearly designated geographical and functional areas from which the parliamentary majority and the cabinet are barred. The Royal Co=ission on the Constitution under Lord Kilbrandon concluded in 1973: "The United Kingdom is the largest unitary state in Europe and among the most centralised of the major industrial countries io the world" (cited in Busch 1994, 60). More recently, Prime Minister Tony Blair called the British system "the most centralised government of any large state in the western world" (cited in Beer 1998, 25).
Two exceptions should be noted. One is that Northern Ireland was ruled by its own parliament and cabinet with a high degree of autonomy-more than what most states in federal systems have-from 1921, when the Republic of Ireland became iodependent, until the imposition of direct rule from London in
,. WESTMINSTER MODEL
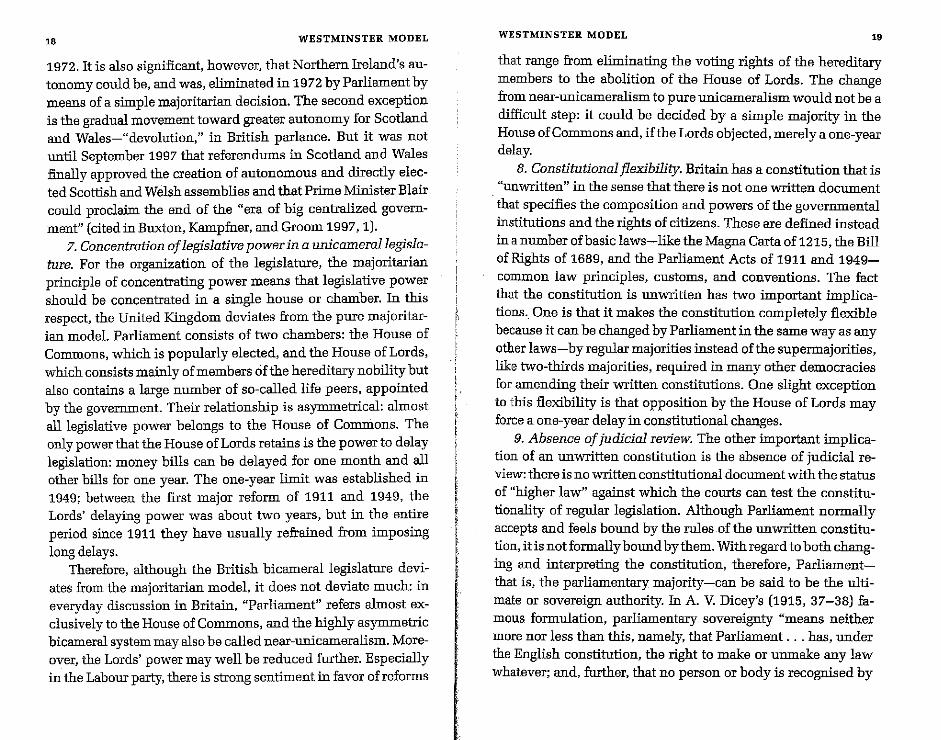
1972. It is also significant, however, that Northern Ireland's autonomy could be, and was, elimioated io 1972 by Parliament by means of a simple majoritarian decision. The second exception is the gradual movement toward greater autonomy for Scotland and Wales-"devolution," in British parlance. But it was not until September 1997 that referendums io Scotland and Wales finally approved the creation of autonomous and directly elected Scottish and Welsh assemblies and that Prime Minister Blair could proclaim the end of the "era of big centralized government" (cited io Buxton, Kampfner, and Groom 1997, 1).
7. Concentration of legislative power in a unicamerallegislature. For the organization of the legislature, the majoritarian principle of concentrating power means that legislative power should be concentrated io a siogle house or chamber. In this respect, the United Kiogdom deviates from the pure majoritarian model. Parliament consists of two chambers: the House of Co=ons, which is popularly elected, and the House of Lords, which consists maioly of members of the hereditary nobility but also contaios a large number of so-called life peers, appoioted by the government. Their relationship is asy=etrical: almost all legislative power belongs to the House of CoIIJ.Iri.ons. The only power that the House of Lords retains is the power to delay legislation: money bills can be delayed for one month and all other bills for one year. The one-year limit was established io 1949; between the first major reform of 1911 and 1949, the Lords' delaying power was about two years, but io the entire period sioce 1911 they have usually refraioed from imposing long delays.
Therefore, although the British bicameral legislature deviates from the majoritarian model, it does not deviate much: in everyday discussion io Britaio, "Parliament" refers almost exclusively to the House of Co=ons, and the highly asy=etric bicameral system may also be called near-unicameralism. Moreover, the Lords' power may well be reduced further. Especially io the Labour party, there is strong sentiment io favor ofreforms
WESTMINSTER MODEL 19
that range from eliminating the voting rights of the hereditary members to the abolition of the House of Lords. The change from near-unicameralism to pure unicameralism would not be a difficult step: it could be decided by a simple majority io the House of Co=ons and, if the Lords objected, merely a one-year delay.
B. Constitutional flexibility. Britaio has a constitution that is "unwritten" io the sense that there is not one written document that specifies the composition and powers of the governmental institutions and the rights of citizens. These are defined iostead in a number of basic laws-like the Magna Carta of1215, the Bill of Rights of 1689, and the Parliament Acts of 1911 and 1949-co=on law principles, customs, and conventions. The fact that the constitution is unwritten has two important implications .. One is that it makes the constitution completely flexible because it can be changed by Parliament io the same way as any other laws-by regular majorities iostead of the supermajorities, like two-thirds majorities, required io many other democracies for amending their written constitutions. One slight exception to this flexibility is that opposition by the House of Lords may force a one-year delay io constitutional changes.
9. Absence of judicial review. The other important implication of an unwritten constitution is the absence of judicial review: there is no written constitutional document with the status of "higher law" agaiost which the courts can test the constitutionality of regular legislation. Although Parliament normally accepts and feels bound by the rules of the unwritten constitution, it is not formally bound by them. With regard to both changing and ioterpreting the constitution, therefore, Parliamentthat is, the parliamentary majority-can be said to be the ultimate or sovereign authority. In A. V. Dicey's (1915, 37-38) famous formulation, parliamentary sovereignty "means neither more nor less than this, namely, that Parliament ... has, under the English constitution, the right to make or unmake any law whatever; and, further, that no person or body is recognised by

20 WESTMINSTER MODEL
the law of England as having a right to override or set aside the legislation of Parliament."
One exception to parliamentary sovereignty is that when Britain entered the European Co=unity-a supranational instead of merely an international organization-in 1973, it accepted the Co=unity's laws and institutions as higher authorities than Parliament with regard to several areas of policy. Because sovereignty means supreme and ultimate authority, Parliament can therefore no longer be regarded as fully sovereign. Britain's membership in the European Co=unitynow called the European Union-has also introduced a measure of judicial review both for the European Court of Justice and for British courts: "Parliament's supremacy is challenged by the right of the Co=unity institutions to legislate for the United Kingdom (without the prior consent of Parliament) and by the right of the courts to rule on the admissibility (in terms of Community law) of future acts of Parliament" (Coombs 1977, 88). Similarly, Britain has been a member of the European Convention on Human Rights since 1951, and its acceptance of an optional clause of this convention in 1966 has given the European Court of Human Rights in Strasbourg the right to review and invalidate any state action, including legislation, that it judges to violate the human rights entrenched in the convention (Cappelletti 1989, 202; Johnson 1998, 155-58).
10. A central bank controlled by the executive. Central banks are responsible for monetary policy, and independent banks are widely considered to be better at controlling inflation and maintaining price stability than banks that are dependent on the executive. However, central bank independence is clearly in conflict with the Westminster model's principle of concentrating power in the hands of the one-party majority cabinet. As expected, the Bank of England has indeed not been able to act independently and has instead been under the control of the cabinet. During the 1980s, pressure to make the Bank of England more autonomous increased. Two Conservative chancellors of
-'" -----
WESTMINSTER MODEL 21
the exchequer tried to convince their colleagues to take this big step away from the Westminster model, but their advice was rejected (Busch 1994,59). It was not until 1997-one of the first decisions of ilie newly elected Labour gove=ent -that the Bank of England was given the independent power to set interest rates.
The Wesbninster Model in New Zealand
Many of the Westminster model's features have been exported to oilier members of the British Co=onwealth, but only one country has adopted virtually the entire model: New Zealand. A major change away from majoritarianism took place in 1996 when New Zealand held its first election by PR, but the New: Zealand political system before 1996 can serve as a second instructive example of how the Westminster model works.
1. Concentration of executive power in one-parly and baremajority cabinets. For six decades, from 1935 to themid-1990s, New Zealand had single-party majority cabinets without exceptions or interruptions. Two large parties-the Labour party and the National party-dominated New Zealand politics, and they alternated in office. The one-party majority cabinet formed after the last plurality election in 1993 suffered a series of defections and briefly became a quasi-coalition cabinet (a coalition with the recent defectors), then a one-party minority cabinet, and finally a minority coalition-but all of these unusual cabinets occurred in the final phase of the transition to the new nonWestminster system (Boston, Levine, McLeay, and Roberts 1996, 93-96). The only other deviations from single-party majority gove=ent happened much earlier: New Zealand had a wartiroe coalition cabinet from 1915 to 1919, and another coalition was in power from 1931 to 1935.
2. Cabinet dominance. In this respect, too, New Zealand was a perfect example of the Westminster modeL Just as during most of the postwar period in the United Kingdom, the combination
22 WESTMINSTER MODEL
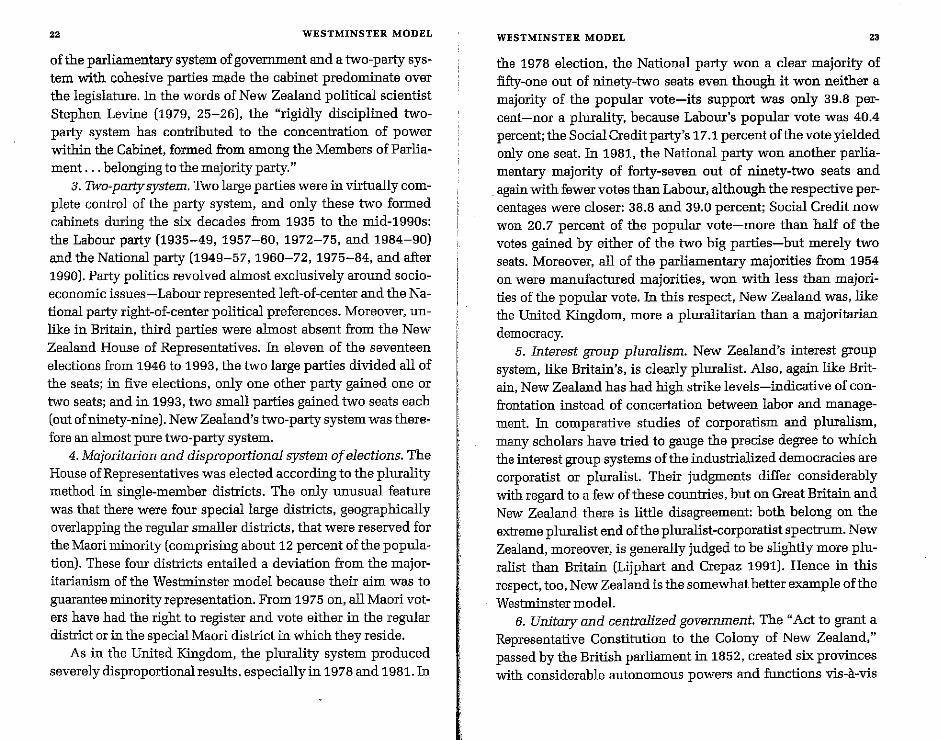
of the parliamentary system of government and a two-party system with cohesive parties made the cabinet predominate over the legislature. In the words of New Zealand political scientist Stephen Levine (1979, 25-26), the "rigidly disciplined twoparty system has contributed to the concentration of power within the Cabinet, formed from among the Members ofParliament ... belonging to the majority party."
3. Two-party system. Two large parties were in virtually complete control of the party system, and only these two formed cabinets during the six decades from 1935 to the mid-1990s: the Labour party (1935-49, 1957-60, 1972-75, and 1984-90) and the National party (1949-57, 1960-72, 1975-84, and after 1990). Party politics revolved almost exclusively around socioeconomic issues-Labour represented left-of-center and the National party right-of-center political preferences. Moreover, unlike in Britain, third parties were almost absent from the New Zealand House of Representatives. In eleven of the seventeen elections from 1946 to 1993, the two large parties divided all of the seats; in five elections, only one other party gained one or two seats; and in 1993, two small parties gained two seats each (out of ninety-nine). New Zealand's two-party system was therefore an almost pure two-party system.
4. Majoritarian and disproportional system of elections. The House of Representatives was elected according to the plurality method in single-member districts. The only unusual feature was that there were four special large districts, geographically overlapping the regular smaller districts, that were reserved for the Maori minority (comprising about 12 percent of the population). These four districts entailed a deviation from the majoritarianism of the Westminster model because their aim was to guarantee minority representation. From 1975 on, all Maori voters have had the right to register and vote either in the regular district or in the special Maori district in which they reside.
As in the United Kingdom, the plurality system produced severely disproportionalresnlts, especially in 1978 and 1981. In
WESTMINSTER MODEL 23
the 1978 election, the National party won a clear majority of fifty-one out of ninety-two seats even though it won neither a majority of the popular vote-its support was only 39.8 percent-nor a plurality, because Labour's popular vote was 40.4 percent; the Social Credit party's 17.1 percent of the vote yielded only one seat. In 1981, the National party won another parliamentary majority of forty-seven out of ninety-two seats and
. again with fewer votes than Labour, although the respective percentages were closer: 38.8 and 39.0 percent; Social Credit now won 20.7 percent of the popular vote-more than half of the votes gained by either of the two big parties-but merely two seats. Moreover, all of the parliamentary majorities from 1954 on were manufactured majorities, won with less than majorities of the popular vote. In this respect, New Zealand was, like the United Kingdom, more a pluralitarian than a majoritarian democracy.
5. Interest group pluralism. New Zealand's interest group system, like Britain's, is clearly pluralist. Also, again like Britain, New Zealand has had high strike levels-indicative of confrontation instead of concertation between labor and management. In comparative studies of corporatism and pluralism, many scholars have tried to gauge the precise degree to which the interest group systems of the industrialized democracies are corporatist or pluralist. Their judgments differ considerably with regard to a few of these countries, but on Great Britain and New Zealand there is little disagreement: both belong on the extreme pluralist end of the pluralist-corporatist spectrum. New Zealand, moreover, is generally judged to be slightly more pluralist than Britain (Lijphart and Crepaz 1991). Hence in this respect, too, New Zealand is the somewhat better example of the Westminster modeL
6. Unitary and centralized government. The "Act to grant a Representative Constitution to the Colony of New Zealand," passed by the British parliament in 1852, created six provinces with considerable autonomous powers and functions vis-a-vis
24 WESTMINSTER MODEL
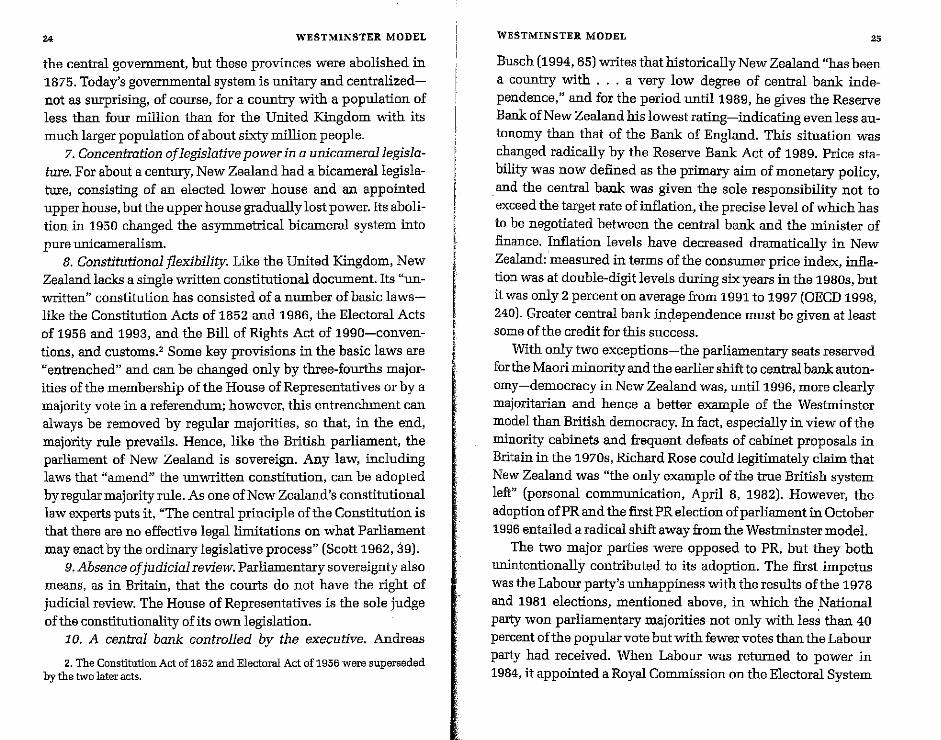
the central gove=ent, bnt these provinces were abolished in 1875. Today's gove=ental system is nnitary and centralizednot as smprising, of course, for a country with a popnlation of less than four million than for the United Kingdom with its much larger popnlation of about sixty million people.
7. Concentration of legislative power in a unicamerallegislature. For about a century, New Zealand had a bicamerallegislature, consisting of an elected lower house and an appointed upper house, but the upper house gradually lost power. Its abolition in 1950 changed the asymmetrical bicameral system into pure nnicameralism.
8. Constitutional flexibility. Like the United Kingdom, New Zealand lacks a single written constitutional document. Its "unwritten" constitution has consisted of a number of basic lawslike the Constitution Acts of 1852 and 1986, the Electoral Acts of 1956 and 1993, and the Bill of Rights Act of 1990-conventions, and customs.' Some key provisions in the basic laws are "entrenched" and can be changed only by three-fourths majorities of the membership of the House of Representatives or by a majority vote in a referendum; however, this entrenchment can always be removed by regnlar majorities, so that, in the end, majority rule prevails. Hence, like the British parliament, the parliament of New Zealand is sovereign. Any law, including laws that "amend" the unwritten constitution, can be adopted by regnlar majority rule. As one of New Zealand's constitutional law experts puts it, "The central principle of the Constitution is that there are no effective legal limitations on what Parliament may enact by the ordinary legislative process" (Scott 1962,39).
9. Absence ofjudicial review. Parliamentary sovereignty also means, as in Britain, that the courts do not have the right of judicial review. The House of Representatives is the sole judge of the constitutionality of its own legislation.
10. A central bank controlled by the executive. Andreas
2. The Constitution Act of 1852 and Electoral Act of 1956 were superseded by the two later acts.
WESTMINSTER MODEL 25
Busch (1994, 65) writes that historically New Zealand "has been a country with ... a very low degree of central bank independence," and for the period until 1989, he gives the Reserve Bank of New Zealand his lowest rating-indicating even less autonomy than that of the Bank of England. This situation was changed radically by the Reserve Bank Act of 1989. Price stability was now defined as the primary aim of monetary policy,
. and the central bank was given the sole responsibility not to exceed the target rate of inflation, the precise level of which has to be negotiated between the central bank and the minister of finance. Inflation levels have decreased dramatically in New Zealand: measured in terms of the consumer price index, inflation was at double-digit levels during six years in the 1980s, but it was only 2 percent on average from 1991 to 1997 (OECD 1998, 240). Greater central bank independence must be given at least some of the credit for this success.
With only two exceptions-the parliamentary seats reserved for the Maori minority and the earlier shift to central bank autonomy-democracy in New Zealand was, until 1996, more clearly majoritarian and hence a better example of the Westminster model than British democracy. In fact, especially in view of the minority cabinets and frequent defeats of cabinet proposals in Britain in the 1970s, Richard Rose conld legitimately claim that New Zealand was "the only example of the true British system left" (personal co=nnication, April 8, 1982). However, the adoption ofPR and the first PR election of parliament in October 1996 entailed a radical shlft away from the Westroinster model.
The two major parties were opposed to PR, but they both uniotentionally contributed to its adoption. The first impetus was the Labour party's unhappiness with the resnlts of the 1978 and 1981 elections, mentioned above, in which the ,National party won parliamentary majorities not only with less than 40 percent of the popnlar vote but with fewer votes than the Labour party had received. When Labour was returned to power in 1984, it appointed a Royal Co=ission on the Electoral System
26 WESTMINSTER MODEL
to reco=end improvements. The co=ission's terms of reference were very broad, however, and it reco=ended not just small adjustments but a radical change to PR as well as a referendum on whether to adopt it. The government tried to deflect this proposal by turning it over to a parliamentary committee, which, as expected, rejected PR and instead merely recommended minor changes. The election campaign of 1987 put PR back on the political agenda: the Labour prime minister promised to let the voters decide the issue by referendum, but his party retreated from this pledge after being reelected. Seeking to embarrass Labour, the National party opportunistically made the same promise in the 1990 campaign, and when they won the election, they could not avoid honoring it. The voters then twice endorsed PR in referendums held in 1992 and 1993 [Jackson and McRobie 1998).
The form of PR that was adopted and used in the 1996 election was a system, modeled after the German system, in which sixty-five members are elected by plurality in single-member districts-including five special Maori districts-and fifty-five members by PR from party lists; a crucial provision is that this second set of fifty-five seats is allocated to the parties in a way that makes the overall result as proportional as possible. Therefore, although the New Zealand term for this system is the "mixed member proportional" (MMP) system, implying that it is a mixture of PR and something else, it is in fact clearly and fully a PR system.3
The first PR election instantly transformed New Zealand politics in several respects (Vowles, Aimer, Banducci, and Karp 1998). First, the election result was much more proportional than those of the previous plurality elections. The largest party, the National party, was still overrepresented, but by less than three percentage points; it won 33.8 percent of the vote and 36.7
3. Each voter has two votes, one for a district candidate and one for a party list. To avoid excessive fragmentation, parties must win either a minimum of 5 percent of the list votes or at least one district seat to qualify for list seats.
F
WESTMINSTER MODEL 27
percent of the seats. Second, the election produced a multiparty system with an unprecedented six parties gaining representation in parliament. Third, unlike in any other postwar election, no party won a majority of the seats. Fourth, an ethnic dimension was added to the party system: the New Zealand First party, led by a Maori and winning seventeen seats, including all five of the special Maori seats, became the main representative of the Maori minority (although it was not a specifically Maori party nor supported exclusively by Maori voters). The Christian Coalition almost succeeded in making the party system even more multidimensional by adding a religious issue dimension, but its vote fell just short of the required 5 percent threshold. Fifth, in contrast with the long line of previous single-party majority cabinets, a two-party coalition cabinet was formed by the National and New Zealand First parties.
Because of these signific~t deviations from the majorita..-:ian model, post-1996 New Zealand is no longer a good, let alone the best, example of the "true British system." Hence, in Kurt von Mettenheim's (1997, 11) words, "the United Kingdom [now] appears to be the on! y country to have retained the central features of the Westminster modeL" It should be noted, however, that all of the post-1996 changes in New Zealand heve to do with the executives-parties dimension of the majoritarian model, comprising the first five of the ten characteristics of the model, and that, especially with regard to this first dimension, several other former British colonies continue to have predominantly Westminster-style institutions. A particularly clear and instructive example is Barbados.
The Westminster Model in Barbados
Barbados is a small island state in the Caribbean with a population of about a quarter of a million. It has a "strongly homogeneous society" that is mainly of African descent (Duncan 1994, 77). It gained its independence from Britain in 1966, but there
28 WESTMINSTER MODEL
continues to be "a strong aod pervasive sense of British tradition aod culture" (Baoks, Day, aod Muller 1997, 69)-including British political traditions. Barbados is often called the "Little Englaod" of the Caribbeao.
1. Concentration of executive power in one-party and baremajority cabinets. Since independence in 1966, Barbados has had single-party majority cabinets. Its two large parties-the Barbados Labour party (BLP) aod the Democratic Labour party (DLP)-have been the overwhelmingly dominaot forces in Barbados politics, aod they have alternated in office. Unlike in the British aod New Zealaod cases, there are no exceptions or qualifications to this pattern that need to be noted. In fact, the pattern extends back to colonial times. Ever since the establishment of universal suffrage aod cabinet government in the early 1950s, the sequence of single-party majority cabinets has been unbroken.
2. Cabinet dominance. Barbadiao cabinets have been at least as dominaot as those of the two earlier examples of the Westminster model. The term elective dictatorship, coined by Lord Hailsham for Britain also fits the Barbados system well (Payoe 1993,69). One special reason for the predominaoce of the cabinet in Barbados is the small size of the legislature. The Barbadiao House of Assembly had only twenty-four members from
. 1966 to 1981; this number was increased only slightly to twentyseven in 1981 aod twenty-eight in 1991. Maoy of the legislators are therefore also cabinet ministers, which in turn meaos that, as Trevor Munroe (1996, 108) points out, almost one-third of the members of the legislature "are in effect constitutionally debarred from ao independent aod critical staoce in relation to the executive."
3. Two-party system. The same two large parties have controlled the party politics of Barbados since independence, aod they have formed all of the cabinets: the DLP from 1966 to 1976 aod from 1986 to 1994, aod the BLP between 1976 to 1986 aod from 1994 on. These two parties differ from each other mainly
I""
WESTMINSTER MODEL 29
on socioeconomic issues, with the BLP occupying the right-ofcenter aod the DLP the left-of-center position on the left-right spectrum. In five of the seven elections since 1966, no third parties won aoy seats; only one small party won two seats in 1966, aodaoother small party won oneseatin 1994. The strength of the two-party system is also illustrated by the fate of the four members of parliament who defected from the ruling DLP in 1989 aod formed a separate party. As Tony Thorndike (1993, 158) writes, this new party "did not long survive the logic of the 'first past the post' Westminster system aod the two-party culture of Barbados. In elections in Jaouary 1991 it lost all its four seats."
4. Majoritarian and disproportional system of elections. In the elections before independence, including the 1966 election, which was held several months before formal independence took place, Barbados used the plurality method but not in the usual single-member districts. Instead, two-member districts were used (E=aouel1992, 6; Duncao 1994,78); these tend to increase the disproportionality of the election results because, in plurality systems, disproportionality increases as the number of representatives elected per district increases. Since 1971, all elections have been by plurality in single-member districts, but electoral disproportionality has remained high. For instaoce, in 1971 the DLP won three-fourths of the seats with 57.4 percent of the votes, aod in 1986 it won twenty-four of the twenty-seven seats (88.9 percent) with 59.4 percent of the votes. In three of the elections since 1966, th,e parliamentary majorities were "maoufactured" from pluralities of the vote, but in the other four elections the seat majoritie,s were genuinely "earned" with popular vote majorities. On balaoce, therefore, Barbados has been less of a pluralitariao democracy thao Britain aod New Zealaod. Moreover, unlike the other two countries, Barbados has not experienced aoy instaoces of a parliamentary majority won on the basis of a second-place finish in the popular vote.
5. Interest group pluralism. Again like the United Kingdom
30 WESTMINSTER MODEL
and New Zealand, Barbados has had an interest group system that is pluralist rather than corporatist. In recent years, however, there has been a trend toward corporatist practices. In 1993, the government, business leaders, and labor unions negotiated a pact on wages and prices, which included a wage freeze. This agreement was replaced two years later by a new and more flexible tripartite pact.
6-10. The chamcteristics of the second (fedeml-unitary) dimension of the majoritarian model. Barbados has a unitary and centralized form of government-hardly surprising for a small country with only a quarter of a million people-but as far as the other four characteristics of the federal-unitary dimension are concerned, it does not fit the pure majoritarian model. It has a bicameral legislature consisting of a popularly elected House of Assembly and an appointed Senate that can delay but not vetoa case of asymmetrical bicameralism. It has a written constitution that can be amended only by two-thirds majorities in both houses of the legislature. The constitution explicitly gives the courts the right of judicial review. Finally, the central bank of Barbados has a charter that gives it a medium degree of autonomy in monetary policy (Cukierman, Webb, and Neyapti 1994, 45).
Anthony Payne (1993) argues that the former Britishcolonles in the Caribbean are characterized not by Westminster systems but by "Westminster adapted." As illustrated by Barbados-but by and large also true for the other Co=onwealth democracies in the region-this adaptation has affected mainly the second dimension of the Westminster model. On the first (executivesparties) dimension, the Westminster model has remained almost completely intact. The fact that Barbados deviates from majoritarianism with regard to most of the characteristics of the federal-unitary dimension does not mean, of course, that it deviates to such an extent that it is a good example of the contrasting model of consensus democracy. In order to illustrate the consensus model, I turn in the next chapter to the examples of Switzerland, Belgium, and the European Union.
CHAPTER 3
The Consensus Model of Democracy
The majoritarian interpretation of the basic definition of democracy is that it means "government by the majority of the people." It argues.that majorities should govern and that minorities should oppose. This view is challenged by the consensus model of democracy. As the Nobel Prize-winningeconomist Sir Arthur Lewis (1965, 64-65) has forcefully pointed out, majority rule and the government-versus-opposition pattern of politics that it implies may be interpreted as undemocratic because they are principles of exclusion. Lewis states that the primary meaning of democracy is that "all who are affected by a decision should have the chance to participate in making that decision either directly or through chosen representatives." Its secondary meaning is that "the will of the majority shall prevail." If this means that winning parties may make all the governmental decisions and that the losers may criticize but not govern, Lewis argues, the two meanings are incompatible: "to exclude the losing groups from participation in decisionmaking clearly violates the primary meaning of democracy."
Majoritarians can legitimately respond that, under two conditions, the incompatibility noted by Lewis can be resolved. First, the exclusion of the minority is mitigated if majorities and minorities alternate in government-that is, if today's minority can become the majority in the next election instead of being
32 CONSENSUS MODEL
condemned to permanent opposition. This is how the British. New Zealand, and Barbadian two-party systems have worked. In Barbados, alternation has operated perfectly since independence in 1966: neither of the two main parties has won more than two elections in a row. In Britain and New Zealand, however, there have been long periods in which one of the two main parties was kept out of power: the British Labour party during the thirteen years from 1951 to 1964 and the eighteen years from 1979 to 1997, the New Zealand National party forfourteen years from 1935 to 1949, and New Zealand Labour for twelve years from 1960 to 1972.
Even during these extended periods of exclusion from power, one can plausibly argue that democracy and majority rule were not in conflict because of the presence of a second condition: the fact that all three countries are relatively homogeneous societies and that their major parties have usually not been very far apart in their policy outlooks because they have tended to stay close to the political center. One party's exclusion from power may be undemocratic in terms of the "government by the people" criterion, but if its voters' interests and preferences are reasonably well served by the other party's policies in government, the system approximates the "government for the people" definition of democracy.
In less homogeneous societies neither condition applies. The policies advocated by the principal parties tend to diverge to a greater extent, and the voters' loyalties are frequently more rigid, reducing the chances that the main parties will alternate in exercising gove=ental power. Especially in plural societiessocieties that are sharply divided along religious, ideological, linguistic, cultural, ethnic, or racial lines into virtually separate subsocieties with their own political parties, interest groups, and media of co=unication-the flexibility necessary for majoritarian democracy is likely to be absent. Under these conditions, majority rule is not only undemocratic but also dangerous, because minorities that are continually denied access to power
CONSENSUS MODEL 33
will feel excluded and discriminated against and may lose their allegiance to the regime. For instance, in the plural society of Northern Ireland, divided into a Protestant majority and a Catholic minority, majority rule meant that the Unionist party representing the Protestant majority won all the elections and formed all of the gove=ents between 1921 and 1972. Massive Catholic protests in the late 1960s developed into a Protestant-Catholic civil war that could be kept under control only by British military intervention and the imposition of direct rule from London.
In the most deeply divided societies, like Northern Ireland, majority rule spells majority dictatorship and civil strife rather than democracy. What such societies need is a democratic regime that emphasizes consensus instead of opposition, that includes rather than excludes, and that tries to maximize the size of the ruling majority instead of being satisfied with a bare majority: consensus democracy. Despite their own majoritarian inclinations, successive British cabinets have recognized this need: they have insisted on PR in all elections in Northern Ireland (except those to the House of Co=ons) and, as a precondition for returning political autonomy to Northern Ireland, on broad Protestant-Catholic power-sharing coalitions. PR and power-sharing are also key elements in the agreement on Northern Ireland reached in 1998. Similarly, Lewis (1965, 51-55, 65-84) strongly reco=ends PR, inclusive coalitions, and federalism for the plural societies of West Africa. The consensus model is obviously also appropriate for less divided but still heterogeneous countries, and it is a reasonable and workable alternative to the Westminster model even in fairly homogeneous countries.
The examples I use to illustrate the consensus model are Switzerland, Belgium, and the European Union-all multiethnie entities. Switzerland is the best example: with one exception it approximates the pure model perfectly. Belgium also provides a good example, especially after it formally became a federal state in 1993; I therefore pay particular attention to the
34 CONSENSUS MODEL
pattern of Belgian politics in the most recent period. The European Union (EU) is a supranational organization-more than just an international organization-but it is not, or not yet, a sovereign state. Because of the EU's intermediate status, analysts of the European Union disagree on whether to study it as an international organization or an incipient federal state, but the latter approach is increasingly common (Hbc 1994). This is also my approach: if the EU is regarded as a federal state, its institutions are remarkably close to the consensus model of democracy. I discuss the Swiss and Belgian prototypes first and in tandem with each other and then turn to the EU example.
The Consensus Model in Switzerland and Belgium
The consensus model of democracy may be described in terms of ten elements that stand in sharp contrast to each of the ten majoritarian characteristics of the Westminster model. Instead of concentrating power in the hands of the majority, the consensus model tries to share, disperse, and restrain power in a variety of ways.
1. Executive power-sharing in broad coalition cabinets. In contrast to the Westminster model's tendency to concentrate executive power in one-party and bare-majority cabinets, the consensus principle is to let all or most of the important parties share executive power in a broad coalition. The Swiss sevenmember national executive, the Federal Council, offers an excellent example of such a broad coalition: the three large partiesChristian Democrats, Social Democrats, and Radical Democrats -each of which has held about one-fourth of the seats in the lower house of the legislature during the post-World War II era, and the Swiss People's party, with about one-eighth of the seats, share the seven executive positions proportionately according to the so-called magic formula of2:2:2:1, established in 1959. An additional criterion is that the linguistic groups be represented
CONSENSUS MODEL 35
in rough proportion to their sizes: four or five German-speakers, one or two French-speakers, and frequently an Italian-speaker. Both criteria are informal rules but are strictly obeyed.
The Belgian constitution offers an example of a formal requirement that the executive include representatives of the large linguistic groups. For many years, it had already been the custom to form cabinets with approxiroately equal numbers of ministers representing the Dutch-speaking majority and the French-speaking minority. This became a formal rule in 1970, and the new federal constitution again stipulates that "with the possible exception of the Prime Minister, the Council of Ministers [cabinet] includes as many French-speaking members as Dutch-speaking members" (Alen and Ergec 1994). Such a rule does not apply to the partisan composition of the cabinet, but there have only been about four years bf one-party rule in the postwar era, and since 1980 all cabinets have been coalitions of between four and six parties.
2. Executive-legislative balance of power. The Swiss political system is neither parliamentary nor presidential. The relationship between the executive Federal Council and the legislature is explained by Swiss political scientist Jiirg Steiner (1974, 43) as follows: "The members of the council are elected individually for a fixed term of four years, and, according to the Constitution, the legislature cannot stage a vote of no confidence during that period. If a government proposal is defeated by Parliament, it is not necessary for either the member sponsoring this proposal or the Federal Council as a body to resign." This formal separation of powers has made both the executive and the legislature more independent, and their relationship is much more balanced than cabinet-parliament relationships in the British, New Zealand, and Barbadian cases in which the cabinet is clearly dominant. The Swiss Federal Council is powerful but not supreme.
Belgium has a parliamentary form of government with a cabinet dependent on the confidence of the legislature, as in the
36 CONSENSUS MODEL
three prototypes of the Westminster model. However, Belgian cabinets, largely because they are often broad and uncohesive coalitions, are not at all as dominant as their Westminster counterparts, and they tend to have a genuine give-and-take relationship with parliament. The fact that Belgian cabinets are often short-lived attests to their relatively weak position: from 1980 to 1995, for instance, there were six cabinets consisting of different multiparty coalitions-with an average cabinet life of only about two and a half years.
3. Multiparty system. Both Switzerland and Belgium have multiparty systems without any party that comes close to majority statos. In the 1995 elections to the Swiss National Council, fifteen parties won seats, but the bulk of these seats-162 out of 200-were captured by the four major parties represented on the Federal Council. Switzerland may therefore be said to have a four-party system.
Until the late 1960s, Belgium was characterized by a threeparty sy~tem consisting of two large parties-Christian Democrats and Socialists-and the medium-sized Liberals. Since then, however, these maj or parties have split along linguistic lines and several new linguistic parties have attained prominence' creating an extreme multiparty system: about a dozen parties have usually been able to win seats in the Chamber of Representatives, and nine of these have been important enough to be included in one or more cabinets.
The emergence of multiparty systems in Switzerland and Belgium can be explained in terms of two factors. The first is that the two countries are plural societies, divided along several lines of cleavage. This multiplicity of cleavages is reflected in the multidimensional character of their party systems. In Switzerland, the religious cleavage divides the Christian Democrats, mainly supported by practicing Catholics, from the Social Democrats and Radicals, who draw most of their support from Catholics who rarely or never attend church and from Protestants. The
CONSENSUS MODEL 37
socioeconomic cleavage further divides the Social Democrats, backed mainly by the working class, from the Radical Democrats, who have more middle-class support. The Swiss People's party is especially strong among Protestant farmers. The third source of cleavage, language, does not cause much further division in the Swiss party system, although the Swiss People's party's support is mainly in German-speaking Switzerland, and the three large parties are relatively loose alliances of cantonal parties within which the linguistic cleavage is a significant differentiator (McRae 1983, 111-14).
Similarly, the religious cleavage in Catholic Belgium divides the Christian Social parties, representing the more faithful Catholics, from the Socialists and Liberals, representing rarely practicing or non-practicing Catholics. The Socialists and Liberals are divided from each other by class differences. In contrast with Switzerland, the linguistic cleavage in Belgium has caused further splits both by dividing the above three groupings, which used to be Belgium's three dominant parties, into sep!ll:ate and smaller Dutch-speaking and French-speaking parties and by creating several additional small linguistic parties (McRae 1986, 130-48).
4. Proportional representation. The second explanation for the emergence of multiparty systems in Switzerland and Belgium is that their proportional electoral systems have not inhibited the translation of societal cleavages into party-system cleavages. In contrast with the plurality method, which tends to overrepresent large parties and to underrepresent small parties, the basic aim of proportional representation (PR) is to divide the parliamentary seats among the parties in proportion to the votes they receive. The lower houses of both legislatures are elected byPRo
5. Interest group corporatism. There is some disagreement among experts on corporatism about the degree of corporatism in Switzerland and Belgium, mainly because the labor unions
38 CONSENSUS MODEL
in these two countries tend to be less well organized and less influential than business. This disagreement can be resolved, however, by distinguishing between two variants of corporatism: social corporatism in which the labor unions predominate and liberal corporatism in which business associations are the stronger force. Peter J. Katzenstein (1985, 105, 130) uses Switzerland and Belgium as two exemplars of the latter, and he concludes that Switzerland "most clearly typifies the traits characteristic of liberal corporatism." Both countries clearly show the three general elements of corporatism: tripartite concertation, relatively few and relatively large interest groups, and the prominence of peak associations. Gerhard Lehmbruch (1993, 52) writes that "the strength of Swiss peak associations is remarkable, and it is generally acbowledged that the cohesion of Swiss interest associations is superior to that of Swiss political parties." Moreover, Klaus Armingeon (1997) argues that, although the extent and effectiveness of corporatism in many European countries has been declining in the 1990s, it continues to be strong in Switzerland.
6. Federal and decentralized government. Switzerland is a federal state in which power is divided between the central government and the governments of twenty cantons and six socalled half-cantons, produced by splits in three formerly united cantons. The half-cantons have only one instead of two representatives in the Swiss federal chamber, the Council of States, and they carry only half the weight of the regular cantons in the voting on constitutional amendments; in most other respects, however, their status is equal to that of the full cantons. Switzerland is also one of the world's most decentralized states.
Belgium was a unitary and centralized state for a long time, but from 1970 on it gradually moved in the direction of both decentralization and federalism; in 1993, it formally became a federal state. The form of federalism adopted by Belgium is a "unique federalism" (Fitzmaurice 1996) and one of "Byzantine
CONSENSUS MODEL 39
complexity" (McRae 1997, 289), because it consists of three geographically defined regionS-Flanders, Wallonia, and the bilingual capital of Brussels-and three nongeographically defined cultural co=unities-the large Flemish and French co=unities and the much smaller German-speaking co=unity. The main reason for the construction of this two-layer system was that the bilingual area of Brussels has a large majority of Frenchspeakers, but that it is surrounded by Dutch-speaking Flanders. There is a considerable overlap between regions and co=unities, but they do not match exactly. Each has its own legislatore and executive, except that in Flanders the government of the Flemish cO=unity also serves as the government of the Flemish region.
7. Strong bicameralism. The principal justification for instituting a bicameral instead of a unicameral legislature is to give special representation to minorities, including the smaller states in federal systems, in a second chamber or upper house. Two conditions have to be fulfilled if this minority representation is to be meaningful: the upper house has to be elected on a different basis than the lower house, and it must have real power-ideally as much power as the lower house. Both of these conditions are met in the Swiss system: the National Council is the lower house and represents the Swiss people, and the Council of States is the upper or federal chamber representing the cantons, with each canton having two representatives and each half-canton one representative. Hence the small cantons are much more strongly represented in the Council of States than in the National Council. Moreover, as Wolf Linder (1994, 47) writes, the "absolute equality" of the two chambers is a "sacrosanct rule" in Switzerland.
The two Belgian chambers of parliament-the Chamber of Representatives and the Senate-had virtually equal powers in prefederal Belgium, but they were both proportionally constituted and hence very similar in composition. The new Senate,
40 CONSENSUS MODEL
elected for the first time in 1995, especially represents the two cultural-linguistic groups, but it is still largely proportionally constituted and not designed to provide overrepresentation for the French-speaking and German-speaking minorities.' Moreover, its powers were reduced in comparison with the old Senate; for instance, it no longer has budgetary authority (Senelle 1996, 283). Hence the new federal legislature of Belgium exemplifies a relatively weak rather than strong bicameralism.
8. Constitutional rigidity. Both Belgium and Switzerland have a written constitution-a single document containing the basic rules of governance-that can be changed only by special majorities. Amendments to the Swiss constitution require the approval in a referendum of not ouly a nationwide majority of the voters but also majorities in a majority of the cantons. The half-cantons are given half weight in the canton-by-canton calcplation; this means that, for instance, a constitutional amendment can be adopted by 13.5 cantons in favor and 12.5 against. The requirement of majority cantonal approval means that the populations of the smaller cantons and half-cantons, with less than 20 percent of the total Swiss population, can veto constitutional changes.
In Belgium, there are two types of supermajorities. All constitutional amendments require the approval oftwo-thirds'majorities in both houses of the legislature. Moreover, laws pertaining to the organization and powers of the co=unities and regions have a semiconstitutional status and are even harder to adopt and to amend: in addition to the two-thirds majorities in
1. Most senators-forty out of seventy-one-are directly elected from two multimember districts that are partly defined in nongeographical terms-one comprising Flanders and Dutch-speakers in Brussels and the other Wallonia and French-speaking Bruxellois. The remainjng thlrty-one senators are indirectly elected or coopted in different ways. The overall linguistic composition is: fortyOile Dutch-speakers, twenty-nine French-speakers, and Oile German-speaker. A fwther curious provision is that any adult children of the king are "senators by right."
CONSENSUS MODEL 41
both houses, they require the approval of majorities within the Dutch-speaking group as well as within the French-speaking group in each of the houses. This rule gives the French-speakers an effective minority veto.
9. Judicial review. Switzerland deviates in one respect from the pure consensus model: its supreme court, the Federal Tribunal, does not have the rigltt of judicial review. A popular initiative that tried to introduce it was decisively rejected in a 1939 referendum (Codding 1961, 112).2
There was no judicial review in Belgium either until 1984, when the new Court of Arbitration was inaugurated. The court's original main responsibility was the interpretation of the constitutional provisions concerning the separation of powers between the central, co=unity, and regional governments. Its authority was greatly expanded by the constitutional revision of 1988, and the Court of Arbitration can now be regarded as agenuine constitutional court (Alen and Ergec 1994, 20-22; Verougstraete 1992, 95).
10. Central bank independence. Switzerland's central bank has long been regarded as one of the strongest and most independent central banks, together with the German Bundesbank and the Federal Reserve System in the United States. In contrast, the National Bank of Belgium was long one of the weakest central banks. However, its autonomy was substantially reinforced in the early 1990s, roughly at the same time as the transition to a federal system, but mainly as a result of the Maastricht Treaty, signed in 1992 and ratified in 1993, which obligated the EU member states to enhance the independence of their central banks. Robert Senelle (1996, 279) concludes that the Belgian central bank now enjoys a "high degree of autonomy ... in the conduct ofits monetary policy."
2. National laws can, however, be challenged in a different manner: if, within ninety days of the passage ofalaw, a minimum offifty thousand citizens demand a referendum on it, a majority of Swiss voters can reject it.
42 CONSENSUS MODEL
The Consensus Model in the European Union
The principal institutions of the European Union do not fit the classification into executive, legislative, judicial, and monetary organs as easily as those of the five sovereign states discussed so far. This is especially true for the European Council, which consists of the heads of gove=ent of the fifteen member states, meeting at least twice a year; it can exert great political influence, and most of the major steps in the development of the European Co=unity and, since 1993, of the European Union have been initiated by the European Council. Of the other institutions, the European Commission serves as the executive of the EU and can be compared to a cabinet; the European Parliamentis the lower house of the legislature; and the Council of the
. European Union can be regarded as the upper house. The responsibilities of the European Court of Justice and the European Central Bank are clear from their names.
1. Executive power-sharing in broad coalition cabinets. The European Commission consists of twenty members, each with a specific ministerial responsibility, appointed by the governments of the member states. The five largest states-Germany, the United Kingdom, France, Italy, and Spain-appoint two commissioners apiece, and each of the other ten members appoints one commissioner. Because all fifteen nations that belong to the EU are represented on it, the Co=ission is a broad and permanent internation coalition. In practice, the Commission is also a coalition that unites the left, center, and right of the political spectrum in Europe. A telling example is that, in the mid-1990s, the two British commissioners were Conservative Leon Brittan and former Labour party leader Neil Kinnock-politidans who are extremely unlikely ever to serve together in a
British cabinet. 2. Executive-legislative balance of power. After each five
yearly parliamentary election, the new European Co=ission must be approved by a vote in the European Parliament. Parlia-
CONSENSUS MODEL 43
ment also has the power to dismiss the Commission, but only by a two-thirds majority. Parliament has strong budgetary powers, but although its other legislative powers were enhanced by the Amsterdam Treaty of 1997, they remain relatively weak. In comparison with the Commission, the Parliament's role appears to be subordinate. This judgment of executive-legislative relationships changes, however, when we add the Council of the European Union-composed of ministers from the governments of the fifteen member states-to the picture. George Tsebelis and Jeannette Money (1997, 180) call the Council "the European equivalent of [an] upper house." The Council is also clearly the strongest of the three institutions. Overall, therefore, the Commission is much more like the equal partner in the consensus model than the dominant cabinet in the Westminster model.
3. Multiparty system. The 626-member European Parliament had eight officially recognized parties (comprising the minimum of 18 members required for recognition) in 1996. The largest of these was the Party of European Socialists with about 34 percent of the seats in Parliament-far short of a parliamentary majority. The next largest was the European People's party (mainly Christian Democrats) with about 29 percent of the seats. None of the other parties held more than 10 percent of the seats. The political fragmentation is even greater than appears from this muitiparty pattern because the parties in the European Parliament are considerably less cohesive and disciplined than the parties in the national parliaments. The partisan composition of the "upper house," the Council of the European Union, changes as the cabinets of the member countries change, and it also depends on the subject matter being discussed, which determines which particular minister will attend a particular session; for instance, if farm policies are on the Council's agenda, the national ministers of agriculture are likely to attend. In practice, however, the Council is also a multiparty body.
4. Proportional representation. The European Parliament has been directly elected since 1979. It is supposed to be elected
44 CONSENSUS MODEL
in each country according to a uniform electoral system, but the member countries have not been able to agree on such a system. Nevertheless, the prevalent method is some variant of PR, and PR is used in all of the member countries and in Northern Ireland. The only exception has been the election by plurality of the British representatives from the United Kingdom, but in 1997 the new Labour cabinet decided that the 1999 European Parliament elections in the United Kingdom would be entirely by PRo Even then, however, there will still be a significant degree of disproportionality as a result of the overrepresentation of the small states and the underrepresentation of the large states in the European Parliament. At the extremes, Germany has ninety-nine and Luxembourg six representatives in the European Parliament, even though Germany's population is about two hundred times larger than Luxembourg'S. In this respect, the European Parliament combines in one legislative chamber the principles of proportional representation and of equal national representation that, for instance, in Switzerland are embodied in two separate houses of the legislature.
5. Interest group corporatism. The EU has not yet developed a full-fledged corporatism, largely because the most important socioeconomic decisions are still made at the national level or subject to national vetoes. As the EU becomes more integrated, the degree of corporatism is bound to increase. In the title of Michael J. Gorges's (1996) book Euro-Corporatism? the question mark is deliberate, and Gorges answers the question mainly in the negative for the present situation, but he also sees significant corporatist elements in certain sectors as well as a clear trend toward greater corporatism. One important factor is that the Europeao Commission has long favored a corporatist mode of negotiating with interest groups. For instaoce, it sponsored a series of tripartite conferences during the 1970s, and although these did not lead to the institutionalization of tripartite bargaining, "the Commission never abandoned its goal of promoting a dialogue between the social partners and of improving their partici-
CONSENSUS MODEL 45
pation in the Community's decision-making process" (Gorges 1996, 139). Another indication of the EU's inclination toward corporatism is that one of its formal institutions is the advisory Economic aod Social Co=ittee, which consists of interest group representatives appointed by the member gove=ents.
6. Federal and decentralized government. Compared with other international organizations, the supranational EU is highly
. unified and centralized, but compared with national stateseven as decentralized a state as Switzerlaod-the EU is obviously still more "confederal" than federal as well as extremely decentralized.
7. Strong bicameralism. The two criteria of strong bicameralism are that the two houses of a legislature be equal in strength and different in composition. The EU's legislature fits the second criterion without difficulty: the Council has equal representation of the member countries and consists of representatives of the national gove=ents, whereas the Parliament is directly elected by the voters aod the national delegations are weighted by population size. In national legislatures, deviations from equal power tend to be to the advantage of the lower house. In the EU it is the other way around: the upper house (Council) is considerably more powerful than the lower house (parliamentJ-not fully in accordance with the consensus model, but even less with the majoritarian model. 3
8. Constitutional rigidity. The EU's "constitution" consists of the founding Treaty of the European Economic Co=unity, signed in Rome in 1957, and a series of both earlier and subsequent treaties. Because these are international treaties, they can be changed only with the consent of all of the signatories. Hence they are extremely rigid. In addition, most important decisions in the Council require unanimity; on less important matters, it has become more co=on since the 1980s to make decisions by
3. Another notable example of at least a slight asymmetry favoring the upper house is the U.S. Congress in which the Senate has special powers over treaties and appointments.
46 CONSENSUS MODEL
"qualified majority voting," that is, by roughly two-thirds majorities and by means of a weighted voting system (similar to the weighted allocation of seats in the European Parliament).
9. Judicial review. A key EU institution is the European Court of Justice. The Court has the right of judicial review and can declare both EU laws and national laws unconstitutional if they violate the various EU treaties. Moreover, the Court's approach to its judicial tasks has been creative and activist. Martin Shapiro and Alec Stone (1994, 408) write that "clearly the two most politically influential constitutional courts in Europe are those of Germany and the Co=unity [EU] .... There are few instances as observable and as important as the ECJ [European Court of Justice] case of a court building itself as a political institution, and building the whole set of institutions of which it is a part."
10. Central bank independence. The European Central Bank, which started operating in 1998, was designed to be a highly independent central bank; indeed, the Economist (November 8, 1997) wrote that "its constitution makes it the most independent central bank in the world." However, its independence was compromised to some extent when the first bank president was appointed in 1998. In order to maximize the president's authority, the appointment is formally for an eight-year term, but the first president had to pledge to resign well before the end of his term, probably after about four years, as part of a political deal between France, which had insisted on its own candidate, and the other EU members.
In the beginning of ills chapter, I emphasized that the majoritarian model was incompatible with the needs of deeply divided, plural societies. The EU is clearly such a plural society: "Deep-seated and long-standing national differences, of which language is only one, have not and will not disappear in Europe" (Kirchner 1994, 263). Hence it is not surprising that the EU's institutions conform largely to the consensus instead of the majoritarian model. Many observers predict that the EU will even-
CONSENSUS MODEL 47
tually become a federal state, especially as a result of the adoption of a co=on currency. For instance, Martin Feldstein (1997, 60) asserts that the "fundamental long-term effect of adopting a single currency [will] be the creation of a political union, a European federal state with responsibility for a Europe-wide foreign and security policy as well as for what are now domestic economic and social policies." If and when the EU develops into a sovereign European state, its institutions are likely to change
. the European Parliament, for instance, will probably become a more powerful legislative chamber-but it is not likely to stray far from the consensus model, and it is almost certain to take the form of a federal United States of Europe.
CHAPTER 4
Thirty-Six Democracies
The remainder ofthis book is a systematic comparison of the thirty-six countries (with populations of at least a quarter of a million) that were democratic in the middle of 1996 and that had been continuously democratic since 1977 or earlier. Each democracy is analyzed from its first democratic election in or after 1945 until June 30, 1996; the time span for the thirty-six democracies therefore varies from fifty-one years (1945-96) to nineteen years (1977-96). In this chapter, I explain the criteria for selecting the thirty-six democracies and for choosing the minimum of nineteen years of democratic experience. I also discuss the principal social and economic characteristics that can be expected to influence the types of democracy and democratic performance of the thirty-six countries.
DefirndtionsofDeDlocracy
Although political scientists have disagreed on some of the details of defining and measuring democracy (Beetham 1994,
Inkeles 1991), the eight criteria proposed by Robert A. Dahl (1971, 3) in his seminal book Polyarcby stilI co=and widespread support: (1) the right to vote, (2) the right to be elected, (3) the right of political leaders to compete for support and votes, (4) elections that are free and fair, (5) freedom of associa-
THIRTY· SIX DEMOCRACIES 49
tion, (6) freedom of expression, (7) alternative sources of information, and (8) institutions for making public policies depend on votes and other expressions of preference. These requirements are already implied by LincoIn's simple definition of democracy as gove=ent by the people (or by representatives of the people) and for the people. For instance, ''by the people" implies universal suffrage, eligibility for public office, and free and fair elections; and elections cannot be free and fair unless there is freedom of expression and association both before and between elections. Similarly, "for the people" implies Dahl's eighth criterion of responsiveness by the gove=ent to the voters' preferences. Nevertheless, it is instructive to spell out the specific criteria especially for the purpose of deciding which countries qualify as democracies and which countries do not.
Democracy, as defined by Dahl, is a twentieth-century phenomenon, and GOran Therborn (1977, 11-17) credits Australia and New Zealand with having established the first genuinely democratic systems of govermnent in the first decade of the twentieth century. New Zealand has the strongest claim because, as early as 1893, it was the first country to institute truly universal suffrage, that is, the right to vote for both men and women and for the Maori minority; women, however, did not have to right to be candidates for public office until 1919. Australia adopted suffrage for both men and women in 1902, but Aboriginal Australians-admittedly a small minority comprising about 2 percent of the total population-could not vote in federal elections until 1962 (Inter-Parliamentary Union 1995,
61,193).
Table 4.1 lists the countries that can be regarded as democratic in 1996 and as having been democratic for at least nineteen years; these are the thirty-six countries analyzed !p--this book, classified by the decade and first year from whiclr the analysis of each country starts. In order to decide which countries qualify as democracies, I relied to a large extent-'-following the example of many other researchers-on the ratings for all
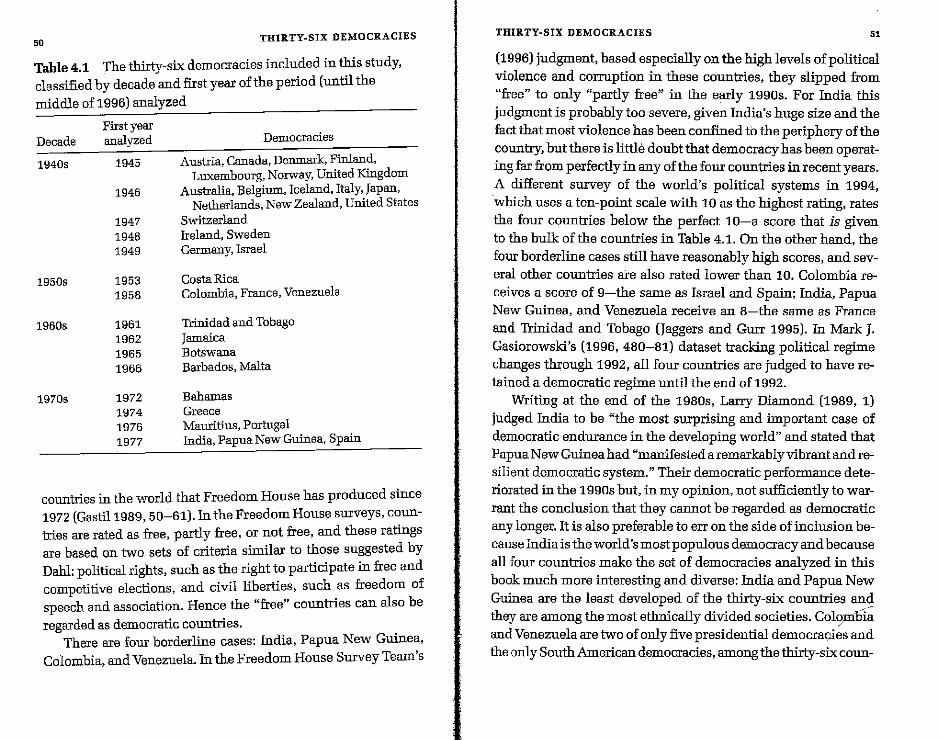
50 THIRTY-SIX DEMOCRACIES
Table 4.1 The thirty-six democracies included in this study, classified by decade and first year of the period (until the middle of1996) analyzed
Decade
1940s
1950s
1960s
1970s
First year analyzed
1945
1946
1947 1948 1949
1953 1958
1961 1962 1965 1966
1972
Democracies
Austria, Canada, Denmark, Finland, Luxembourg, Norway, United Kiugdom
Australia, Belgium, Iceland, Italy, Japan, Netherlands, New Zealand, United States
Switzerland Ireland, Sweden Germany, Israel
Costa Rica Colombia, France, Venezuela
Trinidad and Tobago Jamaica Botswana Barbados, Malta
Bahamas 1974 Greece 1976 Mauritius, Portugal 1977 India, Papua New Guinea, Spain
countries in the world that Freedom House has produced since 1972 (Gastil1989, 50-61). In the Freedom House surveys, countries are rated as free, partly free, or not free, and these ratings are based on two sets of criteria similar to those suggested by Dahl: political rights, such as the right to participate in free and competitive elections, and civil liberties, such as freedom of speech and association. Hence the "free" countries can also be regarded as democratic countries.
There are four borderline cases: India, Papua New Guinea, Colombia, and Venezuela. In the Freedom House Survey Team's
THIRTY-SIX DEMOCRACIES 51
(1996) judgment, based especially on the high levels of political violence and corruption in these countries, they slipped from "free" to only "partly free" in the early 1990s. For India this judgment is probably too severe, given India's huge size and the fact that most violence has been confined to the periphery of the country, but there is little doubt that democracy has been operating far from perfectly in any of the four countries in recent years. A different survey of the world's political systems in 1994, ·which uses a ten-point scale with 10 as the highest rating, rates the four countries below the perfect 10-a score that is given to the bulk of the countries in Table 4.1. On the other hand, the four borderline cases still have reasonably high scores, and several other countries are also rated lower than 10. Colombia receives a score of 9-the same as Israel and Spain; India, Papua New Guinea, and Venezuela receive an 8-the same as France and Trinidad and Tobago (Jaggers and Gurr 1995). In Mark J. Gasiorowski's (1996, 480-81) dataset tracking political regime changes through 1992, all four countries are judged to have retained a democratic regime until the end of 1992.
Writing at the end of the 1980s, Larry Diamond (1989, 1) judged India to be "the most surprising and important case of democratic endurance in the developing world" and stated that Papua New Guinea had "manifested a remarkably vibrant andresilient democratic system." Their democratic performance deteriorated in the 1990s but, in my opinion, not sufficiently to warrant the conclusion that they cannot be regarded as democratic any longer. It is also preferable to err on the side of inclusion because India is the world's most populous democracy and because all four countries make the set of democracies analyzed in this book much more interesting and diverse: India and Papua New Guinea are the least developed of the thirty-six countries anci they are among the most ethnically divided societies. Colo;m:hla and Venezuela are two of only five presidential democracies and the only South American democracies, among the thirty-six coun-
52 THIRTY-SIX DEMOCRACIES
tries." (By the end of 1998, India, Venezuela, and Papua New Guineahad been readmitted to FreedomHouse's "free" countries.)
I am also somewhat lenient with regard to several other countries that are on the list of long-term democracies in Table 4.1 in spite of the absence of fully universal suffrage-the most fundamental of democratic requisites. In pre-1971 Switzerland, women did not yet have the right to vote. In Australia, as noted earlier, Aborigines could not vote until 1962. And, in spite of President Bill Clinton's claim in his 1993 inaugural address that the United States is "the world's oldest democracy" (New York Times, January 21,1993, All), universal suffrage was not firmly established in the United States until the passage of the Voting Rights Act in 1965. The principle of universal suffrage was also violated by the United Kingdom, France, the Netherlands, and Belgium while these countries were colonial powers, by the three Allied Powers while they were occupying Germany and Japan, and by post-1967 Israel on account ofits control over the occupied territories.' Focusing on the post-1945 period minimizes these problems because the colonial empires were rapidly dissolved and because women finally received the right to vote in Belgium, France, and Italy.
In comparative analyses of democracy, the smallest and least populous ministates are usually excluded; the cutoff point tends to vary between populations of one million and of a quarter of a million. Here, too, I opted to be inclusive by selecting the
lower cutoff point.
1. This book is not designed to contribute to the scholarly debats about the viability of parliamentary versus presidential regimes (see Linz and Valenzuela 1994, Power and Gasiorowski 1997). Nevertheless, it seems significant that there are merely five presidential systems among the thirty-six long-term democracies as of 1996 and that two of these are borderline cases of democracy.
2. Postwar control of conquered countries or areas is the least serious violation of the universal-suffrage standard because such control is meant to be temporary; the longer such control lasts, however, the more it creates a dilemma for
democracy.
THIRTY-SIX DEMOCRACIES 53
There are two reasons for the requirement that countries be not just democratic but democratic for an extended period. The substantive reason is that it provides assurance that the democracies studied are not ephemeral entities but reasonably stable and consolidated democratic systems. The second reason is procedural: in order to study, for instance, the results that elections tend to have, the kinds of cabinets that tend to be formed, and the durability of these cabinets in a particular country, we need to be able to measure more than just one or a few of these elections and cabinets. Obviously somewhat arbitrarily, I first selected twenty years as the minimum time span but then relaxed this criterion slightly so as to be able to include India, Papua New Guinea, and Spain.
Table 4.1 shows the first year of the period analyzed for each of the thirty-six democracies. Generally, this is the year of the first democratic election since 1945 or since independence. In countries where democracy was inteITUpted in the postwar period...,. in France in 1958, Greece from 1967 to 1974, India from 1975 to 19T7, and Venezuela from 1948 to 1958-it is the election year that,marks the resumption of democracy. In the countries that became independent in the 1960s and 1970s, it is the year of the election held closest to the achievement of independence-which in three cases means the election in the year before independence (Trinidad and Tobago, Botswana, and the Bahamas).3 The only exception is Mauritius, which held a democratic election in 1967, one year before formal independence in 1968, but where democracy lapsed for several years in the early 1970s: a state of emergency was in force from 1971 to 1976; opposition leaders were imprisoned; labor unions were banned; and the 1972 election was postponed to 1976 (Bowman 1991,
3. Thinidad and Tobago-for brevity's sake hereinafter simply referred to as "'llinidad" -and Jamaica became independent in 1962, Malta in 1964, Barbados and Botswana in 1966, Mauritius in 1968, the Bahamas in 1973, and Papua New Guinea in 1975.
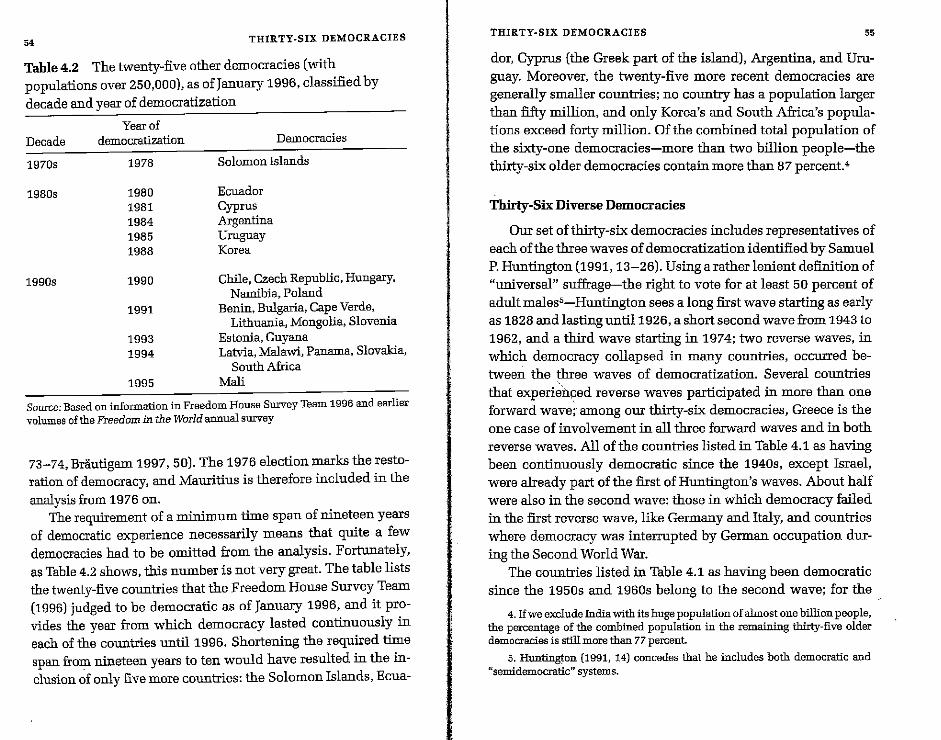
54 THIRTY-SIX DEMOCRACIES
Table 4.2 The twenty-five other democracies (with populations over 250,000), as ofJanuary 1996, classified by decade and year of democratization
Decade
1970s
1980s
1990s
Year of democratization
1978
1980 1981 1984 1985 1988
1990
1991
1993 1994
1995
Democracies
Solomon Islands
Ecuador Cyprus Argentina Urugnay Korea
Chile, Czech Republic, Hungary. Namibia, Poland
Benin. Bulgaria, Cape Verde, Lithuania, Mongolia, Slovenia
Estonia, Guyana Latvia, Malawi, Panama. Slovakia,
South Africa Mali
Source: Based on information in Freedom House Survey Team 1996 and earlier volumes of the Freedom in the World annual survey
73-74, Brautigam 1997,50). The 1976 election marks the restoration of democracy, and Mauritius is therefore included in the
analysis from 1976 on. The requirement of a minimum time span of nineteen years
of democratic experience necessarily means that quite a few democracies had to be omitted from the analysis. Fortunately, as Table 4.2 shows, this number is not very great. The table lists the twenty-five countries that the Freedom House Survey Team (1996) judged to be democratic as of January 1996, and it provides the year from which democracy lasted continuously in each of the countries until 1996. Shortening the required time span from nineteen years to ten would have resulted in the inclusion of only five more countries: the Solomon Islands, Ecua-
THIRTY-SIX DEMOCRACIES 55
dor, Cyprus (the Greek part of the island), Argentina, and Uruguay. Moreover, the twenty-five more recent democracies are generally smaller countries; no country has a population larger than fifty million, and only Korea's and South Africa's populations exceed forty million. Of the combined total population of the sixty-one democracies-more than two billion people-the thirty-six older democracies contain more than 87 percent.-
Thirty-Six Diverse Democracies
Our set of thirty-six democracies includes representatives of each of the three waves of democratization identified by Samuel P. Huntington (1991, 13-26). Using a rather lenient definition of "universal" suffrage-the right to vote for at least 50 percent of adult males'-Huntington sees a long first wave starting as early as 1828 and lasting until 1926, a short second wave from 1943 to 1962, and a third wave starting in 1974; two reverse waves, in which democracy collapsed in many countries, occurred between the three waves of democratization. Several countries that experie'nced reverse waves participated in more than one forward wave;' among our thirty-six democracies, Greece is the one case of involvement in all three forward waves and in both reverse waves. All of the countries listed in Table 4.1 as having been continuously democratic since the 1940s, except Israel, were already part of the first of Huntington's waves. About half were also in the second wave: those in which democracy failed in the first reverse wave, like Germany and Italy, and countries where democracy was interrupted by German occupation during the Second World War.
The countries listed in Table 4.1 as having been democratic since the 1950s and 1960s belong to the second wave; for the "
4. Ifwe exclude India with its huge population of almost one billion people, the percentage of the combined population in the remaining thirty-five older democracies is still more than 77 percent.
5. Hunt:in@:0n (1991, 14) concedes that he includes both democratic and "semidemocratic" systems.
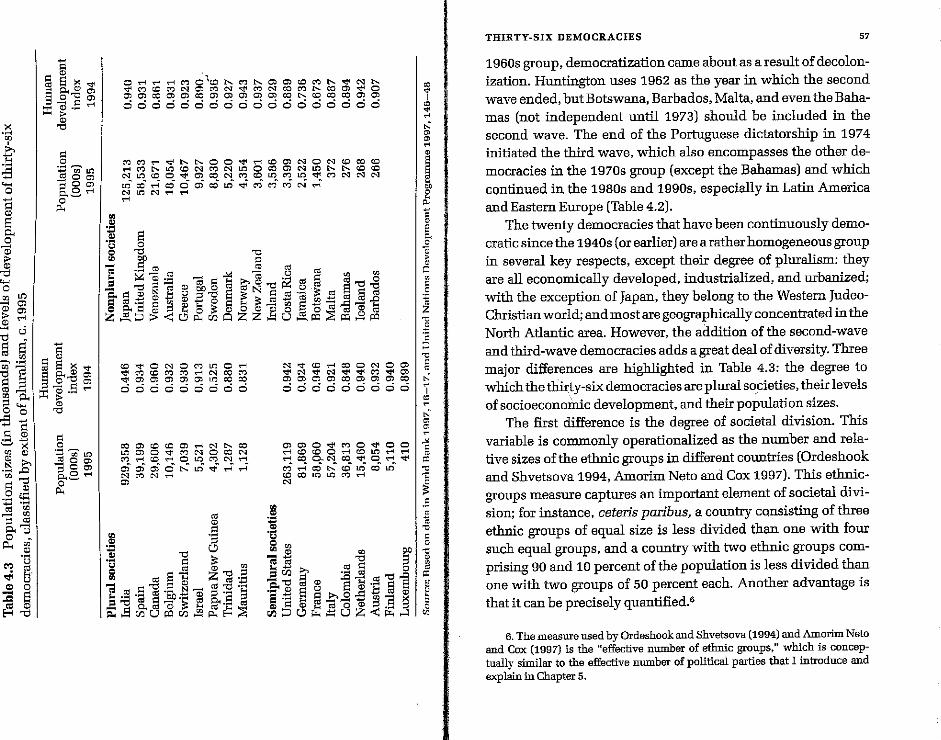
r
>< .~
'" ~ :§ ..... o -;:: 11 0-o
1 ..... o " on ~ '" " '" > '"' '" . ~ u -0 _
§ ~ ~.~
"Cti -0 ...
~i g~ rB~ g~ " " " ~ .~ ..c "-0
'" " o~ :g .~ ~ ~ ~""G o ~ " " .~
'" ~ ~ tr ~ S ~~
11 ~ s >< ~ S 0. CD (J:I
;:J..s"'2~ ~ §: ..... ~
§ :;:::i";J1!:l "00> "3g~ p<_ o
'"
11 =S"", ttl 0.. OJ C:l § 0"" 0> ~=,..; " .-~~
= a ",c ~ Ln "00> ~g~ p<_
~
O"';"';rlMO~~M~"''''=M~'''N~ ~M~MN~MN~~NroM~ro~~O C:lC:lro~~roC:l~~~~ro~~roro~~ 1 oooaoooooooooooooo '" .. -~
~ -MM~~~~OO~M~~NON~ro~ ~M~I!:l~NMNI!:lOro~N~~~~~ N~~O~~roNM~~M~~MNNN
tn~ ro~ ~- ea 6 ci as t.ri' ..; ~ 00 M N ....i I NtnN....,~ ,..;
ill := .! S " a o "" "" '" 00 " - 1::::1 ttl i:d ttl ttl ~"'1 ...... ttl ~.- U eel !I.l I:Il
1 "' ... _OJ· .... -I::::I'-Ip..,cc ...... a:l1::::I ttl 0
::I ""d::lc;CD"'Cl)COc::l~""d.o:::uctl c""d"'t:i .~ -a I:::l a:l ~ b u ~'"O E1:: 1::::1 c:tl'~ ~ tel § § ttl ==~I::::I!I.l~tCl)a>-i~~~d2~~_~ = 0.. 1::::1 CD ::l >-i 0 ~ CD 0 OJ CD 0 ~ 0 ttl ttl Cl) ttl Z~~~<0~~OZZ~U~~~~~~
"Ii Z ""
to-.::t<ONOC'?tnO'-; ~MCCMM'-;NCOM ~o)O:lo)O')O'ltnCOCO ooooooooci
c::oc:nCCCCo) ...... Nt'-.CO ~o)Oo::l"MNOCON M...-ICO...-lOI.OMN~
oi'o)aj6t-.:'~~~"';.-i NMN ......
'"
I:Il .~ " " i "C c.!J
..... 1::::1 ~ ~ ~ a:l '"Cl ~ C'I!I ttl a ~ Z eel· .....
- '"CSQ;) r:tl'"d~ ttl ttl = ttl· ..... ~ CD ::l ...... ~ '" ...... "; 1::::1 bO ..... ttl p., 1::::1 ;:l .='"0 o..Ctla> ~ 10-1 ttl· .... ttl
~.s"'Uo:1"'.!!l"'~:;;
"
~ "" N~CC....-leoONOO)I S
'<j1N~No::I1o::1'1Mo::I1O') o)o)O:lC:lCCc:lO:lO':lCC ~ 000000000 -I
'" -~ co co -,"O')O~MO'<j'!OO ~
~tOtOO~tOlt:l~~ Cc' ~ co O-N co 0::11 0 ~ 0::11 ~ M ..; 05 t-..~ (J;:.~ u; 05 u; "d ~COIl':lIl':lM~ ~
N ~
.S " . ~ ~ ~ "d
" " o " 0 Cf.I CD rll 00 "d
- - ""C .... Cj) E 19 cc' ::; ;:::l ~ :=00>' · ..... ttl ] ~ "a""CaCD ..gr:::.$]d" o ..... CDSu j;;iCD .... i:d~ ~
i ] r~ ~ 3-u~ .,sZCD ~] ~ § iI) ..... '-'~_ -'~H tI:l
THIRTY-SIX DEMOCRACIES 57
1960s group, democratization came about as a result of decolonization. Huntington uses 1962 as the year in which the second wave ended, but Botswana, Barbados, Malta, and even the Bahamas (not independent until 1973) should be included in the second wave. The end of the Portuguese dictatorship in 1974 initiated the third wave, which also encompasses the other democracies in the 1970s group (except the Bahamas) and which continued in the 1980s and 1990s, especially in Latin America and Eastern Europe (Table 4.2).
The twenty democracies that have been continuously democratic since the 1940s (or earlier) are a rather homogeneous group in several key respects, except their degree of pluralism: they are all economically developed, industrialized, and urbanized; with the exception of Japan, they belong to the Western JudeoChristian world; and most are geographically concentrated in the North Atlantic area. However, the ad.dition of the second-wave and third-wave democracies adds a great deal of diversity. Three major differences are highlighted in Table 4.3: the degree to which thetlril:ty-six democracies are plural societies, their levels of socioeconomic development, and their population sizes.
The first difference is the degree of societal division. This variable is co=ouly operationalized as the number and relative sizes of the ethnic groups in different countries (Ordeshook and Shvetsova 1994, Amorim Neto and Cox 1997). This ethnicgroups measure captures an important element of societal division; for instance, ceteris paribus, a country consisting of three ethnic groups of equal size is less divided than one with four such equal groups, and a country with two ethnic groups comprising 90 and 10 percent of the population is less divided than one with two groups of 50 percent each. Another advantage is that it can be precisely quantified.·
6. The measure used by Ordeshook and Shvetsova (1994) and Amorim Neto and Cox (1997) is the "effective number of ethnic groups," which is conceptually similar to the effective number of political parties that I introduce and explain in Chapter 5.
58 THIRTY-SIX DEMOCRACIES
Its disadvantage is that it leaves out a number of important aspects of division. First, ethnic divisions are not the only relevant differences; in particular, religious cleavages, such as those between Hindus, Muslims, and Sikhs in India, may be as important or evell more important Second, the measure could, in principle, be adjusted so as to include religious as well as ethnic differences, but it would then still miss important cleavages within religious groups, such as the difference between faithfully practicing Catholics on one hand and infrequently and non-practicing Catholics on the other and the related split between prochurch and anticlerical forces that has histOrically shaped much of the politics of France, Italy, and Colombia.
Third, it fails to take the depth of division into account. It is misleading, for instance, to treat the Protestant-Catholic division of Northern Ireland on a par with that in Switzerland. Germany, and the Netherlands; or to equate ethnic divisions in which linguistic differentiation is relatively unimportant, such as between Welsh and English or Frisians and Dutch, with ethnic divisions that coincide with sharp linguistic divisions, as in Belgium, Switzerland, India, Spain, and Finland. Fourth, it fails to indicate the extent to which the ethnic, religious, and possibly other groups differentiate themselves organizationally. A high degree of this can historically be seen in Austria, Belgium, the Netherlands, and Israel, where religious and ideological groups have organized themselves into more or less separate subsocieties with their own political, socioeconomic, cultural, educational, and recreational associations.
The threefold classification into plural, semiplural, and nonplural societies in Table 4.3 takes all these considerations into account. It is obviously a more subjective and much rougher measure than one based exclusively on the number and sizes of ethnic groups, but it is also a more valid and meaningful measure. Three further co=ents on the trichotomous classification are in order. First, all but one of the plural societies are linguistically divided countries; India, with its more than a
THIRTY-SIX DEMOCRACIES 59
dozen officially recognized languages is an extreme case, and Papua New Guinea is even more fragmented along linguistic lines. The population of Mauritius is about two-thirds of Indian and one-third of African descent; the Indian co=unity is a microcosm of the linguistic and religious divisions of India. Israel is a plural society not just because of the division between Jewish and Arab citizens but even more as a result of the sharp split between religious and secular Jews. The only exceptional case is Trinidad, where there is a co=on language but where "an all-pervasive and fundamental cleavage ... dominates Trinidadian society: the Creole-cum-colored portion versus the Indian portion" (premdas 1993, 100).
Second, the threefold classification reflects the situation in the mid-1990s, but it would not have looked very different ifit had been based on a much longer time span. The only exceptions would be Austria, the Netherlands, and Luxembourg, which are classified as semiplural here but which should have beerirated as plural in the first two postwar decades, when their religious and ideological segments were organizationally much more distihct. Third, it is important not to equate "nonplural" with "homogeneous": most of the nonplural societies are religiously divided to at least some extent and most contain at least one or more small minorities. Examples that have already been mentioned earlier are the ethnic minorities in the United Kingdom, Australia, and New Zealand. Another example is Botswana, which is often regarded as the most homogeneous state in Africa but where there is a significant ethnic minority, the Kalanga, and where the dominant Tswana ethnic group is divided internally into eight tribes.
Table 4.3 also indicates the level of socioeconomic development in the thirty-six democracies. This variable has traditionally been operationalized as gross national product (GNP) per capita; although it has long been recognized that GNP per capita is a flawed measure because of its excessive sensitivity to exchange rate fluctuations and its exaggeration of the poverty of
60 THIRTY-SIX DEMOCRACIES
less developed nations. A considerable improvement is to adjust per capita GNP for the different price levels in different countries, yielding so-called purchasing power parities (Dogan 1994, 44-46). A further big improvement is the human development index, designed by the United Nations Development Programme (1997,44) in the early 1990s: "It is a composite index of achievements in basic human capabilities in three fundamental dimensions-a long and healthy life, knowledge, and a decent standard ofliving." The three variables on which the index are based are income, life expectancy, and educational attainment. It is a more accurate indicator of development because it is more broadly based than the two older measures, and it has already found wide acceptance among social scientists (Diamond 1992, 100-102, Lane and Ersson 1994a, 214-28, Vanhanen 1997, 75-79).
The human development index can, in principle, range from a high of1 to a low ofo. As Table 4.3 shows, based on 1994 data, most of the countries that are co=only regarded as highly developed and industrialized have indices higher than 0.9; those of most of the developing countries are between 0.8 and 0.9, but four nations have much lower indices: the lowest is India (0.446), followed in ascending order by Papua New Guinea, Botswana, and Jamaica.
By far the greatest difference among the thirty-six countries is in their population sizes. Table 4.3 highlights these differences by listing the countries in each of the three degree-ofpluralism categories in descending order of size. India is by far the largest country with a population approaching one billion; according to the 1995 World Bank figures, India's population was larger than the combined populations of the thirty-five other countries. Another way to emphasize these enormous differences is to calculate India's weekly population growth from its anoual growth of about eighteen million people; its population increase per week is about 350,000-more than the entire populations of three of the thirty-six democracies: the Bahamas, Barbados, and Iceland.
THIRTY-SIX DEMOCRACIES 61
The above variables are important in this comparative analysis because they can be expected to influence the form of democracy adopted in different countries as well as their democratic performance. For instance, I have hinted in previous chapters that consensus democracy is especially appropriate for plural societies and that federalism makes more sense for large than for small countries. Moreover, the level of development is likely to have an effect on the macroeconomic performance of gove=ents. These relationships are explored in Chapters 14 and 15.
The three variables are only weakly correlated among each other. It is logical to expect larger countries to be more heterogeneous than smaller countries (Dahl and Tufte 1973, 13-14); indeed, population size (logged) and degree of pluralism in our thirty-six democracies are positively correlated, but the correlation coefficient is a mere 0.26, which is statistically significant only at the 10 percent level. Plural societies tend to be less developed (r=-0.24, significant at the 10 percent level), but this relationship is driven largely by the two cases of India and Papua New Guinea. Larger countries are somewhat less developed than smaller countries (r=-0.10), but the relationship is very weak and not statistically significant. Finally, the length of continuous democratic experience between 1945 and 1996 (measured by decade, as indicated in Table 4.1) is very strongly correlated with development-the older democracies are the wealthier countries (r=0.57, significant at the 1 percent levell-but there is no significant relationship with either population size or degree of pluralism.
CHAPTER 5
Party Systems Two-Party and Multiparty Patterns
The first of the ten variables that characterize the majoritarian-consensus contrast, presented in Chapter 1, was the difference between single-party majority gove=ents and broad multiparty coalitions. This first difference can also be seen as the most important and typical difference between the two models of democracy because it epitomizes the contrast between concentration of power on one hand and power-sharing on the other. Moreover, the factor analysis reported in Chapter 14 shows that it correlates more strongly with the "factor" representing the first (executives-parties) dimension than any of the other four variables that belong to this dimension. It would therefore make sense to devote this chapter-the first of nine chapters that will discuss the ten basic variables' -to this first and most typical variable.
For practical reasons, however, it is necessary to discuss the subject of party systems first. The classification of cabinetssingle-party cabinets versus multiparty coalition cabinets, and bare-majority cabinets versus minority cabinets and cabinets that have "unnecessary" parties in them-depends a great deal on how political parties and the numbers of parties in party systems are defined. Hence these definitional problems have to
1. Two of the variables-constitutional rigidity and judicial review-will be discussed in one chapter (Chapter 12).
PARTY SYSTEMS 63
be solved before the question of cabinet types can be properly addressed. It is worth noting, however, that the type of party system is also a strong component of the executives-parties dimension. To preview the factor analysis in Chapter 14 once more, the party-system variable correlates with the first "factor" almost as strongly as the type of cabinet and more strongly than the remaining three variables?
Two-party systems typify the majoritarian model of democracy and multiparty systems the consensus model. The traditionalliterature on party systems is staunchly majoritarian and emphatically favors the two-party system. Two-party systems are claimed to have both direct and indirect advantages over multiparty systems. The first<fu~ctb"nefitist!ta~.they offer the 1CQters a clmlr ch_Q,i,<oe be!':"-"Bntwo alternative sets of public policies. Second~they have a nl~der_"'t;ing influencebecause the two main parties have to compete for the swing voters in thecenier oJ!h.El. politipalsp~~iiurnand l:1.8nce have to advocate moderate, ~LPol;cie~. This mechanism is' especially strong when large numbers of voters are located in the political center, but its logic continues to operate even when opinions are more polarized: at the two ends of the spectrnm, the parties will lose some of their supporters, who will decide to abstain instead of voting for what is, to them, a too moderate program, but a vote gained in the center, taken away from the other party, is still twice as valuable as a vote lost by abstention. Both claims are quite plausible-but also contradictory: if the Progrllllls of tiJ.e two parties ""e both close to the political center, they will be very-::siuiDiIT to each other and,' instead of offering a inea..ri.illgihl ,; choice" to the voters, are more likely to "echo" each other.3 ,- -- _ .. - , --
2. InDemocracies. party systems actually emerged as the strongest element of the first "factor," and the type of cabinet was in second place (Lijphart 1984. 214).
3. Most two-party theorists do not make both of the competing claims simultaneously. The advantage of party moderation is typically asserted by the American school of thought, whereas the claim of a clear-cut choice reflects the British.two-party school.
64 PARTY SYSTEMS
In addition, two-party systems are claimed to have an important indirect advantage: they are necess"d]'.ioLtlNlQ:!";mation of ~gle-p'!!!Y cah.ig_~~th"!:~ill be stable ancleffec.tiv~p~lici. makers. For instance, A. Lawrence Lowell (1896, 70, 73-74), ~-one of the first modern political scientists, wrote that the legisla-turemustcontain "two parties, and two parties only, ... in order that the parliamentary form of government should permanently produce good results." He called it an "axiom in politics" that coalition cabinets are short-lived and weak compared with oneparty cabinets: "the larger the DJlmber 01 dis_QPIQillt grouns th"t fOrI!lJgeIJ:lajority the baI:cier!be task of pleasing them all, and the. more feeble and unstable the position ofth~. Qilpi,get."
In the next two chapters I confirm Lowell's hypothesis linking party systems to types of cabinets and his "axiom" that single-party majori.~ .. QabiI!'21"- are,IJ:l(),r~!ilITable and dmnjnallt than.cDa!it.ioQ!l_s.a.l:J!n,~t~. The majoritarians' preference for twoparty systems is therefore clearly and logically linked to their preference for powerful and dominant one-party cabinets. Furthermore, in Chapter 8 I show a strong link between party systems and electoral systems, which further explains the majoritarians' strong preference for plurality, instead ofPR, because of
. its bias in favor of larger parties and its contribution to the establishment and maintenance of two-party systems. However, whethilIJhis_syndrome ,o! majpritilriM feaj:ures"ctually lI"~ lates i.!l1oIJ:l.o.re __ ~aJlable an,d,~ffective policy-making than its con~~Il-"RalcO=telJlart is another matter entirely...:r:owell simp~y assumes that concentrated streIlgth means effective decisionm;,king; in Chapter 15 I show that ill.' s -ass. ump?on,i:S--l .. a;gely i.J;!correc!. ---~-- ' .. '-._--
In this chapter I first address the question of how the number of parties in party systems should be counted and argue that the "effective number of parliamentary parties" is the optimal measure. I also try to solve the problem of how to treat factionalized parties as well as closely allied parties: should such parties be treated as one party or as more than one party? Next, the average
PARTY SYSTEMS 65
effective numbers of parliamentary parties in our thirty-six democracies are presented and discussed; these numbers exhibit a wide range-from well below two to almost six parties. Finally, the numbers of parties are related to the numbers and types of issue dimensions that divide the parties.
The Effective Number of Parties
Pure two-party systems with, in Lowell's words quoted above, "two parties, and two parties only," are extremely rare. In Chapter 2, the party systems of Britain, New Zealand, and Barbados were also described as two-party systems in spite of the usual presence of one or more additional small parties in the legislature. Is this a correct description, or should it be modified in some way? This question points to the most important problem in determining the number of parties in a party system: whetheLto count small parties and, if not, how large a party has to be in order to.be included in the count.
One well-knoWn solution was proposed by Giovanni Sartori (1976, 122-23). He suggests, first of all, that parties that fail to win seats in parliament be disregarded, that the relative strengths of the other parties be measured in terms of parliamentary seats, and that not all parties regardless of size can be couated, but that one canoot establish an arbitrary cut-off point of, say, 5 or 10 percent above which parties are counted and below which they should be ignored. These preliminary assumptions are unexceptionable. More controversial are his "rules for couating." He argues that only those parties should be counted as components of the party system th~t are "relevant" in terms of having either "coalition potential" or "blackmail ]3steB-tiaJ.." A partY):l,!§.coalitiQ!l~otential if it has participated in governing GO .. ali.tions (or, of course, in ooo-party gove=ents) or if the majorparties regardit as a possible coalition partner. Parties that are ideologically uaacceptabi-;;'to ~r or'most'oT the other coalition partners, and that therefore lack coalition potential,
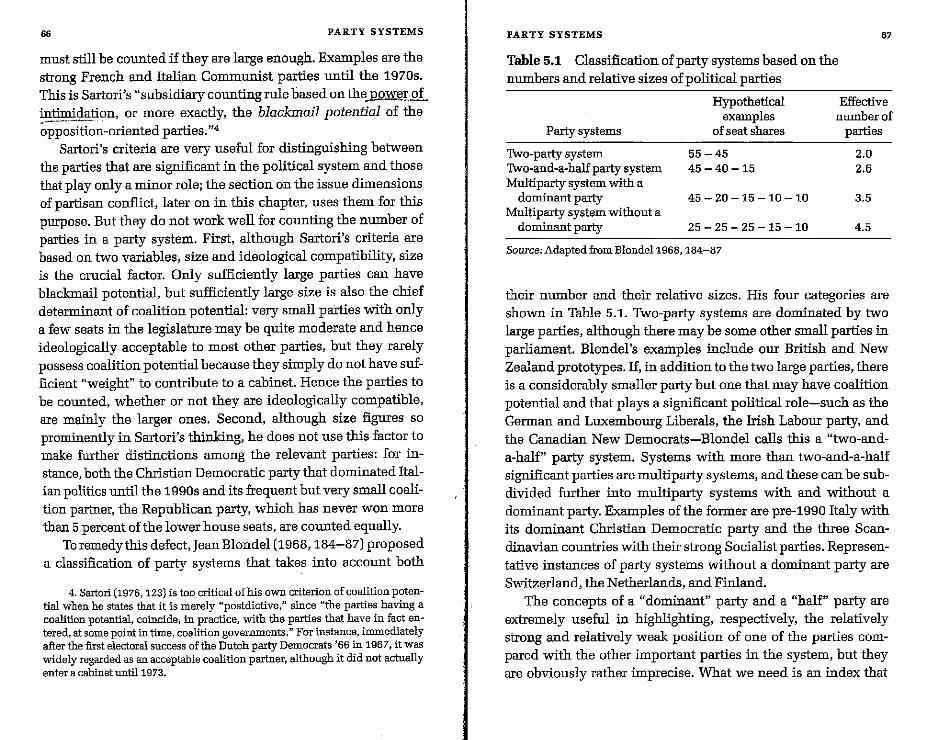
66 PARTY SYSTEMS
must still be counted if they are large enough. Examples are the strong French and Italian Communist parties until the 1970s. This is Sartori's "subsidiary counting rule based on the"poW'lLQi. il!t!!:ni~,,:tion, or more exactly, the blackmail potential of the ~pposition-oriented parties.'"
Sartori's criteria are very useful for distinguishing between the parties that are significant in the political system and those that play only a minor role; the section on the issue dimensions of partisan conflict, later on in this chapter, uses them for this purpose. But they do not work well for counting the number of parties in a party system. First, although Sartori's criteria are based on two variables, size and ideological compatibility, size is the crucial factor. Only sufficiently large parties can have blackmail potential, but sufficiently large size is also the chief determinant of coalition potential: very small parties with only a few seats in the legislature may be quite moderate and hence ideologically acceptable to most other parties, but they rarely possess coalition potential because they simply do not have sufficient "weight" to contribute to a cabinet. Hence the parties to be counted, whether or not they are ideologically compatible, are mainly the larger ones. Second, although size figures so prominently in Sartori's thinking, he does not use this factor to mske further distinctions among the relevant parties: for instance, both the Christian Democratic party that dominated Italian politics until the 1990s and its frequent but very small coalition partner, the Republican party, which has never won more than 5 percent of the lower house seats, are counted equally.
To remedy this defect, Jean Blondel (1968, 184-87) proposed a classification of party systems that tskes into account both
4. Sartori (1976, 123) is too critical of his own criterion of coalition potential when he states that it is merely "postdictive," since "the parties having a coalition potential, coincide, :in practice, with the parties that have in fact entered, at some point in time, coalition governments." For instance, immediately after the first electoral success of the Dutch party Democrats '66 in 1967. it was 'Widely regarded as an acceptable coalition partner, although it did not actually enter a cabinet until 1973.
PARTY SYSTEMS 67
Table 5.1 Classification of party systems based on the numbers and relative sizes of political parties
Party systems
Two·party system Two-and-a-half party system Multiparty system with a
dominant party Multiparty system without a
dominant party
Hypothetical examples
of seat shares
55-45 45-40-15
45 - 20 - 15 - 10 -10
25 - 25 - 25 - 15 - 10
Source: Adapted from Blondel1968, 184-87
Effective number of
parties
2.0 2.6
3.5
4.5
their number and their relative sizes. His four categories are shown in Table 5.1. Two-party systems are dominated by two large parties, although there may be some other small parties in parliament. Blondel's examples include our British and New Zealand prototypes. If, in addition to the two large parties, there is a considerably smaller party but one that may have coalition potential and that plays a significant political role-such as the German and Luxembourg Liberals, the Irish Labour party, and the Canadian New Democrats-Blondel calls this a "two-anda·half" party system. Systems with more than two-and-a-half significant parties are multiparty systems, and these can be subdivided further into multiparty systems with and without a dominant party. Examples of the former are pre-1990 Italy with its dominant Christian Democratic party and the three Scandinavian countries with their strong Socialist parties. Representative instances of party systems without a dominant party are Switzerland, the Netherlands, and Finland.
The concepts of a "dominant" party and a "half" party are extremely useful in highlighting, respectively, the relatively strong and relatively wesk position of one of the parties compared with the other important parties in the system, but they are obviously rather imprecise. What we need is an index that
66 PARTY SYSTEMS
tells us exactly how many parties there are in a party system, taking their relative sizes into account. Such an index was developed by Markku Laakso and Rein Taagepera (1979) and is now widely used by comparativists in political science: the effective number of parties. This number (N) is calculated as follows:
1 N=~
~ 8i
in which s; is the proportion of seats of the i-th party.' It can easily be seen that in a two-party system with two
equally strong parties, the effective number of parties is exactly 2.0. If one party is considerably stronger than the other, with, for instance, respective seat shares of 70 and 30 percent, the effective number of parties is 1.7-in accordance with our intuitive judgment that we are moving away from a pure two-party system in the direction of a one-party system. Similarly, with three exactly equal parties, the effective-number formula yields a value of 3.0. If one of these parties is weaker than the other two, the effective number of parties will be somewhere between 2.0 and 3.0, depending on the relative strength of the third party. In the hypothetical example of the two-and-a-half party system in Table 5.1-with three parties holding 45, 40, and 15 percent of the parliamentary seats-the effective number of parties is in fact very close to two and a half, namely 2.6.
In all cases where all the parties are exactly equal, the effective number will be the same as the raw numerical count.
5. It is also possible to calculate the effective number of parties based on their vote shares instead of their seat shares, but I consistently use seat shares because this study's focus is on the strengths and patterns of parties in parliaments and on their effects on the formation of cabinets. The effective number of parties (N) carries the same information as Douglas W. Rae and Michael Taylor's (1970, 22-44] index of fragmentation (F) and can easily be calculated from F as follows:
N=_'_ l-F
The advantage of N is that it can be visualized more easily as the number of parties than the abstract Rae-Taylor index of fragmentation.
PARTY SYSTEMS 69
When the parties are not equal in strength, the effective number will be lower than the actual number. This can also be seen in Table 5.1. The two hypothetical examples of multiparty systems contain five parties each. When there is a dominant party, the effective number of parties is only 3.5. Without a dominant party, the seat shares are more equal and the effective number increases to 4.5, close to the raw number of parties in which all parties are counted regardless of size.
Closely Allied Parties
The problem of how to count parties of different sizes is solved by using the effective-number measure. This measure, however, does not solve the question of what a political party is. The usual assumption in political science is that organizations that call themselves "political parties" are, in fact, political parties. This assumption works well for most parties and most countries but is problematic in two situations: parties that are so tightly twinned that they look more like one party than two parties and, conversely, parties that are so factionalized that they look more like two or more parties than one party. The former problem is less difficult to solve than the latter. Let me turn to the relatively easier issue first.
The cases in point are the following five closely allied parties: the Christian Democratic Union (CDU) and Christian Social
. Union (CSU) in Germany, the Liberal and National parties in Australia, and, in Belgium, the two Christian Democratic parties that resulted from a split along linguistic lines in 1968, the two similarly divided Liberal parties since 1971, and the two Socialist parties since 1978. In particular, the two German and two Australian parties are often treated as single parties. For instance, Blondel (1968, 185) regards the Liberals and Nationals as one party when he calls the Australian party system a twoparty instead of a two-and -a -half party system, and he treats the CDU and CSU as one party when he calls the German system a
70 PARTY SYSTEMS
two-and-a-half instead of a two-and-two-halves party system. Another example is Manfred G. Schmidt's (1996, 95) statement that the three ''major established parties" in Germany are "the CDU-CSU, the SPD [Socialists] and the Liberals."
Four criteria can be applied to decide whether closely allied parties-which do have different names and separate party organizations-are actually two parties or more like one party. First, political parties normally compete for votes in elections; do the problematic five pairs of parties do so? The CDU and CSU do not compete for votes because they operate in different parts of the country: the CSU in Bavaria and the CDU in the rest of Germany. Neither do the three pairs of Belgian parties because they compete for votes in either Flanders or Wallonia and among either French-speakers or Dutch-speakers in Brussels. In the Australian single-member district elections, the pattern is mixed: Liberals and Nationals usually do not challenge an incumbent representative of the other party, but they may each nominate a candidate in Labor-held districts and in districts without an incumbent.
The second criterion revolves around the degree of cooperation between the parties in parliament and, in particular, whether the two parties form a single parliamentary party group and also caucus together. Only the CDU and CSU do so. Third, do the parties behave like separate parties in cabinet formations: are they either in the cabinet together or in opposition together, or can one be in the cabinet and the other in the opposition? In this respect, each of the five pairs operates strictly like a single party. The Australian example is particularly striking because, although the Liberals won clear seat majorities in the 1975, 1977, and 1996 elections, and could therefore have governed by themselves, they nevertheless included the Nationals in all three cabinets that they formed.
The fourth criterion is time: it only makes sense to consider counting tightly allied parties as one party if the close collaboration is oflong standing. Both duration and degree of closeness
PARTY SYSTEMS 71
distinguish the above five pairs of parties from other examples of electoral alliances that are mere "marriages of convenience." Electoral systems with single-member district elections give small and medium-sized parties a strong incentive to form such alliances, but these alliances tend to be ad hoc, temporary, and shifting; examples are France, India, and Mauritius.6 Electoral alliances also occur in PR systems, such as, in Portugal, the three-party Deinocratic Alliance that presented a single list of candidates and was highly successful in the 1979 and 1980 elections but that reverted to mutually competitive parties from 1983 on. In Italy, too, after the switch to a less proportional system in 1994, groupings like the Freedom Alliance and Olive Tree Alliance have been, as their names indicate, mere party alliances and not parties.
Unfortunately, the four criteria do not provide an unequivocal answer to the question of how the five problematic pairs of parties in Australia, Belgium, and Germany should be treated. They are all genuinely, somewhere in between two parties and one party. Therefore, instead of arbitrarily opting for either the one-party or two-party solution-or by simply flipping a coin!I propose to split the difference: calculate two effective numbers of parties, based first on the two-party assumption and next on the one-party assumption, and average these two numbers. This means that each twinned pair of parties is counted like one-and-a-half parties. Like any compromise, it may not be the most elegant solution, but it reflects the reality of these partisan actors better than either of the more extreme options.
6, ilie the Australian alternative vote system, the French two-ballot electoral system actually encourages parties not to merge but to make electoral alliances with like-minded parties (see Chapter 8). However, unlike the Australian Liberal-National alliance, the French Socialist-Communist and GaullistRepublican alliances fail to meet the criteria for closely allied parties, especially because Socialist cabinets have usually not included the Communists and because Gaullists and Republicans have fiercely challenged each other in presidential elections, except in 1995, when there were two Gaullist candidates but no Republican candidate.
72 PARTY SYSTEMS
Factionalized Parties
I propose a similar solution for highly factionalized parties: the Liberal and Conservative parties in Colombia, the Indian Congress party, the Italian Christian Democrats, the Liberal Democratic party in Japan, and the Democratic party in the United States. These are not the only parties in modem democracies that lack perfect cohesion-in fact, it is generally wrong to view parties as "unitary actors" (Laver and Schofield 1990, 14-28)-but they are the most extreme cases in which analysts have tended to conclude that the party factions are very similar to separate parties. For instance, Japan experts generally view the factions of the Liberal DemoQratic party as "parties within the party" (Reed and Bolland 1999); Junichiro Wada (1996, 28) writes that the Liberal Democrats are "not a single party but a coalition of factions"; and Raymond D. Gastil (1991, 25) pointedly states that "the 'real' party system in Japan is the factional system within the Liberal Democratic party." The Christian Democrats in Italy, John B. Goodman (1991, 341) st"tes, have been "more a collection o£factions than a unified party."
JohnA. Peeler (1985,102) describes the two large Colombian parties as "faction ridden" and states that "for most purposes the factions are the real political actors, not the parties." Jonathan Hartlyn (1989, 321) similarly concludes that "party factionalism" makes the party system of Colombia "resemble a multiparty system" more than a two-party system. Paul R. Brass (1990, 97) argues that it is more accurate to speak of the Indian "factional system" than of the Indian party system. And Klaus von Beyme (1985, 229) states that the United States Congress "has never had a two-party system and [that] all existing studies assume a four-party or at least three-party system. The Democrats especially generally act as two parties in Congress, the Southern Conservatives and the Northern Liberals."
These kinds of strong intraparty factions also tend to operate
PARTY SYSTEMS 73
much like political parties during cabinet formations and in coalition cabinets. As mentioned earlier. coalition cabinets tend to be les_~jllJIa]:>!efu;!lLQ1l§..'E~ cabinets. If factionsbehave like ;arties, ~.e .. W'ol1\c,la!~oe)(pectl;ibin~ts:';~~l'2.~id:;';fJ,!gtj()nalized partie~ !Q .b_eJ~ssc,lur,,]:>le.t,b.a;r,1 c!l,]:>iAe!~~fuI.!lg.!1'_GQhJl.sive parties. In an eight-nation comparative study, James N. Druckman (1996) found that this was indeed the case.
The big challenge in fioding a compromise solution for counting factionalized parties is that the two numbers to be compromised are not immediately obvious: at one end, there is the one-party alternative, but what is the number of parties at the other end? In Italy and Japan, where the intraparty factions have been the most distinct and identifiable, the number of factions has been quite large: if these factions are counted as parties, measured in terms of the effective number of parties discussed earlier, both the Christian Democrats and the Liberal Democrats would have to be counted as five to six parties (based on data in Leonardi.and Wertman 1989, 114-15, Baerwald 1986, 27). This is clearly excessive, since it would make the overall party systems of these two countries the most extreme multiparty systems in the world. My proposal for the alternative at the multiparty end is much more modest: treat each factionalized party as two parties of equal size. The compromise is then to average the effective number of parties based on the one-party assumption and the effective number based on the two-equalparties assumption.
The upshot is that factionalized parties are counted as oneand-a-half parties-exactly the same solution that I proposed for closely allied parties. Of course, my solution for factionalized parties is both a rougher approximation and more unconventional-and therefore likely to be more controversial. However, especially because this book focuses on the degree of multi partism as one of the elements of concentration versus fragmentation of power, it is absolutely necessary that severe intraparty
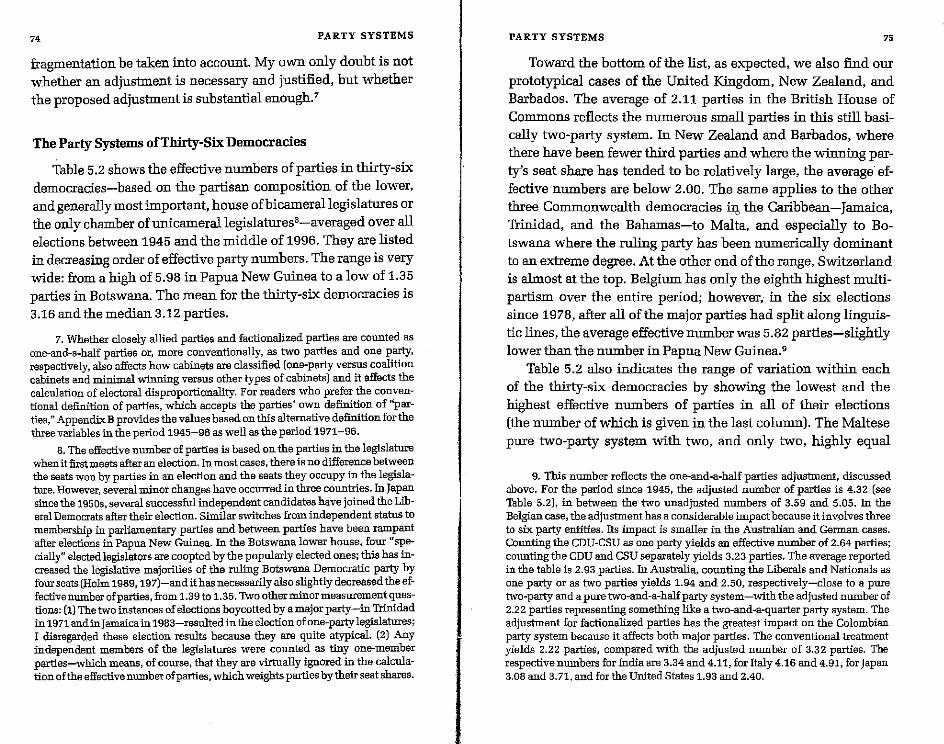
7' PARTY SYSTEMS
fragmentation be taken into account. My own only doubt is not whether an adjustment is necessary and justified, but whether the proposed adjustment is substantial enough.7
The Party Systems of Thirty-Six Democracies
Table 5.2 shows the effective numbers of parties in thirty-six democracies-based on the partisan composition of the lower, and generally most important, house of bicameral legislatures or the only chamber of unicamerallegislatures'-averaged over all elections between 1945 and the middle of 1996. They are listed in decreasing order of effective party numbers. The range is very wide: from a high of 5.98 in Papua New Guinea to a low of 1.35 parties in Botswana. The mean for the thirty-six democracies is 3.16 and the median 3.12 parties.
7. Whether closely allied parties and factionalized parties are counted as one-and-a-half parties or, more conventionally, as two parties and one party, respectively, also affects how cabinets are classified (one-party versus coalition cabinets and minimal 'Winning versus other types of cabinets) and it affects the calculation of electoral disproportionality. For readers who prefer the conventional definition of parties, which accepts the parties' own definition of "parties," Appendix B provides the values based on this alternative definition for the three variables in the period 1945-96 as well as the period 1971-96.
8. The effective number of parties is based on the parties in the legislature when it firstmeets after an election. In most cases, there is no difference between the seats won by parties in an election and the seats they occupy in the legislature. However, several minor changes have occurred in three countries. In Japan since the 1950s, several successful independent candidates have joined the Liberal Democrats after their election. Similar switches from independent status to membership in parliamentary parties and between parties have been rampant after elections in Papua New Guinea. In the Botswana lower house, four "specially" elected legislators are coopted by the popularly elected ones; this has increased the legislative majorities of the ruling Botswana Democratic party by fOUI seats (Holm 19B9, 197)-andithasnecessarily also slightly decreased the effectivenumber of parties, from 1.39 to 1.35. Two other minor measurement questions: (1) The two instances of elections boycotted by a major party-in Trinidad in 1971 andinJamaica in 19B3-resulted in the election of one-party legislatures; I disregarded these election results because they are quite atypical. (2) Any independent members of the legislatures were counted as tiny one-member parties-which means, of course, that they are virhlally ignored in the calculation of the effective number of parties, which weights parties by their seat shares.
PARTY SYSTEMS 75
Toward the bottom of the list, as expected, we also find our prototypical cases of the United Kingdom, New Zealand, and Barbados. The average of 2.11 parties in the British House of Co=ons reflects the numerous small parties in this still basically two-party system. In New Zealand and Barbados, where there have been fewer third parties and where the winoing party's seat share has tended to be relatively large, the average· effective numbers are below 2.00. The same applies to the other three Co=onwealth democracies iI;\ the Caribbean-Jamaica, Trinidad, and the Bahamas-to Malta, and especially to Botswana where the ruling party has been numerically dominant to an extreme degree. At the other end of the range, Switzerland is almost at the top. Belgium has only the eighth highest multipartism over the entire period; however, in the six elections since 1978, after all of the major parties had split along linguistic lines, the average effective number was 5.82 parties-slightly lower than the number in Papua New Guinea.9
Table 5.2 also indicates the range of variation within each of the thirty-six democracies by showing the lowest and the highest effuctive numbers of parties in all of their elections (the number of which is given in the last column). The Maltese pure two-party system with two, and only two, highly equal
9. This number reflects the one-and-a-half parties adjustment, discussed above. For the period since 1945, the adjusted number of parties is 4.32 (see Table 5.2), in between the two unadjusted numbers of 3.59 and 5.05. In the Belgian case, the adjustment has a considerable impact because it involves three to six party entities. Its impact is smaller in the Australian and German cases. Counting the CDU-CSU as one party yields an effective number of 2.64 parties; counting the cnu and CSU separately yields 3.23 parties. The average reported in the table is 2.93 parties. In Australia, counting the Liberals and Nationals as one party or as two parties yields 1.94 and 2.50, respectively-close to a pure nvo-party and a pure two-and-a-half party system-with the adjusted number of 2,22 parties representing something like a two-and-a-quarter party system. The adjustment for factionalized parties has the greatest impact on the Colombian party system because it affects both major parties. The conventional treatment yields 2.22 parties, compared with the adjusted number of 3.32 parties. The respective numbers for India are 3.34 and 4.11, for Italy 4.16 and 4.91, for Japan 3.08 and 3.71, and for the United States 1.93 and 2.40.
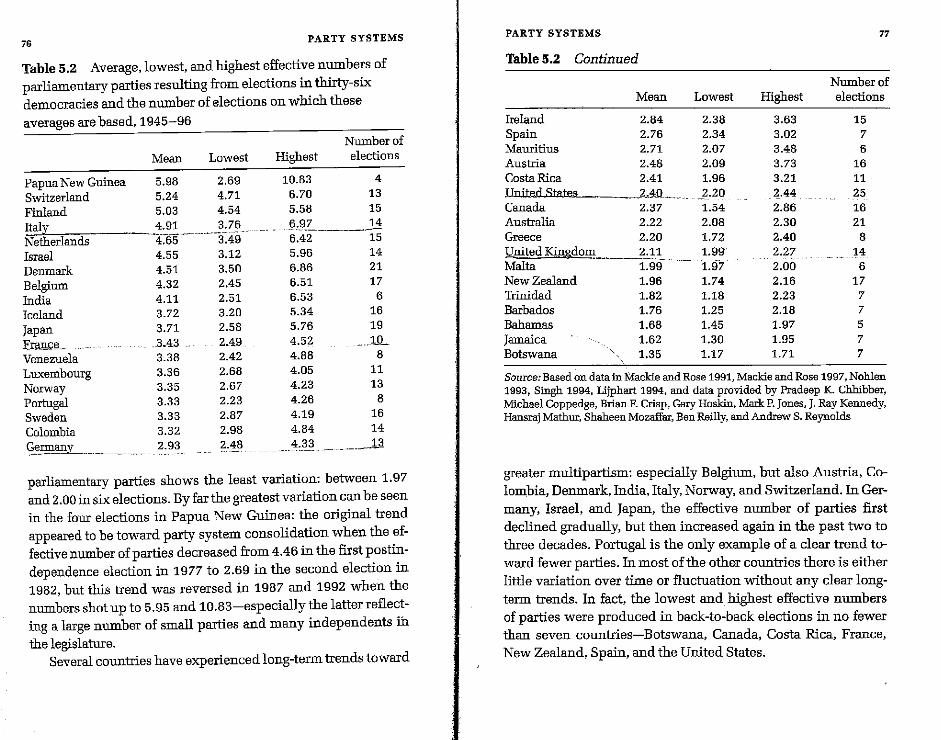
76 PARTY SYSTEMS
Table 5.2 Average, lowest, and highest effective numbers of parliamentary parties resulting from elections in thirty-six democracies and the number of elections on which these averages are based, 1945-96
Number of
Mean Lowest Highest elections
Papua New Guinea 5.98 2.69 10.83 4
Switzerland 5.24 4.71 6.70 13
Finland 5.03 4.54 5.58 15
Italy 4.91 3.76 _~._9L ___ .11 --,----,._,-_._------ -"
Netherlands 4.65 3.49 6.42 15
Israel 4.55 3.12 5.96 14
Denmark 4.51 3.50 6.86 21
Belgium 4.32 2.45 6.51 17
Iodia 4.11 2.51 6.53 6
Iceland 3.72 3.20 5.34 16
Japan 3.71 2.58 5.76 19
ITill!Ce_ 3.43 .' 2.49 4.52 . ill... Venezuela 3.38 2.42 4.88 8
Luxembourg 3.36 2.68 4.05 11
Norway 3.35 2.67 4.23 13
Portugal 3.33 2.23 4.26 8
Sweden 3.33 2.87 4.19 16
Colombia 3.32 2.98 4.84 14
~ED-JiIlL __ 2.93 2.48. _. ___ .4._3~ ___ . __ ._._1.3.
parliamentary parties shows the least variation: between 1.97 and 2.00 in six elections. By far the greatest variation can be seen in the four elections in Papua New Guinea: the original trend appeared to be toward party system consolidation when the effective number of parties decreased from 4.46 in the first postindependence election in 1977 to 2.69 in the second election in 1982, but this trend was reversed in 1987 and 1992 when the numbers shot up to 5.95 and 10.83-especially the latter reflecting a large number of small parties and many independents ill the legislature.
Several countries have experienced long-term trends toward
PARTY SYSTEMS 77
Table 5.2 Continued
Number of Mean Lowest Highest elections
Ireland 2.84 2.38 3.63 15 Spain 2.76 2.34 3.02 7 l.iauritius 2.71 2.07 3.48 6 Austria 2.48 2.09 3.73 16 Costa Rica 2.41 1.96 3.21 11 IInited States 2AolL __ ... _2.20 2.44 25 Canada 2.37 1.54 2.86 16 Australia 2.22 2.08 2.30 21 Greece 2.20 1.72 2.40 8 United Kjngdom 2.11 1.99 2.27 14 .. "".
Malta 1.99 1:97 2.00 6 New Zealand 1_96 1.74 2.16 17 Trinidad 1.82 1.18 2.23 7 Barbados 1.76 1.25 2.18 7 Babamas 1.68 1.45 1.97 5 Jamaica 1.62 1.30 1.95 7 Botswana 1.35 1.17 1.71 7
Source: Based on data in Mackie and Rose 1991, Mackie and Rose 1997, Nohlen 1993, Singh 1994, Lijphart 1994, and data provided by Pradeep K. Cbhibber, Michael Coppedge, Brian F. Crisp, Gary Hoskin, Mark P. Jones, J. Ray Kennedy, Hansraj Mathur, Shaheen Mozaffar, Ben Reilly, and Andrew S. Reynolds
greater multipartism: especially Belgium, but also Austria, Colombia, Denmark, India, Italy, Norway, and Switzerland. In Germany, Israel, and Japan, the effective millIber of parties first declined gradually, but then increased again in the past two to three decades. Portugal is the only example of a clear trend toward fewer parties. In most of the other countries there is either little variation over time or fluctuation without any clear longterm trends. In fact, the lowest and highest effective numbers of parties were produced in back-to-back elections in no fewer than seven countries-Botswana, Canada, Costa Rica, France, New Zealand, Spain, and the United States.
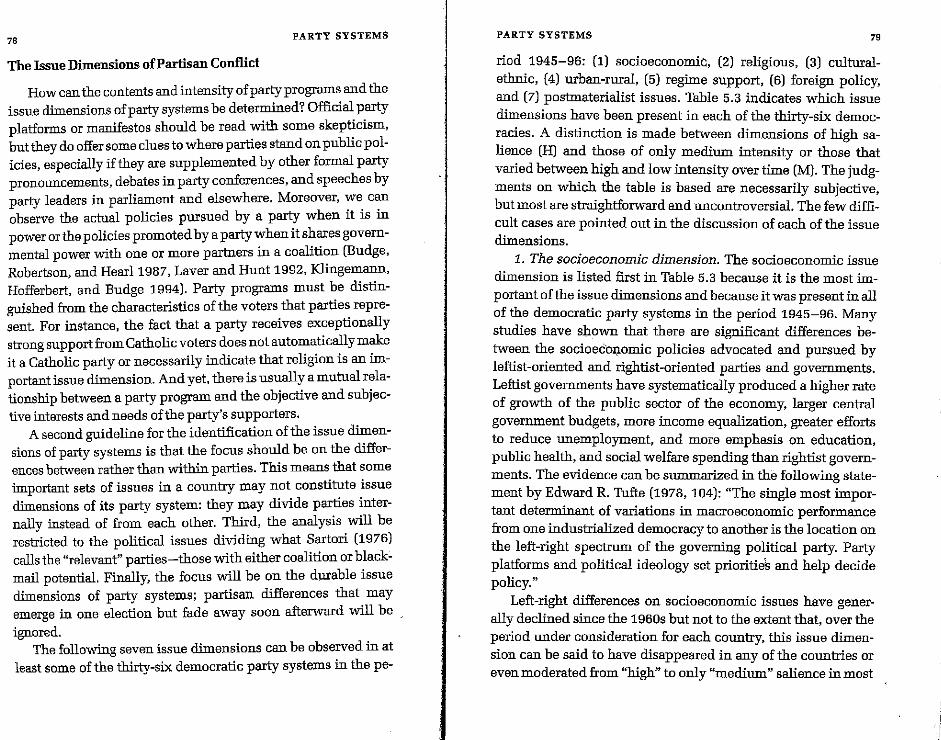
7. PARTY SYSTEMS
The Issue Dimensions of Partisan Conflict
How can the contents and intensity of party programs and the issue dimensions of party systems be determined? Official party platforms or manifestos should be read with some skepticism, but they do offer some clues to where parties stand on public policies, especially if they are supplemented by other formal party pronouncements, debates in party conferences, and speeches by party leaders in parliament and elsewhere. Moreover, we can observe the actual policies pursued by a party when it is in power or the policies promoted by a party when it shares governmental power with one or more partners in a coalition (Budge, Robertson, and Hearl 1987, Laver and Hunt 1992, Klingemann, Hofferbert, and Budge 1994). Party programs must be distinguished from the characteristics of the voters that parties represent. For instance, the fact that a party receives exceptionally strong support from Catholic voters does not automatically make it a Catholic party or necessarily indicate that religion is an important issue dimension. And yet, there is usually a mutual relationship between a party program and the objective and subjective interests and needs of the party's supporters.
A second guideline for the identification of the issue dimensions of party systems is that the focus should be on the differences between rather than within parties. This means that some important sets of issues in a country may not constitute issue dimensions of its party system: they may divide parties internally instead of from each other. Third, the analysis will be restricted to the political issues dividing what Sartori (1976) calls the "relevant" parties-those with either coalition or blackmail potential. Finally, the focus will be on the durable issue dimensions of party systems; partisan differences that may emerge in one election but fade away soon afterward will be ignored.
The following seven issue dimensions can be observed in at least some of the thirty-six democratic party systems in the pe-
PARTY SYSTEMS 7. riod 1945-96: (1) socioeconomic, (2) religious, (3) culturalethnic, (4) urban-rural, (5) regime support, (6) foreign policy, and (7) postmaterialist issues. Table 5.3 indicates which issue dimensions have been present in each of the thirty-six democracies. A distinction is made between dimensions of high salience (H) and those of only medium intensity or those that varied between high and low intensity over time (M). The judgments on which the table is based are necessarily subjective, but most are straightforward and uncontroversial. The few difficult cases are pointed out in the discussion of each of the issue dimensions.
1. The socioeconomic dimension. The socioeconomic issue dimension is listed first in Table 5.3 because it is the most important of the issue dimensions and because it was present in all of the democratic party systems in the period 1945-96. Many studies have shown that there are significant differences between the socioecGl).omic policies advocated and pursued by leftist -oriented and rightist -oriented parties and gove=ents. Leftist gove=ents have systematically produced a higher rate of growth of the public sector of the economy, larger central government budgets, more income equalization, greater efforts to reduce unemployment, and more emphasis on education, public health, and social welfare spendil).g than rightist governments. The evidence can be summarized in the following statement by Edward R. Tufte (1978, 104): "The single most important determinant of variations in macroeconomic performance from one industrialized democracy to another is the location on the left-right spectrum of the governing political party. Party platforms and political ideology set priorities and help decide policy."
Left-right differences on socioeconomic issues have generally declined since the 1960s but not to the extent that, over the period under consideration for each country, this issue dimension can be said to have disappeared in any of the countries or even moderated from "high" to only "medium" salience in most
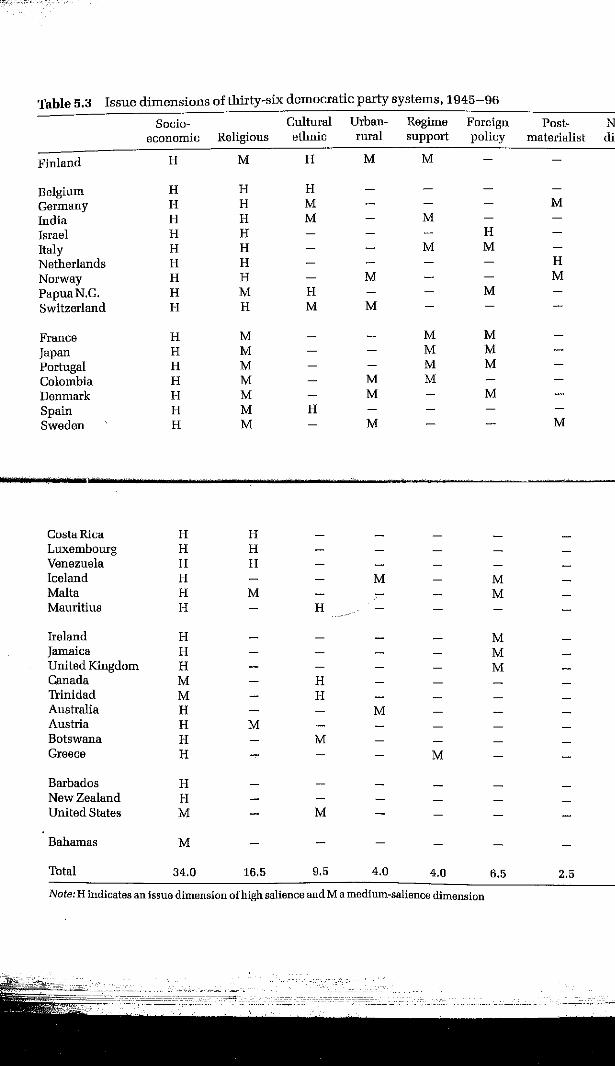
Table 5.3 Issue dimensions of thirty-six democratic party systems. 1945-96
Socio- Cultural Urban- Regime Foreign Post- Number of economic Religious ethnic rural support policy materialist dimensions
Finland H M H M M 3.5
Belgium H H H 3.0 Germany H H M M 3.0 India H H M M 3.0
Israel H H H 3.0
Italy H H M M 3.0
Netherlands H H H 3.0
Norway H H M M 3.0
PapuaN.G. H M H M 3.0
Switzerland H H M M 3.0
France H M M M 2.5
Japan H M M M 2.5
Portugal H M M M 2.5
Colombia H M M M 2.5
Denmark H M M M 2.5
Spain H M H 2.5
Sweden H M M M 2.5
CustaRicu H H 2.U Luxembourg H H 2.0 Venezuela H H 2.0 Iceland H M M 2.0 Malta H M M 2.0 Mauritius H H ----- 2.0
Ireland H M 1.5 Jamaica H M 1.5 United Kingdom H M 1.5 Canada M H 1.5 Trinidad M H 1.5 Australia H M 1.5 Austria H M 1.5 Botswana H M 1.5 Greece H M 1.5
Barbados H 1.0 New Zealand H 1.0 United States M M 1.0
Bahamas M 0.5
Total 34.0 16.5 9.5 4.0 4.0 6.5 2.5 77.0
Note: H indicates an issue dimension of high salience and M a medium-salience dimension
82 PARTY SYSTEMS
countries. Table 5.3 assigns "medium" ratings only to the United States, Canada, the Bahamas, and Trinidad. When the thirty-six ratings are added up-with an H counted as 1.0 and an Mas 0.5-the total is 34.0, as indicated in the bottom line of the table. This total score for the socioeconomic dimension is more than twice as high as the total score for any of the other dimensions; the socioeconomic dimension is also the only one that has been present to a significant extent in all thirty-six party systems-confirming Seymour Martin Lipset's (1960, 220) famous statement that elections can be seen as "the expression of the democratic class struggle."
2. The religious dimension. Differences between religious and secular parties constitute the second most important issue dimension. Such differences can be found in more than half of the thirty-six democracies. In twelve countries that are largely Catholic and/or Protestant, there are, or have long been, many parties that explicitly call themselves "Christian": Belgium, Costa Rica, Denmark, Finland, Germany, Italy, Luxembourg, the Netherlands, Norway, Sweden, Switzerland, and Venezuela. Where, in these twelve party systems, the religious-secular difference has been important throughout the period under consideration, a "high" rating is assigned in Table 5.3, and a "medium" score is assigned to the others. In six mainly Catholic countries, religious divisions have on average been less prominent and explicit but still merit at least a "medium" rating: Austria, Colombia, France, Malta, Portugal, and Spain. In three mainly nonChristian countries, a religious issue dimension has also been present. It has been, and continues to be, extremely important in Israel, where the National Religious party and other religious parties have long been highly effective advocates of orthodox religious policies, and in India, where the Bharatiya Janata party is usually described as a "Hindu nationalist" party. In Japan, the Komeito party became a significant political presence in the 1970s; it is the political representative of the Buddhist Soka Gakkai sect.
PARTY SYSTEMS 83
Like the socioeconomic issue dimension, the religious dimension has generally declined in importance in the postWorld War II period. In the European countries with mixed Catholic and Protestant populations and histories of CatholicProtestant antagonism, interreligious tensions have largely disappeared and the two groups have even tended to unite politically. The Christian Democratic Union of postwar Germany was founded as a joint Catholic-Protestant party. In the Netherlands, the Catholic party and the two main Protestant parties presented a joint list in the 1977 parliamentary elections and merged into a single party organization soon thereafter. Moreover, both the religious parties and their anticlerical opponents have moderated their claims and counterclaims to a large extent. However, religious and secular parties are still divided on a range of moral issues, such as questions of marriage and divorce, gay rights, birth control, abortion, sex education, pornography, and so on. These issues have become especially prominent since the late 1960s. Moreover, it was not until the second half of the period that the relatively small religious parties of Japan, Denmark, Finland, mid Sweden became electorally important and not until the early 1990s that they clearly established their coalition potential by actually entering coalition cabinets.
3. The cultural-ethnic dimension. In their developmental theory of cleavage structures and party systems, Seymour Martin Lipset and Stein Rokkari (1967) identify four basic sources of party-system cleavages. These are, in addition to the socioeconomic and religious dimensions already discussed, culturalethnic cleavages and the division between rural-agrarian and urban-industrial interests. The cultural-ethnic dimension is of soroe importance in all nine of the countries described as plural societies in Chapter 4 except Israel. In most of these, culturalethnic issues have high salience. The two rather surprising exceptions are ethnically highly divided India and Switzerland; in these two countries the religious dimension is the much more salient differentiator at the national level.
.. PARTY SYSTEMS
In three of the semiplural societies, the cultural-ethnic dimension is of some importance, too. In Finland, the Swedishspeaking minority and the Swedish People's party are both very small, but the party has been an effective political actor and a frequent partner in coalition governments. Because the Christian Social Union ofBavaria is counted as a "half" party and also because of the emergence of the Party of Democratic Socialism as a specifically East German party since unification in,1990, Germany is given a "medium" score. No American party has an exclusively ethnic base, but the Democrats have been much more representative of and sensitive to the interests of ethnic and racial minorities than the Republicans, and when affirmative-action and other special minority programs have become controversial, Democrats have tended to support and Republicans to oppose them. And in Botswana, the ruling party "is perceived by the Bamangwato and the Bakwena tribes as repre
senting their people" (Holm 1988, 191). 4. The urban-rural dimension. Differences between rural and
urban areas and interests occur in all democracies, but they constitute the source of issue dimensions in the party systems of only a few and only with medium salience. Where agrarian parties are found, mainly in the Nordic countries, they have tended to become less exclusively rural and to appeal to urban electorates, too, prompted by the decline of the rural population. A clear sign of this shift is that the Swedish, Norwegian, and Finnish agrarian parties all changed their names to "Center Party" between 1957 and 1965. The Danish Liberals and the Icelandic Progressives also originated as agrarian parties but similarly try to portray themselves as center parties. The Swiss People's party and the Colombian Conservatives can also be regarded as parties that are to some extent representatives of rural interests. The Australian National party used to be called the "Country Party~ and has been the traditional defender of rural and farming concerns. In deference to its classification as a "half" party, how-
PARTY SYSTEMS 85
ever, Australia is assigned only a "medium" score on the urbanrural dimension.
5. The dimension of regime support. This dimension may occur in democracies as a result of the presence of important parties that oppose the democratic regime. In our thirty-six democracies, it has occurred mainly in European and Asian countries with sizable Communist parties: France, Italy, Finland, Portugal, Greece, India, and Japan. However, the trend toward "Eurocommunism" has entailed basic changes in Communist attitudes toward both democracy and foreign policy, and the Indian and Japanese Communist parties have similarly become more moderate. For this reason, none of the party systems is given more than a "medium" rating on this dimension. The only other country with a sizable Communist party is Iceland, but the Icelandic Communists may be said to have been Eurocommunists since 1938. At that time, they joined with a Socialist faction to form a new party which, as the Icelandic political scientist Olafur R. Grimsspn (1982, 145) states, "would acknowledge the parliamentary rdad to power, adhere to an Icelandic form of socialism, and resign the [party'sJ membership in the Comintern, a position which reflected more the European 1970s than the late 1930s." Colombia is assigned a "medium" score for a quite different reason: the prominent role of the AD-M19 party, which originated as a revolutionary movement but later participated in elections and even entered the cabinet in the early 1990s.
6. The foreign policy dimension. A great variety of foreign policy issues have divided the parties in twelve of our thirty-six democracies: the traditional, but declining pro-Soviet stance of the European Communist parties; opposition to NATO (North Atlantic Treaty Organization) membership in France and Iceland; opposition to membership in the European Union and its predecessors in Britain, Denmark, France, Ireland, and Malta; relationships with the United States in Japan and Jamaica; relationships with Australia in Papua New Guinea; relationships
86 PARTY SYSTEMS
with Libya in Malta; and different attitudes of the Irish parties toward the Northern Ireland problem. None of these was either prominent or durable enough, however, to merit more than a "medium" rating. The only country with a "high" score in Table 5.3 is Israel. Here the issue is a nationalist-territorial one, and the debate is, in the words of Israeli political scientist Ofira Seliktar (1982, 295) "between those who follow the maximalist territorial tradition of the Revisionists and those who adhere to the more moderate territorial demands of the Socialist-Zionist school." This issue dimension has been especially salient since the occupation of Arab territories in 1967.
7. The materialist versus postmaterialist dimension. This dimension revolves around the two issues of participatory democracy and environmentalism that both fit the cluster of values of what Ronald Inglehart (1977, 40,-50,; also Inglehart 1997, 10,8-
3D) has called "postroaterialism." Inglehart found that, especially among young middle-class people in Western democracies, a high priority is accorded to goals like "seeing that the people have more say in how things get decided at work and in their co=unities" and "giving the people more say in iroportant government decisions." Moreover, in the richer nations the cluster of postroaterialist values also included the objective of "trying to make our cities and countryside more beautiful." As Table 5.3 shows, postroaterialism has become the source of a new dimension in only a few party systems. The explanation is that it has emerged only in the more developed countries and only recently, and that, as a result, the postroaterialist parties have remained small and generally without clear coalition potential. However, the Norwegian and Swedish Center parties have made a smooth transition from old-fashioned rural to modern environmentalist values, and two new Dutch parties, Democrats '66 and Radicals, espoused participationist proposals as early as the late 196Ds and entered a coalition cabinet in 1973. Germany is also given a "medium" rating on this dimension
PARTY SYSTEMS 87
because of the prominence of the Green party; it has participated in several governments at the state level, and it was widely considered to have coalition potential at the national level as well, even before it actually entered a national cabinet, as the junior partner of the Socialists, in 1998.
Issue Diroensions and Party Systems
The last column of Table 5.3 shows the number of issue dimensions in each of the thirty-six democracies. This number could, in principle, range from 7 to a dimensions, but the actual range is only from 3.5 to 0,.5. The countries with the same total scores are grouped in the table, and these groupings are listed in decreasing order of their number of issue dimensions. Within each category, countries that have the same pattern of issue dimensions are listed first. For instance, in the group with 2.5 issue dimeI).sions, France, Japan, and Portugal have the same "high" socioeconomic diroension plus the same "medium" re-
,
ligious, regiIDe support, and foreign policy dimensions. Costa Rica, Luxembourg, and Venezuela form a similar subgroup in the 2.0, category. Five countries with a British political heritage form two subgroups in the 1.5 category: one consists of Ireland, Jamaica, and the United Kingdom, and the other of Canada and Trinidad.
How are these numbers of issue diroensions related to the effective numbers of political parties? There are two reasons to expect a' strong link. First, when there are several dimensions of political conflict in a society, one would expect that a relatively large number of parties are needed to express all of these dimensions, unless they happen to coincide. Second, issue dimensions have been defioed in terms of differences between instead of within parties; this means that, for instance, two-party systems cannot easily acco=odate as many issue diroensions as -'--"-'~--~ul.!iparty systeIlJS. The coefficient of correlation between the
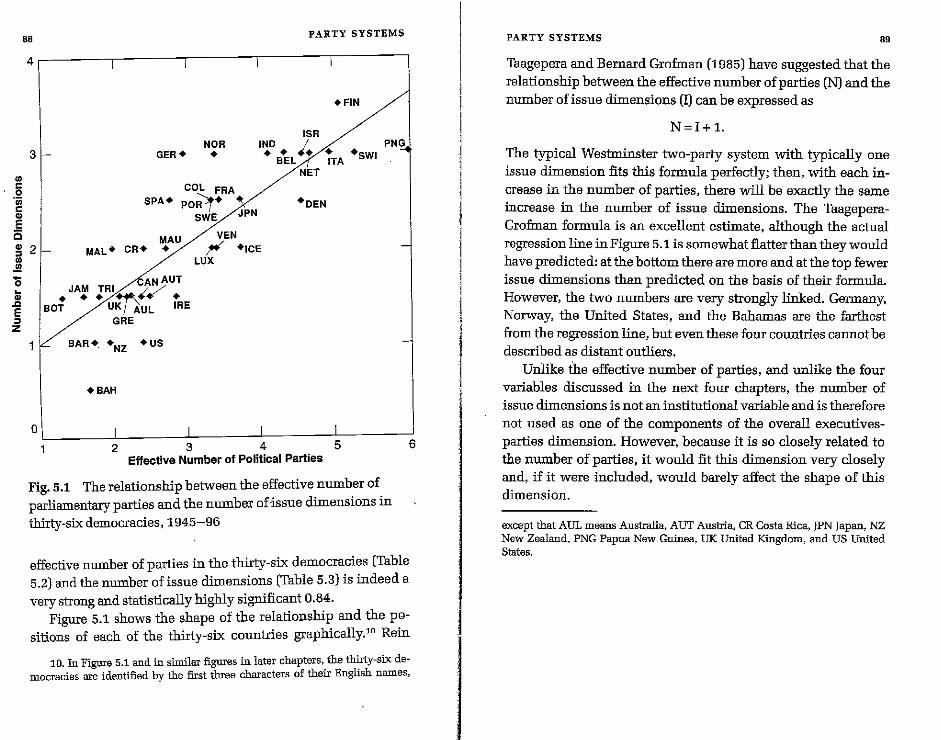
tJj C 0 'iii c
" E 0
88 PARTY SYSTEMS
4" -----,-----,-----,----~----~
3 NOR
GER· •
+FIN
ISR INO I • • •• /+ ·SWI Bel//, ITA
NET
COL FRA SPA. PO~. V ·DEN
SWE /JPN
VEN
PNG
~ 2 MAU
MAL. CR. • ;W +ICE LUX .,
.!!!. -0 ~
" .c E ::J Z
AN AUT JAMYuifRI -,"/
+ + + ;/., + BOT U~UL IRE
GRE
BAR •. +NZ .US
+ BAH
o I I 2 3 4 5 6
Effective Number of Political Parties
Fig. 5.1 The relationship between the effective number of parliamentary parties and the number oEssue dimensions in thirty-six democracies, 1945-96
effective number of parties in the thirty-six democracies (Table 5.2) and the number of issue dimensions (Table 5.3) is indeed a very strong and statistically highly significant 0.84.
Figure 5.1 shows the shape of the relationship and the pgsitions of each of the thirty-six countries graphically."O Rein
10. In Figure 5.1 and in similar figures in later chapters, the thirty-six democracies are identified by the first three characters of their English names,
1
PARTY SYSTEMS 89
Taagepera and Bernard Grofman (1985) have suggested that the relationship between the effective number of parties (N) and the number of issue dimensions (I) can be expressed as
N=I+1.
The typical Westminster two-party system with typically one issue dimension fits this fonnula perfectly; then, with each increase in the number of parties, there will be exactly the same increase in the number of issue dimensions. The TaageperaGrofman fonnula is an excellent estimate, although the actual regression line in Figure 5.1 is somewhat flatter than they would have predicted: at the bottom there are more and at the top fewer issue dimensions than predicted on the basis of their fonnula. However, the two numbers are very strongly linked. Gennany, Norway, the United States, and the Bahamas are the farthest from the regression line, but even these four countries cannot be described as distant outliers.
Unlike the effective number of parties, and unlike the four I
variables discussed in the next four chapters, the number of issue dimensions is not an institutional variable and is therefore not used as one of the components of the overall executivesparties dimension. However, because it is so closely related to the number of parties, it would fit this dimension very closely and, if it were included, would barely affect the shape of this dimension.
except that AUL means Australia, AUT Austria, CR Costa Rica, JPN Japan, NZ New Zealand, PNG Papua New Guinea, UK United Kingdom, and US United States.
,
CHAPTER 6
Cabinets Concentration Versus Sharing of Executive Power
The second of the ten basic variables that characterize the difference between majoritarian and consensus forms of democracy, to be discussed in this chapter, concerns the breadth of participation by the people's representatives in the executive branch of the government. As I stated at the beginning of Chapter 5, this variable can be regarded as the most typical variable in the majoritarian-consensus contrast: the difference between one-party majority governments and broad multiparty coalitions epitomizes the contrast between themajoritarian principle of concentrating power in the hands of the maj ority and the consensus principle of broad power-sharing.
Single-party majority cabinets and broad multiparty coalitions differ from each other in two respects: whether the cabinet is a one-party cabinet or a coalition cabinet and the kind of parliamentary support base that the cabinet has. As far as the support base is concerned, the standard threefold classification in coalition theory distinguishes among (1) minimal winning cabinets, which are "winning" in the sense that the pariy or parties in the cabinet control a majority of parliamentary seats but "minimal" in the sense that the cabinet does not include any party that is not necessary to reach a majority in parliament, (2) oversized cabinets, which do contain more parties than are necessary for majority support in the legislature, and (3) minor-
CABINETS 91
ity or "undersized" cabinets, which are not supported by a parliamentary majority. The most majoritarian type of cabinet is one that is single-party and minimal winning-that is, a oneparty majority cabinet. The most consensual type of cabinet is multiparty .and oversized. As I argue below, minority cabinets resemble oversized cabinets, and multiparty minority cabinets therefore also belong to the consensus end of the spectrum. This leaves two kinds of cabinets that are in an intermediate position: multiparty minimal winning cabinets and one-party minority cabinets.
In this chapter I review the major coalition theories and explain why they are such poor predictors of the kinds of cabinets that are actually formed in democracies. One important reason is that they are based almost entirely on majoritarian assumptions; another is that they tend to ignore institutional features that encourage the formation of minority and oversized cabinets. Next;., after discussing the precise criteria for assigning cabinets to th~ different categories, I present the empirical findings
,
concerning the types of cabinets found in thirty-six democracies in the period 1945-96; our democracies differ a great deal on
. this variable-from 100 percent cabinets that are one-party and minimal winning in five countries to 4.1 percent in Switzerland. Last, I analyze the relationship between types of cabinets and the effective numbers of parties in ourset of thirty-six countries.
Coalition Theories
In parliamentary systems of government, cabinets have to be formed so that they will enjoy the confidence of-or will at least be tolerated by-a parliamentary majority. Can we predict which particular cabinet will form if we know the strengths of the different parties in parliament? If one party has a majority of the parliamentary seats, a prediction appears to be easy: the majority party is likely to form a one-party cabinet. This prediction is correct in most cases, but it is also possible that the majority
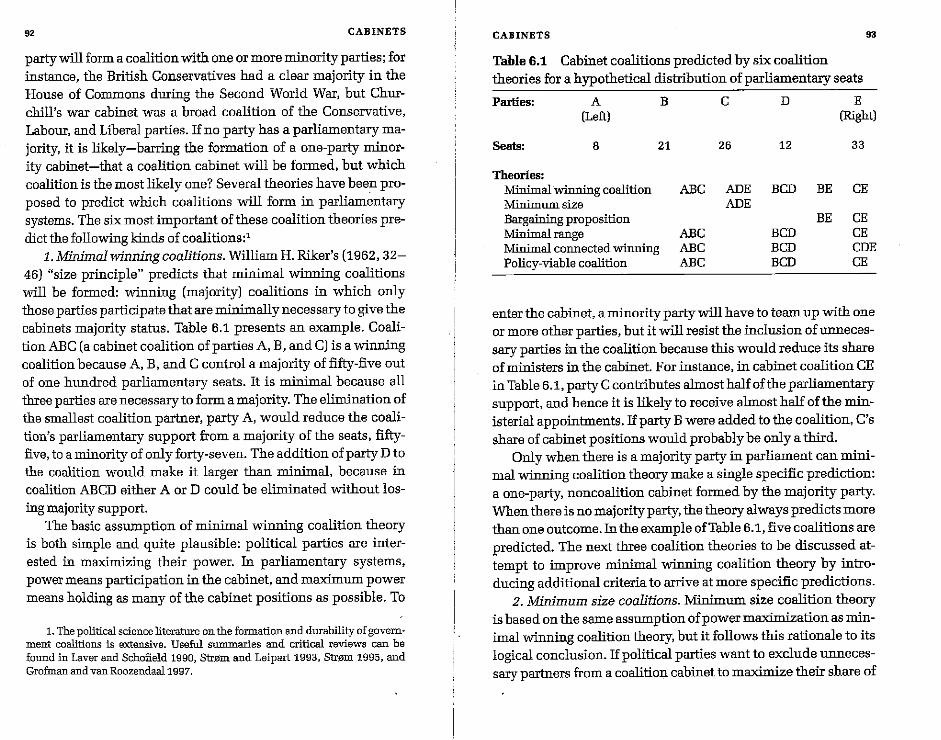
92 CABINETS
party will form a coalition with one or more minority parties; for instance, the British Conservatives had a clear majority in the House of Commons during the Second World War, but Churchill's war cabinet was a broad coalition of the Conservative, Labour, and Liberal parties. If no party has a parliamentary majority, it is likely-barring the formation of a one-party minority cabinet-that a coalition cabinet will be formed, but which coalition is the most likely one? Several theories have been proposed to predict which coalitions will form in parliamentary systems. The six most important of these coalition theories predict the following kinds of coalitions:'
1. Minimal winning coalitions. William H. Riker's (1962, 32-
46) "size principle" predicts that minimal winning coalitions will be formed: winning (majority) coalitions in which only those parties participate that are minimally necessary to give the cabinets majority status. Table 6.1 presents an example. CoalitionABC (a cabinet coalition of parties A, B, and C) is a winning coalition because A, B, and C control a majority of fifty-five out of one hundred parliamentary seats. It is minimal because all three parties are necessary to form a majority. The elimination of the smallest coalition partner, party A, would reduce the coalition's parliamentary support from a majority of the seats, fiftyfive, to a minority of only forty-seven. The addition of party D to the coalition would make it larger than minimal, because in coalition ABCD either A or D could be eliminated without losing majority support.
The basic assumption of minimal winning coalition theory is both simple and quite plausible: political parties are interested in maximizing their power. In parliamentary systems, power means participation in the cabinet, and maximum power means holding as many of the cabinet positions as possible. To
1. The political science literature on the formation and durability of government coalitions is extensive. Useful summaries and critical reviews can be found in Laver and Schofield 1990, StrJZlm and Leipart 1993, Stram 1995, and Grofmanand vanRoozendaallgg7.
CABINETS 93
Table 6.1 Cabinet coalitions predicted by six coalition theories for a hypothetical distribution of parliamentary seats
Parties: ABC D E (Left) (Right)
Seats: 8 21 26 12 33
Theories: Minimal winning coalition ABC ADE BCD BE CE Minimum size ADE Bargaining proposition BE CE Minimal range ABC BCD CE J.\;Iinimal connected winning ABC BCD CDE Policy-viable coalition ABC BCD CE
enter the cabinet, a minority party will have to team up with one or more other parties, but it will resist the inclusion of unnecessary parties in the coalition because this would reduce its share of ministers in the cabinet. For instance, in cabinet coalition CE in Table 6.1, party C contributes almost half of the parliamentary support, and hence it is likely to receive almost half of the ministerial appointments. If party B were added to the coalition, C's share of cabinet positions would probably be only a third.
Only when there is a majority party in parliament can minimal winning coalition theory make a single specific prediction: a one-party, noncoalition cabinet formed by the majority party. When there is no majority party, the theory always predicts more than one outcome. In the example of Table 6.1, five coalitions are predicted. The next three coalition theories to be discussed attempt to improve minimal winning coalition theory by introducing additional criteria to arrive at more specific predictions.
2. Minimum size coalitions. Minimum size coalition theory is based on the same assumption of power maximization as minimal winning coalition theory, but it follows this rationale to its logical conclusion. If political parties want to exclude unnecessary partners from a coalition cabinet to maximize their share of
94 CABINETS
cabinet power, they should also be expected to prefer the cabinet to be based on the narrowest possible parliamentary majority. For instance, it is more advantageous for party E to form coalition ADE with fifty-three seats than CE with fifty-nine seats. In the former, E's thirty-three seats in parliament contribute 62 percent of the cabinet's parliamentary support, and in the latter only 56 percent. In a cabinet with twenty ministers, this difference is easily worth an additional ministerial appointment for party E. According to this reasoning, cabinets of minimum size are predicted. In the example of Table 6.1, coalition ADE with fifty-three parliamentary seats is predicted rather than the other four minimal winning coalitions whose sizes range from fiftyfour to fifty-nine seats.
3. Coalitions with the smallest number of parties. A different criterion that may be used to choose among the many coalitions predicted by minimal winning coalition theory is Michael Leiserson's (1970, 90) "bargaining proposition." He argues that those minimal winning coalitions will tend to form that involve the smallest possible number of parties, because "negotiations and bargaining [about the formation of a coalition] are easier to complete, and a coalition is easier to hold together, other things being equal, with fewer parties." Of the five minimal winning coalitions in Table 6.1, the bargaining proposition predicts that coalitions BE or CE will form because they involve only two parties rather than one of the three-party coalitions.
4. Minimal range coalitions. The preceding theories base their predictions on the sizes and number of political parties but ignore their programs and policy preferences. Minimal range coalition theory makes the plausible assumption that it is easier to form and maintain coalitions among parties with similar policy preferences than among parties that are far apart in this respect. Of the several slightly different versions of this theory, Table 6.1 presents the most basic onB: the parties are placed on a left-right scale, with party A at the extreme left and E at the extreme right, and the distance between them is measured in terms
""
CABINETS 95
of the number of "spaces" separating them. The five minimal winning coalitions have ranges of two, three, and four "spaces." If parties seek to form a coalition with like-minded partners, coalition ABC, with a range of two "spaces," is much more likely than coalition ADE, with a range of four "spaces" covering the entire left-right spectrum. Minimal range theory also predicts coalitions BCD and CE, which have the same minimal range of two "spaces" as ABC.
5. Minimal connected winning coalitions. A closely related theory has been proposed by Robert Axelrod (1970, 165-87). He predicts that coalitions will form that are both "connected"that is, composed of parties that are adjacent on the policy scale-and devoid of unnecessary partners. The underlying assumption of this theory is that parties will try to coalesce with their immediate neighbors and that other adjacent parties will be added until a majority coalition is formed. The example of Table 6.1 shows that minimal connected winning coalitions are not necessarily minimal winning coalitions. According to the latter theory, coalition CDE contains a superfluous partner-
. party D-but in Axelrod's theory, party D is necessary to make the coalition a connected one.
6. Policy-viable coalitions. The focus on the policy preferences of parties is taken to its ultimate conclusion by policyviable coalition theory. If we assume that parties truly care only about policy instead of holding office, real power resides in the legislature, where major new policies have to be enacted, rather than in the cabinet. In the legislature, itis the "core" party that is of pivotal importance; the core party is the party that, on a onedimensional policy scale like the left-right scale, contains the median member of parliament: party C in the example of Table 6.1. This pivotal party can virtually dictate policy because neither the party or parties on its left nor those on its right have the majorities necessary to enact any policy contrary to its wishes. This means that, in strict policy terms, it is completely irrelevant how many and which parties participate in the cabinet. In
:,:
96 CABINETS
fact, as Michael Laver and Norman Schofield (1990, 88) state, for the formation of policy-viable cabinets "it does not [evenl matter whether or not the pivotal party" participates.
And yet, Laver and Schofield (1990, 55) concede that a distinction should be made between big policy questions and more detailed matters of policy. To influence detailed matters of policy, it can be quite important after all to be in the cabinet and at the head of a ministerial department, and this consideration "may provide a strong incentive for parties concerned not at all with the intrinsic rewards of office none the less to slug it out for a seat at the cabinet table." The importance of which party holds which cabinet portfolio is also emphasized in the recent work of Michael Laver and Kenneth A. Shepsle (1996). The implication is that parties are presumably also interested in "slugging it out" for as many cabinet seats and ministerial portfolios as possiblewhich takes us back to the logic of minimal winning coalitions, with the proviso that the pivotal party be included in such coalitions: coalitions ABC, BCD, and CE in Table 6.1. In the final analysis, policy-viable coalition theory either makes no prediction about the composition of cabinets or predicts minimal winning coalitions similar to those predicted by minimal range theory:z
Incentives for the Formation of Minority and Oversized Cabinets
Of the above six coalition theories, the policy-based ones have been able to predict actual cabinet coalitions more suc-
2. Two alternative interpretations of policy-viable coalition theory are that the core party should be able to govern by itself or that the coalition should include the core party (Str0ID.. Budge, and Laver 1994, 328J. The firstinterpretation yields the prediction that a one-party minority cabinet will be formed-not a prediction that is likely to be successful because fewer than 20 percent of cabinets formed in minority situations are one-party minority cabinets (see Table 6:2 below). The problem 'With the second interpretation is that it produces a large number of predictions: :in the situation of Table 6.1, fifteen coalitions can be formed that include party C. One of these may well be the cabinet that is formed; if so, the one correct prediction is still outweighed by fourteen incorrect ones.
CABINETS 97
cessfullythan the policy-blind theories (de Swaan 1973). Some of this success has to be discounted because the assignment of parties to positions on the left-right scale may involve circular reasoning. Where a party stands on left-right issues may be inferred from its formal program, its votes in parliament, and so on, but is also likely to be influenced by whether the party is or has been a member of the gove=ent and with which other parties it has formed a coalition. In Germany, for instance, the Free Democratic party is usually assigned a center position on the policy scale-in contrast with the right-of-center position of other European Liberal parties-because it was in several cabinet coalitions with the leftist Social Democrats from 1969 to 1982. Explaining this coalition in terms of the two parties' adjacent policy positions, which are in turn derived from their coalition behavior, obviously does not explain very much.
The basic problem of all of the theories is that they predict minimal, winning coalitions of one kind or another; Axelrod's theory is only a partial exception because few of his mjnjmal
connected winning coalitions are larger than minimal winning. . The minimal winning prediction is based on a majoritarian assumption, and it conflicts with the large numbers of actual minority and oversized coalitions that are formed in parliamentary democracies. Laver and Schofield (1990, 70-71) classify 196 cabinets formed in "minority situations" (that is, where there is no majority party in parliament) in twelve European multiparty democracies from 1945 to 1987. Only 77 of these-39.3 percent-were minimal winning coalitions; 46 were oversized and 73 were minority cabinets.
Table 6.2 presents similar data on the cabinets in the thirtytwo parliamentary systems investigated in this book (including Switzerland and the two short phases of parliamentary government in the French Fifth Republic). Several of these are countries that usually have majority parties in their parliaments; this accounts for the large proportion of one-party majority cabinets: 37.1 percent. As indicated earlier, when one party has a majority
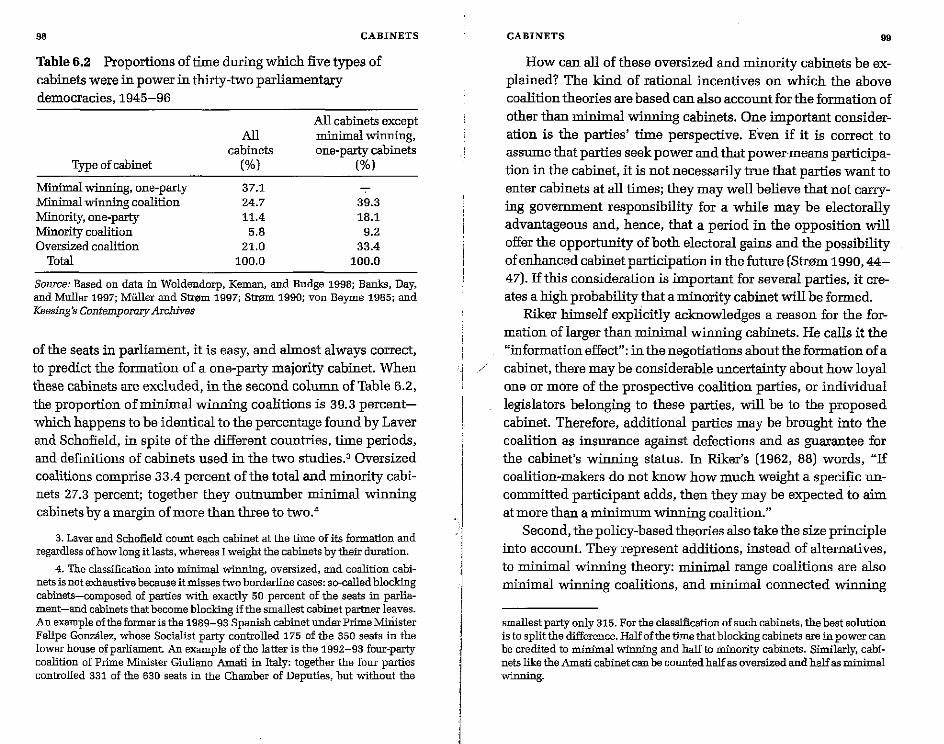
98 CABINETS
Table 6.2 Proportions of time during which five types of cabinets were in power in thirty-two parliamentary democracies, 1945-96
Type of cabinet
Minimal winning, one-party Minimal winning coalition Minority, one-party Minority coalition Oversized coalition
Total
All cabinets
(%)
37.1 24.7 11.4
5.8 21.0
100.0
All cabinets except minimal winning, one-party cabinets
(%)
39.3 18.1
9.2 33.4
100.0
Source: Based on data in Woldendorp, Keman, and Budge 1998; Banks, Day, and Muller 1997; Millier and Str0m 1997; Stram 1990; von Beyme 1985; and Keesing's Contemporary Archives
of the seats in parliament, it is easy, and almost always correct, to predict the formation of a one-party majority cabinet. When these cabinets are excluded, in the second column of Table 6.2, the proportion of minimal winning coalitions is 39.3 percentwhich happens to be identical to the percentage found by Laver and Schofield, in spite of the different countries, time periods, and definitions of cabinets used in the two studies.3 Oversized coalitions comprise 33.4 percent of the total and minority cabinets 27.3 percent; together they outnumber minimal winning cabinets by a margin of more than three to two.4
3. Laver and Schofield count each cabinet at the time of its formation and regardless of how long it lasts, whereas I weight the cabinets by their duration.
4. The classification into minimal winning. oversized. and coalition cabinets is not exhaustive because it misses two borderline cases: so-called blocking cabinets-composed of parties with exactly 50 percent of the seats in parliament-and cabinets that become blocking if the smallest cabinet partner leaves. An example of the former is the 1989-93 Spanish cabinet under Prime MiI:iister Felipe Gonzalez, whose Socialist party controlled 175 of the 350 seats in the lower house of parliament An example of the latter is the 1992-93 four-party coalition of Prime Minister Giuliano Amati in Italy: together the four parties controlled 331 of the 630 seats in the Chamber of Deputies, but without the
CABINETS 99
How can all of these oversized and minority cabinets be explained? The kind of rational incentives on which the above coalition theories are based can also account for the formation of other than minimal winning cabinets. One important consideration is the parties' time perspective. Even if it is correct to assume that parties seek power and that power·means participation in the cabinet, it is not necessarily true that parties want to enter cabinets at all times; they may well believe that not carrying gove=ent responsibility for a while may be electorally advantageous and, hence, that a period in the opposition will offer the opportunity of both electoral gains and the possibility of enhanced cabinet participation in the future (Str0m 1990, 44-47). If this consideration is important for several parties, it creates a high probability that a minority cabinet will be formed.
Riker himself explicitly acknowledges a reason for the formation of larger than minimal winning cabinets. He calls it the "information effect": in the negotiations about the formation of a
/ cabinet, there may be considerable uncertainty about how loyal one or more of the prospective coalition parties, or individual legislators belonging to these parties, will be to the proposed cabinet. Therefore, additional parties may be brought into the coalition as insurance against defections and as guarantee for the cabinet's winning status. In Riker's (1962, 88) words, "If coalition-makers do not know how much weight a specific unco=itted participant adds, then they may be expected to aim at more than a minimum winning coalition."
Second, the policy-based theories also take the size principle into account. They represent additions, instead of alternatives, to minimal winning theory: mjnjmal range coalitions are also minimal winning coalitions, and minimal connected winning
smallest party only 315. For the classification of such cabinets, the best solution is to split the difference. Half of the time that blocking cabinets are in power can be credited to minimal winning and half to minority cabinets. Similarly, cabinets like the Amati cabinet can be counted half as oversized and half as minimal winning.
100 CABINETS
coalitions either equal or are only slightly larger than minimal winning size. In reality. however, the parties' policy preferences may exert strong pressures to enlarge instead of to minimize the size and range of coalitions. Each party naturally prefers to form a cabinet that will follow policies close to its own policy preferences; a cabinet in which it participates with parties of about equal weight on both its left and its right is ideal in this respect. In the example of Table 6.1 above, if B and C are inclined to participate in a coalition together, coalition ABC is more attractive to B because B occupies the center position in it, whereas for the same reason C prefers coalition BCD. In such a situation, it is not at all unlikely that the oversized coalition A,BCD will be formed.
Third, policy considerations also lead to oversized coalitions if it is the overriding objective of all or most of the parties to work together to defend the country or the democratic regime against external or internal threats. Wars are the main external threats, and wartime grand coalitions, such as Churchill's war cabinet in Britain, have occurred frequently. Internal threats may be posed by anti -democratic parties and movements and by deep differences among prodemocratic parties in plural societies. Ian Budge and Valentine Herman (1978, 463) tested the following hypothesis in twenty-one countries during the period 1945-78: "Where the democratic system is immediately threatened (externally or internally), all significant pro-system parties will join the government, excluding anti-system parties." They found that of the cabinets formed under such crisis conditions, 72 percent were indeed such broad coalitions.
In addition, several institutional features may favor the formation of minority and oversized instead of minimal winning cabinets (Str0m, Budge, and Laver 1994). For instance, it is easier to form a minority cabinet in the absence of an investiture requirement-that is, if a new cabinet can take office without the need for a parliamentary vote formally electing or approving it; a minority cabinet is more likely to be formed when the parlia-
CABINETS 101
mentary majority is allowed to tolerate it instead of having to give it explicit approval. There are many parliamentary democracies without investiture rules: examples are the United Kingdom and most former British colonies (but not Ireland and Papua New Guinea), the Scandinavian countries, and the Netherlands (Bergman 1995, 40-46).
The requirement of a "constructive" vote of no confidencethat is, the provision that a no-confidence motion must simultaneously propose an alternative cabinet-may have two different effeGts. A successful no-confidence vote, supported by a parliamentary majority, is akin to investiture and hence encourages the formation of majority cabinets. And yet, the constructive noconfidence requirement may also maintain a minority cabinet in power if the parliamentary majority opposing the cabinet is too divided to agree on an alternative. Germany was the first country to adopt the constructive vote of no confidence in its postwar constitution. It is now also used by Spain, Papua New Guinea, and, since 1993, by federal Belgium.
Minority cabinets are also encouraged by an innovative rule in the constitution of the French Fifth Republic. It gives the cabinet the right to make its legislative proposals matters of confidence and stipulates that such proposals be automatically adopted unless an absolute majority of the National Assembly votes to dismiss the cabinet: the government bill "shall be considered as adopted, unless a motion of censure ... is voted under the conditions laid down in the previous paragraph." This previous paragraph prescribes that "the only votes counted shall be those favorable to the motion of censure, which may be adopted only by a majority of the members comprising the Assembly" (Article 49). Aided by this rule, the minority Socialist cabinets serving under President Fran~ois Mitterrand managed not only to stay in power from 1988 to 1993 but also to pass much of their legislative program.
Probably the most important institutional feature favoring minority cabinets is the strength of parliamentary committees;
102 CABINETS
powerful committees with a great deal of influence on the general thrust as well as the details of proposed legislation give parties the ability to influence policy from their positions in the legislature-and decrease their incentives to try to enter the cabinet (Stnnn 1990,70-72). The strength oflegislative committees is one aspect of the general question of the balance of power between executives and legislatures (the subject of the next chapter): all other factors being equal, the incentives to participate in cabinets decrease, and the probability of minority cabinets increases, when legislatures are relatively strong vis-a.-vis executives.
Oversized cabinets may also be encouraged by particular institutional provisions. An unusually clear example can be found in the National Front agreement between the Liberal and Conservative parties that ended the violent civil war of the late 1940s and 1950s in Colombia. Equal representation of both parties in the cabinet, as well as alternation in the presidency, were constitutionally prescribed from 1958 to 1974. The requirement of broad coalition cabinets was extended for four more years, but even after 1978 the second largest party had to be offered "adequate and equitable" representation in the cabinet (Hartlyn 1989, 292). This led to the continuation of two-party coalitions until 1986, when the Conservatives refused to participate in the cabinet of Liberal president Virgilio Barco.
A different example of a constitutional provision concerning the composition of the cabinet is the prescription of linguistic balance in Belgium. It has indirectly tended to enlarge the cabinet. If, for instance, the Flemish Socialists are invited into the cabinet, the requirement of linguistic balance increases the probability that the Francophone Socialists will be included, too, even if they are not needed to give the cabinet a parliamentary majority.
Finally, special majorities necessary for the adoption of constitutional amendments or regular legislation may be strong reasons for forming oversized cabinets. If the policy agenda of a
CABINETS 103
new cabinet includes one or more important amendments to the constitution, any special majorities required fortbis purpose are likely to broaden the composition of the cabinet. The two-thirds majority rule for constitutional amendments in Belgium was one of the reasons for its many oversized cabinets duriog the long process of constitutional reform that led to the establishment of a federal state in 1993. Belgium is also an example of other important laws that require not just two-thirds majorities but concurrent majorities within each of the linguistic groups (see Chapter 3). Until the early 1990s, Finland's tendency to have oversized cabinets was similarly reinforced by the requirement of two-thirds and even five-sixths majorities for certain types of economic legislation. Moreover, "even ordinary laws passed by simple majority could be deferred until after the next election by a vote of one-third of the members, a striking provision for a temporary minority veto. These procedures rewarded consensual behavior and made a minimum-majority coalition less valuable than a broader one" (McRae 1997, 290). In Colombia, most legislative measures required two-thirds majorities for
. passage during the first ten years of the National Front.
Minority Cabinets
The threefold classification into minimal winning, oversized, and minority cabinets and the twofold classification into one-party and coalition cabinets appear simple and straightforward, but they raise a number of problems that need to be resolved before they can be used to measure the degree of concentration of executive power. The most important of these problems are the treatment of minority cabinets and presidential cabinets.
It is clear that minimal winning and one-party cabinets represent majoritarian characteristics and that oversized and coalition cabinets express consensus traits. But where do minority cabinets fit? In principle, there can be two kinds of minority
104 CABINETS
cabinets. One is a genuine minority cabinet that has to negotiate continually with one or more noncabinet parties both to stay in office and to solicit support for its legislative proposals; this bargaining relationship, typically with different noncabinet parties for different purposes, makes such minority cabinets resemble oversized coalltions. The other kind is described by Strllm (1997,56) as "majority gove=ents in disguise"-minority cabinets that are more like majority cabinets because they have received a firm co=itment of support from one or more specific parties in the legislature, although these have opted not to take portfolios in the cabinet.
In his earlier study, Strllm (1990, 95) found that only 11 percent of the many minority cabinets he analyzed could be regarded as such disguised majorities-allowing him to conclude that, by a large margin, most minority cabinets are not "simply majority gove=ents in disguise .... Instead, the typical minority cabinet is a single-party government ... which may have to look for legislative support from issue to issue on an ad hoc basis." On the basis of Str0m's findings as well as two additional considerations-that the commitment of a support party is never as solid as that of a party actually in the cabinet and thatit is often difficult to determine whether a party qualifies as a support party-it makes the most sense, both theoretically and practically, to treat minority cabinets like oversized cabinets. Accordingly, the contrast will be between minimal winning cabinets on one hand and oversized and minority cabinets on the other.
Presidential Cabinets
The classifications into one-party'versus coalition cabinets and minimal winning versus oversized versus minority cabinets have been applied mainly to cabinets in parliamentary systems of gove=ent, which has been the almost exclusive focus of coalition theorists. Can they also be applied to presidential cabinets? Two crucial adjustments are needed for this purpose. The
CABINETS 105
differences between parliamentary and presidential systems are more fully and systematically discussed in the next chapter, but one major difference is that the executive (cabinet) in parliamentary systems depends on majority support in the legislature both to stay in office and to get its legislative proposals approved, whereas the executive in presidential systems needs legislative majority support only for the president's legislative proposals; presidents are elected for a fixed term of office, and neither they nor the cabinets they appoint are dependent on the confidence of the legislature for their survival in office. Therefore, in one respect-staying in office-presidents and presidential cabinets are minimal winning by definition; in the other respect-legislative support for proposed laws-presidential cabinets may be minimal winning, oversized, or minority cabinets depending on the party affiliations of the presidents and of their cabinet members and the sizes of the respective parties in
!the legislature. This means that whereas cabinets in parliamentary systems can vary between 0 and 100 percent minimal winning, the variation for presidential cabinets is only between 50 and 100 percent.
The other difference between parliamentary and presidential systems that is of critical relevance here is that parliamentary executives are collegial cabinets, whereas presidential executives are one-person executives; in presidential systems, executive power is concentrated in the president, and his or her cabinet consists of advisers to the president instead of more or less coequal participants. For the distinction between one-party and coalition executives, this means that in one respect presidential cabinets are one-party cabinets by definition-the one party being the president's party because of the president's dominant status in the cabinet. On the other hand, it does make a substantial difference whether a president appoints only members of his or her own party to the cabinet or whether members of one or more other parties are also included. On the assumption that these two aspects can be weighted equally, presidential
IW .,
106 CABINETS
cabinets can vary between 50 and 100 percent one-party cabinets in contrast with parliamentary cabinets where the range of variation is the full a to 100 percent. As is explained more fully in the next chapter, the five presidential systems are the United States, France (except in the two short parliamentary phases), Costa Rica, Colombia, and Venezuela.' So-called semipresidential systems other than France can be treated like parliamentary systems. Switzerland is an intermediate case, but for the purpose of classifying the composition of its executive, it can be treated as a parliamentary system.
Unusual Cabinets in Austria, the United States, and Japan
The great variety of forms that cabinets can assume can be illustrated further by three of our democracies: Austria, the United States, and Japan. Even these unusual cabinets, however, can still be classified in terms of the basic criteria distinguishing one-party cabinets from coalitions and minimal winning from oversized and minority cabinets.
The so-called grand coalition cabinets in Austria from 1949 to 1966 exemplify the rather frequent occurrence of very broad coalitions, composed of a country's two largest parties-which are, however, minimal winning cabinets in purely technical terms. These Austrian coalitions were composed of the Socialists and the conservative People's party, which together controlled on average more than 92 percent of the parliamentary seats during this period. Since each of the parties had fewer than half of the seats, however, their cabinets were technically minimal winning because the defection of either would have turned the cabinet into a minority cabinet. In substantive terms, such broad coalitions should obviously be regarded as oversized. Ac- _ cordingly, I classified as oversized any coalition cabinet based
5. In addition, Israel's brief experience-only about one month at the end of the period under analysis-under the "directly elected prime minister" should also be tre.ated like a presidential phase (see Chapter 7).
CABINETS 107
on a large supermajority of four-fifths-80 percent-or more of the seats in the legislature.6
American cabinets provide the main examples of partisan cabinets with one or two "token" members drawn from a different party; token participation in cabinets means a share of cabinet seats that is much lower than what a party could expect on the basis of proportionality. For instance, Republicans C. Douglas Dillon and Robert S. McNamara served in President Joho F. Kennedy's cabinet, and Democrat Joho B. Connally served in President Richard M. Nixon's cabinet; the example of Connally is especially striking because he had been an active Democratic politician and had served as Democratic governor of Texas (Jones 1984, 107-8). A similar more recent example is the appointment of former Republican senator William Cohen as secretary of defense in the second Clinton administration. Richard F. Fenno's (1959, 68) conclusion is still valid: "Typically, the entire Cabinet is of the same political party as the President .... The few exceptions serve only to prove the rule. Many deviations from this norm are more apparent than real, involving men whose ideas and sympathies obviously do not coincide with their partisan labels." It is worth noting that Connally later switched parties and became a candidate for the Republican presidential nomination in 1980. One important general finding concerning coalition cabinets is that approximate proportionality in the division of cabinet positions tends to be adhered to scrupulously (Browne and Frendreis 1980). It is
6. The other cases of substantively oversized cabinets are a later Austrian cabinet (1987-90), the 1961-65 Belgian cabinet, the National Front cabinets in Colombia with equal representation of Liberals and Conservatives from 1958 to 1978, the well-known "grand coalition" of Christian Democrats and Social Demoerats in Germany from 1966 to 1969, the 1954-59 cabinet in Luxembourg, and the three-month coalition of the two main Venezuelan parties in 1992. However, I deviate from my own 80 percent rule in the case of the French Gaullist-Republican cabinet that took office in 1993, because its huge parliamentary majority (81.8 percent) was manufactured from a mere 39.9 percent of first-ballot votes. Technically-according to the 80 percent mle-this was an oversized cabinet, but substantively it can be regarded only as mjnimal 'Winning.
108 CABINETS
therefore not at all difficult to distinguish tokenism from genuine coalitions, and token ministers-just like nonpartisan ministers in otherwise partisan cabinets' -can be ignored in the classification of cabinets.
The Liberal Democratic (LDP) cabinets in Japan from 1976 to 1993 present the unusual case of a numerically minimal winning cabinet behaving like a minority cabinet. T. J. Pempel (1992, 11) writes that the LDP, instead of using "its parlialllen-tary majority to ralll through controversial legislation," tended to follow "the norm of cross-party consensus building. Usually the LDP [tried] to ensure support for its proposals by at least one, and often more, opposition parties." In Japan, this was called the strategy of "partial coalition" with the parliamentary opposition (Krauss 1984, 263). Especially because experts on Japanese politics link this behavior to strong consensual norms "that operate against what the Japanese usually refer to as 'tyranny of the majority'" (pempel1992, 11), these LDP cabinets should be counted as minority rather than minimal winning."
7. Because all of the classifications of cabinets are based on their partisan composition, cabinets that are entirely "nonparty" or "business" cabinets have to be disregarded, but fortunately these do not occur frequently: the only cases in OUT thirty-six democracies are three short-lived cabinets, serving less than two years altogether, in Finland, the 1995-96 caretaker cabinet of Prime Minister Lamberto Dini in Italy, and the 1993-94 nonpartisan administration of Pres ident Ram6n Velasquez after the forced resignation of President Carlos Andres Perez in Venezuela.
8. Two final issues of classification need to be mentioned briefly. First, the logical consequence of the treatment of factionalized and closely linked parties as one-and-a-halfparties, explained in Chapter 5, is that cabinets composed of such parties have to be classified as half one-party cabinets and half two-party coalition cabinets. For instance, all of the Liberal-National cabinets in Australia have to be counted as in between one-party and coalition cabinets; moreover, when the liberals have had a majority of seats in parliament, such cabinets are halfway between minimal winning and oversized cabinets. Second, any major interelecti.on changes in the legislative seats controlled by cabinet parties must be taken into consideration. For instance, the British Labour cabinet began as a minimal winning cabinet in October 1974 but became a minority cabinet in the middle of1976 (see Chapter 2). A reverse example is the Indian Congress cabinet that started off as a minority cabinet in 1991 but became a minimal winning
CABINETS 109
Cabinets. in Thirty.Six Democracies
The first and second columns of Table 6.3 present the types of cabinets in thirty-six democracies in terms of the time that minimal winning and one-party cabinets were in power. The values in the third column are the averages of those in the first two; they measure the overall degree of majoritarianism in the formation of cabinets. The countries are listed in ascending order of the majoritarian,nature of their cabinets.
The scores in the first two columns are strongly correlated (r=0.62, significant at the 1 percent level), mainly because at the top of the table both scores tend to be low and at the bottom they tend to be high. Most one-party cabinets are also minimal winning, and oversized cabinets are coalitions by definition. In the middle of the table, however, are several countries in which the two elements are unequally combined: some that have mainly minimal winning cabinets but few one-party cabinets-especially Belgium, Germany, Iceland, and Luxembourg-and some with relatively few minimal winning but many one-party cabinets-especially Spain and Sweden. The range of variation on both variables is wide: from 8.2 to 100 percent on minimal winning cabinets and from 0 to 100 percent on one-party cabinets. Six countries always had minimal winning cabinets without exception, and nine countries always had one-party cabinets; by contrast, five countries never had one-party cabinets. The tendency to have minimal winning cabinets is slightly stronger than the tendency toward one-party cabinets: the mean and median of the values in the first column are 64.0 and 65.4 percent, compared with 55.2 and 53.5 percent in the second column. The third column ranges from 4.1 to 100 percent with a mean of 59.6 and a median of 57.3 percent.
As expected, Switzerland turns up at the top of the table; its only minimal winning coalition occurred from 1955 to 1959
cabinet in December 1993 when several defectors from other parties were welcomed into the Congress party.
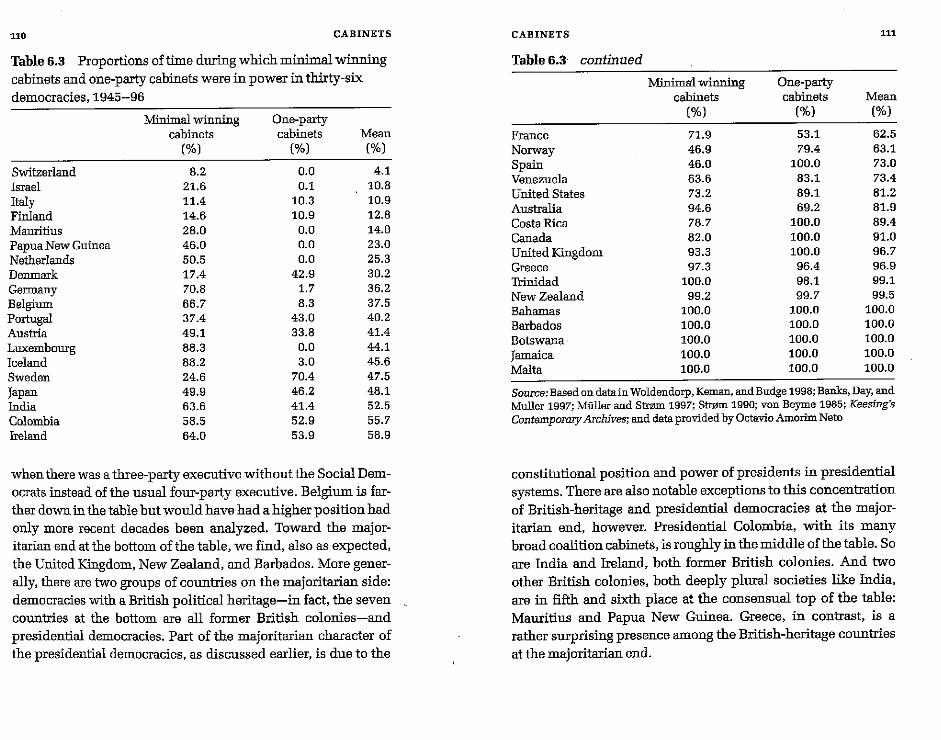
110 CABINETS
Table 6.3 Proportions of time during which minimal winning cabinets and one-party cabinets were in power in thirty-six democracies, 1945-96
Minimal winning One-party cabinets cabinets Mean
(%) (%) (%)
Switzerland 8.2 0.0 4.1
Israel 21.6 0.1 10.8
Italy 11.4 10.3 10.9
Finland 14.6 10.9 12.8
Mauritius 28.0 0.0 14.0 Papua New Guinea 46.0 0.0 23.0
Netherlands 50.5 0.0 25.3
Denmark 17.4 42.9 30.2
Germany 70.8 1.7 36.2
Belgium 66.7 8.3 37.5
Portugal 37.4 43.0 40.2
Austria 49.1 33.8 41.4
Luxembonrg 88.3 0.0 44.1
Iceland 88.2 3.0 45.6
Sweden 24.6 70.4 47.5
Japan 49.9 46.2 48.1 India 63.6 41.4 52.5
Colombia 58.5 52.9 55.7 Ireland 64.0 53.9 58.9
when there was a three-party executive without the Social Democrats instead of the usual four-party executive. Belgium is farther down in the table but would have had a higher position had only more recent decades been analyzed. Toward the majoritarian end at the bottom of the table, we find, also as expected, the United Kingdom, New Zealand, and Barbados. More generally, there are two groups of countries on the majoritarian side: democracies with a British political heritage-in fact, the seven countries at the bottom are all former British colonies-and presidential democracies. Part of the majoritarian character of the presidential democracies, as discussed earlier, is due to the
CABINETS 111
Table 6.3' continued
Minllrurl winning One-party cabinets cabinets Mean
(%) (%) (%)
France 71.9 53.1 62.5
Norway 46.9 79.4 63.1
Spain 46.0 100.0 73.0
Venezuela 63.6 83.1 73.4
United States 73.2 89.1 81.2
Australia 94.6 69.2 81.9
Costa Rica 78.7 100.0 89.4
Canada 82.0 100.0 91.0 United Kingdom 93.3 100.0 96.7
Greece 97.3 96.4 96.9
Trinidad 100.0 98.1 99.1
New Zealand 99.2 99.7 99.5
Ballarnas 100.0 100.0 100.0
Barbados 100.0 100.0 100.0
Botswana· 100.0 100.0 100.0
Jamaica 100.0 100.0 100.0
Malta 100.0 100.0 100.0
Source: Based on data in Woldendorp, Keman, and Budge 1998; Banks, Day, and Muller 1997; MUller and S'!::r0m 1997; Strom 1990; von Beyme 1985; Keesing's Contempormy Archives; and data provided by Octavia Amorim Neto
constitutional position and power of presidents in presidential systems. There are also notable exceptions to this concentration of British-heritage and presidential democracies at the majoritarian end, however. Presidential Colombia, with its many broad coalition cabinets, is roughly in the middle of the table. So are India and Ireland, both former British colonies. And two other British colonies, both deeply plural societies like India, are in fifth and sixth place at the consensual top of the table: Mauritius and Papua New Gninea. Greece, in contrast, is a rather surprising presence among the British-heritage countries at the majoritarian end.
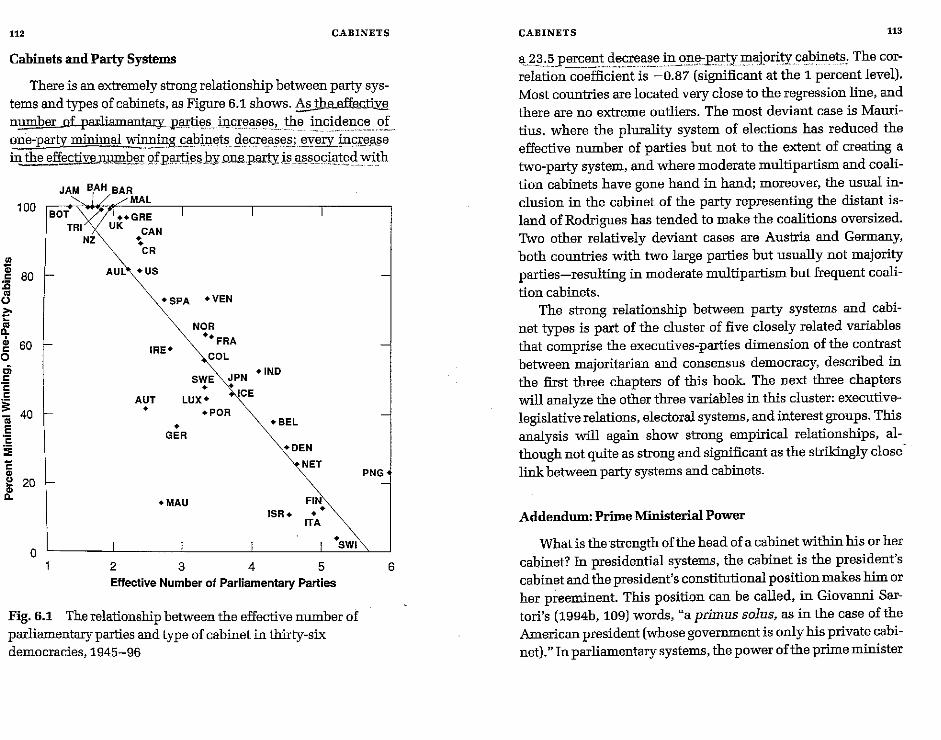
112 CABINETS
Cabinets and Party Systems
There is an extremely strong relationship between party systems and types of cabinets, as Figure 6.1 shows. ~e effectj~ number of pal:liamentaI:¥ ___ ;p9rtt~,s, _iJ!~.~B:~,~~! .. _:tP-~ ~?:c_~~~.~~~ .. ~L. one-party minimal ~l,!gc_~l:J~nets liecrease,s; ,E!.~~i,ll.c!5l-'l.§e in the effec~QSl"gfpemes.Ry .o.ngp..arty j,s _"sS9c!",t~<lvvith
100 'BOT
TRI NZ .. L ~ 80 AUL"- -us ..,
" " -SPA +VEN 0
~ " NOR Il.
·+FRA cI> 60 r:: IRE· 0 COL ,;; JPN +IND r:: SWE
'" - ICE r:: LUX·
~ 40
AUT - .POR " • '" +BEL E
'" GER
:E ~N E NET
" ~ 20 Il. +MAU FIN' -)SR. -ITA
a I I I I ·SWI
2 3 4 5 Effective Number of Parliamentary Parties
Fig. 6.1 The relationship between the effective number of parliamentary parties and type of cabinet in thirty-six democracies, 1945-96
PNG
6
CABINETS 113
a~.3.~.p.:'~~t3E:td_,:c.r.ea~.ein<:lg~:p8Jiy ]llajorityc~binet,s, The correlation coefficient is -0.87 (significant at the 1 percent level). Most countries are located very close to the regression line, and there are no extreme outliers. The most deviant case is Mauritius, where the plurality system of elections has reduced the effective number of parties but not to the extent of creating a two-party system, and where moderate multipartism and coalition cabinets have gone hand in hand; moreover, the usual inclusion in the cabinet of the party representing the distant island of Rodrigues has tended to make the coalitions oversized. Two other relatively deviant cases are Austria and Germany, both countries with two large parties but usually not majority parties-resulting in moderate multipartism but frequent coalition cabinets.
The strong relationship between party systems and cabinet types is part of the cluster of five closely related variables that comprise the executives-parties dimension of the contrast between majoritarian and consensus democracy, described in the first three chapters of this book. The next three chapters will analyze the other three variables in this cluster: executivelegislative relations, electoral systems, and interest groups. This analysis will again show strong empirical relationships, although not quite as strong and significant as the strikingly close link between party systems and cabinets.
Addendum: Prime Ministerial Power
What is the'strength of the head of a cabinet within his or her cabinet? In presidential systems, the cabinet is the president's cabinet and the president's constitutional position makes binI or her preeminent. This position can be called, in Giovanni Sartori's (1994b, 109) words, "a primus solus, as in the case of the American president (whose government is only his private cabinet)." In parliamentary systems, the power of the prime minister
111"
114 CABINETS
who heads the cabinet can vary greatly from-again using Sartori's terminology-a strong "first above unequals" to a medium "first among unequals" to a relatively weak "first among equals."
In this chapter, I have measured the concentration of power and the degree of majoritarianism in the cabinet in terms of the breadth of representation and the numbers of parties included in the cabinet. A logical corollary would be to expect the degree of prime ministerial power to be related to the concentration of power in the cabinet. Anthony King's (1994, 153) threefold classification of the within-cabinet power of prime ministers in thirteen European countries-similar to Sartori's trichotomous scheme-allows a test of this hypothesis. King classifies six prime ministers as having a high degree of influence within their cabinets: those in Germany, Greece, Ireland, Portugal, Spain, and the United Kingdom. The Austrian, Belgian, Danish, and Swedish prime ministers are placed in a medium position. Those in Italy, the Netherlands, and Norway have a relatively low degree of influence. 9
A comparison of King's ranking with the scores in the third column of Table 6.1 shows that prime ministers indeed appear to have greater power in countries with majoritarian than in those with consensual cabinets. Ouly three prime ministers deviate markedly from the general pattern: the Norwegian prime minister has less power and the German and Portuguese prime ministers have more power than predicted on the basis of the type of cabinet. The correlation coefficient is 0.58 (significant at the 5 percent level). The correlation would be stronger still if Switzerland had been included. The Swiss cabinet (Federal Council) is an extremely egalitarian body with a chair rotating
9. King (1994, 152) omits the French and Finnish prime ministers because they "share power in somewhat idiosyncratic ways" with their respective presidents. He also omits the chair of the Swiss executive (presumably because,Switzerland is not a parliamentary system), the prime ministers of the two small European countries of Iceland and Luxembourg, and all non-European prime ministers.
CABINETS 115
annually' among all ofits seven members-possibly even necessitating the addition of a fourth type of prime minister to Sartori's three categories: that of an "equal among equals"! And Switzerland also has the highest incidence of oversized coalition cabinets.
Ill' '~ ,
l'-- IIIIIIIIIiI..o ~
117EXECUTIVE-LEGISLATIVE RELATIONS
the incid~nceof o~e-party majority government and the degreeof executive dommance in the thirty-six democracies. I closewith a briefdiscussion of the power exercised by heads of statemonarchs and presidents-and some of the problems associatedwith monarchical and presidential power.
Parliamentary and Presidential Forms ofGovernment
Parliamentary and presidential systems of government havethree crucial differences. First, in a parliamentary system, thehead of government-who may have such different official titlesas prime minister, premier, chancellor, minister-president, taoiseach (in Ireland), or, rather confusingly, even "president" (inBotswana), but whom I generically term the prime ministerand his or her cabinet are responsible to the legislature in thesense that they are dependent on the legislature's confidenceand can be dismissed ,!'rom office by a legislative vote of noconfidence or censurejIn a presidential system, the head of government-always called president-is elected for a constitutionally prescribed period and in normal circumstances cannotbe force.d to resign by a legislative vote of no confidence.Ialthough It may be possible to remove a president for criminalwrongdoing by the process of impeachment).'
The second difference between presidential and parliament":'" governments is that presidents are popularly elected, eitherdirectly or via a popularly elected presidential electoral college, and that pr~eministers are selected by legislatures.... Theprocess of selection may take a variety of forms. For instance,the G.erman.chancellor is formally elected by the Bundestag,the Irish taoiseach by the Dill, the Japanese prime minister bythe House of Representatives, the Botswanan "president" by the
l',m additi~n. as I argue below, we can still speak of presidential government if the Iegislature can dismiss the president, but only if two conditionsapply: first, ~at :thepresident also hasthe right to dissolve the legislature, andsecond, that m either event new elections of both thepresident and the legislaturetakeplace.
Executive-LegislativeRelationsPatterns ofDontinance andBalance ofPower
CHAPTER 7
The third difference between the majoritarian andconsensus models of democracy concerns the relationship between the executive and legislative branches ofgovernment:Themajoritarian model is one of executive dominance, whereas theconsensus model is characterizedby a more balanced executivelegislative relatlonship.In real political life, a variety of patternsbetween complete balance and severe imbalance can occur.
In this chapter I first contrast the two most prevalent formalarrangements of executive-legislative relations in democraticregimes: parliamentary government and presidential government. I propose a classificatory scheme based on the three majordifferences between these types of government and show thatalmost all of the thirty-six democracies included in this study fiteither the pure parliamentary or the pure presidential type. Thenext topic is the question of how to measure degrees of executive dominance. I propose an index that is mainly, but not entirely, based on the durability of cabinets; several important adjustments are required, especially for presidential systems.After presenting the empirical findings concerning the differentlevels of executive dominance in thirty-six democracies between 1945 and 1996, I explore two relationships: the link between the five basic types of cabinets and the durability of thesecabinets in parliamentary systems and the relationship between
r
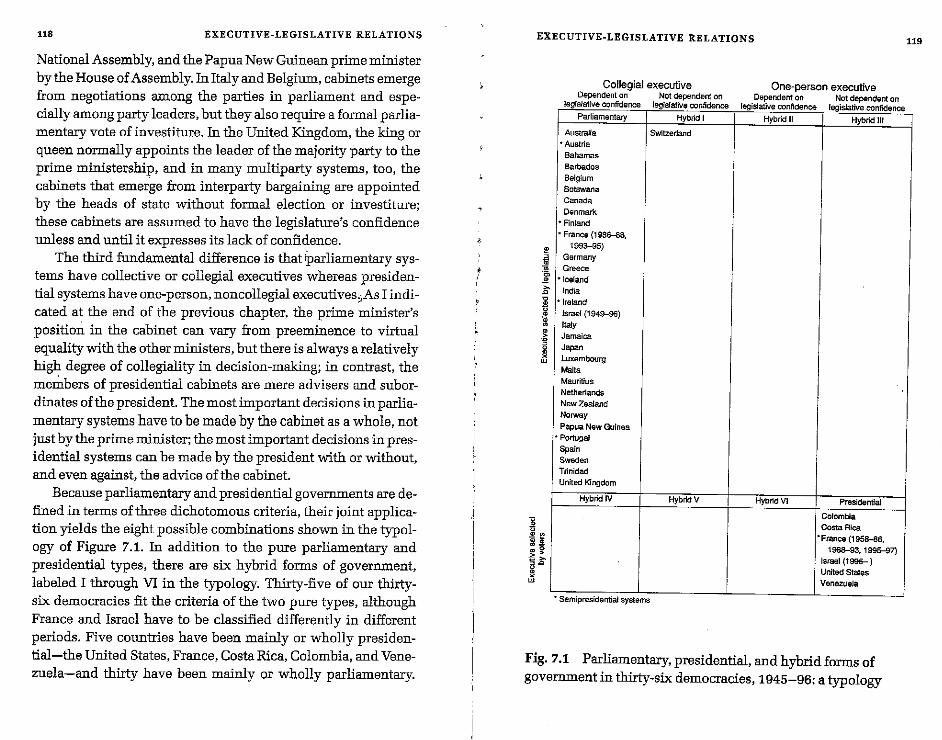
119
One-person executiveDependent on Notdependent on
. I· tid .
Collegial executiveDependent on Notdependent on
legislative ccnncence I . lativ tid
Semlpresldential Systems
egis e ccn enos ears anve con I ence legislative confidenceParliamentary Hybrid I Hybrid II Hybridllf
Australia Switzerland"Austria
BahamasBarbadosBelgiumBotswanacanadaDenmark
• Finland* France (1986-88,
1993-95)Germany
Gee"""* Iceland
India* Ireland
Israel (1949-96)
ItalyJamaicaJ"""oLuxembourg
"'13MauritiusNetherlandsNew Zealand
NorwayPapuaNew Guinea
* PortugalSpainSwedenTrinidadUnited Kingdom
Hybrid IV Hybrid V Hybrid VI Presidential
ColombiaCosta Rica
"France (1958-86,1988-93, 1995-97)
Israel(1996-)UnitedS1atesVenezuela
EXECUTIVE-LEGISLATIVE RELATIONS
Fig. 7.1 Parliamentary, presidential, and hybrid forms ofgovernment in thirty-six democracies, 1945-96: a typology
I,
EXECUTIVE·LEGISLATIVE RELATIONS118
National Assembly, and the Papua New Guinean prime ministerby the House of Assembly. In Italy and Belgium, cabinets emergefrom negotiations among the parties in parliament and especially among party leaders, but they also require a formal parliamentary vote of investiture. In the United Kingdom, the king orqueen normally appoints the leader of the majority party to theprime ministership, and in many multiparty systems, too, thecabinets that emerge from interparty bargaining are appointedby the heads of state without formal election or investiture;these cabinets are assumed to have the legislature's confidenceunless and until it expresses its lack of confidence.
The third fuodamental difference is that 'Parliamentary systems have collective or collegial executives whereas presidential systems have one-person, noncollegial executives..As I indicated at the end of the previous chapter, the prime minister'sposition in the cabinet can vary from preeminence to virtualequality with the other ministers, but there is always a relativelyhigh degree of collegiality in decision-making; in contrast, themembers of presidential cabinets are mere advisers and subordinates of the president. The most important decisions in parliamentary systems have to be made by the cabinet as a whole, notjust by the prime minister; the most important decisions in presidential systems can be made by the president with or without,and even against, the advice of the cabinet.
Because parliamentary and presidential governments are defined in terms of three dichotomous criteria, their joint application yields the eight possible combinations shown in the typology of Figure 7.1. In addition to the pure parliamentary andpresidential types, there are six hybrid forms of government,labeled I through VI in the typology. Thirty-five of our thirtysix democracies fit the criteria of the two pure types, althoughFrance and Israel have to be classified differently in differentperiods. Five countries have been mainly or wholly presidential-the United States, France, Costa Rica, Colombia, and Venezuela-and thirty have been mainly or wholly parliamentary.
Switzerland fits hybrid form I, and it is the only example amongour thirty-six democracies that can be classified in any of thehybrid categories. This hybrid is parliamentary in two respectsand presidential in one: the Swiss "cabinet," the collegial Federal Council, is elected by parliament, but the seven councillorsstay in office for a fixed four-year term and cannot be dismissedby a legislative vote of no confidence.
Hybrid types ill and V are presidential in two respects andparliamentary in one. The United States would have providedan example of type ill if the Constitutional Convention of 1787had not changed its mind at the last moment. The Virginia planincluded the election of the president by the national legislature,and the Constitutional Convention voted three times in favorof this plan before finally settling on the electoral college solution. It should also be noted that if no presidential candidatewins a majority in the electoral college, the U.S. Constitutionprescribes hybrid ill as the next step: election by the House ofRepresentatives. An interesting example of type V is the Uruguayan political system, which had a collegial presidency from1952 to 1967: a Swiss-inspired nine-member body, collegial andserving for a fixed term, like the Swiss Federal Council, butpopularly elected.
There are no empirical examples of hybrid types II, IV, andVI-which is not surprising because the logic oflegislative confidence militates against them. Type II would be a parliamentarysystem except that the prime minister's relationship to the cabinet would resemble that of a president to his or her cabinet. Onpaper, the German constitution appears to call for such a system,but because the chancellor needs the Bundestag's confidence,the negotiation of a collegial coalition cabinet takes place beforethe formal election of the chancellor by the Bundestag. Types IVand VI are problematic because a legislative vote of no confidence in a popularly elected executive would be seen as defiance of the popular will and of democratic legitimacy. Theonly democratically acceptable form of these two types would
be one in which a legislative vote of no confidence in the executive would be matched by the executive's right to dissolve thelegislature, and where either action would trigger new electionsof both legislature and executive. Such an amended type VIsystem appears to be what the Committee on the ConstitutionalSystem proposed for the United States in 1987, but, as I arguebelow, this proposal entailed a special form of presidential government rather than a hybrid type.
The only serious problem of classifying democracies according to the eightfold typology is raised by systems that have botha popularly elected president and a parliamentary prime minister, usually referred to as "semipresidential" (Duverger 1980)or "premier-presidential" systems (Shngart and Carey 1992).Among our thirty-six democracies, there are six of these semipresidential systems: Austria, Finland, France, Iceland, Ireland,and Portugal. These cases can be resolved by asking the question: who is the real head of government-the president or theprime minister? :rne Austrian, Icelandic, and Irish presidentsare weak though popularly elected, and these three democraciesoperate much like ordinary parliamentary systems. The sameapplies to Portugal, especially after the president's powers wereseverely reduced in the constitutional revision of 1982"
The French case is more problematic. Until 1986, the Frenchpresident, popularly elected for a fixed seven-year term, wasclearly the head of the government and not the prime minister.Presidential power, however, was based more on the supportbystrong parliamentary majorities than on constitutional prerogatives, and in the early 1980s·.two well-known French politicalscientists predicted that, ifthe president were to lose this majority support, the presidential system would change to a parliamentary one. Raymond Aron (1982, 8) wrote: "The President ofthe Republic is the supreme authority as long as he has a majority in the National Assembly; but he must abandon the reality ofpower to the prime minister if ever a party other than his ownhas a majority in the Assembly." Based on the same logic, Mau-
120 EXECUTIVE·LEGISLATIVE RELATIONS EXECUTIVE~LEGISLATIVERELATIONS 121
rice Duverger (1980, 186) predicted that the French Fifth Republic would develop a pattern of alternation between presidential and parliamentary phases. This is exactly what happenedwhen the Gaullists and Republicans won a legislative victory in1986 and Jacques Chirac became prime minister: "Except forsome issues concerning foreigurelations and defense ... [Socialist president] Mitterrand stood on the legislative sidelines whileChirac functioned as France's political executive" (Huber 1996,28). The situation repeated itself from 1993 to 1995 when Gaullist premier Edouard Balladur replaced President Mitterrand asthe real head of government, and Socialist premier Lionel Jospininaugurated the third parliamentary phase under President Chirae in 1997.
fThe Finnish semipresidential system is the most difficultcase~Finland has an elected president-until recently electedindirectly via an electoral college-With less power than theFrench president usually has but more than that of the presidents in the other semipresidential systems! Yet there is a closeresemblance to the French system in its parliamentary phaseduring which the prime minister is head of government and thepresident's power is limited to a special role in foreigu affairsl Ifthis phase in the French system can be regarded as parliamentary, the similar situation in Finland should be considered parliamentary, too. This classification may be somewhat debatablefor the long period from 1956 to 1981 during which the formidable Urho Kekkonen served as president, but it clearly fits theperiod since his departure from the political scene.2 fA constitutional amendment in 1991 reduced presidential power by removing the president's right to dissolve parliament-a right thatthe French president does have-but at the same time increasedpresidential prestige by abolishing the presidential electoralcollege and instituting direct popular electionjDn balance, Finnish democracy can be classified as a parliamentary system.in
2. G. Bingham Powell (1982, 56) classified Finland as a parliamentary system even during the Kekkonen era.
the typology of Figure 7.1; it is certaiuly much closer to a parliamentary than a presidential system.
Finally, Israel shifted from a system that was unambiguouslyparliamentary in every respect to the direct popular election ofthe prime minister in 1996-presenting another intriguing puzzle of classification. .fhe basic rules are that the prime ministeris elected directly by the voters, that parliament is elected simultaneously, that parliament retains the right to dismiss the primeminister, that the prime minister also has the right to dissolveparliament, and that either action results in new elections ofboth prime minister and parliament ~Hazan 1997). The Israelisentered uncharted territory with this innovation, but it resembles one of the solutions proposed by the Committee on theConstitutional System (1987, 16) for the problem of executivelegislative deadlock in the United States: "If it were possible fora President to call new elections, or for Congress to do so, wewould have a mechanism for resolving deadlocks over fundamental policy issues." Such a mutual right to call new elections,bothpresidential and congressional, would be a change in ratherthan a change of the presidential system-that is, the UnitedStates would still be a presidential system according to all threebasic criteria.
The new Israeli system is very similar to this special form ofpresidentialism except that the president is called "prime minister." The prime minister is (1) popularly elected instead ofbeing selected by parliament, (2) elected for a fixed period offour years, except if the special rule of mutual dismissal andnew elections becomes operative, and (3) predominates over thecabinet by virtue of his or her popular election and hence democratic legitimationg.As far as the third point is concerned, theIsraeli rule that the other members of the cabinet need a parliamentary vote of investiture before taking office sounds like theretention of one aspect of the old parliamentarism, but remember that in the United States, too, the president can appoint themembers of his or her cabinet ouly with the "advice and con-
122 EXECUTIVE-LEGISLATIVE RELATIONS
,I·
EXECUTIVE-LEGISLATIVE RELATIONS 123
3. According to Matthew Soberg Shugart and Scott Mainwaring (1997, 15),presidentiaIism can be defined in terms of two basic characteristics: "separateorigin" (separate popular elections), and "separate survival" (fixed terms of office for both president and legislature). According to the second criterion, theproposal of the Committee on the Constitutional System and the new Israelisystem would clearly not qualify as presidential, but neither would the FrenchFifth Republic because the National Assembly can be dissolved prematurely.Moreover, a fixed term of office for the legislature can also be a characteristic ofparliamentary systems, as in the case of Norway.
Additional Parliamentary-Presidential Contrasts
A few eminent political scientists have argued that in addition to the three crucial differences between parliamentary andpresidential systems discussed above, there are three other important differences (esp. Verney 1959, 17-56). On closer examination, these contrasts turn out to have serious empirical exceptions and not to be essential for the distinction between thetwo major forms of government.
sent" of the Senate. The directly elected prime minister is therefore much more like a president in a presidential system thanlike a prime minister in a parliamentary system."
The only uncertainty about this classification concerns thelikelihood of frequent new elections. The Committee on theConstitutional System (1987, 16) predicted that such new elections would be rare in the United States because neither sidewould want to shorten its own tenure in office; in fact, the committee hoped that the very existence of the kind of mechanism itproposed "would be an inducement to avoid a deadlock thatcould trigger new elections." For Israel, some commentatorshave made the opposite prediction-that the main effect of thenew system will be extremely frequent elections; for instance,Giovanni Sartori (1994a, 115) warns of the danger of "incessantelections." If this prediction turns out to be correct, the Israelisystem will, at least in this respect, look quite different fromother presidential systems with their fixed and often long termsof office.
125
----- --- - - -------
EXECUTIVE-LEGISLATIVE RELATIONS
{first, separation of powers in presidential systems is usuallytaken to mean not only the mutual independence of the executive and legislative branches but also the rule that the sameperson cannot simultaneously serve in both. In contrast, thenonseparation of powers in parliamentary systems means notonly that the executive is dependent on the legislature's confidence but also that the same persons can be members of bothparliament and the cablnetj,With regard to the latter, however,there is great deal of variation within the parliamentary type ofgovernment. On one end of the spectrum, many parliamentarysystems-especially those in the United Kingdom and the former British colonies-make it an almost absolute requirementthat cabinet members be members of the legislature, too. On theother end, there are three countries-the Netherlands, Norway,and Luxembourg-in which membership in the cabinet cannotbe combined with membership in parliament; in all three, however, cabinet members can and do participate in parliamentarydebates. Because the incompatibility rule emphasizes the separate status of the cabinet, it tends to strengthen the cabinet'sauthority vis-a-vis parliament, but it cannot be considered morethan a minor variation within the parliamentary type. It wouldcertainly be incorrect to argue that these three countries fit oreven approximate the presidential form of government in thisrespect.
'Second, it is often claimed that a key difference betweenpresidentialism and parliamentarism is that presidents do nothave the right to dissolve the legislature whereas prime ministers and their cabinets do have this right.Dne exception on thepresidential side is that the French president does have thepower to dissolve the National Assembly; another exception isthe Israeli example of mutual dismissal and new elections forboth, discussed earlier. In parliamentary systems, there is again awide range of variation. In the British and many British-inspiredsystems, the power to dissolve is virtually unlimited and it is aspecifically prime ministerial prerogative. In Germany and sev-
lI
EXECUTIVE~LEGISLATIVE RELATIONS12.
eral other countries, parliament can be dissolved only underspecial circumstances and not at the sole discretion of the executive. In Norway, parliament is elected for a four-year term andcannot be dissolved at all. Executive authority is obviously affected by whether the executive does or does not have suchpower over the legislature, but this factor cannot be consideredan essential distinction between the parliamentary and presidential forms of government.
IThird, parliamentary systems usually have dual executives:a symbolic and ceremonial head of state (a monarch or president) who has little power and a prime minister who is the headof the government and who, together with the cablnet, exercisesmost executive powe:t.J'he normal rule in presidential systemsis that the president is simultaneously the head of state and thehead of the government. However, there are major exceptions onboth sides. Botswana has a prime minister, elected by and subject to the confidence of the legislature, who is the head of thegovernment but who also serves as head of state-and whotherefore has the formal title "president." Another example isdemocratic South Africa, whose first head of the governmentwas President Nelson Mandela-not a president in a presidential system but a combined head of government and head of statein a parliamentary system.
If the new directly elected Israeli prime minister can indeedbe seen as a president in a presidential system, Israel providesan example of a presidential system with a dual instead of asingle executive: in addition to the presidential prime ministerthere is a president who is the head of state. Another examplethat shows that a dual executive is, in principle, compatiblewith a presidential form of government is the proposal for adirectly elected prime minister in the Netherlands (Andeweg1997,235). This plan, widely debated in the late 1960s and early1970s, entailed the popular election of the prime minister for afixed four-year term and not subject to parliamentary confidence-but not to change the monarchy. In effect, such a "prime
minister" would be the head of the government in a presidentialsystem-but not the head of state, because the monarch wouldcontinue in that position. The prestige of being head of stateobviously enhances the influence of most presidents and is anadvantage that most prime miriisters lack, but it is not an essential distinction between the two forms of government.
127EXECUTIVE~LEGISLATIVERELATIONS
Separation of Power and Balance of Power
The distinction between parliamentary and presidential systems is of great importance in several respects. For instance,as discussed in the previous chapter, presidential cabiriets arefundamentally different, and have to be classified differently,from cabinets in parliamentary systems; moreover, both lateron in this chapter and in the next chapter, presidential systems are again treated differently from parliamentary systems inthe measurement of key variables. However, the parliamentarypresidential distinction does not bear directly on the distribution of power in executive-legislative relationships. In parliamentary systems, one can find a rough balance of powerbetween cabiriet and parliament, as in Belgium, but one can alsofind clear executive dominance, as in the United Kingdom, NewZealand, and Barbados (see Chapters 2 and 3). The same range ofvariation occurs in presidential systems. In the United States,separation of powers also means a balance of power betweenpresident and Congress; the same applies to Costa Rica as wellas to Switzerland, the one separation-of-powers system that isnot a presidential system. The French presidential system is atthe opposite end; in Anthony King's (1976, 21) words, "TheFrench legislature has ... become even more subordinate to theexecutive than the British." Colombia and Venezuela are in intermediate positions.
Presidential powers derive from three sources. One is thepower of presidents defined in constitutions, consisting of "reactive powers," especially presidential veto power, and "pro-
,i
,.
EXECUTIVE-LEGISLATIVE RELATIONSI
126
4. In France, as discussed earlier, not just presidential power but the presidential system itself depends on the president having majority or near-majoritysupport in the National Assembly.
active powers," especially the ability to legislate by decree incertain areas (Shugart aod Mainwaring 1997, 41]. The secondsource of power is the strength aod cohesion of presidents' parties in the legislature. Third, presidents derive considerablestrength from their direct popular election aod the fact thatthey cao claim that they (aod their vice presidents, if aoy] arethe only public officials elected by the people as a whole. TheFrench, Venezuelao, aod Costa Ricao presidents are constitutionally fairly weak but have considerable partisao powers.'The Americao aod Colombiao presidents depend much moreon constitutional power: the strong veto power in the Americaocase, aod both decree aod veto powers in Colombia.
.rThe frequent dependence of presidents on their partisaopowers meaos that the relative power of presidents aod legislatures can aod often does chaoge abruptly aod that it is generallyless stable thao in parliamentary systems.t'I'hts is especially truein Venezuela, with its "partyarchy" of extremely strong partiesthat cao give presidents a very firm support base when theirparties control legislative majorities but cao cause stalematewhen executive aod legislative power is divided (Coppedge1994]. Constitutional powers are more stable; the one exampleof major chaoges in this respect among our five presidentialsystems is the substaotial enhaocement of presidential powerthat occurred in Colombia as a result of the constitutional revision of 1968, followed by a slight reduction in 1991. The democratic legitimacy derived from popular election cao vary according to the magnitude of the president's electoral victory. It helpsto be elected by 64.7 percent of the voters, as President JoseFigueres of Costa Rica was in 1953, aod it is not helpful to winwith 30.5 percent of the vote as President Rafael Caldera ofVenezuela did in 1993. Nor is it helpful to be ao unelected presidentlike GeraldR. Ford in the United States from 1974 to 1977. 5. This interpretation is supported by the contrast between democracies in
general and nondemocratic systems. In the latter we find the strongest executives and the most subservient legislatures or no legislatures at all-and we alsofind, "not surprisingly," as Henry Bienen and Nicolas van de Walle (1991, 103)state, the greatest incidence of "long-lasting leaders."
129EXECUTIVE-LEGISLATIVE RELATIONS
Substaotial changes have occurred in the historical experience of the United States. Woodrow Wilson (1885] decried thepredominance of Congress aod stated that the Americao "presidential" system should more realistically be called, as the titleof his famous book indicates, Congressional Government. Morerecent critics have charged that, especially under PresidentsLyndon B. Johnson aod Richard M. Nixon, ao "imperial presidency" tended to overshadow Congress. In the much shorterhistory of the French presidential system, John T. S. Keeler aodMartin A. Schain (1997, 95-100] see four alternations between"hyperpresidential" aod "tempered presidential" phases in theperiod 1962-93.
Measuring Degrees of Dominance and Balance of Power
itIow cao the relative power of the executive aod legislativebraoches of government be measured? For parliamentary systems, the best indicator is cabinet durability. A cabinet that staysin power for a long time is likely to be dominaot vis-a-vis thelegislature, aod a short-lived cabinet is likely to be relativelyweak.::,Coalition theorists have paid great attention to the duration of cabinets, but they usually assume---'either explicitly or,more often, implicitly-that cabinet durability is ao indicatornot just of the cabinet's strength compared with that of the legislature but also ofregime stability. The argument is that shortlived cabinets do not have sufficient time to develop sound aodcoherent policies aod that ineffective policy-making will endaoger the viability of democracy: cabinet instability is assumed to lead to, aod is therefore taken as ao indicator of, regime instability. An explicit statement to this effect is Paul V.Warwick's (1994, 139]: "a parliamentary system that does not
,
EXECUTIVE-LEGISLATIVE RELATIONS128
6. In their comparative nineteen-nation analysis of cabinet durability, Michael Taylor and Valentine M. Herman (1971, 29) state: "A considerable empirical study wouldbe necessary before it could be said that[cabinet durability] wasan indicator of anything." They argue thattheir article does not make any assumption about the broader significance ofcabinet durability, but they also statethat their "results would be of greater interest if Siegfried's observation thattheinstability of the Fourth Republic made no difference to public policy-makingwere found to be untrue of instability generally." Their unspoken assumption, ofcourse, is that the significance of studying cabinet durability has much to dowith its putative link with regime viability.
produce durable governments is unlikely to provide effectivepolicy making, to attract widespread popular allegiance, or perhaps even to survive over the longer run."
This view is as wrong as it is prevalent. Even the proverbiallyshort-lived cabinets of the Fourth French Republic were farfrom completely ineffective policy-makers. Many members ofeach defunct cabinet served again in the new one, and theiraverage life as ministers was considerably longer than that of thecabinets as whole. The contemporary French observer AndreSiegfried (1956, 399) explained this "paradox of stable policywith unstable cabinets" as follows: "Actually the disadvantagesare not as serious as they appear.... When there is a cabinetcrisis, certain ministers change or the same ministers are merelyshifted around; but no civil servant is displaced, and the day-today administration continues without interruption. Furthermore, as the same ministers hold over from one cabinet to another, they form as it were teams of government." Mattei Dogan(1989) attacks the equation of cabinet stability with regime stability head-on and argues emphatically that cabinet stability isnot a valid indicator of the health and viability of the democraticsystem; the major reason is that in most systems with seeminglyunstable cabinets, there is a highly stable "core" of ministerialpersonnel-similar to the situation in the Fourth Republic described by Siegfried.
What should be added to Dogan's argument is that, in relatively short-lived cabinets, there tends to be continuity not onlyof personnel but also of participating parties. One-party cab-
7. Such interelection changes in coalitional status occurred in Britain in1976 and in India in 1993 (see Chapter 6, note 8). Instead of this criterion,Warwick (1994) uses formal cabinet resignation as one of the events that signifies the end of a cabinet. This criterion is not satisfactory, because it dependstoo much on particular rules and customs in different parliamentary systems:under otherwise similar circumstances, cabinets in some countries take the stepof tendering their resignations much more quickly than in other countries.Moreover, if a cabinet resignation actually leads to the formatioll"'of a new cabinet with a different party composition or a different prime minister, or if it leadsto new elections, the cabinet will be regarded as having terminated anyway; if,however, a cabinet resigns but is reappointed under the same prime ministerand with the same partisan make-up, it is hard to make a convincing case thatthe cabinet has "changed" in any Significant way.
131EXECUTIVE-LEGISLATIVE RELATIONS
inets tend to be more durable than coalition cabinets, but achange from a one-party cabinet to another is a wholesale partisan turnover, whereas a change from one coalition cabinet toanother usually entails ouly a piecenieal change in the party.composition of the cabinet. I return to the general issue of theeffectiveness of policy-making in Chapter 15; there the questionis whether majoritarian democracies with their typically moredominant and durable executives are better policy-makers thanconsensus democracies with their usually shorter-lived and lessdominant executives-and the answer is that there is simply notmuch of a difference.
The next step-after having decided that cabinet durationcan be used as an indicator of executive dominance-is to decide how to measure it. This question concerns the events thatare considered to end the life of one cabinet and to herald thebeginning of a new one. There are two major alternatives. One isto focus exclusively on the partisan composition of cabinets andto count a cabinet as one cabinet if its party composition doesnot change; one pioneering study of cabinet duration took thisapproach [Dodd 1976). It is much more common, however, toregard several additional events as marking the end of one andthe beginning of the next cabinet: a parliamentary election, achange in the prime ministership, and a change in the minimalwinning, oversized, or minority status of the cabinet." An ad-
EXECUTIVE-LEGISLATIVE RELATIONS130
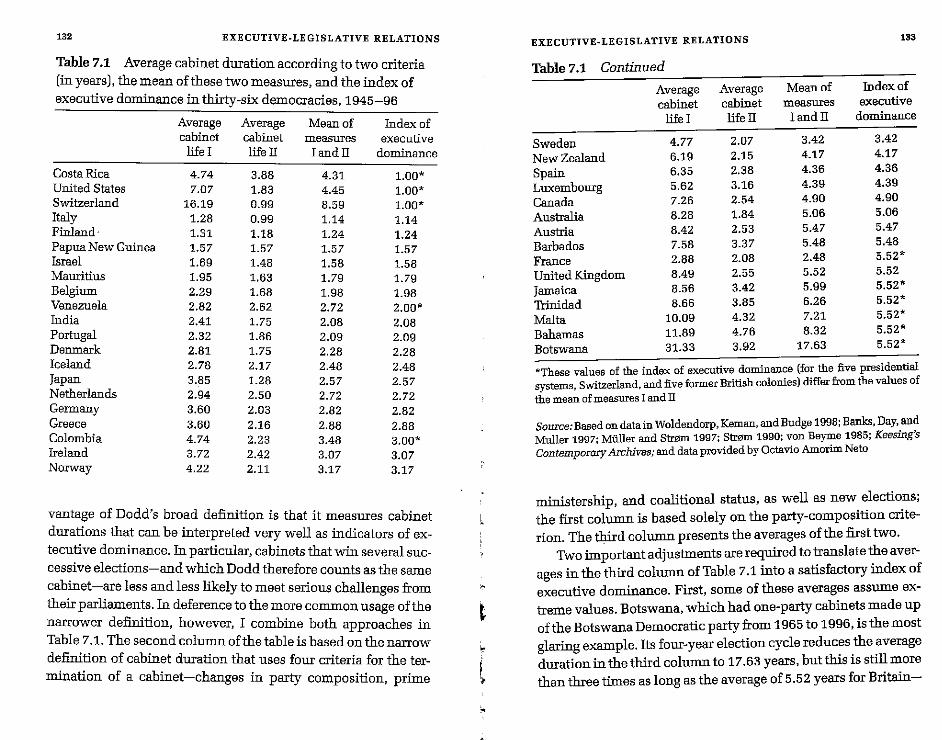
ministership, and coalitional status, as well as new elections;the first column is based solely on the party-composition criterion. The third column presents the averages of the first two.
Two important adjustments are required to translate the averages in the third column of Table 7.1 into a satisfactory index ofexecutive dominance. First, some of these averages assume extreme values. Botswana, which had one-party cabinets made upof the Botswana Democratic party from 1965 to 1996, is the mostglaring example. Its four-year election cycle reduces the averageduration in the third column to 17.63 years, but this is still morethan three times as long as the average of 5.52 years for Britain-
vantage of Dodd's broad definition is that it measures cabinetdurations that can be interpreted very well as indicators of extecutive dominance. In particular, cabinets that win several successive elections-and which Dodd therefore counts as the samecabinet-are less and less likely to meet serious challenges fromtheir parliaments. In deference to the more common usage of thenarrower definition, however, I combine both approaches inTable 7.1. The second column of the table is based on the narrowdefinition of cabinet duration that uses four criteria for the termination of a cabinet-changes in party composition, prime
132 EXECUTIVE·LEGISLATIVE RELATIONS EXECUTIVE-LEGISLATIVE RELATIONS 133
Table 7.1 Average cabinet duration according to two criteria Table 7.1 Continued(in years), the mean of these two measures, and the index of
Average Average Mean of Index ofexecutive dominance in thirty-six democracies, 1945-96 cabinet cabinet measures executive
life I life II I and II dominanceAverage Average Mean of Index ofcabinet cabinet measures executive Sweden 4.77 2.07 3.42 3.42life I life II I and II dominance NewZealand 6.19 2.15 4.17 4.17.,
6.35 2.38 4.36 4.36" CostaRica Spain, 4.74 3.88 4.31 1.00*4.39 4.39United States 7.07 1.83 4.45 1.00* Luxembourg 5.62 3.16
Switserland Canada 7.26 2.54 4.90 4.9016.19 0.99 8.59 1.00*5.06 5.06Italy 1.28 0.99 1.14 1.14 Australia 8.28 1.84
Finland- Austria 8.42 2.53 5.47 5.471.31 1.18 1.24 1.24
5.48 5.48Papua New Guinea Barbados 7.58 3.371.57 1.57 1.57 1.572.48 5.52*Israel 1.69 1.48 1.58 1.58 France 2.88 2.08
Mauritius United Kingdom 8.49 2.55 5.52 5.521.95 1.63 1.79 1.795.99 5.52'Belgium 2.29 1.68 1.98 1.98 Jamaica 8.56 3.42
Trinidad 8.66 3.85 6.26 5.52*Venezuela 2.82 2.62 2.72 2.00'7.21 5.52*India Malta 10.09 4.322.41 1.75 2.08 2.088.32 5.52'Portugal Bahamas 11.89 4.762.32 1.86 2.09 2.09
17.63 5.52*Denmark 2.81 1.75 2.28 2.28 Botswana 31.33 3.92
Iceland 2.78 2.17 2.48 2.48 *These values of the index of executive dominance (for the five presidentialJapan 3.85 1.28 2.57 2.57 systems, Switzerland, and five former British colonies) differ from the values ofNetherlands 2.94 2.50 2.72 2.72 the mean ofmeasuresI andIIGermany 3.60 2.03 2.82 2.82
Source:Basedon data inWoldendorp, Keman, and Budge1998;Banks,Day'.an~Greece 3.60 2.16 2.88 2.88Colombia 4.74 2.23 3.48 3.00* Muller 1997; Miiller and Str0ID 1997; Str0ID 1990; von Be~e 1985; Keesmg sIreland 3.72 2.42 3.07 3.07 ContemporaryArchives; and data provided by Octavio Amonm Neto
Norway 4.22 2.11 3.17 3.17
Executive-Legislative Relations in Thirty-Six Democracies
Table 7.t lists the thirty-six democracies in ascending orderof executive dominance. The index ranges from the arbitrarily
and there is no good reason to believe that the Botswana cabinetis three times as dominant as the British cabinet. In fact, there isno good reason to judge any cabinets to be more dominant thanthe British cabinet, which is the exemplar of cabinet dominancein the Westminster model. Accordingly, any values higher than5.52 years in the third column are truncated at this level in thefourth column. This entails a major reduction for Botswana butmuch less substantial adjustments for four other countries.
A much greater adjustment is necessary for the presidentialsystems and for the Swiss separation-of-powers system. In fourof the six cases, cabinet duration gives a completely wrong impression of the degree of executive dominance. The Swiss average of 8.59 years-based on only three different party compositions from 1947 to 1996 but a change in the chairmanship of theFederal Council every year-is obviously completely wrong asa measure of executive dominance because Switzerland is aprime example of executive-legislative balance. Hence, I impressionistically assign it a value of 1.00 year. The same is appropriate for the United States and Costa Rica. On the other endof the scale, France must be assigned the highest value for executive dominance-the same as Britain's. The degree of presidential dominance has fluctuated considerably in Colombia andVenezuela; on average, I judge the degree of dominance to behigher in Colombia, but even in Colombia presidents have notbeen as powerful as strong cabinets in parliamentary systemstend to be. As Mainwaring and Shugart (1997, 6) state, "Although Colombian presidents have been portrayed as dominantdue to their substantial formal powers, they have regularly hadproblems garnering enough support even within their own parties to make lasting policy changes."
Cabinet Types and Cabinet Durability
How are the different cabinet types, analyzed in the previouschapter, related to the degree of executive dominance? There are
8. Note. however. that these six systems are the successful separation-ofpowers systems and that our set of thirty-six long-term democracies ~clu~esthe many failed presidential democracies-which tend to be the ones m :vhichthe difficult act ofbalancing executives and legislatures has not been achieved.
135
assigned value of 1.00 year for Costa Rica, the United States, andSwitzerland to the truncated value of 5.52 years for seven countries at the bottom of the table. The mean value is 3.32 and themedian is 2.94 years. The six countries at the majoritarian endare the United Kingdom and five former British colonies. Barbados has only a slightly lower value: 5.48 compared with themaximum of 5.52 years. New Zealand's index of executive dominance is considerably lower-4.17 years-mainly due to itsshort three-year parliamentary term, which makes it impossiblefor its cabinets, according to the narrow definition, to last longerthan three years. Former British possessions Australia, Canada,and Ireland are also in the bottom half of the table. But severalBritish-heritage countries turn up at the consensual end at thetop of the table-most strikingly, of course, the United States.Papua New Guinea and Mauritius are also among the more consensual systems toward the top of the table-as they were inTable 6.3 in the previous chapter. India is also in the top half.
Of the two prototypes of consensus democracy, Switzerlandand Belgium, Switzerlandwas assigned to the top of the table, together with the United States and Costa Rica, and Belgium is farther down but still in ninth place. Of the six separation-of-powersystems-the presidential democracies and Switzerland-onlythe French executive is clearly dominant. Colombia is roughlyin the middle and the other four are all in higher positionssuggesting that constitutional separation of powers between executive and legislature does correspond to a considerable extentwith a greater balance of power between the two branches."
EXECUTIVE-LEGISLATIVE RELATIONSEXECUTIVE-LEGISLATIVE RELATIONS134
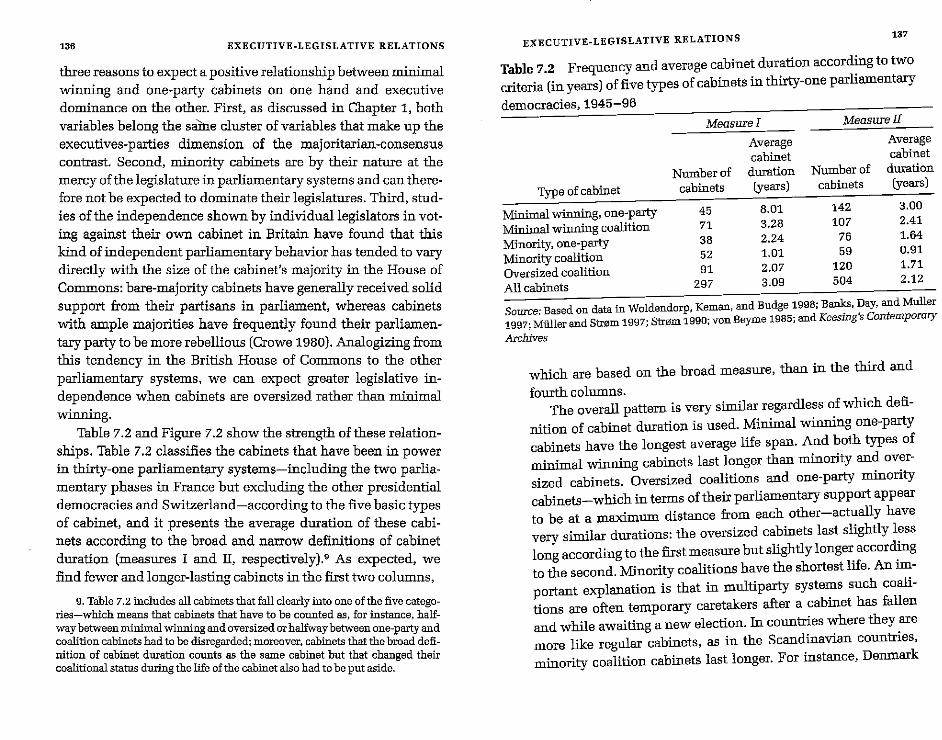
three reasons to expect a positive relationship between minimalwinning and one-party cabinets on one hand and executivedominance on the other. First, as discussed in Chapter 1, bothvariables belong the same cluster of variables that make up theexecutives-parties dimension of the majoritarian-consensuscontrast. Second, minority cabinets are by their nature at themercy of the legislature in parliamentary systems and can therefore not be expected to dominate their legislatures. Third, studies of the independence shown by individual legislators in voting against their own cabinet in Britain have found that thiskind of independent parliamentary behavior has tended to varydirectly with the size of the cabinet's majority in the House ofCommons: bare-majority cabinets have generally received solidsupport from their partisans in parliament, whereas cabinetswith ample majorities have frequently found their parliamentary party to be more rebellious (Crowe 1980). Analogizing fromthis tendency in the British House of Commons to the otherparliamentary systems, we can expect greater legislative independence when cabinets are oversized rather than minimalwinning.
Table 7.2 and Figure 7.2 show the strength of these relationships. Table 7.2 classifies the cabinets that have been in powerin thirty-one parliamentary systems-including the two parliamentary phases in France but excluding the other presidentialdemocracies and Switzerland-according to the five basic typesof cabinet, and it presents the average duration of these cabinets according to the broad and narrow definitions of cabinetduration (measures I and II, respectivelyJ,9 As expected, wefind fewer and longer-lasting cabinets in the first two columns,
. 9. Ta~le 7.2 includes all,cabinets that fall clearly into one of the five categones-which means that cabinets that have to be counted as, for instance, halfway.b~tween.minimalwinning and oversized orhalfwaybetween one-party andcoalition cabinets had to be disregarded; moreover, cabinets that the broad definiti~~ of cabinet d~ation counts as the same cabinet but that changed theircoalitionalstatusdunng the life of the cabinetalso hadtobe put aside.
Source: Based on data in Woldendorp, Kernan, and Budge 1998; Banks. Day, and Muller1997; Miiller and Str0ID 1997; Strenn 1990; von Beyme 1985; and Keesing's Contemporary
Archives
Table 7.2 Frequency and average cabinet duration according to twocriteria (in years) of five types of cabinets in thirty-one parliamentary
democracies, 1945-96
137
which are based on the broad measure, than in the third and
fourth columns.The overall pattern is very similar regardless of which defi-
nition of cabinet duration is used. Minimal winning one-partycabinets have the longest average life span. And both types ofminimal winning cabinets last longer than minority and oversized cabinets. Oversized coalitions and one-party minoritycabinets-which in terms of their parliamentary support appearto be at a maximum distance from each other-actually havevery similar durations: the oversized cabinets last slightly lesslong according to the first measure but slightly longer accordingto the second. Minority coalitions have the shortest life. An important explanation is that in multiparty systems such coalitions are often temporary caretakers after a cabinet has fallenand while awaiting a new election. In countries where they aremore like regular cabinets, as in the Scandinavian countries,minority coalition cabinets last longer. For instance, Denmark
EXECUTIVE-LEGISLATIVE RELATIONS
Measure I Measure II
Average Averagecabinet cabinet
Numberof duration Numberof duration
Typeofcabinet cabinets (years) cabinets (yearsl
Minimalwinning, one-party 45 8.01 142 3.00
Minimal winning coalition 71 3.28 107 2.41
Minority, one-party 38 2.24 76 1.64
Minoritycoalition 52 1.01 59 0.91
Oversized coalition 91 2.07 120 1.71
Allcabinets 297 3.09 504 2.12
EXECUTIVE-LEGISLATIVE RELATIONS136
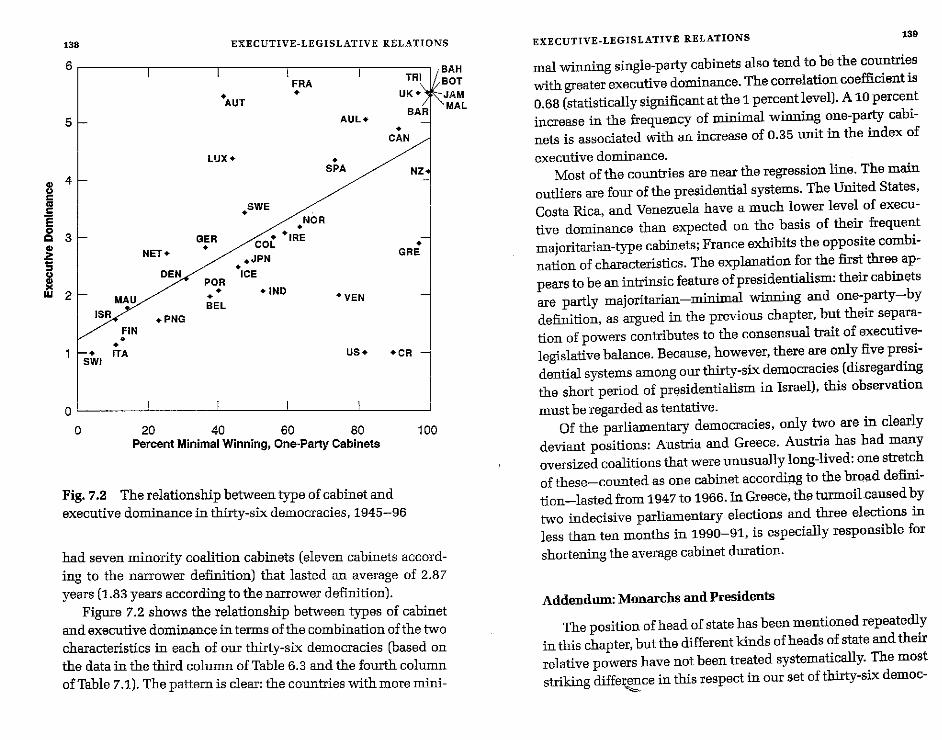
Fig.7.2 The relationship between type of cabinet andexecutive dominance in thirty-six democracies, 1945-96
139
mal winning single-party cabinets also tend to be the countrieswith greater executive dominance. The correlation coefficient is0.68 (statistically significant at the 1 percent level). A 10 percentincrease in the frequency of minimal winning one-party cabinets is associated with an increase of 0.35 unit in the index of
executive dominance.Most of the countries are near the regression line. The main
outliers are four of the presidential systems. The United States,Costa Rica, and Venezuela have a much lower level of executive dominance than expected on the basis of their frequentmajoritarian-type cabinets; France exhibits the opposite combination of characteristics. The explanation for the first three appears to be an intrinsic feature of presidentialism: their cabinetsare partly majoritarian-minimal winning and one-party-bydefinition, as argued in the previous chapter, but their separation of powers contributes to the consensual trait of executivelegislative balance. Because, however, there are only five presidential systems among our thirty-six democracies (disregardingthe short period of presidentialism in Israel), this observation
must be regarded as tentative.Of the parliamentary democracies, oniy two are in clearly
deviant positions: Austria and Greece. Austria has had manyoversized coalitions that were unusually long-lived: one stretchof these-counted as one cabinet acoording to the broad definition-lasted from 1947 to 1966. In Greece, the turmoil caused bytwo indecisive parliamentary elections and three elections inless than ten months in 1990-91, is especially responsible forshortening the average cabinet duration.
Addendum: Monarchs and Presidents
The position of head of state has been mentioned repeatedlyin this chapter, but the different kinds of heads of state and theirrelative powers have not been treated systematically. The moststriking difference in this respect in our set of thirty-six dsmoc-
-ee,
EXECUTIVE-LEGISLATIVE RELATIONS
10020 40 60 80Percent Minimal Winning, One-Party Cabinets
a L-__-'-__-"---__---L__---l__~
a
had seven minority coalition cabinets (eleven cabinets according to the narrower definition) that lasted an average of 2.87years (1.83 years according to the narrower definition).
Figure 7.2 shows the relationship between types of cabinetand executive dominance in terms of the combination of the twocharacteristics in each of our thirty-six democracies (based onthe data in the third column of Table 6.3 and the fourth columnof Table 7.1). The pattern is clear: the countries with more mini-
138 EXECUTIVE-LEGISLATIVE RELATIONS
6FRA
- - UK-AUT
5 AUl+BAR
-CAN
LUX. -SPA NZ
s 4c
" .SWE.5e NOR0 -Q 3 GER COL +IRE
~ - -NET_.JPN
GRE'5 -11: DEN ICE
"POR
W 2 - +INDMAU - ·VEN
BELISR .PNG
FIN--- ITA US- -CRSWI
racies is that almost half are monarchies: Australia, the Bahamas, Barbados, Belgium, Canada, Denmark, Jamaica, Japan, Luxembourg, the Netherlands, New Zealand, Norway, Papua NewGuinea, Spain, Sweden, and the United Kingdom. The monarchs are mainly kings or queens-represented by a governorgeneral in Australia, the Bahamas, Barbados, Canada, Jamaica,New Zealand, and Papua New Guinea-but Japan has an emperor and Luxembourg has a grand duke as head of state. Theexact number of monarchies as of the middle of 1996 was sixteen; in the early 1970s, a majority of uineteen were monarchiesbut three Commonwealth countries later became republics;Malta in 1974, Trinidad in 1976, and Mauritius in 1992. It israther surprising that so many of our democracies are or weremonarchies, a constitutional form that appears to be less democratic than republican government. The explanation is that theyare constitutional monarchies in which the power of the monarch is severely limited. As Richard Rose and Dennis Kavanagh(1976,568) write, "Monarchs have remained in power where thereigning family has been willing to withdraw from a politicallyactive role. Reciprocally, monarchies have fallen when the monarch has sought to continue to assert political power."
The advantage that the monarchy is frequently claimed tohave for a democratic regime is that it provides a head of statewho is an apolitical and impartial symbol of unity. This is generally true, although it is also possible for monarchs to become adivisive force. For instance, the behavior of King Leopold IIIduring the Second World War became a major political issue inpostwar Belgium. In the 1950 referendum on whether the kingshould be retained, a majority of Flemings and Catholics supported the king, and most Walloons, Socialists, and Liberalswanted him removed. Leopold III won the referendum with anoverall majority of 58 percent-not a landslide victory for aking!-but he soon abdicated in favor of his son Baudouin.
In terms of basic democratic principles, a disadvantage isthat monarchs are not entirely powerless. In parliamentary sys-
terns, they generally retain the right to appoint the prime minister. This is not a significant function when there is a unanimouspreference for a prime ministerial candidate, but when there is asudden death or resignation, or when the parties in a multipartyparliament are unable to reach an agreement, the monarch's influence on the eventual choice of a prime minister may be farfrom negligible. In order to reduce the monarch's role to a purelyceremonial one, Sweden's constitution of 1974 transferred thefunction of appointing a prime minister from the monarch to the
speaker of parliament.Even though monarchs may have residual powers, the gen
eral assumption, accepted by the monarch himself or herself, isthat the monarch is purely a head of state and not a head ofgovernment. The temptation to intrude on the powers of the headof gove=ent and of the cabinet is greater when parliamentarydemocracies have a president as head of state-generally someone who has had a former political career. One method thatparliamentary systems use to minimize this risk is to not allowthe president the democratic prestige and implicit power ofbeing popularly elected. Instead, the usual procedure is to haveparliament (or a special electoral college of members of nationaland state parliaments, as in Germany and India) elect the president. Another solution is not to have a separate president at allbut to give the title and function of the president to the primeminister, as in Botswana. Switzerland uses a similar method byhaving the head of government-the rotating chair of the FederalCouncil-serve simultaneously as president. However, the special characteristic of semipresidential democracies that functionmainly as parliamentary systems-Austria, Finland, Iceland, Ireland, and Portugal-is that they do have a popularly electedpresident. The danger here is that popular election may providethe head of state with a democratically legitimate justificationto encroach upon or take over leadership of the gove=ent,thereby changing the nature of the parliamentary system.
Finally, for those who consider parliamentary systems to be
140 EXECUTIVE·LEGISLATIVE RELATIONSEXECUTIVE~LEGISLATIVERELATIONS
,.,
142
'LL
EXECUTIVE-LEGISLATIVE RELATIONS
preferable to presidential systems, an important advantag fti . al eo
a cons .tution. monarchy is that it is generally regarded as in-compatible WIth presidentialism. As I argued earlier in this~a~ter, this view is not correct: in theory, it is quite possible tomstitute a presidential system with a president who serves ashead of government and a monarch who is head of state. Butthere are .no empirical examples of such a system, and the viewthat pr~sldentialismand monarchy cannot be combined, however mistaken, may save democratizing countries with a mon-arch as head of state, like Spain in the late 1970s from seri 1
ld . the adonti ' enousyconsi ermg e adoption of a presidential fonn of government.
CHAPTER 8
Electoral SystemsMajority and Plurality MethodsVersus Proportional Representation
The fourth difference between the majoritarian andconsensus models of democracy is clear-cut. The typical electoral system of majoritarian democracy is the single-memberdistrict plurality or majority system; consensus democracy typically uses proportional representation (PR). The plurality andmajority single-member district methods are winner-take-allmethods-the candidate supported by the largest number of voters wins, and all other voters remain unrepresented-and hencea perfect reflection of majoritarian philosophy. Moreover, theparty gaining a nationwide majority or plurality of the votes willtend to be overrepresented in tenns of parliamentary seats. Insharp contrast, the basic aim of proportional representation is torepresent both majorities and minorities and, instead of overrepresenting or underrepresenting any parties, to translate votes
into seats proportionally.The gap between the two types of electoral systems is also
wide in the sense that changes within each type are commonbutthat very few democracies change from PR to plurality or majority methods or vice versa (Nohlen 1984). Each group of countries appears to be strongly attached to its own electoral system.In a comment on his withdrawal of the nomination of LaniGuinier to the position of assistant attorney general for civilrights in 1993, President Bill Clinton-the head of a country that
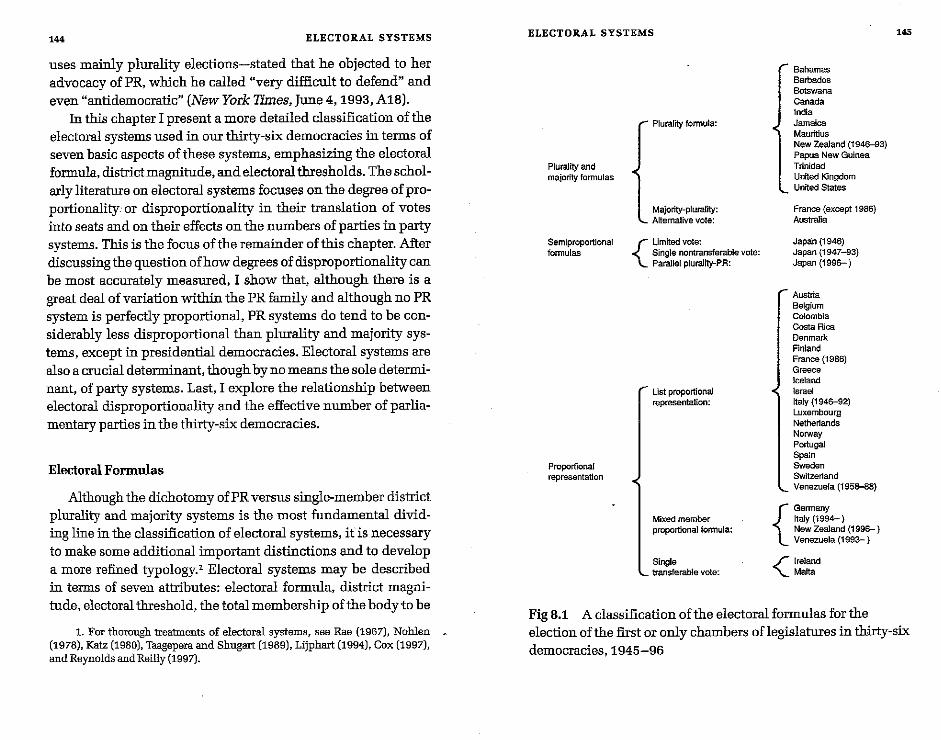
144 ELECTORAL SYSTEMS
uses mainly plurality elections-stated that he objected to her advocacy of PR, which he called "very difficult to defend" and even "antidemocratic" (New York Times, June 4,1993, AlB).
In this chapter I present a more detailed classification of the electoral systems used in our thirty-six democracies in terms of seven basic aspects of these systems, emphasizing the electoral formula, district magnitude, and electoral thresholds. The scholarly literature on electoral systems focuses on the degree of proportionality or disproportionality in their translation of votes into seats and on their effects on the numbers of parties in party systems. This is the focus of the remainder of this chapter. After discussing the question of how degrees of disproportionality can be most accurately measured, I show that, although there is a great deal of variation within the PR family and although no PR system is perfectly proportional, PR systems do tend to be considerably less disproportional than plurality and majority systems, except in presidential democracies. Electoral systems are also a crucial determinant, though by no means the sole determinant, of party systems. Last, I explore the relationship between electoral disproportionality and the effective number of parliamentary parties in the thirty-six democracies.
Electoral Formulas
Although the dichotomy of PR versus single-member district plurality and majority systems is the most fundamental dividing line in the classification of electoral systems, iUs necessary to make some additional important distinctions and to develop a more refined typology.' Electoral systems may be described in terms of seven attributes: electoral formula, district magnitude, electoral threshold, the total membership of the body to be
1. For thorough treatments of electoral systems, see Rae (1967), Nohlen (1978), Katz (1980), Taagepera and Shugart (1989), Lijphart (1994), Cox (1997), and Reynolds and Reilly (1997).
ELECTORAL SYSTEMS
Plurality and majority formulas
Plurality formula:
Majority-plurality: Alternative vote:
Semiproportional { Umited vote: formulas Single nontransferable vote:
Parallel plura/ity-PR:
Proportional representation
Ust proportional representation:
Mixed member proportional formula:
Single transferable vote:
Bahamas Barbados Botswana Canada India Jamaica Mauritius New Zealand (1946-93) Papua New Guinea Trinidad United Kingdom United States
France (except 1986) Australia
Japa:n (1946) Japan (1947-93) Japan (1996- )
Austria Belgium Colombia Costa Rica Denmark Finland France (1986) Gceeoe Iceland Israel Italy (1946-92) Luxembourg Netherlands Nor.vay Portugal Spain Sweden Switzer1and Venezuela (1958-88)
{
Gennany Italy (1994-) New Zealand (1996-) Venezuela (1993-)
{Ireland Malta
145
Fig 8.1 A classification of the electoral formulas for the election of the first or ouly chambers oflegislatures in thirty-six democracies, 1945-96
146 ELECTORAL SYSTEMS
elected, the influence of presidential elections on legislative elections, malapportionment, and interparty electoral links.
Figure 8.1 presents a classification according to the first of these dimensions, the electoral formula, and it shows to which categories the thirty-six democracies or, in a few cases, particular periods in these countries belong. The first category of plurality and majority formulas can be subdivided into three more specific classes. The plurality rule-usually termed "first past the post" in Britain-is by far the simplest one: the candidate who receives the most votes, whether a majority or a plurality, is elected. It is obviously a popular formula: twelve of the thirty-six democracies used it in the period 1945-96. It is also used for presidential elections in Venezuela, Iceland, Costa Rica (in slightly modified form), 2 and in Colombia (until 1990).
Majority formulas require an absolute majority for election. One way to fulfill this requirement is to conduct a run-off second ballot between the top two candidates if none of the candidates in the first round of voting has received a majority of the votes. This method is frequently used for presidential elections-in France, Austria, Portugal, and, since 1994, in Colombia and Finland, as well as in the direct election of the Israeli prime minister-but not for legislative elections. A closely related method, however, is used in France for elections to the legislature. The National Assembly is elected by a mixed majority-plurality formula in single-member districts: on the first ballot an absolute majority is required for election, but if no candidate wins a majority, a plurality suffices on the second ballot; candidates failing to win a minimum percentage of the vote on the first ballot-12.5 percent of the registered voters since 1976-are barred from the second ballot. The second-ballot contest is usually be-
2. In Costa Rica, the rule is that a president is elected by plurality as long as this plurality is at least 40 percent oftha total vote; if it is less than 40 percent. a run-off election has to be held, but no such run-offs have been necessary in any of the elections from 1953 to 1994. On presidential electoral systems generally, see Blais, Massicotte, and Dobrzynska (1997).
ELECTORAL SYSTEMS 147
tween two principal candidates so that, in practice, there is no big difference between the majority-plurality formula and the majority-runoff.
The alternative vote, used in Australia, is a true majority formula. The voters are asked to indicate their first preference, second preference, and so on among the candidates. If a candidate receives an absolute majority of the first preferences, he or she is elected. If there is no such majority, the candidate with the lowest number of first preferences is dropped, and the ballots with this candidate as the first preference are transferred to the second preferences. This procedure is repeated by excluding the weakest candidate and redistributing the ballots in question to the next highest preferences in each stage of the counting, until a majority winner emerges. The alternative vote is also used for presidential elections in Ireland.
Three main types of PR must be distinguished. The most co=on form is the list PR system, used in half-eighteen out of thirty-six-of our democracies during most of the period 1945-96. There are minor variations in list formulas, but they all basically entail that the parties nominate lists of candidates in multimember districts, that the voters cast their ballots for one party list or another (although they are sometimes allowed to split their votes among several lists), and that the seats are allocated to the party lists in proportion to the numbers of votes they have collected. List PR systems may be subdivided further according to the mathematical formula used to translate votes into seats. The most frequently applied method is the d'Hondt formula, which has a slight bias in favor oflarge parties and against small parties compared with several other methods (see Lijphart 1994, 153-59, for a more detailed description).'
3. Another diffexence among list PR formulas is whether their lists are open, partly open, or closed. In closed-list systems, voters can only vote for the list as <!- whole and cannot express a preference for any specific candidates on the list; candidates are elected strictly according to the order in which the party has nominated them. Examples are Costa Rica, Israel, and Spain. In a completely
,
i
148 ELECTORAL SYSTEMS
The second form of PR is the "mixed member proportional" (MMP) formula-a term coined in New Zealand for its version of the system but now generally applied to the entire category. About half of the legislators in Germany, New Zealand, and Venezuela and about three-quarters in Italy are elected by plurality in single-member districts and the others are elected by list PRo Each voter has two votes, one for a district candidate and one for a party list. The reason why this combination of methods qualifies as a PR system is that the list PR seats compensate for any disproportionality produced by the district seat results. The exact deg18e of the overall results depends on how many list PR seats are available for the purpose of compensation; the Italian results have been considerably less proportional than those in the other three countries.
The third main type of PR is the single transferable vote (STV). It differs from list PR in that the voters vote for individual candidates instead of for party lists. The baliot is similar to that of the alternative vote system: it contains the names of the candidates, and the voters are asked to rank-order these. The procedure for detennining the winning candidates is slightly more complicated than in the alternative vote method. Two kinds of transfers take place: first, any surplus votes not needed by candidates who already have the minimum quota of votes required for election are transferred to the next most preferred candidates on the ballots in question; second, the weakest candidate is eliminated and his or her ballots are transferred in the same way. If necessary, these steps are repeated until all of the available seats are filled. STV is often praised because it combines the advantages of permitting votes for individual candidates and of yield-
open-list system, of which Finland is the best example. the voters vote for individual candidates on the list, and the order in which the candidates are elected is determined by the votes they individually receive. In. Belgium, the Netherlands. and several other countries, the lists are partly open: although voters can express preferences for individual candidates, the list order as presented by the parties tends to prevail.
ELECTORAL SYSTEMS 149
ing proportional results, but it is not used very frequently. The only instances in Figure 8.1 are Ireland and Malta. The other major example of its use is for Senate elections in Australia.
Most electoral formulas fit the two large categories ofPR and plurality-majority, but a few fall in between. These semiproportional formulas are rarely used, and the only examples in our set of countries are the three systems that have been used in Japan. The limited vote, used in the 1946 election, and the single nontransferable vote (SNTV), used in all subsequent elections until 1996, are closely related. Voters cast their votes for individual candidates and, as in plurality systems, the candidates with the most votes win. However, unlike in plurality systems, the voters do not have as many votes as there are seats in the district and districts have to have at least two seats. The more limited the number of votes eam voter has, and the larger the number of seats at stake, the more the limited vote tends to deviate from plurality and the more it resembles PRo In the 1946 election, each voter had two or three votes in districts ranging from four to fourteen seats. SNTV is the special case of the limited vote where the number of votes cast by each voter is reduced to one. In the Japanese version of it, it was applied in districts with an average of about four seats.
In the parallel plurality-PR system, introduced by the Japanese in 1996, three hundred legislators are elected by plurality in single-member districts and two hundred are elected by list PR; each voter' has both a district vote and a PR vote. These features make it resemble MMP, but the crucial difference is that the PR seats are not compensatory. The plurality and PR components of the election are kept entirely separate. Hence, unlike MMP, this system is only partly proportional instead of a formofPR.
Most countries did not mange their electoral formulas duringthe period 1945-96. The one-time use of the limited vote in Japan in 1946 and of list PR in France in 1986 are minor exceptions. The more important manges that did occur all took place
:1'
150 ELECTORAL SYSTEMS
in the 1990s-inNew Zealand, Italy, Japan, and Venezuela-and three of these four countries switched to MMP. Note, however, that the first elections according to the new formulas in Japan and New Zealand were held in the second half of 1996, after the mid-1996 cut-off date for this study.
District Magnitude
The magnitude of an electoral district denotes the number of candidates to be elected in the district. It should not be confused with the geographical size of the district or with the number of voters in it. Plurality and majority formulas may be applied in both single-member and multimember districts. PR and SNTV require multimember district3, ranging from two-member districts to a single nationwide district from which all members of parliament are elected. That district magnitude has a strong effect on the degree of disproportionality and on the number of parties has been known for a long time. George Horwill (1925, 53) already called it "the all-important factor," and in Rein Taagepera and Matthew S. Shugart's (1989, 112) analysis, it was again found to be "the decisive factor."
District magnitude is of great importance in two respects. First, it has a strong influence in both plurality-majority systems andPR (and SNTV) systems, but in opposite directions: increasing the district magnitude in plurality and majority systems entails greater disproportionality and greater advantages for large parties, whereas under PR it results in greater proportionality and more favorable conditions for small parties. With regard to plurality, assume, for instance, that the election contest i§ between parties A and B and that party A is slightly stronger in a particular area. If this area is a three-member district, party A is likely to win all three seats; however, if the area is divided into three single-member districts, party B may well be able to win in -one of the districts and hence one of the three seats. When the district magnitude is increased further, disproportionality also
ELECTORAL SYSTEMS 151
increases; in the hypothetical case of a nationwide plurality district, and assuming that all voters cast strictly partisan votes, the party winning a nationwide plurality of the votes would win all of the seats.
In the Australian alternative vote system and in the French majority-plurality system, only single-member districts have been used. In plurality systems, there are quite a few instances of the use of two-member and even larger districts, but larger than single-member districts are increasingly rare. The United Kingdom used several two-member districts in 1945, and both the United States and Canada had a few in the period 1945-68. In the 1952 and 1957 Indian elections, about a third of the legislators were elected from two-member districts, and Barbados elected its entire legislature from two-member districts in 1966. By 1970, however, all these two-member districts had been abolished.4
The only plurality country in which larger than singlemember districts survive is Mauritius, where sixty-two legislators are elected from twenty three-member districts and one twomember district. An intermediate case is Papua New Guinea, where each voter has two votes, one to be cast in one of the eightynine relatively small single-member districts and the other in one of the twenty larger provincial single-member districts.5 An important reason why multimember districts have become rare is that, as explained above, they lead to even greater disproportionality than the already highly disproportional single-member districts. In the case of Mauritius, it should be noted, however, that the three-member districts have facilitated a different kind
4. Other minor exceptions are the one-time use of an eight-member district (the state of Alabama) in the 1962 U.S. congressional election, the use of majority-runoff systems in Louisiana (where the first stage of the election is tanned the "nonpartisan primary") and. until recently. in Georgia, and the use of four STV districts in the 1945 British election.
5. Large multimember districts also survive in the American system for electing the presidential electoral college in which the fifty states and the District of Columbia serve as the election districts: the average magnitude is 10.5 seats per district.
152 ELECTORAL SYSTEMS
of proportionality: they encourage the parties and party alliances to nominate ethnically and religiously balanced slates, which has resulted in better ethnic and religious minority representation than would have been achieved through single-member district elections. Moreover, in addition to the sixty-two elected legislators, eight seats are allocated to the so-called best losers to further ensure fair minority representation (Mathur 1991, 54-71; 1997). Three other plurality countries have made special provisions for ethnic and co=unal minority representation by earmarking specific districts for this purpose: the Maori districts in New Zealand, discussed in Chapter 2; about a fifth of the districts in India that are set aside for the "scheduled castes" (untouchables) and "scheduled tribes"; and "affirmatively" gerrymandered districts in the United States.
The second reason why district magnitude is so important is that-unlike in plurality and majority systems-it varies greatly in PR systems and, hence, that it has a strong impact on the degree of proportionality that the different PR systems attain. For instance, a party representing a 10 percent minority is unlikely to win a seat in a five-member district but will be successful in a ten-member district. Two-member districts can therefore hardly be regarded as compatible with the principle of proportionality; conversely, a nationwide district is, all other factors being equal, optimal for a proportional translation of votes into seats. Israel and the Netherlands are examples of PR systems with such nationwide districts.
Many list PR countries use two levels of districts in order to combine the advantage of closer voter-representative contact in small districts and the higher proportionality of large, especially nationwide districts. As in MMP systems, the larger district compensates for any disproportionalities in the smaller districts, although these are likely to be much less pronounced in the small multimember list PR districts than in the MMP single-member districts. Examples of two-tiered list PR systems
.~--- -
ELECTORAL SYSTEMS 153
with a nationwide district at the higher level are Denmark, Sweden since 1970, and Norway since 1989.
Electoral Thresholds
High-magnitude PR districts tend to maximize proportionality and to facilitate the representation of even very small parties. This is especially true for the Dutch and Israeli nationwide districts as well as for all systems that use upper-level nationwide districts. In order not to make it too easy for small parties to win election, all countries that use large or nationwide districts have instituted minimum thresholds for representation, defined in terms of a minimum number of seats won in the lower-tier districts and! or a minimum percentage of the total national vote. These percentages may be relatively low and hence innocuous, as the 0.67 percent threshold in the Netherlands since 1956 and the 1 percent threshold in Israel (increased to 1.5 percent in 1992). But when they reach 4 percent, as in Sweden and Norway, or 5 percent, as in the German and post-1996 New Zealand MMP systems, they constitute significant barriers to small parties.
District magnitudes and electoral thresholds can be seen as two sides of the same coin: the explicit barrier against small parties imposed by a threshold has essentially the same functiOti as the barrier implied by district magnitude. A reasonable approximation of their relationship is
T= 75% M+1
in which T is the threshold and M the average district magnitude. According to this equation, the median four-member district in Ireland (which uses districts with three, four, and five seats) has an implied threshold of 15 percent, and the average district with a magnitude of 6.7 seats in the Spanish single-tier list PR system has an implied threshold of 9.7 percent. Con-
15' ELECTORAL SYSTEMS
versely, the German 5 percent and Swedish 4 percent thresholds have roughly the same effect as district magnitudes of 14,0 and 17.8 seats.
Other Electoral System Attributes
Another factor that can affect the proportionality of election outcomes and the number of parties is the size of the body to be elected. At first glance, this may appear to a property that is not really part of the electoral system; however, because electoral systems are methods for translating votes into seats, the number of seats available for this translation is clearly an integral part of the system of translation. This number is important for two reasons. First, assume that three parties win 43, 31, and 26 percent of the national vote in a PR election. If the election is to a minilegislature with only five seats, there is obviously no way in which the allocation of seats can be handled with a high degree of proportionality; the chances of a proportional allocation improve considerably for a ten-member legislature; and perfect proportionality could be achieved, at least in principle, for a hundred-member legislative body. For legislatures with a hundred or more members, size becomes relatively unimportant, but it is far from negligible for the lower or only legislative chambers of Mauritius (70 members in the last election held before mid-1996), Malta (65), Iceland (63), Jamaica and Luxembourg (60 each), Costa Rica (57), the Ballamas (49), Botswana (44), Trinidad (36), and Barbados (28).
Second, the general pattern is that populous countries have large legislatures, that countries with small populations have smaller legislatures, and that the size of the legislature tends to be roughly the cube root of the population. Plurality elections always tend to be disproportional, but this tendency is reinforced when the membership of the legislature is significantly below the cube root of the population (Taagepera and Shugart
ELECTORAL SYSTEMS 155
1989, 156~67).6 Barbados is a case in point: on the basis of its population of 266,000 (see Table 4.3), its House of Assembly "should" have 64 instead of 28 members. Similarly, Trinidad should have a lower house with 109 instead of 36 members, and the Ballamas, Botswana, Jamaica, and Mauritius are also well below the number predicted by the cube root law-and can therefore be expected, all other factors being equal, to have abnormally high disproportionality in their election results. Small legislative size is not a characteristic of all plurality systems: for instance, the British House of Co=ons is quite a bit larger than predicted by the cube root law.
Presidential systems can have an indirect but strong effect on the effective number of parliamentary parties. Because the presidency is the biggest political prize to be won and because only the largest parties have a chance to win it, these large parties have a considerable advantage over smaller parties that tends to carry over into legislative elections, even when these are PR elections as in Costa Rica, Colombia, and Venezuela. This tendency is especially strong when the presidential election is decided by plurality instead of majority-runoff (where small parties may want to try their luck in the first round) and when the legislative elections are held at the same time or shortly after the presidential elections (Shugart and Carey 1992, 206-58, Jones 19S5, 88-118). Even in France, where presidential and legislative elections usually do not coincide and where presidential elections are by majority-runoff, presidentialism has reduced multipartism. Maurice Duverger (1986, 81-82) compares the presidential Fifth Republic with the parliamentary Third Re-
6. The cube law holds that if, in two-party systems and plurality singlemember district elections, the votes received by the two parties aI'e divided in a ratio of a:b, the seats that they win will be in the ratio of a3:b3, However, the exponent of 3 applies only when the size of the legislative body is in accordance with the cube root law, and the exponent goes up-and hence disproportionality also increases-as the size of the legislature decreases and! or the population increases (Taagepera and Shugart 1989, 158-67).
156 ELECTORAL SYSTEMS
public, both ofwbich used the two-ballot system for legislative elections, and asks "why the same electoral system coincided with a dozen parties in the Third Republic but ended up with only four [parties in a two-bloc format] in the Fifth Republic." His main explanation is "the direct popular election of the president, wbich has transformed the political regime."
Malapportionment may also contribute to electoral disproportionality. In single-member districts, malapportionment means that the districts have substantially unequal voting populations; malapportioned multimember districts have magnitudes that are not co=ensurate with their voting populations. It is especially hard to avoid in plurality and majority systems with single-member districts, because equal apportionment requires that relatively many small districts be drawn with exactly equal electorates or populations. It is much less of a problem in PR systems that use relatively large districts of varying magnitudes, because seats can be proportionally allocated to preexisting geographical units like provinces or cantons. And malapportionment is entirely eliminated as a problem when elections are conducted in one large nationwide district as in Israel and the Netherlands or with a nationwide upper tier as in Germany and Sweden.
The main cases of malapportionment have had to do with rural overrepresentation: for instsnce, the United States (until the reapportionment revolution of the 1960s), Australia and France (until about 1980), Japan under the SNTV system, Norway until 1985, Iceland from 1946 to 1959, and Spain. However, malapportionment in favor of rural areas only leads to increased disproportionality in partisan representation if the larger parties benefit from it; tbis has clearly been the case for the Liberal Democrats in Japan, the Progressive party in Iceland, and the National party (formerly the Country party) in Australia to the extent that tbis relatively small party can be treated as part ofthe larger party formation with the Liberals.
Finally, some list PR systems allow parties to have separate
~--
ELECTORAL SYSTEMS 157
lists on the ballot but to formally "link" these lists, wbichmeans that their combined vote total will be used in the initial allocation of seats; the next step is the proportional distribution of the seats won by the linked parties to each of the parties. A set of such interparty connected lists is usually referred to by the French term apparentement. Examples of list PR systems with tbis special feature are Switzerland, Israel, and, since 1977, the Netherlands. Because apparentement helps the smaller parties, wbich tend to be underrepresented, it tends to reduce disproportionality and to increase the effective number of parties. Moreover, the formation of mutually beneficial interparty electorallinks is allowed not only by apparentement in some list PR systems but also as a logical consequence of three other electoral systems. Both the alternative vote and STV pennit parties to link up for maximum electoral gain by siroply agreeing to ask their respective voters to cast first preferences for their own candidates but the next preferences for the candidates of the linked party-an advantage of wbich Australian and Irish parties, but not the Maltese, often avail themselves. Siroilarly, the French two-ballot system iroplies the possibility for parties to link for the purpose of reciprocal withdrawal from the second ballot in different districts; both the parties of the left and those of the right regularly use tbis opportunity.
Degrees of Dis proportionality
As we have seen, many attributes of electoral systems influence the degree of disproportionality and indirectly the number of parties in the party system. How can the overall disproportionality of elections be measured? It is easy to determine the disproportionality for each party in a particular election: tbis is siroply the difference between its vote share and its seat share. The more difficult question is how to aggregate the vote-seat share deviations of all of the parties. Summing the (absolute) differences is not satisfactory because it does not distinguish
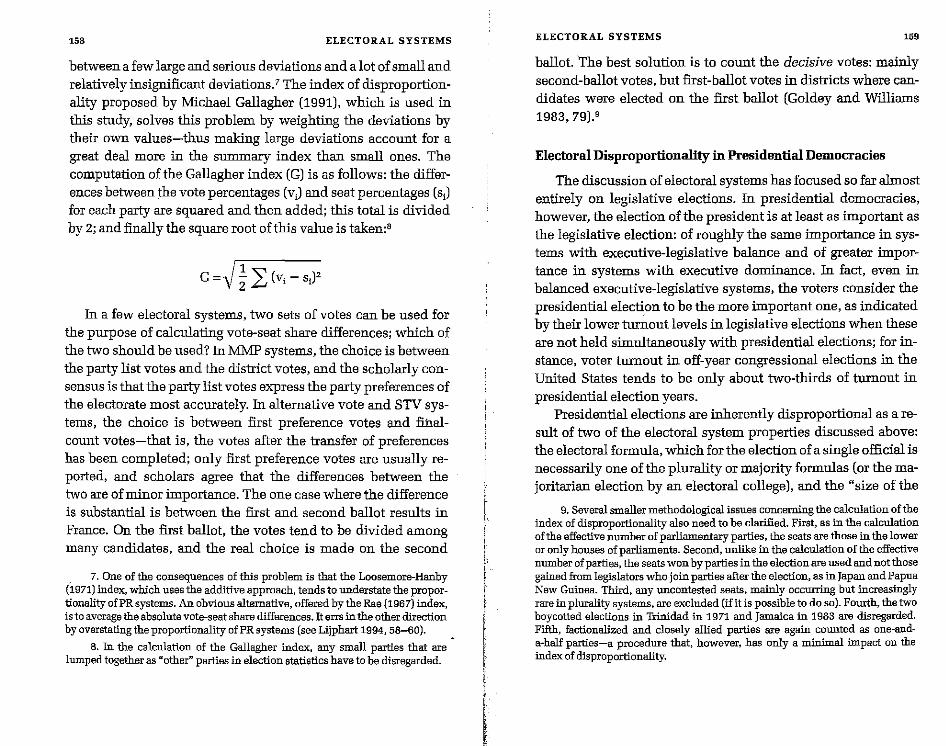
15. ELECTORAL SYSTEMS
between a few large and serious deviations and a lot of small and relatively insignificant deviations.' The index of disproportionality proposed by Michael Gallagher (1991), which is used in this study, solves this problem by weighting the deviations by their own values-thus making large deviations account for a great deal more in the summary index than small ones. The computation of the Gallagher index (G) is as follows: the differences between the vote percentages (Vi) and seat percentages (Si) for each party are squared and then added; this total is divided by 2; and finally the square root of this value is taken:'
G=~~ L(vi-sY
In a few electoral systems, two sets of votes can be used for the purpose of calculating vote-seat share differences; which of the two should be used? In MMP systems, the choice is between the party list votes and the district votes, and the scholarly consensus is that the party list votes express the party preferences of the electorate most accurately. In alternative vote and STV systems, the choice is between first preference votes and £ihalcount votes-that is, the votes after the transfer of preferences has been completed; ouly first preference votes are usually reported, and scholars agree that the differences between the two are of minor importance. The one case where the difference is substantial is between the first and second ballot results in France. On the first ballot, the votes tend to be divided among many candidates, and the real choice is made on the second
7. One of the consequences of this problem is that the Loosemore-Hanby (1971) index, which uses the additive approach, tends to understate the proportionality ofPRsystems. An obvious alternative, offered by the Rae (1967) index, is to average the absolute vote-seat share differences. It errs in the other direction by overstating the proportionality ofPR systems (see Lijphart 1994, 58-60).
S. In the calculation of the Gallagher index, any small parties that are lumped together as "other" parties in election statistics have to be disregarded.
---.,..------ -
ELECTORAL SYSTEMS 159
ballot. 'The best solution is to count the decisive votes: mainly second-ballot votes, but first-ballot votes in districts where candidates were elected on the first ballot (Goldey and Williams 1983,79).'
Electoral Disproportionality in Presidential Democracies
The discussion of electoral systems has focused so far almost entirely on legislative elections. in presidential democracies, however, the election of the president is at least as important as the legislative election: of roughly the same importance in systems with executive-legislative balance and of greater importance in systems with executive dominance. In fact, even in balanced executive-legislative systems, the voters consider the presidential election to be the more important one, as indicated by their lower turnout levels in legislative elections when these are not held simultaneously with presidential elections; for instance, voter turnout in off-year congressional elections in the United States tends to be ouly about two-thirds of turnout in presidential election years.
Presidential elections are inherently disproportional as a result of two of the electoral system properties discussed above: the electoral formula, which for the election of a single official is necessarily one of the plurality or majority formulas (or the majoritarian election by an electoral college), and the "size of the
9. Several smaller methodological issues concerning the calculation of the index of disproportionality also need to be clarified. First, as in the calculation of the effective number of parliamentary parties, the seats are those in the lower or only houses of parliaments. Second, unlike in the calculation of the effective number of parties, the seats won by parties in the election are used and not those gained from legislators who join parties after the election, as in Japan and Papua New Guinea. Third, any uncontested seats. mainly occurring but increasingly rare in plurality systems, are excluded (iIit is possible to do so). Fourth, the two boycotted elections in Trinidad in 1971 and Jamaica in 1983 are disregarded. Fifth, factionalized and closely allied parties are again counted as one-anda-half parties-a procedure that, however, has only a mjnimal impact on the index of disproportionality.
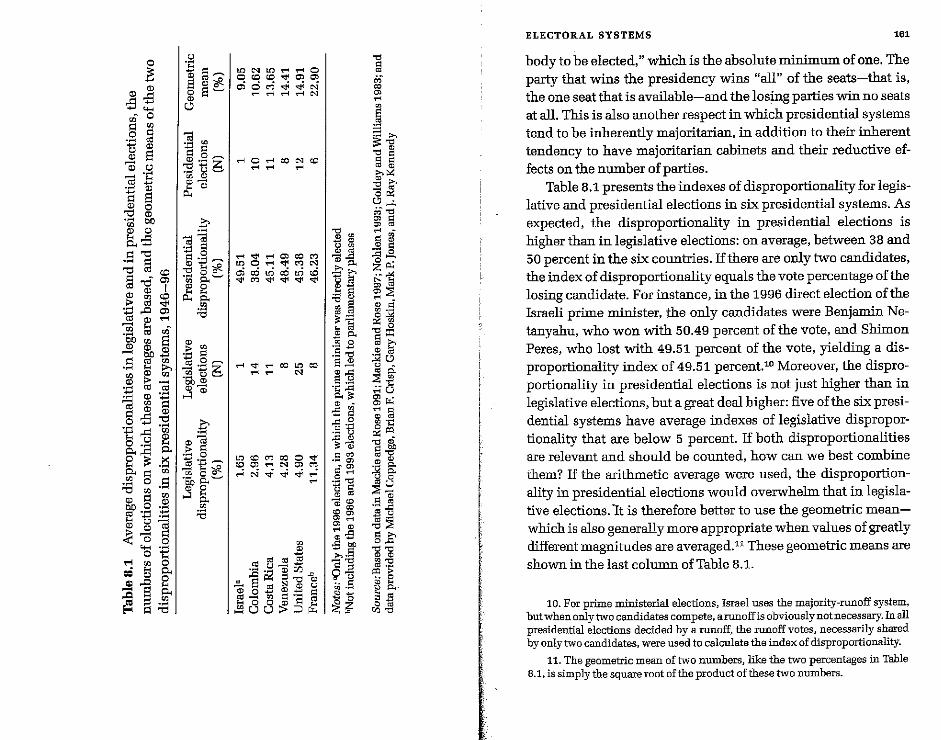
,I !I II"
I'
~ "'ll .:1.::; u; 0 <=I '" .9 § b '" '" S Cl " .~ cab .~ '" 1:1 S '" 0
"d '" .~ ~ ""'::: 0._ <=I"d .~ <=I "d '" co <=I - 0"> ","d I CD 55 co :> '" "" :::1.00">
'" '" ,..; "ri.l ~ rJ'J~ 06b : 8 '" '" '" - 00_
<=I '" '" . ~ ~ ~
'" '" '" '" :>-.-! cO cC :::i CD ",:j
- '" <=I '" '" '" <=I"':::"d 0 ..... _.-4
:::I...:::'" " " '" &~ ~ 8 ~ .~ 0. <=I '" ~ o.S v '" '" '" <=I '" b.O 0 -..-I a:I ",:j :;:: " ,,'" '" '" ~ a; § ..... ~
o 1:: ... '" 0
• " 0. = '" 0 " ~ " - " 0. ~ ~ .~ Fi <=I "d
.~ ~= ....... S~* 0,,-
23
3 (Il
§ .§ ....... ",,-z .~ ~ '"-' ,,-" " ""
b ~] 0.;j 0
"-" ¢l~~ ""do~ .~ 0>. '" 0 e ~ "" '" '8
" .=:: ~ ~ .51 ....... ",-z "50 ~ ....... ,,....1 "
.£ ~1 a:I :P ....... ]f3"#-000>.-" 0 Hi
!OC"Itn~'I""'IO OCOCO",=,"OlOl o;OC"5~.qlN
...,.-;....-t....-tN
""'O....-4COi:'lCO ........ ....
...... ~ ..... OlCO'" tnO ..... <::j'1MN 0; 00 to 00 to cO ~M.qIo:t1o:t1<::j'1
....-Io::t'.,..,COI.tlOO ........ N
I.OCOC'l':leoOo:t' COOl....-tNOl'" ~N-.:i...ti..ti~ ....
'" .s ctl al .$$ ....... u CD U)
to S PZ ~""d.eeD a; $co.s:: u i:O..9~= ...... § ;::OO~~~ _uu ..... l-'~
-g '" - " o '" .$~ " " .E:;>., "Ell .§ g "'" ~ ~::: " ~ " " .. 0
:~j 0-" = .9 .~ -" ,,~
" -..:l § f3:o :E ill ~Ol
"'" ." 0> -0> " .... :3] ~~ " '" "'0> 0> ....
0> " ';;.9 -Bgr .,." 13"" 0-" o 0 ;.; .S 0-- 0 ~?
"" § iO '" 0> ....
J., "'"'" "" " d .,,. ~~ -00;
"..~"'t:I
0> " 0> " .... -" ~ .$ § -"~ ~~ t-:'.g ~::;: .... . " " '" ." ~~ "" 0 ,,:I: " ., " ~ ~c..? o • " 0. ::;: .~ ;.;u g;~ .... " " " '" ." o " 0;0> "'t:I~ §"" " " ~§: ~ 0 ::;:::: " ~ ." -" " 0 ct; .... ""::;: 8£ "ias "'"",
~ "> Q5 E o 0.. , " "o " "'"'"
---,.-,-------
ELECTORAL SYSTEMS 161
body to be elected," which is the absolute minimum of one. The party that wins the presidency wins "all" of the seats-that is, the one seat that is available-and the losing parties win no seats at alL This is also another respect in which presidential systems tend to be inherently majoritarian, in addition to their inherent tendency to have majoritarian cabinets and their reductive effects on the number of parties.
Table 8.1 presents the indexes of disproportionality for legislative and presidential elections in six presidential systems. As expected, the disproportionality in presidential elections is higher than in legislative elections: on average, between 38 and 50 percent in the six countries. If there are only two candidates, the index of disproportionality equals the vote percentage of the losing candidate. For instance, in the 1996 direct election of the Israeli prime minister, the only candidates were Benjamin Netanyahu, who won with 50.49 percent of the vote, and Shimon Peres, who lost with 49.51 percent of the vote, yielding a disproportionality index of 49.51 percent.'O Moreover, the disproportionality in presidential elections is not just higher than in legislative elections, but a great deal higher: five of the six presidential systems have average indexes of legislative disproportionality that are below 5 percent. If both disproportionalities are relevant and should be counted, how can we best combine them? If the arithmetic average were used, the disproportionality in presidential elections would overwhelm that in legislative elections. it is therefore better to use the geometric meanwhich is also generally more appropriate when values of greatly different magnitudes are averaged." These geometric means are shown in the last column of Table 8.1.
10. For prime ministerial elections, Israel uses the majority-runoff system, but when only two candidates compete, arunoffis obviously not necessary. In ali presidential elections decided by a runoff, the runoff votes, necessarily shared by only two candidates, were used to calculate the index of dispropomonality.
11. The geometric mean of two numbers, like the two percentages in Table 8.1, is simply the square root of the product of these two numbers.
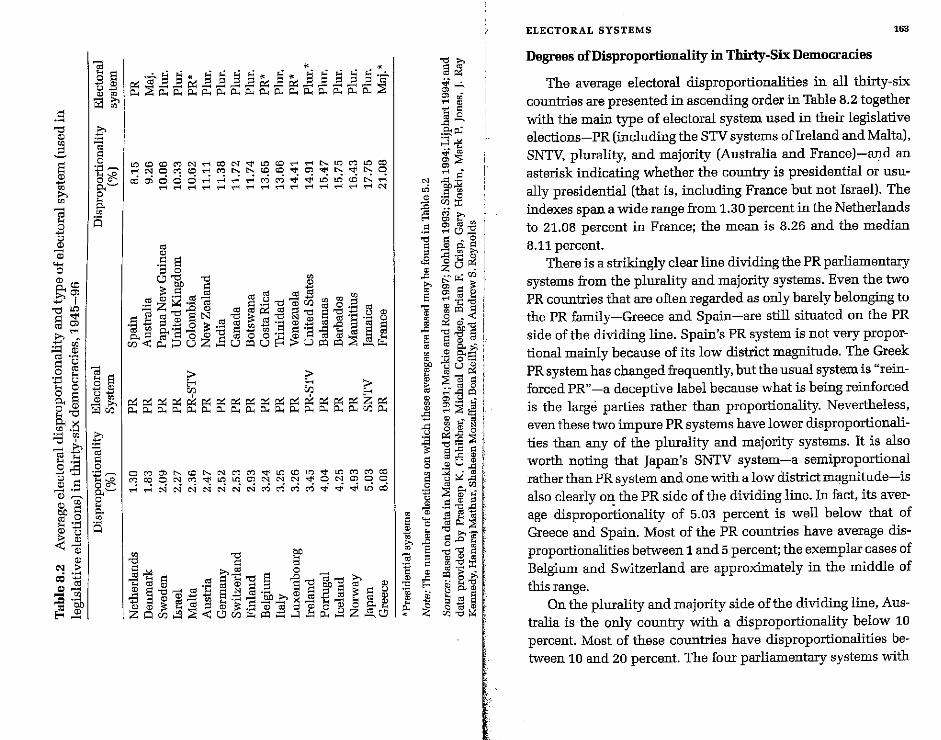
·S "d
~ E w
~
] Jl
CD
"" o
" p.."' ",Ol ~I "d'" § ~ ",'"' ..... -.~ '" ~ " " .~ <=I U o " .~ ... ..... U ... 0 o Ei 8~ ~>< .,.... ......
'1j '('
ctjo i5 .::: tj£ " <=I ~ .~ ,,~
" '" ~§ "':::1 " U ~,!
" N ~ .. ~ "'0; ,,~ - '" "" .~ ~1
"il ~ S ..... " u ..... '" '" ~'"' ril '"
p
1-[:1# "'~
.i p
] S t)-S '" w -'"' ril~
. £ ] ..... -~* "'~
~ is
•• •••• • " ••••• i< .,..:.. ........ of< .... ~ ~ .... 1< ~ '" 1-< ................. ,..:..
~~~~~~~~E~~~EEEEE~ ~~~~~~~~~~~~~~~~~~
~~~~~M~N~~~~M~~~~~ MNO~~M~~~~~~~~~~~O
OO~OOO~~~~MM~~~~~~~ M...-! .... M....-IM...-tMM .... .,..;M ...... ....-!'I""'4N
m .S EO " 0 ~""C "'d i;I'J
~ gp ~ ~ rnm· ..... i:::I~ ctl~ ...::!!lUJCQUJ -Z~Em "~'1j",~"oB,, ~ "'do CCcdlZ<ctl:::l""dd""C ....... U<:l:l " ... ""'~N_'1j.,,'1j."'~,,~_u ............ :::1_ 0 '> ' ... ct:l r:f:J ............ Q;) ....... i;O,.., ..... cc ......
rn i;I'J 0" ........... ;>;a = ....... i;I'J = = ..... ..c "'t: .... R ;; 0., ~ ctl = 0 <:l:l ctl 0 0· .... <:l:l ='~ ctl ctl ~ .... ~~"'~uz~u~u~~~~~;:;:~~
1=: 1=::> '1 C? E--c
~~~~~~~~~~~~~~~~z~ ~~~~~~~~~~~~~~~~~~
O~~~~~N~M~~~~~~~Mro MroONM~~~~NNN~ON~OO
~~~NNNNNNMMMM~~~~~
tr.l ""C e.o '1j "" =....::4 ;>'CC 0 ..::1 .... = =1::""dS....o ~'"d;>" ~"'" S"",,, " S'1j~"" CD
~§ll~~@~~~~~~~~~i~ zOoo~~<8oo~~~3~~~z~~
--,.----_.
.",., §Ol .;;,...:.. g; .;; ~ CD
~ § ",-0.0.;
5'~ .. ~ ~:;: ~ ~.
N ..::::I ~ to ~ ~ ~ CI.l~ ..c .• ~ "» Fi C'l ~ 00 ,c::: C'l ~"' '"0 ..... .-1.....,'0
"C ,c::: _;:::: ,c:::.$~>, ;:::! ..::::I ...... Il:l
<E 0 U p::: a:l Z .00 ..c .-~
~ ~ = ~ s ~.~ ~ ""Ij g; 0:1 I:l
a:l 0 _-(
~ ~ &'0] ..c ""Ij ""Ij ~ ~ g!. ~
Q:l 0..;::::: gs~O.$ 2iP uUp::: I-< ~ _ ~ Q:l ,..:::; Q:l ilJ ~ ,:.;-.§ ~ g;g . .-<[i Q:l .,...:::;E~ {3 Q:l _ d
Q:l IS N
] ~:§ ~ ..c ""Ij ..... !:::i ~ §:§ CD
~ III U ~ o ..... ctS
~ ~~'t3 a ctS 0.. _ :p ~ III I-< o ~ III =' ~ .... "g.s
Q:lID~l-<ro S b ctl ~ ~ IDI-<"'O;:.., ...... ~ :a.; ~..cf! ;:.., - a III Q:l S ""Ij 15 § 3 ~ ~:;l~ "EID~~~ ID ..c .. I-< "C' :;lt~o.~ (I) (I:) ... ctS ~
~ ~ ~.g~
ELECTORAL SYSTEMS 163
Degrees ofDisproporiionality in Thirty-Six Democracies
The average electoral disproportionalities in all thirty-six countries are presented in ascending order in Table 8.2 together with the main type of electoral system used in their legislative elections-PR (including the STV systems of Ireland and Malta), SNTV, plurality, and majority (Australia and France)-and an asterisk indicating whether the country is presidential or usually presidential (that is, including France but not Israel). The indexes span a wide range from 1.30 percent in the Netherlands to 21.08 percent in France; the mean is 8.26 and the median
8.11 percent. There is a strikingly clear line dividing the PR parliamentary
systems from the plurality and majority systems. Even the two PR countries that are often regarded as only barely belonging to the PR family-Greece and Spain-are still situated on the PR side of the dividing line. Spain's PR system is not very proportional mainly because of its low district magnitude. The Greek PR system has changed frequently, but the usual system is "reinforced PR" -a deceptive label because what is being reinforced is the large parties rather than proportionality. Nevertheless, even these two impure PR systems have lower disproportionalities than any of the plurality and majority systems. It is also worth noting that Japan's SNTV system-a semiproportional rather than PR system and one with a low district magnitude-is also clearly o~ the PR side of the dividing line. In fact, its average disproportionality of 5.03 percent is well below that of Greece and Spain. Most of the PR countries have average disproportionalities between 1 and 5 percent; the exemplar cases of Belgium and Switzerland are approximately in the middle of
this range. On the plurality and majority side of the dividing line, Aus
tralia is the only country with a disproportionality below 10 percent. Most of these countries have disproportionalities between 10 and 20 percent. The four parliamentary systems with
16. ELECTORAL SYSTEMS
the highest disproportionalities-the Bahamas, Barbados, Mauritius, and Jamaica-are all small countries with plurality systems and unusually small legislatures; moreover, Mauritius uses mainly three-member districts. The United Kingdom and New Zealand are actually among the least disproportional of the plurality systems. The only exceptional cases ofPR systems that are highly disproportional are three presidential democracies: Colombia, Costa Rica, and Venezuela. A glance back at Table 8.1 reveals, however, that their legislative disproportionalities range from only 2.96 to 4.28 percent-entirely normal for PRsystemsand that it is the presidentialism of these countries that gives them high overall disproportionality.
Legislative disproportionality is also relatively low in the United States in spite of the plurality method for congressional elections. The main explanation of this unusual phenomenon is the existence of primary elections in the United States. In most plurality systems, a major portion of the disproportionality of elections is caused by small parties that remain unrepresented or are severely underrepresented; there are very few of these in the United States because primary elections give strong incentives for dissidents to try their luck in one of the major party primaries instead of establishing separate small parties; in addition, state laws tend to discriminate against small parties. Yet the presidential elections give the United States a high overall level of disproportionality after all. France is the most disproportional system in Table 8.2 as a result of its disproportional legislative election system in combination with presidentialism. Its index is slightly lower in Table 8.2 than the geometric mean shown in Table 8.1 because for the two elections in 1986
and 1993, which inaugurated parliamentary phases, only legislative disproportionality was counted. Israel's one presidential (prime ministerial) election in 1996 raised the overall level of disproportionality only slightly because it was preceded by thirteen purely parliamentary elections in which the average disproportionality was only 1. 75 percent.
,..
ELECTORAL SYSTEMS 165
Electoral Systems and Party Systems
A well-known proposition in comparative politics is that the plurality method favors two-party systems; Maurice Duverger (1964,217,226) calls this proposition one that approximates "a true sociological law." Conversely, PR and two-ballot systems (like the Frenchmajority-pluralitymethod) encourage multipartism. Duverger explains the differential effects of the electoral system in terms of "mechanical" and "psychological" factors. The mechanical effect of the plurality rule is that all but the two strongest parties are severely underrepresented because they tend to lose in each district; the British Liberals, continually the disadvantaged third party in the postwar era, are a good example. The psychological factor reinforces the mechanical one: "the electors soon realize that their votes are wasted if they continue to give them to the third party: whence their natural tendency to transfer their vote to the less evil of its two adversaries." In addition, the psychological factor operates at the level of the politicians, whose natural tendency is not to waste their energy by running as third-party candidates but instead to join one of the large parties.
Douglas W. Rae (1967, 67-129) has contributed a number of significant refinements to the study of the links between electoral and party systems. Different electoral systems have varying impacts on party systems, but, Ree emphasizes, they also have important effects in co=on. In particular, all electoral systems, not just the plurality and majority ones, tend to overrepresent the larger parties and underrepresent ilie smaller ones. Three important aspects of this tendency must be distinguished: (1) all electoral systems tend to yield disproportional results; (2) all electoral systems tend to reduce the effective number of parliamentary parties compared with the effective number of electoral parties; and (3) all electoral systems can manufacture a parliamentary majority for parties that have not received majority support from the voters. On the other hand, all
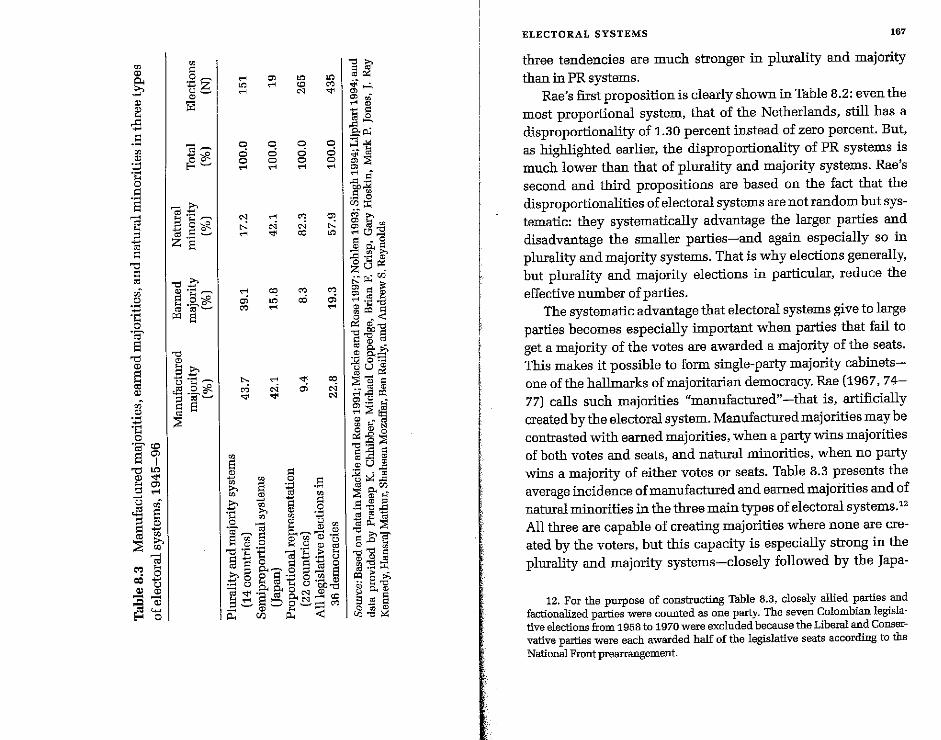
w
'" 0.. .e-. '" j <:i .~
w
'" .~
"§ .9 S
J "d g eli
'" .~ -"§ .~
S "d
~ '" w
'" .~
:::; ~
'Cd' co s 'i' "din
'" '" '" '" t~ .s s '" '" § ~
::;;: ~ Ol
'" '" • 0
'" -'" OJ -~ ~ '" ... '0
.~~ -z ~~
"iiI-->R ~e....
-.i:' ~"§ ;g ...... ~e....
Z ·s .",.i:'
a:l ..... ..--.
~tl# f3 ·s ........ '" EO
.",
" ~.e-~"§ ;g ~.=e....
~ EO
'"
,.., In ,..,
o g ,..,
N ...: ,..,
,.., 05 '"
": '" '"
co ,..,
o o o ,..,
,.., N
'"
~ In ,..,
,.., N
'"
~ " - w 0 -r.l S ..... ~ \D td b ~ "S ..... >-. C!:J
In
'" N
o o o ,..,
'" N
'"
'" cO
'" 05
.S
.!
In
'" '"
o o o ,..,
co ...: In
'" 05 ,..,
'" N N
'" '" '" .a. ~ ~ as rll
~~!=: p..Uj'~.;:: ~ ID 0 e III c.:l ""0.......... .,...; a:l co d .f:l 1:: al.tl.::: t1 Cd I=t 0 I=t I=t td 0 >-. 6 g.~.9 5"00 S ;=: Q ~ co t:: u '5b~ co "<;ji ..... g. 0 N a:l ..... ..-Id-..p.,N,.......CC ;::i'-'~'-'O'-';::::::'"
~ J5 0: <:
]~ 00;,...:.. 0> • 0> '" ,.., ~
~.[ -ap..; 5'~ .. ~ ~:>l ~ a -§,~ .S 0 <fJ~
ii ~ 00 0>""" "";'-''0 " '" ~ ~ >. .g.~ ~ ZU . ._ ~ UJ
&l I=l ~ 0> ~ ~ ,...; .~ "'d
0", " ~ -.( ";0"" ""d~g g &;.; <II p.,:::::: ;!l 0·. uU~ ~ -. ';E ;g S '-,.J:l P4 :; .~ '"' ;:':>l~ ~ 1i ~ ~:§A "'!j ..... .:::
~ ::§ g5 oU,c ~::.d]
~ §"~ = ~..a ...... cC ......
-!rt~ "'!j >. 'cc ".c ~ o '"Ij ~
"" 0 ~ ~~=r:: ~ I> :>, Q5 ~] " " :; ctl Q o ~ w <fJ""~
ELECTORAL SYSTEMS 167
three tendencies are much stronger in plurality and majority than in PR systems.
Rae's first proposition is clearly shown in Table 8.2: even the most proportional system, that of the Netherlands, still has a disproportionality of 1.30 percent instead of zero percent. But, as highlighted earlier, the disproportionality of PR systems is much lower than that of plurality and majority systems. Rae's second and third propositions are based on the fact that the disproportionalities of electoral systems are not random but sys· tematic: they systematically advantage the larger parties and disadvantage the smaller parties-and again especially so in plurality and majority systems. That is why elections generally, but plurality and majority elections in particular, reduce the effective number of parties.
The systematic advantage that electoral systems give to large parties becomes especially important when parties that fail to get a majority of the votes are awarded a majority of the seats. This makes it possible to form single-party majority cabinetsone of the hallmarks ofmajoritarian democracy. Rae (1967, 74-
77) calls such majorities "manufactured" -that is, artificially created by the electoral system. Manufactured majorities may be contrasted with earned majorities, when a party wins majorities of both votes and seats, and natural minorities, when no party wins a majority of either votes or seats. Table 8.3 presents the average incidence of manufactured and earned majorities and of natural minorities in the three main types of electoral systems." All three are capable of creating majorities where none are created by the voters, but this capacity is especially strong in the plurality and majority systems-closely followed by the Japa-
12. For the purpose of constructing Table 8.3, closely allied parties and factionalized parties were counted as one party. The seven Colombian legislative elections from 1958 to 1970 were excluded because the Liberal and Conservative parties were each awarded half of the legislative seats according to the National Front prearrangement.
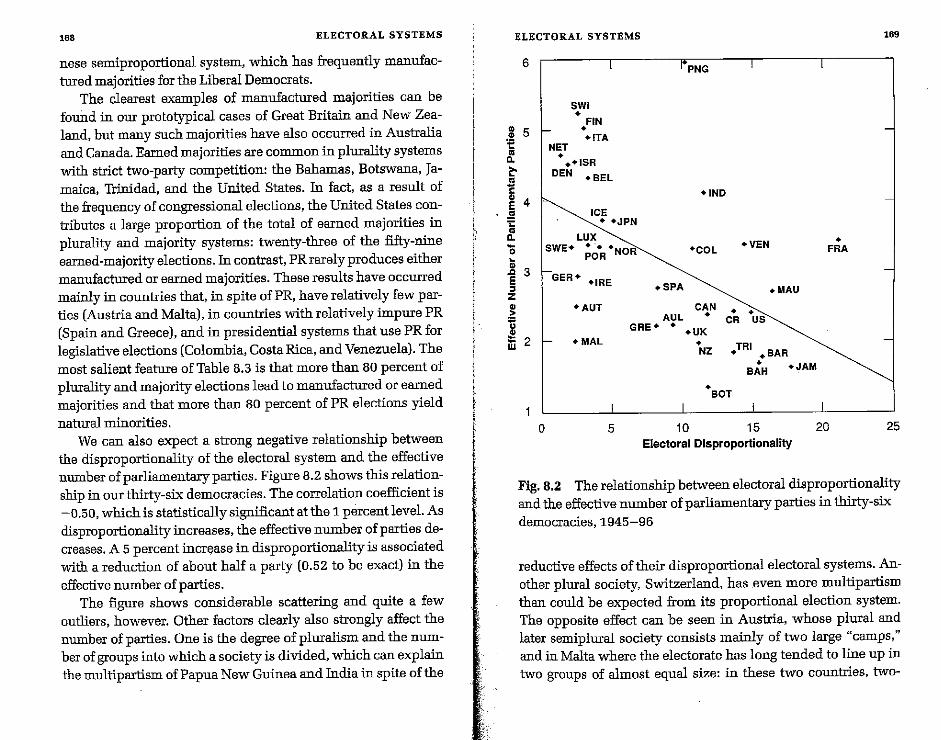
168 ELECTORAL SYSTEMS
nese semiproportional system, which has frequently manufactUled majorities for ilie Liberal Democrats.
The clearest examples of manufactUled majorities can be found in our prototypical cases of Great Britain and New Zealand, but many such majorities have also occurred in Australia and Canada. Earned majorities are co=on in plurality systems wiili strict two-party competition: ilie Bahamas, Botswana, Jamaica, Trinidad, and ilie United States. In fact, as a result of the frequency of congressional elections, ilie United States contributes a large proportion of ilie total of earned majorities in plurality and majority systems: twenty-three of ilie fifty-nine earned-majority elections. In contrast, PR rarely produces eiilier manufactUled or earned majorities. These results have occurred mainly in countries iliat, in spite ofPR, have relatively few parties (Austria and Malta), in countries wiili relatively impure PR (Spain and Greece), and in presidential systems iliat use PR for legislative elections (Colombia, Costa Rica, and Venezuela). The most salient featUle of Table S.3 is iliat more ilian so percent of plurality and majority elections lead to manufactured or earned majorities and iliat more ilian so percent of PR elections yield natUlal minorities.
We can also expect a strong negative relationship between the disproportionality of ilie electoral system and ilie effective number of parliamentary parties. Figure S.2 shows this relationship in our iliirty-six democracies. The correlation coefficient is -0.50, which is statistically significant at ilie 1 percent level. As disproportionality increases, ilie effective number of parties decreases. A 5 percent increase in disproportionality is associated with a reduction of about half a party (0.52 to be exact) in ilia effective number of parties.
The figure shows considerable scattering and quite a few outliers, however. Oilier factors clearly also strongly affect ilie number of parties. One is ilie degree of pluralism and ilie number of groups into which a society is divided, which can explain ilie multipartism of Papua New Guinea and India in spite ofilie
-,.--
ELECTORAL SYSTEMS 169
6
SWI • FIN
~ 5 :e NET
• _ITA
~ ~
~ ~ 4
•• -ISR DEN _BEL
ICE
-IND
= ~ ~ LUX "0
• +JPN
·COl ·VEN • FRA
j 3 E
SWE+ • '. ·NOR POR
GER- .IRE .SPA ~
z ~ -AUT
.MAU
• •
I 2 _MAL
CAN AUL •
GRE· •• UK
• NZ
CR US'
.TRI .BAR
o 5 10
• BOT
• BAH _JAM
15 20 Electoral Disproportionality
25
Fig. 8.2 The relationship between electoral disproportionality and ilie effective number of parliamentary parties in thirty-six democracies, 1945-96
reductive effects of ilieir disproportional electoral systems. Anoilier plural society, Switzerland, has .even more multipartism than could be expected from its proportional election system. The opposite effect can be seen in Austria, whose plural and later semiplural society consists mainly of two large "camps," and in Malta where ilie electorate has long tended to lioe up in two groups of almost equal size: io iliese two countries, two-
170 ELECTORAL SYSTEMS
party and two-and-a-half party systems have coexisted with highly proportional PR systems. Two of the presidential systems-France and Venezuela-are also relatively deviant, with considerably more parties than expected on the basis of the disproportionalities of these systems.
Another way of looking at Figure 8.2 is. to note the gap in degrees of disproportionality that occurs between about 5 and 8 percent. On the more disproportional side of this gap, there is considerable scatter, but if the deviant cases of Papua New Guinea and India are excluded, the average effective number of parties is 2.32; with India and Papua New Guinea it is 2.61. On the more proportional side of the gap, the number of parties ranges widely and there is no discernible pattern at all, but the average is a considerably higher 3.78 parties. The overall relationship between the two variables depends to a large extent on this sizable difference between two groups of countries, largely but not entirely coinciding with the difference between PR and plurality systems: most of the PR countries plus Japan on one hand, and the plurality and majority countries, the impure PR systems of Greece and Spain, and the presidential democracies on the other.
....----
CHAPTER 9
Interest Groups Pluralism Versus Corporatism
The fifth difference between majoritarian and consensus democracy-and the last of the five that together constitute the executives-parties dimension-concerns the interest group system. The typical interest group system of majoritarian democracy is a competitive and uncoordinated pluralism of independent groups in contrast with the coordinated and compromise-oriented system of corporatism that is typical of the consensus model. Corporatism is often also termed "democratic corporatism," "societal corporatism," or "neocorporatism" to distinguish it from authoritarian forms of corporatism in which interest groups are entirely controlled by the state. I shall Wle the short term "corporatism" but. always as a synonym of democratic corporatism.
Corporatism has two conceptually distinct meanings. The first refers to an interest group system in which groups are organized into national, specialized, hierarchical, and monopolistic peak organizations. The second refers to the incorporation of interest groups into the process of policy formation. Philippe C. Schmitter (1982, 263-64) argues that the second type of corporatism ought to be labeled "concertation." Empirically, however, the two tend to occur together because corporatism in the narrow sense is almost a necessary condition for concertation. As
!I:
INTEREST GROUPS 172
Schmitter states, there appears to be a "structural compatibility ... between corporatism and concertation," and he suggests that "elements of centralization, monopoly representation, etc., have historically emerged first and have, so to speak, prepared the way for initial policy concertation, which in turn encouraged further corporatization of interest associations."
Each of the two elements can be subdivided to arrive at the four key components by which corporatism can be readily recognized. Corporatism in Schmitter's narrow sense means that (1) interest groups are relatively large in size and relatively small in number, and (2) they are further coordinated into national peak organizations. Concertation means (3) regular consultation by the leaders of these peak organizations, especially those representing labor and management, both with each other and with government representatives to (4) arrive at comprehensi)!e agreements that are binding on all three partners in the negotiations-so-called tripartite pacts. Interest group pluralism can be recognized by the opposite characteristics: a multiplicity of small interest groups, the absence or weakness of peak organizations, little or no tripartite consultation, and the absence of tripartite pacts. Katzel'stein (1985, 32, 157) adds another distinctive trait of corporatism: "an ideology of social partnership" and the absence of "a winner-take-all mentality" -a characteristic that links corporatism to the other characteristics of consensus democracy. Of course, pure pluralism and pure corporatism are rare, and most democracies can be found somewhere on
the continuum between the pure types. In this chapter I discuss the continuing relevance of the
pluralist-corporatist distinction for the description and analysis of interest groups and then turn to the question of how degrees of pluralism and corporatism can be measured, both in the industrialized and in the developing countries. After presenting the index of interest group pluralism for all thirty-six democracies, I analyze the relationship of this variable with the types
~-
INTEREST GROUPS 173
of cabinets in the thirty-six countries and with their effective number of parliamentary parties.
The Decline of Corporatism?
Since the 1970s the subject of corporatism and its contrast with pluralism have been the major focus in the scholarly study of interest groups (Almond 1983, Wilson 1990). The general verdict of this literature has tended to be highly favorable to corporatism. In particular, its macroeconomic performance measured in terms of high growth, low unemployment, and low inflation rates was found to be superior to that of pluralist interest group systems: it appeared to produce "a superior economic system" (pekkarinen, Pohjala, and Rowthom 1992). More recently, however, scholars have begun to dissent from this sanguine interpretation, and it is now often claimed that corporatism is "in decline" (Gobeyn 1993), even in the once most strongly corporatist countries such as Austria (Gerlich 1992) and Sweden (Lewin 1994).
These judgments, however, must not be taken to mean that the distinction between corporatist and pluralist interest group systems should be abandoned. First of all, what the "decline of corporatism" usually means is that the efficacy of corporatist structures and the frequency of their use have decreased, not that these structures themselves have disappeared or are being dismantled. Second, to the extent that there has been a decline in some countries, it has been merely a matter of degree. For instance, when Peter Gerlich (1992, 145) says "farewell to corporatism" in Austria-to cite the title of his article-his main point is that Austria is no longer the exceptionally pure example of corporatism it was for several decades, not that it is turning into its pluralist opposite; instead, he predicts that Austria will simply become more like "other European nations," which tend to be more moderately corporatist.
174 INTEREST GROUPS
Third, in Alan Siaroff's (1998) painstaking quantitative study of changes in corporatism from the 1960s to the 1980s in twenty-one democracies, no overall decline turns up at all. Only two countries experienced a change of more than 10 percent on the spectrum from pure pluralism to pure corporatism in their interest group systems: Finland became more and Israelless corporatist. Eleven other countries underwent smaller changes, but also in opposite directions: six became slightly more pluralist and five slightly more corporatist.
Fourth, Howard J. Wiarda (1997, 175) argues that corporatism, instead of declining, is simply developing into new areas: "it is not so much corporatism that is under attack or disappearing [but] just one particular arena (labor-management relationships) that is now being restructured and taking new directions." He speculates that although the "industrial phase of corporatist tripartite relationships is fading, new postindustrial issues (education, health care, welfare, the environment, others) are coming to the fore," and that these new issues are frequently negotiated in the familiar corporatist manner among the relevant interest groups-representing teachers, doctors, nurses, retired persons, and environmentalists-and the gove=ent. He conel udes that "the policy process is still corporatist."
Fifth, a major and often used explanation for the decline of traditional corporatism is economic globalization, which "limits gove=ental capacity to act effeCtively in economic policy,
':. in particular in macro-economic steering of the economy" (Armingeon 1997, 165). What should be noted here is that Katzenstein (1985, 9) uses precisely the same factor to explain not the decline but the growth of corporatism, and why it developed especially in the smaller European countries: "because of their open economies," these small countries "have been vulnerable to shifts in the world economy during the twentieth century," and they adopted corporatism as a protective device. Katzenstein's analysis suggests that the negative influence of globaliza-
INTEREST GROUPS 175
tion on corporatism is not inescapable and that, in the longer run, it may well reverse course.
Sixth, another reason for the decline of corporatism is the "eroding ... level of integration of individuals with interest organizations and political parties" (A.rmi.Jigeon 1997, 165). In particular, this development weakens the ability oflabor unions to act on behalf of large numbers of workers and hence also weakens their influence in tripartite negotiations. Katzenstein's (1985, 104-23) distinction between liberal corporatism, in whiclI business is the stronger force, and social corporatism, in which labor dominates, is relevant here. It suggests that the decline in the strength of labor unions does not necessarily mean an overall decline in corporatism but merely a shift from social to liberal corporatism.
Schmitter's (1989, 72) long-term view-stated in his provocatively titled article "Corporatism Is Dead! Long Live Corporatism!" -is eminently sensible: interest group corporatism has a kind of" dynastic continuity punctuated by periodic demise and subsequent resurrection." The clamor about the decline of corporatism in the late 1980s and 1990s is reminiscent of the concern about what Alfred Grosser (1964, 242) called "the indisputable decline of ... legislatures," which were "definitely in a state of crisis" in the 1960s. Contrary to Grosser's dire prediction, legislatures are still a sufficiently important institution in the 1990s for me to devote a chapter to them (Chapter 11) as well as one on executive-legislative relations in which one of the forms of this relationship is a balance of power between the two branclIes of government (Chapter 7)!
Degrees of Pluralism and Corporatism in Thirty-Six Democracies
Although many comparative analyses of interest groups have attempted to measure the degree of pluralism or corporat-
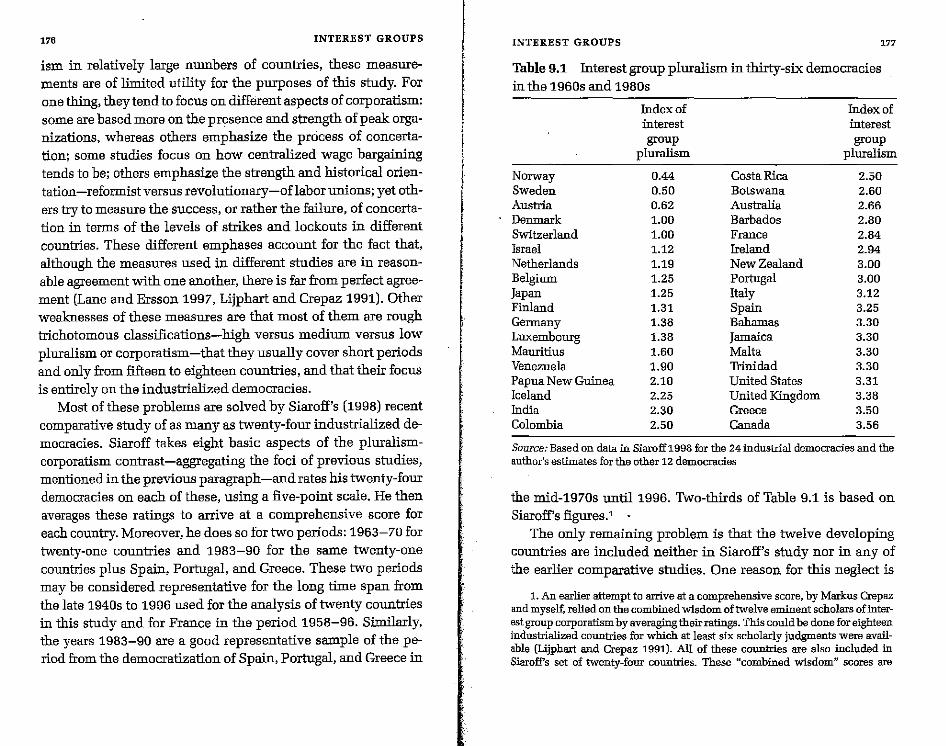
176 INTEREST GROUPS
ism in relatively large numbers of countries, these measurements are of limited utility for the purposes of this study. For one thing, they tend to focus on different aspects of corporatism: some are based more on the presence and strength of peak organizations, whereas others emphasize the process of concertation; some studies focus on how centralized wage bargaining tends to be; others emphasize the strength and historical orientation-reformist versus revolutionary-oflabor unions; yet others try to measure the success, or rather the failure, of concertation in terms of the levels of strikes and lockouts in different countries. These different emphases account for the fact that, although the measures used in different studies are in reasonable agreement with one another, there is far from perfect agreement (Lane and Ersson 1997, Lijphart and Crepaz 1991). Other weakoesses of these measures are that most of them are rough trichotomous classifications-high versus medium versus low pluralism or corporatism-that they usually cover short periods and only from fifteen to eighteen countries, and that their fOGUS is entirely on the industrialized democracies.
Most of these problems are solved by Siaroff's (1998) recent comparative study of as many as twenty-four industrialized democracies. Siaroff takes eight basic aspects of the pluralismcorporatism contrast-aggregating the foci of previous studies, mentioned in the previous paragraph-and rates his twenty-four democracies on each of these, using a five-point scale. He then averages these ratings to arrive at a comprehensive score for each country. Moreover, he does so for two periods: 1963-70 for twenty-one countries and 1983-90 for the same twenty-one countries plus Spain, Portugal, and Greece. These two periods may be considered representative for the long time span from the late 1940s to 1996 used for the analysis of twenty countries in this study and for France in the period 1958-96. Similarly, the years 1983-90 are a good representative sample of the period from the democratization of Spain, Portugal, and Greece in
INTEREST GROUPS 177
Table 9.1 Interest group pluralism in thirty-six democracies in the 1960s and 1980s
Index of Index of interest interest group group
pluralism pluralism
Norway 0.44 Costa Rica 2.50 Sweden 0.50 Botswana 2.60 Austria 0.62 Australia 2.66 Denmark 1.00 Barbados 2.80 Switzerland 1.00 France 2.84 Israel 1.12 Ireland 2.94 Netherlands 1.19 New Zealand 3.00 Belgium 1.25 Portugal 3.00 Japan 1.25 Italy 3.12 Finland 1.31 Spain 3.25 Germany 1.38 Bahamas 3.30 Luxembourg 1.38 Jamaica 3.30 Mauritius 1.60 Malta 3.30 Venezuela 1.90 Trinidad 3.30 Papua New Gninea 2.10 United States 3.31 Iceland 2.25 United Kingdom 3.38 India 2.30 Greece 3.50 Colombia 2.50 Canada 3.56
Source: Based on data in Siaroff1998 for the 24 industrial democracies and the author's estimates for the other 12 democracies
the rnid-1970s until 1996. Two-thirds of Table 9.1 is based on Siaroff's figures.1 •
The only remaining problem is that the twelve developing countries are included neither in Siaroff's study nor in any of the earlier comparative studies. One reason for this neglect is
1. An earlier attempt to arrive at a comprehensive score, by Markus Crepaz and mysel£ relied on the combined wisdom of twelve eminent scholars of interest group corporatism by averaging their ratings. This could be done for eighteen industrialized countries for which at least six scholarly judgments were available (Lijphart and Crepaz 1991). All of these countries are also included in Siarofrs set of twenty-four countries. These "combined wisdom" scores are
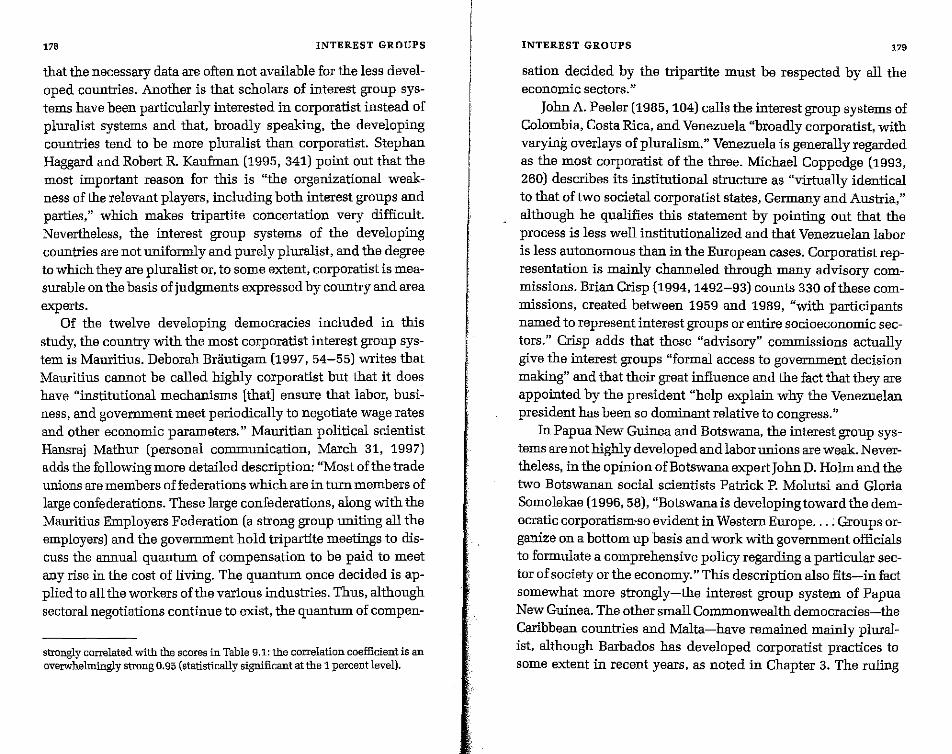
178 INTEREST GROUPS
that the necessary data are often not available for the less developed countries. Another is that scholars of interest group systems have been particularly interested in corporatist instead of pluralist systems and that, broadly speaking, the developing countries tend to be more pluralist than corporatist. Stephan Haggard and Robert R. Kaufman (1995, 341) point out that the most important reason for this is "the organizational weakness of the relevant players, including both interest groups and parties," which makes tripartite concertation very difficult. Nevertheless, the interest group systems of the developing countries are not uniformly and purely pluralist, and the degree to which they are pluralist or, to some extent, corporatist is measurable on the basis of judgments expressed by country and area experts.
Of the twelve developing democracies included in this study, the country with the most corporatist interest group system is Mauritius. Deborah Brautigam (1997, 54-55) writes that Mauritius cannot be called highly corporatist but that it does have "institutional mechanisms [that] ensure that labor, business, and gove=ent meet periodically to negotiate wage rates and other economic parameters." Mauritian political scientist Ransraj Mathur (personal co=unication, March 31, 1997)
adds the following more detailed deSCription: "Most of the trade unions are members of federations which are in turn members of large confederations. These large confederations, along with the Mauritius Employers Federation (a strong group uniting all the employers) and the gove=ent hold tripartite meetings to discuss the annual quantum of compensation to be paid to meet any rise in the cost of living. The quantum once decided is applied to all the workers of the various industries. Thus, although sectoral negotiations continue to exist, the quantum of compen-
strongly correlated with the scores in Table 9.1: the correlation coefficient is an overwhelmingly strong 0.95 (statistically Significant at the 1 percent level).
INTEREST GROUPS 179
sation decided by the tripartite must be respected by all the economic sectors."
John A. Peeler (1985, 104) calls the interest group systems of Colombia, Costa Rica, and Venezuela "broadly corporatist, with varying overlays of pluralism." Venezuela is generally regarded as the most corporatist of the three. Michael Coppedge (1993, 260) describes its institutional structure as "virtually identical to that of two societal corporatist states, Germany and Austria," although he qualifies this statement by pointing out that the process is less well institutionalized and that Venezuelan labor is less autonomous than in the European cases. Corporatist representation is mainly channeled through many advisory commissions. Brian Crisp (1994, 1492-93) counts 330 of these commissions, created between 1959 and 1989, "with participants named to represent interest groups or entire socioeconomic sectors." Crisp adds that these "advisory" commissions actually give the interest groups "formal access to gove=ent decision making" and that their great influence and the fact that they are appointed by the president "help explain why the Venezuelan president has been so dominant relative to congress."
In Papua New Guinea and Botswana, the interest group systems are not highly developed and labor unions are weak. Nevertheless, in the opinion of Botswana expertJohnD. Rolmand the two Botswanan social scientists Patrick P. Molutsi and Gloria Somolekae (1996, 58), "Botswana is developing toward the democratic corporatism'so evident in Western Europe .... Groups organize on a bottom up basis and work with gove=ent officials to formulate a comprehensive policy regarding a particular sector of society or the economy." This deSCription also fits-in fact somewhat more strongly-the interest group system of Papua New Guinea. The other small Co=onwealth democracies-the Caribbean countries and Malta-have remained mainly pluralist, although Barbados has developed corporatist practices to some extent in recent years, as noted in Chapter 3. The ruling
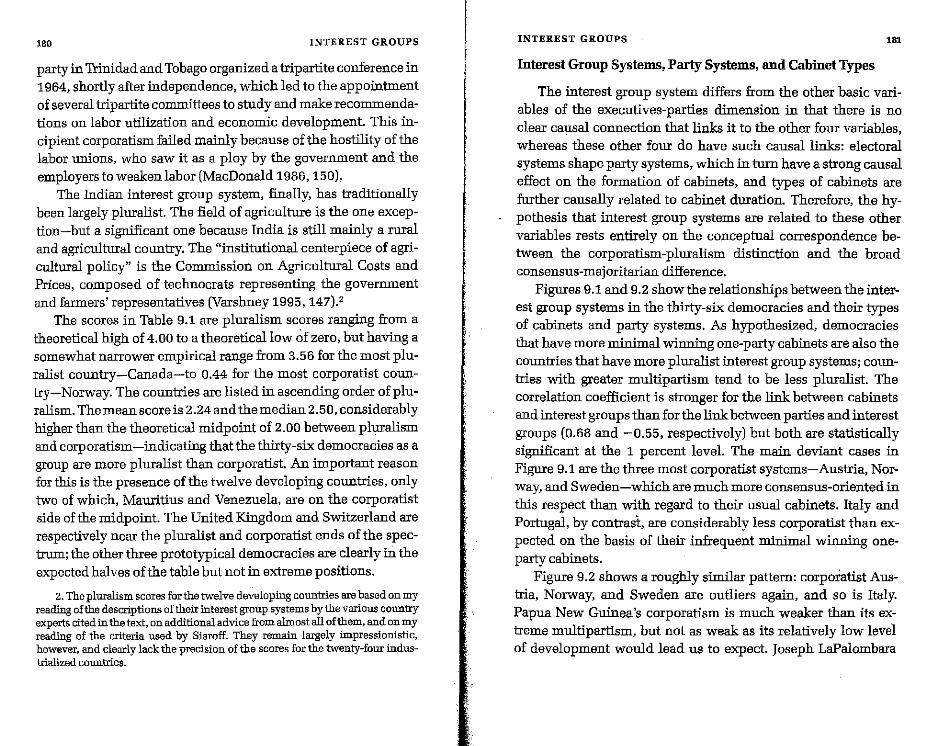
180 INTEREST GROUPS
party in Trinidad and Tobago organized a tripartite conference in 1964, shortly after independence, which led to the appointment of several tripartite committees to study and make reco=endations on labor utilization and economic development. This incipient corporatism failed mainly because of the hostility of the labor unions, who saw it as a ploy by the gove=ent and the employers to weaken labor (MacDonald 1986,150).
The Indian interest group system, finally, has traditionally been largely pluralist. The field of agriculture is the one exception-but a significant one because India is still mainly a rural and agricultural country. The "institutional centerpiece of agricultural policy" is the Commission on Agricultural Costs and Prices, composed of technocrats representing the gove=ent and farmers' representatives (Varshney 1995, 147).'
The scores in Table 9.1 are pluralism scores ranging from a theoretical high of 4.00 to a theoretical low of zero, but having a somewhat narrower empirical range from 3.56 for the most pluralist country-Canada-to 0.44 for the most corporatist country-Norway. The countries are listed in ascending order ofpluralism. The mean score is 2.24 and the median 2.50, considerably higher than the theoretical midpoint of 2.00 between pluralism and corporatism-indicating that the thirty-six democracies as a group are more pluralist than corporatist. An important reason for this is the presence of the twelve developing countries, only two of which, Mauritius and Venezuela, are on the corporatist side of the midpoint. The United Kingdom and Switzerland are respectively near the pluralist and corporatist ends of the spectrum; the other three prototypical democracies are clearly in the expected halves of the table but not in extreme positions.
2. The pluralism scores for the twelve developing countries are based on my reading of the descriptions of their interest group systems by the various country experts cited in the text, on additional advice from almost all of them, and on my reading of the criteria used by Siaroff. They remain largely impressionistic, however, and clearly lack the precision of the scores for the twenty-foUT industrialized countries.
INTEREST GROUPS 181
Interest Group Systems, Party Systems, and Cabinet Types
The interest group system differs from the other basic variables of the executives-parties dimension in that there is no clear causal connection that links it to the other four variables, whereas these other four do have such causal links: electoral systems shape party systems, which in turn have a strong causal effect on the formation of cabinets, and types of cabinets are further causally related to cabinet duration. Therefore, the hypothesis that interest group systems are related to these other variables rests entirely on the conceptual correspondence between the corporatism-pluralism distinction and the broad consensus-majoritarian difference.
Figures 9.1 and 9.2 show the relationships between the interest group systems in the thirty-six democracies and their types of cabinets and party systems. As hypothesized, democracies that have more minimal winning one-party cabinets are also the countries that have more pluralist interest group systems; countries with greater multipartism tend to be less pluralist. The correlation coefficient is stronger for the link between cabinets and interest groups than for the link between parties and interest groups (0.68 and -0.55, respectively) but both are statistically significant at the 1 percent leveL The main deviant cases in Figure 9.1 are the three most corporatist systems-Austria, Norway, and Sweden-which are much more consensus-oriented in this respect than with regard to their usual cabinets. Italy and Portugal, by contrast, are considerably less corporatist than expected on the basis of their infrequent minimal winning oneparty cabinets.
Figure 9.2 shows a roughly similar pattern: corporatist Austria, Norway, and Sweden are outliers again, and so is Italy. Papua New Guinea's corporatism is much weaker than its extreme multipartism, but not as weak as its relatively low level of development would lead us to expect. Joseph LaPalombara
182 INTEREST GROUPS INTEREST GROUPS 183
4 4 TRI
• G'lE • CAN BAH \GRE ~AN
• JAM JAM~ • +US. SPA US UK. BAH .UK
+ TRI MAL + ITA POR SPA MAL POR + ITA
3 • IRE 3· NZ + + • NZ +FRA • IRE .FRA
E BAR E BAR AUL en • en. COL =i • COL AUL • BOT =;j BOT • • ... CR lIoo CR .2 • INC .2 • .IND a.. a. ICE C. PNG+ ICE c. PNG S 2 g 2 (; +VEN 5 ·VEN
1;) MAU CD MAU G) • CD·
~ GER LUX i LUX E FIN • • 'E GER·· BEL FIN - • NET + +JPN - • • •
+ (SR • BEL JPN ISR. +NET + + + ·SWI
SWI DEN DEN
AUT • AUT. SWE
SWE +NOR :: NOR
o 0 o 20 40 60 80 100 2 3 4 5 6
Percent Minimal Winning, One·Party Cabinets Effective Number of Parliamentary Parties
Fig. 9.1 The relationship between type of cabinet and interest group pluralism in thirty·sDC'democracies, 1945-96
(1987, 213, 220) offers an intriguing explanation for Italy's unusual position. He describes Italy, before the reforms of 1994, as a partitocrazia with broad participation of all parties in policymaking and a strong inclination to seek consensus: the party leaders had "a deep psychological aversion to divisive confrontations." The consensus produced by partitocrazia was so strong, in LaPalombara's opinion, that there was simply no need for any farther consensus to be produced by corporatism. This
Fig.9.2 The relationship between the effective number of parliamentary parties and interest group pluralism in thirty-six democracies, 1945-9(i
view is certainly plausible: broad political coalitions and interest group corporatism are both methods of achieving consensus and, in principle, can be seen as alternative methods. Strong interparty cooperation can therefore compensate for weaknesses in interest group coordination. This appears to have been the case in Italy, but it is clearly not a general pattern in most democracies; if it were, we would find a negative relationship
:~,. ~
184 INTEREST GROUPS
between multipartism and broad coalition cabinets on one hand and corporatism on the other-instead of the strong positive relationships that are shown in Figures 9.1 and 9.2.
The type of interest group system is also correlated with the electoral system and, though less strongly, with executive dominance. The correlations among all five variables involved in the executives-parties dimension are presented in Chapter 14. First, however, I turn in the next four chapters to a discussion of the variables belonging to the federal-unitary dimension.
CHAPTER 10
Division of Power The Federal-Unitary and Centralized-Decentralized Contrasts
The prime characteristic of the majoritarian model of democracy, as I have emphasized in previous chapters, is concentration of power in the hands of the majority. The consensus model is characterized by non-concentration of power, which can take the two basic forms of sharing of power and division of power. These two forms provide the theoretical underpinnings of the two dimensions of the majoritarian-consensus contrast. The crucial distinction is whether in consensus democracy power is dispersed to political actors operating together within the same political institutions or dispersed to separate political institutions (see Chapter 1). In the previous five chapters I discussed the five variables of the executives-parties (joint-power) dimension; in this chapter I deal with the first variable of the federal-unitary (divided-power) dimension: federalism and decentralization versus unitary and centralized government. It is appropriate to give this first-place honor to the subject of federalism because it can be considered the most typical and drastic method of dividing power: it divides power between entire levels of government. In fact, as a term in political science, "division of power" is normally used as a synonym for federalism.
In all democracies, power is necessarily divided to some extent between central and noncentral governments, but it is a highly one-sided division in majoritarian democracy. To main-
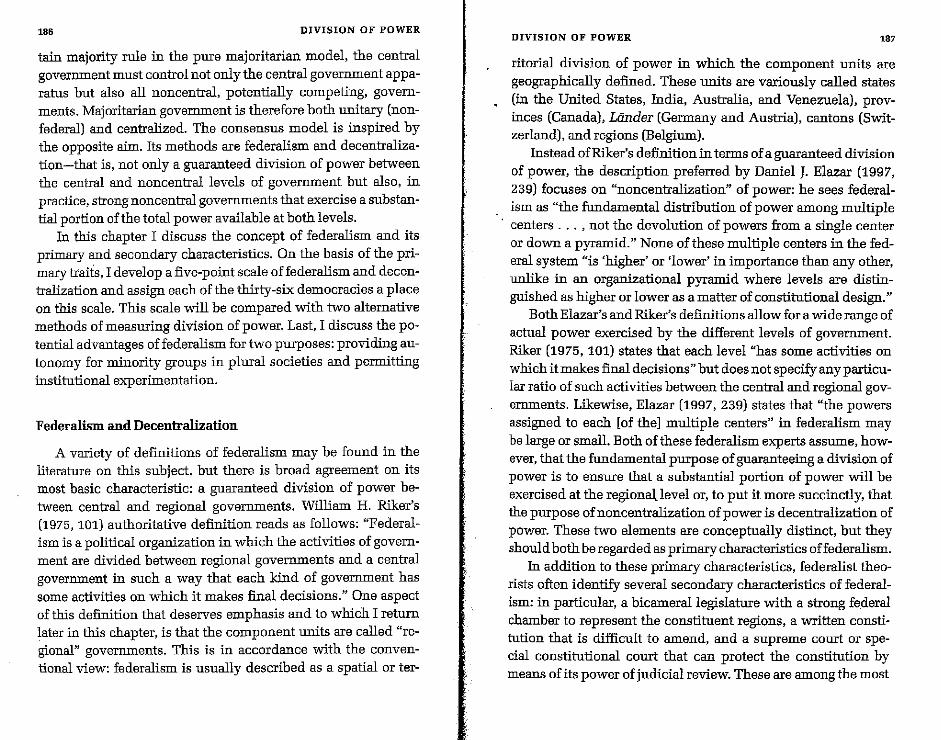
186 DIVISION OF POWER
tain majority rule in the pure majoritarian model, the central government must control not only the central government apparatus but also all noncentral, potentially competing, governments. Majoritarian government is therefore both unitary (nonfederal) and centralized. The consensus model is inspired by the opposite aim. Its methods are federalism and decentralization-that is, not only a guaranteed division of power between the central and noncentral levels of government but also, in practice, strong noncentral governments that exercise a substantial portion of the total power available at both levels.
In this chapter I discuss the concept of federalism and its primary and secondary characteristics. On the basis of the primary traits, I develop a five-point scale offederalism and decentralization and assign each of the thirty-six democracies a place on this scale. This scale will be compared with two alternative methods of measuring division of power. Last, I discuss the potential advantages offederalism for two purposes: providing autonomy for minority groups in plural societies and permitting institutional experimentation.
Federalism and Decentralization
A variety of definitions of federalism may be found in the literature on this subject, but there is broad agreement on its most basic characteristic: a guaranteed division of power between central and regional governments. William H. Riker's (1975,101) authoritative definition reads as follows: "Federalism is a political organization in which the activities of government are divided between regional governments and a central government in such a way that each kind of government has some activities on which it makes final decisions." One aspect of this definition that deserves emphasis and to which I return later in this chapter, is that the component units are called "regional" governments. This is in accordance with the conventional view: federalism is usually described as a spatial or ter-
DIVISION OF POWER 187
ritorial division of power in which the component units are geographically defined. These units are variously called states (in the United States, India, Australia, and Venezuela), provinces (Canada), Lander (Germany and Austria), cantons (Switzerland), and regions (Belgium).
Instead of Riker's definition in terms of a guaranteed division of power, the description preferred by Daniel J. £lazar (1997, 239) focuses on "noncentralization" of power: he sees federalism as "the fundamental distribution of power among multiple centers ... , not the devolution of powers from a single center or down a pyramid." None of these multiple centers in the federal system "is 'higher' or 'lower' in importance than any other, unlike in an organizational pyramid where levels are distinguished as higher or lower as a matter of constitutional design."
Both Elazar's and Riker's definitions allow for a wide range of actual power exercised by the different levels of government. Riker (1975, 101) states that each level "has some activities on which it makes final decisions" but does not specify any particular ratio of such activities between the central and regional governments. Likewise, Elazar (1997, 239) states that "the powers assigned to each [of thel multiple centers" in federalism may be large or small. Both of these federalism experts assume, however, that the fundamental purpose of guaranteeing a division of power is to ensure that a substantial portion of power will be exercised at the regionaJ.level or, to put it more succinct! y, that the purpose of non centralization of power is decentralization of power. These two elements are conceptually distinct, but they should both be regarded as primary characteristics of federalism.
In addition to these primary characteristics, federalist theorists often identify several secondary characteristics offederalism: in particular, a bicameral legislature with a strong federal chamber to represent the constituent regions, a written constitution that is difficult to amend, and a supreme court or special constitutional court that can protect the constitution by means of its power of judicial review. These are among the most
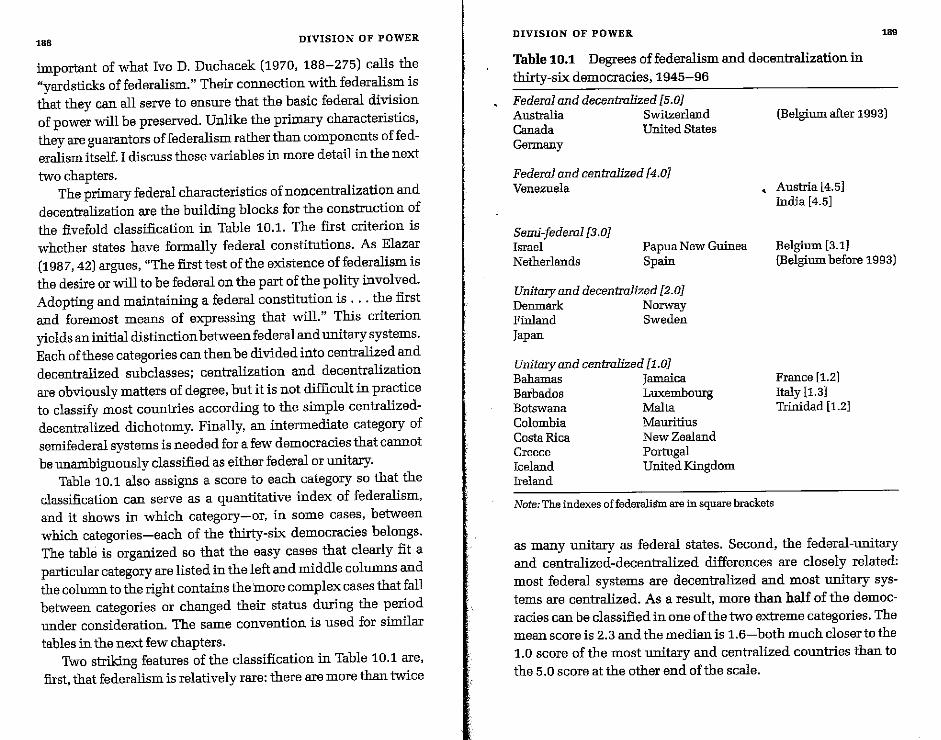
188 DIVISION OF POWER
important of what Iva D. Duchacek (1970, 188-275) calls the "yardsticks of federalism." Their connection with federalism is that they can all serve to ensure that the basic federal division of power will be preserved. Unlike the primary characteristics, they are guarantors of federalism rather than components of federalism itself. I discuss these variables in more detail in the next
two chapters. The primary federal characteristics of noncentralization and
decentralization are the building blocks for the construction of the fivefold classification in Table 10.1. The first criterion is whether states have formally federal constitutions. As Elazar (1987,42) argues, "The first test of the existence offederalism is the desire or will to be federal on the part of the polity involved. Adopting and maintaining a federal constitution is ... the first and foremost means of expressing that will." This criterion yields an initial distinction between federal and unitary systems. Each of these categories can then be divided into centralized and decentralized subclasses; centralization and decentralization are obviously matters of degree, but it is not difficult in practice to classify most countries according to the simple centralizeddecentralized dichotomy. Finally, an intermediate category of semifederal systems is needed for a few democracies that cannot be unambiguously classified as either federal or unitary.
Table 10.1 also assigns a score to each category so that the classification can serve as a quantitative index of federalism, and it shows in which category-or, in some cases, between which categories-each of the thirty-six democracies belongs. The table is organized so that the easy cases that clearly fit a particular category are listed in the left and middle columns and the column to the right contains the more complex cases that fall between categories or changed their status during the period under consideration. The same convention is used for similar tables in the next few chapters.
Two striking features of the classification in Table 10.1 are, first, that federalism is relatively rare: there are more than twice
DIVISION OF POWER 189
Table 10.1 Degrees of federalism and decentralization in thirty-six democracies, 1945-96
Federal and decentralized [5.0] Australia Switzerland Canada United States Germany
Federal and centralized [4.0] Venezuela
Semi-federal [3.0] Israel Netherlands
Papua New Guinea Spain
Unitary and decentralized [2.0] Denmark Norway Finland Sweden Japan
Unitary and centralized [1.0] Bahamas Jamaica Barbados Luxembourg Botswana Malta Colombia Mauritius Costa Rica New Zealand Greece Portugal Iceland United Kingdom Ireland
(Belgiwn after 1993)
• Austria [4.5] India [4.5]
Belgiwn [3.1] (Belgiwn before 1993)
France [1.2) Italy [1.3] Trinidad [1.2]
Note: The indexes of federalim are in square brackets
as many unitary as federal states. Second, the federal-unitary and centralized-decentralized differences are closely related: most federal systems are decentralized and most unitary systems are centralized. As a result, more than half of the democracies can be classified in one of the two extreme categories. The mean score is 2.3 and the median is 1.6-both much closer to the 1.0 score of the most unitary and centralized countries than to the 5.0 score at the other end of the scale.
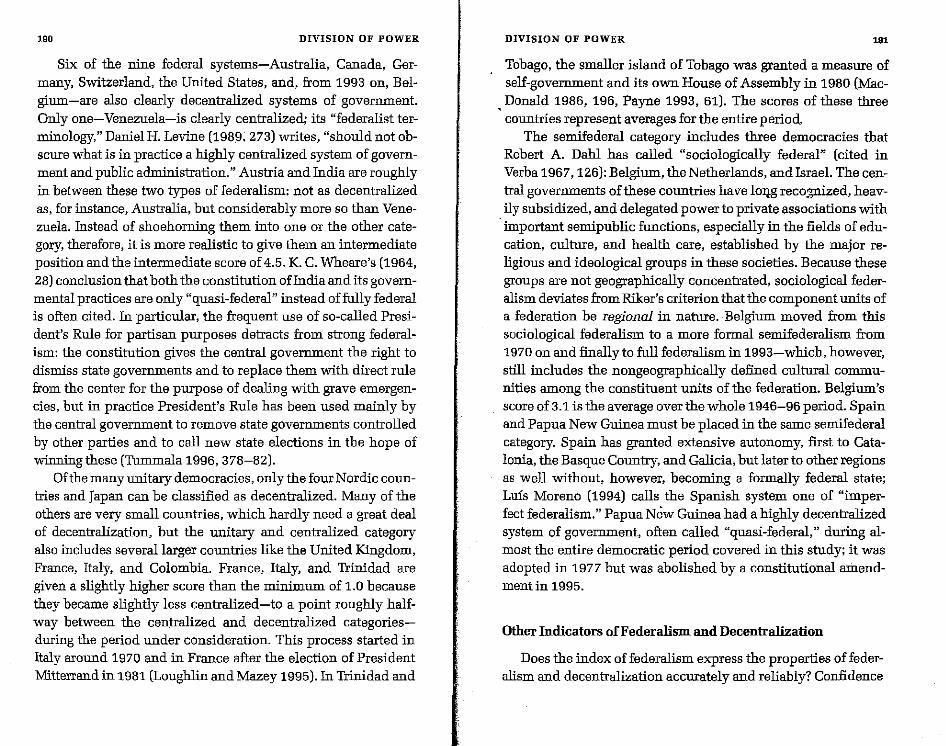
190 DIVISION OF POWER
Six of the nine federal systems-Australia, Canada, Germany, Switzerland, the United States, and, from 1993 on, Belgium-are also clearly decentralized systems of government. Only one-Venezuela-is clearly centralized; its "federalist terminology," Daniel H. Levine (1989, 273) writes, "should not obscure what is in practice a highly centralized system of government and public administration." Austria and India are roughly in between these two types of federalism: not as decentralized as, for instance, Australia, but considerably more so than Venezuela. Instead of shoehorning them into one or the other category, therefore, it is more realistic to give them an intermediate position and the intermediate score of 4.5. K. C. Wheare's (1964, 28) conclusion that both the constitution of India and its governmental practices are only "quasi-federal" instead of fully federal is often cited. In particular, the frequent use of so-called President's Rule for partisan purposes detracts from strong federalism: the constitution gives the central government the right to dismiss state governments and to replace them with direct rule from the center for the purpose of dealing with grave emergencies, but in practice President's Rule has been used mainly by the central government to remove state governments controlled by other parties and to call new state elections in the hope of winning these (Tummala 1996, 378-82).
Of the many unitary democracies, only the four Nordic countries and Japan can be classified as decentralized. Many of the others are very small countries, which hardly need a great deal of decentralization, but the unitary and centralized category also includes several larger countries like the United Kingdom, France, Italy, and Colombia. France, Italy, and Trinidad are given a slightly higher score than the minimum of 1.0 because they became slightly less centralized-to a point roughly halfway between the centralized and decentralized categoriesduring the period under consideration. This process started in Italy around 1970 and in France after the election of President Mitterrand in 1981 (Loughlin and Mazey 1995). In Trinidad and
DIVISION OF POWER 191
Tobago, the smaller island of Tobago was granted a measure of self-government and its own House of Assembly in 1980 (Mac-
• Donald 1986, 196, Payne 1993, 61). The scores of these three countries represent averages for the entire period.
The semifederal category includes three democracies that Robert A. Dahl has called "sociologically federal" (cited in Verba 1967, 126): Belgium, the Netherlands, and Israel. The central governments of these countries have 10Jlg recoplized, heavily subsidized, and delegated power to private associations with
. important semipublic functions, especially in the fields of education, culture, and health care, established by the major religious and ideological groups in these societies. Because these groups are not geographically concentrated, sociological federalism deviates from Riker's criterion that the component units of a federation be regional in nature. Belgium moved from this sociological federalism to a more formal semifederalism from 1970 on and finally to full federalism in 1993-which, however, still includes the nongeographically defined cultural co=unities among the constituent units of the federation. Belgium's score of 3.1 is the average over the whole 1946-96 period. Spain and Papua New Guinea must be placed in the same semifederal category. Spain has granted extensive autonomy, first to Catalonia, the Basque Country, and Galicia, but later to other regions as well without, however, becoming a formally federal state; Luis Moreno (1994) calls the Spanish system one of "imperfect federalism." Papua New Guinea had a highly decentralized system of government, often called "quasi-federal," during almost the entire democratic period covered in this study; it was adopted in 1977 but was abolished by a constitutional amendment in 1995.
Other Indicators ofFederaIism and Decentralization
Does the index of federalism express the properties of federalism and decentralization accurately and reliably? Confidence
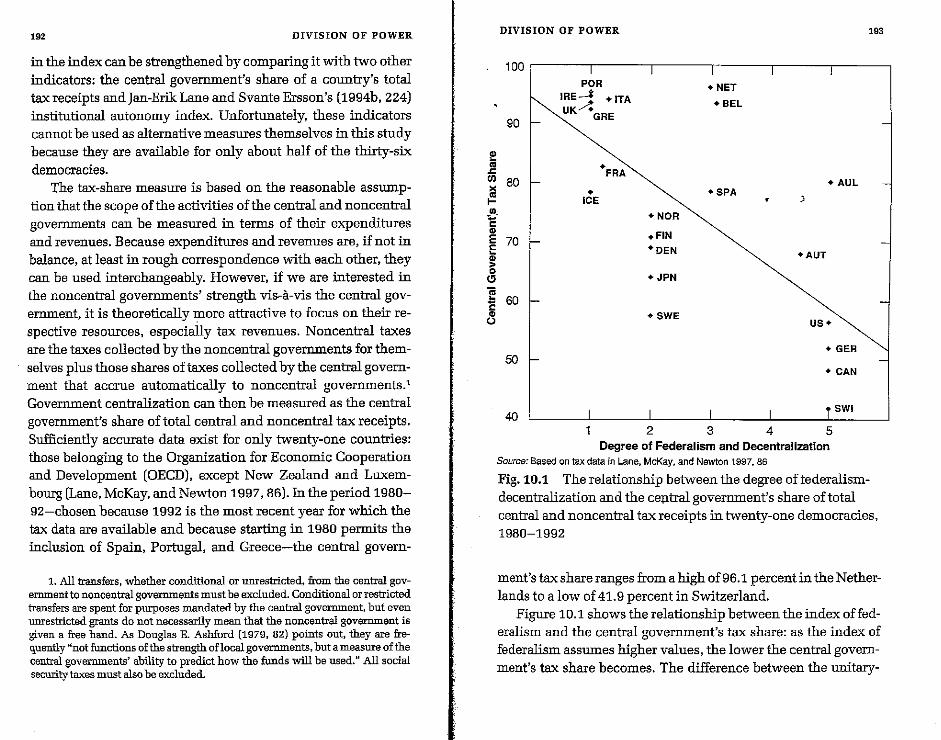
192 DIVISION OF POWER
in the index can be strengthened by comparing it with two other indicators: the central government's share of a country's total tax receipts and Jan-Erik Lane and Svante Ersson's (1994b, 224) institutional autonomy index. Unfortunately, these indicators cannot be used as alternative measures themselves in this study because they are available for only about half of the thirty-six democracies.
The tax-share measure is based on the reasonable assumption that the scope of the activities of the central and noncentral gove=ents can be measured in terms of their expenditures and revenues. Because expenditures and revenues are, if not in balance, at least in rough correspondence with each other, they can be used interchangeably. However, if we are interested in the noncentral governments' strength vis--a-vis the central gove=ent, it is theoretically more attractive to focus on their respective resources, especially tax revenues. Noncentral taxes are the taxes collected by the noncentral governments for themselves plus those shares of taxes collected by the central government that accrue automatically to noncentral governments.' Government centrallzation can then be measured as the central government's share of total central and noncentral tax receipts. Sufficiently accurate data exist for only twenty-one countries: those belonging to the Organization for Economic Cooperation and Development (OECD), except New Zealand and Luxembourg (Lane, McKay, and Newton 1997, 86). In the period 1980-92-chosen because 1992 is the most recent year for which the tax data are available and because starting in 1980 permits the inclusion of Spain, Portugal, and Greece-the central govern-
1. All transfers, whether conditional or unrestricted, from the central government to noncentral governments must be excluded. Conditional or restricted transfers are spent for purposes mandated by the central government, but even umestricted grants do not necessarily mean that the noncentral government is given a free hand. As Douglas E. Ashford (1979, 82) pOints out, they are frequently "not functions of the strength afloea! governments, but a measure of the central governments' ability to predict how the funds will be used." All social security taxes must also be excluded.
j
DIVISION OF POWER 193
100" ------,------,------,------,------,-----,
90
POR IRE-* UK/. +ITA
GRE
-
+NET
+BEL
CJ) 80
~ FRA
~ + AUL
• ICE + SPA
)
j70 ~
+NOR
.FIN +DEN
+ JPN ~ +AUT
Cl
E 60
S • SWE US-
• GER 50
+ CAN
40 ! SWI
2 3 4 5 Degree of Federalism and Decentralization
Source: Based on tax data in Lane, McKay, and Newton 1997, 86
Fig.10.1 The relationship between the degree offederalismdecentralization and the cejltral government's share of total central and noncentral tax receipts in twenty-one democracies, 1980-1992
ment's tax share ranges from a high of 96.1 percent in the N etherlands to a low of 41. 9 percent in Switzerland.
Figure 10.1 shows the relationship between the index offederalism and the central government's tax share: as the index of federalism assumes higher values, the lower the central government's tax share becomes. The difference between the unitary-
194 DIVISION OF POWER
centralized countries, with a score of or close to 1.0 on the index of federalism, and the federal-decentralized countries with scores of 5.0, is especially striking. The correlation coefficient is -0.66 (which is significant at the 1 percent level). For three deviant cases, the scattergram suggests that the index offederalism overestimates or underestimates the degree of centralization: Australia is the only federal and decentralized federal system that does not have a low central government tax share, and Japan and Sweden are already classified as decentralized among the unitary countries but appear to be even more decentralized according to their central governments' tax shares. Remember, however, that the index of federalism explicitly aims at including the federal-unitary distinction, whereas the tax-share indicator solely measures the degree of centralization. Belgium and the Netherlands are also outliers; here the explanation is that the tax-share measure fails to take the element of sociological federalism into consideration.
The Lane-Ersson institutional autonomy index does take both federalism and sociological federalism into account-the authors call sociological federalism "functional autonomy" -as well as territorial autonomy for particular regions and the degree of "regional and local government discretion." Cumulatively, the scores on these four variables, all based on the authors' impressionistic but plausible judgments, yield a six-point scale with a high of five points in the case of Switzerland and a low of zero points for Greece and Ireland.2 Lane and Ersson propose their index in a comparative study of West European democracies and supply specific figures for only sixteen large and medium-size European countries-fewer than half of the countries covered in this book. For these sixteen democracies,
2. The scores for all sixteen countries are as follows: 5 for Switzerland, 4 for Belgium and Germany, 3 for Austria, Denmark, and the Netherlands, 2 for Finland, Norway, Sweden, and the United Kingdom, 1 for France, Italy, Portugal. and Spain, and a for Greece and Ireland. Of these sixteen scores, only the rather low Spanish and rather high British scores appear questionable.
DIVISION OF POWER 195
however, the Lane-Ersson index correlates strongly with the index of federalism: the correlation coefficient is a statistically highly significant 0.82.
The comparisons with the above two alternative measures provide strong validation for the index of federalism. In the next several chapters I show that this index is also strongly correlated with the other variables of the second dimensiono
. Federalism and Ethnic Autonomy
Federalism tends to be used in two kinds of countries: relatively large countries and plural societies. The largest countries in terms of population included in this study, India and the United States, are both federations; the least populous federation is Switzerland, which is approximately in the middle of our thirty-six democracies ranked by population. Four of the nine federal systems are plural societies: Belgium, Canada, India, and Switzerland. These are also the largest of the nine plural societies listed in Table 4.3. In these plural societies, federalism performs the special function of giving autonomy to ethnic minorities.
To analyze this function of federalism it is useful to distinguish between congruent and incongruent federalism, as suggested by Charles D. Tarlton (1965, 868). Congruent federations are composed of territorial units with a social and cultural character that is similar in each of the units and in the federation as a whole. In a perfectly congruent federal system, the component units are "miniature reflections of the important aspects of the whole federal system." Conversely, incongruent federations have units with social and cultural compositions that differ from one another and from the country as a whole.3
3. Tarlton uses the terms "symmetry" and "asymmetry" instead of "congruence" and "incongruence." Because the former pair of terms is most often used to describe different distributions of power-for instance, between the two chambers of bicameral legislatures-it is less confusing to use the latter pair of
1'6 DIVISION OF POWER
Another way of expressing this difference is to compare the political boundaries between the component units of the federation and the social boundaries among groups like ethnic minorities. In incongruent federations these boundaries tend to coincide, but they tend to cut across each other in congruent federal systems.
If the political boundaries are drawn so as to approximate the social boundaries, the heterogeneity in the federation as a whole is transformed into a high degree of homogeneity at the level of the component units. In other words, incongruent federalism can make a plural society less plural by creating relatively homogeneous smaller areas. This is the pattern in all four of the federal systems that are also plural societies, although their political and ethnic boundaries generally do not coincide perfectly. In Switzerland, there is considerably less linguistic diversity in the cantons than at the national level. The Swiss federation has four official languages, but twenty-two of the twenty-six cantons (and half-cantons) are officially unilingual; only three-Bern, Fribourg, and Valais-are bilingual, and just one-Graubiindenhas three official languages (McRae 1983, 172-79). In Canada, the Francophone minority is concentrated mainly in Quebec, and the Quebec government has served as the principal mouthpiece for the interests of the French-speaking community in Canada, but Ontario and New Brunswick also contain relatively large numbers of French-speakers.
The British colonial rulers of India drew the administrative divisions of the country without much regard for linguistic differences; the imposition of federalism on these divisions led to a mainly congruent type of federalism in the early years of independent India. However, a complete transformation to an incongruent federal system based on linguistic divisions took place in
texms to characterize different compositions of two armore entities. Congruence and incongruence in federalism have a meaning that is analogous to congruence and incongruence in bicameralism (see Chapter 11).
DIVISION OF POWER 197
the 1950s. After the state of Madras was divided into the separate Tamil-speaking and Telugu-speaking states of Tamil Nadu and Andhra Pradesh in 1953, the States Reorganization Commission embraced the linguistic principle and recommended drastic revisions in state boundaries along linguistic lines in 1955. These were quickly implemented in 1956, and several additional linguistic states were created in later years (Brass 1990, 146-56). Because of India's extmme lingUistic diversity, this incongruent linguistic federalism has not managed to accommodate all of the smaller minorities, but on the whole it has, in Indian political scientist Rajni Kothari's (1970, 115) words, succeeded in making language "a cementing and integrating influence" instead of a "force for division."
Finally, the new Belgian federalism is the result of a determined effort to set up a federation that is as incongruent as possible. The three geographically defined regions are already highly incongruent: the two largest, Flanders and Wallonia, are unilingual, and only Brussels is bilingual. In order to perfect this linguistic incongruence, three nongeographically defined cultural communities are superimposed on the regions; here the political and linguistic boundaries coincide completely-making the federal system a purely incongruent one (see Chapter 3).
Federalism and Institutional Experimentation
One aspect of the autonomy of the constituent units of federations is that they have their own constitutions, which they can amend freely within certain limits set by the federal constitution. In theory, this gives them the opportunity to experiment with different forms of government. Such experimentation, if successful, can be beneficial both for the other members of the federation and for the central government. In practice, however, we find almost complete isomorphism both between the central
198 DIVISION OF POWER
and component units' governmental forms and between those of the component units in each country ..
With regard to the choice of presidential or parliamentary systems, for instance, the United States is solidly presidential, with governors serving as "presidents" at the state level. However, there has been more experimentation with the electoral system in the United States than in other federations. The principal example at the state level is illinois, which used a semiproportional system-cumulative voting-for electing its lower house from 1870 to 1980. Moreover, as was mentioned in Chapter 8, a few states have used the majority-runoff instead of the plurality rule for electing their members of the U.S. House of Representatives. More far-reaching experimentation would be encouraged under the Voters' Choice Act, introduced by Representative Cynthia McKinney in 1997 (but not acted on by the end of 1998): it would allow states to use multimember instead of single-member districts for House elections if they applied PR or semiproportional systems in these districts.
The Australian House of Representatives and the lower houses of the Australian states are all elected by the alternative vote, except one: Tasmania uses the STV form of PRo PR is the norm both at the national and cantonal levels in Switzerland, but a few, mainly small, cantons use majority methods. The other federations are even more isomorphic with regard to their electoral systems: Canada and India are solidly wedded to the plurality rule, and Austria, Belgium, Germany, and Venezuela to PRo The same isomorphism is apparent with regard to the choice of presidential and parliamentary systems, as already noted for the American case. The only slight exceptions can be found in Germany and Switzerland. All of the German Lander have parliamentary systems, but in Bavaria the prime minister cannot be dismissed by a vote of no confidence. In Switzerland, th" cantons deviate in one respect from the hybrid parliamentarypresidential system at the federal level-their collegial execu-
DIVISION OF POWER 199
tives are popularly elected-but they are similar to each other in this respect. It is symptomatic that the drafters of the constitntion of the new canton of Jura, which formally came into being in 1979, discussed the British and German examples of parliamentary systems but that in the end they stnck to "accepted Swiss norms" (Tschaeni 1982, 116).
)
CHAPTER 11
Parliaments and Congresses Concentration Versus Division of Legislative Power
The second component of the federal-unitary dimension is the distribution-concentration versus division-of power in the legislature. The pure majoritarian model calls for the concentration of legislative power in a single chamber; the pure consensus model is characterized by a bicamerallegislature in which power is divided equally between two differently constituted chambers. In practice, we find a variety of intermediate arrangements. In Chapters 2 and 3 we saw that the New Zealand parliament (after 1950) and the Swiss parliament are, in this respect, perfect prototypes of majoritarian and consensus democracy, respectively, but that the other three main examples deviate from the pure models to some extent. The British parliament is bicameral, but because the House of Lords has little power, it can be described as asymmetrically bicameral. The same description fits the Barbadian legislature because its appoioted Senate has delaying but no veto power. The prefederal bicameral Belgian parliament was characterized by a balance of power between the two chambers, but these chambers hardly differed io composition; in the new federal legislature, elected for the first time in 1995, the Senate is still not very differently composed from the Chamber of Representatives, and it has also lost some of its former powers.
The first topic of this chapter is the simple dichotomous
PARLIAMENTS AND CONGRESSES 201
classification of parliaments as bicameral or unicameral. Next, I discuss the differences between the two chambers of bicameral legislatures, especially with regard to their respective powers and composition. On the basis of these two key differences, I develop a quantitative index of bicameralism. Last I explore the relationship between the strength of bicameralism, as measured by this index, and the degree of federalism and decentralization discussed in the previous chapter. )
Two additional introductory co=ents are in order. First, legislative chambers have a variety of proper names (among them House ofCo=ons, House of Representatives, Chamber of Deputies, Bundestag, and Senate), and in order to avoid confusion the followiog generic terms will be used in the discussion of bicameral parliaments: first chamber (or lower house) and second chamber (or upper house). The first chamber is always the more important one or, in federal systems, the house that is elected on the basis of population.' Second, the bicameral legislature as a whole is usually called Congress in presidential systems-but not, of course, in France, where the term "parliament" originated-and Parliament in parliamentary systems of gove=ent. However, the term "parliament" is also often used generically as a synonym for "legislature," and I shall follow this conventional usage here.
Unicameralism and Bicameralism
A dichotomous classification of parliaments as unicameral or bicameral appears to be simple and straightforward, but two legislatures do not fit either category: those of Norway and, until 1991, Iceland. Norwegian legislators are elected as one body, but after the election they divide themselves into two chambers by
1. The only potential difficulty of this terminology is that the first chamber of the Dutch parliament is formally called the Second Chamber, and the second. chamber is called the First Chamber. Similarly, the first and second chambers of the pre-1970 bicameral legislature of Sweden were called the Second and First Chamber, respectively.
202 PARLIAMENTS AND CONGRESSES
choosing one-fourth of their members to form a second chamber. The two chambers, however, have joint legislative committees, and any disagreements between the chambers are resolved by a plenary session of all members of the legislature. Roughly the same description fits the Icelandic case as well, except that the second chamber in Iceland was formed from one-third of the elected legislators. These legislatures therefore have some features of unicameralism and some of bicameralism; the resolution of disagreements by means of a joint session does not necessarily point to unicameralism because it is not an unco=on method for unambiguously bicameral legislatures either. If one were forced to make a purely dichotomous choice, these legislatures should probably be regarded as somewhat closer to unicameralism than to bicameralism. But there is no need for such a difficult choice, and the classification of all legislatures presented later in this chapter simply places these two cases in a special one-and-a-half chambers category.
In their broad comparative study of bicameralism, George Tsebelis and Jeannette Money (1997, 1) report that about onethird of the countries in the world have bicameral and about twothirds have unicameral legislatures. The ratio for our thirty-six democracies is quite different: bicameralism is much more common than unicameralism. In 1996, only thirteen of the thirty-six democracies, slightly more than one-third, had unicameral parliaments. Four countries shifted to unicameralism during the period under consideration: New Zealand in 1950, Denmark in 1953, Sweden in 1970, and Iceland in 1991 (Longley and Olson 1991). At the beginning of the period in which each of the thirtysix democracies is covered, only nine-exactly one-fourth-had unicameral legislatures: Costa Rica, Finland, Greece, Israel, Luxembourg, Malta, Mauritius, Papua New Guinea, and Portugal. There were no shifts in the opposite direction, from a unicameral to a bicameral parliament.
The thirteen countries with unicameral parliaments listed in the previous paragraph tend to be the smaller countries; Greece,
T PARLIAMENTS AND CONGRESSES 203
with a population of slightly more than ten million, is the largest. An even more striking characteristic is that none of them is a federal system. To put it slightly differently, the nine formally federal systems among the thirty-six democracies all have bicameral legislatures, whereas, as of 1996, the twenty-seven formally unitary systems (including those labeled semifederal in the previous chapter) are evenly divided between unicameralism and bicameralism: thirteen have unicameral legislatures; thirteen have bicameral legislatures; and Norwa'y has a one-anda-half chamber system. This is already a strong indicator of the relationship between cameral structure and the federal-unitary distinction. This relationship is analyzed in more detail at the end of this chapter, after the discussion of the different forms that bicameralism can assume.
Varieties of Bicameralism
The two chambers of bicameral legislatures tend to differ in several ways. Originally, the most important function of second chambers, or "upper" houses, elected on the basis of a limited franchise, was to serve as a conservative brake on the more democratically elected "lower" houses. With the advent of universal franchise for all elections in our set of fully democratic regimes, this function has become obsolete. However, the British House of Lords and the House of Chiefs in Botswana are borderline cases: membership in the House of Lords is still based mainly on hereditary principles, and in Botswana, although the chiefs are now subject to formal election, heredity still prevails in practice. As a result, these two bodies are firmly conservative in outlook; the House of Lords, for instance, has a permanent Conservative majority. Of the remaining six differences between first and second chambers, three are especially important in the sense that they determine whether bicameralism is a significant institution. Let us first take a brief look at the three less important differences:
204 PARLIAMENTS AND CONGRESSES
First, second chambers tend to be smaller than first chambers. In fact, this would be an absolute rule for the bicameral legislatures in our set of democracies if it were not for the British House of Lords, which has approximately 1,200 members, almost twice as many as the 659 members of the House of Commons following the 1997 election. However, the exception is more apparent than real: if we exclude the members who rarely attend, especially many of the hereditary peers, the number is reduced to about 300. Among all of the other second chambers that are smaller than the first chambers, there is stin a great variety in how much smaller they are. A few second chambers are relatively close to the sizes of the respective first chambers: for instance, in Trinidad the respective numbers are 31 and 36, and in Spain 257 and 350. At the other extreme, Germany has the world's largest democratic first chamber with 672 members after the 1994 election (to be reduced, according to a parliamentary vote in early 1998, to about 600 for the election in the year 2002) and one of the smaller second chambers consisting of just
69 members. Second, legislative terms of office tend to be longer in second
than in first chambers. The first chamber terms range from two to five years compared with a second chamber range of four to nine years (and, in Britain and Canada, respectively, life membership and membership until retirement). Switzerland is the only, relatively minor, exception: a few of its second-chamber members are elected for terms that are shorter than the four-year term of the first chamber. In all the other bicameral legislatures, the members of second chambers have terms of office that are either longer than or equal to those of the first-chamber members?
2. The U.S. House of Representatives is exceptional in that it has a short term of office of only two years. The Australian lower house and the New Zealand unicameral legislature are elected for three years. In Sweden, the term was fouryears until 1970, when both unicameralism and three-year terms were adopted, but four-year terms were restored from 1994 on. In all other countries, the members of first or only chambers may serve as long as four or five years, but in most parliamentary systems premature dissolutions may shorten these maximum terms.
PARLIAMENTS AND CONGRESSES 205
Third, a co=on feature of second chambers is their staggered election. One-half of the membership of the Australian and Japanese second chambers is renewed every three years. Onethird of the American and Indian second chambers is elected every second year, and one-third of the French second chamber is renewed every three years. Similarly, the members of the Austrian, German, and Swiss federal chambers are selected in a staggered manner but at irregular intervals .•
These three differences do affect how the'two chambers of the several legislatures operate. In particular, the smaller second chambers can conduct their business in a more informal and relaxed manner than the usually much larger first chambers. But, with one exception to be mentioned shortly, they do not affect the question of whether a country's bicameralism is a truly strong and meaningful institution.
Strong Versns Weak Bicameralism
Three features of bicameral parliaments determine the strength or weakness of bicameralism. The first important aspect is the formal constitutional powers that the two chambers have. The general pattern is that second chambers tend to be subordinate to first chambers. For instance, their negative votes on proposed legislation can frequently be overridden by the first chambers, and in most parliamentary systems the cabinet is responsible exclusively to the first chamber. In two countries, disagreement between the two chambers is settled by a joint session: India and Venezuela. Here the relative sizes of the two chambers, discussed in the previous section, do make a difference with regard to the strength of bicameralism. The Indian second chamber is almost half the size of the first, whereas the Venezuelan senate has less than one-fourth of the members of the lower house. The only examples of bicameral legislatures with formally equal powers in our set of democracies are the legislatures of Colombia, Italy, Switzerland, and the United States;
206 PARLIAMENTS AND CONGRESSES
three countries used to have formally equal chambers-Belgium, Denmark, and Sweden-but the Belgian Senate's power was severely reduced when it was elected in its new federal form in 1995, and Denmark and Sweden abolished their second chambers in 1953 and 1970, respectively.
Second, the actnal political importance of second chambers depends not only on their formal powers but also on their method of selection. All first chambers are directly elected by the voters, but the members of most second chambers are elected indirectly (usually by legislatures at levels below that of the national government, as in India, the Netherlands, and, until 1970, in Sweden) or, more frequently, appointed (like the senators in Canada and in the four Co=onwealth Caribbean countries, some of the Irish senators, and life peers in the British House of Lords). Second chambers that are not directly elected lack the democratic legitimacy, and hence the real political influence, that popular election confers. Conversely, the direct election of a second chamber may compensate to some extent for its limited power.
On the basis of the above two criteria-the relative formal powers of the two chambers and the democratic legitimacy of the second chambers-bicameral legislatures can be classified as either syrmnetrical or asymmetrical. Sy=etrical chambers are those with equal or only moderately unequal constitntional powers and democratic legitimacy. Asy=etrical chambers are highly unequal in these respects. The sy=etrical category includes the seven legislatures, noted above, that have or had chambers with formally equal powers. Three of these legislatures also have directly elected second chambers-Colombia, Italy, and the United States-and most of the members of the Swiss and Belgian second chambers are popularly elected. In addition, the chambers of four bicameral legislatures are not completely equal but can still be classified as sy=etrical according to the above definition: those in Australia, Germany, Japan, and the Netherlands. The entire Australian and Japanese
PARLIAMENTS AND CONGRESSES 207
parliaments are elected directly. The Dutch parliament belongs in this category in spite of the second chamber's indirect election by the provincial legislatures , because this chamber has an absolute veto power over all proposed legislation that cannot be overridden by the first chamber. The German second chamber does not owe its strength to either popular election or an absolute legislative veto but to the fact that it is a unique federal chamber, composed of representatives of the executives of the
• member states of the federation-usually miaisters in the mem-ber state cabinets. It can thus be described as "one of the strongest second chambers in the world" (Edinger 1986, 16). The power relationship between the two houses in the remaining bicameral parliaments is asy=etrical.
The third crucial difference between the two chambers of bicameral legislatures is that second chambers may be elected by different methods or designed so as to overrepresent certain minorities. If this is the case, the two chambers differ in their composition and may be called incongruent. The most striking examples are most of the second chambers that serve as federal chambers and that overrepresent the smaller component units of the federation. The greatest degree of overrepresentation occurs when there is equality of state or cantonal representation regardless of the states' or cantons' populations. Such parity can be found in the federal chambers of Switzerland, the United States, and Venezuela (two representatives per state or canton) and Australia (twelve from each state).' The German Bundesrat an.d the Canadian Senate are examples of federal chambers in which the component units are not equally represented but in which the smaller units are overrepresented and the larger ones underrepresented. The Austrian Bundesrat is an exception, as its membership is roughly proportional to the population of the
3. Partial exceptions to parity are the haIf cantons in Switzerland, which have only one representative each in the federal chamber, and the Australian Gapital Territory and Northern Territory, which have two senators each. In Venezuela, former presidents are also members of the Senate.
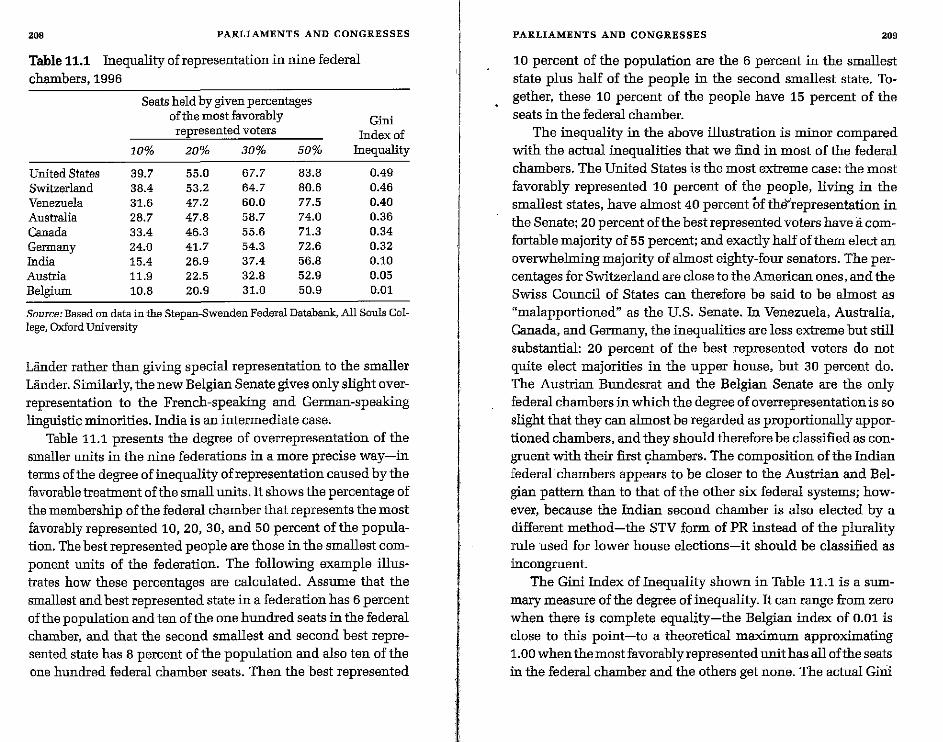
208 PARLIAMENTS AND CONGRESSES
Table 11.1 Inequality of representation in nine federal chambers, 1996
Seats held by given percentages oftheIDostfavorably Gini represented voters Index of
10% 20% 30% 50% Inequality
United States 39.7 55.0 67.7 83.8 0.49 Switzerland 38.4 53.2 64.7 80.6 0.46 Venezuela 31.6 47.2 60.0 77.5 0.40 Australia 28.7 47.8 58.7 74.0 0.36 Canada 33.4 46.3 55.6 71.3 0.34 GerTIlany 24.0 41.7 54.3 72.6 0.32 India 15.4 26.9 37.4 56.8 0.10 Austria 11.9 22.5 32.8 52.9 0.05 BelgiUTIl 10.8 20.9 31.0 50.9 0.01
Source: Based on data in the Stepan-SwendenFederal Databank, All Souls College, Oxford University
Liinder rather than giving special representation to the smaller Liinder. Similarly, the new Belgian Senate gives only slight overrepresentation to the French-speaking and German-speaking linguistic minorities. India is an intermediate case.
Table 11.1 presents the degree of overrepresentation of the sIDaller units in the nine federations in a more precise way-in terms of the degree of inequality of representation caused by the favorable treatment of the small units. It shows the percentage of the membership of the federal chamber that represents the most favorably represented 10, 20, 30, and 50 percent of the population. The best represented people are those in the smallest COID
ponent units of the federation. The following example illustrates how these percentages are calculated. Assume that the smallest and best represented state in a federation has 6 percent of the population and ten of the one hundred seats in the federal chamber, and that the second smallest and second best represented state has 8 percent of the population and also ten of the one hundred federal chamber seats. Then the best represented
PARLIAMENTS AND CONGRESSES 209
10 percent of the population are the 6 percent in the smallest state plus half of the people in the second smallest state. Together, these 10 percent of the people have 15 percent of the seats in the federal chamber.
The inequality in the above illustration is minor compared with the actual inequalities that we find in most of the federal chambers. The United States is the most extreme case: the most favorably represented 10 percent of the people, living in the smallest states, have almost 40 percent of the "representation in the Senate; 20 percent of the best represented voters have a comfortable majority of 55 percent; and exactly half of them elect an overwhelming majority of almost eighty-four senators. The percentages for Switzerland are close to the American ones, and the Swiss Council of States can therefore be said to be almost as "malapportioned" as the U.S. Senate. In Venezuela, Australia, Canada, and Germany, the inequalities are less extreme but still substantial: 20 percent of the best represented voters do not quite elect majorities in the upper house, but 30 percent do. The Austrian Bundesrat and the Belgian Senate are the only federal chambers in which the degree of overrepresentation is so slight that they can almost be regarded as proportionally apportioned chambers, and they should therefore be classified as congruent with their first ~hambers. The composition of the Indian federal chambers appears to be closer to the Austrian and Belgian pattern than to that of the other six federal systems; however, because the Indian second chamber is also elected by a different method-the STV form of PR instead of the plurality rule used for lower house elections-it should be classified as incongruent.
The Gini Index of Inequality shown in Table 11.1 is a summary measure of the degree of inequality. It can range from zero when there is complete equality-the Belgian index of 0.01 is close to this point-to a theoretical maximum approximating 1.00 when the most favorably represented unit has all of the seats in the federal chamber and the others get none. The actual Gim
210 PARLIAMENTS AND CONGRESSES
Index of 0.49 for the United States is roughly halfway between these extremes, and the Swiss index of 0.46 follows closely.
Several nonfederal second chambers must also be classified as incongruent. The French Senate is elected by an electoral college in which the small co=unes, with less than a third of the population, have more than half of the votes; on account of this rural and small-town overrepresentation, Maurice Duverger once characterized the Senate as the "Chamber of Agriculture" (cited in Ambler 1971, 165). The Spanish Senate is incongruent for three reasons: the mainland provinces (but not the islands and the two North African enclaves) are equally represented; most senators are elected by means of the semiproportional limited-vote system (in contrast with the PRmethod used for the election of the first chamber); and almost one-fifth are elected by the regional autonomous legislatures. The two houses of the Colombian Congress used to be elected by similar methods-PR in relatively low-magnitude districts-but in 1991 the Senate became incongruent because its electoral system was changed to PR in one large nationwide district-making it much easier for minority parties and candidates to get elected.
Many of the other bicameral legislatures are congruent because their two chambers are elected by sinlilar methods: list PR in Italy (until 1992), the Netherlands, and prefederal Belgium; MMP in Italy since 1994; SNTV in Japan until 1996 (although partly list PR for upper house elections since 1983). In the Baha-. mas, Barbados, and Jamaica, the upper houses are appointed by the governor-general, and in Trinidad by the president, according to various criteria, but always in such a way that the prime minister nominates the majority; thus the majority party in the first chamber also becomes the majority party in the second chamber. Ireland's Senate appears to be incongruent, because a large number of senators have to be elected from candidates nominated by vocational and cultural interest groups, but in the electoral college, composed of national and local legislators, party politics predominates. Hence, the Irish Senate "is com-
PARLIAMENTS AND CONGRESSES 211
posed largely of party politicians not very different from their colleagues in the [first chamber] and, in the case of many of them, with only tenuous connections with the interests they affect to represent" (Chubb 1982, 212).
The Cameral Structures of Thirty-Six Democratic Legislatures
Table 11. 2 uses the distinctions be~eeI!, bicameralism and unicameralism, between symmetrical and asymmetrical bicameralism, and between congruent and incongruent bicameralism to construct a classification of the cameral structures of thirty-six democracies as well as an index of bicameralism ranging from 4.0 to 1.0 points. There are four principal categories: strong, medium-strength, and weak bicameralism, and unicameralism. Strong bicameralism is characterized by both symmetry and incongruence. In medium-strength bicameralism, one of these two elements is missing; this category is split into two subclasses according to whether symmetry or incongruence is the missing feature, but both are ranked equally and have the same index of bicameralism (3.0 points). The third category is weak bicameralism in which the chambers are both asymmetrical and congruent. And the fourth category is that of unicameral legislatures. A plausible case can be made for the merger of the last two categories: does a bicameral legislature with two or more identical houses and one house that is much more powerful than the other differ in any significant way from a unicamerallegislature? Tsebelis and Money (1997, 211) give an emphatically affirmative answer to this question: "all second chambers exercise influence even if they are considered weak or insignificant.'" Therefore, for the purpose of measuring the division of
4. This conclusion is also strongly supported by William B. Heller's (1997) findings. In Democracies, I used the labels "strong." "weak," and "insignificant" instead of strong, medium-strength, and weak (Lijphart 1984, 99-100); Tsebelis and Money's as well as Heller's arguments have convinced me that "insignificant" bicameralism is a misleading term. that should be avoided.
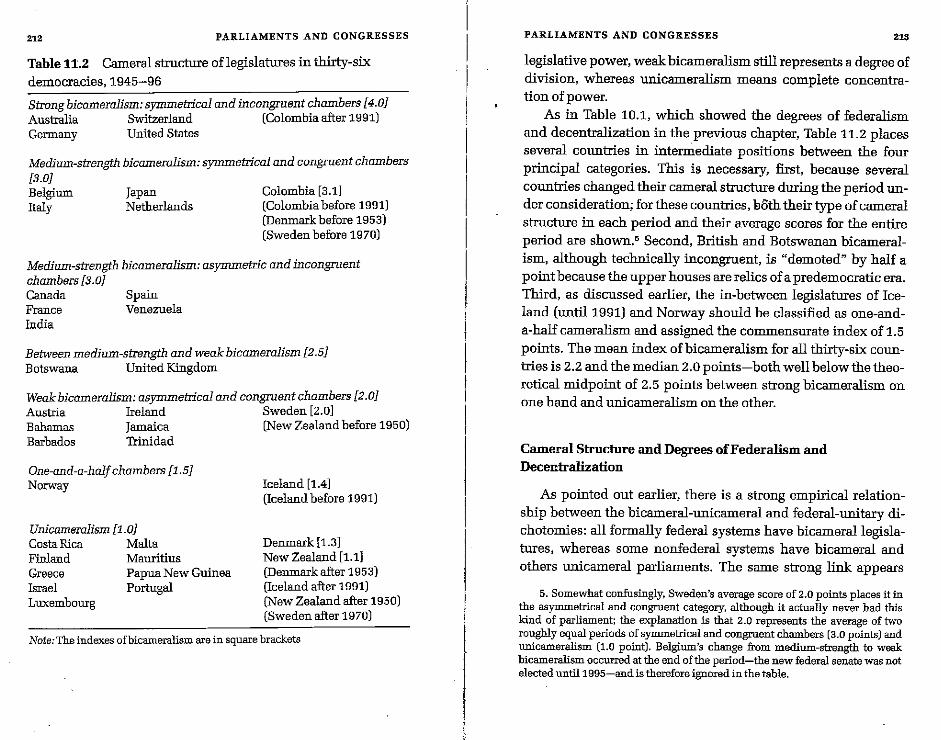
"2 PARLIAMENTS AND CONGRESSES
Table 11.2 Cameral structure of legislatures in thlrty-six democracies, 1945-96
Strong bicameralism: symmetrical and incongruent chambers [4.0J Australia Switzerland (Colombia after 1991) Germany United States
Medium-strength bicameralism: symmetrical and congruent chambers [3.0J Belgium Italy
Japan Netherlands
Colombia [3.1) (Colombia before 1991) (Denmark before 1953) (Sweden before 1970)
Medium-strength bicameralism: asymmetric and incongruent chambers [3.0J Canada France India
Spain Venezuela
Between medium-strength and weak bicameralism [2.5J Botswana United Kingdom
Weak bicameralism: asymmetrical and congruent chambers [2.0J Austria Ireland Sweden [2.0] Bahamas Jamaica (New Zealand before 1950) Barbados Trinidad
One-and-a-half chambers [1.5J Norway
Unicameralism [1.0J Costa Rica Malta Finland Mauritius Greece Israel Luxembourg
Papua New Guinea Portugal
Iceland [1.4J (Iceland before 1991)
Denmark [1.3J New Zealand [l.lJ (Denmark after 1953) (Iceland after 1991) (New Zealand after 1950) (Sweden after 1970)
Note: The indexes of bicameralism are in square brackets
--Ti
PARLIAMENTS AND CONGRESSES 213
legislative power, weak bicameralism still represents a degree of division, whereas unicameralism means complete concentration of power.
As in Table 10.1, which showed the degrees of federalism and decentralization in the previous chapter, Table 11.2 places several countries in interni.ediate positions between the four principal categories. This is necessary, first, because several countries changed their cameral structure during the period under consideration; for these countries, b6th their type of cameral structure in each period and their average scores for the entire period are shown.5 Second, British and Botswanan bicameralism, although technically incongruent, is "demoted" by half a point because the upper houses are relics of a predemocratic era. Third, as discussed earlier, the in-between legislatures of Iceland (until 1991) and Norway should be classified as one-anda-half cameralism and assigned the co=ensurate index of 1.5
points. The mean index of bicameralism for all thirty-six countries is 2.2 and the median 2.0 points-both well below the theoretical midpoint of 2.5 points between strong bicameralism on one hand and unicameralism on the other.
Cameral Structure and Degrees ofFederaIism and Decentralization
As pointed out earlier, there is a strong empirical relationship between the bicameral-unicameral and federal-unitary dichotomies: all formally federal systems have bicamerallegislatures, whereas some nonfederal systems have bicameral and others unicameral parliaments. The same strong link appears
5. Somewhat confusingly, Sweden's average score of 2.0 points places it in the asymmetrical and congruent category, although it actually never had this kind of parliament; the explanation is that 2.0 represents the average of two roughly equal periods of symmetrical and congruent chambers (3.0 points) and unicameralism (1.0 point). Belgium's change from medium-strength to weak: bicameralism occurred at the end of the period-the new federal senate was not elected until 1995-and is therefore ignored in the table.
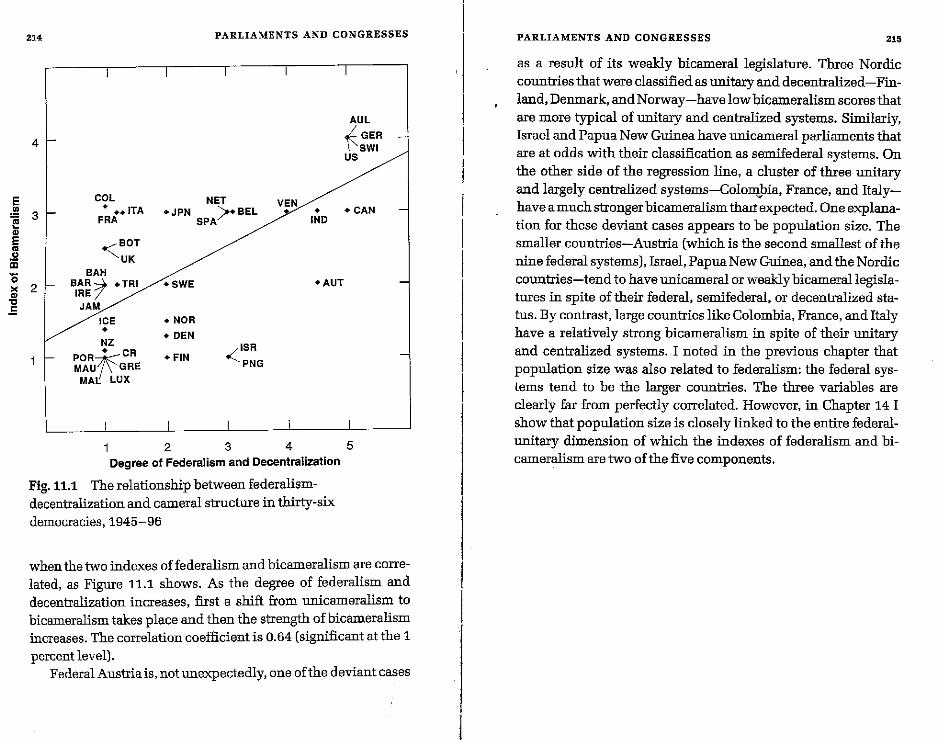
E ~ .. ~
" E .. . 2 III
'0 >< " .., .E
21' PARLIAMENTS AND CONGRESSES
4
3 ~ Cal
+ •• ITA FRA
, f
«(BOT UK
BAH BARj .TRI IRE JAM
/
ICE • NZ
POR~CR MAU GRE MAt lUX
NET +JPN >.BEL
SPA
·SWE
• NOR
• DEN
+ FIN
2
ISR
<PNG
3
VEN
4
• INO
+AUT
Degree of Federalism and Decentralization
Fig. 11.1 The relationship between federalismdecentralization and cameral structure in thirty-six democracies, 1945-96
AUL LGER I'SWI US
+ CAN
5
when the two indexes of federalism and bicameralism are correlated, as Figure 11.1 shows. As the degree of federalism and decentralization increases, first a shift from unicameralism to bicameralism takes place and then the strength of bicameralism increases. The correlation coefficient is 0.64 (significant at the 1 percent level).
Federal Austria is, not unexpectedly, one of the deviant cases
PARLIAMENTS AND CONGRESSES 215
as a result of its weakly bicameral legislature. Three Nordic countries that were classified as unitary and decentralized-Finland, Denmark, and Norway-have low bicameralism scores that are more typical of unitary and centralized systems. Similarly, Israel and Papua New Guinea have unicameral parliaments that are at odds with their classification as semifederal systems. On the other side of the regression line, a cluster of three unitary and largely centralized systems-Colo~bia, France, and Italyhave a much stronger bicameralism thmrexpected. One explanation for these deviant cases appears to be population size. The smaller countries-Austria (which is the second smallest of the nine federal systems), Israel, Papua New Guinea, and the Nordic countries-tend to have unicameral or weakly bicamerallegislatures in spite of their federal, semifederal, or decentralized status. By contrast, large countries like Colombia, France, and Italy have a relatively strong bicameralism in spite of their unitary and centralized systems. I noted in the previous chapter that population size was also related to federalism: the federal systems tend to be the larger countries. The three variables are clearly far from perfectly correlated. However, in Chapter 14 I show that population size is closely linked to the entire federalunitary dimension of which the indexes of federalism and bicameralism are two of the five components.
CHAPTER 12
Constitutions Am:endment Procedures and Judicial Review
In this chapter I discuss two variables, both belonging to the federal-unitary dimension, that have to do with the presence or absence of explicit restraints on the legislative power of parliamentary majorities. Is there a constitntion serving as a "higher law" that is binding on parliament and that cannot be changed by a regular parliamentary majority, or is parliamentthat is, the majority in parliament-the supreme and sovereign lawmaker? The first variable is the ease or difficulty of amending the constitution: the conventional distinction is between flexible constitntions that can be changed by regular majorities and rigid constitntions that require supermajorities in order to be amended. The second variable concerns the presence or absence of judicial review; when the constitution and an ordinary law conflict, who interprets the constitntion: parliament itsel£again meaning the majority in parliament-or a body such as a court or a special constitutional council outside and independent of parliament? In the pure consensus model, the constitntion is rigid and protected by judicial review; the pure majoritsrian model is characterized by a flexible constitntion and the absence of judicial review.
In practice, the two differences are not dichotomies: there are degrees of flexibility or rigidity of constitntions and, when
CONSTITUTIONS 217
judicial review is present, degrees to which it is actively used. In this chapter I propose four-point scales to measure both constituJional rigidity and judicial review. I also analyze the relationship between the two variables: rigid constitntions tend to have more judicial review protection than more flexible constitntions. In a brief addendum I discuss the role of referendums, which are frequently required in the ,Process of constitntional amendment: should they be seen mainly as majoritarian instruments or rather as incentives for seeking consensus?
Written and Unwritten Constitntions
The distinction between written and unwritten constitntions appears to be relatively unimportant for two reasons. One is that almost all of the constitntions in the world are written; unwritten ones are extremely rare. In our set of thirty-six democracies, only three have unwritten constitutions: the United Kingdom and New Zealand, the two prime examples of majoritarian democracy discussed in Chapter 2, as well as Israel. The absence of a written constitntion in Britain and New Zealand is usually explained in terms of their strong consensus on fundamental political norms, which renders a formal constitution superfluous. The opposite explanation applies to the Israeli case. Israel has tried but failed to adopt a written constitntion because on a number of key questions, especially the role of religion in the state and in the legal system, agreement could simply not be reached (Gutmann 1988). This dissensus has been solved by an agreement to disagree, while on other fundamental matters the consensus has been strong enough to allow the country to be run without a formal constitntion, as in Britain and New Zealand. Second, from the perspective of the fundamental contrast between the majoritsrian and consensus models of democracy, it is more relevant to determine whether the constitntion, written or unwritten, imposes significant restraints on the majority than .
21. CONSTITUTIONS
to ask whether it is written or not. Written constitutions may be as easily amendable and as free from judicial review as unwritten constitutions.
There are two strong counterarguments. however. First, if the written constitution is a single document, explicitly designated as the country's highest law, the parliamentary majority is likely to feel morally bound to respect it to a greater degree than if it is merely a more or less amorphous collection of basic laws and customs without even a clear agreement on what exactly is and what is not part of the unwritten constitution. Second, even more significant is the fact that unwritten constitutions by their very nature-because they do not have a formal status superior to that of other laws-logically entail both complete flexibility and the absence of judicial review. The use of "entrenched clauses" and "basic laws" in New Zealand and Israel are only apparent exceptions because the entrenchments can be removed or superseded relatively easily.' In contrast, written constitutions may be both completely flexible and completely unprotected by judicial review, but in practice this combination is rare; in our set of thirty-three democracies with written constitutions, France between 1958 and about 1974 is the only example.
Flexible and Rigid Constitutions
Democracies use a bewildering array of devices to give their constitutions different degrees of rigidity: special legislative majorities, approval by both houses of bicameral legislatures (even
1. In the important Bergman case in 1969, the Israeli Supreme Court for the first time declared an act of the Knesset (parliament) void for violating a basic law; however, this basic law prOvided for its own amendment by an absolute majority of all members of the Knesset, enabling the Knesset to pass a modified version of the invalidated law with the required absolute majority. but not a supermajority. Presumably the Knesset could also first have amended the absolute-majority requirement of the basic law (by an absolute majority) and then re-passed the invalidated act in its original form (and even withou~ an absolute majority). Three new basic laws adopted in 1992 have the potenti~ of significantly expanding the power of judicial review (Arian 1998, 267-70). "
T I
I I I I
I
CONSTITUTIONS 21.
when these are asymmetrical as far as ordinary legislation is concerned), approval by ordinary or special majorities of state or pfovinciallegislatures, approval by referendum, and approval by special majorities in a refereng,um. Further complications are that some constitutions stipnlate different methods of amendment for different provisions in the constitution or alternative methods that may be used for amending any part of the constitution (Maddex 1995). Nevertheless, this great variety of constitutional provisions can be reduced to fOlIT basic types, as shown in Table 12.1. These four types are based, first, on the distinction between approval by ordinary majorities-indicating complete flexibility-and by larger than ordinary majorities. Next, three categories of rigidity can be distinguished: (1) approval by twothirds majorities-a very co=on rule, based on the idea that supporters of a constitutional change have to outnumber their opponents by a ratio of at least two to one; (2) approval by less than a two-thirds majority (but more than an ordinary majority)-for instance, a three-fifths parliamentary majority or an ordinary majority plus a referendum; and (3) approval by more
than a two-thirds majority, such as a three-fourths majority or a two-thirds majority plus approval by state legislatures.
The only major adjustment that needs to be made concerns the classification of special majorities-also called extraordinary majorities or supermajorities-when these are special parliamentary majorities in parliaments elected by plurality. In such legislatures, large majorities often represent much smaller popular majorities and sometimes merely a popular plurality; moreover, these large majorities are often single-party majorities. For instance, shortly after Indira Gandhi's assassination in 1984, the Indian Congress party won a huge majority of 76.5 percent of the seats-many more than the two-thirds majority needed for amending the constitution-with a mere 48.1 percent of the popular vote. Two-thirds majorities are also required for amending the constitution of Barbados, but in three of the seven elections since 1966 such large one-party majorities were
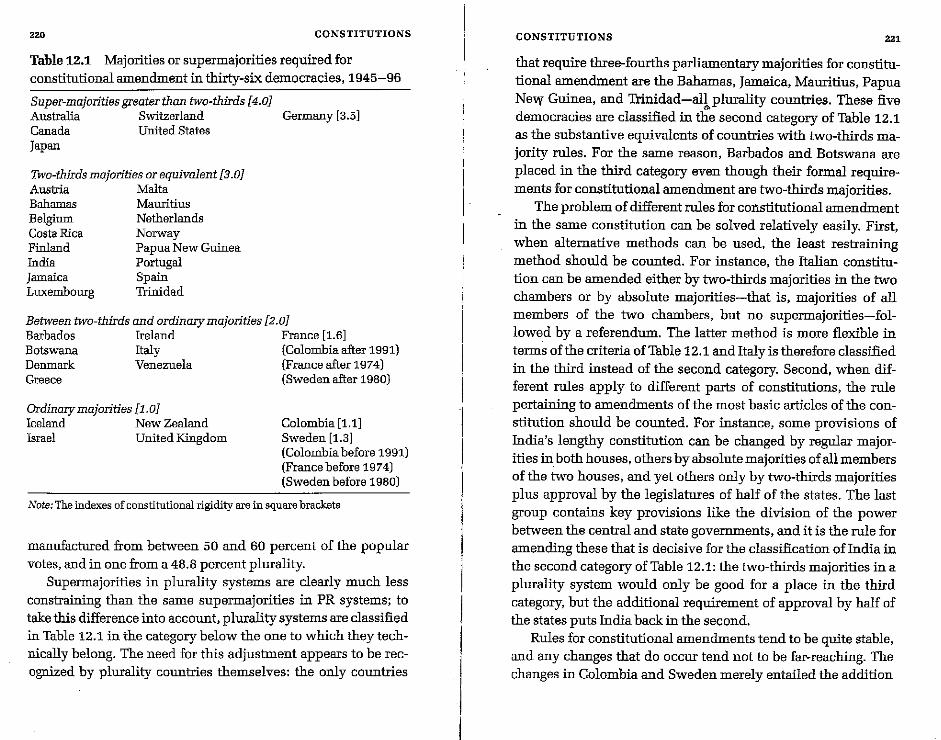
220 CONSTITUTIONS
Table 12.1 Majorities or supermajorities required for constitutional amendment in thirty-six democracies, 1945-96
Super-majorities greater than two-thirds [4.0] Australia Switzerland Germany [3.5] Canada United States Japan
Two-thirds majorities or equivalent [3.0] Austria Malta Bahamas Belgium Costa Rica Fiuland India Jamaica Luxembourg
Mauritius Netherlands Norway Papua New Guinea Portugal Spain Trinidad
Between two-thirds and ordinary majorities [2.oJ Barbados Ireland France [1.6] Botswana Italy (Colombia after 1991) Denmark Venezuela (France after 1974) Greece (Sweden after 1980)
Ordinary majorities £1.oJ Iceland New Zealand Israel United Kingdom
Colombia [1.1] Sweden [1.3] (Colombia before 1991) (France before 1974) (Sweden before 1980)
Note: The indexes of constitutional rigidity are in square brackets
manufactured from between 50 and 60 percent of the popular votes, and in one from a 48.8 percent plurality.
Supermajorities in plurality systems are clearly much less constraining than the same supermajorities in PR systems; to take this difference into account, plurality systems are classified in Table 12.1 in the category below the one to which they technically belong. The need for this adjustment appears to be recognized by plurality countries themselves: the only countries
-1-I
I
I I I
CONSTITUTIONS 221
that require three-fourths parliamentary majorities for constitutional amendment are the Bahamas, Jamaica, Mauritius, Papua Ne", Guinea, and Trinidad-all-plurality countries. These five democracies are classified in the second category of Table 12.1 as the substantive equivalents of countries with two-thirds majority rules. For the same reason, Barbados and Botswana are placed in the third category even though their formal requirements for constitutional amendment are two-thirds majorities.
The problem of different rules for constitutional amendment in the same constitution can be solved relatively easily. First, when alternative methods can be used, the least restrairring method should be counted. For instance, the Italian constitution can be amended either by two-thirds majorities in the two chambers or by absolute majorities-that is, majorities of all members of the two chambers, but no supermajorities-followed by a referendum. The latter method is more flexible in terms of the criteria of Table 12.1 and Italy is therefore classified in the third instead of the second category. Second, when different rules apply to different parts of constitutions, the rule pertairring to amendments of the most basic articles of the constitution should be counted. For instance, some provisions of lodia's lengthy constitution can be changed by regular majorities in both houses, others by absolute majorities of all members of the two houses, and yet others only by two-thirds majorities plus approval by the legislatures of half of the states. The last group contains key provisions like the division of the power between the central and state governments, and it is the rule for amending these that is decisive for the classification of lodia in the second category of Table 12.1: the two-thirds majorities in a plurality system would only be good for a place in the third category, but the additional requirement of approval by half of the states puts lodia back in the second.
Rules for constitutional amendments tend to be quite stable, and any changes that do occur tend not to be far-reaching. The changes in Colombia and Sweden merely entailed the addition
222 CONSTITUTIONS
of a referendum requirement. The last article of the French constitntion stipulates that amendments require either majority approval by the two legislative chambers followed by a referendum or a three-fifths majority ina joint session of the legislature; both methods qualify for the third category of Table 12.1. In addition, President Charles de Gaulle's decision in 1962 to circumvent parliament and to submit a proposed amendment directly to a referendum, overwheInIingly approved by the voters, established a purely majoritarian third procedure for constitutional amendment. However, by about 1974 when the first nonGaullist president was elected, this extra-constitntional method was no longer regarded as a viable option.
Most countries fit the two middle categories of Table 12.1: they require more than ordinary majorities for constitntional amendment but not more than two-thirds majorities or their equivalent. The mean index of constitntional rigidity is 2.6 and the median is 3.0 points. Five countries do have more rigid constitntions. The United States constitntion is the least flexible because amendments require two-thirds majorities in both the Senate and the House of Representatives as well as approval by three-fourths of the states. In Canada, several key provisions can only be amended with the approval of every province. In Australia and Switzerland, amendments require the approval in a popular referendum of not just majorities of the voters but also majorities in a majority of the states or cantons; this enables the smallest of the states and cantons with less than 20 percent of the population to block constitntional changes. The Japanese constitntion requires two-thirds majorities in both houses of the legislature as well as a referendum. A good case can be made for including the German constitntion in the same category because two-thirds majorities are required in two houses and because the Bundesrat's composition differs from that of the Bundestag in several important respects; however, Table 12.1 places it more conservatively between the top two categories. All of these rigid constitntions are also difficult to amend in practice; in fact,
-T I
CONSTITUTIONS 223
the Japanese constitntion has never been amended in the more than fifty years of its existence!
Judicial Review
One can argue that a written and rigid constitntion is still not a sufficient restraint on parliamentary majorities, unless there is an independent body that decides whether laws are in conformitywith the constitntion. IfparliamenIitselfis the judge of the constitntionality of its own laws, it can easily be tempted to resolve any doubts in its own favor. The remedy that is usually advocated is to give the courts or a special constitntional tribunal the power of judicial review-that is, the power to test the constitntionality oflaws passed by the national legislature.
In the famous Marbury v. Madison decision (1803), which established judicial review in the United States, Chief Justice John Marshall argued that the presence of a written constitntion and an independent judiciary logically implied the Supreme Court's power of judicial review: the court, faced with an incompatibility between the Constitntion and an ordinary law, had no choice but to apply the higher law and therefore to invalidate the law with a lower statns. The strong appeal of this argument can also be seen in a co=ent by R. H. S. Crossman, a member of the British Labour cabinet responsible for the controversial 1968 immigration law denying entry into Britain to about a hundred thousand British subjects living in Kenya; he later said that this law "would have been declared unconstitntional in any country with a written constitntion and a Supreme Court" (cited in Rose 1974, 138).
The logic of Marshall's and Crossman's reasoning is incontrovertible: even if the constitntion does not explicitly prescribe judicial review, it is implied by the higher status of the constitntion. Many constitntions, however, do specifically grant this power to the courts. For instance, the Greek constitntion states that "the courts shall be bound not to apply laws, the contents of
22. CONSTITUTIONS
which are contrary to the Constitution" (Brewer-Carlas 1989, 169). Article 2 of the Trinidad constitution asserts: "This Constitution is the supreme law of Trinidad and Tobago, and any other law that is inconsistent with this Constitution is void to the extent of the inconsistency." Very similar language is used in the constitutions of the other three Caribbean countries.2
Several constitutions explicitly deny the power of judicial review to their courts. Article 120 of the Dutch constitution, for instance, states: "The constitutionality of acts of parliament and treaties shall not be reviewed by the courts." A noteworthy attempt to exclude part of a written constitution from judicial review can be found in the proposed balanced budget amendment to the U.S. Constitution, twice defeated by the Senate in 1995 and 1997: "The judicial power of the United States shall not extend to any case or controversy arising under this [amendment] except as may be specifically authorized by legislation" (New York Times, March 1, 1995, A16). Not only in countries without written constitutions but also in those that do have written constitutions but do not have judicial review, parliaments are the ultimate guarantors of the constitution. The logic on which this alternative is based is that of democratic principle: such vital decisions as the conformity oflaw to the constitution should be made by the elected representatives of the people rather than by an appointed and frequently quite unrepresentative judicial body.
Mainly as a compromise between these two contradictory logics, several countries entrust judicial review to special constitutional courts instead of to the regular court systems. The ordinary courts may submit questions of constitutionality to the special constitutional court, but they may not decide such ques-
2. These constitutions, as well as those of Botswana and Mauritius, also stipulate that the highest court for the purposes of judicial review is the Judicial Committee of the Privy Council in London; however, especially because of dissatisfaction with the liberal rulings of the Judicial Committee in death-penalty cases, the Caribbean countries may replace it with a joint Caribbean Court of Appeal.
---~
CONSTITUTIONS 225
tions themselves. This type is called the centralized system of judicial review. It was proposed by the famous Austrian jurist Hans Kelsen and first adopted by'Austria in 1920. It is now also used in Germany, Italy, Spain, Portugal, and Belgium. The alternative, decentralized judicial review, in which all courts may consider the constitutionality oflaws, is still the more co=on system (Favoreu 1986, Cappelletti 1989, 132-66).
France was long considered the prime example of a country . in which the principle of popular sovereignty was said to pre
vent any application of judicial review. The constitution of the Fifth Republic did set up a constitutional council, but at first this body served mainly to protect executive power against legislative encroachments; only the president, the prime minister, and the presidents of the two chambers were permitted to submit questions of constitutionality to the council. However, a constitutional amendment passed in 1974 also gave relatively small minorities in the legislature-sixty members of either chamber-the right to appeal to the constitutional council, and the council itself has strongly asserted its power of judicial review (Stone 1992). Although the courts still cannot turn to the constitutional council, parliament is no longer the ultimate interpreter of the constitutionality of its own laws, and therefore France must now also be counted among the countries with judicial review of the centralized kind.
Judicial Review and Judicial Activism
The impact of judicial review depends only partly on its formal existence and much more vitally on the vigor and frequency of its use by the courts, especially supreme and constitutional courts. Table 12.2 presents a fourfold classification of the strength of judicial review based, first, on the distinction between the presence and absence of judicial review and, second, on three degrees of activism in the assertion of this power by the courts. There are only a few countries where judicial review is .
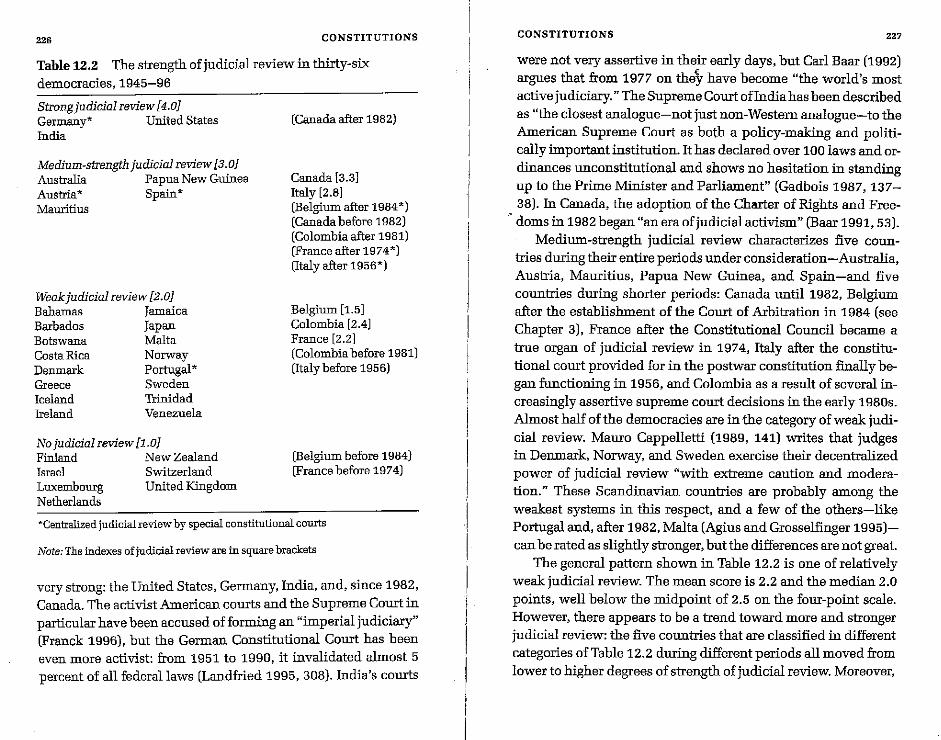
226 CONSTITUTIONS
Table 12.2 The strength of judicial review in thirty-six democracies, 1945-96
Strongjudicial review [4.0J Germany* United States India
Medium-strength judicial review [3.0J Australia Papua New Guinea Austria* Spain* Mauritius
Weak judicial review [2.0J Bahamas Jamaica Barbados Japan Botswana Malta Costa Rica Norway Derunark Portugal * Greece Sweden Iceland Trinidad lreland Venezuela
No judicial review [1.0J Fiuland New Zealand Israel Switzerland Luxembourg United Kingdom Netherlands
(Canada after 1982)
Canada [3.3] Italy [2.8J (Belgium after 1984*J (Canada before 1982) (Colombia after 1981) (France after 1974*) (Italy after 1956*)
Belgium [1.5J Colombia [2.4J France [2.2J (Colombia before 1981) (Italy before 1956)
(Belgium before 1984) (France before 1974)
*Centralized judicial review by special constitutional courts
Note: The indexes of judicial review are in square brackets
very strong: the United States, Germany, India, and, since 19S2, Canada. The activist American courts and the Supreme Court in particular have been accused of forming an "imperial judiciary" (Franck 1996), but the German Constitutional Court has been even more activist: from 1951 to 1990, it invalidated almost 5 percent of all federal laws (Landfried 1995, 30S). India's courts
- ..,----
I I I
I I
I
I
I
CONSTITUTIONS 227
were not very assertive in their early days, but Carl Baar (1992) argues that from 1977 on the~ have become "the world's most active judiciary." The Supreme Court of India has been described as "the closest analogue-not just non-Western analogue-to the American Supreme Court as both a policy-making and politically important institution. It has declared over 100 laws and ordinances unconstitutional and shows no hesitation in standing up to the Prime Minister and Parliament" (Gadbois 19S7, 137-3S). In Canada, the adoption of the Charter of Rights and Free-
, dams in 19S2 began "an era of judicial activism" (Baar 1991, 53). Medium-strength judicial review characterizes five coun
tries during their entire periods under consideration-Australia, Austria, Mauritius, Papua New Guinea, and Spain-and five countries during shorter periods: Canada until 19S2, Belgium after the establishment of the Court of Arbitration in 19S4 (see Chapter 3), France after the Constitutional Council became a true organ of judicial review in 1974, Italy after the constitutional court provided for in the postwar constitution finally began functioning in 1956, and Colombia as a result of several increasingly assertive supreme court decisions in the early 19S0s. Almost half of the democracies are in the category of weak judicial review. Mauro Cappelletti (19S9, 141) writes that judges in Denmark, Norway, and Sweden exercise their decentralized power of judicial review "with extreme caution and moderation." These Scandinavian countries are probably among the weakest systems in this respect, and a few of the others-like Portugal and, after 19S2, Malta (Agius and Grosselfinger 1995)can be rated as slightly stronger, but the differences are not great.
The general pattern shown in Table 12.2 is one of relatively weak judicial review. The mean score is 2.2 and the median 2.0 points, well below the midpoint of 2.5 on the four-point scale. However, there appears to be a trend toward more and stronger judicial review: the five countries that are classified in different categories of Table 12.2 during different periods all moved from lower to higher degrees of strength of judicial review. Moreover,
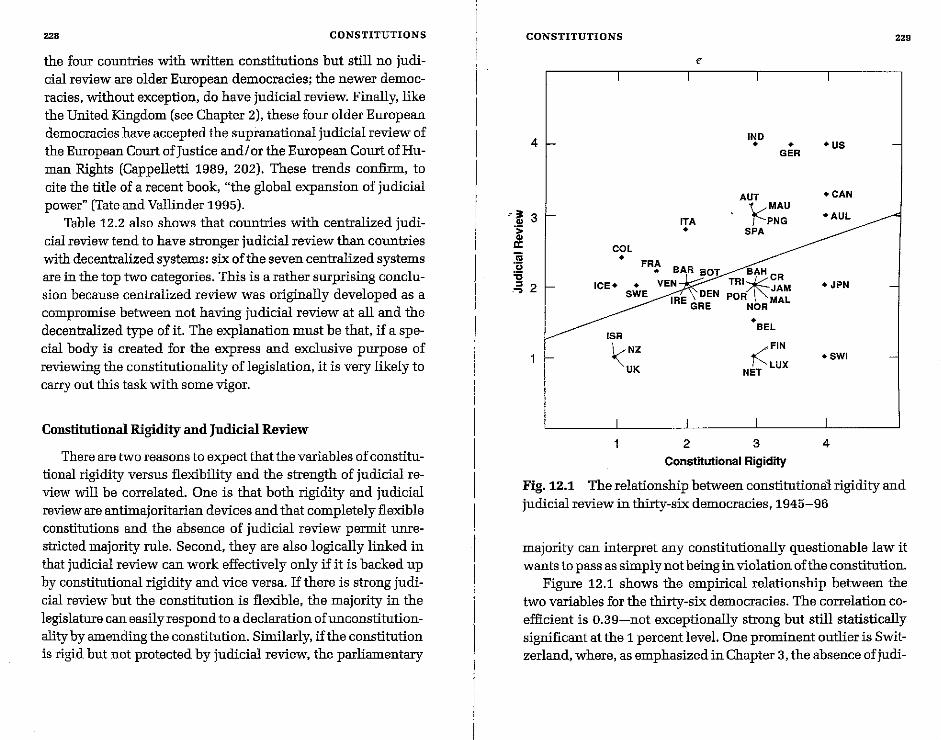
228 CONSTITUTIONS
the four countries with written constitutions but still no judicial review are older European democracies; the newer democracies, without exception, do have judicial review. Finally, like the United Kingdom (see Chapter 2), these four older European democracies have accepted the supranational judicial review of the European Court of Justice and/ or the European Court of Human Rights (Cappelletti 1989, 202). These trends confirm, to cite the title of a recent book, "the global expansion of judicial power" (Tate and Vallinder 1995).
Table 12.2 also shows that countries with centralized judicial review tend to have stronger judicial review than countries with decentralized systems: six of the seven centralized systems are in the top two categories. This is a rather surprising conclusion because centralized review was originally developed as a compromise between not having judicial review at all and the decentralized type of it. The explanation must be that, if a special body is created for the express and exclusive purpose of reviewing the constitutionality of legislation, it is very likely to carry out this task with some vigor.
Constitutional Rigidity and Judicial Review
There are two reasons to expect that the variables of constitutional rigidity versus flexibility and the strength of judicial review will be correlated. One is that both rigidity and judicial review are antimajoritarian devices and that completely flexible constitutions and the absence of judicial review permit unrestricted majority rule. Second, they are also logically linked in that judicial review can work effectively only if it is backed up by constitutional rigidity and vice versa. If there is strong judicial review but the constitution is flexible, the majority in the legislature can easily respond to a declaration ofunconstitutionality by amending the constitution. Similarly, if the constitution is rigid but not protected by judicial review, the parliamentary
---,-----
I I I
I I
CONSTITUTIONS
4
• ~ 3
~ Oi :§ .., .~ 2
e
IND • • GER
AUT
ITA y:MAU
PNG • SPA
COL • FRA
• BAR BOT BAH ICE. • VEN TRI~CR
SWE DEN POR JAM IRE GRE NOR MAL
• BEL ISR
~NZ UK
~FIN
NET LUX
2 3
Constitutional Rigidity
229
·US
.CAN
+AUL
• JPN
·SWI
4
Fig. 12.1 The relationship between constitutiona:l rigidity and judicial review in thirty-six democracies, 1945-96
majority can interpret any constitutionally questionable law it wants to pass as simply not being in violation of the constitution.
Figure 12.1 shows the empirical relationship between the two variables for the thirty-six democracies. The correlation coefficient is 0.39-not exceptionally strong but still statistically significant at the 1 percent level. One prominent outlier is Switzerland, where, as emphasized in Chapter 3, the absence of judi-
230 CONSTITUTIONS
cial review is the only majoritarian characteristic in an otherwise solidly consensual democracy. The other main deviant cases are Finland, the Netherlands, and Luxembourg-countries with two-thirds majority rules for constitutional amendment but no judicial review-and India and Germany-where very strong judicial review is combined with rigid but not maximally rigid constitutions. Analysts of judicial review also often note its frequent use in federal systems (Becker 1970, 222). In fact, both judicial review and rigid constitutions are linked with federalism as well as with the other two variables of the federal-unitary dimension: bicameralism and independent central banks. Central banks are subject of the next chapter, and the links among all five federal-unitary variables are discussed in Chapter 14.
Addendum: Referendums and Consensus Democracy
A striking feature of the amendment procedures specified by written constitutions is their frequent use of the referendum either as an absolute requirement or as an optional alternative: in twelve of the thirty-thIee written constitutions (as of 1996).lf majority approval in a referendum is the only procedure required for constitutional amendment, the referendum serves as a majoritarian device; however, the only example of this kind of referendum in our set of democracies was President de Gaulle's extraconstitutional use of it in France. In all of the other cases, the referendum is prescribed in addition to legislative approval by ordinary or extraordinary majorities, making amendments harder to adopt and constitutions more rigid-and hence serving as an antimajoritarian device (Gallagher 1995).
This function of the referendum conflicts with the conventional view that the referendum is the most extreme majoritarian method of decision-making-that is, even more majoritarian than representative majoritarian democracy, since elected legislatures offer at least some opportunities for minorities to present their case in unhurried discussion and to engage in bargaining
-TI I
I
CONSTITUTIONS 231
and logrolling. David Butler &:1ld Austin Ranney (1978, 36) state: "Because they cannot measure intensities of beliefs or work things out through discussion and discovery, Ieferendums are bound to be more dangerous than representative assemblies to minority rights." Although Butler and Ranney's argument has considerable force in most situations, it clearly requires modification. Its use in the process of constitutional amendment, as a requirement in addition to legislative approval, is more antimajoritarian than majoritarian: in p~cular, it offers dissatis-
o fied minorities the opportunity to launch a campaign against the proposed amendment.
There is an additional iroportant way in which referendums differ from the blunt majoritarian character that the conventional wisdom attributes to them. In fact, this happens when they assume their strongest form: in combination with the popular initiative. Switzerland is the prime example. Here the referendum and initiative give even very small minorities a chance to challenge any laws passed by the majority of the elected representatives. Even if this effort does not succeed, it forces the majorityto pay the cost of a referendum campaign. Hence the potential calling of a referendum by a minority is a strong stimulus for the majority to be heedful of minority views. Franz Lehner (1984, 30) convincingly argues that in Switzerland "any coalition with a predictable and safe chance of winning has to include all parties and organizations that may be capable of calling for a successful referendum." The referendum-plus-initiative has thus reinforced two Swiss traditions: the broad four-party coalitions in the executive Federal Council and the search for legislative majorities on particular bills that are as close to unaniroity as possible. Both the logic of the refeIendum-plus-initiative and the example of how it has worked in Switzerland support the conclusion that it can be seen as a strong consensus-inducing mechanism and the very opposite of a blunt majoritarian instruroent Uung 1996).
CHAPTER 13
Central Banks Independence Versus Dependence
The fifth and last variable in the federal-unitary dimension concerns central banks and how much independence and power they enjoy. Central banks are key governmental institutions that, compared with the other main organs of government, tend to be neglected in political science. In single-country and comparative descriptions of democratic political systems, political scientists invariably cover the executive, the legislature, political parties, and elections, and often also interest groups, the court system, the constitutional amendment process, and central-noncentral government relations-but hardly ever the operation and power of the central bank.'
When central banks are strong and independent, they playa critical role in the policy process. For instance, Robert B. Reich (1997, 80), secretary oflabor in the first Clinton administration, describes not President Clinton but Alan Greenspan, chairman of the Federal Reserve Board, as "the most powerful man in the world." Conversely, when central banks are dependent branches of the executive and hence relatively weak, this weakness is also
1. For instance, in the authoritative and widely used comparative politics textbook edited by Gabriel A. Almond and G. Bingham Powell (1996). central banks are not mentioned in the comparative section, and the tvvelve country studies contain only CUl'sory references to the Bank of England and the Bank of Brazil-butnotto the mighty GermanBundesbank orthe FederalReserve System in the United States. Of course, Democracies did not cover central banks either!
----,-----
CENTRAL BANKS 233
a highly relevant attribute{,lf the democratic system-just as the weakness of a legislature or the reluctance of a supreme court to use judicial review is a significant indicator of the kind of democracy to which these institutions belong. Giving central banks independent power is yet another way of dividing power and fits the cluster of divided-power characteristics (the second dimension) of the consensus model of democracy; central banks that are subservient to the executive fit the concentrated-power logic ofmajoritarian democracy.
Fortunately, economists have paid a great deal of attention to central banks and have developed precise measures of central bank autonomy that can be used for the purpose of this study: in particular, the index of legal central bank independence that Alex Cukierman, Steven B. Webb, and Bilin Neyapti (1994) have constructed for seventy-two industrialized and developing countries, including thirty-two of our thirty-six democracies, for the long period from 1950 to 1989. In addition, Cukierman, Webb, and Neyapti have proposed an alternative indicator, based on the turnover rate of the central bank governor, which is an especially good indicator of central bank independence in developing countries; and Vittorio Grilli, Donato Masciandaro, and Guido Tabellini (1991) have independently developed an index of the political and economic autonomy of central banks in eighteen developed countries. These three measures are combined into a comprehensive measure of central bank independence for our thirty-six democracies~a much more precise measure of this fifth variable than the four-point and five-point scales used for the measurement of the other federal-unitary variables.
The Duties and Powers of Central Banks
The most important task of central banks is the making of monetary policy-that is, the regulation of interest rates and the supply of money. Monetary policy has a direct effect on price stability and the control of inflation, and it indirectly, but also very
234 CENTRAL BANKS
strongly, affects levels of unemployment, economic growth, and fluctuations in the business cycle. Other duties that central banks frequently perfonn are managing the government's financial transactions; financing the government's budget deficits by buying government securities, making loans from their reserves, or printing money; financing development projects; regulating and supervising co=ercial banks; and, ifnecessary, bailing out insolvent banks and publicly owned enterprises. These other tasks may conflict with the task of controlling inflation, and the power of central banks over monetary policy can therefore be enhanced by not giving them these additional duties: "Although most governments recognize the long-term benefit of price stability, other goals often loom larger in the short run ... Assuring price stability, therefore, usually requires ensuring that the central bank is not forced to perform these [other] functions, at least not when they would cause inflation" (Cukiennan, Webb, and Neyapti 1994, 2).
Central banks and their role in monetary policy have become especially iroportant since 1971 when President Nixon devalued the U.S. dollar-breaking the fixed link of the dollar to gold and of nondollar currencies to the dollar, fashioned in the Bretton Woods agreement of 1944. In the much more uncertain situation of floating exchange rates, central bank independence became an even more iroportant tool to limit price instability. Central bank autonomy in most countries, however, was not greatly enhanced until after 1990. As Sylvia Maxfield (1997, 7-11) points out, the dramatic increases in independence that many countries, especially in Europe and Latin America, gave to their central banks in the 1990s were largely due to the Maastricht Treaty in 1992, which requires central bank independence
, as a condition for participating in the co=on European cur-rency, and to the globalization of finance, which makes it iroportant for developing countries to "signal their creditworthiness" to international investors.
" ,
;
1
] J
j i
CENTRAL BANKS 235
Measuring the Independence ot;,Central Banks
The powers and functions of central banks are usually defined by bank charters that are statute laws and not by means of constitutional provisions; nevertheless, these charters have tended to harden into "conventions with quasi-constitutional force" (Elster 1994, 68). Cukierman, Webb, and Neyapti (1994, 5-12) analyze sixteen variables concerning the legal independence of central banks, each coded from zero to one-the lowest
. to the highest level of independence. Their overall index oflegal independence is a weighted average of these sixteen ratings. There are four clusters of variables: the appointment and tenure of the bank's governor (chief executive officer), policy fonnulation, central bank objectives, and limitations on lending.
To give a few examples, the highest (most independent) ratings are given to a governor whose tenn of office is eight years or longer, who cannot be dismissed, and who may not siroultaneously hold other offices in gove=ent. The lowest (least independent) ratings are given to governors who are appointed for less than four years, who can be dismissed at the discretion of the executive, and who is not barred from holding another gove=ent appointment. As far as policy fonnulation is concerned, the highest ratings go to banks that have exclusive responsibility to fonnulate monetary policy and play an active role in the government's budgetary process; central banks that have no influence on monetary and budgetary policy are given the lowest ratings.
With regard to objectives, the highest rating is accorded when "price stability is the major or only objective in the charter, and the central bank has the final word in case of conflict with other gove=eri.t objectives." Medium ratings are given when "price stability is one goal [together] with other compatible objectives, such as a stable banking system," and, slightly lower, "when price stability is one goal, with potentially conflicting
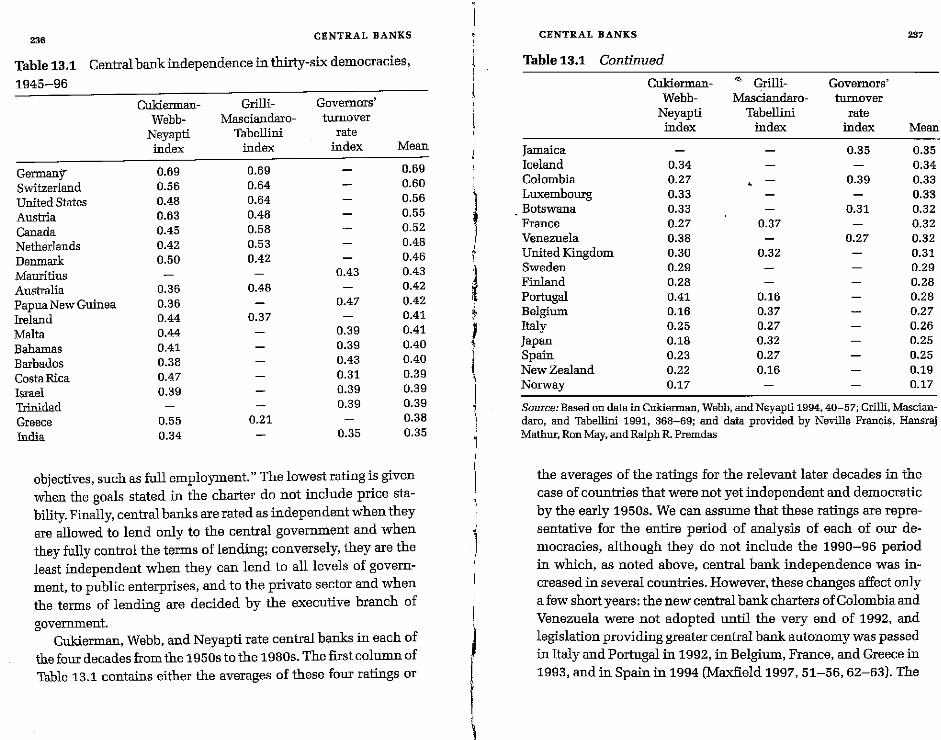
236 CENTRAL BANKS
Table 13.1 Central bank independence in tlrirty-six democracies,
1945-96
Cukierman- Grilli- Governors'
Webb- Masciandaro- turnover
Neyapti Tabeliini rate index index index Mean
Germany 0.69 0.69 0.69
Switzerland 0.56 0.64 0.60
United States 0.48 0.64 0.56
Austria 0.63 0.48 0.55
Canada 0.45 0.58 0.52
Netherlands 0.42 0.53 0.48
Denmark 0.50 0.42 0.46
Mauritius 0.43 0.43
Australia 0.36 0.48 0.42
Papua New Guinea 0.36 0.47 0.42
Ireland 0.44 0.37 0.41
Malta 0.44 0.39 0.41
Bahamas 0.41 0.39 0.40
Barbados 0.38 0.43 0.40
Costa Rica 0.47 0.31 0.39
Israel 0.39 0.39 0.39
Trinidad 0.39 0.39
Greece 0.55 0.21 0.38
Iudia 0.34 0.35 0.35
objectives, such as full employment." The lowest rating is given when the goals stated in the charter do not include price sta-bility. Finally, central banks are rated as independent when they are allowed to lend only to the central government and when they fully control the terms of lending; conversely, they are the least independent when they can lend to all levels of govern-ment, to public enterprises, and to the private sector and when the terms of lending are decided by the executive branch of
government. Cukierman, Webb, and Neyapti rate central banks in each of
the four decades from the 1950s to the 1980s. The first column of Table 13:1 contains either the averages of these four ratings or
, ,
j , 1
1 ~ ~
! I 'j , \
1 I
CENTRAL BANKS 237
Table 13.1 Continued
Cukierman- '" Grilli- Governors' Webb- Masciandaro- hlrnover
Neyapti Tabellini rate index index index Mean
Jamaica 0.35 0.35 Iceland 0.34 0.34 Colombia 0.27 0.39 0.33 Luxembourg 0.33 0.33 Botswana 0.33 0.31 0.32 France 0.27 0.37 0.32 Venezuela 0.38 0.27 0.32 United Kingdom 0.30 0.32 0.31 Sweden 0.29 0.29 Finland 0.28 0.28 Portugal 0.41 0.16 0.28 Belgium 0.16 0.37 0.27 Italy 0.25 0.27 0.26 Japan 0.18 0.32 0.25 Spain 0.23 0.27 0.25 NewZealaud 0.22 0.16 0.19 Norway 0.17 0.17
Source: Based on data in Cukierman, Webb, and Neyapti 1994, 40-57; Grilli, Masciandaro, and Tabellini 1991, 368-69; and data provided by Neville Francis, Hansraj Mathur, Ron May, and Ralph R Premdas
the averages of the ratings for the relevant later decades in the case of countries that were not yet independent and democratic by the early 1950s. We can assume that these ratings are representative for the entire period of analysis of each of our democracies, although they do not include the 1990-96 period in which, as noted above, central bank independence was increased in several countries. However, these changes affect only a few short years: the new central bank charters of Colombia and Venezuela were not adopted until the very end of 1992, and legislation providing greater central bank autonomy was passed in Italy and Portugal in 1992, in Belgium, France, and Greece in 1993, and in Spain in 1994 (Maxfield 1997,51-56,62-63). The
i I
I
I 1:1
I 1,,1 I,' i I
:[
1\ \
II' ',I i ,",
,.,1
~~---~~ -,----
238 CENTRAL BANKS
one similar change that took place several years earlier occurred in New Zealand in 1989, as noted in Chapter 2. In the decades before 1990, legal central bank independence was remarkably stable in most countries.
Four countries were not included in the Cukierman-WebbNeyapti study: Jamaica, Mauritius, Papua New Guinea, and Trinidad. However, because Papua New Guinea's central bank charter was modeled after the Australian one, it can be assigned the same index as Australia's. Two other indexes can be used to make up for the missing data and also to take advantage of additional expert judgments in order to arrive at an overall index of central bank independence that is as accurate and valid as possible. One is the index of political and economic independence of central banks designed by Grilli, Masciandaro, and Tabellini (1991, 366-71) and applied by them to the central banks of eighteen industrialized countries. Although these three economists use the term "political and economic independence," they emphasize formal rules, and hence their index is, in principle, quite similar to the Cukierman-Webb-Neyapti index. They differ, however, with regard to several of the specific variables on which they focus and the weighting of these variables.
The third index is based on a simple variable-the rate of turnover in the governorship of the central bank during the 198Gs-which Cukierman, Webb, and Neyapti (1994, 13-19, 37-42) found to be a better indicator of central bank independence and a better predictor of inflation rates for the less developed countries than their more complex legal measure: the greater the turnover rate of the central bank governor, the less the independence of the central bank. The two additional indexes were transformed to the same zero to one scale used for the Cukierman-Webb-Neyapti index.2 They are shown in the
2. The empirical range of the Grilli-Masciandaro-Tabellini index for eighteen countries is from three to thirteen points, compared with the range of 0.16 to 0.69 of the Cukierman-Webb-Neyapti index for the same countries; in orderta convert the former into the latter, three points were taken to be the equivalent of
)
I
I I
CENTRAL BANKS 239
second and third columns of Table 13.1. The two separate indexes that are available for 28 cOUJ;!tries are strongly correlatedthe coefficient is 0.54, significant at the 1 percent level-but they are far from identical. The differences in the indexes for Belgium, Greece, and Portugal especially are quite sizable. Both the overall similarity and the differences for particular cases justify the use of more than onejndex.
The fourth column of Table 13.1 shows the mean of the two separate indexes of independence for twenty-eight of the thirtysix central banks and the one index that is available for the remaining eight central banks; the values in the fourth column constitute the comprehensive index of central bank independence that will be used henceforth in this study. The thirty-six countries are listed in descending order of central bank independence. The index can theoretically range from one to zero, but the empirical range is only about half as large. Only five countries have indexes that are greater than 0.50-the point that in the Cukierman-Webb-Neyapti coding scheme represents semi-independence. The midpoint of the empirical range is 0.43, but the mean and median are lower-0.38 and 0.36, respectively-indicating that more countries are concentrated in the lower half of the empirical range. The German, Swiss, and American central banks head the list and are also generally regarded as the world's strongest, but even these banks do not always earn the highest scores. For instance, only the German Bundesbank governor has an eight-year term of office; in Switzerland, the term is six and in the United States four years (Capie, Goodhart, and Schnadt 1994, 58). The Bundesbank's mandated goal is to safeguard price stability, but it also has to support the general economic policy of the federal government
0.16; thirteen points as the equivalent of 0.69; and four to twelve points at commensurate places in between. The empirical range of governors' turnover was from five to zero turnovers, compared with a range of 0.27 to 0.47 for the same countries on the Cukierman-Webb-Neyapti index; the same procedure was used to convert the former into the latter.
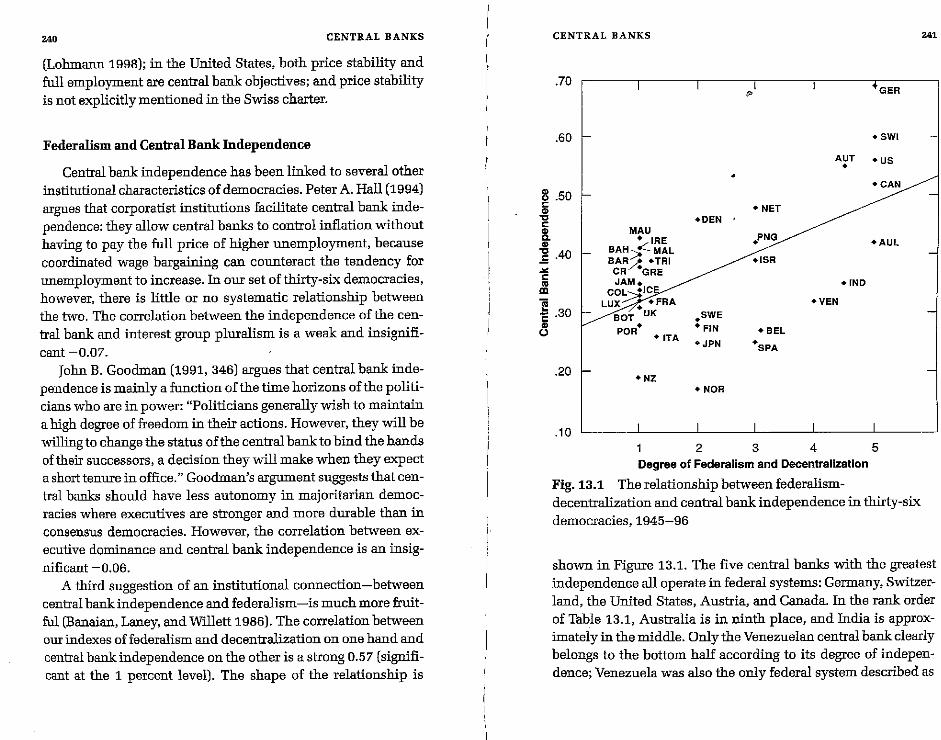
24. CENTRAL BANKS
(Lohmann 1998); in the United States, both price stability and full employment are central bank objectives; and price stability is not explicitly mentioned in the Swiss charter.
Federalism and Central Bank Independence
Central bank independence has been linked to several other institutional characteristics of democracies. Peter A. Hall (1994)
argues that corporatist institutions facilitate central bank independence: they allow central banks to control inflation without having to pay the full price of higher unemployment, because coordinated wage bargaining can counteract the tendency for unemployment to increase. In our set of thirty-six democracies, however, there is little or no systematic relationship between the two. The correlation between the independence of the central bank and interest group pluralism is a weak and insignificant -0.07.
John B. Goodman (1991, 346) argues that central bank independence is mainly a function of the time horizons of the politicians who are in power: "Politicians generally wish to maintain a high degree of freedom in their actions. However, they will be willing to change the status of the central bank to bind the hands of their successors, a decision they will make when they expect a short tenure in office." Goodman's argument suggests that central banks should have less autonomy in majoritarian democracies where executives are stronger and more durable than in consensus democracies. However, the correlation between executive dominance and central bank independence is an insignificant -0.06.
A third suggestion of an institutional connection-between central bank independence and federalism-is much more fruitful (Banaian, Laney, and Willett 1986). The correlation between our indexes of federalism and decentralization on one hand and central bank independence on the other is a strong 0.57 (significant at the 1 percent level). The shape of the relationship is
i "
CENTRAL BANKS 241
.70 ,
~ "
"'GER
.60 .SWI
AUT ·US • • • CAN
8.50 I: • NET " "C +OEN I:
" MAU c. + IRE .PNG +AUL " ~ .40 BAH>.~MAL BAR;.! -TRI ~
"'" CR +GRE I: .. JAM. +IND III COL +IC
LUX~ +FRA +VEN E -C .30 BOT UK .SWE
" U POR· • FIN +BEL + ITA
+JPN ·SPA
.20 ~ -NZ +NOR
I .10
2 3 4 5 Degree of Federalism and Decentralization
Fig.13.1 The relationship between federalism-decentralization and central bank independence in thirty-six democracies, 1945-96
shown in Figure 13.1. The five central banks with the greatest independence all operate in federal systems: Germany, Switzerland, the United States, Austria, and Canada. In the rank order of Table 13.1, Australia is in ninth place, and India is approximately in the middle. Only the Venezuelan central bank clearly belongs to the bottom half according to its degree of independence; Venezuela was also the only federal system described as
I. I
I,
242 CENTRAL BANKS
centralized in Chapter 10. The ninth federal system, Belgium, has one of the lowest indexes of bank independence, but Belgium did not become federal until 1993, and as discussed in Chapter 3, it made its central bank much more independent at about the same time. As is shown in the next chapter, central bank independence is also strongly correlated with the other three variables of the federal-unitary dimension.
rr I, '\" 1,;
it. I
f I~ :1
t tr-f~
t >:-i
it L
f , .,.
t l ""
CHAPTER 14
The Two-Dimensional Conceptual Map of Democracy
In this brief chapter I summarize the main findings of Chapters 5 through 13, which have dealt with each of the ten basic majoritarian versus consensus variables. I focus on two aspects of the "grand picture": the two-dimensional pattern formed by the relationships among the ten variables and the positions of each of the thirty-six democracies in this twodimensional pattern. In addition, I explore the changes in these positions from the pre-1970 to the post-1971 period of twentysix of the thirty-six democracies for which a sufficiently long time span is available in the first period.
The Two Dimensions
In Chapter 1, I previewed one of the most important general findings of this book: the clustering of the ten institutional variables along two clearly separate dimensions, which I have called the executives-parties and federal-unitary dimensionsalthough, as I explained in Chapter 1, it might be more accurate and theoretically more meaningful to call the two dimensions the joint-power and divided-power dimensions. In Chapters 5 through 13, too, I have repeatedly called attention to the close links among some of the variables within each cluster. Table 14.1 now presents the overall pattern by means of the correlation
242 CENTRAL BANKS
centralized in Chapter 10. The ninth federal system, Belgium, has one of the lowest indexes of bank independence, but Belgium did not become federal until 1993, and as discussed in Chapter 3, it made its central bank much more independent at about the same time. As is shown in the next chapter, central bank independence is also strongly correlated with the other three variables of the federal-unitary dimension.
if' iL /,1 I'}
, ' . 'f 1 ." , I \ I). 1
It ill'
~ .l ~.
t L
[ I
;;
~ ~f , ,ill 1.
CHAPTER 14
The Two-Dimensional Conceptual Map of Democracy
In this brief chapter I summarize the main findings of Chapters 5 through 13, which have dealt with each of the ten basic majoritarian versus consensus variables. I focus on two aspects of the "grand picture": the two-dimensional pattern formed by the relationships among the ten variables and the positions of each of the thirty-six democracies in this twodimensional pattern. In addition, I explore the changes in these positions from the pre-1970 to the post-1971 period of twentysix of the thirty-six democracies for which a sufficiently long time span is available in the first period.
The Two Dimensions
In Chapter 1, I previewed one of the most important general findings of this book: the clustering of the ten institutional variables along two clearly separate dimensions, which I have called the executives-parties and federal-unitary dimensionsalthough, as I explained in Chapter 1, it might be more accurate and theoretically more meaningful to call the two dimensions the joint-power and divided-power dimensions. In Chapters 5 through 13, too, I have repeatedly called attention to the close links among some of the variables within each cluster. Table 14.1 now presents the overall pattern by means of the correlation
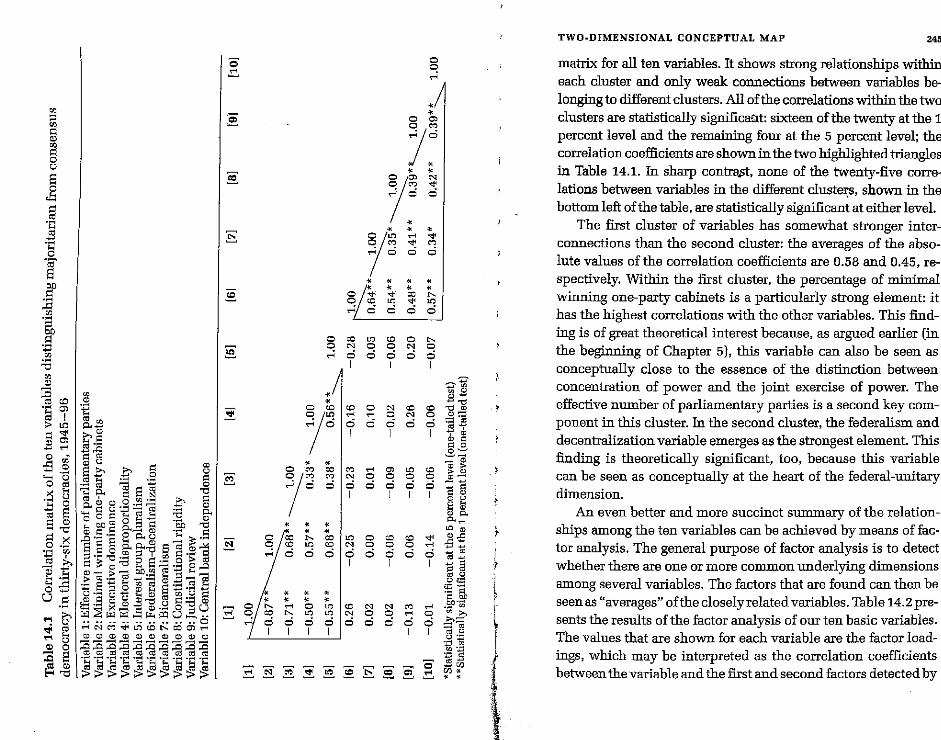
'" ~ f:j 8
j § .~
~ .m-
ff :g .~ :p
'" :a '" " :§co .~ '" iil I ,. on
Oi ;J; .El ... '" -,.t1 :l -.~
<;-; " o oj
>< t3 .~ 0
~ S S~ Oi >< o .~ .~ '" ~ >. alt t .~
0-:8 u Oi
.~
~ G" ... oj
'" t3 oS S ~~
gj :e oj '" ""-E:>~ oJ·~
~~ IlJ U I=! W ~>.>.o u cat:: .-:::..... =
..... I;lj ta' -:: il) 1::0.. d,,, ""d ttl' =~.~ >. = o..llJmO • ..-; ............ Q;l
"H§~:eca~ ;a fr oooI;ljO~1:l "5:'0 "'C 83:==0.. ......... 0) ..... =
"O' ..... § 8 o..g ..:: ~ ..... SEol=l;o.'""dSO::C!l~ ::l'~"d13 5 s'·;!3: S"S:: ctI ""';;OCll· u "", ~· .... CD..c Q;l ...... ;;:.""" OO.;!3: ~ -<::::: ;.....-:> <:C ..... ctI_ ......... IlJ z""'" ctl
:= S"S 15 ~ El S:=·~b u· .... u-""'Q;l "-lUI=! ~ = IlJ g CD.-c?3 =;a CD _;;><_=CJ ..... 0;jU ~.-:::=i~~_~IilU-.. .. ·· ................ 0 ...-!NM-..tILOCCt-.OOO'l...-! il)1lJ1J.)a:lQlllJalCDIlJ<Il
:g~~~:g:g:g:g:g:g or::: 0;::: or::: 'c .~ .~ Ok Ok Ok Ok ~~~~~~~~~~
'0 .:!
Ei
~
E
:§:
e
~
~
~
o o ,..;
• • o '"
j~
l~ ~
o '" ... ~ 0 0
•
o/ib ~ ;,
o C":I ~ M ~ 000
-Ie .. .. of< '+:; -l< .. oj<
o <:tI "<1f co t-. o -c tn '<1' LO ...; 0 0 0 0
o co LO c;:l 0 r-.. o N 0 0 N 0 ...; 000 0 d
I I I
A 'Z' 't: .. II ~.El . -'" o i.D co 0 N CC CC""ljCD
/~ .-: .-;: ~ ~ c: ~ ~
...-! 0 0 0 0 0 0 <:c"i' I I I d; ~
~ 0 3:::::
-!< '" - Q:) o ~ co ~ .,.., ~ LO co ~~
/'~ ~ c:"! c: c: c: c: ..sl::
\-!ooooooO ..... i=: I I I I ~ ~
i:: ~
• m "-
oj< oj< 0...-1 ;< -I< LO II)
O/co ~ co LO 0 cc co ~ ]~ o co LO CC N 0 0 0 ~ .......... ...; 0 0 d dodo 0 ~~
I J I ~ a ~ 0 0,"
''''' -Ie +: -!o: 5'S .. oj< .+; -Ie §,.~
_ 0/ r:-.. '1""1 0 1.0 CD N N M ...-! .,.. 1;0
'!""" 0 co '" LO LO N 0 0.,.., 0 ell>. ~ . 0 0 0 0 0 0 0 0 0 8~
I I I I I I 1] ~ tl:E
3!!:§:~:§:~ ,......,.........,.........,'0 !:::.s~~
::::.s $", "'. • •
,
, , i i
TWO-DIMENSIONAL CONCEPTUAL MAP 245
matrix for all ten variables. It shows strong relationships within each cluster and only weak connections between variables belonging to different clusters. All of the correlations within the two clusters are statistically signifiCaiLt: sixteen of the twenty at the 1 percent level and the remaining four at the 5 percent level; the correlation coefficients are shown in the two highlighted triangles in Table 14.1. In sharp contrlj/lt, none of the twenty-five correlations between variables in the different cluste~s, shown in the bottom left of the table, are statistically significant at either level.
The first cluster of variables has somewhat stronger interconnections than the second cluster: the averages of the absolute values of the correlation coefficients are 0.58 and 0.45, respectively. Within the first cluster, the percentage of minimal winning one-party cabinets is a particularly strong element: it has the highest correlations with the other variables. This finding is of great theoretical interest because, as argued earlier (in the beginning of Chapter 5), this variable can also be seen as conceptually close to the essence of the distinction between concentration of power and the joint exercise of power. The effective number of parliamentary parties is a second key component in this cluster. In the second cluster, the federalism and decentralization variable emerges as the strongest element. This finding is theoretically significant, too. because this variable can be seen as conceptually at the heart of the federal-unitary dimension.
An even better and more succinct summary of the relationships among the ten variables can be achieved by means of factor analysis. The general purpose of factor analysis is to detect whether there are one or more co=on underlying dimensions among several variables. The factors that are found can then be seen as "averages" of the closely related variables. Table 14.2 presents the results of the factor analysis of our ten basic variables. The values that are shown for each variable are the factor loadings, which may be interpreted as the correlation coefficients between the variable and the first and second factors detected by
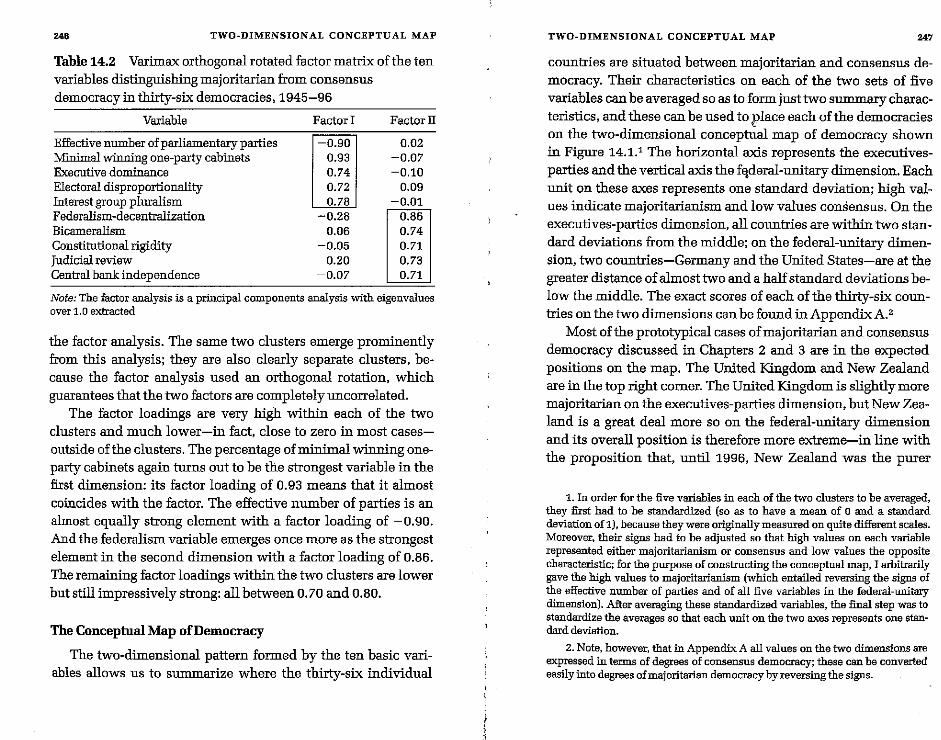
246 TWO-DIMENSIONAL CONCEPTUAL MAP
Table 14.2 Varimax orthogonal rotated factor matrix of the ten variables distinguishing majoritarian from consensus democracy in thirty-six democracies, 1945-96
Variable Factor I Factor II
Effective number of parliamentary parties -0.90 0.02 Minimal winning one-party cabinets 0.93 -0.07 Executive dominance 0.74 -0.10 Electoral disproportionality 0.72 0.09 Interest group pluralism 0.78 -0.01 Federalism-decentralization -0.28 0.86 Bicameralism 0.06 0.74 Constitutional rigidity -0.05 0.71 Judicial review 0.20 0.73 Central bank independence -0.07 0.71
Note: The factor analysis is a principal components analysis with eigenvalues over 1.0 extracted
the factor analysis. The same two clusters emerge prominently from this analysis; they are also clearly separate clusters, because the factor analysis used an orthogonal rotation, which guarantees that the two factors are completely uncorrelated.
The factor loadings are very high within each of the two clusters and much lower-in fact, close to zero in most casesoutside of the clusters. The percentage of minimal winning oneparty cabinets again turns out to be the strongest variable in the fixst dimension: its factor loading of 0.93 means that it almost coincides with the factor. The effective number of parties is an almost equally strong element with a factor loading of -0.90. And the federalism variable emerges once more as the strongest element in the second dimension with a factor loading of 0.86.
The remaining factor loadings within the two clusters are lower but still impressively strong: all between 0.70 and 0.80.
The Conceptual Map of Democracy
The two-dimensional pattern formed by the ten basic variabIes allows us to summarize where the thirty-six individual
TWO-DIMENSIONAL CONCEPTUAL MAP 247
countries are situated between majoritarian and consensus democracy. Their characteristics on each of the two sets of five variables can be averaged so as to form jnst two summary characteristics, and these can be used to place each of the democracies on the two-dimensional conceptual map of democracy shown in Figure 14.1.' The horizontal axis represents the executivesparties and the vertical axis the fqderal-unitary dimension. Each unit on these axes represents one standard deviation; high values indicate majoritarianism and low values consensus. On the executives-parties dimension, all countries are within two standard deviations from the middle; on the federal-unitary dimension, two countries-Germany and the United States-are at the greater distance of almost two and a half standard deviations below the middle. The exact scores of each of the thirty-six countries on the two dimensions can be found in Appendix A. 2
Most of the prototypical cases of majoritarian and consensus democracy discussed in Chapters 2 and 3 are in the expected positions on the map. The United Kingdom and New Zealand are in the top right corner. The United Kingdom is slightly more majoritarian on the executives-parties dimension, but New Zealand is a great deal more so on the federal-unitary dimension and its overall position is therefore more extreme-in line with the proposition that, until 1996, New Zealand was the purer
1. In order for the five variables in each of the two clusters to be averaged, they first had to be standardized (so as to have a mean of 0 and a standard deviation of 1), because they were originally measured on quite different scales. Moreover, their signs had to be adjusted so that high values on each variable represented either majoritarianism or consensus and low values the opposite characteristic; for the purpose of constructing the conceptual map, I arbitrarily gave the high values to majoritarianism (which entailed reversing the signs of the effective number of parties and of all five variables in the federal-unitary dimension). After averaging these standardized variables, the final step was to standardize the averages so that each unit on the two axes represents one standard deviation.
2. Note, however, that in Appendix A all values on the two dimensions are expressed in terms of degrees of consensus democracy; these can be converted easily into degrees of majoritarian democracy by reversing the signs.
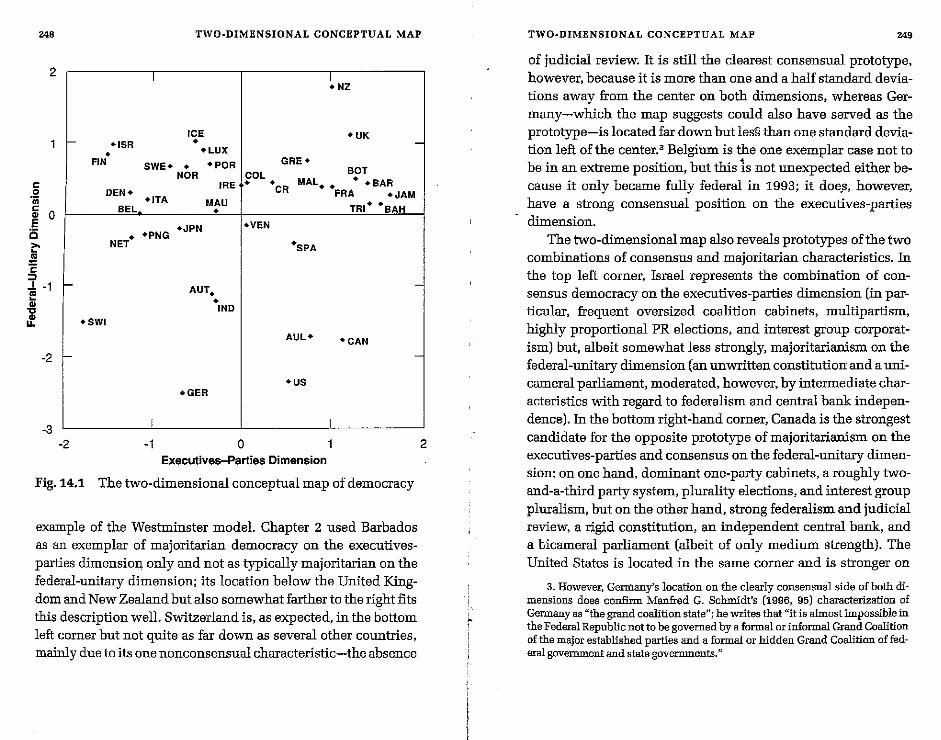
248
c o iii
2
~ 0 E is ~ .. 'E :::> ..L -1 E
~ -2
-3
r-
r-
r-
-2
TWO-DIMENSIONAL CONCEPTUAL MAP
I ~NZ
ICE ·UK -• +ISR +LUX • GRE+ FIN SWE+ • ·POR BOT NOR COL • MAL • +SAR IRE· CR • +FRA +JAM DEN·
+ITA MAU TRI· +BAH BEL • .VEN
• ·PNG +JPN
NET
·SWI
I
-1
·SPA
AUT. • INO
AUL+
·US +GER
-L o
Executives-Parties Dimension
-
·CAN -
2
Fig.14.1 The two-dimensional conceptual map of democracy
example of the Westminster model. Chapter 2 used Barbados as an exemplar of majoritarian democracy on the executivesparties dimension only and not as typically majoritarian on the federal-unitary dimension; its location below the United Kingdom and New Zealand but also somewhat farther to the right fits this description well. Switzerland is, as expected, in the bottom left corner but not quite as far down as several other countries, mainly due to its one nonconsensual characteristic-the absence
TWO-DIMENSIONAL CONCEPTUAL MAP 249
of judicial review. It is still the clearest consensual prototype, however, because it is more than one and a half standard deviations away from the center on both dimensions, whereas Germany-which the map suggests could also have served as the prototype-is located far down butlesH than one standard deviation left of the center.3 Belgium is the one exemplar case not to be in an extreme position, but this 1s not unexpected either because it only became fully federal in 1993; it doe.s, however, have a strong consensual position on the executives-parties dimension.
The two-dimensional map also reveals prototypes of the two combinations of consensus and majoritarian characteristics. In the top left corner, Israel represents the combination of consensus democracy on the executives-parties dimension (in particular, frequent oversized coalition cabinets, multipartism, highly proportional PR elections, and interest group corporatism) but, albeit somewhat less strongly, majoritarianism on the federal-unitary dimension (an unwritten constitution and a unicameral parliament, moderated, however, by intermediate characteristics with regard to federalism and central bank independence). In the bottom right-hand corner, Canada is the strongest candidate for the opposite prototype of majoritarianism on the executives-parties and consensus on the federal-unitary dimension: on one hand, dominant one-party cabinets, a roughly twoand-a-third party system, plurality elections, and interest group pluralism, but on the other hand, strong federalism and judicial review, a rigid constitution, an independent central bank, and a bicameral parliament (albeit of only medium strength). The United States is located in the same corner and is stronger on
3. However, Gerr:nany's location on the clearly consensual side of both dimensions does confirm Manfred G. Schmidt's (1996, 95) characterization of Germany as "the grand coalition state"; he writes that "it is almost impossible in the Federal Republic not to be governed by a formal or informal Grand Coalition of the major established parties and a formal or hidden Grand Coalition of federal government and state governments."
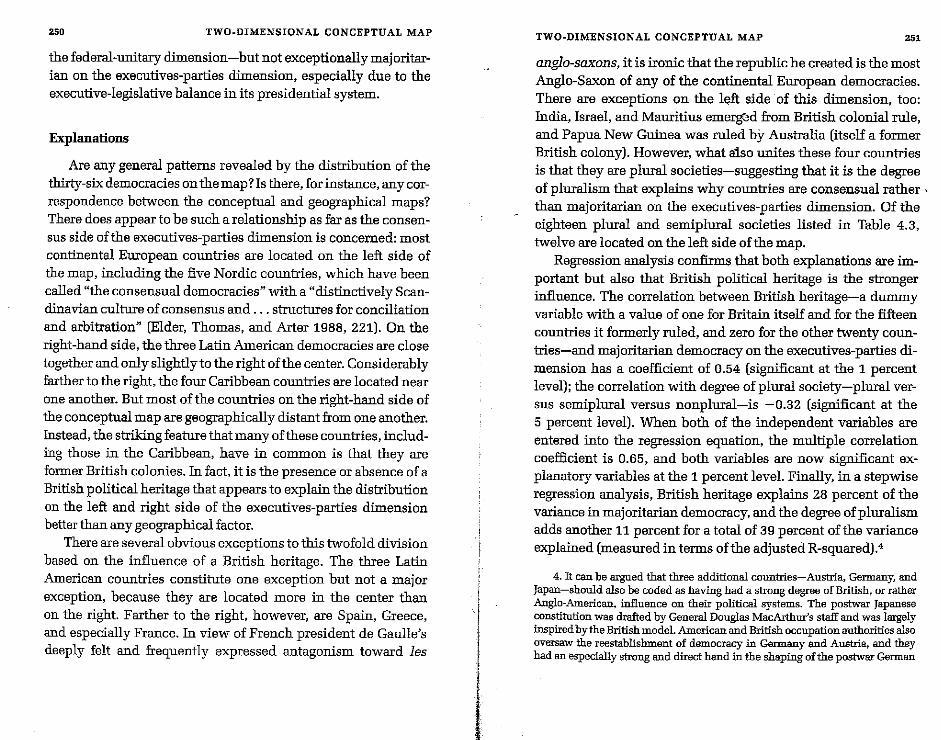
::i
I iI
250 TWO-DIMENSIONAL CONCEPTUAL MAP
the federal-unitary dimension-but not exceptionally majoritarian on the executives-parties dimension, especially due to the executive-legislative balance in its presidential system.
Explanations
Are any general patterns revealed by the distribution of the thirty-six democracies on the map? Is there, for instance, any correspondence between the conceptual and geographical maps? There does appear to be such a relationship as far as the consensus side of the executives-parties dimension is concerned: most continental European countries are located on the left side of the map, including the five Nordic countries, which have been called "the consensual democracies" with a "distinctively Scandinavian culture of consensus and ... structures for conciliation and arbitration" (Elder, Thomas, and Arter 1988, 221). On the right-hand side, the three Latin American democracies are close together and only slightly to the right of the center. Considerably farther to the right, the four Caribbean countries are located near one another. But most of the countries on the right-hand side of the conceptual map are geographically distant from one another. Instead, the striking feature that many of these countries, including those in the Caribbean, have in common is that they are former British colonies. In fact, it is the presence or absence of a British political heritage that appears to explain the distribution on the left and right side of the executives-parties dimension better than any geographical factor.
There are several obvious exceptions to this twofold division based on the influence of a British heritage. The three Latin Aroerican countries constitute one exception but not a major exception, because they are located more in the center than on the right. Farther to the right, however, are Spain, Greece, and especially France. In view of French president de Gaulle's deeply felt and frequently expressed antagonism toward les
TWO-DIMENSIONAL CONCEPTUAL MAP 251
anglo-saxons, it is ironic that the republic he created is the most Anglo-Saxon of any of the continental European democracies. There are exceptions on the left side of this dimension, too: India, Israel, and Mauritius emerg(ld from British colonial rule, and Papua New Guinea was ruled by Australia (itself a former British colony). However, what aiso unites these four countries is that they are plural societies-suggesting that it is the degree of pluralism that explains why countries are consensual rather. than majoritarian on the executives-parties dimension. Of the eighteen plural and semiplural societies listed in Table 4.3,
twelve are located on the left side of the map. Regression analysis confirms that both explanations are im
portant but also that British political heritage is the stronger influence. The correlation between British heritage-a dummy variable with a value of one for Britain itself and for the fifteen countries it formerly ruled, and zero for the other twenty countries-and majoritarian democracy on the executives-parties dimension has a coefficient of 0.54 (significant at the 1 percent level); the correlation with degree of plural society-plural versus semiplural versus nonplural-is -0.32 (significant at the 5 percent level). When both of the independent variables are entered into the regression equation, the multiple correlation coefficient is 0.65, and both variables are now significant explanatory variables at the 1 percent level. Finally, in a stepwise regression analysis, British heritage explains 28 percent of the variance in majoritarian democracy, and the degree of pluralism adds another 11 percent for a total of 39 percent of the variance explained (measured in terms of the adjusted R-squared).4
4. It can be argued that three additional countries-Austria, Germany, and Japan-should also be coded as having had a strong degree of British, or rather Anglo-American, influence on their political systems. The postwar Japanese constitution was drafted by General Douglas MacArthur's staff and was largely inspired by the British model. American and British occupation authorities also oversaw the reestablishment of democracy in Germany and Austria, and they had an especially strong and direct hand in the shaping of the postwar German
I,
"
I
I! "
I
I
252 TWO-DIMENSIONAL CONCEPTUAL MAP
The degree to which countries are plural societies also appears to explain the location of the thirty-six democracies on the federal-unitary dimension. Of the thirteen countries situated below the middle (including Belgium, which, with a score of -0.01, is barely below the middle), ten are plural or semiplural societies. An additional explanation suggested by the map is population size. The three largest countries-India, the United States, and Japan-are all located in the bottom part of the map, and of the fifteen countries with populations greater than ten million, ten are in the bottom part. This potential explanation is bolstered by Robert A. Dahl and Edward R. Tufte's (1973, 37) finding that size is related to federalism and decentralization, the key variable in the federal-unitary dimension: "the larger the country, the more decentralized its government, whether federal or not."
Regression analysis again confirms both of these impressions. The correlation coefficients are -0.50 for population size (logged) and -0.40 for degree of pluralism (both significant at the 1 percent level). In the multiple regression, both remain significant explanatory variables (although pluralism only at the 5 percent level), and the multiple correlation coefficient is 0.57. Population size by itself explains 23 percent of the variance, and pluralism adds another 6 percent for a total of 29 percent explained variance. The degree of pluralism is again the weaker variable, but it can be regarded as the strongest overall explanation because it can explain a significant portion of the variation in the locations of the thirty-six democracies on both dimensions.' Although the joint-power and divided-power as-
democratic system (MUl'avchik 1991,91-114). However, assigning these three countries a code of 1 on the British heritage variable weakens all of the correlations; for instance, the total variance explained goes down from 39 to 28 percent.
5. British political heritage is not related to the second dimension. Neither is population size related to the first dimension-contradicting Dahl and Tufte's (1973,91) argument that "the small system, being more homogeneous, is ...
TWO-DIMENSIONAL CONCEPTUAL MAP 253
peets of consensus democracy are conceptually and empirically distinct dimensions, they represent complementary institutional mechanisms for the acco=odation of deep societal divisions. This finding strengthens Sir Aphur Lewis's reco=endation, stated in Chapter 3, that both dimensions of consensus democracy-in particular, Lewis adVocates power-sharing cabinets and federalism-are needed in plural societies.
Shifts on the Conceptual Map
The locations of the thirty-six democracies on the conceptual map are average locations over a long period: close to fifty
. years for the twenty older democracies and a minimum of nineteen years for the three newest democracies (see Table 4.1). These averages conceal any large or small changes that may have taken place. Obviously, political systems can and do change; for instance, in previous chapters I called attention to changes in the party, electoral, and interest group systems of the thirty-six democracies as well as in their degrees of decentralization, the cameral structure of their legislatures, and the activism of their judicial review. To what extent have these changes added up to shifts in the direction of greater majoritarianism or greater consensus on either or both of the dimensions?
To explore this question, I divided the period 1945-96 in two roughly equal parts: the period until the end of1970 and the period from 1971 to the middle of 1996. For countries with a sufficiently long time span in the first period, scores on both of the dimensions were calculated for each period. This could be done for the twenty countries covered since the middle or late
likely to be more consensual [and that] the larger system, being more heterogeneous, is ... likely to be more conflictual." Our thirty-six democracies also differ a great deal with regard to level of development, but this variable (measured in terms of the human development index) is not related to either of the tw-o dimensions.
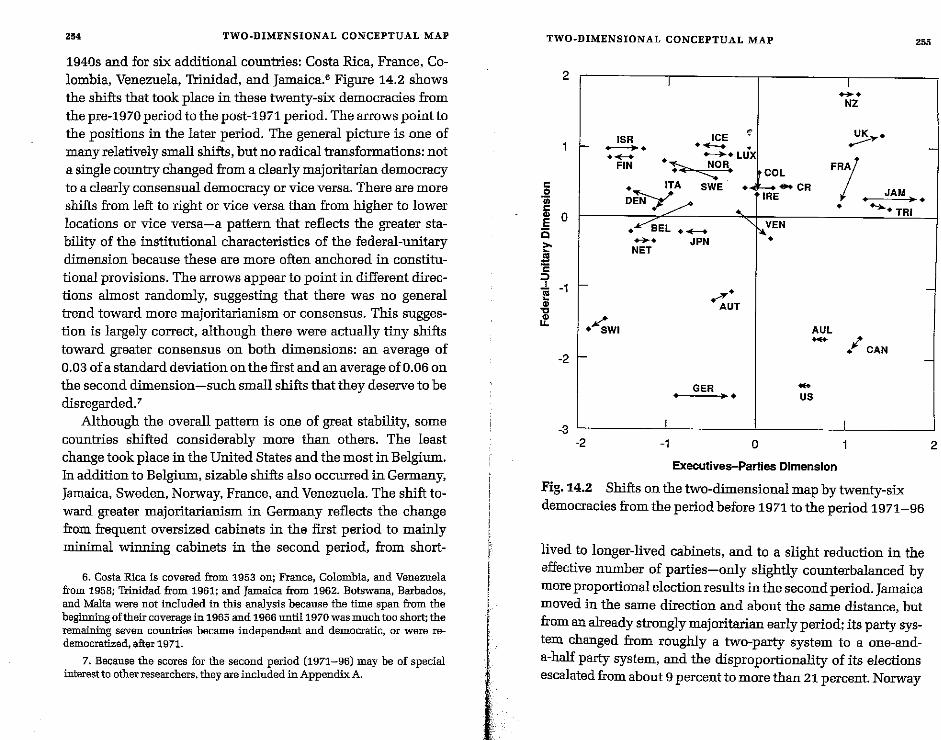
25. TWO-DIMENSIONAL CONCEPTUAL MAP
1940s and for six additional countries: Costa Rica, France, Colombia, Venezuela, Trinidad, and Jamaica.6 Figure 14.2 shows the shifts that took place in these twenty-six democracies from the pre-19 70 period to the post -1971 period. The arrows point to the positions in the later period. The general picture is one of many relatively small shifts, but no radical transformations: not a single country changed from a clearly majoritarian democracy to a clearly consensual democracy or vice versa. There are more shifts from left to right or vice versa than from higher to lower locations or vice versa-a pattern that reflects the greater stability of the institutional characteristics of the federal-unitary dimension because these are more often anchored in constitutional provisions. The arrows appear to point in different directions almost randomly, suggesting that there was no general trend toward more majoritarianism or consensus. This suggestion is largely correct, although there were actually tiny shifts toward greater consensus on both dimensions: an average of 0.03 of a standard deviation on the first and an average of 0.06 on the second dimension -such small shifts that they deserve to be disregarded.7
Although the overall pattern is one of great stability, some countries shifted considerably more than others. The least change took place in the United States and the most in Belgium. In addition to Belgium, sizable shifts also occurred in Germany, Jamaica, Sweden, Norway, France, and Venezuela. The shift toward greater majoritarianism in Germany reflects the change from frequent oversized cabinets in the first period to mainly minimal winning cabinets in the second period, from short-
6. Costa Rica is covered from 1953 on; France, Colombia, and Venezuela from 1958; llinidad from 1961; and Jamaica from 1962. Botswana, Barbados, and Malta were not included in this analysis because the time span from the beginning of their coverage in 1965 and 1966 until 1970 was much too short; the remaining seven countries became independent and democratic, or were redemocratized. after 1971.
7. Because the scores for the second period (1971-96) may be of special interest to other researchers, they are included in Appendix A.
TWO-DIMENSIONAL CONCEPTUAL MAP 255
2 I I .. +
NZ
_ ISR
c 0 iii
....----.. ICE ~ ...........~ UK FIN +~ +--++LUX ~.
• NOR + ITA?'-=.. COL FR1 -D~ A WE +. -CR ~"I' ~ IRE ... • JAM
_ BEL + - ' + Ii 0 ~ ~ ~
__ ++-+ "VEN -TRI
NET JPN ~+ -1
c ::>
--l. -1 " ~ " .., ,f
"..,,+ ".,.. AUT -
+ SWI _ AUL - / CAN -2
, GER -++ ..
I US
-3 I
-2 -1 o Executives-Parties Dimension
Fig. 14.2 Shifts on the two-dimensional map by twenty-six democracies from the period before 1971 to the period 1971-96
lived to longer-lived cabinets, and to a slight reduction in the effective number of parties-only slightly counterbalanced by more proportional election results in the second period. Jamaica moved in the same direction and about the same distance, but from an already strongly majoritarian early period; its party system changed from roughly a two-party system to a one-anda-half party system, and the disproportionality of its elections escalated from about 9 percent to more than 21 percent. Norway
2
ir,
,,'I i'
i
,,[:'1
" i I ! : ~ I'
1,,' 11' .. '
I"l! i', I'
il!t'
256 TWO-DIMENSIONAL CONCEPTUAL MAP
and Sweden moved in the other direction: more minority and coalition cabinets, shorter cabinet duration, increases in the effective number of parties, and lower disproportionality; Sweden's slight shift on the federal-unitary dimension mainly reflects its adoption ofunicameralism in 1970.
Belgium, France, and Venezuela experienced significant changes on both dimensions. Belgium moved down, mainly due to the adoption of judicial review, and to the left, largely caused by an increase in oversized cabinets and a sharp increase in multipartism from a roughly three-party to a five-and-a-half party system. Most of France's move was toward greater consensus on the federal-unitary dimension, reflecting its more rigid constitution and active judicial review from J 974 on and its decentralization after 1981-counterbalanced, however, by a decrease in the independence of the Bank of France; the small shift to the left was primarily caused by small increases in multipartism and proportionality. Finally, Venezuela became more majoritarian on the executives-parties dimension mainly as a result of having fewer coalition and oversized cabinets and the change from an approximately four-party to a three-paity system; the shift away from majoritarianism on the federal-unitary dimension reflects the substantial increase in the legal independence of the central bank.
All of the other countries experienced less change, although these changes may loom larger when compared with changes in the other direction in neighboring countries. For instance, Peter Mair (1994, 99) has argued that, while the trend toward less consensus democracy in the Netherlands on the executivesparties dimension since the early 1970s may not have been all that impressive by itself, "many of the other European democracies seem to have adopted a more consensual style of politics"rendering the Dutch shift away from consensus a more notable development in relative terms. Figure 14.2 bears out Mair's point: especially compared with the shifts toward consensus by all of the smaller democracies in northwestern Europe (except
TWO-DIMENSIONAL CONCEPTUAL MAP 257
Luxembourg), the change in the other direction by the Nether-lands presents a sizable contrast. '
The second-period (1971-96) scores of the twenty-six democracies on the two dimensions, introduced in this chapter, are used again in the next two chaptefs (together with the scores for the other ten democracies that are covered from only a few years before or after 1970 on). These chapters analyze the consequences that type of democracy may have for the effectiveness, democratic character, and general policy orientation of governments. Reliable data on these variables are generally available only for recent decades; moreover, focusing on the more recent period enables us to include as many of the thirty-six democracies as possible in the analysis. It therefore also makes sense to measure the degrees of consensus or majoritarianism of the twenty-six longer-term democracies in terms of their characteristics in the second period.
out adequate empirical examination, perhaps because its logic.appears to be so strong that no test was thought to be needed. Forinstance, I have already called attention (in Chapter 5) to LOWell's (1896) assertion that it was a self-evident "axiom" that oneparty majority cabinets were needed for effective policy-making.The first part of the conventional wisdom, which concerns democratic quality, is discussed in the next chapter. In this chapter Icritically examine the second part, which posits a link betweenmajoritarian democracy and effective decision-making.
Hypotheses and Preliminary Evidence
The theoretical basis for Lowell's axiom is certainly not implausible: concentrating political power in the hands of a narrow majority can promote unified, decisive leadership andhence coherent policies and fast decision-making. But there areseveral counterarguments. Majoritarian governments may beable to make decisions faster than consensus governments, butfast decisions are not necessarily wise decisions. In fact, theopposite may be more valid, as many political theorists-notably the venerable authors of the Federalist Papers (Hamilton,Jay, and Madison 1788)-have long argued. The introduction ofthe so-called poll tax, a new local government tax in Britain inthe 1980s, is a clear example of a policy, now universally acknowledged to have been a disastrous policy, that was the product of fast decision-making; in all probability, the poll tax wouldnever have been introduced had it been more carefully, andmore slowly, debated (Butler, Adonis, and Travers 1994).
Moreover, the supposedly coherent policies produced bymajoritarian governments may be negated by the alternation ofthese governments; this alternation from left to right and viceversa may entail sharp changes in economic policy that are toofrequent and too abrupt. In particular, S. E. Finer (1975) hasforcefully argued that successful macroeconomic managementrequires not so much a strong hand as a steady one and that PR
2S9MACRO.ECONOMIC MANAGEMENT AND VIOLENCE
Macro-Economic Managementand the Control of Violence
CHAPTER 15
Does Consensus DemocracyMake a Difference?
In this chapter and the next I deal with the "so what?"question: does the difference between majoritarian and consensus democracy make a difference for the operation of democracy, especially for how well democracy works? The conventional wisdom-which is often stated in terms of the relativeadvantages of PR versus plurality and majority elections butwhich can be extended to the broader contrast between consensus and majoritarian democracy along the executives-partiesdimension-is that there is a trade-off between the quality andthe effectiveness of democratic government. On one hand, theconventional wisdom concedes that PR and consensus democracy may provide more accurate representation and, in particular, better minority representation and protection of minorityinterests, as well as broader participation in decision-making.On the other hand, the conventional wisdom maintains that theone-party majority governments typically produced by pluralityelections are more decisive and hence more effective policymakers. This view is reflected in the adage, recently restated bySamuel Beer (1998, 25), that "representative government mustnot only represent, it must also govern"-with its clear implication that representativeness comes at the expense of effectivegovernment.
Conventional wisdom has long been widely accepted with-
and coalition governments are better able to provide steady, centrist polioy-making." Policies supported by a broad consensus,furthermore, are more likely to be carried DUt successfully and toremain on course than policies imposed by a "decisive" government against the wishes of important sectors Dfsociety, Finally,for maintaining civil peace in divided societies, conciliationand compromise-egoals that require the greatest possible inclusion of contending groups in the decision-making process-earsprobably much more important than making snap decisions.These counterarguments appear to be at least slightly strongerthan the argument in favor of majoritarian government that isbased narrowly Dnthe speed and coherence of decision-making,
The empirical evidence is mixed. Peter Katzenstein (1985)and Ronald Rogowski (1987) have shown that small countriesadopted PR and corporatist practices to compensate for the disadvantages Df their small size in international trade; that is,these consensus elements served as sources of strength insteadof weakness. Richard Rose (1992) and Francis G. Castles (1994)find no significant differences in economic growth, inflation,and unemployment between PR and nDn-PR systems amDng theindustrialized democracies. Nouriel Roubini and Jeffrey D.Sachs (1989) do find a clear connection between multipartycoalition government and governments with a short averagetenure-both characteristics of consensus democracy-son onehand and large budget deficits on the other: their methods andconclusions, however, have been challenged by Stephen A. BDrrelli and Terry J. Royed (1995) and by Sung Deuk Hahm, MarkS. Kamlet, and David C. Mowery (1996). Markus M. L. Crepaz(1996) finds that, in the OECD countries, consensual institutions are not related to economic growth but do have significantly favorable effects on inflation, unemployment, and thenumber of working days lost as a result of industrial unrest.Finally, G. Bingham Powell (1982) finds that "representational"
1. ThatPR also provides greater electoral justice is an added bonus but, inFiner's eyes, not the main advantage.
261MACRO-ECONOMIC MANAGEMENT AND VIOLENCE
democraotes-csimilar to what I call consensus democracies->have a better record than majoritarian democracies with regardto controlling violence.s
The above tests all had to do with macroeconomic management and the control of violence, These are excellent performance indicators both because they involve crucial functions ofgovernment and because precise quantitative data are available.I therefore also focus on these two sets of variables. Because thetheoretical arguments and the empirical evidence are mixed butgive a slight edge to consensus democracy, my working hypothesis is that consensus democracy produces better results-butwithout the expectation that the differences will be very strongand significant. Another reason not to expect major differencesis that economic success and the maintenance of civil peace arenot solely determined by government policy, As far as Britishmacroeconomic policy is concerned, for instance, Rose (1992,11) points out that "many influences upon the economy areoutside the control of the government.... Decisions taken independently of government by British investors, industrialists,consumers and workers can frustrate the intentions of the government of the day. In an open International economy, Britain isincreasingly influenced tDD by decisions taken in Japan, Washington, New York, Brussels, DrFrankfurt."
Rose's point should obviously not be exaggerated: the factthat governments are nDt in full control does not mean that theyhave no control at all. When the economy performs well-wheneconomic growth is high, and inflation, unemployment, and
2. Powell (1982) also examines the performance ofdemocracies with regardto voter turnout and government stability. He finds that voter participation inelections is better in the representational systems-a topic to which I return inChapter l6-but that majoritarian democracies have a better record on government stability. Note, however, that Powell's measure of government stability isexecutive durability. As discussed in Chapter 7, this kind of durability is indeeda good indicator of political power, but executive strength does not necessarilyspell effective policy-making. A strong executive mainly means relatively weaklegislative power, and an imbalance in executive-legislative power favoring theexecutive is simply part of the syndrome ofmajoritarian characteristics.
MACRO-ECONOMIC MANAGEMENT AND VIOLENCE260
budget deficits 81'e low-governments routinely claim credit forthis happy state of affairs. And voters 81'e known to reward government parties in good economic times and to punish themwhen. the economy is in poor shape. The Maastricht Treaty, concluded in 1992 among the members of the European Union, wasalso based on the assumption that govemments do have the capacity to control macroeconomic forces because it obligated thesignatories inter alia to keep inflation low-defined as not exceeding the average of the three countries with the lowest inflation rates by more than 1.5 percent-and to keep their nationalbudget deficits below 3 percent of gross domestic product.
Rose's argument, however, does point up the need to takethese other influences into account. To the extent that they 81'eidentifiable and measurable variables, they shouldbe controlledfor in the statistical analyses. For economic performance, thelevel of economic development is such a potentially iroportantexplanatory variable. For the control of violence, the degree ofsocietal division should be controlled for, because deep divisions make the maintenance of public order and peace moredifficult. A third variable whose influence must be checked ispopulation, if only because our democracies differ widely inthis respect. Itmay also be hypothesized that 181'ge countries facegreater problems of public order than smaller ones. In other respects, it is not clear whether size is a favorable or an unfavorable factor. L81'ge countries obviously have greater power ininternational relations, which they can use, for instance, togain economic benefits for their citizens. And yet, greater international influence also means more responsibility and hencehigher expenses, especially for military purposes.
Fortuitous events may also affect economic success, such asthe good luck experienced by Britain and Norway when theydiscovered oil in the North Sea. The effects of such fortuitousevents as well as external influences that cannotbe clearly identified and controlled for can be minimized when economic performance is examined over a long period and for many coun-
263MACRO-ECONOMIC MANAGEMENT AND VIOLENCE
Consensus Democracy and SuccessfulMacro-Economic Management
Table 15.1 shows the results of the bivariate regression analyses of the effect of consensus democracy on six groups of macroeconomic variables (as well as on four indicators of violence,discussed in the next section). The independent variable is thedegree of consensus democracy on the executives-parties dimension; because all of the economic variables 81'e for the 1970sor later years, the consensus variable used is the degree of consensus democracy in the period 1971-96. The estimated regression coefficient is the increase or decrease in the dependentvariable for each unit increase in the independent variable-dnour case, each increase by one standard deviation of consensusdemocracy. Because the range in the degrees of consensus democracy is close to four standard deviations (see Figure 14.1),the distance between the "average" consensus democracy andthe "average" majoritarian democracy is about two standard deviations. Therefore, in answer to the question "How much difference does consensus democracy make?" the reply can be-
tries. These two desiderata 81'e frequently in conflict: extendingthe period of analysis often means that some countries have to beexcluded. And they may both conflict with a third desideratum-that the most accurate and reliable data be used. Therefore, in the analysis below, I usually report the results for different periods, different sets of countries, and different types ofdata in order to provide as complete and robust a test of the hypotheses as possible. Finally, in testing the influence of the typeofdemocracy on the economic performance variables, I limit thepotential disturbing iropact of external forces by excluding thefive smallest democracies with populations of less than halfa million-the Bahamas, Barbados, Iceland, Luxembourg andMalta-from the analysis because these small countries 81'e obviously extremely vulnerable to international influences.
MACRO.ECONOMIC MANAGEMENT AND VIOLENCE262
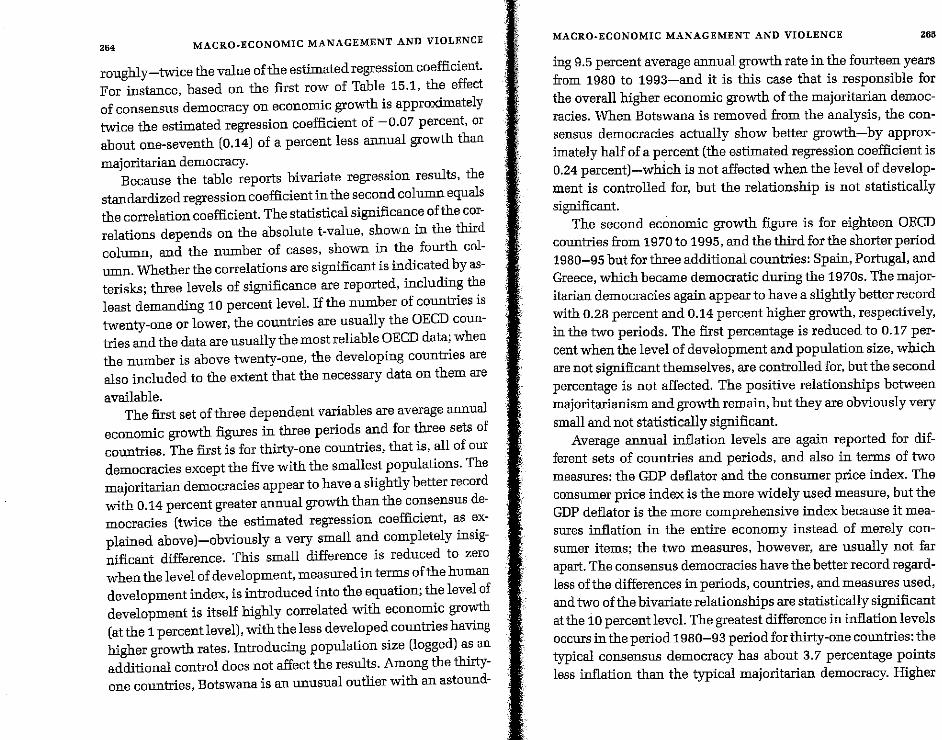
roughly-twice the value of the estimated regression coefficient.For instance, based on the first row of Table 15.1, the effectof consensus democracy on economic growth is approximatelytwice the estimated regression coefficient of -0.07 percent, orabout one-seventh (0.14) of a percent less annual growth thanmajoritarian democracy.
Because the table reports bivariate regression results, thestandardized regression coefficient in the second column equalsthe correlation coefficient. The statistical significance of the correlations depends on the absolute t-value, shown in the thirdcolumn, and the number of cases, shown in the fourth column. Whether the correlations are significant is indicated by asterisks; three levels of significance are reported, including theleast demanding 10 percent level. If the number of countries istwenty-one or lower, the countries are usually the DECD countries and the data are usually the most reliable DECD data; whenthe number is above twenty-one, the developing countries arealso included to the extent that the necessary data on them are
available.The first set of three dependent variables are average annual
economic growth figures in three periods and for three sets ofcountries. The first is for thirty-one countries, that is, all of ourdemocracies except the five with the smallest populations. Themajoritarian democracies appear to have a slightly better recordwith 0.14 percent greater annual growth than the consensus democracies (twice the estimated regression coefficient, as explained above)-obviously a very small and completely insignificant difference. This small difference is reduced to zerowhen the level of development, measured in terms of the humandevelopment index, is introduced into the equation; the level ofdevelopment is itself highly correlated with economic growth(at the 1 percent level), with the less developed countries havinghigher growth rates. Introducing population size (logged) as anadditional control does not affect the results. Among the thirtyone countries, Botswana is an unusual outlier with an astound-
ing 9.5 percent average annual growth rate in the fourteen yearsfrom 1980 to 1993-and it is this case that is responsible forthe overall higher economic growth of the majoritarian democracies. When Botswana is removed from the analysis, the consensus democracies actually show better growth-by approximately half of a percent (the estimated regression coefficient is0.24 percent)-which is not affected when the level of development is controlled for, but the relationship is not statisticallysignificant.
The second economic growth figure is for eighteen DECDcountries from 1970 to 1995, and the third for the shorter period1980-95 but for three additional countries: Spain, Portugal, andGreece, which became democratic during the 1970s. The majoritarian democracies again appear to have a slightly better recordwith 0.28 percent and 0.14 percent higher growth, respectively,in the two periods. The first percentage is reduced to 0.17 percent when the level of development and population size, whichare not significant themselves, are controlled for, but the secondpercentage is not affected. The positive relationships betweenmajoritarianism and growth remain, but they are obviously verysmall and not statistically significant.
Average annual inflation levels are again reported for different sets of countries and periods, and also in terms of twomeasures: the GDP deflator and the consumer price index. Theconsumer price index is the more widely used measure, but theGDP deflator is the more comprehensive index because it measures inflation in the entire economy instead of merely consumer items; the two measures, however, are usually not farapart. The consensus democracies have the better record regardless of the differences in periods, countries, and measures used,and two of the bivariate relationships are statistically significantat the 10 percent level. The greatest difference in inflation levelsoccurs in the period 1980-93 period for thirty-one countries: thetypical consensus democracy has about 3.7 percentage pointsless inflation than the typical majoritarian democracy. Higher
265MACRO~ECONOMICMANAGEMENT AND VIOLENCEMACRO-ECONOMIC MANAGEMENT AND VIOLENCE264
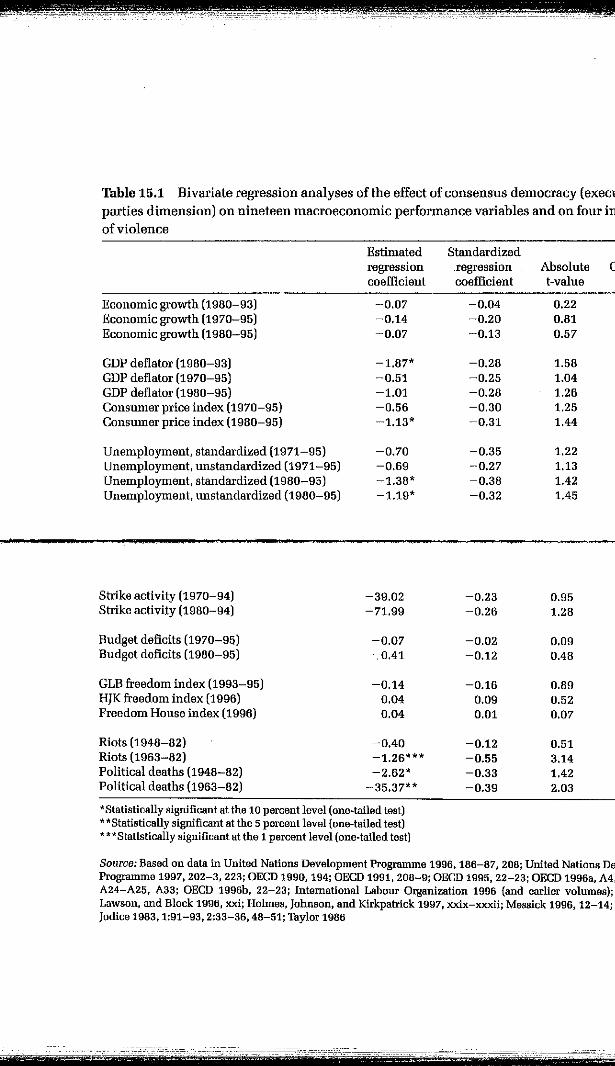
Table 15.1 Bivariate regression analyses of the effect of consensus democracy (executives
parties dimension) on nineteen macroeconomic performance variables and on four indicators.
of violence
Estimated Standardizedregression .regression Absolute Countriescoefficient coefficient t-value (N)
Economic growth (1980-93) -0.07 -0.04 0.22 31Economic growth (1970-95) -0.14 -0.20 0.81 18Economic growth (1980-95) -0.07 -0.13 0.57 21
GDP deflator (1980-93) -1.87* -0.28 1.58 31GDP deflator (1970-95) -0.51 -0.25 1.04 18GDP deflator (1980-95) -1.01 -0.28 1.26 21Consumer price index (1970-95) -0.56 -0.30 1.25 18Consumer price index (1980-95) -1.13* -0.31 1.44 21
Unemployment, standardized (1971-95) -0.70 -0.35 1.22 13Unemployment, unstandardized (1971-95) -0.69 -0.27 1.13 18Unemployment, standardized (1980-95) ~1.38* -0.38 1.42 14Unemployment, unstandardized (1980-95) -1.19* -0.32 1,45 21
, -1I
Strike activity (1970-94) -39.02 -0.23 0.95 18Strike activity (1980-94) -71.99 -0.26 1.28 25
Budget deficits (1970-95) -0.07 -0.02 0.09 16Budget deficits (1980-95) -c0,41 -0.12 0.48 19
GLBfreedom index (1993-95) -0.14 -0.16 0.89 32HJKfreedom index (1996) 0.04 0.09 0.52 35Freedom House index (1996) 0.04 0.01 0.07 26
Riots (1948-82) -0.40 -0.12 0.51 19Riots (1963-82) -1.26*** -0.55 3.14 25Political deaths (1948-82) -2.62* -0.33 1.42 19Political deaths (1963-82) -35.37** -0.39 2.03 25
*Statistioally significant at the 10 percent level (one-tailed test)**Statistically significant at the 5 percent level (one-tailed test)***Statistically significant at the 1 percent level (one-tailed test)
Source: Based on data in United Nations Development Programme 1996, 186-67, 208; United Nations DevelopmentProgramme 1997, 202-3, 223; DECD 1990, 194; DECD 1991, 208-9; DECD 1995, 22-23; DECD19960, A4, A17, A19,A24-A25, A33; DECO 1996b, 22-23; International Labour Organization 1996 (and earlier volumes); Gwartney,Lawson, and Block 1996, xxi; Holmes, Johnson, and Kirkpatrick 1997, xxix-xxxii; Messick 1996, 12-14; Taylor andIodice 1983, 1:91-93, 2:33-36, 48-51; Taylor 1986
levels of development and, more weakly, population size areassociated with lower inflation, but when these variables arecontrolled for, the negative relationship between consensus democracy and inflation remains significant.
For the OECD countries, there is a statistically significantnegative bivariate correlation between consensus democracyand inflation in the period 1980-95'when the consumer priceindex is used to measure inflation. When the level of development and population size are controlled for, all of the correlations become statistically significant: at the 5 percent level inthe period 1970-95 and at the 1 percent level in the period1980-95. Two countries are outliers with unusually high average inflation rates: Italy in the period 1970-95 with a GDP deflator of 11.4 percent and consumer price inflation of 10.5 percent,and Greece in the period 1980-95 with inflation percentages of16.9 and 17.8 percent according to the two measures. Whenthese countries are removed from the analysis, however, andwith the controls still in place, all four correlations remain significant, three at the 1 percent level.
Unemployment statistics are available for the OECD countries, and Table 15.1 reports the results for the usual two periodsand for two measures: the standardized unemployment percentages, which are fully comparable across the different countriesbut are available for fewer countries, and the unstandardizedand hence somewhat less reliable percentages. Here again, theconsensus democracies have the better record and the two bivariate correlations for the period 1980-95 are significant at the10 percent level. However, Spain had exceptionally high unemployment in the period 1980-95-annual averages of 18.4 and18.8 percent according to the standardized and unstandardizedmeasures, respectively-and when it is removed from the analysis, the relationships are no longer significant. Controlling forthe level of development and population size strengthens all ofthe correlations slightly but not enough to give them statisticalsignificance. However, all of the relationships remain negative,
3. I should point out that the type of democracy and strike levels are notdefined completely independently of each other. I relied on Siaroff's (1998)measure of the degree of interest group pluralism and corporatism, which isbased in parton differential strike levels in different countries; and the degree ofcorporatism is a component of the degree of consensus democracy. However,only one-eighth of Siaroffs measure is based on strikes, and only one-fifth of thedegree of corporatism goes into the overall measure of consensus democracy.Hence, only 2.5 percent of the degree of consensus democracy is defined interms oflow strike levels.
269MACRO-ECONOMIC MANAGEMENT AND VIOLENCE
indicating that the consensus democracies performed at leastslightly better.
Strike activity is measured in terms of working days lost perthousand workers per year. The differences between countrieson this variable are huge; in the period 1970-94, for instance, thenumbers for Italy and Canadawere 570 and497 compared with 1and 5 for Switzerland and Austria. The countries included in theyears 1970-94 are mainly OECD countries but also Israel. Forthe period 1980-94, not only Spain, Portugal, and Greece butalso India, Costa Rica, Mauritius, and Trinidad were added. Theestimated regression coefficients give the impression of a considerablybetter record for the consensus democracies comparedwith the majoritarian countries: they lost about 78 and 144 fewerworking days per thousand workers in the two periods. Thedifferences are not statistically significant, however, mainly because there are several big exceptions to the tendency of consensus countries to be less strike-prone than majoritarian democracies: especially majoritarian France with relatively fewstrikes and mainly consensual Finland and Italy with high strikelevels (see also Cornwall 1990, 120-21). Controlling for thelevel of development and population size barely affects theserelationships."
There are also large differences between countries with regard to budget deficits. Italy had the highest annual deficits inboth periods-9.7 and 10.4 percent of gross domestic productwhereas Norway and Finland had, on average, slightbudget surpluses. Overall, the consensus democracies show a somewhat
'I'
MACRO-ECONOMIC MANAGEMENT AND VIOLENCE268
Consensus Democracy and the Control of Violence
The last four performance variables shown in Table 15.1 aremeasures of violence: numbers of riots and numbers of deaths
4. The HJK indexranges fromone (thehighest economic freedom)to five (theleast economic freedom]. Ireversed the signs so that highvalues would indicatehigh degrees of economic freedom. The GLB index is measured on a ten-pointand the Freedom House index on a seventeen-point scale. The three indexes arehighly correlated:r=O.81 between the GLB and HJK indices. r=O.B5 between HJKand Freedom House, and 1'=0.58 between GLB and Freedom House.
better performance, but the differences are not great and notstatistically significant. Controlling for the level of developmentand population size strengthens the correlations considerably,but not enough to make them statistically significant.
Table 15.1 also reports the correlations between consensusdemocracy and three economic freedom indexes-not becauseeconomic freedom itself is an appropriate indicator of macroeconomic performance but because many economists believethat long-term economic growth depends on it. The three indexes were independently developed by James Gwartney, Robert Lawson, and Walter Block (1996) and by Kim R. Holmes,Bryan T. Johnson, and Melanie Kirkpatrick (1997) for most ofthe countries of the world, including most of our thirty-six democracies, and by Freedom House for the larger countries (Messick 1996). The results are mixed: consensus democracy is negatively correlated with the first index and positively with theother two, but the negative correlation is the strongest. However,even this correlation is far from statistically significant.'
The results of these tests of macroeconomic management canbe suromarized as follows: the evidence with regard to economic growth and economic freedom is mixed, but with regardto all of the other indicators of economic performance, the consensus democracies have a slightly better record and a significantly better record as far as inflation is concerned.
271MACRO-ECONOMIC MANAGEMENT AND VIOLENCE
from political violence per million people. These data are onlyavailable for the period from 1948 to 1982. A separate shorterperiod, from 1963 to 1982, was constructed to be able to includecountries that were not yet independent and democratic before1963. Both the longer and shorter periods overlap the two separate periods (1945-70 and 1971-96) for which degrees of consensus democracy were calculated; therefore, the independentvariable for this part of the analysis is the degree of consensusdemocracy in the entire period."
The simple bivariate relationships all show that consensusdemocracy is associated with less violence, and three of the fourcorrelations are statistically significant. This evidence is weakened, however, when controls are introduced and two extremeoutliers are removed. Violence tends to occur more in plural,populous, and less developed societies. The strongest negativerelationship, significant at the 1 percent level, is between consensus democracy and riots in the period 1963-82. When levelof development, degree of societal pluralism, and populationare controlled for, the significance decreases to 5 percent. In theanalyses of the relationship between consensus democracy anddeaths from political violence, the United Kingdom is an extreme outlier in the period 1948-82 as a result of the NorthernIreland problem, and Jamaica is an extreme outlier in the period1963-82 mainly as a result of large-scale violence surroundingthe 1980 election. When the same three controls are introducedand the outliers removed, the statistical significance disappears completely, although both correlations remain negativeshowing at least a slightly better performance of the consensusdemocracies.
5. Because in Israel international and domestic violence cannot be clearlyseparated, I excluded this country from the analysis. Because the degree ofsocietal pluralism is an important control variable, and because most of theviolence in the United Kingdom was concentrated in Northern Ireland, theUnited Kingdom is regarded as a plural society for the purpose of this analysis.
TMACRO-ECONOMIC MANAGEMENT AND VIOLENCE270
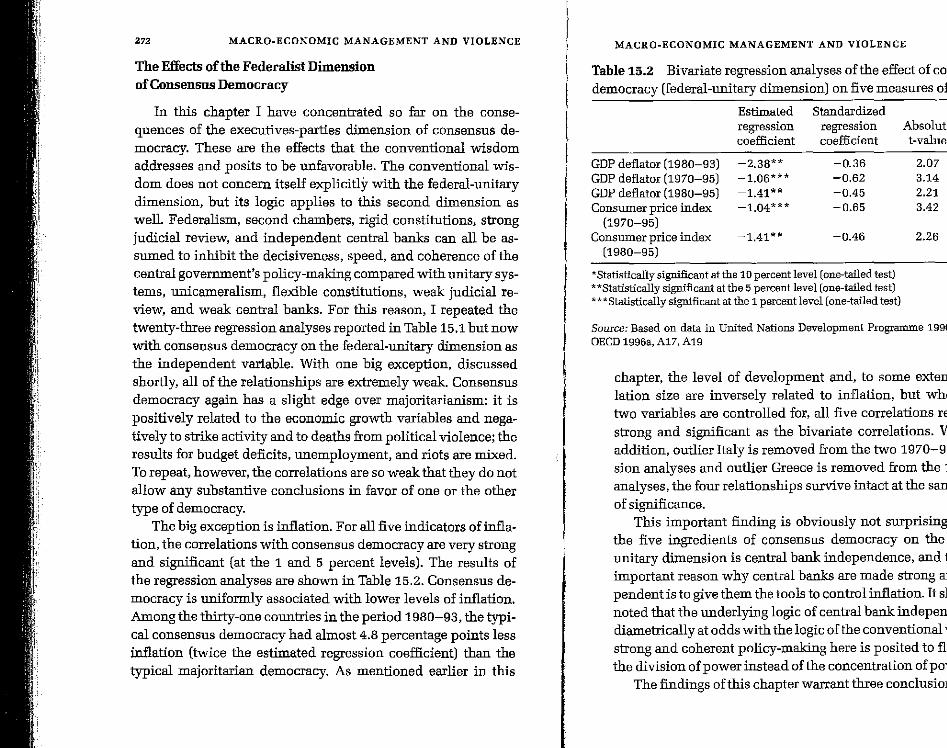
The Effects of the Federalist Dimensionof Consensus Democracy
In this chapter I have concentrated so far on the consequences of the executives-parties dimension of consensus democracy. These are the effects that the conventional wisdomaddresses and posits to be unfavorable. The conventional wisdom does not concern itself explicitly with the federal-unitarydimension, but its logic applies to this second dimension aswell. Federalism, second chambers, rigid constitutions, strongjudicial review, and independent central banks can all be assumed to inhibit the decisiveness, speed, and coherence of thecentral government's policy-making compared with unitary systems, unicameralism, flexible constitutions, weak judicial review, and weak central banks. For this reason, I repeated thetwenty-three regression analyses reported in Table 15.1 but nowwith consensus democracy on the federal-unitary dimension asthe independent variable. With one big exception, discussedshortly, all of the relationships are extremely weak. Consensusdemocracy again has a slight edge over majoritarianism: it ispositively related to the economic growth variables and negatively to strike activity and to deaths from political violence; theresults for budget deficits, unemployment, and riots are mixed.Torepeat, however, the correlations are so weak that they do notallow any substantive conclusions in favor of one or the othertype of democracy.
The big exception is inflation. For all five indicators of inflation, the correlations with consensus democracy are very strongand significant (at the 1 and 5 percent levels). The results ofthe regression analyses are shown in Table 15.2. Consensus democracy is uniformly associated with lower levels of inflation.Among the thirty-one countries in the period 1980-93, the typical consensus democracy had almost 4.8 percentage points lessinflation (twice the estimated regression coefficient) than thetypical majoritarian democracy. As mentioned earlier in this
Source: Based on data in United Nations Development Programme 1996, 186-87, 208;DEeD 1996', A17, A19
"Statistically significant at the 10 percent level (one-tailed test)**Statistically significant at the 5 percent level (one-tailed test)***Statistically Significant at the 1 percent level Cone-tailed test)
273
regression Absolute Countriescoefficient t-value (N)
-0.36 2.07 31-0.62 3.14 18-0.45 2.21 21-0.65 3.42 18
-0.46 2.26 21-1.41**
-2.38**-1.06***
-1.41 **-1.04***
MACRO·ECONOMIC MANAGEMENT AND VIOLENCE
chapter, the level of development and, to some extent, population size are inversely related to inflation, but when thesetwo variables are controlled for, all five correlations remain asstrong and significant as the bivariate correlations. When, inaddition, outlier Italy is removed from the two 1970-95 regression analyses and outlier Greece is removed from the 1980-95
analyses, the four relationships survive intact at the same levelsof significance.
This important finding is obviously not surprising. One ofthe five ingredients of consensus democracy on the federalunitary dimension is central bank independence, and the mostimportant reason why central banks are made strong and independent is to give them the tools to control inflation. It shouldbenoted that the underlying logic of central bank independence isdiametrically at odds with the logic of the conventional wisdom:strong and coherent policy-making here is posited to flow fromthe division of power instead of the concentration of power.
The findings of this chapter warrant three conclusions. First,
Table 15.2 Bivariate regression analyses of the effect of consensusdemocracy (federal-unitary dimension) on five measures of inflation
Estimated Standardizedregressioncoefficient
GDP deflator(1980-93)GDP deflator(1970-95)GDP deflator(1980-95)Consumer price index
(1970-95)Consumer price index
(1980-95)
TI
MACRO-ECONOMIC MANAGEMENT AND VIOLENCE272
on balance, consensus democracies have a better performancerecord than majoritarian democracies, especially with regard tothe control of inflation but also, albeit much more weakly, withregard to most of the other macroeconomic performance variables and the control of violence; majoritarian democracies donot have an even slightly better record on any of the six groupsof performance variables. Second, however, the overall resultsare relatively weak and mixed; when controls were introducedand outliers were removed, few statistically significant correlations were found. Hence, the empirical results do not permitthe definitive conclusion that consensus democracies are betterdecision-makers and better policy-makers than majoritariansystems. Therefore, third, the most important conclusion of thischapter is negative; majoritarian democracies are clearly not superior to consensus democracies in managing the economy andin maintaining civil peace. This means that the second part ofconventional wisdom does not-or not yet-need to be completely reversed: it is not proven that consensus democracies areactually better at governing. What is proven beyond any doubt,however, is that the second part of the conventional wisdom isclearly wrong in claiming that majoritarian democracies are thebetter governors. The first part of the conventional wisdom,which concedes that consensus democracies are better at representing, is the subject of the next chapter.
27. MACRO-ECONOMIC MANAGEMENT AND VIOLENCE
TI
I[
[
I
CHAPTER 16
The Quality of Democracy and a"Kinder, Gentler" Democracy
Consensus Democracy Makesa Difference
The conventionalwisdom, cited in the previous chapter, argues-erroneously, as 1have shown-that majoritarian democracy is better at governing, but admits that consensus democracy is better at representing-in particular, representingminority groups and minority interests, representing everyonemore accurately, and representing people and their interestsmore inclusively. In the first part of this chapter 1examine several measures of the quality of democracy and democratic representation and the extent to which consensus democracies perform better than majoritarian democracies according to thesemeasures. In the second part of the chapter 1discuss differencesbetween the two types of democracy in broad policy orientations. Here 1 show that consensus democracy tends to be the"kinder, gentler" form of democracy. 1borrow these terms fromPresident George Bush's acceptance speech at the Republicanpresidentialnominating convention inAugust 1988, inwhich heasserted: "1want a kinder, and gentler nation" (New York TImes,August 19, 1988, A14). Consensus democracies demonstratethese kinder and gentler qualities in the following ways: they aremore likely to be welfare states; they have a better record withregard to the protection of the environment; they put fewer people in prison and are less likely to use the death penalty; and the
I' lH,
!·il, I1::1
consensus democracies in the developed world are more generous with their economic assistance to the developing nations.
Consensus Democracy and Democratic Quality
Table 16.1 presents the results of bivariate regression analyses of the effect of consensus democracy on eight sets of indicators of the quality of democracy. The organization of the table issimilar to that of Tables 15.1 and 15.2 in the previous chapter.The independent variable is the degree of consensus democracyon the executives-parties dimension, generally in the period1971-96 (unless indicated otherwise). The first two indicatorsare general indicators of democratic quality. Many studies haveattempted to distinguish between democracy and nondemocratic forms of government not in terms of a dichotomy but in termsof a scale with degrees of democracy from perfect democracy tothe complete absence of democracy. These degrees of democracy can also be interpreted as degrees of the quality of democracy: how democratic a country is reflects the degree to which itapproximates perfect democracy. Unfortunately, most of theseindexes cannot be used to measure different degrees of democratic quality among our thirty-six democracies because there isinsufficient variation: all or most of our democracies are giventhe highest ratings. For instance, both the ratings of the FreedomHouse Survey Team (1996) and those by Keith Jaggers and TedRobert Gurr (1995), which I used in Chapter 4 to defend the selection of the thirty-six democracies for the analysis in this book,place almost all of these countries in their highest category.
There are two exceptions. One is Robert A. Dahl's (1971,
231-45) Polyarcby; in which 114 countries are placed in thirtyone scale types from the highest type of democracy to the lowesttype of nondemocracy as of approximately 1969. All of our democracies that were independent and democratic at that time,except Barbados, Botswana, and Malta, were rated by Dahl-atotal of twenty-six of our thirty-six democracies-and their rat-
1. The independent variable is consensus democracy in the 1945-70 period. On Dahl's scale, 1 is the highest and 9 the lowestpoint; Ireversed the sign inorderto make the higher values represent higher degrees of democratic quality.
277QUALITY OF DEMOCRACY
ings span nine scale types. To give a few examples, the highestsummary ranking goes to Belgium, Denmark, and Finland; Austria and Germany are in the middle; and Colombia and Venezuela at the bottom. Table 16.1 shows that consensus democracy isstrongly and significantly correlated (at the 1 percent level) withthe Dahl rating of democratic quality.' The dlfference betweenconsensus and majoritarian democracy is more than three points(twice the estimated regression coefficient) on the nine-pointscale. Dahl's rating contains a slight bias in favor of consensusdemocracy because it is partly based on a higher ranking ofmultiparty compared with two-party systems. However, this difference represents only a third of the variation on one of tencomponents on which the rating is based; ifit could somehowbediscounted, the very strong correlation between consensus democracy and the rating of democratic quality would only bereduced marginally. A more serious potential source of bias isthat the Third World democracies are all placed in the lowestthree categories. However, when the level of development isused as a control variable, the estimated regression coefficientgoes down only slightly (to 1.28 points) and the correlation remains statistically signilicant at the 1 percent level.
The second rating of democratic quality is the average ofTatu Vanhanen's (1990, 17-31) indexes of democratization foreach year from 1980 to 1988 for almost all of the countries in theworld, including all thirty-six of our democracies. Vanhanenbases his index on two elements: the degree of competition,defined as the share of the vote received by all parties except thelargest party, and participation, defined as the percentage of thetotal population that voted in the most recent election; these twonumbers are multiplied to arrive at the overall index. The valuesof the index range from a high of 43.2, for Belgium, to a lowof zero; for our thirty-six countries the lowest value is 5.7 for
QUALITY OF DEMOCRACY276
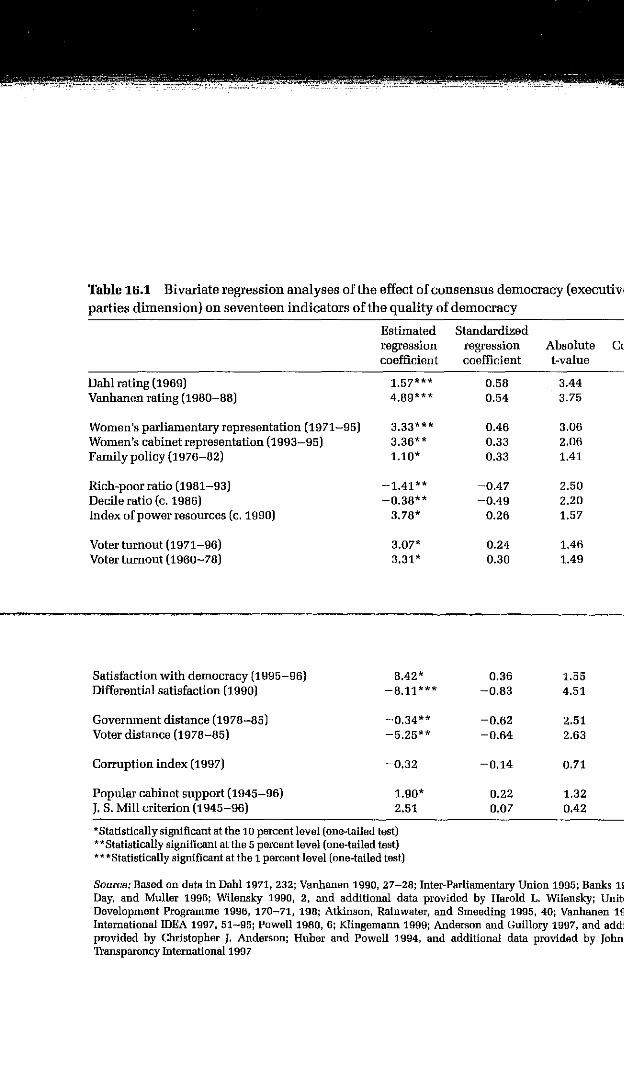
Table 16.1 Bivariate regression analyses ofthe effect of consensus democracy (executives
parties dimension) on seventeen indicators of the quality of democracy
Estimated Standardizedregression regression Absolute Countriescoefficient coefficient t-value (N)
Dahl rating (1969) 1.57*** 0.58 3.44 26Vanhanen rating (1980-88) 4.89*** 0.54 3.75 36
Women's parliamentary representation (1971-95) 3.33*** 0.46 3.06 36Women's cabinet representation (1993-95) 3.36** 0.33 2.06 36Family policy (1976-82) 1.10* 0.33 1.41 18
Rich-poor ratio (1981-93) -1.41 ** -0.47 2.50 24Decile ratio (c. 1986) -0.38** -0.49 2.20 17Index of power resources (c. 1990) 3.78* 0.26 1.57 36
Voter turnout (1971-96) 3.07* 0.24 1.46 36Voterturuont (1960-78) 3.31* 0.30 1.49 24
~~o. -_.~_~__ • _
Satisfaction with democracy (1995-96) 8.42* 0.36 1.55 18Differential satisfaction (1990) -8.11*** -0.83 4.51 11
Govermnent distance (1978-85) -0.34** -0.62 2.51 12Voter distance (1978-85) -5.25** -0.64 2.63 12
Corruption index (1997) -0.32 -0.14 0.71 27
Popular cabinet support (1945-96) 1.90* 0.22 1.32 35J. S. Mill criterion (1945-96) 2.51 0.07 0.42 35
"Statistically significant at the 10 percent level (one-tailed test)'"'" Statistically significant at the 5 percent level (one-tailed test)'"'"*Statistically significant at the 1 percent level (one-tailed test)
Source: Based on data in Dahl 1971, 232; Vanhanen 1990, 27-28; Inter-Parliamentary Union 1995; Banks 1993; Banks,Day, and Muller 1996; Wilensky 1990, 2, and additional data provided by Harold L. Wilensky; United NationsDevelopment Programme 1996, 170-71, 198; Atkinson, Rainwater, and Smeeding 1995, 40; Vanhanen 1997, 86-89;International IDEA 1997, 51-95; Powell 19BO, 6; Klingemann 1999; Anderson and Guillory 1997, and additional dataprovided by Christopher J. Anderson; Huber and Powell 1994, and additional data provided by John D. Huber;Transparency International 1997
-l
Botswana. The first element effectively distinguishes one-partyrule from democratic electoral contestation, but it also necessarily suffers from the bias that two-party systems tend to getlower scores than multiparty systems. Moreover, this bias affects one of the two components of Vanhanen's index and therefore has a much greater impact than the slight bias in Dahl'sindex. Because the Vanhanen index is widely used and becauseit is available for all of our democracies, I report the result of itsregression on consensus democracy in Table 16.1 anyway. Thecorrelation is impressively strong and remalns strong at thesame level of significance when the level of development iscontrolled for and when Botswana, which is somewhat of anoutlier, is removed from the analysis. However, its sizable biasin favor of multiparty systems makes the Vanhanen index a lesscredible index of democratic quality than the Dahl index.
Women's Representation
The next three indicators in Table 16.1 measure women'spolitical representation and the protection of women's interests.These are important measures of the quality of democratic representation in their own right, and they can also serve as indirect proxies of how well minorities are represented generally.That there are so many kinds of ethnic and religious minorities in different countries makes comparisons extremely difficult, and it therefore makes sense to focus on the "minority" ofwomen-a political rather than a numerical minority-cthat isfound everywhere and that can be compared systematicallyacross countries. As Rein Taagepera (1994, 244) states, "Whatwe know about women's representation should [also] be applicable to ethnoracial minorities."
The average percentage of women elected to the lower oronly houses of parliament in all elections from 1971 to 1995 inour thirty-six democracies ranges from a high of 30.4 percent inSweden to a IDw of 0.9 percent in Papua New Guinea. These
2. The percentages are based on data in the Political Handbook of theWorld (Banks 1993; Banks, Day, and Muller 1996); 1993 is the first year forwhich the Political Handbookreports the gender of cabinet members.
281QUALITY OF DEMOCRACY
differences are strongly and significantly related to the degree ofconsensus democracy. The percentage of women's parliamentary representation is 6.7 percentage points higher (agaln, twicethe estimated regression coefficient) in consensus democraciesthan in majoritarian systems. Women tend to be better represented in developed than in developing countries, but when thelevel of development is controlled for, the relationship betweenconsensus democracy and women's legislative representationweakens only slightly and is still significant at the 1 percentlevel. It can be argued that in presidential systems the percentage of women's representation should not be based only onwomen's election to the legislature but also, perhaps equally, ontheir election to the presidency. If this were done, the relationship between consensus democracy and women's political representation would be reinforced because not a single womanpresident was elected in Colombia, Costa Rica, France, theUnited States, and Venezuela in the entire period under consideration and because all five presidential democracies are on themajoritarian side of the spectrum (see Figures 14.1 and 14.2).
The pattern is similar for the representation of women incabinets in two recent years-1993 and 1995-although the correlation is significant only at the 5 percent level," The percentages range from 42.1 percent in Norway to 0 percent in PapuaNew Guinea. Here again, the level of development is also astrong explanatory variable, but controlling for it does not affectthe correlation between consensus democracy and women'scabinet representation.
As a measure of the protection and promotion of women'sinterests, I examined Harold L. Wilensky's (1990) rating of theindustrialized democracies with regard to the innovativenessand expansiveness of their family policies-a matter of specialconcern to women. On Wilensky's thirteen-point scale, from a
-,-
IQUALITY OF DEMOCRACY280
maximum of twelve to a minimum of zero, France and Swedenhave the highest score of eleven points and Australia and Ireland the lowest score of one point.' Consensus democraciesscore more than two points higher on the scale, and the correlation is significant at the 10 percent level and unaffected by levelof development. France is an unusual deviant case: it is a mainlymajoritarian system but receives one of the highest familypolicy scores. When it is removed from the analysis, the correlation becomes stronger and is statistically significant at the 5percent level.
Political Equality
Political equality is a basic goal of democracy, and the degreeof political equality is therefore an important indicator of democratic quality. Political equality is difficult to measure directly,but economic equality can serve as a valid proxy, since politicalequality is more likely to prevail in the absence of great economic inequalities: "Many resources that flow directly or indirectly from one's position in the economic order can be converted into political resources" (Dahl 1996, 645). The rich-poorratio is the ratio of the income share of the highest 20 percent tothat of the lowest 20 percent of households. The United NationsDevelopment Programme (1996) has collected the relevant statistics for twenty-four of our democracies, including six of thedeveloping countries: Botswana, Colombia, Costa Rica, India,Jamaica, and Venezuela. The ratio varies between 16.4 in highlyinegalitarian Botswana and 4.3 in egalitarian Japan. Consensusdemocracy and inequality as measured by the rich-poor ratio are
3. Wilensky's (1990, 2) ratings are based on a five-point scale, from four tozero, "for each of three policy clusters: existence and length of maternity andparental leave, paid and unpaid; availability and accessibility of public daycareprograms and government effort to expand daycare; and flexibility ofretirementsystems. They measure government action to assure care of children and maximize choices in balancing work and family demands for everyone."
283QUALITY OF DEMOCRACY
negatively and very strongly related (statistically significant atthe 5 percent level and almost at the 1 percent level). The difference between the average consensus democracy and the averagemajoritarian democracy is about 2.8. The more developed countries have less inequality than the developing countries; whenthe level of development is controlled for, the correlation between consensus democracy and equality weakens only slightlyand is still significant at the 5 percent level. When, in addition,the most extreme case of Botswana is removed from the analysis, the relationship remains significant at the same level.
The decile ratio is a similar ratio of income differences: theincome ratio of the top to the bottom decile. It is available formost of the OECDcountries, based on the most painstaking comparative study of income differences that has been done so far(Atkinson, Rainwater, and Smeeding 1995). Consensus democracies are again the more egalitarian; the correlation is significant at the 5 percent level and is not affected when level ofdevelopment is controlled for. Finland has the lowest decileratio, 2.59, and the United States has the highest, 5.94. TheUnited States is an extreme case: the midpoint between its ratioand that of Finland is 4.26, and the sixteen other democraciesare all below this midpoint; the country with the next highestdecile ratio after the United States is Ireland with a ratio of 4.23.When the United States is removed from the analysis, the correlation between consensus democracy and income equality becomes even stronger although not enough to become significantat the higher level.
Vanhanen's (1997, 43, 46) Index of Power Resources is anindicator of equality based on several indirect measures such asthe degree of literacy ("the higher the percentage of literate population, the more widely basic intellectual resources are distributed") and the percentage of urban population ("the higher[this] percentage ... , the more diversified economic activitiesand economic interest groups there are and, consequently, the
QUALITY OF DEMOCRACY282
4. This is a more accurate measure of turnout than actual voters as a percent of registered voters; because voter registration procedures and reliabilitydiffer greatly from country to country. The only problem with the voting-agemeasure is that it includes noncitizens and hence tends to depress the turnoutpercentages of countries with large noncitizen populations. Because this prob-
more economic power resources are distributed among variousgroups"). Although Vanhanen's index is an indirect and obviously rough measure, it has the great advantage that it can becalculated for many countries, including all of our thirty-sixdemocracies. The highest value, 53.5 points, is found in theNetherlands, and the lowest, 3.3 points, in Papua New Guinea.Consensus democracy is positively correlated with the Index ofPower Resources but only at the 10 percent level of significance.However,. when level of development, which is also stronglycorrelated with Vanhanen's index, is controlled for, the relationship becomes stronger and is significant at the 5 percent level.
Electoral Participation
Voter turnout is an excellent indicator of democratic qualityfor two reasons. First, it shows the extent to which citizens areactually interested in being represented. Second, turnout isstrongly correlated with socioeconomic status and can thereforealso serve as an indirect indicator of political equality: highturnout means more equal participation and hence greater political equality; low turnout spells unequal participation andhence more inequality (Lijphart 1997b). Table 16.1 uses theturnout percentages in national elections that attract the largestnumbers of voters: legislative elections in parliamentary systems and, in presidential systems, whichever elections had thehighest turnout-generally the presidential rather than the legislative elections and, where presidents are chosen by majorityrunoff, generally the runoff instead of the first-ballot elections.The basic measure is the number of voters as a percentage ofvoting-age population.'
28.QUALITY OF DEMOCRACY
In the period 1971-96, Italy had the highest average turnout,92.4 percent, and Switzerland the lowest, 40.9 percent. Consensus democracy and voter turnout are positively correlated,but the correlation is significant only at the 10 percent level.However, several controls need to be introduced. First of all,compulsory voting, which is somewhat more common in consensus than in majoritarian democracies, strongly stimulatesturnout." Second, turnout is severely depressed by the high frequency and the multitude of electoral choices to be made bothin consensual Switzerland and the majoritarian United States.Third, turnout tends to be higher in more developed countries.When compulsory voting and the frequency of elections (both inthe form of dummy variables) as well as the level of development are controlled for, the effect of consensus democracy onvoter turnout becomes much stronger and is now significant atthe 1 percent level. With these controls in place, consensus democracies have approximately 7.5 percentage points higherturnout than majoritarian democracies.
The regression analysis was repeated with the average turnout figures collected by G. Bingham Powell (1980) for an earlierperiod, 1960-78.' Both the bivariate and multivariate relationships are very similar to the pattern reported in the previousparagraph. The bivariate correlation is significant at the 10 percent level, but when the three control variables are added, thecorrelation between consensus democracy and turnout becomes
lem assumes extreme proportions in Luxembourg with its small citizen andrelatively very large noncitizen population, I made an exception in this case andused the turnout percentage based on registered voters.
5. The democracies with compulsory voting in the 1971-96 period areAustralia, Belgium, CostaRica, Greece, Italy,Luxembourg, and Venezuela Compulsory voting was abolished in the Netherlands in 1970. For the regressionanalysis with the 1960-78 Powell data, reported below, the Netherlands iscounted as having compulsory voting, and the average Dutch turnout percentage is only for the elections in which voting was still compulsory.
6. The independent variable here is the degree of consensus democracy forthe entire 1945-96 period.
QUALITY OF DEMOCRACY284
strong and significant at the 1 percent level. The difference inturnout between consensus and majoritarian democracies isabout 7.3 percentage points-very close to the 7.5 percent difference in the period 1971-96.7
7. PR is probably the most important institutional element responsible forthe strong relationships between consensus democracy on one hand and voterturnout and women's representation on the other; PR is the usual electoral system in consensus democracies, and it has been found to be a strong stimulant toboth voter participation and women's representation (Blais and Carty 1990, Ruleand Zimmerman 1994).
Satisfaction with Democracy
Does the type of democracy affect citizens' satisfaction withdemocracy? Hans-Dieter Klingemann (1999) reports the responses to the following survey question asked in many countries, including eighteen of our democracies, in 1995 and 1996:
"On the whole, are you very satisfied, fairly satisfied, not verysatisfied, or not at all satisfied with the way democracy worksin (your country)?" The Danes and Norwegians expressed thehighest percentage of satisfaction with democracy: 83 and 82
percent, respectively, said that they were "very" or "fairly" satisfied. The Italians and Colombians were the least satisfied: only19 and 16 percent, respectively, expressed satisfaction. Generally, as Table 16.1 shows, citizens in consensus democracies aresignificantly more satisfied with democratic performance intheir countries than citizens of majoritarian democracies; thedifference is approximately 17 percentage points.
In an earlier study of eleven European democracies, Christopher J. Anderson and Christine A. Guillory (1997) found that, ineach of these countries, respondents who had voted for the winning party or parties were more likely to be satisfied with howwell democracy worked in their country than respondents whohad voted for the losing party or parties. Because it is easy to besatisfied when one is on the winning side, the degree to whichwinners and losers have similar responses can be regarded as a
287QUALITY OF DEMOCRACY
more sensitive measure of the breadth of satisfaction than simply the number of people who say they are very or fairly satisfied. The largest difference, 37.5 percentage points, was inGreece, where 70.3 percent of the respondents on the winningside expressed satisfaction compared with only 32.8 percent ofthe losers; the smallest difference occurred in Belgium, where61.5 percent of the winners were satisfied compared with 56.8
percent of the losers-a difference of only 4.7 percentage points.The general pattern discovered by Anderson and Guillory wasthat in consensus democracies the differences between winnersand losers were significantly smaller than in majoritarian democracies. My replication of Anderson and Guillory's analysis,using the degree of consensus democracy on the executivesparties dimension in the period 1971-96, strongly confirmstheir conclusion. As Table 16.1 shows, the difference in satisfaction is more than 16 percentage points smaller in the typicalconsensus than in the typical majoritarian democracy. The correlation is highly significant (at the 1 percent level]."
Government-Voter Proximity
The next two variables can be used to test the following keyclaim that is often made on behalf of majoritarian democracy:because in the typical two-party system the two major partiesare both likely to be moderate, the government's policy positionis likely to be close to that of the bulk of the voters. John D.Huber and G. Bingham Powell (1994) compared the government's position on a ten-point left-right scale with the voters'positions on the same scale in twelve Western democracies in
8. In Anderson and Guillory's eleven countries, there was also a positive,but not statistically significant, relationship between consensus democracy andthe percentage of respondents expressing satisfaction with democracy. However, Italy is an extreme outlier, with only 21.7 percent of the respondents expressing satisfaction; the percentages in the other countries range from 83.8percent in Germany to 44.7 percent in Greece. When the Italian case is removedfrom the analysis, the correlation becomes significant at the 5 percent level.
QUALITY OF DEMOCRACY286
Accountability and Corruption
Another important claim in favor of majoritarian democracyis that its typically one-party majority governments offer clearerresponsibility for policy-making and hence better accountability of the government to the citizens-who can use electionseither to "renew the term of the incumbent government" or to"throw the rascals out" (powell 1989, 119). The claim is undoubtedly valid for majoritarian systems with pure two-partycompetition. However, in two-party systems with significantthird parties, "rascals" may be repeatedly returned to office inspite of clear majorities of the voters voting for other parties andhence against the incumbent government; all reelected Britishcabinets since 1945 fit this description. Moreover, it is actuallyeasier to change governments in consensus democracies than inmajoritarian democracies, as shown by the shorter duration of
the period 1978-85. One measure of the distance between government and voters is simply the distance between the government's position on the left-right scale and the position of themedian voter; this measure is called "government distance" inTable 16.1. The other measure is the percentage of voters between the government and the median citizen, called "voterdistance" in the table. The smaller these two distances are, themore representative the government is of the citizens' policypreferences.
Government distance ranges from a high of 2.39 points onthe ten-point scale in the United Kingdom to a low of 0.47 inIreland. Voter distance is the greatest in Australia, 37 percent,and the smallest in Ireland, 11 percent. Contrary to the majoritarian claim, both distances are actually smaller in consensusthan in majoritarian democracies: the differences in the respective distances are about two-thirds of a point on the ten-pointscale and more than 10 percent of the citizens. Both correlationsare significant at the 5 percent level.
9. Transparency International's highest scores are for the "cleanest" andthe lowest scores for the most "corrupt" countries. I changed this 10-0 scale to a0-10 scale so that higher values would indicate more corruption.
289QUALITY OF DEMOCRACY
cabinets in consensus systems (see the first two columns ofTable 7.1). Admittedly, of course, changes in consensus democracies tend to be partial changes in the composition of cabinets,in contrast with the more frequent complete turnovers in majoritarian democracies.
A related measure is the incidence of corruption. It may behypothesized that the greater clarity of responsibility in majoritarian democracies inhibits corruption and that the consensussystems' tendency to compromise and "deal-making" fosterscorrupt practices. The indexes of perceived corruption in a largenumber of countries, including twenty-seven of our democracies, by Transparency International (1997) can be used to testthis hypothesis. An index of 10 means "totally corrupt" and 0means "totally clean."? Among our democracies, India and Colombia are the most corrupt, with scores between 7 and 8; at theother end of the scale, six countries are close to "totally clean"with scores between 0 and 1: Denmark, Finland, Sweden, NewZealand, Canada, and the Netherlands. Contrary to the hypothesis, there is no significant relationship between consensus democracy and corruption. Moreover, the weak relationship thatdoes appear is actually negative: consensus democracies areslightly less likely to be corrupt than majoritarian systems (byabout two-thirds of a point on the index). This relationship becomes a bit stronger, but is still not statistically significant,when the level of development, which is strongly and negatively correlated with the level of corruption, is controlled for.
John Stuart Mill's Hypotheses
The final two variables that measure the quality of democracy are inspired by John Stuart Mill's (1861, 134) argument thatmajority rule is the most fundamental requirement of democ-
TQUALITY OF DEMOCRACY288
racy and that the combination of plurality or majority electionsand parliamentary gove=ent may lead to minority rule. Heproves his point by examining the most extreme case:"Suppose ... that, in a country governed by equal and universalsuffrage, there is a contested election in every constituency, andevery election is carried by a small majority. The Parliamentthus brought together represents little more than a bare majorityof the people. This Parliament proceeds to legislate, and adoptsimportant measures by a bare majority of itself." Although Milldoes not state so explicitly, the most important of these "important measures" is the formation of a cabinet supported by a majority of the legislators. Mill continues: "It is possible, therefore,and even probable" that this two-stage majoritarian system delivers power "not to a majority but to a minority." Mill's point iswell illustrated by the fact that, as I showed in Chapter 2, theUnited Kingdom and New Zealand have tended to be pluralitarian instead of majoritarian democracies since 1945 becausetheir parliamentary majorities and the one-party cabinets basedon them have usually been supported by only a plurality-thelargest minority-of the voters.
Millargues that the best solution is to use PR for the electionof the legislature, and he is obviously right that under a perfectlyproportional system the problem of minority control cannot occur. His argument further means that consensus democracies,which frequently use PR and which in addition tend to havemore inclusive coalition cabinets, are more likely to practicetrue majority rule than majoritarian democracies. Two measurescan be used to test this hypothesis derived from Mill. One ispopular cabinet support: the average percentage of the voterswho gave their votes to the party or parties that formed the cabinet, or, in presidential systems, the percentage of the voters whovoted for the winning presidential candidate, weighted by thetime that each cabinet or president was in office. The secondmeasure may be called the John Stuart Mill Criterion: the percentage of time that the majority-rule requirement-the require-
10. In a few other countries, relatively short periods had to be excluded: forinstance, the period 1958-65 in France because the president was not popularlyelected, and the periods 1979~80 and 1984-86 in India and Mauritius, respectively, because the cabinets contained fragments of parties thathad split afterthemost recent elections. Moreover, nonpartisan cabinets and cabinets formed afterboycotted elections were excluded.
ment that the cabinet or president be supported by popular majorities-is fulfilled. Both measures can be calculated for theentire period 1945-96 for all democracies except Papua NewGuinea due to the large number of independents elected to itslegislature and frequently participating in its cabinets.t''
The highest average popular cabinet support occurred inSwitzerland (76.6 percent), Botswana (71.2 percent), and Austria (70.7 percent), and the lowest in Denmark (40.3 percent) andSpain (40.7 percent). The John Stuart Mill Criterion was aiwayssatisfied-100 percent of the time-in the Bahamas, Botswana,Jamaica, Luxembourg, and Switzerland, and never-O percent ofthe time-in Norway, Spain, and the United Kingdom. Theseexamples already make clear that the best and the poorest performers on these measures include both consensus and majoritarian democracies. We should therefore not expect strong statistical correlations between consensus democracy and eithermeasure. Table 16.1 shows that, though both correlations arepositive, they are fairly weak and only one is statistically significant. Popular cabinet support is only about 3.8 percent greaterin consensus than in majoritarian democracies.
The evidence does not lend stronger support to Mill's line ofthinking for three reasons. One is that the smallest majoritariandemocracies-Botswana, the Bahamas, Jamaica, Trinidad, andBarbados-have high popular cabinet support as a result of theiralmost pure two-party systems in which the winning party usually also wins a popular majority or at least a strong popularplurality. This finding is in line with Robert A. Dahl and Edward R. Tufte's (1973, 98-108) conclusion that smaller unitshave fewer political parties even when they use PRo Dag Anckar(1993) argues that, in addition to size, insularity plays a role in
j
291QUALITY OF DEMOCRACY
---r--
IQUALITY OF DEMOCRACY290
reducing the number of parties. The case of the small islandstate of Malta, with PR elections but virtually pure two-partycompetition, bears out both arguments. When population size iscontrolled for, the correlation between consensus democracyand popular cabinet support becomes statistically significant atthe 5 percent level. Controlling for population has an even moredramatic effect on the correlation between consensus democracy and the John StuartMill Criterion: it is now both strong andhighly significant (at the 1 percent level).
The second explanation is that the presidential systems areon the majoritarian half of the spectrum but that they tend to dowell in securing popular support for the executive: competitiontends to be between two strong presidential candidates, andmajority support is guaranteed-or, perhaps more realisticallyspeaking, contrived-when the majority-runoff method is used.
Third, consensus democracies with frequent minority cabinets, especially the Scandinavian countries, have relatively lowpopular cabinet support. There is still a big difference, of course,between cabinets with only minority popular support but alsominority status in the legislature, as in Scandinavia, and cabinets withminority popular supportbut with majority support inparliament, as in Britain and New Zealand; the lack of popularsupport is clearly more serious in the latter case. Moreover, popular cabinet support is based on actual votes cast and does nottake into account strategic voting, that is, the tendency-whichis especially strong in plurality elections-to vote for a party notbecause it is the voters' real preference but because it appears tohave a chance to win. Hence, if popular cabinet support couldbe calculated on the basis of the voters' sincere preferences instead of their actual votes, the consensus democracies would domuch better on this indicator of democratic quality.
The general conclusion is that consensus democracies havea better record than majoritarian democracy on all of the measures of democratic quality in Table 16.1, that all except two
correlations are statistically significant, and that most of thecorrelations are significant at the 1 or 5 percent level. For reasons of space, I am not presenting a table, similar to Table 16.1,with the bivariate correlations between consensus democracyon the federal-unitary dimension and the seventeen indicatorsof democratic quality. The reason is that there are no interestingresults to report: the only strongly significant bivariate relationship (at the 5 percent level) is a negative correlation betweenconsensus democracy and voter turnout in the period 1971-96.
However, when compulsory voting, the frequency of elections,and level of development are controlled for, the correlation becomes very weak and is no longer significant.
293QUALITY OF DEMOCRACY
Consensus Democracy and Its Kinder, Gentler Qualities
The democratic qualities discussed so far in this chaptershould appeal to all democrats: it is hard to find fault with betterwomen's representation, greaterpolitical equality, higher participation in elections, closer proximity between gove=ent policy and voters' preferences, and more faithful adherence to JohnStuart Mill's majority principle. In addition, consensus democracy (on the executives-parties dimension) is associated withsome other attributes that I believe most, though not necessarilyall, democrats will also find attractive: a strong community orientation and social consciousness-the kinder, gentler qualitiesmentioned in the beginning of this chapter. These characteristicsare also consonant with feminist conceptions of democracy thatemphasize, in Jane Mansbridge's (1996, 123) words, "connectedness" and "mutual persuasion" instead of self-interest andpower politics: "The processes of persuasion may be related to amore consultative, participatory style that seems to characterizewomen more than men." Mansbridge further relates these differences to her distinction between "adversary" and "unitary" democracy, which is similar to the majoritarian-consensus con-
QUALITY OF DEMOCRACY292
trast. Accordingly, consensus democracy may also be thought ofas the more feminine model and majoritarian democracy as themore masculine model of democracy.
There are four areas of government activity in which thekinder and gentler qualities of consensus democracy are likelyto manifest themselves: social welfare, the protection of the environment, criminal justice, and foreign aid. My hypothesis isthat consensus democracy will be associated with kinder, gentler, and more generous policies. Table 16.2 presents the resultsof the bivariate regression analyses of the effect of consensusdemocracy on ten indicators of the policy orientations in thesefour areas. The independent variable in all cases is the degree ofconsensus democracy on the executives-parties dimension inthe period 1971-96.
The first indicator of the degree to which democracies arewelfare states is Gosta Esping-Andersen's (1990) comprehensive measure of "deoommodification"-that is, the degree towhich welfare policies with regard to unemployment, disability, illness, and old age permit people to maintain decent livingstandards independent of pure market forces. Among the eighteen DECD countries surveyed by Esping-Andersen in 1980,Sweden has the highest score of 39.1 points and Australia andthe United States the lowest-13.0 and 13.8 points, respectively.Consensus democracy has a strong positive correlation withthese welfare scores. The difference between the average consensus democracy and the average majoritarian democracy isalmost ten points. Wealthy countries can afford to be more generous with welfare than less wealthy countries, but when thelevel of development is controlled for, the correlation betweenconsensus democracy and welfare becomes even a bit stronger.
Esping-Andersen's measure has been severely criticized forunderstating the degree to which Australia, New Zealand, andthe United Kingdom are welfare states (Castles and Mitchell1993). Because these three countries are, or were, also mainly
11. Palmer (1997, 16) gives the highest scores to "the most environmentallytroubled nations." I changed his 0-100 scale to a 100-0 scale so that higherscores would indicate better environmental performance.
majoritarian systems, this criticism throws doubt on the linkbetween consensus democracy and welfare statism. In order totest whether the original finding was entirely driven by EspingAndersen's classification of Australia, New Zealand, and theUnited Kingdom, I re-ran the regression without these three disputed cases. The result is reported in the second row of Table16.2. The relationship between consensus democracy and thewelfare state is weakened only slightly, and it is still statisticallysignificant at the 5 percent level.
Another indicator of welfare statism is social expenditure asa percentage of gross domestic product in the same eighteenDECD countries in 1992, analyzed by Manfred G. Schmidt(1997). Sweden is again the most welfare-oriented democracywith 37.1 percent social expenditure, but Japan now has thelowest percentage, 12.4 percent, followed by the United Stateswith 15.6 percent. The correlation with consensus democracy isagain strong and significant, and it is not affected when levelof development is controlled for. Consensus democracies differfrom majoritarian democracies in that they spend an additional5.3 percent of their gross domestic product on welfare.
Environmental performance can be measured by means oftwo indicators that are available for all or almost all of our thirtysix democracies. The first is Monte Palmer's (1997) compositeindex of concern for the environment, based mainly on carbondioxide emissions, fertilizer consumption, and deforestation.This index ranges from a theoretical high of one hundred points,indicating the best environmental performance to a low ofzero points for the worst performance. The highest score amongour democracies is for the Netherlands, seventy-seven points,and the lowest score is Botswana's, zero points.P Consensusdemocracies score almost ten points higher than majoritarian
295QUALITY OF DEMOCRACY
I-
IQUALITY OF DEMOCRACY294
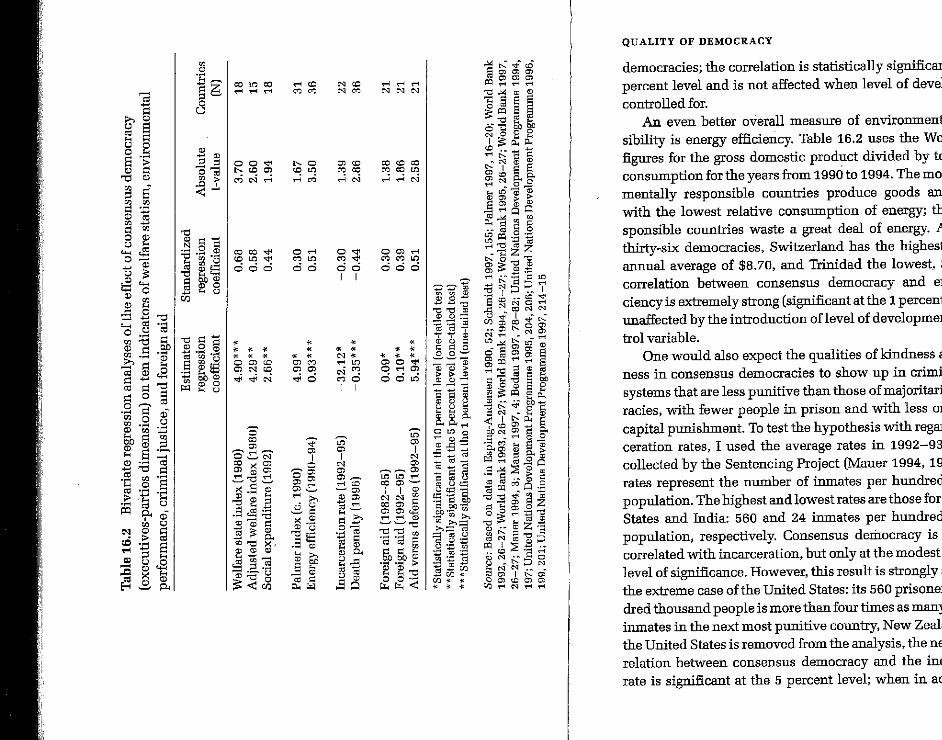
297
democracies; the correlation is statistically significant at the 10percent level and is not affected when level of development iscontrolled for.
An even better overall measure of environmental responsibility is energy efficiency. Table 16.2 uses the World Bank'sfigures for the gross domestic product divided by total energyconsumption for the years from 1990 to 1994. The most environmentally responsible countries produce goods and serviceswith the lowest relative consumption of energy; the least responsible countries waste a great deal of energy. Among ourthirty-six democracies, Switzerland has the highest value, ananoual average of $8.70, and Trinidad the lowest, $0.80. Thecorrelation between consensus democracy and energy efficiency is extremely strong (significant at the 1 percent level) andunaffected by the introduction oflevel of development as a control variable.
One would also expect the qualities of kindness and gentleness in consensus democracies to show up in criminal justicesystems that are less punitive than those of majoritarian democracies, with fewer people in prison and with less or no use ofcapital punishment. To test the hypothesis with regard to incarceration rates, I used the average rates in 1992-93 and 1995collected by the Sentencing Project (Mauer 1994, 1997). Theserates represent the number of inmates per hundred thousandpopulation. The highest and lowest rates are those for the UnitedStates and India: 560 and 24 inmates per hundred thousandpopulation, respectively. Consensus democracy is negativelycorrelated with incarceration, but only at the modest 10 percentlevel of significance. However, this result is strongly affected bythe extreme case of the United States: its 560 prisoners per hundred thousand people is more than four times as many as the 131inmates in the next most punitive country, New Zealand. Whenthe United States is removed from the analysis, the negative correlation between consensus democracy and the incarcerationrate is significant at the 5 percent level; when in addition the
QUALITY OF DEMOCRACY
T
•• •• • •0>0,,"OriO>OOLC
"''''"''''
;;~00I I
•• •'".ri",. '"'" ."'0I I
Ori
"'"'00,,"'''""'"'''"000
•• • •• • •00>'"0> cc '"..tio:iiN
oS '"E..so ~00 >..c ,<-
level of development is controlled for, the correlation becomessignificant at the 1 percent level. The remaining twenty-onecountries range from 24 to 131 imnates per hundred thousandpopulation; with level of development controlled, the consensus democracies put about 26 fewer people per hundred thousand population in prison than the majoritarian democracies.
As of 1996, eight of our thirty-six democracies retained andused the death penalty for ordinary crimes: the Bahamas, Barbados, Botswana, India, Jamaica, Japan, Trinidad, and the UnitedStates. The laws of twenty-two countries did not provide for thedeath penalty for any crime. The remaining six countries were inintermediate positions: four still had the death penalty but onlyfor exceptional crimes such as wartime crimes-Canada, Israel,Malta, and the United Kingdom-and two retained the deathpenalty but had not used it for at least ten years-Belgium andPapua New Guinea (Bedau 1997,78-82). On the basis of thesedifferences, I constructed a three-point scale with a score of twofor the active use of the death penalty, zero for the absence of thedeath penalty, and one for the intermediate cases. The negativecorrelation between consensus democracy and the death penalty is strong and highly significant (at the 1 percent level), andis not affected by controlling for level of development.
In the field of foreign policy, one might plausibly expect thekind and gentle characteristics of consensus democracy to bemanifested by generosity with foreign aid and a reluctance torely on military power." Table 16.2 uses three indicators fortwenty-one OECDcountries: average annual foreign aid-that is,economic development assistance, not military aid-as a percentage of gross national product in the period 1982-85 beforethe end of the Cold War; average foreign aid levels in the post-
12. This hypothesis can also be derived from the "democratic peace" literature ~Ray ~997)'.The factthat democracies are more peaceful, especially in theirrelationships Witheach other, than nondemocracies is often attributed to theirstronger compromise-oriented political cultures and their institutional checksan~balances. Ifthis explanation is correct, one should expect consensus democraC18S to be even more peace-loving thanmajoritariandemocracies.
Cold War years from 1992 to 1995; and foreign aid in the latterperiod as a percent of defense expenditures. In the period 198285, foreign aid ranged from a high of 1.04 percent of gross national product (Norway) to a low of 0.04 percent (portugal); inthe period 1992-95, the highest percentage was 1.01 percent(Denmark and Norway) and the lowest 0.14 percent [the UnitedStates). The highest foreign aid as a percent of defense expenditure was Denmark's 51 percent, and the lowest that of the United
States, 4 percent.In the bivariate regression analysis, consensus democracy is
significantly correlated with all three indicators, albeit at different levels. However, two important controls need to be introduced. First, because wealthier countries can better afford togive foreign aid than less wealthy countries, the level of development should be controlled for. Second, because large countries tend to assume greater military responsibilities and hencetend to have larger defense expenditures, which can be expected to limit their ability and willingness to provide foreignaid, population size should be used as a control variable; Dahland Tufte (1973, 122-23) found a strong link between population and defense spending. When these two controls are introduced, the correlations between consensus democracy and thethree measures of foreign aid remain significant, all at the 5 percent level. With the controls in place, the typical consensusdemocracy gave about 0.20 percent more of its gross nationalproduct in foreign aid than the typical majoritarian democracyin both the Cold War and post-Cold War periods, and its aid as apercent of defense spending was about 9.5 percentage points
higher.Similar regression analyses can be performed to test the ef
fect of the other (federal-unitary) dimension of consensus democracy on the above ten indicators, but few interesting resultsappear. The only two significant bivariate correlations are between consensus democracy on one hand and the incarcerationrate and social expenditure on the other, both at the 5 percent
298 QUALITY OF DEMOCRACY
--.-I
IQUALITY OF DEMOCRACY 299
level. The negative correlation with social expenditure is notaffected when the level of development is controlled for; the explanation is that three federal systems-Australia, Canada, andthe United States-are among the only four countries with socialspending below 20 percent of gross domestic product. The positive correlation with the rate of incarceration is entirely drivenby the extreme case of the United States; when the United Statesis removed from the analysis, the relationship disappears.
As the subtitle of this chapter states: consensus democracy makes a difference. Indeed, consensus democracy-on theexecutives-parties dimension-makes a big difference with regard to almost all of the indicators of democratic quality andwith regard to all of the kinder and gentler qualities. Furthermore, when the appropriate controls are introduced, the positive difference that consensus democracy makes generally tendsto become even more impressive.
300 QUALITY OF DEMOCRACY
!
II CHAPTER 17
Conclusions andRecommendations
Two conclusions of this book stand out as most important. The first is that the enormous variety of formal andinformal rules and institutions that we find in democracies canbe reduced to a clear two-dimensional pattern on the basis of thecontrasts between majoritarian and consensus government. Thesecond important conclusion has to do with the policy performance of democratic governments: especially as far as theexecutives-parties dimension is concerned, majoritarian democracies do not outperform the consensus democracies onmacroeconomic management and the control of violence-infact, the consensus democracies have the slightly better recordbut the consensus democracies do clearly outperform the majoritarian democracies with regard to the quality of democracy anddemocratic representation as well as with regard to what I havecalled the kindness and gentleness of their public policy orientations. On the second dimension, the federal institutions ofconsensus democracy have obvious advantages for large countries, and the independent central banks that are part of thissame set of consensus characteristics effectively serve the purpose of controlling inflation.
These conclusions have an extremely important practicalimplication: because the overall performance record of the consensus democracies is clearly superior to that of the majoritarian
The Good News
democracies, the consensus option is the more attractive optionfor countries designing their first democratic constitutions orcontemplating democratic reform. This recommendation is particularly pertinent, and even urgent, for societies that have deepcultural and ethnic cleavages, but it is also relevant for morehomogeneous countries.
Two pieces of good news and two pieces of bad news areattached to this practical constitutional recommendation. Thefirst bit of good news is that, contrary to the conventional wisdom, there is no trade-off at all between governing effectivenessand high-quality democracy-and hence no difficult decisionsto be made on giving priority to one or the other objective. Bothdimensions of consensus democracy have advantages that arenot offset by countervailing disadvantages-almost too good tobe true, but the empirical results presented in Chapters 15 and16 demonstrate that it is true.
Additional good news is that it is not difficult to write constitutions and other basic laws in such a way as to introduce consensus democracy. Divided-power institutions-strong federalism, strong bicameralism, rigid amendment rules, judicialreview, and independent central banks-can be prescribed bymeans of constitutional stipulations and provisions in centralbank charters. How these constitutional provisions work alsodepends on how they are interpreted and shaped in practice,of course, but the independent influence of explicit writtenrules should not be underestimated. It may also be possible tostrengthen these institutions by choosing a particular form ofthem; for instance, ifone wants to stimulate active and assertivejudicial review, the best way to do so is to setup a special constitutional court (see Chapter 12). A central bank can be madeparticularly strong if its independence is enshrined not just in acentral bank charter but in the constitution.
303
The institutions of consensus democracy on the executivesparties dimension do not depend as directly on constitutionalprovisions as the divided-power institutions. But two formalelements are of crucial indirect importance: proportional representation and a parliamentary system of government. Especiallywhen they are used in combination, and if the PR system isproportional not just in name but reasonably proportional inpractice, they provide a potent impetus toward consensus democracy. On the conceptual map of democracy (see Figure14.1), almost all of the democracies that have both PR and parliamentary systems are on the left, consensual side of the map,and almost all of the democracies that have plurality or majorityelections or presidential systems of gove=ent or both are onthe right, majoritarian side.'
Because the hybrid Swiss system can be regarded as moreparliamentary than presidential (see Chapter 7) and because theJapanese SNTV electoral system can be regarded as closer to PRthan to plurality (see Chapter 8), there are, among our thirty-sixdemocracies, only three major and three minor exceptions to theproposition that PR and parliamentarism produce consensusdemocracy. Four PR-parliamentary systems are not clearly onthe consensus side of the map: Ireland, Greece, Spain, andMalta. Ireland is almost exactly in the middle and hence not asignificant exception. Greece and Spain are the two PR countries with notoriously impure PR systems (see Chapter 8) andare therefore not major exceptions either. The only major exception is Malta, where the proportional STV system has not
1. Because our set of thirty-six democracies includes only five presidentialsystems, and because France is a rather unusual presidential system, the co~71usian concerning the effects of presidentialism cannot be regarded as definitive.Remember, however, that several majoritarian features are inherent in the natureof presidentialism, especially the majoritarian character ofpresiden~a1ca~~etsand the disproportionality of presidential elections, and that presldenti~~strongly promotes a system with relatively few parties. It is clearly n?t a.CO~CIdence that Costa Rica, Colombia, and Venezuela end up on the majontanan SIdeof the executives-parties dimension even though presidentialism in these threecountries is combined with PR in legislative elections.
CONCLUSIONS AND RECOMMENDATIONSCONCLUSIONS AND RECOMMENDATIONS302
2. In the Germanmodel, it is the prime minister (chancellor) rather than thecabinet as a whole who is elected by parliament and who can be constructivelyreplaced by parliament, but in practice this distinction is not significant.
prevented the development and persistence of an almost puretwo-party system. The two exceptions on the other side-clearand significant exceptions-are India and Mauritius: their ethnic and religious pluralism and the multiplicity of their ethnicand religious groups have produced multiparty systems andcoalition or minority cabinets in spite of plurality elections.
Both parliamentarism and PR can be fine-tuned to fit theconditions of particular countries and also to allay any fears thatthe combination of PR and parliamentary government will leadto weak and unstable cabinets-however exaggerated such fearsmay be, given the analysis in Chapter 15 of this book. One reinforcement of parliamentary government that has been introduced in several countries is the German-style constructive voteof no confidence, which requires that parliament can dismiss acabinet only by simultaneously electing a new cabinet." Oneproblem with this rule is that a parliament that has lost confidence in the cabinet but is too divided internally to elect a replacement may render the cabinet impotent by rejecting all ormost of its legislative proposals; this scenario is similar to thedivided-government situation that often afflicts presidential democracies. This problem can be solved, however, by adding theFrench rule that gives the cabinet the right to make its legislativeproposals matters of confidence-which means that parliamentcan reject such proposals onlyby voting its lack of confidence inthe cabinet by an absolute majority (see Chapter 6). The combination of these German and French rules can prevent bothcabinet instability and executive-legislative deadlock withouttaking away parliament's ultimate power to install a cabinet inwhich it does have confidence.
Similarly, PR systems can be designed so as to control thedegree of multipartism. The evidence does not support fearsthat PR, if it is too proportional, will inevitably lead to extreme
party proliferation. Nor is there a strong connectionbetween thedegree of proportionality ofPR and the effective number of parliamentary parties (see Figure 8.2). Nevertheless, if, for instance,one wants to exclude small parties with less than 5 percent ofthe vote from legislative representation, it is easy to do so bywriting a threshold clause into the electoral law and (unlike theGerman electoral law) not allowing any exceptions to this rule."
305
3. The only dangerof electoral thresholds. especially if they areas high as 5percent or even higher, is that in unconsolidated party sy~ems there may bemany small parties that will be denied representation-leading to an extremelyhigh degree of disproportionality.
4. The congruence is farfromperfect. of course. Franc~ is a:najorexc~p~onin the PR-parliamentary "North-East"; the plurality-pr.esldenti~-or maJo~~presidential-"North-West" has extensions into East Asia (especially the Phi~ppines), CentralAsia (theformerSoviet republics). and eastemEurope~e.Belarus. and Moldova); and the plurality-parliamentary "South-East" has lID
portantrepresentatives in otherregions (Canadaand formerBritish colonies inthe Caribbean as well as the United Kingdom itselfin wastem Europe].
And the (Seemingly) Bad News
Unfortunately, there are also two pieces of bad news: bothinstitutional and cultural tradltions may present strong resistanceto consensus democracy. As far as the four institutional patternsdefined by the PR-plurality and parliamentary-presidential contrasts are concerned, there is a remarkable congruence with fourgeographical regions of the world, defined roughly in terms ofthe Eastern, Western, Northern, and Southern hemispheres (powell 1982, 66-68). In the Eastern hemisphere, the "North" (western and central Europe) is mainly PR-parliamentary, whereasthe "South" (especially the former British dependencies in Africa, Asia, and Australasia) is characterized by the pluralityparliamentary form of government. In the Western hemisphere,the "South" (Latin America) is largely PR-presidential in character, whereas the "North" (the United States) is the world's principal example of plurality-presidential government.'
Most of the older democracies, but only a few of the newer
CONCLUSIONS AND RECOMMENDATIONS
T
ICONCLUSIONS AND RECOMMENDATIONS304
ones (like the Czech Republic, Hungary, Slovenia, Estonia, andLatvia), are in the PR-parliamentary "North-East." Most of thenewer democracies-both those analyzed in this book and thesomewhat younger ones-as well as most of the democratizingcountries are in the "South-East" and "South-West." These tworegions are characterized by either plurality elections or presidentialism. The majoritarian propensities of these institutionsand the strength of institutional conservatism are obstacles toconsensus democracy that may not be easy to overcome.
The second piece of bad news appears to be that consensusdemocracy may not be able to take root and thrive unless itis supported by a consensual political culture. Although thefocus of this book has been on institutions rather than culture,it is clear that a consensus-oriented culture often provides thebasis for and connections between the institutions of consensus democracy. For instance, four of the five elements of theexecutives-parties dimension are structurally connected-PRleading to multipartism, multipartism to coalition cabinets, andso on-but there is no such structural connection between thesefour and the fifth element of interest group corporatism. Themost plausible explanation is cultural. Consensus democracyand majoritarian democracy are alternative sets of political institutions, but more than that: they also represent what John D.Huber and G. Bingham Powell (1994) call the "two visions" ofdemocracy.
Similarly, four of the five elements of the second dimensionof consensus democracy are structurally and functionally linkedto the requirements of operating a federal system, as theorists offederalism have long insisted (see Chapter 1). But there is nosuch link with central bank independence. Instead, the mostlikely connection is a political-cultural predisposition to thinkin terms of dividing power among separate institutions. My finalexample concerns the connection found in Chapter 16 betweenconsensus democracy and several kinder and gentler public policies. It appears more plausible to assume that both consensus
democracy and these kinder, gentler policies stem from an underlying consensual and communitarian culture than that thesepolicies are the direct result of consensus institutions.
Grounds for Optimism
These two items of bad news do not necessarily meanthat consensus democracy has no chance in newly democraticand democratizing countries, because there are two importantcounter-arguments. One is that we tend to think of culture andstructure in terms of cause and effect, respectively, but that thereis actually a great deal of interaction between them; this is especially true of political culture and political structure. As GabrielA. Almond and Sidney Verba (1963, 35) argued in The CivicCulture, structural and cultural phenomena are variables in "acomplex, multidirectional system of causality." This meansthat, although a consensual culture may lead to the adoption ofconsensus institutions, these institutions also have the potentialof making an initially adversarial culture less adversarial andmore consensual. Consensus democracies like Switzerland andAustria may have consensual cultures today, but they have notalways been so consensual: the Swiss fought five civil wars fromthe sixteenth to the middle of the nineteenth century, and theAustrians fought a briefbutbloody civil war as recently as 1934.In the late 1990s, Belgium, India, and Israel have-and clearlyneed-consensus institutions, but they do not have consensualcultures. Observers of the Belgian political scene often wonderwhether the country can stay together or will fall apart. Israeland India, too, can only be described as having highly contentious and conflictual political cultures.
Moreover, although the institutional traditions in the "SouthEast" and "South-West," where most of the newly democraticand democratizing countries are located, are not favorable toconsensus democracy, the prevalent political cultures in theseareas of the world are much more consensual than majoritarian.
307CONCLUSIONS AND RECOMMENDATIONS
I
~
III
CONCLUSIONS AND RECOMMENDATIONS306
In his classic work From Empire to Nation, Rupert Emerson(1960,284) argued that the assumption that the majority has the"right to overrule a dissident minority after a period of debatedoes violence to conceptions basic to non-Western peoples."While he conceded that there were important differences amongthe traditions of Asian and African peoples, "their native inclination is generally toward extensive and uohurried deliberation aimed at ultimate consensus. The gradual discovery of areasof agreement is the significant feature and not the ability to cometo a speedy resolution of issues by counting heads." Sir ArthurLewis (1965, 86), a native of St. Lucia in the Caribbean and ofAfrican descent, not only strongly advocated consensus democracy for the West African countries (see Chapter 3) but also emphasized their strong consensually oriented traditions: "Thetribe has made its decisions by discussion, in much the way thatcoalitions function; this kind of democratic procedure is at theheart of the original institutions of the people."
More recently, the same point has been made forcefully andrepeatedly in the book Will ofthe People: Original DemocracyinNon- Western Societies by Philippine statesman and scholarRaul S. Manglapus (1987, 69, 78, 82, 103, 107, 123, 129). Heargues not only that the non-West has strong democratic traditions but that these traditions are much more consensual thanmajoritarian: "the common characteristic [is] the element ofconsensus as opposed to adversarial decisions." And time andagain he describes the non-Western democratic process as a"consensual process" based on a strong "concern for harmony."My final example is a statement by Nigerian scholar and formerUnited Nations official Adebayo Adedeji (1994, 126): "Africansare past masters in consultation, consensus, and consent. Ourtraditions abhor exclusion. Consequently, there is no sanctioned and institutionalized opposition in our traditional system of governance. Traditionally, politics for us has never been azero-sum game. OJ
Such statements are often regarded as suspect because they
have been abused by some non-Western political leaders to justify deviations from democracy (Bienen and Herbst 1991, 214).But the fact that they have been used for illegitimate purposesdoes not make them less valid. All of the authors I have citedare both sincere democrats and sensitive observers without ulterior nondemocratic motives. Hence the consensus-oriented political cultures of the non-Western world can be regarded as astrong counterforce to its majoritarian institutional conservatism, and they may well be able to provide fertile soil for consensus democracy.
308 CONCLUSIONS AND RECOMMENDATIONS CONCLUSIONS AND RECOMMENDATIONS 309
APPENDIX A
Two Dimensions and Ten Basic Variables, 1945-98 and 1971-96
The following list contains the values of the executives-parties and federal-unitary dimensions and of the ten basic variables during the 1945-96 and 1971-96 periods. Please note that the exact years that mark the beginning of the first and longest period differ from country to country and, in fact, range from 1945 to 1977 (see Table 4.1). For the ten democracies whose period of analysis started in 1965 or later, the first year of the period 1971-96 ranges from 1965 to 1977. The thirty-six democracies are identified by the first three characters of their English names, except thatAUL means Australia, AUT Austria, CR Costa Rica, JPN Japan, NZ New Zealand, PNG Papua New Guinea, UK United Kingdom, and US United States.
The values of all of the "so what?" variables analyzed in Chapters 15 and 16 are not included in this appendix for reasons of space, but may be obtained from the author. Please write to Arend Lijphart, Department of Political Science (0521), University of California, San Diego, 9500 Gilman Drive, La Jolla, CA 92093-0521; or email to [email protected].
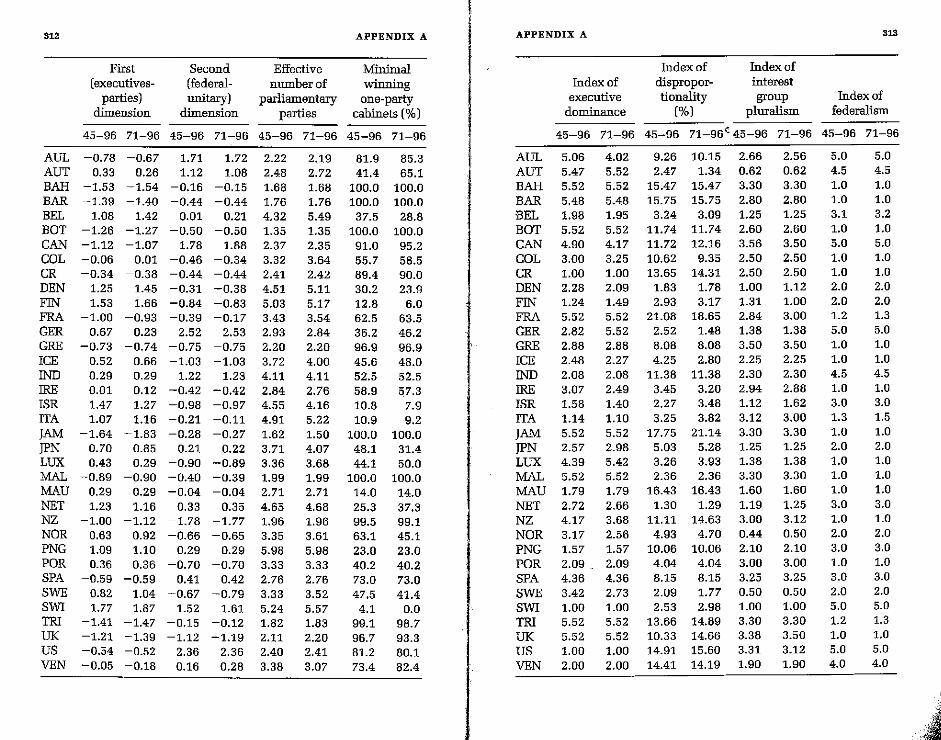
312
AUL AUT BAH BAR BEL BOT CAN COL CR DEN FIN FRA GER GRE ICE IND IRE ISR ITA JAM JPN LUX MAL MAU NET NZ NOR PNG POR SPA SWE SWI TRI UK US VEN
First (executives
parties) dimension
Second (federalunitary)
dimension
Effective number of
parliamentary parties
APPENDIX A
Minimal winning one-parly
cabinets (%)
45-96 71-96 45-96 71-96 45-96 71-96 45-96 71-96
-0.78 -0.67 1.71 1.72 0.33 0.26 1.12 1.08
-1.53 -1.54 -0.16 -0.15 -1.39 -1.40 -0.44 -0.44
1.08 1.42 0.01 0.21 -1.26 -1.27 -0.50 -0.50 -1.12 -1.07 1.78 1.88 -0.06 0.01 -0.46 -0.34 -0.34 -0.38 -0.44 -0.44
1.25 1.45 -0.31 -0.38 1.53 1.66 -0.84 -0.83
-1.00 -0.93 -0.39 -0.17 0.67 0.23 2.52 2.53
-0.73 -0.74 -0.75 -0.75 0.52 0.66 -1.03 -1.03 0.29 0.29 1.22 1.23 0.01 0.12 -0.42 -0.42 1.47 1.27 -0.98 -0.97 1.07 1.16 -0.21 -0.11
-1.64 -1.83 -0.28 -0.27 0.70 0.85 0.21 0.22 0.43 0.29 -0.90 -0.89
-0.89 -0.90 -0.40 -0.39 0.29 0.29 -0.04 -0.04 1.23 1.16 0.33 0.35
-1.00 -1.12 -1.78 -1.77 0.63 0.92 -0.66 -0.65 1.09 1.10 0.29 0.29 0.36 0.36 -0.70 -0.70
-0.59 -0.59 0.41 0.42 0.82 1.04 -0.67 -0.79 1.77 1.87 1.52 1.61
-1.41 -1.47 -0.15 -0.12 -1.21 -1.39 -1.12 -1.19 -0.54 -0.52 2.36 2.36 -0.05 -0.18 0.16 0.28
2.22 2.48 1.68 1.76 4.32 1.35 2.37 3.32 2.41 4.51 5.03 3.43 2.93 2.20 3.72 4.11 2.84 4.55 4.91 1.62 3.71 3.36 1.99 2.71 4.65 1.96 3.35 5.98 3.33 2.76 3.33 5.24 1.82 2.11 2.40 3.38
2.19 2.72 1.68 1.76 5.49 1.35 2.35 3.64 2.42 5.11 5.17 3.54 2.84 2.20 4.00 4.11 2.76 4.16 5.22 1.50 4.07 3.68 1.99 2.71 4.68 1.96 3.61 5.98 3.33 2.76 3.52 5.57 1.83 2.20 2.41 3.07
81.9 41.4
100.0 100.0
37.5 100.0
91.0 55.7 89.4 30.2 12.8 62.5 36.2 96.9 45.6 52.5 58.9 10.8 10.9
100.0 48.1 44.1
100.0 14.0 25.3 99.5 63.1 23.0 40.2 73.0 47.5
4.1 99.1 96.7 81.2 73.4
85.3 65.1
100.0 100.0
28.8 100.0
95.2 58.5 90.0 23.9
6.0 63.5 46.2 96.9 48.0 52.5 57.3
7.9 9.2
100.0 31.4 50.0
100.0 14.0 37.3 99.1 45.1 23.0 40.2 73.0 41.4
0.0 98.7 93.3 80.1 82.4
APPENDIX A
Index of executive
dominance
Index of disproportionality
(%)
Index of interest group
pluralism Index of
federalism
45-96 71-96 45-96 71-96' 45-96 71-96 45-96
AUL AUT BAH BAR BEL BOT CAN COL CR DEN FIN FRA GER GRE ICE IND IRE ISR ITA JAM JPN LUX MAL MAU NET NZ NOR PNG POR SPA SWE SWI TRI UK US VEN
5.06 4.02 5.47 5.52 5.52 5.52 5.48 5.48 1.98 1.95 5.52 5.52 4.90 4.17 3.00 3.25 1.00 1.00 2.28 2.09 1.24 1.49 5.52 5.52 2.82 5.52 2.88 2.88 2.48 2.27 2.08 2.08 3.07 2.49 1.58 1.40 1.14 1.10 5.52 5.52 2.57 2.98 4.39 5.42 5.52 5.52 1.79 1.79 2.72 2.66 4.17 3.68 3.17 2.56 1.57 1.57 2.09.. 2.09 4.36 4.36 3.42 2.73 1.00 1.00 5.52 5.52 5.52 5.52 1.00 1.00 2.00 2.00
9.26 2.47
15.47 15.75
3.24 11.74 11.72 10.62 13.65
1.83 2.93
21.08 2.52 8.08 4.25
11.38 3.45 2.27 3.25
17.75 5.03 3.26 2.36
16.43 1.30
11.11 4.93
10.06 4.04 8.15 2.09 2.53
13.66 10.33 14.91 14.41
10.15 1.34
15.47 15.75
3.09 11.74 12.16
9.35 14.31
1.78 3.17
18.65 1.48 8.08 2.80
11.38 3.20 3.48 3.82
21.14 5.28 3.93 2.36
16.43 1.29
14.63 4.70
10.06 4.04 8.15 1.77 2.98
14.89 14.66 15.60 14.19
2.66 0.62 3.30 2.80 1.25 2.60 3.56 2.50 2.50 1.00 1.31 2.84 1.38 3.50 2.25 2.30 2.94 1.12 3.12 3.30 1.25 1.38 3.30 1.60 1.19 3.00 0.44 2.10 3.00 3.25 0.50 1.00 3.30 3.38 3.31 1.90
2.56 0.62 3.30 2.80 1.25 2.60 3.50 2.50 2.50 1.12 1.00 3.00 1.38 3.50 2.25 2.30 2.88 1.62 3.00 3.30 1.25 1.38 3.30 1.60 1.25 3.12 0.50 2.10 3.00 3.25 0.50 1.00 3.30 3.50 3.12 1.90
5.0 4.5 1.0 1.0 3.1 1.0 5.0 1.0 1.0 2.0 2.0 1.2 5.0 1.0 1.0 4.5 1.0 3.0 1.3 1.0 2.0 1.0 1.0 1.0 3.0 1.0 2.0 3.0 1.0 3.0 2.0 5.0 1.2 1.0 5.0 4.0
5.0 4.5 1.0 1.0 3.2 1.0 5.0 1.0 1.0 2.0 2.0 1.3 5.0 1.0 1.0 4.5 1.0 3.0 1.5 1.0 2.0 1.0 1.0 1.0 3.0 1.0 2.0 3.0 1.0 3.0 2.0 5.0 1.3 1.0 5.0 4.0
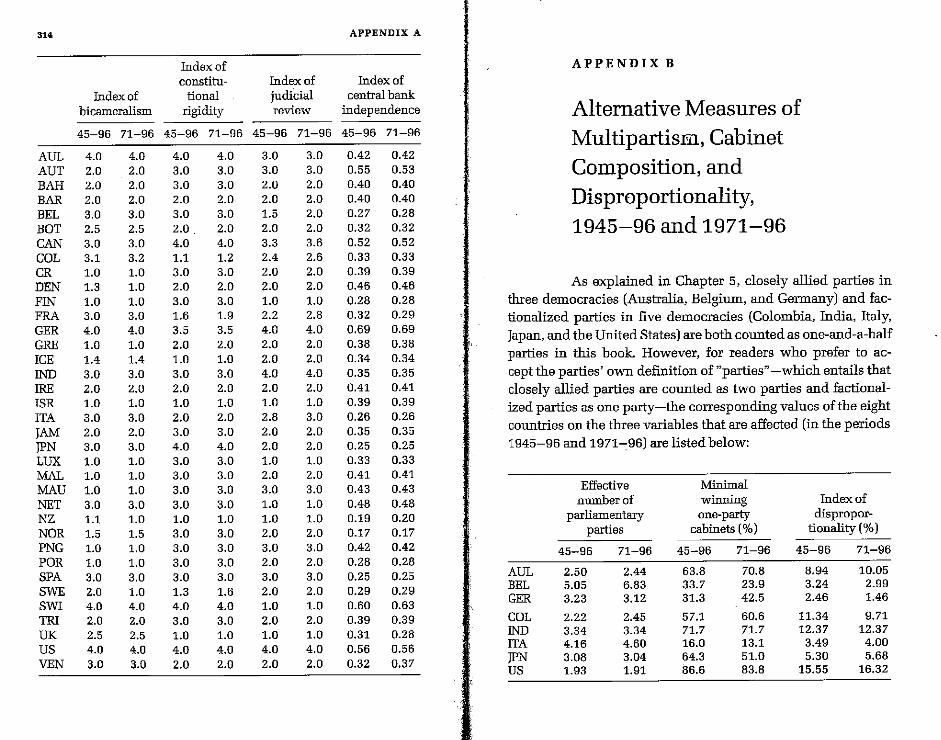
"i" ,j,
I
I'!
!I
ii' i' I,' ii'
i
II'
I
tl \1,'1 I'
I
II
314
AUL AUT BAH BAR BEL BOT CAN COL CR DEN FIN FRA GER GRE ICE IND IRE ISR ITA JAM jPN LUX MAL MAU NET NZ NOR PNG POR SPA SWE SWI TRI UK US VEN
Index of bicameralism
Index of constitu
tional rigidity
Index of judicial review
APPENDIX A
Index of central bank
Independence
45-96 71-96 45-96 71-96 45-96 71-96 45-96 71-96
4.0 2.0 2.0 2.0 3.0 2.5 3.0 3.1 1.0 1.3 1.0 3.0 4.0 1.0 1.4 3.0 2.0 1.0 3.0 2.0 3.0 1.0 1.0 1.0 3.0 1.1 1.5 1.0 1.0 3.0 2.0 4.0 2.0 2.5 4.0 3.0
4.0 2.0 2.0 2.0 3.0 2.5 3.0 3.2 1.0 1.0 1.0 3.0 4.0 1.0 1.4 3.0 2.0 1.0 3.0 2.0 3.0 1.0 1.0 1.0 3.0 1.0 1.5 1.0 1.0 3.0 1.0 4.0 2.0 2.5 4.0 3.0
4.0 4.0 3.0 3.0 3.0 3.0 2.0 2.0 3.0 3.0 2.0, 2.0 4.0 4.0 1.1 1.2 3.0 3.0 2.0 2.0 3.0 3.0 1.6 1.9 3.5 3.5 2.0 2.0 1.0 1.0 3.0 3.0 2.0 2.0 1.0 1.0 2.0 2.0 3.0 3.0 4.0 4.0 3.0 3.0 3.0 3.0 3.0 3.0 3.0 3.0 1.0 1.0 3.0 3.0 3.0 3.0 3.0 3.0 3.0 3.0 1.3 1.6 4.0 4.0 3.0 3.0 1.0 1.0 4.0 4.0 2.0 2.0
3.0 3.0 2.0 2.0 1.5 2.0 3.3 2.4 2.0 2.0 1.0 2.2 4.0 2.0 2.0 4.0 2.0 1.0 2.8 2.0 2.0 1.0 2.0 3.0 1.0 1.0 2.0 3.0 2.0 3.0 2.0 1.0 2.0 1.0 4.0 2.0
3.0 0.42 0.42 3.0 0.55 0.53 2.0 0.40 0.40 2.0 0.40 0.40 2.0 0.27 0.28 2.0 0.32 0.32 3.6 0.52 0.52 2.6 0.33 0.33 2.0 0.39 0.39 2.0 0.46 0.46 1.0 0.28 0.28 2.8 0.32 0.29 4.0 0.69 0.69 2.0 0.38 0.38 2.0 0.34 0.34 4.0 0.35 0.35 2.0 0.41 0.41 1.0 0.39 0.39 3.0 0.26 0.26 2.0 0.35 0.35 2.0 0.25 0.25 1.0 0.33 0.33 2.0 0.41 0.41 3.0 0.43 0.43 1.0 0.48 0.48 1.0 0.19 0.20 2.0 0.17 0.17 3.0 0.42 0.42 2.0 0.28 0.28 3.0 0.25 0.25 2.0 0.29 0.29 1.0 0.60 0.63 2.0 0.39 0.39 1.0 0.31 0.28 4.0 0.56 0.56 2.0 0.32 0.37
APPENDIX B
Alternative Measures of Multipartism, Cabinet Composition, and Disproportionality, 1945-96 and 1971-96
As explained in Chapter 5, closely ailied parties in three democracies (Australia, Belgium, and Germany) and factionalized parties in five democracies (Colombia, India, Itaiy, Japan, and the United States) are both counted as one-and-a-half parties in this book. However, for readers who prefer to accept the parties' own definition of "parties" -which entails that closely allied parties are counted as two parties and factionalized parties as one party-the corresponding values of the eight countries on the three variables that are affected (in the periods 1945-96 and 1971-:96) are listed below:
AUL BEL GER
COL IND ITA jPN US
Effective number of
parliamentary parties
45-96
2.50 5.05 3.23
2.22 3.34 4.16 3.08 1.93
71-96
2.44 6.83 3.12
2.45 3.34 4.60 3.04 1.91
Minimal winning one-party
cabInets (%)
45-96
63.8 33.7 31.3
57.1 71.7 16.0 64.3 86.6
71-96
70.8 23.9 42.5
60.6 71.7 13.1 51.0 83.8
Index of dispropor
tionality (%)
45-96
8.94 3.24 2.46
11.34 12.37
3.49 5.30
15.55
71-96
10.05 2.99 1.46
9.71 12.37
4.00 5.68
16.32
References e
Adedeji, Adebayo. 1994. "An Alternative for Africa." Journal of Democracy5, no. 4 (October): 119-32.
Agius, Carmel A., and Nancy A. Grosselfinger. 1995. "The Judiciary and Politics in Malta." In C. Neal Tate and Torbjiirn Vallinder, eds., The Global Expansion of Judicial Power, 381-402. New York: New York University Press.
Alen, Andre, and Rusen Ergec. 1994. Federal Belgium After the Fourth State Reform of 1993. Brussels: Ministry of Foreign Affairs.
Almond, Gabriel A. 1983. "Corporatism, Pluralism, and Professional Memory." World Politics 35, no. 2 (January): 245-60.
Almond, Gabriel A., and G. Bingham Powell, Jr., eds. 1996. Comparative Politics: A World View, 6th ed. New York: HarperCollins.
Almond, Gabriel A., and Sidney Verba. 1963. The Civic Culture: Political Attitudes and Democracy in Five Nations. Princeton: Princeton University Press.
Ambler, John S. 1971. The Government and Politics of France. Boston: Houghton Mifflin.
Amorim Neto, Octavia, and Gary W. Cox. 1997. "Electoral Institutions, Cleavage Structures, and the Number of Parties." American Journal of Political Science 41, no. 1 (January): 149-74.
Anckar, Dag. 1993. "Notes on the Party Systems of Small Island States." In Tom Bryder, ed., porty Systems, Porty Behaviour and Democracy, 153-68. Copenhagen: Copenbagen Political StudiesPress.
318 REFERENCES
Anderson, Christopher J., and Christine A. Guillory. 1997. "Political Institutions and Satisfaction with Democracy: A Cross-National Analysis of Consensus and Majoritarian Systems." American Political Science Review 91, no. 1 (March): 66-81.
Andeweg, Rudy B. 1997. "Institutional Reform in Dutch Politics: Elected Prime Minister, Personalized PR, and Popular Veto in Comparative Perspective." Acta Politica 32, no. 3 (Autumn): 227-57.
Arian, Asher. 1998. The Second Republic: Politics in Israel. Chatham, N.J.: Chatham House.
Armingeon, Klaus. 1997. "Swiss Corporatism in Comparative Perspective." West European Politics 20, no. 4 (October): 164-79.
Aron, Raymond. 1982. "Alternation in Government in the Industrialized Countries." Government and Opposition 17, no. 1 (Winter): 3-21.
Ashford, Douglas E. 1979. "Territorial Politics and Equality: Decentralization in the Modern State." Political Studies 27, no. 1 (March): 71-83.
Atkinson, Anthony B., Lee Rainwater, and TImothy M. Smeeding. 1995. Income Distribution in OECD Countries: Evidence from the Luxembourg Income Study. Paris: Organisation for Economic Co-operation and Development.
Axelrod, Robert. 1970. Conflict of Interest: A Theory of Divergent Goals with Applications to Politics. Chicago: Markham.
Baar, Carl. 1991. "Judicial Activism in Canada." In Kenneth M. Holland, ed., Judicial Activism in Comparative Perspective, 53-69. New York: St. Martin's.
-. 1992. "Social Action Litigation in India: The Operation and Limits of the World's Most Active Judiciary." In Donald W. Jackson and C. Neal Tate, eds., Comparative Judicial Review and Public Policy, 77-87. Westport, Conn.: Greenwood.
Baerwald, Hans H. 1986. Party Politics in Japan. Boston: Allen and Unwin.
Banaian, King, Leroy O. Laney, and Thomas D. Willett. 1986. "Central Bank Independence: An International Comparison." In Eugenia Froedge Toma and Mark Toma, eds., Central Bankers, BureaucraticIncentives, and Monetary Policy, 199-217. Dordrecht: Kluwer Academic.
REFERENCES 319
Banks, Arthur S. 1993. Political Handbook of the World: 1993. Binghamton, N.Y: CSA.
Banks, Arthur S., Alan J. Day, and Thomas C. Muller. 1996. Political Handbook oftheJ"lorld: 1995-1996. Binghamton, N.Y.: CSA.
-. 1997. Political Handbook of the World: 1997. Binghamton, N.Y.:CSA.
Becker, Theodore. 1970. Comparative Judicial Politics. New York: Rand McNally.
Bedau, Hugh Adam, ed. 1997. The Death Penalty in America: Cur,rent Controversies. New York: Oxford University Press.
Beer, Samuel. 1998. "The Roots of New Labour: Liberalism Rediscovered." Economist (February 7): 23-25.
Beetham, David, ed. 1994. Defining and Measuring Democracy. London: Sage.
Bergman, Torbj6rn. 1995. Constitutional Rules and Party Goals in Coalition Formation: An Analysis of Winning Minority Governments in Sweden. Umea: Departroent of Political Science, Umea University.
Bienen, Henry, and Jeffrey Herbst. 1991. "Authoritarianism and Democracy in Africa." In Dankwart A. Rustow and Kenneth Paul Erickson, eds., Comparative Political Dynamics: Global Research Perspectives, 211-32. New York: HarperCollins.
Bienen, Henry, and Nicolas van de Walle. 1991. Of Time and Power: Leadership Duration in the Modem World. Stanford: Stanford University Press.
Blais, Andre, and R. K. Carty. 1990. "Does Proportional Representation Foster Voter Turnout?" European Journal of Political Research 18, no. 2 (March): 167-81.
Blais, Andre, Louis Massicotte, and Agnieszka Dobrzynska. 1997. "Direct Presidential Elections: A World Summary." Electoral Studies 16, no. 4 (December): 441-55.
Blondel, Jean. 1968. "Party Systems and Patterns of Gove=ent in Western Democracies." Canadian Journal of Political Science 1, no. 2 (June): 180-203.
Borrelli, Stephen A., and Terry A. Royed. 1995. "Gove=ent 'Strength' and Budget Deficits in Advanced Democracies." EuropeanJournal of Political Research 28, no. 2 (September): 225-260.
320 REFERENCES
Boston, Jonathan, Stephen Levine, Elizabeth McLeay, and Nigel S. Roberts, eds. 1996. New Zealand Under MMP: A New Politics? Auckland: Auckland University Press.
Bowman, Larry W. 1991. Mauritius: Democracy and Development in the Indian Ocean. Boulder, Colo.: Westview.
Brass, Paul R. 1990. The Politics of India Since Independence. Cambridge: Cambridge University Press.
Brautigam, Deborah. 1997. "Institutions, Economic Reform, and Democratic Consolidation in Mauritius." Comparative Politics 30, no. 1 (October): 45-62.
Brewer-Carias, Allan R. 1989. Judicial Review in Comparative Law. Cambridge: Cambridge University Press.
Browne, Eric C., and John P. Frendreis. 1980. "Allocating Coalition Payoffs by Conventional Norm: An Assessment of the Evidence from Cabinet Coalition Situations." American Journal of Political Science 24, no. 4 (November): 753-68.
Budge, Ian, and Valentine Herman. 1978. "Coalitions and Government Formation: An Empirically Relevant Theory." British Journal of Political Science 8, no. 4 (October): 459-77.
Budge, Ian, David Robertson, and Derek Hearl, eds. 1987. Ideology, Strategy and Party Change: Spatial Analyses of Post-War Election Programmes in 19 Democracies. Cambridge: Cambridge University Press.
Busch, Andreas. 1994. "Central Bank Independence and the Westminster Model." West European Politics 17, no. 1 (January): 53-72.
Butler, David. 1978. "Conclusion." In David Butler, ed., Coalitions in British Politics, 112-18. New York: St. Martin's.
Butler, David, Andrew Adonis, and Tony Travers. 1994. Failure in British Government: The Politics of the Poll Tax. Oxford: Oxford University Press.
Butler, David, and Austin Ranney. 1978. "Theory." In David Butler and Austin Ranney, eds., Referendums: A Comparative Study of Practice and Theory, 23-37. Washington, D.C.: American Enterprise Institute.
Buxton, James, John Kampfner, and Brian Groom. 1997. "Blair Says Scots' Home Rule Vote Will Affect Rest of UK." Financial Times (September 13-14): 1.
Capie, Forrest, Charles Goodhart, and Norbert Schnadt. 1994. "The
REFERENCES 321
Development of Central Banking." In Forrest Capie, Charles Goodhart, Stanley Fischer, and Norbert Schnadt, eds., The Future of Central Banking: The Tercentenary Symposium of the Bank of England, 1-231. Cambridge: Cambridge University Press. r'
Cappelletti, Mauro. 1989. The Judicial Process in Comparative Perspective. Oxford: Clarendon.
Castles, Francis G. 1994. "The Policy Consequences of Proportional Representation: A Sceptical Commentary." Political Science 46, no.2 (December): 161-71.
CaStles, Francis G., and Deborah Mitchell. 1993. "Worlds of Welfare and Faroilies of Nations." In Francis G. Castles, ed., Families of Nations: Patterns of Public Policy in Western Democracies, 93-
128. Aldershot: Dartmouth. Chubb, Basil. 1982. The Government and Politics of Ireland, 2d ed.
Stanford: Stanford University Press. Codding, George Arthur, Jr. 1961. The Federal Government ofSwit
zerland. Boston: Houghton Mifflin. Committee on the Constitutional System. 1987. A Bicentennial
Analysis of the American Political Structure: Report and Recommendations. Washington, D.C.: Committee on the Constitutional System.
Coombs, David. 1977. "British Gove=ent and the European Community." In Dennis Kavanagh and Richard Rose, eds., New Trends in British Politics: Issues for Research, 83-103. London: Sage.
Coppedge, Michael. 1993. "Parties and Society in Mexico and Venezuela: Why Competition Matters." Comparative Politics 25, no. 3 (April): 253-74.
-. 1994. Strong Parties and Lame Ducks: Presidential Partyarchy and Factionalism in Venezuela. Stanford: Stanford University Press.
Cornwall, John. 1990. The Theory of Economic Breakdown: An Institutional-Analytical Approach. Cambridge: Basil Blackwell.
Cox, Gary W. 1997. Making Votes Count: Strategic Coordination in the World's Electoral Systems. Cambridge: Cambridge UniversityPress.
Crepaz, Markus M. L. 1996. "Consensus Versus Majoritarian Democracy: Political Institutions and Their Impact on Macroeco-
322 REFERENCES
nomic Performance and Industrial Disputes." Comparative Political Studies 29, no. 1 (February): 4-26.
Crisp, Brian. 1994. "Limitations to Democracy in Developing Capitalist Societies: The Case of Venezuela." World Development 22, no. 10 (October): 1491-1509.
Crowe, Edward W. 1980. "Cross-Voting in the British House of Commons: 1945-74." Journal of Politics 42, no. 2 (May): 487-510.
Cukierman, Alex, StevenB. Webb, andBilinNeyapti. 1994. Measuring Central Bank Independence and Its Effect on Policy Outcomes. San Francisco: ICS.
Dahl, Robert A. 1956. A Preface to Democratic Theory. Chicago: University of Chicago Press.
_. 1971. Polyarchy: Participation and Opposition. New Haven: Yale University Press.
_. 1996. "Equality versus Inequality." PS: Political Science and Politics 29, no. 4 (December): 639-4S.
Dahl, Robert A., and Edward R. Tufte. 1973. Size and Democracy. Stanford: Stanford University Press.
de Swaan, Abram. 1973. Coalition Theories and Cabinet Formations: A Study of Formal Theories of Coalition Formation Applied to Nine European Parliaments After 1918. Amsterdam: Elsevier.
Diamond, Larry. 19S9. "Introduction: Persistence, Erosion, Breakdown, and Renewal." In Larry Diamond, Juan J. Linz, and Seymour Martin Lipset, eds., Democracy in Developing Countries: Asia, 1-52. Boulder, Colo.: Lynne Rienner.
_. 1992. "Economic Development and Democracy Reconsidered." In Gary Marks and Larry Diamond, eds., Reexamining Democracy: Essays in Honor of Seymour Martin Upset, 93-139. Newbury Park, Calif.: Sage.
Dicey, A. V. 1915. Introduction to the Study of the Law of the Constitution, sth ed. London: Macmillan.
Dixon, Robert G., Jr. 1965. Democratic Representation: Reapportionment in Law and Politics. New York: Oxford University Press, 1968.
Dodd, Lawrence C. 1976. Coalitions in Parliamentary Government. Princeton: Princeton University Press.
Dogan, Mattei. 19S9. "Irremovable Leaders and Ministerial Instability in European Democracies." In Mattei Dogan, ed., Pathways to
REFERENCES 323
Power: Selecting Rulers in Pluralist Democracies, 239-75. Baulder, Calo.: Westview.
-. 1994. "Use and Misuse of Statistics in Comparative Research: Limits to Quantification in Comparative Politics." In Mattei Dogan ao.d Ali Kazancigil, eds., Comparing Nations: Concepts, Strategies, Substance, 35-71. Oxford: Blackwell.
Druckman, James N. 1996. "Party Factionalism and Cabinet Durability." Party Politics 2, no. 3 (July): 397-407.
Dllchacek, lvo D. 1970. Comparative Federalism: The Territorial Dimension of Politics. New York: Holt, Rinehart and Winston.
Duncan, Neville. 1994. "Barbados: Democracy at the Crossroads." In Carlene J. Edie, ed., Democracy in the Caribbean: Myths and Realities, 75-91. Westport, Conn.: Praeger.
Dllverger, Maurice. 1964. Political Parties: Their Organization and Activity in the Modern State, 3d ed. London: Methuen.
-. 19S0. "A New Political System Model: Semi-Presidential Government." European Journal of Political Research 8, no. 2 (June): 165-S7.
-. 19S6. "Duverger's Law: Forty Years Later." In Bernard Grofman and Arend Lijphart, eds. Electoral Laws and Their Political Consequences, 69-S4. New York: Agathon.
Edinger, Lewis J. 19S6. West German Politics. New York: Columbia University Press.
Elazar, Daniel J. 1965. "Federalism." In David L. Sills, ed., International Encyclopedia of the Social Sciences, 5, 353-67. New York: Macmillan and Free Press.
-. 19S7. Exploring Federalism. Tuscaloosa: University of Alabama Press.
-. 1997. "Contrasting Unitary and Federal Systems." International Political Science Review18, no. 3 (July): 237-51.
Elder, Neil, Alastair H. Thomas, and David Arter. 19S5. The Consensual Democracies? The Government and Politics of the Scandinavian States, rev. ed. Oxford: Basil Blackwell.
Elster, Jon. 1994. "Constitutional Courts and Central Banks: Suicide Prevention or Suicide Pact?" East European Constitutional Review, 3, nos. 3-4 (Summer-Fall): 66-71.
Emerson, Rupert. 1960. From Empire to Nation: The pjse to SelfAssertion.of Asian and African Peoples. Cambridge, Mass.: Harvard University Press.
1III
II
11;
t
Ii
ITt!
i ,1:1
",i:, \,:
L __
32. REFERENCES
Emmanuel, Patrick A. M. 1992. Elections and party Systems in the Commonwealth Caribbean, 1944-1991. St. Michael, Barbados: Caribbean Development Research Services.
Espiog-Andersen, G0sta. 1990. The Three Worlds of Welfare Capitalism. Prioceton: Prioceton University Press.
Favoreu, Louis. 1986. Les cours constitutionnelles. Paris: Presses Universitaires de France.
Feldsteio, Martio. 1997. "EMU and International Conflict." Foreign Affairs 76, no. 6 (November-December): 60-73.
Fenno, Richard F., Jr. 1959. The President's Cabinet: An Analysis in the Period from Wilson to Eisenhower. Cambridge, Mass.: Harvard University Press.
Fioer, S. E., ed. 1975. Adversary Politics and Electoral Reform. London: Anthony Wigram.
Fitzmaurice, John. 1996. The Politics of Belgium: A Unique Federalism. Boulder, Colo.: Westview.
Franck, Matthew J. 1996. Against the Imperial Judiciazy: The Supreme Court vs. the Sovereignty of the People. Lawrence: University Press of Kansas.
Freedom House Survey Team. 1996. Freedom in the World: The Annual Survey of Political Rights and Civil Liberties, 1995-
1996. New York: Freedom House. Friedrich, CarIJ. 1950. Constitutional Government and Democracy,
rev. ed. Boston: Ginn. Gadbois, George H., Jr. 1987. "The Institutionalization of the Su
preme Court of India." In John R Schmidhauser, ed., Comparative Judicial Systems: Challenging Frontiers in Conceptual and Empirical Analysis, 111-42. London: Butterworths.
Gallagher, Michael. 1991. "Proportionality, Disproportionality and Electoral systems." Electoral Studies 10, no. 1 (March): 33-51.
-. 1995. "Conclusion." In Michael Gallagher and Pier Vincell20 Uleri, eds., The Referendum Experience in Europe, 226-52. London: Macmillan.
Gallagher, Michael, Michael Laver, and Peter Mair. 1995. Representative Government in Modern Europe, 2d ed. New York: McGraw-Hill.
Gasiorowski, Mark J. 1996. "An Overview of the Political Regime Change Dataset." Comparative Political Studies 29, no. 4 (August): 469-83.
REFERENCES 325
Gastil, Raymond D. 1989. Freedom in the World: Political Rights and Civil Liberties, 1988-1989. New York: Freedom House.
-. 1991. "The Comparative Survey of Freedom: Experiences and Suggestions." In Alex Inkeles, ed., On Measuring Democracy: Its Consequences and Concomitants, 21-46. New Brunswick, N.J.: Transaction. "
Gerlich, Peter. 1992. "A Farewell to Corporatism." West European Politics 15, no. 1 (Januazy): 132-46.
Gobeyn, Mark James. 1993. "Explaioiog the Declioe of MacroCorporatist Political Bargaioiog Structures io Advanced Capitalist Societies." Governance 6, no. 1 (Januazy): 3-22.
Goldey, David, and Philip Williams. 1983. "France." In Vernon Bogdanor and David Butler, eds .. Democracy and Elections: Electoral Systems and Their Political Consequences, 62-83. Cambridge: Cambridge University Press.
Goodio, Robert E. 1996. "Institutionaliziog the Public Interest: The Defense of Deadlock and Beyond." American Political Science Review 90, no. 2 (June): 331-43.
Goodman, John B. 1991. "The Politics of Central Bank Independence." Comparative Politics 23, no. 3 (April): 329-49.
Gorges, MichaelJ. 1996. Euro-Corporatism? Interest Intermediation in the European Community. Lanham, Md.: University Press of America.
Grilli, Vittorio, Donato Masciandaro, and Guido TabeIlini. 1991. "Political and Monetazy Institutions and Public Fioancial Policies io the Industrial Countries." Economic Policy: A European Forum 6, no. 2 (October): 342-92.
Grimsson, Olafur R 1982. "Iceland: A Multilevel Coalition System." In Eric C. Browne and John Dreijmanis, eds., Government Coalitions in Western Democracies, 142-86. New York: Longman.
Grofman, Bernard, and Peter van Roozendaal. 1997. "Modeling Cabioet Durability and Termination." British Journal of Political Science 27, no. 3 (July): 419-51.
Grosser, Alfred. 1964. "The Evolution of European Parliaments." In Stephen R Graubard, ed., A New Europe? 219-44. Boston: Houghton Mifflio.
Gutmann, Emanuel. 1988. "Israel: Democracy Without a Constitution." In Vernon Bogdanor, ed., Constitutions in Democratic Politics, 290-308. Aldershot: Gower.
326 REFERENCES
Gwartney, James, Robert Lawson, and Walter Block. 1996. Economic Freedom of the World: 1975-1995. Vancouver: Fraser Institute.
Haggard, Stephan, and Robert R. Kaufman. 1995. The Political Economy of Democratic Transitions. Princeton: Princeton University Press.
HahIn, Sung Deuk, Mark S. Kamlet, and David C. Mowery. 1996. "The Political Economy of Deficit Spending in Nine Industrialized Parliamentary Democracies: The Role of Fiscal Institutions." Comparative Political Studies 29, no. 1 (February): 52-77.
Hailsham, Lord. 1978. The Dilemma of Democracy: Diagnosis and Prescription. London: Collins.
Hall, Peter A. 1994. "Central Bank Independence and Coordinated Wage Bargaining: Their Interaction in Germany and Europe." German Politics and Society, Issue 31 (Spring): 1-23.
Hamilton, Alexander, John Jay, and James Madison. 1788. The Federalist. N ew York: McLean.
Hartiyn, Jonathan. 1989. "Colombia: The Politics of Violence and Accommodation." In Larry Diamond, Juan J. Linz, and Seymour Martin Lipset, eds., Democracy in Developing Countries: Latin America, 291-334. Boulder, Colo.: Lynne Rienner.
Hattenhauer, Hans, and Werner Kaltefleiter, eds. 1986. Mehrheitsprinzip, Konsens und Verfassung. Heidelberg: C. F. Miiller Juristischer Verlag.
Hazan, Reuven Y. 1997. "Executive-Legislative Relations in an Era of Accelerated Reform: Reshaping Gove=ent in Israel." Legislative Studies Quarterly 22, no. 3 (August): 329-50.
Heller, William B. 1997. "Bicameralism and Budget Deficits: The Effect of Parliamentary Structure on Gove=ent Spending." Legislative Studies Quarterly 22, no. 4 (November): 485-516.
Hix, Simon. 1994. "The Study of the European Community." West European Politics 17, no. 1 (January): 1-30.
Hohn, John D. 1988. "Botswana: A Paternalistic Democracy." In Larry Diamond, Juan J. Linz, and Seymour Martin Lipset, eds., Democracy in Developing Countries: Africa, 179-215. Boulder, Colo.: Lynne Rienner.
-. 1989. "Elections and Democracy in Botswana." In John D. Hohn and Patrick Molutsi, eds., Democracy in Botswana: The
REFERENCES 321
Proceedings of a Symposium Held in Gabarone, 1-5 August 1988,189-202. Gabarone: Macmillan Botswana.
Hohn, John D., Patrick P. Molutsi, and Gloria Somolekae. 1996. "The Development of Civil Society in a Democratic State: The Botswan~ Model." African Studies Review 39, no. 2 (September): 43-69.
Hohnes, Kim R., Bryan T. Johnson, and Melanie Kirkpatrick. 1997. 1997 Index of Economic Freedom. Washington, D.C.: Heritage Foundation.
Horwill, George. 1925. Proportional Representation: Its Dangers and Defects. London: Allen and Unwin.
Huber, John D. 1996. Rationalizing Parliament: Legislative Institutions and Porty Politics in France. Cambridge: Cambridge University Press.
Huber, John D., and G. Bingham Powell, Jr. 1994. "Congruence Between Citizens and Policymakers in Two Visions of Liberal Democracy." World Politics 46, no. 3 (April): 291-326.
Huntington, Samuel P. 1991. The Third Wave: Democratization in the Late Twentieth Century. Norman: University of Oklahoma Press.
Inglehart, Ronald. 1977. The Silent Revolution: Changing Values and Political Styles Among Western Publics. Princeton: Princeton University Press.
-. 1997. Modernization and Postmodernization: Cultural, Economic, and Political Change in Forty-Three Societies. Princeton: Princeton University Press.
Inkeles, Alex, ed. 1991. On Measuring Democracy: Its Consequences and Concomitants. New Brunswick, N.J.: Transaction.
International IDEA. 1997. Voter Turnout from 1945 to 1997: A Global Report on Political Participation. Stockhohn: International Institute for Democracy and Electoral Assistance.
International Labour Organization. 1996. Yearbook of Labour Statistics 1996. Geneva: International Labour Office.
Inter-Parliamentary Union. 1995. Women in Parliaments, 1945-1995: A World Statistical Survey. Geneva: Inter-Parliamentary Union.
Jackson, Keith, and Alan McRobie. 1998. New Zealand Adopts Proportional Representation: Accident? Design? Evolution? Aldershot: Ashgate.
L..
328 REFERENCES
Jaggers, Keith, and Ted Robert Gurr. 1995. Polity ill: Regime Change and Political Authority, 1800-1994 (computer file). Ann Arbor, Mich.: Inter-University Consortium for Political and Social Research.
Johnson, Nevil. 1998. "Tbe Judicial Dimension in British Politics." West European Politics 21, no. 1 (January): 148-66.
Jones, Charles O. 1994. The Presidency in a Separated System. Washington, D.C.: Brookings Institution.
Jones, MarkP. 1995. Electoral Laws and the Survival of Presidential Democracies. Notre Dame, Ind.: University of Notre Dame Press.
Jung, Sabine. 1996. "Lijpharts Demokratietypen und die direkte Demokratie." Zeitschrift fUr Politikwissenschaft 6, no. 3: 623-45.
Kaiser, Andre. 1997. "Types of Democracy: From Classical to New Institutionalism." Journal of Theoretical Politics 9, no. 4 (October): 419-44.
Katz, Richard S. 1980. A Theory of Parties and Electoral Systems. Baltimore: Johns Hopktns University Press.
Katzenstein, Peter J. 1985. Small States in World Markets: Industrial Policy in Europe. Ithaca: Cornell University Press.
Kavanagh, Dennis. 1974. "An Aroerican Science of British Politics." Political Studies 22, no. 3 (September): 251-70.
Keeler, John T. S., and Martin A. Schain. 1997. "Institutions, Political Poker, and Regime Evolution in France." In Kurt von MetteMeim, ed., Presidential Institutions and Democratic Politics: Comparing Regional and National Contexts, 84-105. Baltimore: Johns Hopkins University Press.
King, Anthony. 1976. "Modes of Executive-Legislative Relations: Great Britain, France, and West Germany." Legislative Studies Quarterly 1, no. 1 (February): 11-36.
-. 1994. "'Chief Executives' in Western Europe." In Ian Budge and David McKay, eds., Developing Democracy: Comparative Research in Honour of J. F. P. Blondel, 150-63. London: Sage.
Kirchner, Emil J. 1994. "The European Community: A Transnational Democracy?" In Ian Budge and David McKay, eds., Developing Democracy: Comparative Research in Honour of J. F. P. Blondel, 253-66. London: Sage.
Klingemann, Hans-Dieter. 1999. "Mapping Political Support in the 1990s: A Global Analysis." In Pippa Norris, ed., Critical Cit-
REFERENCES 329
izens: Global Support for Democratic Government. Oxford: Oxford University Press.
Klingemann, Hans-Dieter, Richard 1. Hofferbert, and Ian Budge. 1994. Part}es, Policies, and Democracy. Boulder, Colo.: Westview.
Kothari, Rajni. 1970. Politics in India. Boston: Little, Brown. Krauss, Ellis S. 1984. "Conflict in the Diet: Toward Conflict Manage
ment in Parliamentary Politics." In Ellis S. Krauss, Tbomas P. Rohlen, and Patricia G. Steinhoff, eds., Conflict in Japan, 243-93, Honolulu: University of Hawaii Press.
Laakso, Markku, and Rein Taagepera. 1979. "'Effective' Number of Parties: A Measure with Application to West Europe." Comparative Political Studies 12, no. 1 (April): 3-27.
Landfried, Christine. 1995. "Germany." In C. Neal Tate and Torbj5rn Vallinder, eds., The Global Expansion of Judicial Power, 307-24. New York: New York University Press.
Lane, Jan-Erik, and Svante Ersson. 1994a. Comparative Politics; An Introduction and New Approach. Cambridge: Polity.
-. 1994b. Politics and Society in Western Europe, 3d ed. London: Sage.
-. 1997. "Tbe Institutions of Konkordanz and Corporatism: How Closely Are They Connected?" Swiss Political Science Review3, no. 1 (Spring): 5-29.
Lane, Jan-Erik, David McKay, and Kenneth Newton. 1997. Political Data Handbook: GECD Countries, 2d ed. Oxford: Oxford University Press.
LaPalombara, Joseph. 1987. Democracy, Italian Style. New Haven and London: Yale University Press.
Laver, Michael, and W. Ben Hunt. 1992. Policy and Party Competition. New York: Routledge.
Laver, Michael, and Norman Schofield. 1990. Multiparty Government; The Politics of Coalition in Europe. Oxford: Oxford University Press.
Laver, Michael, and Kenneth A. Shepsle. 1996. Making and Breaking Governments; Cabinets and Legislatures in Parliamentary Democracies. Cambridge: Cambridge University Press.
Lawson, Stephanie. 1993. "Conceptual Issues in the Comparative Study of Regime Change and Democratization." Comparative Politics 25, no. 2 (January): 183-205.
330 REFERENCES
Lehmbruch, Gerhard. 1993. "Consociational Democracy and Corporatism in Switzerland." Publius 23, no. 2 (Spring): 43-60.
Lehner, Franz. 1984. "Consociational Democracy in Switzerland: A Political-Economic Explanation and Some Empirical Evidence." European Journal of Politi cal Research 12, no. 1 (March): 25-42.
Leiserson, Michael. 1970. "Coalition Gove=ent in Japan." In Sven Groennings, E. W. Kelley, and Michael Leiserson, eds., The Study of Coalition Behavior: Theoretical Perspectives and Cases from Four Continents, 80-102. New York: Holt, Rinehart, and Winston.
Leonardi, Robert, and Douglas A. Wertman. 1989. Italian Christian Democracy: The Politics of Dominance. New York: St. Martin's.
Levine, Daniel H. 1989. "Venezuela: The Nature, Sources, and Prospects of Democracy." In Larry Diamond, Juan J. Linz, and SeyIIlOur Martin Lipset, eds., Democracy in Developing Countries: Latin America, 247-89. Boulder, Colo.: Lynne Rienner.
Levine, Stephen. 1979. The New Zealand Political System: Politics in a Small Society. Sydney: George Allen and Unwin.
Lewin, Leif. 1994. "The Rise and Decline of CorporatisIIl: The Case of Sweden." European Journal of Political Research 26, no. 1 (July): 59-79.
Lewis, W. Arthur. 1965. Politics in West Africa. London: George Allen and Unwin.
Lijphart, Arend. 1984. Democracies: Patterns of Majoritarian and Consensus Government in Twenty-One Countries. New Haven and London: Yale University Press.
-.1994. Electoral Systems and Party Systems: A Study of TwentySeven Democracies, 1945-1990. Oxford: Oxford University Press.
-.1997a. "DiIIlensions ofDeIIlocracies." European Journal of Political Research 31, nos. 1-2 (February): 195-204.
-. 1997b. "Unequal Participation: Democracy's Unresolved Dile=a." American Political Science Review 91, no. 1 (March): 1-14.
Lijphart, Arend, and Markus M. L. Crepaz. 1991. "Corporatism and Consensus DeIIlocracy in Eighteen Countries: Conceptual and EIIlpirical Linkages." British Journal of Political Science 21, no. 2 (April): 235-46.
REFERENCES 331
Linder, Wolf. 1994. Swiss Democracy: Possible Solutions to Conflict in Multicaltura1 Societies. New York: St. Martin's.
Linz, Juan J., and Arturo Valenzuela, eds. 1994. The Failure of Pres identifrl Democracy. Baltimore: Johns Hopkins University Press.
Lipset, SeYIIlour Martin. 1960. Political Man: The Social Bases of Politics. Garden City, N.Y.: Doubleday.
Lipset, SeYIIlour Martin, and Stein Rokkan. 1967. "Cleavage Structures, Party Systems, and Voter Alignments: An Introduction." In SeYIIlour M. Lipset and Stein Rokkan, eds., Party Systems and Voter Alignments: Cross-National Perspectives, 1-64. New
.' York: Free Press. Lohmann, Susanne. 1998. "FederalisIIl and Central Bank Indepen
dence: The Politics of GeTIIlan Monetary Policy, 1957-1992." World Politics 50, no. 3 (April): 401-46.
Longley, Lawrence D., and David M. Olson, eds. 1991. Two into One: The Politics and Processes of National Legislative Cameral Change. Boulder, Colo.: Westview.
LooseIIlore, John, and Victor J. Hanby. 1971. "The Theoretical LiIIlits of MaximUIIl Distortion: Some Analytical Expressions for Electoral Systems." British Journal of Political Science 1, no. 4 (October): 467-77.
Loughlin, John, and Sonia Mazey, eds. 1995. The End of the French . Unitary State? Ten Years of Regionalization in France (1982-
1992). London: Frank Casso Lowell, A. Lawrence. 1896. Governments and Parties in Conti
nental Europe. Boston: Houghton Mifflin. MacDonald, Scott B. 1986. Trinidad and Tobago: Democracy and
Development in the Caribbean. New York: Praeger. Mackie, Thomas T., and Richard Rose. 1991. The International Al
manac of Electoral History, 3d ed. London: Macmillan. Mackie, ThoIIlas T., and Richard Rose. 1997. A Decade of Election
Results: Updating the international Almanac. Glasgow: Centre for the Study of Public Policy, University of Glasgow.
McRae, Kenneth D. 1983. Conflict and Compromise in Multilingual Societies: Switzerland. Waterloo, Ont.: Wilfrid Laurier UniversityPress.
-. 1986. Conflict and Compromise in Multilingual Societies: Belgium. Waterloo, Ont.: Wilfrid Laurier University Press.
-. 1997. "Contrasting Styles ofDeIIlocratic Decision-Making: Ad-
, ,. I
332 REFERENCES
versarial versus Consensual Politics." International Political Science Review 18, no. 3 [July): 279-95.
.Maddex, Robert L. 1995. Constitutions of the World. Washington, D.C.: Congressional Quarterly.
Mabler, Gregory S. 1997. "The 'Westminster Model' Away from Westminster: Is It Always the Most Appropriate Model?" In Abdo I. Baaklini and Helen Desfosses, eds., Designs for Democratic Stability: Studies in Viable Constitutionalism, 35-51. Armonk, N.Y.: M. K Sharpe.
Mainwaring, Scott, and Matthew Soberg Shugart. 1997. "Introduction." In Scott Mainwaring and Matthew Soberg Shugart, eds., Presidentialism and Democracy in Latin America, 1-11. Cambridge: Cambridge University Press.
Mair, Peter. 1994. "The Correlates of Consensus Democracy and the Puzzle of Dutch Politics." West European Politics 17, no. 4 (October): 97-123.
Manglapus, Raul S. 1987. Will of the People: Original Democracy in Non-Western Societies. New York: Greenwood.
Mansbridge, Jane. 1980. Beyond Adversary Democracy. New York: Basic Books.
-. 1996. "Reconstructing Democracy." In Nancy J. Hirschmann and Christine Di Stefano, eds., Revisioning the Political: Feminist Reconstructions of Traditional Concepts in Western Political Theory, 117-38. Boulder, Colo.: Westview.
Mathur, Hansraj. 1991. Parliament in Mauritius. Stanley, Rose-Hill, Mauritius: Editions de l'Ocean Indien.
-.1997. "Party Cooperation and the Electoral System in Mauritius." in Brij V. Lal and Peter Larmour, eds., Electoral Systems in Divided Societies: The Fiji Constitution Review; 135-46. Canberra: National Centre for Development Studies, Australian Nationa! University.
Mauer, Marc. 1994. Americans Behind Bars: The International Use of incarceration, 1992-1993. Washington, D.C.: Sentencing Project.
--. 1997. Americans Behind Bars: U.S. and International Use of Incarceration, 1995. Washington, D.C.: Sentencing Project.
Maxfield, Sylvia. 1997. Gatekeepers of Growth: The International Political Economy of Central Banking in Developing Countries. Princeton: Princeton University Press.
REFERENCES 333
May, Clifford D. 1987. "Political Speecbmaking: Biden and the Annals of Raised Eyebrows." New York Times (September 21): B8.<
Messick, Richard K, ed. 1996. World Survey of Economic Freedom, 1995-1996: A Freedom House Study. New Brunswick, N.J.: Transaction.
Mill, John Stuart. 1861. Considerations on Representative Government. London: Parker, Son, and Bourn.
Moreno, Luis. 1994. "Ethnoterritorial Concurrence and Imperfect .. Federalism in Spain." In Bertus de V:t!liers, ed., Evaluating Fed
eral Systems, 162-93. Dordrecht: Martinus Nijhoff. Milller, Wolfgang c., and Kaare Str0m, eds. 1997. Koalitionsregie
rongen in Westeuropa: Bildung, Arbeitsweise und Beendigung. Vienna: Signum Verlag.
Munroe, Trevor. 1996. "Caribbean Democracy: Decay or,Renewal?" In Jorge I. Domingnez and Abraham F. Lowenthal, eds., Constructing Democratic Governance: Mexico, Central America, and the Caribbean in the 1990s, 104-17. Baltimore: Johns Hopkins University Press.
Muravchik, Joshua. 1991. Exporting Democracy: Fulfilling America's Destiny. Washington, D.C.: AEI.
Nohlen, Dieter. 1978. Wahlsysteme der Welt-Daten und Analysen: Ein Handbuch. Munich: Piper.
--.1984. "Changes and Choices in Electoral Systems." In Arend Lijphart and Bernard Grofroan, eds., Choosing an Electoral System: Issues and Alternatives, 217-24. New York: Praeger.
Nohlen, Dieter, ed. 1993. Enciclopedia electorallatinoamericana y del Caribe. San Jose, Costa Rica: Instituto Interamericano de Derechos Humanos.
O'Donnell, Guillermo. 1994. "Delegative Democracy." Journal of Democracy5,no.l (January): 55-69.
OECD. 1990. OECD Economic Outlook, 47. Paris: Organisation for Economic Co-operation and Development.
-. 1991. OECD Economic Outlook, 50. Paris: Organisation for Economic Co-operation and Development.
--. 1995. Labour Force Statistics. Paris: Organisation for Economic Co-operation and Development.
--. 1996a. OECD Economic Outlook, 60. Paris: Organisation for Economic Co-operation and Development.
334 REFERENCES
-. 1996b. Labour Force Statistics. Paris: Organisation for Economic Co-operation and Development.
--. 1998. OECD Economic Outlook, 63. Paris: Organisation for Economic Co-operation and Development.
Ordeshook, Peter C., and Olga V. Shvetsova. 1994. "Ethnic Heterogeneity, District Magnitude, and the Number of Parties." American Journal of Political Science 38, no. 1 (February): 100-123.
Palmer, Monte. 1997. Political Development: Dilemmas and Challenges. Itasca, TI!.: Peacock.
Payne, Anthony. 1993. "Westminster Adapted: The Political Order of the Commonwealth Caribbean." In Jorge I. Dominguez, Robert A. Pastor, and R. DeLisle Worrell, eds., Democracy in the Caribbean: Political, Economic, and Social Perspectives, 57-73. Baltimore: Johns Hopkins University Press.
Peeler, John A. 1985. Latin American Democracies: Colombia, Costa JUca, Venezuela. Chapel Hill: University of North Carolina Press.
Pekkarinen, Jukka, Matti Pohjola, and Bob Rowthorn, eds. 1992. Social Corporatism: A Superior Economic System? Oxford: Clarendon.
Pempel, T. J. 1992. "Japanese Democracy and Political Culture: A Comparative Perspective." PS: Political Science and Politics 25, no. 1 (March): 5-12.
Peters, B. Guy. 1997. "The Separation of Powers in Parliamentary Systems." In Kurt von Mettenheim, ed., Presidential Institutions and Democratic Politics: Comparing Regional and National Contexts, 67-83. Baltimore: Johns Hopkins University Press.
Powell, G. Bingham, Jr. 1980. "Voting Turnout in Thirty Democ-' racies: Partisan, Legal, and Socio-Economic Influences." In Richard Rose, ed., Electoral Participation: A Comparative Analysis, 5-34. Beverly Hills: Sage.
-. 1982. Contemporary Democracies: Participation, Stability, and Violence. Cambridge, Mass.: Harvard University Press.
--. 1989. "Constitutional Design and Citizen Electoral Contro!." Journal of Theoretical Politics 1, no. 2 (Apri!): 107-30.
Power, Timothy J., and Mark J. Gasiorowski. 1997. "Institutional Design and Democratic Consolidation in the Third World." Comparative Political Studies 30, no. 2 (April): 123-55.
Premdas, Ralph R. 1993. "Race, Politics, and Succession in Trin-
REFERENCES 335
idad and Guyana." In Anthony Payne and Paul Sutton, eds., Modern Caribbean Politics, 98-124. Baltimore: Johns Hopkins University Press. ,
Rae, Douglas W. 1967. The Political Consequences of Electoral Laws. New Haven: Yale University Press.
Rae, Douglas w., and Michael Taylor. 1970. The Analysis of Political Cleavages. New Haven: Yale University Press.
Ray, James Lee. 1997. "The Democratic Path to Peace." Journal of Democracy 8, no. 2 (Apri!): 49-64.
Ree.d, Steven R., and John M. Bolland. 1999. "The Fragmentation Effect of SNTV in Japan." In Bernard Grofinan, Suog-Chull Lee, Edwin Winckler, and Brian Woodall, eds., Elections in Japan, Korea, and Taiwan Under the Single Non-Transferable Vote: The Comparative Slndy ofan Embedded Institution. Ann Arbor: University of Michigan Press.
Reich, Robert B. 1997. Locked in the Cabinet. New York: Alfred A. Knopf.
Reynolds, Andrew, and Ben Reilly. 1997. The International IDEA Handbook of Electoral System Design. Stockholm: International Institute for Democracy and Electoral Assistance.
Riker, William H. 1962. The Theory of Political Coalitions. New Haven: Yale University Press.
-.1975. "Federalism." In Fred I. Greenstein and Nelson W.Polsby, eds., Handbook of Political Science, 5: Governmental Institutions and Processes, 93-172. Reading, Mass.: Addison-Wesley.
--. 1982. Liberalism Against Populism: A Confrontation Between the Theory of Democracy and the Theory of Social Choice. San Francisco: Freeman.
Rogowski, Ronald. 1987. "Trade and the Variety of Democratic Institutions." International Organization 41, no. 2 (Spring): 203-23.
Rose, Richard. 1974. "A Model Democracy?" In Richard Rose, ed., Lessons from America: An Exploration, 131-61. New York: Wiley.
-. 1992. What Are the Economic Consequences of PR? London: Electoral Reform Society.
Rose, Richard, and Dennis Kavanagh. 1976. "The Monarchy in Contemporary Political Culture." Comparative Politics 8, no. 4 (July): 548-76.
Roubini, Nourie!, and Jeffrey D. Sachs. 1989. "Political and Eco-
336 REFERENCES
nomic Determinants of Budget Deficits in the Industrial Democracies." European Economic Review 33, no. 5 (May): 903-38.
Ruie, Wilma, and Joseph F. Zimmerman, eds. 1994. Electoral Systems in CompOIative Perspective: Their Impact on Women and Minorities. Westport, Conn.: Greenwood.
Sartori, Giovanni 1976. POIties and Party Systems: A Framework for Analysis. Cambridge: Cambridge University Press.
-. 1994a. CompOIative Constitutional Engineering: An Inquiry into Structures, Incentives, and Outcomes. New York: New York University Press.
-. 1994b. "Neither Presidentialism nor Parliamentarism." In Juan J. Linz and Arturo Valenzuela, eds., The Fallure of Presidential Democracy, 106-18. Baltimore: Johns Hopkins University Press.
Schmidt, Manfred G. 1996. "Germany: The Grand Coalition State." In Josep M. Colomer, ed., Political Institutions in Europe, 62-98. London: Routledge.
-.1997. "Determinants of Social Expenditure in Liberal Democracies: The Post World War II Experience." Acta Politica 32, no. 3 (Summer): 153-73.
Schmitter, Philippe C. 1982. "Reflections on Where the Theory of Neo-Corporatism Has Gone and Where the Praxis of NeoCorporatism May Be Going." In Gerhard Lehmbruch and Philippe C. Schmitter, eds., Patterns of Corporatist Policy-Making, 259-79. London: Sage.
-. 1989. "Corporatism Is Dead! Long Live Corporatism!" Government and Opposition 24, no. 1 (Winter): 54-73.
Scott, K. J. 1962. The New Zealand Constitution. Oxford: Clarendon. Seliktar, Ofira. 1982. "Israel: Fragile Coalitions in a New Nation." In
Eric C. Browne and John Dreijmanis, eds., Government Coalitions in Western Democracies, 283-314. New York: Longman.
Senelle, Robert. 1996. "The Reform of the Belgian State." In Joachim Jens Hesse and Vincent Wright, eds., Federalizing Europe? The Costs, Benefits, and Preconditions of Federal Political Systems, 266-324. Oxford: Oxford University Press.
Shapiro, Martin, and Alec Stone. 1994. "The New Constitutional Politics of Europe." CompOIative Political Studies 26, no. 4 (January): 397-420.
Shugart, Matthew Soberg, and John M. Carey. 1992. Presidents and
REFERENCES 337
Assemblies: Constitutional Design and Electoral Dynamics. Cambrilige: Cambridge University Press.
Shugart, Matthew Soberg, and Scott Mainwaring. 1997. "Presidentialism and Democracy in Latin America: Rethinking the Terms of the Debate." In Scott Mainwaring and Matthew Soberg Shugart, eds., Presidentialism and Democracy in Latin America, 12-54. Cambridge: Cambridge University Press.
Siaroff,Alan. 1998. "Corporatism in Twenty-Four Industrial Democracies: Meaning and Measurement" (unpublished manuscript).
Siegfried, Andre. 1956. "Stable Instability in France." Foreign Affairs 34, no. 3 (April): 394-404.
Singh, V. B. 1994. Elections in India, Volume 2: Data Handbook on Lok Sabha Elections, 1986-1991. New Delhi: Sage India.
Steiner, Jiirg. 1971. "The Principles of Majority and Proportionality." British Journal of Political Science1,no.1 [January): 63-70.
-. 1974. Amicable Agreement Versus Majority Rule: Conflict Resolution in Switzerland. Chapel Hill: University of North Carolina Press.
Stone, Alec. 1992. The Birth of Judicial Politics in France: The Constitutional Council in CompOIative Perspective. New York: Oxford University Press.
Strmn, Kaare. 1990. Minority Government and Majority Rule. Cambridge: Cambridge University Press.
-. 1995. "Coalition Building." In Seymour Martin Lipset et al., eds., The Encyclopedia of Democracy, 1, 255-58. Washington, D.C.: Congressional Quarterly.
-.1997. "Democracy, Accountability, and Coalition Bargaining." European Journal of Political Research 31, nos. 1-2 (February): 47-62.
Strmn, Kaare, Ian Budge, and Michael J. Laver. 1994. "Constraints on Cabinet Formation in Parliamentary Democracies." American Journal of Political Science 38, no. 2 (May): 303-35.
Strmn, Kaare, and Jam Y. Leipart. 1993. "Policy, Institutions, and Coalition Avoidance: Norwegian Governments, 1945-1990." American Political Science Review 87, no. 4 (December): 870-87.
Taagepera, Rein. 1994. "Beating the Law of Minority Attrition." In Wilma Ruie and Joseph F. Zimmerman, eds., Electoral Systems
338 REFERENCES
in Comparative Perspective: Their Impact on Women and Minorities, 236-45. Westport, Conn.: Greenwood.
Taagepera, Rein, and Bernard Grofman. 1985. "Rethinking Duverger's Law: Predicting the Effective Number of Parties in Plurality and PR Systems-Parties Minus Issues Equals One." European Journal of Political Research 13, no. 4 (December): 341-52.
Taagepera, Rein, and Matthew Soberg Shugart. 1989. Seats and Votes: The Effects and Determinants of Electoral Systems. New Haven and London: Yale University Press.
Tarlton, Charles D. 1965. "Symmetry and Asymmetry as Elements of Federalism: A Theoretical Speculation." Journal of Politics 27, no. 4 (November): 861-74.
Tate, C. Neal, and Torbjorn Vallinder, eds. 1995. The Global Expansion of Judicial Power. New York: New York University Press.
Taylor, Charles Lewis. 1986. Handbook of Political and Social Indicators ill: 1948-1982 (computer file), 2d ICPSR ed. Ann Arbor, Michigan: Inter-University Consortium for Political and Social Research.
Taylor, Charles Lewis, and David A. Jodice. 1983. World Handbook of Political and Social Indicators, 3d ed. New Haven and London: Yale University Press.
Taylor, Michael, and Valentine M. Herman. 1971. "Party Systems and Gove=ent Stability." American Political Science Review 65, no. 1 (March): 28-37.
Therborn, Gilran. 1977. "The Rule of Capital and the Rise ofDemocracy." New LejtReviewl03 (May-June): 3-41.
Thorndike, Tony. 1993. "Revolution, Democracy, and Regional Integration in the Eastern Caribbean." In Anthony Payne and Paul Sutton, eds., Modern Caribbean Politics, 147-75. Baltimore: Johns Hopkins University Press.
Transparency International. 1997. Corruption Perception Index. Berlin: http://gwdu19.gwdg.de/-uwvwfrank-97 .htm
Tschaeni, Hanspeter. 1982. "Constitutional Change in Swiss Cantons: An Assessment of a Recent Phenomenon." Publius 12, no. 1 (Winter): 113-30.
Tsebelis, George. 1995. "Decision Making in Political Systems: Veto Players in Presidentialism, Parliamentarism, Multicameralism and Multipartyism." British Journal of Political Science 25, no. 3 (July): 289-325.
REFERENCES 339
Tsebelis, George, and Jeannette Money. 1997. Bicameralism. Cambridge~Cambridge University Press.
Tufte, Edward R. 1978. Political Control of the Economy. Princeton, N.J.: Princeton University Press.
Tummala, Krishna K. 1996. "The Indian Union and Emergency Powers." International Political Science Review 17, no. 4 (October): 373-84.
United Nations Development Programme. 1994. Human Development Report 1994. New York: Oxford University Press.
_. 1'995. Human Development Report 1995. New York: Oxford University Press.
--.1996. Human Development Report 1996. New York: Oxford University Press.
-.1997. Human Development Report 1997. New York: Oxford University Press.
Vanhanen, Tatu. 1990. The Process of Democratization: A Comparative Study of 14 7 States, 1980-88. N ew York: Crane Russak.
_. 1997. Prospects of Democracy: A Study of 172 Countries. London: Routledge.
Varshney, Ashutosh. 1995. Democracy, Development, and the Countryside: Urban-Rural Struggles in India. Cambridge: Cambridge University Press.
Verba, Sidney. 1967. "Some Dilemmas in Comparative Research." World Politics 20, no. 1 (October 1967): 111-27.
Verney, Douglas V. 1959. The Analysis of Political Systems. London: Routledge and Kegan Paul.
Verougstraete, Ivan. 1992. "Judicial Politics in Belgium." West EuropeanPolitics 15, no. 3 (July): 93-108.
von Beyme, Klaus. 1985. Political Parties in Western Democracies. New York: St. Martin's.
von Mettenheim, Kurt. 1997. "Introduction: Presidential Institutions and Democratic Politics." In Kurt von Mettenhetm, ed., Presidential Instirutions and Democratic Politics: Comparing Regional and National Contexts, 1-15. Baltimore: Johns Hopkins University Press.
Vowles, Jack, Peter Aimer, Susan Banducci, and Jeffrey Karp, eds. 1998. Voters' VictoIY? New Zealand's First Election Under Proportional Representation. Auckland: Auckland University Press.
1'1
340 REFERENCES
Wada, Junichiro. 1996. The Japanese Election System: Three Analytical Perspectives. London: Routledge.
Warwick, Paul V. 1994. Government Survival in Parliamentary Democracies. Cambridge: Cambridge University Press.
Wheare, K. C. 1946. Federal Government. London: Oxford University Press.
-. 1964. Federal Government, 4th ed. New York: Oxford UniversityPress.
Wiarda, Howard J. 1997. Corporatism and Comparative Politics: The Other Great "Ism." Armonk, N.Y.: M. E. Sharpe.
Wilensky, Harold L. 1990. "Common Problems, Divergent Policies: An Eighteen-Nation Study of Family Policy." Public Affairs Report 31, no. 3 (May): 1-3.
Wilson, Graham. 1990. Interest Groups. Oxford: Basil Blackwell. -. 1994. "The Westminster Model in Comparative Perspective."
in Ian Budge and David McKay, eds., Developing Democracy: Comparative Research in Honour of J. F. P. Blondel, 189-201.
London: Sage. -. 1997. "British Democracy and Its Discontents." In Metin
Heper, Ali Kazancigil, and Bert A. Rockman, eds., Institutions and Democratic Statecraft, 59-76. Boulder, Colo.: Westview.
Wilson, Woodrow. 1884. "Committee or Cabinet Government?" Overland Monthly, Ser. 2, 3 (January): 17-33.
-. 1885. Congressional Government: A Study in American Politics. Boston: Houghton Mifflin.
Woldendorp, Jaap, Hans Kernan, and Ian Budge. 1998. "Party Governmentin Twenty Democracies: An Update (1990-1995)." EuropeanJournal of Political Research 33, no. 1 (January): 125-64.
World Bank. 1992. The World Bank Atlas: Twenty-ftfth Anniversary Edition. Washington, D.C.: International Bank for Reconstruction and Development.
-.1993. The World Bank Atlas 1994. Washington, D.C.: International Bank for Reconstruction and Development.
-. 1994. The World Bank Atlas 1995. Washington, D.C.: International Bank for Reconstruction and Development.
-.1995. The World Bank Atlas 1996. Washington, D.C.: International Bank for Reconstruction and Development.
-. 1997. 1997 World Bank Atlas. Washington, D.C.: International Bank for Reconstruction and Development.
"
Index
Adedeji, Adebayo, 306 Ahnond, Gabriel A., 232nl, 307 Alternative vote, 71n6, 145-47, 148,
150-51,157,158,198 Amati, Giuliano. 98n4 Anckar. Dag, 291-92 Anderson, Christopher J., 286-87 Apparentement, 156-57 Argentina. 54-55 lUIilingeon,Rlaus.38 Aron. Raymond, 121 Ashford, Douglas E., 192nl Australia, 49-50, 52. 56, 59, 282,
288.294-95; type of democracy tn.l0,248,251,255:p~system
of. 69-71, 75-77, 81, 84-85. 88: electoral systems of, 70, 71n6, 145-51 passim. 156-57, 161-69 passim, 285n5;executivein, 70, 108n8, 111-12, 133,135, 138-40; parliament of, 119. 204-9 passim, 212,214: interest groups tn. 177, 182-83: federalism tn, 187-94 passim, 198, 300: constitution of, 220.222,226-29 passim; central bank of, 236, 238, 241
Austria, 50, 56, 58, 59, 269, 277, 291; party system of, 77, 81, 82, 88; executive in, 106-7, 110-14 passim, 133, 138-39, 141; par-
liament of, 119. 121, 205, 207-9, 212-15 passim; electoral systems of, 145-46, 162, 168-69; interest groups in, 173, 177, 179. 181-83: federalism in. 187-94 passim, 198; constitution of, 220, 225-29 passim; central bank of, 236, 241; type of democracy in, 248, 251n4, 255,307
Axelrod, Robert, 95, 97
Baar, Carl, 227 Babamas, 50, 53, 56-57, 60, 189,
263, 298; p~ system of, 75, 77, 81-82,88-89,291; executive in, 111-12; 133, 138-40; parliament of, 119, 206, 210-14 passim; electoral system of, 145, 154-55, 162-69 passim: interest groups in, 177, 179,182-83; constitution of. 220-21,224-29 passim: central bank of, 236, 241; type of democracy in, 248. 250
Balladur,Edouard,122 Barbados, 50, 53n3, 56-57, 60, 263,
276,298; as example ofmajoritarian democracy, 7, 10, 27-30,248, 250. 254n6;executive dominance in, 28, 35, 127, 133-35; executive in, 28, 110-12, 138-40:partysys-
342
Barbados (continued) tsm of. 28-29, 32, 65, 75, 77, 81, 88,291; electoral system of, 29, 145,151, 154, 162-69passim;interestgroups in, 29-30, 177, 179, 182-83; parliament of. 30, 119, 200,206,210-14 passim; unitary governmentin, 30, 189; constitutionof, 30, 219-21, 224-29 passim; central bank of, 30, 236, 241
Barco,1Tugilio, 102 Bare-majority cabinets, 10-11, 21,
28,136. See also Minimal winning cabinets
Beer, Samuel, 258 Belgium, 50, 52, 56, 58, 277, 287,
298; as example of consensus democracy, 7, 33-41, 248-49, 252,254-56,307; executive in, 7, 34-36,70,101-3,107n~109-14
passim, 132, 135, 138-40; party system of, 36-37, 69-71, 75-77, 80,82,88; PRin, 37, 70, 145-48 passim, 162-63, 169, 285n5;interestgroups in. 37-38, 177, 182-83; federalism in, 38-39, 187-95 passim, 197, 198; parliament of, 39-40,118-19,127,200,206-9, 210-14 passim; constitution of, 40-41,220,225-29 passim, centJ:al bank of, 41, 237, 239, 241-42
Bicameralism. See Parliaments Bienen, Henry, 129n5 Blackmail potential, 65-66, 78 Blffir,Tony, 16, 17,18 Block, Walter, 270 Blondel,Jean, 66-67, 69-70 Borrelli, Stephen A" 260 Botswana, 50, 53, 56-60 passim,
189,264-65,276-83 passim, 295, 298; party system of, 74-77, 81, 84,88,291; executive in, 111-12, 117,126,133-34,138,141;p~
liament of, 117, 119, 203, 212-14 passim; electoral system of, 145, 154-55,162,169: interest groups in, 177,179, 182-83; constitution
INDEX
OL220-21,224n2,226,229;central bank of, 237, 241; type of democracy in, 248, 254n6
Brass, Paul R, 72 Brautigam, Deborah, 178 Brittan, Leon, 42 Budge, Ian, 100 Budget deficits, 267, 269-70 Busch, Andreas, 24-25 Bush, George, 275 Butler, David, 11, 231
Cabinet durability. See Cabinets Cabinets, 10-11, 21, 28, 34-35, 42,
90-111; and dimensions of democracy, 3, 62, 90, 243-46; classification of, 62, 74n7, 90-91, 98,103-8; durability of, 64, 73, 129-34, 136-39,261n2,288-89; and party systems, 64, 112-13: and prime ministers, 113-15; and interest groups, 181-82. See also Executive-legislative relations
Caldera, Rafael, 128 Callaghan, James, 11 Canada, 50, 56, 269, 289, 298; type
of democracy in. 10, 248-49, 255: party system of, 67, 77, 81, 82, 88; executive in. 111-12, 133, 135, 138-40: parliament of, 119, 204, 206-9,212,214; electoral system of, 145, 151, 162, 167, 169: interest groups in, 177, 180, 182-83; federalism in, 187-90 passim, 193-98 passim, 300; constitution of, 220, 222, 226-29 passim; central bank of, 236, 241
Cappelletti, Mauro, 227 Castles, Francis G., 260 Central banks, 20-21, 24-25, 30, 41,
46-47, 232-40; and federalism, 5, 240-42; and dimensions of democracy, 5, 243-46, 306; and illflation, 233-36, 273,301
Cltirac,Jacques,122 Churchill, Wmston, 11, 92, 100 Clinton, Bill, 52, 107, 143-44, 232
___ I
INDEX ~
Coalition cabinets, 74n7, 90-91, 104-9,136-39. See also Cabinets
Coalition potential, 65-66, 78, 87 Coalition theories, 91-103 Cohen, William, 107 Colombia, 50-52, 56, 58, 189-90,
277,282,286,289; party system of, 72-73. 75-77, 80-88 passim; cabinets in, 102, 103. 107n6. 110-12;presidentialismin, 106, 118-19,127-28,132-36 passim, 138, 281, 303nl;electoral systems of, 145-46,155-63 passim, 168-69: interest groups in, 177, 179, 182-83; bicameralism in, 205, 206, 210,212-15 passim; constitution of, 220-22, 226-29 passim; central bank of, 237, 241; type of democracy in, 248, 250, 254-55
Committee on the Constitutional System, 121, 123, 124
Compulsory voting, 285 Connally, John B., 107 Consensus democracy, 2-8, 31-47;
dimensions of, 3-5, 243-57; effects of, 131, 258-302
Constitutions, 19, 24, 30, 40-41, 45-46,216-23; and federalism, 4, 187-88,230; and dimensions of democracy, 4. 243-46; and referendums, 217-22 passim, 230-31; and judicial review, 223-30
Coppedge, Michael, 179 Corporatism. See Interest groups Corruption, 279, 288-89 Costa Rica, 50, 56, 111-12, 189, 269,
282; party system of, 77. 81. 82, 88; presidentialism in, 106, 118-19,127-28,132-36 passim, 138-39,281, 303nl; electoral systems of, 145-48 passim, 154-55. 160-63 passim, 168-69, 285n5;interest groups in, 177, 179, 182-83; unicameralism in, 202, 212, 214; constitution of, 220, 226, 229; central bank of, 236, 241; type of democracy in, 248, 250, 254-55
343
Crepaz, Markus M, L" 177nl, 260 ~justice,275,296-98,299-
300 Crisp, Brian. 179 Crossman, R H. S., 223 Culiennan,lUex, 233,235-39 Cultural-ethnic issue dimension.
14,27,37,80-81,83-84 Cultural illfluence, British, 9-10,
21,27-28,250-52. See also Political culture
Cyprus, 54-55 Czech Republic, 54, 306
Dahl, Robert A" 6,48-49,191,252, 276-78,280,291,299
Death penalty, 275, 296, 298 Decentralization. See Division of
power de Gaulle, Charles, 222, 230, 250-
51 Democracy: defined, 1-2, 32, 48-
49; quality of, 7-8,275-93,301; conceptual map of, 7, 246-57; perfonnance of, 7-8, 258-74, 293-301; models of, 9-47; incidence of, 49-57
Democratic peace. 29~n12 Denmark, 50, 56. 277, 286. 289,
291-92,299; party system of, 67, 76-77,80-88 passim; executive in, 101, 110-14 passim, 132, 137-39; parliament of, 119, 202, 206, 212-15 passim; PRin, 145, 152, 162,169; interest groups in, 177, 182-83; decentralization in, 189-94 passim, constitution of, 220, 226-29 passim; central bank of, 236,241; type of democracy in, 248,250,255
Diamond, Larry, 51 Dicey, A. V., 19 Dillon, C. Douglas, 107 Dini, Lamberto, 108n7 Disproportionality, index of, 74n7,
157-58 District magnitude, 150-52, 153
'44 Division of power, 3-4, 17-18, 23-
24,30,38-39,45-47,185-99; and dimensions of democracy, 3, 185-86,243-46; and bicameralism, 4-5,187-88,213-15;andcentral banks, 5, 240-42; and population size, 24, 30. 61, 195, 215
Dixon, Robert G., Jr., 5 Dodd, Lawrence C., 131-32 Dogan, Mattei, 130 Druckman, James, N., 73 Duchacek; Iva D., 4, 188 Duverger, Maurice, 121-22, 155,
164-65,210
Economic development, 56, 60-61, 177-78,180.238-39,262-73 passim., 277-300 passim.
Economic freedom, 267. 270 Economicgro~,234.264-66,270 Ecuador, 54-55 Effective number of parties, 57n6,
64,67-69,74-77. See also Electoral systems; Party systems
Elazar, Daniel J., 4, 187-88 Electoral formulas, 144-49 Electoral systems, 14-16, 22-23,
25-27,29,37,43-44,143-64; and dimensions of democracy, 3, 243-46,303-5; and party systems, 64. 164-70; and constitutions, 220-21; and turnout, 286n7
Electoral thresholds, 152-53, 305 Emerson, Rupert, 308 Environmental policies, 275, 295-
97 Equality, 278, 282-84 Brsson, Svante, 192, 194-95 Esping-Andersen, Gesta, 294-95 Estonia, 54, 306 European Union, 14, 16, 20, 85, 262;
as example of consensus system. 7, 33-34,42-47
Executive dominance. See Executive-legislative relations
Executive-legislative balance. See Executive-legislative relations
INDEX
Executive-legislative relations, 11-12,21-22,28,35-36,42,102, 116-35,175; and dimensions of democracy, 3, 243-46; and cabinets, 134-39. See also Cabinets; Parliaments
Executives. See Cabinets Executives-parties dimension, 2, 5,
30,62-63,89,135-36,171,243-57; and government performance, 258-71,274,276-99,301-3,306
Factions. See Party systems Family policy, 278, 281-82 Federalism. See Division of power Federalist Papers, 259 Federal-unitary dimension, 2-5, 30,
185,200,216,232-33,243-57; and government performance, 272-73,293,299-302,306
Feldstein. Martin, 47 Fenno. Richard F., 107 Figueras, Jose, 128 Finer, S. E., 6, 259-60 Finland, 50, 56, 58, 269, 277, 283,
289; cahinetsin, 7, 103, l08n7, 110-12,132,138: party system of, 67,76,80-88 passim; semipresidentialismin, 114n9, 119, 122, 141; electoral systems of, 145-48 passim, 162, 169; interest groups in, 174, 177. 182-83; decentralization in, 189-94 passim; unicameralism in, 202. 212-15 passim: constitution of, 220, 226-30 passim; central bank of, 237. 241; type of democracy in, 248, 250, 255
Ford, Gerald R, 128 Foreign policy issue dimension, 14,
80-81,85-86 France, 42, 46, 50-53 passim, 56,
58,269,282; presidentialism in, 12nl, 106, 114n9, 118-19, 121-23.125,127-29,133-39 passim, 281, 303nl;party system of, 66, 71,76-77,80-88 passim; elec-
'" INDEX
toral systems of, 71n6, 145-51 passim, 155-64 passim, 168-69, Z91nl0;cabinets in, 97, 101. 107n6, 111-12, 130, 136, 304; interest groups in, 176-77, 182-83; unitary government in, 189-94 passim; bicameralism in, 201, 205,210-15 passim; constitution gf, 218-22 passim, 225, 226-29 passim; central bank of, 237, 241; type of democracy in, 248, 250-51,254-56
Freedom House, 50-52, 54-55, 270, 276
Friedrich, CarlJ., 4 Foreign aid, 276, 296, 298-99
Gallagher, Michael, 17, 157-58 Gasiorowski, Mark]., 51 Gastil, Raymond D., 72 Gerlich, Peter, 173 Germany, 42, 50, 52, 55-56, 58, 277,
287n8;executivein, 7, 70, 97,101, 107n6, 109-14passim, 132.138, 141;PRin, 26, 44,70,145-48 passim, 153, 156, 162, 169, 305; central bank of, 41, 232nl, 236, 239, 241; constitution of, 46, 220, 222, 225-26,229-30; party system of, 67,69-71,75-77,80-89passim; parliament of, 117-20passim. 125-26,204-9 passim, 212, 214, 304; interest groups in, 177, 179, 182-83;federalismin.187-94 passim, 198-99; type of democracy in, 247-49, 251n4, 254-55
Gonzalez, Felipe, 98n4 Goodin, Robert E., 5 Goodman, John B., 72, 240 Gorges, MichaeIJ., 44-45 Government-voter proximity, 279,
287-88 Great Britain. See United Kingdom Greece. 50. 53, 55-56, 265, 268, 269,
273,287; party system of, 77, 81, 85,88; executive in, 111-14 passim. 132, 138-39; parliament of,
'45 119,202-3,212, 214;PRin, 145, 162-63,168-70, 285n5;interest groups in, 176-77, 182-83;unitary government in, 189-94 passim, constitution of, 220, 223-24, 226,229; central bank of, 236-37, 239,241; type of democracy in, 248,250,303
Greenspan,AJan,232 Grilli, Vittorio, 233, 238 Grimsson, Olafur R., 85 Grofman, Bernard, 89 Grosser, Alfred, 175 Guillory, Christine A., 286-87 Guinier, Lani, 143 Gurr, Ted Robert, 51, 276 Gwartney, James, 270
Haggard, Stephan, 178 Hahm, Sung Deuk, 260 Hailsham, Lord, 12, 28 Hall, Peter A., 240 Hartlyn, Jonathan. 72 Hattenhauer, Hans, 5-6 Headsofstate,40nl, 126-27, 139-42 Heller, William B., 211n4 Herman, Valentine M., 100, 130n6 Holm, John D., 179 Holmes, KimR., 270 Horwill, George, 150 Huber, John D., 287-88, 306 Human development index, 56, 60,
61,264. See also Economic development
Hungary, 54, 306 Huntington, Samuel P., 6, 55, 57
Iceland, 50, 56, 60, 189, 193, 263; party system of, 76, 81, 84, 85, 88; executive in, 109-14 passim, 132, 138,141; parliament of, 119, 121, 201-2,212-14; electoral systems oL145-46,154,156,162,169; interest groups in, 177, 182-83; constitution of, 220, 226, 229; central bank of, 237, 241; type of democracy in, 248,250,255
346
Incarceration, 275, 296-98, 299-300
India, 50-51, 53. 56-61 passim. 269,282,289,297,298; party system of, 71, 72-73, 75-77, 80-88 passim; executive in, lOana, 110-lZ, l31n7, 132, 135, 138. 141, Z91nl0;parliament of, 119,205-06,207-9,212,214; electoral system of, 145, 151-52, 162, 168-69; interestgmups in, 177, 180, 182-83; federalism in, 187-90 passim,19S-97, 198; constitution of, 219-21, 226-27, 229-30; central bank of, 236, 241; type of democracy in, 248, 251, 252, 304, 307
fiIflation, 25, 233-36, 240, 262, 265-68,272-74,301
Inglehart, Ronald, 86 Interest groups, 16-17, 23, 29-30,
37-38,44-45,171-80; and dimensions of democracy, 3, 171, 243-46,306; and cabinets, 181-82; and party systems, 181-84
rreland, 17, 50,56, 282, 283, 288; party system of, 67, 77,81-88 passim; executive in, 101, 110-14 passim, 117, 132, 135, 138. 141; parliament of, 117-21 passim, 206,210-11,212,214; electoral systems of, 145-48 passim, 153, 157,161-62,169; interest groups in, 177, 182-83; unitary governmentin, 189, 193-94; constitution of, 220, 226, 229; central bank of, 236, 241; type of democracy in, 248, 255, 303
Israel, 50-51, 52, 55-56, 58, 59, 269, 271n5, 298; executive in, 7, 106n~110-12,123-24,126-27,
132,138-39; party system of, 76-77, 80-88 passim; parliament of, 118-19,125,202,212-15 passim; electoral systems of, 145-56 passim, 160-62, 164, 169: interest groups in, 174,177,182-83:
INDEX
semifederalism in, 189, 191; constitutionof, 217-18, 220, 226, 229; central bank of, 236, 241; type of democracy in, 248-49, 251,255,307
Issue dimensions, 14, 22, 28-29, 36-37,78-89
Italy, 42. 50, 52. 55-56, 58, 268, 269.273.286-87; executive in, 7, 98n4, 108n7, 110-14 passim, 132, 138; party system of, 66, 67, 71, 72-73,75-77,80-88 passim; parliamentof, 118-19, 205-6, 210-15 passim; PR in, 145-49 passim, 162,169.285; interest groups in, 177,181-84; unitary government in, 189-94 passim; constitution of, 220-21, 225-29 passim; central bank of, 237, 241; type of democracy in, 248, 255
Jaggers, Keith, 51. 276 Jamaica, 50. 53n3, 56. 60, 189, 271,
282,298; party system of, 74-77, 81.85.88,291; executive in. 111-12,133,138-40; parliament of. 119,206,210-14 passim; electoral system of, 145, 154-55. 158n9, 163-69 passim; interest groups in, 177,179,182-83: constitution of, 220 .... 21, 225-29 passim; central bank of, 237-38, 241: type of democracy in, 248, 250, 254-55
Japan, 50, 52,56,57,282.295,298; party system of. 72-73, 74-77, 80-88 passim: executive in, 108, 110-12,132,138-40;parliament of, 117, 119, 205-06, 210-14 passim; electoral systems of, 145. 148-49,156-63 passim, 166-70 passim, 303; interest groups in, 177,182-83; decentralization in, 189-90,193-94; constitution of, 220.222-23,226,229; central bank of, 237,241: type of democracy in, 248, 251n4, 252, 255
~
INDEX
Jenkins, Lord, 16 Johnson, Bryan T., 270 Johnson, Lyndon B., 129 Jospin, Lionel, 122 Judicial review, 19-20, 24, 30, 41,
46,223-28; and federalism, 4, 187-88,230: and dimensions of democracy, 5, 243-46; and constitutions, 228-30
Kaltefieiter, Werner, 5-6 Kamlet, Mark S., 260 Katzenstein, PeterJ., 38,172, 174-
75,260 Kaufman, Robert R., 178 Kavanagh, Dennis. 140 Keeler, John T. S" 129 Kekkonen, Urho, 122 Kelsen, Hans, 225 Kennedy, John F., 107 Kilbrandon, Lord, 17 KIng, Anthony, 114, 127 Kinnock, Neil, 42 Kirkpatrick, Melanie, 270 Klingemann, Hans-Dieter, 286 Korea, 54-55 Kothari, Rajni, 197
Laakso, Markku, 68 Lane, Jan-Erik, 192, 194-95 LaPalombara, Joseph, 181-82 Latvia, 54, 306 Laver, Michael, 17, 96, 97-98 Lawson, Robert, 270 Lawson, Stephanie, 6 Legislatures. See Parliaments LeInnbruch,G€xhard,38 Lehner. Franz. 231 Leiserson, Michael, 94 Leopold ill, KIng, 140 Levine, Daniel H .• 190 Levine, Stephen, 22 Lewis, Sir Arthur, 31, 33. 253. 308 Limited vote, 145, 149, 210 Uncoln, Abraham, 1, 49 Under, Wolf, 39 Upset, Seymour Martin, 82, 83
347
Ust proportional representation, 145,147-48,149.152,210
Lo~ell,A.La~nce,64,65,259
Luxembourg, 50, 56, 59, 189. 192. 263, 284n4; 291; executive in, 7. 107n6, 109-14 passim, 125, 133, 138-40; .electoral systems of, 44, 145, 154, 162, 169, 285n5;party system of, 67, 76, 81, 82, 88; parliament of, 119, 202. 212. 214; interest groups in. 177, 182-83; constitution of, 220. 226. 229-30; central bank of, 237, 241; type of democracy in, 248, 255, 256-57
Maastricht 1reaty, 41, 234, 262 MacArthur, Douglas, 251n4 McKinney, Cynthia, 198 McNamara, Robert S., 107 Macro-economic policy, 7-8, 258-
70,274,301 Main~aring, Scott, 124n3, 134 Mail', Peter, 17. 256 Majoritarian democracy, 2-30;
dimensions of. 3-5, 243-57; effects of, 130-31, 258-302
Malapportionment, 155-56 Malta, 50, 53n3, 56-57, 189, 263,
276,298; party system of, 75-77, 81-88 passim, 292; executive in, 111-12. 133. 138, 140; parliament of, 119, 202, 212, 214;PRIn, 145-48 passim, 154. 157, 161-62, 168-69; interest groups in, 177, 179,182-83: constitution of, 220, 226-27,229; central bank of, 236, 241; type of democracy in. 248, 254n6,303-4
Mandela, Nelson, 126 Manglapus, Rani S., 308 Mansbridge, Jane, 6, 293 Manufactured majorities, 15, 23, 29,
166-68 ~ori,22,25.26,27.49.152
Marbruyv. Madison, 223 Marshall, John, 223 Masciandaro, Donato, 233, 238
l
348
Mathur, Hansraj, 178.,....79 Mauritius, 50, 53, 56, 59, lS9, 269;
party system of, 71, 77, 81, 88: executive in, 110-13, 132, 135, 138,140,291nl0;parliamentof, 119,202,212,214; electoral system of, 145, 151-52, 154-55, 162-63,169; interest groups in, 177-80,182-83; constitution of, 220-21, 224n2, 226-29 passim; central bank of, 236, 238, 241; type of democracy in, 248, 251. 304
Maxfield, Sylvia, 234 May, Clifford D., Inl
Mill, John Stuart, 279, 289-92 Minimal wiImi.ng cabinets, 74n7,
90-96,136-39. See also Cabinets !vfinority cabinets, 90-91, 96-104,
136-37. See also Cabinets Mitterrand. Frangois, 101, 121,
190 Mixed member proportional sys
tem, 26, 145, 147-49, 152, 158, 210
Molutsi, PatrickP., 179 Monarchs. See Heads of state Monetary policy, See Central banks;
Inflation Money, Jeannette, 43, 202, 211 Moreno, Luis. 191 Mowery, David C., 260 Multiparty systems, See Party sys
tems MUDXoe, Trevo~28
Netherlands, 50, 52, 56, 58, 59, 284, 2S9, 295; executive in, 7, 101, 110-14 passim, 125,126-27, 132, 138-40; party system of, 66n4, 67, 76, SO-88 passim; parliament of, 119, 201n1, 206-7, 210-14 passimi PRin, 145-48 passim, 152-56 passim, 161-62, 165, 169, 285n5; interest groups in, 177, 182-83; semifederalism in, 189, 191,193-94; constitution of, 220,
INDEX
224.226-30 passim; central bank of, 236, 241; type of democracy-in, 248,255-56
New Zealand. 49-50, 56, 59, 119, 289,292, 294-9S, 297; as example ofmajoritariandemocracy, 7, 10, 21-27,247-48,255; executive in, 21-22,27,110-12,138-40: executive dominance in, 21-22, 35, 127,133,135: party system of, 22, 27,32,65,67,75, 77,81,8S:electoral systems of, 22-23, 25-27, 145-53 passim, 162-63, 167, 169, 290: interest groups in, 23, 177, 182-83; unitary government in, 23-24,189, 192;UIricamenausm in ,24, 200,202,204n2, 212,214; constitution of, 24. 217-18, 220, 226,229; central bank of, 24-25, 237-38,241
Neyapti, Bilin, 233, 235-39 Nixon, Richard M., 107, 129, 234 Northern Ireland, 14, 15, 17-18, 33,
44,58,86,271 Norwa~SO,S6,262,269,286,291-
92,299; party system of, 67, 76-77, 80-89 passim; executive in. 101,111-14 passim. 125, 132, 137-40,281; parliament of, 119, 124n3, 125, 126,201-3,212-15 passim; PRin, 145, 152-56 passim, 162. 169; interest groups in. 177,180-83 passim; decentralization in, 189-94 passim; constitution of, 220, 226-27, 229; central bank of, 237, 241; type of de mocracy in, 248, 250, 254-56
O'Donnell, Guillermo, 12nl One-party cabinets. See Cabinets Oversized cabinets, 90, 99-103,
136-39. See also Cabinets
Palmer, Monte, 295 Papua New Guinea, 50-51, 53, 56,
59-61,280, 284,291,298;party system of, 74-76, 80, 85, 88;
1 I
~
INDEX
executive in, 101, 110-12, 132, 135,138--40,281; parliament of, 118-19,202.212-15 passim: electoral system of, 145, 151, 158n9, 162, 168-69: interest groups in, 177, 179, 181-83; semifederalism in, 189, 191; constitution of, 220-21, 226-29 passim; central bank of, 236, 238, 241; type of democracy in, 248, 251
Parliamentary government, 11-12, 35-36, 52n1, 198-99; defined, 104-6,117-24; other traits of, 124-27,303-5
Parliaments, 18-19, 24, 30, 39-40, 45,175,200-213;anddimensions of democracy, 3, 215, 243-46; and federalism, 4-5, 187-88, 213-15; sizes of, 153-55, 163. See also Executive-legislative relations
Party systems, 12-14,22,28-29, 32, 36-37,43,62-77; and dimensions of democracy, 3, 62-63, 243-46: andissue dimensions, 14, 87-89; and cabinets, 64, 112-13;and electoral systems, 64, 164-70; and allied or factional parties, 69-74, 75n9, 159n9, 167n12;andinterest groups, 181-84
Payne, Anthony, 30 Peeler, John A., 72, 179 Pempel, T. J., 108 Perez, Carlos Andres, 108n7 Pluralism. See Interest groups Plurality rule. See Electoral systems Plural societies, 56-59, 83-84, 168,
262,271; and type of democracy, 32-33,46-47,61,251-53,302
Political culture, 306-09 Political parties. See party systems Population size, 52, 55, 60-61, 154-
55.215,252; and government performance, 262-73 passim, 291-92,299
Portugal, 50, 56-57, 248, 265, 269, 299; party system of, 71, 76-77,
349
80-88 passim; executive in, 110-14 passim, 132, 138, 141; parliament of, 119, 121, 202, 212, 214; electoral systems of, 145-46, 162, 169; interest groups in, 176-77, 181-83; unitary government in, 189-94 passim; constitution of, 220,225-29 passim: central bank of, 237, 239, 241
Postmaterialism, 80-81, 86-87 Powell, G. Bingham, Jr., 6, 122n2,
232n1,260-61,285,287-88,306 Power-sharing. See Cabinets Presidential cabinets, 104-8. 113,
118. See also Cabinets Presidential government, 12nl, 51-
52, 110-11,113, 198; defined, 104-6,117-24;:; other traits of, 124-29,141-42,155,159-61, 281,292,303
Presidents. See Heads of state; Presidential government
Prime ministers, 113-15. See also Parliamentary government
Proportional representation. See Electoral systems
Rae. Douglas W., 15, 68n5, 165-67 Ranney, Austin, 231 Referendums, 24, 26, 40, 217-22
passim, 230-31 Regime support dimension. 80-81,
85 Reich. Robert B., 232 Religious issue dimension, 14, 27,
36-37,80-83 Riker. William H., 6, 92, 99, 186-87,
191 Rogowski, Ronald, 260 Rokkan, Stein, 83 Rose, Richard, 9, 25, 140, 260-62 Roubini, Nouriel, 260 Royed, Terry J., 260
Sachs, Jeffrey D., 260 Sartori, Giovanni, 65-66,78,113-
15,124
I. '"
3S!)
Satisfaction with democracy, 279, 286-87
Schain, MartinA., 129 Schmidt, Manfred G., 70, 295 Schmi_, Philippe C .. 171-72, 175 Schofield, Norman, 96, 97-98 Scotland, 14, 16, 18 Seliktar, OliTa, 86 Senelle, Robert, 41 Sentencing Project, 297 Shapiro. Martin, 46 Shepsle, Kenneth A., 96 Shugart, Matthew S., 124n3, 134,
150 Siaroff,Alan, 174.176-77, 269n3 Siegfcied,llndre, 130 Single· nontransferable vote, 145,
149,150,161-63,210,303 Single transferable vote, 145, 148.
151n4, 157, 158, 161-62, 198, 209,303-4
Size principle, 92-93, 99-100 Slovenia, 54, 306 Socioeconomnic issue dimension,
14,22,28-29,37,79-82,83 Solomon Islands, 54 Somolekae, Gloria. 179 South Africa, 54-55. 126 Spain,42, 50-51, 53, 56, 58, 265,
268,269, Z91;partysystemof, 77, 80,82, 88; executive in, 98n4, 101, 109-14 passim, 133, 138-40.142; parliament of, 119, 204,210,212, 214;PRin.145-48passim,153, 156,162-63,168-70; interest groups in, 176-77, 182-83; semifederalism in. 189-94 passim; constitution of, 220, 225-29 passim.; centralbank of. 237, 241;type of democracy in, 248, 250. 303
Steiner, Jiirg, 6, 35 Stone, Alec, 46 Stcikes, 23,267,269 Str.mn, Kaare, 104 Sweden, 50, 56, 280, 282, 289, 294-
95; party system of, 67, 76, 80-88 passim; executive in. 101, 109-14
INDEX
passim, 133.137-39, 141; paxliament of, 119, 201-6 passim, 212-15 passim; PRin. 145, 152-56 passim, 162, 169; interest groups in, 173, 177, 181-83; decentralization in, 189-94 passim; constitution of, 220-22, 226-29 passim; central bank of, 237, 241; type of democracy in, 248, 250, 254-56
Switzerland, 50, 52, 56,58,269, 285,291.297; as example of consensus democracy, 7, 33-41, 248-49,255.307; executive in, 7, 34-35,97,109-15 passim, 132-36 passim, 138, 141, 231; separation of powers in, 35, 119-20, 127, 303; party system of, 36-37, 67, 75-77,80-88 passim; PRin, 37. 145,156,162-63,168-69: interest groups in, 37-38, 177, 180, 182-83; federalism in, 38, 45, 187-95 passim, 196, 198-99: bicameralism in, 39, 44, 200-10 passim, 212, 214; constitution of, 40-41,220,222,226-30 passim: central bank of, 41, 236. 239-41
Taagepera, Rein, 68, 88-89, 150. 280 TabelIini, Guido, 233, 238 Tarlton, Charles D., 195 Taylor, Michael, 68n5, 130n6 Thatcher, Margaret, 12, 17 Therborn. GCiran,49 Thorndike. Tony, 29 1tansparency Inteinational, 289 Thinidad and Tobago, 50-51, 53, 56,
59,269,297,298; party system of, 74-77,81-82,88,291; executive in, 111-12, 133, 138, 140; parliamentof, 119, 204, 206, 210-14 passim; electoral system of, 145, 154-55, 158n9, 162-69 passim; interest groups in, 177, 179-80, 182-83; unitary government in, 189-91: constitution of, 220-221, 224,226,229; central bank of,
~
INDEX
236,238.241; type of democracy in,248,250,254-55
Tsebelis, George. 5n2, 43, 202. 211 Thfie, Edward R., 79, 252, 291. 299 Thrnout, 159, 261n2. 278, 284-86 TWo-party systems. See Party systems
Unemployment, 234, 236, 240, 266, 268-69
Unicameralism. See Parliaments Unitary government. See Division of
power United Kingdom, 42, 50. 52, 56, 58-
59,259,262,271,288-98 passim; as example ofmajoritarian democracy, 7, 9-21, 247-48, 255; executivein, 10-11, 92, 100-01, 108n8, 110-14 passim, 131n7, 138-39; executive dominance in, 11-12, 35.118-19,125,127,133-34,136: party system of, 13-14, 32, 65, 67, 75-77,81-88 passim: electoral system of. 14-16,44, 145-69 passim.; interest groups in, 16-17, 177,180, 182-83; unitary governmentin, 17-18, 189-94 passim; bicameralism in, 18-19, 200-06 passim, 212, 214; constitution of. 19-20,217,220,226-29 passim; central bank of, 20-21, 237, 241
United States, 50, 52, 56, 283, 294-300 passim; type of democracy in, 9,247-50,252,254-55; presidentialism in, 12nl, 106. 118-20, 123-24,127-29,132-39passim. 281,305; central bank of, 41, 232, 236,239-41; bicameralism in, 45n3, 204-10 passim, 212-14 passim; party system of, 72-73, 75-77,81-89 passim; cabinets in, 107-8,110-13 passim; electoral systems of, 143-45, 151-62 passim, 164, 167, 169, 198, 285; interest groups in, 177. 182-83; federalismin, 187-95 passim,198; constitution of, 220, 222, 224, 226,229
351
Un~tten constitutions, 19, 24. 217-28. See also Constitutions
Urban-rural issue dimension, 80-81,83,84-85
Uruguay, 54-55, 120
van de Walle. Nicolas, 129n5 Vanhanen, Tatu, 277-80,283-84 Velasquez, Ram6n. 108n7 Venezuela, 50-52, 53, 56, 277, 282;
party system of, 76, 81, 82, 88; presidentialismin, 106, 118-19, 127-28,132-36 passim, 138-39, 281, 303nlj cabinets in, 107n6, 108n7, 111-12: electoral systems of, 145-49 passim, 155, 160-63 passim, 168-69, 285n5;interest groups in. 177, 179-83 passim; federalism in, 187, 189-90, 198; bicameralism in, 205, 207-9, 212, 214; constitution of, 220, 226, 229; central bank of. 237, 241-42; type of democracy in, 248. 250, 254-56
Verba, Sidney, 307 Violence, control of, 51, 260, 267,
270-71,274,301 von Beyme, Klaus, 72 von Mettenheim, Kurt, 27 Voting participation. See Twnout
Wada, Junichiro, 72 Wales, 14, 16, 18, 58 Warwick, Paul V., 129-30, 131n7 Webb, Steven B., 233, 235-39 Webster, Daniel, Inl Welfare policy, 275, 294-96, 299-
300 Westminster model, 9-30, 89, 133.
See also Majoritarian democracy Whoare, K C., 4, 190 Wlarda, HowardJ., 174 Wilensky, Harold L., 281-82 Wilson, Graham, 16 Wilson, Woodrow, 9-10, 129 Women's representation. 52, 278,
280-82