qualitative and quantitative metabolomic investigation of...
TRANSCRIPT
©20
13 N
atu
re A
mer
ica,
Inc.
All
rig
hts
res
erve
d.
protocol
nature protocols | VOL.8 NO.4 | 2013 | 783
IntroDuctIonThe metabolome, which encompasses the suite of metabolites in a biological system, is an indicator of the physiological and path-ological condition of a cell. Concentrations and localizations of intracellular metabolites are in a dynamic balance that can change rapidly (e.g., in minutes to seconds). Intracellular metabolites are structurally diverse and are found over a broad range of concen-trations (e.g., from picomolar to millimolar scales). The intricate complexity of the metabolome is partly reflected by the number of documented metabolites. For example, the human metabolome database1, which currently contains more than 8,000 entries, is con-tinually expanding. It is therefore understandable that characteriza-tion of this chemical milieu within the small volume of a single cell places challenges on analytical measurement systems and benefits from developing measurement protocols tailored for metabolites. Despite major progress in the field, further developments are needed in the technology and methodology for single-cell analysis (SCA) to facilitate interrogation of the metabolome with sufficient detection sensitivity and metabolite coverage.
MS is at the forefront of the bioanalytical technologies that facilitate investigations of various levels of cellular and molecular organization, including the metabolome. MS complements single-cell and subcellular interrogations via established and emerging techniques such as light microscopy2–4 (e.g., Bessel beam plane microscopy5 and light endoscopy via nanowires6). MS detection provides rich chemical information and usually does not require analyte labeling. The approach can be quantitative, and allows the user to observe diverse types of unknown and/or unpredicted compounds. Advances in small-volume sampling and MS mea-surement schemes have improved this powerful technique for the study of individual cells, making detection of hundreds of metabolites possible.
The number of direct MS-based techniques capable of perform-ing single-cell measurements is rapidly increasing. The current state
of the field has been the focus of several recent reviews7–13. We previously described a number of approaches for characterizing peptides from a range of cells, from larger molluscan to smaller insect and mammalian neurons, using matrix-assisted laser desorp-tion ionization (MALDI) MS14–16, including a detailed protocol adapted to pituitary cells17. Several other developments in MS technology were recently introduced and applied to SCA, and have included investigation of individual metastatic breast cancer cells by nanostructure initiator MS18,19, unicellular algae and bacteria by high-density microarray MS20, and yeast cells using nanostructure post arrays21. The distributions of vitamin E22, lipids and lipid frag-ments at the soma-neurite junctions of neurons23, as well as lipid domain formation in mating unicellular organisms with ~100-nm resolution, were determined using secondary ionization MS imag-ing24. More recently, analyses of plant, animal and human cells were extended to ambient conditions compatible with specimen viability in live video MS25, laser ablation ESI26,27 and femtosecond laser desorption ionization28. The chemical complexity inherent to single cells can potentially interfere with gas-phase ion genera-tion, which in turn can hamper metabolite identification and/or quantification. To expand the coverage of the metabolome and improve quantification, additional steps, such as the separation of metabolites in small sample volumes, are needed.
The current protocol facilitates SCA by efficiently separating chemical species using CE before ESI-MS detection. CE is amenable to multiple sampling approaches, offers relatively high peak capacity in separation and operates with small sample volumes (e.g., a few nanoliters); thus, it has been adapted for individual cell mea-surements10,29–32. CE combined with the high information content of MS enables measurements of a range of metabolites in a single experiment. This technology also unites high detection sensitivity with a wide linear dynamic concentration range for quantification (at least four orders of magnitude31).
Qualitative and quantitative metabolomic investigation of single neurons by capillary electrophoresis electrospray ionization mass spectrometryPeter Nemes1,2, Stanislav S Rubakhin1, Jordan T Aerts1 & Jonathan V Sweedler1
1Department of Chemistry and the Beckman Institute, University of Illinois at Urbana-Champaign, Urbana, Illinois, USA. 2Present address: US Food and Drug Administration, Silver Spring, Maryland, USA. Correspondence should be addressed to J.V.S. ([email protected]).
Published online 28 March 2013; doi:10.1038/nprot.2013.035
single-cell mass spectrometry (Ms) empowers metabolomic investigations by decreasing analytical dimensions to the size of individual cells and subcellular structures. We describe a protocol for investigating and quantifying metabolites in individual isolated neurons using single-cell capillary electrophoresis (ce) coupled to electrospray ionization (esI) time-of-flight (toF) Ms. the protocol requires ~2 h for sample preparation, neuron isolation and metabolite extraction, and 1 h for metabolic measurement. We used the approach to detect more than 300 distinct compounds in the mass range of typical metabolites in various individual neurons (25–500 mm in diameter) isolated from the sea slug (Aplysia californica) central and rat (Rattus norvegicus) peripheral nervous systems. We found that a subset of identified compounds was sufficient to reveal metabolic differences among freshly isolated neurons of different types and changes in the metabolite profiles of cultured neurons. the protocol can be applied to the characterization of the metabolome in a variety of smaller cells and/or subcellular domains.
©20
13 N
atu
re A
mer
ica,
Inc.
All
rig
hts
res
erve
d.
protocol
784 | VOL.8 NO.4 | 2013 | nature protocols
Experimental workflow of single-cell CE-ESI-MSHere we provide a CE-ESI-MS protocol that can be used to success-fully profile and quantify the metabolic content of single cells iso-lated from model organisms in neuroscience and systems biology. Our SCA protocol was used to measure multiple metabolites, including classical neurotransmitters in individual neurons coll-ected from the sea slug (A. californica) CNS and rat (R. norvegicus) peripheral nervous system. We selected a set of biologically impor-tant cationic metabolites (e.g., carnitines and betaines) and charac-terized and differentiated neurons on the basis of their underlying chemistries. The analytical workflow begins with sample prepara-tion and is followed by CE separation with mass spectrometric detection and subsequent data analysis and quantification.
The main goal of sample preparation is to identify, isolate and stabilize a particular neuron of interest, and then extract its metabo-lites. A number of different approaches can be used for cell selection and isolation in combination with this protocol, including physical collection via manual manipulations, sorting of cells with select attributes by flow cytometry and sampling tissue-bound or fixed
individual cells and their organelles using laser capture microdis-section10,29. During the initial stage of an experiment, the selected cells are isolated, optionally cultured and rinsed. They are then placed in a small volume of organic solution such as acidified aque-ous methanol to facilitate extracting metabolites, quenching enzy-matic activity and reducing metabolic degradation during storage. Each step may influence the detectable portion of the intracellu-lar metabolome, and in turn determine the ability to deduce the in vivo chemistry of the neuron. Our goal is to attain high analytical reproducibility in sample preparation, as well as to use an adequate number of biological replicates (e.g., the same neuron type isolated from different members of the same species) and technical parallels (same extract measured multiple times) in order to ensure experi-mental success. The results presented here are shown for multiple biological replicates (at least five) measured in technical duplicates and are in agreement with genetic, metabolic and physiological data obtained in independent investigations. However, the exact number of biological and technical replicates required is strictly dependent on the sample type and the purpose of the study.
Box 1 | Considerations for ensuring robust system operation Successful experiments are facilitated by careful attention to the methodological details, precise calibrations and frequent maintenance of the CE-ESI-MS system. Sample injection reproducibility is improved by handling the capillary with caution and consistency. Bending of the inlet end should be avoided, as the bare fused silica is fragile and can readily chip off or break. During sample loading and positioning of the capillary inlet into the background electrolyte, the polyimide coating of the capillary should not contact the solutions, as droplets may be trapped at the silica-coating interface and transferred between vials, potentially causing cross- contamination or sample dilution. CE separation reproducibility and reliability is enhanced by frequent cleaning, as well as by occasional conditioning of the capillary using a NaOH solution. If migration time reproducibility falls below ~15% RSD, the separation capillary is conditioned by flushing it with 100 mM NaOH for ~5–10 min, followed by thorough rinsing with Sigma water and with the background electrolyte for 10 min. The CE-ESI interface should also be thoroughly rinsed with the ES solvent, and its metal emitter should be frequently rinsed to remove salts and compound deposits. When the platform is not in use, a gentle flow of Sigma water through the capillary connections helps avoid capillary and emitter clogging and prolong system lifetime. Additional temperature control of the separation capillary further enhances separation reproducibility.
Stable ESI is a prerequisite for reproducible analyte quantification. In a typical operation, the performance of the ESI is characterized continuously through multiple channels of observation. The temporal pattern of the total ion current and spray current (capillary current) are monitored using the mass spectrometer; the electrohydrodynamic behavior of the ES liquid meniscus is visually observed under a microscope. The operation mode of the ES is driven in the dripping-burst-pulsating-astable–cone-jet spraying regime, primarily by decreasing the distance of the ES emitter to the sampling plate while keeping the spray voltage constant. Cessation of hydrodynamic pulsation at the ES emitter tip and a sudden increase in ion signal intensity indicates onset of the cone-jet mode, usually at a distance below ~3 mm from the sampling plate held at − 1,700 V when the ES sheath solution is supplied at 750 nl min − 1 through the ES emitter55. Note that changing the spray potential and sheath flow rate and composition can further affect the spraying mode parameters. As CE-ESI-MS measurements span over a long time period, it is important to actively monitor and, if needed, regulate ES stability; among the governing factors that should be closely managed are the potential and geometry of the ES, the composition and flow rate of the solvent supply, as well as the integrity of connections.
The CE-ESI interface presented here can be operated in two distinct modes, each of which helps assess system performance at different stages of the experiments. Initially, the ion source is maintained as an ESI-MS-only device—i.e., the CE voltage is held at ground potential—and the integrity of the solution supply and stability of the Taylor cone are tested. Unstable spray current (e.g., high ion signal fluctuation and/or lack of signal) may indicate erroneous connections and/or improper anchoring of the liquid meniscus at the ES emitter tip (supplementary Methods), and/or variations in spraying modes. In the subsequent step, the ion source is operated as a CE-ESI device by applying the CE voltage across the separation capillary. Experimental conditions are routinely refined to mitigate excessive electrolysis and/or solvent heating in the CE region and/or electrical breakdowns (supplementary Methods) in the ESI-MS region of the setup. Representative examples of spray and total ion current measurements are demonstrated for erroneous and ideal conditions in the supplementary Methods.
The overall performance of the CE-ESI-MS system is validated daily. A reproducibility in migration time with no more than ~15% RSD, a signal-to-noise ratio of at least 3 for the reference signals (test solution) and an error in absolute ion signal intensity within 20% RSD are preferred for 6 nl of the test solution analyzed. Careful optimization of variables, regular system maintenance and data analysis can ensure errors of < 1% RSD in migration time and 5% RSD in quantification33. The CE-ESI-MS system, when optimized as described in this protocol, provides reproducible and stable CE separation and efficient ion generation over an extended period of time.
©20
13 N
atu
re A
mer
ica,
Inc.
All
rig
hts
res
erve
d.
protocol
nature protocols | VOL.8 NO.4 | 2013 | 785
For this protocol, only a portion of the obtained single-cell extract is measured; the sampled volume corresponds to 0.1% of the vol-ume of the extract, and it is adjustable so that a greater fraction of the cell content is measured for smaller cells. Alternatively, the metabolite coverage can be improved by drying and then reconsti-tuting the cell extract in a smaller volume, thus increasing the con-centration of metabolites that are present at low abundance in the cell. To enable the detection of many metabolites, often present in broad concentration ranges, this protocol imposes stringent criteria on the performance and operation of the CE-ESI-MS platform. Stable CE-ESI operation and the use of the internal standards and data analysis schemes discussed here (Box 1) improve the detection limit to about 100 attomoles for standards of neurotransmitters (e.g., acetylcholine and dopamine), the electrophoretic migra-tion reproducibility to 1% relative standard deviation (RSD) and the mass accuracy to below 5 p.p.m. (refs. 31,33,34). By collecting higher-quality data, these measurements enable the identification and quantification of more metabolites.
This protocol was validated using A. californica and rat individual neuronal cell bodies with diameters of ~25–500 µm. The metabolites detected were classical neurotransmitters (e.g., acetylcholine and histamine), energy carriers (e.g., adenosine) and osmolytes (e.g., betaines), among others33. The metabolic content allowed us to distinguish distinct neuron types on the basis of chemistry33 and to determine metabolic changes in single neurons placed in over-night culture34. Contemporary developments in cell isolation offer technological and methodological capabilities for the measure-ment of ever-smaller cells and organelles with increasing sample throughput. A number of sample preparation approaches can feasi-bly be combined with our CE-ESI-MS platform. Examples include laser-capture microdissection (to harvest minuscule amounts of samples for extraction35,36), flow and chemical cytometries (to sort and analyze cells with exceptional throughput37–39) and single-cell microfluidic platforms (to automate sample preparation, cell lysis and direct analysis40). It is anticipated that the presented protocol can be readily extended to SCA of smaller cells, subcellular structures and cells of various species (Box 2).
Advantages and limitations of single-cell CE-ESI-MSSingle-cell CE-ESI-MS provides a means to profile, identify and quantify a representative part of the metabolome. Thus, selected cells that have real or suspected cell heterogeneity make key targets. Compared with many more traditional single-cell assays, advantages
of the approach include an ability to detect both known and unknown compounds. CE separation is compatible with the vol-ume regime of single cells; it yields high separation power and an ability to work with metabolites of broad types. Furthermore, CE separation can tolerate biological samples with high salt concen-trations, such as the individual neurons of A. californica and rat measured here.
This section discusses several challenges. The first involves creat-ing a robust approach for selecting the cell of interest. Cell selec-tion is defined by the specific question being addressed and will vary from model to model. As cell sampling is application and cell type dependent, it is discussed further only for the specific cases covered here that use manual cell isolation. Note that the sample preparation and measurement process, analytical system setup and routine operation all require judicious attention. Key parameters for optimization are discussed in Box 1 and include isolation of single cells and extraction of metabolites during sample prepara-tion (Steps 1–11), collecting information-rich metabolic data with low limits of detection and high analytical reproducibility using the CE-ESI-MS platform (Steps 12–29), and streamlining data analysis (Steps 30–35).
Another challenge relates to the applied aspects of ESI MS. A technical challenge is that ESI sources are intolerant of inorganic salts and complex buffers, and have low stability of Taylor-cone formation in the negative ion mode. Although this protocol is opti-mized for detecting metabolites in the positive ion mode, revising the ES source parameters can help extend detection to the nega-tive mode, thus potentially enhancing coverage of the single-cell metabolome (Reagent Setup). A practical matter, as is the case with the majority of ‘omic approaches that yield high data content, is that some users may find manual data analysis to be particularly labor intensive. As a final point worth noting, the throughput of many single-cell measurements, including the CE-MS approaches highlighted here, is low enough that large numbers of cells are not normally probed, and therefore the cell selection step becomes especially critical.
Adapting our protocol to alternative platforms may help mitigate some challenges. Interfering compounds (e.g., salts and buffers) may be diverted from the analytical path of ion generation via microreactors in microfluidic devices or capillary-based electro-phoretic systems40,41. Alternatively, separated compounds may be ionized using ion sources with higher sample matrix tolerance or different operating principles; e.g., CE coupled to desorption ESI
Box 2 | System adaptability The success of analyte identification and quantification is enhanced by monitoring the quality of the analyte signal that is registered by the mass spectrometer. The present protocol profiles analytes over a wide concentration range (e.g., nM to mM concentrations) by addressing low signal-to-noise ratios and detector saturation at the low- and high-concentration extremes, respectively. Measurement of the appropriate signal intensities aids in accurate mass determinations (m/z values) and in obtaining informative tandem mass spectra, and also helps expand the linear dynamic range of concentration for quantification. As only a fraction of the cell extract is analyzed in this protocol, the sample can be measured more than once. Replicate measurements allow for adjustment of the sample amounts that are loaded into the separation capillary by refining the duration of injection and/or vertical displacement between the inlet and outlet ends, thus producing different hydrodynamic injection forces. Analytes in aliquots of the sample may also be concentrated via air-drying or diluted in situ in the loading vial before measurement—the use of internal standards is especially recommended. In addition, various CE separation methodologies can be adapted to this protocol to enhance the separation efficiency of the platform (e.g., online sample stacking and micellar electrokinetic chromatography). Similar analytical considerations should be effective in measuring diverse types of small molecules and concentrations, while also providing an opportunity to expand detection to larger compound types such as peptides and proteins of single cells.
©20
13 N
atu
re A
mer
ica,
Inc.
All
rig
hts
res
erve
d.
protocol
786 | VOL.8 NO.4 | 2013 | nature protocols
is compatible with 10–50 mM detergents and inorganic salts42, and similar advantages can be anticipated for other ambient ion sources11,43,44. With regard to data analysis, several software pack-
ages (e.g., metaXCMS45, MZmine46 and MathDAMP47) can help align electrophoretic data and automate metabolite identification, statistical analysis and multivariate analysis.
MaterIalsREAGENTS
Animals (see Reagent Setup) ! cautIon Experiments involving animals must adhere to all relevant institutional and governmental regulations.HEPES (Sigma, cat. no. H3375)Acetic acid (Sigma, cat. no. A6283) ! cautIon Acetic acid is highly corrosive and combustible, and toxic if inhaled. It readily absorbs upon contact and may be harmful. When handling it, wear gloves, use safety goggles, use a pipetting aid and work in a ventilated chemical hood.Acetylcholine chloride (Sigma, cat. no. A6625) ! cautIon Acetylcholine chloride causes irritation if contacted, inhaled or swallowed. When handling it, wear gloves and work in a ventilated chemical hood.Calcium chloride dihydrate (CaCl2; Sigma, cat. no. C7902)Dopamine hydrochloride (Sigma, cat. no. H8502) ! cautIon Dopamine hydro-chloride causes irritation if contacted or inhaled, and is harmful if swallowed. When handling it, wear gloves and work in a ventilated chemical hood.Formic acid (Thermo Scientific, cat. no. TS-28905) ! cautIon Formic acid is highly corrosive, combustible and toxic. It readily absorbs upon contact or inhalation. When handling it, wear gloves, use safety goggles, use a pipetting aid and work in a ventilated chemical hood.Gentamicin sulfate (Sigma, cat. no. G1264) ! cautIon Gentamicin sulfate may cause an allergic reaction on the skin or in the respiratory system. When handling it, wear gloves and work in a ventilated chemical hood.Glycerol (Sigma, cat. no. G7893) ! cautIon Glycerol causes irritation to the eyes and skin. When handling it, wear gloves.Histamine dihydrochloride (Sigma, cat. no. H7250) ! cautIon Histamine dihydrochloride is toxic and causes irritation if contacted, inhaled or swal-lowed. When handling it, wear gloves and work in a ventilated chemical hood.Isopropanol (Sigma, cat. no. 34965) ! cautIon Isopropanol is highly flammable and is a mild skin irritant and a serious eye irritant. When handling it, wear gloves, use goggles and work in a ventilated chemical hood.Magnesium chloride hexahydrate (MgCl2; Sigma, cat. no. M2393)Magnesium sulfate heptahydrate (MgSO4; Sigma, cat. no. M2773)Methanol (Sigma, cat. no. 34860) ! cautIon Methanol is highly toxic and combustible. When handling it, wear gloves, safety goggles, use a pipetting aid and work in a ventilated chemical hood.Penicillin G sodium (Sigma, cat. no. P3032) ! cautIon Penicillin may cause an allergic reaction on the skin or in the respiratory system. When handling it, wear gloves and work in a ventilated chemical hood.Potassium chloride (KCl; Sigma, cat. no. P5405)Potassium phosphate monobasic (KH2PO4; Sigma, cat. no. P5655)Protease type IX (Sigma, cat. no. P6141) ! cautIon Protease type IX is a skin, eye, and lung irritant as well as a respiratory sensitizer. When handling it, wear gloves and goggles and work in a ventilated chemical hood.Serotonin hydrochloride (Sigma, cat. no. H9523) ! cautIon Serotonin hydrochloride is highly toxic and causes irritation on contact, on inhalation or if swallowed. When handling it, wear gloves and work in a ventilated chemical hood.Sodium bicarbonate (NaHCO3; Fisher, cat. no. S233)Sodium chloride (NaCl; Sigma, cat. no. S5886)Sodium formate (Sigma, cat. no. 71540)Sodium hydroxide (NaOH; Sigma, cat. no. 221465) ! cautIon NaOH causes severe skin burns and eye damage. When handling it, wear gloves and protective clothing and goggles.Sodium phosphate monobasic (NaH2PO4; Sigma, cat. no. S5011) ! cautIon Sodium phosphate monobasic causes eye irritation. Wear goggles while handling the compoundStreptomycin sulfate (Sigma, cat. no. S9137)Water for metabolite extraction and CE-ESI-MS analysis (Sigma, cat. no. 39253). Note that this type of water is of high purity and is referred to as Sigma water in this protocolWater (deionized) for neuron isolation and culturing (Millipore, Milli-Q water with resistivity of ≥ 18.2 MΩ cm). This type of water is referred to as Milli-Q water in this protocol
•
••
•
••
•
•
•
•
•
•••
•
•••
•
••••
•
••
•
EQUIPMENTAir dehumidifier (optional)Alligator clips for making electrical connectionsBinocular headband magnifier with ×2.75 magnification (e.g., Donegan Optical DA-7)Copper wire without insulation, 10 cm in length, thin and flexibleData acquisition and control card with software (National Instruments, model USB-6008 and LabVIEW 8.2 or later)Digital multimeter (Fluke, e.g., 79 series III)Electrical wires with insulationElectrospray mounting and positioning system (Thorlabs, cat. no. PT3/M or New Objective, cat. no. PicoView)Fine glass pipettes made from thin-walled, single-barrel, standard borosilicate glass tubing with 1,000-µm outer diameter (o.d.) and 750-µm inner diameter (i.d.) (World Precision Instruments, cat. no. TW100F-4) using a micropipette puller (e.g., Sutter Instrument, model P-80)Fused silica capillary with 105-µm o.d. and 40-µm i.d. and ~120 cm in length for separation (Polymicro Technologies, cat. no. TSP040105). Note that this capillary is referred to as a separation capillary in this protocol ! cautIon Fused silica capillaries are flexible and have sharp ends; use protective eyewear when handling.Fused silica capillary with 365-µm o.d. and 75-µm i.d. and ~120 cm length for delivery of ES solvent (Polymicro Technologies, cat. no. TSP075375). Note that this capillary is referred to as sheath capillary in this protocol ! cautIon Fused silica capillaries are flexible and have sharp ends; use protective eyewear when handling them.High-resolution, high-mass-accuracy mass spectrometer equipped with software packages (Bruker Daltonics, micrOTOF TOF-MS and/or maXis Qq-TOF-MS/MS series and Compass software)High-voltage power supply (HVPS) generating regulated 30-kV potential (Spellman High-Voltage Electronics, e.g., Bertan model 30R)Hygrometer and thermometer (optional; Fisher Scientific, cat. no. 14-649-84)Inverted microscope (Carl Zeiss, model Axiovert 25) equipped with ×2.5 and ×10 objectives, AxioCam MRc camera (Carl Zeiss) and digital image-processing software for widefield microscopy (Carl Zeiss, AxioVision; freeware edition of AxioVision LE is downloadable from http://www.zeiss.de/)PCR tubes (MidSci)Petri dish filled with solidified Sylgard 184 silicone elastomer (Dow Corning)Petri dishes (plastic) with 36-mm diameter for A. californica cell culturingPowder-free nitrile gloves, goggles and low-lint absorbent wipes (Kimwipes, Kimberly-Clark, cat. no. 34155)Resistor (10 kΩ)Scissors with pointed tips, 4 to 6 inches in lengthScribe for fused silica cleaving (New Objective, cat. no. SCRIBE)Sharp tungsten needles (World Precision Instruments) ! cautIon Needles have sharp ends; handle with care and use protective equipmentSmall animal guillotine (e.g., NEMI Scientific, model 701)Stainless steel needle (Small Parts, stainless steel tubing with 210-µm outer diameter (o.d.) and 165-µm i.d., or Hamilton Company, cat. nos. 21030A or 21031A blunt-tip needles)Soldering station with solderStandards solution containing ESI tuning mix (Agilent, cat. no. G1969-85000 or Bruker, cat. no. 18220)Stereomicroscope with 7.9:1 adjustable zoom (Leica Microsystems, cat. no. MZ 7.5) equipped with a digital cameraStereo-zoom microscope on boom stand capable of ×1–6.3 adjustable magnification with long working range (Olympus, cat. no. SZ6045) for visual monitoring of ES stabilityStopwatch (Sigma, cat. no. Z253294)
••••
••
•••
•
•
•
•
•
•
•
••
•
•
••••
••
••
•
•
•
©20
13 N
atu
re A
mer
ica,
Inc.
All
rig
hts
res
erve
d.
protocol
nature protocols | VOL.8 NO.4 | 2013 | 787
Surgical instruments, including fine forceps and microscissors (e.g., Fine Science Tools, Dumont no. 5 fine forceps, cat. no. 11253-20 and Cohan- Vannas spring scissors with 4-mm cutting edge, cat. no. 15018-10)Syringe pump (Harvard Apparatus, model 70-2000 or 55-2222) with 500-µl and 5-ml gas-tight syringes (Hamilton, part nos. 81220 and 81520, respec-tively) equipped with 22-gauge needles (Hamilton Company, cat. no. 90134)Tubes, protein LoBind, Safe-Lock, 0.5 ml, PCR clean (Eppendorf)Tubes, plastic, ~2.5 ml (e.g., Eppendorf, cat. no. 05-402-7 and Wheaton, cat. no. 225415)Tubing sleeves with 635-µm o.d., and i.d. of 125 µm, 330 µm and 395 µm (IDEX Health & Science, cat. nos. F-180, F-184 and F-185, respectively)T-union (IDEX Health & Science, cat. no. P-875)
REAGENT SETUPAnimals Adult A. californica (175–250 g; National Resource for Aplysia, Rosenstiel School of Marine & Atmospheric Science) are maintained in con-tinuously circulated and aerated artificial seawater (ASW) cooled to 14 °C. Male Sprague-Dawley outbred rats (R. norvegicus), 2.5–3 months old (Harlan Laboratories), are housed on a 12-h light cycle and fed ad libitum. In our hands, animal euthanasia is performed in accordance with the appropriate institu-tional animal care guidelines (the Illinois Institutional Animal Care and Use Committee), and in full compliance with federal guidelines for the humane care and treatment of animals. ! cautIon Experiments involving animals must follow all relevant institutional and governmental regulations. Rats are killed by decapitation using a sharp guillotine. A volume of 120 ml of ice-cold modi-fied Gey’s balanced salt solution (mGBSS; see below) is injected immediately into the subepidermal areas close to the dorsal root ganglia (DRG) of interest. Injected rat trunks are placed on ice, where all surgical manipulations are made. DRG are surgically isolated during the ~10-min dissection procedure and placed into ~2 ml of cell stabilization mixture containing 33% (vol/vol) glycerol and 67% (vol/vol) mGBSS prepared with Milli-Q water. Studies involving ani-mals should be planned in accordance with the ARRIVE guidelines48.Artificial seawater ASW is 460 mM NaCl, 10 mM KCl, 10 mM CaCl2, 22 mM MgCl2, 26 mM MgSO4 and 10 mM HEPES in Milli-Q water, with the pH adjusted to 7.8 using 1 M NaOH in Milli-Q water. The solution can be stored at 14 °C for up to 1 month.Culturing solution Culturing solution is ASW freshly supplemented with 100 units ml − 1 penicillin G, 100 µg ml − 1 streptomycin and 100 µg ml − 1 gentamicin in Milli-Q water, with the pH adjusted to 7.8 using 1 M NaOH in Milli-Q water. The temperature of the solution is maintained at 20–25 °C during culturing. (Optional) Nutrients and growth factors may be added, depending on the cell type and study goals. ! cautIon Culturing medium may influence the cellular metabolome34, and it may need optimization in specific studies.Electrolyte Electrolyte is 1% (vol/vol) formic acid in Sigma water. Although this solution works well for the CE separation of many metabolites, its composition may be adjusted depending on the purpose of the experiment. The solution can be stored in a tightly sealed container at room temperature (~20 °C) for 1 month.Enzyme solution for Aplysia neuron isolation Enzyme solution is freshly pre-pared 1% (wt/vol) protease type IX in ASW supplemented with 100 units ml − 1 penicillin G, 100 µg ml − 1 streptomycin and 100 µg ml − 1 gentamicin.Mass calibration solution for the mass spectrometer Mass calibration solu-tion is 15 mM sodium formate in Sigma water. The solution can be stored at room temperature for up to 1 year. (Optional) The majority of the available mass calibration solutions for MS can be used in the protocol (e.g., PEG and polypropylene glycol polymers).Metabolite extraction solution Metabolite extraction solution is 0.5% (vol/vol) acetic acid in 50% (vol/vol) methanol prepared with Sigma water. The solution can be stored in a tightly sealed container at room temperature for 1 month. (Optional) Standards may be added to the solution, including migration time markers for CE data alignment (e.g., HEPES, glutathione and peptides) and internal calibrants for mass spectrometer calibration, signal normalization and/or quantification (e.g., deuterated metabolite standards). The solution composition may be adjusted to improve extraction efficiency for certain classes of compounds; for example, increasing methanol concentration should help better extract nonpolar compounds, and adjusting the pH to basic conditions may better extract acidic metabolites for negative ion mode detection.Modified Gey’s balanced salt solution mGBSS contains 1.5 mM CaCl2, 4.9 mM KCl, 0.2 mM KH2PO4, 11 mM MgCl2, 0.3 mM MgSO4, 138 mM NaCl,
•
•
••
•
•
27.7 mM NaHCO3, 0.8 mM NaH2PO4 and 25 mM HEPES dissolved in Milli-Q water, with the pH adjusted to 7.2 using NaOH in Milli-Q water. The solution can be stored at 4 °C for 3 months without detectably affecting the outcome of metabolomic measurements in this protocol.
Sheath flow solution Sheath flow solution is 0.1% (vol/vol) formic acid in 50% (vol/vol) methanol prepared with Sigma water. The solution can be stored in a tightly sealed container at room temperature for 1 month. (Optional) The composition of the sheath flow solution can be changed to optimize ion generation yield and stability. For example, replacing formic acid by volatile basic additives such as ammonium hydroxide facilitates the detection of metabolites in the negative ion mode. Refer to the MS literature for alternative approaches.
Stabilizing solution for Aplysia neurons Stabilizing solution for Aplysia neurons is a mixture (vol/vol) of 33% glycerol and 67% ASW prepared with Milli-Q water. The solution can be stored at 4 °C for 3 months.
Stabilizing solution for DRG neurons Stabilizing solution for DRG neurons is a mixture (vol/vol) of 33% glycerol and 67% mGBSS prepared using Milli-Q water. The solution can be stored at 4 °C for 3 months.
Test solution Test solution is 50 nM acetylcholine, 50 nM dopamine, 50 nM histamine and 50 nM serotonin in 0.5% (vol/vol) acetic acid prepared with 50% (vol/vol) methanol in Sigma water. The solution can be stored in a tightly sealed secondary container at − 20 °C for about 6 months without substantial changes in composition.EQUIPMENT SETUP ES emitter The ES emitter is a metal capillary (~35 mm length) with ends that have been laser-cut perpendicularly to the axis and fine-polished using 12-µm diamond lapping paper to yield a smooth surface. The capillary is thoroughly cleaned by sequential sonication in 50% (vol/vol) isopropanol in Sigma water, then in Sigma water, then in 50% (vol/vol) methanol in Sigma water, and then in pure methanol. It is then air-dried.
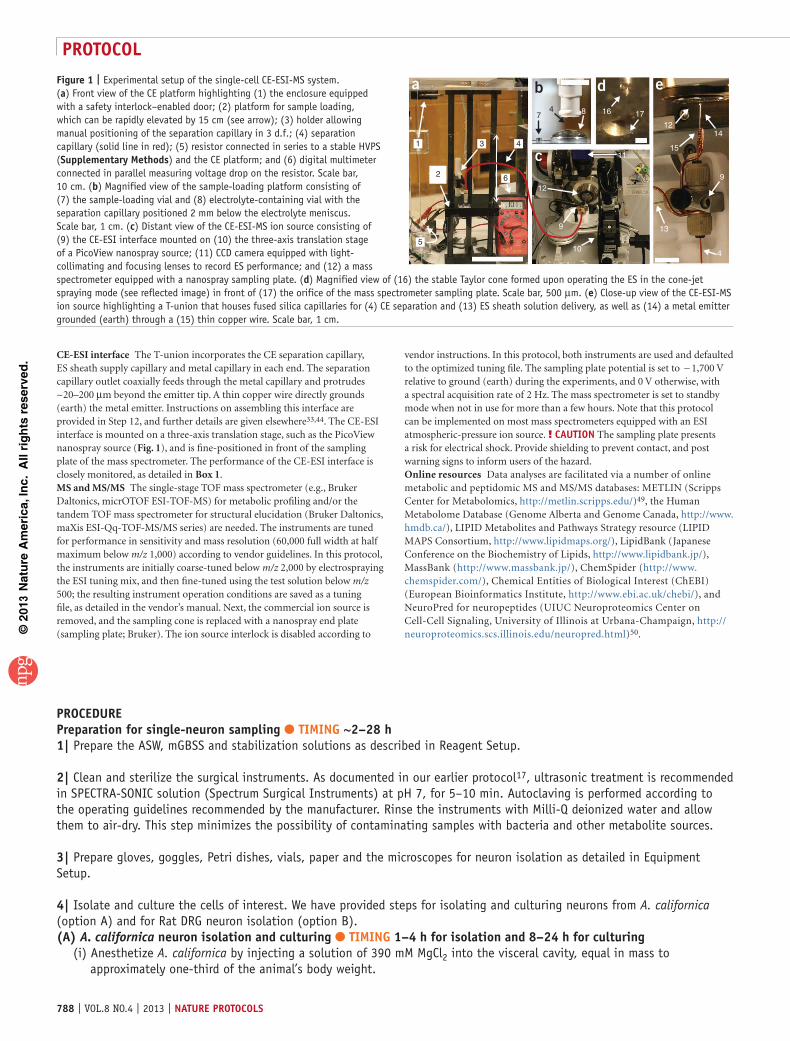
Single-neuron isolation Microscissors, sharp metal needles, Petri dishes containing Sylgard 184, a stereomicroscope and an inverted microscope are needed for cell isolation. A. californica neurons are cultured in plastic Petri dishes filled with the ASW-antibiotics solution. The same set of items is used for the isolation of the rat neurons. The setup used for the isolation of mammalian pituitary cells is discussed elsewhere17.System for sampling and CE separation The system includes a custom- designed stage capable of elevating a platform by 15 cm within 1 s. Components of the platform are shown in Figure 1. This platform houses a capillary holder capable of transitioning in 3 d.f. (element 3, Fig. 1) and two stainless steel vials, one for the sample (element 7, Fig. 1) and the other for the CE background electrolyte (element 8, Fig. 1). The sample-loading vial is milled out conically to hold about 500 nl of solution, and the electrolyte-containing vial is cylindrical, with an internal volume of 2 ml. The overall measurement throughput of this protocol is increased by milling (in advance) 3–5 replicate vials for the CE background electrolyte and 30–50 separate vials for sample loading. During system use, both vials are held in a metal block and are removable for frequent cleaning. The metal block is connected through a 10-kΩ resistor to an HVPS, and a battery-operated digital multimeter connected in parallel measures the voltage drop across the resistor to deduce electrophoretic current during separation. An electrically insulating enclosure (e.g., Plexiglas), equipped with a safety interlock–enabled door, houses all components and overrides the power feed to the CE HVPS for added safety. The CE power supply is controlled by a personal computer executing the attached custom-written LabVIEW-based virtual instrument (see Supplementary Data and Supplementary Methods for operation) that is capable of generating a temporally defined voltage and/or current program (Supplementary Methods). An insulating plastic tube with an ~2-cm i.d. encloses and guides the separation capillary from the capillary holder in the enclosure into the CE-ESI interface (element 9, Fig. 1). Additional details on the elements and operation of the system are available elsewhere31,33,44. Optionally, the CE HVPS may be operated manually. ! cautIon High voltage and high current pose electrical shock hazards. Ground conductive parts and shield electrical connections to prevent contact. Provide warning signs to inform users of the hazard. Ensure that no salt-containing solution spillage remains (even in dry form) inside the enclosure, as buildup of contaminants can result in electrical breakdown.
©20
13 N
atu
re A
mer
ica,
Inc.
All
rig
hts
res
erve
d.
protocol
788 | VOL.8 NO.4 | 2013 | nature protocols
CE-ESI interface The T-union incorporates the CE separation capillary, ES sheath supply capillary and metal capillary in each end. The separation capillary outlet coaxially feeds through the metal capillary and protrudes ~20–200 µm beyond the emitter tip. A thin copper wire directly grounds (earth) the metal emitter. Instructions on assembling this interface are provided in Step 12, and further details are given elsewhere33,44. The CE-ESI interface is mounted on a three-axis translation stage, such as the PicoView nanospray source (Fig. 1), and is fine-positioned in front of the sampling plate of the mass spectrometer. The performance of the CE-ESI interface is closely monitored, as detailed in Box 1.MS and MS/MS The single-stage TOF mass spectrometer (e.g., Bruker Daltonics, micrOTOF ESI-TOF-MS) for metabolic profiling and/or the tandem TOF mass spectrometer for structural elucidation (Bruker Daltonics, maXis ESI-Qq-TOF-MS/MS series) are needed. The instruments are tuned for performance in sensitivity and mass resolution (60,000 full width at half maximum below m/z 1,000) according to vendor guidelines. In this protocol, the instruments are initially coarse-tuned below m/z 2,000 by electrospraying the ESI tuning mix, and then fine-tuned using the test solution below m/z 500; the resulting instrument operation conditions are saved as a tuning file, as detailed in the vendor’s manual. Next, the commercial ion source is removed, and the sampling cone is replaced with a nanospray end plate (sampling plate; Bruker). The ion source interlock is disabled according to
vendor instructions. In this protocol, both instruments are used and defaulted to the optimized tuning file. The sampling plate potential is set to − 1,700 V relative to ground (earth) during the experiments, and 0 V otherwise, with a spectral acquisition rate of 2 Hz. The mass spectrometer is set to standby mode when not in use for more than a few hours. Note that this protocol can be implemented on most mass spectrometers equipped with an ESI atmospheric-pressure ion source. ! cautIon The sampling plate presents a risk for electrical shock. Provide shielding to prevent contact, and post warning signs to inform users of the hazard.Online resources Data analyses are facilitated via a number of online metabolic and peptidomic MS and MS/MS databases: METLIN (Scripps Center for Metabolomics, http://metlin.scripps.edu/)49, the Human Metabolome Database (Genome Alberta and Genome Canada, http://www.hmdb.ca/), LIPID Metabolites and Pathways Strategy resource (LIPID MAPS Consortium, http://www.lipidmaps.org/), LipidBank (Japanese Conference on the Biochemistry of Lipids, http://www.lipidbank.jp/), MassBank (http://www.massbank.jp/), ChemSpider (http://www.chemspider.com/), Chemical Entities of Biological Interest (ChEBI) (European Bioinformatics Institute, http://www.ebi.ac.uk/chebi/), and NeuroPred for neuropeptides (UIUC Neuroproteomics Center on Cell-Cell Signaling, University of Illinois at Urbana-Champaign, http://neuroproteomics.scs.illinois.edu/neuropred.html)50.
a b d
c
47 8
9
10
11
12
1716
e
4
1214
13
15
9
1
2
3 4
6
5
Figure 1 | Experimental setup of the single-cell CE-ESI-MS system. (a) Front view of the CE platform highlighting (1) the enclosure equipped with a safety interlock–enabled door; (2) platform for sample loading, which can be rapidly elevated by 15 cm (see arrow); (3) holder allowing manual positioning of the separation capillary in 3 d.f.; (4) separation capillary (solid line in red); (5) resistor connected in series to a stable HVPS (supplementary Methods) and the CE platform; and (6) digital multimeter connected in parallel measuring voltage drop on the resistor. Scale bar, 10 cm. (b) Magnified view of the sample-loading platform consisting of (7) the sample-loading vial and (8) electrolyte-containing vial with the separation capillary positioned 2 mm below the electrolyte meniscus. Scale bar, 1 cm. (c) Distant view of the CE-ESI-MS ion source consisting of (9) the CE-ESI interface mounted on (10) the three-axis translation stage of a PicoView nanospray source; (11) CCD camera equipped with light-collimating and focusing lenses to record ES performance; and (12) a mass spectrometer equipped with a nanospray sampling plate. (d) Magnified view of (16) the stable Taylor cone formed upon operating the ES in the cone-jet spraying mode (see reflected image) in front of (17) the orifice of the mass spectrometer sampling plate. Scale bar, 500 µm. (e) Close-up view of the CE-ESI-MS ion source highlighting a T-union that houses fused silica capillaries for (4) CE separation and (13) ES sheath solution delivery, as well as (14) a metal emitter grounded (earth) through a (15) thin copper wire. Scale bar, 1 cm.
proceDurepreparation for single-neuron sampling tIMInG ~2–28 h1| Prepare the ASW, mGBSS and stabilization solutions as described in Reagent Setup.
2| Clean and sterilize the surgical instruments. As documented in our earlier protocol17, ultrasonic treatment is recommended in SPECTRA-SONIC solution (Spectrum Surgical Instruments) at pH 7, for 5–10 min. Autoclaving is performed according to the operating guidelines recommended by the manufacturer. Rinse the instruments with Milli-Q deionized water and allow them to air-dry. This step minimizes the possibility of contaminating samples with bacteria and other metabolite sources.
3| Prepare gloves, goggles, Petri dishes, vials, paper and the microscopes for neuron isolation as detailed in Equipment Setup.
4| Isolate and culture the cells of interest. We have provided steps for isolating and culturing neurons from A. californica (option A) and for Rat DRG neuron isolation (option B).(a) A. californica neuron isolation and culturing tIMInG 1–4 h for isolation and 8–24 h for culturing (i) Anesthetize A. californica by injecting a solution of 390 mM MgCl2 into the visceral cavity, equal in mass to
approximately one-third of the animal’s body weight.
©20
13 N
atu
re A
mer
ica,
Inc.
All
rig
hts
res
erve
d.
protocol
nature protocols | VOL.8 NO.4 | 2013 | 789
(ii) Open A. californica’s visceral cavity with sharp surgical scissors, dissect the ganglia of interest and place them into 2.5-ml plastic tubes filled with the enzyme solution.
(iii) Incubate the A. californica ganglion in the enzyme solution at 34 °C for 20–120 min. This step helps loosen or remove the connective tissues surrounding the cells and the intercellular mechanical contacts. Depending on the age, size and physiological condition of the animal, as well as the season and properties of the ganglion and cell of interest, treatment time should be optimized. Overtreated cells have a low rate of survival in culture, whereas undertreated neurons can be difficult to isolate or separate from glia.
(iv) Rinse the ganglion several times with fresh ASW for a total of 30–60 min to remove the enzyme, and then incubate it for 10–15 min in the glycerol stabilization solution.
(v) Pin down the A. californica ganglion (Fig. 2) onto a Sylgard surface in a Petri dish. While working under the stereomi-croscope, isolate the individual neurons of interest in ASW or the stabilization solution for Aplysia using sharp needles, forceps or surgical scissors. crItIcal step The MS measurement reproducibility is improved when the isolation is performed in the stabilization solution34. Although there are several established protocols and technologies to aid single-cell isolation from tissues and cell suspensions51–53, only one is described here.
?trouBlesHootInG (vi) (Optional) To culture neurons, aspirate the neurons one by one into a plastic micropipette, and then transfer each
neuron into a separate Petri dish filled with culturing solution. Culture the neurons overnight at room temperature. To extend the time frame of culturing (e.g., up to 3 d), reduce the temperature to 14 °C. Optimize the culturing conditions, including solution composition, nutrients, oxygen supply, temperature and time of experiment according to cell characteristics or the purpose of the study. After culturing, gradually replace the culturing solution with the stabilizing solution by sequentially removing the former and adding the latter in equal volume. crItIcal step During this step, neurons should not contact the air in order to avoid cell lysis, and they should not be exposed to the stabilizing solution for more than 3–10 min in order to preserve cell stability. This step may be skipped if neuron culturing is not the goal of the study.
(B) rat DrG neuron isolation tIMInG 35 min (i) Euthanize rats by rapid decapitation. Cut the vertebral bones in the pedicle areas on both sides of the vertebrae,
lift the dorsal side of the chain of the cut vertebrae and remove the spinal cord with forceps to expose the DRG for isolation using fine forceps and scissors. Alternatively, multiple DRG can be rapidly exposed by severing the dorsal and ventral roots via rapid hydro-extrusion to the spinal cord with cold physiological saline as described elsewhere54.
(ii) Place the isolated DRG in the stabilization solution and incubate them for at least 10 min. (iii) Transfer the DRG onto a regular microscopy glass slide, and while monitoring the procedure under an inverted
microscope (×2.5 objective) use sharp metal needles to break the sheath of connective tissues surrounding the neurons.
(iv) Use the needles to pull small groups of DRG neurons out of the ganglia, and then isolate the neuron of interest using the same needles while visually following the isolation procedure under a stereomicroscope (with ×10–20 magnification).
preparation of cell extracts and controls tIMInG 30 s crItIcal Note that this protocol eliminates purposeful mechanical disruption to the cell, as the extraction solution was found to reproducibly extract metabolites with sufficient efficiency. This conclusion was made from the observation that extracts from cells that are visually intact and those that are damaged during transfer produce similar results. However, verification of this observation is needed for each new type of cell owing to differences in cellular physicochemical characteristics, as well as analyte and surrounding matrix properties. As a result, additional chemical and/or physical treatments may be implemented to influence analyte extraction and preservation.
5| Aspirate the isolated cell into a plastic micropipette with minimal ASW, and deposit it on the inner wall of a PCR vial. Use a pipette to gently reduce the volume of ASW surrounding the cell. Note that a small amount of extracellular solution is inherently transferred along with the neuron during this step and will be removed in Step 7. crItIcal step Handle the cell gently and rapidly to minimize cell damage and accidental excessive leakage or release of metabolites.
6| (Optional) Collect this extracellular solution into a separate PCR vial as a negative control for characterizing the chemical environment of the cell and potential analyte loss as a result of its leakage or release (label: cell environment).
©20
13 N
atu
re A
mer
ica,
Inc.
All
rig
hts
res
erve
d.
protocol
790 | VOL.8 NO.4 | 2013 | nature protocols
7| Rinse the neuron within 3 s by depositing ~1 µl of water on it and quickly withdrawing the solution into a pipette tip. crItIcal step This step is especially important when incubating cells in culture media whose composition is not precisely known (e.g., serum). The purpose of rinsing is to minimize the influence of extracellular compounds on measurement results, thereby facilitating data interpretation. Although isolated cells are usually rinsed in this protocol, this step may be skipped with justification; for example, a cell prepared in the stabilization solution may transfer an insignificant volume of extracellular media.
8| (Optional) Collect this rinse solution into a PCR vial for the measurement of compounds removed from the cell environment (label: rinse solution). crItIcal step Analyzing the rinse solution helps to establish the effect rinsing may have on the cell metabolome (e.g., rinse-stimulated endogenous compound release or leakage); systematic chemical biases in cell preparation may also be feasibly identified this way34.
9| Pipette 500 nl of the extraction solution onto a rat DRG neuron of ~25 µm in size, and pipette 5 µl of the extraction solution onto an ~50–500-µm A. californica neuron (label: cell extract). The volume of the extraction solution may be adjusted depending on the size and chemistry of the cell, as well as on the purpose of the study. Alternatively, deposit glycerol-stabilized cells using pulled glass pipettes into said volumes of extraction solution preloaded into protein LoBind or PCR tubes. Note that small glass pieces that may break into the extraction solution from the glass micropipette tip during cell transfer do not typically interfere with sample measurement. crItIcal step Ensure that the cell is immersed in solution during metabolite extraction.
10| (Optional) Add standards to the extract: migration time markers for CE data alignment and internal calibrants for mass spectrometer calibration, signal normalization and/or quantification. Alternatively, the same standards may be added to the metabolite extraction solution (Reagent Setup) before depositing it onto the cell.
11| Centrifuge the vials at 2,000g for 1 min at room temperature and analyze the cell extracts. crItIcal step Ensure that the cells are immersed in solution during storage. Other control samples, including the metabolite cell extraction, as well as rinse and test solutions, should be kept under identical conditions. (Optional) Keep solutions at − 80 °C to reduce metabolite degradation for about 1 month. Method development should optimize storage conditions according to the compounds of interest, cell type and extraction parameters, among other factors.pause poInt The cells can be stored in the extraction solution at − 20 °C for up to 1 week.
assembling the ce-esI-Ms platform tIMInG 2–4 h! cautIon Bare fused silica is highly fragile and poses a poking hazard. When performing this task, wear protective eyewear and gloves. crItIcal Use appropriate parts (e.g., sleeves, fittings, ferrules, and nuts) during system assembly to ensure the integrity of connections.
12| Assemble the CE-ESI interface (Fig. 1e):
i Mount the ES emitter into the T-union (Fig. 1e) and feed the separation capillary through the parallel inlet of the union until it protrudes ~15 cm past the emitter tip
ii Cleave the separation capillary ends with a scribe and then rapidly burn ~3 mm of coating from both ends
iii Wipe the capillary ends with isopropanol until the exposed fused silica ends appear clean under a microscope
iv Gently retrieve the capillary through the ES emitter and finger-tighten the connections, allowing the outlet end to protrude 20–200 µm beyond the emitter tip as measured using a microscope
v Connect the sheath capillary to the perpendicular inlet of the T-union
crItIcal step The protrusion length and position of the separation capillary within the ES emitter will affect the stability of the Taylor cone during CE separation and should be optimized.
13| Mount the CE-ESI interface onto the three-axis translation stage and position the ES emitter perpendicularly to the sampling plate at an ~20-mm distance. Figure 1c demonstrates the use of the PicoView nanospray source fitted for the maXis mass spectrometer.
©20
13 N
atu
re A
mer
ica,
Inc.
All
rig
hts
res
erve
d.
protocol
nature protocols | VOL.8 NO.4 | 2013 | 791
14| Secure the separation capillary inlet into the capillary holder of the sample-loading platform (element 3, Fig. 1), and then connect the sheath capillary to the syringe driven by the syringe pump.
15| Clean the internal and external CE-ESI interface components for ~30 min after the first assembly, for ~10–15 min at the beginning of an experiment series and for at least 5 min between consecutive measurements, according to the procedure in Box 3.
16| Remove the rubber band–operated syringe from the separation capillary, mount the capillary inlet into the capillary mount of the platform, and then translate this capillary mount to transfer the separation capillary inlet end ~2 mm below the background electrolyte liquid meniscus. Improve the accuracy of manual fine positioning with a magnifier and adequate lighting. Ensuring the proper capillary dipping depth is important in order to offset the decreasing meniscus levels resulting from electrolyte evaporation. Although this protocol proposes 1 h of separation, longer experiments are feasible by increas-ing the dipping depth.pause poInt (Optional) To place the setup in standby mode for a short time (e.g., 1–2 h), apply –1,700 V on the sampling plate and operate the ES in the burst-pulsating-dripping spraying regime55 by adjusting the ES emitter-to-sampling plate distance to ~5–15 mm; monitor the spraying mode using the microscope. See Box 1 and the supplementary Methods for additional comments. The system may be turned off by Step 29.
ce-esI-Ms measurement tIMInG 1 h per measurement17| Operate the ES as an ESI-MS-only device (Box 1) in the cone-jet mode by carefully decreasing the emitter-to-sampling plate distance to ~3 mm, and monitor and optimize system performance. Upon first assembly of the CE-ESI-MS platform, optimize the signal intensity and stability by positioning the ES emitter in front of the sampling plate orifice in all directions, as well as by refining the ES emitter axis-to-sampling plate angle to ~90°. The absolute location of the emitter is not crucial and can be adjusted, even during experiments, by a few millimeters in each direction without noticeably altering the absolute ion intensity. Monitor the stability of the electrified liquid meniscus by optical means and monitor the ion signal using the mass spectrometer for about 45 min upon initial system assembly, for 10 min at the beginning of an experiment series and for at least 1 min between consecutive measurements. crItIcal step The purpose of this step is multifold: the integrity of the connections and sheath supply are ensured, and the ES performance is characterized. Other experimental variables, including the flow rate and composition of the sheath flow, may be tuned during this step. Optimized variables, however, should not be altered between experiments.
18| (Optional) Refine the tuning of the mass spectrometer by electrospraying the test solution at ~300–1,000 nl min − 1 through the CE-ESI interface as an ES-only device (supplementary Methods); register the new tuning file to default.?trouBlesHootInG
19| Start the CE separation by gradually increasing the potential across the separation capillary to 20 kV within 10 s using the attached virtual instrument (supplementary Data and supplementary Methods). Test system
Box 3 | Cleaning CE-ESI interface components tIMInG 5–30 minThe purpose of these steps is to fill up the connections and remove potential contaminants, including metabolites that may be carried over between experiments. When appropriate, the steps may be performed in parallel to obtain higher throughput. Note that each measurement requires a new, dry, clean sample-loading vial as well as replenishing of the electrolyte. The same electrolyte-containing vial can be used ~15 times before cleaning via sonication. Clean the interface as follows:1. Turn on the mass spectrometer with the sampling plate potential set to 0 V.2. Position the emitter ~15 mm from the sampling plate.3. Flush the background electrolyte through the separation capillary using the syringe equipped with a rubber band by applying gentle pressure on the syringe plunger (another syringe pump or gravity-driven solution supply may alternatively be used for this purpose).4. Supply the sheath solution at a 750 nl min − 1 rate through the sheath capillary using a separate syringe and the syringe pump. crItIcal step The sheath flow supply rate should be optimized for system performance (Box 1) and should be kept stable throughout the protocol.5. Rinse the ES emitter tip with Sigma water and then with methanol.6. By using tweezers, remove a cleaned sample-loading vial from the storage solution, dry it with an absorbent wipe (e.g., Kimwipe) and transfer it into the corresponding vial holder (element 7, Fig. 1) of the sample-loading platform to allow it to further air-dry.7. Replenish the background electrolyte in the electrolyte-containing vial (element 8, Fig. 1) in the sample-loading platform.
©20
13 N
atu
re A
mer
ica,
Inc.
All
rig
hts
res
erve
d.
protocol
792 | VOL.8 NO.4 | 2013 | nature protocols
performance in the ensuing CE-ESI-MS operation mode (Box 1): perform separation for 45 min upon initial system assembly, 10 min at the beginning of an experiment series and at least 2 min between consecutive measurements, while monitoring the ES. The purpose of this step is to ensure stable ion generation for the sample analysis. (Optional) Measure the current-voltage characteristics of the CE-ESI system (Ohm’s plot) to minimize solvent heating and electrolysis (see supplementary information in ref. 33).?trouBlesHootInG
20| Gather the sample and centrifuge it for 1 min at 2,000g at room temperature. This step helps reduce cellular debris in the supernatant that may clog the separation capillary. (Optional) Thaw the frozen sample extract and sonicate it if needed before centrifugation. In the present protocol, thawing is accomplished at room temperature without homogenization. Temperature-sensitive samples may be thawed in an ice-water mixture at ~4 °C.
21| Stop the CE separation by gradually decreasing the potential across the separation capillary from 20 kV to 0 V (earth ground) within 10 s using the attached virtual instrument (supplementary Data and supplementary Methods). Open the door of the CE enclosure to clear access to the sample-loading platform. Note that this will automatically turn off the power supply to the CE HVPS (Equipment Setup).
22| Transfer 500 nl of the sample supernatant into the clean and dry sample-loading vial installed in the CE platform per Step 15 (Box 1). (Optional) Practice allows the reproducible transfer of smaller sample volumes into the sample-loading vial. During this step, the sample may be modified depending on the purpose of the study, including dilution or concentration (Box 2).
23| Load 6 nl of neuron extract into the separation capillary, as follows. By using the capillary holder of the CE platform, move the separation capillary inlet into the sample-loading vial, allowing it to submerge below the sample meniscus. Raise the inlet end of the separation capillary 15 cm above the outlet end by quickly elevating the CE stage (within 1 s). Wait for 60 s to siphon ~6 nl of the extract into the separation capillary. Lower the stage immediately afterward (within 1 s), leveling it with the outlet end of the capillary. crItIcal step Use magnifiers and work in a well-lit environment to increase reproducibility, and avoid bending the bare fused silica capillary inlet. (Optional) The inlet end of the separation capillary may be positioned 1 cm above the outlet end during all times in order to prevent sample loss during capillary positioning31. As discussed in Box 2, different neuron extract volumes may be sampled by adjusting the elevation or injection time.?trouBlesHootInG
24| By using the capillary mount of the platform, quickly transfer the separation capillary over the electrolyte and secure its inlet end at least 2 mm below the liquid meniscus. Quickly close the CE enclosure door to automatically power the CE HVPS (Equipment Setup).
25| Start CE separation by repeating Step 19, and simultaneously begin mass spectrometric acquisition in single- (MS) or tandem-stage (MS/MS) operation. It is advisable to continuously monitor the stability of the ES during separation (Box 1). The troubleshooting advice given in Steps 18 and 19 apply.?trouBlesHootInG
26| Stop the CE separation and mass spectrometric data acquisition upon detecting the compounds of interest. Non-targeted metabolic and peptidomic analyses (e.g., profiling) can be enhanced by prolonging the CE separation and data acquisition. In this protocol, many amino acids, osmolites and neurotransmitters of interest are separated and detected within 45 min (refs. 31,33,34). Monitor the selected-ion electropherogram of an endogenous compound as an indicator of the endpoint in an experiment (e.g., similar to a targeted experiment). In the experiments shown here, CE-ESI-MS data were collected until detection of glutathione (protonated m/z 308.0916) with an ~40-min migration time. (Optional) Exogenous compounds spiked into the cell extracts before analysis can also help mark the endpoint of the experiment (Reagent Setup).
27| Clean the CE-ESI-MS system components by following Step 15. Rinse the used sample-loading vial with Sigma water and methanol, and store it in 50% (vol/vol) methanol prepared with Sigma water. It is practical to collect ~30 sample-loading vials in the same container for batch cleaning via sonication in 50% (vol/vol) methanol prepared with Sigma water.
©20
13 N
atu
re A
mer
ica,
Inc.
All
rig
hts
res
erve
d.
protocol
nature protocols | VOL.8 NO.4 | 2013 | 793
system testing and calibration tIMInG variable28| By repeating Steps 15–27, analyze the test solution to assess system performance and the mass calibration solution to generate data for mass calibrating the mass spectrometer. (Optional) Mass calibration may be performed with alternative compounds (Reagent Setup). crItIcal step Note that performing this step before and after measuring a series of sample extracts is recommended to help identify potential instrumental biases (e.g., during the same day). It is also recommended that the cell environment and rinse solution samples be analyzed to aid in the interpretation of the results.?trouBlesHootInG
29| To turn the system off:
i Lower the mass spectrometer sampling plate potential to 0 V
ii Set the mass spectrometer to standby mode
iii Turn off the CE HVPS
iv Set the ES emitter-to-sampling plate distance to 15–20 mm
v Clean the system components as per Step 15
vi Begin flushing Sigma water through the sheath capillary using a syringe pump (750 nl min − 1 rate or lower) and the separation capillary using the rubber band–driven syringe (Step 15)
crItIcal step Maintain a gentle flow of deionized water in the separation and sheath capillaries until the next experiment to keep capillary walls hydrated and mitigate clogging of the capillaries. pause poInt The system can be left turned off for about 1 week without a detectable change in performance.
Data analysis tIMInG 5 min–1 d30| Recalibrate the mass spectra to 5 p.p.m. accuracy or better using the Compass software. In the present protocol, a selected-ion electropherogram is generated for the sodium formate dimer ion (m/z 158.9 ± 0.1), and a mass spectrum is integrated over the salt peak (9–11 min migration time). This spectrum typically contains an abundance of sodium for-mate cluster ions and is used to externally calibrate the mass spectra in the m/z 50–500 range. Alternatively, a calibration spectrum registered the same day for the mass calibration solution or a calibrated sample can serve as an external mass calibration. This protocol implements an enhanced quadratic equation for mass calibration (Compass), yielding a typical mass accuracy of 1 p.p.m. crItIcal step Ensuring that data are collected with high mass accuracy is critical for successful identification of metabolites. (Optional) Although only one approach is discussed here, mass calibration may be performed by alternative means, or it can be skipped if the mass accuracy was sufficient during data acquisition; e.g., the mass accuracy of acquisition may be tested for known endogenous compounds detected at previously determined migration times (supplementary Methods).
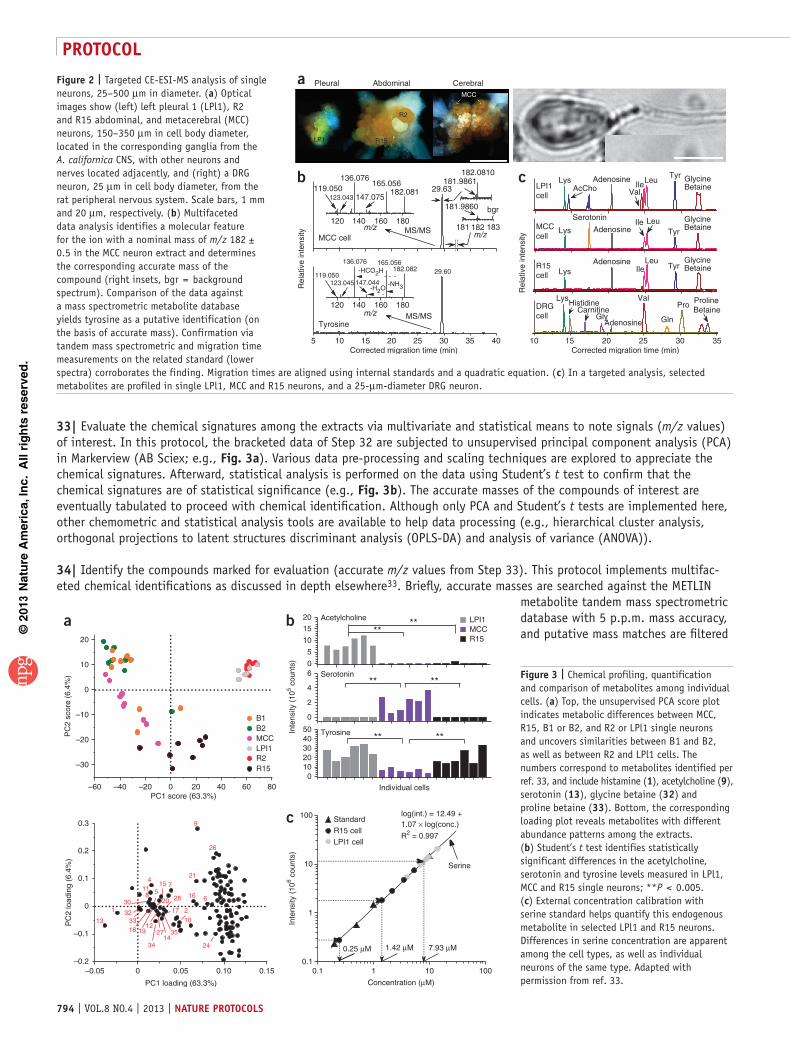
31| Find molecular features and create a list of the measured ion masses of interest. Here, the PlotEIC.m (Bruker) script is executed in Compass to compute m/z-selected ion electropherograms between m/z 50 and 500 with a search window of 500 mDa, and the data are smoothed using a 3-point Gaussian function. Electrophoretic signals are high-pass-filtered with an arbitrary threshold of 5×10⁴ counts. Adducts, clusters, isotopes and compounds not related to the neuron metabolome (e.g., polymers and plasticizers from vials and other contaminants from solvents) are manually eliminated, and the accurate masses of the remaining signals are determined by generating mass spectra across the corresponding electrophoretic peaks (Fig. 2b). (Optional) Advanced software packages, such as ProfileAnalysis (Bruker) or metaXCMS (METLIN), present automated protocols to find molecular features. Although the presented protocol aims for large-scale chemical profiling, this step may be skipped when you are performing a targeted analysis.
32| Calculate and tabulate the abundance and migration time of the measured signals of interest (m/z values). Here, the custom-written script (supplementary Methods) is executed, generating mass (m/z)-selected ion electropherograms with a 5-mDa window for the accurate masses noted in Step 31, and also implementing 3-point Gaussian smoothing on the data. Peak areas are manually integrated and tabulated into mass migration time brackets. Although it is laborious, this semiautomated approach provides complete oversight on data analysis, and it is capable of profiling 144 endogenous compounds in over 60 different single-neuron extracts33. (Optional) ProfileAnalysis and metaXCMS can help automate this step, thus substantially reducing the processing time. In a targeted study, limit analysis to the accurate mass of the compound of interest.
©20
13 N
atu
re A
mer
ica,
Inc.
All
rig
hts
res
erve
d.
protocol
794 | VOL.8 NO.4 | 2013 | nature protocols
33| Evaluate the chemical signatures among the extracts via multivariate and statistical means to note signals (m/z values) of interest. In this protocol, the bracketed data of Step 32 are subjected to unsupervised principal component analysis (PCA) in Markerview (AB Sciex; e.g., Fig. 3a). Various data pre-processing and scaling techniques are explored to appreciate the chemical signatures. Afterward, statistical analysis is performed on the data using Student’s t test to confirm that the chemical signatures are of statistical significance (e.g., Fig. 3b). The accurate masses of the compounds of interest are eventually tabulated to proceed with chemical identification. Although only PCA and Student’s t tests are implemented here, other chemometric and statistical analysis tools are available to help data processing (e.g., hierarchical cluster analysis, orthogonal projections to latent structures discriminant analysis (OPLS-DA) and analysis of variance (ANOVA)).
34| Identify the compounds marked for evaluation (accurate m/z values from Step 33). This protocol implements multifac-eted chemical identifications as discussed in depth elsewhere33. Briefly, accurate masses are searched against the METLIN
metabolite tandem mass spectrometric database with 5 p.p.m. mass accuracy, and putative mass matches are filtered
Figure 2 | Targeted CE-ESI-MS analysis of single neurons, 25–500 µm in diameter. (a) Optical images show (left) left pleural 1 (LPl1), R2 and R15 abdominal, and metacerebral (MCC) neurons, 150–350 µm in cell body diameter, located in the corresponding ganglia from the A. californica CNS, with other neurons and nerves located adjacently, and (right) a DRG neuron, 25 µm in cell body diameter, from the rat peripheral nervous system. Scale bars, 1 mm and 20 µm, respectively. (b) Multifaceted data analysis identifies a molecular feature for the ion with a nominal mass of m/z 182 ± 0.5 in the MCC neuron extract and determines the corresponding accurate mass of the compound (right insets, bgr = background spectrum). Comparison of the data against a mass spectrometric metabolite database yields tyrosine as a putative identification (on the basis of accurate mass). Confirmation via tandem mass spectrometric and migration time measurements on the related standard (lower spectra) corroborates the finding. Migration times are aligned using internal standards and a quadratic equation. (c) In a targeted analysis, selected metabolites are profiled in single LPl1, MCC and R15 neurons, and a 25-µm-diameter DRG neuron.
a b
c
20
10
0
PC
2 sc
ore
(6.4
%)
Inte
nsity
(10
5 cou
nts)
PC
2 lo
adin
g (6
.4%
)
Inte
nsity
(10
6 cou
nts)
PC1 loading (63.3%) Concentration (µM)
–10
–20
–30
0.3100 Standard
Individual cells
Tyrosine
Serotonin
Acetylcholine LPI1MCCR15
20
**
****
****
**
R15 cell
LPI1 cell
Serine
log(int.) = 12.49 +1.07 × log(conc.)
R2 = 0.997
–60
–0.05 0.05
9
26
21
16
7154
58
2
10
17
3514
27
34
121918
3332
30
13
1
11
2820 6
24
0.10 0.15 0.1 1 10
7.93 µM1.42 µM0.25 µM
1000
–40 –20 20PC1 score (63.3%)
40
B1B2MCCLPI1R2R15
60 800
0.2
0.1
0
–0.1
–0.2
10
1
0.1
15
10
5
06
4
2
0
50403020100
Figure 3 | Chemical profiling, quantification and comparison of metabolites among individual cells. (a) Top, the unsupervised PCA score plot indicates metabolic differences between MCC, R15, B1 or B2, and R2 or LPl1 single neurons and uncovers similarities between B1 and B2, as well as between R2 and LPl1 cells. The numbers correspond to metabolites identified per ref. 33, and include histamine (1), acetylcholine (9), serotonin (13), glycine betaine (32) and proline betaine (33). Bottom, the corresponding loading plot reveals metabolites with different abundance patterns among the extracts. (b) Student’s t test identifies statistically significant differences in the acetylcholine, serotonin and tyrosine levels measured in LPl1, MCC and R15 single neurons; **P < 0.005. (c) External concentration calibration with serine standard helps quantify this endogenous metabolite in selected LPl1 and R15 neurons. Differences in serine concentration are apparent among the cell types, as well as individual neurons of the same type. Adapted with permission from ref. 33.
a
b c
Pleural
136.076
147.075
165.056182.081 29.63
181.9861182.0810
181.9860 bgr
LPI1cell
MCCcell
R15cell
DRGcell
Lys
Lys
Lys
Lys
AcChoAdenosine
Adenosine
Adenosine
HistidineCarnitine
Gly
Adenosine
Serotonin
Leu
Leu
Leu
Val
Gln
Pro
Tyr
Tyr
Tyr
GlycineBetaine
GlycineBetaine
GlycineBetaine
ProlineBetaine
Ile
Ile
Ile
Val
181 182 183
119.050
120 140 160m/z
m/z
m/z
180
120 140 160 180
MS/MS
MS/MS
MCC cell
Tyrosine
5 10 15 20 25Corrected migration time (min)
30 35 40 10 15 20 25Corrected migration time (min)
30 35
Rel
ativ
e in
tens
ity
Rel
ativ
e in
tens
ity
123.043
136.076
119.050
165.056
147.044123.045
-HCO2H
-NH3-H2O
182.082 29.60
LP1
R2
MCC
R15
Abdominal Cerebral
©20
13 N
atu
re A
mer
ica,
Inc.
All
rig
hts
res
erve
d.
protocol
nature protocols | VOL.8 NO.4 | 2013 | 795
on the basis of isotope distribution. Next, the tandem mass spectrum recorded for the unknown signal is compared against that of the putative metabolite in the METLIN database or in alternative resources (e.g., online databases and publica-tions). The confidence of assignment is further enhanced by measuring the migration time and tandem mass spectrum of the authentic chemical standard that corresponds to the putative candidate (e.g., Fig. 2b). (Optional) When you are performing a targeted analysis, this step is skipped.
35| Quantify the compounds of interest in follow-up measurements by establishing a correlation between the CE-ESI-MS signal intensity and analyte concentration using related chemical standards (external calibration; e.g., Fig. 3c). crItIcal step Depending on inter-day variances in system performance, it is advisable to perform external calibration on the same day as analysis of the neuron extract(s). (Optional) The standard addition method can be alternatively used to deduce compound concentrations.
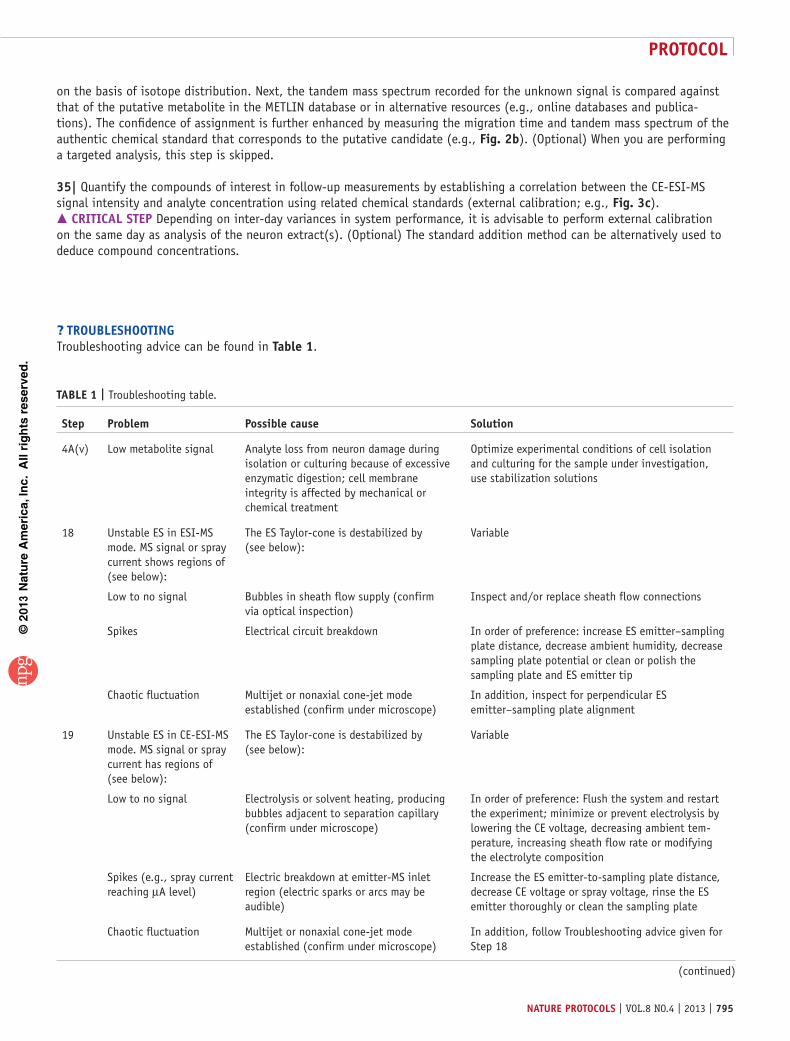
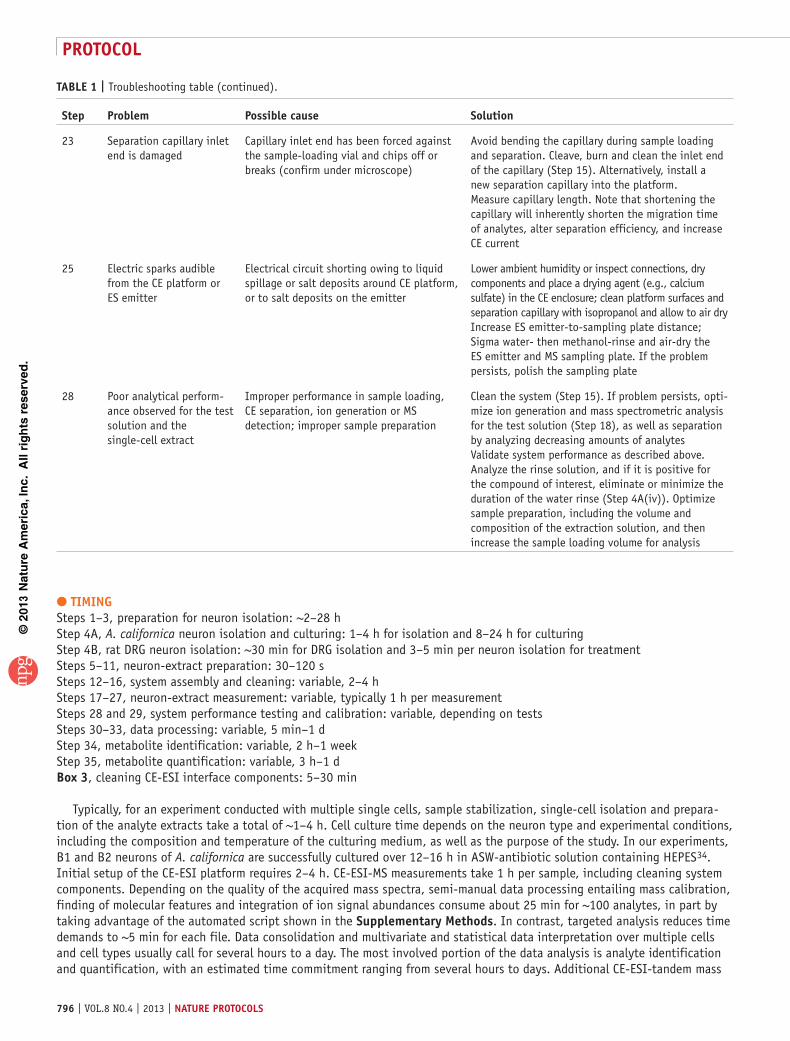
?trouBlesHootInGTroubleshooting advice can be found in table 1.
taBle 1 | Troubleshooting table.
step problem possible cause solution
4A(v) Low metabolite signal Analyte loss from neuron damage during isolation or culturing because of excessive enzymatic digestion; cell membrane integrity is affected by mechanical or chemical treatment
Optimize experimental conditions of cell isolation and culturing for the sample under investigation, use stabilization solutions
18 Unstable ES in ESI-MS mode. MS signal or spray current shows regions of (see below):
The ES Taylor-cone is destabilized by (see below):
Variable
Low to no signal Bubbles in sheath flow supply (confirm via optical inspection)
Inspect and/or replace sheath flow connections
Spikes Electrical circuit breakdown In order of preference: increase ES emitter–sampling plate distance, decrease ambient humidity, decrease sampling plate potential or clean or polish the sampling plate and ES emitter tip
Chaotic fluctuation Multijet or nonaxial cone-jet mode established (confirm under microscope)
In addition, inspect for perpendicular ES emitter–sampling plate alignment
19 Unstable ES in CE-ESI-MS mode. MS signal or spray current has regions of (see below):
The ES Taylor-cone is destabilized by (see below):
Variable
Low to no signal Electrolysis or solvent heating, producing bubbles adjacent to separation capillary (confirm under microscope)
In order of preference: Flush the system and restart the experiment; minimize or prevent electrolysis by lowering the CE voltage, decreasing ambient tem-perature, increasing sheath flow rate or modifying the electrolyte composition
Spikes (e.g., spray current reaching µA level)
Electric breakdown at emitter-MS inlet region (electric sparks or arcs may be audible)
Increase the ES emitter-to-sampling plate distance, decrease CE voltage or spray voltage, rinse the ES emitter thoroughly or clean the sampling plate
Chaotic fluctuation Multijet or nonaxial cone-jet mode established (confirm under microscope)
In addition, follow Troubleshooting advice given for Step 18
(continued)
©20
13 N
atu
re A
mer
ica,
Inc.
All
rig
hts
res
erve
d.
protocol
796 | VOL.8 NO.4 | 2013 | nature protocols
tIMInGSteps 1–3, preparation for neuron isolation: ~2–28 hStep 4A, A. californica neuron isolation and culturing: 1–4 h for isolation and 8–24 h for culturingStep 4B, rat DRG neuron isolation: ~30 min for DRG isolation and 3–5 min per neuron isolation for treatment Steps 5–11, neuron-extract preparation: 30–120 sSteps 12–16, system assembly and cleaning: variable, 2–4 hSteps 17–27, neuron-extract measurement: variable, typically 1 h per measurementSteps 28 and 29, system performance testing and calibration: variable, depending on testsSteps 30–33, data processing: variable, 5 min–1 dStep 34, metabolite identification: variable, 2 h–1 weekStep 35, metabolite quantification: variable, 3 h–1 dBox 3, cleaning CE-ESI interface components: 5–30 min
Typically, for an experiment conducted with multiple single cells, sample stabilization, single-cell isolation and prepara-tion of the analyte extracts take a total of ~1–4 h. Cell culture time depends on the neuron type and experimental conditions, including the composition and temperature of the culturing medium, as well as the purpose of the study. In our experiments, B1 and B2 neurons of A. californica are successfully cultured over 12–16 h in ASW-antibiotic solution containing HEPES34. Initial setup of the CE-ESI platform requires 2–4 h. CE-ESI-MS measurements take 1 h per sample, including cleaning system components. Depending on the quality of the acquired mass spectra, semi-manual data processing entailing mass calibration, finding of molecular features and integration of ion signal abundances consume about 25 min for ~100 analytes, in part by taking advantage of the automated script shown in the supplementary Methods. In contrast, targeted analysis reduces time demands to ~5 min for each file. Data consolidation and multivariate and statistical data interpretation over multiple cells and cell types usually call for several hours to a day. The most involved portion of the data analysis is analyte identification and quantification, with an estimated time commitment ranging from several hours to days. Additional CE-ESI-tandem mass
taBle 1 | Troubleshooting table (continued).
step problem possible cause solution
23 Separation capillary inlet end is damaged
Capillary inlet end has been forced against the sample-loading vial and chips off or breaks (confirm under microscope)
Avoid bending the capillary during sample loading and separation. Cleave, burn and clean the inlet end of the capillary (Step 15). Alternatively, install a new separation capillary into the platform. Measure capillary length. Note that shortening the capillary will inherently shorten the migration time of analytes, alter separation efficiency, and increase CE current
25 Electric sparks audible from the CE platform or ES emitter
Electrical circuit shorting owing to liquid spillage or salt deposits around CE platform, or to salt deposits on the emitter
Lower ambient humidity or inspect connections, dry components and place a drying agent (e.g., calcium sulfate) in the CE enclosure; clean platform surfaces and separation capillary with isopropanol and allow to air dry Increase ES emitter-to-sampling plate distance; Sigma water- then methanol-rinse and air-dry the ES emitter and MS sampling plate. If the problem persists, polish the sampling plate
28 Poor analytical perform-ance observed for the test solution and the single-cell extract
Improper performance in sample loading, CE separation, ion generation or MS detection; improper sample preparation
Clean the system (Step 15). If problem persists, opti-mize ion generation and mass spectrometric analysis for the test solution (Step 18), as well as separation by analyzing decreasing amounts of analytes Validate system performance as described above. Analyze the rinse solution, and if it is positive for the compound of interest, eliminate or minimize the duration of the water rinse (Step 4A(iv)). Optimize sample preparation, including the volume and composition of the extraction solution, and then increase the sample loading volume for analysis
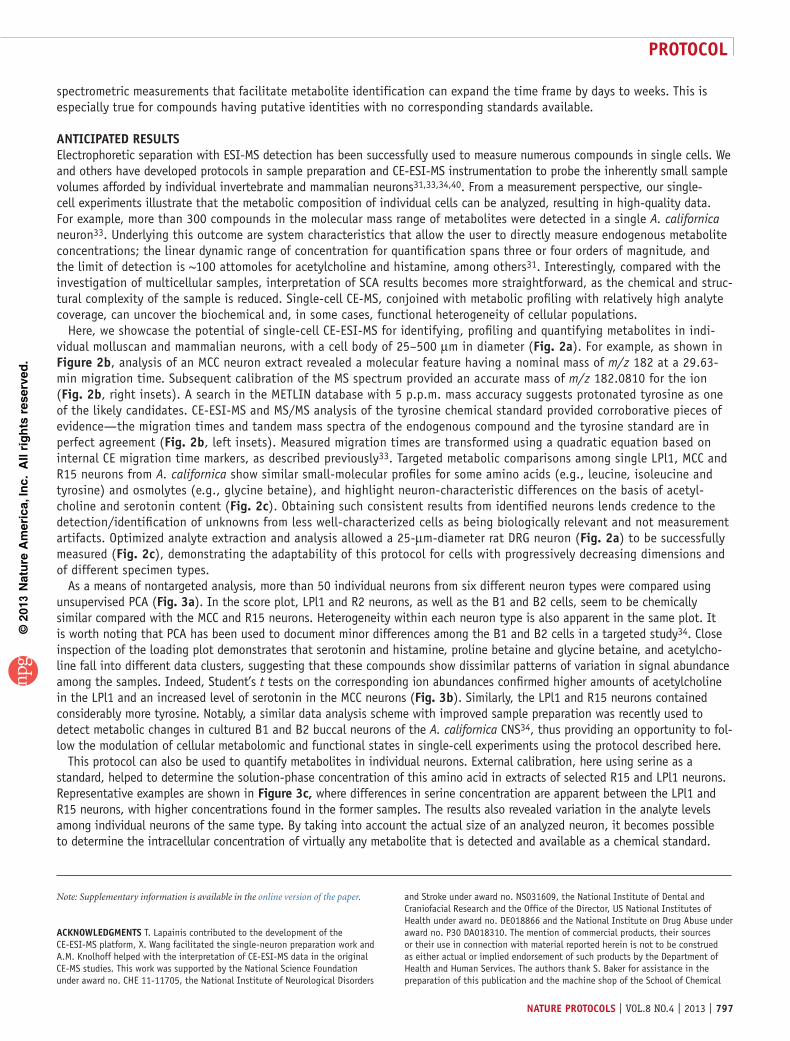
©20
13 N
atu
re A
mer
ica,
Inc.
All
rig
hts
res
erve
d.
protocol
nature protocols | VOL.8 NO.4 | 2013 | 797
spectrometric measurements that facilitate metabolite identification can expand the time frame by days to weeks. This is especially true for compounds having putative identities with no corresponding standards available.
antIcIpateD resultsElectrophoretic separation with ESI-MS detection has been successfully used to measure numerous compounds in single cells. We and others have developed protocols in sample preparation and CE-ESI-MS instrumentation to probe the inherently small sample volumes afforded by individual invertebrate and mammalian neurons31,33,34,40. From a measurement perspective, our single- cell experiments illustrate that the metabolic composition of individual cells can be analyzed, resulting in high-quality data. For example, more than 300 compounds in the molecular mass range of metabolites were detected in a single A. californica neuron33. Underlying this outcome are system characteristics that allow the user to directly measure endogenous metabolite concentrations; the linear dynamic range of concentration for quantification spans three or four orders of magnitude, and the limit of detection is ~100 attomoles for acetylcholine and histamine, among others31. Interestingly, compared with the investigation of multicellular samples, interpretation of SCA results becomes more straightforward, as the chemical and struc-tural complexity of the sample is reduced. Single-cell CE-MS, conjoined with metabolic profiling with relatively high analyte coverage, can uncover the biochemical and, in some cases, functional heterogeneity of cellular populations.
Here, we showcase the potential of single-cell CE-ESI-MS for identifying, profiling and quantifying metabolites in indi-vidual molluscan and mammalian neurons, with a cell body of 25–500 µm in diameter (Fig. 2a). For example, as shown in Figure 2b, analysis of an MCC neuron extract revealed a molecular feature having a nominal mass of m/z 182 at a 29.63-min migration time. Subsequent calibration of the MS spectrum provided an accurate mass of m/z 182.0810 for the ion (Fig. 2b, right insets). A search in the METLIN database with 5 p.p.m. mass accuracy suggests protonated tyrosine as one of the likely candidates. CE-ESI-MS and MS/MS analysis of the tyrosine chemical standard provided corroborative pieces of evidence—the migration times and tandem mass spectra of the endogenous compound and the tyrosine standard are in perfect agreement (Fig. 2b, left insets). Measured migration times are transformed using a quadratic equation based on internal CE migration time markers, as described previously33. Targeted metabolic comparisons among single LPl1, MCC and R15 neurons from A. californica show similar small-molecular profiles for some amino acids (e.g., leucine, isoleucine and tyrosine) and osmolytes (e.g., glycine betaine), and highlight neuron-characteristic differences on the basis of acetyl-choline and serotonin content (Fig. 2c). Obtaining such consistent results from identified neurons lends credence to the detection/identification of unknowns from less well-characterized cells as being biologically relevant and not measurement artifacts. Optimized analyte extraction and analysis allowed a 25-µm-diameter rat DRG neuron (Fig. 2a) to be successfully measured (Fig. 2c), demonstrating the adaptability of this protocol for cells with progressively decreasing dimensions and of different specimen types.
As a means of nontargeted analysis, more than 50 individual neurons from six different neuron types were compared using unsupervised PCA (Fig. 3a). In the score plot, LPl1 and R2 neurons, as well as the B1 and B2 cells, seem to be chemically similar compared with the MCC and R15 neurons. Heterogeneity within each neuron type is also apparent in the same plot. It is worth noting that PCA has been used to document minor differences among the B1 and B2 cells in a targeted study34. Close inspection of the loading plot demonstrates that serotonin and histamine, proline betaine and glycine betaine, and acetylcho-line fall into different data clusters, suggesting that these compounds show dissimilar patterns of variation in signal abundance among the samples. Indeed, Student’s t tests on the corresponding ion abundances confirmed higher amounts of acetylcholine in the LPl1 and an increased level of serotonin in the MCC neurons (Fig. 3b). Similarly, the LPl1 and R15 neurons contained considerably more tyrosine. Notably, a similar data analysis scheme with improved sample preparation was recently used to detect metabolic changes in cultured B1 and B2 buccal neurons of the A. californica CNS34, thus providing an opportunity to fol-low the modulation of cellular metabolomic and functional states in single-cell experiments using the protocol described here.
This protocol can also be used to quantify metabolites in individual neurons. External calibration, here using serine as a standard, helped to determine the solution-phase concentration of this amino acid in extracts of selected R15 and LPl1 neurons. Representative examples are shown in Figure 3c, where differences in serine concentration are apparent between the LPl1 and R15 neurons, with higher concentrations found in the former samples. The results also revealed variation in the analyte levels among individual neurons of the same type. By taking into account the actual size of an analyzed neuron, it becomes possible to determine the intracellular concentration of virtually any metabolite that is detected and available as a chemical standard.
Note: Supplementary information is available in the online version of the paper.
acknoWleDGMents T. Lapainis contributed to the development of the CE-ESI-MS platform, X. Wang facilitated the single-neuron preparation work and A.M. Knolhoff helped with the interpretation of CE-ESI-MS data in the original CE-MS studies. This work was supported by the National Science Foundation under award no. CHE 11-11705, the National Institute of Neurological Disorders
and Stroke under award no. NS031609, the National Institute of Dental and Craniofacial Research and the Office of the Director, US National Institutes of Health under award no. DE018866 and the National Institute on Drug Abuse under award no. P30 DA018310. The mention of commercial products, their sources or their use in connection with material reported herein is not to be construed as either actual or implied endorsement of such products by the Department of Health and Human Services. The authors thank S. Baker for assistance in the preparation of this publication and the machine shop of the School of Chemical
©20
13 N
atu
re A
mer
ica,
Inc.
All
rig
hts
res
erve
d.
protocol
798 | VOL.8 NO.4 | 2013 | nature protocols
Sciences, University of Illinois at Urbana-Champaign, for providing various components for the construction of the CE-ESI system. They also thank M. Kim for help in photography.
autHor contrIButIons The contributions of the authors to the original studies that were used to generate the protocol are indicated in the original cited articles. For the protocols described here, P.N. generated many of the protocol steps related to CE-MS operation and wrote the data analysis script and virtual instrument; J.T.A. modified the protocols and validated them using the DRG neurons; S.S.R. performed the cell isolations and optimized the protocols for cell handling; and J.V.S. modified and clarified the protocol. All authors participated in the writing of the protocol.
coMpetInG FInancIal Interests The authors declare no competing financial interests.
Reprints and permissions information is available online at http://www.nature.com/reprints/index.html.
1. Wishart, D.S. et al. HMDB: a knowledgebase for the human metabolome. Nucleic Acids Res. 37, D603–D610 (2009).
2. Stephens, D.J. & Allan, V.J. Light microscopy techniques for live cell imaging. Science 300, 82–86 (2003).
3. Fischer, R.S., Wu, Y.C., Kanchanawong, P., Shroff, H. & Waterman, C.M. Microscopy in 3D: a biologist′s toolbox. Trends Cell Biol. 21, 682–691 (2011).
4. Hell, S.W. Far-field optical nanoscopy. Science 316, 1153–1158 (2007).5. Planchon, T.A. et al. Rapid three-dimensional isotropic imaging of living
cells using Bessel beam plane illumination. Nat. Methods 8, 417–U468 (2011).
6. Yan, R.X. et al. Nanowire-based single-cell endoscopy. Nat. Nanotechnol. 7, 191–196 (2012).
7. Wang, D.J. & Bodovitz, S. Single cell analysis: the new frontier in ‘omics’. Trends Biotechnol. 28, 281–290 (2010).
8. Amantonico, A., Urban, P.L. & Zenobi, R. Analytical techniques for single-cell metabolomics: state of the art and trends. Anal. Bioanal. Chem. 398, 2493–2504 (2010).
9. Rubakhin, S.S., Romanova, E., Nemes, P. & Sweedler, J.V. Profiling metabolites and peptides in single cells. Nat. Methods 8, S20–S29 (2011).
10. Lin, Y.Q., Trouillon, R., Safina, G. & Ewing, A.G. Chemical analysis of single cells. Anal. Chem. 83, 4369–4392 (2011).
11. Nemes, P. & Vertes, A. Ambient mass spectrometry for in vivo local analysis and in situ molecular tissue imaging. Trac-Trends Anal. Chem. 34, 22–34 (2012).
12. Lee, Y.J., Perdian, D.C., Song, Z.H., Yeung, E.S. & Nikolau, B.J. Use of mass spectrometry for imaging metabolites in plants. Plant J. 70, 81–95 (2012).
13. Rubakhin, S.S., Lanni, E.J. & Sweedler, J.V. Progress toward single cell metabolomics. Curr. Opin. Biotechnol. 24, 95–104 (2013).
14. Rubakhin, S.S., Churchill, J.D., Greenough, W.T. & Sweedler, J.V. Profiling signaling peptides in single mammalian cells using mass spectrometry. Anal. Chem. 78, 7267–7272 (2006).
15. Li, L. & Sweedler, J.V. Peptides in the brain: mass spectrometry-based measurement approaches and challenges. Annu. Rev. Anal. Chem. 1, 451–483 (2008).
16. Neupert, S., Rubakhin, S.S. & Sweedler, J.V. Targeted single cell microchemical analysis: MS-based peptidomics of individual paraformaldehyde-fixed immunolabeled neurons. Chem. Biol. 19, 1010–1019 (2012).
17. Rubakhin, S.S. & Sweedler, J.V. Characterizing peptides in individual mammalian cells using mass spectrometry. Nat. Protoc. 2, 1987–1997 (2007).
18. Northen, T.R. et al. Clathrate nanostructures for mass spectrometry. Nature 449, 1033–1036 (2007).
19. Greving, M.P., Patti, G.J. & Siuzdak, G. Nanostructure-initiator mass spectrometry metabolite analysis and imaging. Anal. Chem. 83, 2–7 (2011).
20. Urban, P.L., Amantonico, A., Fagerer, S.R., Gehrig, P. & Zenobi, R. Mass spectrometric method incorporating enzymatic amplification for attomole-level analysis of target metabolites in biological samples. Chem. Commun. 46, 2212–2214 (2010).
21. Stolee, J.A., Walker, B.N., Zorba, V., Russo, R.E. & Vertes, A. Laser-nanostructure interactions for ion production. PCCP 14, 8453–8471 (2012).
22. Monroe, E.B., Jurchen, J.C., Lee, J., Rubakhin, S.S. & Sweedler, J.V. Vitamin E imaging and localization in the neuronal membrane. J. Am. Chem. Soc. 127, 12152–12153 (2005).
23. Yang, H.J. et al. Detection of characteristic distributions of phospholipid head groups and fatty acids on neurite surface by time-of-flight secondary ion mass spectrometry. Med. Mol. Morphol. 43, 158–164 (2010).
24. Kurczy, M.E. et al. Mass spectrometry imaging of mating Tetrahymena show that changes in cell morphology regulate lipid domain formation. Proc. Natl Acad. Sci. USA 107, 2751–2756 (2010).
25. Tsuyama, N., Mizuno, H. & Masujima, T. Mass spectrometry for cellular and tissue analyses in a very small region. Anal. Sci. 27, 163–170 (2011).
26. Nemes, P. & Vertes, A. Laser ablation electrospray ionization for atmospheric pressure, in vivo, and imaging mass spectrometry. Anal. Chem. 79, 8098–8106 (2007).
27. Shrestha, B., Patt, J.M. & Vertes, A. In situ cell-by-cell imaging and analysis of small cell populations by mass spectrometry. Anal. Chem. 83, 2947–2955 (2011).
28. Coello, Y., Jones, A.D., Gunaratne, T.C. & Dantus, M. Atmospheric-pressure femtosecond laser imaging mass spectrometry. Anal. Chem. 82, 2753–2758 (2010).
29. Cecala, C. & Sweedler, J.V. Sampling techniques for single-cell electrophoresis. Analyst 137, 2922–2929 (2012).
30. Lapainis, T. & Sweedler, J.V. Contributions of capillary electrophoresis to neuroscience. J. Chromatogr. A 1184, 144–158 (2008).
31. Lapainis, T., Rubakhin, S.S. & Sweedler, J.V. Capillary electrophoresis with electrospray ionization mass spectrometric detection for single-cell metabolomics. Anal. Chem. 81, 5858–5864 (2009).
32. Page, J.S., Rubakhin, S.S. & Sweedler, J.V. Single-neuron analysis using CE combined with MALDI MS and radionuclide detection. Anal. Chem. 74, 497–503 (2002).
33. Nemes, P., Knolhoff, A.M., Rubakhin, S.S. & Sweedler, J.V. Metabolic differentiation of neuronal phenotypes by single-cell capillary electrophoresis-electrospray ionization-mass spectrometry. Anal. Chem. 83, 6810–6817 (2011).
34. Nemes, P., Knolhoff, A.M., Rubakhin, S.S. & Sweedler, J.V. Single-cell metabolomics: Changes in the metabolome of freshly isolated and cultured neurons. ACS Chem. Neurosci. 3, 782–792 (2012).
35. Bonner, R.F. et al. Cell sampling-laser capture microdissection: Molecular analysis of tissue. Science 278, 1481–1483 (1997).
36. Espina, V. et al. Laser-capture microdissection. Nat. Protoc. 1, 586–603 (2006).
37. Miao, J. & Cui, L.W. Rapid isolation of single malaria parasite–infected red blood cells by cell sorting. Nat. Protoc. 6, 140–146 (2011).
38. Cohen, D. et al. Chemical cytometry: fluorescence-based single-cell analysis. Annu. Rev. Anal. Chem. 1, 165–190 (2008).
39. Bodenmiller, B. et al. Multiplexed mass cytometry profiling of cellular states perturbed by small-molecule regulators. Nat. Biotechnol. 30, 858–867 (2012).
40. Mellors, J.S., Jorabchi, K., Smith, L.M. & Ramsey, J.M. Integrated microfluidic device for automated single cell analysis using electrophoretic separation and electrospray ionization mass spectrometry. Anal. Chem. 82, 967–973 (2010).
41. Schoenherr, R.M., Ye, M.L., Vannatta, M. & Dovichi, N.J. CE-microreactor-CE-MS/MS for protein analysis. Anal. Chem. 79, 2230–2238 (2007).
42. Barbula, G.K., Safi, S., Chingin, K., Perry, R.H. & Zare, R.N. Interfacing capillary-based separations to mass spectrometry using desorption electrospray ionization. Anal. Chem. 83, 1955–1959 (2011).
43. Harris, G.A., Nyadong, L. & Fernandez, F.M. Recent developments in ambient ionization techniques for analytical mass spectrometry. Analyst 133, 1297–1301 (2008).
44. Knolhoff, A.M., Nemes, P., Rubakhin, S.S. & Sweedler, J.V. in Methodologies for metabolomics: Experimental strategies and techniques (eds. Norbert Lutz, Jonathan V. Sweedler & Ron A. Wevers) 119–139 (Cambridge University Press, 2013).
45. Patti, G.J., Tautenhahn, R. & Siuzdak, G. Meta-analysis of untargeted metabolomic data from multiple profiling experiments. Nat. Protoc. 7, 508–516 (2012).
46. Pluskal, T., Castillo, S., Villar-Briones, A. & Oresic, M. MZmine 2: modular framework for processing, visualizing, and analyzing mass spectrometry-based molecular profile data. BMC Bioinformatics 11, 395 (2010).
47. Baran, R. et al. MathDAMP: a package for differential analysis of metabolite profiles. BMC Bioinformatics 7, 530 (2006).
©20
13 N
atu
re A
mer
ica,
Inc.
All
rig
hts
res
erve
d.
protocol
nature protocols | VOL.8 NO.4 | 2013 | 799
48. Kilkenny, C., Browne, W.J., Cuthill, I.C., Emerson, M. & Altman, D.G. Improving bioscience research reporting: the ARRIVE guidelines for reporting animal research. PLoS Biol. 8, e1000412 (2010).
49. Smith, C.A. et al. METLIN - a metabolite mass spectral database. Ther. Drug Monit. 27, 747–751 (2005).
50. Southey, B.R., Amare, A., Zimmerman, T.A., Rodriguez-Zas, S.L. & Sweedler, J.V. NeuroPred: a tool to predict cleavage sites in neuropeptide precursors and provide the masses of the resulting peptides. Nucleic Acids Res. 34, W267–W272 (2006).
51. Geigl, J.B. & Speicher, M.R. Single-cell isolation from cell suspensions and whole genome amplification from single cells to provide templates for CGH analysis. Nat. Protoc. 2, 3173–3184 (2007).
52. Neupert, S. & Predel, R. Mass spectrometric analysis of single identified neurons of an insect. Biochem. Biophys. Res. Commun. 327, 640–645 (2005).
53. Eyer, K., Kuhn, P., Hanke, C. & Dittrich, P.S. A microchamber array for single cell isolation and analysis of intracellular biomolecules. Lab Chip 12, 765–772 (2012).
54. De Sousa, B.N. & Horrocks, L.A. Development of rat spinal cord. I. Weight and length with a method for rapid removal. Dev. Neurosci. 2, 115–121 (1979).
55. Nemes, P., Marginean, I. & Vertes, A. Spraying mode effect on droplet formation and ion chemistry in electrosprays. Anal. Chem. 79, 3105–3116 (2007).