qu: how do human activities disrupt drainage basin
TRANSCRIPT

QU: How do human activities disrupt drainage basin processes.AIM: To example and explain the above through examining human
uses of the Amazon basin.ST: Answer the questions around the map.
Equator
How many countries is the basin part of?
Explain what type of rainfall the basin is most likely to receive.
This is a______________.
This is the ____________.

The Amazon Basin is the largest drainage basin in the world. It covers about 40 percent of South America. In an average dry season, 110,000 square kilometres of land are watercovered. In the wet season, the area of the Amazon Basin flooded increases to 350,000 square kilometres. Seasonal flooding is characteristic of many tropical rivers. The lowest flood stage usually occurs from August to September. The highest stage usually occurs from April to May. Tributaries of the Guyana Shield flood in June and the tributaries of the Brazilian Shield flood from March to April. In the rainy season, the volume of water flow to the Atlantic Ocean is over 300,000 cubic meters per second. The Amazon River is responsible for about 20% of the total volume of freshwater entering the ocean. (Amazon River 2007)
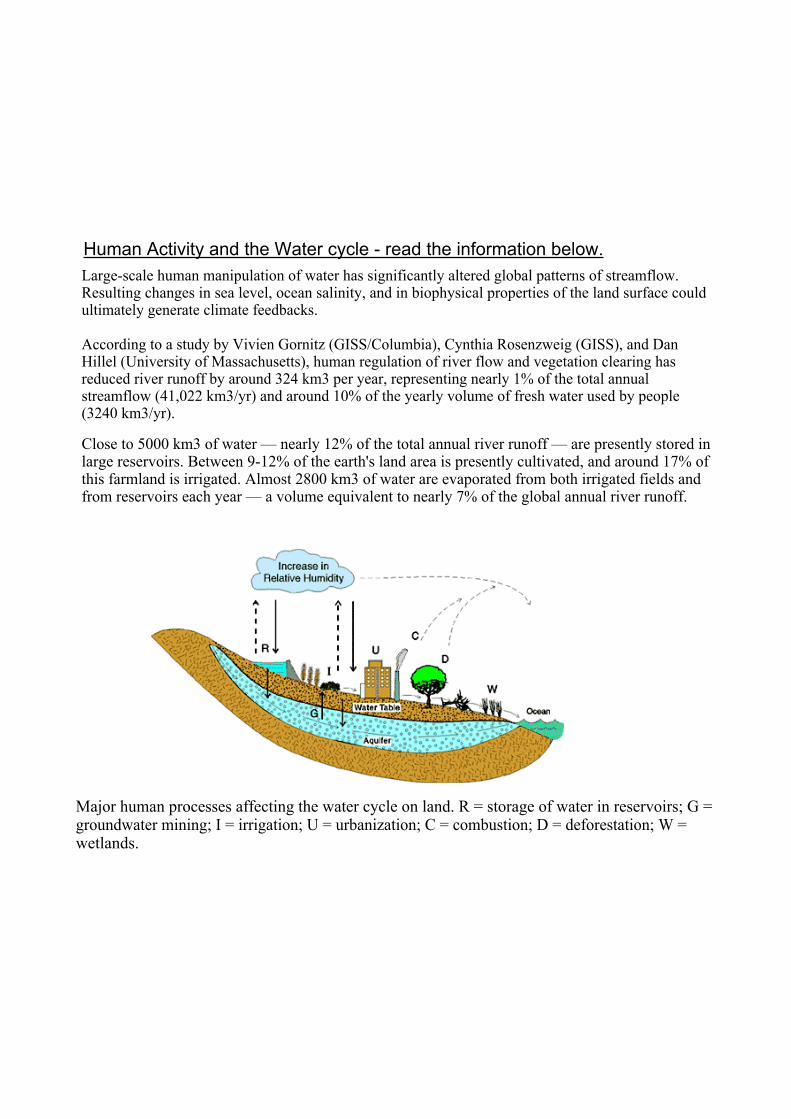
Largescale human manipulation of water has significantly altered global patterns of streamflow. Resulting changes in sea level, ocean salinity, and in biophysical properties of the land surface could ultimately generate climate feedbacks.
According to a study by Vivien Gornitz (GISS/Columbia), Cynthia Rosenzweig (GISS), and Dan Hillel (University of Massachusetts), human regulation of river flow and vegetation clearing has reduced river runoff by around 324 km3 per year, representing nearly 1% of the total annual streamflow (41,022 km3/yr) and around 10% of the yearly volume of fresh water used by people (3240 km3/yr).
Human Activity and the Water cycle read the information below.
Major human processes affecting the water cycle on land. R = storage of water in reservoirs; G = groundwater mining; I = irrigation; U = urbanization; C = combustion; D = deforestation; W = wetlands.
Close to 5000 km3 of water — nearly 12% of the total annual river runoff — are presently stored in large reservoirs. Between 912% of the earth's land area is presently cultivated, and around 17% of this farmland is irrigated. Almost 2800 km3 of water are evaporated from both irrigated fields and from reservoirs each year — a volume equivalent to nearly 7% of the global annual river runoff.

Human Activity and impacts upon the Water cycleTask 1: Cut out each diagram of how Human activity alters the water cycle.
EXT: Explain the impact of human activity on water extraction. Use appropriate terminology. Refer to specific inputs, stores, transfers and outputs.
Defore
station
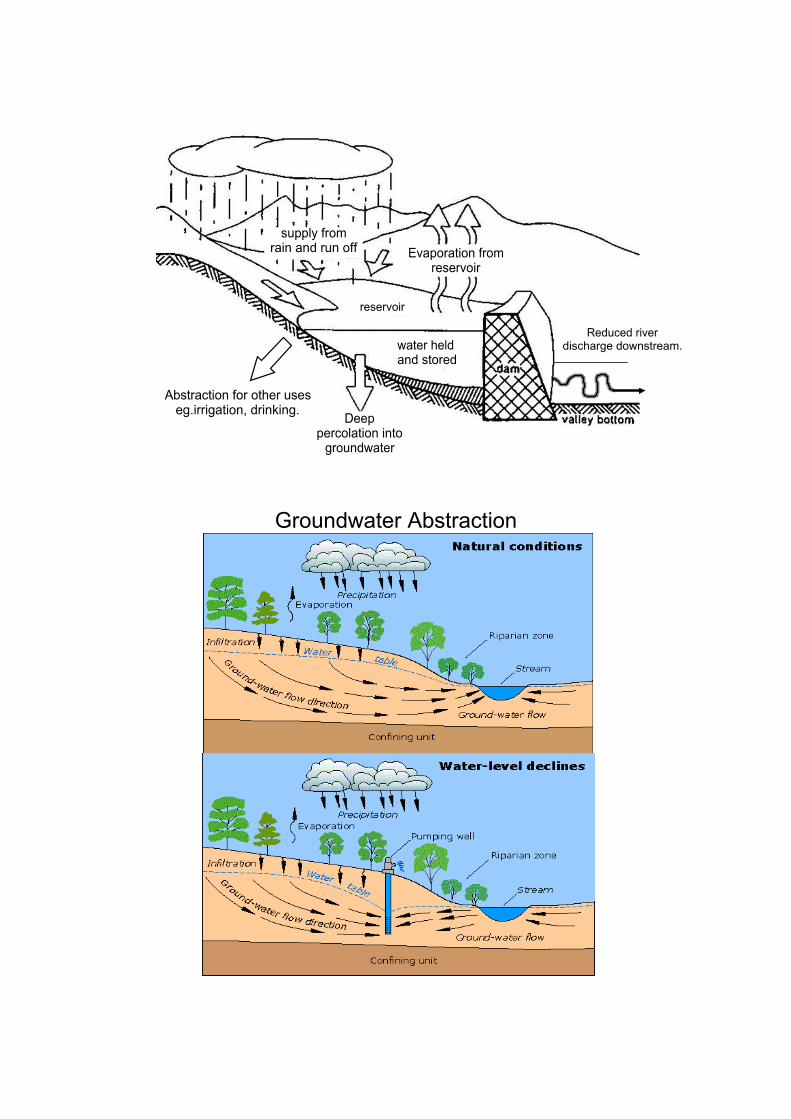
Reduced river discharge downstream.
supply from rain and run off Evaporation from
reservoir
Deep percolation into groundwater
Abstraction for other useseg.irrigation, drinking.
reservoir
water held and stored
Then cut out and stick the corresponding grid opposite/beneath the diagram.Complete the grid by stating how each element of the drainage basin cycle will be altered. Keep to brief explanations of why it may accelerate, slow down, increase, stop, alter. Not all will be applicable each time.Copies of pages 1415 in Geog for Edexcel (Oxford) will help. Diagram Grid

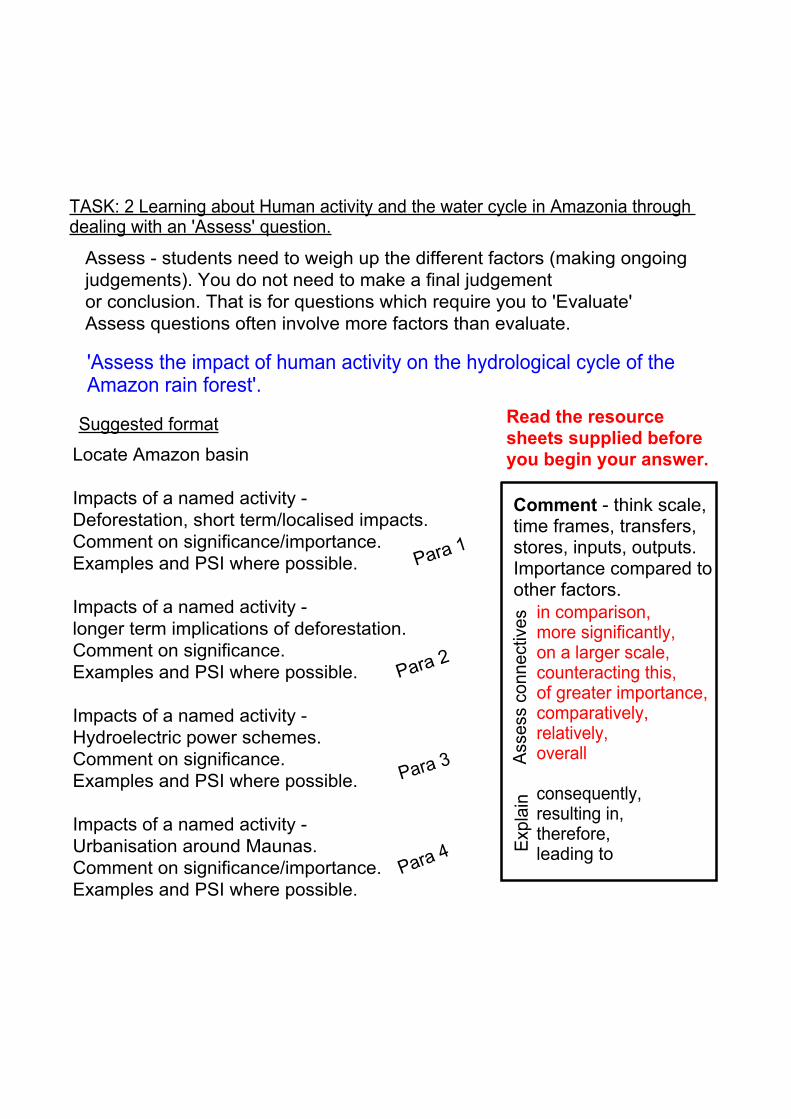
TASK: 2 Learning about Human activity and the water cycle in Amazonia through dealing with an 'Assess' question.
'Assess the impact of human activity on the hydrological cycle of the Amazon rain forest'.
Locate Amazon basin
Impacts of a named activity Deforestation, short term/localised impacts. Comment on significance/importance.Examples and PSI where possible.
Impacts of a named activity longer term implications of deforestation.Comment on significance.Examples and PSI where possible.
Impacts of a named activity Hydroelectric power schemes.Comment on significance.Examples and PSI where possible.
Impacts of a named activity Urbanisation around Maunas.Comment on significance/importance.Examples and PSI where possible.
Assess students need to weigh up the different factors (making ongoing judgements). You do not need to make a final judgementor conclusion. That is for questions which require you to 'Evaluate'Assess questions often involve more factors than evaluate.
in comparison,more significantly,on a larger scale,counteracting this,of greater importance,comparatively,relatively,overall
consequently,resulting in,therefore,leading to
Assess connectives
Explain
Comment think scale, time frames, transfers, stores, inputs, outputs.Importance compared to other factors.
Para 1
Para 2
Para 3
Para 4
Suggested format Read the resource sheets supplied before you begin your answer.

Resources

Defore
station
Changing Land use Urbanisation
InterceptiontranspirationSurface runoff
slowed infiltration
Some larger cities can trigger convectional rainfall due to rising thermals as heat is reflected from buildings and roads.
Reduced river discharge downstream.
supply from rain and run off Evaporation from
reservoir
Deep percolation into groundwater
Abstraction for other useseg.irrigation, drinking.
reservoir
water held and stored
Groundwater Abstraction


Assess question resources

Soil moisture
Soil fertility
Transpiration rates
Water/wind erosion
Biomass/carbonstore
Average Temp Normal
decreasing
Low
How is climate change
affecting forest health
and the water cycle?
Rainfall totals
TIME
high Low
high
high
Low
Remember this?
Lesson 21 Carbon, you were given an article about the increasing number of drought events in the Amazon. reread it at home.The Amazon rainforest experienced recordbreaking high temperatures and severe drought during the 201516 El Niño, according to a recent study, and the area of droughtstricken forest was 20 percent greater than other extreme El Niño events.
Longer term impacts of deforestation on the Amazon water cycle
Cattle ranching and logging drive this process But remember deforestation rates globally are
reducing.Deforestation reduces rainfall

Shorter term/localised impacts of deforestation on the water cycle in the Amazon basin.
More infiltration
Groundwater recharged
High evapotranspiration rates
More su
rface ru
noff
Less infiltration
High interception rates
High river levelsafter rainfall.
Drop in 'green water' stores. Increase in 'blue water' transfers through surface drainage and ponding.
PSI. Tocantins river discharge, AmazoniaHere we analyse a 50year long time series of discharge of a tropical river, the Tocantins River at Porto Nacional (175,360 km2), as well as precipitation over this drainage area, during a period where substantial changes in land cover occurred in the basin (1949–1998). Based on agricultural census data, we estimate that, in 1960, about 30% of the basin was used for agriculture. Previous work indicates that by 1995, agriculture had increased substantially, with about 49% of the basin land used as cropland and pastures. Initially, we compare one period with little changes in land cover (period 11949–1968) with another with more intense changes in land cover (period 21979–1998). Our analysis indicates that, while precipitation over the basin is not statistically different between period 1 and period 2 (α=0.05), annual mean discharge in period 2 is 24% greater than in period 1 (P<0.02), and the highflow season discharge is greater by 28% (P<0.01).

Consider scale
This is for the A grade pupil.
In the middle of the Amazon rainforest, there’s a creature growing.
It’s the city of Manaus. Two million people live there now, and the population is only expected to grow. The city is at one end of the Rio Negro, and a recently completed 3.5kilometer bridge will make for easier access by migrants.
This is how it works in the Amazon cities spring up around the transportation hubs. “Roads are the drivers of urbanization in the Amazon,” says John Browder, coauthor of the book Rainforest Cities and a professor at Virginia Tech University.
According to Browder, more than half the population of the Brazilian Amazon has lived in urban areas since at least the early 1990s. Much of the current migration in the Amazon is from other cities within the rainforest.
Urbanisation

At least 40 large dams are being built or planned in the Amazon, which will require smaller dams upstream to guarantee water flow. Millions of trees will be lost which by a twist of irony actually help create the rainfall that fill the rivers, that top up the reservoirs.
Brazil is in the midst of a dambuilding spree in the Amazon basin that is changing the face of the world’s largest tropical forest region. The most notable example is the massive Belo Monte Dam, the world’s fourthlargest hydroelectric project. The dam itself has already blocked the 1,000mile Xingu River, a major tributary of the Amazon. Should Brazil’s unfettered dam construction continue at the current pace, the country will essentially take all of the major freeflowing Amazon tributaries east of the Madeira River — in effect, half of the Amazon basin — and turn them into continuous chains of reservoirs.
Belo Monte damXinghu river,Para stae, Brazil
Reservoir construction