q4 & fy 2015 results
TRANSCRIPT

Q4 & FY 2015 RESULTS Capital Markets Day
Consolidated financial statements as of December 31, 2015 were authorized for issue by the Board of Directors held on February 10, 2016.
They have been audited by statutory auditors.
February 11, 2016
Q4 & FY 2015 RESULTS AT A GLANCE 1.
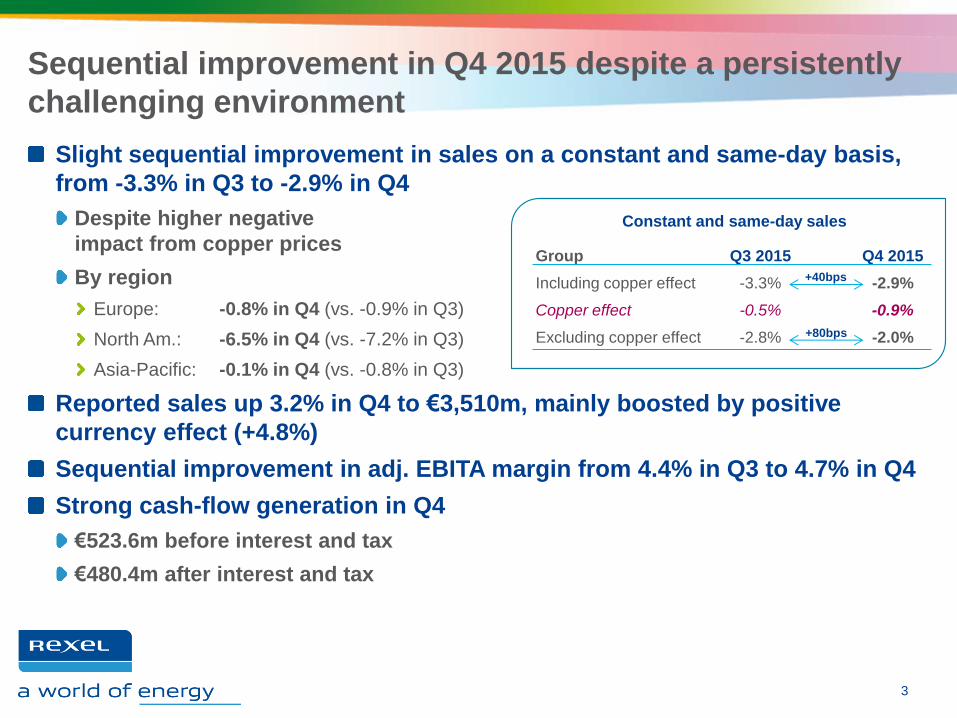
Sequential improvement in Q4 2015 despite a persistently
challenging environment
Slight sequential improvement in sales on a constant and same-day basis,
from -3.3% in Q3 to -2.9% in Q4
Despite higher negative
impact from copper prices
By region
Europe: -0.8% in Q4 (vs. -0.9% in Q3)
North Am.: -6.5% in Q4 (vs. -7.2% in Q3)
Asia-Pacific: -0.1% in Q4 (vs. -0.8% in Q3)
Reported sales up 3.2% in Q4 to €3,510m, mainly boosted by positive
currency effect (+4.8%)
Sequential improvement in adj. EBITA margin from 4.4% in Q3 to 4.7% in Q4
Strong cash-flow generation in Q4
€523.6m before interest and tax
€480.4m after interest and tax
3
Constant and same-day sales
Group
Including copper effect
Copper effect
Excluding copper effect
Q3 2015
-3.3%
-0.5%
-2.8%
Q4 2015
-2.9%
-0.9%
-2.0%
+40bps
+80bps
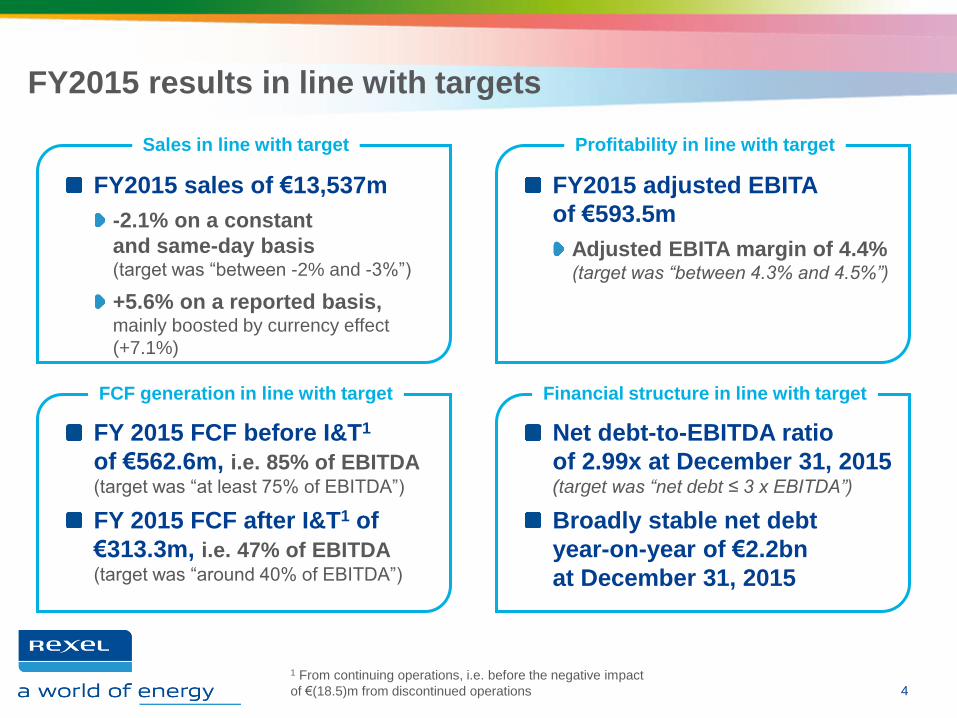
FY2015 results in line with targets
4
1 From continuing operations, i.e. before the negative impact
of €(18.5)m from discontinued operations
Sales in line with target Profitability in line with target
FCF generation in line with target Financial structure in line with target
FY2015 sales of €13,537m
-2.1% on a constant
and same-day basis (target was “between -2% and -3%”)
+5.6% on a reported basis, mainly boosted by currency effect
(+7.1%)
FY 2015 FCF before I&T1
of €562.6m, i.e. 85% of EBITDA (target was “at least 75% of EBITDA”)
FY 2015 FCF after I&T1 of
€313.3m, i.e. 47% of EBITDA (target was “around 40% of EBITDA”)
FY2015 adjusted EBITA
of €593.5m
Adjusted EBITA margin of 4.4% (target was “between 4.3% and 4.5%”)
Net debt-to-EBITDA ratio
of 2.99x at December 31, 2015 (target was “net debt ≤ 3 x EBITDA”)
Broadly stable net debt
year-on-year of €2.2bn
at December 31, 2015
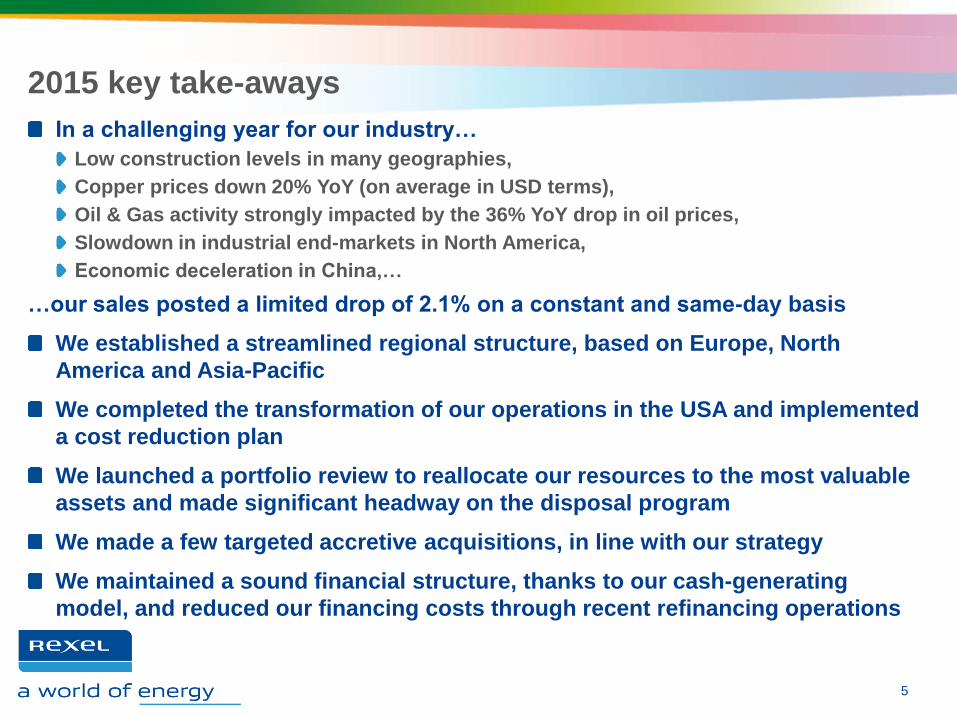
2015 key take-aways
In a challenging year for our industry…
Low construction levels in many geographies,
Copper prices down 20% YoY (on average in USD terms),
Oil & Gas activity strongly impacted by the 36% YoY drop in oil prices,
Slowdown in industrial end-markets in North America,
Economic deceleration in China,…
…our sales posted a limited drop of 2.1% on a constant and same-day basis
We established a streamlined regional structure, based on Europe, North
America and Asia-Pacific
We completed the transformation of our operations in the USA and implemented
a cost reduction plan
We launched a portfolio review to reallocate our resources to the most valuable
assets and made significant headway on the disposal program
We made a few targeted accretive acquisitions, in line with our strategy
We maintained a sound financial structure, thanks to our cash-generating
model, and reduced our financing costs through recent refinancing operations
5

RESULTS BY GEOGRAPHY 2.
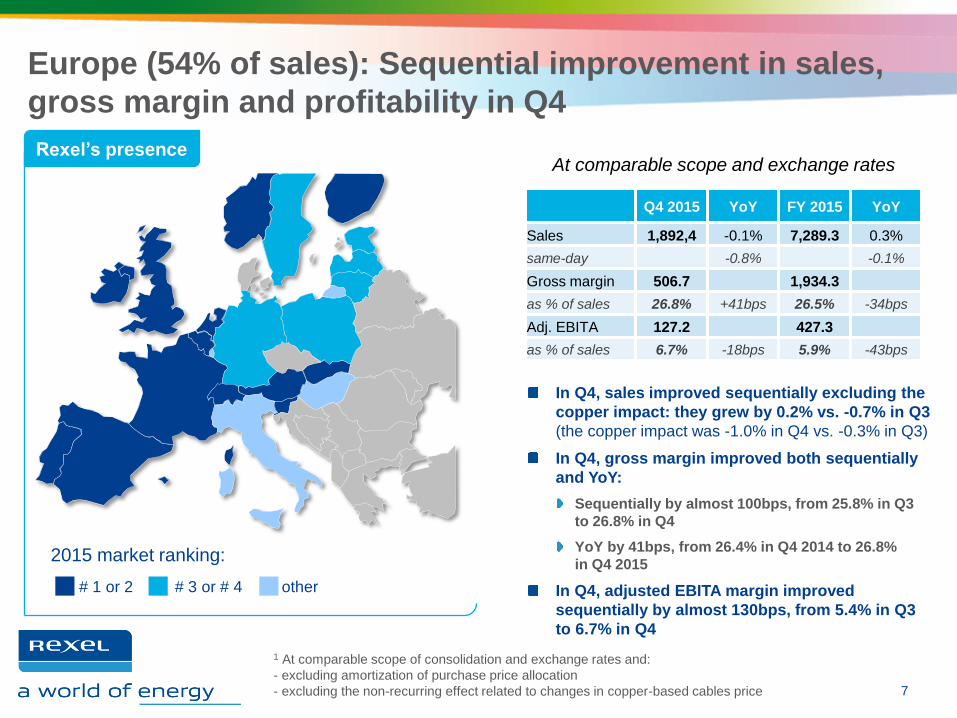
Europe (54% of sales): Sequential improvement in sales,
gross margin and profitability in Q4
7
Rexel’s presence
2015 market ranking:
# 1 or 2 # 3 or # 4 other
At comparable scope and exchange rates
1 At comparable scope of consolidation and exchange rates and:
- excluding amortization of purchase price allocation
- excluding the non-recurring effect related to changes in copper-based cables price
Q4 2015 YoY FY 2015 YoY
Sales 1,892,4 -0.1% 7,289.3 0.3%
same-day -0.8% -0.1%
Gross margin 506.7 1,934.3
as % of sales 26.8% +41bps 26.5% -34bps
Adj. EBITA 127.2 427.3
as % of sales 6.7% -18bps 5.9% -43bps
In Q4, sales improved sequentially excluding the
copper impact: they grew by 0.2% vs. -0.7% in Q3
(the copper impact was -1.0% in Q4 vs. -0.3% in Q3)
In Q4, gross margin improved both sequentially
and YoY:
Sequentially by almost 100bps, from 25.8% in Q3
to 26.8% in Q4
YoY by 41bps, from 26.4% in Q4 2014 to 26.8%
in Q4 2015
In Q4, adjusted EBITA margin improved
sequentially by almost 130bps, from 5.4% in Q3
to 6.7% in Q4

Europe (54% of sales): Sequential improvement in sales,
gross margin and profitability in Q4
Q4 sales of €1,892.4m, up 1.1% on a reported basis
Positive currency effect of €27.2m (i.e. 1.4% of last year’s sales)
Q4 sales down 0.8% on a constant and
same-day basis (after -0.9% in Q3),
impacted by a negative copper price
effect of 1.0% (vs. -0.3% in Q3)
France (32% of the region’s sales) continued to proved very resilient and improved sequentially
with sales down 1.8% (after -3.6% in Q3)
Reflecting continuing low construction levels as well as negative impact from copper prices
United Kingdom (14% of the region’s sales) returned to positive territory with 3.1% growth
Growth was driven by higher PV sales (representing 2 percentage points out of the 3.1%) and positive momentum
in other segments
Scandinavia (13% of the region’s sales) remained solid with 2.7% growth
Sweden up 6.0% and Norway up 1.7% in Q4; Finland posted a 4.2% drop, impacted by a tough macro-economic
environment
Germany (11% of the region’s sales) posted a 4.7% drop in sales
Half of the drop was attributable to lower copper prices
Other European countries (30% of the region’s sales) posted a compound drop of 1.5%
Switzerland and Belgium down 5.2% and 0.9% respectively, while Austria and Spain were up 5.8% and 4.1% respectively
8
Const. & same-day Q1 Q2 Q3 Q4
Incl. copper effect, -0.1% +1.5% -0.9% -0.8%
o/w copper effect: -0.3% +0,3% -0.3% -1.0%
= Excl. copper effect +0.2% +1.2% -0.7% +0.2%

In line with its resource reallocation program, Rexel
announced the disposal of non-strategic assets in Europe
9
On February 12, 2015, Rexel presented its disposal program aimed at reallocating
its resources to its most profitable assets
Expected impacts of the total program (based on FY2014 accounts) A reduction of c. 5% in the Group’s consolidated sales
A positive contribution of c. 20bps to the Group’s adj. EBITA margin
A moderate increase in the Group’s FCF before interest and tax
Expected completion by the end of 2016
On April 30, 2015, Rexel announced the disposal of its Latin American operations
representing c. €260m of consolidated sales, i.e. around 40% of the total program
On January 20, 2016, Rexel announced the disposal of three non-strategic assets
in Europe: Poland, Slovakia and Baltics
Combined contribution to the Group’s 2015 consolidated sales: €153m
Combined contribution to the Group’s 2015 consolidated adj. EBITA: €0.0m
To date, Rexel has already completed around 60% of the total resource
reallocation program announced on February 12, 2015
On track to achieve the resource reallocation program
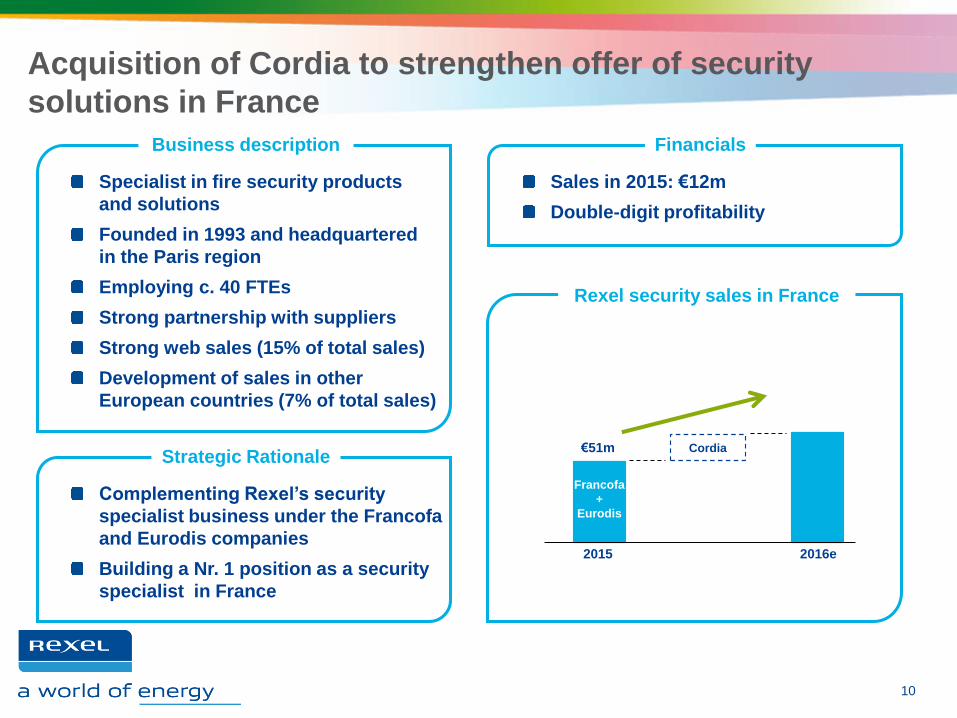
Specialist in fire security products
and solutions
Founded in 1993 and headquartered
in the Paris region
Employing c. 40 FTEs
Strong partnership with suppliers
Strong web sales (15% of total sales)
Development of sales in other
European countries (7% of total sales)
Acquisition of Cordia to strengthen offer of security
solutions in France
10
Rexel security sales in France
2015
€57m
Francofa
+
Eurodis
2016e
Cordia €51m
Business description
Sales in 2015: €12m
Double-digit profitability
Financials
Complementing Rexel’s security
specialist business under the Francofa
and Eurodis companies
Building a Nr. 1 position as a security
specialist in France
Strategic Rationale

North America (36% of sales): Sequential improvement
in sales and stable gross margin year-on-year in Q4
11
Rexel’s presence
1 At comparable scope of consolidation and exchange rates and:
- excluding amortization of purchase price allocation
- excluding the non-recurring effect related to changes in copper-based cables price
2015 market ranking:
# 1 or 2 # 3 or # 4 other
In Q4, sales improved sequentially, from -7.2%
in Q3 to -6.5% in Q4 (copper impact broadly stable
in both quarters, at -1.0% in Q4 vs. -1.1% in Q3)
In Q4, gross margin was stable YoY at 21.6%
Stable YoY in the US
Stable YoY in Canada
In Q4, profitability continued to be impacted
by low activity
Q4 2015 YoY FY 2015 YoY
Sales 1,274.6 -5.5% 4,898.1 -5.2%
same-day -6.5% -5.2%
Gross margin 275.4 1,075.2
as % of sales 21.6% Stable 22.0% +19bps
Adj. EBITA 49.4 196.6
as % of sales 3.9% -80bps 4.0% -64bps
At comparable scope and exchange rates
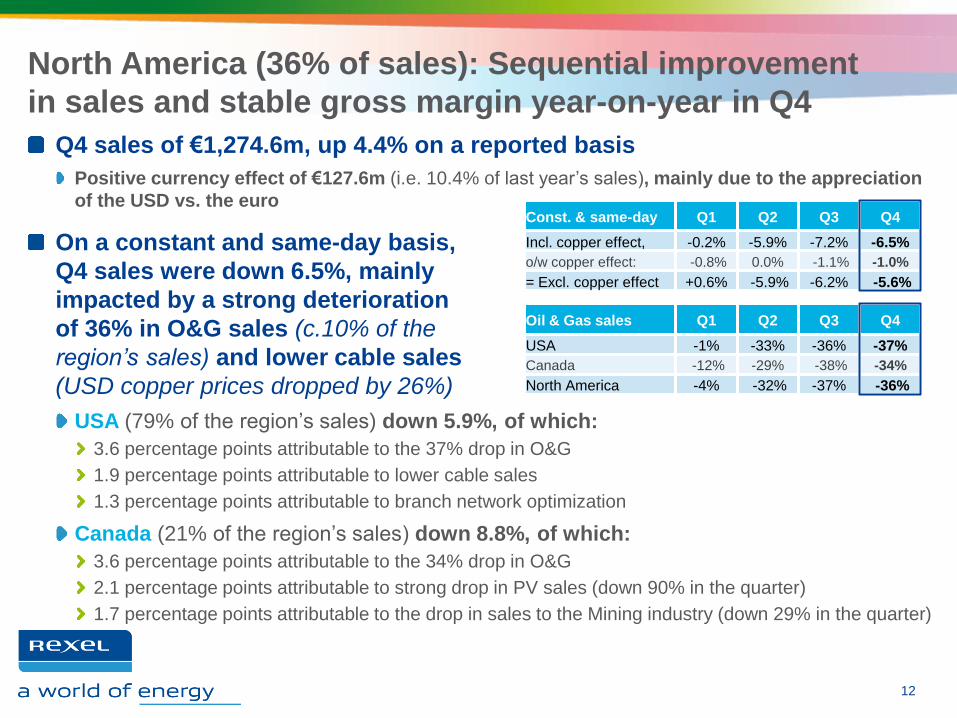
North America (36% of sales): Sequential improvement
in sales and stable gross margin year-on-year in Q4
Q4 sales of €1,274.6m, up 4.4% on a reported basis
Positive currency effect of €127.6m (i.e. 10.4% of last year’s sales), mainly due to the appreciation
of the USD vs. the euro
On a constant and same-day basis,
Q4 sales were down 6.5%, mainly
impacted by a strong deterioration
of 36% in O&G sales (c.10% of the
region’s sales) and lower cable sales
(USD copper prices dropped by 26%)
USA (79% of the region’s sales) down 5.9%, of which:
3.6 percentage points attributable to the 37% drop in O&G
1.9 percentage points attributable to lower cable sales
1.3 percentage points attributable to branch network optimization
Canada (21% of the region’s sales) down 8.8%, of which:
3.6 percentage points attributable to the 34% drop in O&G
2.1 percentage points attributable to strong drop in PV sales (down 90% in the quarter)
1.7 percentage points attributable to the drop in sales to the Mining industry (down 29% in the quarter)
12
Const. & same-day Q1 Q2 Q3 Q4
Incl. copper effect, -0.2% -5.9% -7.2% -6.5%
o/w copper effect: -0.8% 0.0% -1.1% -1.0%
= Excl. copper effect +0.6% -5.9% -6.2% -5.6%
Oil & Gas sales Q1 Q2 Q3 Q4
USA -1% -33% -36% -37%
Canada -12% -29% -38% -34%
North America -4% -32% -37% -36%

Acquisition of Brohl & Appell to strengthen Rexel’s
position in the automation and MRO segments in the US
13
Specialist in Automation and MRO
products
Exclusive distributor of Rockwell
Mostly Industrial customers (85%)
Founded in 1889 and based in Ohio
7 branches
About 60 FTEs
Brohl & Appell footprint
Business description
2015 sales: €24m (USD 26m)
Profitability above Group average
Financials
In line with strategy to strengthen
footprint in the US, reinforce
partnership with Rockwell and develop
MRO operations
In 2015, automation represented 15%
of Rexel’s sales in the US
Strategic Rationale
Ohio
14
Rexel’s presence
1 At comparable scope of consolidation and exchange rates and:
- excluding amortization of purchase price allocation
- excluding the non-recurring effect related to changes in copper-based cables price
2015 market ranking:
# 1 or 2 # 3 or # 4 other
In Q4, sales improved sequentially excluding
the copper impact: they grew by 0.1% vs.
-0.9% in Q3 (the copper impact was -0.2% in Q4
vs. +0.1% in Q3)
In Q4, gross margin slightly improved
sequentially from 16.3% to 16.5% but was still
significantly down YoY
In Q4, adjusted EBITA margin was still
impacted by low activity and cost inflation but
also by a €4.5m charge for bad debt
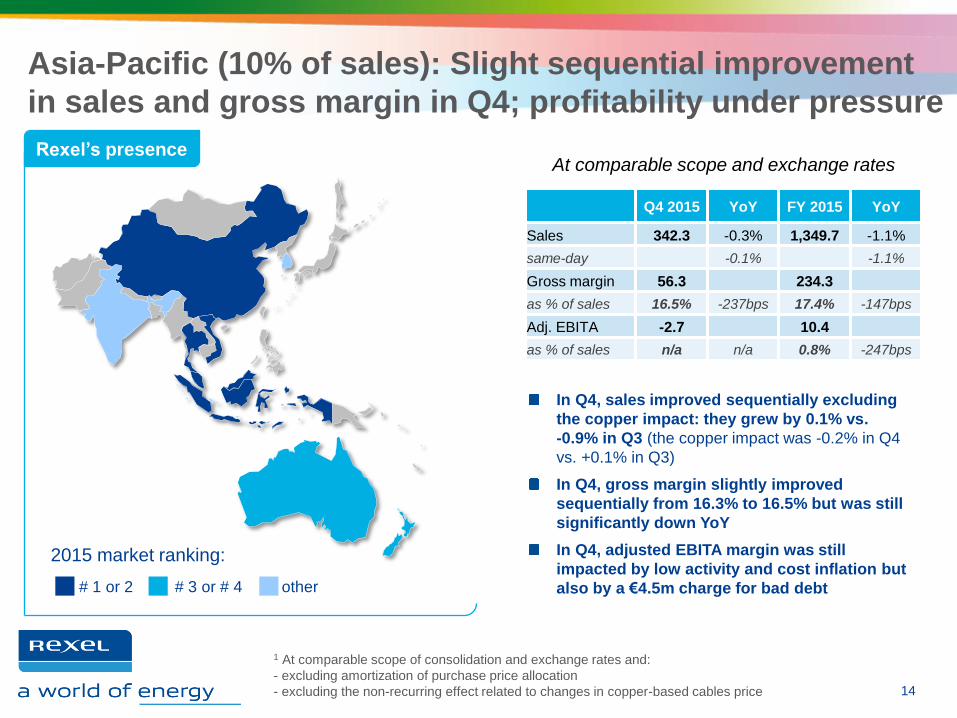
Asia-Pacific (10% of sales): Slight sequential improvement
in sales and gross margin in Q4; profitability under pressure
At comparable scope and exchange rates
Q4 2015 YoY FY 2015 YoY
Sales 342.3 -0.3% 1,349.7 -1.1%
same-day -0.1% -1.1%
Gross margin 56.3 234.3
as % of sales 16.5% -237bps 17.4% -147bps
Adj. EBITA -2.7 10.4
as % of sales n/a n/a 0.8% -247bps
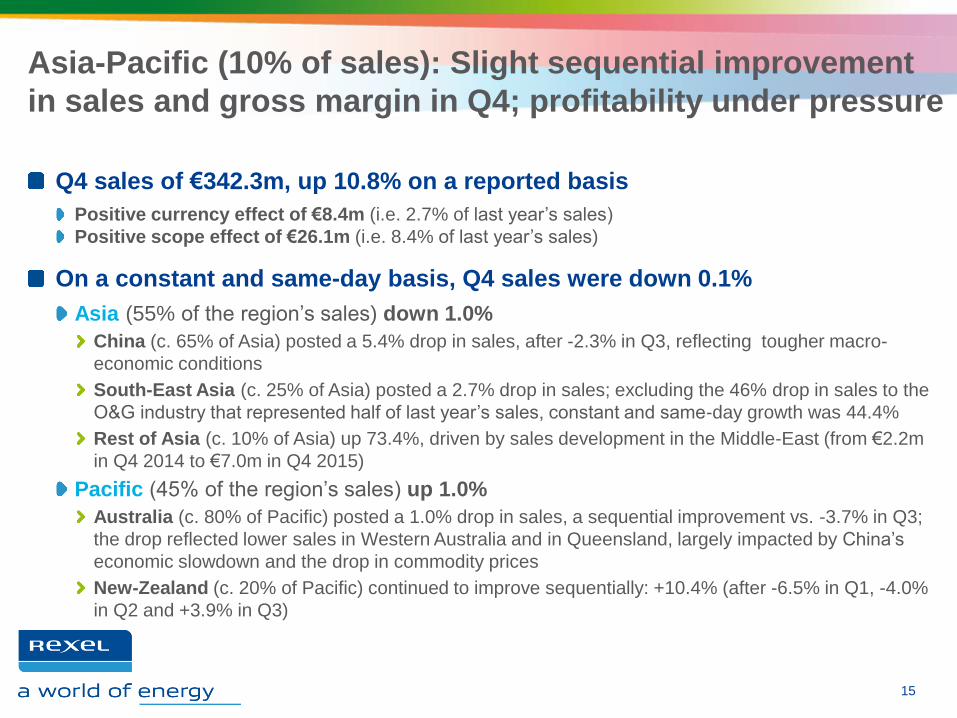
Asia-Pacific (10% of sales): Slight sequential improvement
in sales and gross margin in Q4; profitability under pressure
Q4 sales of €342.3m, up 10.8% on a reported basis
Positive currency effect of €8.4m (i.e. 2.7% of last year’s sales)
Positive scope effect of €26.1m (i.e. 8.4% of last year’s sales)
On a constant and same-day basis, Q4 sales were down 0.1%
Asia (55% of the region’s sales) down 1.0%
China (c. 65% of Asia) posted a 5.4% drop in sales, after -2.3% in Q3, reflecting tougher macro-
economic conditions
South-East Asia (c. 25% of Asia) posted a 2.7% drop in sales; excluding the 46% drop in sales to the
O&G industry that represented half of last year’s sales, constant and same-day growth was 44.4%
Rest of Asia (c. 10% of Asia) up 73.4%, driven by sales development in the Middle-East (from €2.2m
in Q4 2014 to €7.0m in Q4 2015)
Pacific (45% of the region’s sales) up 1.0%
Australia (c. 80% of Pacific) posted a 1.0% drop in sales, a sequential improvement vs. -3.7% in Q3;
the drop reflected lower sales in Western Australia and in Queensland, largely impacted by China’s
economic slowdown and the drop in commodity prices
New-Zealand (c. 20% of Pacific) continued to improve sequentially: +10.4% (after -6.5% in Q1, -4.0%
in Q2 and +3.9% in Q3)
15
FINANCIAL REVIEW 3.
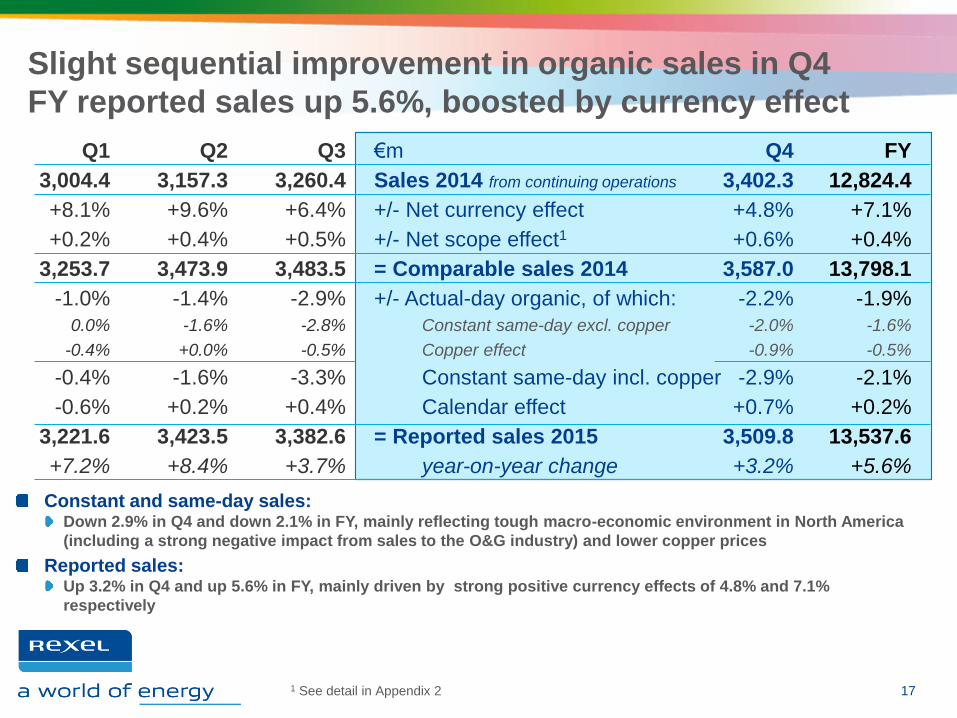
Slight sequential improvement in organic sales in Q4
FY reported sales up 5.6%, boosted by currency effect
17
Constant and same-day sales: Down 2.9% in Q4 and down 2.1% in FY, mainly reflecting tough macro-economic environment in North America
(including a strong negative impact from sales to the O&G industry) and lower copper prices
Reported sales: Up 3.2% in Q4 and up 5.6% in FY, mainly driven by strong positive currency effects of 4.8% and 7.1%
respectively
1 See detail in Appendix 2
Q1
3,004.4
+8.1%
+0.2%
3,253.7
-1.0%
0.0%
-0.4%
-0.4%
-0.6%
3,221.6
+7.2%
€m
Sales 2014 from continuing operations
+/- Net currency effect
+/- Net scope effect1
= Comparable sales 2014
+/- Actual-day organic, of which:
Constant same-day excl. copper
Copper effect
Constant same-day incl. copper
Calendar effect
= Reported sales 2015
year-on-year change
Q2
3,157.3
+9.6%
+0.4%
3,473.9
-1.4%
-1.6%
+0.0%
-1.6%
+0.2%
3,423.5
+8.4%
Q3
3,260.4
+6.4%
+0.5%
3,483.5
-2.9%
-2.8%
-0.5%
-3.3%
+0.4%
3,382.6
+3.7%
Q4
3,402.3
+4.8%
+0.6%
3,587.0
-2.2%
-2.0%
-0.9%
-2.9%
+0.7%
3,509.8
+3.2%
FY
12,824.4
+7.1%
+0.4%
13,798.1
-1.9%
-1.6%
-0.5%
-2.1%
+0.2%
13,537.6
+5.6%

Q4 2015
GM improvement in Europe, both sequentially
and YoY
Sequential improvement in opex as % of sales in Europe Adj. EBITA margin at 4.7%
of sales:
Up 31bps vs. Q3 2015, driven by strong sequential improvement in Europe
Down 57bps YoY, mainly impacted by Asia-Pacific
Stable GM in North America YoY
Opex down €2.5m YoY in North America, but up as % of
sales due to low activity
Slight sequential improvement in GM in Asia-Pacific, but still
significantly down YoY
Asia-Pacific impacted by cost inflation and low activity
Sequential improvement in adj. EBITA margin in Q4 at 4.7%
FY adj. EBITA margin at 4.4%, in line with target
18
5.9%
-43bps
4.0%
-64bps
0.8%
-247bps
n/a
4.4%
-23bps
at Group level
-22bps
at Group level
-24bps
at Group level
Europe
change yoy
North America
change yoy
Asia-Pacific
change yoy
Other
Change yoy
Group
Change yoy
26.5%
-34bps
22.0%
+19bps
17.4%
-147bps
24.0%
-18bps
at Group level
+12bps
at Group level
-14bps
at Group level
(20.7)%
-9bps
(17.9)%
-83bps
(16.6)%
-100bps
n/a
(19.6)%
-5bps
at Group level
-34bps
at Group level
-10bps
at Group level
+4ps
at Group level
+4bps
at Group level
FY 2015 Gross margin: €3,244.3m Opex (incl. depr.): €(2,650.8)m Adj. EBITA margin: €593.5m
-20bps -45bps -65bps
1 At comparable scope of consolidation and exchange rates and:
- excluding amortization of purchase price allocation
- excluding the non-recurring effect related to changes in copper-based cables price
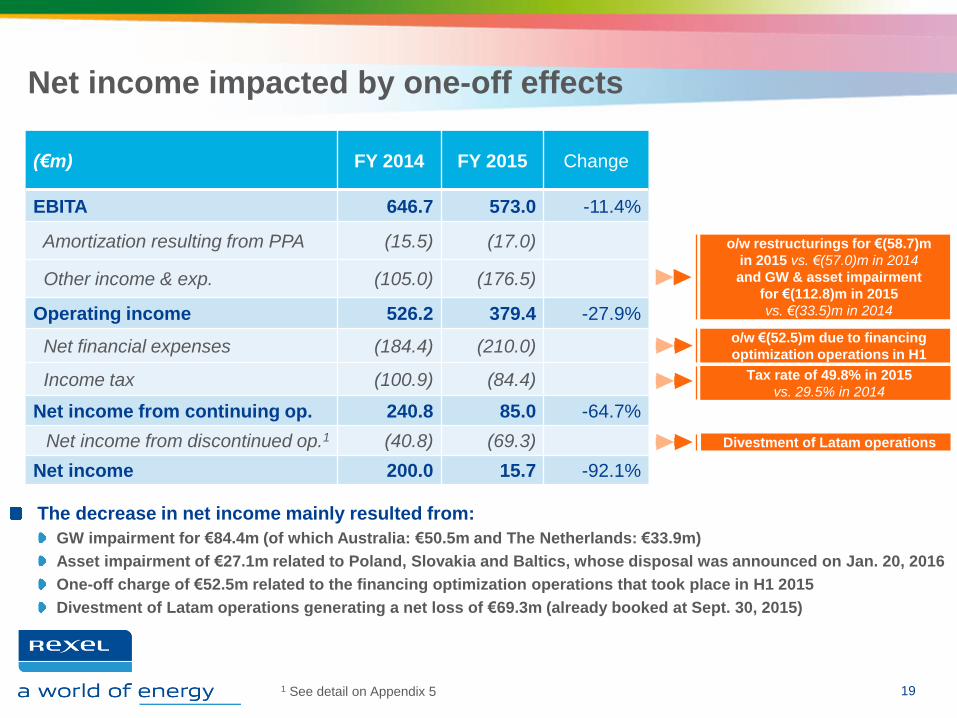
Net income impacted by one-off effects
19
(€m) FY 2014 FY 2015 Change
EBITA 646.7 573.0 -11.4%
Amortization resulting from PPA (15.5) (17.0)
Other income & exp. (105.0) (176.5)
Operating income 526.2 379.4 -27.9%
Net financial expenses (184.4) (210.0)
Income tax (100.9) (84.4)
Net income from continuing op. 240.8 85.0 -64.7%
Net income from discontinued op.1 (40.8) (69.3)
Net income 200.0 15.7 -92.1%
The decrease in net income mainly resulted from:
GW impairment for €84.4m (of which Australia: €50.5m and The Netherlands: €33.9m)
Asset impairment of €27.1m related to Poland, Slovakia and Baltics, whose disposal was announced on Jan. 20, 2016
One-off charge of €52.5m related to the financing optimization operations that took place in H1 2015
Divestment of Latam operations generating a net loss of €69.3m (already booked at Sept. 30, 2015)
o/w restructurings for €(58.7)m
in 2015 vs. €(57.0)m in 2014
and GW & asset impairment
for €(112.8)m in 2015
vs. €(33.5)m in 2014
Tax rate of 49.8% in 2015
vs. 29.5% in 2014
o/w €(52.5)m due to financing
optimization operations in H1
Divestment of Latam operations
1 See detail on Appendix 5
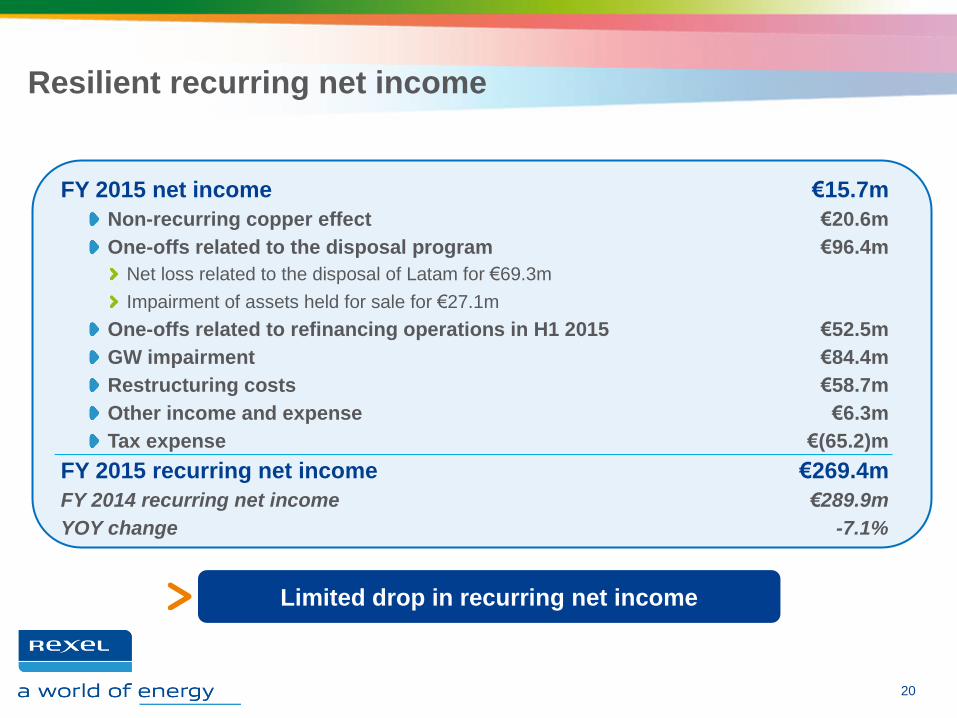
Resilient recurring net income
20
FY 2015 net income €15.7m
Non-recurring copper effect €20.6m
One-offs related to the disposal program €96.4m
Net loss related to the disposal of Latam for €69.3m
Impairment of assets held for sale for €27.1m
One-offs related to refinancing operations in H1 2015 €52.5m
GW impairment €84.4m
Restructuring costs €58.7m
Other income and expense €6.3m
Tax expense €(65.2)m
FY 2015 recurring net income €269.4m
FY 2014 recurring net income €289.9m
YOY change -7.1%
Limited drop in recurring net income
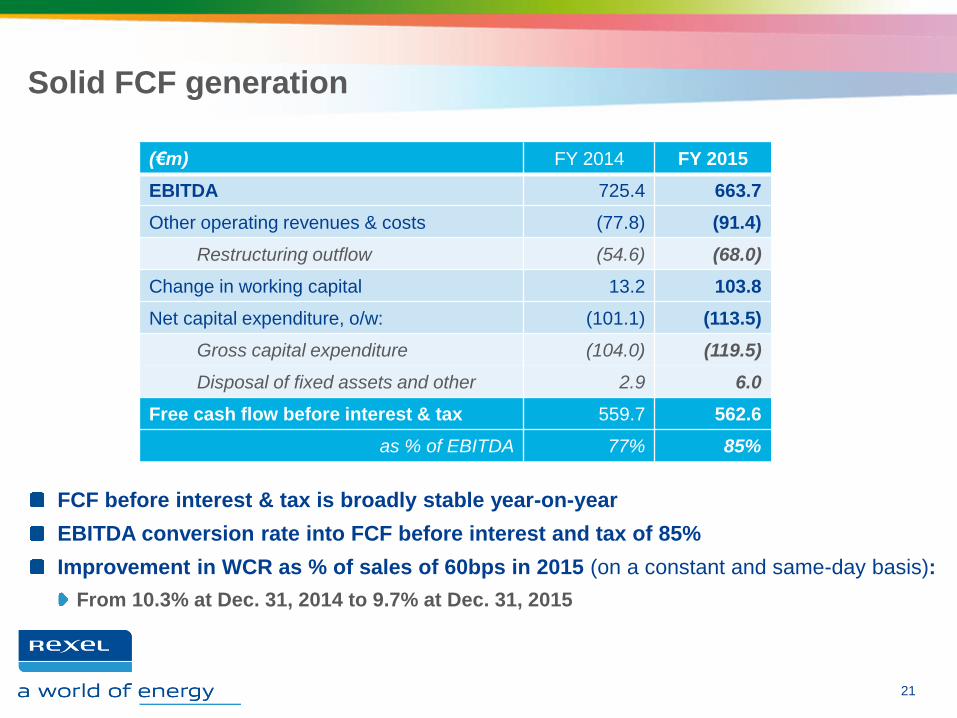
(€m) FY 2014 FY 2015
EBITDA 725.4 663.7
Other operating revenues & costs (77.8) (91.4)
Restructuring outflow (54.6) (68.0)
Change in working capital 13.2 103.8
Net capital expenditure, o/w: (101.1) (113.5)
Gross capital expenditure (104.0) (119.5)
Disposal of fixed assets and other 2.9 6.0
Free cash flow before interest & tax 559.7 562.6
as % of EBITDA 77% 85%
Solid FCF generation
FCF before interest & tax is broadly stable year-on-year
EBITDA conversion rate into FCF before interest and tax of 85%
Improvement in WCR as % of sales of 60bps in 2015 (on a constant and same-day basis):
From 10.3% at Dec. 31, 2014 to 9.7% at Dec. 31, 2015
21

Broadly stable net debt year-on-year
22
(€m) FY 2014 FY 2015
Free cash flow before interest & tax 559.7 562.6
Net interest paid (152.6) (141.0)
Income tax paid (83.7) (108.4)
Free cash flow after interest & tax 323.4 313.3
as % of EBITDA 45% 47%
Net financial investment (43.0) (27.3)
Dividend paid (65.6) (91.3)
Other (100.1) (49.6)
Net debt variation before currency 114.7 145.1
Currency change (135.8) (130.7)
Net debt variation after currency (21.1) 14.4
Debt at the beginning of the period 2,192.0 2,213.1
Debt at the end of the period 2,213.1 2,198.7
Net-debt-to-EBITDA ratio at 2.99x at year-end,
in line with target of below 3 times

Sound financial structure
Breakdown of net debt at December 31, 2015: €2,198.7m
Senior unsecured notes €1,637.1m
USD Bond issued April 2013 (maturity: June 2020) @ 5.250% €463.8m
EUR Bond issued April 2013 (maturity: June 2020) @ 5.125% €669.7m
EUR Bond issued May 2015 (maturity: June 2022) @ 3.250% €503.8m
Senior Credit Agreement (SCA) undrawn
€1.0bn facility (maturity: Nov. 2020 +1 year)
Securitization (4 programs for a compound commitment of €1.4bn) €1,089.4m
Commercial paper €134.6m
Other debt & cash €(662.4)m
Strong financial flexibility, with €1.6bn of cash and undrawn facilities at Dec. 31
Average maturity of c. 4 years
No significant repayment before June 2020
Cost of financing reduced by 100bps in 2015 vs. 2014
Average effective interest rate of 3.9% on gross debt in 2015 (vs. 4.9% in 2014)
23

24
Proposed dividend of €0.40 per share payable in cash
Rexel will propose to shareholders a dividend of €0.40 per share, entirely
payable in cash, subject to approval at the Annual Meeting to be held on
May, 25
Pay-out of 45% of 2015 recurring net income, in line with policy of paying out
at least 40% of recurring net income
Yield of 4.1%, on the basis of the February 10, 2016 closing share price
Dividend consistent with cash allocation policy
1 Calculation on Appendix
2011 2012 2013 2014 2015
Dividend per share (€) 0.65 0.75 0.75 0.75 0.40
Net income (€m) 319.0 318.6 211.0 200.0 15.7
Recurring net income1 (€m) 374.6 386.7 328.1 289.9 269.4
Pay-out ratio as % of recurring net income 46% 53% 64% 75% 45%

OUTLOOK 4.
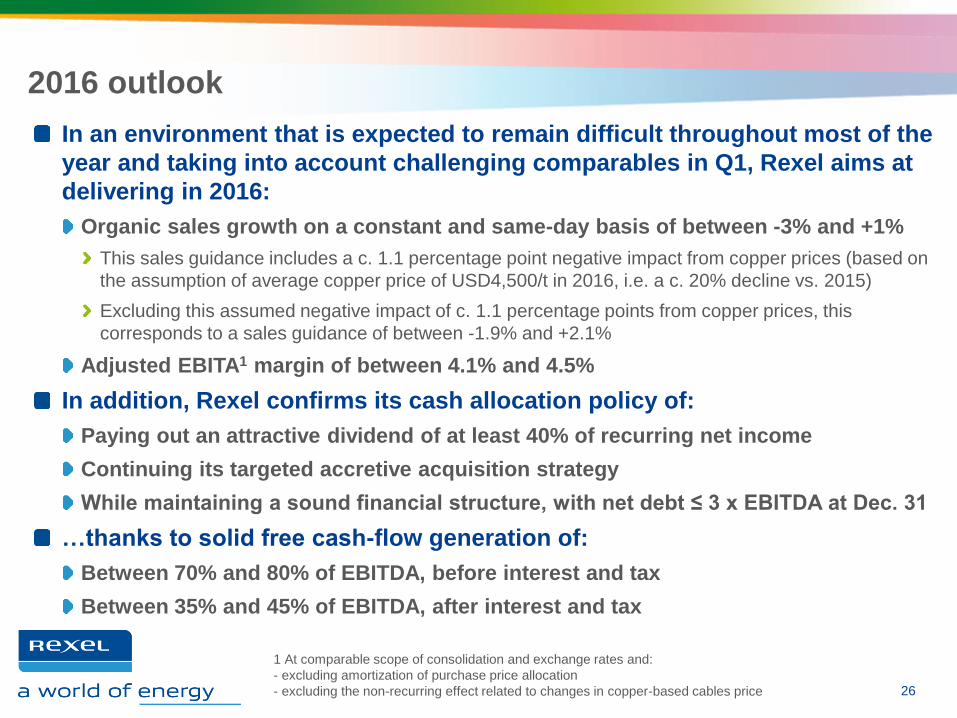
2016 outlook
1 At comparable scope of consolidation and exchange rates and:
- excluding amortization of purchase price allocation
- excluding the non-recurring effect related to changes in copper-based cables price
26
In an environment that is expected to remain difficult throughout most of the
year and taking into account challenging comparables in Q1, Rexel aims at
delivering in 2016:
Organic sales growth on a constant and same-day basis of between -3% and +1%
This sales guidance includes a c. 1.1 percentage point negative impact from copper prices (based on
the assumption of average copper price of USD4,500/t in 2016, i.e. a c. 20% decline vs. 2015)
Excluding this assumed negative impact of c. 1.1 percentage points from copper prices, this
corresponds to a sales guidance of between -1.9% and +2.1%
Adjusted EBITA1 margin of between 4.1% and 4.5%
In addition, Rexel confirms its cash allocation policy of:
Paying out an attractive dividend of at least 40% of recurring net income
Continuing its targeted accretive acquisition strategy
While maintaining a sound financial structure, with net debt ≤ 3 x EBITDA at Dec. 31
…thanks to solid free cash-flow generation of:
Between 70% and 80% of EBITDA, before interest and tax
Between 35% and 45% of EBITDA, after interest and tax

2020 financial ambitions
1 At comparable scope of consolidation and exchange rates and:
- excluding amortization of purchase price allocation
- excluding the non-recurring effect related to changes in copper-based cables price
27
At its Capital Market Day to be held today in Paris, Rexel will present its long-term
strategy and financial ambitions
Even assuming a challenging environment throughout most of 2016 and taking into
account the cautious guidance for 2016, Rexel aims at achieving on average over the
next five years the following financial targets:
Organic sales outperforming the market, with annual growth of between 1% and 2% on a constant
and same-day basis
Annual adjusted EBITA1 growth of at least twice the pace of organic sales growth
Conversion rates of EBITDA into free cash flow of:
Between 70% and 80%, before interest and tax
Between 35% and 45%, after interest and tax
These financial ambitions are conditional upon an economic recovery materializing
over the five-year period
On top of organic growth, Rexel will continue its targeted accretive acquisition
strategy, in line with its cash allocation policy
Rexel 2016-2020: a roadmap for profitable growth
APPENDICES

Appendix 1:
Segment reporting - Constant and adjusted basis
Group
Constant and adjusted = at comparable scope of consolidation and exchange rates, excluding the non-
recurring effect related to changes in copper-based cables price and before amortization of purchase
price allocation; the non-recurring effect related to changes in copper-based cables price was, at the
EBITA level:
• a profit of €0.6 million in Q4 2014 and a loss of €7.0 million in Q4 2015,
• a loss of €3.3 million in FY 2014 and a loss of €20.6 million in FY 2015.
29
Constant and adjusted basis (€m) Q4 2014 Q4 2015 Change FY 2014 FY 2015 Change
Sales 3,587.0 3,509.8 -2.2% 13,798.1 13,537.6 -1.9%
on a constant basis and same days -2.9% -2.1%
Gross profit 855.9 839.0 -2.0% 3,334.5 3,244.3 -2.7%
as a % of sales 23.9% 23.9% 4 bps 24.2% 24.0% -20 bps
Distribution & adm. expenses (incl. depreciation) (667.0) (674.2) +1.1% (2,638.8) (2,650.8) +0.5%
EBITA 188.8 164.8 -12.7% 695.7 593.5 -14.7%
as a % of sales 5.3% 4.7% -57 bps 5.0% 4.4% -65 bps
Headcount (end of period) 28,497 27,703 -2.8%
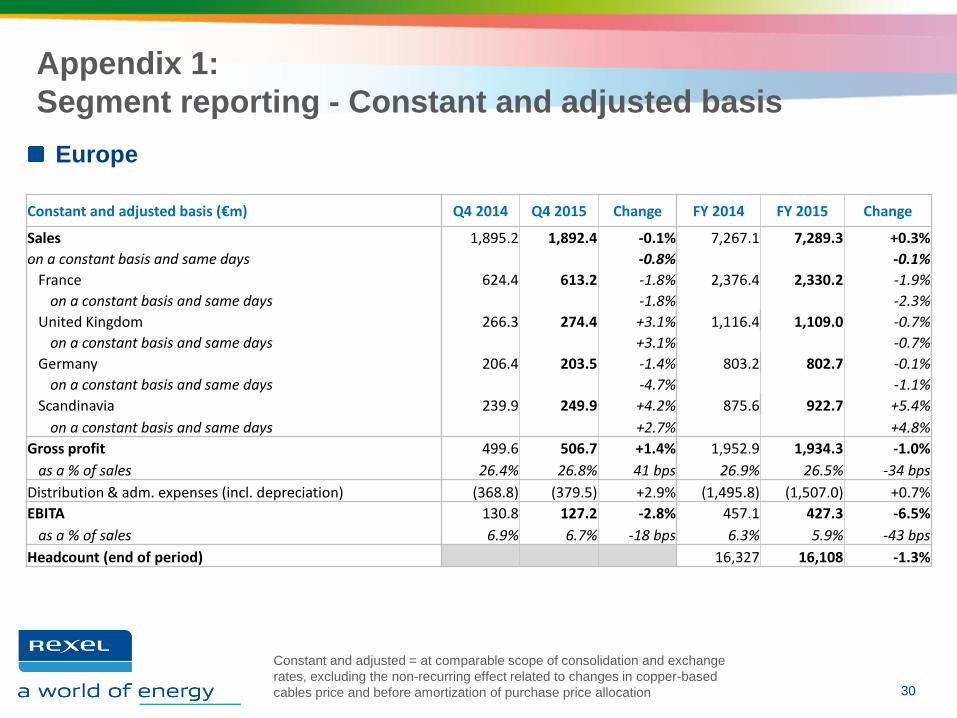
Appendix 1:
Segment reporting - Constant and adjusted basis
Europe
Constant and adjusted = at comparable scope of consolidation and exchange
rates, excluding the non-recurring effect related to changes in copper-based
cables price and before amortization of purchase price allocation 30
Constant and adjusted basis (€m) Q4 2014 Q4 2015 Change FY 2014 FY 2015 Change
Sales 1,895.2 1,892.4 -0.1% 7,267.1 7,289.3 +0.3%
on a constant basis and same days -0.8% -0.1%
France 624.4 613.2 -1.8% 2,376.4 2,330.2 -1.9%
on a constant basis and same days -1.8% -2.3%
United Kingdom 266.3 274.4 +3.1% 1,116.4 1,109.0 -0.7%
on a constant basis and same days +3.1% -0.7%
Germany 206.4 203.5 -1.4% 803.2 802.7 -0.1%
on a constant basis and same days -4.7% -1.1%
Scandinavia 239.9 249.9 +4.2% 875.6 922.7 +5.4%
on a constant basis and same days +2.7% +4.8%
Gross profit 499.6 506.7 +1.4% 1,952.9 1,934.3 -1.0%
as a % of sales 26.4% 26.8% 41 bps 26.9% 26.5% -34 bps
Distribution & adm. expenses (incl. depreciation) (368.8) (379.5) +2.9% (1,495.8) (1,507.0) +0.7%
EBITA 130.8 127.2 -2.8% 457.1 427.3 -6.5%
as a % of sales 6.9% 6.7% -18 bps 6.3% 5.9% -43 bps
Headcount (end of period) 16,327 16,108 -1.3%

Appendix 1:
Segment reporting - Constant and adjusted basis
North America
Constant and adjusted = at comparable scope of consolidation and exchange rates, excluding the non-recurring
effect related to changes in copper-based cables price and before amortization of purchase price allocation
31
Constant and adjusted basis (€m) Q4 2014 Q4 2015 Change FY 2014 FY 2015 Change
Sales 1,348.3 1,274.6 -5.5% 5,165.4 4,898.1 -5.2%
on a constant basis and same days -6.5% -5.2%
United States 1,050.8 1,003.2 -4.5% 3,963.9 3,799.1 -4.2%
on a constant basis and same days -5.9% -4.2%
Canada 297.5 271.4 -8.8% 1,201.6 1,099.0 -8.5%
on a constant basis and same days -8.8% -8.5%
Gross profit 291.5 275.4 -5.5% 1,124.1 1,075.2 -4.4%
as a % of sales 21.6% 21.6% stable 21.8% 22.0% 19 bps
Distribution & adm. expenses (incl. depreciation) (228.6) (226.1) -1.1% (883.9) (878.6) -0.6%
EBITA 62.9 49.4 -21.6% 240.3 196.6 -18.2%
as a % of sales 4.7% 3.9% -80 bps 4.7% 4.0% -64 bps
Headcount (end of period) 8,619 8,202 -4.8%
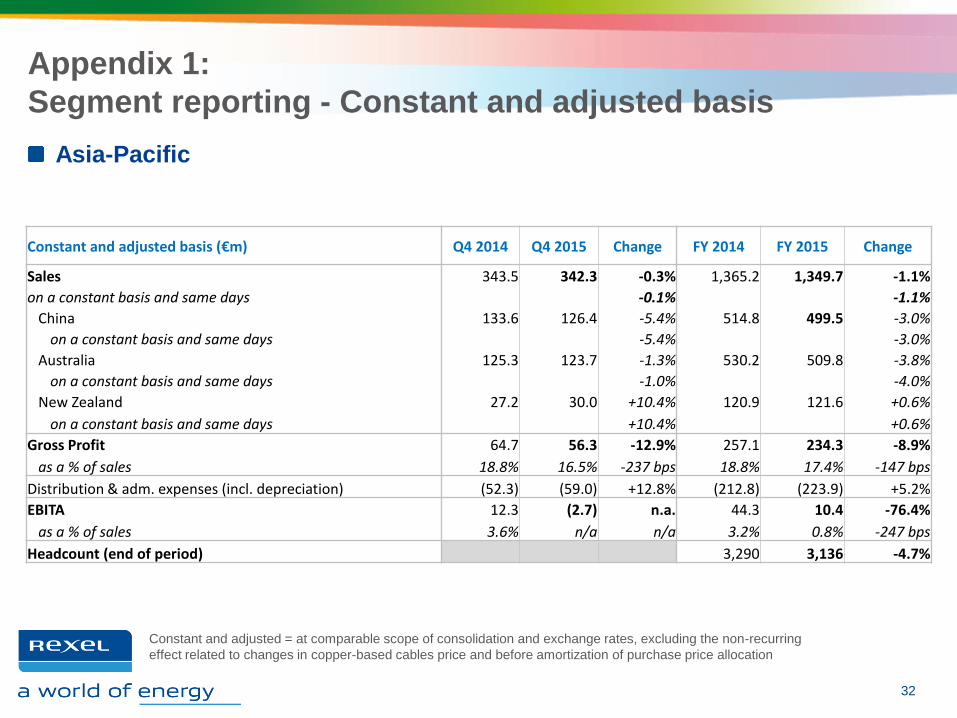
Appendix 1:
Segment reporting - Constant and adjusted basis
Asia-Pacific
Constant and adjusted = at comparable scope of consolidation and exchange rates, excluding the non-recurring
effect related to changes in copper-based cables price and before amortization of purchase price allocation
32
Constant and adjusted basis (€m) Q4 2014 Q4 2015 Change FY 2014 FY 2015 Change
Sales 343.5 342.3 -0.3% 1,365.2 1,349.7 -1.1%
on a constant basis and same days -0.1% -1.1%
China 133.6 126.4 -5.4% 514.8 499.5 -3.0%
on a constant basis and same days -5.4% -3.0%
Australia 125.3 123.7 -1.3% 530.2 509.8 -3.8%
on a constant basis and same days -1.0% -4.0%
New Zealand 27.2 30.0 +10.4% 120.9 121.6 +0.6%
on a constant basis and same days +10.4% +0.6%
Gross Profit 64.7 56.3 -12.9% 257.1 234.3 -8.9%
as a % of sales 18.8% 16.5% -237 bps 18.8% 17.4% -147 bps
Distribution & adm. expenses (incl. depreciation) (52.3) (59.0) +12.8% (212.8) (223.9) +5.2%
EBITA 12.3 (2.7) n.a. 44.3 10.4 -76.4%
as a % of sales 3.6% n/a n/a 3.2% 0.8% -247 bps
Headcount (end of period) 3,290 3,136 -4.7%

Appendix 2:
Consolidated Income Statement
33
Reported basis (€m) Q4 2014 Q4 2015 Change FY 2014 FY 2015 Change
Sales 3,402.3 3,509.8 3.2% 12,824.3 13,537.6 5.6%
Gross profit 817.8 831.5 1.7% 3,118.5 3,222.6 3.3%
as a % of sales 24.0% 23.7% 24.3% 23.8%
Distribution & adm. expenses (excl. depreciation) (617.1) (649.5) 5.2% (2,393.2) (2,558.9) 6.9%
EBITDA 200.7 182.1 -9.3% 725.4 663.7 -8.5%
as a % of sales 5.9% 5.2% 5.7% 4.9%
Depreciation (19.8) (24.3) (78.7) (90.7)
EBITA 180.8 157.7 -12.8% 646.7 573.0 -11.4%
as a % of sales 5.3% 4.5% 5.0% 4.2%
Amortization of intangibles resulting from purchase price allocation (4.1) (4.2) (15.5) (17.0)
Operating income bef. other inc. and exp. 176.7 153.5 -13.1% 631.1 555.9 -11.9%
as a % of sales 5.2% 4.4% 4.9% 4.1%
Other income and expenses (56.8) (101.3) (105.0) (176.5)
Operating income 120.1 52.2 -56.5% 526.2 379.4 -27.9%
Financial expenses (net) (48.9) (32.5) (184.4) (210.0)
Net income (loss) before income tax 71.2 19.7 -72.3% 341.8 169.4 -50.4%
Income tax (18.7) (25.4) (100.9) (84.4)
Net income (loss) from continuing operations 52.5 (5.7) n.a. 240.8 85.0 -64.7%
Net income (loss) from discontinued operations (10.1) 0.0 (40.8) (69.3)
Net income (loss) 42.5 (5.7) n.a. 200.0 15.7 -92.1%
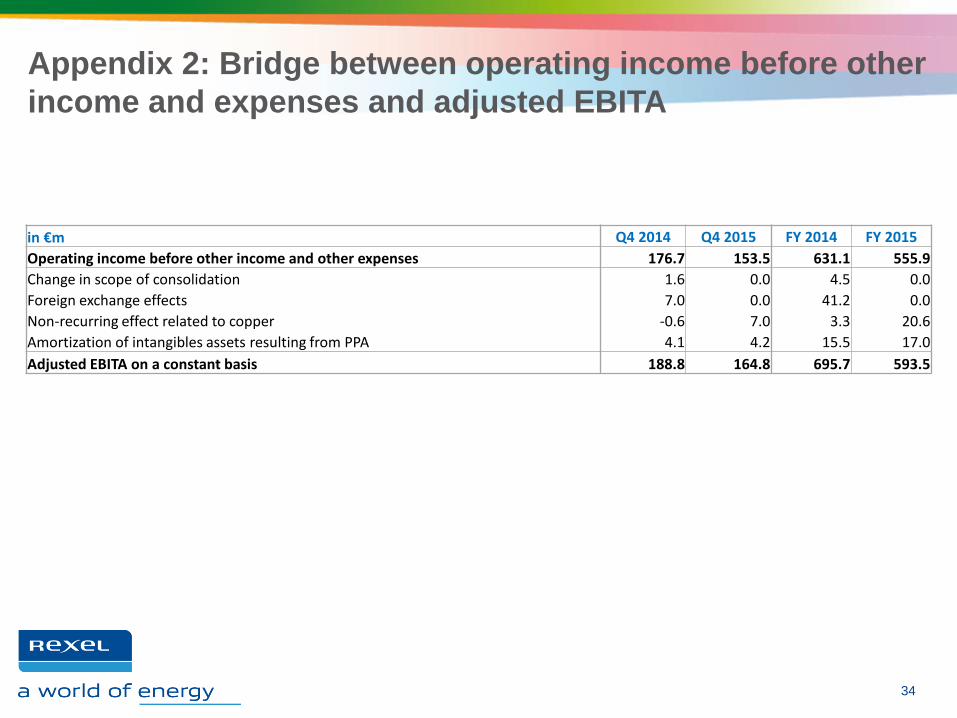
Appendix 2: Bridge between operating income before other
income and expenses and adjusted EBITA
34
in €m Q4 2014 Q4 2015 FY 2014 FY 2015
Operating income before other income and other expenses 176.7 153.5 631.1 555.9
Change in scope of consolidation 1.6 0.0 4.5 0.0
Foreign exchange effects 7.0 0.0 41.2 0.0
Non-recurring effect related to copper -0.6 7.0 3.3 20.6
Amortization of intangibles assets resulting from PPA 4.1 4.2 15.5 17.0
Adjusted EBITA on a constant basis 188.8 164.8 695.7 593.5
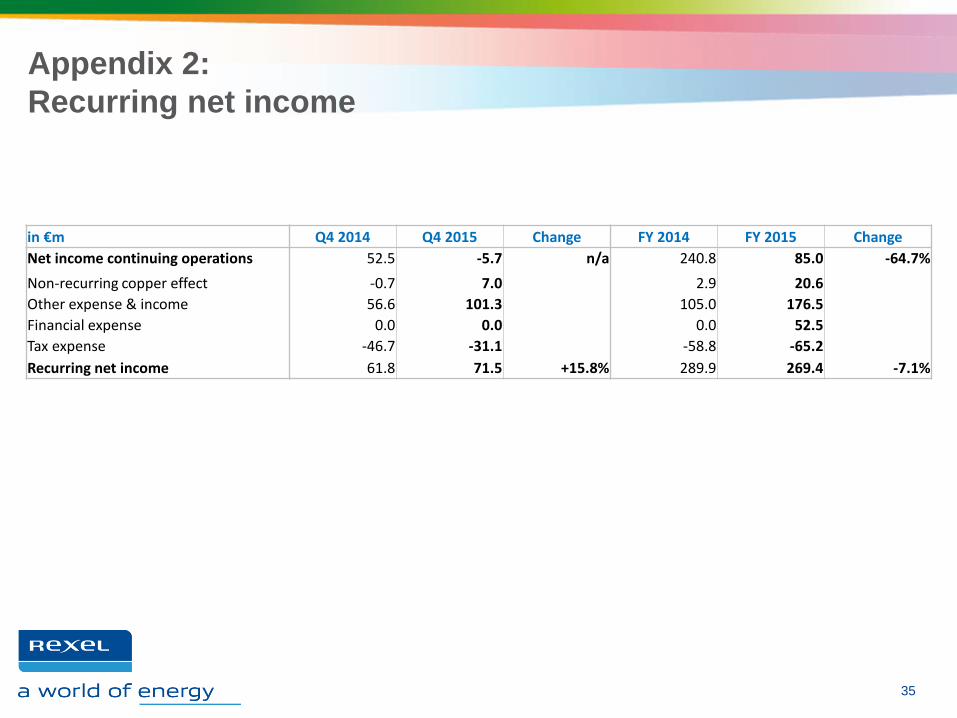
Appendix 2:
Recurring net income
35
in €m Q4 2014 Q4 2015 Change FY 2014 FY 2015 Change
Net income continuing operations 52.5 -5.7 n/a 240.8 85.0 -64.7%
Non-recurring copper effect -0.7 7.0 2.9 20.6
Other expense & income 56.6 101.3 105.0 176.5
Financial expense 0.0 0.0 0.0 52.5
Tax expense -46.7 -31.1 -58.8 -65.2
Recurring net income 61.8 71.5 +15.8% 289.9 269.4 -7.1%

Appendix 2: Sales and profitability by segment - Reported
basis
36
Reported basis (€m) Q4 2014 Q4 2015 Change FY 2014 FY 2015 Change
Sales 3,402.3 3,509.8 +3.2% 12,824.3 13,537.6 +5.6%
Europe 1,872.6 1,892.4 +1.1% 7,145.2 7,289.3 +2.0%
North America 1,220.7 1,274.6 +4.4% 4,477.9 4,898.1 +9.4%
Asia-Pacific 308.9 342.3 +10.8% 1,200.9 1,349.7 +12.4%
Gross profit 817.8 831.5 +1.7% 3,118.5 3,222.6 +3.3%
Europe 495.9 502.7 +1.4% 1,919.7 1,921.7 +0.1%
North America 262.0 272.0 +3.8% 966.7 1,066.0 +10.3%
Asia-Pacific 59.9 56.3 -5.9% 231.8 234.3 +1.1%
EBITA 180.8 157.7 -12.8% 646.7 573.0 -11.4%
Europe 131.9 123.3 -6.5% 452.9 415.0 -8.4%
North America 56.0 46.2 -17.5% 204.0 188.3 -7.7%
Asia-Pacific 10.2 -2.7 n.a. 35.8 10.4 -70.8%
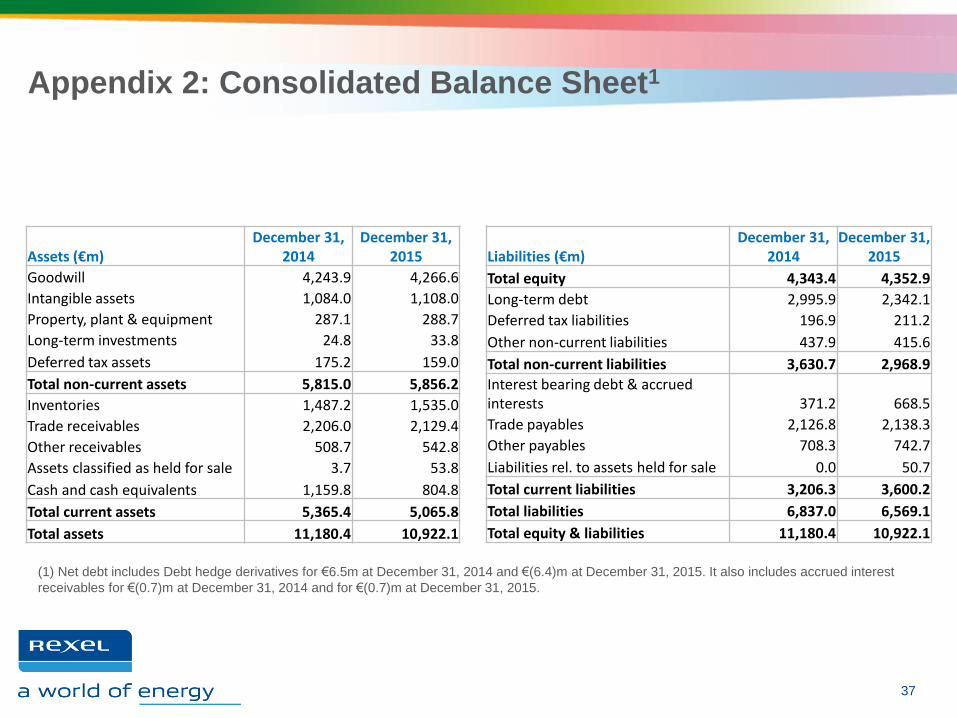
Appendix 2: Consolidated Balance Sheet1
37
(1) Net debt includes Debt hedge derivatives for €6.5m at December 31, 2014 and €(6.4)m at December 31, 2015. It also includes accrued interest
receivables for €(0.7)m at December 31, 2014 and for €(0.7)m at December 31, 2015.
Assets (€m) December 31,
2014 December 31,
2015
Goodwill 4,243.9 4,266.6
Intangible assets 1,084.0 1,108.0
Property, plant & equipment 287.1 288.7
Long-term investments 24.8 33.8
Deferred tax assets 175.2 159.0
Total non-current assets 5,815.0 5,856.2
Inventories 1,487.2 1,535.0
Trade receivables 2,206.0 2,129.4
Other receivables 508.7 542.8
Assets classified as held for sale 3.7 53.8
Cash and cash equivalents 1,159.8 804.8
Total current assets 5,365.4 5,065.8
Total assets 11,180.4 10,922.1
Liabilities (€m) December 31,
2014 December 31,
2015
Total equity 4,343.4 4,352.9
Long-term debt 2,995.9 2,342.1
Deferred tax liabilities 196.9 211.2
Other non-current liabilities 437.9 415.6
Total non-current liabilities 3,630.7 2,968.9
Interest bearing debt & accrued interests 371.2 668.5
Trade payables 2,126.8 2,138.3
Other payables 708.3 742.7
Liabilities rel. to assets held for sale 0.0 50.7
Total current liabilities 3,206.3 3,600.2
Total liabilities 6,837.0 6,569.1
Total equity & liabilities 11,180.4 10,922.1

Appendix 2: Change in Net Debt
(1) Includes restructuring outflows of:
• €16.9m in Q4 2014 and €12.9m in Q4 2015
• €54.6m in 2014 and €68.0m in 2015
(2) Excluding settlement of fair value hedge derivatives
38
€m Q4 2014 Q4 2015 FY 2014 FY 2015
EBITDA 200.7 182.1 725.4 663.7
Other operating revenues & costs(1) (24.7) (20.8) (77.8) (91.4)
Operating cash flow 176.0 161.2 647.6 572.3
Change in working capital 374.8 398.6 13.2 103.8
Net capital expenditure, of which: (30.6) (36.3) (101.1) (113.5)
Gross capital expenditure (37.4) (45.5) (104.0) (119.5)
Disposal of fixed assets & other 6.8 9.2 2.9 6.0
Free cash flow from continuing op. before interest and tax 520.2 523.6 559.7 562.6
Net interest paid / received(2) (39.4) (31.1) (152.6) (141.0)
Income tax paid (15.7) (12.0) (83.7) (108.4)
Free cash flow from continuing op. after interest and tax 465.1 480.4 323.4 313.3
FCF from discontinued operations 4.8 (0.0) (1.2) (18.5)
Net financial investment (11.2) (3.7) (43.0) (27.3)
Dividends paid (0.0) 0.0 (65.6) (91.3)
Net change in equity 3.8 2.9 (26.1) 1.8
Other (2.4) (7.2) (72.9) (32.9)
Currency exchange variation (18.4) (48.5) (135.8) (130.7)
Decrease (increase) in net debt 441.7 423.9 (21.1) 14.4
Net debt at the beginning of the period 2,654.8 2,622.6 2,192.0 2,213.1
Net debt at the end of the period 2,213.1 2,198.7 2,213.1 2,198.7
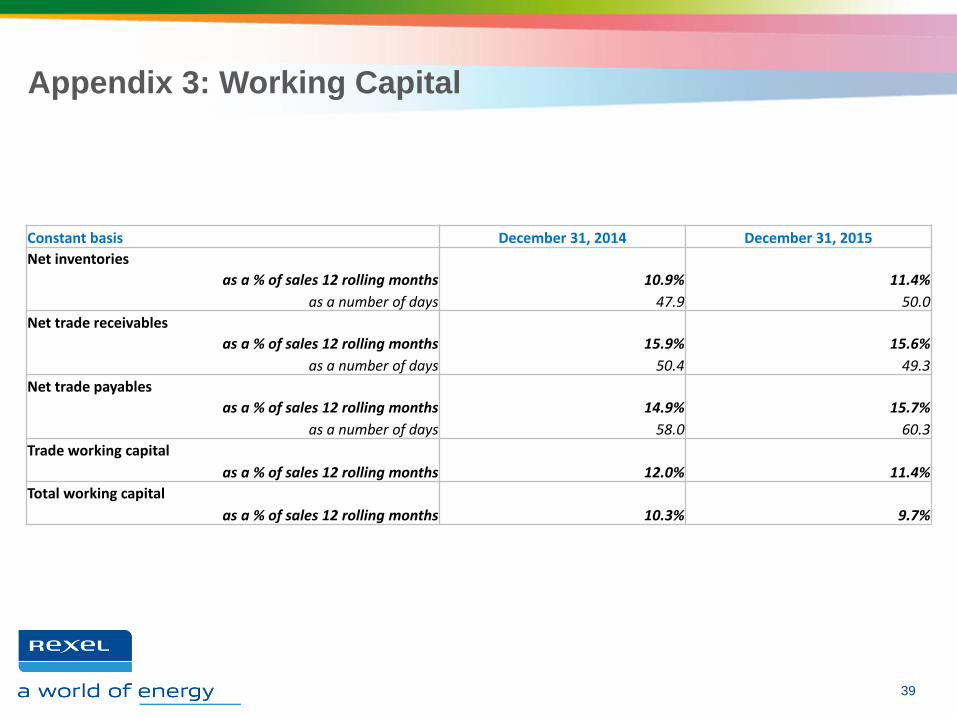
Appendix 3: Working Capital
39
Constant basis December 31, 2014 December 31, 2015
Net inventories
as a % of sales 12 rolling months 10.9% 11.4%
as a number of days 47.9 50.0
Net trade receivables
as a % of sales 12 rolling months 15.9% 15.6%
as a number of days 50.4 49.3
Net trade payables
as a % of sales 12 rolling months 14.9% 15.7%
as a number of days 58.0 60.3
Trade working capital
as a % of sales 12 rolling months 12.0% 11.4%
Total working capital
as a % of sales 12 rolling months 10.3% 9.7%
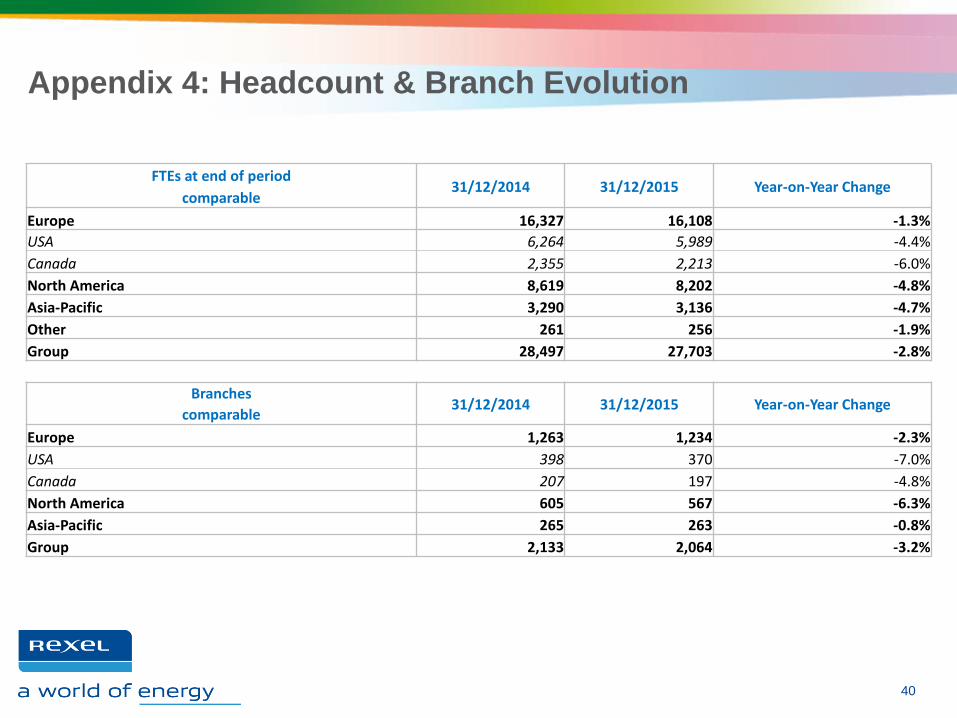
Appendix 4: Headcount & Branch Evolution
40
FTEs at end of period 31/12/2014 31/12/2015 Year-on-Year Change
comparable
Europe 16,327 16,108 -1.3%
USA 6,264 5,989 -4.4%
Canada 2,355 2,213 -6.0%
North America 8,619 8,202 -4.8%
Asia-Pacific 3,290 3,136 -4.7%
Other 261 256 -1.9%
Group 28,497 27,703 -2.8%
Branches 31/12/2014 31/12/2015 Year-on-Year Change
comparable
Europe 1,263 1,234 -2.3%
USA 398 370 -7.0%
Canada 207 197 -4.8%
North America 605 567 -6.3%
Asia-Pacific 265 263 -0.8%
Group 2,133 2,064 -3.2%
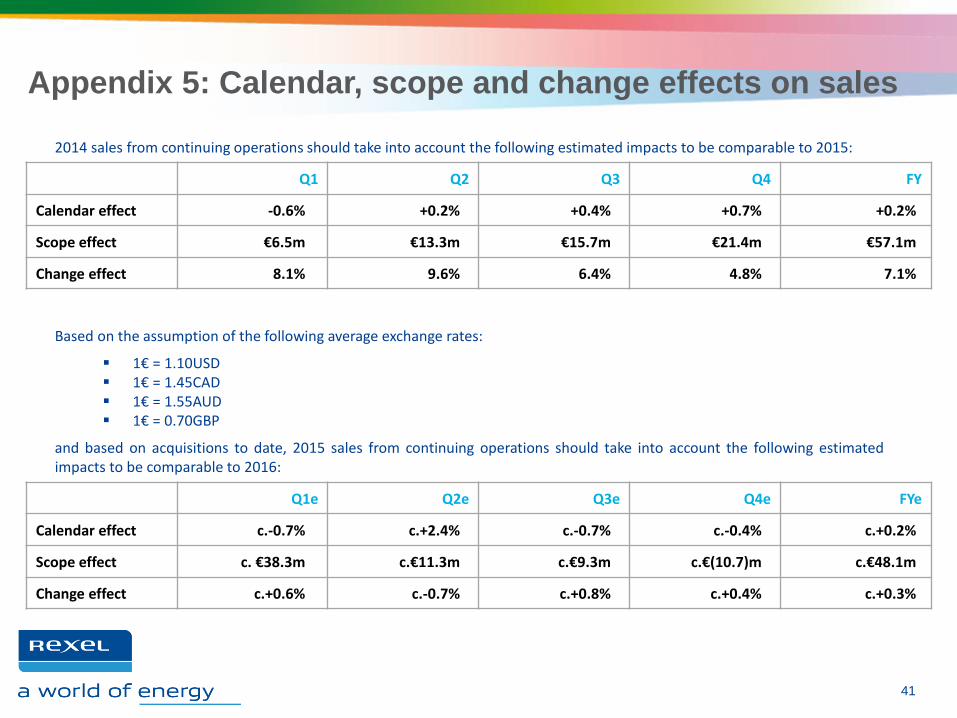
Appendix 5: Calendar, scope and change effects on sales
41
Q1e Q2e Q3e Q4e FYe
Calendar effect c.-0.7% c.+2.4% c.-0.7% c.-0.4% c.+0.2%
Scope effect c. €38.3m c.€11.3m c.€9.3m c.€(10.7)m c.€48.1m
Change effect c.+0.6% c.-0.7% c.+0.8% c.+0.4% c.+0.3%
Based on the assumption of the following average exchange rates:
1€ = 1.10USD 1€ = 1.45CAD 1€ = 1.55AUD 1€ = 0.70GBP
and based on acquisitions to date, 2015 sales from continuing operations should take into account the following estimated impacts to be comparable to 2016:
2014 sales from continuing operations should take into account the following estimated impacts to be comparable to 2015:
Q1 Q2 Q3 Q4 FY
Calendar effect -0.6% +0.2% +0.4% +0.7% +0.2%
Scope effect €6.5m €13.3m €15.7m €21.4m €57.1m
Change effect 8.1% 9.6% 6.4% 4.8% 7.1%
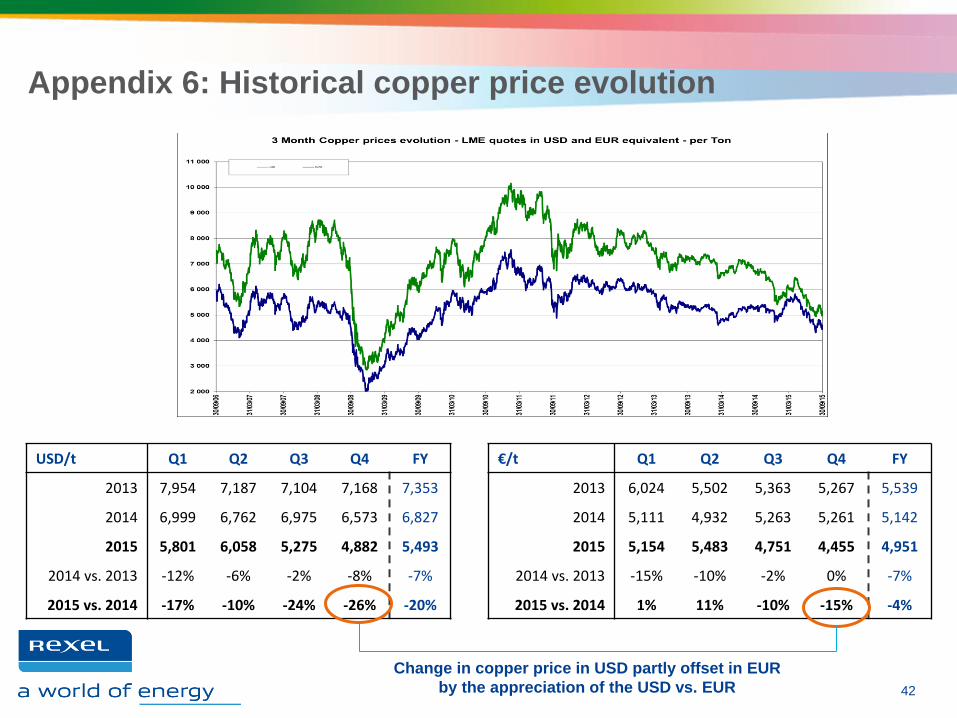
Appendix 6: Historical copper price evolution
42
USD/t Q1 Q2 Q3 Q4 FY
2013 7,954 7,187 7,104 7,168 7,353
2014 6,999 6,762 6,975 6,573 6,827
2015 5,801 6,058 5,275 4,882 5,493
2014 vs. 2013 -12% -6% -2% -8% -7%
2015 vs. 2014 -17% -10% -24% -26% -20%
€/t Q1 Q2 Q3 Q4 FY
2013 6,024 5,502 5,363 5,267 5,539
2014 5,111 4,932 5,263 5,261 5,142
2015 5,154 5,483 4,751 4,455 4,951
2014 vs. 2013 -15% -10% -2% 0% -7%
2015 vs. 2014 1% 11% -10% -15% -4%
Change in copper price in USD partly offset in EUR
by the appreciation of the USD vs. EUR
Financial Calendar and contacts
43
• April 29, 2016
First-quarter 2016 results
• May 25, 2016
Annual Shareholder Meeting
• Investors & Analysts
Marc MAILLET
Tel: +33 1 42 85 76 12
Email: [email protected]
Florence MEILHAC
Tel: +33 1 42 85 57 61
Email: [email protected]
• Press
Pénélope LINAGE
Tel: +33 1 42 85 76 28
Email: [email protected]
Brunswick - Thomas KAMM
Tel: +33 1 53 96 83 92
Email: [email protected]
Financial Calendar Contacts
Disclaimer
44
The Group is exposed to fluctuations in copper prices in connection with its distribution of cable products. Cables accounted for approximately 14% of the Group's sales, and copper accounts for approximately 60% of the composition of cables. This exposure is indirect since cable prices also reflect copper suppliers' commercial policies and the competitive environment in the Group's markets. Changes in copper prices have an estimated so-called "recurring" effect and an estimated so called "non-recurring" effect on the Group's performance, assessed as part of the monthly internal reporting process of the Rexel Group:
- the recurring effect related to the change in copper-based cable prices corresponds to the change in value of the copper part included in the sales price of cables from one period to another. This effect mainly relates to the Group’s sales;
- the non-recurring effect related to the change in copper-based cables prices corresponds to the effect of copper price variations on the sales price of cables between the time they are purchased and the time they are sold, until all such inventory has been sold (direct effect on gross profit). Practically, the non-recurring effect on gross profit is determined by comparing the historical purchase price for copper-based cable and the supplier price effective at the date of the sale of the cables by the Rexel Group. Additionally, the non-recurring effect on EBITA corresponds to the non-recurring effect on gross profit, which may be offset, when appropriate, by the non-recurring portion of changes in the distribution and administrative expenses.
The impact of these two effects is assessed for as much of the Group’s total cable sales as possible, over each period. Group procedures require that entities that do not have the information systems capable of such exhaustive calculations to estimate these effects based on a sample representing at least 70% of the sales in the period. The results are then extrapolated to all cables sold during the period for that entity. Considering the sales covered, the Rexel Group considers such estimates of the impact of the two effects to be reasonable.
This document may contain statements of future expectations and other forward-looking statements. By their nature, they are subject to numerous risks and uncertainties, including those described in the Document de Référence registered with the French Autorité des Marchés Financiers (AMF) on March 25, 2015 under number D.15-0201. These forward-looking statements are not guarantees of Rexel's future performance. Rexel's actual results of operations, financial condition and liquidity as well as development of the industry in which Rexel operates may differ materially from those made in or suggested by the forward-looking statements contained in this release. The forward-looking statements contained in this communication speak only as of the date of this communication and Rexel does not undertake, unless required by law or regulation, to update any of the forward-looking statements after this date to conform such statements to actual results, to reflect the occurrence of anticipated results or otherwise.
The market and industry data and forecasts included in this document were obtained from internal surveys, estimates, experts and studies, where appropriate, as well as external market research, publicly available information and industry publications. Rexel, its affiliates, directors, officers, advisors and employees have not independently verified the accuracy of any such market and industry data and forecasts and make no representations or warranties in relation thereto. Such data and forecasts are included herein for information purposes only.
This document includes only summary information and must be read in conjunction with Rexel’s Document de Référence registered with the AMF on March 25, 2015 under number D.15-0201, as well as the consolidated financial statements and activity report for the 2015 fiscal year, which may be obtained from Rexel’s website (www.rexel.com).