q3 2019 - cision · › the sale of the residential properties kolding 1 and kolding 2 in kista to...
TRANSCRIPT

1Q3 2019 ATRIUM LJUNGBERG
RENTAL INCOME, LIKE-FOR-LIKE PORTFOLIOS, %
+6.5PROFIT BEFORE CHANGES IN
VALUE, SEK MILLION
945FORECAST FOR 2019 PROFIT BEFORE CHANGES IN VALUE,
SEK MILLION
1,200
› Net sales increased to SEK 2,073 million (SEK 1,968 m), of which rental income increased to SEK 1,933 million (SEK 1,799 m).
› Operating surplus 1) from property management increased to SEK 1,315 million (SEK 1,254 m), excluding the effects of the implementation of IFRS 16, an increase of 4.9 per cent. This increase is re-lated to completed projects.
› Profit before changes in value increased to SEK 945 million (SEK 937 m). › Unrealised changes in the value of investment properties increased to SEK 1,597 million (SEK 1,390 m),
which is mainly due to higher net operating income and the market’s lower yield requirements. Unrealised changes in the value of derivatives amounted to SEK –554 million (SEK 27 m) related to lower market interest rates..
› Profit for the period totalled SEK 1,762 million (SEK 2,151 m). The decrease is mainly explained by unrealised changes in the value of derivatives.
› Net letting amounted to SEK –75 million (SEK 116 m), which includes SEK –42 million (SEK 83 m) for project properties. Several of the notices of termination are for properties that are being prepared for projects.
› Acquisition of properties amounted to SEK 1 166 million (SEK 167 m) and sales of properties amounted to SEK 1 031 million (SEK 127 m).
› The forecast for 2019 for profit before changes in value remains unchanged to SEK 1,200 million. Profit after tax is expected to amount to SEK 1,820 million, corresponding to SEK 14.00/share.
Q3 | 2019
“CONTINUED STRONG RENTAL GROWTH AND HIGH ACTIVITY LEVEL IN OUR PROJECTS”
SIGNIFICANT EVENTS DURING THE THIRD QUARTER
› The sale of the residential properties Kolding 1 and Kolding 2 in Kista to HSB Stockholm. The properties were vacated on 30 September 2019.
› As of 23 September our share has been included in the EPRA index, which is a global index comprising approximately 500 property companies.
1) Operating surplus and other earnings figures that are affected by the implementation of IFRS 16 are recognised in the comments for comparisons between the periods exclusive of the effects of the implementation of IFRS 16. This means that earnings figures, such as operating surplus, in the comments differ from the figures in the income statement. The effect of the implementation of IFRS 16 has resulted in the leasehold fees for 2019 being recognised in net financial items instead of being included in property management costs. All of the key ratios for 2019 have been calculated exclusive of the effects of the implementation of IFRS 16. See page 19 for the full key ratios table and pages 25–27 for definitions.
INTERIM REPORT 1 JANUARY – 30 SEPTEMBER
Key ratios 1)
Period2019
Jan–Sep
Period2018
Jan–Sep
Quarter2019
Jul–Sep
Quarter2018
Jul–Sep
Full year2018
Jan–Dec
Property value, SEK m 47,150 43,467 47,150 43,467 44,201
Operating surplus margin, % 68 70 69 70 68
Average interest rate for interest-bearing liabilities, % 1.7 1.4 1.7 1.4 1.6
Market value, SEK/share 217.50 161.20 217.50 161.20 152.00
EPRA NAV, SEK/share 209.27 184.62 209.27 184.62 194.82
Financial goals 1)
Investments in held properties, >SEK 2,000 million per year 1,217 1,176 402 401 1,758
Return on shareholders’ equity, >10 % over time 11.1 15.2 10.0 8.6 17.7
Gearing ratio, <45 % 41.8 43.8 41.8 43.8 41.9
Interest coverage ratio, >2.0 4.5 5.1 4.2 5.4 5.0
This interim report has been prepared in Swedish and translated into English. In the event of any discrepancies between the Swedish and the translation, the former shall have precedence.

2 Q3 2019 ATRIUM LJUNGBERG
Our retail hubs are in growth areas on strong subsidiary markets with a high customer footfall. We have reported an increase in total sales for our retail hubs over the first eight months of the year. For comparable stores, the increase was 2.3 per cent, while the sales increase amounted to 4.5 per cent. We are continuing to strongly focus on the development of our retail hubs, updating our range and offering new services. I am sure that the retail hubs and stores that can adapt their offering to new consumer patterns will do well, both now and in the future.
WHAT IS HAPPENING IN SLAKTHUSOMRÅDETIn June we took possession of the first properties in Slakthusområdet. Over the next ten years this area will be transformed into a new dynamic city district and will become the meeting place for the whole of Stockholm for food, culture and experiences, alongside workplaces and residentials. Over the summer we carried out a number of activations in the area, which generated a lot of attention. At the start of the autumn we also signed a lease contract for the Fållan property with the group behind Nobelberget’s concert and club activities. Fållan will become a venue for concerts, clubs and drama projects and is scheduled to open in November. Activating this area is part of our strategy to put this location on the map and we are already noticing a high level of interest in establishing in the future Slakthusområdet.
GROUNDBREAKING EVENT FOR LIFE CITY IN HAGASTADENIn September we carried out a symbolic groundbreaking event for the Life City project in Hagastaden. Our ambition is for this building to be the clear choice of meeting place for everyone working in the life science segment in Hagastaden. Life City is one of our most exciting projects with a unique location above the E4, with 200,000 people passing by every day. The building will also be right next to some of the most important life science organisations in Sweden; Karolinska Institutet, Karolinska University Hospital, KTH Royal Institute of Technology and Stockholm University. One of our guiding principles in this project is collaboration, so it felt particularly good that we were able to bring academia, trade and industry, and the public sector together for this groundbreaking event.
I follow the progress of this project every day as I drive in the tunnel under this future office building on my way home. It’s wonderful that we have finally started after so many years of hard work. Life City is a fantastic project and the property will be eye-catching. During the groundbreaking event, we got to see what the facade will look like, and it looks really great. And what a great location for a billboard!
Annica Ånäs, CEO
CEO’S STATEMENT
PROFIT IN THE THIRD QUARTERWe are now entering the final quarter of the year and I can report that our profit for the first three quarters of 2019 remains stable. Rental income increased by 7.5 per cent to SEK 1,933 million. Rental income increased in like-for-like portfolios by 6.5 per cent. Operating increase rose by SEK 61 million even though we net sold properties. Our forecast for profit before changes in value of SEK 1,200 million remains unchanged, despite our most recent sale of residentials in Ärvinge in Kista.
EPRA INDEXIn September Atrium Ljungberg was officially included in the FTSE EPRA Nareit Global Real Estate Index Series. EPRA Index is one of the most renowned and utilised indexes for property investments listed on the stock exchange and includes almost 500 property companies around the world. I’m incredibly happy that we now are included in the EPRA Index. We have seen a significant increase in the level of interest in our company, with trading in our share more than doubling since we were included.
STRATEGIC SALES IN KISTAIn August we sold the residential properties Kolding 1 and Kolding 2 in Ärvinge, Kista, to HSB Stockholm. These properties comprised just over 37,000 m2 of letting area distributed over 29 buildings with a total of 417 rental apartments. There was a high interest in acquiring these residentials, which resulted in a fantastic deal. This has enabled us to reinvest this capital on our subsidiary markets where our urban develop-ment strategy can bear more fruit.
SICKLA IN THE FUTURESickla is one of our main priority areas and a large part of our future project portfolio is there. In the coming years Sickla and Nacka will expand by more than 14,000 new residentials and more than 200,000 m2 of office space. Education, healthcare, retail and culture will be added to this. In 2026 the new stretch of underground is scheduled to be completed with one station and two underground entrances in the heart of Sickla, one of which will be in our shopping centre. It will take only seven minutes by underground to travel between Sickla and the central of Stockholm.
Intense work is currently being carried out at Atrium Ljungberg to develop Sickla so that it becomes an extension of Stockholm’s city centre. For example, we are reconstructing Sickla shopping centre to include an extra storey with more retail space and a large number of parking spaces, which are needed for the new offices in the area. As always, reconstruction work results in a period of store moves and disruption. We have found replacement premises for some stores, while we have decided to pause our collaboration with others, for example, H&M. This is fully in line with our long-term plan for the area, which not only includes a bigger shopping centre, but also a large hotel on Marcusplatsen and the healthcare building Curanten. Both will be completed in the autumn of 2020. We are also making plans for the new Stationshuset, which will have offices as well as the underground station. In addition, the long-term plans for Sickla include the continued development of residentials in Nobelberget and the future Sicklastråket, which is a new road in Nacka that will link Hammarby Sjöstad with Sickla. The Traversen project is also planned for this area, which is a new residential building in the heart of Sickla. We are looking at the outdoor parking central Sickla as well, which could be transformed into a large number of offices and residentials with underground parking. When Sickla is complete, it will be transformed into a city district that ful-ly reflects our vision, “Our city – where everyone thrives”.
GOOD SALES FOR OUR FIRST TENANT-OWNED DWELLINGS PROJECTSales of the apartments in the first district in Nobelberget in Sickla have really taken off, reaching a sales level of 50 per cent at the time of writing. A very positive development. In the autumn we have seen a high level of interest in smaller apartments, particularly among young adults who find Nobelberget exciting. The apartments in the first district will be ready for occupancy in the autumn of 2020.
RETAIL DEVELOPMENTInterest in the development of retail remains high. As I have mentioned before, we are seeing a structural change in this industry which is having an effect on the profitability of some stores.
” I’m happy that we have now joined the EPRA Index. We have seen a significant increase in the level of interest in our company, with trading in our share more than doubling since we joined.

3Q3 2019 ATRIUM LJUNGBERG 3Q3 2019 ATRIUM LJUNGBERG
ATRIUM LJUNGBERG AS AN INVESTMENTAs a shareholder of Atrium Ljungberg, you receive a stable dividend yield at a low risk. At the same time, you have the potential for a healthy long-term total yield on your investment with regard to the company’s interesting project portfolio on attractive growth markets. Investing in Atrium Ljungberg also means investing in sustainable urban development.
FOUR REASONS TO OWN SHARES IN ATRIUM LJUNGBERG:
STABLE DIVIDEND YIELD
The dividend yield over the past five years has been 3.1 per cent per year on average. The dividends paid per share by the company since its listing on the stock exchange in 1994 have never dropped.
Dividend and share dividend yield
LOW FINANCIAL RISK
We are in a strong financial position, with solid key ratios such as a low gearing ratio and high interest cov-erage ratio, and an investment grade rating from Moody's of Baa2 with stable outlook.
Gearing ratio and interest coverage ratio
POTENTIAL FOR GOOD VALUE GROWTH
With a planned investment rate of SEK 2 billion per year and a goal of 20 per cent return on new build and extension projects, Atrium Ljungberg, and there-fore the share, has excellent potential for good value growth over time. The total yield over the past five years has been 12 per cent per year on average.
Share’s total yield SUSTAINABLE URBAN DEVELOPMENT
Sustainability work is integrated in the business model where we continuously develop our areas in a sustainable direction. We are a long-term player that takes responsibility for the impact of our business on people and the environment.
% times
4245
42
0
10
20
30
40
50
20182017201620152014
4643
0
1
2
3
4
5
Gearing ratio, %Interest coverage ratio, times
SEK/share %
3.95
4.50
0
1
2
3
4
5
20182017201620152014
3.303.55
4.85
Dividend, SEK/shareDividend yield, %
%
–10
0
10
20
30
40
20182017201620152014Share change in value, %Dividend yield, %Total return, %
The Atrium Ljungberg share
50
100
150
200
250
300
201920182017201620152014
ATRLJ B Nasdaq Stockholm PI Nasdaq Stockholm Real Estate PI
Sour
ce: N
asda
q
index69NUMBER OF PROPERTIES
47PROPERTY VALUE,
SEK BILLION
2.5CONTRACTED ANNUAL
RENT, SEK BILLION
1,177TOTAL LETTING AREA,
1,000 M2
93LETTING RATE
EXCLUDING PROJECT PROPERTIES, %
323AVERAGE NUMBER OF
EMPLOYEES

4 Q3 2019 ATRIUM LJUNGBERG
CONSOLIDATED STATEMENT OF COMPREHENSIVE INCOME
Amounts in SEK m
Period2019
1/1–30/9
Period2018
1/1–30/9
Quarter2019
1/7–30/9
Quarter2018
1/7–30/9
Full year2018
1/1–31/12
12 months2018/20191/10–30/9
Rental income 1,933 1,799 653 601 2,412 2,546Sales, project and construction work 140 169 62 55 217 188Net sales 2,073 1,968 715 656 2,629 2,734
Property management costs Service charge-related costs –145 –137 –44 –41 –186 –194 Other operating costs –152 –118 –52 –43 –173 –207 Management costs –121 –109 –37 –36 –157 –169 Repairs –39 –41 –13 –10 –58 –56 Property tax –128 –108 –46 –37 –150 –170 Leasehold fees – –22 – –9 –27 –5 Non-deductible VAT –9 –9 –2 –3 –12 –12
–594 –545 –194 –178 –764 –813
Project and construction work costs –169 –186 –77 –66 –246 –229
Gross profit 1,310 1,236 445 412 1,619 1,692
— of which gross profit/loss property management (operating surplus)
1,339 1,254 460 423 1,648 1,733
— of which gross profit/loss from project and construction work –29 –18 –15 –11 –29 –40
Central administration, property management –57 –50 –17 –17 –73 –78Central administration, project and construction work –13 –22 –3 –6 –30 –21
–69 –72 –20 –23 –103 –99
Financial income 1 1 2 0 1 1Financial expenses –272 –227 –99 –73 –303 –348Leasehold fees –25 – –10 – – –25
–296 –226 –107 –72 –302 –371
Profit/loss before changes in value 945 937 318 317 1,214 1,221
Changes in valueProperties, unrealised 1,597 1,390 283 174 2,516 2,722Properties, realised 59 9 49 –1 121 170Derivatives, unrealised –554 27 –179 99 –70 –650Derivatives, realised – 1 – 1 1 –
1,102 1,427 152 272 2,568 2,242
Profit before tax 2,046 2,365 469 589 3,781 3,463
Current tax –69 –31 –9 26 –35 –73Deferred tax –216 –183 73 –197 –294 –327
–284 –213 65 –171 –329 –399
Profit/loss for the period 1,762 2,151 534 418 3,453 3,065
Other comprehensive incomeItems which will be reclassified to profit/lossCash flow hedging 12 13 4 4 16 15Tax attributable to other reported income and expenses –3 –3 –1 –1 –3 –4Total other comprehensive income 9 10 3 3 13 11
Total comprehensive income for the period 1,771 2,161 537 421 3,466 3,076
Earnings per share, SEK 13.55 16.25 4.13 3.18 26.15 23.51

5Q3 2019 ATRIUM LJUNGBERG
PROFIT JANUARY–SEPTEMBER 2019
CHANGES IN THE PROPERTY PORTFOLIOThe profit for the period was impacted by earlier property trans-actions. The contribution from acquired properties mainly relates to Tranbodarne 11 in Slussen, which was taken into possession on 1 November 2018, and the acquisition of 14 properties in Slakthus-området, which were taken into possession on 11 June 2019. The sale of properties primarily relates to Blästern 6 in Haga staden and Roddaren 7 in Kungsholmen, which were vacated on 1 November 2018, and Arbetsstolen 3 in Västberga, which was vacated on 20 December 2018. On 30 September 2019 Kolding 1 and Kolding 2 in Ärvinge, Kista, were vacated, which will only impact the operating surplus in the fourth quarter.
NET SALESThe Group’s net sales for the period increased to SEK 2,073 million (SEK 1,968 m), of which rental income comprised SEK 1,933 million (SEK 1,799 m). Rental income increased by 6.5 per cent in the like-for-like portfolio compared with the same period for last year, while office properties increased by 7.9 per cent and retail properties by 5.1 per cent. The increase in rental income for like-for-like portfolios is mostly explained by new rentals, renegotiations and SEK 14 million higher surcharges for property tax. The development of rental in-come for retail properties is mostly due to the completion of the ex-tension at Gränby shopping centre, SEK 16 million, and letting out va-cant premises in the first three quarters of 2018.
During the year, non-recurring payments of SEK 3 million (SEK 5 m) were received for premature vacating of premises.
RENTAL INCOME TRENDPeriod
20191/1–30/9
Period2018
1/1–30/9Change,
%Like-for-like portfolio 1,668 1,567 6.5Non-recurring remuneration 3 5Project properties 136 79Properties acquired 86 1Properties sold 39 147Rental income 1,933 1,799 7.5
At the end of the period the market value for the like-for-like portfo-lio was SEK 37,778 million excluding development rights, corre-sponding to 80 per cent of the property portfolio’s total value.
PROPERTY EXPENSESProperty expenses totalled SEK –594 million (SEK –545 m) and SEK –618 million (SEK –545 m) excluding the effects of IFRS 16. For like-for-like portfolios, excluding the effects of IFRS 16, property costs increased by 13.8 per cent compared with the corresponding period last year. The increase property costs can be explained by increased customer losses, management costs and costs of electricity. The increase in bad debt was mostly due to the bankruptcy of Best of Brands, BR Leksaker and Room. Best of Brands has been handed over and is now under new management. The increase in management costs has been impacted by the investment in the concept Leveriet. Although property tax increased by SEK 19 million in like-for-like portfolios, non-recurrent costs in the first quarter reduced this increase for the property portfolio as a whole.
PROPERTY COSTS TREND Period
20191/1–30/9
Period2018
1/1–30/9Change,
%Like-for-like portfolio –539 –474 13.8Project properties –45 –32Properties acquired –20 0Properties sold –14 –39Property management costs –618 –545 13.4
GROSS PROFIT/LOSS PROPERTY MANAGEMENTThe gross profit for property management totalled SEK 1,339 million (SEK 1,254 m) and SEK 1,315 million (SEK 1,254 m) excluding the effects of IFRS 16. The main reason for the increase is the comple-tion of project properties with the occupancy of tenants as well as the new leases and renegotiations relating to office properties. For the like-for-like portfolio, excluding the effects of IFRS 16, the gross profit for property management increased by 3.3 per cent com-pared with the corresponding period last year. This increase is mostly due to new rentals and renegotiations, but has also been negatively impacted by higher property costs resulting primarily from rises in bed debt, management costs and the costs of electricity.
The surplus ratio fell to 68 per cent (70 %), due to divested proper-ties with relatively higher surplus ratios and a rise in property costs.
GROSS PROFIT/LOSS PROJECT AND CONSTRUCTION WORKThe gross profit for project and construction activities totalled SEK –29 million (SEK –18 m). The decrease in gross profit is mostly due to a lower gross profit in TL Bygg. Internal Group sales for the period in
Like-for-like net rental income growth
– Strong development in the office segment
7.9
5.1
0.0
6.5
Total, %Residential properties, %Retail properties, %Office properties, %
Operating surplus and operating surplus margin
– Customer losses and investments for the future have impacted the surplus ratio
SEK m %
0
50
100
150
200
250
300
350
400
450
500
Q3Q2Q1Q4Q3Q2Q1Q4Q3Q2Q1
Operating surplus, SEK mOperating surplus margin, %50
55
60
65
70
75
2017 2018 2019

6 Q3 2019 ATRIUM LJUNGBERG
TL Bygg amounted to SEK 240 million (SEK 270 m), which corresponds to 63 per cent (63 %) of total sales. TL Bygg’s gross profit, including intra-group transactions amounted to SEK 19 million (SEK 26 m). TL Bygg’s gross profit was impacted by delays in project starts as well as start-up costs in early project stages.
SEASONAL EFFECTS The operating surplus is impacted by seasonal variations in operating costs. Generally costs are higher during the first and last quarter of the year, primarily caused by higher costs of heating and property maintenance.
CENTRAL ADMINISTRATIONCentral administration comprises of costs for the company manage-ment as well as central support functions. The cost for the period amounted to SEK –69 million (SEK –72 m). Central administration costs for project and construction work decreased mostly due to start-up costs in the previous year for the new deal for tenant-owned dwellings. The cost for central administration for property manage-ment increased as a result of investments in the company's future growth.
FINANCIAL INCOME AND EXPENSES Financial expenses for the period amounted to SEK –272 million (SEK –227 m) excluding leasehold fees. This increase is due to both higher interest-bearing liabilities and an increase in the average interest rate. The average interest rate at the end of the period amounted to 1.7 per cent (1.4 %). For more information, refer to the section on financing on page 14.
CHANGES IN VALUEUnrealised changes in the value of investment properties amounted to SEK 1,597 million (SEK 1,390 m) and are mostly due to higher net operating income and the market’s lower yield requirements. For more information, refer to the section on property values on page 8.
The realised changes in the value of investments properties amounted to SEK 59 million (SEK 9 m), due to the sale of the residential properties Kolding 1 and Kolding 2 in Kista.
TAXThe current tax for the period totalled SEK –69 million (SEK –31 m). The current tax has been affected by tax deductible depreciation and investments. Deferred tax amounted to SEK –216 million (SEK –183 m), which was mainly impacted by unrealised changes in the value of properties, the sale of properties and derivatives. The comparison year has also been affected by a reduction in the tax rate from 22.0 to 20.6 per cent.
The company tax rate for the 2019 tax year has been reduced to 21.4 per cent (22.0 per cent in 2018). The reduction in the company tax rate is taking place in two stages from 2019. The next reduction will be in 2021, and the company tax rate will then be 20.6 per cent. The deferred tax liability has been calculated on the lower tax rate since tax liabilities are not expected to be realised in any significant extent in 2019 and 2020.
The Group’s accumulated tax deficit amounted to SEK 9 million (SEK 22 m) and comprises the base of the Group’s deferred tax receivable.
The residual tax value of the property stock amounts to SEK 17,927 million (SEK 16,348 m).
TAX CALCULATION, 30/09/2019SEK m Current tax Deferred taxReported profit/loss before tax 2,046Tax deductible depreciation –476 476 investments –177 177Non-taxable/non-deductible changes in the value of properties, unrealised –1,597 1,597 changes in the value of properties, realised –59 59 changes in the value of derivatives, unrealised 554 –554 consolidated capitalisation of borrowing –9 9 consolidated internal profit 19 –19Other fiscal adjustments 15 –83Taxable profit/loss before loss carry-forwards 317 1,662
Change in loss carry-forwards – –Taxable profit/loss 317 1,662Of which 21.4 per cent current/20.6 per cent deferred tax
–69 –342
Reversal of deferred tax for properties sold 126Reported tax expense –69 –216
PROFITThe profit before changes in value increased to SEK 945 million (SEK 937 m).
Profit for the period amounted to SEK 1,762 million (SEK 2,151 m), corresponding to SEK 13.55/share (SEK 16.25).
PROFIT FORECASTThe forecast for profit before changes in value for the full year 2019 amounts to SEK 1,200 million, compared with SEK 1,214 million, which was the result in 2018. The decrease is related to the net sale of properties during 2018. The forecast for profit after tax is SEK 1,820 million, corresponding to SEK 14.00/share. Future changes in value and any other future property acquisitions and sales of properties have not been taken into account in the forecast.
CONT. PROFIT/LOSS JANUARY–JUNE 2019
GOTHENBURG – In Lindholmen in Gothenburg we are part of the extensive city development work that is transforming the former shipbuilding area into a modern, vibrant meeting place with both offices and residentials.

7Q3 2019 ATRIUM LJUNGBERG
There are a total of 133,220,736 (133,220,736) shares, of which 4,000,000 (4,000,000) are class A shares and 129,220,736 (129,220,736) are class B shares. One class A share grants entitlement to ten votes and one class B share grants entitlement to one vote. During the period Atrium Ljungberg acquired 621,000 (1,691,000) class B shares. As of 30 September the company owns 3,382,000 class B shares. The number of out-standing shares amounted to 129,838,736 (31/12/2018, 130,459,736) at the end of the period. The average number of outstanding shares for the period from 1/1/2019 to 30/9/2019 amounts to 130,061,619 (132,326,029).
CONSOLIDATED BALANCE SHEETS SUMMARY
CONSOLIDATED CHANGES IN SHAREHOLDERS’ EQUITY
Amounts in SEK m 30/09/2019 30/09/2018 30/06/2019 30/06/2018 31/12/2018ASSETSInvestment properties 46,199 42,584 46,547 42,012 43,310Leaseholds 1,305 – 1,375 – –Goodwill 225 240 225 240 225Other fixed assets 54 47 51 48 45Total fixed assets 47,784 42,871 48,198 42,300 43,579
Development properties 951 883 943 880 891Current assets 385 303 393 362 323Liquid assets 498 368 390 100 335Total current assets 1,834 1,554 1,726 1,342 1,549
Total assets 49,618 44,426 49,924 43,642 45,128
SHAREHOLDERS’ EQUITY AND LIABILITIESShareholders’ equity 21,737 19,554 21,198 19,138 20,696
Deferred tax liability 4,742 4,719 4,864 4,518 4,598Long-term interest-bearing liabilities 19,687 15,745 20,043 15,234 18,506Long-term financial leasing liability 1,305 – 1,375 – –Derivatives 921 253 736 547 349Other long-term liabilities 207 82 207 77 202Total long-term liabilities 26,861 20,799 27,225 20,378 23,655
Short-term interest-bearing liabilities – 3,291 463 2,947 –Other current liabilities 1,020 783 1,038 1,179 777Total current liabilities 1,020 4,073 1,501 4,126 777
Total shareholders’ equity and liabilities 49,618 44,426 49,924 43,642 45,128
Attributable to the Parent Company shareholders
Amounts in SEK m Share capitalOther capital
contributedHedging reserves
Profits brought forward
Total share- holders’ equity
Opening balance as per 1 January 2018 333 3,960 –39 13,970 18,223Profit/loss for the period 2,151 2,151Other comprehensive income 10 10Option premiums received 1 1Acquisition of own shares –232 –232Dividend, SEK 4.50/share –599 –599Closing balance, as per 30 September 2018 333 3,960 –30 15,291 19,554
Profit/loss for the period 1,302 1,302Other comprehensive income 4 4Acquisition of own shares –164 –164Closing balance as per 31 December 2018 333 3,960 –26 16,429 20,696
Profit/loss for the period 1,762 1,762Other comprehensive income 9 9Dividend, SEK 4.85/share –631 –631Acquisition of own shares –99 –99Closing balance, as per 30 September 2019 333 3,960 –17 17,461 21,737

8 Q3 2019 ATRIUM LJUNGBERG
1) m2 excluding garage.
MARKET AND PROPERTY PORTFOLIOTHE PROPERTY MARKETRental levels for offices continue to increase, particularly in Gothenburg and Uppsala. Although the top rents in Stockholm CBD have stabilised, the rents in the other parts of the market continue to increase.
The transaction volume in the Swedish property market in the first three quarters amounted to SEK 152 billion according to Savills, an increase of 48 per cent compared with the same period in the previous year. Foreign investors have remained active while Swedish investors have continued to generate net sales.
The yield requirements are stable at low levels thanks to the continued strong interest in investing in properties. Yield requirements decreased during the quarter following a reduction in the long-term interest rates over the summer.
The prices of tenant-owned units in Atrium Ljungberg’s subsidiary markets remain stable or show a minor increase following the drop in autumn 2017. The supply of tenant owned dwellings remains high, but the suppply of new production has declined. The new production of rental properties has increased, but waiting times for mediated new apartments show a stable demand.
PROPERTY PORTFOLIOOur property portfolio is concentrated to central locations in the growth regions of Stockholm, Gothenburg, Malmö and Uppsala, with Stockholm accounting for 72 per cent of the contracted annual rent. The property portfolio contains a total of 69 properties with a combined letting area of 1,177,000 m² including garage. In the third quarter a number of buildings have been reclassified from office properties to retail properties, with a fair value of approximately SEK 500 million.
During the period, possession has been completed for 14 properties in the Slakthusområdet in Stockholm. Possession of the Barkarby 2:64 property in Järfälla, where development of the Bas Barkarby project is underway, has also taken place. Over the period, stamp duty were also paid for the acquisition of Molekylen 1, which is the land for the Life City project in Hagastaden.
During the period the residential properties Kolding 1 and Kolding 2 in Ärvinge, Kista, were vacated.
Property acquisitions
Property Area CategoryLetting
area, m² Possession
Acquisition values, SEK m
14 properties Slakthus-området
Industry/offices/retail
51,000 June 2019 1,127
Barkarby 2:64 Barkarby Land for offices – May 2019 16
Property sales
Property Area CategoryLetting
area, m²Date
vacated
Underlying price property,
SEK mKolding 1 & 2 Ärvinge, Kista Residentials 42,612 Sep 2019 1,100
CONTRACTED ANNUAL RENT AND LETTING RATEAs of 1 October 2019 the contracted annual rent amounted to SEK 2,523 million (SEK 2,411 m). The economic letting rate including project properties was 92 per cent (94 %), and excluding project properties, 93 per cent (95 %). The EPRA vacancy rate was therefore 7 per cent (5 %). The lower letting rate is explained by, among other things, by two projects (Sickla Front II and Gränby Entré, house 3) being completed but not yet being fully let, two properties in Slussen and Sickla that are being prepared for reconstruction projects, as well as a few bankruptcies and terminations of leases within retail.
The average remaining term for contracted rent excluding residentials and parking was 3.5 years as of 01/10/2019 (3.6).
Contracted annual rent per premises type
– Half comprises offices
Offices 50 % SEK 1,263 millionRetail 26 % SEK 653 millionFMCG 6 % SEK 154 millionRestaurant 5 % SEK 121 millionCulture/Education 4 % SEK 106 millionHealth care 4 % SEK 93 millionOther 3 % SEK 85 millionResidentials 2 % SEK 49 million
Contracted annual rent per region
– Concentrated to the growth regions
Stockholm 72 % SEK 1,824 millionUppsala 13 % SEK 324 millionMalmö 9 % SEK 216 millionGothenburg 6 % SEK 159 million
Rental value per m2 and letting rate
– Stable letting rate over time
SEK/m² %
1,500
2,000
2,500
3,000
3,500
4,000
Q3Q2Q1Q4Q3Q2Q1Q4Q3Q2Q1
Rental value Offices, SEK/m²Rental value Retail, SEK/m²Letting rate excluding project properties, %
2017 2018 2019
75
80
85
90
95
100
01/10/2019 01/10/2018
Premises typeRental value,
SEK mRental value,
SEK/m2 1)Letting rate, %
Rental value, SEK m
Rental value,SEK/m2 1)
Letting rate, %
Offices 1,250 2,780 93 1,136 2,569 94Retail 955 3,438 93 910 3,477 95Other 232 2,002 90 223 1,832 95Residentials 39 1,660 100 79 1,399 100Garage/parking 57 93 60 – 93Business area Property 2,534 2,922 93 2,408 2,661 95Project properties 205 83 163 83Property portfolio, total 2,739 92 2,571 94
Rental value and letting rate

9Q3 2019 ATRIUM LJUNGBERG
1) m2 excluding garage. 2) Letting area for new production is not reported until the project is completed, so the figures do not accurately represent the actual situation.
NET LETTINGNet letting (ie newly signed contracted annual rents with deductions for annual rents due to terminated contracts) during the third quarter amounted to SEK –61 million (SEK 76 m), of which SEK –26 million (SEK 71 m) referred to project properties. Net letting has been negatively affected by termination of office premises in Hagastaden and Södermalm with an amount of SEK –27 million.
Net letting for the period amounted to SEK –75 million (SEK 116 m), of which SEK –42 million (SEK 83 m) referred to project properties. A total of SEK –75 million of the net letting for the period relates to Tranbodarne 11 (Katarinahuset in Slussen), which has been reclassified as a project property.
The time lag between net letting and its effect on profit is assessed to be 3–12 months.
Net letting
– –75 million of net letting during the period, impacted, for example, by notices of termination in properties that are being prepared for project.
–80
–60
–40
–20
0
20
40
60
80
Q3Q2Q1Q4Q3Q2Q1Q4Q3Q2Q12017 2018 2019
Investment properties, SEK mProject properties, SEK mNet letting, SEK m
SEK m
PROPERTY VALUATIONAtrium Ljungberg conducted an internal valuation of its property portfolio during the third quarter.
The market valuation is based on analyses of completed property transactions for properties of a similar standard and in a similar loca-tion, in order to assess the market’s yield requirements. The valua-tion also entails cash flow calculations, with individual assessments of the earning capacity of each individual property. Assumed rental levels in conjunction with contract expirations correspond to assessed long-term market rent levels. Operating costs have been assessed on the basis of the company’s actual costs. Development rights have been valued based on an assessed market value per m2 of GFA for determined development rights in accordance with an approved detailed development plan or where the detailed development plan is assessed to enter into force within the near future.
Project properties are valued on the basis of completed projects, less remaining investments. A risk surcharge is added to the yield requirement on the basis of the current phase of the project.
DEVELOPMENT PROPERTIESDevelopment properties are properties that are intended to be developed into tenant-owned dwellings before being sold. The development properties are recognised at the lowest of the invest-ments expended and the estimated net realisable value.
CHANGE IN VALUEThe unrealised changes in value during the period amounted to SEK 1,597 million (SEK 1,390 m) and are mainly explained by higher net operating income and the market’s lower yield requirements.
Unrealised changes in value, properties
SEK m
Period2019
1/1–30/9
Period2018
1/1–30/9Change in yield requirements 722 355Change in operating net etc. 829 1,035Development rights 46 –Total 1,597 1,390
Changes in the property portfolio
SEK m
Period2019
1/1–30/9
Period2018
1/1–30/9
Full year2018
1/1–31/12Investment propertiesFair value at the start of the period 43,310 39,991 39,991Acquisitions (after deduction of deferred tax) 1,166 167 1,727Sales –1,031 –127 –2,662Investments in our own properties 1,157 1,163 1,738Unrealised changes in value 1,597 1,390 2,516Fair value at the end of the period 46,199 42,584 43,310
Development propertiesAt beginning of period 891 870 870Investments 60 13 21Development properties, at period end 951 883 891Property portfolio, total 47,150 43,467 44,201
Dividend yield requirement per premises type
% Interval30/09/2019
Average31/12/2018
AverageOffices 3.6–6.3 4.5 4.5Retail 3.6–6.2 4.9 4.9Residentials 2.3–4.0 3.2 3.2Other 3.7–6.3 5.0 5.0Total 2.3–6.3 4.6 4.6
Dividend yield requirement per region
% Interval30/09/2019
Average31/12/2018
AverageStockholm 2.3–6.2 4.5 4.5Uppsala 3.8–5.8 5.0 5.2Malmö 3.8–6.3 5.4 5.4Gothenburg 4.5–5.0 4.5 4.5Total 2.3–6.3 4.6 4.6
CONT. MARKET AND PROPERTY PORTFOLIO
30/09/2019 30/09/2018
Property typeLetting area,
’000 m2Fair value,
SEK mFair value, SEK/m2 1)
Letting area, ’000 m2
Fair value, SEK m
Fair value, SEK/m2 1)
Office properties 650 23,385 45,800 671 22,180 42,429Retail properties 392 16,301 50,338 334 14,591 50,388Residential properties 39 1,046 32,022 77 1,726 26,462Total 1,082 40,732 46,976 1,081 38,497 43,868Project properties 89 5,101 E/T 2) 68 3,216 E/T 2)
Land and development rights 366 – 871Total Investment properties 1,171 46,199 1,149 42,584Development properties 6 951 18 883Property portfolio, total 1,177 47,150 1,167 43,467
Property portfolio
10 Q3 2019 ATRIUM LJUNGBERG
INVESTMENTS AND PROJECTSCONFIRMED AND COMPLETED PROJECTSDuring the first three quarters of 2019, investments in own proper-ties amounted to SEK 1,217 million (SEK 1,176 m), of which SEK 693 million (SEK 716 m) was in project properties and SEK 60 million (SEK 13 m) in development properties. Investments in project prop-erties relate primarily to projects in Sickla, Mobilia, Barkarby and Hagastaden. Other investments relate mostly to tenant adaptations in properties in Sickla, Sundbyberg, Södermalm and Gothenburg.
The remaining investment volume for confirmed projects amounted to SEK 3,390 million as of 30 September.
SICKLA – NACKACuranten – Curanten will become a healthcare destination, with stores, cafes and restaurants on the ground floor. The project com-prises a total of 11,700 m2, which includes 8,100 m2 for healthcare. Work is currently underway to complete the framework and to adapt the premises for the tenants. Occupancy is planned for the end of 2020. Lease contracts have been signed with Sickla Hälsocenter, Alva Barnklinik and GHP Specialisttandläkarna in Nacka.
Tapetfabriken – The building is planned to comprise 9,800 m2, with a hotel and offices as well as a garage. The largest tenant is Nordic Choice Hotels, which will lease 7,200 m2 with 156 hotel rooms and a 2,000 m2 lobby with a restaurant, event spaces and conference premises. The foundation work for the project is complete and framing is underway. The hotel is planned to be completed in the third quarter of 2020.
Nobelbergsgaraget – Framing is complete and the garage is scheduled to be fully finished in 2020.
Formalinfabriken – A former industrial building in Nobelberget which used to be a laboratory and offices is being reconstructed. The building comprises approximately 2,000 m2 across four levels. It has new tenants, Sport Desing Sweden and the cultural organisation Konstjord. The building will also house a cafe, a restaurant and a community centre where dinners, meetings and corporate events can be held. Formalinfabriken was completed in the third quarter of 2019.
Panncentralen – The former power house in Nobelberget is being reconstructed and extended to create a modern pre-school with six departments and an outdoor play area. Ground and foundation work is currently being carried out. In the first quarter of 2019, an agree-ment was signed with Jensen Education, which plans to open at the end of 2020.
Brf Sicklastråket – Brf Sicklastråket contains 68 tenant-owned apartments and is the first residential district to be built in Nobel-berget. Three-dimensional property formation will be used for this property and the apartments are being built above Nobelbergsgara-get.
Sales started for this tenant-owned apartment project in the autumn of 2018 and as of the end of September 2019 bindning contracts had been signed for 46 per cent of the apartments. Construction of the residential building has started and framing is in progress. The district is expected to be completed at the end of 2020.
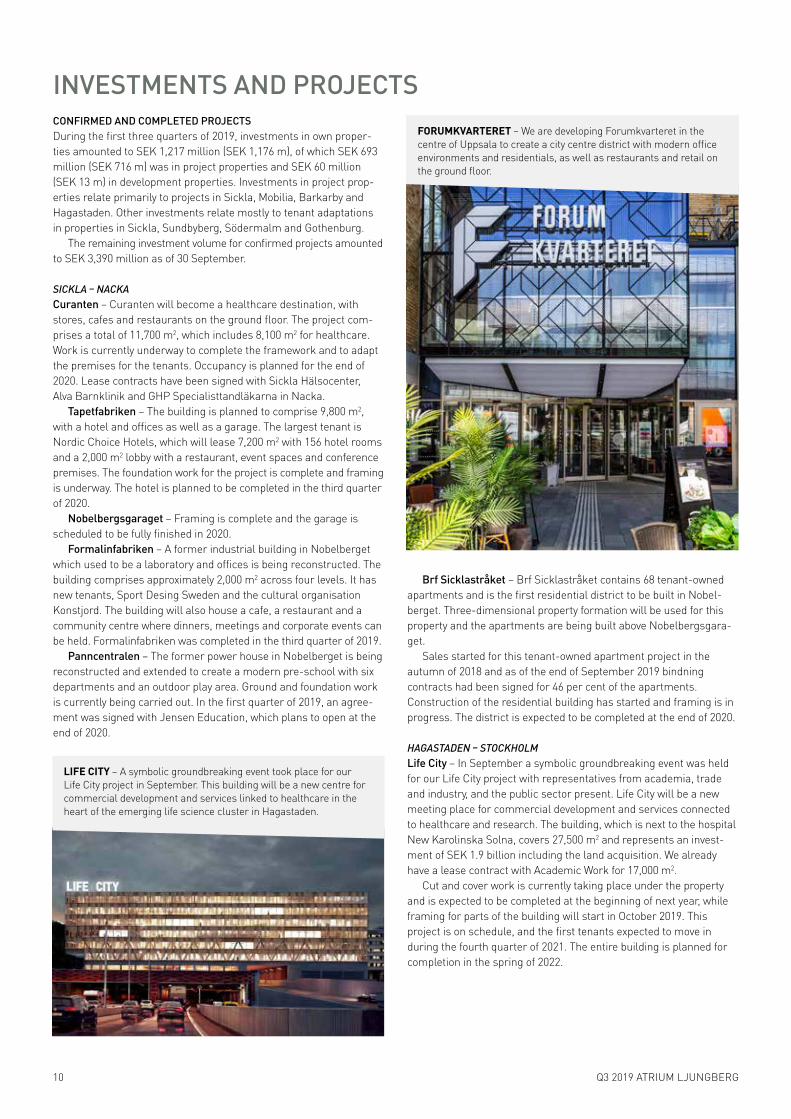
HAGASTADEN – STOCKHOLMLife City – In September a symbolic groundbreaking event was held for our Life City project with representatives from academia, trade and industry, and the public sector present. Life City will be a new meeting place for commercial development and services connected to healthcare and research. The building, which is next to the hospital New Karolinska Solna, covers 27,500 m2 and represents an invest-ment of SEK 1.9 billion including the land acquisition. We already have a lease contract with Academic Work for 17,000 m2.
Cut and cover work is currently taking place under the property and is expected to be completed at the beginning of next year, while framing for parts of the building will start in October 2019. This project is on schedule, and the first tenants expected to move in during the fourth quarter of 2021. The entire building is planned for completion in the spring of 2022.
LIFE CITY – A symbolic groundbreaking event took place for our Life City project in September. This building will be a new centre for commercial development and services linked to healthcare in the heart of the emerging life science cluster in Hagastaden.
FORUMKVARTERET – We are developing Forumkvarteret in the centre of Uppsala to create a city centre district with modern office environments and residentials, as well as restaurants and retail on the ground floor.

11Q3 2019 ATRIUM LJUNGBERG
Confirmed projects
BAS BARKARBY — JÄRFÄLLABas Barkarby – Construction of the first phase of Bas Barkarby started in the second quarter of 2019 and comprises approximately 25,000 m2. Piling work is currently underway and the casting of the foundation will be carried out soon. Bas Barkarby will be directly connected to western Stockholm’s new hub for the underground rail-way, long-distance trains, commuter trains and buses. Here we will be bringing together education with the business community to create an entirely new meeting place. Järfälla Municipality will lease almost 11,000 m2 for upper secondary education, a multi-purpose hall, a library and other cultural activities. Occupancy is expected to take place in the spring of 2022.
GRÄNBYSTADEN – UPPSALAGränby Entré, house 3 – We have constructed three buildings con-taining rental apartments, commercial premises and offices next to
Gränbystaden Galleria. Buildings 1 and 2 are already occupied. Build-ing 3 contains 66 rental apartments, offices and premises for restau-rants and other service activities. All apartments in building 3 are now occupied and work on the final commercial premises is expected to be completed in the first quarter of 2020.
Parkhusen in Gränbystaden, phase 1 – We are building a residen-tial district called Parkhusen right next to Gränbystaden galleria and Gränbyparken. The project comprises a total of approximately 250 apartments and we will create an urban frontage and a clearly defined entrance to the park. Phase 1 comprises 44 rental apart-ments with commercial premises on the ground floor. Construction is planned to start in the fourth quarter of 2019, provided that planning permission is obtained. The building is scheduled for completion in the first quarter of 2021. The apartments will be mediated through Uppsala Bostadsförmedling.
CONT. INVESTMENTS AND PROJECTS
Schedule for confirmed projectsPlanning Construction Completion
2019 2020 2021 2022Q3 Q4 Q1 Q2 Q3 Q4 Q1 Q2 Q3 Q4 Q1 Q2
Curanten
Tapetfabriken
Nobelbergsgaraget
Gränby Entré, house 3
Mobilia Torghuset
Life City
Bas Barkarby
Parkhusen, district 1
Forumkvarteret
Formalinfabriken
Panncentralen
Brf Sicklastråket
1) Including any land acquisition in connection with the project implementation, but excluding any initial values such as the market value of a demolished building. 2) Excluding premiums and any net sales result.3) Rental value/letting rate is not reported as a subtotal with regard to individual business transactions.4) The letting rate for commercial premises amounts to 58 per cent. The letting rate for residential units is 100 per cent.5) The letting rate for commercial premises amounts to 53 per cent. Residential units are let closer to completion.6) Divided into SEK 1,858 million for new building and extensions, SEK 805 million for reconstructions and SEK 80 for tenant-owned dwelling projects.7) Refers to the proportion of signed advance purchase agreements as a percentage.
Letting area, m²
Project, property, municipality Retail OfficesResi-
dentials OtherParking,
GFA
Total investment,
SEK m 1)
Of which remaining,
SEK mFair value,
SEK m
Rental value,
SEK m 2)Letting rate, %
New builds and extensionsCuranten, Sicklaön 83:22, Nacka 3,300 8,400 530 300 40 23Tapetfabriken, Sicklaön 83:22, Nacka 2,600 7,200 4,600 410 220 24 E/T 3)
Nobelbergsgaraget, Sicklaön 83:40, Nacka 600 3,500 60 30 4Gränby Entré, house 3, Gränby 21:5, Uppsala 1,200 1,300 3,400 240 40 15 78 4)
Mobilia Torghuset, Bohus 8, Malmö 3,400 3,800 5,700 540 320 31 41 5)
Life City, Molekylen 1, Stockholm 27,500 4,400 1,870 1,260 109 E/T 3)
Bas Barkarby, Barkarby 2:64, Järfälla 24,300 830 720 54 E/T 3)
Parkhusen, phase 1, Gränby 25:1, Uppsala 100 2,700 120 110 6 –
ReconstructionForumkvarteret, Dragarbrunn 27:2, Uppsala 6,200 7,500 1,400 1,300 360 80 50 92Formalinfabriken, Sicklaön 83:39, Nacka 2,100 60 20 4 E/T 3)
Panncentralen, Sicklaön 83:33, Nacka 1,000 90 70 E/T 3) 100
Tenant-owned dwellingsBrf Sicklastråket, Sicklaön 83:40, Nacka 4,500 300 220 E/T 46 7)
Total 14,800 66,300 15,800 21,300 13,800 5,410 3,390 2,743 6)

12 Q3 2019 ATRIUM LJUNGBERG
FORUMKVARTERET – UPPSALAForumkvarteret – We are in the final phase of a major reconstruction work in Forumkvarteret in the centre of Uppsala. Work will continue in the autumn of 2019 to develop new, modern office spaces in the upper levels of the property. Rental agreements have been signed with Academic Work, Tengbom Arkitekter, Helenius VVS-konsulter and Previa which will all move in during 2019.
MOBILIA – MALMÖMobilia Torghuset – Work continues on the new construction and extension of approximately 12,900 m2. Internal work and the final touches to the framework are currently underway. Adaptations are being made for the tenants, Nordisk Film and Funnys Äventyr, while the residentials are being fitted out. Funnys Äventyr is planning to move in around the start of 2020. Occupancy of the 74 rental apart-ments will take place in May 2020, while Nordic Film and Funnys Äventyr are planning to open in the fourth quarter of the same year.
POTENTIAL DEVELOPMENT PROJECTSOur current project portfolio with new constructions and develop-ment projects enables future investments of approximately SEK 24 billion, which includes potential land acquisitions through land allocations.
In terms of area, more than 50 per cent of the project portfolio comprises offices, about 35 per cent residentials, while the remainder is retail/service, education and culture. The project portfolio is divided among the majority of our areas with Sickla, Slakthusområdet and Gränbystaden accounting for approximately 70 per cent. The rate at
which we can complete the projects depends on the market situation and the progress made in the detailed development plan process. A project market area is not usually started until we have secured a minimum return in the form of signed lease contracts.
Here is a selection of the projects that we expect to start in 2019–2021. Some projects are covered by current detailed development plans and others are dependent on new detailed development plans.
POTENTIAL PROJECT STARTS 2019–2021Here is a selection of potential project starts 2019–2021.
In Sickla there are plans to extend Sickla galleria by approximately 3,000 m2 GFA for retail, plus a two-storey parking garage with approxi-mately 220 spaces. The parking garage will provide the parking spaces needed for the Curanten and Stationshuset projects. There is a complete detailed development plan for this expansion, the projection is being prepared and construction is expected to start in 2019.
Sales are in progress of the first tenant-owned apartments of a total of 500 at Nobelberget. The development of the remaining apartments will be carried out gradually depending on market demand. At Nobelberget we want to create an attractive and dense urban environment with residentials as well as office premises and cultural activities.
We have a development right for approximately 7,500 m² GFA at Sickla station, where Tvärbanan and Saltsjöbanan will be linked via the new underground station. Work is underway to produce a new detailed development plan with an extended development right, which will include a 23-storey building and approximately 21,000 m² GFA. This building will house both an underground station and offices.
1) Anticipated premises use may change and may include other elements.2) The investment volume relates to investments in existing properties and future development
rights, including any land acquisitions.3) Of which approximately 60,000 m2 of GFA refers to reconstruction.4) Of which approximately 200,000 m2 of GFA refers to land allocations.
CONT. OUR INVESTMENTS AND PROJECTS
Project area, m², GFA
MunicipalityPremises type 1)
Detailed develop-
ment plan exists
Change to detailed
development plan required
Potential investment,
SEK m 2)
Barkarby Järfälla Offices 20,000Lindholmen Gothenburg Offices 35,000Hagastaden Stockholm Offices 21,000Hagastaden Stockholm Retail 1,000Mobilia Malmö Offices 7,000Sickla Nacka Education 9,000Sickla Nacka Apartments 41,000 94,000Sickla Nacka Offices 22,000Sickla Nacka Retail 5,000Slakthusområdet Stockholm Training 7,000Slakthusområdet Stockholm Apartments 44,000Slakthusområdet Stockholm Offices 77,000Slakthusområdet Stockholm Retail 28,000Slakthusområdet Stockholm Culture/
restaurant11,000
Sundbyberg Sundbyberg Offices 39,000Södermalm Stockholm Offices 69,000Södermalm Stockholm Retail 7,000Uppsala Uppsala Apartments 18,000 21,000Uppsala Uppsala Offices 46,000Uppsala Uppsala Retail 5,000 23,000Total 3) 4) 173,000 477,000 24,000
Potential projectsSLAKTHUSOMRÅDET – Slakthusområdet is being devel-oped into a new dynamic city district and a meeting place for food, culture and experiences. This summer the people living in Stockholm were given a taste of what’s to come in our collaboration with Parkteatern in Förbindelsehallen.
13Q3 2019 ATRIUM LJUNGBERG
Consultation is planned for the fourth quarter of 2019. Preparatory work on the underground station will start at the beginning of 2020.
There is an opportunity for us to create a new 16-storey residential building with approximately 80 apartments as well as retail and offices on the ground floors. The preparatory work on the station entrance is planned for the autumn of 2021.
Gränbystaden, the development of Uppsala’s second city centre continues. Construction of the first residential phase in Parkhusen is planned to start in the autumn of 2019, but there is also the potential for approximately 200 additional apartments within the framework of the existing detailed development plan.
In northern Gränbystaden there is the possibility of developing 5,000 m2 GFA for retail and offices on the remaining land within the existing detailed development plan.
In May 2019, we obtained a new land allocation with a development right for potentially 45,000 m2 GFA south of Gränbystaden Galleria. The plan is to develop the area into a new office cluster. Detailed develop-ment planning is underway and expected to be complete in 2020.
At Mobilia in Malmö we have a development right of 6,800 m2 GFA for offices on Trelleborgsvägen. Construction could potentially start in the first quarter of 2021 once Torghuset is complete.
SLAKTHUSOMRÅDETIn June 2019, Atrium Ljungberg took possession of 14 properties totalling approximately 51,000 m2 of letting area. We also have an option to acquire an investment property of 32,000 m2 of letting area. This deal also includes additional options, with Atrium Ljungberg being able to order land allocations of approximately 100,000 m2 GFA. The acquisitions and developed land allocations amount to a total of approximately 200,000 m2 GFA for offices and residentials, supple-mented with culture, retail, a restaurant, hotel, education, etc. The total investment, including acquisitions, amounts to approximately SEK 8 billion for the period 2019–2030. The first acquisition has already been made.
Slakthusområdet is one of Stockholm’s largest urban develop-ment projects. Detailed development planning work is underway for the first stage and construction start is planned for the first quarter of 2023. A preliminary study is being carried out with the City of Stockholm to enable us to start several detailed development stages in the new year.
We are working alongside other property owners in the area to create a strong destination; a meeting place for food, culture and experiences in Stockholm. This will become an engine for the entire Söderort.
CONT. INVESTMENTS AND PROJECTS
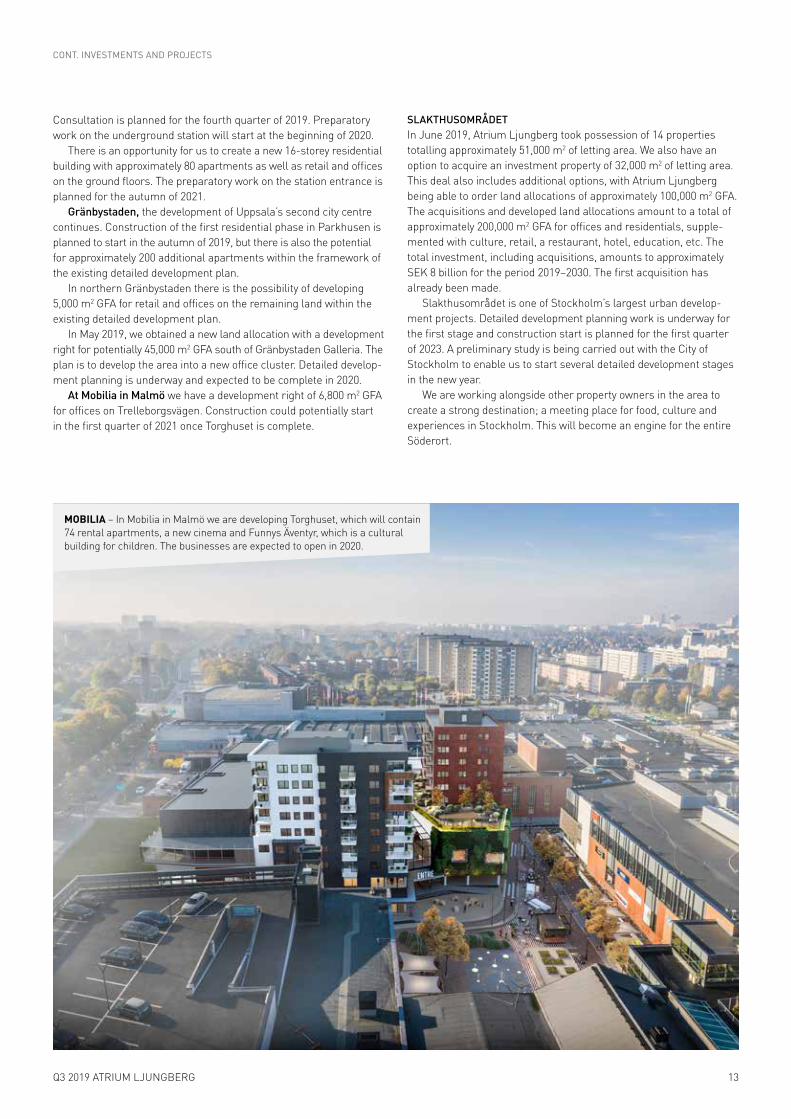
MOBILIA – In Mobilia in Malmö we are developing Torghuset, which will contain 74 rental apartments, a new cinema and Funnys Äventyr, which is a cultural building for children. The businesses are expected to open in 2020.

14 Q3 2019 ATRIUM LJUNGBERG
FINANCINGTHE FINANCIAL MARKETThe strong global economy was impacted heavily in the third quarter by worse future prospects, the trade war between the USA and China, and a possible hard Brexit. The central banks are pursuing an expansive monetary policy with low key interest rates. Interest rates remain very low and are expected to stay that way for a long time to come. However, low interest rates are positive in the long term for capital-intensive industries, such as the property sector.
Swedish GDP reported a negative growth in the second quarter of this year, primarily due to a drop in investments. Employment also fell for the second quarter in a row and it is now clear that the Swedish economy has entered a slowdown phase. At the beginning of October the National Institute of Economic Research assessed growth in GDP to be 1.2 per cent for 2019 and 1.1 per cent for 2020.
During the last quarter, the variable rate, 3M Stibor, decreased from –0.03 per cent at the middle of the year to –0.09 percent at the end of September. The 10-year swap interest rate fell strongly during the quarter and was 0.26 per cent at the end of the quarter compared with 0.54 percent at the middle of the year.
INTEREST-BEARING LIABILITIESAtrium Ljungberg meets its financing requirements through the capital market, Nordic banks and direct financing. Interest-bearing liabilities at the end of the period amounted to SEK 19,687 million (SEK 19,036 m). In the third quarter, interest-bearing liabilities decreased by SEK 820 million, primarily due to the sale of two properties in Kista. Outstanding bonds under the MTN programme amounted to SEK 8,645 million (SEK 7,104 m).
The average interest rate at the end of the period amounted to 1.7 per cent (1.4 %). Including unutilised loan guarantees the average interest rate was 1.8 per cent (1.5 %). The average fixed interest term was 5.6 years (4.2 years) and the average capital commitment term was 4.9 years (3.4 years). The interest coverage ratio for the period amounted to 4.5 (5.1). According to the company’s financial goals, the gearing ratio is to be less than 45 per cent over the long term. At the end of the quarter it amounted to 41.8 per cent (43.8 %).
Unutilised loan guarantees in addition to loan guarantees which cover outstanding commercial papers amounted to SEK 2,723 million (SEK 390 m). The unutilised overdraft facility amounted to SEK 300 million (SEK 300 m).
COLLATERALAtrium Ljungberg’s borrowing is partly secured by real estate mortgages. Of the interest-bearing liabilities, SEK 8,312 million (SEK 8,448 m) is secured by mortgage deeds which corresponds to 17 per cent (19 %) in relation to the total assets.
GREEN FINANCINGAtrium Ljungberg is creating attractive and sustainable cities as part of our sustainability strategy. We are focusing on improving resource efficiency, which will reduce our environmental impact. This also enables us to apply green financing. Green financing accounts for 35 per cent of the total loan volume. At the end of the period, there were SEK 5,916 million (SEK 4,500 m) in green bonds outstanding, as well as SEK 913 million (SEK – m) of green bank loans.
Capital structure
– Secured loans correspond to 17 per cent in relation to total assets
Shareholders’ equity 42 % SEK 20,864 millionUnsecured loans 23 % SEK 11,374 millionSecured loans 17 % SEK 8,312 millionDeferred tax liability 10 % SEK 4,864 millionOther liabilities 9 % SEK 4,510 million
Development of financing sources– The increase in financing volume has mostly been achieved through the capital
market.
SEK billion
2015 2016 2017 2018 2019
Green bank loans
Bank loans0
5
10
15
20
Q3Q2Q1Q4Q3Q2Q1Q4Q3Q2Q1Q4Q3Q2Q1Q4Q3Q2Q1
Direct lending
Green bondsBondsCommercial papers
Interest–bearing liabilities
– SEK 19.7 billion in liabilities with 35 per cent green financing
Bank loans 32 % SEK 6,369 millionDirect loans 5 % SEK 1,030 millionGreen bank loans 5 % SEK 913 millionGreen bonds 30 % SEK 5,916 millionBonds 14 % SEK 2,729 millionCommercial papers 14 % SEK 2,729 millionSecured loans
BAS BARKARBY – In Järfälla we are building a brand new district where we are linking education with trade and industry. Järfälla Municipality will lease almost 11,000 m2 for upper secondary education, a multi-purpose hall and a library. Occupancy of the first stage of two is planned for 2022.
15Q3 2019 ATRIUM LJUNGBERG
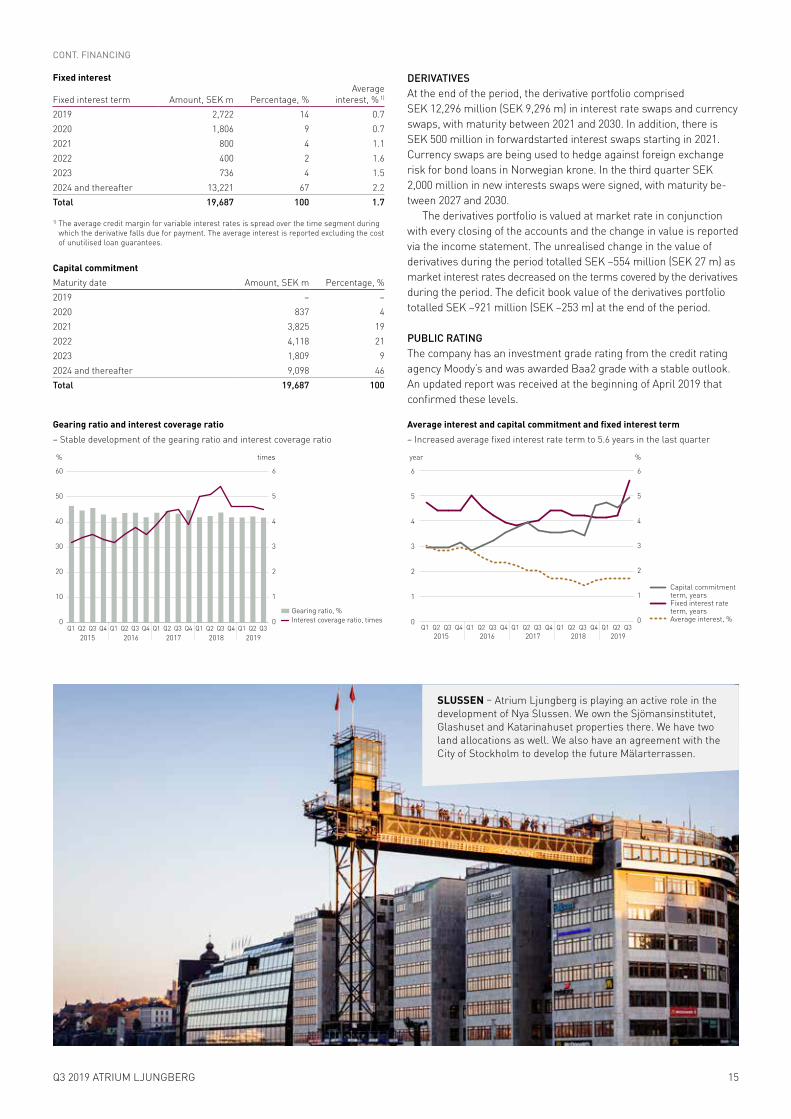
Gearing ratio and interest coverage ratio
– Stable development of the gearing ratio and interest coverage ratio
% times
0
10
20
30
40
50
60
Q3Q2Q1Q4Q3Q2Q1Q4Q3Q2Q1Q4Q3Q2Q1Q4Q3Q2Q1
Gearing ratio, %Interest coverage ratio, times
2015 2016 2017 2018 2019
0
1
2
3
4
5
6
CONT. FINANCING
Average interest and capital commitment and fixed interest term
– Increased average fixed interest rate term to 5.6 years in the last quarter
year
2015 2016 2017 2018 2019
0
1
2
3
4
5
6
Q3Q2Q1Q4Q3Q2Q1Q4Q3Q2Q1Q4Q3Q2Q1Q4Q3Q2Q1
Capital commitment term, yearsFixed interest rate term, yearsAverage interest, %
%
0
1
2
3
4
5
6
DERIVATIVESAt the end of the period, the derivative portfolio comprised SEK 12,296 million (SEK 9,296 m) in interest rate swaps and currency swaps, with maturity between 2021 and 2030. In addition, there is SEK 500 million in forwardstarted interest swaps starting in 2021. Currency swaps are being used to hedge against foreign exchange risk for bond loans in Norwegian krone. In the third quarter SEK 2,000 million in new interests swaps were signed, with maturity be-tween 2027 and 2030.
The derivatives portfolio is valued at market rate in conjunction with every closing of the accounts and the change in value is reported via the income statement. The unrealised change in the value of derivatives during the period totalled SEK –554 million (SEK 27 m) as market interest rates decreased on the terms covered by the derivatives during the period. The deficit book value of the derivatives portfolio totalled SEK –921 million (SEK –253 m) at the end of the period.
PUBLIC RATINGThe company has an investment grade rating from the credit rating agency Moody’s and was awarded Baa2 grade with a stable outlook. An updated report was received at the beginning of April 2019 that confirmed these levels.
Fixed interest
Fixed interest term Amount, SEK m Percentage, %Average
interest, % 1)
2019 2,722 14 0.72020 1,806 9 0.72021 800 4 1.12022 400 2 1.62023 736 4 1.52024 and thereafter 13,221 67 2.2Total 19,687 100 1.7
1) The average credit margin for variable interest rates is spread over the time segment during which the derivative falls due for payment. The average interest is reported excluding the cost of unutilised loan guarantees.
Capital commitmentMaturity date Amount, SEK m Percentage, %2019 – –2020 837 42021 3,825 192022 4,118 212023 1,809 92024 and thereafter 9,098 46Total 19,687 100
SLUSSEN – Atrium Ljungberg is playing an active role in the development of Nya Slussen. We own the Sjömansinstitutet, Glashuset and Katarinahuset properties there. We have two land allocations as well. We also have an agreement with the City of Stockholm to develop the future Mälarterrassen.

16 Q3 2019 ATRIUM LJUNGBERG
CONSOLIDATED STATEMENTS OF CASH FLOW
COMMENTS ON THE CASH FLOW STATEMENTThe cash flow from operating activities totalled SEK 1,126 million (SEK 990 m), corresponding to SEK 8.66/share (SEK 7.48). The higher cash flow during the period compared to the same period last year is mainly explained by the change in operating capital.
Investment activities have contributed to a negative cash flow by SEK –1,387 million (SEK –741 m), primarily relating to the acquisition of properties and investments in own properties.
The cash flow in financing activities amounted to SEK 423 million (SEK –225 m) as a result of new loans.
Available liquidity amounted to SEK 3,521 million (SEK 1,058 m) and comprised of bank deposits of SEK 498 million (SEK 368 m), unutilised overdraft facilities of SEK 300 million (SEK 300 m) and unutilised lines of credit of SEK 2,723 million (SEK 390 m) in addition to credit facilities covering outstanding commercial paper.
Amounts in SEK m
Period2019
1/1–30/9
Period2018
1/1–30/9
Quarter2019
1/7–30/9
Quarter2018
1/7–30/9
Full year2018
1/1–31/12
12 months2018/20191/10–30/9
OPERATING ACTIVITIESProfit/loss before changes in value 945 937 318 317 1,214 1,221Reversal of depreciation and write-downs 9 8 3 3 11 12Other items not included in the cash flow 32 0 32 1 17 49Tax paid –23 –34 –10 –9 –14 –3Cash flow from operating activities before change in working capital 962 911 343 311 1,228 1,278
Net change in working capital 164 79 –8 132 32 117Cash flow from operating activities 1,126 990 336 442 1,260 1,395
INVESTMENT ACTIVITIESAcquisition of investment properties –1,166 –599 –6 –432 –2,159 –2,726Reconstruction and new construction of investment properties –1,217 –1,176 –402 –401 –1,758 –1,799Sale of investment properties 1,016 1,047 1,016 – 3,582 3,551Investment in financial fixed assets –6 – 2 – – –6Purchase/sale of equipment –15 –13 –9 –2 –13 –15Cash flow from investment activities –1,387 –741 601 –834 –348 –994
FINANCING ACTIVITIESChange in other long-term liabilities 4 10 –1 4 10 4Loans raised 4,287 4,090 743 1,650 5,867 6,064Amortisation of debts –3,138 –3,303 –1,572 –796 –5,612 –5,447Exercise of derivatives – –191 – –191 –191 –Dividends paid –631 –599 – – –599 –631Buy-back of own shares –99 –232 – –8 –396 –263Cash flow from financing activities 423 –225 –829 659 –920 –272
Cash flow for the period 163 24 108 268 –8 130Liquid assets at the beginning of the period 335 344 390 100 344 368Liquid assets at the end of the period 498 368 498 368 335 498
17Q3 2019 ATRIUM LJUNGBERG
SUSTAINABILITYSUSTAINABLE ENTERPRISEOne of Atrium Ljungberg’s overall operational goals is Corporate Social Responsibility. In this context we have defined four sustainability goals which are monitored quarterly:
› By 2021, 100 per cent of our investment properties will be environ-mentally certified (with the exception of project properties and properties acquired over the past two years).
› Energy consumption per square metre will decrease by 30 per cent between 2014 and 2021.
› The proportion of green lease contracts will be 50 per cent of the contracted annual rent by 2021.
› We will be one of Sweden’s best workplaces, which forms part of our aim to have sustainable employees and to be an attractive employer.
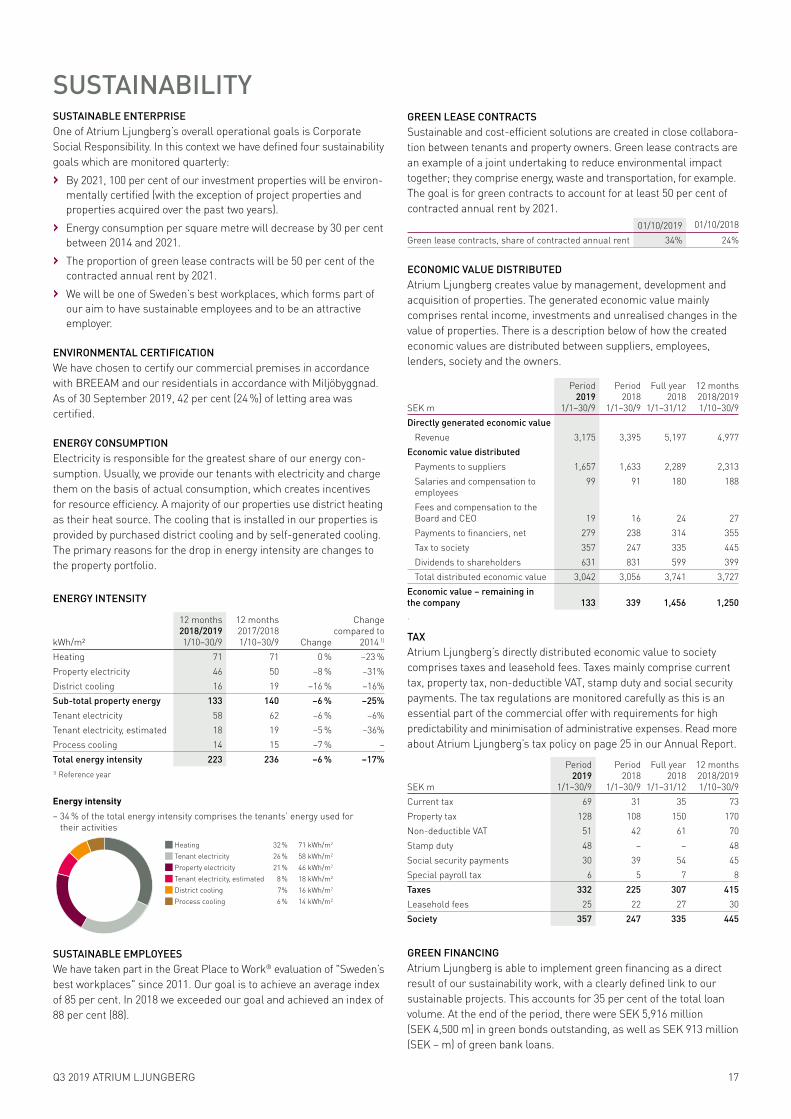
ENVIRONMENTAL CERTIFICATIONWe have chosen to certify our commercial premises in accordance with BREEAM and our residentials in accordance with Miljöbyggnad. As of 30 September 2019, 42 per cent (24 %) of letting area was certified.
ENERGY CONSUMPTIONElectricity is responsible for the greatest share of our energy con-sumption. Usually, we provide our tenants with electricity and charge them on the basis of actual consumption, which creates incentives for resource efficiency. A majority of our properties use district heating as their heat source. The cooling that is installed in our properties is provided by purchased district cooling and by self-generated cooling. The primary reasons for the drop in energy intensity are changes to the property portfolio.
ENERGY INTENSITY
kWh/m²
12 months2018/20191/10–30/9
12 months2017/20181/10–30/9 Change
Change compared to
2014 1)
Heating 71 71 0 % –23 %Property electricity 46 50 –8 % –31%District cooling 16 19 –16 % –16%Sub-total property energy 133 140 –6 % –25%Tenant electricity 58 62 –6 % –6%Tenant electricity, estimated 18 19 –5 % –36%Process cooling 14 15 –7 % –Total energy intensity 223 236 –6 % –17%1) Reference year
SUSTAINABLE EMPLOYEESWe have taken part in the Great Place to Work® evaluation of "Sweden’s best workplaces" since 2011. Our goal is to achieve an average index of 85 per cent. In 2018 we exceeded our goal and achieved an index of 88 per cent (88).
GREEN LEASE CONTRACTSSustainable and cost-efficient solutions are created in close collabora-tion between tenants and property owners. Green lease contracts are an example of a joint undertaking to reduce environmental impact together; they comprise energy, waste and transportation, for example. The goal is for green contracts to account for at least 50 per cent of contracted annual rent by 2021.
01/10/2019 01/10/2018
Green lease contracts, share of contracted annual rent 34% 24%
ECONOMIC VALUE DISTRIBUTEDAtrium Ljungberg creates value by management, development and acquisition of properties. The generated economic value mainly comprises rental income, investments and unrealised changes in the value of properties. There is a description below of how the created economic values are distributed between suppliers, employees, lenders, society and the owners.
SEK m
Period2019
1/1–30/9
Period2018
1/1–30/9
Full year2018
1/1–31/12
12 months2018/20191/10–30/9
Directly generated economic valueRevenue 3,175 3,395 5,197 4,977
Economic value distributedPayments to suppliers 1,657 1,633 2,289 2,313Salaries and compensation to employees
99 91 180 188
Fees and compensation to the Board and CEO 19 16 24 27Payments to financiers, net 279 238 314 355Tax to society 357 247 335 445Dividends to shareholders 631 831 599 399Total distributed economic value 3,042 3,056 3,741 3,727
Economic value – remaining in the company 133 339 1,456 1,250.
TAXAtrium Ljungberg’s directly distributed economic value to society comprises taxes and leasehold fees. Taxes mainly comprise current tax, property tax, non-deductible VAT, stamp duty and social security payments. The tax regulations are monitored carefully as this is an essential part of the commercial offer with requirements for high predictability and minimisation of administrative expenses. Read more about Atrium Ljungberg’s tax policy on page 25 in our Annual Report.
SEK m
Period2019
1/1–30/9
Period2018
1/1–30/9
Full year2018
1/1–31/12
12 months2018/20191/10–30/9
Current tax 69 31 35 73Property tax 128 108 150 170Non-deductible VAT 51 42 61 70Stamp duty 48 – – 48Social security payments 30 39 54 45Special payroll tax 6 5 7 8Taxes 332 225 307 415Leasehold fees 25 22 27 30Society 357 247 335 445
GREEN FINANCINGAtrium Ljungberg is able to implement green financing as a direct result of our sustainability work, with a clearly defined link to our sustainable projects. This accounts for 35 per cent of the total loan volume. At the end of the period, there were SEK 5,916 million (SEK 4,500 m) in green bonds outstanding, as well as SEK 913 million (SEK – m) of green bank loans.
Heating 32 % 71 kWh/m2
Tenant electricity 26 % 58 kWh/m2
Property electricity 21 % 46 kWh/m2
Tenant electricity, estimated 8 % 18 kWh/m2
District cooling 7 % 16 kWh/m2
Process cooling 6 % 14 kWh/m2
Energy intensity
– 34 % of the total energy intensity comprises the tenants’ energy used for their activities

18 Q3 2019 ATRIUM LJUNGBERG
Atrium Ljungberg's segmentation is based on two business areas: Properties and Project and construction activities.
1) The profit within project development mainly refers to costs of investigations at early project stages and ongoing development projects. 2) Properties, unrealised SEK 1,597 million (SEK 1,390 m). Properties, realised SEK 59 (9) million.3) Unrealised value changes derivatives SEK –554 million (SEK 27 m). Realised changes in value of derivatives – (1).4) Refers only to Investment Properties. Other assets attributable to the segment are reported under Non-allocated items and eliminations. 5) Refers only to Development Properties. Other assets attributable to the segment are reported under Non-allocated items and eliminations.
SEGMENT REPORTING
30/09/2019
Amounts in SEK m PropertiesProject
development 1) TL Bygg
Project and construction
activities
Non-allocat-ed items and eliminations The Group
Rental income 1,946 –13 1,933Sales, project and construction work 13 382 395 –254 140Net sales 1,946 13 382 395 –267 2,073
Property management costs –603 8 –594Project and construction work costs – –28 –362 –390 221 –169Gross profit 1,343 –15 19 5 –37 1,310
Central administration –57 –4 –10 –14 1 –69Financial income and expenses –296 –296Profit/loss before changes in value 1,286 –18 9 –9 –333 945
Changes in value 2) 3) 1,656 –554 1,102Tax –284 –284Profit/loss for the period 2,943 –18 9 –9 –1,171 1,762
Investments and acquisitions 2,323 60 0 60 20 2,403Assets, period end 4) 5) 47,505 951 159 1,110 1,003 49,618
30/09/2018
Amounts in SEK m PropertiesProject
development 1) TL Bygg
Project and construction
activities
Non-allocat-ed items and eliminations The Group
Rental income 1,808 –9 1,799Sales, project and construction work 9 428 438 –269 169Net sales 1,808 9 428 438 –278 1,968
Property management costs –550 4 –545Project and construction work costs –41 –403 –444 258 –186Gross profit 1,257 –32 25 –7 –16 1,236
Central administration –52 –10 –12 –22 2 –72Financial income and expenses –226 –226Profit/loss before changes in value 1,205 –42 13 –28 –240 937
Changes in value 2) 3) 1,400 28 1,427Tax –213 –213Profit/loss for the period 2,605 –42 13 –28 –425 2,151
Investments and acquisitions 1,330 13 – 13 – 1,343Assets, period end 4) 5) 42,584 883 168 1,051 790 44,426
Amounts in SEK m PropertiesProject
development TL Bygg
Project and construction
activities
Non-allocat-ed items and eliminations The Group
Rental income 1,946 –13 1,933Sales, project and construction workof which Turnkey contracts, fixed price 63 63 –4 59of which Turnkey contracts, open account 180 180 –172 7of which Performance contracts, fixed price 21 21 21of which Performance contracts, open account 118 118 –64 54of which Other 13 13 –13Total Project and construction sales 13 382 395 –254 140Total Net sales 1,946 13 382 395 –267 2,073
Revenue type per segment, 30/09/2019

19Q3 2019 ATRIUM LJUNGBERG
Period2019
1/1–30/9
Period2018
1/1–30/9
Full year2018
1/1–31/12EPRA Earnings, SEK m 877 903 1,172EPRA EPS, SEK 6.75 6.86 8.99EPRA NAV, SEK m 27,172 24,282 25,416EPRA NAV, SEK/share 209.27 184.62 194.82EPRA NNNAV 2), SEK m 25,318 23,051 24,126EPRA NNNAV 2), SEK/share 195.00 175.28 184.93EPRA Vacancy rate 7 % 5 % 5 %
KEY RATIOS1)
EPRA KEY RATIOS 1)
Share price, SEK/shareEPRA NNNAV, SEK/shareEPRA NAV, SEK/share
SEK/share
80
100
120
140
160
180
200
220
80
100
120
140
160
180
200
220
Q3Q2Q1Q4Q3Q2Q1Q4Q3Q2Q1Q4Q3Q2Q1Q4Q3Q2Q12015 2016 2017 2018 2019
EPRA NAV, EPRA NNNAV and share price
– The share was traded at a premium of 4 % against EPRA NAV at the end of the period.
PROPERTY-RELATED KEY RATIOS
Period2019
1/1–30/9
Period2018
1/1–30/9
Quarter2019
1/7–30/9
Quarter2018
1/7–30/9
Full year2018
1/1–31/12
12 months2018/20191/10–30/9
Letting rate excluding project properties, % 93 95 93 95 95 93Letting rate including project property, % 92 94 92 94 94 92Operating surplus margin, % 68 70 69 70 68 67Letting area, ‘000 m² 1,177 1,167 1,177 1,167 1,129 1,177Investments in investment properties, SEK m 1,217 1,176 402 401 1,758 1,799Number of properties at period end 69 53 69 53 51 69
FINANCIAL KEY RATIOSEquity/assets ratio, % 45.0 44.0 45.0 44.0 45.9 45.0Gearing ratio, % 41.8 43.8 41.8 43.8 41.9 41.8Adjusted gearing ratio, % 41.8 43.8 41.8 43.8 41.9 41.8Interest coverage ratio 4.5 5.1 4.2 5.4 5.0 4.5Average interest rate for interest-bearing liabilities, % 1.7 1.4 1.7 1.4 1.6 1.7Return on shareholders’ equity, % 11.1 15.2 10.0 8.6 17.7 14.8Return on shareholders’ equity, excluding changes in value, % 4.7 5.2 4.6 5.1 5.1 4.8Return on total assets, % 9.9 7.9 4.7 6.0 9.3 15.8Return on total assets excluding changes in value, % 2.8 2.8 2.7 2.8 2.7 2.7
DATA PER SHAREEarnings per share, SEK 13.55 16.25 4.13 3.18 26.15 23.51Profit/loss before changes in value less nominal tax, SEK 5.72 5.56 1.93 1.88 7.26 7.38Cash flow, SEK 8.66 7.48 2.59 3.36 9.54 10.70Shareholders’ equity, SEK 167.41 148.67 167.41 148.67 158.64 167.41Share price, SEK 217.50 161.20 217.50 161.20 152.00 217.50Average number of outstanding shares, ‘000 130,062 132,326 129,839 131,536 132,019 130,325Number of outstanding shares at end of period, thousand 129,839 131,529 129,839 131,529 130,460 129,839
EMPLOYEESAverage number of employees 323 305 319 305 302 313
1) See the definitions on pages 25–27, and see the reconciliation for key ratios at www.al.se. 2) For calculation of current net worth (EPRA NNNAV), an estimated deferred tax of 4.0 per cent has
been used.

20 Q3 2019 ATRIUM LJUNGBERG
QUARTERLY SUMMARY
2019 2019 2019 2018 2018 2018 2018 2017Amounts in SEK m Q3 Q2 Q1 Q4 Q3 Q2 Q1 Q4Rental income 653 647 633 613 601 597 601 603Sales, project and construction work 62 46 32 48 55 59 54 70Net sales 715 693 665 661 656 656 656 673Property management costs –194 –195 –206 –218 –178 –175 –192 –202Project and construction work costs –77 –55 –37 –60 –66 –65 –55 –82Gross profit 445 443 422 383 412 416 408 389— of which gross profit/loss property management (operating surplus) 460 452 427 395 423 422 409 401— of which gross profit/loss from project and construction work –15 –9 –5 –12 –11 –6 –1 –12
Central administration, property management –17 –21 –19 –21 –17 –17 –17 –21Central administration, project and construction work –3 –3 –7 –10 –6 –11 –4 –5
–20 –25 –25 –31 –23 –28 –21 –26
Financial income and expenses –107 –97 –91 –76 –72 –76 –78 –92
Profit/loss before changes in value 318 321 306 276 317 312 309 271
Properties, unrealised 283 1,166 148 1,125 174 717 499 129Properties, realised 49 –7 17 112 –1 6 5 –4Derivatives, unrealised –179 –215 –160 –97 99 –70 –2 –15Derivatives, realised – – – – 1 – – –5
152 945 5 1,140 272 653 502 105
Profit before tax 469 1,265 311 1,417 589 965 811 376Tax 65 –258 –91 –115 –171 151 –193 20Profit/loss for the period 534 1,007 220 1,301 418 1,116 618 396
2019 2019 2019 2018 2018 2018 2018 2017Property-related key ratios Q3 Q2 Q1 Q4 Q3 Q2 Q1 Q4Letting rate excluding project properties, % 93 93 94 95 95 95 95 95Letting rate including project property, % 92 93 93 94 94 94 94 95Operating surplus margin, % 69 69 66 64 70 71 68 67Letting area, ‘000 m² 1,177 1,216 1,166 1,129 1,167 1,139 1,145 1,146Investments in investment properties, SEK m 402 417 398 583 401 411 364 426Number of properties at period end 69 68 51 51 53 53 53 53
Financial key ratiosEquity/assets ratio, % 45.0 43.7 44.1 45.9 44.0 43.9 44.0 42.6Gearing ratio, % 41.8 43.2 41.8 41.9 43.8 42.4 41.9 44.7Adjusted gearing ratio, % 41.8 43.2 41.8 41.9 43.8 42.8 42.3 44.1Interest coverage ratio 4.2 4.6 4.6 4.6 5.4 5.1 5.0 3.9Average interest rate for interest-bearing liabilities, % 1.7 1.7 1.7 1.6 1.4 1.6 1.7 1.7Return on shareholders’ equity, % 10.0 19.4 4.3 25.8 8.6 23.5 13.3 8.9Return on shareholders’ equity, excluding changes in value, % 4.6 4.9 4.5 4.3 5.1 5.0 5.3 4.6Return on total assets, % 4.7 11.8 3.5 13.3 6.0 9.6 8.3 4.4Return on total assets excluding changes in value, % 2.7 2.8 2.7 2.5 2.8 2.8 2.8 2.7
Data per shareEarnings per share, SEK 4.13 7.74 1.69 9.93 3.18 8.44 4.64 2.98Profit/loss before changes in value less nominal tax, SEK 1.93 1.94 1.85 1.65 1.88 1.85 1.81 1.59EPRA EPS, SEK 2.38 2.30 2.08 2.06 2.61 2.13 2.10 1.90Cash flow, SEK 2.59 3.45 2.59 2.05 3.36 1.75 2.37 2.72Shareholders’ equity, SEK 167.41 163.27 155.48 158.64 148.67 145.46 141.45 136.79Long-term net worth (EPRA NAV), SEK 209.27 204.65 193.37 194.82 184.62 182.13 178.44 172.59Current net worth (EPRA NNNAV), SEK 3) 195.00 191.80 182.29 184.93 175.28 171.17 168.22 162.57Share price, SEK 217.50 167.80 158.80 152.00 161.20 144.60 123.00 130.30Average number of outstanding shares, ‘000 129,839 129,991 132,019 131,107 131,536 132,240 133,221 133,221Number of outstanding shares at end of period, thousand 129,839 129,839 130,163 130,460 131,529 131,576 133,221 133,2211) See definitions pages 25–27.2) See reconciliation for key ratios on Atrium Ljungberg’s website.3) For calculation of current net worth (EPRA NNNAV), an estimated deferred tax of 4.0 per cent has been used.
INCOME STATEMENTS
KEY RATIOS 1) 2)

21Q3 2019 ATRIUM LJUNGBERG
PARENT COMPANYThe Parent Company’s operations comprise Group-wide functions and the organisation for the management of the properties owned by the Parent Company and the subsidiaries.
Net sales totalled SEK 251 million (SEK 292 m). Operating profit/loss totalled SEK –270 million (SEK 27 m). Profit/loss after financial items totalled SEK –101 million (SEK –31 m).
Interest-bearing liabilities amounted to SEK 15,664 million (SEK 16,179 m). These funds finance the parent company’s property portfolio and are lent on to other Group companies.
OTHER INFORMATIONOUTLOOK FOR 2019Atrium Ljungberg’s outlook remains positive. Despite signs of the economy slowing down, we believe that our strong locations com-bined with our project development will contribute to continued value growth for our company. The full year forcast for profit before changes in value is SEK 1,200, compared with the result of SEK 1,214 million in 2018. The forecast for profit after tax is SEK 1,820 million, corre-sponding to SEK 14.00/share. Changes in value and any other future property acquisitions and sales have not been taken into account in the forecast. The investment volume in own properties for 2019 is assessed to amount to approximately SEK 1,700 million. This reduction is related to projects that started later than had been expected.
BUY-BACK OF SHARESOn 28 March 2018, the Board of Atrium Ljungberg decided to initiate a buy-back of its own shares. The buy-back programme started on 20 April 2018. The aim of the programme is to secure the supply of shares in accordance with the Group’s stock option programme, and to give the Board more flexibility in its work on the company’s capital
structure, which will therefore help to increase shareholder value. As of 30 September the company owned 3,382,000 class B shares. The buy-back has been in the range of SEK 132.20–165.96 per share.
NUMBER OF OUTSTANDING SHARESAt the end of the period the parent company had issued a total of 94,500 call options, which entitle Atrium Ljungberg’s staff to acquire the equivalent number of class B shares. The underlying share price reached a rate on the closing day and during parts of this period that would justify a redemption of these options. However, no dilution from the utilisation of these options has been taken into account when calculating earnings per share, as the effect is immaterial.
RETAIL SECTOR’S SALES TRENDIn the first eight months of the year, total sales at our four regional retail hubs – Sickla, Farsta Centrum, Gränbystaden and Mobilia – increased by an overall 4.5 per cent compared to the same period of the previous year. Gränbystaden is the retail hub with the highest percentage sales increase of the four.
Amounts in SEK m
Period2019
1/1–30/9
Period2018
1/1–30/9
Full year2018
1/1–31/12Rental income 145 134 176Management income 106 158 300Net sales 251 292 476
Property costs –31 –44 –61Management and administration expenses –307 –205 –364Capital gain/loss from sale of properties –167 – –72Depreciation –16 –16 –21Operating profit –270 27 –42
Result of participations in Group companies – – 500Interest income and similar profit items 464 420 565Interest expenses and similar profit items –295 –478 –574
169 –58 491
Profit after financial items –101 –31 449Appropriations – –1 185
Profit before tax –101 –32 634Current tax –1 7 –35Deferred tax 123 –1 12
122 6 –23Profit/loss for the period 21 –26 611
Amounts in SEK m 30/09/2019 30/09/2018 31/12/2018ASSETSTangible fixed assets 1,102 1,607 1,498Financial fixed assets 888 897 956Current assets 20,656 20,882 19,734Total assets 22,646 23,386 22,188
SHAREHOLDERS’ EQUITY AND LIABIL-ITIESShareholders’ equity 6,680 6,908 7,381Untaxed reserves 61 61 61Provisions 66 98 99Long-term liabilities 15,668 13,547 14,483Current liabilities 171 2,772 164Total shareholders’ equity and liabilities 22,646 23,386 22,188
22 Q3 2019 ATRIUM LJUNGBERG
ACCOUNTING PRINCIPLESAtrium Ljungberg’s consolidated accounts have been prepared in accordance with the International Financial Reporting Standards (IFRS). The Interim Report has been prepared in accordance with IAS 34 Interim Financial Reporting and the Swedish Annual Accounts Act. The Parent Company applies Swedish Financial Reporting Board's recommendation, RFR 2 Accounting for Legal Entities, and the Swedish Annual Accounts Act. The accounting principles applied conform to those described in the 2018 Annual Report, except for the implementation of IFRS 16 Leasing.
Also refer to note IK 4 in the 2018 Annual Report, which shows the reconciliation between the leasing information in accordance with IAS 17 and IFRS 16 as of 1 January 2019.
In the parent company the leaseholds continue to be recognised as operating leases in accordance with the exception in RFR 2.
Valuation method for investment propertiesInvestment properties are valued at fair value in the Balance Sheet. The valuation took place in accordance with level 3 in the IFRS valuation hierarchy.
Valuation method for derivativesDerivatives (interest swap agreements) are valued at fair value in the Balance Sheet. Pursuant to the IFRS valuation hierarchy, the fair value of derivatives has been valued in accordance with level 2. This level means that the valuation is based on input data other than the listed prices, and which are observable for the asset or the liability, either directly or indirectly. The derivative agreements (ISDA agree-ments) include an option to net obligations in respect of the same counterparty.
Fair value interest-bearing liabilitiesAccording to the Balance Sheet, the Group's reported interest-bearing liabilities total SEK 19,687 million (SEK 19,036 m) and their fair value totals SEK 20,008 million (SEK 19,116 m). The fair value calculation is based on discounted estimated future cash flows. The discounting is effected on the basis of current market rates plus the relevant borrowing margin. The valuation is hereby conducted with IFRS valua-tion hierarchy level 2. Atrium Ljungberg is of the opinion, with regard to other financial assets and liabilities reported at accrued acquisition value, that the differences between book values and fair values are insignificant.
CHANGES TO ACCOUNTING PRINCIPLES AS A RESULT OF NEW IFRSIFRS 16 LEASESThe new standard requires lessees to report assets and liabilities attributable to all lease agreements, with the exception of agree-ments which are shorter than twelve months and/or refer to small amounts. For lessees, the standard does not entail any immediate changes to reporting compared to current standards.
Following the implementation of IFRS 16 on 1 January 2019 Atrium Ljungberg has recognised a right-of-use asset and a leasing liability in the balance sheet attributable to leaseholds. Leaseholds are considered to be perpetual leases in terms of IFRS 16 and are recognised at their fair value. This means that instead of being
depreciated, the value of this right-of-use asset remains the same until the next renegotiation of the leasehold fee. The right-of-use asset is recognised in the balance sheet in the “Leaseholds” item. A long-term leasing liability is recognised that corresponds to the value of the right-of-use asset. The leasing liability is not amortised, with the value remaining unchanged until the renegotiation of the relevant leasehold fee.
The income statement has been affected by leasehold fees being reclassified from “Property management costs” to net financial expenses. The leasehold fees that are paid are recognised in their entirety as an interest expense as these leases are considered to be perpetual leases.
The cash flow statements will not be affected by the implementa-tion of IFRS 16, as the cash flow statements are based on “Profit before changes in value”.
Atrium Ljungberg has chosen to apply the simplified method and will not apply the standard retrospectively. In accordance with the simplified transition method, the comparison figures for 2018 have not been recalculated.
Atrium Ljungberg has elected to reverse the effect of the imple-mentation of IFRS 16 when calculating the alternative performance measures that are presented in this report. This means that some of the definitions of the alternative performance measures have been changed. For more information, see pages 25–27.
EPRAAtrium Ljungberg reports EPRA EPS, EPRA Vacancy rate, EPRA NAV as well as EPRA NNNAV in accordance with the European Public Real Estate Association’s definitions.
When calculating the EPRA NNNAV (the triple net asset value), an estimated deferred tax of 4.0 per cent has been used for properties. The calculation of the tax rate is based on a discount rate of three per cent (real) and the fact that the property portfolio is realised over 50 years, where ten per cent of the properties are sold through transfer of property with a nominal tax rate of 20.6 per cent, and that 90 per cent are sold indirectly through transfer of shares with a tax deduction for the buyer of six per cent.
ALTERNATIVE PERFORMANCE MEASURESAtrium Ljungberg applies the guidelines of the European Securities and Markets Authority (ESMA) on Alternative Performance Measures (APMs). According to these guidelines, an APM is a financial measure of historical or future profit performance, financial position, financial results or cash flows which are not defined or stated in applicable rules for financial reporting; IFRS and the Swedish Annual Accounts Act.
Reconciliation of APMs is available on Atrium Ljungberg’s website, www.al.se.
ROUNDING OFFDue to the effects of rounding off, figures presented in this interim report may not exactly match the totals in certain cases, and percentages may differ from the exact percentages.
CONT. OTHER INFORMATION
23Q3 2019 ATRIUM LJUNGBERG
MARKET DEVELOPMENT, RISKS AND UNCERTAINTY FACTORSAtrium Ljungberg’s property portfolio, with office, retail and full-service environments, is primarily located in strong subsidiary markets in the expanding regions Stockholm, Gothenburg, Malmö and Uppsala. The primary prioritised risk management areas, in light of both their complexity and size of the amounts involved, are letting, property valua-tion, project activities and financing. The company has good procedures for managing these risks and also has a strong financial position with strong key ratios, such as a low gearing ratio and high interest coverage ratio.
For further information on risks and uncertainty factors in general, please see Atrium Ljungberg’s 2018 Annual Report and the section entitled “Risks and risk management” on pages 72–76.
CHANGES OF RULES IN THE AREA OF TAXOn 14 June 2018 the Swedish Parliament decided on amendments to the Swedish Income Tax Act with regard to the tax rules for companies. This change in the law came into force on 1 January 2019 and limits the right to deduct interest for negative net interest income to 30 per cent of taxable EBITDA. In its current financial position Atrium Ljungberg will not be affected by this change, but a low level of capital lock-in could occur in individual subsidiaries. The company tax rate for the 2019 tax year has been reduced to 21.4 per cent (22.0 per cent in 2018). The reduction in the company tax rate is taking place in two stages from 2019. The next reduction will be in 2021, when the
company tax rate will be 20.6 per cent. A general deduction, referred to as a primary deduction, has been introduced, with a deduction for impairment of 2 per cent per year for the first six years. This applies to newly-constructed buildings that are classified as apartment blocks according to the cadastral survey.
According to the Treasury Department, the parcelling study continues to be subject to administration.
ANNUAL GENERAL MEETING 2020The Annual General Meeting for 2020 will be held on Wednesday 25 March at 17.00 at Filmstaden Sickla, Nacka.
Shareholders who would like an item to be discussed at this meeting should submit their proposal by 5 February 2020 so that the item can be included in the notice to convene the meeting.
EVENTS AFTER THE CLOSING DAYNo significant events have occurred since the closing day.
Nacka, 18 October 2019
Annica Ånäs, CEO
CONT. OTHER INFORMATION
AUDITOR’S REPORT
Atrium Ljungberg, reg. no. 556175-7047
IntroductionWe have reviewed the condensed interim financial information (interim report) of Atrium Ljungberg as of 30 September 2019 and the nine-month period then ended. The board of directors and the CEO are responsible for the preparation and presentation of the interim financial information in accordance with IAS 34 and the Swedish Annual Accounts Act. Our responsibility is to express a conclusion on this interim report based on our review.
Scope of ReviewWe conducted our review in accordance with the International Standard on Review Engagements ISRE 2410, Review of Interim Report Performed by the Independent Auditor of the Entity. A review consists of making inquiries, primarily of persons responsible for financial and accounting matters, and applying analytical and other review procedures. A review is substantially less in scope than an audit conducted in accordance with International Standards on Auditing, ISA, and other generally accepted auditing standards in
Sweden. The procedures performed in a review do not enable us to obtain assurance that we would become aware of all significant matters that might be identified in an audit. Accordingly, we do not express an audit opinion.
ConclusionBased on our review, nothing has come to our attention that causes us to believe that the interim report is not prepared, in all material respects, in accordance with IAS 34 and the Swedish Annual Accounts Act, regarding the Group, and with the Swedish Annual Accounts Act, regarding the Parent Company.
Stockholm, 18 October 2019
Öhrlings PricewaterhouseCoopers AB
Helena EhrenborgAuthorized Public Accountant
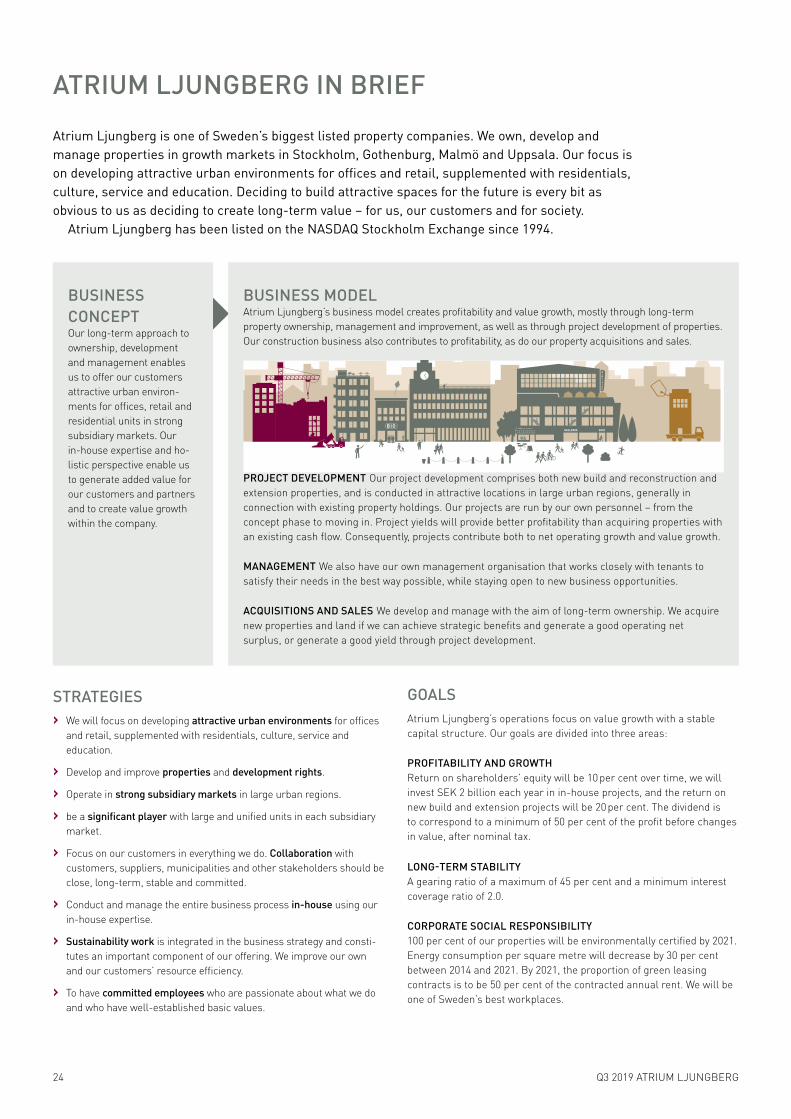
24 Q3 2019 ATRIUM LJUNGBERG
Atrium Ljungberg is one of Sweden’s biggest listed property companies. We own, develop and manage properties in growth markets in Stockholm, Gothenburg, Malmö and Uppsala. Our focus is on developing attractive urban environments for offices and retail, supplemented with residentials, culture, service and education. Deciding to build attractive spaces for the future is every bit as obvious to us as deciding to create long-term value – for us, our customers and for society.
Atrium Ljungberg has been listed on the NASDAQ Stockholm Exchange since 1994.
BUSINESS CONCEPT Our long-term approach to ownership, development and management enables us to offer our customers attractive urban environ-ments for offices, retail and residential units in strong subsidiary markets. Our in-house expertise and ho-listic perspective enable us to generate added value for our customers and partners and to create value growth within the company.
BUSINESS MODEL Atrium Ljungberg’s business model creates profitability and value growth, mostly through long-term property ownership, management and improvement, as well as through project development of properties. Our construction business also contributes to profitability, as do our property acquisitions and sales.
PROJECT DEVELOPMENT Our project development comprises both new build and reconstruction and extension properties, and is conducted in attractive locations in large urban regions, generally in connection with existing property holdings. Our projects are run by our own personnel – from the concept phase to moving in. Project yields will provide better profitability than acquiring properties with an existing cash flow. Consequently, projects contribute both to net operating growth and value growth.
MANAGEMENT We also have our own management organisation that works closely with tenants to satisfy their needs in the best way possible, while staying open to new business opportunities.
ACQUISITIONS AND SALES We develop and manage with the aim of long-term ownership. We acquire new properties and land if we can achieve strategic benefits and generate a good operating net surplus, or generate a good yield through project development.
STRATEGIES› We will focus on developing attractive urban environments for offices
and retail, supplemented with residentials, culture, service and education.
› Develop and improve properties and development rights.
› Operate in strong subsidiary markets in large urban regions.
› be a significant player with large and unified units in each subsidiary market.
› Focus on our customers in everything we do. Collaboration with customers, suppliers, municipalities and other stakeholders should be close, long-term, stable and committed.
› Conduct and manage the entire business process in-house using our in-house expertise.
› Sustainability work is integrated in the business strategy and consti-tutes an important component of our offering. We improve our own and our customers’ resource efficiency.
› To have committed employees who are passionate about what we do and who have well-established basic values.
GOALSAtrium Ljungberg’s operations focus on value growth with a stable capital structure. Our goals are divided into three areas:
PROFITABILITY AND GROWTHReturn on shareholders’ equity will be 10 per cent over time, we will invest SEK 2 billion each year in in-house projects, and the return on new build and extension projects will be 20 per cent. The dividend is to correspond to a minimum of 50 per cent of the profit before changes in value, after nominal tax.
LONG-TERM STABILITYA gearing ratio of a maximum of 45 per cent and a minimum interest coverage ratio of 2.0.
CORPORATE SOCIAL RESPONSIBILITY100 per cent of our properties will be environmentally certified by 2021. Energy consumption per square metre will decrease by 30 per cent between 2014 and 2021. By 2021, the proportion of green leasing contracts is to be 50 per cent of the contracted annual rent. We will be one of Sweden’s best workplaces.
ATRIUM LJUNGBERG IN BRIEF

25Q3 2019 ATRIUM LJUNGBERG
DEFINITIONSFINANCIAL DEFINITIONS
The effect of the implementation of IFRS 16Atrium Ljungberg has applied IFRS 16 Leasing since 1 January 2019.The implementation of IFRS 16 Leasing has resulted in Atrium Ljungberg recognising a financial asset and liability for leaseholds in the balance sheet. In the income statement leasehold fees have been reclassified from ‘Property management costs’ to net financial expenses. Atrium Ljungberg has elected to use the simplified transition method and is not applying the standard retrospectively.
In order to increase comparability, Atrium Ljungberg has elected to reverse the effect of the implementation of IFRS 16 when calculating the alternative performance measures in this report.
This means that the definitions of the following alternative performance measures have been changed:– Return on total assets, %– Return on total assets excluding changes in value, %– Gearing ratio, %– Adjusted gearing ratio, %– Interest coverage ratio, multiple– Equity/assets ratio, %– Operating surplus margin, %
Adjusted gearing ratio, % Interest-bearing liabilities, excluding the liability for financial leasing for leaseholds, as a percentage of the sum of the properties’ fair values at the end of the period, less properties acquired but not possessed and plus properties sold but not vacated.
The adjusted gearing ratio is used to illustrate Atrium Ljungberg’s financial risk.
Average capital commitment, yearsAverage remaining term until final maturity of all credits in the liabilities portfolio.
The average capital commitment is used to illustrate Atrium Ljungberg’s financial risk.
Average fixed interest, yearsAverage remaining term until interest settlement date of all credits in the liabilities portfolio.
The average fixed interest is used to illustrate Atrium Ljungberg’s financial risk.
Average interest rate for interest-bearing liabilities, %Weighted average contracted interest for all credits in the liabilities portfolio at the end of the period excluding unutilised credit facilities.
The average interest is used to illustrate Atrium Ljungberg’s financial risk.
Average number of outstanding shares Weighted average number of outstanding shares calculated in accordance with IAS 33.
Cash flow per share, SEK Cash flow from operating activities divided by the average number of out-standing shares.
Cash flow per share, SEK is used to illustrate Atrium Ljungberg’s cash flow, and particularly its dividend capacity.
Dividend pay-out ratio, % Dividend per share as a percentage of the profit/loss per share before changes in value, less applicable nominal tax.
Dividend pay-out ratio is used to illustrate how large share of the results is shifted out to the Group’s owners and reinvested in the opera-tions respectively.
Earnings per share, SEK Net profit/loss for the period divided by the average number of outstanding shares after dilution.
EPRA The European Public Real Estate Association is a trade organisation for publicly listed property companies and investors in Europe which sets standards for the financial reporting.
EPRA NAV per share, SEKReported shareholders’ equity with reversal of goodwill, interest derivatives and deferred tax, divided by the number of outstanding shares at the end of the period.
Long-term net worth (EPRA NAV) per share is used to provide stake-holders information on Atrium Ljungberg’s long term net worth per share calculated in a uniform manner for publicly listed real estate companies.
EPRA NNNAV per share, SEKReported shareholders’ equity with reversal of goodwill adjusted with estimated actual deferred tax, divided by the number of outstanding shares at the end of the period.
EPRA NNNAV per share is used to provide stakeholders information on Atrium Ljungberg’s current net worth per share calculated in a uniform manner for publicly listed real estate companies.
Equity/assets ratio, % Reported shareholders’ equity as a percentage of the balance sheet total, excluding leaseholds, at the end of the period.
The equity/assets ratio is used to illustrate Atrium Ljungberg’s interest rate sensitivity and financial stability.
Equity per share, SEK Reported equity divided by the number of outstanding shares at the end of the period.
Equity per share is used to illustrate the owners’ share of the company’s total assets per share.
Gearing ratio, % Interest-bearing liabilities, excluding the liability for financial leasing for leaseholds, as a percentage of the sum of the properties’ fair value at the end of the period.
The gearing ratio is used to illustrate Atrium Ljungberg’s financial risk.
Gross profit/loss property management Rental income minus expenses for property management activities with a reversal of leasehold fees which, pursuant to IFRS 16, are recognised as an interest expense in the income statement.
Gross profit/loss project and construction work Project and construction sales minus project and construction costs.
Interest coverage ratio, multiple Profit/loss before changes in value, plus interest expenses divided by interest expenses, excluding leasehold fees, which, according to IFRS 16, have been reclassified as an interest expense.
The interest coverage ratio is used to illustrate how sensitive the company’s results are to interest rate changes.
Management result less nominal tax (EPRA EPS) per share, SEKProfit/loss before changes in value, less calculated current tax excluding loss carry-forwards, divided by the average number of outstanding shares. The deducted tax has been calculated by taking into account tax deductible depreciation and investments.
Management result less nominal tax (EPRA EPS) is used to provide stakeholders information on Atrium Ljungberg’s management result per share calculated in a uniform manner for publicly listed property companies.
Number of outstanding shares Number of registered shares at the end of the period less bought-back shares, which do not provide entitlement to dividend or voting rights.
Profit/loss before changes in value per share, SEK Profit/loss before changes in value, less current tax, divided by the average number of outstanding shares.
Profit/loss before changes in value per share is used to illustrate the ongoing management operations.

26 Q3 2019 ATRIUM LJUNGBERG
Property costsThe total of the ‘Property management costs’ with a reversal of the lease-hold fees which, pursuant to IFRS 16 are recognised as an interest expense in the income statement, which excludes central administration.
Return on shareholders’ equity, % Net profit/loss for the year as a percentage of average shareholders’ equity.
Return on shareholders’ equity is used to illustrate Atrium Ljungberg’s capacity to generate profit on the owners’ capital in the Group.
Return on shareholders’ equity, excluding changes in value, % Net profit/loss for the year as a percentage of average shareholders’ equity excluding changes in value.
Return on shareholders’ equity excluding changes in value is used to illustrate Atrium Ljungberg’s capacity to generate current cash flow on the owners’ capital in the Group.
Return on total assets, % Profit/loss before tax plus interest expenses as a percentage of the average balance sheet total, excluding leaseholds.
Return on total assets is used to illustrate Atrium Ljungberg’s capacity to generate profit on the Group’s assets uninfluenced by the Group’s financing.
Return on total assets excluding changes in value % Profit/loss before changes in value plus interest expenses, excluding leasehold fees, as a percentage of the average balance sheet total, excluding leaseholds.
Return on total assets excluding changes in value is used to illustrate Atrium Ljungberg’s capacity to generate current cash flow on the Group’s assets uninfluenced by the Group’s financing.
Share dividend yield, % The proposed share dividend as a percentage of the share price at the end of the previous year.
The share’s dividend yield is used to illustrate which current yield shareholders are expected to receive.
Share’s total yield, %The year’s change in the share price plus the distributed dividend during the year as a percentage of the share price at the end of the previous year.
The share’s total yield is used to illustrate the shareholders’ total yield on their ownership in Atrium Ljungberg.
PROPERTY-RELATED DEFINITIONS
BreeamIs an environmental certification system developed in Europe for built environments. BREEAM takes a big picture approach to environmental performance. There are two types of Breeam certifications; Breeam that relates to new production and BREEAM In-Use, which relates to existing properties.
The areas addressed by BREEAM are energy and water consumption, health, transport, materials, waste, land usage, emissions, ecology and management.
Development propertiesDevelopment properties are properties that are built or unbuilt that the Group owns in order to develop and sell them as tenant-owned dwellings. These properties are recognised as current assets, even though some of the properties are managed and generate rental income while they are waiting to be developed.
They are recognised at the lowest of their accumulated acquisition value and their net realisable value.
EPRA Vacancy rate, %The rental value of unlet premises divided by the rental value of the entire property portfolio. Project properties are excluded.
The EPRA Vacancy rate is reported in accordance with the EPRA’s definition of vacancy rate, which enables comparison between different companies.
GFA, m² GFA (Gross Floor Area) refers to the building’s total area, including outer walls.
LeaseholdThe right of use for building plots In compliance with IFRS 16, leasehold rights are recognised as a right-of-use asset or leasing liability in the balance sheet.
Leasehold feesThe fee paid for the utilisation of leasehold rights. Regarded according to IFRS 16 as an interest expense in the income statement.
Letting area, m² Total area available for letting.
Letting rate, % Contracted annual rents as a percentage of the rental value in conjunction with full letting. Reported figures are based on the immediately subsequent quarter.
The letting rate is used to illustrate the Group’s efficiency in the use of its investment properties.
Like-for-like portfolioComparable portfolio refers to the properties which were not classified as project properties and were owned throughout the period and entire comparison period.
Comparable portfolio is used to illustrate the trend of rental income excluding non-recurrent effects for premature vacating of premises and property costs uninfluenced by project properties as well as acquired and sold properties.
MiljöbyggnadMiljöbyggnad is a certification system for buildings which are based on Swedish construction practice and covers energy, the indoor environment and material.
Net lettingTotal contracted annual rent for new lets less annual rents terminated due to clients vacating the premises for the period.
Net letting is used to illustrate the letting situation.
Operating surplus This refers to the gross profit with a reversal of leasehold fees which, according to IFRS 16, are recognised as an interest expense in property management.
CONT. DEFINITIONS

27Q3 2019 ATRIUM LJUNGBERG
Operating surplus margin, % The gross profit for property management with a reversal of leasehold fees which, pursuant to IFRS 16, are recognised as an interest expense in the income statement as a percentage of recognised rental income.
Operating surplus margin is used to illustrate how large share of the Group’s rental income remains after property costs. The operating surplus margin also forms the basis of valuation of the Group’s investment properties.
Premises typeThe operations managed in the individual premises determine the premises type: retail, offices, residential or other. Other includes, among other things, education, culture and service enterprises.
The letting rate and yield requirement are reported per premises type.
Project property An individual property or a clearly delimited part of a property that has been vacated in order to permit the renovation and upgrading of the property. The term, project property, also refers to buildings under construction and to undeveloped land and development rights. Reclassification from project property to completed property occurs on 1 January of the year after completion.
Project return, %Market value after completed project minus total investment as a percentage of total investment.
Project return is used to illustrate value creation in the project operations.
Property typeThe premises type which comprises the predominant share of the rental value of a register property determines the property type.
The market value and development of rental income in like-for-like portfolios recognised per property type.
Rental value Contracted annual rents including rent surcharges (e.g. for property tax and electricity) and estimated market rents for vacant space in existing condition.
Rental value is used to illustrate the Group’s income potential.
SUSTAINABILITY-RELATED DEFINITIONS
Directly generated and distributed economic valueGenerated value: Composed of Atrium Ljungberg’s net sales and fair value changes.
Distributed value: This comprises Atrium Ljungberg’s payments to suppliers, salaries and remuneration to employees, fees and remuneration to the Board of Directors, the CEO and senior executives, net payments to financiers, taxes and fees to society, and the dividend to the shareholders.
Payments to suppliers: Composed of operative costs for purchases of materials, products, premises and services from suppliers.
Salaries and compensation to employees: Composed of the period’s total salary and pension costs, including benefits. Employees do not include consultants or other temporary staff.
Fees and compensation to the Board, CEO and senior executives: Composed of compensation to Board members, as well as fixed salary, other compen-sation and pension costs for the CEO and other senior executives. For more information, see note IK6.
Net payments to financiers: Composed by the period’s reported interest expense expenses plus consolidated capitalised interest expenses. Describes Atrium Ljungberg’s total compensation to lenders.
Tax and fees to society: Composed by the total compensation to the government during the period in the form of leasehold fees and total taxes and charges to the Swedish government. Deferred tax is not included.
Dividends to shareholders: Composed of the period’s paid dividends.Economic value — remaining in the company: Composed of generated
value minus distributed value.
Energy intensityTotal energy consumption from heating, cooling, tenant electricity and property electricity divided by the average estimated total letting area that is heated, excluding garages.
Green lease contracts, %Contracted annual rent for commercial premises excluding the garage and storage for lease contracts with green rent supplement in per cent of contracted annual rent for commercial premises excluding the garage and storage. Green rent supplement is a supplement to the agreement from the Swedish Property Federation in which the tenant and landlord jointly under-take to reduce the environmental impact and covers, for example, energy, waste and transport. Reported figures are based on the immediately subsequent quarter.
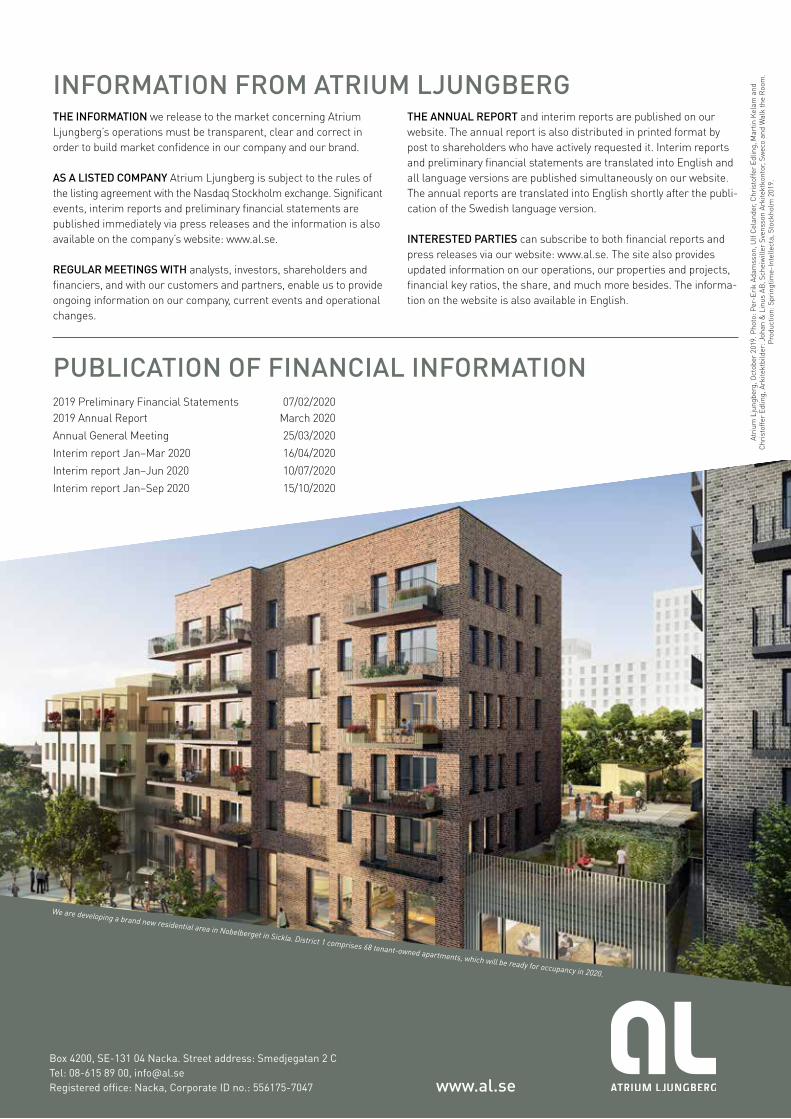
28 Q3 2019 ATRIUM LJUNGBERG
INFORMATION FROM ATRIUM LJUNGBERGTHE INFORMATION we release to the market concerning Atrium Ljungberg’s operations must be transparent, clear and correct in order to build market confidence in our company and our brand.
AS A LISTED COMPANY Atrium Ljungberg is subject to the rules of the listing agreement with the Nasdaq Stockholm exchange. Significant events, interim reports and preliminary financial statements are published immediately via press releases and the information is also available on the company’s website: www.al.se.
REGULAR MEETINGS WITH analysts, investors, shareholders and financiers, and with our customers and partners, enable us to provide ongoing information on our company, current events and operational changes.
THE ANNUAL REPORT and interim reports are published on our website. The annual report is also distributed in printed format by post to shareholders who have actively requested it. Interim reports and preliminary financial statements are translated into English and all language versions are published simultaneously on our website. The annual reports are translated into English shortly after the publi-cation of the Swedish language version.
INTERESTED PARTIES can subscribe to both financial reports and press releases via our website: www.al.se. The site also provides updated information on our operations, our properties and projects, financial key ratios, the share, and much more besides. The informa-tion on the website is also available in English.
Box 4200, SE-131 04 Nacka. Street address: Smedjegatan 2 CTel: 08-615 89 00, [email protected] office: Nacka, Corporate ID no.: 556175-7047 www.al.se
PUBLICATION OF FINANCIAL INFORMATION2019 Preliminary Financial Statements 07/02/20202019 Annual Report March 2020Annual General Meeting 25/03/2020Interim report Jan–Mar 2020 16/04/2020Interim report Jan–Jun 2020 10/07/2020Interim report Jan–Sep 2020 15/10/2020
We are developing a brand new residential area in Nobelberget in Sickla. District 1 comprises 68 tenant-owned apartments, which will be ready for occupancy in 2020.
Atri
um L
jung
berg
, Oct
ober
201
9. P
hoto
: Per
-Eri
k Ad
amss
on, U
lf C
elan
der,
Chr
isto
ffer
Edlin
g, M
artin
Kel
am a
nd
Chr
isto
ffer
Edlin
g, A
rkite
ktbi
lder
: Joh
an &
Lin
us A
B, S
chei
will
er S
vens
son
Arki
tekt
kont
or, S
wec
o an
d W
alk
the
Roo
m.
Prod
uctio
n: S
prin
gtim
e-In
telle
cta,
Sto
ckho
lm 2
019.