published by raymond james ltd. power & energy ... · pdf fileutility peer group...
TRANSCRIPT

Canada Research Published by Raymond James Ltd.
Please read domestic and foreign disclosure/risk information beginning on page 17 and Analyst Certification on page 16. Raymond James Ltd. | 2100 – 925 West Georgia Street | Vancouver BC Canada V6C 3L2
Power & Energy Infrastructure | Diversified & Utilities September 22, 2016 Industry Report
Diversified & Utilities: Overhauling the Largest Machine in the World
Recommendation
In the decades since the establishment of North America’s first power plant in Manhattan in 1882, the utilities sector has seen massive expansion while its structure has remained largely unchanged. However, we believe developments have begun to unfold within the most recent decade that mark the beginnings of structural change for the industry. These include the proliferation of renewable power, the pressing need for investment in aging grid infrastructure after years of underinvestment, and the beginnings of distributed generation (rooftop solar, for example). While we believe attractive investment and growth opportunities exist for the companies in our coverage universe, from an investor’s perspective, we must also acknowledge the negative correlation between interest rates and sector valuations and the fact that with a few exceptions, trading multiples are generally at the high end of the historical range. Given our view of potentially rising interest rates pressuring valuations, we believe investors will be well served by a selective approach to the sector with a focus on companies where growth is sufficiently attractive as to offset this risk or relative valuations appear attractive.
Analysis
Algonquin Power & Utilities Corp. (AQN-TSX, Outperform, $14.50 Target) – Our top pick among the Canadian utilities, we believe Algonquin has an attractively balanced mix of regulated utility and power generation assets as well as numerous promising avenues for growth. We also take a positive view of the pending acquisition of Empire District Electric (EDE) on earnings accretion and strategic fit. Accordingly, our estimates indicate AQN will see earnings growth well outpacing that of the utility peer group supporting a targeted 10% annual dividend growth rate.
Fortis Inc. (FTS-TSX, Outperform, $50.00 Target) – We regard Fortis as a premier diversified Canadian utility and a core defensive holding within the broader energy infrastructure sector. Our constructive stance is primarily based on our view of Fortis’ low risk business and solid growth opportunities supporting an attractive risk adjusted return. Further, we believe the stock’s current valuation discount to the Canadian utility peer group is unwarranted and expect it will normalize over time. As such, we are initiating coverage with an Outperform rating and $50/share target price.
Emera Inc. (EMA-TSX, Market Perform, $51.50 Target) – While we take a positive view of Emera from a fundamental perspective, our neutral stance is largely a call on relative valuation. We like EMA’s pending acquisition of TECO and its attendant investment opportunities as well as the company’s strong slate of current and potential transmission projects. However, given Emera’s (albeit reduced) exposure to merchant power (16% of pro-forma earnings) we believe the company has a modestly higher risk profile than fellow large cap peer Fortis with similar potential returns. Accordingly, the fact that Emera trades at a premium to Fortis and is trading at the high end of its 5-year trading range, prompts our Market Perform rating.
David Quezada CFA
604.659.8257 [email protected]
Bryan Fast CFA (Associate)
604.659.8262 [email protected]

Canada Research | Page 2 of 23 Power & Energy Infrastructure | Diversified & Utilities
Raymond James Ltd. | 2100 – 925 West Georgia Street | Vancouver BC Canada V6C 3L2
Company Ticker(s) Current Target Price Dividend Total Return Suitability Rating Power & Energy Infrastructure | Diversified & Utilities
Algonquin Power & Utilities AQN-TSX C$11.91 C$14.50 5% 27% M/INC OP2
Emera Inc. EMA-TSX C$47.62 C$51.50 5% 13% M/INC MP3
Fortis, Inc. FTS-TSX C$42.29 C$50.00 4% 22% M/INC OP2
Note: M/INC - Medium Risk/Income, M/GRW - Medium Risk/Growth, H/GRW - High Risk/Growth, H/INC - High Risk/Income, H/SPEC - High Risk/Speculation; SB1 - Strong Buy, OP2 - Outperform, MP3 - Market Perform, UP4 - Underperform, UR - Under Review, R - Restricted.
Raymond James Ltd.
Power & Energy Infrastructure | Diversified & Utilities Canada Research | Page 3 of 23
Raymond James Ltd. | 2100 – 925 West Georgia Street | Vancouver BC Canada V6C 3L2
Industry Overview
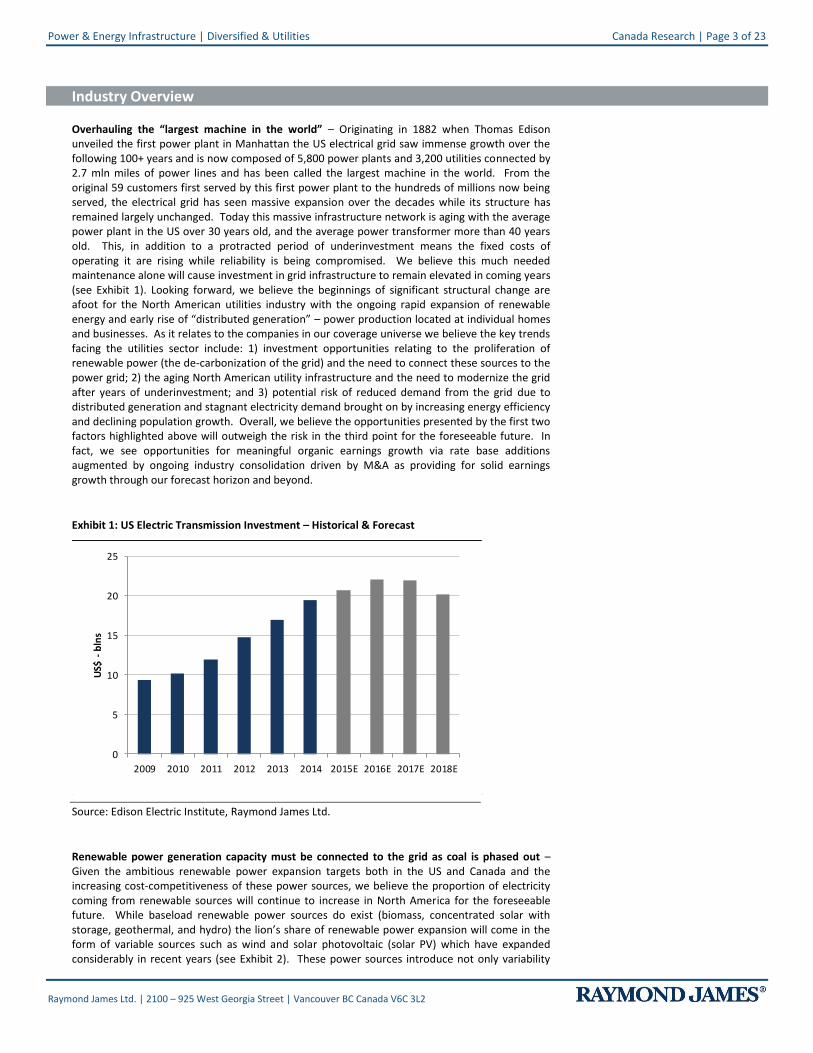
Overhauling the “largest machine in the world” – Originating in 1882 when Thomas Edison unveiled the first power plant in Manhattan the US electrical grid saw immense growth over the following 100+ years and is now composed of 5,800 power plants and 3,200 utilities connected by 2.7 mln miles of power lines and has been called the largest machine in the world. From the original 59 customers first served by this first power plant to the hundreds of millions now being served, the electrical grid has seen massive expansion over the decades while its structure has remained largely unchanged. Today this massive infrastructure network is aging with the average power plant in the US over 30 years old, and the average power transformer more than 40 years old. This, in addition to a protracted period of underinvestment means the fixed costs of operating it are rising while reliability is being compromised. We believe this much needed maintenance alone will cause investment in grid infrastructure to remain elevated in coming years (see Exhibit 1). Looking forward, we believe the beginnings of significant structural change are afoot for the North American utilities industry with the ongoing rapid expansion of renewable energy and early rise of “distributed generation” – power production located at individual homes and businesses. As it relates to the companies in our coverage universe we believe the key trends facing the utilities sector include: 1) investment opportunities relating to the proliferation of renewable power (the de-carbonization of the grid) and the need to connect these sources to the power grid; 2) the aging North American utility infrastructure and the need to modernize the grid after years of underinvestment; and 3) potential risk of reduced demand from the grid due to distributed generation and stagnant electricity demand brought on by increasing energy efficiency and declining population growth. Overall, we believe the opportunities presented by the first two factors highlighted above will outweigh the risk in the third point for the foreseeable future. In fact, we see opportunities for meaningful organic earnings growth via rate base additions augmented by ongoing industry consolidation driven by M&A as providing for solid earnings growth through our forecast horizon and beyond.
Exhibit 1: US Electric Transmission Investment – Historical & Forecast
Source: Edison Electric Institute, Raymond James Ltd.
Renewable power generation capacity must be connected to the grid as coal is phased out – Given the ambitious renewable power expansion targets both in the US and Canada and the increasing cost-competitiveness of these power sources, we believe the proportion of electricity coming from renewable sources will continue to increase in North America for the foreseeable future. While baseload renewable power sources do exist (biomass, concentrated solar with storage, geothermal, and hydro) the lion’s share of renewable power expansion will come in the form of variable sources such as wind and solar photovoltaic (solar PV) which have expanded considerably in recent years (see Exhibit 2). These power sources introduce not only variability
0
5
10
15
20
25
2009 2010 2011 2012 2013 2014 2015E 2016E 2017E 2018E
US$
-b
lns

Canada Research | Page 4 of 23 Power & Energy Infrastructure | Diversified & Utilities
Raymond James Ltd. | 2100 – 925 West Georgia Street | Vancouver BC Canada V6C 3L2
but also an element of uncertainty in supply, as well as location specific properties relating to the strength of the wind or solar resource in any given region. Thus, the integration of these power sources into the grid will require not only investment in interconnection but design and planning considerations that account for these issues. Meanwhile, renewable power sources also tend to be located further away from population centers. While challenges certainly do exist solutions including large scale storage, switching in more flexible baseload sources, aggregation over larger areas (to smooth variability), and smart grid technologies are in development. As it currently stands, roughly 70% of US electricity is generated by fossil fuels (of which 33% comes from coal) while nuclear power accounts for a further 20% and renewables remain below 10%. The American Physical Society estimates moving intermittent renewable power sources to more than 30% of total electrical generation in the US will require new approaches to operating the grid. Thus, we see a significant runway of renewable power development in the US before its intermittency becomes a significant challenge.
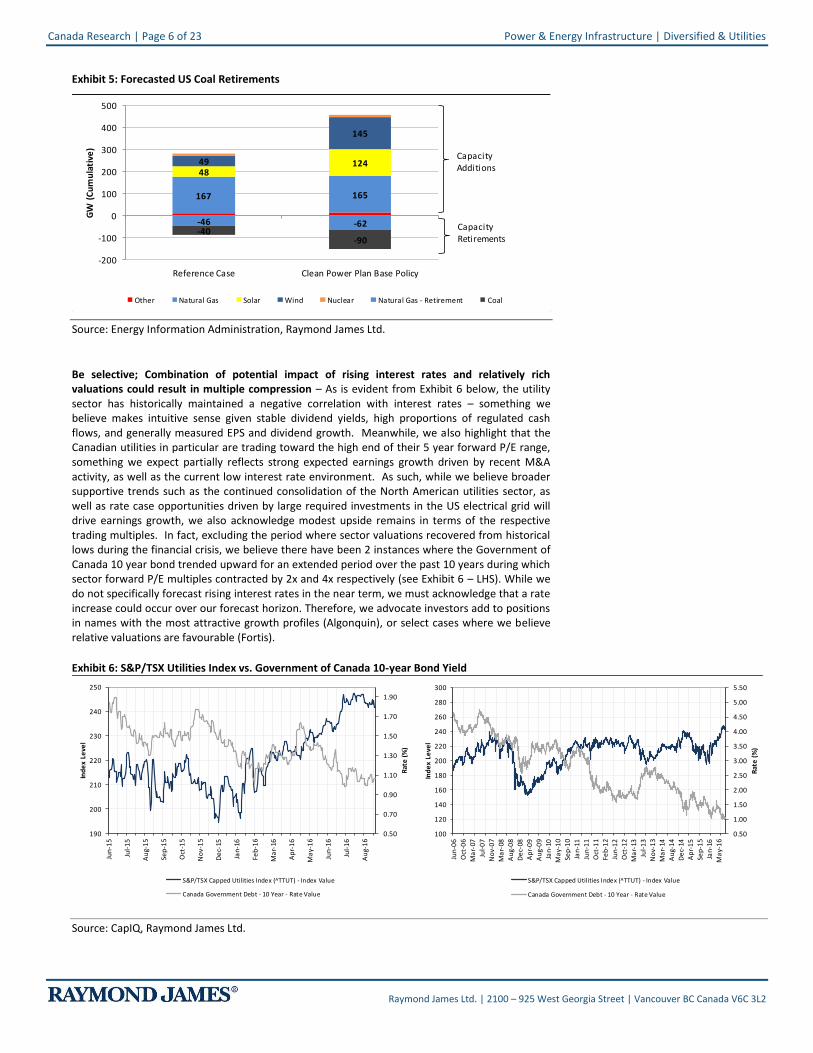
Reflecting the rapid decline in costs and continued government support renewable sources have comprised more than half of new generation capacity built in recent years – something we expect will continue to be the case going forward. According to data from the SEIA, installations of solar PV power capacity are expected to come in at a record total of 16 GW in 2016, more than double the prior record 7.3 GW in 2015 (see Exhibit 2). This impressive total is partially due to the fact that the solar ITC had been set to expire at the end of this year, prompting developers to fill pipelines with projects coming on line in 2016. As a result, we would not expect this extreme growth to repeat in 2017 and beyond, but continue to expect significant annual capacity growth as costs decline. In addition, we note the Energy Information Administration estimates a solid 6.8 GW in wind power capacity additions in 2016 while the wind investment tax credits also spurs growth in wind power capacity through to the end of the decade. Notably, in order to secure the 100% wind investment tax credit, deposits must be placed by the end of this year, spurring investments in wind turbines required to “safe harbor” future potential projects. Longer term, renewable power is expected grow from a combined 22% of electrical generation in 2013 to 34% by 2040, offsetting the declining proportion of coal and oil electrical generation in the global mix. Given that coal generated 33% of US electrical generation in 2015 and there are still 491 coal fired electrical power plants as of the end of 2014 (down from 619 in 2005) we believe coal retirements are still in the early stages in the US (see Exhibit 5). In light of this significant expected renewable expansion, and also considering that renewable power sources are often located farther from existing power grid, we expect significant investment opportunities exist not only on the generation side, but in transmission and distribution as well.
Exhibit 2: Historical & Forecast Solar PV Power Capacity (LHS) and Wind Power Capacity (RHS)
Source: Solar Energy Industries Association, Energy Information Administration, Raymond James Ltd.
0
2,000
4,000
6,000
8,000
10,000
12,000
14,000
16,000
18,000
20
00
20
01
20
02
20
03
20
04
20
05
20
06
20
07
20
08
20
09
20
10
20
11
20
12
20
13
20
14
20
15
20
16E
An
nu
al S
ola
r P
V In
stal
led
(M
W)
0
2,000
4,000
6,000
8,000
10,000
12,000
14,000
20
00
20
01
20
02
20
03
20
04
20
05
20
06
20
07
20
08
20
09
20
10
20
11
20
12
20
13
20
14
20
15
20
16E
An
nu
al W
ind
Po
we
r In
stal
led
(M
W)

Power & Energy Infrastructure | Diversified & Utilities Canada Research | Page 5 of 23
Raymond James Ltd. | 2100 – 925 West Georgia Street | Vancouver BC Canada V6C 3L2
Exhibit 3: US Renewable Power Investment Remains Elevated
Source: EIA, Raymond James Ltd.
Exhibit 4: Global Shift to Renewable Power Sources
Source: Energy Information Administration, Raymond James Ltd.
5.6
11
.9
29
.1 33
.2 35
.5
23
.9
34
.7
49
.1
40
.6
35
.3
37
.0
44
.1
0
10
20
30
40
50
60
2004 2005 2006 2007 2008 2009 2010 2011 2012 2013 2014 2015
US$
bln
s
US Renewable Power Project Spending
Linear (US Renewable Power Project Spending)
World Electricity Generation by Source - 2013 World Electricity Generation by Source - 2040
Wind 3%
Solar PV1%
Hydro16%
Nuclear11%
Oil4%Coal
41%
Gas22%
Other Renewables
2%
Wind 9%
Solar PV4%
Hydro16%
Nuclear12%
Oil1%
Coal30%
Gas23%
Other Renewables
5%
Canada Research | Page 6 of 23 Power & Energy Infrastructure | Diversified & Utilities
Raymond James Ltd. | 2100 – 925 West Georgia Street | Vancouver BC Canada V6C 3L2
Exhibit 5: Forecasted US Coal Retirements
Source: Energy Information Administration, Raymond James Ltd.
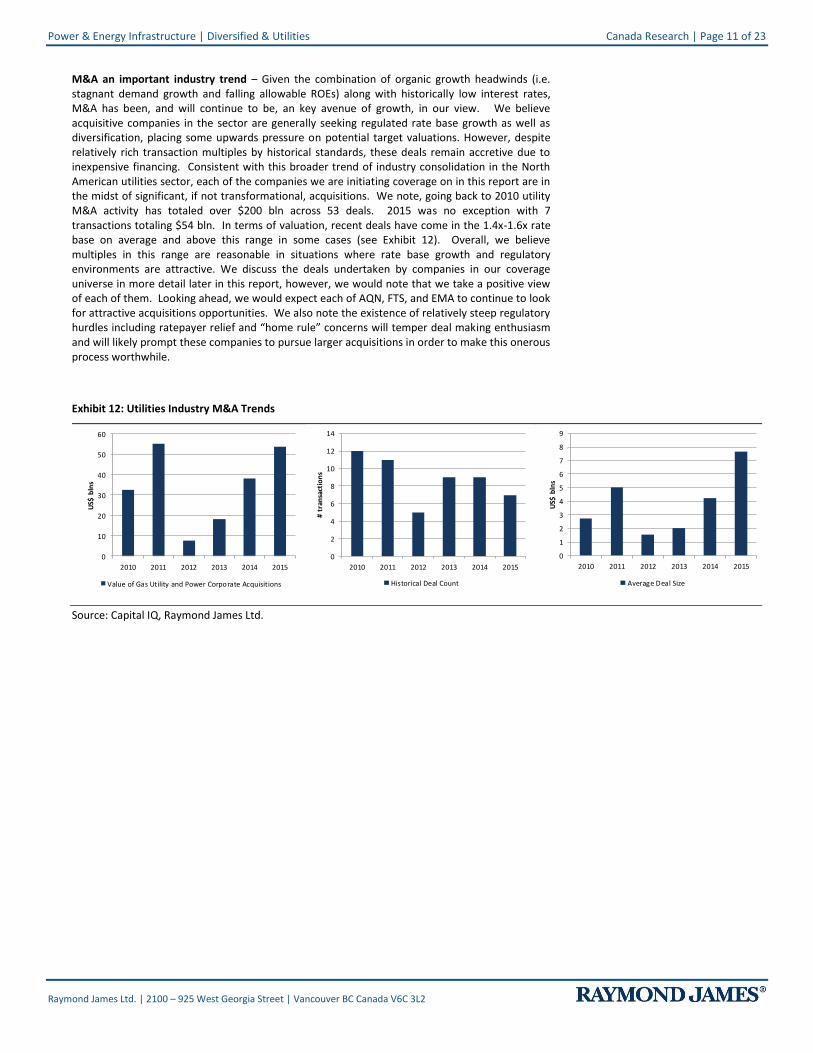
Be selective; Combination of potential impact of rising interest rates and relatively rich valuations could result in multiple compression – As is evident from Exhibit 6 below, the utility sector has historically maintained a negative correlation with interest rates – something we believe makes intuitive sense given stable dividend yields, high proportions of regulated cash flows, and generally measured EPS and dividend growth. Meanwhile, we also highlight that the Canadian utilities in particular are trading toward the high end of their 5 year forward P/E range, something we expect partially reflects strong expected earnings growth driven by recent M&A activity, as well as the current low interest rate environment. As such, while we believe broader supportive trends such as the continued consolidation of the North American utilities sector, as well as rate case opportunities driven by large required investments in the US electrical grid will drive earnings growth, we also acknowledge modest upside remains in terms of the respective trading multiples. In fact, excluding the period where sector valuations recovered from historical lows during the financial crisis, we believe there have been 2 instances where the Government of Canada 10 year bond trended upward for an extended period over the past 10 years during which sector forward P/E multiples contracted by 2x and 4x respectively (see Exhibit 6 – LHS). While we do not specifically forecast rising interest rates in the near term, we must acknowledge that a rate increase could occur over our forecast horizon. Therefore, we advocate investors add to positions in names with the most attractive growth profiles (Algonquin), or select cases where we believe relative valuations are favourable (Fortis).
Exhibit 6: S&P/TSX Utilities Index vs. Government of Canada 10-year Bond Yield
Source: CapIQ, Raymond James Ltd.
167 165
4812449
145
-46 -62-40
-90
-200
-100
0
100
200
300
400
500
Reference Case Clean Power Plan Base Policy
GW
(C
um
ula
tive
)
Other Natural Gas Solar Wind Nuclear Natural Gas - Retirement Coal
Capacity Additions
Capacity Retirements
0.50
0.70
0.90
1.10
1.30
1.50
1.70
1.90
190
200
210
220
230
240
250
Jun
-15
Jul-
15
Au
g-1
5
Sep
-15
Oct
-15
No
v-1
5
De
c-15
Jan
-16
Feb
-16
Ma
r-16
Ap
r-1
6
Ma
y-1
6
Jun
-16
Jul-
16
Au
g-1
6
Rat
e (
%)
Ind
ex
Leve
l
S&P/TSX Capped Utilities Index (̂ TTUT) - Index Value
Canada Government Debt - 10 Year - Rate Value
0.50
1.00
1.50
2.00
2.50
3.00
3.50
4.00
4.50
5.00
5.50
100
120
140
160
180
200
220
240
260
280
300
Jun
-06
Oct
-06
Ma
r-07
Jul-
07
No
v-0
7
Ma
r-08
Au
g-0
8
De
c-08
Ap
r-0
9
Au
g-0
9
Jan
-10
Ma
y-1
0
Sep
-10
Jan
-11
Jun
-11
Oct
-11
Feb
-12
Jun
-12
Oct
-12
Ma
r-13
Jul-
13
No
v-1
3
Ma
r-14
Au
g-1
4
De
c-14
Ap
r-1
5
Sep
-15
Jan
-16
Ma
y-1
6
Rat
e (
%)
Ind
ex
Leve
l
S&P/TSX Capped Utilities Index (̂ TTUT) - Index Value
Canada Government Debt - 10 Year - Rate Value

Power & Energy Infrastructure | Diversified & Utilities Canada Research | Page 7 of 23
Raymond James Ltd. | 2100 – 925 West Georgia Street | Vancouver BC Canada V6C 3L2
Exhibit 7: Historical Gov’t of Canada Bond Yields vs. Cdn Utilities Forward Consensus P/E Ratio
Source: Capital IQ, Raymond James Ltd.
Demand for electricity growing at a very modest pace – Historically, electricity demand has been strongly correlated with GDP expansion, meaning the North American utilities have benefitted from rising demand base to drive growth. However, in economically developed nations, this relationship is expected to decouple going forward as efficiency improvements and the decline of energy-intensive industry results in lower electricity use per unit of GDP. Analysis from the IEA suggests that US electrical demand grew at a CAGR of 0.7% from 2010 to 2013 reaching 2,859 TWh. Looking forward, the EIA forecasts total electricity demand reaching 4,544 TWH by 2040 representing a 0.6% CAGR for 2013-2040 (see Exhibit 8). While demand growth will likely be sluggish, we nevertheless believe required investments in electrical grid infrastructure will support earnings growth in coming years. We also note, on the demand side, the potential for the increased usage of electric vehicles could also cause electricity demand to increase (details follow).
Exhibit 8: Stagnant US Electricity Demand
Source: EIA, Raymond James Ltd.
0.0
0.5
1.0
1.5
2.0
2.5
3.0
3.5
4.0
4.5
5.0
10
12
14
16
18
20
22
24Ju
n-0
6
No
v-0
6
Ap
r-0
7
Sep
-07
Feb
-08
Jul-
08
De
c-08
Ma
y-0
9
Oct
-09
Ma
r-10
Au
g-1
0
Jan
-11
Jun
-11
No
v-1
1
Ap
r-1
2
Sep
-12
Feb
-13
Jul-
13
De
c-13
Ma
y-1
4
Oct
-14
Ma
r-15
Au
g-1
5
Jan
-16
Jun
-16
Cd
n 1
0 Y
r. B
on
d (
%)
P/F
wd
. C
on
s. E
PS
Cdn. Average Fwd. P/E Mupltiple Cdn. 10 Yr. Bond Yld.
0
500
1,000
1,500
2,000
2,500
3,000
3,500
4,000
4,500
5,000
2000 2013 2020E 2025E 2030E 2035E 2040E
US
Ele
ctri
city
De
man
d (
TWh
)
US Electricity Demand (TWh)

Canada Research | Page 8 of 23 Power & Energy Infrastructure | Diversified & Utilities
Raymond James Ltd. | 2100 – 925 West Georgia Street | Vancouver BC Canada V6C 3L2
Allowed ROEs have been under pressure – Regulated utilities in the US undergo rate cases periodically (every ~3 yrs) with state utility commissions which allow them to grow revenues via increased customer fees based on the amount invested in maintenance and upgrades. These rate cases typically allow an ROE of 8-11% for capital invested in a given regional utility infrastructure. Largely a function of declining interest rates, the allowed ROEs for regulated utilities in the US and Canada have been under pressure of late. Notably, in the US (where EMA (~70%), FTS (~60%) and AQN (~85%) generate the majority of their respective pro-forma earnings) ROEs have declined from as high as 12-13% in the 1990s to 10-11% for 2000-2010, ~10% since the beginning of 2011 and are now closer to 9.5% currently. Meanwhile, allowed ROEs in the relevant Canadian jurisdictions have also declined and are modestly below those in the US on average with BC at 8.75-9.15%, Alberta at 8.3%, Newfoundland at 8.8%, Ontario at 9.0%, and Nova Scotia at 8.75-9.25%. That said, looking at actual reported ROEs for the Canadian utilities companies according to the reported financials, we highlight this has not pressured the actual ROEs earned by the equities to a material degree as these have changed very modestly over the past 2 decades. This is something we attribute several factors including the declining costs of capital (which has fallen roughly in line with ROEs), the use of leverage to increased earned ROEs, and the potential for companies to earn ROEs above the allowed return in some cases (i.e. earnings sharing and performance based returns).
Exhibit 9: Average Allowed ROEs - US
Source: Edison Electric Institute, Raymond James Ltd.
8.0
9.0
10.0
11.0
12.0
13.0
14.0
19
90
19
91
19
92
19
93
19
94
19
95
19
96
19
97
19
98
19
99
20
00
20
01
20
02
20
03
20
04
20
05
20
06
20
07
20
08
20
09
20
10
20
11
20
12
20
13
20
14
20
15
20
16
Ave
rage
Aw
ard
ed
RO
E (%
)
Average US Awarded ROE Linear (Average US Awarded ROE)

Power & Energy Infrastructure | Diversified & Utilities Canada Research | Page 9 of 23
Raymond James Ltd. | 2100 – 925 West Georgia Street | Vancouver BC Canada V6C 3L2
Exhibit 10: Averaged Awarded ROE vs. Calculated ROEs per Financial Statements
Source: Edison Electric Institute, CapIQ, Raymond James Ltd.
Incentive regulation vs. cost plus ratemaking – Under the traditional utility business model the large capital cost of building and operating a regional utility grid necessitates that the provider essentially operate as a natural monopoly. As a result, rates charged by the regional utility are legally mandated to go through a ratemaking process to determine allowable service charges. Depending on the jurisdiction regulated utility earnings are generally determined under either cost of service or performance base rate setting mechanisms. In the case of cost of service the regulatory authority will set electricity/gas rates at such a level that the utility is able to recover the costs of providing service plus a reasonable rate of return on a timely basis. This rate of return is applied to a deemed capital structure or “equity thickness” to the approved invested capital which is known as the rate base. Provided the utility is able to meet forecasts set out in the rate setting process, it should be able to recover costs incurred while also earning its allowed return. In cases where a historical test year is used to set rates regulatory lag can occur. The utility’s rates are set on the basis of the company’s own costs, thereby hindering the incentive to reduce these costs and, in some cases, compensating them for overinvestment. In the case of performance based rate setting, a formula is usually applied that accounts for inflation and some degree of productivity improvements. This method generally allows utilities the opportunity to recover costs and earn its allowed ROE and has the benefit of motivating regulated utilities to reduce costs to increase profit. In fact, we believe performance based regimes in some regions in North America actually provide the utility with superior returns. In accordance with the above noted rate setting mechanisms the factors that affect utility earnings include the allowed ROE, equity thickness (the equity component of the deemed capital structure), the level of rate base, changes in the number of utility customers or electricity/gas delivery volumes, variances in actual and forecast expenses, and regulatory lag.
Distributed generation is not a near-term risk to the utility business model – Often referred to ominously as the “utilities death spiral”, distributed renewable generation (most notably rooftop solar) and the corresponding implications is considered by some to be a significant risk to the traditional utilities business model. From a high level, this risk involves the increased usage of rooftop solar resulting in reduced demand for electricity from utility providers, who are then forced to spread the significant cost of maintaining the electrical grid over a smaller customer base. This increases rates to the remaining customers thereby providing an even greater incentive for them to leave the grid. While we would acknowledge this as a potential long term threat (decades from now), we note, distributed solar remains in the very early stages, with roughly 1% adoption of single family homes in the US at an unsubsidized levelized cost of electricity of between $180-265/MWh (excluding subsidies) compared to other sources including onshore wind, utility scale solar, and traditional fossil fuel based generation at ~$40-60/MWh. Rooftop solar remains a much higher cost alternative primarily being used by relatively wealthy
0
5
10
15
20
25
8.0
8.5
9.0
9.5
10.0
10.5
11.0
11.5
12.0
12.5
13.0
19
99
20
00
20
01
20
02
20
03
20
04
20
05
20
06
20
07
20
08
20
09
20
10
20
11
20
12
20
13
20
14
20
15
20
16
Re
po
rte
d R
OE
Pe
r Fi
nan
cial
s (%
)
Ave
rage
Aw
ard
ed
RO
E (%
)
Average US Awarded ROE Average Reported ROE on Financial Stmt.
Linear (Average US Awarded ROE) Linear (Average Reported ROE on Financial Stmt.)

Canada Research | Page 10 of 23 Power & Energy Infrastructure | Diversified & Utilities
Raymond James Ltd. | 2100 – 925 West Georgia Street | Vancouver BC Canada V6C 3L2
customers. That said, rooftop solar provider SolarCity estimates that 14% of new generation capacity in 2015 was distributed solar, compared to utility scale solar at 19% suggesting it is becoming an increasingly legitimate option. In addition, distributed solar grew at a 40% CAGR between 2010 and 2015 reaching 3.1 GW in 2015 (see Exhibit 11).
Net metering has spurred adoption of rooftop solar, but is being phased out in most regions – Net metering is a concept topic closely tied to the expansion of rooftop solar whereby utility customers with rooftop generation are able to sell excess electricity back to the grid at retail rates (thus further offsetting their utility bill). This has been a hotly contested issue and will have a material impact on the pace of development of distributed generation going forward, in our view. First introduced to encourage introduction of rooftop solar when it first came to market, net metering is considered a means of subsidization for these customers by their respective utilities who are forced to buy the electricity when they could source it at a lower cost from utility scale generating assets. Given the intermittence of solar power and lack of an economically viable storage option at this point, even users of DG (who do not typically have storage systems) require access to the traditional grid for when the sun is not shining, as well as in cases where the rooftop system would not provide reliable service. While net metering policies vary state by state, we expect safe, reliable access to electricity will require maintenance of the existing grid for the foreseeable future and see policies facilitating necessary investments in the grid infrastructure as the most likely outcome. Supporting this notion, we believe it makes intuitive sense that the 99% of traditional utility customers will reject the notion of paying higher rates to offset reduced revenues from those (typically higher income households) with rooftop generation facilities. In fact, nearly every state is currently considering options for addressing the net metering issue. Decisions in some solar-heavy states such as Nevada and Hawaii have already placed prices received by rooftop solar owners at levels in line with wholesale rates paid to competitive utility scale generators and in some cases, have charged these customers a fixed rate for grid usage. Thus, we see the incentives for distributed generation declining in the near term potentially weighing on adoption of these facilities until such time as they become more cost competitive and/or an economic means of storage is found.
Exhibit 11: Growth of US Distributed Generation Capacity
Source: SolarCity Investor Presentation, Raymond James Ltd.
1%3%
6%
17% 18% 19%
3%
5%
5%
11% 11%
14%
0%
5%
10%
15%
20%
25%
30%
35%
2010 2011 2012 2013 2014 2015
% o
f 2
01
5 U
S N
ew
Bu
ild G
en
era
tin
g C
apac
ity
Utility Scale Solar Distributed Solar Generation
0.0
0.5
1.0
1.5
2.0
2.5
3.0
3.5
2010 2011 2012 2013 2014 2015
GW
US Distributed Solar Capacity
Power & Energy Infrastructure | Diversified & Utilities Canada Research | Page 11 of 23
Raymond James Ltd. | 2100 – 925 West Georgia Street | Vancouver BC Canada V6C 3L2
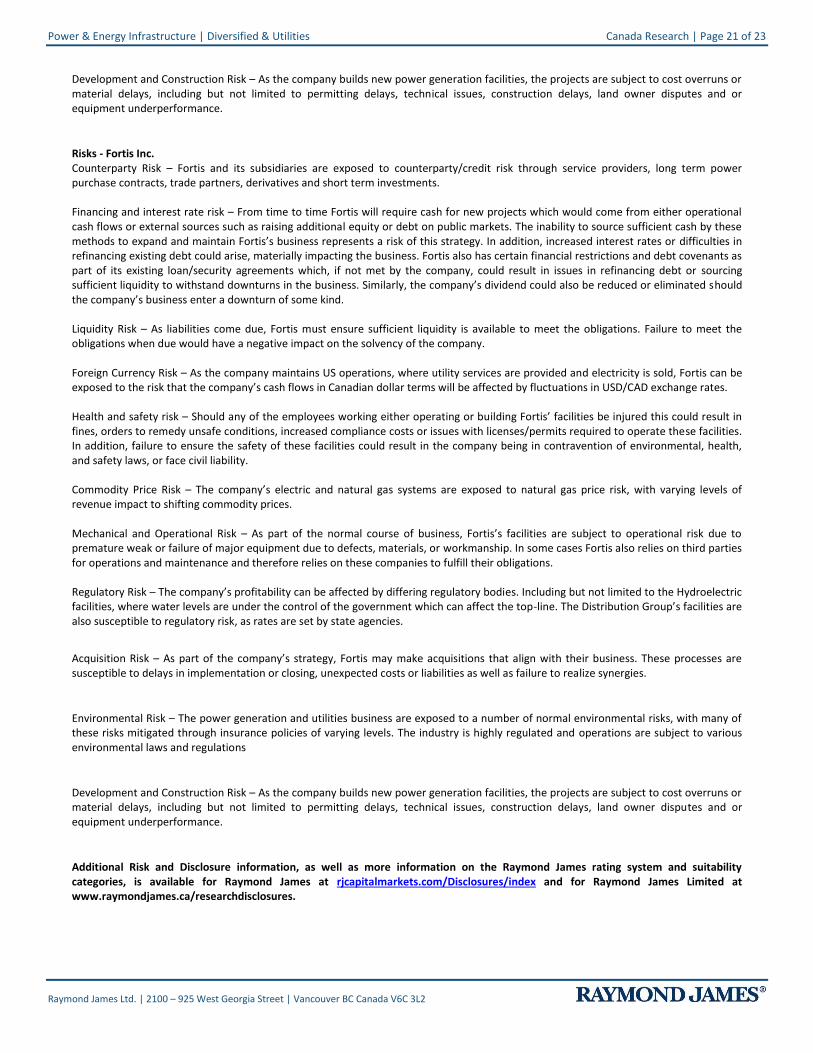
M&A an important industry trend – Given the combination of organic growth headwinds (i.e. stagnant demand growth and falling allowable ROEs) along with historically low interest rates, M&A has been, and will continue to be, an key avenue of growth, in our view. We believe acquisitive companies in the sector are generally seeking regulated rate base growth as well as diversification, placing some upwards pressure on potential target valuations. However, despite relatively rich transaction multiples by historical standards, these deals remain accretive due to inexpensive financing. Consistent with this broader trend of industry consolidation in the North American utilities sector, each of the companies we are initiating coverage on in this report are in the midst of significant, if not transformational, acquisitions. We note, going back to 2010 utility M&A activity has totaled over $200 bln across 53 deals. 2015 was no exception with 7 transactions totaling $54 bln. In terms of valuation, recent deals have come in the 1.4x-1.6x rate base on average and above this range in some cases (see Exhibit 12). Overall, we believe multiples in this range are reasonable in situations where rate base growth and regulatory environments are attractive. We discuss the deals undertaken by companies in our coverage universe in more detail later in this report, however, we would note that we take a positive view of each of them. Looking ahead, we would expect each of AQN, FTS, and EMA to continue to look for attractive acquisitions opportunities. We also note the existence of relatively steep regulatory hurdles including ratepayer relief and “home rule” concerns will temper deal making enthusiasm and will likely prompt these companies to pursue larger acquisitions in order to make this onerous process worthwhile.
Exhibit 12: Utilities Industry M&A Trends
Source: Capital IQ, Raymond James Ltd.
0
10
20
30
40
50
60
2010 2011 2012 2013 2014 2015
US$
bln
s
Value of Gas Utility and Power Corporate Acquisitions
0
2
4
6
8
10
12
14
2010 2011 2012 2013 2014 2015
# tr
ansa
ctio
ns
Historical Deal Count
0
1
2
3
4
5
6
7
8
9
2010 2011 2012 2013 2014 2015
US$
bln
s
Average Deal Size

Canada Research | Page 12 of 23 Power & Energy Infrastructure | Diversified & Utilities
Raymond James Ltd. | 2100 – 925 West Georgia Street | Vancouver BC Canada V6C 3L2
Exhibit 13: Recent Selected Utilities M&A Transactions
Note: The above chart represents only the records with complete information available Source: Capital IQ, Raymond James Ltd.
A low beta, creditworthy, hedge to volatility – While this likely goes without stating, the Canadian utility providers are generally very large, stable, low beta investments with investment grade or better credit ratings (see Exhibit 14). Moreover, with very little exposure to commodity prices, the utilities also exhibit much less volatility than other energy related asset classes such as pipelines/midstream. We regard these attributes as facilitating elevated valuations, and low cost of capital – something highly important, in our view, given our expectation of continued growth via M&A going forward. Discussed in more detail in the company specific section of this report, we believe substantial recent acquisitions have resulted in somewhat stretched balance sheets (in terms of maintaining these credit ratings). Nevertheless, we believe each of Algonquin, Emera, and Fortis maintain abundant access to capital markets – both equity and debt.
1.4 1.5 1.5 1.5
1.7 1.7
2.0
1.3
1.6 1.6 1.61.5
1.9
1.71.6
0.0
0.5
1.0
1.5
2.0
2.5
Tran
sact
ion
Vla
ue
/Ne
t P
P&
E
2013 2014 2015 2016

Power & Energy Infrastructure | Diversified & Utilities Canada Research | Page 13 of 23
Raymond James Ltd. | 2100 – 925 West Georgia Street | Vancouver BC Canada V6C 3L2
Exhibit 14: Utility Company Beta & Credit Rating
Source: Capital IQ
Regulatory approval can be onerous – Representing one of the key hurdles to the ongoing consolidation of the North American industry, utility M&A transactions typically face several federal and state level regulatory commissions before receiving approval. We note, in the majority of cases, the state-level approval is the most challenging. These sometimes protracted, detailed state level reviews inject significant uncertainty into a potential transaction with the primary goal being the determination of whether or not the transaction is in the public’s interest. The definition of public interest differs from state to state and ranges from the narrowest “no net harm”, to “consistent with the public interest”, to the strictest standard “provide net benefits” for ratepayers. In addition to either approving or denying a merger request, state regulatory commissions can conditionally approve a merger proposal subject to certain provisions that can affect the closing of the merger. These can include rate concessions, ring fencing provisions, service quality guarantees, the prohibition of anti-competitive conduct, local job preservation, charitable contributions, and maintenance of corporate presence in the state, among others. We note the $6.8 bln Excelon-Pepco merger (which affected 2.2 mln utility customers in Maryland, Delaware, New Jersey, and the District of Columbia), was first announced in Apr-2014 and took almost 2 years to close with the strongest opposition coming from DC residents where it was rejected twice before finally being approved. As part of the approval process from the various state commissions the transaction featured a wide range of settlement conditions including rate credits, energy efficiency program spending and standards, and new reliability standards. Specific elements included a $72.8 mln deposit by the utilities in a “customer investment fund,” the provision of $11.25 mln for energy efficiency and conservation programs targeted toward low-income residents and a carve-out of $21.55 million for pilot projects, such as modernizing the electric-distribution grid. In another case, another large US utility called off its $4.3 bln proposed acquisition of Hawaiian Electric Co. largely due to it being rejected by Hawaiian regulators. It was the Hawaiian Public Utilities Commission’s position that the acquirer failed to prove the transaction would be good for the state as well as concerns over the acquirer’s commitment to clean energy. We believe these examples underscore the relatively onerous regulatory environment for utility sector transactions; however, we believe the pending transactions by Algonquin and Fortis are well positioned to be approved.
Federally, the Federal Energy Regulation Commission (FERC) oversees the electric utilities. The FERC’s stated review period is 12-15 months (in practice it is sometimes as little at 6 months) as the agency assesses whether the transaction is in the public’s best interest by analyzing its effect of competition in wholesale power markets and the region’s ratepayers. This analysis can include consideration of the products sold by the merger parties’ potential sources of supply, and market concentration. The merging entities are encouraged to propose rate protections for customers such as rate reductions, rate freezes, hold harmless provisions, or the opportunity to exit contracts. FERC also maintains authority over natural gas company M&A activity and requires that they demonstrate how a proposed acquisition is in the public’s best interest in terms of convenience or necessity. Other federal agencies involved in approving utility mergers include the Securities and Exchange Commission and the Federal Trade Commission or Department of Justice.
A smarter grid could ease the introduction of renewable power & improve efficiency – As the current electrical grid utilizes out-of-date analog technology, there exists a significant opportunity to digitize the system. This transition will involve elements supporting increased efficiency including more sensors of different types, smart meters, power line sensors, and potentially smart appliances. These technologies would facilitate the flow of information back and forth between each element of the transmission and distribution system such that fluctuations in supply and demand would be better anticipated and outages avoided. These sensors currently see limited use and are primarily in place at locations where demand is high (factories). However, as they become cheaper and cheaper, we expect they can be deployed more widely and with increasing
Company Beta Credit Rating
Algonquin Power & Utilities Corp. 0.25 BBB
Emera Incorporated 0.06 BBB+
Fortis Inc. 0.13 A-
Canadian Utilities Ltd. 0.22 A
Hydro One Limited 0.36 A

Canada Research | Page 14 of 23 Power & Energy Infrastructure | Diversified & Utilities
Raymond James Ltd. | 2100 – 925 West Georgia Street | Vancouver BC Canada V6C 3L2
sophistication. This increased level of information will enable the grid to redistribute electricity to areas where it is needed while moving it away from lines that are in danger of over-heating while also reducing the need for backup electricity and improve potential usage of intermittent renewable power sources. Since 2010 the US Dept. of Energy has invested $4.5 bln in smart grid infrastructure including 15 mln smart meters while consumer products such as Google Nest’s smart thermostats and household lithium ion batteries produced by Tesla are also advancing the concept of smart grid technology. Notably, smart grid technologies also reduce the need to standby “peaking plants” which are the least efficient element of the electrical network.
Electric cars to potentially boost demand for electricity – While certainly a longer term development, the potential for more and more cars to derive fuel from electricity could materially increase what is currently stagnant demand. In fact, CEO of Tesla and Chairman of SolarCity, Elon Musk, has suggested that he expects demand from electric vehicles to cause electricity to double, with half of the demand over time filled by rooftop solar and the other half coming from traditional utilities.
An un-sexy investment? Only if long term outperformance bores you – Referring to Exhibit 15 below, we highlight that over the past 5 years the utilities index has significantly outperformed other more commodity levered sectors, while also exhibiting a much lower degree of volatility. While we acknowledge this strong performance has at least partly come thanks to a long run of depressed interest rates, we highlight our view of the attractiveness of risk-adjusted returns available in this sector. Notably, each of the companies we are launching coverage of in this report have meaningfully outperformed the broader utilities index, something we believe speaks to their strong respective management teams. We also highlight the stable, long term, increasingly regulated cash flows these companies generate mean there is minimal downside to our earnings estimates while strong M&A track records and attractive organic rate base growth opportunities provide for rising earnings over our forecast horizon.
Exhibit 15: Utilities Have Outperformed Long Term
Source: Capital IQ, Raymond James Ltd.
Company Citations
Company Name Ticker Exchange Currency Closing Price RJ Rating RJ Entity
Hydro One Ltd. H TSX C$ 25.91 3 RJ Ltd. SolarCity Corp. SCTY NASDAQ US$ 18.35 3 RJ & Associates
Notes: Prices are as of the most recent close on the indicated exchange and may not be in US$. See Disclosure section for rating definitions. Stocks that do not trade on a U.S. national exchange may not be registered for sale in all U.S. states. NC=not covered.
* All Index values represent S&P/TSX Composite Indices
-100%
-50%
0%
50%
100%
150%
Sep
-11
Oct
-11
Nov
-11
Dec
-11
Jan
-12
Feb
-12
Mar
-12
Ap
r-1
2
May
-12
Jun
-12
Jul-
12
Au
g-1
2
Sep
-12
Oct
-12
Nov
-12
Dec
-12
Jan
-13
Feb
-13
Mar
-13
Ap
r-1
3
May
-13
Jun
-13
Jul-
13
Au
g-1
3
Sep
-13
Oct
-13
Nov
-13
Dec
-13
Jan
-14
Feb
-14
Mar
-14
Ap
r-1
4
May
-14
Jun
-14
Jul-
14
Au
g-1
4
Sep
-14
Oct
-14
Nov
-14
Dec
-14
Jan
-15
Feb
-15
Mar
-15
Ap
r-1
5
May
-15
Jun
-15
Jul-
15
Au
g-1
5
Sep
-15
Oct
-15
Nov
-15
Dec
-15
Jan
-16
Feb
-16
Mar
-16
Ap
r-1
6
May
-16
Jun
-16
Jul-
16
Au
g-1
6
% I
nd
ex/S
ha
re P
rice
Ret
urn
Algonquin(TSX:AQN)
Emera(TSX:EMA)
Fortis (TSX:FTS)
CappedUtilities Index
Oil & GasExploration &Production
Oil & GasEquipment &Services
Materials

Power & Energy Infrastructure | Diversified & Utilities Canada Research | Page 15 of 23
Raymond James Ltd. | 2100 – 925 West Georgia Street | Vancouver BC Canada V6C 3L2
IMPORTANT INVESTOR DISCLOSURES Raymond James & Associates (RJA) is a FINRA member firm and is responsible for the preparation and distribution of research created in the United States. Raymond James & Associates is located at The Raymond James Financial Center, 880 Carillon Parkway, St. Petersburg, FL 33716, (727) 567-1000. Non-U.S. affiliates, which are not FINRA member firms, include the following entities which are responsible for the creation and distribution of research in their respective areas; In Canada, Raymond James Ltd. (RJL), Suite 2100, 925 West Georgia Street, Vancouver, BC V6C 3L2, (604) 659-8200; In Latin America, Raymond James Argentina S.A., San Martin 344, 22nd Floor, Buenos Aires, C10004AAH, Argentina, +54 11 4850 2500; In Europe, Raymond James Euro Equities, SAS, 40, rue La Boetie, 75008, Paris, France, +33 1 45 61 64 90, and Raymond James Financial International Ltd., Broadwalk House, 5 Appold Street, London, England EC2A 2AG, +44 203 798 5600.
This document is not directed to, or intended for distribution to or use by, any person or entity that is a citizen or resident of or located in any locality, state, country, or other jurisdiction where such distribution, publication, availability or use would be contrary to law or regulation. The securities discussed in this document may not be eligible for sale in some jurisdictions. This research is not an offer to sell or the solicitation of an offer to buy any security in any jurisdiction where such an offer or solicitation would be illegal. It does not constitute a personal recommendation nor does it take into account the particular investment objectives, financial situations, or needs of individual clients. Information in this report should not be construed as advice designed to meet the individual objectives of any particular investor. Investors should consider this report as only a single factor in making their investment decision. Consultation with your investment advisor is recommended. Past performance is not a guide to future performance, future returns are not guaranteed, and a loss of original capital may occur.
The information provided is as of the date above and subject to change, and it should not be deemed a recommendation to buy or sell any security. Certain information has been obtained from third-party sources we consider reliable, but we do not guarantee that such information is accurate or complete. Persons within the Raymond James family of companies may have information that is not available to the contributors of the information contained in this publication. Raymond James, including affiliates and employees, may execute transactions in the securities listed in this publication that may not be consistent with the ratings appearing in this publication.
With respect to materials prepared by Raymond James Ltd. (“RJL”), all expressions of opinion reflect the judgment of the Research Department of RJL, or its affiliates, at this date and are subject to change. RJL may perform investment banking or other services for, or solicit investment banking business from, any company mentioned in this document.
Raymond James (“RJ”) research reports are disseminated and available to RJ’s retail and institutional clients simultaneously via electronic publication to RJ's internal proprietary websites (RJ Investor Access & RJ Capital Markets). Not all research reports are directly distributed to clients or third-party aggregators. Certain research reports may only be disseminated on RJ's internal proprietary websites; however such research reports will not contain estimates or changes to earnings forecasts, target price, valuation, or investment or suitability rating. Individual Research Analysts may also opt to circulate published research to one or more clients electronically. This electronic communication distribution is discretionary and is done only after the research has been publically disseminated via RJ’s internal proprietary websites. The level and types of communications provided by Research Analysts to clients may vary depending on various factors including, but not limited to, the client’s individual preference as to the frequency and manner of receiving communications from Research Analysts. For research reports, models, or other data available on a particular security, please contact your RJ Sales Representative or visit RJ Investor Access or RJ Capital Markets.
In the event that this is a compendium report (i.e., covers 6 or more subject companies), Raymond James Ltd. may choose to provide specific disclosures for the subject companies by reference. To access these disclosures, clients should refer to: http://www.raymondjames.ca (click on Equity Capital Markets / Equity Research / Research Disclosures) or call toll‐free at 1‐800‐667‐2899.
ANALYST INFORMATION
Analyst Compensation: Equity research analysts and associates at Raymond James are compensated on a salary and bonus system. Several factors enter into the compensation determination for an analyst, including i) research quality and overall productivity, including success in rating stocks on an absolute basis and relative to the local exchange composite Index and/or a sector index, ii) recognition from institutional investors, iii) support effectiveness to the institutional and retail sales forces and traders, iv) commissions generated in stocks under coverage that are attributable to the analyst’s efforts, v) net revenues of the overall Equity Capital Markets Group, and vi) compensation levels for analysts at competing investment dealers.

Canada Research | Page 16 of 23 Power & Energy Infrastructure | Diversified & Utilities
Raymond James Ltd. | 2100 – 925 West Georgia Street | Vancouver BC Canada V6C 3L2
The views expressed in this report accurately reflect the personal views of the analyst(s) covering the subject securities. No part of said person's compensation was, is, or will be directly or indirectly related to the specific recommendations or views contained in this research report. In addition, said analyst has not received compensation from any subject company in the last 12 months.
RATINGS AND DEFINITIONS
Raymond James Ltd. (Canada) definitions: Strong Buy (SB1) The stock is expected to appreciate and produce a total return of at least 15% and outperform the S&P/TSX Composite Index over the next six months. Outperform (MO2) The stock is expected to appreciate and outperform the S&P/TSX Composite Index over the next twelve months. Market Perform (MP3) The stock is expected to perform generally in line with the S&P/TSX Composite Index over the next twelve months and is potentially a source of funds for more highly rated securities. Underperform (MU4) The stock is expected to underperform the S&P/TSX Composite Index or its sector over the next six to twelve months and should be sold.
Raymond James & Associates (U.S.) definitions: Strong Buy (SB1) Expected to appreciate, produce a total return of at least 15%, and outperform the S&P 500 over the next six to 12 months. For higher yielding and more conservative equities, such as REITs and certain MLPs, a total return of at least 15% is expected to be realized over the next 12 months. Outperform (MO2) Expected to appreciate and outperform the S&P 500 over the next 12-18 months. For higher yielding and more conservative equities, such as REITs and certain MLPs, an Outperform rating is used for securities where we are comfortable with the relative safety of the dividend and expect a total return modestly exceeding the dividend yield over the next 12-18 months. Market Perform (MP3) Expected to perform generally in line with the S&P 500 over the next 12 months. Underperform (MU4) Expected to underperform the S&P 500 or its sector over the next six to 12 months and should be sold. Suspended (S) The rating and price target have been suspended temporarily. This action may be due to market events that made coverage impracticable, or to comply with applicable regulations or firm policies in certain circumstances, including when Raymond James may be providing investment banking services to the company. The previous rating and price target are no longer in effect for this security and should not be relied upon.
Raymond James Argentina S.A. rating definitions: Strong Buy (SB1) Expected to appreciate and produce a total return of at least 25.0% over the next twelve months. Outperform (MO2) Expected to appreciate and produce a total return of between 15.0% and 25.0% over the next twelve months. Market Perform (MP3) Expected to perform in line with the underlying country index. Underperform (MU4) Expected to underperform the underlying country index. Suspended (S) The rating and price target have been suspended temporarily. This action may be due to market events that made coverage impracticable, or to comply with applicable regulations or firm policies in certain circumstances, including when Raymond James may be providing investment banking services to the company. The previous rating and price target are no longer in effect for this security and should not be relied upon.
Raymond James Europe (Raymond James Euro Equities SAS & Raymond James Financial International Limited) rating definitions: Strong Buy (1) Expected to appreciate, produce a total return of at least 15%, and outperform the Stoxx 600 over the next 6 to 12 months. Outperform (2) Expected to appreciate and outperform the Stoxx 600 over the next 12 months. Market Perform (3) Expected to perform generally in line with the Stoxx 600 over the next 12 months. Underperform (4) Expected to underperform the Stoxx 600 or its sector over the next 6 to 12 months. Suspended (S) The rating and target price have been suspended temporarily. This action may be due to market events that made coverage impracticable, or to comply with applicable regulations or firm policies in certain circumstances, including when Raymond James may be providing investment banking services to the company. The previous rating and target price are no longer in effect for this security and should not be relied upon.
In transacting in any security, investors should be aware that other securities in the Raymond James research coverage universe might carry a higher or lower rating. Investors should feel free to contact their Financial Advisor to discuss the merits of other available investments.
Suitability Ratings (SR)
Medium Risk/Income (M/INC) Lower to average risk equities of companies with sound financials, consistent earnings, and dividend yields above that of the S&P 500. Many securities in this category are structured with a focus on providing a consistent dividend or return of capital.
Medium Risk/Growth (M/GRW) Lower to average risk equities of companies with sound financials, consistent earnings growth, the potential for long-term price appreciation, a potential dividend yield, and/or share repurchase program.
High Risk/Income (H/INC) Medium to higher risk equities of companies that are structured with a focus on providing a meaningful dividend but may face less predictable earnings (or losses), more leveraged balance sheets, rapidly changing market dynamics, financial and competitive issues, higher price volatility (beta), and potential risk of principal. Securities of companies in this category may have a less predictable income stream from dividends or distributions of capital.
High Risk/Growth (H/GRW) Medium to higher risk equities of companies in fast growing and competitive industries, with less predictable earnings (or losses), more leveraged balance sheets, rapidly changing market dynamics, financial or legal issues, higher price volatility (beta), and potential risk of principal.
High Risk/Speculation (H/SPEC) High risk equities of companies with a short or unprofitable operating history, limited or less predictable revenues, very high risk associated with success, significant financial or legal issues, or a substantial risk/loss of principal.

Power & Energy Infrastructure | Diversified & Utilities Canada Research | Page 17 of 23
Raymond James Ltd. | 2100 – 925 West Georgia Street | Vancouver BC Canada V6C 3L2
RATING DISTRIBUTIONS
Coverage Universe Rating Distribution* Investment Banking Distribution
RJL RJA RJ Arg RJEE/RJFI RJL RJA RJ Arg RJEE/RJFI
Strong Buy and Outperform (Buy) 70% 54% 53% 53% 41% 17% 11% 0%
Market Perform (Hold) 29% 42% 47% 34% 17% 8% 0% 0%
Underperform (Sell) 1% 4% 0% 13% 0% 5% 0% 0%
* Columns may not add to 100% due to rounding.
RAYMOND JAMES RELATIONSHIP DISCLOSURES
Raymond James Ltd. or its affiliates expects to receive or intends to seek compensation for investment banking services from all companies under research coverage within the next three months.
Company Name Disclosure
Algonquin Power & Utilities Raymond James Ltd. has managed or co-managed a public offering of securities within the last 12 months with respect to AQN.
Raymond James Ltd. has provided investment banking services within the last 12 months with respect to AQN.
Raymond James Ltd. has received compensation for investment banking services within the last 12 months with respect to AQN.
STOCK CHARTS, TARGET PRICES, AND VALUATION METHODOLOGIES
Valuation Methodology: The Raymond James methodology for assigning ratings and target prices includes a number of qualitative and quantitative factors including an assessment of industry size, structure, business trends and overall attractiveness; management effectiveness; competition; visibility; financial condition, and expected total return, among other factors. These factors are subject to change depending on overall economic conditions or industry- or company-specific occurrences.
Target Prices: The information below indicates target price and rating changes for the subject companies included in this research.
Valuation Methodology: Our valuation methodology for Algonquin Power is based on P/E multiple relative to appropriate industry competitors.

Canada Research | Page 18 of 23 Power & Energy Infrastructure | Diversified & Utilities
Raymond James Ltd. | 2100 – 925 West Georgia Street | Vancouver BC Canada V6C 3L2
Valuation Methodology: Our valuation methodology for Emera Inc. is based on P/E multiple relative to appropriate industry competitors.
Valuation Methodology: Our valuation methodology for Fortis Inc. is based on P/E multiple relative to appropriate industry competitors.
RISK FACTORS
General Risk Factors: Following are some general risk factors that pertain to the businesses of the subject companies and the projected target prices and recommendations included on Raymond James research: (1) Industry fundamentals with respect to customer demand or product / service pricing could change and adversely impact expected revenues and earnings; (2) Issues relating to major competitors or market shares or new product expectations could change investor attitudes toward the sector or this stock; (3) Unforeseen developments with respect to the management, financial condition or accounting policies or practices could alter the prospective valuation.

Power & Energy Infrastructure | Diversified & Utilities Canada Research | Page 19 of 23
Raymond James Ltd. | 2100 – 925 West Georgia Street | Vancouver BC Canada V6C 3L2
Risks - Algonquin Power & Utilities Counterparty Risk – Algonquin and its subsidiaries are exposed to counterparty/credit risk through service providers, long term power purchase contracts, trade partners, derivatives and short term investments. Financing and interest rate risk – From time to time Algonquin will require cash for new projects which would come from either operational cash flows or external sources such as raising additional equity or debt on public markets. The inability to source sufficient cash by these methods to expand and maintain Algonquin’s business represents a risk of this strategy. In addition, increased interest rates or difficulties in refinancing existing debt could arise, materially impacting the business. Algonquin also has certain financial restrictions and debt covenants as part of its existing loan/security agreements which, if not met by the company, could result in issues in refinancing debt or sourcing sufficient liquidity to withstand downturns in the business. Similarly, the company’s dividend could also be reduced or eliminated should the company’s business enter a downturn of some kind. Liquidity Risk – As liabilities come due, Algonquin must ensure sufficient liquidity is available to meet the obligations. Failure to meet the obligations when due would have a negative impact on the solvency of the company. Foreign Currency Risk – As the company maintains US operations, where utility services are provided and electricity is sold, Algonquin can be exposed to the risk that the company’s cash flows in Canadian dollar terms will be affected by fluctuations in USD/CAD exchange rates. Health and safety risk – Should any of the employees working either operating or building Algonquin’s facilities be injured this could result in fines, orders to remedy unsafe conditions, increased compliance costs or issues with licenses/permits required to operate these facilities. In addition, failure to ensure the safety of these facilities could result in the company being in contravention of environmental, health, and safety laws, or face civil liability. Commodity Price Risk – The company’s electric and natural gas systems are exposed to natural gas price risk, with varying levels of revenue impact to shifting commodity prices. Mechanical and Operational Risk – As part of the normal course of business, Algonquin’s facilities are subject to operational risk due to premature weak or failure of major equipment due to defects, materials, or workmanship. In some cases Algonquin also relies on third parties for operations and maintenance and therefore relies on these companies to fulfill their obligations.
Regulatory Risk – The company’s profitability can be affected by differing regulatory bodies. Including but not limited to the Hydroelectric facilities, where water levels are under the control of the government which can affect the top-line. The Distribution Group’s facilities are also susceptible to regulatory risk, as rates are set by state agencies.
Acquisition Risk – As part of the company’s strategy, Algonquin may make acquisitions that align with their business. These processes are susceptible to delays in implementation or closing, unexpected costs or liabilities as well as failure to realize synergies.
Environmental Risk – The power generation and utilities business are exposed to a number of normal environmental risks, with many of these risks mitigated through insurance policies of varying levels. The industry is highly regulated and operations are subject to various environmental laws and regulations.
Development and Construction Risk – As the company builds new power generation facilities, the projects are subject to cost overruns or material delays, including but not limited to permitting delays, technical issues, construction delays, land owner disputes and or equipment underperformance.

Canada Research | Page 20 of 23 Power & Energy Infrastructure | Diversified & Utilities
Raymond James Ltd. | 2100 – 925 West Georgia Street | Vancouver BC Canada V6C 3L2
Risks - Emera Inc. Regulatory Risk – As part of the structure of Emera’s rate-regulated subsidiaries, the company is subject to the risk of the recovery of costs and investments and the associated time lag. The recovery of costs and investments for subsidiaries are based upon approval by the appropriate Regulator and are subject to scrutiny during the public hearing process. Acquisition Risk – As part of the company’s strategy, Emera may make acquisitions that align with their business. These processes are susceptible to delays in implementation or closing, unexpected costs or liabilities as well as failure to realize synergies. Weather Risk – From time to time severe weather results in unplanned outages at Emera’s facilities; there is an increase in operating costs to restore power when this occurs. Environmental Risk – The power generation and utilities business are exposed to a number of normal environmental risks, with many of these risks mitigated through insurance policies of varying levels. The industry is highly regulated and operations are subject to various environmental laws and regulations Energy Consumption Risk – The level of energy demand is affected by economic conditions within the serviced areas; this can be caused by changes in employment, disposable income levels, energy prices and housing starts. The increasing use of rooftop solar power and distributed generation can also have an impact on energy demand, resulting in negatively impacting revenue and cash flows. Foreign Currency Risk – As the company maintains US operations, where utility services are provided and electricity is sold, Emera can be exposed to the risk that the company’s cash flows in Canadian dollar terms will be affected by fluctuations in USD/CAD exchange rates. In 2015, ~50% of adjusted net income was based in US dollars. Counterparty Risk – Emera and its subsidiaries are exposed to counterparty/credit risk through service providers, long term power purchase contracts, trade partners, derivatives and short term investments. Liquidity Risk – As liabilities come due, Emera must ensure sufficient liquidity is available to meet the obligations. Failure to meet the obligations when due would have a negative impact on the solvency of the company.
Financing and Interest Rate Risk – From time to time Emera will require cash for new projects which would come from either operational cash flows or external sources such as raising additional equity or debt on public markets. The inability to source sufficient cash by these methods to expand and maintain Emera’s business represents a risk of this strategy. In addition, increased interest rates or difficulties in refinancing existing debt could arise, materially impacting the business. Emera also has certain financial restrictions and debt covenants as part of its existing loan/security agreements which, if not met by the company, could result in issues in refinancing debt or sourcing sufficient liquidity to withstand downturns in the business.
Health and Safety Risk – Should any of the employees working either operating or building Emera’s facilities be injured this could result in fines, orders to remedy unsafe conditions, increased compliance costs or issues with licenses/permits required to operate these facilities. In addition, failure to ensure the safety of these facilities could result in the company being in contravention of environmental, health, and safety laws, or face civil liability.
Commodity Price Risk – In order to mitigate the impact of fluctuating fuel supply costs, Emera uses hedging instruments on both financial and physical contracts.
Employee Benefit Plan Performance and Funding Risk – Should the Employee Benefit Plan underperform based on the plans’ estimates, additional contributions could be required, which would ultimately impact Emera’s cash flows and financial condition.
Labour Risk – Nearly 49% of Emera employees are represented by labour unions; should there be a disagreement in collective labour agreements, there could be potential labour disruptions.
Mechanical and Operational Risk – As part of the normal course of business, Emera’s facilities are subject to operational risk due to premature weak or failure of major equipment due to defects, materials, or workmanship. In some cases Emera also relies on third parties for operations and maintenance and therefore relies on these companies to fulfill their obligations.
Power & Energy Infrastructure | Diversified & Utilities Canada Research | Page 21 of 23
Raymond James Ltd. | 2100 – 925 West Georgia Street | Vancouver BC Canada V6C 3L2
Development and Construction Risk – As the company builds new power generation facilities, the projects are subject to cost overruns or material delays, including but not limited to permitting delays, technical issues, construction delays, land owner disputes and or equipment underperformance.
Risks - Fortis Inc. Counterparty Risk – Fortis and its subsidiaries are exposed to counterparty/credit risk through service providers, long term power purchase contracts, trade partners, derivatives and short term investments. Financing and interest rate risk – From time to time Fortis will require cash for new projects which would come from either operational cash flows or external sources such as raising additional equity or debt on public markets. The inability to source sufficient cash by these methods to expand and maintain Fortis’s business represents a risk of this strategy. In addition, increased interest rates or difficulties in refinancing existing debt could arise, materially impacting the business. Fortis also has certain financial restrictions and debt covenants as part of its existing loan/security agreements which, if not met by the company, could result in issues in refinancing debt or sourcing sufficient liquidity to withstand downturns in the business. Similarly, the company’s dividend could also be reduced or eliminated should the company’s business enter a downturn of some kind. Liquidity Risk – As liabilities come due, Fortis must ensure sufficient liquidity is available to meet the obligations. Failure to meet the obligations when due would have a negative impact on the solvency of the company. Foreign Currency Risk – As the company maintains US operations, where utility services are provided and electricity is sold, Fortis can be exposed to the risk that the company’s cash flows in Canadian dollar terms will be affected by fluctuations in USD/CAD exchange rates. Health and safety risk – Should any of the employees working either operating or building Fortis’ facilities be injured this could result in fines, orders to remedy unsafe conditions, increased compliance costs or issues with licenses/permits required to operate these facilities. In addition, failure to ensure the safety of these facilities could result in the company being in contravention of environmental, health, and safety laws, or face civil liability. Commodity Price Risk – The company’s electric and natural gas systems are exposed to natural gas price risk, with varying levels of revenue impact to shifting commodity prices. Mechanical and Operational Risk – As part of the normal course of business, Fortis’s facilities are subject to operational risk due to premature weak or failure of major equipment due to defects, materials, or workmanship. In some cases Fortis also relies on third parties for operations and maintenance and therefore relies on these companies to fulfill their obligations. Regulatory Risk – The company’s profitability can be affected by differing regulatory bodies. Including but not limited to the Hydroelectric facilities, where water levels are under the control of the government which can affect the top-line. The Distribution Group’s facilities are also susceptible to regulatory risk, as rates are set by state agencies.
Acquisition Risk – As part of the company’s strategy, Fortis may make acquisitions that align with their business. These processes are susceptible to delays in implementation or closing, unexpected costs or liabilities as well as failure to realize synergies.
Environmental Risk – The power generation and utilities business are exposed to a number of normal environmental risks, with many of these risks mitigated through insurance policies of varying levels. The industry is highly regulated and operations are subject to various environmental laws and regulations
Development and Construction Risk – As the company builds new power generation facilities, the projects are subject to cost overruns or material delays, including but not limited to permitting delays, technical issues, construction delays, land owner disputes and or equipment underperformance.
Additional Risk and Disclosure information, as well as more information on the Raymond James rating system and suitability categories, is available for Raymond James at rjcapitalmarkets.com/Disclosures/index and for Raymond James Limited at www.raymondjames.ca/researchdisclosures.
Canada Research | Page 22 of 23 Power & Energy Infrastructure | Diversified & Utilities
Raymond James Ltd. | 2100 – 925 West Georgia Street | Vancouver BC Canada V6C 3L2
INTERNATIONAL DISCLOSURES
FOR CLIENTS IN THE UNITED STATES:
Any foreign securities discussed in this report are generally not eligible for sale in the U.S. unless they are listed on a U.S. exchange. This report is being provided to you for informational purposes only and does not represent a solicitation for the purchase or sale of a security in any state where such a solicitation would be illegal. Investing in securities of issuers organized outside of the U.S., including ADRs, may entail certain risks. The securities of non-U.S. issuers may not be registered with, nor be subject to the reporting requirements of, the U.S. Securities and Exchange Commission. There may be limited information available on such securities. Investors who have received this report may be prohibited in certain states or other jurisdictions from purchasing the securities mentioned in this report. Please ask your Financial Advisor for additional details and to determine if a particular security is eligible for purchase in your state.
Raymond James Ltd. is not a U.S. broker‐dealer and therefore is not governed by U.S. laws, rules or regulations applicable to U.S. broker‐dealers. Consequently, the persons responsible for the content of this publication are not licensed in the U.S. as research analysts in accordance with applicable rules promulgated by the U.S. Self Regulatory Organizations.
Any U.S. Institutional Investor wishing to effect trades in any security should contact Raymond James (USA) Ltd., a U.S. broker‐dealer affiliate of Raymond James Ltd.
FOR CLIENTS IN THE UNITED KINGDOM:
For clients of Raymond James & Associates (London Branch) and Raymond James Financial International Limited (RJFI): This document and any investment to which this document relates is intended for the sole use of the persons to whom it is addressed, being persons who are Eligible Counterparties or Professional Clients as described in the FCA rules or persons described in Articles 19(5) (Investment professionals) or 49(2) (High net worth companies, unincorporated associations etc) of the Financial Services and Markets Act 2000 (Financial Promotion) Order 2005 (as amended) or any other person to whom this promotion may lawfully be directed. It is not intended to be distributed or passed on, directly or indirectly, to any other class of persons and may not be relied upon by such persons and is therefore not intended for private individuals or those who would be classified as Retail Clients.
For clients of Raymond James Investment Services, Ltd.: This report is for the use of professional investment advisers and managers and is not intended for use by clients.
For purposes of the Financial Conduct Authority requirements, this research report is classified as independent with respect to conflict of interest management. RJA, RJFI, and Raymond James Investment Services, Ltd. are authorised and regulated by the Financial Conduct Authority in the United Kingdom.
FOR CLIENTS IN FRANCE:
This document and any investment to which this document relates is intended for the sole use of the persons to whom it is addressed, being persons who are Eligible Counterparties or Professional Clients as described in “Code Monétaire et Financier” and Règlement Général de l’Autorité des Marchés Financiers. It is not intended to be distributed or passed on, directly or indirectly, to any other class of persons and may not be relied upon by such persons and is therefore not intended for private individuals or those who would be classified as Retail Clients.
For clients of Raymond James Euro Equities: Raymond James Euro Equities is authorised and regulated by the Autorité de Contrôle Prudentiel et de Résolution and the Autorité des Marchés Financiers.
For institutional clients in the European Economic Area (EEA) outside of the United Kingdom: This document (and any attachments or exhibits hereto) is intended only for EEA institutional clients or others to whom it may lawfully be submitted.
Proprietary Rights Notice: By accepting a copy of this report, you acknowledge and agree as follows:
This report is provided to clients of Raymond James only for your personal, noncommercial use. Except as expressly authorized by Raymond James, you may not copy, reproduce, transmit, sell, display, distribute, publish, broadcast, circulate, modify, disseminate or commercially exploit the information contained in this report, in printed, electronic or any other form, in any manner, without the prior express written consent of Raymond James. You also agree not to use the information provided in this report for any unlawful purpose.
This report and its contents are the property of Raymond James and are protected by applicable copyright, trade secret or other intellectual property laws (of the United States and other countries). United States law, 17 U.S.C. Sec.501 et seq, provides for civil and criminal penalties for copyright infringement. No copyright claimed in incorporated U.S. government works.
Additional information is available upon request. This document may not be reprinted without permission.
RJL is a member of the Canadian Investor Protection Fund. ©2016 Raymond James Ltd.

Power & Energy Infrastructure | Diversified & Utilities Canada Research | Page 23 of 23
Raymond James Ltd. | 2100 – 925 West Georgia Street | Vancouver BC Canada V6C 3L2
RAYMOND JAMES LTD. CANADIAN INSTITUTIONAL EQUITY TEAM WWW.RAYMONDJAMES.CA EQUITY RESEARCH HEAD OF EQUITY RESEARCH
DARYL SWETLISHOFF, CFA 604.659.8246
CONSUMER
CONSUMER & RETAIL KENRIC TYGHE, MBA 416.777.7188
ENERGY
OIL & GAS ENERGY SERVICES, HEAD OF ENERGY RESEARCH ANDREW BRADFORD, CFA 403.509.0503 TIM MONACHELLO (ASSOCIATE) 403.509.0562
OIL & GAS PRODUCERS KURT MOLNAR 403.221.0414 GORDON STEPPAN, CFA (SR ASSOCIATE) 403.221.0411
OIL & GAS PRODUCERS JEREMY MCCREA, CFA 403.509.0518 MICHAEL SHAW, CFA (ASSOCIATE) 403.509.0534
SR. OIL & GAS PRODUCERS | ENERGY INFRASTRUCTURE CHRIS COX, CFA 416.777.7175 MICHAEL BARTH (ASSOCIATE) 403.509.0511
POWER & UTILITIES
DAVID QUEZADA, CFA 604.659.8257
INDUSTRIAL & TRANSPORTATION
INDUSTRIAL | TRANSPORTATION, HEAD OF INDUSTRIAL RESEARCH BEN CHERNIAVSKY 604.659.8244 EDWARD GUDEWILL, CFA (ASSOCIATE) 604.659.8280
INFRASTRUCTURE & CONSTRUCTION FREDERIC BASTIEN, CFA 604.659.8232 BRIAN MARTIN, CFA (ASSOCIATE) 604.654.1236
TRANSPORTATION | AGRIBUSINESS & FOOD PRODUCTS STEVE HANSEN, CFA, CPA, CMA 604.659.8208 DANIEL CHEW, CFA, CPA, CA (ASSOCIATE) 604.659.8238
MINING
BASE & PRECIOUS METALS ALEX TERENTIEW, MBA 416.777.4912 KYLE FRANKLIN, MBA (ASSOCIATE) 416.777.7144
PRECIOUS METALS PHIL RUSSO 416.777.7084 BRANDON THROOP (ASSOCIATE) 416.777.7165
PRECIOUS METALS CHRIS THOMPSON, M.SC. (ENG), P.GEO 604.659.8439 JUSTIN STEVENS (ASSOCIATE) 604.659.8470
FINANCIAL SERVICES
DIVERSIFIED FINANCIALS MICHAEL OVERVELDE, CFA, CPA, CA 416.777.4943 BRENNA PHELAN, CFA, CPA, CA (ASSOCIATE) 416.777.7042
FOREST PRODUCTS
FOREST PRODUCTS DARYL SWETLISHOFF, CFA 604.659.8246
BRYAN FAST, CFA (ASSOCIATE) 604.659.8262
REAL ESTATE
REAL ESTATE & REITS KEN AVALOS, MBA 727.567.1756 JOHANN RODRIGUES (ASSOCIATE ANALYST) 416.777.7189
TECHNOLOGY & COMMUNICATIONS
TECHNOLOGY, ALTERNATIVE ENERGY & CLEAN TECH STEVEN LI, CFA 416.777.4918 JONATHAN LO (ASSOCIATE) 416.777.6414
EQUITY RESEARCH PUBLISHING SENIOR SUPERVISORY ANALYST
HEATHER HERRON 403.509.0509 HEAD OF PUBLISHING | SUPERVISORY ANALYST
CYNTHIA LUI 604.659.8210
TYLER BOS (SUPERVISORY ANALYST | EDITOR) 647.624.1596 INDER GILL (RESEARCH EDITOR) 604.659.8202 KATE MAJOR (RESEARCH PRINCIPAL | EDITOR) 416.777.7173 ASHLEY RAMSAY (SUPERVISORY ANALYST |EDITOR) 604.376.2291
INSTITUTIONAL EQUITY SALES HEAD OF SALES
MIKE WESTCOTT 416.777.4935 GREG JACKSON (ECM, BUSINESS MANAGER) 416.777.7172 MICHELLE MARGUET ( ECM, INSTITUTIONAL MARKETING) 416.777.4951
TORONTO (CAN 1.888.601.6105 | USA 1.800.290.4847)
SEAN BOYLE 416.777.4927 JEFF CARRUTHERS, CFA 416.777.4929 RICHARD EAKINS 416.777.4926 JONATHAN GREER 416.777.4930 DAVE MACLENNAN 416.777.4934 ROBERT MILLS, CFA 416.777.4945 BRADY PIMLOTT 416.777.4993 NICOLE SVEC-GRIFFIS, CFA (U.S. EQUITIES) 416.777.4942 NEIL WEBER 416.777.4931 ORNELLA BURNS (ASSISTANT) 416.777.4928 SATBIR CHATRATH (ASSISTANT) 416.777.4915 MARIA STEPANOVA (ASSISTANT) 416.777.4949
VANCOUVER (1.800.667.2899)
SCOT ATKINSON, CFA 604.659.8225 NICK POCRNIC 604.659.8230 TERRI MCEWAN (ASSISTANT) 604.659.8228
MONTREAL (514.350.4450 | 1.866.350.4455)
JOHN HART 514.350.4462 DAVID MAISLIN, CFA 514.350.4460 TANYA HATCHER (ASSISTANT) 514.350.4458
LONDON
ADAM WOOD 0.207.426.5612
INSTITUTIONAL EQUITY TRADING
CO-HEAD OF TRADING BOB MCDONALD, CFA 604.659.8222 ANDREW FOOTE, CFA 416.777.4924
TORONTO (CANADA 1.888.601.6105 | USA 1.800.290.4847) MARK ARMSTRONG 416.777.4981 PAM BANKS 416.777.4923 OLIVER HERBST 416.777.4947 ANDY HERRMANN 416.777.4937 MATT MALOWNEY 416.777.4941 ERIC MUNRO, CFA 416.777.4983 BOB STANDING 416.777.4921 PETER MASON (ASSISTANT) 416.777.7195
VANCOUVER (1.800.667.2899) NAV CHEEMA 604.659.8224 FRASER JEFFERSON 604.659.8218 DEREK ORAM 604.659.8223
MONTREAL (514.350.4450 | 1.866.350.4455) JOE CLEMENT 514.350.4470 PATRICK SANCHE 514.350.4465
INSTITUTIONAL EQUITY OFFICES
Calgary Suite 4250 525 8th Avenue SW Calgary, AB T2P 1G1 403.509.0500
Montreal Suite 3000 1800 McGill College Montreal, PQ H3A 3J6 514.350.4450 Toll Free: 1.866.350.4455
Vancouver Suite 2100 925 West Georgia Street Vancouver, BC V6C 3L2 604.659.8000 Toll Free: 1.800.667.2899
Toronto Suite 5400, Scotia Plaza 40 King Street West Toronto, ON M5H 3Y2 416.777.4900 Toll Free Canada: .888.601.6105 Toll Free USA: 1.800.290.4847
International Headquarters The Raymond James Financial Center 880 Carillon Parkway St.Petersburg, FL USA 33716 727.567.1000