publications - ohio state...
TRANSCRIPT

Investigating the preservation of nitrate isotopiccomposition in a tropical ice corefrom the Quelccaya Ice Cap, PeruAron M. Buffen1, Meredith G. Hastings1, Lonnie G. Thompson2, and Ellen Mosley-Thompson3
1Department of Geological Sciences and Environmental Change Initiative, Brown University, Providence, Rhode Island, USA,2School of Earth Sciences and Byrd Polar Research Center, Ohio State University, Columbus, Ohio, USA, 3Department ofGeography and Byrd Polar Research Center, Ohio State University, Columbus, Ohio, USA
Abstract The nitrogen and oxygen isotopic composition of nitrate in ice cores offers unique potential forexamining reactive nitrogen oxide (NOx) budgets and oxidation chemistry of past atmospheres. A low-latituderecord is of particular interest given that the dominant natural sources of NOx and production of hydroxyl radicalare most prevalent in the tropics. Any interpretation of nitrate in ice cores, however, must first consider thatnitrate in snow is vulnerable to postdepositional loss and isotopic alteration. We report and assess theintegrity of nitrate–δ15N, –δ18O, and –Δ17O in a 30m ice core from a high-elevation site in the central Andes.Clear seasonality in δ15N, δ18O, and nitrate concentration exists throughout most of the record and cannot beexplained by photolysis or evaporation based on our current understanding of these processes. In contrast,nitrate in the upper ~12m of the core and in a snowpit shows very different behavior. This may reflectalteration facilitated by recent melting at the surface. The relationships between δ15N, δ18O, Δ17O, andconcentration in the unaltered sections can be interpreted in terms of mixing of nitrate from discrete sources.Transport effects and an englacial contribution from nitrification cannot be ruled out at this time, but theobserved isotopic compositions are consistent with expected signatures of known NOx sources and atmosphericoxidation pathways. Specifically, nitrate deposited during the wet season reflects biogenic soil emissions andhydroxyl/peroxy radical chemistry in the Amazon, while dry season deposition reflects a lightning source andozone chemistry at higher levels in the troposphere.
1. Introduction
Reactive nitrogen oxides (NOx=NO+NO2) are of fundamental importance to the chemistry of the troposphere.The formation and fate of NOx has implications for air quality, ecosystem health, and the composition of theatmosphere. Photochemical cycling of NOx in the presence of volatile organic compounds, methane, andcarbon monoxide produces ozone (O3), a major air pollutant and potent greenhouse gas in the troposphere[Anenberg et al., 2009]. Oxidation of NOx by O3 or the hydroxyl radical (OH) forms nitrate (NO3
�), an importantand often limiting bionutrient [Elser et al., 2009; Holtgrieve et al., 2011] and a primary component of acidrain in the form of nitric acid (HNO3) [Likens and Bormann, 1974]. Together, concentrations of OH and O3
determine the oxidizing capacity of the atmosphere and regulate the lifetimes of trace gases such asmethane [Thompson, 1992]. NOx emission and nitrate deposition can also affect planetary radiativebalance via direct and indirect aerosol effects and the potential to alter ecosystem carbon storage [Shindellet al., 2009; Janssens et al., 2010].
Over the past 150 years, NOx emissions have increased globally as a result of fossil fuel and biofuel combustion,biomass burning, and aircraft emissions [Galloway et al., 2004]. Important natural inputs of NOx to the troposphereinclude biomass burning, soil microbial emissions, and lightning, with minor contribution from stratosphericinjection and ammonia oxidation [Delmas et al., 1997; Lee et al., 1997]. Past variability in NOxmixing ratios and therelative contribution of these sources, however, remain poorly constrained, and effects on the oxidizing capacity ofthe atmosphere through time are unclear.
The utility of atmospheric nitrate as a paleoenvironmental proxy (e.g., biomass burning and lightning) and inreconstructing NOx concentrations has long motivated its study in ice cores. Nitrate concentrations ([NO3
�])in snow have been shown to reflect changes in atmospheric loading [Mayewski et al., 1990; Schwikowski et al.,1999], but quantitative assessments of atmospheric mixing ratios based on [NO3
�] have been hindered by a
BUFFEN ET AL. ©2014. American Geophysical Union. All Rights Reserved. 2674
PUBLICATIONSJournal of Geophysical Research: Atmospheres
RESEARCH ARTICLE10.1002/2013JD020715
Key Points:• First measurements of nitrate isotopiccomposition from a tropical ice core
• Postdepositional alteration appearslimited throughout most of the record
• Seasonal changes may reflect NOx
sources and atmospheric oxida-tion chemistry
Supporting Information:• Readme• Figure S1• Figure S2• Figure S3
Correspondence to:A. M. Buffen,[email protected]
Citation:Buffen, A. M., M. G. Hastings, L. G.Thompson, and E. Mosley-Thompson(2014), Investigating the preservation ofnitrate isotopic composition in a tropicalice core from the Quelccaya Ice Cap,Peru, J. Geophys. Res. Atmos., 119,2674–2697, doi:10.1002/2013JD020715.
Received 19 AUG 2013Accepted 24 JAN 2014Accepted article online 30 JAN 2014Published online 13 MAR 2014
susceptibility to postdepositional loss, while the partitioning of NOx inputs is complicated by the fact thatconcentration alone is not diagnostic of individual sources.
Measurement of nitrogen and oxygen stable isotope ratios in nitrate provides a complementary approach toreconstructing precursor NOx dynamics through time. Oxygen isotope ratios reflect relative abundances ofoxidants and the reaction pathways by which they convert NOx to nitrate (section 5.6.1) [Michalski et al., 2003,2011; Alexander et al., 2004, 2009; Kendall et al., 2007; Jarvis et al., 2008, 2009; Kunasek et al., 2008]. Thenitrogen isotopic composition, on the other hand, can contain a signature imprinted by the respective NOx
source (section 5.6.2) [e.g., Hoering, 1957; Heaton, 1986; Hastings et al., 2003, 2009; Elliott et al., 2007, 2009;Kendall et al., 2007; Savarino et al., 2007; Li and Wang, 2008; Felix et al., 2012].
Most of these studies have taken place in the mid and high latitudes, and work focusing on archivescontained in snow and ice have been confined, unsurprisingly, to polar regions (see Savarino and Morin[2011] for a summary), the European Alps [Freyer et al., 1996; Pichlmayer et al., 1998], and the RockyMountains [Naftz et al., 2011]. Isotopic studies of atmospheric nitrate in the tropics (23.4°N-S) have beensparse and, to our knowledge, limited to Ecuadorian rain, stream and fog water [Brothers et al., 2008; Fabianet al., 2009; Schwarz et al., 2011], aerosols and rain over the Atlantic Ocean [Baker et al., 2007; Alexanderet al., 2009; Morin et al., 2009], and salt deposits in the Atacama Desert of Chile [Michalski et al., 2004a, andreferences therein].
The dominant natural sources of NOx, however, are located in the tropics as is production of OH [Yienger andLevy, 1995; Lee et al., 1997; Crutzen and Lelieveld, 2001; Jaeglé et al., 2005]. Given the short residence times of NOx
(hours to days) and nitrate (days as HNO3; up to weeks as organic nitrate) in the lower troposphere relative tothe interhemispheric mixing time (~1 year), concentrations of these species are highly heterogeneous in theatmosphere. As such, the spatial context within which a given record of atmospheric nitrate can be interpretedwill be largely regional.
Tropical ice core records of nitrate isotopic composition thus hold a unique potential for reconstructing NOx andoxidant variability in key source regions and add to the suite of paleoenvironmental proxies available from thesearchives (e.g., as a biomass burning indicator). Such reconstructions would provide useful validation for models[Levy et al., 1999; Alexander et al., 2009] and can bridge higher-latitude studies in establishing a more globalperspective. A serious potential caveat, however, is that nitrate can be lost from the snowpack by processeswhich are isotopically fractionating, and where significant, this will preclude an accurate interpretation of therecord ultimately preserved in the ice below. As such, any study of nitrate in ice cores must first assess the extentto which such postdepositional processing has occurred.
The work presented here takes this approach in developing the first tropical ice core record of nitrate isotopiccomposition. Using a 30m core drilled from the Quelccaya Ice Cap, southeastern Peru, that spans the period~1980 to 2003, we find that the effects of photolysis and evaporation of HNO3 have been limited or negligiblethroughout much of the record. In contrast, the more recent portion of the core (~1997 to 2003) and a 2msnowpit sampled in 2011 appear to have been isotopically altered. The fractionating processes by which thishas occurred are difficult to distinguish but may have been facilitated by meltwater leaching of nitrate inducedby recent warming at the site. We conclude that interpreting the isotopic composition of the unaltered portionsof the core in terms of source and oxidant signatures should be possible and that this potential also exists forother tropical glaciers where conditions are suitable.
2. Site Description
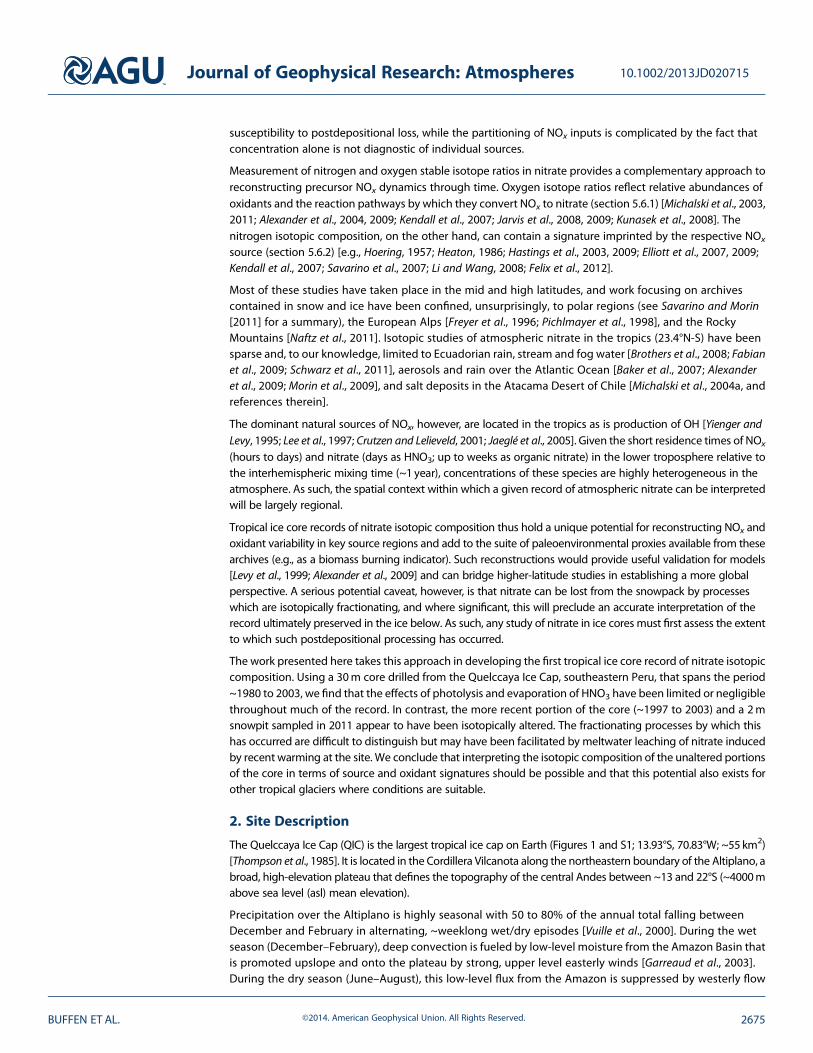
The Quelccaya Ice Cap (QIC) is the largest tropical ice cap on Earth (Figures 1 and S1; 13.93°S, 70.83°W; ~55 km2)[Thompson et al., 1985]. It is located in the Cordillera Vilcanota along the northeastern boundary of the Altiplano, abroad, high-elevation plateau that defines the topography of the central Andes between ~13 and 22°S (~4000mabove sea level (asl) mean elevation).
Precipitation over the Altiplano is highly seasonal with 50 to 80% of the annual total falling betweenDecember and February in alternating, ~weeklong wet/dry episodes [Vuille et al., 2000]. During the wetseason (December–February), deep convection is fueled by low-level moisture from the Amazon Basin thatis promoted upslope and onto the plateau by strong, upper level easterly winds [Garreaud et al., 2003].During the dry season (June–August), this low-level flux from the Amazon is suppressed by westerly flow
Journal of Geophysical Research: Atmospheres 10.1002/2013JD020715
BUFFEN ET AL. ©2014. American Geophysical Union. All Rights Reserved. 2675
aloft, while the contribution of moist air from the eastern Pacific is inhibited by sharp coastal topography,large-scale subsidence, and a strong temperature inversion over the cool surface waters.
Net accumulation at the QIC summit (5670m asl) is ~2 to 3m snowyr�1, and mean annual air temperature is�4.3°C based on automated weather station measurements from June 2007 through July 2012 (D. Hardy,personal communication, 2013). Average daily temperatures during December–March and June–Septemberare �5.0 and �3.6°C, though daily maxima during the wet season often exceed the freezing point [Bradleyet al., 2009; D. Hardy, personal communication, 2013].
3. Methods3.1. Sample Collection
In August 2003, a 29.97m ice core (QND30) was recovered from the northern dome (5620m asl) of the QIC bymembers of the Byrd Polar Research Center (BPRC) of The Ohio State University as part of a larger drillinginitiative on the ice cap (Figure S1). The firn-ice transition at the drill site was located below ~23m based ondensity measurements. The unconsolidated top 0.18m of the core was lost during the drilling. QND30 wasdrilled electromechanically without the use of fluid.
The core was returned frozen to the BPRC and stored at �30°C prior to sampling in 2010. All samples werecut by bandsaw in a �10°C facility at ~10 cm resolution, and ~1 cm of each outer surface was discarded.Individual samples, excluding those from sections of snow and firn, were then rinsed with ultrapure MilliporeMilli-Q water and melted at room temperature in precleaned, high-density polyethylene bottles (HDPE) priorto analysis.
Figure 1. Location of the Quelccaya Ice Cap (open star) and regional atmospheric circulation patterns at the 850, 500, and 200hPa levels for December-January-February(wet season) and June-July-August (dry season) averaged over the period 1980–2009 (NCEP--DOE Reanalysis-2 [Kanamitsu et al., 2002]). Geopotential heights of the threepressure levels are roughly 1.5, 5.9, and 12.4 km over the central Andes, respectively. Note that the scale arrows for wind speed, in units of m s�1, differ in size. Shadedareas represent elevations above 3000m asl.
Journal of Geophysical Research: Atmospheres 10.1002/2013JD020715
BUFFEN ET AL. ©2014. American Geophysical Union. All Rights Reserved. 2676

In July 2011, a 2.10m snowpit was sampled at the QIC summit dome (5670m asl) at 2 to 10 cm intervals(Figure S1). These samples were melted in the field in precleaned HDPE bottles sealed with Parafilm andreturned as liquid to Brown University where they were stored at �20°C. The samples were not exposed tosunlight and were kept as liquid for less than 3 days.
3.2. Laboratory Analysis
Nitrate and nitrite (NO2�) concentrations were measured photometrically using a Westco Scientific SmartChem
200 discrete chemistry analyzer. The pooled standard deviation (1σp) of [NO3�] in 85 control standards run
within sets of samples was 0.10μmol L�1 (μM; 6.2ppb NO3�). Nitrite, which is not discriminated from nitrate in
the isotopic analyses described below, was consistently at or below detection limits as determined by systemblanks ([NO3
�] = 0.09μM and [NO2�] = 0.05μM).
Isotopic composition was analyzed following the denitrifier method developed by Sigman et al. [2001] andCasciotti et al. [2002]. This method utilizes denitrifying bacteria to convert NO3
�(aq) to nitrous oxide (N2O(g))
which is then captured and injected into an isotope ratio mass spectrometer (IRMS) in continuous flowmode.At Brown, the technique requires as little as 5 nmol nitrate-N and is thus suited to the low-concentration, low-volume samples typical of ice core research.
Isotope ratios are reported using delta notation (δ15N and δ18O),
δ ¼ Rsample
Rreference� 1
� �� 103 ‰; (1)
where R= 15N/14N or 18O/16O, and values are referenced to atmospheric N2 and Vienna Standard MeanOcean Water (VSMOW), respectively, in units of per mil (‰). All isotope measurements were made using aThermo Scientific Delta V Plus IRMS, and the data were calibrated using the IAEA-NO-3, USGS-34, and USGS-35 nitrate reference standards (Table 1).
We report precision in twoways: the 1σp of all standards runwithin sample sets and the 1σp of replicate samples runin at least two different sets (Table 1). These measures account for variance derived from both sample preparationand isotopic analysis and thus represent the overall method precision rather than instrumental precision.
The bacterial strain used (Pseudomonas aureofaciens) promotes a limited exchange of oxygen between waterand the intermediates of denitrification. This amounts to less than 10%, and frequently less than 3%, of theoxygen in the produced N2O, and thus the δ18O of nitrate is corrected using the measured δ18O of water(δ18Owater) in the sample or standard (see Casciotti et al. [2002] and Kaiser et al. [2007] for further details).Sample δ18Owater was measured at the BPRC using a Finnigan MAT Delta S Plus IRMS (1σ=0.2‰). For 7%exchange, a difference greater than ±10‰ from the “true” δ18Owater is required to affect the accuracy of ournitrate–δ18O results by more than the method precision.
Table 1. Pooled Standard Deviationsa (1σp) in ‰ and Total Sample Size (n) of Standards Run Within Sample Sets andSample Replicates Run in Separate Setsb
1σp (n) IAEA-NO-3 USGS-34 USGS-35 Sample Replicates
δ15N 0.3 (92) 0.2 (92) - 0.5 (108)δ18O 0.5 (92) 0.5 (92) 0.6 (93) 0.8 (108)Δ17O - 0.4 (39) 0.5 (39) 0.6 (7)
Standard Values IAEA-NO-3 USGS-34 USGS-35 Reference
δ15N 4.7 �1.8 - Böhlke et al. [2003]δ18O 25.6 �27.9 57.5 Böhlke et al. [2003]Δ17Oc - �0.3 21.6 Michalski et al. [2002]
aσp ¼ffiffiffiffiffiffiffiffiffiffiffiffiffiffiffiffiffiffiffiffiffiffiffiffiffiffiffiffi∑ki¼1 ni � 1ð Þs2i∑ki¼1 ni � 1ð Þ
s, where ni and si
2 are the size and variance of the ith set of samples, respectively, and k is
the total number of sets.bAlso listed are the accepted reference values for δ15N versus N2-air and for δ18O and Δ
17O versus VSMOW for the cali-bration standards used. Within a run, samples and standards are analyzed at similar concentrations and in equivalentamounts (10–5 nmol for δ15N and δ18O; 50–35 nmol for Δ17O).
cCalculated using the linear definition Δ17O= δ17O� 0.52 · δ18O.
Journal of Geophysical Research: Atmospheres 10.1002/2013JD020715
BUFFEN ET AL. ©2014. American Geophysical Union. All Rights Reserved. 2677
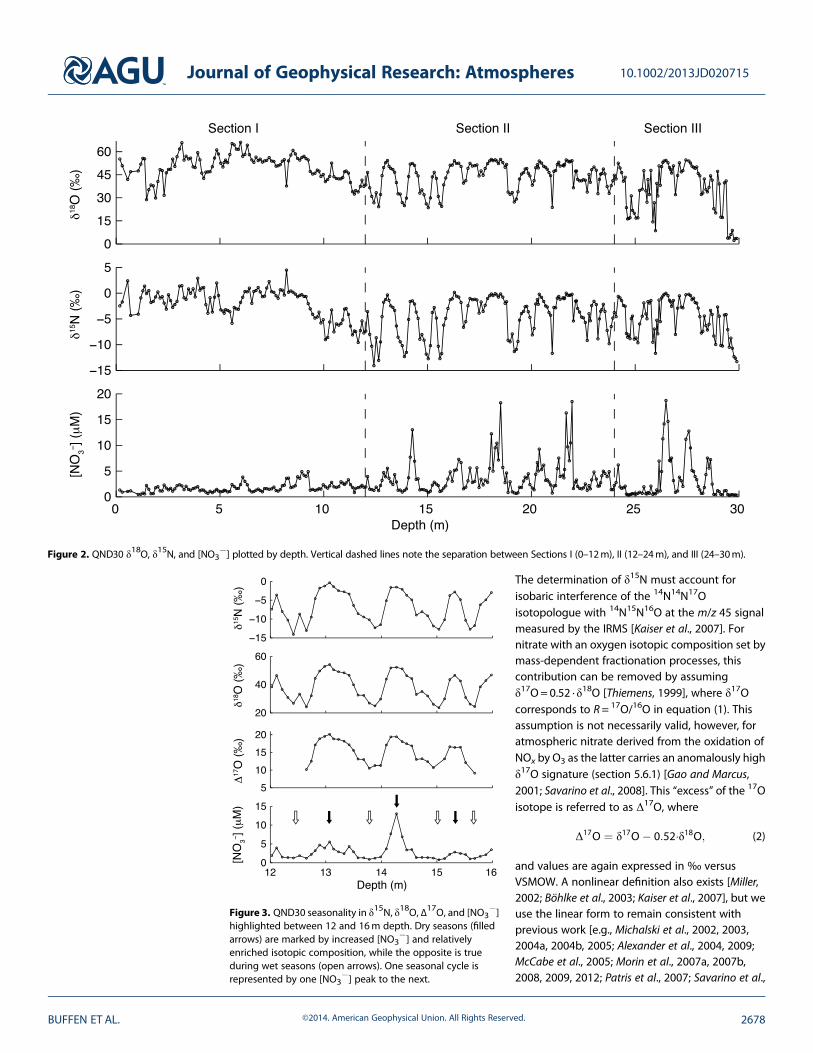
The determination of δ15N must account forisobaric interference of the 14N14N17Oisotopologue with 14N15N16O at the m/z 45 signalmeasured by the IRMS [Kaiser et al., 2007]. Fornitrate with an oxygen isotopic composition set bymass-dependent fractionation processes, thiscontribution can be removed by assumingδ17O= 0.52 · δ18O [Thiemens, 1999], where δ17Ocorresponds to R= 17O/16O in equation (1). Thisassumption is not necessarily valid, however, foratmospheric nitrate derived from the oxidation ofNOx by O3 as the latter carries an anomalously highδ17O signature (section 5.6.1) [Gao and Marcus,2001; Savarino et al., 2008]. This “excess” of the 17Oisotope is referred to as Δ17O, where
Δ17O ¼ δ17O� 0:52�δ18O; (2)
and values are again expressed in ‰ versusVSMOW. A nonlinear definition also exists [Miller,2002; Böhlke et al., 2003; Kaiser et al., 2007], but weuse the linear form to remain consistent withprevious work [e.g., Michalski et al., 2002, 2003,2004a, 2004b, 2005; Alexander et al., 2004, 2009;McCabe et al., 2005; Morin et al., 2007a, 2007b,2008, 2009, 2012; Patris et al., 2007; Savarino et al.,
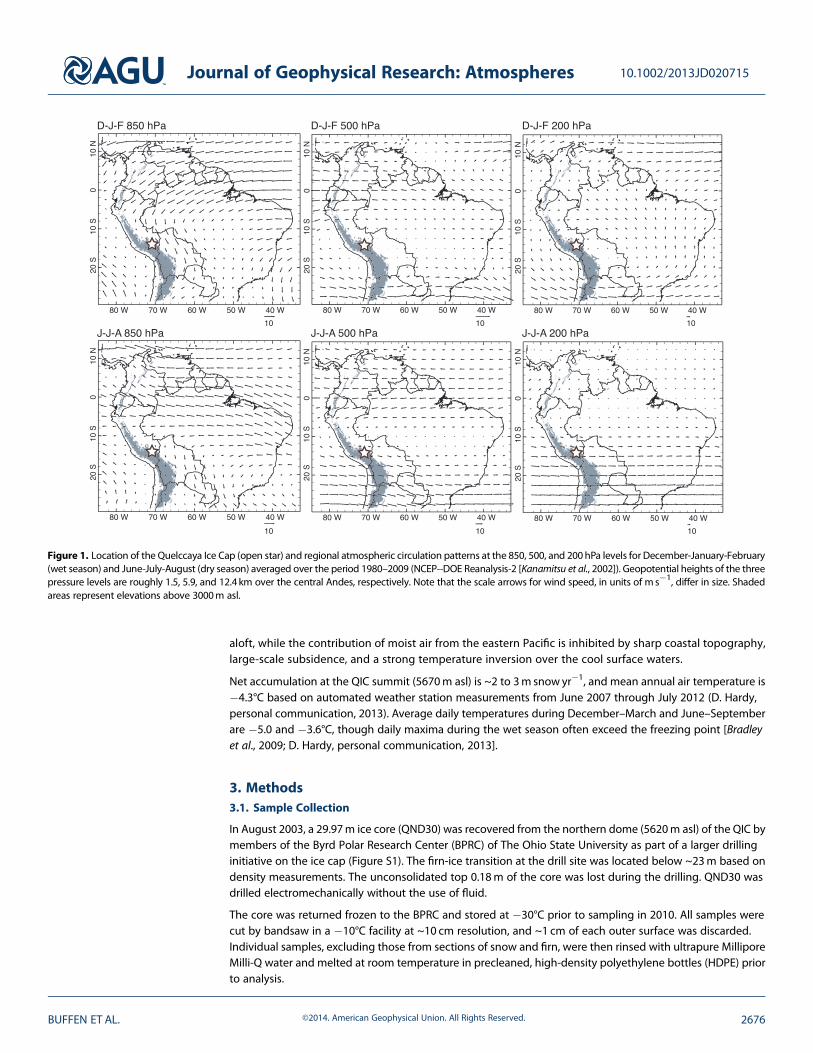
Figure 2. QND30 δ18O, δ15N, and [NO3�] plotted by depth. Vertical dashed lines note the separation between Sections I (0–12m), II (12–24m), and III (24–30m).
Figure 3. QND30 seasonality in δ15N, δ18O, Δ17O, and [NO3�]
highlighted between 12 and 16m depth. Dry seasons (filledarrows) are marked by increased [NO3
�] and relativelyenriched isotopic composition, while the opposite is trueduring wet seasons (open arrows). One seasonal cycle isrepresented by one [NO3
�] peak to the next.
Journal of Geophysical Research: Atmospheres 10.1002/2013JD020715
BUFFEN ET AL. ©2014. American Geophysical Union. All Rights Reserved. 2678
2007; Kunasek et al., 2008; Frey et al., 2009; Erblandet al., 2013].
Underestimating this contribution will lead to anoverestimate of δ15N by as much as 1 to 2‰. Wethus correct the QND30 data by using Δ17Omeasured on a subset of 66 samples following thedenitrifier approach of Kaiser et al. [2007] andreferenced to the USGS-34 and USGS-35 standards(Table 1). This method involves thermally decomposingthe N2O product to O2 for isotopic analysis and requiresa minimum sample size of 35nmol nitrate-N at Brown.(Note that Δ17O and δ18O are thus determinedindependently as separate injections result in Δ17Ocalculated from the O2 measurements compared toδ18O determined from N2O analysis.) The 1σp ofstandards and replicates is reported in Table 1. Forsamples that were not analyzed, Δ17O was estimatedbased on the strong linear relationship with δ18O thatis observed in our data set (section 4.2). A differencewithin ±8‰ of the “true” sample Δ17O, whichis greater than the largest residual in the regressions,influences the δ15N results by less than the method
precision. For the snowpit, the same approach was taken to correct the data using 15 samples withsufficient volume remaining after having been analyzed for δ15N and δ18O.
4. Results4.1. Nitrate Concentration
It is well established that insoluble dust and major ion concentrations (e.g., NO3�, Cl�, F�, SO4
2�, Ca2+, K+,Na+, NH4
+, and Mg2+) in ice cores from throughout thecentral Andes reflect the strong seasonality ofprecipitation in the region [Thompson et al., 1986, 1995,1998, 2006, 2013]. Dry seasons are marked by highconcentrations of both dust and ions due to elevatedfluxes and minimal snowfall, while low concentrationsduring the wet season reflect muted deposition andhigh snow accumulation. Dating of annual layers inAndean cores primarily relies on counting of theseseasonal cycles in dust and chemistry, including[NO3
�] in particular (see Thompson et al. [1995, 1998]for examples).
QND30 exhibits strong variability in [NO3�], ranging
from 0.26 to 18.69μM (16–1159 ppb NO3�; Figure 2).
Characteristic seasonal cycles are evident, particularlybelow 12m (Figures 2 and 3). Above this depth,seasonality exists but appears dampened with [NO3
�]varying between 0.46 and 4.88μM (29–303 ppb NO3
�).Counting of the dry season [NO3
�] peaks places thebottom age of the record at ~1980. Concentrations inthe 2011 snowpit span 0.14 to 9.44μM (8–585 ppbNO3
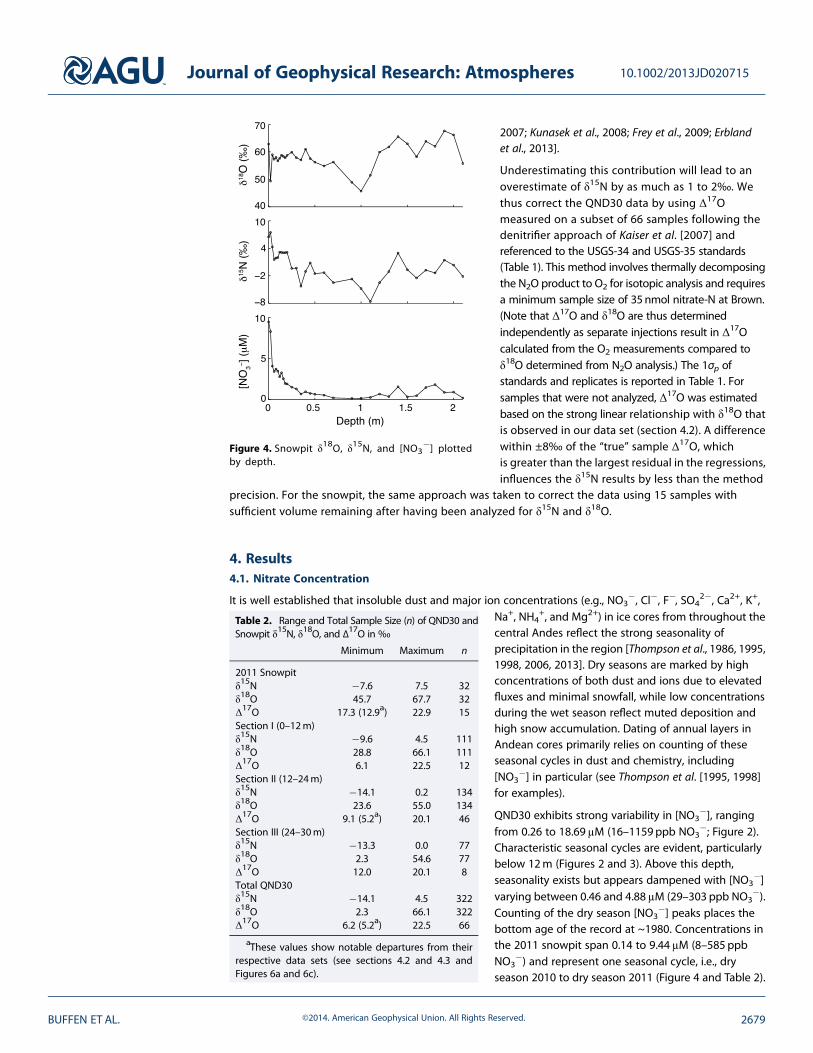
�) and represent one seasonal cycle, i.e., dryseason 2010 to dry season 2011 (Figure 4 and Table 2).
Figure 4. Snowpit δ18O, δ15N, and [NO3�] plotted
by depth.
Table 2. Range and Total Sample Size (n) of QND30 andSnowpit δ15N, δ18O, and Δ
17O in‰
Minimum Maximum n
2011 Snowpitδ15N �7.6 7.5 32δ18O 45.7 67.7 32Δ17O 17.3 (12.9a) 22.9 15Section I (0–12m)δ15N �9.6 4.5 111δ18O 28.8 66.1 111Δ17O 6.1 22.5 12Section II (12–24m)δ15N �14.1 0.2 134δ18O 23.6 55.0 134Δ17O 9.1 (5.2a) 20.1 46Section III (24–30m)δ15N �13.3 0.0 77δ18O 2.3 54.6 77Δ17O 12.0 20.1 8Total QND30δ15N �14.1 4.5 322δ18O 2.3 66.1 322Δ17O 6.2 (5.2a) 22.5 66
aThese values show notable departures from theirrespective data sets (see sections 4.2 and 4.3 andFigures 6a and 6c).
Journal of Geophysical Research: Atmospheres 10.1002/2013JD020715
BUFFEN ET AL. ©2014. American Geophysical Union. All Rights Reserved. 2679
4.2. QND30 Isotopic Composition
There are marked differences in δ15N, δ18O, and Δ17O between sections of the core in terms of absolutevalues, seasonality, and how the three isotopic parameters relate to each other and to [NO3
�]. To aid thediscussion below, we thus segregate the results into three depth intervals: 0 to 12m (Section I), 12 to24m (Section II), and 24 to 30m (Section III).4.2.1. Section I—0 to 12mSection I generally appears isotopically enriched relative to the record below (Figure 2 and Table 2). δ15N andδ18O vary from �9.6 to 4.5‰ and 28.8 to 66.1‰, respectively, and these ranges include the highest valuesobserved in QND30. It is interesting to note that enrichment in the top 12m is much more apparent in theabsence of the very low values found in the sections below. Section I also lacks straightforward variability in
a) b) c)
d) e) f)
g) h) i)
j) k) l)
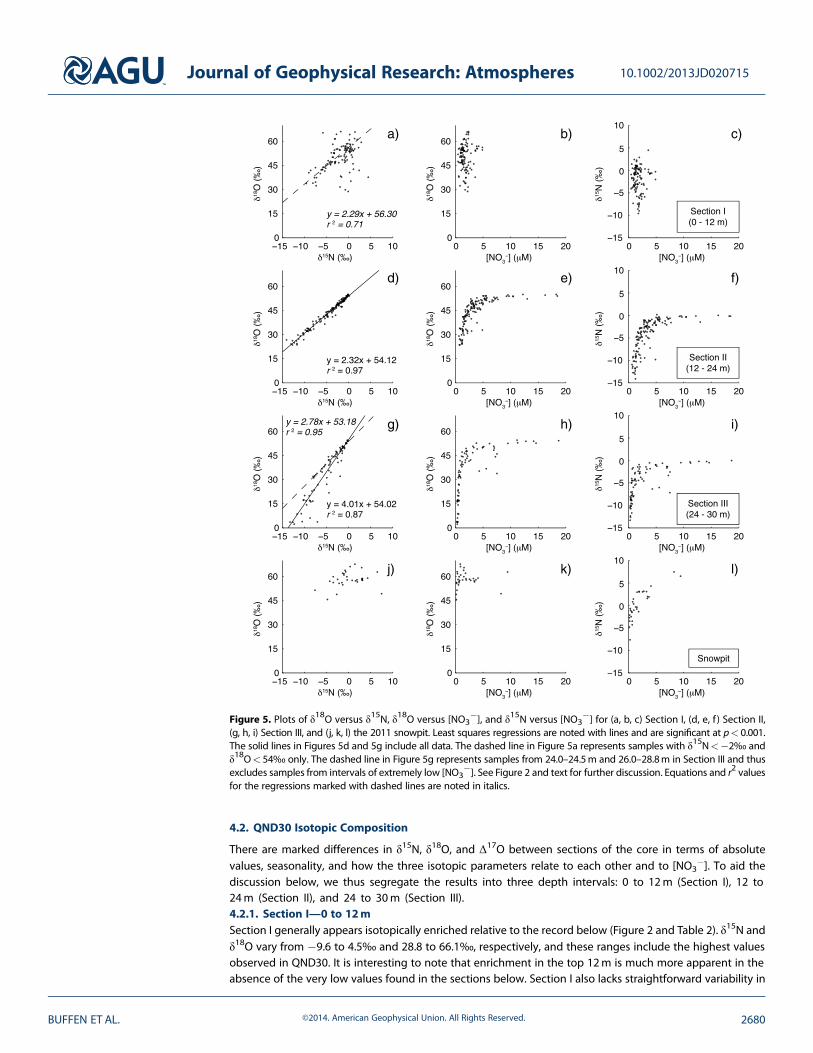
Figure 5. Plots of δ18O versus δ15N, δ18O versus [NO3�], and δ15N versus [NO3
�] for (a, b, c) Section I, (d, e, f ) Section II,(g, h, i) Section III, and (j, k, l) the 2011 snowpit. Least squares regressions are noted with lines and are significant at p< 0.001.The solid lines in Figures 5d and 5g include all data. The dashed line in Figure 5a represents samples with δ15N<�2‰ andδ18O< 54‰ only. The dashed line in Figure 5g represents samples from 24.0–24.5m and 26.0–28.8m in Section III and thusexcludes samples from intervals of extremely low [NO3
�]. See Figure 2 and text for further discussion. Equations and r2 valuesfor the regressions marked with dashed lines are noted in italics.
Journal of Geophysical Research: Atmospheres 10.1002/2013JD020715
BUFFEN ET AL. ©2014. American Geophysical Union. All Rights Reserved. 2680
δ15N and δ18O unlike the lower corewhere there are defined seasonal cyclescorresponding to [NO3
�]. As notedabove, [NO3
�] seasonality in this sectionis identifiable but appears muted. Noclear relationship exists between [NO3
�]and δ15N or δ18O (Figures 5b and 5c).There is considerable spread in the datawhen δ18O is plotted against δ15N,especially at higher values, though alinear relationship appears to exist forvalues of δ15N<�2‰ andδ18O< 54‰ (Figure 5a).
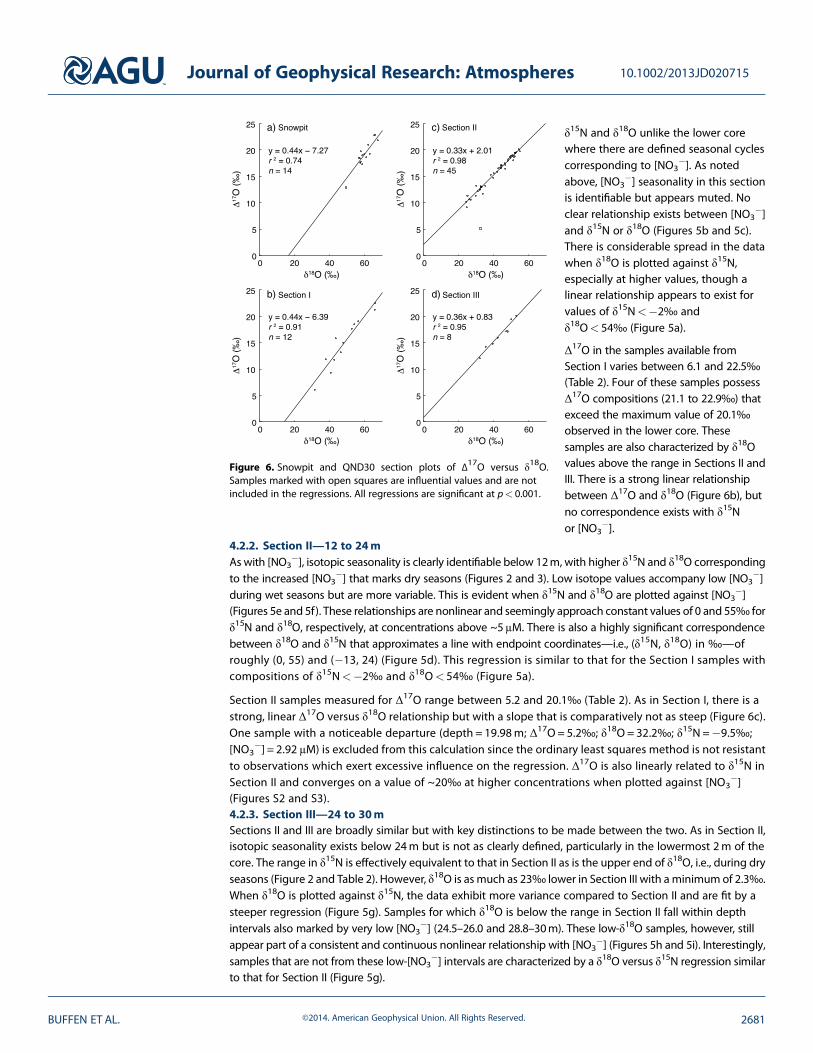
Δ17O in the samples available fromSection I varies between 6.1 and 22.5‰(Table 2). Four of these samples possessΔ17O compositions (21.1 to 22.9‰) thatexceed the maximum value of 20.1‰observed in the lower core. Thesesamples are also characterized by δ18Ovalues above the range in Sections II andIII. There is a strong linear relationshipbetween Δ17O and δ18O (Figure 6b), butno correspondence exists with δ15Nor [NO3
�].4.2.2. Section II—12 to 24mAs with [NO3
�], isotopic seasonality is clearly identifiable below 12m, with higher δ15N and δ18O correspondingto the increased [NO3
�] that marks dry seasons (Figures 2 and 3). Low isotope values accompany low [NO3�]
during wet seasons but are more variable. This is evident when δ15N and δ18O are plotted against [NO3�]
(Figures 5e and 5f). These relationships are nonlinear and seemingly approach constant values of 0 and 55‰ forδ15N and δ18O, respectively, at concentrations above ~5μM. There is also a highly significant correspondencebetween δ18O and δ15N that approximates a line with endpoint coordinates—i.e., (δ15N, δ18O) in ‰—ofroughly (0, 55) and (�13, 24) (Figure 5d). This regression is similar to that for the Section I samples withcompositions of δ15N<�2‰ and δ18O< 54‰ (Figure 5a).
Section II samples measured for Δ17O range between 5.2 and 20.1‰ (Table 2). As in Section I, there is astrong, linear Δ17O versus δ18O relationship but with a slope that is comparatively not as steep (Figure 6c).One sample with a noticeable departure (depth = 19.98m; Δ17O = 5.2‰; δ18O = 32.2‰; δ15N =�9.5‰;[NO3
�] = 2.92 μM) is excluded from this calculation since the ordinary least squares method is not resistantto observations which exert excessive influence on the regression. Δ17O is also linearly related to δ15N inSection II and converges on a value of ~20‰ at higher concentrations when plotted against [NO3
�](Figures S2 and S3).4.2.3. Section III—24 to 30mSections II and III are broadly similar but with key distinctions to be made between the two. As in Section II,isotopic seasonality exists below 24m but is not as clearly defined, particularly in the lowermost 2m of thecore. The range in δ15N is effectively equivalent to that in Section II as is the upper end of δ18O, i.e., during dryseasons (Figure 2 and Table 2). However, δ18O is as much as 23‰ lower in Section III with a minimum of 2.3‰.When δ18O is plotted against δ15N, the data exhibit more variance compared to Section II and are fit by asteeper regression (Figure 5g). Samples for which δ18O is below the range in Section II fall within depthintervals also marked by very low [NO3
�] (24.5–26.0 and 28.8–30m). These low-δ18O samples, however, stillappear part of a consistent and continuous nonlinear relationship with [NO3
�] (Figures 5h and 5i). Interestingly,samples that are not from these low-[NO3
�] intervals are characterized by a δ18O versus δ15N regression similarto that for Section II (Figure 5g).
Figure 6. Snowpit and QND30 section plots of Δ17O versus δ18O.
Samples marked with open squares are influential values and are notincluded in the regressions. All regressions are significant at p< 0.001.
Journal of Geophysical Research: Atmospheres 10.1002/2013JD020715
BUFFEN ET AL. ©2014. American Geophysical Union. All Rights Reserved. 2681
Values for Δ17O in Section III range between 12.0 and 20.1‰ and are linearly related to both δ18O and δ15N(Table 2 and Figures 6d and S2). The composition and character of these values are similar to those in SectionII. This would seem to conflict with the different relationships between δ18O and δ15N in the two sections(Figures 6c and 6d). This apparent discrepancy is likely due to the fact that Section III sample availability waslimited by volume, and samples with [NO3
�] less than 0.85μM could not be analyzed. As a result, no sampleswith δ18O below the range observed for Section II were measured for Δ17O, and those that were analyzed hadisotopic compositions which plot close to the δ18O versus δ15N regression for Section II.
4.3. 2011 Snowpit
Snowpit δ15N and δ18O range from�7.6 to 7.5‰ and 45.7 to 67.7‰, respectively (Table 2). Like Section I, thesevalues are generally higher than in Sections II and III, and seasonality is not apparent in isotopic compositiondespite being present in [NO3
�] (Figure 4). There is also little or no correspondence between δ18O, δ15N, and[NO3
�] (Figures 5j–5l). Snowpit Δ17O varies between 12.9 and 22.9‰, but these measurements representmostly dry season samples due to the limited volumes available for analysis. As with Section I, there is a linearrelationship between Δ17O and δ18O that is steeper compared to Sections II and III (Figure 6a). One sample(depth=0.02m;Δ17O=12.9‰; δ18O=49.4‰; δ15N=7.5‰; [NO3
�] = 8.26μM) is not included in the regressionas it is a highly influential value. The snowpit is also similar to Section I in that there is no statistically significantrelationship between Δ17O and δ15N (Figure S2a).
5. Discussion
Any interpretation of nitrate archived in ice must consider that it is not irreversibly deposited in the snowpack.Nitrate can be lost from the surface and near-surface via photolysis and/or evaporation of HNO3 [Honrath et al.,1999, 2000; Jones et al., 2000; Röthlisberger et al., 2000, 2002; Dibb et al., 1998, 2002; Grannas et al., 2007]. Theextent of loss, however, is dependent on local factors such as snow accumulation rate, temperature, snowchemistry and pH, actinic flux, and the chemical form and physical state in which nitrate is present [Freyer et al.,1996; Röthlisberger et al., 2000, 2002; Burkhart et al., 2004, 2009; Grannas et al., 2007].
Loss can be particularly severe at sites where accumulation rates are extremely low. At Dome C and Vostok inEast Antarctica (< 10 cm snowyr�1 [Röthlisberger et al., 2000]), decreases in [NO3
�] approaching 100-fold areobserved over the top few centimeters of the snowpack [Mayewski and Legrand, 1990; Wagnon et al., 1999;Röthlisberger et al., 2000; Blunier et al., 2005; Frey et al., 2009]. Isotopic fractionation associated with such loss isstriking. Decreasing [NO3
�] over the top 10 cm at Dome C, for example, is coincident with a ~200‰ increasein δ15N attributed to the photolytic destruction of nitrate [Blunier et al., 2005; Frey et al., 2009]. Such changeappears consistent with other sites on the East Antarctic Plateau [Erbland et al., 2013].
Under higher accumulation regimes, however, seasonal and interannual profiles of [NO3�] and isotopic
composition appear largely preserved indicating that postdepositional alteration is less influential [Mulvaneyand Wolff, 1993; Burkhart et al., 2004, 2006; Hastings et al., 2004; Dibb et al., 2007; Jarvis et al., 2008, 2009]. Thisis evident at Summit, Greenland (~65 cm snowyr�1 [Dibb and Fahnestock, 2004]) where it is estimated that 70to over 90% of deposited nitrate is preserved [Burkhart et al., 2004; Dibb et al., 2007]. At the same site, Hastingset al. [2004] found no change in [NO3
�], δ15N, or δ18O in overlapping snowpits sampled at the beginning andend of the summer, i.e., after 6months of continuous irradiance. Modeling work by Jarvis et al. [2008]concluded that the seasonal profiles in these same snowpits could not be explained byphotochemical processing.
In this context, the QIC presents an interesting case in that snow accumulation is roughly 3 to 5 times greaterthan at summit, but the distribution is strongly skewed toward the wet season. During the dry season,prolonged exposure of snow at the surface increases the potential for photolysis. Additionally, the relativelywarm temperatures at the site may promote evaporation of HNO3. These possibilities must be consideredbefore any attempt is made to interpret the downcore archive. In what follows, we evaluate the QND30 and2011 snowpit records in terms of processes that can alter the isotopic composition and/or concentration ofnitrate subsequent to its deposition. These include the direct and indirect effects of photolysis (section 5.1),evaporation (section 5.2), englacial microbial activity (section 5.3), and meltwater leaching (section 5.5).
Journal of Geophysical Research: Atmospheres 10.1002/2013JD020715
BUFFEN ET AL. ©2014. American Geophysical Union. All Rights Reserved. 2682
5.1. Assessing Photolytic Alteration5.1.1. Isotopic Fractionation of Nitrate by PhotolysisThe major pathways for nitrate photolysis at Earth’s surface proceed by
NO3� þ hv þHþð Þ→NO2 þ OH (R1)
NO3� þ hv→NO2
� þ O 3P� �
; (R2)
with reaction (R1) thought to be roughly 8 to 9 times more effective than (R2) [Warneck and Wurzinger, 1988;Dubowski et al., 2001]. These reactions are thought to take place in the aqueous phase within a quasi-liquidlayer (QLL) on the surface of ice crystals, and yields measured in liquid and ice thus appear continuous acrossthe freezing point [Dubowski et al., 2001; 2002; Chu and Anastasio, 2003; Grannas et al., 2007]. Nitratephotochemistry in snow is complex [e.g., Jacobi and Hilker, 2007; Abida and Osthoff, 2011], but losses undermost conditions are expected to be as NO2 and NO released in the gas phase from the QLL. NO2 is primarilyderived via (R1) or by the reaction of NO2
� with OH, while NO is a product of NO2� and NO2 photolysis. NO2
can also be oxidized back to NO3� by OH at rates comparable to its transfer to the gas phase [Jacobi and
Hilker, 2007]. Under acidic conditions (pH<~5), the protonation of NO2� to form gaseous HONO is also
important [Grannas et al., 2007, and references therein].
Frey et al. [2009] examined photolytic fractionation of nitrate in snow at Dome C using a theoretical framework firstapplied by Yung and Miller [1997] to stratospheric N2O. The framework exploits mass-dependent differences invibrational frequency and ground-state energy for a given set of isotopologues. These differences shift the spectralabsorptivities of the heavier isotopologues to longer wavelengths and are, in turn, directly related to their isotopicfractionation constants [Miller and Yung, 2000]. As pointed out by Frey et al. [2009], this assumes that the differentnitrate isotopologues retain similar spectral absorption curves and equal quantumyields. Despite these assumptions,we agree that this approach provides a useful first approximation with which to assess available observations.
The photolysis rate constant, jA (s�1), for a given molecule, A, can be calculated by
jA ¼ ∫λ2
λ1σA λ; Tð Þ ϕA λ; T ; pHð Þ I λð Þ d λð Þ; (3)
where σA is the spectral absorptivity (cm�2), I is the spectral actinic flux (photons cm�2 sec�1 nm�1), andϕA is
the quantum yield and represents the probability (0 to 1) that dissociation occurs [Seinfeld and Pandis, 2006].Using rate constants derived by integrating this equation for a given photolysis pathway and heavy/lightisotopologue pair (e.g., 15N16O3
�/14N16O3�), an isotopic enrichment factor, ε (‰), can be calculated by
ε ¼ jheavyjlight
� 1
!� 103 ¼ α� 1ð Þ �103; (4)
where α is the fractionation constant in the classical Rayleigh equation [Criss, 1999]
δresidual ¼ δinitial þ 103� �� f α–1ð Þ � 103; (5)
and f is the fraction of the initial nitrate pool remaining in the snowpack, i.e., [NO3�]residual/[NO3
�]initial.
Given the predominance of reaction (R1), we have carried out the above calculations for this pathway usingspectral absorptivities measured by Chu and Anastasio [2003] between 280 and 360nmat 278°K. Measurementswere made only between 278 and 298°K, but the authors note that σ varies little over this range. The quantumyield was calculated to be 5.57× 10�3 at 273°K, and pH=5 in the same study. The pH of QND30 samples is likelycircumneutral to basic (section 5.4), but changes in ϕ at pH≥ 5 are negligible. A mean daily actinic flux (λ=280to 360nm) at the QIC was estimated for eachmonth of 2003 using the Tropospheric Ultraviolet Visible (TUV) 5.0radiation model assuming clear sky conditions and includes total-column O3 concentrations [Madronich andFlocke, 1998].
The resulting mean annual enrichment factors are ε15N =�42.5 ± 0.9‰ and ε18O =�30.5 ± 0.6‰. Forcomparison, Frey et al. [2009] calculated values for summer conditions at Dome C of ε15N =�47.6‰ andε18O =�34.2‰. Monthly averages for the QIC vary from�41.7 to�44.1‰ for ε15N and�29.9 to�31.6‰ for
Journal of Geophysical Research: Atmospheres 10.1002/2013JD020715
BUFFEN ET AL. ©2014. American Geophysical Union. All Rights Reserved. 2683
ε18O with the more negative values centered around the month of June, i.e., the dry season. This implies thatthe fraction lost by photolysis will be isotopically depleted relative to the residual nitrate in the snowwhich, inturn, will undergo strong progressive enrichment. Additionally, increases in δ15N will exceed those in δ18Odue to the more negative ε15N value.5.1.2. Photolysis—Direct EffectsWe begin by assuming the null hypothesis that δ15N and δ18O variability in QND30 is, exclusively, controlledby photolytic fractionation following from the calculated enrichment factors. We assume that the initial nitratepool is deposited at the surface with a fixed isotopic composition and concentration and that fractionationproceeds as a Rayleigh-type process such that it is unidirectional and enrichment is a function of the residualconcentration. When using the approximate form of equation (5),
δresidual ≈ δinitial þ ε � ln NO3�½ �residual; (6)
it is clear that a regression of observed δ versus ln[NO3�] will be linear with a slope roughly equal to the
enrichment factor [e.g., Mariotti et al., 1988].
At Dome C, changes in δ15N and [NO3�] appear to be adequately described within this framework. There is
strong, progressive enrichment as [NO3�] decreases in the snowpack, and a regression of δ15N versus ln
[NO3�] is approximately linear with the derived ε values agreeing reasonably well with that modeled for
photolysis at this site [Blunier et al., 2005; Frey et al., 2009].
With regard toQND30, there is no correspondence between the isotope parameters and [NO3�] above 12m (which
we address in section 5.5), while δ15N and δ18O in Sections II and III exhibit nonlinear relationships with [NO3�] as
progressively higher values correspond with increasing [NO3�] (Figure 5). This pattern is opposite that predicted by
themodeled ε values since photolytic losswould lead to enrichment at lower concentrations. Additionally, δ15N andδ18O are not linearly related to ln[NO3
�] and this further conflicts with a simple Rayleigh process.
It is important, however, to qualify this last point. Equation (5) requires that [NO3�]initial be fixed, but nitrate
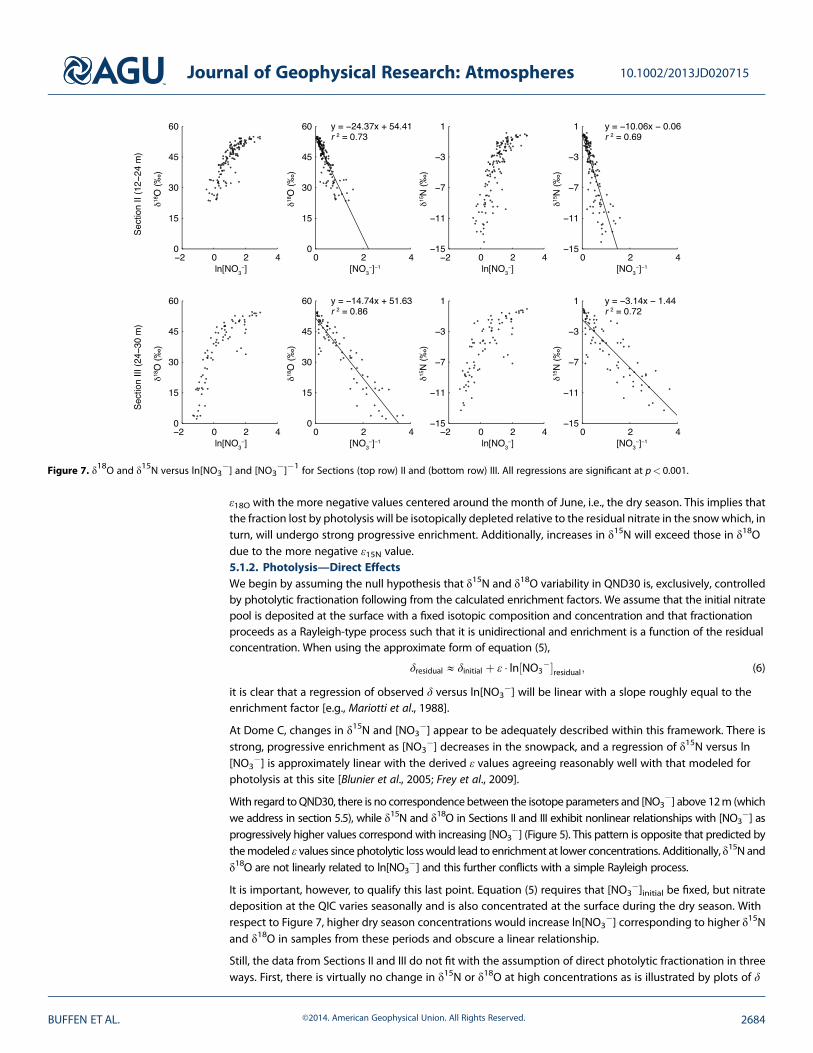
deposition at the QIC varies seasonally and is also concentrated at the surface during the dry season. Withrespect to Figure 7, higher dry season concentrations would increase ln[NO3
�] corresponding to higher δ15Nand δ18O in samples from these periods and obscure a linear relationship.
Still, the data from Sections II and III do not fit with the assumption of direct photolytic fractionation in threeways. First, there is virtually no change in δ15N or δ18O at high concentrations as is illustrated by plots of δ
Figure 7. δ18O and δ15N versus ln[NO3�] and [NO3
�]�1 for Sections (top row) II and (bottom row) III. All regressions are significant at p< 0.001.
Journal of Geophysical Research: Atmospheres 10.1002/2013JD020715
BUFFEN ET AL. ©2014. American Geophysical Union. All Rights Reserved. 2684
versus [NO3�] (Figures 5e, 5f, 5h, and 5i). This implies that any fractionating loss process must be negligible
during the dry season because it is the fraction lost from an initial reactant pool that governs the degree ofenrichment, not the initial concentration. Second, relative changes in δ15N and δ18O due to fractionation shouldvary predictably and proportionally to their enrichment factors regardless of changes in [NO3
�]initial. If driven byphotolysis alone, a plot of δ18O versus δ15N would approximate a line with a slope of ~0.7 (i.e., ε18O/ε15N). Linearregressions of δ18O versus δ15N for Sections II and III, however, display slopes of 2.3 and 4.0, respectively(Figures 5d and 5g). Finally, photolytic fractionation would have no direct effect on Δ17O since it is a mass-dependent process, yet Δ17O clearly changes and exhibits strong relationships with δ18O in all sections and withδ15N in Sections II and III (Figures 6 and S2).5.1.3. Photolysis—Secondary Oxidation EffectsAs discussed above, direct photolytic loss should increase both δ15N and δ18O in the residual NO3
� while
leaving Δ17O unaltered. In East Antarctic snowpit profiles, however, δ18O and Δ17O consistently show
decreases with depth that are coincident with the strong δ15N increases predicted by photolysis [Frey et al.,
2009; Erbland et al., 2013]. One explanation for this apparent discrepancy is that the NO2, NO2�, and NO
photolytic products undergo subsequent oxidation reactions with OH and H2O in the QLL to produce
secondary NO3� [McCabe et al., 2005; Jacobi and Hilker, 2007]. Since OH and H2O typically possess a Δ17O of
~0‰ and δ18O lower than that of the initial NO3� [Dubey et al., 1997;Meijer and Li, 1998;Michalski et al., 2011],
the evolving nitrate-O pool will be diluted by mixing with the re-formed NO3�, acting to decrease both δ18O
and Δ17O. Direct oxygen exchange between NO3� and H2O is negligible except at HNO3 concentrations far
higher than those found in natural snow [Bunton et al., 1952].
Decreases in δ18O due to mixing with secondary NO3� should be offset to some degree by the competing
effect of direct photolytic enrichment. This direct effect, as mentioned above, was invoked to explain the250 to 300‰ increases in δ15N observed in East Antarctic snowpits [Frey et al., 2009; Erbland et al., 2013].Following from the ratio of photolytic enrichment factors calculated by Frey et al. [2009] for Dome C (ε18O/ε15N),this would equate to concomitant increases in δ18O of 180 to 216‰ due solely to direct photolytic loss. Theobserved changes in δ18O, which are on the order of �30 to �40‰, imply that mixing with an isotopicallydepleted oxygen pool has been substantial.
Variations in δ15N do not correspond to δ18O or Δ17O in Section I, but δ15N changes in Sections II and III are ofthe same sign as δ18O and Δ17O (Figures 5, 6, and S2). This behavior in the lower sections suggests thatsecondary oxidation in the QLL has not been extensive. Even if it is assumed that increases in δ18O are due tophotolytic enrichment somehow outweighing secondary isotopic depletion, which seems unlikely followingfrom the discussion of direct effects above, Δ17O should still decrease if oxygen exchange was taking placewith OH or H2O (i.e., slopes of the Δ17O versus δ18O linear regressions would be negative) since Δ17O wouldbe unaffected by the mass-dependent fractionation.
NOx can also be released from the QLL and react in the gas phase to form secondary nitrate within or above thesnowpack. In East Antarctica, emissions of NOx and nitrate from the interior can be transported by katabaticwinds and redeposited along the coast [Savarino et al., 2007]. Redeposition at the QIC, however, may bemitigated by several factors: snow on the ice cap should be well ventilated by wind pumping and convectiondriven by diurnal heating; the ice cap is small, measuring only about 3 to 14 km wide at its center (Figure S1);and the median hourly wind speed measured at the summit is 14.5 kmhr�1 (25th to 75th percentile is 9.8 to19.9 kmhr�1) (D. Hardy, personal communication, 2013). Taken together, it seems likely that NOx and nitrateflushed from the snow would be rapidly removed from the site. If it is assumed that nitrate was in fact beingredeposited and had an oxygen isotopic signature set locally by oxidation in the gas phase (see also section 5.6.1),a decrease in the δ18O and Δ17O of NO3
� in the snow would probably still be observed given that rates of NO2
loss from the QLL are thought to be comparable to oxidation back to NO3�within the condensed phase [Jacobi
and Hilker, 2007]. Following from this, Δ17O (or δ18O) should still have a negative relationship with δ15N foranything less than 100% redeposition (in which case δ15N would not change).
5.2. Evaporation
In addition to photolysis, evaporation of HNO3 has been proposed as a postdepositional loss pathway fornitrate [Dibb et al., 1998; Mulvaney et al., 1998; Röthlisberger et al., 2000; Erbland et al., 2013]. Evaporation
Journal of Geophysical Research: Atmospheres 10.1002/2013JD020715
BUFFEN ET AL. ©2014. American Geophysical Union. All Rights Reserved. 2685

must be considered at the QIC given that the solubility of HNO3 in ice is low and its expulsion to grainsurfaces is promoted by increasing temperature [Thibert and Dominé, 1998]. The extent and isotopiceffects of this process in snow, however, are poorly understood. Sato et al. [2008] found no detectableevaporative loss from the surfaces of frozen 100 μM NaNO3 solutions acidified to a pH of 4 at �6°C overthe course of several days. Since evaporation proceeds only as HNO3, this was attributed to the highdissociation constant for HNO3 as weaker acids were readily lost, and it was suggested that evaporationwould be further inhibited under alkaline conditions. Negligible loss of nitrate in snow has also beenobserved in field and laboratory sublimation experiments ranging from a few days to 1month in duration[Cragin and McGilvary, 1995; Ginot et al., 2001]. In the field experiment of Ginot et al. [2001], nitrate behavedconservatively when in the presence of base cations (Ca2+, Mg2+, Na+, and K+), while losses were severewhen associated with H+.
The isotopic effects of evaporation also remain an open question. Based on theoretical calculations thatassumed fractionation to be determined by the protonation of the NO3
� isotopologues in the aqueous phaseto form HNO3 (as opposed to the equilibria of the liquid-vapor transfer), Frey et al. [2009] estimated HNO3
evaporative enrichment factors of ε15N = 14.2‰ and ε18O = 0.8‰ at �33°C, with little change at lowertemperatures. However, in a sublimation experiment conducted by Erbland et al. [2013] at Dome C, an ε15N of0.9 ± 1.5‰ was derived from observations at �30°C. This value decreased to �0.3 ± 1.2 and �3.6 ± 1.1‰ at�20 and �10°C, respectively. No data regarding changes in δ18O or Δ17O were reported.
Following from the discussion of photolysis above, the relationships between δ15N and δ18O in Sections II andIII are similarly unexplained by the evaporative ε values calculated by Frey et al. [2009] as are the relationshipswith relative changes in [NO3
�], especially during the dry season. As discussed in section 5.1.2., assessing thedata by comparison with ln[NO3
�] is complicated by seasonal changes in surface concentration.
These conclusions should be taken with a degree of caution, however, given that our current understanding ofevaporative fractionation remains low—the discrepancies in ε15N between Frey et al. [2009] and Erbland et al. [2013]have yet to be reconciled, and no observational estimates of ε18O are available. Despite the uncertainty, we still notethat evaporative fractionation would be mass-dependent and thus cannot explain the observed changes in Δ17O.
5.3. Englacial Microbial Activity
Englacial microbial processes—e.g., nitrification and/or denitrification—have been invoked to explain anomalousN2O concentrations in both polar and tropical ice cores [Campen et al., 2003; Miteva et al., 2007]. Nitrification anddenitrification have not been directly assessed at the QIC, but we consider their effects in the context of our datagiven that nitrate can be produced or consumed by such activity.
Denitrification should be inhibited by oxic conditions in snow and firn, but its presence should still be resolvablesince δ18O systematically varies with δ15N as a result of the ~1:2 ratio of the respective enrichment factors[Lehmann et al., 2003; Kendall et al., 2007]. This ratio predicts that increases in δ18O relative to δ15N in the residualnitrate will approximate a line with a slope of ~0.5 and which is invariant to changes in the initial [NO3
�]. Incontrast, regression slopes for δ18O versus δ15N in Sections II and III are 2.3 and 4.0, respectively (Figures 5d and5g). Furthermore, denitrification is a mass-dependent process and would leave Δ17O unchanged.
Unlike denitrification, nitrification produces NO3� (NO3
�nitrif ) with nitrogen and oxygen derived from different
sources. Nitrogen originates from ammonium (NH4+) but is subject to fractionation during conversion. Culture
studies suggest that the δ15N of NO3�nitrif (δ
15Nnitrif ) should be offset by at least�14 to�38‰ relative to that ofNH4
+ [Kendall et al., 2007, and references therein]. If the initial NH4+ pool is finite, however, the δ15N of the
accumulating NO3�nitrif will approach that of NH4
+ as the reactant is consumed.
Oxygen in NO3�nitrif is typically interpreted as a mixture of one atom from ambient atmospheric O2 (δ
18Oatm)and two from the surrounding water:
δ18Onitrif ¼ 1=3ð Þ� δ18Oatm þ 2=3ð Þ� δ18Owater; (7)
where δ18Oatm is 23.88‰ [Barkan and Luz, 2005] and δ18Owater can be approximated as that of QIC snow(melting is effectively nonfractionating), which varies from roughly �28 to �10‰ between wet and dryseasons, respectively. Δ17Onitrif will equal that of O2 and H2O, which are ~0‰.
Journal of Geophysical Research: Atmospheres 10.1002/2013JD020715
BUFFEN ET AL. ©2014. American Geophysical Union. All Rights Reserved. 2686

Estimates for δ18Onitrif are thus between �11 and 1‰ depending on the seasonal snow composition. Thesevalues are far lower than observed δ18O in the dry season (i.e., high [NO3
�] samples with δ18O up to ~55‰),but this does not rule out the possibility that lower δ18O during wet seasons is due to nitrification havingdiluted a dry season input via mixing. This nominally fits with the Δ17O versus δ18O regression for Section IIsince the x intercept of �6‰ could be interpreted as the δ18Onitrif end-member (since Δ17Onitrif is 0‰,corresponding to O2 and H2O; Figure 6c) and is within the estimated range. If a δ18O of 55‰ is taken as thedry season atmospheric end-member (Figure 5e and section 5.6), then δ18O as low as 24‰ in Section IIrequires as much as 51% of the NO3
� to be derived from in situ nitrification. This should also affect δ15N suchthat, for a dry season end-member composition of 0‰ (Figure 5f) and the same 51% contribution fromnitrification, a δ15Nnitrif of �25‰ is needed to produce low δ15N values of �13‰ (i.e., corresponding toδ18O= 24‰ via Figure 5d). Future measurements of the δ15N of NH4
+ are needed to evaluate whether such aδ15N for NO3
�nitrif is realistic.
Amoroso et al. [2010] presented evidence for nitrification in Arctic snow based in part on very high NO2�
concentrations (1 to 10μM) that were preserved by alkaline conditions in the snow. Identifying nitrificationbased on the presence of NO2
� is complicated since the conversion of NO2� to NO3
� is often not rate-limiting, but NO2
� can accumulate when oxidation to NO3� is inhibited by high pH [Shen et al., 2003] or NO2
�
consumption is otherwise decoupled from its production [Ward, 1996]. As noted above, [NO2�] was not
detected in QND30 or the snowpit. Major ion concentrations measured in two other cores drilled from thenorth and summit domes in 2003 suggest that QND30 is likely alkaline throughout and that [NH4
+] generallyexceeds [NO3
�], especially during the wet season (section 5.4). Thus, it is possible that NO2� would be
present in our samples if nitrification had been active.
Sections II and III are characterized by similar Δ17O versus δ18O regressions—resulting in δ18Onitrif estimatesof �6 and �2‰, respectively—though no samples with δ18O below 32‰ in Section III were analyzed forΔ17O due to insufficient volume (Figures 6c and 6d). The two δ18O versus δ15N regressions are also similarwhen excluding the data from the low-[NO3
�] intervals in Section III, which are also marked by very lowδ18O (24.5–26.0 and 28.8–30m; Figures 5d and 5g). To explain such low δ18O values (approaching 2‰) inSection III would require an 87% contribution from nitrification using the same assumed values above, yetthe range in δ15N is very similar for the two sections. As such, it is unlikely that the compositions of theseintervals can be explained by a higher proportion of nitrate derived from in situ nitrification.
5.4. Possible Factors Mitigating Loss
We address the possibility that alteration has influenced the upper core and snowpit in section 5.5, butfollowing from the discussion above, there appears to have been limited photolytic or evaporative alterationof QND30 below ~12m. This conclusion seems surprising and especially so during the dry season when theresidence time of nitrate at the surface would be relatively long.
The intensity of photolysis is directly related to light penetration in the snowpack. Typical e-folding depths—the depth at which the actinic flux has been attenuated by a factor of 1/e (~0.37)—for wavelengths at whichnitrate photolyzes range between 5 and 25 cm but vary with solar zenith angle, snow density, grain size andshape, and impurity content (e.g., mineral dust, black carbon, and humic-like substances) [Grannas et al.,2007; France et al., 2011; Zatko et al., 2013]. Concentrations of insoluble dust, pollen, charcoal, and other organics(including vegetation and insect fragments) in QIC snow can exceed those at polar sites by several orders ofmagnitude, especially during the dry season [Thompson et al., 1979; Thompson and Mosley-Thompson, 1982;Reese and Liu, 2002; Kehrwald et al., 2008]. One possibility then is that the effects of strong insolation and lowsolar zenith angles at the QIC have been offset to a degree by the significant impurity content in the snowpack,though this remains to be confirmed by in situ measurements of light penetration.
The extent of photolytic and evaporative loss is also influenced by snow chemistry. Several studies haveproposed that nitrate in alkaline snow is likely to be less labile or even inert [Thibert and Dominé, 1998; Legrandet al., 1999; Ginot et al., 2001; Röthlisberger et al., 2000, 2002; Beine et al., 2002, 2003, 2006; Amoroso et al., 2006;Abida and Osthoff, 2011]. Under such conditions, stable salts (e.g., Ca(NO3)2, Mg(NO3)2, or NaNO3) may act tosequester NO3
� in particulates or provide counter cations which stabilize NO3� in the liquid phase and inhibit
evaporation as HNO3. Additionally, nitrate is more vulnerable to loss when present on grain surfaces, but
Journal of Geophysical Research: Atmospheres 10.1002/2013JD020715
BUFFEN ET AL. ©2014. American Geophysical Union. All Rights Reserved. 2687
diffusivity in ice has only been measured for HNO3 and may be orders of magnitude slower if associated withheavy cations [Thibert and Dominé, 1998], while the presence of NH4
+ can promote incorporation of NO3� into
the ice lattice [Gross and Svec, 1997; Eichler et al., 2001].
Major ion concentrations other than nitrate were not measured in QND30 but have been analyzed in twoother cores drilled by the BPRC at the north and summit domes in 2003 (data not shown). Negative ionbalances ([F�+Cl�+NO3
�+ 2(SO42�)]� [2(Ca2+) + K+ +Na+ +NH4
+ + 2(Mg2+)] in μeq L�1) throughout thetop 30m of these cores indicate alkaline conditions. Of the cations measured, Na+ and NH4
+ are the mostabundant with Na+/NO3
� and NH4+/NO3
� molar ratios consistently above 1. Na+/NO3� is generally higher
during dry seasons, while NH4+/NO3
� is greater during wet seasons. Molar ratios relative to NO3� for all other
cations are typically below 1 in both seasons. Given the close proximity of the three cores and the flat surfacetopography of the ice cap (Figure S1), these conditions should be representative of QND30 and imply thelikelihood of nitrate being present as a stable salt.
5.5. Recent Melting
The 2011 snowpit and Section I are clearly distinct from the lower core in several ways whichmake it difficult toevaluate alteration in a manner similar to that for Sections II and III: there are no straightforward relationshipsbetween δ15N and δ18O or Δ17O in Section I and the snowpit; the isotope parameters do not appear to relate to[NO3
�]; δ15N and δ18O are higher on average compared to Sections II and III, especially in terms of wet seasonvalues; isotopic seasonality is not readily apparent; and [NO3
�] is lower on average while seasonal cycles,although present, are muted.
Such differences are not conclusive evidence for alteration, but taken together they do reflect a differentregime, whether it be predepositional or postdepositional, under which the more recent record has formed.(Section I covers the period ~1997 to 2003 based on counting of the seasonal [NO3
�] peaks. The snowpitrepresents 1 year of snowfall.) Postdepositional changes are especially worth considering given the currentanomalous climate regime at the QIC. Recent retreat of the ice cap due to warming has been dramatic andnonlinear [Thompson et al., 2006; Bradley et al., 2009], and 14C dating of relict vegetation exposed at themargins since circa 2002 confirms that the QIC is smaller now than it has been in over 6000 years [Thompsonet al., 2006, 2013; Buffen et al., 2009].
Recent warming has increased surface melt even at the summit and especially during the wet season whenhigher humidity and temperature promote ablation by melting over sublimation [Thompson et al., 2006].Meltwater percolating along grain boundaries can leach major ions resulting in lower concentrations andsmoothed seasonality [Davies et al., 1982; Eichler et al., 2001; Ginot et al., 2010]. Nitrate is vulnerable to elution,but such studies show varying degrees of removal since leaching rates are influenced by factors such as ioninteractions [Eichler et al., 2001].
Leaching and consequent mixing of nitrate is consistent with lower [NO3�] and smoothed profiles in Section I
and the snowpit, as well as the lack of relationships between [NO3�] and the isotope values. The preservation
of seasonal [NO3�] cycles below 12m along with the absence of obvious melt features such as elongated
vertical cavities or bubble-free ice [e.g., Thompson et al., 2009] suggests that the lower sections have notreceived percolation from above. Leaching alone, however, cannot explain δ15N and δ18O values in Section Iand the snowpit that are above the ranges found in the lower core or the lack of correspondence betweenδ15N, δ18O, and Δ17O as observed in Sections II and III if we consider that the isotopic compositions mightotherwise be similar—which would explain why some samples from Sections I and III appear to fall along theδ18O versus δ15N regression for Section II (Figures 5a, 5d, and 5g). For example, if discrete samples from Section IIwere to be mixed, the resulting values would still place along the original δ18O versus δ15N regression inFigure 5d due to mass balance.
This suggests that if alteration of Section I and the snowpit has occurred, it must have been isotopicallyfractionating. As described in section 5.2, nitrate may be less prone to loss under alkaline conditions. Leaching,however, would likely raise the potential for loss via photolysis and/or evaporation since nitrate would beincreasingly present in liquid and also undergo separation from other ions given the varied elution rates [Eichleret al., 2001]. Furthermore, H+ has also been shown to be mobile and may accompany NO3
� and SO42� [Davies
et al., 1982]. This would be consistent with snowpit pH measurements, which varied from ~7–8 in dry season
Journal of Geophysical Research: Atmospheres 10.1002/2013JD020715
BUFFEN ET AL. ©2014. American Geophysical Union. All Rights Reserved. 2688
samples at the top of the profile to ~5 in wet season snow. Samples near the surface, however, should notnecessarily be taken to represent pristine deposition given that they were exposed during the 2011 dry seasonprior to collection. Ultimately, concurrent collections of atmospheric samples, fresh and aged surface snow, andsnowpit samples are needed to address whether or not alteration is presently occurring.
The two intervals of very low [NO3�] in Section III (24.5 to 26.0m and 28.8 to 30m; Figure 2) are unusual
compared to the rest of the record, and we question whether meltwater and leaching could explain these lowconcentrations. Percolation from directly above would seem unlikely given that the intervals in Section III areclearly defined and abruptly bounded by sections with seasonality in both isotopic composition and [NO3
�].Lateral transport, however, is possible along impermeable boundaries such as those within the transitionfrom firn to ice [Eichler et al., 2001]. These low-[NO3
�] intervals are located within the firn-ice transition, andmeltwater at similar depths was observed pooling in the borehole during drilling of the 2003 summitdome core.
The isotopic composition of these intervals, however, is very different compared to Section I and thesnowpit. There are no δ15N or δ18O values higher than those found in Section II, and while δ15N iswithin a similar range, δ18O values below the minimum found in Section II (23.6‰) are observedand extend to as low as 2.3‰ (Figures 5d and 5g). Additionally, δ15N and δ18O exhibit consistentnonlinear relationships with [NO3
�] (Figure 5). If the character of the upper core and snowpit werethe result of elution having facilitated fractionation by photolysis or evaporation, these processeswould be unable to affect sections far below the surface. The presence of very low δ18O in Section IIImay thus reflect mixing with an isotopically depleted source of oxygen, but the nature of such apool and process responsible is unclear.
5.6. Mixing of Atmospheric Nitrate
While it is possible that the snowpit and portions of QND30 have been affected by melting, it does not appearthat photolysis or evaporation has significantly influenced the QND30 record below 12m given our currentunderstanding of these processes. This would then argue that either (a) our current estimates for photolytic andevaporative enrichment factors are incorrect; (b) additional photolysis pathways or other mechanisms ofpostdepositional alteration must be invoked but, if fractionating, must still be negligible during the dry seasonfor Sections II and III; or (c) the isotopic composition of the nitrate input is variable and the relationshipsbetween δ15N, δ18O, and Δ17O are determined prior to deposition (i.e., at the NOx source or in the atmosphere).
Both fractionation and mixing of two sources with discrete isotopic compositions can produce similar butfundamentally different nonlinear relationships between [NO3
�] and δ15N or δ18O [Mariotti et al., 1988;Kendall et al., 2007]. Rayleigh fractionation proceeds such that linearity exists between δ and ln[NO3
�] for afixed initial concentration. Mixing, on the other hand, is governed by mass balance and results in linearrelationships when δ is plotted against [NO3
�]�1. Plots of δ versus δ will also be linear and describe mixinglines that fall between the compositions of the two end-members. Such relationships between Δ17O andδ18O in nitrate have been interpreted in this context since Δ17O is not directly altered by mass-dependentfractionation but will vary in proportion to mixing of different oxygen sources [Michalski et al., 2003, 2004a,2004b, 2005; Kendall et al., 2007; Morin et al., 2008].
The linear relationships between the isotopic parameters and with [NO3�]�1 in Sections II and III would fit with
mixing of two sources that vary seasonally (Figures 7 and S3). The approximate end-member composition of thenitrate input during the dry season would appear to be δ15N=0‰, δ18O=55‰, and Δ17O=20‰ for bothsections. Indeed, this end-member composition remains constant even with increasing [NO3
�] (Figures 5e, 5f,S2, and S3). The wet season component for Section II would be δ15N=�13‰, δ18O=24‰, andΔ17O=10‰ orless. In contrast to the dry season end-member, the isotope values at low [NO3
�] do not converge on a singlecomposition and the quantification of this end-member should therefore be taken as amaximumestimate. Wetseason values from the low-[NO3
�] intervals in Section III extend to δ15N=�13‰ and δ18O=2‰, while thosein the remainder of the section extend to δ15N=�8‰ and δ18O=31‰. Section III Δ17O is as low as 12‰ andseems to follow along a Δ17O versus δ18O regression similar to that for Section II (Figures 6c and 6d), but wenote again that no samples with δ18O lower than that observed in Section II were measured. Given the strongrelationships between the two parameters, it seems reasonable that lowerΔ17Owould also correspond to these
Journal of Geophysical Research: Atmospheres 10.1002/2013JD020715
BUFFEN ET AL. ©2014. American Geophysical Union. All Rights Reserved. 2689
samples. To simplify an interpretation of these compositions, we address δ18O andΔ17O separately from δ15N inthe discussion below.5.6.1. δ18O and Δ17OAtmospheric nitrate can be formed via several different chemical pathways. Production is initiated by oxidationof NO to NO2 by either O3 (R3) or peroxy radicals (HO2 or RO2) formed by reaction of a hydrogen atom or anorganic radical (R) with O2 ((R4) and (R5)).
NOþ O3 → NO2 þ O2 (R3)
H or Rþ O2 þM→ HO2 or RO2 þM (R4)
NOþ HO2 or RO2 →NO2 þ OH or RO: (R5)
In the presence of sunlight, the primary HNO3 formation pathway is reaction of NO2 with OH and an unreactivethird body (M) such as N2 (R6):
NO2 þ OHþM→ HNO3 þM: (R6)
Production of HNO3 also occurs via hydrolysis of dinitrogen pentoxide (N2O5) on an aerosol surface ((R7), (R8), and(R9)) or hydrogen abstraction by the nitrate radical (NO3) from a hydrocarbon (HC) or dimethyl sulfide (DMS) (R10).
NO2 þ O3 →NO3 þ O2 (R7)
NO2 þ NO3 þM→N2O5 þM (R8)
N2O5 gð Þ þ H2O aqð Þ þ surface→ 2HNO3 aqð Þ (R9)
NO3 þ HC or DMS→ HNO3 þ products: (R10)
These pathways are restricted during the day due to photolysis of NO3 and N2O5 and are also more prevalentin cold environments since N2O5 is thermally unstable as well.
The Δ17O anomaly in atmospheric nitrate is derived from O3 via reactions (R3) and (R7). In polar regions,reactive bromine (BrO) can also impart a high Δ17O signature due to the role of O3 in BrO formation [Morinet al., 2012]. The Δ17O of O3 has been observed within the range 20 to 40‰ [Vicars et al., 2012, and referencestherein], while that of the other oxidants is close to 0‰ [Alexander et al., 2009; Morin et al., 2011, andreferences therein]. The δ18O of O3 is also large, and measurements vary between 95 and 130‰ [Michalskiet al., 2011, and references therein].
Nitrate with nonzero Δ17O is thus considered atmospheric in origin, with Δ17O and δ18O varying as a functionof the fractional contribution of the reaction pathways above. Previous observations for δ18O and Δ17O rangefrom roughly 25 to 115‰ and 10 to 45‰, respectively, and tend to vary with season and latitude [Alexanderet al., 2009; Michalski et al., 2011, and references therein].
With regard to the tropics, nitrate production should be dominated by the reaction of NO2 with OH (R6)following from the high temperatures, humidities, and insolation in these regions. This is in accord with theestimates of Alexander et al. [2009] from the GEOS-Chem global atmospheric chemistry model which predictthat up to ~87% of atmospheric nitrate is formed by this pathway at low latitudes. In the same study, meanannualΔ17O values as low as 7‰ are calculated at the surface over tropical forests due to increased NOx cyclingby peroxy radicals ((R4) and (R5)).
For the gridbox occupied by the QIC, the GEOS-Chem model estimates 3month averages for Δ17O inatmospheric nitrate of 20.6‰ (June-July-August); 21.0‰ (September-October-November); 11.5‰ (December-January-February), and 12.3‰ (March-April-May), with an annual mean of 19.2‰ (B. Alexander, personalcommunication, 2012). These predictions agree well with dry seasonΔ17O (~20‰) in all sections of QND30 andwith wet season values in Section II (~10‰) (Table 2 and Figure 6). In comparison with existing observationsfrom the tropics, the Δ17O of nitrate in fog water from the Podocarpus National Forest, Ecuador, was measuredbetween 13 and 22‰ [Brothers et al., 2008]. Bulk aerosols collected in the eastern tropical Atlantic boundarylayer were observed to be within 22 to 30‰ [Morin et al., 2009; Alexander et al., 2009 and supportinginformation therein]. The Δ17O of nitrate salts in the Atacama Desert, Chile, range between 14 and 21‰, butthese deposits have accumulated over several million years and are thus not directly comparable.
Journal of Geophysical Research: Atmospheres 10.1002/2013JD020715
BUFFEN ET AL. ©2014. American Geophysical Union. All Rights Reserved. 2690
The seasonal Δ17O variability in QND30 can be explained within the context of regional atmospheric circulationpatterns (Figure 1 and section 2). During the wet season, transport to the QIC is dominated by the entrainment oflow-level air from the Amazon Basin onto the Altiplano by upper level easterly winds. This would be consistent
with an increase in the relative contribution of peroxy radicals in the cycling of NOx ((R3) and (R4)) and OH in the
production of HNO3 (R6). The reversal of wind direction aloft during the dry season results in westerly to northerlytransport of midlevel air masses with colder and drier origins. These conditions would favor oxidation of NO by
O3 (R3) and nitrate formation via N2O5 hydrolysis ((R7), (R8), and (R9)), both resulting in higher Δ17O. Themovement of low-level air onto the Altiplano during this season is restricted by coastal topography andatmospheric stability over the eastern Pacific due to coastal upwelling and descending Walker Circulation.
The Δ17O of QND30 nitrate thus confirms an atmospheric origin. Seasonal variations are consistent with modelpredictions and regional circulation patterns, and atmospheric oxidation chemistry therefore provides analternative explanation to mixing with an in situ nitrification source. The GEOS-Chemmodel does not calculateδ18O explicitly, but most values in the core and snowpit fall within the range of previous atmospheric nitrateobservations, which vary from 25 to 115‰ [Michalski et al., 2011]. The exception to this would be δ18O valuesapproaching 2‰ in the low-[NO3
�] intervals of Section III, which remain unexplained.5.6.2. δ15NUnlike oxygen, the nitrogen atom can be conserved during the conversion of NOx to nitrate. This has led to aninterpretation of δ15N as indicative of the precursor NOx source. However, δ
15Nmay be influenced by fractionationduring the cycling of NOx, the conversion of NO2 to nitrate, transport, or the formation of particulates.
Early work by Begun and Melton [1956] suggested that equilibrium fractionation during NOx cycling leads to a28‰ increase in the δ15N of NO2 relative to NO at 25°C. At low NOx concentrations, there should be completeconversion such that the δ15N of NO2 would equal that of mean NOx. Freyer et al. [1993], however, suggestedthat in environments where NOx concentrations are high and exceed those of oxidants, incompleteconversion leads to a higher δ15N in NO2 that is then carried over to nitrate. This explanation was given toaccount for seasonal offsets between the δ15N of gaseous HNO3 and particulate nitrate at a polluted urbansite in Jülich, Germany.
Unlike polluted environments, low NOx concentrations are expected at the QIC given the remote location, butelevated NOx (and O3) mixing ratios occur in biomass burning plumes over the Amazon [Andreae et al., 1988].Burning is more prevalent during the dry season (when higher δ15N is observed) and peaks in September andOctober, i.e., at the end of the dry season, but varies year to year [Potter et al., 2002; van der Werf et al., 2004].Given the general consistency in δ15N between, and within, dry seasons, we do not believe that incompleteconversion to NO2 can explain our results.
Based on theoretical calculations, Freyer [1991] proposed that the δ15N of nitrate produced by reaction (R6)should be offset by roughly�3‰ compared to NO2. This has been disputed byMorin et al. [2009], and giventhe lack of observational support, the potential fractionation is generally assumed to be negligible.
The possibility of isotope effects during atmospheric transport represents a longstanding question thatremains unresolved. In the study by Freyer [1991], the δ15N of particulate nitrate exceeded that in rainwaterby ~9‰ throughout the year at Jülich. This was interpreted as a rainout effect such that wet depositionduring transport led to progressive isotopic enrichment in the remaining nitrate. As noted by Morin et al.[2009], this reasoning has been invoked by a number of studies to rule out transport effects in explaining lowδ15N values observed in remote regions. The conclusions of Freyer [1991], however, conflict with observationsfrom the eastern tropical Atlantic of higher δ15N in rainwater compared to dry deposition [Baker et al., 2007;Morin et al., 2009].
In QND30, higher δ15N during the dry season is unlikely to be the result of washout since precipitation is solimited and the observed values so consistent. Lower and more variable δ15N during the wet season conflictswith the predictions of Freyer [1991] that wet deposition leads to progressive enrichment, but the wet seasonδ15N would be consistent with washout should the observations of Baker et al. [2007] prove representativeof precipitation effects. However, only two rainwater samples were collected in this study, compared tonumerous measurements made by Freyer [1991] across several years, and changes in the δ15N of rain of up to8.8‰ have been observed over the course of single precipitation events [Buda and DeWalle, 2009].
Journal of Geophysical Research: Atmospheres 10.1002/2013JD020715
BUFFEN ET AL. ©2014. American Geophysical Union. All Rights Reserved. 2691
Changes in δ18O due to transport are less understood but if affected similarly to δ15N, the linear δ18O versusδ15N relationships in Sections II and III could, hypothetically, be attributed to transport effects assuming that theinitial isotopic composition is that of dry season nitrate (i.e., δ15N≈ 0‰, δ18O≈ 55‰). Buda and DeWalle [2009],however, found no correspondence between δ18O and δ15N in nitrate collected during and betweenprecipitation events.
Mass-dependent fractionation during transport would not influence Δ17O, but both δ18O and Δ17O havebeen shown to vary between different sizes of aerosol nitrate, with higher values in coarser particles [Patriset al., 2007; Morin et al., 2009]. These results were attributed to nitrate formation by different oxidationpathways. Morin et al. [2009] found no difference in δ15N between size fractions collected over thesoutheastern tropical Atlantic, suggesting that δ15N was not affected by aerosol formation, and concludedthat δ15N in the remote low latitudes may thus reflect NOx sources.
The δ15N signatures of NOx sources have been constrained to varying degrees and represent a critical subjectof ongoing research. Lightning NOx is thought to be close to 0‰ based on laboratory experiments [Hoering,1957]. NOx produced by microbial processes in fertilized soils was found to be strongly negative (�48.9 to�19.9‰) [Li and Wang, 2008], in accord with predictions [Freyer, 1978]. NOx formed by the oxidation of N2Oin the stratosphere has been estimated to be close to 19‰ [Savarino et al., 2007]. The δ15N of NOx producedby fossil fuel combustion has been observed and suggested to be both positive and negative [see Hastingset al., 2009; Felix et al., 2012, and references therein]. No direct measurements exist for biomass burningdespite the recognized importance of this source. As with fossil fuel combustion, the δ15N of the producedNOx is likely to vary with temperature and the composition of the initial material. The high δ15N of nitrate inpreindustrial ice from Greenland may indicate a positive composition [Hastings et al., 2005, 2009], butnegative values have also been indirectly suggested based on laboratory burning experiments [Turekianet al., 1998].
With regard to the contribution of nitrate sources to the QIC, fossil fuel combustion is likely negligible giventhe remote and sparsely populated air mass source regions [Levy et al., 1999; Jaeglé et al., 2005]. The dryseason δ15N of ~0‰ in Sections II and III compares well with that expected from lightning, which is estimatedto be the dominant source of NOx in the tropical midtroposphere and upper troposphere [Levy et al., 1996,1999]. The higher-altitude nature of this source would also be consistent with the higher δ18O and Δ17Ocompositions reflecting increases in NOx cycling by O3 and nitrate formation via N2O5 hydrolysis (section 5.6.1).Nitrate salts in the Atacama Desert of Chile, which have δ15N (and δ18O) compositions similar to that ofQND30 dry season nitrate, have also been attributed to lightning [Michalski et al., 2004a], but transport ofthese salts to the QIC is not consistent with the prevailing regional winds and influence of topography(Figure 1 and section 2). Given our current understanding of microbially produced NOx, the lower δ15Nobserved during wet seasons may reflect a biogenic source in the Amazon Basin. Based on modeling, suchemissions are suggested to represent the largest contribution to NOx in the lower troposphere over theregion during this time of the year [Levy et al., 1999].
6. Conclusions
A low-latitude, high-elevation ice core from the Quelccaya Ice Cap in southeastern Peru provides the firstrecord of the isotopic composition of atmospheric nitrate as preserved in tropical ice. This marks an initialstep in developing tropical ice cores as continuous and long-term archives of nitrate–δ15N, –δ18O, and –Δ17Ofor a region of the planet where no other such histories are currently available. Given the susceptibility ofnitrate to postdepositional loss and isotopic fractionation, we have assessed the influence of photolysis andHNO3 evaporation and, based on our current understanding of these processes, find no evidence for suchalteration below ~12m depth. This preservationmay have been promoted by a high snow accumulation rate,alkalinity in the snow, and the effect of high impurity concentrations on light penetration. The nitrate profilesof the upper ~12m and a snowpit from 2011, however, may reflect alteration facilitated by recent melting atthe surface. Limited intervals marked by very low [NO3
�] near the bottom (~30m) of the core may have alsobeen affected by meltwater. In the unaltered sections, clear seasonal cycles in isotopic composition and[NO3
�] exist, with dry seasons marked by high δ15N, δ18O, Δ17O, and [NO3�], while low values are observed
during wet seasons. Rainout effects during transport and in situ production by nitrification cannot be ruled
Journal of Geophysical Research: Atmospheres 10.1002/2013JD020715
BUFFEN ET AL. ©2014. American Geophysical Union. All Rights Reserved. 2692

out at this time, but our results are consistent with mixing of atmospheric nitrate derived from discreteand seasonally dependent NOx sources and oxidation pathways. Future work should include concurrentatmospheric, surface snow, and snowpit sampling, but our findings suggest that higher, colder, and dustierlow-latitude glaciers in the Andes and Himalayas would likely be suitable for future isotopic studies of nitratein ice.
ReferencesAbida, O., and H. D. Osthoff (2011), On the pH dependence of photo-induced volatilization of nitrogen oxides from frozen solutions con-
taining nitrate, Geophys. Res. Lett., 38, L16808, doi:10.1029/2011GL048517.Alexander, B., J. Savarino, K. J. Kreutz, and M. H. Thiemens (2004), Impact of preindustrial biomass-burning emissions on the oxidation
pathways of tropospheric sulfur and nitrogen, J. Geophys. Res., 109, D08303, doi:10.1029/2003JD004218.Alexander, B., M. G. Hastings, D. J. Allman, J. Dachs, J. A. Thornton, and S. A. Kunasek (2009), Quantifying atmospheric nitrate formation
pathways based on a global model of the oxygen isotopic composition (Δ17O) of atmospheric nitrate, Atmos. Chem. Phys., 9(14),
5043–5056, doi:10.5194/acp-9-5043-2009.Amoroso, A., H. J. Beine, R. Sparapani, M. Nardino, and I. Allegrini (2006), Observation of coinciding arctic boundary layer ozone depletion
and snow surface emissions of nitrous acid, Atmos. Environ., 40(11), 1949–1956, doi:10.1016/j.atmosenv.2005.11.027.Amoroso, A., et al. (2010), Microorganisms in dry polar snow are involved in the exchanges of reactive nitrogen species with the atmosphere,
Environ. Sci. Technol., 44(2), 714–719, doi:10.1021/es9027309.Andreae, M. O., et al. (1988), Biomass-burning emissions and associated haze layers over Amazonia, J. Geophys. Res., 93(D2), 1509–1527,
doi:10.1029/JD093id02p01509.Anenberg, S. C., et al. (2009), Intercontinental impacts of ozone pollution on human mortality, Environ. Sci. Technol., 43(17), 6482–6487,
doi:10.1021/es900518z.Baker, A. R., K. Weston, S. D. Kelly, M. Voss, P. Streu, and J. N. Cape (2007), Dry and wet deposition of nutrients from the tropical Atlantic
atmosphere: Links to primary productivity and nitrogen fixation, Deep Sea Res., Part I, 54(10), 1704–1720, doi:10.1016/j.dsr.2007.07.001.Barkan, E., and B. Luz (2005), High precision measurements of
17O/
16O and
18O/
16O ratios in H2O, Rapid Commun. Mass Spectrom., 19(24),
3737–3742, doi:10.1002/rcm.2250.Begun, G. M., and C. E. Melton (1956), Nitrogen isotopic fractionation between NO and NO2 and mass discrimination in mass analysis of NO2,
J. Chem. Phys., 25(6), 1292–1293, doi:10.1063/1.1743215.Beine, H. J., F. Dominé, W. Simpson, R. E. Honrath, R. Sparapani, X. Zhou, and M. King (2002), Snow-pile and chamber experiments during the
Polar Sunrise Experiment ‘Alert 2000’: Exploration of nitrogen chemistry, Atmos. Environ., 36(15-16), 2707–2719, doi:10.1016/s1352-2310(02)00120-6.
Beine, H. J., F. Dominé, A. Ianniello, M. Nardino, I. Allegrini, K. Teinilä, and R. Hillamo (2003), Fluxes of nitrates between snow surfaces and theatmosphere in the European high Arctic, Atmos. Chem. Phys., 3(2), 335–346, doi:10.5194/acp-3-335-2003.
Beine, H. J., A. Amoroso, F. Dominé, M. D. King, M. Nardino, A. Ianniello, and J. L. France (2006), Surprisingly small HONO emissions from snowsurfaces at Browning Pass, Antarctica, Atmos. Chem. Phys., 6(9), 2569–2580, doi:10.5194/acp-6-2569-2006.
Blunier, T., G. L. Floch, H.-W. Jacobi, and E. Quansah (2005), Isotopic view on nitrate loss in Antarctic surface snow, Geophys. Res. Lett., 32,L13501, doi:10.1029/2005GL023011.
Böhlke, J. K., S. J. Mroczkowski, and T. B. Coplen (2003), Oxygen isotopes in nitrate: New reference materials for18O:
17O:
16O measurements
and observations on nitrate-water equilibration, Rapid Commun. Mass Spectrom., 17(16), 1835–1846, doi:10.1002/rcm.1123.Bradley, R. S., F. T. Keimig, H. F. Diaz, and D. R. Hardy (2009), Recent changes in freezing level heights in the tropics with implications for the
deglacierization of high mountain regions, Geophys. Res. Lett., 36, L17701, doi:10.1029/2009GL037712.Brothers, L. A., G. Dominguez, P. Fabian, and M. H. Thiemens (2008), Using multi-isotope tracer methods to understand the sources of nitrate
in aerosols, fog and river water in Podocarpus National Forest, Ecuador, Eos Trans. AGU, 89(53), Fall Meet. Suppl., Abstract A11C-0136.Buda, A. R., and D. R. DeWalle (2009), Using atmospheric chemistry and storm track information to explain the variation of nitrate stable
isotopes in precipitation at a site in central Pennsylvania, USA, Atmos. Environ., 43(29), 4453–4464, doi:10.1016/j.atmosenv.2009.06.027.Buffen, A. M., L. G. Thompson, E. Mosley-Thompson, and K. I. Huh (2009), Recently exposed vegetation reveals Holocene changes in the
extent of the Quelccaya Ice Cap, Peru, Quat. Res., 72(2), 157–163, doi:10.1016/j.yqres.2009.02.007.Bunton, C. A., E. A. Halevi, and D. R. Llewellyn (1952), Oxygen exchange between nitric acid and water. Part I, J. Chem. Soc., 4913–4916,
doi:10.1039/jr9520004913.Burkhart, J. F., M. Hutterli, R. C. Bales, and J. R. McConnell (2004), Seasonal accumulation timing and preservation of nitrate in firn at Summit,
Greenland, J. Geophys. Res., 109, D19302, doi:10.1029/2004JD004658.Burkhart, J. F., R. C. Bales, J. R. McConnell, and M. A. Hutterli (2006), Influence of North Atlantic Oscillation on anthropogenic transport
recorded in northwest Greenland ice cores, J. Geophys. Res., 111, D22309, doi:10.1029/2005JD006771.Burkhart, J. F., R. C. Bales, J. R. McConnell, M. A. Hutterli, and M. M. Frey (2009), Geographic variability of nitrate deposition and preservation
over the Greenland Ice Sheet, J. Geophys. Res., 114, D06301, doi:10.1029/2008JD010600.Campen, R. K., T. Sowers, and R. B. Alley (2003), Evidence of microbial consortia metabolizing within a low-latitude mountain glacier, Geology,
31(3), 231–234, doi:10.1130/0091-7613(2003)031<0231:eomcmw>2.0.co;2.Casciotti, K. L., D. M. Sigman, M. G. Hastings, J. K. Böhlke, and A. Hilkert (2002), Measurement of the oxygen isotopic composition of nitrate in
seawater and freshwater using the denitrifier method, Anal. Chem., 74(19), 4905–4912, doi:10.1021/ac020113w.Chu, L., and C. Anastasio (2003), Quantum yields of hydroxyl radical and nitrogen dioxide from the photolysis of nitrate on ice, J. Phys. Chem.
A, 107(45), 9594–9602, doi:10.1021/jp0349132.Cragin, J. H., and R. McGilvary (1995), Can inorganic chemical species volatilize from snow?, in Biogeochemistry of Seasonally Snow-Covered
Catchments, edited by K. A. Tonnessen, M. W. Williams, and M. Tranter, pp. 11–16, IAHS Press, Wallingford, U. K.Criss, R. E. (1999), Principles of Stable Isotope Distribution, Oxford Univ. Press, New York.Crutzen, P. J., and J. Lelieveld (2001), Human impacts on atmospheric chemistry, Ann. Rev. Earth Planet. Sci., 29(1), 17–45, doi:10.1146/
annurev.earth.29.1.17.Davies, T. D., C. E. Vincent, and P. Brimblecombe (1982), Preferential elution of strong acids from a Norwegian ice cap, Nature, 300(5888),
161–163, doi:10.1038/300161a0.
AcknowledgmentsThe authors wish to thank Mary Davisfor her assistance throughout this pro-ject, Doug Hardy for helpful meteorolo-gical data and discussion, and twoanonymous reviewers for theirthoughtful comments. Field assistanceand support were provided by FélixBenjamin Vicencio and VicencioExpeditions, the Explorers ClubExploration Fund, the AmericanPhilosophical Society Lewis and ClarkAward, and the Brown UniversityGraduate School. This is Byrd PolarResearch Center contribution C-1435.
Journal of Geophysical Research: Atmospheres 10.1002/2013JD020715
BUFFEN ET AL. ©2014. American Geophysical Union. All Rights Reserved. 2693
Delmas, R., D. Serça, and C. Jambert (1997), Global inventory of NOx sources, Nutr. Cycling Agroecosyst., 48(1), 51–60, doi:10.1023/a:1009793806086.
Dibb, J. E., and M. Fahnestock (2004), Snow accumulation, surface height change, and firn densification at Summit, Greenland: Insights from2 years of in situ observation, J. Geophys. Res., 109, D24113, doi:10.1029/2003JD004300.
Dibb, J. E., R. W. Talbot, J. W. Munger, D. J. Jacob, and S.-M. Fan (1998), Air-snow exchange of HNO3 and NOy at Summit, Greenland, J. Geophys.Res., 103(D3), 3475–3486, doi:10.1029/97JD03132.
Dibb, J. E., M. Arsenault, M. C. Peterson, and R. E. Honrath (2002), Fast nitrogen oxide photochemistry in Summit, Greenland snow, Atmos.Environ., 36(15-16), 2501–2511, doi:10.1016/s1352-2310(02)00130-9.
Dibb, J. E., S. I. Whitlow, and M. Arsenault (2007), Seasonal variations in the soluble ion content of snow at Summit. Greenland: Constraintsfrom three years of daily surface snow samples, Atmos. Environ., 41(24), 5007–5019, doi:10.1016/j.atmosenv.2006.12.010.
Dubey, M. K., R. Mohrschladt, N. M. Donahue, and J. G. Anderson (1997), Isotope specific kinetics of hydroxyl radical (OH) with water (H2O):Testing models of reactivity and atmospheric fractionation, J. Phys. Chem. A, 101(8), 1494–1500, doi:10.1021/jp962332p.
Dubowski, Y., A. J. Colussi, and M. R. Hoffmann (2001), Nitrogen dioxide release in the 302 nm band photolysis of spray-frozen aqueousnitrate solutions: Atmospheric implications, J. Phys. Chem. A, 105(20), 4928–4932, doi:10.1021/jp0042009.
Dubowski, Y., A. J. Colussi, C. Boxe, and M. R. Hoffmann (2002), Monotonic increase of nitrite yields in the photolysis of nitrate in ice and waterbetween 238 and 294 K, J. Phys. Chem. A, 106(30), 6967–6971, doi:10.1021/jp0142942.
Eichler, A., M. Schwikowski, and H. W. Gäggeler (2001), Meltwater-induced relocation of chemical species in Alpine firn, Tellus B, 53(2),192–203, doi:10.1034/j.1600-0889.2001.d01-15.x.
Elliott, E. M., C. Kendall, S. D. Wankel, D. A. Burns, E. W. Boyer, K. Harlin, D. J. Bain, and T. J. Butler (2007), Nitrogen isotopes as indicators of NOx
source contributions to atmospheric nitrate deposition across the midwestern and northeastern United States, Environ. Sci. Technol.,41(22), 7661–7667, doi:10.1021/es070898t.
Elliott, E. M., C. Kendall, E. W. Boyer, D. A. Burns, G. G. Lear, H. E. Golden, K. Harlin, A. Bytnerowicz, T. J. Butler, and R. Glatz (2009), Dual nitrateisotopes in dry deposition: Utility for partitioning NOx source contributions to landscape nitrogen deposition, J. Geophys. Res., 114,G04020, doi:10.1029/2008JG000889.
Elser, J. J., T. Andersen, J. S. Baron, A.-K. Bergström, M. Jansson, M. Kyle, K. R. Nydick, L. Steger, and D. O. Hessen (2009), Shifts inlake N:P stoichiometry and nutrient limitation driven by atmospheric nitrogen deposition, Science, 326(5954), 835–837, doi:10.1126/science.1176199.
Erbland, J., W. C. Vicars, J. Savarino, S. Morin, M. M. Frey, D. Frosini, E. Vince, and J. M. F. Martins (2013), Air-snow transfer of nitrate on the EastAntarctic Plateau—Part 1: Isotopic evidence for a photolytically driven dynamic equilibrium in summer, Atmos. Chem. Phys., 13(13),6403–6419, doi:10.5194/acp-13-6403-2013.
Fabian, P., R. Rollenbeck, N. Spichtinger, L. Brothers, G. Dominguez, and M. Thiemens (2009), Sahara dust, ocean spray, volcanoes, biomassburning: Pathways of nutrients into Andean rainforests, Adv. Geosci., 22, 85–94, doi:10.5194/adgeo-22-85-2009.
Felix, J. D., E. M. Elliott, and S. L. Shaw (2012), Nitrogen isotopic composition of coal-fired power plant NOx: Influence of emission controls andimplications for global emission inventories, Environ. Sci. Technol., 46(6), 3528–3535, doi:10.1021/es203355v.
France, J. L., M. D. King, M. M. Frey, J. Erbland, G. Picard, S. Preunkert, A. MacArthur, and J. Savarino (2011), Snow optical properties at Dome C(Concordia), Antarctica; implications for snow emissions and snow chemistry of reactive nitrogen, Atmos. Chem. Phys., 11(18), 9787–9801,doi:10.5194/acp-11-9787-2011.
Frey, M. M., J. Savarino, S. Morin, J. Erbland, and J. M. F. Martins (2009), Photolysis imprint in the nitrate stable isotope signal in snow andatmosphere of East Antarctica and implications for reactive nitrogen cycling, Atmos. Chem. Phys., 9(22), 8681–8696, doi:10.5194/acp-9-8681-2009.
Freyer, H. D. (1978), Preliminary15N studies on atmospheric nitrogenous trace gases, Pure Appl. Geophys., 116(2), 393–404, doi:10.1007/
bf01636894.Freyer, H. D. (1991), Seasonal variation of
15N/
14N ratios in atmospheric nitrate species, Tellus B, 43(1), 30–44, doi:10.1034/j.1600-0889.1991.00003.x.
Freyer, H. D., D. Kley, A. Volz-Thomas, and K. Kobel (1993), On the interaction of isotopic exchange processes with photochemical reactions inatmospheric oxides of nitrogen, J. Geophys. Res., 98(D8), 14,791–14,796, doi:10.1029/93JD00874.
Freyer, H. D., K. Kobel, R. J. Delmas, D. Kley, and M. R. Legrand (1996), First results of15N/
14N ratios in nitrate from alpine and polar ice cores,
Tellus B, 48(1), 93–105, doi:10.1034/j.1600-0889.1996.00009.x.Galloway, J. N., et al. (2004), Nitrogen cycles: Past, present, and future, Biogeochemistry, 70(2), 153–226, doi:10.1007/s10533-004-0370-0.Gao, Y. Q., and R. A. Marcus (2001), Strange and unconventional isotope effects in ozone formation, Science, 293(5528), 259–263, doi:10.1126/
science.1058528.Garreaud, R., M. Vuille, and A. C. Clement (2003), The climate of the Altiplano: Observed current conditions andmechanisms of past changes,
Palaeogeogr. Palaeoclimatol. Palaeoecol., 194, 5–22, doi:10.1016/s0031-0182(03)00269-4.Ginot, P., C. Kull, M. Schwikowski, U. Schotterer, and H. W. Gäggeler (2001), Effects of postdepositional processes on snow composition of a
subtropical glacier (Cerro Tapado, Chilean Andes), J. Geophys. Res., 106(D23), 32,375–32,386, doi:10.1029/2000JD000071.Ginot, P., U. Schotterer, W. Stichler, M. A. Godoi, B. Francou, and M. Schwikowski (2010), Influence of the Tungurahua eruption on the ice core
records of Chimborazo, Ecuador, Cryosphere, 4(4), 561–568, doi:10.5194/tc-4-561-2010.Grannas, A. M., et al. (2007), An overview of snow photochemistry: Evidence, mechanisms and impacts, Atmos. Chem. Phys., 7(16), 4329–4373,
doi:10.5194/acp-7-4329-200.Gross, G. W., and R. K. Svec (1997), Effect of ammonium on anion uptake and dielectric relaxation in laboratory-grown ice columns, J. Phys.
Chem. B, 101(32), 6282–6284, doi:10.1021/jp963213c.Hastings, M. G., D. M. Sigman, and F. Lipschultz (2003), Isotopic evidence for source changes of nitrate in rain at Bermuda, J. Geophys. Res.,
108(D24), 4790, doi:10.1029/2003JD003789.Hastings, M. G., E. J. Steig, and D. M. Sigman (2004), Seasonal variations in N and O isotopes of nitrate in snow at Summit, Greenland:
Implications for the study of nitrate in snow and ice cores, J. Geophys. Res., 109, D20306, doi:10.1029/2004JD004991.Hastings, M. G., D. M. Sigman, and E. J. Steig (2005), Glacial/interglacial changes in the isotopes of nitrate from the Greenland Ice Sheet
Project 2 (GISP2) ice core, Global Biogeochem. Cycles, 19, GB4024, doi:10.1029/2005GB002502.Hastings, M. G., J. C. Jarvis, and E. J. Steig (2009), Anthropogenic impacts on nitrogen isotopes of ice-core nitrate, Science, 324(5932), 1288,
doi:10.1126/science.1170510.Heaton, T. H. E. (1986), Isotopic studies of nitrogen pollution in the hydrosphere and atmosphere: A review, Chem. Geol., 59(0), 87-102,
doi:10.1016/0168-9622(86)90059-x.Hoering, T. (1957), The isotopic composition of the ammonia and the nitrate ion in rain, Geochim. Cosmochim. Acta, 12(1-2), 97–102,
doi:10.1016/0016-7037(57)90021-2.
Journal of Geophysical Research: Atmospheres 10.1002/2013JD020715
BUFFEN ET AL. ©2014. American Geophysical Union. All Rights Reserved. 2694
Holtgrieve, G. W., et al. (2011), A coherent signature of anthropogenic nitrogen deposition to remote watersheds of the Northern Hemisphere,Science, 334(6062), 1545–1548, doi:10.1126/science.1212267.
Honrath, R. E., M. C. Peterson, S. Guo, J. E. Dibb, P. B. Shepson, and B. Campbell (1999), Evidence of NOx production within or upon iceparticles in the Greenland snowpack, Geophys. Res. Lett., 26(6), 695–698, doi:10.1029/1999GL900077.
Honrath, R. E., S. Guo, M. C. Peterson, M. P. Dziobak, J. E. Dibb, and M. A. Arsenault (2000), Photochemical production of gas phase NOx fromice crystal NO3, J. Geophys. Res., 105(D19), 24,183–24,190, doi:10.1029/2000JD900361.
Jacobi, H.-W., and B. Hilker (2007), A mechanism for the photochemical transformation of nitrate in snow, J. Photochem. Photobiol., A,185(2-3), 371–382, doi:10.1016/j.jphotochem.2006.06.039.
Jaeglé, L., L. Steinberger, R. V. Martin, and K. Chance (2005), Global partitioning of NOx sources using satellite observations: Relative roles offossil fuel combustion, biomass burning and soil emissions, Faraday Discuss., 130, 407–423, doi:10.1039/b502128f.
Janssens, I. A., et al. (2010), Reduction of forest soil respiration in response to nitrogen deposition, Nat. Geosci., 3(5), 315–322, doi:10.1038/ngeo844.
Jarvis, J. C., E. J. Steig, M. G. Hastings, and S. A. Kunasek (2008), Influence of local photochemistry on isotopes of nitrate in Greenland snow,Geophys. Res. Lett., 35, L21804, doi:10.1029/2008GL035551.
Jarvis, J. C., M. G. Hastings, E. J. Steig, and S. A. Kunasek (2009), Isotopic ratios in gas-phase HNO3 and snow nitrate at Summit, Greenland,J. Geophys. Res., 114, D17301, doi:10.1029/2009JD012134.
Jones, A. E., R. Weller, E. W. Wolff, and H.-W. Jacobi (2000), Speciation and rate of photochemical NO and NO2 production in Antarctic snow,Geophys. Res. Lett., 27(3), 345–348, doi:10.1029/1999GL010885.
Kaiser, J., M. G. Hastings, B. Z. Houlton, T. Rockmann, and D. M. Sigman (2007), Triple oxygen isotope analysis of nitrate using the denitrifiermethod and thermal decomposition of N2O, Anal. Chem., 79(2), 599–607, doi:10.1021/ac061022s.
Kanamitsu, M., W. Ebisuzaki, J. Woollen, S.-K. Yang, J. J. Hnilo, M. Fiorino, and G. L. Potter (2002), NCEP-DOE AMIP-II Reanalysis (R-2), Bull. Am.Meteorol. Soc., 83(11), 1631–1643, doi:10.1175/bams-83-11-1631.
Kehrwald, N. M., C. I. Czimczik, G. M. Santos, L. G. Thompson, and L. Ziolkowski (2008), Concentration and14C content of total organic
carbon and black carbon in small (<100 μg C) samples from low-latitude alpine ice cores, Eos Trans. AGU, 89(53), Fall Meet. Suppl.,Abstract C41C-0536.
Kendall, C., E. M. Elliott, and S. D. Wankel (2007), Tracing anthropogenic inputs of nitrogen to ecosystems, in Stable Isotopes in Ecologyand Environmental Science, edited by K. Lajtha and R. H. Michener, pp. 375–449, Blackwell, Oxford, U. K., doi:10.1002/9780470691854.ch12.
Kunasek, S. A., B. Alexander, E. J. Steig, M. G. Hastings, D. J. Gleason, and J. C. Jarvis (2008), Measurements and modeling of Δ17O of nitrate in
snowpits from Summit, Greenland, J. Geophys. Res., 113, D24302, doi:10.1029/2008JD010103.Lee, D. S., I. Köhler, E. Grobler, F. Rohrer, R. Sausen, L. Gallardo-Klenner, J. G. J. Olivier, F. J. Dentener, and A. F. Bouwman (1997), Estimations of
global NOx emissions and their uncertainties, Atmos. Environ., 31(12), 1735–1749, doi:10.1016/s1352-2310(96)00327-5.Legrand, M., E. Wolff, and D. Wagenbach (1999), Antarctic aerosol and snowfall chemistry: Implications for deep Antarctic ice-core chemistry,
Ann. Glaciol., 29, 66–72, doi:10.3189/172756499781821094.Lehmann, M. F., P. Reichert, S. M. Bernasconi, A. Barbieri, and J. A. McKenzie (2003), Modelling nitrogen and oxygen isotope fractionation during
denitrification in a lacustrine redox-transition zone, Geochim. Cosmochim. Acta, 67(14), 2529–2542, doi:10.1016/s0016-7037(03)00085-1.Levy, H., II, W. J. Moxim, and R. S. Kasibhatla (1996), A global three-dimensional time-dependent lightning source of tropospheric NOx,
J. Geophys. Res., 101(D17), 22,911–22,922, doi:10.1029/96JD02341.Levy, H., II, W. J. Moxim, A. A. Klonecki, and P. S. Kasibhatla (1999), Simulated tropospheric NOx: Its evaluation, global distribution and indi-
vidual source contributions, J. Geophys. Res., 104(D21), 26,279–26,306, doi:10.1029/1999JD900442.Li, D., and X. Wang (2008), Nitrogen isotopic signature of soil-released nitric oxide (NO) after fertilizer application, Atmos. Environ., 42(19),
4747–4754, doi:10.1016/j.atmosenv.2008.01.042.Likens, G. E., and F. H. Bormann (1974), Acid rain: A serious regional environmental problem, Science, 184(4142), 1176–1179, doi:10.1126/
science.184.4142.1176.Madronich, S., and S. Flocke (1998), The role of solar radiation in atmospheric chemistry, in Handbook of Environmental Chemistry, edited by
P. Boule, pp. 1–26, Springer-Verlag, Berlin, Germany.Mariotti, A., A. Landreau, and B. Simon (1988),
15N isotope biogeochemistry and natural denitrification process in groundwater: Application
to the chalk aquifer of northern France, Geochim. Cosmochim. Acta, 52(7), 1869–1878, doi:10.1016/0016-7037(88)90010-5.Mayewski, P. A., and M. R. Legrand (1990), Recent increase in nitrate concentration of Antarctic snow, Nature, 346(6281), 258–260,
doi:10.1038/346258a0.Mayewski, P. A., W. B. Lyons, M. J. Spencer, M. S. Twickler, C. F. Buck, and S. Whitlow (1990), An ice-core record of atmospheric response to
anthropogenic sulphate and nitrate, Nature, 346(6284), 554–556, doi:10.1038/346554a0.McCabe, J. R., C. S. Boxe, A. J. Colussi, M. R. Hoffmann, and M. H. Thiemens (2005), Oxygen isotopic fractionation in the photochemistry of
nitrate in water and ice, J. Geophys. Res., 110, D15310, doi:10.1029/2004JD005484.Meijer, H. A. J., and W. J. Li (1998), The use of electrolysis for accurate δ
17O and δ
18O isotope measurements in water, Isot. Environ. Health
Stud., 34(4), 349–369, doi:10.1080/10256019808234072.Michalski, G., J. Savarino, J. K. Böhlke, and M. Thiemens (2002), Determination of the total oxygen isotopic composition of nitrate and the
calibration of a Δ17O nitrate reference material, Anal. Chem., 74(19), 4989–4993, doi:10.1021/ac0256282.
Michalski, G., Z. Scott, M. Kabiling, and M. H. Thiemens (2003), First measurements and modeling of Δ17O in atmospheric nitrate, Geophys.
Res. Lett., 30, 1870, doi:10.1029/2003GL017015.Michalski, G., J. K. Böhlke, andM. Thiemens (2004a), Long term atmospheric deposition as the source of nitrate and other salts in the Atacama
Desert, Chile: New evidence from mass-independent oxygen isotopic compositions, Geochim. Cosmochim. Acta, 68(20), 4023–4038,doi:10.1016/j.gca.2004.04.009.
Michalski, G., T. Meixner, M. Fenn, L. Hernandez, A. Sirulnik, E. Allen, and M. Thiemens (2004b), Tracing atmospheric nitrate deposition in acomplex semiarid ecosystem using Δ
17O, Environ. Sci. Technol., 38(7), 2175–2181, doi:10.1021/es034980+.
Michalski, G., J. G. Bockheim, C. Kendall, and M. Thiemens (2005), Isotopic composition of Antarctic Dry Valley nitrate: Implications for NOy
sources and cycling in Antarctica, Geophys. Res. Lett., 32, L13817, doi:10.1029/2004GL022121.Michalski, G., S. K. Bhattacharya, and D. F. Mase (2011), Oxygen isotope dynamics of atmospheric nitrate and its precursor molecules, in
Handbook of Environmental Isotope Geochemistry, edited by M. Baskaran, pp. 613–635, Springer-Verlag, Berlin, Germany, doi:10.1007/978-3-642-10637-8_30.
Miller, M. F. (2002), Isotopic fractionation and the quantification of17O anomalies in the oxygen three-isotope system: An appraisal and
geochemical significance, Geochim. Cosmochim. Acta, 66(11), 1881–1889, doi:10.1016/s0016-7037(02)00832-3.
Journal of Geophysical Research: Atmospheres 10.1002/2013JD020715
BUFFEN ET AL. ©2014. American Geophysical Union. All Rights Reserved. 2695
Miller, C. E., and Y. L. Yung (2000), Photo-induced isotopic fractionation, J. Geophys. Res., 105(D23), 29,039–29,051, doi:10.1029/2000JD900388.Miteva, V., T. Sowers, and J. Brenchley (2007), Production of N2O by ammonia oxidizing bacteria at subfreezing temperatures as a model for
assessing the N2O anomalies in the Vostok ice core, Geomicrobiol. J., 24(5), 451–459, doi:10.1080/01490450701437693.Morin, S., J. Savarino, S. Bekki, A. Cavender, P. B. Shepson, and J. W. Bottenheim (2007a), Major influence of BrO on the NOx and nitrate
budgets in the Arctic spring, inferred from Δ17O(NO3
�) measurements during ozone depletion events, Environ. Chem., 4(4), 238–241,
doi:10.1071/en07003.Morin, S., J. Savarino, S. Bekki, S. Gong, and J. W. Bottenheim (2007b), Signature of Arctic surface ozone depletion events in the isotope
anomaly (Δ17O) of atmospheric nitrate, Atmos. Chem. Phys., 7, 1451–1469, doi:10.5194/acp-7-1451-2007.
Morin, S., J. Savarino, M. M. Frey, N. Yan, S. Bekki, J. W. Bottenheim, and J. M. F. Martins (2008), Tracing the origin and fate of NOx in the arcticatmosphere using stable isotopes in nitrate, Science, 322(5902), 730–732, doi:10.1126/science.1161910.
Morin, S., J. Savarino, M. M. Frey, F. Dominé, H.-W. Jacobi, L. Kaleschke, and J. M. F. Martins (2009), Comprehensive isotopic composition ofatmospheric nitrate in the Atlantic Ocean boundary layer from 65°S to 79°N, J. Geophys. Res., 114, D05303, doi:10.1029/2008JD010696.
Morin, S., R. Sander, and J. Savarino (2011), Simulation of the diurnal variations of the oxygen isotope anomaly (Δ17O) of reactive atmospheric
species, Atmos. Chem. Phys., 11(8), 3653–3671, doi:10.5194/acp-11-3653-2011.Morin, S., J. Erbland, J. Savarino, F. Domine, J. Bock, U. Friess, H.-W. Jacobi, H. Sihler, and J. M. F. Martins (2012), An isotopic view on the
connection between photolytic emissions of NOx from the Arctic snowpack and its oxidation by reactive halogens, J. Geophys. Res., 117,D00R08, doi:10.1029/2011JD016618.
Mulvaney, R., and E. W. Wolff (1993), Evidence for winter/spring denitrification of the stratosphere in the nitrate record of Antarctic firn cores,J. Geophys. Res., 98(D3), 5213–5220, doi:10.1029/92JD02966.
Mulvaney, R., D. Wagenbach, and E. W. Wolff (1998), Postdepositional change in snowpack nitrate from observation of year-round near-surface snow in coastal Antarctica, J. Geophys. Res., 103(D9), 11,021–11,031, doi:10.1029/97JD03624.
Naftz, D. L., P. F. Schuster, and C. A. Johnson (2011), A 50-year record of NOx and SO2 sources in precipitation in the Northern RockyMountains, USA, Geochem. Trans., 12(1), 1–10, doi:10.1186/1467-4866-12-4.
Patris, N., S. S. Cliff, P. K. Quinn, M. Kasem, and M. H. Thiemens (2007), Isotopic analysis of aerosol sulfate and nitrate during ITCT-2 k2:Determination of different formation pathways as a function of particle size, J. Geophys. Res., 112, D23301, doi:10.1029/2005JD006214.
Pichlmayer, F., W. Schöner, P. Seibert, W. Stichler, and D. Wagenbach (1998), Stable isotope analysis for characterization of pollutants at highelevation alpine sites, Atmos. Environ., 32(23), 4075–4085, doi:10.1016/s1352-2310(97)00405-6.
Potter, C., V. Brooks-Genovese, S. Klooster, and A. Torregrosa (2002), Biomass burning emissions of reactive gases estimated fromsatellite data analysis and ecosystem modeling for the Brazilian Amazon region, J. Geophys. Res., 107(D20), 8056, doi:10.1029/2000JD000250.
Reese, C. A., and K.-B. Liu (2002), Pollen dispersal and deposition on the Quelccaya Ice Cap, Peru, Phys. Geogr., 23(1), 44–58, doi:10.2747/0272-3646.23.1.44.
Röthlisberger, R., M. A. Hutterli, S. Sommer, E. W. Wolff, and R. Mulvaney (2000), Factors controlling nitrate in ice cores: Evidence from theDome C deep ice core, J. Geophys. Res., 105(D16), 20,565–20,572, doi:10.1029/2000JD900264.
Röthlisberger, R., et al. (2002), Nitrate in Greenland and Antarctic ice cores: A detailed description of post-depositional processes, Ann.Glaciol., 35, 209–216, doi:10.3189/172756402781817220.
Sato, K., N. Takenaka, H. Bandow, and Y. Maeda (2008), Evaporation loss of dissolved volatile substances from ice surfaces, J. Phys. Chem. A,112(33), 7600–7607, doi:10.1021/jp075551r.
Savarino, J., and S. Morin (2011), The N, O, S isotopes of oxy-anions in ice cores and polar environments, in Handbook of EnvironmentalIsotope Geochemistry, edited by M. Baskaran, pp. 835–864, Springer-Verlag, Berlin, Germany, doi:10.1007/978-3-642-10637-8_39.
Savarino, J., J. Kaiser, S. Morin, D. M. Sigman, and M. H. Thiemens (2007), Nitrogen and oxygen isotopic constraints on the origin of atmo-spheric nitrate in coastal Antarctica, Atmos. Chem. Phys., 7(8), 1925–1945, doi:10.5194/acp-7-1925-2007.
Savarino, J., S. K. Bhattacharya, S. Morin, M. Baroni, and J. F. Doussin (2008), The NO+O3 reaction: A triple oxygen isotope perspective on the reactiondynamics and atmospheric implications for the transfer of the ozone isotope anomaly, J. Chem. Phys., 128(19), 194,303, doi:10.1063/1.2917581.
Schwarz, M., Y. Oelmann, and W. Wilcke (2011), Stable N isotope composition of nitrate reflects N transformations during the passage ofwater through a montane rain forest in Ecuador, Biogeochemistry, 102(1-3), 195–208, doi:10.1007/s10533-010-9434-5.
Schwikowski, M., S. Brütsch, H. W. Gäggeler, and U. Schotterer (1999), A high-resolution air chemistry record from an Alpine ice core:Fiescherhorn glacier, Swiss Alps, J. Geophys. Res., 104(D11), 13,709–13,719, doi:10.1029/1998JD100112.
Seinfeld, J. H., and S. N. Pandis (2006), Atmospheric Chemistry and Physics: From Air Pollution to Climate Change, John Wiley, Hoboken, N. J.Shen, Q. R., W. Ran, and Z. H. Cao (2003), Mechanisms of nitrite accumulation occurring in soil nitrification, Chemosphere, 50(6), 747–753,
doi:10.1016/s0045-6535(02)00215-1.Shindell, D. T., G. Faluvegi, D. M. Koch, G. A. Schmidt, N. Unger, and S. E. Bauer (2009), Improved attribution of climate forcing to emissions,
Science, 326(5953), 716–718, doi:10.1126/science.1174760.Sigman, D. M., K. L. Casciotti, M. Andreani, C. Barford, M. Galanter, and J. K. Böhlke (2001), A bacterial method for the nitrogen isotopic analysis
of nitrate in seawater and freshwater, Anal. Chem., 73(17), 4145–4153, doi:10.1021/ac010088e.Thibert, E., and F. Dominé (1998), Thermodynamics and kinetics of the solid solution of HNO3 in ice, J. Phys. Chem. B, 102(22), 4432–4439,
doi:10.1021/jp980569a.Thiemens, M. H. (1999), Mass-independent isotope effects in planetary atmospheres and the early solar system, Science, 283(5400), 341–345,
doi:10.1126/science.283.5400.341.Thompson, A. M. (1992), The oxidizing capacity of the Earth’s atmosphere: Probable past and future changes, Science, 256(5060), 1157–1165,
doi:10.1126/science.256.5060.1157.Thompson, L. G., and E. Mosley-Thompson (1982), Spatial distribution of microparticles within Antarctic snow-fall, Ann. Glaciol., 3, 300–306.Thompson, L. G., S. Hastenrath, and B. M. Arnao (1979), Climatic ice core records from the tropical Quelccaya Ice Cap, Science, 203(4386),
1240–1243, doi:10.1126/science.203.4386.1240.Thompson, L. G., E. Mosley-Thompson, J. F. Bolzan, and B. R. Koci (1985), A 1500-year record of tropical precipitation in ice cores from the
Quelccaya Ice Cap, Peru, Science, 229(4717), 971–973, doi:10.1126/science.229.4717.971.Thompson, L. G., E. Mosley-Thompson, W. Dansgaard, and P. M. Grootes (1986), The Little Ice Age as recorded in the stratigraphy of the
Tropical Quelccaya Ice Cap, Science, 234(4774), 361–364, doi:10.1126/science.234.4774.361.Thompson, L. G., E. Mosley-Thompson, M. E. Davis, P.-N. Lin, K. A. Henderson, J. Cole-Dai, J. F. Bolzan, and K.-B. Liu (1995), Late Glacial Stage
and Holocene tropical ice core records from Huascarán, Peru, Science, 269(5220), 46–50, doi:10.1126/science.269.5220.46.Thompson, L. G., et al. (1998), A 25,000-year tropical climate history from Bolivian ice cores, Science, 282(5395), 1858–1864, doi:10.1126/
science.282.5395.1858.
Journal of Geophysical Research: Atmospheres 10.1002/2013JD020715
BUFFEN ET AL. ©2014. American Geophysical Union. All Rights Reserved. 2696
Thompson, L. G., E. Mosley-Thompson, H. Brecher, M. Davis, B. León, D. Les, P.-N. Lin, T. Mashiotta, and K. Mountain (2006), Abrupt tropicalclimate change: Past and present, Proc. Natl. Acad. Sci. U. S. A., 103(28), 10,536–10,543, doi:10.1073/pnas.0603900103.
Thompson, L. G., H. H. Brecher, E. Mosley-Thompson, D. R. Hardy, and B. G. Mark (2009), Glacier loss on Kilimanjaro continues unabated, Proc.Natl. Acad. Sci. U. S. A., 106(47), 19,770–19,775, doi:10.1073/pnas.0906029106.
Thompson, L. G., E. Mosley-Thompson, M. E. Davis, V. S. Zagorodnov, I. M. Howat, V. N. Mikhalenko, and P.-N. Lin (2013), Annually resolved icecore records of tropical climate variability over the past ~1800 years, Science, 340(6135), 945–950, doi:10.1126/science.1234210.
Turekian, V. C., S. Macko, D. Ballentine, R. J. Swap, and M. Garstang (1998), Causes of bulk carbon and nitrogen isotopic fractionations in theproducts of vegetation burns: Laboratory studies, Chem. Geol., 152(1-2), 181–192, doi:10.1016/s0009-2541(98)00105-3.
van der Werf, G. R., J. T. Randerson, G. J. Collatz, L. Giglio, P. S. Kasibhatla, A. F. Arellano Jr., S. C. Olsen, and E. S. Kasischke (2004), Continental-scale partitioning of fire emissions during the 1997 to 2001 El Niño/La Niña period, Science, 303(5654), 73–76, doi:10.1126/science.1090753.
Vicars, W. C., S. K. Bhattacharya, J. Erbland, and J. Savarino (2012), Measurement of the17O-excess (Δ
17O) of tropospheric ozone using a
nitrite-coated filter, Rapid Commun. Mass Spectrom., 26(10), 1219–1231, doi:10.1002/rcm.6218.Vuille, M., R. S. Bradley, and F. Keimig (2000), Interannual climate variability in the Central Andes and its relation to tropical Pacific and Atlantic
forcing, J. Geophys. Res., 105(D10), 12,447–12,460, doi:10.1029/2000JD900134.Wagnon, P., R. J. Delmas, and M. Legrand (1999), Loss of volatile acid species from upper firn layers at Vostok, Antarctica, J. Geophys. Res.,
104(D3), 3423–3431, doi:10.1029/98JD02855.Ward, B. B. (1996), Nitrification and denitrification: Probing the nitrogen cycle in aquatic environments, Microbiol. Ecol., 32(3), 247–261,
doi:10.1007/bf00183061.Warneck, P., and C. Wurzinger (1988), Product quantum yields for the 305-nm photodecomposition of nitrate in aqueous solution, J. Phys.
Chem., 92(22), 6278–6283, doi:10.1021/j100333a022.Yienger, J. J., and H. Levy II (1995), Empirical model of global soil-biogenic NOx emissions, J. Geophys. Res., 100(D6), 11,447–11,464, doi:10.1029/
95JD00370.Yung, Y. L., and C. E. Miller (1997), Isotopic fractionation of stratospheric nitrous oxide, Science, 278(5344), 1778–1780, doi:10.1126/
science.278.5344.1778.Zatko, M. C., T. C. Grenfell, B. Alexander, S. J. Doherty, J. L. Thomas, and X. Yang (2013), The influence of snow grain size and impurities on the
vertical profiles of actinic flux and associated NOx emissions on the Antarctic and Greenland ice sheets, Atmos. Chem. Phys., 13(7),3547–3567, doi:10.5194/acp-13-3547-2013.
Journal of Geophysical Research: Atmospheres 10.1002/2013JD020715
BUFFEN ET AL. ©2014. American Geophysical Union. All Rights Reserved. 2697