lomonosovfonna and holtedahlfonna ice cores reveal east±west...
TRANSCRIPT

Lomonosovfonna and Holtedahlfonna ice cores reveal eastndashwestdisparities of the Spitsbergen environment since AD 1700
Emilie BEAUDON1 John C MOORE123 Tonu MARTMA4 Veijo A POHJOLA3
Roderik SW VAN DE WAL5 Jack KOHLER6 Elisabeth ISAKSSON6
1Arctic Centre University of Lapland Rovaniemi FinlandE-mail emiliebeaudonulaplandfi
2Colleges of Global Change and Earth System Science Beijing Normal University Beijing China3Department of Earth Sciences Uppsala University Uppsala Sweden4Institute of Geology Tallinn University of Technology Tallinn Estonia
5Institute for Marine and Atmospheric Research Utrecht Utrecht University Utrecht The Netherlands6Norwegian Polar Institute Fram Centre Tromsoslash Norway
ABSTRACT An ice core extracted from Holtedahlfonna ice cap western Spitsbergen record spanning
the period 1700ndash2005 was analyzed for major ions The leading empirical orthogonal function (EOF)
component is correlated with an index of summer melt (log([Na+][Mg2+]) from 1850 and shows that
almost 50 of the variance can be attributed to seasonal melting since the beginning of the industrial
revolution The Holtedahlfonna d18O value is less negative than in the more easterly Lomonosovfonna
ice core suggesting that moist air masses originate from a closer source most likely the Greenland Sea
During the Little Ice Age the lower methanesulfonic acid (MSA) concentration and MSA non-sea-salt
sulfate fraction are consistent with the Greenland Sea as the main source for biogenic ions in the ice
cores Both the melt index and the MSA fraction suggest that the early decades of the 18th century may
have exhibited the coldest summers of the last 300 years in Svalbard Ammonium concentrations rise
from 1880 which may result from the warming of the Greenland Sea or from zonal differences in
atmospheric pollution transport over Svalbard During winter neutralized aerosols are trapped within
the tropospheric inversion layer which is usually weaker over open seas than over sea ice placing
Holtedahlfonna within the inversion more frequently than Lomonosovfonna
1 INTRODUCTION
Sea-ice cover is an important modulator of the decadal-scaleclimate variability in the Arctic The largest temperaturechanges associated with the high winter sea-ice covervariability are observed in the GreenlandndashBarentsndashKara seas(Bengtsson and others 2004) which receive warm waterdriven by the southwesterly to westerly winds betweenSvalbard and the northernmost Norwegian coast Thelocation of Svalbard at the southern edge of the permanentsea-ice cover of the Arctic Ocean and on the pathway of bothArctic and North Atlantic cyclones contributes to therelatively mild climate compared with most of the ArcticSea-ice variations have been one of the main driving forces ofthe Svalbard climate over at least the past 500 years (Isakssonand others 2005a Grinsted and others 2006) henceSvalbard is an interesting location to conduct climate studiesin the European Arctic Ocean sector
Previous Svalbard ice cores have proven the suitability ofthese records for paleoclimate investigations despite altera-tion by post-depositional processes in particular seasonalmelt (Pohjola and others 2002a Kekonen and others2005 Van der Wel and others 2011) Consequently apanel of proxies and statistical tools useful in decipheringclimatic signals disrupted by melting has been developedfor these low-altitude ice caps For instance Iizuka andothers (2002) and Grinsted and others (2006) found goodsummer melting indices based on ion concentrations ofsnow and ice from Austfonna Nordaustlandet andLomonosovfonna eastern Spitsbergen (Fig 1) Moore andothers (2005) examined the impact of seasonal melt usingprincipal components analysis (PCA) on the complete
Lomonosovfonna ion dataset Environmental signals wereseparated from melting in Lomonosovfonna (Kekonen andothers 2005) Austfonna (Watanabe and others 2001) andVestfonna (Nordaustlandet) (Matoba and others 2002) icecores with detection of Medieval Warm Period (Kekonenand others 2005) and Little Ice Age (LIA) at multi-year ormulti-decadal resolution (Watanabe and others 2001Matoba and others 2002) The origins of major chemicalspecies were discussed (Kekonen and others 2002) and aregional-scale picture of the anthropogenic pollution historyhas been composed the 20th-century sulfate sources inparticular being inventoried by Moore and others (2006) forLomonosovfonna ice cap
Northndashsouth disparities across Svalbard due to theinfluence of the Arctic front and the impact of the ice extentof the Barents Sea were identified by comparing the Aust-fonna ice core with Lomonosovfonna (Isaksson and others2005b) However glaciochemical references for westernSpitsbergen are lacking with the exception of the Snoslashfjella-fonna ice core drilled in 1995 with a published recordspanning only 70 years (Kameda and others 1993 Goto-Azuma and others 1995 Goto-Azuma and Koerner 2001)The new chemical dataset from a long ice core drilled onHoltedahlfonna presented here aims to fill this gap andprovides the first century-length paleo-environmentalequivalent to the Lomonosovfonna core for western Spits-bergen Although these two ice caps lie at the same altitudeand only 100 km apart on the same island the complex anddiverse Svalbard environment leads to somewhat dissimilarice-core signatures In this paper we compare the chemicaldataset from these two glaciers throughout their overlapping
Journal of Glaciology Vol 59 No 218 2013 doi 1031892013JoG12J203 1069
time period and using statistical methods we discuss thedifferences in their respective ionic budget focusing onbiogenic sulfur and ammonium
2 SITE DESCRIPTION AND DATING
21 Glaciological characteristics
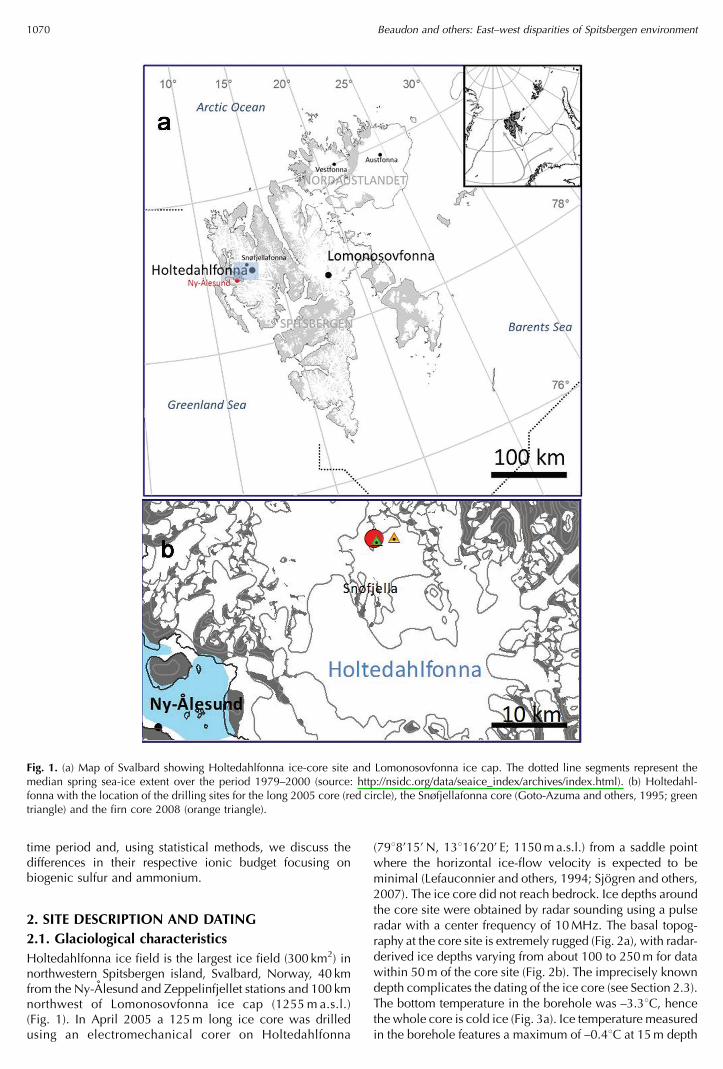
Holtedahlfonna ice field is the largest ice field (300 km2) innorthwestern Spitsbergen island Svalbard Norway 40 kmfrom the Ny-Alesund and Zeppelinfjellet stations and 100 kmnorthwest of Lomonosovfonna ice cap (1255m asl)(Fig 1) In April 2005 a 125m long ice core was drilledusing an electromechanical corer on Holtedahlfonna
(7988rsquo15rsquoN 13816rsquo20rsquo E 1150masl) from a saddle pointwhere the horizontal ice-flow velocity is expected to beminimal (Lefauconnier and others 1994 Sjogren and others2007) The ice core did not reach bedrock Ice depths aroundthe core site were obtained by radar sounding using a pulseradar with a center frequency of 10MHz The basal topog-raphy at the core site is extremely rugged (Fig 2a) with radar-derived ice depths varying from about 100 to 250m for datawithin 50m of the core site (Fig 2b) The imprecisely knowndepth complicates the dating of the ice core (see Section 23)The bottom temperature in the borehole was ndash338C hencethe whole core is cold ice (Fig 3a) Ice temperature measuredin the borehole features a maximum of ndash048C at 15m depth
Fig 1 (a) Map of Svalbard showing Holtedahlfonna ice-core site and Lomonosovfonna ice cap The dotted line segments represent themedian spring sea-ice extent over the period 1979ndash2000 (source httpnsidcorgdataseaice_indexarchivesindexhtml) (b) Holtedahl-fonna with the location of the drilling sites for the long 2005 core (red circle) the Snoslashfjellafonna core (Goto-Azuma and others 1995 greentriangle) and the firn core 2008 (orange triangle)
Beaudon and others Eastndashwest disparities of Spitsbergen environment1070
(Sommer 2005) Latent heat from refreezing of percolatingmeltwater is assumed to produce the thermal maximum at15m and is expected to impact chemistry as discussed inSection 32
22 Sampling and analysis
On average 60 cm long ice-core pieces were retrieved andpacked in clean plastic bags placed in insulated boxes andtransported under frozen conditions to the Norwegian PolarInstitute Tromsoslash Norway where dielectric profiling (DEP)and high-resolution density measurements were performedalong the entire core (Sjogren and others 2007) beforesubsampling for chemical measurements
In a cold room parallel-sided sections of the core were cutand distributed for tritium (Van der Wel and others 2011)oxygen isotope (Divine and others 2011) organic contam-inant (Ruggirello and others 2010) and ion measurements(this study) for which rectangular sections were collectedfrom the inner part of the core At the Finnish Forest Institute(Rovaniemi research station) the core pieces as well as blanksmade from ultrapure Milli-Q water were subsampled into10ndash20 cm long increments A total of 740 samples weremelted at room temperature in a clean room just before beinganalyzed for major water-soluble ions (Na+ NH4
+ K+ Mg2+Ca2+ CH3SO3
ndash Clndash SO42ndash NO3
ndash) via Dionex ion-sup-pressed chromatography (DX-120 series) equipped withDionex Ionpack CS12 columns for the cation channel andwith Dionex Ionpack AS15 columns for the anion channelKekonen and others (2002 2004) and Virkkunen (2004)describe the analytical methods in detail Mean blank values(12 samples) obtained were 009 08 ng gndash1 for sodium0815 ng gndash1 for ammonium 02 01 ng gndash1 for potas-sium 008009 ng gndash1 for magnesium 05 07 ng gndash1 forcalcium 0030 09ng gndash1 for methanesulfonic acid (MSA)101 07 ng gndash1 for chloride 09 06 ng gndash1 for sulfate and0209 ng gndash1 for nitrate Non-sea-salt (nss) fractions ofcalcium sulfate magnesium and chloride were calculatedusing a conservative sea-salt species ie sodium as the sea-salt indicator (Keene and others 1986)
23 Dating
Previous studies using the Holtedahlfonna ice-core data(Sjogren and others 2007 Ruggirello and others 2010 Vander Wel and others 2011) used an agendashdepth scale based on
Fig 2 (a) Topographical map of the drilling site (black circle) area showing radar survey tracks The black arrows and the dashed black lineshow the track corresponding to the radargram shown in (b) (b) Radar profile passing over the drilling site (dashed red line)
Fig 3 Temperature profile (gray dashed curve) measured along theborehole (Sommer 2005) Agendashdepth scale combining the Nye agescale assuming a glacier thickness of 300m with an automatedd18O cycle counting (black dashed curve) Nye age scale (for aglacier thickness of 250m) used in Van der Wel and others (2011)(red curve) Age scale developed by Moore and others (2012) (greencurve) using five volcanic reference horizons (blue triangles) withcycle counting and employed in this study The table (inset) showsthe average accumulation rates calculated for intervals betweenvolcanic reference horizons and decompressed using a Nye modelwith 300m ice depth
Beaudon and others Eastndashwest disparities of Spitsbergen environment 1071
the Nye thinning model (Nye 1963) constrained by thedepth of the 1963 radioactivity fallout layer at 285m depth(Van der Wel and others 2011) giving a constant accumu-lation rate (050mwe andash1 for 1963ndash2005) together with arange of plausible ice thicknesses (Fig 3b) Divine andothers (2011) used automated counting of annual d18O(Pohjola and others 2002b) layers to derive variableaccumulation rates The rate of thinning of layers is bestmatched with the Nye agendashdepth model having a glacierthickness of 300m which is 150m more than the icethickness estimation used in earlier studies (Sjogren andothers 2007) Ice thicknesses up to 250m are found withintens of meters of the drilling site (Fig 2)
Recently a dating method based on statistical extractionof historically known volcanic eruptions was used (Mooreand others 2012) To do this the sulfate profile is fitted to allother ion species measured in the core using a multiplelinear regression with moving windows in logarithmicconcentration space (Moore and others 2006) This allowsthe contributions of the several possible time-varying sulfatesources (other than volcanic) as well as the melt-inducedrelocation of ions and the heteroscedastic ion chroma-tography errors to be taken into account In the sulfateresidual obtained peaks can only be related to stochasticsources (ie mainly volcanic) The significance of thesepeaks in the residual is found by assessing the variancewithin the sliding window used in the empirical regressionThe chemical fingerprints of five volcanic eruptions werefound (at 95 confidence level) and among them a peakcould be assigned to the Laki (Iceland) eruption (1783) at1036m depth The volcanic signatures could be used asreference horizons in a stacked Nye thinning modelFigure 3b shows that the Nye ice thickness makes littledifference to the dating except below 100m depth Theclosest fit to the volcanic reference layers is with a Nyedepth of 300m This is deeper than the depth from the radar(Fig 2) however it is consistent with the temperature profile(Fig 3a) (Sommer 2005) The extremely rugged topographywill lead to ice dynamic flow far different from that assumedin the simple Nye model so we use a thinning model with300m depth to compensate for the different vertical shear
As described in Sections 33 and 34 Holtedahlfonnachemistry is dominated by ions originating mostly frommarine and anthropogenic sources with the volcanic sulfatefraction representing only 14 of the total sulfate budget(Moore and others 2012) This rather weak volcanic signalexplains why none of the five volcanic peaks could bedetected previously with DEP measurements For eachhorizon the dating uncertainty ie the difference betweenthe eruption date and the dating model based on cyclecounting (Divine and others 2011) ranges from ndash09 years(for Agung Indonesia 1963) to +96 years (for KrakatauIndonesia 1883) The core agendashdepth scale calculated byMoore and others (2012) shows that the core covers aperiod of 305 years with a mean accumulation rate of038mwe andash1
3 RESULTS AND DISCUSSION
31 Snow accumulation and source of moisture
For the period 1963ndash2005 ie for the upper 285m of theHoltedahlfonna core Van der Wel and others (2011)calculated an average annual accumulation rate on Holte-dahlfonna of 050mwe andash1 somewhat higher than the rate
given by Kekonen and others (2005) for the period 1963ndash97on Lomonosovfonna (041mwe andash1) Van der Wel andothers (2011) attributed this difference to Holtedahlfonnabeing located first on the trajectory of westerly storm tracksFor the earlier period 1783ndash1963 we found little differencein accumulation at Holtedahlfonna in contrast with Lomo-nosovfonna where average annual snow accumulation ratesare 20 greater over the recent period compared with thepre-1963 period (Fig 3b) This result suggests a substantialdifference in the responses of western and eastern Spitsber-gen concurrent with warming and increased moisturecontent of the Arctic troposphere (Morison and others2000 Groves and Francis 2002) We shall show that this islikely due to different sea-ice histories on western andeastern Spitsbergen which in turn impacts moisture avail-ability water isotopes and chemistry for Lomonosovfonnaand Holtedahlfonna
The oxygen isotope ratio in ice cores is commonly usedas a tracer for the water cycle Divine and others (2011)show that the d18O of Svalbard ice cores is a useful proxy forregional winter air temperatures Most of the d18O signal ispreserved in the annual layer despite percolation andrefreezing (Van der Wel and others 2011) The 10 yearrunning means of the d18O time series for the Holtedahl-fonna and Lomonosovfonna ice cores are plotted in Figure 4Although the amplitude of the isotopic variations is similar atboth sites (between 1 and 3 on average) the smoothedd18O values are less negative in the Holtedahlfonna coreand average ndash14 over the whole period spanned by thecore (ndash16 for Lomonosovfonna) The similar altitude andlatitude of Holtedahlfonna and Lomonosovfonna suggestssimilar cloud and surface temperatures hence the differencein isotope values suggests either depletion due to longertransport pathways from a common source or two differentmoisture sources The short distance to the mostly non-sea-ice-covered Greenland Sea provides an obvious sourceinvolving travel of a further 100 km to reach Lomonosov-fonna In the Canadian Arctic a 200 km difference in snowfrom a moisture source produces a 3 change in d18O(Koerner 1979) which compares with the 2 averagedifference between Holtedahlfonna and Lomonosovfonnafor a 100 km distance difference to open water Of coursethe Barents Sea will also provide a moisture source for bothdrill sites on some occasions though in that case we wouldexpect the deposition at Holtedahlfonna to be moredepleted relative to Lomonosovfonna hence this must bea relatively infrequent moisture source for HoltedahlfonnaAn alternative explanation for the relatively higher d18Ovalues in Holtedahlfonna ice may be that part of the wintersnow is removed at the coring site by wind scouring withresulting mean d18O biased toward heavier values (Fisherand others 1983 1998) There are no direct data onseasonal distribution of snow accumulation and windregime on Holtedahlfonna however data from radio-isotope deposits suggest that wind scouring is not significantin these locations as we discuss in the next subsection
32 Impact of post-depositional processes onglaciochemistry
Experience from the Lomonosovfonna ice core leads us toexpect that the Holtedahlfonna chemical records will beaffected by significant seasonal surface melting meltwaterpercolation and refreezing In fact for LomonosovfonnaVan de Wal and others (2002) reported a firn temperature of
Beaudon and others Eastndashwest disparities of Spitsbergen environment1072
ndash288C at 15m depth which considering the mean annualair temperature at the drilling site is ndash1258C (Pohjola andothers 2002a) results principally from transfer and releaseof latent heat by meltwater refreezing at depth In hisdetailed stratigraphic study of shallow cores from Lomono-sovfonna Samuelsson (2001) found that meltwater does notnormally penetrate further than 4 or 5m depth This isconsistent with Kekonen and others (2005) who found thatduring the warmest years on Lomonosovfonna the percola-tion length ranges from two to eight annual layersHoltedahlfonna borehole measurements (Sommer 2005)reveal a firn temperature of ndash048C at 15m depth (Fig 3a)suggesting a greater impact of refreezing than on Lomono-sovfonna This is also reflected in the presence of more icylayers in the firn pack at Holtedahlfonna than at Lomono-sovfonna Grumet and others (1998) and Fisher and others(1998) showed that higher infiltration layer frequencygenerally implies the chemical signals are more affectedby elution for Penny Ice Cap Canadian Arctic However theopposite effect of ice layer formation ie limiting thediffusion of the chemical signal (Hou and Qin 2002) wasshown by Van der Wel and others (2011) using high-resolution tritium profiles from Holtedahlfonna andLomonosovfonna although it should be taken into accountthat the limited diffusion of radioactive isotopes is alsoinherent in their location within the ice crystal The samestudy also indicates the 1963 tritium peak has the sameamplitude in both ice cores and is consistent with otherradioactivity measurement from other Svalbard ice cores(Pinglot and others 1999) More particularly 137Cs onLomonosovfonna has the same mean value at the summitdrill site and at much lower altitudes on the glacier rulingout any strong removal of snow or high-magnitude spatialnoise induced by wind scouring (Pinglot and others 1999)
As an overview of the role of melting and percolation inthe post-depositional processes over the entire record inFigure 5 we plot log([Na+] [Mg2+]) which has been definedas a good index of ion elution in Svalbard (Iizuka and others2002 Grinsted and others 2006) with higher valuesreflecting more melt The Holtedahlfonna and Lomonosov-fonna melt indices (10 year running average) show someinteresting dissimilarities (Fig 5) variations in amplitudeand frequency are larger for Holtedahlfonna especiallyduring the periods before 1740 and after 1970 Thesedifferences are especially visible during the 20th centuryshowing that Holtedahlfonna was more sensitive to meltthan Lomonosovfonna We found a significant correlation(r=041 p 005) between the Holtedahlfonna melt indexand the summer air temperatures (June July August (JJA))recorded at Svalbard airport (Longyearbyen) since 1911 forLomonosovfonna the correlation coefficient is only 001Virkkunen and others (2007) found that for Spitsbergenglaciers daily peak air temperature affects the amount ofmelting more than for example the duration of the summeror the number of positive degree-days Assuming thatHoltedahlfonna melt was well correlated with summer airtemperature also before 1911 Figure 5 shows that prior to1860 daily maximum summer temperatures were lower andless variable than during the 20th century The 1720s mighthave seen the coldest summers of the last 300 years inSvalbard The sharp rise in the melt index log([Na+][Mg2+])in the 1980s (Fig 5) is closely matched with a pronounceddecrease in concentration towards the detection limit for thenitrate and sulfate (Fig 5) both of which are easily eluted
Fig 4 Holtedahlfonna glaciochemical records (gray curves) atsample resolution with 10 year running average (black curve) andnon-sea-salt fraction (light gray shaded area) Lomonosovfonnad18O curve (10 year running average) is shown in gray The grayshaded area in the C plot displays the acidic portion of theHoltedahlfonna core (Cgt0 with C=
Panions ndash
Pcations)
Beaudon and others Eastndashwest disparities of Spitsbergen environment 1073
components (Moore and others 2005) and with lesserdepletion for calcium magnesium and potassium Thus onehypothesis is that the ion concentrations are driven by post-depositional melt processes This is consistent with therecent warming recorded by the melt index with some ofthe more mobile ions species appearing to have been lost byrunoff in recent decades The impact of melt and runoff onion chemistry has been long studied in seasonal snowpack(Davies and others 1982) Alpine firn (Eichler and others2001) and Svalbard snow pits (Virkkunen and others 2007)These and numerous other investigations show almostcomplete removal of ions during the first summer This is aresult of the location of most ions at grain boundaries in thesnowpack resulting in their preferential elution with melt-water Ion concentrations in the firn remaining after asummer melt and washout are far lower than those observedin Holtedahlfonna except in some post-1980 ice (Fig 4)Prior to 1980 the temporal evolution of these ions wassimilar to that found for Lomonosovfonna (Kekonen andothers 2002 2005) which preserves a good record that ismodified by melt but not runoff (Pohjola and others 2002a)Hence we can reject the hypothesis that the chemical record
is simply post-depositional variability However we clearlyneed to take into consideration the tangled nature ofvariation in snow chemistry with post-depositional pro-cesses such as melt and percolation
Moore and others (2005) performed an empirical orthog-onal function (EOF) analysis on Lomonosovfonna ice-coresamples to investigate the roles of precipitation and post-depositional movement of species in ice Monte Carlotesting of the EOF factors (Moore and Grinsted 2009)showed that the first eight EOFs were significant Moore andothers (2005) found that 60 of the variation in Lomono-sovfonna data is due to elution and is the leading EOF Weuse a similar approach for the Holtedahlfonna core usinglog-transformed and standardized concentrations The firstsix EOFs each correlate with one or several chemical speciesthat are not distinctively representative of a single source ordo not have a clear link with anything measurable The firstsix EOFs account for a total of 95 of the variance (weexpect 5 measurement noise errors so no more than95 variance can be expected to be physically explainable)
Table 1 displays only the two first eigenvectors whichtogether account for 68 of the variance the first eigen-vector (EOF 1) describes 493 of variance in the datasetEOF 1 is loaded in all ions except ammonium and to alesser extent MSA Virkkunen and others (2007) showedthat ammonium is the least mobile ion within the snowpackand has the lowest elution rate (Pohjola and others 2002a)due to its solubility within the ice crystal MSA has a higherelution rate than ammonium (Pohjola and others 2002aMoore and others 2005) as it is a highly soluble acid thatcan move in the liquid or vapor phase along firn grainboundaries (Mulvaney and others 1992) even in snowpackand firn well below the melting point (Kreutz and others1998 Pasteur and Mulvaney 2000 Curran and others2002) However at sites with seasonal melting providedmelting rate does not lead to ion loss by runoff eluted ionsare trapped by refrozen ice layers and prevented from longerdiffusion and relocation Furthermore MSA variations in theLomonosovfonna core were found to correlate significantlywith Barents Sea surface temperatures (OrsquoDwyer and others2000) showing meaningful signals are preserved in the MSArecord Hence as for Lomonosovfonna about half of thevariance of the Holtedahlfonna chemical dataset is due to
Fig 5 Ten-year running average of the melt index (log([Na+][Mg2+])) for Holtedahlfonna (black curve) and Lomonosovfonna (gray curve)JJA mean (orange) and 5 year running average (red) air temperature recorded at Longyearbyen airport weather station (78258N 15478 E29masl) between 1911 and 2000 (source httpclimexpknminl)
Table 1 Loading coefficients of each ion species obtained by EOFanalysis of Holtedahlfonna and Lomonosovfonna major-ion stand-ardized log-transformed data for the period 1700ndash1997 Boldnumbers are the significant loadings
Holtedahlfonna Lomonosovfonna
EOF 1 EOF 2 EOF 1 EOF 2
Clndash 033 048 037 009NO3
ndash 037 006 031 ndash055SO4
2ndash 043 ndash005 034 ndash027MSA 016 ndash034 030 020NH4
+ 007 044 017 ndash066K+ 037 ndash012 035 021Ca2+ 036 ndash041 033 016Mg2+ 041 ndash022 040 023Na+ 033 047 037 016Variance () 4932 1849 5422 1361Cumulative variance () 4932 6781 5422 6783
Beaudon and others Eastndashwest disparities of Spitsbergen environment1074
post-depositional movement of ions with the other halflikely related to climatic factors Therefore to improve thesignal-to-noise ratio and to take into account the signalfractionation due to elution we use 10 year running meansof the ion time series
33 Chemical composition of the Holtedahlfonna icecore
Basic statistical properties of each ion and their non-sea-saltfraction at different periods on Holtedahlfonna and Lomo-nosovfonna are summarized in Table 2 Since we have noconcrete evidence of the bedrock depth or layer thinning asa function of depth in the complex ice-flow regime aroundthe drill site we do not attempt to calculate fluxes of ionsTherefore it is not possible to thoroughly conclude that ionconcentrations in the Holtedahlfonna ice core are con-trolled by accumulation or dry deposition HoweverFigure 3b shows that accumulation rates vary little for mostof the core and in order to ease the comparison with theLomonosovfonna ice-core dataset (Kekonen and others2005) we will use concentrations rather than fluxes in thediscussion of our results
Almost all ion (chloride sulfate nitrate ammoniumsodium potassium magnesium) concentration profiles(Fig 4) display an increase from 1815 Calcium and MSAare exceptions and their average concentrations during theperiod 1700ndash1815 were 50 higher than after 1815(Table 2) Sodium chloride and potassium do not showsignificantly higher concentrations during the coldest part ofthe LIA culminating at about 1850 in Svalbard (Divine andothers 2011) and between 1800 and 1840 in the Arctic as awhole (Overpeck and others 1997) In contrast magnesiumconcentrations are gt50 higher during 1750ndash1880 and are
dominated by the terrestrial fraction (Fig 4) as was alsoobserved in Canadian Arctic and Greenland ice cores(Mayewski and others 1993)
The ice is distinctly acidic from 1850 which correspondsto the onset of the industrial revolution in Europe (Cgt0Fig 4) and even more so between 1940 and 1980 whenhuman activity (fossil-fuel burning) significantly enhancedthe level of acidic species such as nitrate nss-sulfate nss-chloride probably deposited as nitric acid (HNO3) sulfuricacid (H2SO4) and hydrochloric acid (HCl) brought by Arctichaze (Virkkunen 2004) Sulfate concentrations have risen bya factor of 17 since 1880 The major part of the increaseoccurred after 1940 Peak levels are reached during the1960s which is consistent with ice-core records fromSnoslashfjellafonna Svalbard (Goto-Azuma and others 1995)and from Severnaya Zemlya Russian arctic (Weiler andothers 2005) but contrasts with Greenland and theCanadian Arctic (Grumet and others 1998) which displaya more gradual rise in sulfate over the 20th century It islikely that these ice cores from Greenland and Canada aremore representative of the Northern Hemisphere tropo-spheric concentration (Fisher and others 1998) In theHoltedahlfonna core the average concentration of ammo-nium is 22 times higher during the 20th century than duringthe 18th century (Table 2)
34 Comparison with the Lomonosovfonna ice core
Since ion chromatograph data are heteroscedastic (in thiscase errors are proportional to concentration) and post-depositional processes affect ion elution rates (Moore andothers 2005) calculation of statistics assuming normalityand non-sea-salt ratios is suspect however these measuresare still commonly used and may be useful for comparing
Table 2 Average concentrations (x (meq Lndash1)) and standard deviation () in (a) Holtedahlfonna and (b) Lomonosovfonna (Kekonen and others2005) in different time periods (n is the number of samples nss is the non-sea-salt fraction over the period 1700ndash1997 calculated usingsodium as a reference)
a MSA (10ndash3) Clndash SO42ndash NO3
ndash Na+ NH4+ K+ Mg2+ Ca2+ n
x x x x x x x x x
Whole core 4797 692 1195 75 266 31 066 07 989 69 106 08 025 02 190 21 130 38 7391700ndash1815 7944 997 886 58 216 21 061 05 737 54 082 06 033 03 217 22 184 19 1461815ndash80 6333 60 1283 86 278 21 059 03 1091 85 072 04 028 02 284 22 228 76 1661880ndash1920 2709 346 1538 83 408 33 062 03 1269 86 085 06 032 02 289 26 126 1 661920ndash50 1087 173 1579 71 256 23 054 04 1312 66 099 05 025 02 149 13 088 08 691950ndash70 5744 555 1273 72 692 51 145 09 1048 58 180 11 029 02 235 18 118 07 641970ndash97 2527 359 1232 61 129 23 058 07 968 47 152 09 014 02 067 11 033 05 1651997ndash2004 4572 97 739 64 138 25 059 1 665 6 083 05 020 02 095 13 070 07 65
nss 22 557 152 228 677
b MSA Clndash SO42ndash NO3
ndash Na+ NH4+ K+ Mg2+ Ca2+ n
x x x x x x x x x
Whole core 11512 1459 806 57 380 46 088 08 503 287 089 11 018 02 163 18 172 25 7871700ndash1815 12481 984 739 42 307 41 068 04 267 135 006 02 018 01 160 12 159 2 2141815ndash80 14390 161 828 6 290 33 086 08 347 115 124 07 023 02 182 18 207 28 2221880ndash1920 14426 2489 1038 69 371 32 080 05 400 102 121 09 022 02 206 20 170 19 1031920ndash50 6388 916 917 61 515 55 071 06 894 272 082 06 011 01 179 21 257 38 881950ndash70 9251 909 756 54 749 8 146 11 1757 885 152 24 015 02 154 25 103 11 631970ndash97 5812 727 590 51 395 4 120 12 318 68 120 12 007 01 070 08 088 15 97
nss 264 743 373 297 875
Beaudon and others Eastndashwest disparities of Spitsbergen environment 1075
similar cores providing all concentration data are log-transformed On average over the last three centuries thenumber of species with a dominant sea-salt source (Na+ ClndashK+ Mg2+ Table 2) is larger in Holtedahlfonna thanLomonosovfonna At both sites sulfate is the third largestcontributor to the ion budget although its proportion of thesum in Holtedahlfonna ice is only half that in Lomonosov-fonna The nss-sulfate contribution to the total sulfateconcentration is also on average much smaller on Holte-dahlfonna (55) than on Lomonosovfonna (74) Mooreand others (2012) estimate that the volcanic sulfate fractionon Holtedahlfonna is less than half that on Lomonosovfonna
The greater total amount of sea salt as well as the smallerfraction of nss-sulfate at Holtedahlfonna may reflect theshorter distance from the marine aerosol source to Holte-dahlfonna summit compared with Lomonosovfonna Themarine biogenic fraction of sulfate estimated by MSAconcentrations is surprisingly low at Holtedahlfonna withan average concentration less than half that of Lomonosov-fonna (005 and 012 meq Lndash1 respectively) This probablypoints to a difference in the primary productivity of themarine source implying two different marine origins withrespectively low and high primary productivity This latterpoint is discussed further in Section 35
The difference in the calcium budget and the relativeproportion of terrestrial calcium in the two ice cores alsoreveals the more proximal and influential sea-salt source forHoltedahlfonna While Kekonen and others (2005) reportthat over the common period between the cores (1700ndash1997) 88 of calcium in Lomonosovfonna ice is ofterrestrial origin we calculate that on Holtedahlfonna thisfraction is more limited and represents only 68 Never-theless this observation should be moderated when compar-ing the different periods For example Holtedahlfonnareceived on average about the same amount of terrestrialcalcium as Lomonosovfonna during most of the 18thcentury (1700ndash80 152 and 156 meq Lndash1 respectively) andtwice as much between 1950 and 1970 (072 and036meq Lndash1 respectively)
Proportions of ammonium and nitrate are slightly smallerin Holtedahlfonna than in Lomonosovfonna for the sameperiod
35 Biogenic source productivity
As an oxidation product of gaseous biogenic dimethylsulfide(DMS) emissions (Dacey and Wakeham 1986) MSA iscommonly used as a proxy for marine biogenic productivityIsaksson and others (2005a) suggested that sea-ice extentwas likely the dominant effect on the variability of MSAconcentrations in Lomonosovfonna ice and also hypothe-sized that the higher MSA concentration during the colder19th century could result from a change of source andorfrom more favorable growing conditions for the DMS-producing phytoplankton during the prevailing colderconditions For the 20th century OrsquoDwyer and others(2000) found that Lomonosovfonna MSA better correlatedwith Barents Sea surface temperature and ice cover thanwith the Greenland Sea conditions indicating that theamount of MSA deposited on Lomonosovfonna is very muchinfluenced by the conditions in the Barents Sea
Similarly to Lomonosovfonna the Holtedahlfonna corecontains more MSA on average during part of the cold period1700ndash1880 (007008 meq Lndash1) than during the 20thcentury (003005meq Lndash1) The MSA concentrations in
Holtedahlfonna remain lower than those in Lomonosovfonnathroughout the last three centuries suggesting a different andor less productive marine source influencing westernSpitsbergen The transition from the LIA to the warmer 20thcentury is more marked in Holtedahlfonna records with20th-century concentrations being 43 of LIA values than atLomonosovfonnawhenMSA concentrations dropped to 66of earlier levels (Fig 6a) These decreases slightly precede thechange in sea-ice cover in the Greenland Sea at 1880(Divine and others 2008) creating on the western side ofSpitsbergen year-round open-water conditions Figure 6bdisplays the maximum (April) and minimum (August) sea-sonal sea-ice extent anomalies for the Greenland Sea andshows the larger annual ice extent amplitude before 1885comparedwith the 20th century The reduction in annual sea-ice amplitude (ie the difference between April and Augustsea-ice extent) corresponds with the lowMSA concentrationsin Holtedahlfonna Correlation between the 10 year runningaverage time series of MSA and the 10 year running averageof the Greenland Sea April ice extent anomaly for the period1762ndash1880 is higher than with the Barents Sea ice extentanomaly coefficients are significantly different (046(p lt 005) and 010 respectively) and suggestive of aconnection between positive Greenland Sea ice anomaliesand high MSA levels at Holtedahlfonna during the LIA
These results may be expected as the more extensiveseasonally ice-covered western side of Svalbard during theLIA leads to increased production of meltwater therebystabilizing the water column in spring and summer whichmay have favoured biomass production in the euphotic zoneand thus enhanced release of DMS in the atmosphere (Strassand Nothig 1996 Sakshaug and Walsh 2000) A similarprocess also might have taken place in the Barents Sea(Isaksson and others 2006a) with a wider seasonally ice-free area creating a stronger DMS source on eastern Svalbardbeing recorded in Lomonosovfonna ice Records of higherMSA concentration for the 19th century in Holtedahlfonnaare in accordance with those from Greenland ice cores Anegative relationship between the Greenland Sea surfacetemperature and MSA concentrations in the 20D (southernGreenland) ice core was found by Whung and others (1994)over the period 1870ndash1950 and Legrand and others (1997)suggest that such a correlation also demonstrated for MSArecords from Summit central Greenland may result fromincreased sea-ice extent during cold periods causing higherDMS emissions in the atmosphere
The relationship between MSA and Greenland Sea iceextent as well as the MSA concentration difference betweenHoltedahlfonna and Lomonosovfonna seems to imply thatthe biogenic productivity of the Greenland Sea was weakerthan that of the Barents Sea during the 19th centuryHowever this does not rule out the possible contribution oflower-latitude air masses to the Holtedahlfonna MSA budgetThe MSA fraction of nss-sulfate is known to increase withlatitude and has often been used to investigate the possibleorigin of marine air masses (Bates and others 1992) This isbased on the fact that DMS oxidation by OH radicals (thedominant oxidant in a clean atmosphere) is temperature-dependent as the additional pathway producing MSA isfavored at low temperature (Hynes and others 1986 Seinfeldand Pandis 1998) Between 1700 and 1920 the MSAfraction ie MSA(MSA+nss-SO4) (Fig 6c) in Holtedahl-fonna is fairly consistently 3 lower than that of Lomono-sovfonna while the Greenland MSA fraction (10ndash20)
Beaudon and others Eastndashwest disparities of Spitsbergen environment1076
(Legrand and others 1997) is more similar to Lomonosov-fonna in the LIA than Holtedahlfonna The MSA fractionshows marked variability during the LIA compared with the20th century at Holtedahlfonna consistent with the muchreduced sea-ice cover in the Greenland Sea and especiallythe reduced amplitude of seasonal variations After 1920Lomonosovfonna and Holtedahlfonna have a very similarMSA fraction which is linked to the retreat of the sea-icemargin in the Barents Sea at that time (Divine and others2008) The Holtedahlfonna MSA fraction is negative or zerobefore 1730 This pattern in the Holtedahlfonna record could
be the consequence of a smaller difference between Apriland August sea-ice extents in the Greenland Sea at thebeginning of the 18th century which could have resultedfrom colder summers (see Section 32) and limited oceanheat loss in summer in the 1720s
The loss of ions through runoff is responsible for thenegative fraction seen after 1980 at Holtedahlfonna Thegenerally lower MSA fraction compared with Lomonosov-fonna either constitutes more evidence for a different marinebiogenic source influencing western Spitsbergen or points toan additional source of nss-sulfate for Holtedahlfonna which
Fig 6 Ten-year running average for Holtedahlfonna (black) and Lomonosovfonna (gray) of (a) MSA concentrations (b) April (blue) andAugust (orange) sea-ice extent anomaly for the Greenland Sea ice (Divine and Dick 2006 data are not available for every year) (note thedecrease in amplitude of seasonal variability in sea-ice extent at 1880) (c) MSA fraction with a mean of 8 for Holtedahlfonna prior to1880 and 1 after that (d) nss-sulfate (nssSO4) concentrations and (e) nitrate (NO3
ndash) note that the profiles are uncorrelated with MSA
Beaudon and others Eastndashwest disparities of Spitsbergen environment 1077
could be terrestrial biogenic continental (gypsum dust) orvolcanic Any significant volcanic contribution is unlikely asthe fraction of volcanic sulfate in Holtedahlfonna is very low(14) in comparison with that of Lomonosovfonna (45)(Moore and others 2006 2012) or Greenland (57)(Legrand and others 1997) We can use wavelet coherence(WTC Grinsted and others 2004) to investigate the relation-ship between MSA and nss-sulfate (Fig 6d) variationsBetween 1700 and 1880 (Fig 7) the time series are highlycoherent (WTCgt08) and in phase at almost all periods Thiscontrasts with a smaller and more disjointed significant areain the WTC plot for nss-calcium and nss-sulfate (Fig 7)
The correlation between MSA and nss-sulfate argues infavor of a dominant biogenic source of nss-sulfate inHoltedahlfonna during the 18th and 19th centuries SinceDMS can also be oxidized by radicals other than OHproducing sulfur dioxide (SO2) or sulfate instead of MSA theinterpretation of the MSA fraction in terms of the biogenicsource latitude (or temperature) is not straightforward whenthe oxidative capacity of the atmosphere changes The mostefficient atmospheric oxidants of DMS are OH BrO andnitrate whereas others such as Cl IO andO3 are less efficient(Barnes and others 2006) Yet Whung and others (1994)argue that despite the substantial NOx levels in the Arcticatmosphere during the industrial period NO3
ndash oxidant doesnot control the MSA concentration in Greenland ice coresbecause nitrate is photolyzed before DMS emissions reachtheir maximum in springsummer Similarly in the Holte-dahlfonna core the sharp increase in nitrate (NOx) (seeFig 9e further below) did not lead to a decrease in MSA Insummer only OH and BrO may compete efficiently inoxidizing the DMS For instance recent measurements ofBrO made over 1 year by Saiz-Lopez and others (2007) atHalley Antarctica indicate a mean level of 3 pptv during
JanuaryndashMarch Such high BrO levels in summer make theBrO reaction on DMS producing MSA four times faster thanthat with OH (addition pathway) (Read and others 2008)Since numerous studies suggest that the bromine chemistry ispromoted by sea-ice coverage we cannot exclude thepossibility that the decrease in sea ice was accompaniedby decreasing halogen chemistry and may have contributedto the decrease of the MSA fraction between 1700ndash1880 andrecent decades Additionally the increases of nss-sulfate aresimilar at Holtedahlfonna and Lomonosovfonna (Fig 6dTable 2) so we ascribe the sharp change of MSA inHoltedahlfonna at 1880 to the rapid decline in sea-icecover in the Greenland Sea and the relatively largertemperature rise at the end of the LIA than occurred in thewider North Atlantic (Engelsen and others 2002)
36 Ammonium variability
Lomonosovfonna and Holtedahlfonna display divergentbehavior of ammonium around the end of the LIA (Fig 4)The 10 year running mean ammonium values in theLomonosovfonna core follow a decreasing trend from1900 to 1940 before reflecting the impact of anthropogenicpollution in the 1950s (Fig 8a) (Kekonen and others 2002)In contrast Holtedahlfonna ammonium concentrations riseby a factor of 3 starting in 1880 Explanations for the earlierrise of ammonium concentration could be that it eitherreflects a more efficient ammonium transport to Holtedahl-fonna or that during the period 1880ndash1940 Holtedahlfonnareceived an additional source of ammonium compared withLomonosovfonna In relation to the regional climate com-ponent discussed in Section 31 local wetland formed bythe reduction of snow-covered areas at the end of theLIA might have constituted a source of local gaseousammonia (NH3 a precursor of ammonium) influencing the
Fig 7 Wavelet coherency and phase in Holtedahlfonna between (a) MSA and nss-sulfate and (b) nssCa and nss-sulfate The thick blackcontour designates the 5 significance level against red noise and the thin black curve is the cone of influence Arrows pointing to the rightindicate in-phase relative relationship
Beaudon and others Eastndashwest disparities of Spitsbergen environment1078
Holtedahlfonna ammonium budget However the lack ofdata on wetlands for the Svalbard region makes itimpossible to verify this hypothesis
Jickells and others (2003) used stable N isotopes inammonium to derive sources of ammonium However wehave only ion concentration data so we use an indirectapproach To investigate the temporal evolution of thecontributions to the ammonium budget along the core weperformed a multiple linear regression (MLR) betweenammonium and other ions (Fig 8b) This innovativeprocedure is essentially the same as that used to evaluatethe sulfate budget in Lomonosovfonna described by Mooreand others (2006) and the first steps of finding the volcanicsulfate residuals (Moore and others 2012 Section 23) butrather than modeling sulfate as a function of the other ionshere we target ammonium by fitting the other ions
During the pre-industrial period until 1880 nitrate is themost significant cofactor with ammonium indicating theexistence of natural ammonium nitrate (NH4NO3) acompound formed more favorably in cold conditions (Battyeand others 2003 Teinila and others 2003) The NorthAmerican soil vegetation and biomass-burning NH3 emis-sions constitute the main pre-industrial source of ammoniumfor Greenland and reflect the propensity of polar ice sheetsto sample the free troposphere where NH3 and ammoniumresidence times allow their long-range transport (Fuhrer andothers 1996) Yet the oceanic source of NH3 in the Arctic isconsidered non-negligible especially in winter (Fisher and
others 2011) Jickells and others (2003) provided evidencefor a substantial marine ammonia winter source The oceanconstitutes a net source of NHx (ie NH3 and NH4
+) to thecontinents during pre-industrial times with smaller sea-water NHx concentrations in regions of low primaryproductivity (nutrient-limited communities being moreefficient at utilizing recycled nitrogen and thus maintaininga lower ambient concentration Spokes and others 2000Johnson and others 2008 and references therein)
Depending on which of the natural sources (oceanic orcontinental) dominates the Svalbard ammonium budget thelower pre-industrial ammonium concentration measured inHoltedahlfonna ice compared with Lomonosovfonna could(1) be an additional argument in favor of a cold and lowproductive marine source for western Spitsbergen comparedwith eastern Spitsbergen which is more influenced by theNorth Atlantic where NH3 seandashair fluxes are one order ofmagnitude higher (Johnson and others 2008) or (2) indicatethat Holtedahlfonna is less influenced by the free tropo-sphere than Lomonosovfonna After 1880 the nitratecovariation and fractional contribution to ammoniumbecomes insignificant and none of the other ions becomesa consistent replacement in the MLR (Fig 8b) Over a periodwhen melting impact rises constantly this probably reflectsthe specific elution-resistant behavior of ammonium(Table 1) This may be the case during the 1980s whenhigher ammonium concentrations are not correlated withnitrate or sulfate (Fig 4)
Fig 8 (a) Ten year running average concentrations of ammonium (meq Lndash1) in Holtedahlfonna (black) and Lomonosovfonna (gray) cores Theshaded area indicates the Little Ice Age (LIA) termination (b) Holtedahlfonna ammonium multiple linear regression (MLR) (i) sample-by-sample ammonium ion concentration profile (blue dotted curve) and the F statistic for the 100 points windowed MLR (ii) contributions ofeach species in the MLR to the ammonium concentration (see Moore and others (2006) for method details) the ion curves are only plottedwhen their contribution is significant at the 95 level Most of the record is dominated by covariation with nitrate (light green) After 1880no ion stands out as generally covarying with ammonium though sometimes both sodium (Na+ turquoise) and sulfate (SO4
2ndash purple) areimportant factors
Beaudon and others Eastndashwest disparities of Spitsbergen environment 1079
Virkkunen and others (2007) showed that the chemicalfingerprint of anthropogenic ammonia (NH3) sulfur dioxide(SO2) and nitrogen oxides (NOx) (the main constituents ofthe Arctic haze) was present in 200102 snowpack onHoltedahlfonna but absent on Lomonosovfonna The rise ofammonium in Holtedahlfonna records starting in 1880could result from mid-latitude pollution reaching the Arcticin late winter when meridional transport intensifies (Iversenand Joranger 1985) The global NOx emissions started torise in the 1860s (Klimenko and others 2000) Anthropo-genic ammonium pollution is also detected from 1870 inthe Colle Gnifetti (ItalySwitzerland) ice core (Doscher andothers 1996) and at least from 1920 in Col du DomeFrance (Fagerli and others 2007) while no increasing trendis visible before the 1940ndash1950s in Greenland (Fuhrer andothers 1996) Qomolangma (Mount Everest Hou andothers 2003) or Lomonosovfonna (Kekonen and others2005) records
To account for the absence of Arctic haze from Lomono-sovfonna snow Virkkunen and others (2007) invoked geo-graphical factors such as the orientation of the surroundingfjords Here we advocate the respective positions of the twoglaciers relative to the top of the atmospheric boundary layerwithin which neutralized pollutants are transported fromcontinental source areas in late winter The acidity of Arctichaze aerosols depends on the availability of ammonia toneutralize sulfate Using aircraft and surface aerosol data(including data from Zeppelin station) Fisher and others(2011) investigated the source contributing to ammoniumsulfate and aerosol acidity through the depth of the Arctictroposphere over the winterndashspring season For the winterseason they found that sulfate and ammonium sources aremore stratified than later in spring Aerosols in the free
troposphere are more acidic and are dominated by sulfate(originating mostly from east Asia) whereas more abundantand neutralized aerosols (from west Asia and Europe) remainwithin the boundary layer
As shown in Figure 9 the shorter distance of Holtedahl-fonna to the quasi-permanent open sea (the Greenland Sea)could facilitate oceanic heat advection to the ice cap insummer and in winter allow some vertical convectionthereby weakening the temperature inversion gradient andslightly raising its upper boundary placing Holtedahlfonnawithin the inversion layer (Solberg and others 1996Treffeisen and others 2007) Conversely the presence ofice-covered sea on the eastern side of Spitsbergen wouldprovoke an intensive radiative cooling of the lower tropo-sphere leading to the formation of a very stable and hencethin inversion layer during the polar night (Wu and others2004 Koenigk and others 2009) In those conditionsLomonosovfonna would be located above the thermalinversion layer and would most likely collect pollution fromthe more acidic free troposphere in winter This contrastswith the summer configuration when the northern positionof the sea-ice margin makes the Barents Sea waterstratification propitious to algal bloom which then forms alocal source of MSA (and sea salt) for Lomonosovfonna (seeSection 35) The atmospheric vertical stratification of acidityin winter could then also explain why Svalbardrsquos highestsulfate and greater acidity levels are recorded in Lomono-sovfonna (Kekonen and others 2005) (Fig 7)
4 CONCLUSIONS
We have presented ion chemical data for the past 300 yearsfrom Holtedahlfonna and compared them with recordsextracted from the Lomonosovfonna core to illustrate site-specific climatic and glaciological factors and better esti-mate the local influence of environmental factors on icerecords in the Svalbard setting Despite the fact that the meltindex is on average higher in Holtedahlfonna melting isresponsible for 49 of the variance in ion concentrationwhich is almost the same as that estimated for theLomonosovfonna ice core (55) This is likely because ofthe formation of thin layers of ice in the annual snowpackwhich act as barriers to the deeper elution of ions helping topreserve a multi-year resolution environmental recordHoltedahlfonna chemical melt index (log([Na+][Mg2+])) isa better proxy for Svalbard 20th-century summer airtemperatures than provided by other ice cores fromthe archipelago
A strong local response is also shown in the spatial andtemporal variability of chemical species As expected wefound that Holtedahlfonna ice contains more sea salt due toits proximity to the Greenland Sea which is ice-free almostthroughout the year The lower MSA and ammonium levelsmeasured for the LIA compared with those measured inLomonosovfonna also argue in favour of the influence of alocal marine source with lower primary productivity (acooler source) during this period The good correlationbetween Greenland Sea ice extent and Holtedahlfonnabiogenic sulfur record (MSA) supports this hypothesis andreveals the complex airndashseandashice interactions that character-ize the Greenland Sea compared with other Nordic seas(Kvingedal 2005)
In addition to providing a proximal source of warmthmoisture sea salt and biogenic sulfur to western Svalbard
Fig 9 (a) Map of Svalbard and surrounding seas showing present-day typical sea-ice conditions in winter (source httpretrometnokyst_og_haviskarthtml) The black double-headed arrow marks thewestndasheast profile section of Spitsbergen through Holtedahlfonna(HF) and Lomonosovfonna (LF) represented in (b) (b) WinterndashspringArctic haze situation and the vertical stratification of aerosol acidity(Fisher and others 2011) The process shown in this figure appliesfor the present time
Beaudon and others Eastndashwest disparities of Spitsbergen environment1080
the low ice concentration of the Greenland Sea favors thealtitudinal dispersal of tropospheric pollution The study ofthe ammonium budget suggests that either the open seaprovides a winter source of ammonium or just as consist-ently that the glaciers of the western part of Spitsbergensuch as Holtedahlfonna may better reflect the troposphericboundary layer pollution burden than do eastern glacierswhich are more representative of the free troposphere inwinter The small sea-ice extent in the Greenland Seastrongly influences the height of the winter inversion layerand thus the delivery of more neutralized Arctic hazeaerosols to the glacier As Arctic warming progresses wemay expect drastic retreat of the Barents Sea seasonal icecover The analysis of the Holtedahlfonna ice core foretellshow glaciochemical signals from eastern Svalbard glaciers(such as Lomonosovfonna) could be altered and howwinterndashspring pollution would be mixed higher in theArctic troposphere
ACKNOWLEDGEMENTS
We thank the Norwegian Polar Institute the Dutch ScienceFoundation (NWO) and the Swedish Science Council (VR) forfunding the ice-core drilling and Kristiina Virkkunen andVenkata Gandikota for the primary cutting of the ice coreWealso thank the Finnish Forest Research Institute RovaniemiResearch Unit for the use of the laboratory facilities and theAcademy of Finland and the ARKTIS Graduate School forproviding financial support for sample analysis This researchwas partially supported by Chinarsquos National Key ScienceProgram for Global Change Research (No 2010CB950504)by the European Union Regional Development Foundationproject VeeOBS (32080211-0043) and by National NaturalScience Foundation of China (NSFC) grant No 41076125
REFERENCES
Barnes I Hjorth J and Mihalopoulos N (2006) Dimethyl sulfide anddimethyl sulfoxide and their oxidation in the atmosphere ChemRev 106(3) 940ndash975 (doi 101021cr020529)
Bates TS Calhoun JA and Quinn PK (1992) Variations in themethanesulfonate to sulfate molar ratio in submicrometermarine aerosol particles over the south Pacific OceanJ Geophys Res 97(D9) 9859ndash9865 (doi 10102992JD00411)
Battye W Aneja VP and Roelle PA (2003) Evaluation and improve-ment of ammonia emissions inventories Atmos Environ 37(27)3873ndash3883 (doi 101016S1352-2310(03)00343-1)
Bengtsson L Semenov VA and Johannessen OM (2004) The earlytwentieth-century warming in the Arctic ndash a possible mech-anism J Climate 17(20) 4045ndash4057 (doi 1011751520-0442(2004)017lt4045TETWITgt20CO2)
Curran MAJ and 6 others (2002) Post-depositional movement ofmethanesulphonic acid at Law Dome Antarctica and theinfluence of accumulation rate Ann Glaciol 35 333ndash339 (doi103189172756402781816528)
Dacey JWH and Wakeham SG (1986) Oceanic dimethylsulfideproduction during zooplankton grazing on phytoplanktonScience 233(4770) 1314ndash1316 (doi 101126science23347701314)
Davies TD Vincent CE and Brimblecombe P (1982) Preferentialelution of strong acids from a Norwegian ice cap Nature300(5888) 161ndash163 (doi 101038300161a0)
Divine DV and Dick C (2006) Historical variability of sea-ice edgeposition in the Nordic Seas J Geophys Res 111(C1) C01001(doi 1010292004JC002851)
Divine DV and 8 others (2008) Deuterium excess record from asmall Arctic ice cap J Geophys Res 113(D19) D19104 (doi1010292008JD010076)
Divine D and 7 others (2011) Thousand years of winter surface airtemperature variations in Svalbard and northern Norwayreconstructed from ice-core data Polar Res 30 7379 (doi103402polarv30i07379)
Doscher A Gaggeler HW Schotterer U and Schwikowski M (1996)A historical record of ammonium concentrations from a glacierin the Alps Geophys Res Lett 23(20) 2741ndash2744 (doi10102996GL02615)
Eichler A Schwikowski M and Gaggeler HW (2001) Meltwater-induced relocation of chemical species in Alpine firnTellus 53B(2) 192ndash203 (doi 101034j1600-08892001d01-15x)
Engelsen O Hegseth EN Hop H Hansen E and Falk-Petersen S(2002) Spatial variability of chlorophyll-a in the Marginal IceZone of the Barents Sea with relations to sea ice andoceanographic conditions J Mar Syst 35(1ndash2) 79ndash97 (doi101016S0924-7963(02)00077-5)
Fagerli H Legrand M Preunkert S Vestreng V Simpson D andCerqueira M (2007) Modeling historical long-term trends ofsulfate ammonium and elemental carbon over Europe acomparison with ice-core records in the Alps J GeophysRes 112(D23) D23S13 (doi 1010292006JD008044)
Fisher DA Koerner RM Paterson WSB Dansgaard W GundestrupN and Reeh N (1983) Effect of wind scouring on climatic recordsfrom ice-core oxygen-isotope profiles Nature 301(5897)205ndash209 (doi 101038301205a0)
Fisher DA and 12 others (1998) Penny Ice Cap cores Baffin IslandCanada and the Wisconsinan Foxe Dome connection twostates of Hudson Bay ice cover Science 279(5351) 692ndash695(doi 101126science2795351692)
Fisher JA and 17 others (2011) Sources distribution and acidity ofsulfatendashammonium aerosol in the Arctic in winterndashspringAtmos Environ 454(39) 7301ndash7318 (doi 101016jatmosenv201108030)
Fuhrer K Neftel A Anklin M Staffelbach T and Legrand M (1996)High-resolution ammonium ice-core record covering a com-plete glacialndashinterglacial cycle J Geophys Res 101(D2)4147ndash4164 (doi 10102995JD02903)
Goto-Azuma K and Koerner RM (2001) Ice-core studies ofanthropogenic sulfate and nitrate trends in the ArcticJ Geophys Res 106(D5) 4959ndash4969 (doi 1010292000JD900635)
Goto-Azuma K and 6 others (1995) An ice-core chemistry recordfrom Snoslashfjellafonna northwestern Spitsbergen Ann Glaciol21 213ndash218
Grinsted A Moore JC and Jevrejeva S (2004) Application of thecross wavelet transform and wavelet coherence in geophysicaltime series Nonlinear Process Geophys 11(5ndash6) 561ndash566(doi 105194npg-11-561-2004)
Grinsted A Moore JC Pohjola V Martma T and Isaksson E (2006)Svalbard summer melting continentality and sea-ice extent fromthe Lomonosovfonna ice core J Geophys Res 111(D7)D07110 (doi 1010292005JD006494)
Groves DG and Francis JA (2002) Variability of the Arcticatmospheric moisture budget from TOVS satellite dataJ Geophys Res 107(D24) 4785 (doi 1010292002JD002285)
Grumet NS Wake CP Zielinski GA Fisher D Koerner R and JacobsJD (1998) Preservation of glaciochemical time-series in snowand ice from the Penny Ice Cap Baffin Island Geophys ResLett 25(3) 357ndash360 (doi 10102997GL03787)
Hou S and Qin D (2002) The effect of post-depositional process onthe chemical profiles of snow pits in the percolation zone ColdReg Sci Technol 34(2) 111ndash116 (doi 101016S0165-232X(01)00065-9)
Hou S Qin D Zhang D Kang S Mayewski PA and Wake CP (2003)A 154 a high-resolution ammonium record from the RongbukGlacier north slope of Mt Qomolangma (Everest) TibetndashHimal
Beaudon and others Eastndashwest disparities of Spitsbergen environment 1081
region Atmos Environ 37(5) 721ndash729 (doi 101016S1352-2310(02)00582-4)
Hynes AJ Wine PH and Semmes DH (1986) Kinetics andmechanism of hydroxyl reactions with organic sulfidesJ Phys Chem 90(17) 4148ndash4156
Iizuka Y Igarashi M Kamiyama K Motoyama H and Watanabe O(2002) Ratios of Mg2+Na+ in snowpack and an ice core atAustfonna ice cap Svalbard as an indicator of seasonalmelting J Glaciol 48(162) 452ndash460 (doi 103189172756502781831304)
Isaksson E and 10 others (2005a) Two ice-core 18O records fromSvalbard illustrating climate and sea-ice variability over the last400 years Holocene 15(4) 501ndash509 (doi 1011910959683605hl820rp)
Isaksson E Kekonen T Moore J and Mulvaney R (2005b) Themethanesulphonic acid (MSA) record in a Svalbard icecore Ann Glaciol 42 345ndash351 (doi 103189172756405781812637)
Iversen T and Joranger E (1985) Arctic air pollution and large scaleatmospheric flows Atmos Environ 19(12) 2099ndash2108 (doi1010160004-6981(85)90117-9)
Jickells TD and 7 others (2003) Isotopic evidence for a marineammonia source Geophys Res Lett 30(7) 1374 (doi1010292002GL016728)
Johnson MT and 9 others (2008) Field observations of the oceanndashatmosphere exchange of ammonia fundamental importance oftemperature as revealed by a comparison of high and lowlatitudes Global Biogeochem Cycles 22(GB1) GB1019 (doi1010292007GB003039)
Kameda T Takahashi S Goto-Azuma K Kohshima S Watanabe Oand Hagen JO (1993) First report of ice core analyses andborehole temperatures on the highest icefield on westernSpitsbergen in 1992 Bull Glacier Res 11 51ndash61
Keene WC Pszenny AAP Galloway JN and Hawley ME (1986) Sea-salt corrections and interpretation of constituent ratios in marineprecipitation J Geophys Res 91(D6) 6647ndash6658 (doi101029JD091iD06p06647)
Kekonen T Moore JC Mulvaney R Isaksson E Pohjola V and Vande Wal RSW (2002) An 800 year record of nitrate from theLomonosovfonna ice core Svalbard Ann Glaciol 35 261ndash265 (doi 103189172756402781817121)
Kekonen T Peramaki P and Moore JC (2004) Comparison ofanalytical results for chloride sulfate and nitrate obtained fromadjacent ice core samples by two ion chromatographic methodsJ Environ Monitor 6(2) 147ndash152 (doi 101039B306621E)
Kekonen T and 6 others (2005) The 800 year long ion record fromthe Lomonosovfonna (Svalbard) ice core J Geophys Res110(D7) D07304 (doi 1010292004JD005223)
Klimenko VV Klimenko AV and Tereshin AG (2000) Reducingemissions of trace greenhouse gases as an alternative to reducingemissions of carbon dioxide part II Therm Eng 47(6) 476ndash483
Koenigk T Mikolajewicz U Jungclaus JH and Kroll A (2009) Sea icein the Barents Sea seasonal to interannual variability andclimate feedbacks in a global coupled model Climate Dyn32(7ndash8) 1119ndash1138 (doi 101007s00382-008-0450-2)
Koerner RM (1979) Accumulation ablation and oxygen isotopevariations on the Queen Elizabeth Islands ice caps CanadaJ Glaciol 22(86) 25ndash41
Kreutz KJ Mayewski PA Whitlow SI and Twickler MS (1998)Limited migration of soluble ionic species in a Siple DomeAntarctica ice core Ann Glaciol 27 371ndash377
Kvingedal B (2005) Sea ice extent and variability in the Nordic Seas1967ndash2002 In Drange H Dokken T Furevik T Gerdes R andBerger W eds The Nordic seas an integrated perspective (Geo-physical Monograph Series 158) American Geophysical UnionWashington DC 38ndash49
Lefauconnier B Hagen JO and Rudant JP (1994) Flow speed andcalving rate of Kongsbreen glacier Svalbard using SPOT imagesPolar Res 13(1) 59ndash65 (doi 101111j1751-83691994tb00437x)
Legrand M and 6 others (1997) Sulfur-containing species (methane-sulfonate and SO4) over the last climatic cycle in the GreenlandIce Core Project (central Greenland) ice core J Geophys Res102(C12) 26 663ndash26 679 (doi 10102997JC01436)
Matoba S Narita H Motoyama H Kamiyama K and Watanabe O(2002) Ice core chemistry of Vestfonna Ice Cap in SvalbardNorway J Geophys Res 107(D23) 4721 (doi 1010292002JD002205)
Mayewski PA and 7 others (1993) Ice-core sulfate from threeNorthern Hemisphere sites source and temperature forcingimplications Atmos Environ 27(17ndash18) 2915ndash2919
Moore JC and Grinsted A (2009) Ion fractionation and percolationin ice cores with seasonal melting In Hondoh T ed Physics ofice core records II (Supplement Issue of Low TemperatureScience 68) Hokkaido University Press Sapporo 381ndash386
Moore JC Grinsted A Kekonen T and Pohjola V (2005) Separationof melting and environmental signals in an ice core withseasonal melt Geophys Res Lett 32(10) L10501 (doi1010292005GL023039)
Moore JC Kekonen T Grinsted A and Isaksson E (2006) Sulfatesource inventories from a Svalbard ice-core record spanning theIndustrial Revolution J Geophys Res 111(D15) D15307 (doi1010292005JD006453)
Moore JC and 6 others (2012) Statistical extraction of volcanicsulphate from nonpolar ice cores J Geophys Res 117(D3)D03306 (doi 1010292011JD016592)
Morison J Aagaard K and Steele M (2000) Recent environmentalchanges in the Arctic a review Arctic 53(4) 359ndash371
Mulvaney R Pasteur EC Peel DA Saltzman ES and Whung PY(1992) The ratio of MSA to non-sea-salt sulphate in AntarcticPeninsula ice cores Tellus 44B(4) 295ndash303 (doi 101034j1600-08891992t01-2-00007x)
Nye JF (1963) Correction factor for accumulation measured by thethickness of the annual layers in an ice sheet J Glaciol 4(36)785ndash788
OrsquoDwyer J and 7 others (2000) Methanesulfonic acid in a Svalbardice core as an indicator of ocean climate Geophys Res Lett27(8) 1159ndash1162 (doi 1010291999GL011106)
Overpeck J and 17 others (1997) Arctic environmental change ofthe last four centuries Science 278(5341) 1251ndash1256 (doi101126science27853411251)
Pasteur EC and Mulvaney R (2000) Migration of methanesulphonate in Antarctic firn and ice J Geophys Res105(D9) 11 525ndash11 534 (doi 1010292000JD900006)
Pinglot J-F and 6 others (1999) Accumulation in Svalbard glaciersdeduced from ice cores with nuclear tests and Chernobylreference layers Polar Res 18(2) 315ndash321 (doi 101111j1751-83691999tb00309x)
Pohjola V and 7 others (2002a) Effect of periodic melting ongeochemical and isotopic signals in an ice core on Lomono-sovfonna Svalbard J Geophys Res 107(D4) 4036 (doi1010292000JD000149)
Pohjola VA and 6 others (2002b) Reconstruction of three centuriesof annual accumulation rates based on the record of stableisotopes of water from Lomonosovfonna Svalbard AnnGlaciol 35 57ndash62 (doi 103189172756402781816753)
Read KA and 10 others (2008) DMS and MSA measurements in theAntarctic Boundary Layer impact of BrO on MSA productionAtmos Chem Phys 8(11) 2985ndash2997 (doi 105194acp-8-2985-2008)
Ruggirello RM and 8 others (2010) Current use and legacy pesticidedeposition to ice caps on Svalbard Norway J Geophys Res115(D18) D18308 (doi 1010292010JD014005)
Saiz-Lopez A and 6 others (2007) Boundary layer halogens incoastal Antarctica Science 317(5836) 348ndash351 (doi 101126science1141408)
Sakshaug E and Walsh J (2000) Marine biology biomass product-ivity distributions and their variability in the Barents and BeringSeas In Nuttall M and Callaghan TV eds The Arctic environ-ment people policy Harwood Academic Amsterdam 161ndash196
Beaudon and others Eastndashwest disparities of Spitsbergen environment1082
Samuelsson H (2001) Distribution of melt layers on the ice fieldLomonosovfonna Spitsbergen (MSc thesis University ofUppsala)
Seinfeld JH and Pandis SN (1998) Atmospheric chemistry andphysics from air pollution to climate change John Wiley ampSons New York
Sjogren B and 6 others (2007) Determination of firn density in icecores using image analysis J Glaciol 53(182) 413ndash419 (doi103189002214307783258369)
Solberg S Schmidbauer N Semb A Stordal F and Hov Oslash (1996)Boundary-layer ozone depletion as seen in the NorwegianArctic in spring J Atmos Chem 23(3) 301ndash332 (doi 101007BF00055158)
Sommer W (2005) Reconstruction of surface temperature variationsfrom temperaturemeasurements along amedium-depth boreholeat Holtedahlfonna Svalbard (BSc thesis University of Utrecht)
Spokes LJ Yeatman SG Cornell SE and Jickells TD (2000) Nitrogendeposition to the eastern Atlantic Ocean The importance ofsoutheasterly flow Tellus B 52(1) 37ndash49 (doi 101034j1600-0889200000062x)
Strass VH and Nothig EM (1996) Seasonal shifts in ice edgephytoplankton blooms in the Barents Sea related to the watercolumn stability Polar Biol 16(6) 409ndash422
Teinila K Hillamo R Kerminen VM and Beine HJ (2003) Aerosolchemistry during the NICE dark and light campaigns AtmosEnviron37(4) 563ndash575 (doi 101016S1352-2310(02)00826-9)
Treffeisen R Krejci R Strom J Engvall AC Herber A and ThomasonL (2007) Humidity observations in the Arctic troposphere overNy-Alesund Svalbard based on 15 years of radiosonde dataAtmos Chem Phys 7(10) 2721ndash2732 (doi 105194acp-7-2721-2007)
Van deWal RSWand 6 others (2002) Reconstruction of the historicaltemperature trend from measurements in a medium-lengthborehole on the Lomonosovfonna plateau Svalbard AnnGlaciol 35 371ndash378 (doi 103189172756402781816979)
Van der Wel LG and 8 others (2011) Using high-resolution tritiumprofiles to quantify the effects of melt on two Spitsbergen icecores J Glaciol 57(206) 1087ndash1097 (doi 103189002214311798843368)
Virkkunen K (2004) Snowpit studies in 2001ndash2002 in Lomonosov-fonna Svalbard (MSc thesis University of Oulu)
Virkkunen K and 6 others (2007) Warm summers and ionconcentrations in snow comparison of present day withMedieval Warm Epoch from snow pits and an ice core fromLomonosovfonna Svalbard J Glaciol 53(183) 623ndash634 (doi103189002214307784409388)
Watanabe O and 7 others (2001) Studies on climatic andenvironmental changes during the last few hundred years usingice cores from various sites in Nordaustlandet Svalbard MemNatl Inst Polar Res Spec Iss 54 227ndash242
Weiler K Fischer H Fritzsche D Ruth U Wilhelms F and Miller H(2005) Glaciochemical reconnaissance of a new ice core fromSevernaya Zemlya Eurasian Arctic J Glaciol 51(172) 64ndash74(doi 103189172756505781829629)
Whung PY Saltzman ES Spencer MJ Mayewski PA and Gundes-trup N (1994) Two-hundred-year record of biogenic sulfur in asouth Greenland ice core (20D) J Geophys Res 99(D1)1147ndash1156 (doi 10102993JD02732)
Wu B Wang J and Walsh J (2004) Possible feedback of winter seaice in the Greenland and Barents Seas on the local atmosphereMon Weather Rev 132(7) 1868ndash1876 (doi 1011751520-0493(2004)132lt1868PFOWSIgt20CO2)
MS received 30 October 2012 and accepted in revised form 12 July 2013
Beaudon and others Eastndashwest disparities of Spitsbergen environment 1083
time period and using statistical methods we discuss thedifferences in their respective ionic budget focusing onbiogenic sulfur and ammonium
2 SITE DESCRIPTION AND DATING
21 Glaciological characteristics
Holtedahlfonna ice field is the largest ice field (300 km2) innorthwestern Spitsbergen island Svalbard Norway 40 kmfrom the Ny-Alesund and Zeppelinfjellet stations and 100 kmnorthwest of Lomonosovfonna ice cap (1255m asl)(Fig 1) In April 2005 a 125m long ice core was drilledusing an electromechanical corer on Holtedahlfonna
(7988rsquo15rsquoN 13816rsquo20rsquo E 1150masl) from a saddle pointwhere the horizontal ice-flow velocity is expected to beminimal (Lefauconnier and others 1994 Sjogren and others2007) The ice core did not reach bedrock Ice depths aroundthe core site were obtained by radar sounding using a pulseradar with a center frequency of 10MHz The basal topog-raphy at the core site is extremely rugged (Fig 2a) with radar-derived ice depths varying from about 100 to 250m for datawithin 50m of the core site (Fig 2b) The imprecisely knowndepth complicates the dating of the ice core (see Section 23)The bottom temperature in the borehole was ndash338C hencethe whole core is cold ice (Fig 3a) Ice temperature measuredin the borehole features a maximum of ndash048C at 15m depth
Fig 1 (a) Map of Svalbard showing Holtedahlfonna ice-core site and Lomonosovfonna ice cap The dotted line segments represent themedian spring sea-ice extent over the period 1979ndash2000 (source httpnsidcorgdataseaice_indexarchivesindexhtml) (b) Holtedahl-fonna with the location of the drilling sites for the long 2005 core (red circle) the Snoslashfjellafonna core (Goto-Azuma and others 1995 greentriangle) and the firn core 2008 (orange triangle)
Beaudon and others Eastndashwest disparities of Spitsbergen environment1070
(Sommer 2005) Latent heat from refreezing of percolatingmeltwater is assumed to produce the thermal maximum at15m and is expected to impact chemistry as discussed inSection 32
22 Sampling and analysis
On average 60 cm long ice-core pieces were retrieved andpacked in clean plastic bags placed in insulated boxes andtransported under frozen conditions to the Norwegian PolarInstitute Tromsoslash Norway where dielectric profiling (DEP)and high-resolution density measurements were performedalong the entire core (Sjogren and others 2007) beforesubsampling for chemical measurements
In a cold room parallel-sided sections of the core were cutand distributed for tritium (Van der Wel and others 2011)oxygen isotope (Divine and others 2011) organic contam-inant (Ruggirello and others 2010) and ion measurements(this study) for which rectangular sections were collectedfrom the inner part of the core At the Finnish Forest Institute(Rovaniemi research station) the core pieces as well as blanksmade from ultrapure Milli-Q water were subsampled into10ndash20 cm long increments A total of 740 samples weremelted at room temperature in a clean room just before beinganalyzed for major water-soluble ions (Na+ NH4
+ K+ Mg2+Ca2+ CH3SO3
ndash Clndash SO42ndash NO3
ndash) via Dionex ion-sup-pressed chromatography (DX-120 series) equipped withDionex Ionpack CS12 columns for the cation channel andwith Dionex Ionpack AS15 columns for the anion channelKekonen and others (2002 2004) and Virkkunen (2004)describe the analytical methods in detail Mean blank values(12 samples) obtained were 009 08 ng gndash1 for sodium0815 ng gndash1 for ammonium 02 01 ng gndash1 for potas-sium 008009 ng gndash1 for magnesium 05 07 ng gndash1 forcalcium 0030 09ng gndash1 for methanesulfonic acid (MSA)101 07 ng gndash1 for chloride 09 06 ng gndash1 for sulfate and0209 ng gndash1 for nitrate Non-sea-salt (nss) fractions ofcalcium sulfate magnesium and chloride were calculatedusing a conservative sea-salt species ie sodium as the sea-salt indicator (Keene and others 1986)
23 Dating
Previous studies using the Holtedahlfonna ice-core data(Sjogren and others 2007 Ruggirello and others 2010 Vander Wel and others 2011) used an agendashdepth scale based on
Fig 2 (a) Topographical map of the drilling site (black circle) area showing radar survey tracks The black arrows and the dashed black lineshow the track corresponding to the radargram shown in (b) (b) Radar profile passing over the drilling site (dashed red line)
Fig 3 Temperature profile (gray dashed curve) measured along theborehole (Sommer 2005) Agendashdepth scale combining the Nye agescale assuming a glacier thickness of 300m with an automatedd18O cycle counting (black dashed curve) Nye age scale (for aglacier thickness of 250m) used in Van der Wel and others (2011)(red curve) Age scale developed by Moore and others (2012) (greencurve) using five volcanic reference horizons (blue triangles) withcycle counting and employed in this study The table (inset) showsthe average accumulation rates calculated for intervals betweenvolcanic reference horizons and decompressed using a Nye modelwith 300m ice depth
Beaudon and others Eastndashwest disparities of Spitsbergen environment 1071
the Nye thinning model (Nye 1963) constrained by thedepth of the 1963 radioactivity fallout layer at 285m depth(Van der Wel and others 2011) giving a constant accumu-lation rate (050mwe andash1 for 1963ndash2005) together with arange of plausible ice thicknesses (Fig 3b) Divine andothers (2011) used automated counting of annual d18O(Pohjola and others 2002b) layers to derive variableaccumulation rates The rate of thinning of layers is bestmatched with the Nye agendashdepth model having a glacierthickness of 300m which is 150m more than the icethickness estimation used in earlier studies (Sjogren andothers 2007) Ice thicknesses up to 250m are found withintens of meters of the drilling site (Fig 2)
Recently a dating method based on statistical extractionof historically known volcanic eruptions was used (Mooreand others 2012) To do this the sulfate profile is fitted to allother ion species measured in the core using a multiplelinear regression with moving windows in logarithmicconcentration space (Moore and others 2006) This allowsthe contributions of the several possible time-varying sulfatesources (other than volcanic) as well as the melt-inducedrelocation of ions and the heteroscedastic ion chroma-tography errors to be taken into account In the sulfateresidual obtained peaks can only be related to stochasticsources (ie mainly volcanic) The significance of thesepeaks in the residual is found by assessing the variancewithin the sliding window used in the empirical regressionThe chemical fingerprints of five volcanic eruptions werefound (at 95 confidence level) and among them a peakcould be assigned to the Laki (Iceland) eruption (1783) at1036m depth The volcanic signatures could be used asreference horizons in a stacked Nye thinning modelFigure 3b shows that the Nye ice thickness makes littledifference to the dating except below 100m depth Theclosest fit to the volcanic reference layers is with a Nyedepth of 300m This is deeper than the depth from the radar(Fig 2) however it is consistent with the temperature profile(Fig 3a) (Sommer 2005) The extremely rugged topographywill lead to ice dynamic flow far different from that assumedin the simple Nye model so we use a thinning model with300m depth to compensate for the different vertical shear
As described in Sections 33 and 34 Holtedahlfonnachemistry is dominated by ions originating mostly frommarine and anthropogenic sources with the volcanic sulfatefraction representing only 14 of the total sulfate budget(Moore and others 2012) This rather weak volcanic signalexplains why none of the five volcanic peaks could bedetected previously with DEP measurements For eachhorizon the dating uncertainty ie the difference betweenthe eruption date and the dating model based on cyclecounting (Divine and others 2011) ranges from ndash09 years(for Agung Indonesia 1963) to +96 years (for KrakatauIndonesia 1883) The core agendashdepth scale calculated byMoore and others (2012) shows that the core covers aperiod of 305 years with a mean accumulation rate of038mwe andash1
3 RESULTS AND DISCUSSION
31 Snow accumulation and source of moisture
For the period 1963ndash2005 ie for the upper 285m of theHoltedahlfonna core Van der Wel and others (2011)calculated an average annual accumulation rate on Holte-dahlfonna of 050mwe andash1 somewhat higher than the rate
given by Kekonen and others (2005) for the period 1963ndash97on Lomonosovfonna (041mwe andash1) Van der Wel andothers (2011) attributed this difference to Holtedahlfonnabeing located first on the trajectory of westerly storm tracksFor the earlier period 1783ndash1963 we found little differencein accumulation at Holtedahlfonna in contrast with Lomo-nosovfonna where average annual snow accumulation ratesare 20 greater over the recent period compared with thepre-1963 period (Fig 3b) This result suggests a substantialdifference in the responses of western and eastern Spitsber-gen concurrent with warming and increased moisturecontent of the Arctic troposphere (Morison and others2000 Groves and Francis 2002) We shall show that this islikely due to different sea-ice histories on western andeastern Spitsbergen which in turn impacts moisture avail-ability water isotopes and chemistry for Lomonosovfonnaand Holtedahlfonna
The oxygen isotope ratio in ice cores is commonly usedas a tracer for the water cycle Divine and others (2011)show that the d18O of Svalbard ice cores is a useful proxy forregional winter air temperatures Most of the d18O signal ispreserved in the annual layer despite percolation andrefreezing (Van der Wel and others 2011) The 10 yearrunning means of the d18O time series for the Holtedahl-fonna and Lomonosovfonna ice cores are plotted in Figure 4Although the amplitude of the isotopic variations is similar atboth sites (between 1 and 3 on average) the smoothedd18O values are less negative in the Holtedahlfonna coreand average ndash14 over the whole period spanned by thecore (ndash16 for Lomonosovfonna) The similar altitude andlatitude of Holtedahlfonna and Lomonosovfonna suggestssimilar cloud and surface temperatures hence the differencein isotope values suggests either depletion due to longertransport pathways from a common source or two differentmoisture sources The short distance to the mostly non-sea-ice-covered Greenland Sea provides an obvious sourceinvolving travel of a further 100 km to reach Lomonosov-fonna In the Canadian Arctic a 200 km difference in snowfrom a moisture source produces a 3 change in d18O(Koerner 1979) which compares with the 2 averagedifference between Holtedahlfonna and Lomonosovfonnafor a 100 km distance difference to open water Of coursethe Barents Sea will also provide a moisture source for bothdrill sites on some occasions though in that case we wouldexpect the deposition at Holtedahlfonna to be moredepleted relative to Lomonosovfonna hence this must bea relatively infrequent moisture source for HoltedahlfonnaAn alternative explanation for the relatively higher d18Ovalues in Holtedahlfonna ice may be that part of the wintersnow is removed at the coring site by wind scouring withresulting mean d18O biased toward heavier values (Fisherand others 1983 1998) There are no direct data onseasonal distribution of snow accumulation and windregime on Holtedahlfonna however data from radio-isotope deposits suggest that wind scouring is not significantin these locations as we discuss in the next subsection
32 Impact of post-depositional processes onglaciochemistry
Experience from the Lomonosovfonna ice core leads us toexpect that the Holtedahlfonna chemical records will beaffected by significant seasonal surface melting meltwaterpercolation and refreezing In fact for LomonosovfonnaVan de Wal and others (2002) reported a firn temperature of
Beaudon and others Eastndashwest disparities of Spitsbergen environment1072
ndash288C at 15m depth which considering the mean annualair temperature at the drilling site is ndash1258C (Pohjola andothers 2002a) results principally from transfer and releaseof latent heat by meltwater refreezing at depth In hisdetailed stratigraphic study of shallow cores from Lomono-sovfonna Samuelsson (2001) found that meltwater does notnormally penetrate further than 4 or 5m depth This isconsistent with Kekonen and others (2005) who found thatduring the warmest years on Lomonosovfonna the percola-tion length ranges from two to eight annual layersHoltedahlfonna borehole measurements (Sommer 2005)reveal a firn temperature of ndash048C at 15m depth (Fig 3a)suggesting a greater impact of refreezing than on Lomono-sovfonna This is also reflected in the presence of more icylayers in the firn pack at Holtedahlfonna than at Lomono-sovfonna Grumet and others (1998) and Fisher and others(1998) showed that higher infiltration layer frequencygenerally implies the chemical signals are more affectedby elution for Penny Ice Cap Canadian Arctic However theopposite effect of ice layer formation ie limiting thediffusion of the chemical signal (Hou and Qin 2002) wasshown by Van der Wel and others (2011) using high-resolution tritium profiles from Holtedahlfonna andLomonosovfonna although it should be taken into accountthat the limited diffusion of radioactive isotopes is alsoinherent in their location within the ice crystal The samestudy also indicates the 1963 tritium peak has the sameamplitude in both ice cores and is consistent with otherradioactivity measurement from other Svalbard ice cores(Pinglot and others 1999) More particularly 137Cs onLomonosovfonna has the same mean value at the summitdrill site and at much lower altitudes on the glacier rulingout any strong removal of snow or high-magnitude spatialnoise induced by wind scouring (Pinglot and others 1999)
As an overview of the role of melting and percolation inthe post-depositional processes over the entire record inFigure 5 we plot log([Na+] [Mg2+]) which has been definedas a good index of ion elution in Svalbard (Iizuka and others2002 Grinsted and others 2006) with higher valuesreflecting more melt The Holtedahlfonna and Lomonosov-fonna melt indices (10 year running average) show someinteresting dissimilarities (Fig 5) variations in amplitudeand frequency are larger for Holtedahlfonna especiallyduring the periods before 1740 and after 1970 Thesedifferences are especially visible during the 20th centuryshowing that Holtedahlfonna was more sensitive to meltthan Lomonosovfonna We found a significant correlation(r=041 p 005) between the Holtedahlfonna melt indexand the summer air temperatures (June July August (JJA))recorded at Svalbard airport (Longyearbyen) since 1911 forLomonosovfonna the correlation coefficient is only 001Virkkunen and others (2007) found that for Spitsbergenglaciers daily peak air temperature affects the amount ofmelting more than for example the duration of the summeror the number of positive degree-days Assuming thatHoltedahlfonna melt was well correlated with summer airtemperature also before 1911 Figure 5 shows that prior to1860 daily maximum summer temperatures were lower andless variable than during the 20th century The 1720s mighthave seen the coldest summers of the last 300 years inSvalbard The sharp rise in the melt index log([Na+][Mg2+])in the 1980s (Fig 5) is closely matched with a pronounceddecrease in concentration towards the detection limit for thenitrate and sulfate (Fig 5) both of which are easily eluted
Fig 4 Holtedahlfonna glaciochemical records (gray curves) atsample resolution with 10 year running average (black curve) andnon-sea-salt fraction (light gray shaded area) Lomonosovfonnad18O curve (10 year running average) is shown in gray The grayshaded area in the C plot displays the acidic portion of theHoltedahlfonna core (Cgt0 with C=
Panions ndash
Pcations)
Beaudon and others Eastndashwest disparities of Spitsbergen environment 1073
components (Moore and others 2005) and with lesserdepletion for calcium magnesium and potassium Thus onehypothesis is that the ion concentrations are driven by post-depositional melt processes This is consistent with therecent warming recorded by the melt index with some ofthe more mobile ions species appearing to have been lost byrunoff in recent decades The impact of melt and runoff onion chemistry has been long studied in seasonal snowpack(Davies and others 1982) Alpine firn (Eichler and others2001) and Svalbard snow pits (Virkkunen and others 2007)These and numerous other investigations show almostcomplete removal of ions during the first summer This is aresult of the location of most ions at grain boundaries in thesnowpack resulting in their preferential elution with melt-water Ion concentrations in the firn remaining after asummer melt and washout are far lower than those observedin Holtedahlfonna except in some post-1980 ice (Fig 4)Prior to 1980 the temporal evolution of these ions wassimilar to that found for Lomonosovfonna (Kekonen andothers 2002 2005) which preserves a good record that ismodified by melt but not runoff (Pohjola and others 2002a)Hence we can reject the hypothesis that the chemical record
is simply post-depositional variability However we clearlyneed to take into consideration the tangled nature ofvariation in snow chemistry with post-depositional pro-cesses such as melt and percolation
Moore and others (2005) performed an empirical orthog-onal function (EOF) analysis on Lomonosovfonna ice-coresamples to investigate the roles of precipitation and post-depositional movement of species in ice Monte Carlotesting of the EOF factors (Moore and Grinsted 2009)showed that the first eight EOFs were significant Moore andothers (2005) found that 60 of the variation in Lomono-sovfonna data is due to elution and is the leading EOF Weuse a similar approach for the Holtedahlfonna core usinglog-transformed and standardized concentrations The firstsix EOFs each correlate with one or several chemical speciesthat are not distinctively representative of a single source ordo not have a clear link with anything measurable The firstsix EOFs account for a total of 95 of the variance (weexpect 5 measurement noise errors so no more than95 variance can be expected to be physically explainable)
Table 1 displays only the two first eigenvectors whichtogether account for 68 of the variance the first eigen-vector (EOF 1) describes 493 of variance in the datasetEOF 1 is loaded in all ions except ammonium and to alesser extent MSA Virkkunen and others (2007) showedthat ammonium is the least mobile ion within the snowpackand has the lowest elution rate (Pohjola and others 2002a)due to its solubility within the ice crystal MSA has a higherelution rate than ammonium (Pohjola and others 2002aMoore and others 2005) as it is a highly soluble acid thatcan move in the liquid or vapor phase along firn grainboundaries (Mulvaney and others 1992) even in snowpackand firn well below the melting point (Kreutz and others1998 Pasteur and Mulvaney 2000 Curran and others2002) However at sites with seasonal melting providedmelting rate does not lead to ion loss by runoff eluted ionsare trapped by refrozen ice layers and prevented from longerdiffusion and relocation Furthermore MSA variations in theLomonosovfonna core were found to correlate significantlywith Barents Sea surface temperatures (OrsquoDwyer and others2000) showing meaningful signals are preserved in the MSArecord Hence as for Lomonosovfonna about half of thevariance of the Holtedahlfonna chemical dataset is due to
Fig 5 Ten-year running average of the melt index (log([Na+][Mg2+])) for Holtedahlfonna (black curve) and Lomonosovfonna (gray curve)JJA mean (orange) and 5 year running average (red) air temperature recorded at Longyearbyen airport weather station (78258N 15478 E29masl) between 1911 and 2000 (source httpclimexpknminl)
Table 1 Loading coefficients of each ion species obtained by EOFanalysis of Holtedahlfonna and Lomonosovfonna major-ion stand-ardized log-transformed data for the period 1700ndash1997 Boldnumbers are the significant loadings
Holtedahlfonna Lomonosovfonna
EOF 1 EOF 2 EOF 1 EOF 2
Clndash 033 048 037 009NO3
ndash 037 006 031 ndash055SO4
2ndash 043 ndash005 034 ndash027MSA 016 ndash034 030 020NH4
+ 007 044 017 ndash066K+ 037 ndash012 035 021Ca2+ 036 ndash041 033 016Mg2+ 041 ndash022 040 023Na+ 033 047 037 016Variance () 4932 1849 5422 1361Cumulative variance () 4932 6781 5422 6783
Beaudon and others Eastndashwest disparities of Spitsbergen environment1074
post-depositional movement of ions with the other halflikely related to climatic factors Therefore to improve thesignal-to-noise ratio and to take into account the signalfractionation due to elution we use 10 year running meansof the ion time series
33 Chemical composition of the Holtedahlfonna icecore
Basic statistical properties of each ion and their non-sea-saltfraction at different periods on Holtedahlfonna and Lomo-nosovfonna are summarized in Table 2 Since we have noconcrete evidence of the bedrock depth or layer thinning asa function of depth in the complex ice-flow regime aroundthe drill site we do not attempt to calculate fluxes of ionsTherefore it is not possible to thoroughly conclude that ionconcentrations in the Holtedahlfonna ice core are con-trolled by accumulation or dry deposition HoweverFigure 3b shows that accumulation rates vary little for mostof the core and in order to ease the comparison with theLomonosovfonna ice-core dataset (Kekonen and others2005) we will use concentrations rather than fluxes in thediscussion of our results
Almost all ion (chloride sulfate nitrate ammoniumsodium potassium magnesium) concentration profiles(Fig 4) display an increase from 1815 Calcium and MSAare exceptions and their average concentrations during theperiod 1700ndash1815 were 50 higher than after 1815(Table 2) Sodium chloride and potassium do not showsignificantly higher concentrations during the coldest part ofthe LIA culminating at about 1850 in Svalbard (Divine andothers 2011) and between 1800 and 1840 in the Arctic as awhole (Overpeck and others 1997) In contrast magnesiumconcentrations are gt50 higher during 1750ndash1880 and are
dominated by the terrestrial fraction (Fig 4) as was alsoobserved in Canadian Arctic and Greenland ice cores(Mayewski and others 1993)
The ice is distinctly acidic from 1850 which correspondsto the onset of the industrial revolution in Europe (Cgt0Fig 4) and even more so between 1940 and 1980 whenhuman activity (fossil-fuel burning) significantly enhancedthe level of acidic species such as nitrate nss-sulfate nss-chloride probably deposited as nitric acid (HNO3) sulfuricacid (H2SO4) and hydrochloric acid (HCl) brought by Arctichaze (Virkkunen 2004) Sulfate concentrations have risen bya factor of 17 since 1880 The major part of the increaseoccurred after 1940 Peak levels are reached during the1960s which is consistent with ice-core records fromSnoslashfjellafonna Svalbard (Goto-Azuma and others 1995)and from Severnaya Zemlya Russian arctic (Weiler andothers 2005) but contrasts with Greenland and theCanadian Arctic (Grumet and others 1998) which displaya more gradual rise in sulfate over the 20th century It islikely that these ice cores from Greenland and Canada aremore representative of the Northern Hemisphere tropo-spheric concentration (Fisher and others 1998) In theHoltedahlfonna core the average concentration of ammo-nium is 22 times higher during the 20th century than duringthe 18th century (Table 2)
34 Comparison with the Lomonosovfonna ice core
Since ion chromatograph data are heteroscedastic (in thiscase errors are proportional to concentration) and post-depositional processes affect ion elution rates (Moore andothers 2005) calculation of statistics assuming normalityand non-sea-salt ratios is suspect however these measuresare still commonly used and may be useful for comparing
Table 2 Average concentrations (x (meq Lndash1)) and standard deviation () in (a) Holtedahlfonna and (b) Lomonosovfonna (Kekonen and others2005) in different time periods (n is the number of samples nss is the non-sea-salt fraction over the period 1700ndash1997 calculated usingsodium as a reference)
a MSA (10ndash3) Clndash SO42ndash NO3
ndash Na+ NH4+ K+ Mg2+ Ca2+ n
x x x x x x x x x
Whole core 4797 692 1195 75 266 31 066 07 989 69 106 08 025 02 190 21 130 38 7391700ndash1815 7944 997 886 58 216 21 061 05 737 54 082 06 033 03 217 22 184 19 1461815ndash80 6333 60 1283 86 278 21 059 03 1091 85 072 04 028 02 284 22 228 76 1661880ndash1920 2709 346 1538 83 408 33 062 03 1269 86 085 06 032 02 289 26 126 1 661920ndash50 1087 173 1579 71 256 23 054 04 1312 66 099 05 025 02 149 13 088 08 691950ndash70 5744 555 1273 72 692 51 145 09 1048 58 180 11 029 02 235 18 118 07 641970ndash97 2527 359 1232 61 129 23 058 07 968 47 152 09 014 02 067 11 033 05 1651997ndash2004 4572 97 739 64 138 25 059 1 665 6 083 05 020 02 095 13 070 07 65
nss 22 557 152 228 677
b MSA Clndash SO42ndash NO3
ndash Na+ NH4+ K+ Mg2+ Ca2+ n
x x x x x x x x x
Whole core 11512 1459 806 57 380 46 088 08 503 287 089 11 018 02 163 18 172 25 7871700ndash1815 12481 984 739 42 307 41 068 04 267 135 006 02 018 01 160 12 159 2 2141815ndash80 14390 161 828 6 290 33 086 08 347 115 124 07 023 02 182 18 207 28 2221880ndash1920 14426 2489 1038 69 371 32 080 05 400 102 121 09 022 02 206 20 170 19 1031920ndash50 6388 916 917 61 515 55 071 06 894 272 082 06 011 01 179 21 257 38 881950ndash70 9251 909 756 54 749 8 146 11 1757 885 152 24 015 02 154 25 103 11 631970ndash97 5812 727 590 51 395 4 120 12 318 68 120 12 007 01 070 08 088 15 97
nss 264 743 373 297 875
Beaudon and others Eastndashwest disparities of Spitsbergen environment 1075
similar cores providing all concentration data are log-transformed On average over the last three centuries thenumber of species with a dominant sea-salt source (Na+ ClndashK+ Mg2+ Table 2) is larger in Holtedahlfonna thanLomonosovfonna At both sites sulfate is the third largestcontributor to the ion budget although its proportion of thesum in Holtedahlfonna ice is only half that in Lomonosov-fonna The nss-sulfate contribution to the total sulfateconcentration is also on average much smaller on Holte-dahlfonna (55) than on Lomonosovfonna (74) Mooreand others (2012) estimate that the volcanic sulfate fractionon Holtedahlfonna is less than half that on Lomonosovfonna
The greater total amount of sea salt as well as the smallerfraction of nss-sulfate at Holtedahlfonna may reflect theshorter distance from the marine aerosol source to Holte-dahlfonna summit compared with Lomonosovfonna Themarine biogenic fraction of sulfate estimated by MSAconcentrations is surprisingly low at Holtedahlfonna withan average concentration less than half that of Lomonosov-fonna (005 and 012 meq Lndash1 respectively) This probablypoints to a difference in the primary productivity of themarine source implying two different marine origins withrespectively low and high primary productivity This latterpoint is discussed further in Section 35
The difference in the calcium budget and the relativeproportion of terrestrial calcium in the two ice cores alsoreveals the more proximal and influential sea-salt source forHoltedahlfonna While Kekonen and others (2005) reportthat over the common period between the cores (1700ndash1997) 88 of calcium in Lomonosovfonna ice is ofterrestrial origin we calculate that on Holtedahlfonna thisfraction is more limited and represents only 68 Never-theless this observation should be moderated when compar-ing the different periods For example Holtedahlfonnareceived on average about the same amount of terrestrialcalcium as Lomonosovfonna during most of the 18thcentury (1700ndash80 152 and 156 meq Lndash1 respectively) andtwice as much between 1950 and 1970 (072 and036meq Lndash1 respectively)
Proportions of ammonium and nitrate are slightly smallerin Holtedahlfonna than in Lomonosovfonna for the sameperiod
35 Biogenic source productivity
As an oxidation product of gaseous biogenic dimethylsulfide(DMS) emissions (Dacey and Wakeham 1986) MSA iscommonly used as a proxy for marine biogenic productivityIsaksson and others (2005a) suggested that sea-ice extentwas likely the dominant effect on the variability of MSAconcentrations in Lomonosovfonna ice and also hypothe-sized that the higher MSA concentration during the colder19th century could result from a change of source andorfrom more favorable growing conditions for the DMS-producing phytoplankton during the prevailing colderconditions For the 20th century OrsquoDwyer and others(2000) found that Lomonosovfonna MSA better correlatedwith Barents Sea surface temperature and ice cover thanwith the Greenland Sea conditions indicating that theamount of MSA deposited on Lomonosovfonna is very muchinfluenced by the conditions in the Barents Sea
Similarly to Lomonosovfonna the Holtedahlfonna corecontains more MSA on average during part of the cold period1700ndash1880 (007008 meq Lndash1) than during the 20thcentury (003005meq Lndash1) The MSA concentrations in
Holtedahlfonna remain lower than those in Lomonosovfonnathroughout the last three centuries suggesting a different andor less productive marine source influencing westernSpitsbergen The transition from the LIA to the warmer 20thcentury is more marked in Holtedahlfonna records with20th-century concentrations being 43 of LIA values than atLomonosovfonnawhenMSA concentrations dropped to 66of earlier levels (Fig 6a) These decreases slightly precede thechange in sea-ice cover in the Greenland Sea at 1880(Divine and others 2008) creating on the western side ofSpitsbergen year-round open-water conditions Figure 6bdisplays the maximum (April) and minimum (August) sea-sonal sea-ice extent anomalies for the Greenland Sea andshows the larger annual ice extent amplitude before 1885comparedwith the 20th century The reduction in annual sea-ice amplitude (ie the difference between April and Augustsea-ice extent) corresponds with the lowMSA concentrationsin Holtedahlfonna Correlation between the 10 year runningaverage time series of MSA and the 10 year running averageof the Greenland Sea April ice extent anomaly for the period1762ndash1880 is higher than with the Barents Sea ice extentanomaly coefficients are significantly different (046(p lt 005) and 010 respectively) and suggestive of aconnection between positive Greenland Sea ice anomaliesand high MSA levels at Holtedahlfonna during the LIA
These results may be expected as the more extensiveseasonally ice-covered western side of Svalbard during theLIA leads to increased production of meltwater therebystabilizing the water column in spring and summer whichmay have favoured biomass production in the euphotic zoneand thus enhanced release of DMS in the atmosphere (Strassand Nothig 1996 Sakshaug and Walsh 2000) A similarprocess also might have taken place in the Barents Sea(Isaksson and others 2006a) with a wider seasonally ice-free area creating a stronger DMS source on eastern Svalbardbeing recorded in Lomonosovfonna ice Records of higherMSA concentration for the 19th century in Holtedahlfonnaare in accordance with those from Greenland ice cores Anegative relationship between the Greenland Sea surfacetemperature and MSA concentrations in the 20D (southernGreenland) ice core was found by Whung and others (1994)over the period 1870ndash1950 and Legrand and others (1997)suggest that such a correlation also demonstrated for MSArecords from Summit central Greenland may result fromincreased sea-ice extent during cold periods causing higherDMS emissions in the atmosphere
The relationship between MSA and Greenland Sea iceextent as well as the MSA concentration difference betweenHoltedahlfonna and Lomonosovfonna seems to imply thatthe biogenic productivity of the Greenland Sea was weakerthan that of the Barents Sea during the 19th centuryHowever this does not rule out the possible contribution oflower-latitude air masses to the Holtedahlfonna MSA budgetThe MSA fraction of nss-sulfate is known to increase withlatitude and has often been used to investigate the possibleorigin of marine air masses (Bates and others 1992) This isbased on the fact that DMS oxidation by OH radicals (thedominant oxidant in a clean atmosphere) is temperature-dependent as the additional pathway producing MSA isfavored at low temperature (Hynes and others 1986 Seinfeldand Pandis 1998) Between 1700 and 1920 the MSAfraction ie MSA(MSA+nss-SO4) (Fig 6c) in Holtedahl-fonna is fairly consistently 3 lower than that of Lomono-sovfonna while the Greenland MSA fraction (10ndash20)
Beaudon and others Eastndashwest disparities of Spitsbergen environment1076
(Legrand and others 1997) is more similar to Lomonosov-fonna in the LIA than Holtedahlfonna The MSA fractionshows marked variability during the LIA compared with the20th century at Holtedahlfonna consistent with the muchreduced sea-ice cover in the Greenland Sea and especiallythe reduced amplitude of seasonal variations After 1920Lomonosovfonna and Holtedahlfonna have a very similarMSA fraction which is linked to the retreat of the sea-icemargin in the Barents Sea at that time (Divine and others2008) The Holtedahlfonna MSA fraction is negative or zerobefore 1730 This pattern in the Holtedahlfonna record could
be the consequence of a smaller difference between Apriland August sea-ice extents in the Greenland Sea at thebeginning of the 18th century which could have resultedfrom colder summers (see Section 32) and limited oceanheat loss in summer in the 1720s
The loss of ions through runoff is responsible for thenegative fraction seen after 1980 at Holtedahlfonna Thegenerally lower MSA fraction compared with Lomonosov-fonna either constitutes more evidence for a different marinebiogenic source influencing western Spitsbergen or points toan additional source of nss-sulfate for Holtedahlfonna which
Fig 6 Ten-year running average for Holtedahlfonna (black) and Lomonosovfonna (gray) of (a) MSA concentrations (b) April (blue) andAugust (orange) sea-ice extent anomaly for the Greenland Sea ice (Divine and Dick 2006 data are not available for every year) (note thedecrease in amplitude of seasonal variability in sea-ice extent at 1880) (c) MSA fraction with a mean of 8 for Holtedahlfonna prior to1880 and 1 after that (d) nss-sulfate (nssSO4) concentrations and (e) nitrate (NO3
ndash) note that the profiles are uncorrelated with MSA
Beaudon and others Eastndashwest disparities of Spitsbergen environment 1077
could be terrestrial biogenic continental (gypsum dust) orvolcanic Any significant volcanic contribution is unlikely asthe fraction of volcanic sulfate in Holtedahlfonna is very low(14) in comparison with that of Lomonosovfonna (45)(Moore and others 2006 2012) or Greenland (57)(Legrand and others 1997) We can use wavelet coherence(WTC Grinsted and others 2004) to investigate the relation-ship between MSA and nss-sulfate (Fig 6d) variationsBetween 1700 and 1880 (Fig 7) the time series are highlycoherent (WTCgt08) and in phase at almost all periods Thiscontrasts with a smaller and more disjointed significant areain the WTC plot for nss-calcium and nss-sulfate (Fig 7)
The correlation between MSA and nss-sulfate argues infavor of a dominant biogenic source of nss-sulfate inHoltedahlfonna during the 18th and 19th centuries SinceDMS can also be oxidized by radicals other than OHproducing sulfur dioxide (SO2) or sulfate instead of MSA theinterpretation of the MSA fraction in terms of the biogenicsource latitude (or temperature) is not straightforward whenthe oxidative capacity of the atmosphere changes The mostefficient atmospheric oxidants of DMS are OH BrO andnitrate whereas others such as Cl IO andO3 are less efficient(Barnes and others 2006) Yet Whung and others (1994)argue that despite the substantial NOx levels in the Arcticatmosphere during the industrial period NO3
ndash oxidant doesnot control the MSA concentration in Greenland ice coresbecause nitrate is photolyzed before DMS emissions reachtheir maximum in springsummer Similarly in the Holte-dahlfonna core the sharp increase in nitrate (NOx) (seeFig 9e further below) did not lead to a decrease in MSA Insummer only OH and BrO may compete efficiently inoxidizing the DMS For instance recent measurements ofBrO made over 1 year by Saiz-Lopez and others (2007) atHalley Antarctica indicate a mean level of 3 pptv during
JanuaryndashMarch Such high BrO levels in summer make theBrO reaction on DMS producing MSA four times faster thanthat with OH (addition pathway) (Read and others 2008)Since numerous studies suggest that the bromine chemistry ispromoted by sea-ice coverage we cannot exclude thepossibility that the decrease in sea ice was accompaniedby decreasing halogen chemistry and may have contributedto the decrease of the MSA fraction between 1700ndash1880 andrecent decades Additionally the increases of nss-sulfate aresimilar at Holtedahlfonna and Lomonosovfonna (Fig 6dTable 2) so we ascribe the sharp change of MSA inHoltedahlfonna at 1880 to the rapid decline in sea-icecover in the Greenland Sea and the relatively largertemperature rise at the end of the LIA than occurred in thewider North Atlantic (Engelsen and others 2002)
36 Ammonium variability
Lomonosovfonna and Holtedahlfonna display divergentbehavior of ammonium around the end of the LIA (Fig 4)The 10 year running mean ammonium values in theLomonosovfonna core follow a decreasing trend from1900 to 1940 before reflecting the impact of anthropogenicpollution in the 1950s (Fig 8a) (Kekonen and others 2002)In contrast Holtedahlfonna ammonium concentrations riseby a factor of 3 starting in 1880 Explanations for the earlierrise of ammonium concentration could be that it eitherreflects a more efficient ammonium transport to Holtedahl-fonna or that during the period 1880ndash1940 Holtedahlfonnareceived an additional source of ammonium compared withLomonosovfonna In relation to the regional climate com-ponent discussed in Section 31 local wetland formed bythe reduction of snow-covered areas at the end of theLIA might have constituted a source of local gaseousammonia (NH3 a precursor of ammonium) influencing the
Fig 7 Wavelet coherency and phase in Holtedahlfonna between (a) MSA and nss-sulfate and (b) nssCa and nss-sulfate The thick blackcontour designates the 5 significance level against red noise and the thin black curve is the cone of influence Arrows pointing to the rightindicate in-phase relative relationship
Beaudon and others Eastndashwest disparities of Spitsbergen environment1078
Holtedahlfonna ammonium budget However the lack ofdata on wetlands for the Svalbard region makes itimpossible to verify this hypothesis
Jickells and others (2003) used stable N isotopes inammonium to derive sources of ammonium However wehave only ion concentration data so we use an indirectapproach To investigate the temporal evolution of thecontributions to the ammonium budget along the core weperformed a multiple linear regression (MLR) betweenammonium and other ions (Fig 8b) This innovativeprocedure is essentially the same as that used to evaluatethe sulfate budget in Lomonosovfonna described by Mooreand others (2006) and the first steps of finding the volcanicsulfate residuals (Moore and others 2012 Section 23) butrather than modeling sulfate as a function of the other ionshere we target ammonium by fitting the other ions
During the pre-industrial period until 1880 nitrate is themost significant cofactor with ammonium indicating theexistence of natural ammonium nitrate (NH4NO3) acompound formed more favorably in cold conditions (Battyeand others 2003 Teinila and others 2003) The NorthAmerican soil vegetation and biomass-burning NH3 emis-sions constitute the main pre-industrial source of ammoniumfor Greenland and reflect the propensity of polar ice sheetsto sample the free troposphere where NH3 and ammoniumresidence times allow their long-range transport (Fuhrer andothers 1996) Yet the oceanic source of NH3 in the Arctic isconsidered non-negligible especially in winter (Fisher and
others 2011) Jickells and others (2003) provided evidencefor a substantial marine ammonia winter source The oceanconstitutes a net source of NHx (ie NH3 and NH4
+) to thecontinents during pre-industrial times with smaller sea-water NHx concentrations in regions of low primaryproductivity (nutrient-limited communities being moreefficient at utilizing recycled nitrogen and thus maintaininga lower ambient concentration Spokes and others 2000Johnson and others 2008 and references therein)
Depending on which of the natural sources (oceanic orcontinental) dominates the Svalbard ammonium budget thelower pre-industrial ammonium concentration measured inHoltedahlfonna ice compared with Lomonosovfonna could(1) be an additional argument in favor of a cold and lowproductive marine source for western Spitsbergen comparedwith eastern Spitsbergen which is more influenced by theNorth Atlantic where NH3 seandashair fluxes are one order ofmagnitude higher (Johnson and others 2008) or (2) indicatethat Holtedahlfonna is less influenced by the free tropo-sphere than Lomonosovfonna After 1880 the nitratecovariation and fractional contribution to ammoniumbecomes insignificant and none of the other ions becomesa consistent replacement in the MLR (Fig 8b) Over a periodwhen melting impact rises constantly this probably reflectsthe specific elution-resistant behavior of ammonium(Table 1) This may be the case during the 1980s whenhigher ammonium concentrations are not correlated withnitrate or sulfate (Fig 4)
Fig 8 (a) Ten year running average concentrations of ammonium (meq Lndash1) in Holtedahlfonna (black) and Lomonosovfonna (gray) cores Theshaded area indicates the Little Ice Age (LIA) termination (b) Holtedahlfonna ammonium multiple linear regression (MLR) (i) sample-by-sample ammonium ion concentration profile (blue dotted curve) and the F statistic for the 100 points windowed MLR (ii) contributions ofeach species in the MLR to the ammonium concentration (see Moore and others (2006) for method details) the ion curves are only plottedwhen their contribution is significant at the 95 level Most of the record is dominated by covariation with nitrate (light green) After 1880no ion stands out as generally covarying with ammonium though sometimes both sodium (Na+ turquoise) and sulfate (SO4
2ndash purple) areimportant factors
Beaudon and others Eastndashwest disparities of Spitsbergen environment 1079
Virkkunen and others (2007) showed that the chemicalfingerprint of anthropogenic ammonia (NH3) sulfur dioxide(SO2) and nitrogen oxides (NOx) (the main constituents ofthe Arctic haze) was present in 200102 snowpack onHoltedahlfonna but absent on Lomonosovfonna The rise ofammonium in Holtedahlfonna records starting in 1880could result from mid-latitude pollution reaching the Arcticin late winter when meridional transport intensifies (Iversenand Joranger 1985) The global NOx emissions started torise in the 1860s (Klimenko and others 2000) Anthropo-genic ammonium pollution is also detected from 1870 inthe Colle Gnifetti (ItalySwitzerland) ice core (Doscher andothers 1996) and at least from 1920 in Col du DomeFrance (Fagerli and others 2007) while no increasing trendis visible before the 1940ndash1950s in Greenland (Fuhrer andothers 1996) Qomolangma (Mount Everest Hou andothers 2003) or Lomonosovfonna (Kekonen and others2005) records
To account for the absence of Arctic haze from Lomono-sovfonna snow Virkkunen and others (2007) invoked geo-graphical factors such as the orientation of the surroundingfjords Here we advocate the respective positions of the twoglaciers relative to the top of the atmospheric boundary layerwithin which neutralized pollutants are transported fromcontinental source areas in late winter The acidity of Arctichaze aerosols depends on the availability of ammonia toneutralize sulfate Using aircraft and surface aerosol data(including data from Zeppelin station) Fisher and others(2011) investigated the source contributing to ammoniumsulfate and aerosol acidity through the depth of the Arctictroposphere over the winterndashspring season For the winterseason they found that sulfate and ammonium sources aremore stratified than later in spring Aerosols in the free
troposphere are more acidic and are dominated by sulfate(originating mostly from east Asia) whereas more abundantand neutralized aerosols (from west Asia and Europe) remainwithin the boundary layer
As shown in Figure 9 the shorter distance of Holtedahl-fonna to the quasi-permanent open sea (the Greenland Sea)could facilitate oceanic heat advection to the ice cap insummer and in winter allow some vertical convectionthereby weakening the temperature inversion gradient andslightly raising its upper boundary placing Holtedahlfonnawithin the inversion layer (Solberg and others 1996Treffeisen and others 2007) Conversely the presence ofice-covered sea on the eastern side of Spitsbergen wouldprovoke an intensive radiative cooling of the lower tropo-sphere leading to the formation of a very stable and hencethin inversion layer during the polar night (Wu and others2004 Koenigk and others 2009) In those conditionsLomonosovfonna would be located above the thermalinversion layer and would most likely collect pollution fromthe more acidic free troposphere in winter This contrastswith the summer configuration when the northern positionof the sea-ice margin makes the Barents Sea waterstratification propitious to algal bloom which then forms alocal source of MSA (and sea salt) for Lomonosovfonna (seeSection 35) The atmospheric vertical stratification of acidityin winter could then also explain why Svalbardrsquos highestsulfate and greater acidity levels are recorded in Lomono-sovfonna (Kekonen and others 2005) (Fig 7)
4 CONCLUSIONS
We have presented ion chemical data for the past 300 yearsfrom Holtedahlfonna and compared them with recordsextracted from the Lomonosovfonna core to illustrate site-specific climatic and glaciological factors and better esti-mate the local influence of environmental factors on icerecords in the Svalbard setting Despite the fact that the meltindex is on average higher in Holtedahlfonna melting isresponsible for 49 of the variance in ion concentrationwhich is almost the same as that estimated for theLomonosovfonna ice core (55) This is likely because ofthe formation of thin layers of ice in the annual snowpackwhich act as barriers to the deeper elution of ions helping topreserve a multi-year resolution environmental recordHoltedahlfonna chemical melt index (log([Na+][Mg2+])) isa better proxy for Svalbard 20th-century summer airtemperatures than provided by other ice cores fromthe archipelago
A strong local response is also shown in the spatial andtemporal variability of chemical species As expected wefound that Holtedahlfonna ice contains more sea salt due toits proximity to the Greenland Sea which is ice-free almostthroughout the year The lower MSA and ammonium levelsmeasured for the LIA compared with those measured inLomonosovfonna also argue in favour of the influence of alocal marine source with lower primary productivity (acooler source) during this period The good correlationbetween Greenland Sea ice extent and Holtedahlfonnabiogenic sulfur record (MSA) supports this hypothesis andreveals the complex airndashseandashice interactions that character-ize the Greenland Sea compared with other Nordic seas(Kvingedal 2005)
In addition to providing a proximal source of warmthmoisture sea salt and biogenic sulfur to western Svalbard
Fig 9 (a) Map of Svalbard and surrounding seas showing present-day typical sea-ice conditions in winter (source httpretrometnokyst_og_haviskarthtml) The black double-headed arrow marks thewestndasheast profile section of Spitsbergen through Holtedahlfonna(HF) and Lomonosovfonna (LF) represented in (b) (b) WinterndashspringArctic haze situation and the vertical stratification of aerosol acidity(Fisher and others 2011) The process shown in this figure appliesfor the present time
Beaudon and others Eastndashwest disparities of Spitsbergen environment1080
the low ice concentration of the Greenland Sea favors thealtitudinal dispersal of tropospheric pollution The study ofthe ammonium budget suggests that either the open seaprovides a winter source of ammonium or just as consist-ently that the glaciers of the western part of Spitsbergensuch as Holtedahlfonna may better reflect the troposphericboundary layer pollution burden than do eastern glacierswhich are more representative of the free troposphere inwinter The small sea-ice extent in the Greenland Seastrongly influences the height of the winter inversion layerand thus the delivery of more neutralized Arctic hazeaerosols to the glacier As Arctic warming progresses wemay expect drastic retreat of the Barents Sea seasonal icecover The analysis of the Holtedahlfonna ice core foretellshow glaciochemical signals from eastern Svalbard glaciers(such as Lomonosovfonna) could be altered and howwinterndashspring pollution would be mixed higher in theArctic troposphere
ACKNOWLEDGEMENTS
We thank the Norwegian Polar Institute the Dutch ScienceFoundation (NWO) and the Swedish Science Council (VR) forfunding the ice-core drilling and Kristiina Virkkunen andVenkata Gandikota for the primary cutting of the ice coreWealso thank the Finnish Forest Research Institute RovaniemiResearch Unit for the use of the laboratory facilities and theAcademy of Finland and the ARKTIS Graduate School forproviding financial support for sample analysis This researchwas partially supported by Chinarsquos National Key ScienceProgram for Global Change Research (No 2010CB950504)by the European Union Regional Development Foundationproject VeeOBS (32080211-0043) and by National NaturalScience Foundation of China (NSFC) grant No 41076125
REFERENCES
Barnes I Hjorth J and Mihalopoulos N (2006) Dimethyl sulfide anddimethyl sulfoxide and their oxidation in the atmosphere ChemRev 106(3) 940ndash975 (doi 101021cr020529)
Bates TS Calhoun JA and Quinn PK (1992) Variations in themethanesulfonate to sulfate molar ratio in submicrometermarine aerosol particles over the south Pacific OceanJ Geophys Res 97(D9) 9859ndash9865 (doi 10102992JD00411)
Battye W Aneja VP and Roelle PA (2003) Evaluation and improve-ment of ammonia emissions inventories Atmos Environ 37(27)3873ndash3883 (doi 101016S1352-2310(03)00343-1)
Bengtsson L Semenov VA and Johannessen OM (2004) The earlytwentieth-century warming in the Arctic ndash a possible mech-anism J Climate 17(20) 4045ndash4057 (doi 1011751520-0442(2004)017lt4045TETWITgt20CO2)
Curran MAJ and 6 others (2002) Post-depositional movement ofmethanesulphonic acid at Law Dome Antarctica and theinfluence of accumulation rate Ann Glaciol 35 333ndash339 (doi103189172756402781816528)
Dacey JWH and Wakeham SG (1986) Oceanic dimethylsulfideproduction during zooplankton grazing on phytoplanktonScience 233(4770) 1314ndash1316 (doi 101126science23347701314)
Davies TD Vincent CE and Brimblecombe P (1982) Preferentialelution of strong acids from a Norwegian ice cap Nature300(5888) 161ndash163 (doi 101038300161a0)
Divine DV and Dick C (2006) Historical variability of sea-ice edgeposition in the Nordic Seas J Geophys Res 111(C1) C01001(doi 1010292004JC002851)
Divine DV and 8 others (2008) Deuterium excess record from asmall Arctic ice cap J Geophys Res 113(D19) D19104 (doi1010292008JD010076)
Divine D and 7 others (2011) Thousand years of winter surface airtemperature variations in Svalbard and northern Norwayreconstructed from ice-core data Polar Res 30 7379 (doi103402polarv30i07379)
Doscher A Gaggeler HW Schotterer U and Schwikowski M (1996)A historical record of ammonium concentrations from a glacierin the Alps Geophys Res Lett 23(20) 2741ndash2744 (doi10102996GL02615)
Eichler A Schwikowski M and Gaggeler HW (2001) Meltwater-induced relocation of chemical species in Alpine firnTellus 53B(2) 192ndash203 (doi 101034j1600-08892001d01-15x)
Engelsen O Hegseth EN Hop H Hansen E and Falk-Petersen S(2002) Spatial variability of chlorophyll-a in the Marginal IceZone of the Barents Sea with relations to sea ice andoceanographic conditions J Mar Syst 35(1ndash2) 79ndash97 (doi101016S0924-7963(02)00077-5)
Fagerli H Legrand M Preunkert S Vestreng V Simpson D andCerqueira M (2007) Modeling historical long-term trends ofsulfate ammonium and elemental carbon over Europe acomparison with ice-core records in the Alps J GeophysRes 112(D23) D23S13 (doi 1010292006JD008044)
Fisher DA Koerner RM Paterson WSB Dansgaard W GundestrupN and Reeh N (1983) Effect of wind scouring on climatic recordsfrom ice-core oxygen-isotope profiles Nature 301(5897)205ndash209 (doi 101038301205a0)
Fisher DA and 12 others (1998) Penny Ice Cap cores Baffin IslandCanada and the Wisconsinan Foxe Dome connection twostates of Hudson Bay ice cover Science 279(5351) 692ndash695(doi 101126science2795351692)
Fisher JA and 17 others (2011) Sources distribution and acidity ofsulfatendashammonium aerosol in the Arctic in winterndashspringAtmos Environ 454(39) 7301ndash7318 (doi 101016jatmosenv201108030)
Fuhrer K Neftel A Anklin M Staffelbach T and Legrand M (1996)High-resolution ammonium ice-core record covering a com-plete glacialndashinterglacial cycle J Geophys Res 101(D2)4147ndash4164 (doi 10102995JD02903)
Goto-Azuma K and Koerner RM (2001) Ice-core studies ofanthropogenic sulfate and nitrate trends in the ArcticJ Geophys Res 106(D5) 4959ndash4969 (doi 1010292000JD900635)
Goto-Azuma K and 6 others (1995) An ice-core chemistry recordfrom Snoslashfjellafonna northwestern Spitsbergen Ann Glaciol21 213ndash218
Grinsted A Moore JC and Jevrejeva S (2004) Application of thecross wavelet transform and wavelet coherence in geophysicaltime series Nonlinear Process Geophys 11(5ndash6) 561ndash566(doi 105194npg-11-561-2004)
Grinsted A Moore JC Pohjola V Martma T and Isaksson E (2006)Svalbard summer melting continentality and sea-ice extent fromthe Lomonosovfonna ice core J Geophys Res 111(D7)D07110 (doi 1010292005JD006494)
Groves DG and Francis JA (2002) Variability of the Arcticatmospheric moisture budget from TOVS satellite dataJ Geophys Res 107(D24) 4785 (doi 1010292002JD002285)
Grumet NS Wake CP Zielinski GA Fisher D Koerner R and JacobsJD (1998) Preservation of glaciochemical time-series in snowand ice from the Penny Ice Cap Baffin Island Geophys ResLett 25(3) 357ndash360 (doi 10102997GL03787)
Hou S and Qin D (2002) The effect of post-depositional process onthe chemical profiles of snow pits in the percolation zone ColdReg Sci Technol 34(2) 111ndash116 (doi 101016S0165-232X(01)00065-9)
Hou S Qin D Zhang D Kang S Mayewski PA and Wake CP (2003)A 154 a high-resolution ammonium record from the RongbukGlacier north slope of Mt Qomolangma (Everest) TibetndashHimal
Beaudon and others Eastndashwest disparities of Spitsbergen environment 1081
region Atmos Environ 37(5) 721ndash729 (doi 101016S1352-2310(02)00582-4)
Hynes AJ Wine PH and Semmes DH (1986) Kinetics andmechanism of hydroxyl reactions with organic sulfidesJ Phys Chem 90(17) 4148ndash4156
Iizuka Y Igarashi M Kamiyama K Motoyama H and Watanabe O(2002) Ratios of Mg2+Na+ in snowpack and an ice core atAustfonna ice cap Svalbard as an indicator of seasonalmelting J Glaciol 48(162) 452ndash460 (doi 103189172756502781831304)
Isaksson E and 10 others (2005a) Two ice-core 18O records fromSvalbard illustrating climate and sea-ice variability over the last400 years Holocene 15(4) 501ndash509 (doi 1011910959683605hl820rp)
Isaksson E Kekonen T Moore J and Mulvaney R (2005b) Themethanesulphonic acid (MSA) record in a Svalbard icecore Ann Glaciol 42 345ndash351 (doi 103189172756405781812637)
Iversen T and Joranger E (1985) Arctic air pollution and large scaleatmospheric flows Atmos Environ 19(12) 2099ndash2108 (doi1010160004-6981(85)90117-9)
Jickells TD and 7 others (2003) Isotopic evidence for a marineammonia source Geophys Res Lett 30(7) 1374 (doi1010292002GL016728)
Johnson MT and 9 others (2008) Field observations of the oceanndashatmosphere exchange of ammonia fundamental importance oftemperature as revealed by a comparison of high and lowlatitudes Global Biogeochem Cycles 22(GB1) GB1019 (doi1010292007GB003039)
Kameda T Takahashi S Goto-Azuma K Kohshima S Watanabe Oand Hagen JO (1993) First report of ice core analyses andborehole temperatures on the highest icefield on westernSpitsbergen in 1992 Bull Glacier Res 11 51ndash61
Keene WC Pszenny AAP Galloway JN and Hawley ME (1986) Sea-salt corrections and interpretation of constituent ratios in marineprecipitation J Geophys Res 91(D6) 6647ndash6658 (doi101029JD091iD06p06647)
Kekonen T Moore JC Mulvaney R Isaksson E Pohjola V and Vande Wal RSW (2002) An 800 year record of nitrate from theLomonosovfonna ice core Svalbard Ann Glaciol 35 261ndash265 (doi 103189172756402781817121)
Kekonen T Peramaki P and Moore JC (2004) Comparison ofanalytical results for chloride sulfate and nitrate obtained fromadjacent ice core samples by two ion chromatographic methodsJ Environ Monitor 6(2) 147ndash152 (doi 101039B306621E)
Kekonen T and 6 others (2005) The 800 year long ion record fromthe Lomonosovfonna (Svalbard) ice core J Geophys Res110(D7) D07304 (doi 1010292004JD005223)
Klimenko VV Klimenko AV and Tereshin AG (2000) Reducingemissions of trace greenhouse gases as an alternative to reducingemissions of carbon dioxide part II Therm Eng 47(6) 476ndash483
Koenigk T Mikolajewicz U Jungclaus JH and Kroll A (2009) Sea icein the Barents Sea seasonal to interannual variability andclimate feedbacks in a global coupled model Climate Dyn32(7ndash8) 1119ndash1138 (doi 101007s00382-008-0450-2)
Koerner RM (1979) Accumulation ablation and oxygen isotopevariations on the Queen Elizabeth Islands ice caps CanadaJ Glaciol 22(86) 25ndash41
Kreutz KJ Mayewski PA Whitlow SI and Twickler MS (1998)Limited migration of soluble ionic species in a Siple DomeAntarctica ice core Ann Glaciol 27 371ndash377
Kvingedal B (2005) Sea ice extent and variability in the Nordic Seas1967ndash2002 In Drange H Dokken T Furevik T Gerdes R andBerger W eds The Nordic seas an integrated perspective (Geo-physical Monograph Series 158) American Geophysical UnionWashington DC 38ndash49
Lefauconnier B Hagen JO and Rudant JP (1994) Flow speed andcalving rate of Kongsbreen glacier Svalbard using SPOT imagesPolar Res 13(1) 59ndash65 (doi 101111j1751-83691994tb00437x)
Legrand M and 6 others (1997) Sulfur-containing species (methane-sulfonate and SO4) over the last climatic cycle in the GreenlandIce Core Project (central Greenland) ice core J Geophys Res102(C12) 26 663ndash26 679 (doi 10102997JC01436)
Matoba S Narita H Motoyama H Kamiyama K and Watanabe O(2002) Ice core chemistry of Vestfonna Ice Cap in SvalbardNorway J Geophys Res 107(D23) 4721 (doi 1010292002JD002205)
Mayewski PA and 7 others (1993) Ice-core sulfate from threeNorthern Hemisphere sites source and temperature forcingimplications Atmos Environ 27(17ndash18) 2915ndash2919
Moore JC and Grinsted A (2009) Ion fractionation and percolationin ice cores with seasonal melting In Hondoh T ed Physics ofice core records II (Supplement Issue of Low TemperatureScience 68) Hokkaido University Press Sapporo 381ndash386
Moore JC Grinsted A Kekonen T and Pohjola V (2005) Separationof melting and environmental signals in an ice core withseasonal melt Geophys Res Lett 32(10) L10501 (doi1010292005GL023039)
Moore JC Kekonen T Grinsted A and Isaksson E (2006) Sulfatesource inventories from a Svalbard ice-core record spanning theIndustrial Revolution J Geophys Res 111(D15) D15307 (doi1010292005JD006453)
Moore JC and 6 others (2012) Statistical extraction of volcanicsulphate from nonpolar ice cores J Geophys Res 117(D3)D03306 (doi 1010292011JD016592)
Morison J Aagaard K and Steele M (2000) Recent environmentalchanges in the Arctic a review Arctic 53(4) 359ndash371
Mulvaney R Pasteur EC Peel DA Saltzman ES and Whung PY(1992) The ratio of MSA to non-sea-salt sulphate in AntarcticPeninsula ice cores Tellus 44B(4) 295ndash303 (doi 101034j1600-08891992t01-2-00007x)
Nye JF (1963) Correction factor for accumulation measured by thethickness of the annual layers in an ice sheet J Glaciol 4(36)785ndash788
OrsquoDwyer J and 7 others (2000) Methanesulfonic acid in a Svalbardice core as an indicator of ocean climate Geophys Res Lett27(8) 1159ndash1162 (doi 1010291999GL011106)
Overpeck J and 17 others (1997) Arctic environmental change ofthe last four centuries Science 278(5341) 1251ndash1256 (doi101126science27853411251)
Pasteur EC and Mulvaney R (2000) Migration of methanesulphonate in Antarctic firn and ice J Geophys Res105(D9) 11 525ndash11 534 (doi 1010292000JD900006)
Pinglot J-F and 6 others (1999) Accumulation in Svalbard glaciersdeduced from ice cores with nuclear tests and Chernobylreference layers Polar Res 18(2) 315ndash321 (doi 101111j1751-83691999tb00309x)
Pohjola V and 7 others (2002a) Effect of periodic melting ongeochemical and isotopic signals in an ice core on Lomono-sovfonna Svalbard J Geophys Res 107(D4) 4036 (doi1010292000JD000149)
Pohjola VA and 6 others (2002b) Reconstruction of three centuriesof annual accumulation rates based on the record of stableisotopes of water from Lomonosovfonna Svalbard AnnGlaciol 35 57ndash62 (doi 103189172756402781816753)
Read KA and 10 others (2008) DMS and MSA measurements in theAntarctic Boundary Layer impact of BrO on MSA productionAtmos Chem Phys 8(11) 2985ndash2997 (doi 105194acp-8-2985-2008)
Ruggirello RM and 8 others (2010) Current use and legacy pesticidedeposition to ice caps on Svalbard Norway J Geophys Res115(D18) D18308 (doi 1010292010JD014005)
Saiz-Lopez A and 6 others (2007) Boundary layer halogens incoastal Antarctica Science 317(5836) 348ndash351 (doi 101126science1141408)
Sakshaug E and Walsh J (2000) Marine biology biomass product-ivity distributions and their variability in the Barents and BeringSeas In Nuttall M and Callaghan TV eds The Arctic environ-ment people policy Harwood Academic Amsterdam 161ndash196
Beaudon and others Eastndashwest disparities of Spitsbergen environment1082
Samuelsson H (2001) Distribution of melt layers on the ice fieldLomonosovfonna Spitsbergen (MSc thesis University ofUppsala)
Seinfeld JH and Pandis SN (1998) Atmospheric chemistry andphysics from air pollution to climate change John Wiley ampSons New York
Sjogren B and 6 others (2007) Determination of firn density in icecores using image analysis J Glaciol 53(182) 413ndash419 (doi103189002214307783258369)
Solberg S Schmidbauer N Semb A Stordal F and Hov Oslash (1996)Boundary-layer ozone depletion as seen in the NorwegianArctic in spring J Atmos Chem 23(3) 301ndash332 (doi 101007BF00055158)
Sommer W (2005) Reconstruction of surface temperature variationsfrom temperaturemeasurements along amedium-depth boreholeat Holtedahlfonna Svalbard (BSc thesis University of Utrecht)
Spokes LJ Yeatman SG Cornell SE and Jickells TD (2000) Nitrogendeposition to the eastern Atlantic Ocean The importance ofsoutheasterly flow Tellus B 52(1) 37ndash49 (doi 101034j1600-0889200000062x)
Strass VH and Nothig EM (1996) Seasonal shifts in ice edgephytoplankton blooms in the Barents Sea related to the watercolumn stability Polar Biol 16(6) 409ndash422
Teinila K Hillamo R Kerminen VM and Beine HJ (2003) Aerosolchemistry during the NICE dark and light campaigns AtmosEnviron37(4) 563ndash575 (doi 101016S1352-2310(02)00826-9)
Treffeisen R Krejci R Strom J Engvall AC Herber A and ThomasonL (2007) Humidity observations in the Arctic troposphere overNy-Alesund Svalbard based on 15 years of radiosonde dataAtmos Chem Phys 7(10) 2721ndash2732 (doi 105194acp-7-2721-2007)
Van deWal RSWand 6 others (2002) Reconstruction of the historicaltemperature trend from measurements in a medium-lengthborehole on the Lomonosovfonna plateau Svalbard AnnGlaciol 35 371ndash378 (doi 103189172756402781816979)
Van der Wel LG and 8 others (2011) Using high-resolution tritiumprofiles to quantify the effects of melt on two Spitsbergen icecores J Glaciol 57(206) 1087ndash1097 (doi 103189002214311798843368)
Virkkunen K (2004) Snowpit studies in 2001ndash2002 in Lomonosov-fonna Svalbard (MSc thesis University of Oulu)
Virkkunen K and 6 others (2007) Warm summers and ionconcentrations in snow comparison of present day withMedieval Warm Epoch from snow pits and an ice core fromLomonosovfonna Svalbard J Glaciol 53(183) 623ndash634 (doi103189002214307784409388)
Watanabe O and 7 others (2001) Studies on climatic andenvironmental changes during the last few hundred years usingice cores from various sites in Nordaustlandet Svalbard MemNatl Inst Polar Res Spec Iss 54 227ndash242
Weiler K Fischer H Fritzsche D Ruth U Wilhelms F and Miller H(2005) Glaciochemical reconnaissance of a new ice core fromSevernaya Zemlya Eurasian Arctic J Glaciol 51(172) 64ndash74(doi 103189172756505781829629)
Whung PY Saltzman ES Spencer MJ Mayewski PA and Gundes-trup N (1994) Two-hundred-year record of biogenic sulfur in asouth Greenland ice core (20D) J Geophys Res 99(D1)1147ndash1156 (doi 10102993JD02732)
Wu B Wang J and Walsh J (2004) Possible feedback of winter seaice in the Greenland and Barents Seas on the local atmosphereMon Weather Rev 132(7) 1868ndash1876 (doi 1011751520-0493(2004)132lt1868PFOWSIgt20CO2)
MS received 30 October 2012 and accepted in revised form 12 July 2013
Beaudon and others Eastndashwest disparities of Spitsbergen environment 1083
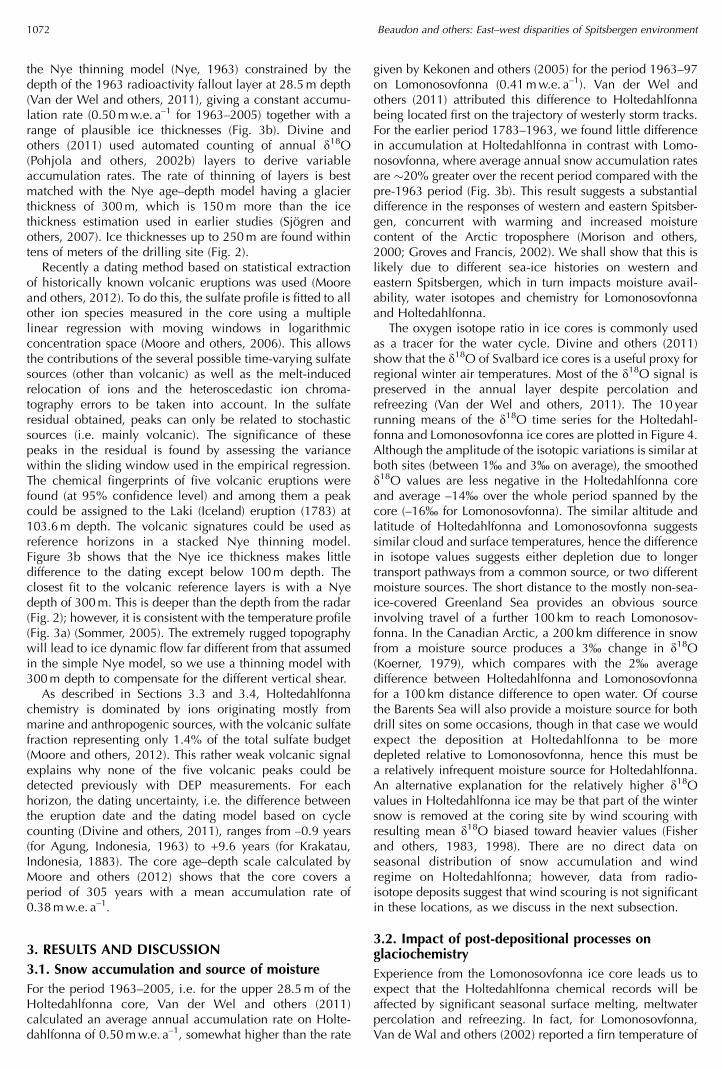
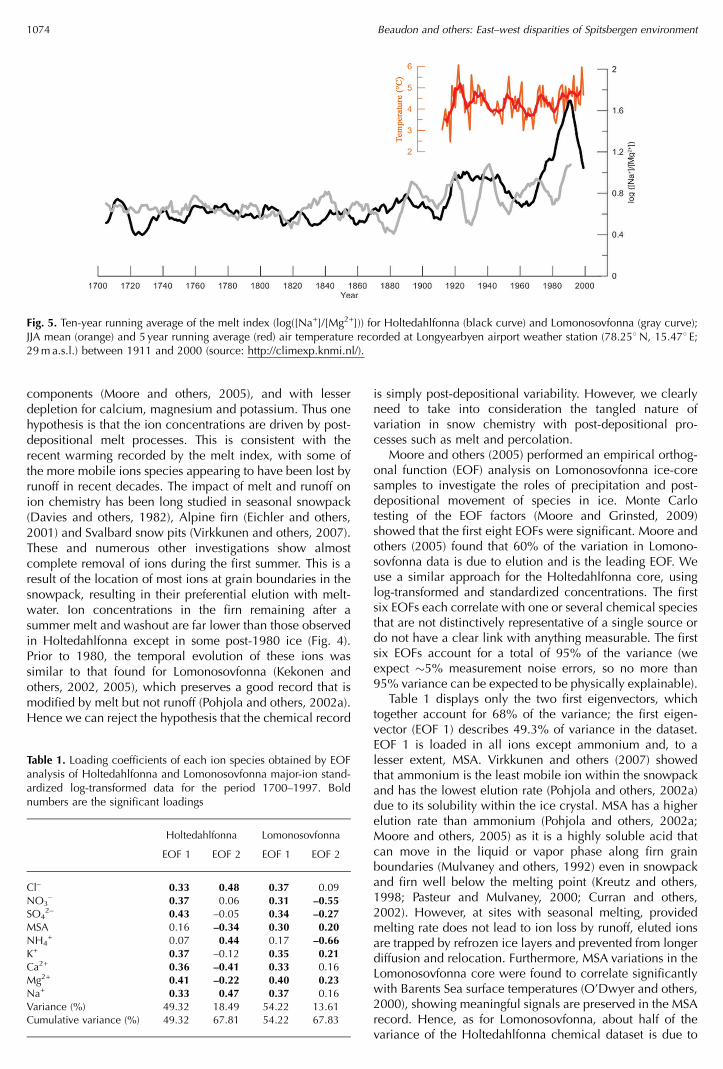
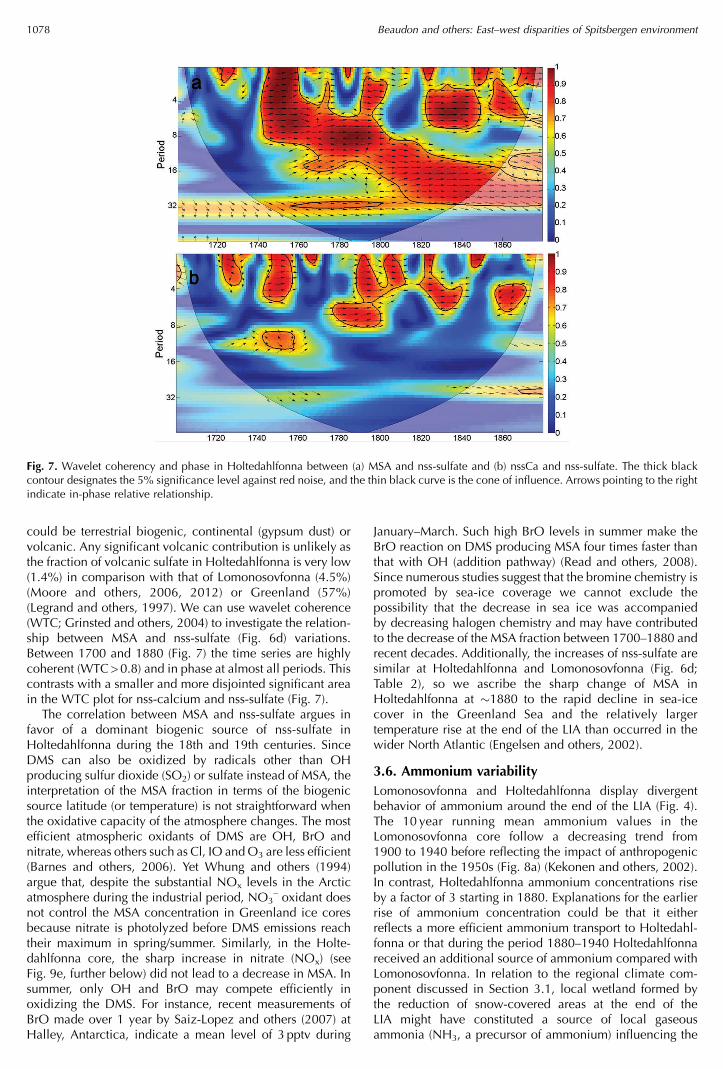
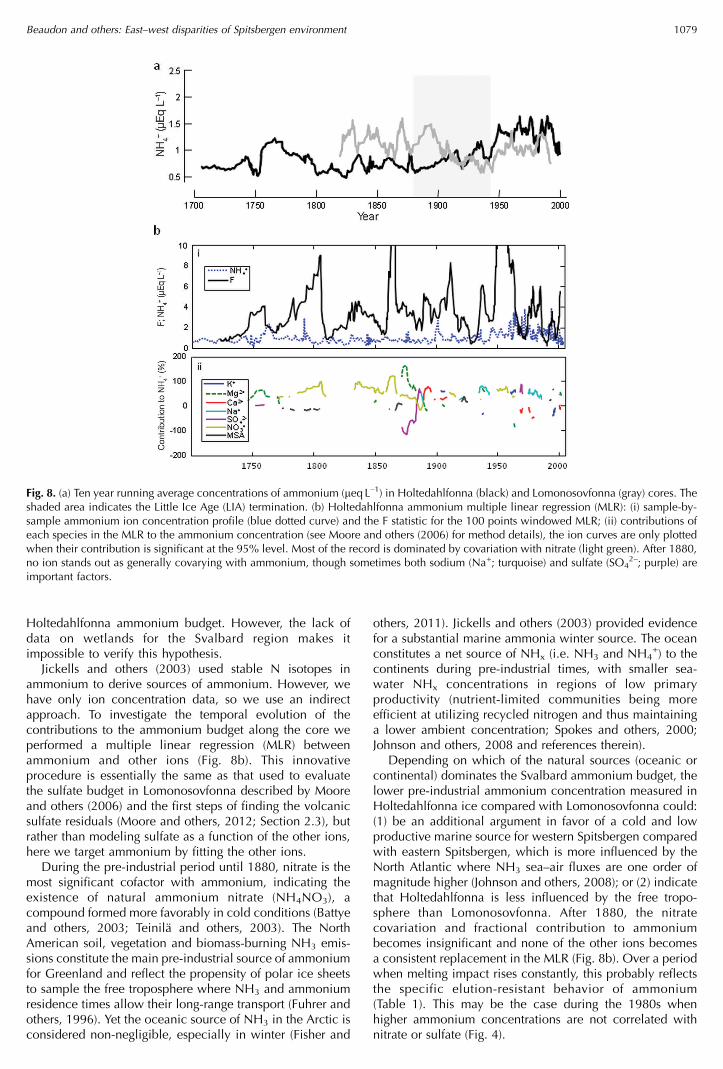
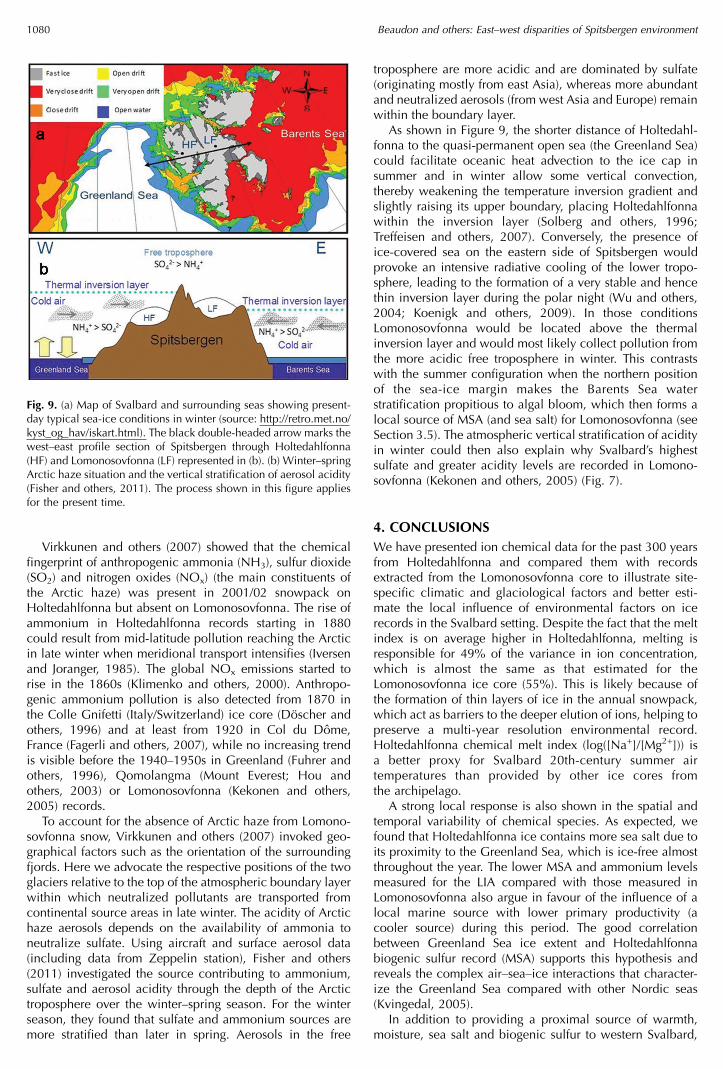