public sector economics 4/2018
TRANSCRIPT
VLAD
IMIR
ARČ
ABIĆ
Fis
cal c
onve
rgen
ce a
nd su
stai
nabi
lity
in
the
Euro
pean
Uni
on
OZA
NA
NAD
OVE
ZA JE
LIĆ
and
MAR
GAR
ETA
GAR
DIJA
N K
EDŽO
Ef
ficie
ncy
vs e
ffect
iven
ess
an
anal
ysis
of t
ertia
ry e
duca
tion
ac
ross
Eur
ope
IVAN
A D
RAŽE
NO
VIĆ
MAR
INA
KUN
OVA
C an
d D
OM
INIK
PRI
PUŽI
Ć
Dyn
amic
s and
det
erm
inan
ts o
f em
igra
tion
the
case
of C
roat
ia a
nd
the
expe
rien
ce o
f new
EU
mem
ber s
tate
s
BRAN
KO S
TAN
IĆ D
eter
min
ants
of s
ubna
tiona
l bud
get
fisca
l tr
ansp
aren
cy a
revi
ew o
f em
piri
cal e
vide
nce
Vol
42 N
o 4
| pp
353
-494
Dec
embe
r 201
8 | Z
agre
b
issn
245
9-88
60ht
tps
do
iorg
10
3326
pse
424
Public Sector Economics
42018
table of contents
articles 353 VLADIMIR ARČABIĆ
Fiscal convergence and sustainability in the European Union
381 OZANA NADOVEZA JELIĆ and MARGARETA GARDIJAN KEDŽO Efficiency vs effectiveness an analysis of tertiary education across Europe
415 IVANA DRAŽENOVIĆ MARINA KUNOVAC and DOMINIK PRIPUŽIĆ Dynamics and determinants of emigration the case of Croatia and the experience of new EU member states
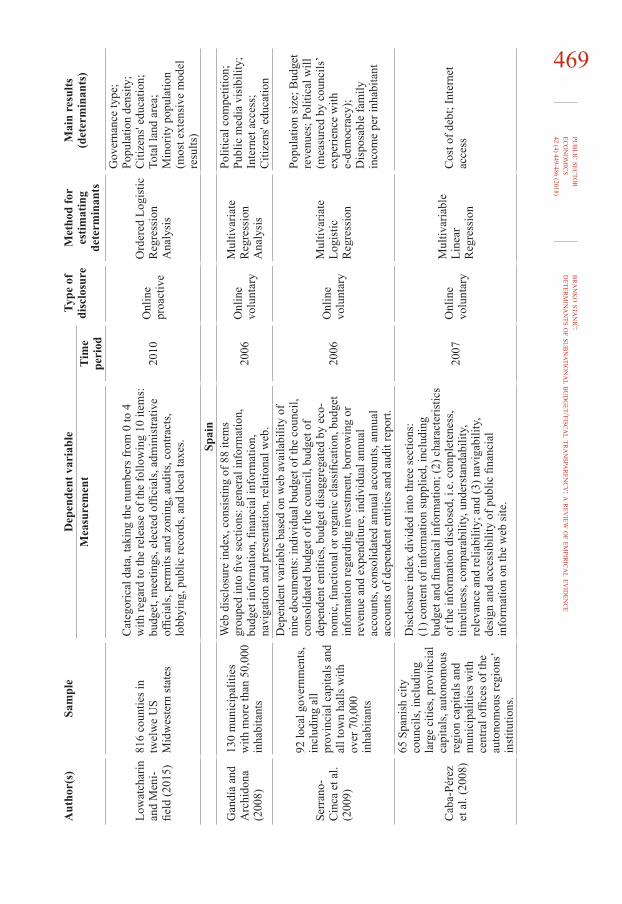
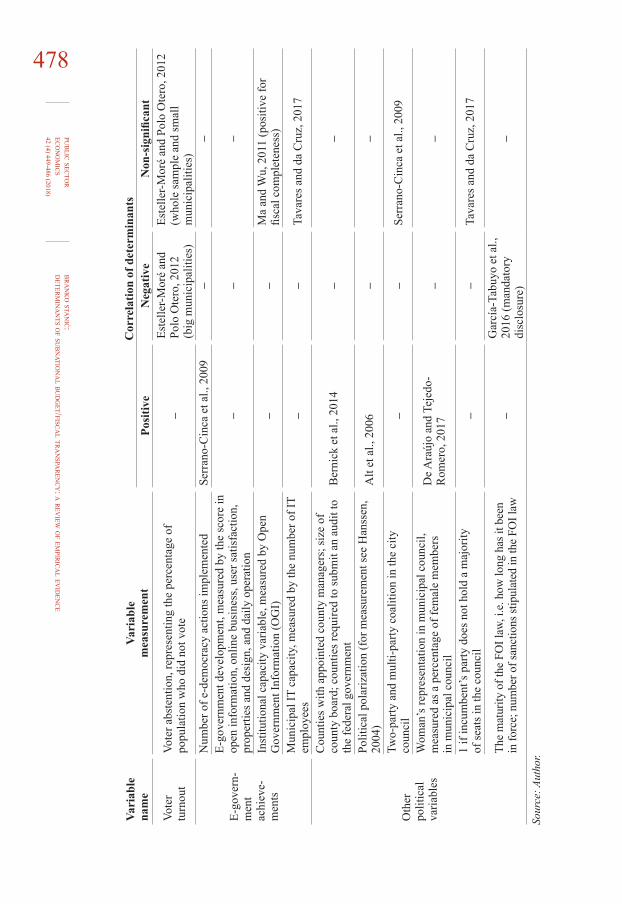
449 BRANKO STANIĆ Determinants of subnational budgetfiscal transparency a review of empirical evidence
book review 487 UNITED NATIONS
Working Together Integration Institutions and the Sustainable Development Goals World Public Sector Report 2018 (Predrag Bejaković)
Vol 42 No 4 I pp 353-494 I December 2018 I Zagreb
Public Sector Economics
42018
Fiscal convergence and sustainability in the European Union
VLADIMIR ARČABIĆ PhD
ArticleJEL C32 C33 E62 H60httpsdoiorg103326pse4241
The author would like to thank Junsoo Lee Robert J Sonora Hrvoje Šimović Josip Tica Tomislav Globan Kyoung Tae Kim Ozana Nadoveza Jelić Irena Raguž Krištić Yu You and two anonymous referees for helpful comments on the paper This work has been supported in part by Croatian Science Foundation under the project 6785
Received June 1 2018 Accepted October 10 2018
The article was judged the best paper in the regular category in the annual competition for the Prof Dr Marijan Hanžeković Prize for 2018
Vladimir ARČABIĆUniversity of Zagreb Faculty of Economics and Business Department of Macroeconomics and Economic Development Trg J F Kennedyja 6 10000 Zagreb CroatiaE-mail varcabicefzghr ORCiD 0000-0003-4173-8637
vla
dim
ir ar
ča
bić
fisca
l co
nv
erg
enc
e an
d susta
ina
bility in th
e eur
opea
n un
ion
pub
lic secto
r ec
on
om
ics
42 (4) 353-380 (2018)
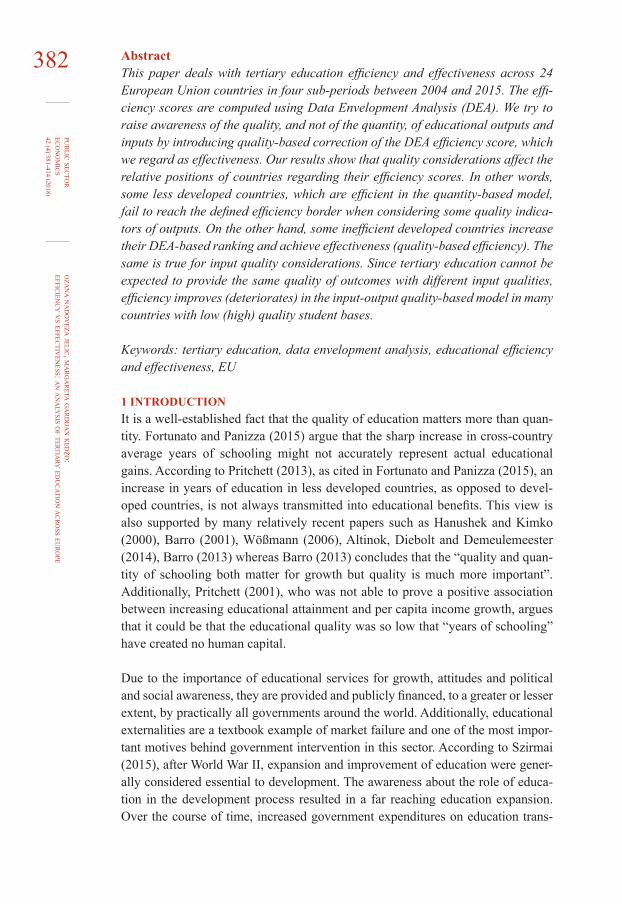
354 abstractThis paper analyzes fiscal convergence and sustainability in the European Union using data on government debt revenues and expenditures Absolute fiscal diver-gence is present in the EU especially after the sovereign debt crisis However we find evidence of fiscal club convergence when clubs are endogenously determined Club convergence is important for the EU because there is no single fiscal policy and member statesrsquo policies are heterogeneous Endogenous clubs do not share the usual geographical political or development similarities Fiscal policy in the EU is found to be unsustainable but it is countercyclical We use a policy response function where the primary surplus is a function of public debt and the output gap The primary surplus does not respond to changes in public debt and this is con-sidered to be unsustainable However it increases in expansions and decreases in recessions thus being countercyclical The countercyclical primary surplus is important for smoothing business cycles
Keywords convergence clubs fiscal sustainability public debt structural breaks log t test dynamic panel
1 IntroductIonWith the sovereign debt crisis in the Eurozone fiscal policy has become an increasingly important topic The sovereign debt crisis and the Great Recession led to many European Union countries breaching the public debt and deficit goals set by Stability and Growth Pact (SGP) The goals are for public debt not to exceed 60 of GDP and for the deficit not to exceed 3 of GDP These goals which are part of the nominal convergence criteria were established to ensure sound and sustainable public finances in the European Union However whether or not there is a convergence of member statesrsquo fiscal policies and whether fiscal policy is sustainable is still an open question
This paper analyzes fiscal convergence and tests for fiscal sustainability in the European Union We test fiscal convergence directly using government revenue expenditure and debt as key government variables instead of testing for GDP convergence as is usual in the convergence literature The paper considers both absolute convergence and convergence clubs which is important because the European Union does not have a single fiscal policy and member statesrsquo policies are heterogeneous Heterogeneous fiscal policies among member states could easily lead to different fiscal convergence clubs which are analyzed in the paper Based on the identified convergence clubs we test for fiscal sustainability in the clubs as well as in the whole of the European Union Fiscal sustainability has become an especially important topic for the EU countries after the Greek crisis
The literature on fiscal convergence is relatively scarce Economic integration common institutional factors and common policies in the EU should lead to con-vergence in key fiscal indicators On the other hand the sovereign debt crisis and the Great Recession affected member states in different ways possibly leading to
vla
dim
ir ar
ča
bić
fisca
l co
nv
erg
enc
e an
d susta
ina
bility in th
e eur
opea
n un
ion
pub
lic secto
r ec
on
om
ics
42 (4) 353-380 (2018)355fiscal divergence It seems that the observed period plays an important role Earlier
research finds some evidence of fiscal convergence in the period from the late 1960s to the early 2000s (De Bandt and Mongelli 2000 and Delgado 2006) while more recent studies such as Kočenda Kutan and Yigit (2008) show the lack of it in the period from 1995 to 2005 The mentioned papers measure convergence using the popular β- and α-convergence tests as well as cointegration tests in a time series framework
The literature does not tackle the issue of convergence clubs regarding fiscal pol-icy However the idea of convergence clubs is implicitly included in discussions on the EU core and periphery or on the two-speed Europe idea popularized by Blanchard (2010) which argues that different groups of European countries show faster and slower recoveries after the Great Recession Accordingly fiscal conver-gence and the possibility of convergence clubs are important issues for EU poli-cymakers This paper analyzes both absolute convergence and club convergence Instead of grouping countries according to ad-hoc criteria such as geographical location or EU accession date we determine convergence clubs endogenously
We also analyze fiscal sustainability within the clubs and in the whole EU 28 using a policy response function proposed by Bohn (1998 2007) Fiscal policy is sustainable if the primary government surplus increases as a response to the increase in public debt This is considered responsible and sustainable behavior because the government increases its revenue or decreases spending when faced with a higher public debt Bohn (1998 2005) concludes that US fiscal policy is sustainable Cassou Shadmani and Vaacutezquez (2017) refine this finding by showing that the US fiscal policy is sustainable only during good economic times but not in times of economic distress
The research regarding European fiscal policy is somewhat different Collignon (2012) develops a policy response function to analyze European fiscal sustainabil-ity His policy response function is adjusted to EU fiscal rules looking at the pri-mary surplus response to changes in debt and deficit Results indicate that Euro-pean fiscal policy is sustainable in this respect but conditions on financial markets and the risk of financial contagion can make it insufficient as shown by the Greek crisis Research has also focused on the cyclical behavior of fiscal policy The common understanding is that fiscal policy should be countercyclical higher gov-ernment spending in recessions followed by fiscal consolidation in expansions to smooth business cycles The countercyclical fiscal policy is sustainable in the long run when extra deficits accumulated in recessions are compensated for during times of economic growth Balassone Francese and Zotteri (2010) show that budget balance in fourteen EU countries deteriorates during recessions but does not improve to the same extent during expansions Government expenditures are responsible for the asymmetry
vla
dim
ir ar
ča
bić
fisca
l co
nv
erg
enc
e an
d susta
ina
bility in th
e eur
opea
n un
ion
pub
lic secto
r ec
on
om
ics
42 (4) 353-380 (2018)
356 Public debt sustainability has been widely analyzed for individual countries as well Babić (2003) and Mihaljek (2004) analyze the sustainability of public and external debt in Croatia This early analysis1 concluded that Croatian public debt is not too sensitive to the various shocks analyzed but credit rating and interest rate spread in Croatia are worse than those of central European countries Deskar-Škrbić and Šimović (2017) on the other hand showed that public debt level affects the effectiveness of fiscal spending by reducing the size of fiscal effects in Croatia
This paper contributes to the literature by analyzing absolute fiscal convergence and convergence clubs using quarterly data for government debt revenues and expenditures in EU member states from 20001 to 20172 We test convergence using a log t test proposed by Phillips and Sul (2007 2009) accompanied with the clustering algorithm for endogenous club classification Commonly used β- and σ-convergence tests might be biased and suffer from low power as noted in Ber-nard and Durlauf (1995 1996) among others Such tests assume linear dynamics in the convergence process Phillips and Sulrsquos (2007) log t test is based on a non-linear dynamic factor model which allows a nonlinear adjustment in parameters both over time and across different countries Therefore it is suitable in testing for convergence We check the robustness of our results by applying recently devel-oped unit root tests which control for both sharp and smooth structural breaks
The paper also contributes to the fiscal policy sustainability literature We use a policy response function proposed by Bohn (1998) in a panel framework where the primary government surplus is a function of public debt and the output gap We use a dynamic panel model and include a lagged dependent variable in the equation since there is a strong inter-temporal relationship between the govern-ment surplus and public debt Furthermore EU countries are somewhat homoge-nous and therefore there is a possibility of cross-sectional dependence Unlike the previous literature we use a dynamic panel system GMM estimator with common correlated effects proposed by Pesaran (2006) which controls for pronounced homogeneity among the EU countries
The main findings can be summarized as follows There is strong and robust evi-dence of absolute divergence in government debt revenues and expenditures among the EU countries The process of divergence was intensified during the sovereign debt crisis and the Great Recession However we find two three and four endogenous convergence clubs in government debt revenue and expendi-tures respectively The clubs are found to be quite heterogeneous club members do not share the usual geographical political or development similarities On the other hand groups of EU-15 and EU-13 countries as well as EU core and EU periphery countries are shown to diverge which suggests an important difference between endogenous and exogenous groupings
1 1997-2003 period is considered
vla
dim
ir ar
ča
bić
fisca
l co
nv
erg
enc
e an
d susta
ina
bility in th
e eur
opea
n un
ion
pub
lic secto
r ec
on
om
ics
42 (4) 353-380 (2018)357Fiscal policy is found to be unsustainable but countercyclical both in the EU as a
whole and within identified convergence clubs Our model does not show an increase in the primary surplus after debt upsurge which is identified as unsus-tainable behavior We find only limited evidence of fiscal sustainability in the EU-13 group and in a subsample with public debt higher than 90 On the other hand fiscal policy in the EU is countercyclical indicating the efforts of fiscal policy to smooth business cycles
The paper is structured as follows Section 2 explains and presents the data It describes empirical methods used in the paper namely log t test and the clustering algorithm for club convergence analysis unit root tests with structural breaks and the dynamic panel model used for the sustainability analysis Section 3 presents results on fiscal convergence and sustainability while section 4 concludes
2 data and methodology21 dataFor convergence analysis we use quarterly general government debt revenues and expenditures in a percent of GDP as our key variables Variables in current prices are divided by nominal GDP and expressed in real terms as a percent of GDP The data span from 2000q1 to 2017q2 which is the longest available period for a balanced panel for 28 EU countries For the sustainability analysis we use primary surplus public debt and the output gap data but the sample starts in 2002q1 because of the availability of primary surplus data The primary sur-plus is calculated as total surplus plus payable interest and it is expressed as a percent of GDP Public debt is expressed as a percent of GDP as well The output gap is a percent deviation of GDP from its long-run trend computed using the Hodrick and Prescott (1997) filter
All variables are seasonally adjusted using Census X11 method for Census Bureaursquos X12-ARIMA program Data are collected primarily from the Eurostat and International Financial Statistics (IFS) database For Croatia we use central government revenues and expenditures provided by the Croatian National Bank as a proxy for general government For some countries we had to reconstruct data from different sources to work with balanced panels for the analysis Details on data construction are explained in appendix Appendix also plots series of govern-ment debt revenues expenditures and primary surplus as a percent of GDP and presents basic descriptive statistics
22 the log t conVergence test and club conVergenceWe use the log t test for convergence analysis of government debt revenues and expenditures as well as for analysis of convergence clubs The test was developed by Phillips and Sul (2007 2009) who built on a neoclassical growth model with heterogeneous technology and looked for the output convergence Intuitively the test looks at cross-sectional dispersion over time If the dispersion decays over time countries are becoming more similar ie there is convergence Phillips and
vla
dim
ir ar
ča
bić
fisca
l co
nv
erg
enc
e an
d susta
ina
bility in th
e eur
opea
n un
ion
pub
lic secto
r ec
on
om
ics
42 (4) 353-380 (2018)
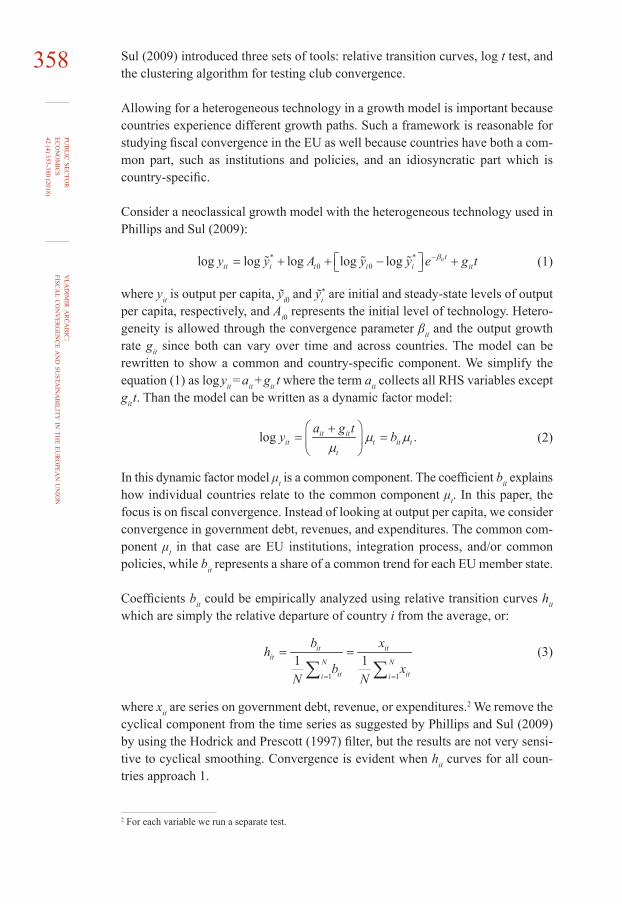
358 Sul (2009) introduced three sets of tools relative transition curves log t test and the clustering algorithm for testing club convergence
Allowing for a heterogeneous technology in a growth model is important because countries experience different growth paths Such a framework is reasonable for studying fiscal convergence in the EU as well because countries have both a com-mon part such as institutions and policies and an idiosyncratic part which is country-specific
Consider a neoclassical growth model with the heterogeneous technology used in Phillips and Sul (2009)
(1)
where yit is output per capita ỹi0 and ỹi are initial and steady-state levels of output
per capita respectively and Ai0 represents the initial level of technology Hetero-geneity is allowed through the convergence parameter βit and the output growth rate git since both can vary over time and across countries The model can be rewritten to show a common and country-specific component We simplify the equation (1) as log yit = ait + git t where the term ait collects all RHS variables except git t Than the model can be written as a dynamic factor model
(2)
In this dynamic factor model μt is a common component The coefficient bit explains how individual countries relate to the common component μt In this paper the focus is on fiscal convergence Instead of looking at output per capita we consider convergence in government debt revenues and expenditures The common com-ponent μt in that case are EU institutions integration process andor common policies while bit represents a share of a common trend for each EU member state
Coefficients bit could be empirically analyzed using relative transition curves hit which are simply the relative departure of country i from the average or
(3)
where xit are series on government debt revenue or expenditures2 We remove the cyclical component from the time series as suggested by Phillips and Sul (2009) by using the Hodrick and Prescott (1997) filter but the results are not very sensi-tive to cyclical smoothing Convergence is evident when hit curves for all coun-tries approach 1
2 For each variable we run a separate test
vla
dim
ir ar
ča
bić
fisca
l co
nv
erg
enc
e an
d susta
ina
bility in th
e eur
opea
n un
ion
pub
lic secto
r ec
on
om
ics
42 (4) 353-380 (2018)359The log t test is a more formal way for testing convergence The test builds on
relative transition curves and has the following form
(4)
where is a quadratic distance measure which goes to 0 when countries converge t = T0 T where T0 is the first observation after we discard the initial 30 of observations as suggested by Phillips and Sul (2009) Second term on LHS is a penalty function which improves test performance and ut is an iid error Convergence is tested with the coefficient γ When γ is negative and statistically significant we can conclude that countries diverge If 0 le γ lt 2 we can conclude there is a conditional convergence in growth rates For absolute convergence to hold γ ge 23 The critical value at 5 level significance is 165
Phillips and Sul (2007 2009) also developed a clustering algorithm for detecting endogenous convergence clubs based on the log t regression If the convergence hypothesis is rejected for the full sample club convergence can be considered The clustering algorithm has four steps Simplified in the first step we sort coun-tries in the panel and in the second step we form a core group of k countries where k lt N for which the log t regression yields the highest t-statistics4 The remaining N ndash k countries form a complementary group In the third step we add one country at the time from the complementary to the core group and for each we apply the log t test If t gt -165 the new country is added to the core group The first convergence club is obtained after all countries that satisfy the condition are added In the fourth step we apply the log t test on the group of remaining coun-tries which are not a part of the first convergence club If the t-statistic is greater than -165 the second convergence club is identified If not we repeat steps (1) to (3) on the group of remaining countries to identify other possible convergence clubs
To obtain as few clubs as possible we run separate tests for club merging Once initial clubs are identified we run the log t test on them If convergence hypothesis is not rejected for club 1 and club 2 we merge them and form a new club 1 New club 1 is then tested for merging with club 3 and so on The advantage of this procedure is that it produces fewer convergence clubs but the downside is that the evidence for convergence is less convincing because the t-statistic on the γ coef-ficient is usually insignificant
23 unIt root tests for conVergenceWe use different unit root tests for convergence analysis within identified clubs to check the robustness of our results We test for convergence in government debt revenues and expenditures both in the full sample of EU 28 and in each identified convergence club Following the approach of Bernard and Durlauf (1995) and
3 Phillips and Sul (2007 2009) provide more technical details of the test For empirical analysis we use a set of procedures described in Du (2017)4 To form a group the t-statistic for parameter γ from log t regression must be t gt -165
vla
dim
ir ar
ča
bić
fisca
l co
nv
erg
enc
e an
d susta
ina
bility in th
e eur
opea
n un
ion
pub
lic secto
r ec
on
om
ics
42 (4) 353-380 (2018)
360 Pesaran (2007) we compute a difference between country i and the average which we test for the unit root xit = xit ndash xt (5)
where xit represents government debt revenues or expenditures in country i and xt is an adjusted average excluding country i under consideration The adjusted average should prevent a bias in testing which could be large for big countries such as Germany
If the difference series xit is stationary then there is convergence in government debt revenues or expenditures Shocks to an individual countryrsquos fiscal variables may be permanent or temporary but all shocks to the difference series xit should be only temporary if country i converges to the average Rejection of unit root is evidence of convergence If our results are robust rejections should be higher within identified clubs than in the full sample of EU 28
We apply unit root tests developed by Lee and Strazicich (2003) and Enders and Lee (2012) that can control for structural breaks Structural breaks are highly pos-sible in government debt revenues and expenditures time series since they include the period of the sovereign debt crisis and the Great Recession in the EU Ignoring structural breaks might be a serious problem that reduces the power of the test as argued in Perron (1989) We also present results of a standard ADF test which does not control for structural breaks Intuitively structural breaks are abrupt changes in the data such as the Great Recession It is possible that the con-vergence was present both before and after the break but the existence of the break violates our conclusions
The Lee and Strazicich (2003) unit root test controls for two sharp breaks in the data It is a Lagrange Multiplier (LM) test with the equation
∆ xt = δʹ∆ Zt + ϕ Stndash1 + εt (6)
where St is a detrended xt series and ϕ is a coefficient of interest Under the null hypothesis of unit root ϕ = 0 and the rejection of unit root implies convergence
We use the so-called break model which allows for two breaks in both level and the trend of the series using dummy variable vector Zt = [1 t D1t D2t DT1t DT2t] Dummy variables D1t and D2t control for breaks in level and take value 1 if t ge TBj + 1 and 0 otherwise for breaks j = 1 2 where TBj are break locations On the other hand dummy variables DT1t and DT2t control for breaks in the trend where DTjt = t ndash TBj for t ge TBj + 1 and 0 otherwise for breaks j = 1 2 Break locations TB1 and TB2 are endogenously determined in a grid search which minimizes the t-sta-tistics of coefficient ϕ
Critical values for the LM test with two breaks in a level and the trend are taken from table 2 of Lee and Strazicich (2003) Number of lags in the equation (6) is chosen based on general to specific procedure
vla
dim
ir ar
ča
bić
fisca
l co
nv
erg
enc
e an
d susta
ina
bility in th
e eur
opea
n un
ion
pub
lic secto
r ec
on
om
ics
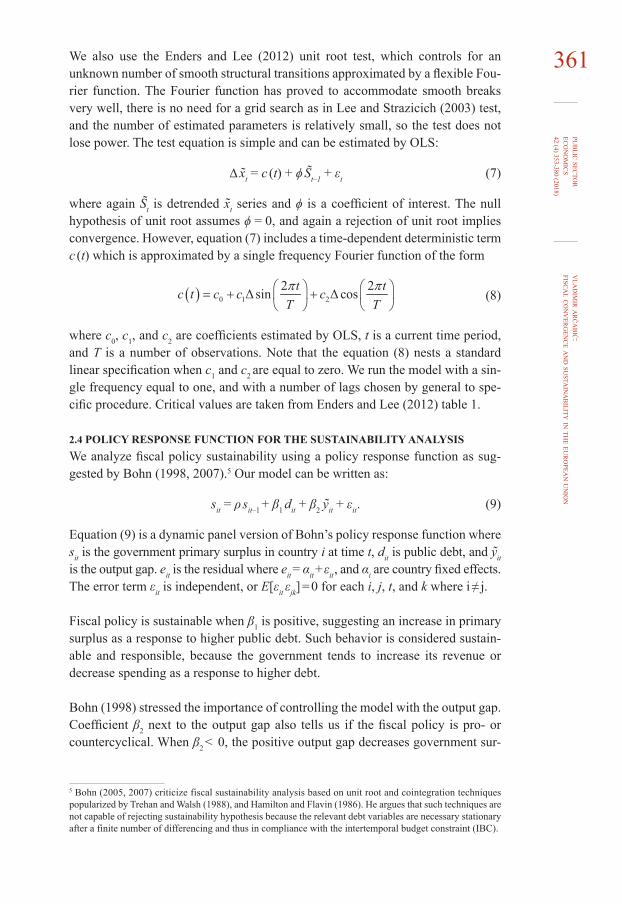
42 (4) 353-380 (2018)361We also use the Enders and Lee (2012) unit root test which controls for an
unknown number of smooth structural transitions approximated by a flexible Fou-rier function The Fourier function has proved to accommodate smooth breaks very well there is no need for a grid search as in Lee and Strazicich (2003) test and the number of estimated parameters is relatively small so the test does not lose power The test equation is simple and can be estimated by OLS
∆ xt = c (t) + ϕ Stndash1 + εt (7)
where again St is detrended xt series and ϕ is a coefficient of interest The null hypothesis of unit root assumes ϕ = 0 and again a rejection of unit root implies convergence However equation (7) includes a time-dependent deterministic term c (t) which is approximated by a single frequency Fourier function of the form
(8)
where c0 c1 and c2 are coefficients estimated by OLS t is a current time period and T is a number of observations Note that the equation (8) nests a standard linear specification when c1 and c2 are equal to zero We run the model with a sin-gle frequency equal to one and with a number of lags chosen by general to spe-cific procedure Critical values are taken from Enders and Lee (2012) table 1
24 PolIcy resPonse functIon for the sustaInabIlIty analysIsWe analyze fiscal policy sustainability using a policy response function as sug-gested by Bohn (1998 2007)5 Our model can be written as
sit = ρ sitndash1 + β1 dit + β2 yit + εit (9)
Equation (9) is a dynamic panel version of Bohnrsquos policy response function where sit is the government primary surplus in country i at time t dit is public debt and yit is the output gap eit is the residual where eit = αit + εit and αi are country fixed effects The error term εit is independent or E[εit εjk] = 0 for each i j t and k where i ne j
Fiscal policy is sustainable when β1 is positive suggesting an increase in primary surplus as a response to higher public debt Such behavior is considered sustain-able and responsible because the government tends to increase its revenue or decrease spending as a response to higher debt
Bohn (1998) stressed the importance of controlling the model with the output gap Coefficient β2 next to the output gap also tells us if the fiscal policy is pro- or countercyclical When β2 lt 0 the positive output gap decreases government sur-
5 Bohn (2005 2007) criticize fiscal sustainability analysis based on unit root and cointegration techniques popularized by Trehan and Walsh (1988) and Hamilton and Flavin (1986) He argues that such techniques are not capable of rejecting sustainability hypothesis because the relevant debt variables are necessary stationary after a finite number of differencing and thus in compliance with the intertemporal budget constraint (IBC)
vla
dim
ir ar
ča
bić
fisca
l co
nv
erg
enc
e an
d susta
ina
bility in th
e eur
opea
n un
ion
pub
lic secto
r ec
on
om
ics
42 (4) 353-380 (2018)
362 plus and fiscal policy can be considered as procyclical and vice versa (Balassone Francese and Zotteri 2010)
Our model includes a richer dynamic than initially proposed in Bohn (1998) by including a lagged primary surplus (Cassou Shadmani and Vaacutezquez 2017) This specification is more appropriate because it allows for fiscal policy persistence and because of a possible feedback effect between public debt and surplus in a panel framework accumulated government deficits (negative surpluses) are closely related to public debt
The benchmark model is estimated by a system GMM augmented with common correlated effects (CCE) proposed by Pesaran (2006) to deal with cross-sectional dependence The system GMM estimator proposed by Arellano and Bover (1995) and Blundell and Bond (1998) is often used for dynamic panel estimation and we use their two-step procedure with robust standard errors where fixed effects are removed by first differencing6
Our panel consists of European Union countries which are somewhat homoge-nous in terms of common institutions and policies and therefore a cross-sectional dependence can be an important issue affecting our results7 To deal with the issue of cross-sectional dependence we augment the system GMM estimator by adding cross-sectional means of all variables as instruments in the model from the equa-tion (9) Common correlated effects procedure is proposed by Pesaran (2006) for a group of OLS estimators However we use this principle to augment system GMM estimator Pesaran (2006) showed that adding CCE has satisfactory small sample properties for relatively small N and T even in heterogeneous models We call this model system GMM-CCE model
We confirm the robustness of the benchmark model by estimating a dynamic panel model with fixed effects (FE) using robust errors Our data set is a balanced panel with a reasonably large T = 62 and therefore the FE estimator should not be biased We refer to this model simply as the FE model
3 fIscal conVergence and sustaInabIlIty31 conVergence clubsWe do not find any evidence to support the absolute convergence of government debt revenues and expenditures in the EU using relative transition curves and log t test The relative transition curves in figure 1 show lack of convergence because they do not approach 1 in the observed period By contrast curves are scattered equally at the beginning and the end of the sample
6 We use first differencing instead of forward orthogonal deviaton (FOD) because our data set is a balanced panel Refer to Arellano and Bover (1995) and Blundell and Bond (1998) for complete technical details7 Indeed when we apply Pesaran (2015) test for weak cross-sectional dependence to the model the null hypoth-esis of cross-sectional independence can be easily rejected
vla
dim
ir ar
ča
bić
fisca
l co
nv
erg
enc
e an
d susta
ina
bility in th
e eur
opea
n un
ion
pub
lic secto
r ec
on
om
ics
42 (4) 353-380 (2018)363Figure 1
Relative transition paths(a) Gov debt (b) Gov revenues
Estonia Estonia
BelgiumGreece
05
11
52
25
Rel
ativ
e tra
nsiti
on p
aram
eter
2000q3 2004q3 2008q3 2012q3 2016q3Quarter
Transition paths for government debt
Cyprus
Ireland
SwedenFinland
68
11
21
4R
elat
ive
trans
ition
par
amet
er
2000q3 2004q3 2008q3 2012q3 2016q3Quarter
Transition paths for government revenue
(c) Gov expenditures
Ireland
Ireland
Croatia France
68
11
21
4R
elat
ive
trans
ition
par
amet
er
2000q3 2004q3 2008q3 2012q3 2016q3Quarter
Transition paths for government expenditures
This is further supported by a more formal log t test presented in table 1 Table 1 shows γ coefficient from the log t regression applied to government debt (1a) rev-enues (1b) and expenditures (1c) data Again γ lt 0 implies divergence 0 le γ lt 2 is evidence of conditional convergence and γ ge 2 implies absolute convergence in levels Table 1 shows that γ coefficient is significantly negative (marked with an asterisk) when log t test is applied to all EU countries which rejects absolute con-vergence of government debt revenues and expenditures Kočenda Kutan and Yigit (2008) also find fiscal divergence in a form of pronounced level of heteroge-neity in public debt and deficit among EU member states
We also find that the Great Recession and sovereign debt crisis further increased fiscal divergence in the EU In figure 2 we show results of estimated rolling win-dow γ coefficient for government debt revenues and expenditures We estimate the log t regression with a centered rolling window of 20 quarters (five years) together with 95 confidence intervals For all three variables estimates are sig-nificantly negative throughout the observed period which further confirms the result of fiscal divergence An interesting finding is that the estimated γ further decreases from 2008 in the case of government revenues and expenditures and from 2011 in the case of government debt Therefore it could be argued that the Great Recession and sovereign debt crisis pushed the EU further away from fiscal convergence
vla
dim
ir ar
ča
bić
fisca
l co
nv
erg
enc
e an
d susta
ina
bility in th
e eur
opea
n un
ion
pub
lic secto
r ec
on
om
ics
42 (4) 353-380 (2018)
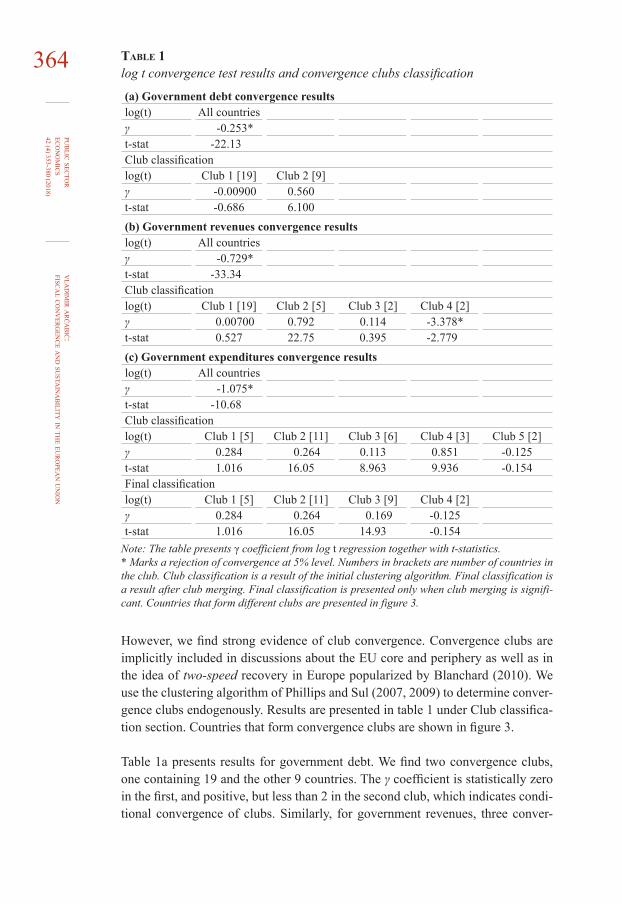
364 Table 1log t convergence test results and convergence clubs classification
(a) government debt convergence resultslog(t) All countriesγ -0253t-stat -2213Club classificationlog(t) Club 1 [19] Club 2 [9]γ -000900 0560t-stat -0686 6100(b) government revenues convergence resultslog(t) All countriesγ -0729t-stat -3334Club classificationlog(t) Club 1 [19] Club 2 [5] Club 3 [2] Club 4 [2]γ 000700 0792 0114 -3378t-stat 0527 2275 0395 -2779(c) government expenditures convergence resultslog(t) All countriesγ -1075t-stat -1068Club classificationlog(t) Club 1 [5] Club 2 [11] Club 3 [6] Club 4 [3] Club 5 [2]γ 0284 0264 0113 0851 -0125t-stat 1016 1605 8963 9936 -0154Final classificationlog(t) Club 1 [5] Club 2 [11] Club 3 [9] Club 4 [2]γ 0284 0264 0169 -0125t-stat 1016 1605 1493 -0154
Note The table presents γ coefficient from log t regression together with t-statistics Marks a rejection of convergence at 5 level Numbers in brackets are number of countries in the club Club classification is a result of the initial clustering algorithm Final classification is a result after club merging Final classification is presented only when club merging is signifi-cant Countries that form different clubs are presented in figure 3
However we find strong evidence of club convergence Convergence clubs are implicitly included in discussions about the EU core and periphery as well as in the idea of two-speed recovery in Europe popularized by Blanchard (2010) We use the clustering algorithm of Phillips and Sul (2007 2009) to determine conver-gence clubs endogenously Results are presented in table 1 under Club classifica-tion section Countries that form convergence clubs are shown in figure 3
Table 1a presents results for government debt We find two convergence clubs one containing 19 and the other 9 countries The γ coefficient is statistically zero in the first and positive but less than 2 in the second club which indicates condi-tional convergence of clubs Similarly for government revenues three conver-
vla
dim
ir ar
ča
bić
fisca
l co
nv
erg
enc
e an
d susta
ina
bility in th
e eur
opea
n un
ion
pub
lic secto
r ec
on
om
ics
42 (4) 353-380 (2018)365gence clubs emerged and club sizes are 19 5 and 3 (table 1b) Ireland and Roma-
nia form a divergence group since they do not converge to any club For govern-ment expenditures club classification finds five clubs in total plus Ireland as a divergent group However clubs 3 and 4 can be merged together according to log t test so the final classification shows four convergence clubs plus Ireland (table 1c) Club sizes are 5 11 9 and 2 for Clubs 1 2 3 and 4 respectively In each case 0 le γ lt 2 indicating conditional convergence
Figure 2Rolling window estimation of log t regression
(a) Gov debt (b) Gov revenues
-9-8
-7-6
-5
2005q1 2008q1 2011q1 2014q1 2017q1
Time2log t coefficient
-9-8
-7-6
2005q1 2008q1 2011q1 2014q1 2017q1
Time2log t coefficient
(c) Gov expenditures
-12
-1-8
-6-4
-2
2005q1 2008q1 2011q1 2014q1 2017q1
Time2log t coefficient
Identified clubs are heterogeneous in a sense that countries within a club do not share common geographical political or development similarities In figure 3 we show countries that form different clubs The first row of figure 3 shows clubs from 1 to 4 and divergent groups The first column indicates fiscal variables gov-ernment debt revenues and expenditures Convergence clubs are in squares while divergent groups are in circles For example government debt Club 1 includes Croatia Cyprus Estonia Hungary Lithuania Romania Slovakia and Slovenia which are new member states mostly small countries and most of them experienced the transition from centrally planned to market economy However Austria Belgium Finland France Greece Ireland Italy Portugal Spain Swe-den and the UK are also members of the same club (government debt Club 1) Similar diversity can be found within other clubs
vla
dim
ir ar
ča
bić
fisca
l co
nv
erg
enc
e an
d susta
ina
bility in th
e eur
opea
n un
ion
pub
lic secto
r ec
on
om
ics
42 (4) 353-380 (2018)
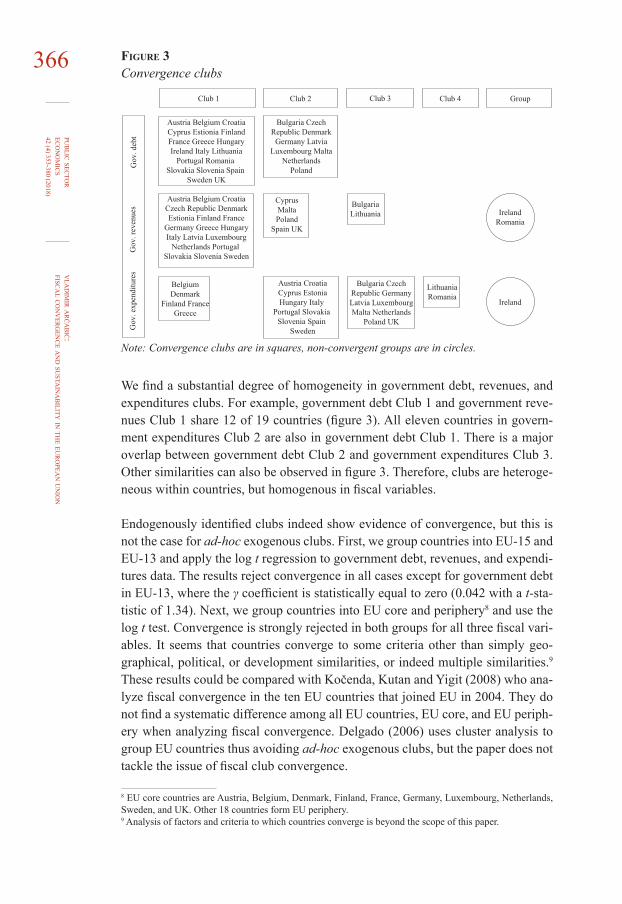
366 Figure 3Convergence clubs
Club 1 Club 2
Gov
exp
endi
ture
s G
ov r
even
ues
Gov
deb
t
Club 3 Club 4 Group
Austria Belgium CroatiaCyprus Estionia FinlandFrance Greece HungaryIreland Italy Lithuania
Portugal Romania Slovakia Slovenia Spain
Sweden UK
Bulgaria CzechRepublic Denmark
Germany LatviaLuxembourg Malta
NetherlandsPoland
CyprusMaltaPoland
Spain UK
Austria CroatiaCyprus EstoniaHungary Italy
Portugal Slovakia Slovenia Spain
Sweden
Bulgaria CzechRepublic GermanyLatvia LuxembourgMalta Netherlands
Poland UK
BulgariaLithuania Ireland
Romania
Ireland
LithuaniaRomania
Austria Belgium CroatiaCzech Republic DenmarkEstionia Finland France
Germany Greece HungaryItaly Latvia Luxembourg
Netherlands Portugal Slovakia Slovenia Sweden
BelgiumDenmark
Finland FranceGreece
Note Convergence clubs are in squares non-convergent groups are in circles
We find a substantial degree of homogeneity in government debt revenues and expenditures clubs For example government debt Club 1 and government reve-nues Club 1 share 12 of 19 countries (figure 3) All eleven countries in govern-ment expenditures Club 2 are also in government debt Club 1 There is a major overlap between government debt Club 2 and government expenditures Club 3 Other similarities can also be observed in figure 3 Therefore clubs are heteroge-neous within countries but homogenous in fiscal variables
Endogenously identified clubs indeed show evidence of convergence but this is not the case for ad-hoc exogenous clubs First we group countries into EU-15 and EU-13 and apply the log t regression to government debt revenues and expendi-tures data The results reject convergence in all cases except for government debt in EU-13 where the γ coefficient is statistically equal to zero (0042 with a t-sta-tistic of 134) Next we group countries into EU core and periphery8 and use the log t test Convergence is strongly rejected in both groups for all three fiscal vari-ables It seems that countries converge to some criteria other than simply geo-graphical political or development similarities or indeed multiple similarities9 These results could be compared with Kočenda Kutan and Yigit (2008) who ana-lyze fiscal convergence in the ten EU countries that joined EU in 2004 They do not find a systematic difference among all EU countries EU core and EU periph-ery when analyzing fiscal convergence Delgado (2006) uses cluster analysis to group EU countries thus avoiding ad-hoc exogenous clubs but the paper does not tackle the issue of fiscal club convergence
8 EU core countries are Austria Belgium Denmark Finland France Germany Luxembourg Netherlands Sweden and UK Other 18 countries form EU periphery9 Analysis of factors and criteria to which countries converge is beyond the scope of this paper
vla
dim
ir ar
ča
bić
fisca
l co
nv
erg
enc
e an
d susta
ina
bility in th
e eur
opea
n un
ion
pub
lic secto
r ec
on
om
ics
42 (4) 353-380 (2018)367The log t regression improves upon the standard β-convergence tests but results are
compatible with such tests In figure 4 we show a simple scatter plot of government debt level and a growth rate which is a version of an unconditional β-convergence test For government debt Clubs 1 and 2 we estimate the equation of the form log (dTi d1i) = α + β d1i + εi where the dependent variable is the debt growth rate between the last and the first period and the independent variable is a debt level in the first period Club 1 is depicted with black circles and Club 2 with grey pluses As shown in the figure 4 regression lines for each club are negatively sloped indi-cating convergence within clubs according to the standard β-convergence test
Figure 4β-convergence in clubs
-1-5
05
11
5
Deb
t gro
wth
0 1 2 3 4 5Debt level
Club 1 Club 2
Beta convergence among clubs
32 unIt root tests of fIscal conVergenceTable 2 presents results of fiscal convergence using unit root tests for the sample of 28 EU countries and within clubs identified by the clustering algorithm For the government debt data we analyze convergence to the average for the full sample of the EU 28 then for the 19 countries of convergence club 1 and then for the 9 countries of club 2 (table 2a) A similar analysis is done for government revenues and expenditure in table 2b and 2c respectively For each club we compute a separate adjusted average Unit root rejection rates at 10 significance level are presented for ADF Lee and Strazicich (2003) and Enders and Lee (2012) test Rejection of the unit root hypothesis is considered evidence of convergence
vla
dim
ir ar
ča
bić
fisca
l co
nv
erg
enc
e an
d susta
ina
bility in th
e eur
opea
n un
ion
pub
lic secto
r ec
on
om
ics
42 (4) 353-380 (2018)
368 Table 2Club convergence using unit root tests2a Percent of countries converging to the average gov debt ()
adf lee amp strazicich enders amp leeEU [28] 357 357 714Club 1 [19] 000 526 526Club 2 [9] 2222 000 000
2b Percent of countries converging to the average gov revenues ()adf lee amp strazicich enders amp lee
EU [28] 3571 8571 4643Club 1 [19] 4211 9474 5789Club 2 [5] 4000 10000 4000Club 3 [2] 000 10000 10000
2c Percent of countries converging to the average gov expenditures ()adf lee amp strazicich enders amp lee
EU [28] 3929 7857 4643Club 1 [5] 4000 10000 4000Club 2 [11] 5455 9091 8181Club 3 [9] 3333 7778 5556Club 4 [2] 10000 10000 10000
Notes Rejection rates of unit root hypothesis at 10 level of significance are reported in the table Number of countries in a club is in brackets The rejection rate is calculated as ( of rejections of countries within a club)times100
We find neither absolute nor club convergence in government debt data because the difference of government debt against the average is stationary for just a few countries For the full sample of EU 28 unit root rejection rates are only 35 in the case of ADF and the Lee and Strazicich test and 7 for the Enders and Lee test Rejection rates within two clubs are not much different thus not supporting club convergence of government debt
In the case of government revenues and expenditures we do not find evidence of absolute convergence but club convergence is supported Almost half of countries in the EU 28 sample converge to the average ADF test has low power in the pres-ence of structural breaks but the unit root is rejected in 35 to 40 of countries for both series The Enders and Lee test has more power and rejects the unit root in 46 of countries Finally the Lee and Strazicich test with sharp structural breaks shows the biggest rejection rates of 78 and 85 For both government revenues and expenditures rejection rates within clubs are higher than in the full sample of EU 28 indicating stronger convergence within clubs This is especially true for Lee and Strazicich (2003) test where rejection rates are mostly over 90 within clubs indicating strong club convergence Enders and Lee (2012) test has rejection rates within clubs well over 50 except in government revenues club 2 and government expenditures club 1 ADF test gives somewhat mixed results but does not reject the club convergence hypothesis This confirms that convergence clubs using the Phillips and Sul (2007 2009) clustering algorithm are robust
vla
dim
ir ar
ča
bić
fisca
l co
nv
erg
enc
e an
d susta
ina
bility in th
e eur
opea
n un
ion
pub
lic secto
r ec
on
om
ics
42 (4) 353-380 (2018)369except for government debt As a comparison De Bandt and Mongelli (2000) use
cointegration techniques to analyze fiscal convergence in the Eurozone Their findings support fiscal convergence in the Eurozone over the 1970-1998 period Unit root tests which allow for nonlinearities have recently been a more popular way of analyzing convergence (see Raguž Krištić Rogić Dumančić and Arčabić (2018) and references therein)
33 fIscal (un)sustaInabIlItyNext we analyze if fiscal policy is sustainable in the European Union and within convergence clubs found in the previous section In this respect we use the policy response function from equation (9) which relates primary government surplus with public debt and the output gap If surplus increases as a response to an increase in public debt fiscal policy is considered sustainable as discussed in the methodology section
We analyze fiscal sustainability using seven different models (subsamples) Model 1 is the benchmark model which includes 28 EU countries Models 2 and 3 include subsamples of countries from government debt convergence clubs identi-fied in the previous section The first club consists of 19 and the second of 9 countries10 Next we consider fiscal policy sustainability within exogenous clubs of EU-15 and EU-13 countries with Models 4 and 5 Finally Models 6 and 7 use subsamples with government debt ge 90 (Model 6) and debt lt 90 of GDP (Model 7) This subsample analysis is motivated by the influential paper of Rein-hart and Rogoff (2010) who argue that a public debt higher than 90 of GDP depresses economic growth Maastricht criteria also require government debt below 60 of GDP However EU countries fought with the Great Recession and the sovereign debt crisis which substantially increased the level of public debt in some countries Our data show that 15 out of 28 EU countries had a government debt higher than 60 of GDP in 2017Q2 Therefore such subsample analysis is interesting from both an academic and a policy perspective The 90 level of public debt can be considered as arbitrary especially since Arčabić et al (2018) show there is no single level of public debt associated with the decrease of GDP growth However in this paper we are only interested in fiscal sustainability
Fiscal policy is found to be unsustainable in the EU We present the results of system GMM-CCE and FE estimators in tables 3 and 4 respectively Different models are numbered in the first row of each table and independent variables are in the first column In table 3 the estimated coefficient β1 next to the government debt is negative or insignificant In other words the government does not increase primary surplus as a response of higher government debt and fiscal policy is not sustainable We find weak evidence of fiscal sustainability for the EU-13 group countries and for the subsample with debt ge 90 For these two models (Models
10 We consider government debt convergence clubs only but clubs are fairly homogeneous between fiscal variables as discussed In addition some government revenues and expenditures convergence clubs include only a few countries which is impractical for panel data analysis
vla
dim
ir ar
ča
bić
fisca
l co
nv
erg
enc
e an
d susta
ina
bility in th
e eur
opea
n un
ion
pub
lic secto
r ec
on
om
ics
42 (4) 353-380 (2018)
370 5 and 6) point estimates are positive with both system GMM-CCE and FE estima-tor However coefficients are insignificant for system GMM-CCE estimator and point estimates are small in magnitude in both cases (tables 3 and 4)
Fiscal policy is countercyclical in the EU and in all subsamples considered Balas-sone Francese and Zotteri (2010) and Cassou Shadmani and Vaacutezquez (2017) use β2 coefficient next to the output gap to analyze cyclicality of fiscal policy As pre-sented in tables 3 and 4 the coefficient next to output gap is positive and statisti-cally significant in all models11 Positive output gaps are related to an increase in primary surplus which can be interpreted as a countercyclical fiscal policy This indicates that fiscal policy in the European Union tries to smooth business cycles
Fiscal policy is fairly persistent because the coefficient ρ next to the lagged sur-plus is positive statistically significant and roughly 05
11 Only Model 6 in table 4 has a positive but insignificant output gap
vla
dim
ir ar
ča
bić
fisca
l co
nv
erg
enc
e an
d susta
ina
bility in th
e eur
opea
n un
ion
pub
lic secto
r ec
on
om
ics
42 (4) 353-380 (2018)371
Ta
bl
e 3
Resu
lts o
f fisc
al su
stai
nabi
lity
anal
ysis
usi
ng sy
stem
GM
M-C
CE
mod
el
mod
els
mod
el 1
ben
chm
ark
mod
el 2
clu
b 1
mod
el 3
clu
b 2
mod
el 4
eu
-15
mod
el 5
eu
-13
mod
el 6
deb
t ge 9
0m
odel
7d
ebt lt
90
Varia
bles
Surp
lus
Surp
lus
Surp
lus
Surp
lus
Surp
lus
Surp
lus
Surp
lus
Surp
lus (
lagg
ed) (
ρ)0
502
(0
08)
041
5
(00
9)0
390
(0
10)
054
7
(00
6)0
308
(0
11)
057
3
(02
1)0
526
(0
10)
Deb
t (β 1)
-00
18(0
01)
-00
09(0
01)
-00
43(0
12)
-00
29(0
02)
004
0(0
03)
003
6(0
08)
-00
57
(00
3)
Out
put G
ap (β
2)0
286
(0
05)
041
3
(00
7)0
435
(0
13)
039
4
(00
4)0
388
(0
15)
029
7
(00
9)0
305
(0
07)
Con
stan
t0
776
(07
6)0
122
(10
6)2
030
(56
3)1
879
(12
3)-2
351
(1
15)
-42
98(8
69)
245
9
(14
4)O
bser
vatio
ns1
708
115
954
991
579
328
11
427
Num
ber o
f cou
ntrie
s28
199
15
13
926
F-te
st0
340
e-06
000
139
02
43e-
05 0
003
520
of
inst
rum
ents
2314
1114
11
11
20H
anse
n te
st0
222
010
00
371
017
50
102
050
60
166
Not
e S
tand
ard
erro
rs in
par
enth
eses
and
m
ark
stat
istic
al s
igni
fican
ce a
t 1
5
and
10
leve
l M
odel
1 is
the
benc
hmar
k m
odel
Mod
els
2 an
d 3
incl
ude
coun
trie
s fro
m e
ndog
enou
s deb
t con
verg
ence
clu
bs 1
and
2 r
espe
ctiv
ely
Mod
els 4
and
5 in
clud
e EU
-15
and
EU-1
3 co
untr
ies
and
mod
els 6
and
7 in
clud
e su
bsam
ples
with
go
vern
men
t deb
t ge 9
0 a
nd d
ebt lt
90
of G
DP
resp
ectiv
ely
vla
dim
ir ar
ča
bić
fisca
l co
nv
erg
enc
e an
d susta
ina
bility in th
e eur
opea
n un
ion
pub
lic secto
r ec
on
om
ics
42 (4) 353-380 (2018)
372
Ta
bl
e 4
Resu
lts o
f fisc
al su
stai
nabi
lity
anal
ysis
usi
ng F
E m
odel
mod
els
mod
el 1
ben
chm
ark
mod
el 2
clu
b 1
mod
el 3
clu
b 2
mod
el 4
eu
-15
mod
el 5
eu
-13
mod
el 6
deb
t ge 9
0m
odel
7d
ebt lt
90
Varia
bles
Surp
lus
Surp
lus
Surp
lus
Surp
lus
Surp
lus
Surp
lus
Surp
lus
Surp
lus (
lagg
ed) (
ρ)0
512
(0
06)
051
5
(00
7)0
491
(0
12)
063
7
(00
4)0
336
(0
07)
024
8
(01
0)0
611
(0
09)
Deb
t (β 1)
000
6(0
01)
000
4(0
01)
002
5(0
02)
000
3(0
00)
002
9
(00
1)0
031
(0
01)
-00
09(0
01)
Out
put G
ap (β
2)0
176
(0
04)
017
2
(00
4)0
209
(0
09)
022
6
(00
3)0
197
(0
05)
021
3(0
12)
013
3
(00
4)
Con
stan
t-0
614
(0
36)
-07
13(0
42)
-09
98(0
71)
-03
27(0
35)
-18
31
(0
40)
-39
51
(14
8)0
168
(06
3)O
bser
vatio
ns1
708
115
954
991
579
328
11
427
R-s
quar
ed0
304
029
80
335
045
70
173
012
30
384
Num
ber o
f cou
ntrie
s28
199
1513
926
Not
e S
tand
ard
erro
rs in
par
enth
eses
and
m
ark
stat
istic
al s
igni
fican
ce a
t 1
5
and
10
leve
l M
odel
1 is
the
benc
hmar
k m
odel
Mod
els
2 an
d 3
incl
ude
coun
trie
s fro
m e
ndog
enou
s deb
t con
verg
ence
clu
bs 1
and
2 r
espe
ctiv
ely
Mod
els 4
and
5 in
clud
e EU
-15
and
EU-1
3 co
untr
ies
and
mod
els 6
and
7 in
clud
e su
bsam
ples
with
go
vern
men
t deb
t ge 9
0 a
nd d
ebt lt
90
of G
DP
resp
ectiv
ely
vla
dim
ir ar
ča
bić
fisca
l co
nv
erg
enc
e an
d susta
ina
bility in th
e eur
opea
n un
ion
pub
lic secto
r ec
on
om
ics
42 (4) 353-380 (2018)3734 conclusIon
The Great Recession and the sovereign debt crisis in the Eurozone have shaken fiscal policies in the EU Many European countries have breached public debt and deficit goals set by the Stability and Growth Pact Therefore the issue of fiscal policy convergence and sustainability is very important for the EU
This paper analyzes fiscal policy convergence and tests for fiscal sustainability in 28 EU countries using data on government debt revenues and expenditures We show absolute divergence in fiscal policies which was further increased by the Great Recession and the sovereign debt crisis However we find strong evidence of club convergence Club convergence is important to consider because the EU does not have a single fiscal policy and member state policies are heterogeneous In general convergence clubs are implicitly included in discussions on the EU core and periphery and in the two-speed recovery idea which argues that different groups (or clubs) of European countries are characterized by faster and slower recoveries from the recession We find two government debt convergence clubs three government revenue clubs and four government expenditure clubs Endog-enously identified clubs do not have simple geographical political or development similarities They are heterogeneous within countries but homogenous between fiscal variables Exogenous grouping of EU countries into EU-15 and EU-13 or into EU core and periphery does not show evidence of fiscal convergence Conver-gence clubs are related to multiple equilibriums within the EU which makes a single fiscal policy difficult to achieve More precise fiscal rules could be consid-ered by policymakers together with corrective measures such as the Excessive Deficit Procedure Fiscal rules instead of discretionary decision making might be a step toward similar fiscal policies and fiscal convergence in the EU
Fiscal policy in the EU is found to be unsustainable but countercyclical We use a policy response function for the sustainability analysis where primary surplus is a function of government debt and the output gap We show that surplus does not respond to an increase in government debt which cannot be interpreted as sustain-able However primary government surplus increases in expansions and decreases in recession thus being countercyclical and aimed at smoothing business cycles In this respect the fiscal goals for public debt and deficit set by the Stability and Growth Pact may not be enough to ensure fiscal sustainability More precise fiscal rules together with corrective measures would be helpful for both fiscal sustaina-bility and convergence
disclosure statement No potential conflict of interest was reported by the author
vla
dim
ir ar
ča
bić
fisca
l co
nv
erg
enc
e an
d susta
ina
bility in th
e eur
opea
n un
ion
pub
lic secto
r ec
on
om
ics
42 (4) 353-380 (2018)
374 aPPendIX
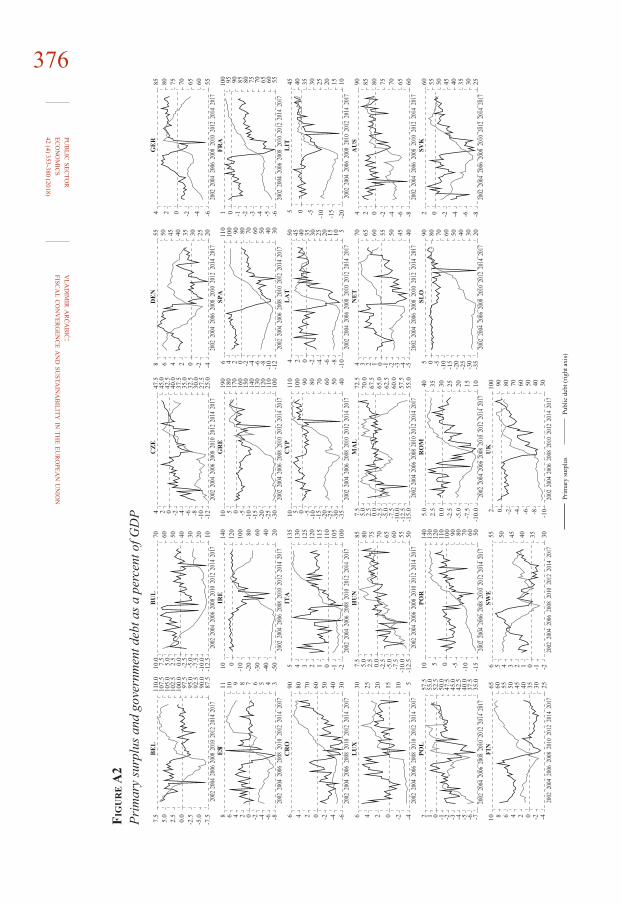
data constructIon and sourcesFor the convergence analysis we use data on general government debt revenues and expenditures Variables are in millions of euro current prices We divide all by nominal GDP to express fiscal variables in real terms and in a percent of GDP The main data source is Eurostat and the International Financial Statistics data-base from the International Monetary Fund All data span the period from 2000q1 to 2017q2 but some data have been reconstructed For Germany Estonia Ire-land and Luxemburg we interpolate annual data for 2000 and 2001 since quar-terly data start from 2002q1 For Austria we interpolate annual data for 2000 since quarterly data start from 2001q1 For Croatia we reconstruct monthly data on central government expenditure and revenue based on the old methodology The data are provided by Croatian National Bank (CNB) and we use central gov-ernment data as a proxy for the general government Nominal GDP is taken from the Eurostat database except for Croatia Malta and Poland for which we take the data from IFS Public debt data are entirely taken from the Eurostat database Public debt is usually expressed as a percent of GDP on annual bases Therefore public debt is divided by a sum of GDP in a current and previous three quarters or where dt is public debt in a percent of GDP $dt and $yt are nominal debt and GDP in millions of euro We use this approach for the sustainability analysis when the sample starts in 2002q1 For the convergence analysis where the sample starts in 2000q1 we divide public debt only by current quarter GDP to maximize number of observations or dt = ($dt $yt ) times 100 For the sustainability analysis we also use primary surplus and real GDP data from Euro-stat All the data span the period from 2002q1 to 2017q2 (balanced panel) Below we plot time series of government revenues and expenditures (figure A1) and primary surplus and government debt (figure A2) in a percent of GDP Table A1 contains basic descriptive statistics
vla
dim
ir ar
ča
bić
fisca
l co
nv
erg
enc
e an
d susta
ina
bility in th
e eur
opea
n un
ion
pub
lic secto
r ec
on
om
ics
42 (4) 353-380 (2018)375
Fig
ur
e a
1G
over
nmen
t rev
enue
s and
exp
endi
ture
s as a
per
cent
of G
DP
Rev
enue
sEx
pend
iture
s
BE
L
2000
2002
2004
2006
2008
2010
2012
2014
2017
046
048
050
052
054
056
058
060
BU
L
2000
2002
2004
2006
2008
2010
2012
2014
2017
027
50
300
032
50
350
037
50
400
042
50
450
047
5C
ZE
2000
2002
2004
2006
2008
2010
2012
2014
2017
035
040
045
050
055
060
065
DE
N
2000
2002
2004
2006
2008
2010
2012
2014
2017
048
050
052
054
056
058
060
GE
R
2000
2002
2004
2006
2008
2010
2012
2014
2017
040
042
044
046
048
050
052
EST
2000
2002
2004
2006
2008
2010
2012
2014
2017
030
00
325
035
00
375
040
00
425
045
00
475
050
00
525
IRE
2000
2002
2004
2006
2008
2010
2012
2014
2017
02
03
04
05
06
07
08
GR
E
2000
2002
2004
2006
2008
2010
2012
2014
2017
035
040
045
050
055
060
065
070
075
080
SPA
2000
2002
2004
2006
2008
2010
2012
2014
2017
032
50
350
037
50
400
042
50
450
047
50
500
052
5FR
A
2000
2002
2004
2006
2008
2010
2012
2014
2017
048
050
052
054
056
058
CR
O
2000
2002
2004
2006
2008
2010
2012
2014
2017
035
040
045
050
055
060
065
ITA
2000
2002
2004
2006
2008
2010
2012
2014
2017
040
042
044
046
048
050
052
CY
P
2000
2002
2004
2006
2008
2010
2012
2014
2017
03
04
05
06
07
08
LA
T
2000
2002
2004
2006
2008
2010
2012
2014
2017
030
00
325
035
00
375
040
00
425
045
00
475
LIT
2000
2002
2004
2006
2008
2010
2012
2014
2017
030
00
325
035
00
375
040
00
425
045
00
475
050
00
525
LU
X
2000
2002
2004
2006
2008
2010
2012
2014
2017
032
50
350
037
50
400
042
50
450
047
5H
UN
2000
2002
2004
2006
2008
2010
2012
2014
2017
040
042
044
046
048
050
052
054
056
MA
L
2000
2002
2004
2006
2008
2010
2012
2014
2017
030
035
040
045
050
055
NE
T
2000
2002
2004
2006
2008
2010
2012
2014
2017
038
040
042
044
046
048
050
AU
S
2000
2002
2004
2006
2008
2010
2012
2014
2017
042
50
450
047
50
500
052
50
550
057
50
600
POL
2000
2002
2004
2006
2008
2010
2012
2014
2017
036
038
040
042
044
046
048
POR
2000
2002
2004
2006
2008
2010
2012
2014
2017
035
040
045
050
055
060
065
RO
M
2000
2002
2004
2006
2008
2010
2012
2014
2017
027
50
300
032
50
350
037
50
400
042
50
450
SLO
2000
2002
2004
2006
2008
2010
2012
2014
2017
040
045
050
055
060
065
070
075
080
085
SVK
2000
2002
2004
2006
2008
2010
2012
2014
2017
032
50
350
037
50
400
042
50
450
047
50
500
052
50
550
FIN
2000
2002
2004
2006
2008
2010
2012
2014
2017
046
048
050
052
054
056
058
060
SWE
2000
2002
2004
2006
2008
2010
2012
2014
2017
048
050
052
054
056
058
UK
2000
2002
2004
2006
2008
2010
2012
2014
2017
034
036
038
040
042
044
046
048
050
vla
dim
ir ar
ča
bić
fisca
l co
nv
erg
enc
e an
d susta
ina
bility in th
e eur
opea
n un
ion
pub
lic secto
r ec
on
om
ics
42 (4) 353-380 (2018)
376
Fig
ur
e a
2Pr
imar
y su
rplu
s and
gov
ernm
ent d
ebt a
s a p
erce
nt o
f GD
P B
EL
2002
2004
2006
2008
2010
2012
2014
2017
-75
-50
-2500
25
50
75
875
900
925
950
975
100
010
25
105
010
75
110
0B
UL
2002
2004
2006
2008
2010
2012
2014
2017
-12
5-1
00
-75
-50
-2500
25
50
75
100
10203040506070C
ZE
2002
2004
2006
2008
2010
2012
2014
2017
-12
-10-8-6-4-2024
250
275
300
325
350
375
400
425
450
475
DE
N
2002
2004
2006
2008
2010
2012
2014
2017
-4-202468
2025303540455055G
ER
2002
2004
2006
2008
2010
2012
2014
2017
-6-4-2024
55606570758085
EST
2002
2004
2006
2008
2010
2012
2014
2017
-8-6-4-202468
34567891011IR
E
2002
2004
2006
2008
2010
2012
2014
2017
-50
-40
-30
-20
-10010
20406080100
120
140
GR
E
2002
2004
2006
2008
2010
2012
2014
2017
-30
-25
-20
-15
-10-50510
100
110
120
130
140
150
160
170
180
190
SPA
2002
2004
2006
2008
2010
2012
2014
2017
-12
-10-8-6-4-20246
30405060708090100
110
FRA
2002
2004
2006
2008
2010
2012
2014
2017
-6-5-4-3-2-101
556065707580859095100
CR
O
2002
2004
2006
2008
2010
2012
2014
2017
-6-4-20246
30405060708090IT
A
2002
2004
2006
2008
2010
2012
2014
2017
-2-1012345
100
105
110
115
120
125
130
135
CY
P
2002
2004
2006
2008
2010
2012
2014
2017
-35
-30
-25
-20
-15
-10-50510
405060708090100
110
LA
T
2002
2004
2006
2008
2010
2012
2014
2017
-10-8-6-4-2024
5101520253035404550L
IT
2002
2004
2006
2008
2010
2012
2014
2017
-20
-15
-10-505
1015202530354045
LU
X
2002
2004
2006
2008
2010
2012
2014
2017
-4-20246
51015202530H
UN
2002
2004
2006
2008
2010
2012
2014
2017
-12
5-1
00
-75
-50
-2500
25
50
75
5055606570758085M
AL
2002
2004
2006
2008
2010
2012
2014
2017
-15
0-1
25
-10
0-7
5-5
0-2
500
25
50
75
550
575
600
625
650
675
700
725
NE
T
2002
2004
2006
2008
2010
2012
2014
2017
-5-4-3-2-101234
40455055606570A
US
2002
2004
2006
2008
2010
2012
2014
2017
-8-6-4-2024
60657075808590
POL
2002
2004
2006
2008
2010
2012
2014
2017
-7-6-5-4-3-2-1012
350
375
400
425
450
475
500
525
550
575
POR
2002
2004
2006
2008
2010
2012
2014
2017
-15
-10-50510
5060708090100
110
120
130
140
RO
M
2002
2004
2006
2008
2010
2012
2014
2017
-10
0-7
5-5
0-2
500
25
50
10152025303540SL
O
2002
2004
2006
2008
2010
2012
2014
2017
-35
-30
-25
-20
-15
-10-505
2030405060708090SV
K
2002
2004
2006
2008
2010
2012
2014
2017
-8-6-4-202
2530354045505560
FIN
2002
2004
2006
2008
2010
2012
2014
2017
-4-20246810
253035404550556065SW
E
2002
2004
2006
2008
2010
2012
2014
2017
-2-10123456
303540455055U
K
2002
2004
2006
2008
2010
2012
2014
2017
-10-8-6-4-202
30405060708090100
Prim
ary
surp
lus
Publ
ic d
ebt (
right
axi
s)
vla
dim
ir ar
ča
bić
fisca
l co
nv
erg
enc
e an
d susta
ina
bility in th
e eur
opea
n un
ion
pub
lic secto
r ec
on
om
ics
42 (4) 353-380 (2018)377Table a1
Descriptive statistics
country revenues expenditures debt surplusmean st dev mean st dev mean st dev mean st dev
Belgium 0498 0014 0519 0029 102371 6191 1489 2662Bulgaria 0375 0032 0378 0035 25430 12762 0809 3995Czech R 0397 0021 0427 0030 34493 6377 -1570 2538Denmark 0542 0012 0537 0025 41284 6727 2350 2937Germany 0439 0011 0453 0017 69791 6443 0853 1749Estonia 0380 0027 0376 0035 6770 2386 0605 2605Ireland 0331 0031 0374 0095 63992 35900 -3019 8925Greece 0427 0042 0501 0052 135084 31814 -2996 4643Spain 0380 0016 0417 0035 64440 24433 -1729 4398France 0506 0016 0544 0023 78400 13788 -1601 1526Croatia 0433 0030 0478 0030 56491 19248 -1880 2281Italy 0453 0019 0485 0019 115085 12457 1345 1277Cyprus 0365 0030 0395 0055 73230 21307 -0192 5510Latvia 0352 0022 0374 0036 26770 14433 -1088 3003Lithuania 0341 0013 0367 0039 28502 10293 -1275 3675Luxembourg 0434 0013 0418 0026 14941 7215 1360 1821Hungary 0444 0021 0490 0023 69585 8796 -0745 3255Malta 0384 0020 0416 0023 66048 4001 0266 2870Netherlands 0429 0009 0446 0021 56298 8245 -0165 2086Austria 0489 0012 0513 0019 76310 6738 0363 1796Poland 0395 0013 0435 0018 48860 5134 -1724 1608Portugal 0415 0021 0469 0035 92343 30325 -1906 3499Romania 0335 0016 0367 0033 25756 10096 -1550 3267Slovenia 0434 0010 0472 0048 44276 22349 -1759 4888Slovakia 0373 0024 0417 0039 43263 8989 -1969 2157Finland 0531 0013 0520 0040 46337 10241 1891 3288Sweden 0520 0019 0515 0016 42539 4814 1568 1730UK 0378 0012 0420 0036 60967 22826 -2558 2478
vla
dim
ir ar
ča
bić
fisca
l co
nv
erg
enc
e an
d susta
ina
bility in th
e eur
opea
n un
ion
pub
lic secto
r ec
on
om
ics
42 (4) 353-380 (2018)
378 references1 Arčabić V [et al] 2018 Public Debt and Economic Growth Conundrum
Nonlinearity and Inter-temporal Relationship Studies in nonlinear dynamics and econometrics 22(1) pp 1-20 httpsdoiorg101515snde-2016-0086
2 Arellano M and Bover O 1995 Another look at the instrumental variable estimation of error-components models Journal of econometrics 68(1) pp 29-51 httpsdoiorg1010160304-4076(94)01642-D
3 Babić A 2003 Dynamic analysis of Croatiarsquos fiscal and external debt Privredna kretanja i ekonomska politika 13(97) pp 77-126 Available at lthttpshrcaksrcehrfile28961gt
4 Balassone F Francese M and Zotteri S 2010 Cyclical asymmetry in fiscal variables in the EU Empirica 37(4) pp 381-402 httpsdoiorg101007s10663-009-9114-7
5 Bernard A B and Durlauf S N 1995 Convergence in international out-put Journal of applied econometrics 10(2) pp 97-108 httpsdoiorg 101002jae3950100202
6 Bernard A B and Durlauf S N 1996 Interpreting tests of the convergence hypothesis Journal of econometrics 71(1-2) pp 161-173 httpsdoiorg 1010160304-4076(94)01699-2
7 Blanchard O 2010 Interview IMF Survey Two-speed Recovery to Extend into 2011 Says IMF In International Monetary Fund December 30 2010 Available at lthttpswwwimforgenNewsArticles201509280453sonew123010agt
8 Blundell R and Bond S 1998 Initial conditions and moment restrictions in dynamic panel data models Journal of econometrics 87(1) pp 115-143 httpsdoiorg101016S0304-4076(98)00009-8
9 Bohn H 1998 The behavior of US public debt and deficits The Quarterly Journal of economics 113(3) pp 949-963 httpsdoiorg101162003355 398555793
10 Bohn H 2005 The Sustainability of Fiscal Policy in the United States CESifo Group Munich Working paper No 1446 Available at lthttpwwwcesifo-groupdeDocDLcesifo1_wp1446pdfgt
11 Bohn H 2007 Are stationarity and cointegration restrictions really neces-sary for the intertemporal budget constraint Journal of monetary economics 54(7) pp 1837-1847 httpsdoiorg101016jjmoneco200612012
12 Cassou S P Shadmani H and Vaacutezquez J 2017 Fiscal policy asymmetries and the sustainability of US government debt revisited Empirical econom-ics 53(3) pp 1193-1215 httpsdoiorg101007s00181-016-1159-4
13 Collignon S 2012 Fiscal policy rules and the sustainability of public debt in Europe International economic review 53(2) pp 539-567 httpsdoiorg 101111j1468-2354201200691x
14 De Bandt O and Mongelli F 2000 Convergence of fiscal policies in the euro area European Central Bank Working paper No 20 Available at lt https
vla
dim
ir ar
ča
bić
fisca
l co
nv
erg
enc
e an
d susta
ina
bility in th
e eur
opea
n un
ion
pub
lic secto
r ec
on
om
ics
42 (4) 353-380 (2018)379wwwecbeuropaeupubpdfscpwpsecbwp020pdffb62cab7f4d858d8e528
47b202892351gt 15 Delgado F 2006 Are the tax mix and the fiscal pressure converging in the
European Union Instituto de Estudios Fiscales Working paper No 11-0616 Deskar-Škrbić M and Šimović H 2017 Effectiveness of fiscal spending in
Croatia Slovenia and Serbia The role of trade openness and public debt level Post-communist economies 29(3) pp 336-358 httpsdoiorg1010801463137720161267972
17 Du K 2017 Econometric convergence test and club clustering using Stata Stata journal 17(4) pp 882-900 Available at lt httpsmedmahidolacthcebsitesdefaultfilespublicpdfstata_journalsj17-4pdfgt
18 Enders W and Lee J 2012 A unit root test using a Fourier series to approx-imate smooth breaks Oxford bulletin of economics and statistics 74(4) pp 574-599 httpsdoiorg101111j1468-0084201100662x
19 Hamilton J D and Flavin M A 1986 On the Limitations of Government Borrowing A Framework for Empirical Testing American economic review 76(4) pp 808-819
20 Hodrick R J and Prescott E C 1997 Postwar US business cycles an empirical investigation Journal of money credit and banking pp 1-16 httpsdoiorg1023072953682
21 Kočenda E Kutan A M and Yigit T M 2008 Fiscal convergence in the European Union The North American journal of Economics and finance 19(3) pp 319-330 httpsdoiorg101016jnajef200806003
22 Lee J and Strazicich M C 2003 Minimum Lagrange multiplier unit root test with two structural breaks Review of economics and statistics 85(4) pp 1082-1089 httpsdoiorg101162003465303772815961
23 Mihaljek D 2003 Analysis of public and external debt sustainability for Croatia Application of standard financial indicators Privredna kretanja i ekonomska politika 13(97) pp 29-75 Available at lthttpshrcaksrcehrfile28958gt
24 Perron P 1989 The great crash the oil price shock and the unit root hypoth-esis Econometrica pp 1361-1401 httpsdoiorg1023071913712
25 Pesaran M H (2006) Estimation and inference in large heterogeneous pan-els with a multifactor error structure Econometrica 74(4) pp 967-1012 httpsdoiorg101111j1468-0262200600692x
26 Pesaran M H 2007 A pair-wise approach to testing for output and growth convergence Journal of econometrics 138(1) pp 312-355 httpsdoiorg 101016jjeconom200605024
27 Pesaran M H 2015 Testing weak cross-sectional dependence in large pan-els Econometric reviews 34(6-10) pp 1089-1117 httpsdoiorg101080074749382014956623
28 Phillips P C and Sul D 2007 Transition modeling and econometric conver-gence tests Econometrica 75(6) pp 1771-1855 httpsdoiorg101111 j1468-0262200700811x
vla
dim
ir ar
ča
bić
fisca
l co
nv
erg
enc
e an
d susta
ina
bility in th
e eur
opea
n un
ion
pub
lic secto
r ec
on
om
ics
42 (4) 353-380 (2018)
380 29 Phillips P C and Sul D 2009 Economic transition and growth Journal of applied econometrics 24(7) pp 1153-1185 httpsdoiorg101002jae1080
30 Raguž Krištić I Rogić Dumančić L and Arčabić V 2018 Persistence and stochastic convergence of euro area unemployment rates Economic Model-ling httpsdoiorg101016jeconmod201807032
31 Reinhart C M and Rogoff K S 2010 Growth in a Time of Debt American economic review 100(2) pp 573-78 httpsdoiorg101257aer1002573
32 Trehan B and Walsh C E 1988 Common trends the governmentrsquos budget constraint and revenue smoothing Journal of economic dynamics and con-trol 12(2-3) pp 425-444 httpsdoiorg1010160165-1889(88)90048-6
Efficiency vs effectiveness an analysis of tertiary education across Europe
OZANA NADOVEZA JELIĆ PhDMARGARETA GARDIJAN KEDŽO PhD
ArticleJEL I21 I22 I23httpsdoiorg103326pse4242
The authors would like to thank two anonymous referees for helpful comments on the paper Received June 1 2018
Accepted October 21 2018
The article was submitted for the 2018 annual award of the Prof Dr Marijan Hanžeković Prize
Ozana NADOVEZA JELIĆUniversity of Zagreb Faculty of Economics and Business Trg J F Kennedyja 6 10000 Zagreb Croatiae-mail onadovezaefzghr ORCiD 0000-0002-3651-7795
Margareta GARDIJAN KEDŽOUniversity of Zagreb Faculty of Economics and Business Trg J F Kennedyja 6 10000 Zagreb Croatiae-mail mgardijanefzghrORCiD 0000-0001-5390-057X
oza
na n
ad
ov
eza jelić ma
rg
ar
eta ga
rd
ijan k
edžo
efficien
cy v
s effectiv
eness a
n an
aly
sis of tertia
ry edu
catio
n ac
ro
ss eur
ope
pub
lic secto
r ec
on
om
ics
42 (4) 381-414 (2018)
382 abstractThis paper deals with tertiary education efficiency and effectiveness across 24 European Union countries in four sub-periods between 2004 and 2015 The effi-ciency scores are computed using Data Envelopment Analysis (DEA) We try to raise awareness of the quality and not of the quantity of educational outputs and inputs by introducing quality-based correction of the DEA efficiency score which we regard as effectiveness Our results show that quality considerations affect the relative positions of countries regarding their efficiency scores In other words some less developed countries which are efficient in the quantity-based model fail to reach the defined efficiency border when considering some quality indica-tors of outputs On the other hand some inefficient developed countries increase their DEA-based ranking and achieve effectiveness (quality-based efficiency) The same is true for input quality considerations Since tertiary education cannot be expected to provide the same quality of outcomes with different input qualities efficiency improves (deteriorates) in the input-output quality-based model in many countries with low (high) quality student bases
Keywords tertiary education data envelopment analysis educational efficiency and effectiveness EU
1 IntroductIonIt is a well-established fact that the quality of education matters more than quan-tity Fortunato and Panizza (2015) argue that the sharp increase in cross-country average years of schooling might not accurately represent actual educational gains According to Pritchett (2013) as cited in Fortunato and Panizza (2015) an increase in years of education in less developed countries as opposed to devel-oped countries is not always transmitted into educational benefits This view is also supported by many relatively recent papers such as Hanushek and Kimko (2000) Barro (2001) Woumlszligmann (2006) Altinok Diebolt and Demeulemeester (2014) Barro (2013) whereas Barro (2013) concludes that the ldquoquality and quan-tity of schooling both matter for growth but quality is much more importantrdquo Additionally Pritchett (2001) who was not able to prove a positive association between increasing educational attainment and per capita income growth argues that it could be that the educational quality was so low that ldquoyears of schoolingrdquo have created no human capital
Due to the importance of educational services for growth attitudes and political and social awareness they are provided and publicly financed to a greater or lesser extent by practically all governments around the world Additionally educational externalities are a textbook example of market failure and one of the most impor-tant motives behind government intervention in this sector According to Szirmai (2015) after World War II expansion and improvement of education were gener-ally considered essential to development The awareness about the role of educa-tion in the development process resulted in a far reaching education expansion Over the course of time increased government expenditures on education trans-
oza
na n
ad
ov
eza jelić ma
rg
ar
eta ga
rd
ijan k
edžo
efficien
cy v
s effectiv
eness a
n an
aly
sis of tertia
ry edu
catio
n ac
ro
ss eur
ope
pub
lic secto
r ec
on
om
ics
42 (4) 381-414 (2018)383lated into higher levels of education Consequently higher education enrolments
have grown significantly over the last three decades According to World Bank (2018) data the world gross enrolment ratio in tertiary education1 grew from 13 to 35 during the 1985-2015 period Growth has been even more impressive in the European Union (EU) where the average annual growth rate of the gross enrolment ratio in tertiary education reached 35 This has led to an increase in the gross enrolment ratio in tertiary education from 25 in 1985 to 68 in 2014
However as Szirmai (2015) puts it ldquoSince the 1970s optimism about the contribu-tions of education has been shaken and more emphasis is given to improving the quality of educationrdquo This author notices that not all educational investments are effective and efficient in the development process Due to the potential ineffective-ness of educational inputs the quality of education can be unsatisfactory Thus the rising educational coverage and duration of education as well as government and even private educational expenditures are not always efficiently transmitted into higher productivity and wages growth rates and better institutions Therefore it can be argued it is not quantity that underlies the successful exploitation of all forms of educational benefits but the quality and the effectiveness of the educational inputs and investments Although efficiency and effectiveness are similar concepts they are not synonyms Viljoen (cited in Kenny 2008) defined efficiency as relating to ldquohow well an activity or operation is performedrdquo The term effectiveness relates to performing the correct activity or operation In other words ldquoefficiency measures how well an organization does what it does but effectiveness raises value questions about what the organization should be doing in the first placerdquo
There is a significant body of literature which deals with the efficiency of all levels of the national educational systems in the EU Many of those studies chose to use data envelopment analysis (DEA) in their methodological approach because DEA as a nonparametric method of mathematical programming enables the cal-culation of the relative efficiency of quite homogenous and comparable units given multiple criteria These criteria dictate the choice of certain input variables whose values are preferred to be as small as possible and certain output variables whose values are preferred to be as great as possible The choice of the criteria and consequently the choice of the variables defines the concept of the research
Conclusions of various DEA-based studies sometimes differ significantly which makes it impossible to draw general conclusions concerning tertiary educational efficiency at the EU level Differences in conclusions mostly arise from the diverse selection of inputs and outputs considered within different studies Additionally some papers deal with a narrow sample of countries (eg Ahec Šonje Deskar-Škrbić and Šonje 2018 Yotova and Stefanova 2017) ie homogenous countries with similar development levels and others deal with a broader and more or less
1 Total enrolment in tertiary education (ISCED 5 to 8) regardless of age expressed as a percentage of the total population of the five-year age group following on from secondary school leaving
oza
na n
ad
ov
eza jelić ma
rg
ar
eta ga
rd
ijan k
edžo
efficien
cy v
s effectiv
eness a
n an
aly
sis of tertia
ry edu
catio
n ac
ro
ss eur
ope
pub
lic secto
r ec
on
om
ics
42 (4) 381-414 (2018)
384 heterogeneous set of countries which can also affect the difference in the results (Aubyn et al 2009 Aristovnik and Obadić 2011 and Toth 2009)
Still most of the papers that use the DEA approach make comparisons on tertiary education between countries considering only the definition of efficiency Some papers deal with quality issues but mostly on the output side of the educational ldquoproduction functionrdquo Therefore questions regarding the quality of educational inputs and outputs and their effectiveness are usually covered only partially In this paper we argue that a greater focus on efficiency can give misleading results that could translate into flawed educational policy prescriptions
The paper is organized as follows The second section summarizes previous research findings The third section gives the rationale for selected inputs and outputs as well as a glimpse of the educational inputs and outputs in the EU The fourth section deals with the methodology and the fifth presents and discusses the main results The last part of the paper provides comments on policy implications and future research recommendations
2 lIterature oVerVIewDEA is a generally suitable method for a country-level public sector efficiency evaluation2 and it is commonly used and widely accepted as an appropriate analy-sis approach in the tertiary education efficiency research For example to rank eleven Eastern European countries according to their tertiary education efficiency during the 2005-2013 period Ahec Šonje Deskar-Škrbić and Šonje (2018) use input-oriented DEA with variable returns to scale (VRS) The authors use expend-iture on tertiary education per pupil in the percentage of GDP per capita as an input variable and the share of unemployed with tertiary education in the total number of unemployed (model 1) and World University Ranking list as an alterna-tive output measure (model 2) However the authors consider models with only one input and one output variable which limits the possibility of making more general conclusions
Yotova and Stefanova (2017) used the same method on a set of countries similar to that chosen by Ahec Šonje Deskar-Škrbić and Šonje (2018) As an input vari-able authors used total expenditures on tertiary education per student as a percent-age of per capita GDP in 2012 while the set of educational outputs variables included three indicators tertiary educational attainment (age 25-34) the employ-ment rate of the population with tertiary education outside the risk of poverty and social exclusion and the mean monthly earnings of a person with tertiary educa-tion as a share in per capita GDP in 2014 Again the analysis is limited to one input and one output It should be noted that both studies include some educa-
2 We wonrsquot go in any details regarding the broader usage of DEA in public sector efficiency evaluations How-ever interested reader can refer to the following research in this area Clements (2002) Afonso and St Aubyn (2006) Aristovnik (2013a 2013b) Aristovnik and Obadić (2014) etc
oza
na n
ad
ov
eza jelić ma
rg
ar
eta ga
rd
ijan k
edžo
efficien
cy v
s effectiv
eness a
n an
aly
sis of tertia
ry edu
catio
n ac
ro
ss eur
ope
pub
lic secto
r ec
on
om
ics
42 (4) 381-414 (2018)385tional output quality indicators but they do not consider any educational input
quality measures which could lead to biased results and conclusions
Toth (2009) analyzed the efficiency of tertiary education in 20 EU countries in 2006 using output-oriented DEA with variable returns to scale (VRS) The author used a ratio of expenditures spent on higher education to GDP as an educational input and the ratio of people with a degree to the total population as well as the employment rate of people with a degree as educational output variables Beside standard outputs and inputs the author used two non-discretionary variables (parental educational attainment and public-to-total expenditure GDP per capita in current US$) However Tothrsquos (2009) results differ significantly from other related studies that include EU countries3 She found that for example Denmark and Italy (among others) share the first position regarding tertiary education effi-ciency in 20 analyzed EU countries while Aristovnik and Obadić (2011) and Aubyn et al (2009) rank these countries as relatively inefficient
Aristovnik and Obadić (2011) used output oriented DEA with variable returns to scale (VRS) to assess tertiary education efficiency in a broad set of countries (selected group of EU and OECD countries) during the 1999-2007 period The analysis included input data on expenditure per student (tertiary of GDP per capita) school enrolment (tertiary gross) and outputoutcome data ie school enrolment (tertiary gross) labor force with a tertiary education ( of total) and the unemployed with a tertiary education ( of total unemployment) To assess technical efficiency regarding different inputs and outputsoutcome the authors tested three Two out of three considered outputs are standard educational quantity output indicators while the last can be regarded as a quality indicator In the con-clusion authors emphasize the need to consider some educational quality data
The most comprehensive study employing DEA methodology to assess the effi-ciency of the tertiary education in a broad set of countries is authored by Aubyn et al (2009) The authors used two approaches input and output-oriented DEA with variable returns to scale (VRS) The analysis is conducted over two subperiods 1998-2001 and 2002-2005 In the first model authors used a number of academic staff and students as inputs while the second model considered spending in pri-vate government-dependent institutions (in of GDP) as an input variable A weighted number of graduates and a weighted number of published articles were used as output variables in both models All educational inputs and outputs con-sidered in this paper can be regarded as quantitative However the study includes a number of non-discretionary measures such as selection of students budget autonomy staff policy output flexibility evaluation funding rules and PISA results4 which can be seen as qualitative measures (mostly) of inputs
3 See table A1 in appendix4 For detailed explanation of variables see Aubyn et al (2009)
oza
na n
ad
ov
eza jelić ma
rg
ar
eta ga
rd
ijan k
edžo
efficien
cy v
s effectiv
eness a
n an
aly
sis of tertia
ry edu
catio
n ac
ro
ss eur
ope
pub
lic secto
r ec
on
om
ics
42 (4) 381-414 (2018)
386 It should be noted that conclusions differ in the abovementioned papers which makes it impossible for us to draw any general conclusions on tertiary educational efficiency at EU level5 We suspect that differences in conclusions mostly arise from the diverse selection of inputs and outputs considered within different papers However the differences in the conclusions of the reviewed papers also arise because of the different samples of countries That is two papers deal with a nar-row sample of countries ie homogenous countries with similar development lev-els and others deal with a broader and heterogeneous set of countries which can also produce different results Still differences arise even if the samples are rela-tively similar For example Aristovnik and Obadić (2011) and Aubyn et al (2009) use the same number and coverage of countries and even time periods in different model specifications (variables) but sometimes the results differ significantly For example the first model in Aristovnik and Obadić (2011) ranks the Czech Repub-lic as the first and then as the 33rd in the second model Similarly in Aubyn et al (2009) Cyprus is ranked number one in the first model (1998-2001) and then as 27th in the second model (1998-2001)6
3 data tertIary educatIon InPuts and outPutsThis paper differentiates between quantity and quality measures of educational inputs and outputs which enables us to discriminate tertiary education efficiency and tertiary education effectiveness Since there is no consensus regarding the appropriateness of available inputs and outputs it seemed inappropriate to make an ad hoc decision to include some and to exclude other inputs and outputs that were used in the previous researches Therefore this paper uses a somewhat broader set of inputs and outputs than most of the papers presented in the literature overview It also considers quality indicators on both side of the educational pro-duction function ndash the input and the output side This decision comes with a cost as the discriminatory power of the method becomes questionable with the increase of the variables due to the inappropriate degrees of freedom (Cooper Seiford Tone 2006106) However any future research should try to detect key inputs and outputs in the tertiary education ldquoproductionrdquo process and try to synthesize them to get more information with fewer datavariables This approach could lead to more robust and more consistent DEA-based conclusions regarding tertiary edu-cation efficiency
To our knowledge there is no precise definition and delimitation of quantitative and qualitative educational inputs and outputs According to Lee in Bourguignon Elkana and Pleskovic (2007) an outcome of education is composed of both the quantity and the quality of educational capital According to him the quantity of educational capital can be measured by the number of graduates However he emphasizes that it is rather difficult to measure the quality of education accurately The author adds that the quality of education is reflected in the performance of
5 Table A1 in appendix provides a table with the previous research results6 See table A1 in appendix
oza
na n
ad
ov
eza jelić ma
rg
ar
eta ga
rd
ijan k
edžo
efficien
cy v
s effectiv
eness a
n an
aly
sis of tertia
ry edu
catio
n ac
ro
ss eur
ope
pub
lic secto
r ec
on
om
ics
42 (4) 381-414 (2018)387students and graduates as the value added of schooling can be measured by labor
market performance such as extra earnings or employment of educated workers Due to the lack of official quantity vs quality definitions regarding educational inputs and outputs in this section we provide the basic rationale behind the choices made in this paper
Before the provision of details regarding the selected inputs and outputs figure 1 gives a synthetic overview of educational inputs and outcomes as defined in Scheerens Luyten and van Ravens (2011)
Figure 1A synthetic overview of educational inputs processes and outcomes
Inputs Process outputs
System level financial material and human resources indicators
System level process indicators
output indicators bull Subject matter based bull Literacy (reading
mathematical scientific)
bull Competencies
outcomeattainment indicators bull Graduation rates bull Proportion of students
graduated without delay
bull Drop-out rates bull Class repetition rates
Impact indicators bull (For each attainment
level) of employed at a certain job level
bull of unemployed bull (For lower school
levels) enrolled in follow-up education
bull Degree of social participation (social capital)
bull Adult literacy rates bull Average income for
each attainment level
financial and material resources indicators 1 Proportion of gross
domestic product spent on education
2 Educational expenditure per student
3 Proportion of public and private investments in education
4 Public investment in educational research and development etc
human resources indicators 1 Teacher background
characteristics 2 Teacher professional
knowledge and skills 3 Teacher working
conditions 4 Teacher autonomy 5 Teacher morale and
status 6 Staff to student ratios
system level process indicators 1 Teaching time per
subject 2 Opportunity to learn 3 The locus of
decision-making 4 School autonomy 5 Education standards
by level 6 Whether formal
examinations are taken
7 The evaluation capacity of the system
8 The magnitude and diversification of an educational support structure
9 The division of private government dependent and public schools
10 Incentive-based policies to stimulate school performance
11 The degree to which school choice is free
contextual indicators (student background characteristics societal conditions antecedent conditions within the educational system the organizational infrastructure
of the local community etc)Source Scheerens Luyten and van Ravens (2011) adapted by the authors
oza
na n
ad
ov
eza jelić ma
rg
ar
eta ga
rd
ijan k
edžo
efficien
cy v
s effectiv
eness a
n an
aly
sis of tertia
ry edu
catio
n ac
ro
ss eur
ope
pub
lic secto
r ec
on
om
ics
42 (4) 381-414 (2018)
388 The selection of quality and quantity educational input and output indicators was mostly dictated by data availability (on the system level) Additionally some indi-cators that were considered as either inputs or outputs of the tertiary education system were highly correlated with other selected variables Thus we had to drop some of them The following subsections link selected variables to the definitions of input output and process indicators shown in figure 1 System-level process indicators have not been considered at all due to the lack of appropriate data
31 QuantItatIVe measures of educatIonal InPutsGeneral government expenditures on tertiary education as a percentage of GDP (financial resources indicator) are chosen as the most common measure of tertiary education public investmentsexpenditures Due to the correlation of this measure with similar measures of inputs other measures are excluded Data for this meas-ure are available for the entire analyzed period
Financial aid to students as a percentage of total public expenditure on education at the tertiary level of education (financial resources indicator) is selected as an input since it indicates public expenditures pointed directly towards students It is assumed that it adds new information regarding tertiary education financial inputs since it is not correlated with the previous financial resources indicator Data for this measure are available for the 2004-2012 period
One limitation should be noted here Namely both financial resources indicators contain only public spending on tertiary education However the structure of financing sources could also affect the efficiency since publicly financed education resources (see system level financial inputs and process indicators in figure 1) do not represent the total amount of educational spending However comparable data on private spending on education for all countries in our sample was not available
The ratio of pupils and students to teachers and academic staff in tertiary educa-tion is selected as a human resource indicator in the last analyzed sub-period (2013-2015) which was dictated by data availability
32 QualItatIVe measure of educatIonal InPutsThe percentage of underachieving 15-year-old students in the PISA survey (aver-age of all fields) is an output indicator of secondary education We assume it is a contextual indicator that measures human capital input quality at the tertiary level education since it contains information about the quality of the student population before entering the system of tertiary education Data for this measure are availa-ble for the entire analyzed period
33 QuantItatIVe measures of educatIonal outPutsTertiary education graduates (ISCED 5-6 per 1000 of population aged 20-29) and graduates aged 20-34 ( of the corresponding population) are selected as out-comeattainment indicators that are the most important and commonly used meas-
oza
na n
ad
ov
eza jelić ma
rg
ar
eta ga
rd
ijan k
edžo
efficien
cy v
s effectiv
eness a
n an
aly
sis of tertia
ry edu
catio
n ac
ro
ss eur
ope
pub
lic secto
r ec
on
om
ics
42 (4) 381-414 (2018)389ures of tertiary education outputs The first indicator is available for the 2004-
2012 period while the latter was used for the analysis in the last sub-period (2013-2015) Since both measures indicate only the number of students who successfully exit the tertiary education system and do not contain any information regarding their ldquoqualityrdquo we regard them as quantitative indicators of educational outputs
The population aged 15-64 with completed tertiary education is selected as a com-mon quantitative output indicator since it only considers the number of tertiary educated people and provides no information regarding the qualitative features of the tertiary educated population It should be noted that population with com-pleted tertiary education also reflects past spending on education while our analy-sis measures the outputs at the same time as inputs However if we considered only past spending on tertiary education we would still have a similar problem Beside historical data availability problems if we took (financial) inputs from previous periods we would neglect the potential efficiency of current expendi-tures to ldquoproducerdquo a new tertiary educated population This is because current financial resources devoted to tertiary education are spread across current stu-dents In three-year periods (for which we take averages) some of those students become part of the tertiary educated population Data for this measure are availa-ble for the entire analyzed period
The ratio of unemployment rates ( age 15-64) for all educational levels to unemployment rates ( age 15-64) of the tertiary educated labor force is selected as an impact indicator of tertiary education outcomes It measures tertiary educa-tion returns on the labor market Due to its correlation with similar labor market outcomes measures other measures are excluded Data for this measure are avail-able for the entire analyzed period Even if this indicator could be seen as a quali-tative tertiary education outcome measure we included it in both the efficiency and the effectiveness analysis We argue that a high ratio of unemployment rates for all educational levels and unemployment rates of tertiary educated labor force does not necessarily reflect the high efficiency of the tertiary education in terms of labor market outcomes but could be also a result of low activity rates of the ter-tiary educated population Therefore we correct this measure with activity rates of tertiary educated population
34 QualItatIVe measure of educatIonal outPutsFollowing the preceding paragraph the ratio of unemployment rates ( age 15-64) for all educational levels to unemployment rates ( age 15-64) of the tertiary educated labor force is multiplied by the activity rates of tertiary educated population The resulting measure is selected as a qualitative impact indicator of the tertiary education outcomes Data for this measure are available for the entire analyzed period
An average overall score of Times Higher Education university rankings is cho-sen as an output indicator of the tertiary education quality in the last sub-period
oza
na n
ad
ov
eza jelić ma
rg
ar
eta ga
rd
ijan k
edžo
efficien
cy v
s effectiv
eness a
n an
aly
sis of tertia
ry edu
catio
n ac
ro
ss eur
ope
pub
lic secto
r ec
on
om
ics
42 (4) 381-414 (2018)
390 (2013-2015) We considered other ranking lists but Times Higher Education was the only university rankings database which covered all countries in our sample in 2016 In previous sub-periods (2004-2012) we used the gross domestic product in PPS per capita ( of average) as a proxy for tertiary education outputs quality due to the incompleteness of the university rankings data and their correlation with university rankings (overall score) Anecdotal evidence presented in figure 2 justi-fies this choice Namely it seems that the correlation between the GDP per capita and the average university overall score (measure of the educational outcomes quality) using the ranking of the Times Higher Education (2017) significantly exceeds the correlation between the GDP per capita and the tertiary educated pop-ulation as a percentage of 15-64 years aged population (typical measure of educa-tional outcomes quantity)
Figure 2Quantity versus quality of education as GDP per capita correlates
Rsup2 = 025
-15
-10
-5
0
5
10
15
20
25
30
-15 -10 -5 0 5 10
Dev
iatio
n fr
om E
U 2
6 av
erag
e
GD
P p
c in
PPS
k
Deviation from EU 26 averagetertiary educated population (as of 15-64)
Rsup2 = 076
-15
-10
-5
0
5
10
15
20
25
30
-30 -20 -10 0 10 20 30
Dev
iatio
n fr
om E
U 2
6 av
erag
eG
DP
pc
in P
PSk
Deviation from EU 26 average average THE WUR overall score
Source Times Higher Education (2017) Eurostat (2018c 2018d)
The analysis is performed on a sample of 24 EU countries7 for which all the neces-sary data during the 2004-2015 period were available The entire time span has been divided into four 3-years sub-periods for which comparable data and varia-bles were available Table 1 summarizes selected inputs and outputs in efficiency and effectiveness DEA models
Figures 3 4 and 5 show educational (quantity and quality) inputs and outputs trends within the EU countries during the analyzed periods (averages for sub-periods 2004-2006 2007-2009 2010-2012 2013-2015) The figures reveal a lot of differences among EU member states regarding the educational inputs and out-puts However a few conclusions can be drawn
7 Due to data shortages Cyprus Greece Malta and Luxemburg were excluded from the dataset
oza
na n
ad
ov
eza jelić ma
rg
ar
eta ga
rd
ijan k
edžo
efficien
cy v
s effectiv
eness a
n an
aly
sis of tertia
ry edu
catio
n ac
ro
ss eur
ope
pub
lic secto
r ec
on
om
ics
42 (4) 381-414 (2018)391Table 1
Inputs outputs and quality indicators
label Definition used in periodCountries Belgium Bulgaria Czech Republic Denmark Germany Estonia Ireland Spain France Croatia Italy Latvia Lithuania Hungary Netherlands Austria Poland Portugal Romania Slovenia Slovakia Finland Sweden United KingdomInputs
(I)EX2( GDP) General government expenditure (tertiary education GDP) 2004-2015
(I)FA( EX)Financial aid to students as of total public expenditure on education at tertiary level of education (ISCED 5 6 )
2004-2012
(I)ST Ratio of pupils and students to teachers and academic staff (tertiary education levels 5-8) 2013-2015
Outputs
(O)GRAD(20-29) Tertiary education graduates (ISCED 5-6 per 1000 of population aged 20-29) 2004-2012
(O)GRADT(20-34) Graduates aged 20-34 tertiary education level ( of corresponding population) 2013-2015
(O)POPT Population aged 15-64 with completed tertiary education (levels 5-8) 2004-2015
(O)UUTUnemployment rates ( 15-64) all ISCED 2011 levelsunemployment rates ( 15-64) tertiary education (levels 5-8)
2004-2015
Quality indicators of inputs and outputs
(O)UUTACTT (O)UUT Activity rates ( of 15-64 tertiary education (levels 5-8)) 2004-2015
(O)GDP PC PPSGross domestic product at market prices current prices purchasing power standard per capita ( of average)
2004-2012
(O)UR_2016 Average overall score university rankings ndash The Higher Education 2013-2015
(I)PISA Underachieving 15-year-old students ( PISA survey an average of all fields) 2004-2015
Source Authors
Inputs ndash The more developed EU countries generally have greater direct invest-ment in students (in ) (figure 3a) Something similar is true for general govern-ment expenditure (figure 3b) However there are a few exceptions like the UK on the low expenditures side and Poland Estonia and Lithuania on the high expendi-tures side (figure 3c) Student to teacher ratio varies from 107 in Sweden to 225 in the Czech Republic
Outputs ndash Graduation rates (figure 4a) have been increasing in all countries within the period of analysis whereas a few post-transition economies which have rela-tively low incomes have relatively high graduation rates Regarding the labor market outcomes (figure 4c) the tertiary educated labor force seems to have a somewhat lower unemployment rate relative to the overall unemployment rate in
oza
na n
ad
ov
eza jelić ma
rg
ar
eta ga
rd
ijan k
edžo
efficien
cy v
s effectiv
eness a
n an
aly
sis of tertia
ry edu
catio
n ac
ro
ss eur
ope
pub
lic secto
r ec
on
om
ics
42 (4) 381-414 (2018)
392 less developed EU countries This could be due to the relative scarcity of tertiary educated labor in lower income countries which provides them with a better labor market position (figure 4b)
Quality indicators of inputs and outputs ndash After correcting the above described labor market outcomes for the tertiary educated activity rates some countries like the Netherlands Sweden Germany Ireland and Austria improve their relative position while the positions of Croatia Slovakia and Romania positions deterio-rate (figure 5a) The correlation between per capita GDP and university ranking overall score has already been commented on As we have already emphasized both of those outputs measure the quality of the tertiary education Finally figure 5c shows that the percentage of underachieving 15-year-old students (measured as the average of all fields in a PISA survey) is usually much larger in the poorest EU countries while it is the lowest in the wealthiest ones (with a few exceptions) This means that poorer countries get students of ldquolower qualityrdquo
Figure 3Tertiary education inputs (averages 2004-2006 2007-2009 2010-2012 2013-2015)
a) Financial aid to students as of total public expenditureon education at the tertiary level of
education
b) General government expenditure (tertiary education GDP)
05
10152025303540
Cze
ch R
C
roat
iaFr
ance
Fran
ce
Rom
ania
Spai
nA
ustri
aEs
toni
aLi
thua
nia
Pola
ndLa
tvia
Irel
and
Irel
and
Hun
gary
Bel
gium
Bel
gium
Finl
and
Bul
garia
Bul
garia
Portu
gal
Portu
gal
Slov
akia
EU28
EU28
Ger
man
y
Ger
man
y
Italy
Slov
enia
Slov
enia
Swed
enN
ethe
rland
s
Net
herla
nds
Den
mar
k
Den
mar
k
UK
UK
00
05
10
15
20
25
Italy
Spai
n
Slov
akia
Rom
ania
Aus
tria
Cze
ch R
Hun
gary
Latv
ia
Cro
atia
Swed
en
Esto
nia
Pola
nd
Finl
and
Lith
uani
a
c) The ratio of pupils and students to teachers and academic staff (tertiary education)
Fran
ce
Bul
garia
EU28
Ger
man
y
UK
Italy
Slov
akia
Aus
tria
Cze
ch R
Cro
atia
Pola
nd
Finl
and
0
5
10
15
20
25
Swed
en
Spai
n
Den
mar
k
Rom
ania
Portu
gal
Esto
nia
Hun
gary
Net
herla
nds
Lith
uani
a
Slov
enia
Latv
ia
Bel
gium
Source Eurostat (2018b 2018c 2018g)
oza
na n
ad
ov
eza jelić ma
rg
ar
eta ga
rd
ijan k
edžo
efficien
cy v
s effectiv
eness a
n an
aly
sis of tertia
ry edu
catio
n ac
ro
ss eur
ope
pub
lic secto
r ec
on
om
ics
42 (4) 381-414 (2018)393
Fig
ur
e 4
Terti
ary e
duca
tion
outp
uts (
aver
ages
200
4-20
06 2
007-
2009
201
0-20
12 2
013-
2015
)
a) T
ertia
ry e
duca
tion
grad
uate
s (permil
20-
29) a
nd g
radu
ates
ag
ed 2
0-34
(permil o
f cor
resp
ondi
ng p
opul
atio
n)b)
Pop
ulat
ion
aged
15-
64 w
ith c
ompl
eted
te
rtiar
y ed
ucat
ion
c) U
nem
ploy
men
t rat
es (
15-
64) a
ll IS
CED
201
1 le
vels
U
nem
ploy
men
t rat
es (
15-
64) t
ertia
ry e
duca
tion
00
05
10
15
20
25
30
35
40
HungaryLithuaniaCzech RBulgaria
GermanyLatvia
SlovakiaUK
PolandSweden
NetherlandsBelgium
IrelandFinlandCroatia
EU28Italy
SpainFrance
SloveniaEstoniaAustria
RomaniaDenmarkPortugal
020406080100
120
DenmarkIrelandPolandFrance
LithuaniaUK
FinlandSlovakiaBelgium
SpainAustria
EU28Czech RSlovenia
NetherlandsBulgaria
LatviaCroatia
PortugalSweden
RomaniaEstonia
HungaryItaly
Germany
0510152025303540
UKIrelandFinlandEstoniaSweden
BelgiumSpain
LithuaniaDenmark
NetherlandsFranceLatviaEU28
SloveniaAustria
GermanyPoland
BulgariaHungaryPortugal
Czech RCroatia
SlovakiaItaly
Romania
Sour
ce E
uros
tat (
2018
d 2
018f
201
8g 2
018h
201
8j)
oza
na n
ad
ov
eza jelić ma
rg
ar
eta ga
rd
ijan k
edžo
efficien
cy v
s effectiv
eness a
n an
aly
sis of tertia
ry edu
catio
n ac
ro
ss eur
ope
pub
lic secto
r ec
on
om
ics
42 (4) 381-414 (2018)
394 Figure 5Tertiary education quality indicators (averages 2004-2006 2007-2009 2010-2012 2013-2015)
a) Unemployment rates ( 15-64) all ISCED 2011 levelsUnemployment rates ( 15-64) tertiary
education (levels 5-8) multiplied by tertiary educated population activity rate
b) Gross domestic product at market prices current prices purchasing power standard
per capita (three-year averages)
0
50
100
150
200
250
300
Lith
uani
aH
unga
ryC
zech
R
Ger
man
yB
ulga
riaSw
eden
Latv
iaU
KN
ethe
rland
sSl
ovak
iaFi
nlan
dIr
elan
dPo
land
Spai
nB
elgi
umEU
28Fr
ance
Esto
nia
Slov
enia
Aus
tria
Cro
atia
Den
mar
kIta
lyPo
rtuga
lR
oman
ia
05000
1000015000200002500030000350004000045000
Irel
and
Net
herla
nds
Aus
tria
Den
mar
kG
erm
any
Swed
enB
elgi
umFi
nlan
dU
KFr
ance
EU28
Italy
Spai
nC
zech
R
Slov
enia
Slov
akia
Portu
gal
Esto
nia
Lith
uani
aH
unga
ryPo
land
Latv
iaC
roat
iaR
oman
iaB
ulga
ria
c) Underachieving 15-year-old students ( PISA survey average of all fields)
d) University rankings ndash Times Higher Education an average overall score
0
10
20
30
40
50
60
Bul
garia
Rom
ania
Slov
akia
Hun
gary
Cro
atia
Lith
uani
aIta
lyFr
ance
Aus
tria
Cze
ch R
EU
28Sw
eden
Bel
gium
Portu
gal
UK
Spai
nLa
tvia
Net
herla
nds
Ger
man
yPo
land
Slov
enia
Den
mar
kIr
elan
dFi
nlan
dEs
toni
a
0
10
20
30
40
50
60
70
Net
herla
nds
Swed
enB
elgi
umG
erm
any
Den
mar
kFi
nlan
dU
KA
ustri
aIr
elan
dFr
ance
Italy
Esto
nia
Spai
nPo
rtuga
lC
roat
iaSl
oven
iaH
unga
ryC
zech
R
Slov
akia
Rom
ania
Pola
ndLa
tvia
Lith
uani
aB
ulga
ria
Source Eurostat (2018a 2018e 2018i 2018j) Times Higher Education (2017)
4 methodologyThe efficiency and (what we later regard as) the effectiveness analysis of the ter-tiary education in 24 EU member states8 is conducted using data envelopment analysis (DEA) DEA is a nonparametric method of mathematical programming which is developed for evaluating the relative efficiency of units under assess-ment usually called the decision-making units (DMUs) Since its introduction by the pioneering CCR model in 1978 (Charnes Cooper and Rhodes 1978) followed by the BCC model published by Banker Charnes and Cooper in 1984 DEA has instantly been recognized as a modern tool for performance management While the CCR model assumes constant returns to scale (CRS) the BCC model assumes variable returns to scale which allows the use of DEA in problems where increases in inputs result in non-proportionate increases in outputs (and vice versa) The most appealing features of DEA are that it allows multiple criteria for determining efficiency to be used and appropriate variables to be selected which are (in most models) unit-invariant without the use of their pre-defined weights In addition all assessments are relative given the finite number of comparable DMUs Follow-
8 We excluded Cyprus Malta Luxemburg and Greece from the analysis due to the lack of data
oza
na n
ad
ov
eza jelić ma
rg
ar
eta ga
rd
ijan k
edžo
efficien
cy v
s effectiv
eness a
n an
aly
sis of tertia
ry edu
catio
n ac
ro
ss eur
ope
pub
lic secto
r ec
on
om
ics
42 (4) 381-414 (2018)395ing the specific needs of the research environment a vast number of models have
been developed within DEA to fit and capture the nature of the research problem thus providing a great tool for different kinds of efficiency analysis Additionally the popularity of DEA and the number of its applications are on the rise (Emrouzne-jad and Yang 2018)
DEA was initially developed with the idea of measuring the efficiency of produc-tion units such as factories hospitals or banks where one can unswervingly determine their inputs and their outputs Such DMUs can manage their inputs and outputs to a certain degree (thus the name decision-making units) An additional assumption is that the aim of DMUs is to use their available inputs to achieve greater outputs or try to use fewer inputs for producing the desired level of output In other words they are assumed to aim for the efficiency in a production process However the application of DEA has spread outside the production processes and researchers are using it for evaluating the relative efficiency of different kinds of (relatively homogenous) units that need to be estimated given their undesirable (input) and desirable (output) characteristics The examples are the portfolio selection the performance of companies using their financial ratio data perfor-mance of countries according to their macroeconomic indicators or different ldquopro-cessesrdquo for example fiscal policy or educational policy As is obvious such DMUs are not the ldquodecision-makingrdquo units themselves and not all of them should aim for efficiency in terms of fewer inputs to greater outputs Moreover the selec-tion of their inputs and outputs is arbitrary but this allows a researcher to define the relevant aspects of the ldquoefficiencyrdquo of DMUs
The use of DEA for estimating the relative efficiency of education at different levels (primary secondary tertiary) has been very popular over recent years The overview of some of these researches previously mentioned in the literature over-view revealed that the most frequently used model is the BCC model (with input or output orientation) which is an appropriate approach given the nature of this research problem Without questioning the great contribution and effort of past researches what we argue is that their selection of inputs and outputs gives more importance to the greater quantity of the educational output We strongly suggest that education should be assessed not only in terms of quantity but also in terms of quality Figuratively speaking a factory that manages to produce something using almost nothing should be seen as a role model and a factory that invests a lot relative to others and achieves less than the others should be recognized as poorly managed However countries that have large investments in education should not be punished in such studies if they manage to provide a high quality of education Likewise the countries that have almost negligible inputs should not be rewarded just because they managed ldquoto producerdquo any amount of outputs of low quality despite their low inputs Therefore we suggest that at the beginning of the study using DEA the crucial question should be asked ldquoAre we really aiming at the quantity or the qualityrdquo and the answer should be followed with the selec-tion of the inputs and the outputs that are relevant for the study
oza
na n
ad
ov
eza jelić ma
rg
ar
eta ga
rd
ijan k
edžo
efficien
cy v
s effectiv
eness a
n an
aly
sis of tertia
ry edu
catio
n ac
ro
ss eur
ope
pub
lic secto
r ec
on
om
ics
42 (4) 381-414 (2018)
396 In addition just as the output of the production facility is determined with the qual-ity of the inputs which cannot be always controlled certain levels of the educa-tional process are determined by the outputs of the preceding processes Figura-tively one cannot make a tasty cake using salt instead of sugar For this problem DEA allows the definition of non-discretionary inputs which are relevant but they are not controllable and are defined by the environment (Banker and Morey 1986) This approach was used in some previous studies of education using DEA How-ever as we will explain in the following paragraphs we will treat the non-discre-tionary variables as discretionary to provide results that are more informative
DEA models can be output oriented aiming at maximization of outputs for the given level of inputs input-oriented aiming at minimization of inputs for the given level of outputs or non-oriented Also the models can assume constant variable or generalized returns to scale Following the nature of the problem we are analyzing we decide to use the output-oriented model assuming variable returns to scale (BCC model) To explain the methodology we first formulate the model Let there be N decision-making units (DMUs) DMU1 DMU2hellip DMUN which are homog-enous and comparative We assume that their efficiency should be estimated in terms of a certain number of inputs ndash the variables the values of which we want to be as small as possible and a certain number of outputs ndash variables the values of which we prefer to be as big as possible Let xij ge 0 be an i-th input for some DMUj
and yrj gt 0 its r-th output Therefore each DMUj is represented by a vector of inputs and a vector of out-puts so is an input matrix and is an output matrix To make the model stable it is recommended that the number of DMUs (N) should not exceed The BCC model (Banker Charnes and Cooper 1984) can be written in the following envelopment form
(1)
(2)
(3)
(4)
where ε gt 0 and and are slack variables If we denote the optimal solution as a DMUo is efficient if and only if the efficiency score and
all DMUo is weakly efficient if and only if but or for some i and r in some alternate optima (Cooper Seiford and Zhu 2011)
Otherwise a DMU is inefficient Resulting from the optimal solution of the pro-gram (1) ndash (4) an inefficient DMU can be projected to the BCC efficiency
oza
na n
ad
ov
eza jelić ma
rg
ar
eta ga
rd
ijan k
edžo
efficien
cy v
s effectiv
eness a
n an
aly
sis of tertia
ry edu
catio
n ac
ro
ss eur
ope
pub
lic secto
r ec
on
om
ics
42 (4) 381-414 (2018)397frontier as a combination of other DMU using the formulas
and (Cooper Seiford and Zhu 2011) Therefore the lambdas allow us to identify the peer group of an inefficient DMU By observing these efficient projections we can analyze how a DMU should increase its outputs andor decrease its inputs to become relatively efficient9
The period of analysis is divided into four subperiods 2004-2006 2007-2009 2010-2012 and 2013-2015 The selection of the periods is mostly dictated by the availability of the data and the change in the data methodology As explained in table 1 subperiods within 2004-2012 and subperiod 2013-2015 are characterized by different variables due to the availability of the data Therefore a direct com-parison of results between periods is not advisable
To circumvent the problem of missing data we decided to calculate the simple three ndash years averages of data as the closest representative of the period However even this procedure resulted in some countries having missing data so our approach was to exclude countries that had more than one missing data item In order to keep as many countries as possible in the sample those countries that had only one missing data item were kept in the sample and missing inputsoutputs were assigned a pessimistic value which is largesmall enough for an objective function not to be entered as proposed by Kuosmanen (2009) We did this only for countries that had one missing data item because we did not want to affect the ldquotechnology setrdquo and worsen the relative ranking of other DMUs that had com-plete data Additionally we checked that the objective function in the solution included a multiplier of 0 for inputsoutputs variables with an arbitrary set value
After the correction of the sample the analysis includes 24 EU countries Belgium Bulgaria the Czech Republic Denmark Germany Estonia Ireland Spain France Croatia Italy Latvia Lithuania Hungary the Netherlands Austria Poland Portu-gal Romania Slovenia Slovakia Finland Sweden and the United Kingdom
In the first step we run the quantity-based models using variables expenditures (I)EX2 and financial aid (I)FA(EX) as inputs and as outputs we use the percentage of graduates (O)GRAD(20-29) the education returns on labor market (O)UUT and the percentage of highly educated population (O)POPT for the period of 2004-2012 We performed a similar analysis for the period 2013-2015 except that variable (I)FA(EX) is replaced by the ratio of students per teacher (I)(ST) and variable (O)GRAD(20-29) with (O)GRAD(20-34) As is obvious such a selection of variables led to rewarding the quantity of the educational output and reporting on the efficiency of the tertiary education
The second step was to include quality corrections for the previously obtained efficiency analysis Firstly we take account of output-quality and then we intro-
9 Some additional explanation on the BCC and other DEA models can be found in for example Cooper Sei-ford and Tone (2006) or Cooper Seiford and Zhu (2011)
oza
na n
ad
ov
eza jelić ma
rg
ar
eta ga
rd
ijan k
edžo
efficien
cy v
s effectiv
eness a
n an
aly
sis of tertia
ry edu
catio
n ac
ro
ss eur
ope
pub
lic secto
r ec
on
om
ics
42 (4) 381-414 (2018)
398 duce the input-quality correction as well For the output-quality control we replace the output variable (O)UUT by the quality-corrected variable (O)UUTACT ((O)UUT multiplied with activity rates of the tertiary educated population) Also variable (O)POPT was substituted for by (O)GDPpc in 2004-2012 and by (O)UR university ranking in 2013-2015 (as (O)GDPpc and (O)UR showed to be highly positively correlated) Afterward the input-quality control was introduced by including PISA results in the analysis Altogether we estimated 6 different models using inputs and outputs in certain subperiods as presented in table 2
Table 2Variables used in each DEA model by period
Period 2004-2012 2013-2015Model Inputs Outputs Inputs Outputs
Quantity model
(I)EX2( GDP)(I)FA( EX)
(O)GRAD(20-29)(O)UUT(O)POPT
(I)EX2( GDP)(I)ST
(O)GRAD(20-34)(O)UUT(O)POPT
Output ndash quality model
(I)EX2( GDP)(I)FA( EX)
(O)GRAD(20-29)(O)UUTACT(O)GDPpc
(I)EX2( GDP)(I)ST)
(O)GRAD(20-34)(O)UUTACT(O)UR
Input ndash output quality model
(I)EX2( GDP)(I)FA( EX)(I)PISA a
(O)GRAD(20-29)(O)UUTACT(O)GDPpc
(I)EX2( GDP)(I)ST(I)PISA
(O)GRAD(20-34)(O)UUTACT(O)UR
a Circled variables present quality correction measuresSource Authors
5 results analysIs of the effIcIency and effectIVeness of tertIary educatIon In the eu
Figures 6a-6c present our results for the period of 2004-2012 whereas figure 6d shows the results for the last period of 2013-2015 which is analyzed using differ-ent variables Therefore we do not make ready comparisons between them How-ever the results from the period of 2013-2015 mostly support our conclusions and what we also conclude is that the choice of the variables for this period is rather robust and findings can be drawn that are similar to those from the period of 2007-2012
The tables with exact DEA scores for the analyzed period are given in table A5 in appendix and here we present the rankings resulting from these scores The dark bars in figures 6a-6d indicate the rankings of the countries calculated by the quan-tity model For the sake of clarity we present the higher ranking with a higher bar In addition we rank all efficient units as 24th and a unit with the highest inefficient score as the 23rd (or the second best) etc By generally observing the results we see that approximately a similar number of countries (9 to 14) remains efficient throughout the years within each model The relatively large number of efficient countries within each period is the result of the total number of input and output variables decreasing the number of inputs and outputs would decrease the num-ber of efficient countries However we aimed to include most of the variables that
oza
na n
ad
ov
eza jelić ma
rg
ar
eta ga
rd
ijan k
edžo
efficien
cy v
s effectiv
eness a
n an
aly
sis of tertia
ry edu
catio
n ac
ro
ss eur
ope
pub
lic secto
r ec
on
om
ics
42 (4) 381-414 (2018)399were used in the previous studies and this comes at a cost Quantity-based effi-
ciency results show that some of the most developed countries in the sample like Austria and the Netherlands are not efficient while some less developed countries like Hungary Estonia and Bulgaria define the efficient frontier in some periods The change of ranking reported by the output-quality model is shown with a striped bar When output-quality control is included most of the efficient coun-tries retain their position but a significant number of them decrease in rank and the rank of some of rises Overall the number of efficient countries decreases and the overall average efficiency score decreases
Afterward we take account of the quality of the inputs In the input-output quality model we add PISA as an input In this way if underachieving PISA results are relatively low it will increase the efficiency score If the opposite PISA will decrease the score In figures 6a-6d we use a dark black bar to indicate the differ-ence between rank in output-quality and input-output-quality model If the differ-ence is positive it means that countriesrsquo tertiary education produces relatively higher quality outputs given the relatively low quality of students (inputs) meas-ured by PISA results If the difference is negative the opposite is true In this way we get an insight into how the quality of the students measured by PISA can influence educational efficiency
When we consider educational output quality in our model it becomes obvious that countries which were inefficient in the quantity-based model and which are usually perceived as countries with solid educational systems improve their rank significantly Namely output-quality based efficiency results in almost all ana-lyzed periods (figures 6a-6d) show that Austria and the Netherlands reach the efficient frontier Austria and Netherlands are the most obvious examples but the same is true for Germany (2007-2009) Denmark (2007-2009 2010-2012) Swe-den (2007-2009 2010-2012) and Belgium (2013-2015) which also experience efficiency gains in output-quality model On the other hand less developed coun-tries (like Hungary Estonia and Bulgaria) lose their efficiency in all periods in the quality-based model in comparison to the quantity model
The correction for the input-quality generally shows that at a given level of PISA results for many countries the tertiary education efficiency ranking should actu-ally be increased This is noticeable for Austria Italy France and the Netherlands within developed countries and in Bulgaria (all periods) Croatia and Hungary (slight increase in all periods except 2007-2009) within the group of the less developed countries
For example during the period of 2007-2012 Croatiarsquos relative position is slightly degraded when an output-quality control is introduced Therefore when consider-ing the relatively poor quality of students in Croatia tertiary education effective-ness is greater than the output-quality model results imply Generally Croatia has one of the lowest indicators of (O)UUTACT and (O)GDPpc but according to
oza
na n
ad
ov
eza jelić ma
rg
ar
eta ga
rd
ijan k
edžo
efficien
cy v
s effectiv
eness a
n an
aly
sis of tertia
ry edu
catio
n ac
ro
ss eur
ope
pub
lic secto
r ec
on
om
ics
42 (4) 381-414 (2018)
400 our results it is not the worst ranked country in the EU concerning tertiary educa-tion efficiency and effectiveness By observing the reference set of efficient coun-tries for Croatia (identified by λgt0 from the model (1)-(4) results shown in tables A2-A4 in appendix) for the period 2004-2012 the BCC model projects Croatia using the inputoutput vectors of the efficient Czech Republic (among others) For the purpose of comparison the Czech Republic has lower inputs in expenditures and PISA and all outputs greater than Croatia
Poland and Estonia are less developed countries that could achieve greater tertiary education effectiveness given the relatively high-quality students The same can be concluded for Finland a developed country that ineffectively uses its high-quality students
Figure 6Results of the DEA analysis
a) 2004-2006 b) 2007-2009
-24-20-16-12-8-4048
12162024
-25-20-15-10-505
10152025
Quantity based score 0406Output quality based model (change to quantity model) ndash rhs 0406 Correction for input quality ndash rhs 0406
Quantity based score 0709Output quality based model (change to quantity model) ndash rhs 0709Correction for input quality ndash rhs 0709
Bul
garia
Rom
ania
Slov
akia
Hun
gary
Cro
atia
Lith
uani
a
Italy
Fran
ce
Aus
tria
Cze
ch R
Swed
en
Bel
gium
Portu
gal
UK
Spai
n
Latv
ia
Net
herla
nds
Ger
man
y
Pola
nd
Slov
enia
Den
mar
k
Irel
and
Finl
and
Esto
nia
Bul
garia
Rom
ania
Slov
akia
Hun
gary
Cro
atia
Lith
uani
aIta
lyFr
ance
Aus
tria
Cze
ch R
Sw
eden
Bel
gium
Portu
gal
UK
Spai
nLa
tvia
Net
herla
nds
Ger
man
y
Pola
nd
Slov
enia
Den
mar
k
Irel
and
Finl
and
Esto
nia
c) 2010-2012 d) 2013-2015
-24-20-16-12-8-4048
12162024
-24-20-16-12-8-4048
12162024
Quantity based score 1012Output quality based model (change to quantity model) ndash rhs 1012Correction for input quality ndash rhs 1012
Quantity based score 1315Output quality based model (change to quantity model) ndash rhs 1315Correction for input quality ndash rhs 1315
Bul
garia
Rom
ania
Slov
akia
Hun
gary
Cro
atia
Lith
uani
a
Italy
Fran
ce
Aus
tria
Cze
ch R
Swed
en
Bel
gium
Portu
gal
UK
Spai
n
Latv
ia
Net
herla
nds
Ger
man
y
Pola
nd
Slov
enia
Den
mar
k
Irel
and
Finl
and
Esto
nia
Bul
garia
Rom
ania
Slov
akia
Hun
gary
Cro
atia
Lith
uani
aIta
lyFr
ance
Aus
tria
Cze
ch R
Sw
eden
Bel
gium
Portu
gal
UK
Spai
n
Latv
ia
Net
herla
nds
Ger
man
y
Pola
nd
Slov
enia
Den
mar
k
Irel
and
Finl
and
Esto
nia
Source Authors
The question is what could a country do to be relatively better in the area of edu-cational quality in the future and what its closest quality-led efficient role models should be The optimal results of the BCC model provide the values of the slack variables for inefficient countries The slacks indicate the shortfalls in the data of a certain country and possible suggestions for future improvements in the quality
oza
na n
ad
ov
eza jelić ma
rg
ar
eta ga
rd
ijan k
edžo
efficien
cy v
s effectiv
eness a
n an
aly
sis of tertia
ry edu
catio
n ac
ro
ss eur
ope
pub
lic secto
r ec
on
om
ics
42 (4) 381-414 (2018)401aspect However the findings are related to a certain country and the analysis is
beyond the scope of this paper Interested readers can find the results in appendix (figure A1) where the figures indicate the greatest shortfalls in the of the origi-nal data for each country
We chose not to analyze the scale of suggested corrections for each country within each model but we give some general observations and comments on the indi-vidual results (1) periods of 2007-2009 and 2010-2012 show rather similar pat-terns where output quality corrections are noticeable for Bulgaria Estonia and Denmark (2) in the period of 2007-2015 Austria and the Netherlands improve their rating after both output and input-output quality corrections (3) Poland and especially Finland and Estonia are the only countries able to utilize their high-quality students (measured by PISA results) more effectively (in terms of educa-tional outputsoutcomes quality) Finally the overall best-ranked countries after both input and output quality control for the whole period of 2004-2015 are the UK Slovakia Italy France Lithuania Ireland and Finland
6 PolIcy ImPlIcatIons and future research recommendatIonsThis paper has dealt with tertiary education efficiency and effectiveness in the EU It is a well-established fact that the quality of education matters more than the quantity Still most of the papers which use the DEA approach make tertiary edu-cation comparisons between countries considering only the definition of effi-ciency Some papers deal with quality issues but mostly on the output side of the educational ldquoproduction functionrdquo Therefore the questions regarding the quality of educational inputs and outputs and the effectiveness are usually covered only partially In this paper we argue that a greater focus on efficiency can give mis-leading results which could translate into flawed educational policy prescriptions
We performed DEA over available educational inputs and outputs during four non-overlapping periods from 2004 to 2015 in 24 EU countries DEA allowed us to rank countries regarding their tertiary education efficiencyeffectiveness in achieving favorable educational and labor market outcomes However we argued that DEA results should be interpreted with a great deal of caution and should not serve as important educational policy and strategy inputs due to the lack of the quality of educational inputs and outputs considerations as well as the decreasing returns on higher education in countries with broad coverage of the population by tertiary edu-cation To avoid a potential bias towards the low input units within the DEA educa-tional inputs and outputs were adjusted for the quality of education indicators Spe-cifically we differentiated the quantity and quality measures of educational inputs and outputs which enabled us to distinguish tertiary education efficiency from ter-tiary education effectiveness since the latter seems to matter more for growth
Our results show that many less developed EU countries achieve efficiency but not effectiveness in tertiary education The opposite is true for some developed coun-tries This is possible due to the low (high) educational inputs in less (more) devel-
oza
na n
ad
ov
eza jelić ma
rg
ar
eta ga
rd
ijan k
edžo
efficien
cy v
s effectiv
eness a
n an
aly
sis of tertia
ry edu
catio
n ac
ro
ss eur
ope
pub
lic secto
r ec
on
om
ics
42 (4) 381-414 (2018)
402 oped countries However when we consider some quality indicators of outcomesoutputs a few less developed EU countries which were characterized as efficient in the quantity model fail to reach defined efficiency border On the other hand some of the inefficient developed countries increase their DEA based ranking and achieve effectiveness (quality-based efficiency) It is not only that the quality of educational outputs matters for the results but the same is true for input quality considerations It turns out that some countries which were downgraded (upgraded) in the output quality DEA model have a lower (higher) quality student base as measured by PISA results Since it could not be expected that tertiary education provides the same quality of outcomes with different input quality efficiency improves (deteriorates) in the input-output quality-based model in many countries with a low (high) quality student base Therefore the results confirmed our hypothesis that quality considera-tions could significantly affect standard tertiary education efficiency analysis results Any future research in this area should not evaluate tertiary education effi-ciency only in terms of the quantity measures of educational inputs and outputs As already emphasized the literature on economic growth and convergence long ago acknowledged educational quality as being more important than quantity DEA based efficiencyeffectiveness research should follow this example
Future research should dig deeper into the rich set of models and results which DEA provides Questions like ldquowhat induces inefficiency in inefficient countriesrdquo (see figure A1 in appendix) and ldquowhich countries define the reference sets (role-models) for inefficient countriesrdquo (see tables A2-A4 in appendix) are especially important for countries like Croatia which proved to be inefficient and ineffective regarding tertiary education Research into the first question should illuminate potential financial black holes while the answers to the second question could shed some light on good practices which could be (easily) implemented in Croa-tian education and customized for its needs From the methodological point of view any future research should address the issues of large numbers of variables which result in too many efficient decision units (countries) as well as some tim-ing and variable selection issues
The key policy implication of our results suggests that greater emphasis should be put on the convergence of tertiary education effectiveness (and not efficiency) within the EU to enhance transmission of tertiary education outcomes into higher productivity and growth rates However since primary and secondary education define the ldquoqualityrdquo of inputs at higher educational levels such a policy task requires comprehensive educational reform in countries which are lagging behind Nevertheless it should be emphasized that the major limitations of the study fol-low from the limited data resources and some concerns about the quality of the data reported by Eurostat The inclusion of data that do not properly represent the situation might significantly change the relative results of the analysis
disclosure statement No potential conflict of interest was reported by the authors
oza
na n
ad
ov
eza jelić ma
rg
ar
eta ga
rd
ijan k
edžo
efficien
cy v
s effectiv
eness a
n an
aly
sis of tertia
ry edu
catio
n ac
ro
ss eur
ope
pub
lic secto
r ec
on
om
ics
42 (4) 381-414 (2018)403
aPP
en
dIX
Ta
bl
e a
1Pr
evio
us re
sear
ch ra
nkin
gs (D
EA)
Pape
ra
hec
Šonj
e
Des
kar-
Škrb
ić
and
Šonj
e (2
018)
toth
(2
009)
ari
stov
nik
and
Oba
dić
(201
1)a
ubyn
et a
l (2
009)
yoto
va a
nd
stef
anov
a (2
017)
year
2005
-201
3 (a
vg)
2006
1999
-200
7 (a
vg)
1998
-20
0120
02-
2005
1998
-20
0120
02-
2005
1998
-20
0120
02-
2005
1998
-20
0120
02-
2005
2012
and
201
4
mod
el1
21
12
31
12
23
34
41
23
no
of e
u c
ount
ries
1117
2222
2225
9A
ustri
a
15
13 9
11 9
10 6
9 8
B
ulga
ria3
31
10 8
10 8
2420
2325
65
5B
elgi
um
2121
2625
8 8
7 9
C
ypru
s
3727
11
1027
23
Cze
ch R
epub
lic1
111
133
717
18
14
1722
243
31
Ger
man
y
13
1516
1210
911
1011
D
enm
ark
111
1 9
111
10 8
7
Esto
nia
82
21
1619
2728
1722
1815
1716
77
6G
reec
e
18
1910
3118
2228
2719
2424
23
Spai
n
1
3217
3426
2720
2021
1818
15
Finl
and
12 1
120
1 7
1 7
1 7
1 5
Fr
ance
934
2432
1917
1611
1213
1214
C
roat
ia9
8
2632
23
Hun
gary
47
1612
28 9
2323
2426
2322
2122
88
8Ir
elan
d
1721
14 1
1 1
1 1
1 1
1
Italy
118
2322
1212
1314
1312
1312
oza
na n
ad
ov
eza jelić ma
rg
ar
eta ga
rd
ijan k
edžo
efficien
cy v
s effectiv
eness a
n an
aly
sis of tertia
ry edu
catio
n ac
ro
ss eur
ope
pub
lic secto
r ec
on
om
ics
42 (4) 381-414 (2018)
404
Pape
ra
hec
Šonj
e
Des
kar-
Škrb
ić
and
Šonj
e (2
018)
toth
(2
009)
ari
stov
nik
and
Oba
dić
(201
1)a
ubyn
et a
l (2
009)
yoto
va a
nd
stef
anov
a (2
017)
year
2005
-201
3 (a
vg)
2006
1999
-200
7 (a
vg)
1998
-20
0120
02-
2005
1998
-20
0120
02-
2005
1998
-20
0120
02-
2005
1998
-20
0120
02-
2005
2012
and
201
4
mod
el1
21
12
31
12
23
34
41
23
Lith
uani
a1
1
112
128
2621
1917
1616
171
11
Latv
ia1
1
2013
2317
11
1M
alta
16
1519
16 7
911
10
Net
herla
nds
10 1
1 1
1 1
5 1
6
Pola
nd5
117
122
1322
2018
1516
1915
185
64
Portu
gal
1425
2522
2122
2120
21
Rom
ania
26
13
3510
113
22
2Sw
eden
823
827
1 1
1 1
1 1
1 1
Sl
oven
ia7
5
113
129
1415
1825
2525
204
44
Slov
akia
64
1 1
36 1
2424
2524
1514
1919
U
nite
d K
ingd
om
7
2219
17 1
1 1
1 1
1 1
1
Sour
ce A
utho
rs
oza
na n
ad
ov
eza jelić ma
rg
ar
eta ga
rd
ijan k
edžo
efficien
cy v
s effectiv
eness a
n an
aly
sis of tertia
ry edu
catio
n ac
ro
ss eur
ope
pub
lic secto
r ec
on
om
ics
42 (4) 381-414 (2018)405Figure a1
Input and output slacks of inefficient countriesa) Quantity model results
i Output slacks () ii Input slacks ()
-45-40-35-30-25-20-15-10-50
Finl
and
Slov
enia
Net
herla
nds
Den
mar
kEs
toni
aB
elgi
umH
unga
rySw
eden
Pola
ndC
roat
iaPo
rtuga
lR
oman
iaA
ustri
aB
ulga
riaC
zech
R
Ger
man
yLa
tvia
(I)EX2( GDP) (I)FA( EX) (I)ST
0
10
20
30
40
50
60
70
Portu
gal
Aus
tria
Ger
man
yR
oman
iaB
ulga
riaSl
oven
iaSw
eden
Net
herla
nds
Hun
gary
Cro
atia
Finl
and
Esto
nia
Bel
gium
Pola
ndD
enm
ark
Cze
ch R
La
tvia
(O)GRAD(20-29) (O)POPT (O)UUT
b) Outputs quality model resultsi Output slacks () ii Input slacks ()
-60
-50
-40
-30
-20
-10
0
Finl
and
Den
mar
kR
oman
iaSl
oven
iaEs
toni
aSw
eden
Portu
gal
Hun
gary
Net
herla
nds
Cro
atia
Cze
ch R
Po
land
Bel
gium
Bul
garia
Spai
nG
erm
any
Aus
tria
Fran
ceIr
elan
dLa
tvia
(I)EX2( GDP) (I)FA( EX) (I)ST (O)GRAD(20-29) (O)UUTACTT
(O)GDPpc (O)UR
0
50
100
150
200
250
300A
ustri
aG
erm
any
Portu
gal
Spai
nEs
toni
aB
ulga
riaH
unga
rySl
oven
iaC
roat
iaSw
eden
Net
herla
nds
Rom
ania
Irel
and
Bel
gium
Finl
and
Latv
iaD
enm
ark
Cze
ch R
Fr
ance
Pola
nd
c) Inputs and outputs quality model resultsi Output slacks () ii Input slacks ()
Den
mar
kR
oman
ia
Slov
enia
Swed
enPo
rtuga
l
Hun
gary
Net
herla
nds
Cro
atia
Bel
gium
Bul
garia
Spai
n
Ger
man
yA
ustri
aIta
lyLa
tvia
Lith
uani
a
Den
mar
k
Rom
ania
Slov
enia
Swed
en
Portu
gal
Hun
gary
Net
herla
nds
Cro
atia
Bel
gium
Bul
garia
Spai
nG
erm
any
Aus
tria
Italy
Latv
ia
Lith
uani
a
(I)EX2( GDP) (I)FA( EX) (O)GRAD(20-29) (O)UUTACTT
(I)ST (I)PISA (O)GDPpc (O)UR
-60
-50
-40
-30
-20
-10
0
0
50
100
150
200
250
300
Source Authors
oza
na n
ad
ov
eza jelić ma
rg
ar
eta ga
rd
ijan k
edžo
efficien
cy v
s effectiv
eness a
n an
aly
sis of tertia
ry edu
catio
n ac
ro
ss eur
ope
pub
lic secto
r ec
on
om
ics
42 (4) 381-414 (2018)
406T
ab
le a
2Re
fere
nce
set o
f a D
MU
from
the
quan
tity-
base
d D
EA m
odel
by
peri
od
2004
-200
620
07-2
009
2010
-201
220
13-2
015
1B
elgi
umB
elgi
umB
elgi
um
Bel
gium
Irel
and-
Lith
uani
a2
Bul
garia
Bul
garia
Bel
gium
-Cze
ch R
ep-E
ston
ia-F
inla
ndB
ulga
riaC
zech
Rep
-Ger
man
y-Sl
ovak
ia-U
K3
Cze
ch R
ep
Cze
ch R
ep
Cze
ch R
ep
Cze
ch R
ep
Cze
ch R
ep
4D
enm
ark
Den
mar
kD
enm
ark
Irel
and-
Lith
uani
a-U
KIr
elan
d-Li
thua
nia
5G
erm
any
Ger
man
yB
elgi
um-S
lova
kia-
Finl
and
Bul
garia
-Hun
gary
-Fin
land
-UK
Ger
man
y6
Esto
nia
Esto
nia
Esto
nia
Esto
nia
Esto
nia
7Ir
elan
dIr
elan
dIr
elan
d Ir
elan
dIr
elan
d8
Spai
nSp
ain
Spai
n Sp
ain
Spai
n9
Fran
ceFr
ance
Fran
ce
Fran
ceFr
ance
10C
roat
iaC
roat
iaC
zech
Rep
-Spa
in-C
roat
ia-P
olan
dC
zech
Rep
-Fra
nce-
Pola
ndC
zech
Rep
-Lith
uani
a11
Italy
Italy
Italy
Ita
lyIta
ly
12La
tvia
Latv
iaLa
tvia
C
zech
Rep
-Fra
nce-
Lith
uani
a-Po
land
-Rom
ania
Cze
ch R
ep-G
erm
any-
Irel
and-
Lith
uani
a-U
K13
Lith
uani
aLi
thua
nia
Lith
uani
a Li
thua
nia
Lith
uani
a14
Hun
gary
Hun
gary
Irel
and-
Slov
akia
-Fin
land
-UK
Hun
gary
Hun
gary
15N
ethe
rland
sN
ethe
rland
sB
elgi
um-D
enm
ark-
Finl
and
Irel
and-
Finl
and-
UK
Irel
and-
Lith
uani
a16
Aus
tria
Aus
tria
Bel
gium
-Slo
vaki
a-Fi
nlan
d B
ulga
ria-S
pain
-Slo
vaki
a-U
KC
zech
Rep
-Spa
in-S
lova
kia-
UK
17Po
land
Pola
ndPo
land
Po
land
Lith
uani
a18
Portu
gal
Portu
gal
Irel
and-
Lith
uani
a-Po
land
-Slo
vaki
aFr
ance
-Lith
uani
a-R
oman
ia-U
KLi
thua
nia-
Slov
akia
19R
oman
iaR
oman
iaPo
land
-Slo
vaki
aR
oman
iaR
oman
ia20
Slov
enia
Slov
enia
Lith
uani
a-Sl
ovak
ia-U
K
Bul
garia
-Lith
uani
a-H
unga
ry-U
KIr
elan
d-Li
thua
nia
21Sl
ovak
iaSl
ovak
iaSl
ovak
ia
Slov
akia
Slov
akia
22Fi
nlan
dFi
nlan
dFi
nlan
d Fi
nlan
dIr
elan
d-Li
thua
nia
23Sw
eden
Swed
enB
elgi
um-D
enm
ark-
Finl
and
Irel
and-
Finl
and-
UK
Irel
and-
Lith
uani
a24
UK
UK
UK
U
KU
KN
ote
Effi
cien
t cou
ntri
es a
re a
pro
ject
ion
of th
emse
lves
So
urce
Aut
hors
oza
na n
ad
ov
eza jelić ma
rg
ar
eta ga
rd
ijan k
edžo
efficien
cy v
s effectiv
eness a
n an
aly
sis of tertia
ry edu
catio
n ac
ro
ss eur
ope
pub
lic secto
r ec
on
om
ics
42 (4) 381-414 (2018)407
Ta
bl
e a
3Re
fere
nce
set o
f a D
MU
from
the
outp
ut q
ualit
y-ba
sed
DEA
mod
el b
y pe
riod
2004
-200
620
07-2
009
2010
-201
220
13-2
015
1B
elgi
umIr
elan
d-Ita
ly-S
lova
kia-
UK
Irel
and-
Fran
ce-L
ithua
nia-
Slov
akia
-UK
Cze
ch R
ep-G
erm
any-
Irel
and-
Aus
tria
Ger
man
y-N
ethe
rland
s-U
K
2B
ulga
riaC
zech
Rep
-Lat
via-
Lith
uani
a-Sl
ovak
iaC
zech
Rep
-Slo
vaki
aC
zech
Rep
-Ger
man
y-Sl
ovak
iaG
erm
any-
Lith
uani
a-Sl
ovak
ia-
Swed
en3
Cze
ch R
ep
Cze
ch R
ep
Cze
ch R
ep
Cze
ch R
ep
Lith
uani
a-H
unga
ry-U
K4
Den
mar
kIr
elan
d-Li
thua
nia
Irel
and-
Lith
uani
aIr
elan
d-Li
thua
nia
Den
mar
k5
Ger
man
yC
zech
Rep
-Ire
land
Ger
man
yG
erm
any
Ger
man
y
6Es
toni
aC
zech
Rep
-Ire
land
-Pol
and-
UK
Cze
ch R
ep-I
rela
nd-L
ithua
nia-
Rom
ania
Cze
ch R
ep-G
erm
any-
Irel
and-
Lith
uani
aD
enm
ark-
Lith
uani
a-N
ethe
rland
s-Sw
eden
7Ir
elan
dIr
elan
dIr
elan
dIr
elan
dIr
elan
d
8Sp
ain
Cze
ch R
ep-I
rela
nd-F
ranc
eC
zech
Rep
-Fra
nce-
Aus
tria-
Slov
akia
Cze
ch R
ep-S
pain
-Fra
nce-
Italy
Spai
n
9Fr
ance
Fran
ceFr
ance
Fran
ceFr
ance
10C
roat
iaC
zech
Rep
-Cro
atia
-Pol
and
Cze
ch R
ep-P
olan
dC
zech
Rep
-Lith
uani
aD
enm
ark-
Lith
uani
a-Sl
ovak
ia-
Swed
en11
Italy
Italy
Italy
Italy
Italy
-UK
12La
tvia
Latv
iaC
zech
Rep
-Lith
uani
a-R
oman
ia-
Slov
akia
Cze
ch R
ep-G
erm
any-
Lith
uani
aLi
thua
nia-
Hun
gary
-UK
13Li
thua
nia
Lith
uani
aLi
thua
nia
Lith
uani
aLi
thua
nia
14H
unga
ryLi
thua
nia-
Pola
nd-S
lova
kia-
UK
Cze
ch R
ep
Cze
ch R
ep-G
erm
any
Hun
gary
15N
ethe
rland
sC
zech
Rep
-Ire
land
Net
herla
nds
Net
herla
nds
Net
herla
nds
16A
ustri
aIr
elan
d-Ita
ly-S
lova
kia-
UK
Aus
tria
Aus
tria
Den
mar
k-N
ethe
rland
s-Sw
eden
-UK
17Po
land
Pola
ndPo
land
Lith
uani
aD
enm
ark-
Irel
and-
Lith
uani
a-U
K
oza
na n
ad
ov
eza jelić ma
rg
ar
eta ga
rd
ijan k
edžo
efficien
cy v
s effectiv
eness a
n an
aly
sis of tertia
ry edu
catio
n ac
ro
ss eur
ope
pub
lic secto
r ec
on
om
ics
42 (4) 381-414 (2018)
408
2004
-200
620
07-2
009
2010
-201
220
13-2
015
18Po
rtuga
lC
zech
Rep
-Ire
land
-Fra
nce
Irel
and-
Lith
uani
a-R
oman
iaG
erm
any-
Irel
and-
Lith
uani
aD
enm
ark-
Lith
uani
a-Sl
ovak
ia-
Swed
en-U
K19
Rom
ania
Lith
uani
a-Po
land
-Slo
vaki
aR
oman
iaR
oman
iaD
enm
ark-
Spai
n-Sl
ovak
ia-U
K
20Sl
oven
iaC
zech
Rep
-Ire
land
-UK
Cze
ch R
ep-I
rela
nd-
Lith
uani
a-U
KIr
elan
d-Li
thua
nia
Den
mar
k-Ir
elan
d-Li
thua
nia-
UK
21Sl
ovak
iaSl
ovak
iaSl
ovak
iaSl
ovak
iaSl
ovak
ia
22Fi
nlan
dC
zech
Rep
-Ire
land
Cze
ch R
ep-I
rela
nd-U
KC
zech
Rep
-Ger
man
y-Ir
elan
d-A
ustri
aD
enm
ark-
Lith
uani
a-N
ethe
rland
s-Sw
eden
23Sw
eden
Cze
ch R
ep-I
rela
ndG
erm
any-
Irel
and-
Net
herla
nds
Ger
man
y-N
ethe
rland
s-A
ustri
aSw
eden
24U
KU
KU
KU
KU
KSo
urce
Aut
hors
oza
na n
ad
ov
eza jelić ma
rg
ar
eta ga
rd
ijan k
edžo
efficien
cy v
s effectiv
eness a
n an
aly
sis of tertia
ry edu
catio
n ac
ro
ss eur
ope
pub
lic secto
r ec
on
om
ics
42 (4) 381-414 (2018)409
Ta
bl
e a
4Re
fere
nce
set o
f a D
MU
from
the
inpu
t and
out
put q
ualit
y ndash
base
d D
EA m
odel
by
peri
od
2004
-200
620
07-2
009
2010
-201
220
13-2
015
1B
elgi
umIr
elan
d-Fr
ance
-Ita
ly-
Slov
akia
-UK
Bel
gium
Cze
ch R
ep-G
erm
any-
Irel
and-
Aus
tria
Ger
man
y-N
ethe
rland
s-U
K
2B
ulga
riaC
zech
Rep
-Lat
via-
Lith
uani
a-Sl
ovak
iaC
zech
Rep
-Slo
vaki
aC
zech
Rep
-Ger
man
y-Sl
ovak
iaG
erm
any-
Lith
uani
a-Sl
ovak
ia-
Swed
en3
Cze
ch R
ep
Cze
ch R
ep
Cze
ch R
ep
Cze
ch R
ep
Cze
ch R
ep
4D
enm
ark
Irel
and-
Lith
uani
aD
enm
ark
Irel
and-
Lith
uani
aD
enm
ark
5G
erm
any
Cze
ch R
ep-I
rela
ndG
erm
any
Ger
man
yG
erm
any
6Es
toni
aEs
toni
aEs
toni
aEs
toni
aEs
toni
a7
Irel
and
Irel
and
Irel
and
Irel
and
Irel
and
8Sp
ain
Cze
ch R
ep-I
rela
nd-F
ranc
eC
zech
Rep
-Ger
man
y-Fr
ance
-A
ustri
a-Sl
ovak
iaSp
ain
Spai
n
9Fr
ance
Fran
ceFr
ance
Fran
ceFr
ance
10C
roat
iaC
roat
iaC
zech
Rep
-Pol
and
Cze
ch R
ep-L
ithua
nia
Den
mar
k-Li
thua
nia-
Slov
akia
-Sw
eden
11Ita
lyIta
lyIta
lyIta
lyIta
ly
12La
tvia
Latv
iaLa
tvia
Cze
ch R
ep-L
ithua
nia-
Pola
nd-
Finl
and
Ger
man
y-Ir
elan
d-Li
thua
nia-
Finl
and-
UK
13Li
thua
nia
Lith
uani
aLi
thua
nia
Lith
uani
aLi
thua
nia
14H
unga
ryC
zech
Rep
-Ire
land
-Pol
and-
UK
Cze
ch R
ep-S
lova
kia-
Finl
and
Cze
ch R
ep-G
erm
any
Hun
gary
15N
ethe
rland
sC
zech
Rep
-Ire
land
-Fin
land
Net
herla
nds
Net
herla
nds
Net
herla
nds
16A
ustri
aIr
elan
d-Ita
ly-S
lova
kia-
UK
Aus
tria
Aus
tria
Den
mar
k-Sw
eden
-UK
17Po
land
Pola
ndPo
land
Pola
ndPo
land
18Po
rtuga
lC
zech
Rep
-Ire
land
-Fra
nce
Irel
and-
Lith
uani
a-Po
land
-R
oman
iaG
erm
any-
Irel
and-
Lith
uani
aD
enm
ark-
Spai
n-Li
thua
nia-
Slov
akia
-Sw
eden
-UK
oza
na n
ad
ov
eza jelić ma
rg
ar
eta ga
rd
ijan k
edžo
efficien
cy v
s effectiv
eness a
n an
aly
sis of tertia
ry edu
catio
n ac
ro
ss eur
ope
pub
lic secto
r ec
on
om
ics
42 (4) 381-414 (2018)
410
2004
-200
620
07-2
009
2010
-201
220
13-2
015
19R
oman
iaLi
thua
nia-
Pola
nd-S
lova
kia
Rom
ania
Rom
ania
Den
mar
k-Sp
ain-
Slov
akia
-UK
20Sl
oven
iaC
zech
Rep
-Ire
land
-Pol
and-
Finl
and
Cze
ch R
ep-I
rela
nd-
Lith
uani
a-U
KIr
elan
d-Li
thua
nia
Den
mar
k-Es
toni
a-Ir
elan
d-Fi
nlan
d-U
K21
Slov
akia
Slov
akia
Slov
akia
Slov
akia
Slov
akia
22Fi
nlan
dFi
nlan
dFi
nlan
dFi
nlan
dFi
nlan
d23
Swed
enC
zech
Rep
-Ire
land
Ger
man
y-Ir
elan
d-N
ethe
rland
sG
erm
any-
Net
herla
nds-
Aus
tria
Swed
en24
UK
UK
UK
UK
UK
Sour
ce A
utho
rs
oza
na n
ad
ov
eza jelić ma
rg
ar
eta ga
rd
ijan k
edžo
efficien
cy v
s effectiv
eness a
n an
aly
sis of tertia
ry edu
catio
n ac
ro
ss eur
ope
pub
lic secto
r ec
on
om
ics
42 (4) 381-414 (2018)411
Ta
bl
e a
5Ef
ficie
ncy
scor
es o
btai
ned
from
all
mod
els
by p
erio
d
Qua
ntity
mod
elo
utpu
t qua
lity
mod
elIn
put a
nd o
utpu
t qua
lity
mod
el20
04-2
006
2007
-200
920
10-2
012
2013
-201
520
04-2
006
2007
-200
920
10-2
012
2013
-201
520
04-2
006
2007
-200
920
10-2
012
2013
-201
51
Bel
gium
11
095
40
905
094
097
30
929
098
90
961
10
929
098
92
Bul
garia
087
91
096
41
070
70
879
086
40
986
070
70
879
086
40
986
3C
zech
Rep
1
11
095
11
11
098
11
11
4D
enm
ark
10
932
091
21
087
70
996
099
31
087
71
099
31
5G
erm
any
087
60
954
11
093
11
10
931
11
6Es
toni
a1
11
093
10
770
837
073
90
748
11
11
7Ir
elan
d1
11
11
11
11
11
18
Spai
n1
11
10
920
943
11
092
095
21
19
Fran
ce1
11
11
11
11
11
110
Cro
atia
10
803
080
60
873
10
808
080
60
821
10
808
080
60
821
11Ita
ly1
11
11
11
11
11
112
Latv
ia1
094
30
905
085
71
091
90
904
086
21
10
955
092
413
Lith
uani
a1
11
11
11
11
11
114
Hun
gary
089
81
11
081
10
847
087
91
081
60
909
087
91
15N
ethe
rland
s0
929
091
60
853
087
80
947
11
10
957
11
116
Aus
tria
071
90
805
084
10
843
097
71
10
90
977
11
09
17Po
land
11
10
995
11
10
975
11
11
18Po
rtuga
l0
591
062
80
679
072
50
742
071
30
740
733
074
20
713
074
073
719
Rom
ania
076
81
10
748
075
11
10
725
075
11
10
725
20Sl
oven
ia0
811
073
50
741
076
80
810
763
078
90
752
082
40
763
078
90
833
21Sl
ovak
ia1
11
11
11
11
11
122
Finl
and
11
099
50
997
093
50
990
967
092
41
11
123
Swed
en0
903
090
60
914
10
908
096
90
981
090
80
969
098
124
UK
11
11
11
11
11
11
Sour
ce A
utho
rs
oza
na n
ad
ov
eza jelić ma
rg
ar
eta ga
rd
ijan k
edžo
efficien
cy v
s effectiv
eness a
n an
aly
sis of tertia
ry edu
catio
n ac
ro
ss eur
ope
pub
lic secto
r ec
on
om
ics
42 (4) 381-414 (2018)
412 references1 Afonso A and St Aubyn M 2006 Cross-country efficiency of secondary
education provision A semi-parametric analysis with non-discretionary inputs Economic Modelling 23(3) pp 476-491 httpsdoiorg101016jeconmod200602003
2 Ahec Šonje A Deskar-Škrbić M and Šonje V 2018 Efficiency of public expenditure on education comparing Croatia with other NMS MPRA Paper No 85152 Available at lthttpsmpraubuni-muenchende851521MPRA_paper_85152pdfgt
3 Altinok N Diebolt C and Demeulemeester J-L 2014 A new international database on education quality 1965-2010 Applied Economics 46(11) pp 1212-1247 httpsdoiorg101080000368462013868592
4 Aristovnik A 2013a Technical Efficiency of Education Sector in the EU and OECD Countries The Case of Tertiary Education Conference Proceedings 16th Toulon-Verona Conference ldquoExcellence in Servicesrdquo Ljubljana 29-30 August 2013 pp 43-51
5 Aristovnik A 2013b Relative efficiency of education expenditures in East-ern Europe a non-parametric approach Journal of Knowledge Management Economics and Information Technology ScientificPapersorg 3(3) 1-4 Avail-able at lthttpwwwscientificpapersorgwp-contentfiles1379_ARISTOVNIK_Relative_Efficiency_of_Education_Expenditures_in_Eastern_Europepdfgt
6 Aristovnik A and Obadić A 2011 The funding and efficiency of higher education in Croatia and Slovenia a non-parametric comparison Amfiteatru Economic 13(30) pp 362-376 Available at lthttpwwwamfiteatrueco-nomicrotempArticle_1050pdfgt
7 Aristovnik A and Obadić A 2014 Measuring relative efficiency of second-ary education in selected EU and OECD countries the case of Slovenia and Croatia Technological and Economic Development of Economy 20(3) pp 419-433 httpsdoiorg103846202949132014880085
8 Aubyn M S [et al] 2008 Study on the efficiency and effectiveness of public spending on tertiary education European Economy Economic Papers No 390 httpsdoiorg10276530348
9 Banker R D Charnes A and Cooper W W 1984 Some Models for Esti-mating Technical and Scale Inefficiencies in Data Envelopment Analysis Management Science 30(9) pp 1078-1092 Available at lthttpwwwutdal-lasedu~ryoungphdseminarBCC1984pdfgt
10 Banker R D and Morey R C 1986 Efficiency Analysis for Exogenously Fixed Inputs and Outputs Operations Research 34(4) pp 513-521 httpsdoiorg101287opre344513
11 Barro R 2001 Human Capital and Growth The American Economic Review 91(2) pp 12-17 Available at lthttpswwwaeaweborgarticlesid=101257aer91212gt
12 Barro R 2013 Education and Economic Growth Annals of Economics and Finance 14(2) pp 301-328 Available at lthttpdownaefwebnetWorking-Papersw571pdfgt
oza
na n
ad
ov
eza jelić ma
rg
ar
eta ga
rd
ijan k
edžo
efficien
cy v
s effectiv
eness a
n an
aly
sis of tertia
ry edu
catio
n ac
ro
ss eur
ope
pub
lic secto
r ec
on
om
ics
42 (4) 381-414 (2018)41313 Bourguignon F Elkana Y and Pleskovic B 2007 Capacity Building in
Economics Education and Research Washington DC World Bank14 Charnes A Cooper W W and Rhodes E 1978 Measuring the efficiency of
decision making units European Journal of Operational Research 2(6) pp 429-444 httpsdoiorg1010160377-2217(78)90138-8
15 Clements B J 2002 How efficient is education spending in Europe Euro-pean review of economics and finance 1(1) pp 3-26
16 Cooper W W Seiford L M and Zhu J (eds) 2011 Handbook on Data Envelopment Analysis International Series in Operations Research amp Man-agement Science Cham Springer Science and Business Media
17 Cooper W W and Seiford L M Tone K 2006 Introduction to Data Envel-opment Analysis and Its Uses New York Springer
18 Emrouznejad A and Yang G 2018 A survey and analysis of the first 40 years of scholarly literature in DEA 1978-2016 Socio-Economic Planning Sciences Recent developments on the use of DEA in the public sector 61(March) pp 4-8 httpsdoiorg101016jseps201701008
19 Eurostat 2018a Main GDP aggregates per capita Gross domestic product at market prices Luxembourg Eurostat Available at lthttpappssoeurostateceuropaeunuishowdodataset=nama_10_pcamplang=engt
20 Eurostat 2018b Population by educational attainment level sex and age () ndash main indicators Luxembourg Eurostat Available at lthttpappssoeuro-stateceuropaeunuishowdodataset=edat_lfse_03amplang=enggt
21 Eurostat 2018c Financial aid to students by education level ndash as of total public expenditure Luxembourg Eurostat Available at lthttpseceuropaeueurostatwebproducts-datasetsproductcode=educ_uoe_fina01gt
22 Eurostat 2018d General government expenditure by function (COFOG) Luxembourg Eurostat Available at lthttpseceuropaeueurostatstatistics-explainedindexphpGovernment_expenditure_by_function_E28093_COFOGgt
23 Eurostat 2018e Ratio of pupils and students to teachers and academic staff by education level and programme orientation Luxembourg Eurostat Avail-able at lthttpsdataeuropaeueuodpdatadatasetSGGhyHTPqi7AMFH-FePHoxwgt
24 Eurostat 2018f Tertiary education graduates Luxembourg Eurostat Avail-able at lthttpseceuropaeueurostatstatistics-explainedindexphpTertiary_ education_statisticsgt
25 Eurostat 2018g Graduates by education level programme orientation com-pletion sex and age Luxembourg Eurostat Available at lthttpsdataeuropaeueuodpdatadatasetBhJ0FRyxpdrmRBlsQAkggt
26 Eurostat 2018h Unemployment rates by sex age and educational attainment level () Luxembourg Eurostat Available at lthttpappssoeurostateceuropaeunuishowdodataset=lfsq_urgaedamplang=engt
27 Eurostat 2018i Activity rates by sex age and educational attainment level () Luxembourg Eurostat Available at lthttpappssoeurostateceuropaeunuishowdodataset=lfsa_argaedamplang=engt
oza
na n
ad
ov
eza jelić ma
rg
ar
eta ga
rd
ijan k
edžo
efficien
cy v
s effectiv
eness a
n an
aly
sis of tertia
ry edu
catio
n ac
ro
ss eur
ope
pub
lic secto
r ec
on
om
ics
42 (4) 381-414 (2018)
414 28 Eurostat 2018j Underachieving 15-year-old students by sex and field ndash PISA survey Luxembourg Eurostat Available at lthttpseceuropaeueurostatwebproducts-datasetsproductcode=educ_outc_pisagt
29 Fortunato P and Panizza U 2015 Democracy education and the quality of government Journal of Economic Growth 20(4) pp 333-363 httpsdoiorg101007s10887-015-9120-5
30 Hanushek E A and Kimko D D 2000 Schooling Labor-Force Quality and the Growth of Nations American Economic Review 90(5) pp 1184-1208 httpsdoiorg101257aer9051184
31 Kenny J 2008 Efficiency and Effectiveness in Higher Education Who is Accountable for What Australian Universitiesrsquo Review 50(1) pp 11-19 Available at lthttpsfilesericedgovfulltextEJ802278pdfgt
32 Kuosmanen T 2009 Data Envelopment Analysis with Missing Data The Journal of the Operational Research Society 60(12) pp 1767-1774 httpsdoiorg101057jors2008132
33 Pritchett L 2001 Where Has All the Education Gone The World Bank Eco-nomic Review 15(3) pp 367-391 Available at lthttpdocumentsworld-bankorgcurateden859821468180273788pdf773740JRN020010l0the0Education0Gonepdfgt
34 Pritchett L 2013 The Rebirth of Education Schooling Ainrsquot Learning Center for Global Development Washington Center for Global Development
35 Scheerens J Luyten H and van Ravens J 2011 Measuring Educational Quality by Means of Indicators in J Scheerens H Luyten and J van Ravens eds Perspectives on Educational Quality Springer Netherlands Dordrecht pp 35-50 httpsdoiorg101007978-94-007-0926-3_2
36 Szirmai A 2015 Socio-Economic Development Cambridge Cambridge University Press
37 Times Higher Education 2017 World University Rankings Available at lthttpswwwtimeshighereducationcomgt
38 Toth R 2009 Using DEA to Evaluate Efficiency of Higher Education APSTRACT Applied Studies in Agribusiness and Commerce pp 79-82 Available at lthttpsageconsearchumnedubitstream53548217_Using 20DEA_Apstractpdfgt
39 World Bank 2018 Education Statistics-Gross enrolment ratio in tertiary educa-tion Washington The World Bank Available at lthttpsdataworldbankorggt
40 Woumlszligmann L 2006 Efficiency and Equity of European Education and Train-ing Policies CESifo Working Paper Series (No 1779) Available at lthttpswwwcesifo-groupdeDocDLcesifo1_wp1779pdfgt
41 Yotova L and Stefanova K 2017 Efficiency of Tertiary Education Expend-iture in CEE Countries Data Envelopment Analysis Economic Alternatives (3) pp 352-364 Available at lthttpswwwunwebguploadsAlternatives2_Alternativi_english_br_3_2017pdfgt
Dynamics and determinants of emigration the case of Croatia and the experience of new EU member states
IVANA DRAŽENOVIĆ mag oecMARINA KUNOVAC dott mag desDOMINIK PRIPUŽIĆ dipl oec
ArticleJEL J61 E65 C33httpsdoiorg103326pse4243
We would like to thank two anonymous referees and the editor for the constructive and very useful remarks We are particularly grateful to Evan Kraft Gordi Sušić Vedran Šošić Teo Matković Maja Bukovšak Nina Ranilović Davor Kunovac Marko Mrkalj Ervin Duraković Karlo Kotarac and Alan Bobetko for their valuable comments during the early stages of the research Our work also benefited a lot from the presentation and discussion during the 24th Dubrovnik Economic Conference in June 2018 The views expressed are those of the authors and do not necessarily represent those of the Croatian National Bank No financial support received
Received June 1 2018 Accepted November 4 2018
The article was submitted for the 2018 annual award of the Prof Dr Marijan Hanžeković Prize
Ivana DRAŽENOVIĆCenter for Economic Research and Graduate Education ndash Economics Institute Politickyacutech vězňů 7 111 21 Prague 1 Czech Republice-mail IvanaDrazenoviccerge-eiczORCiD 0000-0002-6738-1288
Marina KUNOVACCroatian National Bank Trg hrvatskih velikana 3 10000 Zagreb Croatiae-mail marinakunovachnbhr ORCiD 0000-0002-3200-5928
Dominik PRIPUŽIĆCroatian National Bank Trg hrvatskih velikana 3 10000 Zagreb Croatiae-mail dominikpripuzichnbhrORCiD 0000-0003-3377-9260
ivan
a dr
ažen
ov
ić ma
rin
a ku
no
vac d
om
inik pr
ipužić
dy
na
mic
s an
d deter
min
an
ts of em
igr
ation th
e ca
se of c
ro
atia an
d the ex
perien
ce
of n
ew eu m
emb
er states
pub
lic secto
r ec
on
om
ics
42 (4) 415-447 (2018)
416 abstractThis paper analyzes the emigration flows from Croatia and other new EU member states to the core EU countries after their EU accession In order to assess the magnitude and dynamics of the recent emigration wave properly we construct the series of indirect emigration flows resorting to the national statistical offices of the selected core EU destination countries We compare the Croatian experience with that of other NMS and show that the intensity of Croatiarsquos emigration flows after EU accession is proportional to that of the Romanian and Bulgarian cases Finally we empirically analyze the economic and non-economic drivers of emi-gration from NMS to the core EU in the 2000-2016 period Results show that both economic (measured by different GDP and labour market indicators) and non-economic factors (capturing the EU accession the level of corruption in the econ-omy and demographic characteristics of the origin country population) are rele-vant for emigration decisions
Keywords emigration EU accession new member states gravity model
1 IntroductIonIn mid-2013 Croatia joined the European Union (EU) and as a member state (MS) gained access to the EU single market By becoming a part of the single market the country benefits from ldquothe four freedomsrdquo ndash the free movement of goods services capital and labour which enable more efficient reallocation of domestic factors of production resulting in new business and trade opportunities and ultimately increasing MS growth prospects At the same time EU accession triggered imple-mentation of temporary transitional provisions restricting free labour mobility from Croatia to the labour markets of other MS1 Despite that one of the direct effects of EU accession and the related reallocation of domestic factors of produc-tion was also a significant emigration outflow from Croatia to other states in the EU
Such developments raised emigration-related issues to the forefront of public debate in Croatia Drawing on a mixture of anecdotal evidence ad hoc surveys and social network posts the media predominantly engaged in painting and prop-agating a bleak picture of the ldquoCroatian exodusrdquo At the same time no proper estimate of the magnitude and nature of this emigration wave has been made due to inaccurate migration statistics Official migration statistics collected by the Central Bureau of Statistics in Croatia are published with a disclaimer that the numbers of emigrants are based on the self-reporting of emigration by emigrants themselves a process clearly discouraged by a relatively burdensome procedure that results in a loss of domestic social security benefits
1 Transitional provisions do not apply on cross boarder movements of citizens for reasons other than work but only restrict free movement of citizens for work purposes According to the Accession Treaty for Croa-tia transitional provisions can apply for a maximum period of seven years (2+3+2 formula) More details are given in table A1 appendix 1
ivan
a dr
ažen
ov
ić ma
rin
a ku
no
vac d
om
inik pr
ipužić
dy
na
mic
s an
d deter
min
an
ts of em
igr
ation th
e ca
se of c
ro
atia an
d the ex
perien
ce
of n
ew eu m
emb
er states
pub
lic secto
r ec
on
om
ics
42 (4) 415-447 (2018)417Therefore in this paper we try to assess the characteristics of the recent Croatian
emigration wave to EU countries We present a comprehensive analysis of the dynamics and the main determinants of emigration from Croatia to core EU coun-tries following EU accession comparing the Croatian case with the experience of other new member states2
To our knowledge there are few analyses of the impact of the free mobility of labour on Croatian emigration flows Potential migration flows from Croatia after EU accession are ex-ante estimated in Strielkowski Šaacuterkovaacute and Żornaczuk (2013) Fertig and Kahanec (2013) and Vidovic and Mara (2015) Strielkowski Šaacuterkovaacute and Żornaczuk (2013) find that around 220 thousand residents from Croa-tia were expected to live in the EU15 by 2016 The Fertig and Kahanec (2013) estimates vary between negative net migration balance and 360 thousand residents from Croatia in the EU14 by 2020 while the Vidovic and Mara (2015) estimates are between 160 and 220 thousand residents from Croatia in the EU by 2019
Effective emigration outflows from Croatia following the EU accession are ana-lyzed in Vidovic and Mara (2015) and Župarić-Ilijić (2016) Vidovic and Mara (2015) integrate several data sources (CBS data Eurostat employment data data about the stock of Croatian citizens in EU member states and various surveys) They show that emigration patterns from Croatia in 2014 intensified significantly due to higher economic development and better quality of life in other MS as perceived by Croatian emigrants However their paper analyses emigration out-flows only up to 2014 due to data availability Another overall analysis of emigra-tion trends from Croatia is given in Župarić-Ilijć (2016) This author emphasized that Croatian net migration balance significantly worsened with the onset of the global financial crisis and in particular after the accession to the EU and argued that official Central Bureau of Statistics migration data are underestimated and should be compared with destination country data but provided no such estimate Thus in this paper we extend existing literature in time referring to the broader period integrating several data sources and analyzing the movements that were effectively observed after Croatia had joined the EU in 2013 The main contribu-tions of our paper are threefold3
First we construct indirect emigration flows from Croatia following the EU accession Currently the Central Bureau of Statistics (CBS) in Croatia collects the
2 Due to data availability core EU countries are represented by 11 countries Austria Belgium Denmark Finland Germany Ireland Italy Luxembourg Netherlands Sweden and United Kingdom New EU member states are represented by 10 countries Bulgaria Croatia Czech Republic Estonia Hungary Latvia Lithu-ania Poland Slovakia and Slovenia3 In addition several authors implement partial analyses of emigration flows from Croatia following the EU accession Šonje (2018) estimates family emigration by using primary school enrolment data and shows that in 2009-2016 period around 50 thousand young citizens with children left Croatia The Croatian Employ-ment Service uses the annual employersrsquo survey to examine the extent of migration among the employed and shows that in 2016 around 20 thousand employed persons emigrated from Croatia Finally Jurić (2017) did a detailed on line survey among Croatian emigrants in Germany and showed that although economic fac-tors are relevant for emigration decision there is a prevalence of non-economic factors among the motives of emigration for Croatian emigrants
ivan
a dr
ažen
ov
ić ma
rin
a ku
no
vac d
om
inik pr
ipužić
dy
na
mic
s an
d deter
min
an
ts of em
igr
ation th
e ca
se of c
ro
atia an
d the ex
perien
ce
of n
ew eu m
emb
er states
pub
lic secto
r ec
on
om
ics
42 (4) 415-447 (2018)
418 data about migration flows from the Ministry of the Interior which records only persons that have registered the change in their country of usual residence with the Ministry Following related literature contributions (Izquierdo Jimeno and Lac-uesta 2014 Bertoli Bruumlcker and Moraga 2013) we assume that there are no clear incentives and benefits of registering in home country offices when emigrating while on the other hand immigrants have an incentive to register when they arrive in the destination country given that access to some basic social services in a destination country (ie education and health) generally requires registration Therefore we assume that official emigration numbers from CBS could be under-estimated and resort to the European Union destination countries national statisti-cal offices to collect numbers of registered immigrants coming from Croatia The differences are striking Our indirect emigration estimates show that emigration from Croatia to the core EU countries following the accession is on average around 26 times higher than the officially registered numbers in Croatia with around 230 thousands people having left Croatia and settled in one of the analyzed core EU countries in the 2013-2016 period
Secondly we show that although emigration flows in Croatia following the acces-sion are sizeable they are not an isolated case Bulgaria and Romania also expe-rienced proportionally similar population outflows after they became member states in 2007 CEE countries that joined the EU in 2004 also saw an increase in emigration rates towards the core EU countries though to a lower extent Time series of indirect emigration flows from NMS show that higher emigration rates recorded after the EU accession persisted over the years In other words average emigration rate from NMS to the core EU countries in 2016 is on average equal to or higher than the emigration rates in the four years following accession to the EU which corroborates the strong persistency of higher emigration rates4 Such trends raise several serious sustainability concerns for Croatia which will become rele-vant in the medium term since the current population outflow to the core EU countries according to the indirect emigration flows constructed is around 2 of population each year
The third contribution of our paper consists of empirical analyses of the main economic and non-economic determinants of emigration flows from Croatia and other NMS to the core EU countries We believe that their evaluation provides insights that are highly important for policymakers in order to shape and imple-ment adequate and targeted policies to mitigate emigration flows In our analysis of relevant emigration determinants we employed a gravity model Results obtained under alternative specifications and estimation strategies of the gravity model show that the access to the single EU market (after transitional provisions were lifted) has been a main driver of emigration flows in Croatia since 2013 However current economic conditions and labour market indicators together with demographic factors and prevalence of the corruption in the country also
4 That is 12 or 8 years following EU accession
ivan
a dr
ažen
ov
ić ma
rin
a ku
no
vac d
om
inik pr
ipužić
dy
na
mic
s an
d deter
min
an
ts of em
igr
ation th
e ca
se of c
ro
atia an
d the ex
perien
ce
of n
ew eu m
emb
er states
pub
lic secto
r ec
on
om
ics
42 (4) 415-447 (2018)419turned out to be significant in the determination of emigration flows among NMS
and core EU countries implying that there is a room for policymakers to alleviate the intensity of emigration pressures in Croatia
The remainder of the paper is structured as follows in section 2 we describe in detail the major characteristics of recent Croatian emigration flows firstly by dis-cussing Croatiarsquos official emigration figures and secondly by comparing official data with data on indirect emigration from Croatia collected from national statisti-cal offices of the core EU destination countries In section 3 we present a com-parative overview of the emigration experiences of other new EU member states following their EU accession In section 4 we provide a basic overview of gravity models and their applicability in studying migration issues and describe the vari-ables used in the model In section 5 we present different specifications of the gravity models and discuss the results of the econometric analysis together with robustness checks In section 6 we emphasize the main conclusions
2 demograPhIc and geograPhIcal characterIstIcs of croatIan emIgrants
21 emIgratIon flows from croatIa accordIng to the central bureau of statIstIcs data
As a starting point we take a deeper look at the official Croatian migration statis-tics in order to improve our understanding of the migration dynamics in Croatia Notwithstanding existent methodological issues and while accepting the claim that official Croatian migrations are under-reported we nevertheless believe that they could be under-reported systematically which means that they still might contain some useful information about the underlying migration trends
Looking at the big picture we can see that prior to the global financial crisis Croatia had a positive net migration balance However migration flows reversed at the onset of the global financial crisis (net migration balance turned negative) Until the EU accession negative net migration remained relatively low and stable After Croatia became a full member of the EU in July 2013 migration flows clearly intensified (figure 1)
Figure 1 also shows that EU accession had no significant effect on the number of immigrants while emigration outflows intensified significantly with the acces-sion Thus in the remaining part of the paper we concentrate exclusively on gross emigration outflows and analyze emigrantsrsquo main characteristics
Available data provide a basis for a simple demographic analysis of Croatian emi-grants Numbers suggest that there is an almost equal share of male and female emigrants throughout the period with the share of male emigrants slightly increas-ing at times of high migration (figure 2)
ivan
a dr
ažen
ov
ić ma
rin
a ku
no
vac d
om
inik pr
ipužić
dy
na
mic
s an
d deter
min
an
ts of em
igr
ation th
e ca
se of c
ro
atia an
d the ex
perien
ce
of n
ew eu m
emb
er states
pub
lic secto
r ec
on
om
ics
42 (4) 415-447 (2018)
420 Figure 1 Net migration balance of Croatia between 2001 and 2016 Central Bureau of Statistics data net migration
-40
-30
-20
-10
0
10
20
30
2001 2002 2003 2004 2005 2006 2007 2008 2009 2010 2011 2012 2013 2014 2015 2016
In th
ousa
nds
Emigration Immigration Net migration
Note Net migration = number of immigrants ndash number of emigrants in thousandsSource CBS
Figure 2 Structure of emigrants from Croatia by sex between 2002 and 2016 Central Bureau of Statistics data gross emigration flows
0
5
10
15
20
25
30
35
40
2002 2003 2004 2005 2006 2007 2008 2009 2010 2011 2012 2013 2014 2015 2016
Num
ber o
f em
igra
nts
Males Females
Note In thousandsSource CBS
The age structure of emigrants suggests that there was a structural shift towards younger emigrants in the last emigration wave Firstly there is a striking increase in the number of youngest emigrants (age 0-15) and secondly it appears that the decrease in the average age of the emigrants is accelerating Our estimates show that the average age of emigrants in the period between 2001 and 2013 was 415
ivan
a dr
ažen
ov
ić ma
rin
a ku
no
vac d
om
inik pr
ipužić
dy
na
mic
s an
d deter
min
an
ts of em
igr
ation th
e ca
se of c
ro
atia an
d the ex
perien
ce
of n
ew eu m
emb
er states
pub
lic secto
r ec
on
om
ics
42 (4) 415-447 (2018)421years but dropped sharply over next three years and reached 336 years in 2016
(figure 3) These results are in line with Šonje (2018) The author estimates that in 2009-2016 period around 50 thousand young citizens with children left Croatia permanently5
Figure 3 (a) Relative share of different age groups of emigrants and average age of emi-grant between 2002 and 2016 (b) Number of emigrants by different age groups between 2002 and 2016 Central Bureau of Statistics data gross emigration flows
30
32
34
36
38
40
42
44
46
48
00
01
02
03
04
05
06
07
08
09
10
2002
2003
2004
2005
2006
2007
2008
2009
2010
2011
2012
2013
2014
2015
2016
Ave
rage
age
of m
igra
nt (i
n ye
ars)
sh
are
of se
lect
ed a
ge g
roup
in to
tal p
opul
atio
n
0-15 15-39 40-64 65+Average age of migrant (right)
0
4000
8000
12000
16000
20000
24000
0
1000
2000
3000
4000
5000
6000
2002
2003
2004
2005
2006
2007
2008
2009
2010
2011
2012
2013
2014
2015
2016
Num
ber o
f em
igra
nts
65+
25-49 (right)
0-15 15-24 50-64
Source CBS
Turning to the distribution of emigrants across Croatian regions again there is a very clear compositional change towards the end of the analyzed period with a growing proportion of emigrants from less-developed regions Following the rela-tively stable situation during the 2000s the deep and prolonged domestic reces-sion pushed up emigration more or less gradually in almost all regions After the EU accession there was a rapid and pronounced growth of emigration from all regions albeit at a different pace Emigration flows were much stronger in the regions with the highest unemployment As a result looking at the share of migrants in their population in 2016 Croatian regions can be broadly divided into two groups one with the ratio of migrants to domestic population close to or above 1 (Eastern Croatia Central Croatia Lika and Gorski Kotar) and other economically more advanced regions with the ratio of around 066 (figure 4) Therefore even though emigration is a country-wide problem the intensity of emigration flows (as a percentage of total population) is a much stronger phenom-enon in the economically less developed regions (figure 5)
5 Estimates are based exclusively on households with children (obtained by comparison of expected and effec-tive primary school enrolment) and are considered to represent irreversible emigration based on the assump-tion that child integration in system of destination countries strongly disincentives return-migration
ivan
a dr
ažen
ov
ić ma
rin
a ku
no
vac d
om
inik pr
ipužić
dy
na
mic
s an
d deter
min
an
ts of em
igr
ation th
e ca
se of c
ro
atia an
d the ex
perien
ce
of n
ew eu m
emb
er states
pub
lic secto
r ec
on
om
ics
42 (4) 415-447 (2018)
422 Figure 4 Structure of emigrants from Croatia by region between 2001 and 2016 Central Bureau of Statistics data gross emigration flows
00
02
04
06
08
10
12
14
16
Num
ber o
f em
igra
nts
in
of t
otal
pop
ulat
ion
Eastern Croatia Central Croatia Lika and Gorski kotar Central and Southern Adriatic
Northen Adriatic Northwestern Croatia City of Zagreb
2002
2001
2003
2004
2005
2006
2007
2008
2009
2010
2011
2012
2013
2014
2015
2016
Notes Eastern Croatia encompasses Virovitičko-podravska Požeško-slavonska Brodsko-posavska Osječko-baranjska and Vukovarsko-srijemska counties Central Croatia encompass-es Zagrebačka Sisačko-moslavačka Karlovačka and Bjelovarsko-bilogorska counties Lika and Gorski kotar encompass Primorsko-goranska and Ličko-senjska counties Central and Southern Adriatic encompass Zadarska Šibensko-kninska Splitsko-dalmatinska and Dubrovačko-neretvanska counties Northen Adriatic refers to Istarska County Northwestern Croatia encom-pass Krapinsko-zagorska Varaždinska Međimurska and Koprivničko-križevačka countiesSource CBS
Figure 5 Unemployment rate and share of emigrants by county in 2016 Central Bureau of Statistics data gross emigration flows
Sisačko-moslavačka
Virovitičko-podravska
Požeško-slavonskaBrodsko-posavska
Osječko-baranjska
Vukovarsko-srijemska
Istarska
5
10
15
20
25
30
35
40
04 06 08 10 12 14 16 18 20
Une
mpl
oym
ent r
ate
in
Emigration rate as of total population
Krapinsko-zagorska
Varaždinska Međimurska
Grad Zagreb
Splitsko-dalmatinska
Note The size of the circles correspond to the emigration rate as of total population of the countySource CBS
ivan
a dr
ažen
ov
ić ma
rin
a ku
no
vac d
om
inik pr
ipužić
dy
na
mic
s an
d deter
min
an
ts of em
igr
ation th
e ca
se of c
ro
atia an
d the ex
perien
ce
of n
ew eu m
emb
er states
pub
lic secto
r ec
on
om
ics
42 (4) 415-447 (2018)423Finally CBS data show that slightly more than 85 of emigrants from Croatia
after the EU accession was directed to three EU countries Germany Austria and Ireland Figure 6 compares main emigration destinations of Croatians in the EU before and after Croatian accession Although total emigration flows towards the EU increased significantly the composition of the main destinations remained almost unchanged from the period before accession The only exception is Ire-land since emigration to Ireland before the EU accession was almost non-existent in Croatia while in 2016 Ireland become third biggest destination for Croatian emigrants In addition EU accession caused a change in relative position between Germany and Austria two main emigration destinations with even more emi-grants going to Germany This is a direct consequence of Austriarsquos decision to extend the application of transitional provisions for Croatian citizens until June 2018 After 2018 we expect the share of Croatians heading towards Austria to increase unless Austria prolongs the application of the transitional provisions until 20206
Figure 6 (a) Main EU emigration destinations for Croatians in 2010 (b) Main EU emigra-tion destinations for Croatians in 2016 Central Bureau of Statistics data gross emigration flows
713
76
67
47
3224 24 18
457
24201
91
85
8822 14
Germany
Austria
Ireland
Other EU countries
Italy
Slovenia
Sweden
United Kingdom
Germany
Austria
Ireland
Other EU countries
Italy
Slovenia
Sweden
United Kingdom
Total emigration to EU in 2010 ndash 1697 persons Total emigration to EU in 2016 ndash 28659 persons
Note Germany and Italy lifted transitional provisions for Croatia in 2015 UK and Austria are applying transitional provisions until June 2018 with possible extension until 2020Source CBS
6 Prolongation of application of transitional provisions in the period from June 2018 until June 2020 is possi-ble only in the case of serious disturbances for the Austrian labour market that would otherwise occur
ivan
a dr
ažen
ov
ić ma
rin
a ku
no
vac d
om
inik pr
ipužić
dy
na
mic
s an
d deter
min
an
ts of em
igr
ation th
e ca
se of c
ro
atia an
d the ex
perien
ce
of n
ew eu m
emb
er states
pub
lic secto
r ec
on
om
ics
42 (4) 415-447 (2018)
424 22 emIgratIon from croatIa accordIng to natIonal statIstIcal offIces of core eu countrIes
The Croatian Central Bureau of Statistics detailed data about emigration presented so far are useful for an analysis of some main characteristics of Croatian emi-grants However as previously explained in the Introduction the official number of emigrants published by the Central Bureau of Statistics in Croatia is based on the people who voluntarily registered their departure with the authorities while standard migration theory predicts that migrants are much more likely to register in the country of destination than in the country of origin7 Therefore in addition we construct an indirect emigration flow taking as a starting point the immigration statistics from the national statistical offices of the following core EU countries Germany Denmark Austria Ireland Belgium Netherlands Italy Finland Swe-den Luxembourg and United Kingdom For UK and Ireland immigration statis-tics are not available so we use the individually appointed national insurance numbers (NINo) in the UK and personal public service numbers (PPS) in Ireland that are commonly used in the literature (Hazans and Philips 2011) We analyze the period from 2000 until 2016 and for each year in the sample we consult offi-cial immigration statistics of the selected core EU countries and take the number of immigrants coming from Croatia
Where available our preferred choice is statistics that register immigrants from Croatia according to the country of birth principle (as in Netherlands Italy UK and Belgium) or country of previous residence principle (as in Germany and Denmark)8 Immigration flows registered according to citizenship principle (as in Sweden Finland Luxembourg and Austria) could be inaccurate since they also include migrants from Bosnia and Herzegovina (and other countries) having Cro-atian (or dual) citizenship9 According to Jurić (2017) in a survey of Croatian emigrants to Germany around 20 of emigrants registered as Croatian citizens in Germany actually emigrated from Bosnia and Herzegovina This is the reason why we have avoided using migration numbers based on the citizenship principle if the country of birth principle or country of previous residence principle was also available among migration statistics Nevertheless given that for some countries migration statistics are available only based on the citizenship principle indirect emigration flows constructed with resort to the national statistical offices of core EU countries and presented in the remaining part of the paper should be inter-preted as an upper bound for emigration outflows from Croatia Detailed informa-tion about the construction of indirect emigration flows is given in appendix 1 Comparison between constructed indirect emigration flows from Croatia based on
7 Illustrative case in point is a Polish example Following the EU accession Poland experienced a strong emi-gration flows At some point policymakers realized that the official statistics grossly underestimate the extent of emigration As a result research project has been initiated in Poland in order to properly estimate the true numbers The upgraded and consolidated sources raised the official emigration numbers by a factor ten (Sta-tistics Poland 2011)8 Destination country can register immigrants according to the following principles country of birth princi-ple country of previous residence principle and citizenship principle Registration of immigrants according to the different principles is defined by Eurostat International Migration Statistics 9 For Ireland personal public service number the principle for registration of immigrants is not denoted
ivan
a dr
ažen
ov
ić ma
rin
a ku
no
vac d
om
inik pr
ipužić
dy
na
mic
s an
d deter
min
an
ts of em
igr
ation th
e ca
se of c
ro
atia an
d the ex
perien
ce
of n
ew eu m
emb
er states
pub
lic secto
r ec
on
om
ics
42 (4) 415-447 (2018)425data published by national statistical offices of the core EU countries and official
Central Bureau of Statistics data are represented in figure 7 1011
Figure 7 Indirect emigration flows from Croatia to the core EU countries according to national statistical offices of core EU countries compared to the official emigra-tion numbers to EU 27 countries according to Central Bureau of Statistics gross emigration flow
0
10
20
30
40
50
60
70
80
2000 2001 2002 2003 2004 2005 2006 2007 2008 2009 2010 2011 2012 2013 2014 2015 2016
Num
ber o
f em
igra
nts
Indirect emigration numbers ndash from national statistical offices of core EU countres
Official Croatian Bureau of Statistics emigration to EU 27
Note Official Central Bureau of Statistics emigration number for emigration in EU 27 Core EU countries are represented by 11 countries due to data availability Austria Belgium Denmark Finland Germany Ireland Italy Luxembourg Netherlands Sweden and United Kingdom in thousandsSource CBS national statistical offices of the core EU countries
The differences in emigration outflows between the two sources are striking According to the indirect estimates of emigration 230 thousand persons emigrated from Croatia to the core EU countries in the period from 2013-2016 On the other hand official data report 61 thousand emigrants in 2013-2016 period directed towards the selected core EU countries and 102 thousand emigrants in total during the same time period However the difference between the mirror statistics of Cro-atia and core EU destination countries is expected to decrease in the future This would reflect the fact that by the end-2016 the Croatian Tax Administration encour-aged Croatian migrants to change their residency status with authorities in order to
10 According to the Central Bureau of Statistics national statistical offices of the selected core EU countries represent broadly around 90 of total emigration to the European Union from Croatia over the entire sam-ple period which makes them a valid and representative indicator of total emigration flows towards the EU11 We have also estimated total emigration flows from Croatia by putting together (1) indirectly constructed emigration flows to the core EU countries and (2) Central Bureau of Statistics official emigration data for all other emigration destinations ie ldquothe rest of the worldrdquo The same approach is followed in order to construct an approximation of total immigration flows in Croatia Calculation details of total net emigration are given in appendix 2 According to our discretional combination of different data sources net emigration from Cro-atia is estimated to be around 155 thousands person in the 2013-2016 period
ivan
a dr
ažen
ov
ić ma
rin
a ku
no
vac d
om
inik pr
ipužić
dy
na
mic
s an
d deter
min
an
ts of em
igr
ation th
e ca
se of c
ro
atia an
d the ex
perien
ce
of n
ew eu m
emb
er states
pub
lic secto
r ec
on
om
ics
42 (4) 415-447 (2018)
426 avoid double taxation of their income12 The threat of double taxation of income probably incentivized migrants to be more prompt in registering their departure and changing their residence in their origin country offices13
Overall the discrepancies between the mirror statistics of origin and destination countries are common in migration statistics and most other countries are also faced with similar challenges Thus in our analysis we will adopt the same prin-ciple for other NMS Bulgaria Romania Poland Czech Republic Slovakia Slo-venia Hungary Latvia Lithuania and Estonia and construct indirect emigration flows for these countries referring to the immigration statistics of national statisti-cal offices of the core EU countries
3 mIgratIon flows In other new eu member states after the eu accessIon
In this section by looking into the emigration experience of other new EU mem-bers we tried to gain additional insight about some additional characteristics of emigration flows caused by EU accession such as the average structure of emi-grants (according to main demographic attributes) stability of the flows number of years after the accession needed to reach a plateau the likely duration of an emigration wave and possible reversal points
Detailed migration data from national statistical offices of the new EU member states allow us to analyze the main attributes of emigrants from NMS in order to look for some substantial differences or similarities in migration flows between countries According to figure 8 data about the age structure of emigrants does not follow any single path across countries However for all countries in the sample the average age of emigrant in 2016 is similar ranging broadly from the low to the mid-thirties At the same time the median age of the total population is rapidly increasing which in most countries widens the gap between the average popula-tion and average emigrant age This situation makes the emigration outflows of relatively younger citizens even more concerning in terms of the long-term sus-tainability of social services (such as public pensions and health)
Comparison of top emigration destinations for emigrants coming from NMS reveals that Germany is ranked among the top three emigration destinations for all countries in the sample The Croatian main emigration destinations Austria and the United Kingdom are also the second most frequent EU destinations for emi-grants from NMS in 2016 (table 1)14
12 At the beginning of 2017 Croatian government adopted the Ordinance for the implementation of the Gen-eral Tax Act (OG 3017) that clarified the process of determination of residency status for tax purposes and induced migrants to register their change of residency within authorities to avoid double income taxation 13 CBS is constantly working on improving migration data sources so part of the observed developments might reflect underlying methodological changes For example in 2011 the CBS changed its definition of migrants from people who registered their departurearrival to people who are absent from their usual place of residence in a one year period14 Nevertheless there are some peculiarities among main emigration destinations between NMS Finland was the main destination for emigrants from Estonia and Spain for emigrants from Romania in 2016 reflecting their cultural and historical linkages
ivan
a dr
ažen
ov
ić ma
rin
a ku
no
vac d
om
inik pr
ipužić
dy
na
mic
s an
d deter
min
an
ts of em
igr
ation th
e ca
se of c
ro
atia an
d the ex
perien
ce
of n
ew eu m
emb
er states
pub
lic secto
r ec
on
om
ics
42 (4) 415-447 (2018)427Figure 8
New MS emigrantsrsquo average age and median age of population 2000-2016 national statistical offices of NMS countries gross emigration flows
20
25
30
35
40
45
50
20
25
30
35
40
45
50
BGEE CZ RO LT LV SK PL HU SI HR
Average migrant age Median population age
Sources CBS national statistical offices and Eurostat authorsrsquo calculations
Table 1 Main EU emigration destinations for NMS in 2016 (in of total EU emigration) national statistical offices of NMS countries gross emigration flows
origin country top 3 emigration destinations in eu as of total eu emigrationBulgaria na na naCroatia Germany 71 Austria 8 Ireland 7Czech Republic Slovakia 60 Germany 9 Poland 6Estonia Finland 63 United Kingdom 8 Germany 7Hungary Germany 32 Austria 27 United Kingdom 17Latvia na na naLithuania United Kingdom 60 Ireland 11 Germany 10Poland Germany 43 United Kingdom 28 Netherlands 8Romaniaa Spain 24 Germany 17 Italy 16Slovakia Czech Republic 38 Austria 27 Germany 10Slovenia Germany 27 Austria 27 Croatia 12
a Percentage of total emigrationSources CBS national statistical offices and Eurostat
Given that similar core EU countries dominate as the main emigration destinations to Europe for NMS this corroborates our decision to construct indirect emigration flows for NMS by resorting to the national statistical offices of core EU countries as we did for Croatia Thus in the remaining part of this section we use data about indirect emigration flows from NMS to the core EU countries and employ them to compare the dynamics and intensity of migration outflows among the NMS
Comparison of the indirect emigration flows from other NMS to core EU coun-tries shows that the intensity of emigration flows from Croatia following the accession is not unique in its size given the experience of other economically less
ivan
a dr
ažen
ov
ić ma
rin
a ku
no
vac d
om
inik pr
ipužić
dy
na
mic
s an
d deter
min
an
ts of em
igr
ation th
e ca
se of c
ro
atia an
d the ex
perien
ce
of n
ew eu m
emb
er states
pub
lic secto
r ec
on
om
ics
42 (4) 415-447 (2018)
428 developed member states (Bulgaria and Romania) but also that emigration flows from NMS following the EU accession in 2004 were significantly lower (figure 9) Another important pattern arises from the analysis of NMS emigration flows since it is visible that a rise in the average migration rate towards the core EU countries following EU accession is not a temporary one-off reaction to accession to the common EU market According to figure 10 the average emigration rate in 2016 is equal to or higher than the average emigration rate in four years following the EU accession pointing to the persistence of intensive emigration flows15
Figure 9 Indirect emigration flows from NMS to the core EU countries national statistical offices of core EU countries gross emigration flows
0002040608101214161820
2000
2001
2002
2003
2004
2005
2006
2007
2008
2009
2010
2011
2012
2013
2014
2015
2016
In
of t
otal
pop
ulat
ion
Czech R Hungary PolandSlovakia Slovenia Baltics
0002040608101214161820
2000
2001
2002
2003
2004
2005
2006
2007
2008
2009
2010
2011
2012
2013
2014
2015
2016
In
of t
otal
pop
ulat
ion
Bulgaria Croatia Romania
Note Dashed lines denote the years of EU accessionSource National statistical offices of the core EU countries
Figure 10 Indirect emigration flows of NMS in time national statistical offices of core EU countries gross emigration flows
00
02
04
06
08
10
12
14
16
18
20
SI CZ HU LV EE SK LT BG PL RO
In
of t
otal
pop
ulat
ion
Avg migration rate in 4 years following EU accession Avg migration rate in 2016
Source National statistical offices of the core EU countries
15 However all member states but Croatia gained access to the common EU market prior to the onset of the global crisis Only Croatia joined the EU after six consecutive years of economic distress This might have created an additional pressure on migration outflows from Croatia However proper evaluation of this phe-nomenon will be possible only with some time delay
ivan
a dr
ažen
ov
ić ma
rin
a ku
no
vac d
om
inik pr
ipužić
dy
na
mic
s an
d deter
min
an
ts of em
igr
ation th
e ca
se of c
ro
atia an
d the ex
perien
ce
of n
ew eu m
emb
er states
pub
lic secto
r ec
on
om
ics
42 (4) 415-447 (2018)429A careful consideration must also be given to the influence of the economic cycle
on emigration Persistence of increased emigration flows from NMS to core EU countries in the decade following EU accession could reflect the impact of the economic crisis that started in 2009 on emigration decisions Figure 11 in both panel (a) and (b) shows that economic conditions are indeed related to intensity of emigration
Figure 11Average emigration flow as in total population from 2011 to 2016 compared to average unemployment rate (a) and average GDP PC in PPS (b) national statis-tical offices of core EU countries gross emigration flows
BG
HR
CZ
EEHU
LV
LT
PL
RO
SK
SI
10000
12000
14000
16000
18000
20000
22000
24000
00 05 10 15
GD
P PC
in P
PS (2
008-
2016
)
Emigration flow as in total population
BG
HR
CZ EE
HU
LVLT
PL ROSKSI
50
55
60
65
70
75
00 02 04 06 08 10 12 14 16 18
Emigration flow as in total population (2013-2016)
Empl
oym
ent r
ate
in
(201
3-20
16)
y = -68574x + 69749Rsup2 = 04745
y = -63306x + 23269Rsup2 = 07714
Source Eurostat and national statistical offices of the core EU countries
The NMS had rather different crisis and post-crisis experiences Poland experi-enced no recession but faced sizable emigration flows some countries recovered rather quickly after the initial shock (the Baltics Slovakia) while others experi-enced a double-dip recession (Slovenia) or a very deep and prolonged recession (Croatia) In addition the economic slack was global in nature ie the worsening of economic conditions was not restricted only to NMS but was also present in most of the core EU countries thus altering to some extent the relative benefits between origin and destination countries As a result a simple comparison of var-ious economic performance indicators and the intensity of emigration flows can provide only a partial and limited insight into the relative importance of different economic and non-economic determinants of migration flows In the next section we thus resort to formal econometric analysis using a gravity model to examine the main determinants of emigration in Croatia and other new EU member states to the core EU countries in the 2000-2016 period
4 graVIty model of mIgratIonThe application of Newtonian physics in economics started with Tinbergen (1962) who used a gravity model to explain international trade flows Flowerdew and Salt (1979) introduced the gravity model in the context of migration analysis and it soon become widely used to analyze different migration determinants However some authors claim that the first application of a gravity model to explain migration patterns goes back to Ravenstein who used it to analyze migra-tion patterns in 19th century Britain (Anderson 2011)
ivan
a dr
ažen
ov
ić ma
rin
a ku
no
vac d
om
inik pr
ipužić
dy
na
mic
s an
d deter
min
an
ts of em
igr
ation th
e ca
se of c
ro
atia an
d the ex
perien
ce
of n
ew eu m
emb
er states
pub
lic secto
r ec
on
om
ics
42 (4) 415-447 (2018)
430 Notwithstanding their long history gravity models have experienced a revival since the early 2000s due to much improved bilateral migration data (Ramos 2016) and the emergence of statistical theories appropriate for studying spatial interaction The reasons for the popularity of gravity models in migration analysis are trifold intuitive consistency with migration theories ease of estimation in its simplest form goodness of fit in most applications (Poot et al 2016) Gravity models assume migration flows (M) between the origin country i and destination country j in time t are proportional to the product of their populations (P) (which are in migration contexts used as proxies for the concept of mass from standard gravity model) and inversely proportional to the distance (D) between them
(1)
Gravity models in their original form are purely non-theoretical so they are usu-ally enriched with different variables capturing traditional pull and push factors of migration following human capital theory approach to migration developed by Sjaastad (1962) and Harris and Todaro (1970) The authors consider migration decision as a complex form of investment in human capital that is influenced by future expected income levels and the relative probability of employment oppor-tunities in destination and origin countries16 More formal arguments for the use of an extended vector of explanatory variables in migration analysis can be derived from the Random utility model introduced in migration literature by Borjas (1987) and Grogger and Hanson (2011) that provided micro foundations in the context of migration analysis Reflecting these considerations the gravity model used in this paper is augmented by an additional set of explanatory variables covering differ-ent economic demographic and educational factors as well as the level of corrup-tion in the country
The dependent variable is the gross flow of emigrants from NMS to the core EU country in each year for 2000-2016 period In order to trace emigration flows accurately we rely on immigration statistics of the selected receiving countries as available from national statistical offices of the core EU countries as explained in section 2
Explanatory variables used in the analysis are related to traditional pull and push factors of migration presented in literature The basic specification of our model contains GDP per capita in purchasing power parity of origin and destination country relative size of populations between countries based on Eurostat data and geographical distance between capitals of destination and origin countries down-loaded from CEPIIrsquos geo-distance database Moreover our basic specification also contains the variable capturing the effect of EU accession The variable is based on transitional provisions on the free movement of workers from new EU
16 Income levels are usually approximated by GDP per capita in PPP terms given that wage data are not com-parable across countries
ivan
a dr
ažen
ov
ić ma
rin
a ku
no
vac d
om
inik pr
ipužić
dy
na
mic
s an
d deter
min
an
ts of em
igr
ation th
e ca
se of c
ro
atia an
d the ex
perien
ce
of n
ew eu m
emb
er states
pub
lic secto
r ec
on
om
ics
42 (4) 415-447 (2018)431member states following the EU enlargement in 2004 2007 and 2013 as reported
by the European Commission Following the EU enlargement several core EU states decided to apply transitional provisions on the free movement of workers from NMS and effectively postpone the full liberalization of their labour markets Thus for each pair of origin and destination countries in the sample the dummy variable associated to transitional provisions takes the value 1 in the year that the core EU country lifted its restrictions on the free movement of workers coming from the respective NMS
In the extended version of our model we include additional variables accounting for some additional characteristics of origin and destination countries Following Lamberty (2015) we use data from the World Governance Index (WGI) database and include a corruption index for origin and destination country as explanatory variables in our analysis to evaluate if differences in corruption between coun-tries are a relevant factor in explaining observed emigration patterns From among the different WGI indexes evaluating the quality of governance and institutions from different aspects we have opted for the inclusion of the corruption index in our main specification following Poprawe (2015) who shows that corruption increases emigration since it retards the economic development of the country and creates an insecure living and economic environment1718 We also evaluate the impact of origin country population attributes on migration outflows Following Sprenger (2013) we include the share of persons educated to tertiary level in total population of origin country to test whether higher emigration flows are associ-ated with higher skill levels The impact of demographic characteristics of origin population on emigration flows is measured through the share of young people (persons aged 20-34) in total population of origin country as an approximation of the potential emigration pool
Finally we include alternative variables for economic performance of the country We find this relevant since Bertoli Bruumlcker and Moraga (2013) and Beine et al (2017) argue that relative difference in GDP per capita in purchasing power stand-ard represents a difference in level of economic development between two coun-tries which is relevant for emigration decisions but that current and future eco-nomic prospects not captured by relative GDP per capita in PPS are also impor-tant Bertoli Bruumlcker and Moraga (2013) and Beine et al (2017) argue that dif-ferences in GDP per capita in PPS are already captured by the inclusion of origin and destination fixed effects Additionally economic distress arising during the crisis period causes changes in future economic prospects that not reflected in a timely way in the level of GDP per capita in PPS Therefore in the extended specification of our model we substitute for GDP per capita in PPS with short-
17 Vukovic (2017) shows that the Croatian economy is permeated by corruption since the political system is characterized by systematic corruption on national and local levels Also WGI corruption index data point to a substantial gap in corruption incidence between most NMS and core EU countries in general18 As a main alternative to the corruption index we could have used the governance index from the same data-base Estimation results obtained with the governance index as independent variable are shown in appendix 3
ivan
a dr
ažen
ov
ić ma
rin
a ku
no
vac d
om
inik pr
ipužić
dy
na
mic
s an
d deter
min
an
ts of em
igr
ation th
e ca
se of c
ro
atia an
d the ex
perien
ce
of n
ew eu m
emb
er states
pub
lic secto
r ec
on
om
ics
42 (4) 415-447 (2018)
432 term indicators of economic activity ndash employment rate and output gap of origin and destination country19 These variables capture how changing growth prospects and labour market opportunities affect emigration across countries
Detailed descriptions of all variables and respective data sources are provided in appendix 1
In order to evaluate the main determinants of migration flows from NMS into the core EU countries we apply the Poisson pseudo maximum likelihood estimator Numerous literature contributions examine the main drivers of migration by using a fixed effects model as a baseline methodology20 However a fixed effect model does not allow for the estimation of variables that are constant in time (such as the distance between two countries) Moreover Santos-Silva and Tenreyro (2006) in their paper show that parameters in log-linearized models estimated by OLS in the presence of heteroscedasticity could lead to biased estimates The authors alterna-tively propose application of the Poisson pseudo maximum likelihood (PPML) estimator and argue that the PPML estimator is more suitable given its consist-ency in presence of heteroscedasticity Moreover the PPML estimator will allow us to properly account for zero migration flows between two countries since the dependent variable in PPML is not in logarithmic form but is assumed to take positive integer values Given this advantages of the PPML estimator over the standard panel fixed effects estimator we transform our basic gravity model from equation (1) and extend it by additional explanatory variables
(2)
where mijt represents migration from origin country i into destination country j in a year t xit is a vector of explanatory variables characteristic for origin country economic political geographical and demographic factors yjt is vector of explan-atory variables representing destination country characteristics in time and δi and ϑj are respectively origin and destination country specific effects
5 results ndash maIn determInants of emIgratIon The main results of the estimation of equation (2) using the PPML estimator are presented in table 2 As a robustness check estimates obtained by the application of the fixed effect model are also presented in table 2 but are not discussed explic-itly According to the results of the baseline model (Model 1) population and dis-tance parameters are in line with gravity model predictions An increase in distance between destination and origin country by 1 will decrease emigration flows by 15 all other factors being equal confirming the theoretical predictions of the
19 We opt for the exclusion of GDP per capita in PPS from the extended model specification since inclusion of GDP PC in PPS and short term economic indicators could result in multicollinearity Instead differences in level of economic development are captured by origin and destination fixed effects20 A detailed overview of different estimation strategies and models used in assessment of impact of EU acces-sion for CEE countries in 2004 is given in Bruumlcker et al (2009)
ivan
a dr
ažen
ov
ić ma
rin
a ku
no
vac d
om
inik pr
ipužić
dy
na
mic
s an
d deter
min
an
ts of em
igr
ation th
e ca
se of c
ro
atia an
d the ex
perien
ce
of n
ew eu m
emb
er states
pub
lic secto
r ec
on
om
ics
42 (4) 415-447 (2018)433standard gravity model implying that migration flows between two countries are
inversely proportional to the distance between them This interesting result sug-gests that importance of transportation and information costs that are approximated with physical distance between countries still remains relevant in migration deci-sions irrespective of the decrease in transportation costs and the development of the internet since the rather different world around the time of the pioneer application of gravity models in migration analysis in the late 1970s The positive coefficient associated with the relative difference between population of destination and origin country suggests that countries with bigger populations have more intensive migra-tion flows However this result is not statistically significant Secondly our base-line model shows GDP per capita in PPS in destination country increases migration flows directed toward the country confirming the theories arguing that a positive difference in the level of economic conditions will increase emigration flows from origin to destination country Estimated parameters show that an increase in GDP per capita in PPS in a destination country of 1 will lead to an increase in emigra-tion flows from origin to destination country by 22 assuming all other factors remain unchanged On other hand the coefficients associated to GDP PC in PPS in origin country are not statistically significant
Finally the variable transitional provisions measuring the impact of the accession to the principle of free movement of persons across borders going from new EU member states (origin countries) to the core EU (destination countries) is statisti-cally significant and large in its value increasing migration flow by 4021
The results of the extended model specification (Model 2) show that short-term economic indicators represented by different labour market indicators and cycli-cal position of the economy of origin and destination countries are statistically significant and thus affect emigration decisions An increase in employment opportunities in a destination country by 1 will increase emigration flows from origin to destination countries by 82 all other factors being equal At the same time an increase in employment opportunities in origin country by 1 will decrease emigration flows by 5 Results indicate that cyclical position of the economy is also important for migration decisions An improvement in cyclical position of a destination country by 1 percentage point (ie positive output gap) will increase emigration flows from origin to destination countries by 2 if all other factors remain constant
21 Changes in the predicted emigration flow for dummy variable representing transitional provisions are calu-lated according to the formula -1
ivan
a dr
ažen
ov
ić ma
rin
a ku
no
vac d
om
inik pr
ipužić
dy
na
mic
s an
d deter
min
an
ts of em
igr
ation th
e ca
se of c
ro
atia an
d the ex
perien
ce
of n
ew eu m
emb
er states
pub
lic secto
r ec
on
om
ics
42 (4) 415-447 (2018)
434 Table 2 Determinants of emigration flows from new EU member states to the core EU countries between 2000 and 2016 Fixed effects estimator (FE) and Poisson pseudo maximum likelihood estimator (PPML)
model 1 (baseline) fe
model 1 (baseline) PPml
model 2 fe
model 2 PPml
Distance ndashndash
-148(000)
ndashndash
-154(000)
Population 059(017)
141(035)
099(002)
585(000)
GDP PC in PPS (origin)
011(059)
027(046)
GDP PC in PPS (destination)
155(000)
215(001)
Transitional provisions
054(000)
034(000)
046(000)
046(000)
Employment rate (origin)
-145(000)
-504(000)
Employment rate (destination)
12(006)
815(000)
Output gap (origin)
-227(000)
307(02)
Output gap (destination)
374(000)
203(004)
Corruption index (origin)
003(089)
-166(000)
Corruption index (destination)
378(000)
246(009)
Share of youth (20-34) origin
15(000)
019(08)
Share of tertiary educated (origin)
025(014)
058(007)
Cons -1191 023 -1365 551Number of observations 1958 1972 1958 1972
R2 046 078 053 082Note and refer to 10 5 and 1 statistical significance levels respectively P-values are in parenthesis All specifications include origin and destination fixed effects dum-mies Parameters associated to output gap for origin and destination country are multiplied by 100 since the output gap enters the model specification in levels instead of being transformed into logarithms due to negative valuesSource Authorsrsquo elaboration based on national statistical offices of the core EU countries immi-gration data and on the data presented appendix 1
Moreover we find an importance in the level of education of the workforce in the origin country since the coefficient associated to the variable denoting the share of those with tertiary education in the total population of origin country assumes a positive significant value The estimates imply that an increase in the share of the tertiary educated in an origin population will increase migration flows from
ivan
a dr
ažen
ov
ić ma
rin
a ku
no
vac d
om
inik pr
ipužić
dy
na
mic
s an
d deter
min
an
ts of em
igr
ation th
e ca
se of c
ro
atia an
d the ex
perien
ce
of n
ew eu m
emb
er states
pub
lic secto
r ec
on
om
ics
42 (4) 415-447 (2018)435the origin country by 06 The share of young population in an origin country is
also found to be positively correlated with the intensity of migration from the origin country but the results are not statistically significant Finally the differ-ence in corruption between destination and origin countries is also significant for emigration decisions An increase in the corruption index in the origin country by 1 (an increase in WGI corruption index represents a decrease of level of corrup-tion in the economy given the construction of corruption index) will lead to lower emigration from origin country by 17 At the same time an increase in the cor-ruption index of destination country by 1 (implying a lower corruption level in destination country) will increase emigration flows from origin to destination country on average by 25 all other factors being equal
As a final step in our analysis we compare results of the extended model specifi-cation with the baseline model specification and confirm the relevance of gravity model predictions for migration flows The importance of EU accession meas-ured through the transitional provisions dummy variable again proved statistically significant and large in its value suggesting that EU accession could raise emigra-tion flows by 60 if all other factors remain unchanged Overall baseline and extended model specification results show that the possibility of free movement of people across borders gained with EU accession is the main trigger of intensifica-tion of emigration flows from NMS to the core EU countries However the new higher level of emigration flows from NMS towards the core EU countries follow-ing EU accession differs among countries ranging from 02 of the population as in the Czech Republic to almost 2 of population in Romania According to the estimates of the gravity model apart from the EU accession significant determi-nants in explaining the magnitude of migration outflows are represented by the characteristics of origin country population itself economic development and per-formance of short term economic indicators and level of institutional quality assessed through the corruption incidence of both origin (NMS) and destination countries (the core EU)
51 robustness checKsIn addition to static estimation models as a robustness check we also estimate a dynamic model We apply the Arellano and Bond (1991) and Blundell and Bond (1998) generalized method of moments estimator which is suitable for datasets characterized by short-time periods and large cross sectional dimension with endogenous independent variable and in presence of fixed effects and heterosce-dasticity and autocorrelation within observations Inclusion of a lagged dependent variable is also relevant for assessment of network effect on emigration decisions since lagged migration flow can be interpreted as network approximation Con-trolling for network effect is important since networks offer support and an addi-tional information set for migrants reducing migration costs and associated risks (Beine Docquier and Ozden 2009) In line with previous model specifications the dynamic model also contains origin dummies and destination dummies to take into account all unobservable time invariant origin and destination specific varia-
ivan
a dr
ažen
ov
ić ma
rin
a ku
no
vac d
om
inik pr
ipužić
dy
na
mic
s an
d deter
min
an
ts of em
igr
ation th
e ca
se of c
ro
atia an
d the ex
perien
ce
of n
ew eu m
emb
er states
pub
lic secto
r ec
on
om
ics
42 (4) 415-447 (2018)
436 bles that were not captured by the set of variables included in the model but are relevant for migration decisions and the intensity of migration flows The results of the dynamic model corroborate the main findings from the previous section The estimates confirm the importance of gravity model variables in the determina-tion of emigration flows Moreover EU accession assessed through the transi-tional provisions variable again resulted as sizable and significant increasing average emigration flows by 30 Finally we confirm the importance of short-term economic conditions ndash employment opportunities in origin country and changes in cyclical economic position in destination country as determinants of migration flows Contrary to the static model specification the impacts of the educational level of population in the origin country and the degree of corruption in the economy have the expected signs but are not statistically significant The results of dynamic model specification are presented in appendix 3
6 conclusIonThis paper aimed to clarify some basic facts about the dynamics and main deter-minants of emigration from Croatia following EU accession To that purpose extensive data analysis was conducted capturing and comparing different emigra-tion data sources Further the application of panel gravity model to Croatian and other NMS indirect emigration data enabled us to detect and discuss the main determinants of emigration from Croatia and other NMS to the core EU countries and their importance in making decisions about emigration
As a first contribution to the discussion of the issue of the current emigration wave in Croatia we use mirror statistics from core EU national statistical offices and compare them to the official emigration numbers of CBS Construction of an alter-native emigration dataset using immigration data from the national statistical offices of the core EU countries showed that emigration flows from Croatia following EU accession are on average 26 times as high as those recorded in official statistical data amounting to 230 thousand people leaving Croatia in the 2013-2016 period If we relate our results to a priori projections of emigration from Croatia after EU accession our estimates can be placed in between Vidovic and Mara (2015) and Strielkowski Šaacuterkovaacute and Żornaczuk (2013)22 Similar proportional population out-flows were observed in less developed new member states following their EU acces-sion (Romania and Bulgaria) while new member states from the initial wave of enlargement experienced less pronounced rises in their emigration flows
Analysis of detailed migration data available at national statistical offices of the new EU member states statistical offices showed that average characteristics of emigrants from NMS are similar across countries and point to a balanced emigra-tion with respect to the sex of the emigrants The main destination country for most countries in the sample was Germany Finally data also show that the aver-age emigrant from NMS in 2016 was between 31 and 37 years old indicating that emigration affects the young part of the population Emigration of mostly young
22 Direct comparison is not possible since the aforementioned authors estimate net migration potential while our analysis is based on gross emigration flows
ivan
a dr
ažen
ov
ić ma
rin
a ku
no
vac d
om
inik pr
ipužić
dy
na
mic
s an
d deter
min
an
ts of em
igr
ation th
e ca
se of c
ro
atia an
d the ex
perien
ce
of n
ew eu m
emb
er states
pub
lic secto
r ec
on
om
ics
42 (4) 415-447 (2018)437citizens is indisputably a human capital loss for origin countries However long-
term overall effects of emigration flows on origin countries should be interpreted with caution Emigration leads to improvement of knowledge and skills of emi-grants given that their skills increase due to exposure to international competi-tion instead of gradually deteriorating in the low capacity domestic labour mar-ket In the case of reverse migration this can result in a brain-gain for origin economies Moreover the effect of migration on the labour markets of origin countries is also twofold According to the extensive migration literature (Thaut 2009) the employment opportunities and wages of those who stay in origin coun-tries increase and the unemployment rate decreases causing the activation of long-term unemployed people On other hand labour market shortages in some sectors inevitably arise and sustainability of public pensions and other social ser-vice are threatened The overall effects will depend on synchronization of educa-tional policies with origin country labour market requirements overall degree of economic development and future economic performance in origin country
In fact the analysis of main determinants of migration showed the most significant factor in explaining emigration flows between NMS and the core EU countries is the accession to the principle of free movement of workers obtained by EU acces-sion which increased emigration flows in the range from 30 to 60 This is in line with other relevant studies about labour mobility within the EU where EU membership is found to increase labour mobility significantly23 However estima-tion of the gravity model revealed that there exist other significant determinants in explaining migration outflows such as the characteristics of origin country popu-lations itself economic development performance of short-term economic indica-tors and level of institutional quality assessed through the corruption incidence of both origin (NMS) and destination countries (the core EU) These findings imply that policies that promote broad and solid economic development can influence emigration flows which raises several implications for policymakers
Emigration phenomena will probably have a strong impact on the Croatian econ-omy in the medium-run Accordingly we would like to emphasise the importance of further research in this field Potential research topics encompass the assess-ment of the impact of the last emigration wave on the potential growth prospects of the Croatian economy the effect of increasing remittances on the Croatian economy sustainability of the current setup of social policies (pension funds health system new infrastructure investment existing infrastructure mainte-nance) required immigration flows in order to alleviate negative emigration con-sequences and finally the implications of emigration flows for the conduct of monetary fiscal and structural policy in the broadest sense
disclosure statementNo conflict of interest
23 For more details about relationship between EU membership and labour mobility see Arpaia et al (2016)
ivan
a dr
ažen
ov
ić ma
rin
a ku
no
vac d
om
inik pr
ipužić
dy
na
mic
s an
d deter
min
an
ts of em
igr
ation th
e ca
se of c
ro
atia an
d the ex
perien
ce
of n
ew eu m
emb
er states
pub
lic secto
r ec
on
om
ics
42 (4) 415-447 (2018)
438 aPPendIX 1
Table a1 Data sources and details independent variables
data sources and details for set of independent variables
Variable description source estimation details
GDP PC in PPS
Gross domestic product at market prices current prices PPS per capita
Eurostat online statistical database
Destination and origin country in log
Unemployment rate
Yearly unemployment rates from 15 to 64 years percentage
Eurostat online statistical database
Destination and origin country in log
Population Population on 1 January total
Eurostat online statistical database
Relative values between destination and origin country in log
Distance
ldquoDistance between two countries is calculated based on latitudes and longitudes of the most important citiesagglomerations (in terms of population) Mayer and Zignago (2011)rdquo
CEPII database In log
Youth population number
Population on 1 January from 20 to 34 years
Eurostat online statistical database
Origin country as a share in total population in log
Tertiary educated
Population by educational attainment level from 15 to 64 years tertiary education (levels 5-8)
Eurostat online statistical database
Origin country as a share in total population 1000 in log
Corruption index
Control of corruption captures perceptions of the extent to which public power is exercised for private gain including both petty and grand forms of corruption as well as ldquocapturerdquo of the state by elites and private interests (httpinfoworldbankorggovernanceWGIdoc)
Worldwide Governance Indicators (WGI) The World Bank
Destination and origin country in log
ivan
a dr
ažen
ov
ić ma
rin
a ku
no
vac d
om
inik pr
ipužić
dy
na
mic
s an
d deter
min
an
ts of em
igr
ation th
e ca
se of c
ro
atia an
d the ex
perien
ce
of n
ew eu m
emb
er states
pub
lic secto
r ec
on
om
ics
42 (4) 415-447 (2018)439data sources and details for set of independent variables
Variable description source estimation details
Governance index
ldquoGovernment effectiveness captures perceptions of the quality of public services the quality of the civil service and the degree of its independence from political pressures the quality of policy formulation and implementation and the credibility of the governments commitment to such policies (httpinfoworldbankorggovernanceWGIdoc)rdquo
Worldwide Governance Indicators (WGI) The World Bank
Destination and origin country in log
Output gap Output gaps ( of potential output) HP filter
European Commission CIRCAB II autum fore-cast
Destination and origin country
Employment rates
Yearly employment rates from 15 to 64 years percentage
Eurostat online statistical database
Destination and origin country in log
Transitional provisions
Variable representing the access to common free EU market for BG and RO takes value 1 for FI SE from 2007 for DK from 2009 for IT and IE from 2012 and for all other countries from 2014 Variable representing the access to common free EU market for HR takes value 1 for DK FI IR SE from 2013 for BE IT DE LU from 2015 while NL AT and UK apply transitional provisions for HR during the entire sample period (sample is ending in 2016 while transitional provisions applied by NL AT and UK should be lifted by June 2018) Variable representing the access to common free EU market for CZ SK SI PL HU LV LT EE takes value 1 for UK SE IE from 2004 for IT FI from 2006 for NL LU from 2007 for BE DK from 2009 and for AT DE from 2011
European Commission
Set of dummy variables
ivan
a dr
ažen
ov
ić ma
rin
a ku
no
vac d
om
inik pr
ipužić
dy
na
mic
s an
d deter
min
an
ts of em
igr
ation th
e ca
se of c
ro
atia an
d the ex
perien
ce
of n
ew eu m
emb
er states
pub
lic secto
r ec
on
om
ics
42 (4) 415-447 (2018)
440 Table a2 Data sources and details dependent variable
data sources and details for set of independent variablesVariable description source estimation details
Emigration flows
Data for IR NL FI SE IT AT LU DK avaliable on line Data for DE BE UK obtained on email request Data for UK and IE refers to immigration numbers and not to official migration statistics
National statistical offices websites of core EU countries
For static models ndash emigration from origin country i into destination country j in time t for dynamic model ndash share of emigrants in total population of origin country in log
Data for Germany and Denmark are based on country of previous residence principle Data for Netherlands Italy United Kingdom and Belgium on country of birth principle while data for Sweden Finland Luxemburg and Austria are based on citizenship principleCore EU countries are represented by 11 countries due to data availability Austria Belgium Denmark Finland Germany Ireland Italy Luxemburg Netherlands Sweden and United Kingdom Usually Portugal Greece Spain and France are also included in core EU countries Required immigration data are not publicaly available on their website Statistical office of Portugal delivered the data from our customized request Since data are starting in 2008 we do not include them in main specifications Upon conclusion of this paper we have not managed to receive required data from customized requests sent to other statistical offices
ivan
a dr
ažen
ov
ić ma
rin
a ku
no
vac d
om
inik pr
ipužić
dy
na
mic
s an
d deter
min
an
ts of em
igr
ation th
e ca
se of c
ro
atia an
d the ex
perien
ce
of n
ew eu m
emb
er states
pub
lic secto
r ec
on
om
ics
42 (4) 415-447 (2018)441aPPendIX 2
Table a3 Total migration flow in Croatia ndash approximation based on discretional combination of different data sources
emigration from and to croatia following the eu accession 2013 2014 2015 2016 2013-2016(1) Emigration to core EU countries from national statistical offices of core EU countries
31655 53666 72528 71314 229163
(2) Emigration to ldquorest of the worldrdquo according to CBS 11220 9049 11116 9238 40623
(3) Total emigration = (1) + (2) 42875 62715 83644 80552 269786(4) CNB total emigration 15262 20858 29651 36436 102207(5) Emigration coefficient 28 30 28 22 26(6) Immigration from core EU countries according to national statistical offices of core EU countries
14164 19346 23261 23422 80193
(7) Immigration from ldquorest of the worldrdquo according to CBS 8676 8540 8512 9705 35433
(8) Total immigration = (6) + (7) 22840 27886 31773 33127 115626(9) CBS total immigration 10378 10638 11706 13985 46707(10) Immigration coefficient 22 26 27 24 25(11) Net emigration = (3) ndash (8) 20035 34829 51871 47425 154160(12) CNB net emigration 4884 10220 17945 22451 55500(13) Net emigration coefficient 41 34 29 21 28
Note UK and Ireland not included in immigration numbersSource CBS and national statistical offices of the core EU countries
ivan
a dr
ažen
ov
ić ma
rin
a ku
no
vac d
om
inik pr
ipužić
dy
na
mic
s an
d deter
min
an
ts of em
igr
ation th
e ca
se of c
ro
atia an
d the ex
perien
ce
of n
ew eu m
emb
er states
pub
lic secto
r ec
on
om
ics
42 (4) 415-447 (2018)
442 aPPendIX 3
Table a4 Determinants of emigration flows from new EU member states to the core EU coun-tries between 2000 and 2016 dynamic estimation Arellano-Bond GMM estimator
model 3 dynamic model (gmm)
Distance -049(000)
Population 029(059)
Transitional provisions 025(000)
Employment rate (origin) -201(000)
Employment rate (destination) 053(047)
Output gap (origin) 372(036)
Output gap (destination) 218(000)
Corruption index (origin) -037(040)
Corruption index (destination) 057(055)
Share of youth (20-34) origin -032 (059)
Share of tertiary educated (origin) 035 (012)
ln(m t-1) 066(000)
Cons 74 Note and refer to 10 5 and 1 statistical significance levels respectively P-values are in parenthesis All specifications include origin and destination fixed effects dum-mies Parameters associated to output gap for origin and destination country are multiplied by 100 since the output gap enters the model specification in levels instead of being transformed into logarithms due to negative valuesSource Authorsrsquo elaboration based on national statistical offices of the core EU countries immi-gration data and on the data presented in appendix 1
ivan
a dr
ažen
ov
ić ma
rin
a ku
no
vac d
om
inik pr
ipužić
dy
na
mic
s an
d deter
min
an
ts of em
igr
ation th
e ca
se of c
ro
atia an
d the ex
perien
ce
of n
ew eu m
emb
er states
pub
lic secto
r ec
on
om
ics
42 (4) 415-447 (2018)443Table a5
Determinants of emigration flows from new EU member states to the core EU countries between 2000 and 2016 Poisson pseudo maximum likelihood estimator extended specification Model 4
model 4 fe model 4 PPml
Distance ndashndash
-152(000)
Population 169(000)
663(000)
Transitional provisions 047(000)
042(000)
Unemployment rate (origin) 019(003)
069(000)
Unemployment rate (destination) -003(066)
-109(000)
Output gap (origin) 218(001)
153(034)
Output gap (destination) 464(000)
252(009)
Governance index (origin) -022(052)
-229(000)
Governance index (destination) 089(011)
-271(040)
Share of youth (20-34) origin 171(000)
134(011)
Share of tertiary educated (origin) 041(002)
069(001)
Cons -104 422Number of observations 1958 1972R2 051 082
Note and refer to 10 5 and 1 statistical significance levels respectively P-values are in parenthesis All specifications include origin and destination fixed effects dum-mies Parameters associated to output gap for origin and destination country are multiplied by 100 since the output gap enters the model specification in levels instead of being transformed into logarithms due to negative valuesSource Authorsrsquo elaboration based on national statistical offices of the core EU countries immi-gration data and on the data presented in appendix 1
ivan
a dr
ažen
ov
ić ma
rin
a ku
no
vac d
om
inik pr
ipužić
dy
na
mic
s an
d deter
min
an
ts of em
igr
ation th
e ca
se of c
ro
atia an
d the ex
perien
ce
of n
ew eu m
emb
er states
pub
lic secto
r ec
on
om
ics
42 (4) 415-447 (2018)
444
aPP
en
dIX
4
Ta
bl
e a
6 Nu
mbe
r of e
mig
rant
s fro
m C
roat
ia b
y re
gion
(as
of t
otal
pop
ulat
ion
of th
e re
gion
) bet
ween
200
1 an
d 20
16 C
entra
l Bur
eau
of S
tatis
tics d
ata
gro
ss
emig
ratio
n flo
ws
20
0120
0220
0320
0420
0520
0620
0720
0820
0920
1020
1120
1220
1320
1420
1520
16Ea
ster
n C
roat
ia0
20
20
20
30
20
30
30
20
40
30
30
30
40
61
01
4C
entra
l Cro
atia
02
02
02
02
02
02
03
03
03
03
04
03
05
06
08
10
Lika
and
Gor
ski k
otar
02
02
02
01
01
02
02
02
02
02
03
03
04
06
09
10
Cen
tral a
nd S
outh
ern
Adr
iatic
01
02
01
01
01
01
02
02
02
03
04
04
05
05
06
07
Nor
then
Adr
iatic
02
02
01
01
01
01
01
01
01
02
05
04
03
04
06
07
Nor
thw
este
rn C
roat
ia0
10
10
10
10
00
10
10
00
00
00
10
10
10
30
40
6C
ity o
f Zag
reb
02
06
02
01
01
01
01
01
01
02
03
03
03
04
06
06
Not
es E
aste
rn C
roat
ia e
ncom
pass
es V
irovi
tičko
-pod
ravs
ka P
ožeš
ko-s
lavo
nska
Bro
dsko
-pos
avsk
a O
sječk
o-ba
ranj
ska
and
Vuko
vars
ko-s
rijem
ska
coun
ties
Cent
ral C
roat
ia
enco
mpa
sses
Zag
reba
čka
Sis
ačko
-mos
lava
čka
Kar
lova
čka
and
Bjel
ovar
sko-
bilo
gors
ka c
ount
ies
Lika
and
Gor
ski k
otar
enc
ompa
ss P
rim
orsk
o-go
rans
ka a
nd L
ičko
-sen
jska
co
untie
s C
entr
al a
nd S
outh
ern
Adri
atic
enc
ompa
ss Z
adar
ska
Šib
ensk
o-kn
insk
a S
plits
ko-d
alm
atin
ska
and
Dub
rova
čko-
nere
tvan
ska
coun
ties
Nor
then
Adr
iatic
refe
rs to
Is
tars
ka C
ount
y N
orth
wes
tern
Cro
atia
enc
ompa
ss K
rapi
nsko
-zag
orsk
a V
araž
dins
ka M
eđim
ursk
a an
d K
opri
vnič
ko-k
riže
vačk
a co
untie
sSo
urce
CBS
ivan
a dr
ažen
ov
ić ma
rin
a ku
no
vac d
om
inik pr
ipužić
dy
na
mic
s an
d deter
min
an
ts of em
igr
ation th
e ca
se of c
ro
atia an
d the ex
perien
ce
of n
ew eu m
emb
er states
pub
lic secto
r ec
on
om
ics
42 (4) 415-447 (2018)445references
1 Anderson J E 2011 The Gravity Model Annual Review of Economics Annual Reviews 3(1) pp 133-160
2 Arellano M and Bond S 1991 Some tests of specification for panel data Monte Carlo evidence and an application to employment equations Review of Economic Studies 58(2) pp 277-297 httpsdoiorg1023072297968
3 Arpaia A [et al] 2016 Labour mobility and labour market adjustment in the EU IZA Journal of Devlopment and Migration 5(21) pp 1-37 httpsdoiorg101186s40176-016-0069-8
4 Beine M Bourgeon P and Bricongne J C 2017 Aggregate Fluctuations and International Migration Scand Journal of Economics Accepted Author Manuscript httpsdoiorg101111sjoe12258
5 Beine M Docquier F and Ozden C 2009 Diasporas Journal of Develop-ment Economics 95(1) pp 30-41 httpsdoiorg101016jjdeveco2009 11004
6 Bertoli S Bruumlcker H and Fernaacutendez-Huertas Moraga J 2013 The Euro-pean Crisis and Migration to Germany Expectations and the Diversion of Migration Flows IZA Discussion Papers No 7170 Available at lthttpftpizaorgdp7170pdfgt
7 Blundell R and Bond S 1998 Initial conditions and moment restrictions in dynamic panel data models Journal of Econometrics 87(1) pp 115-143 httpsdoiorg101016S0304-4076(98)00009-8
8 Borjas G J 1987 Self-Selection and the Earnings of Immigrants The Amer-ican Economic Review 77(4) pp 531-553
9 Božić S and Burić B 2005 Migracijski potencijal Hrvatske ndash mikroanalitički aspekti Migracijske i etničke teme 21(1-2) pp 9-33
10 Bruumlcker H [et al] 2009 Labour mobility within the EU in the context of enlargement and the functioning of the transitional arrangements Nurem-berg European Integration Consortium Final Report Available at lthttpeceuropaeusocialBlobServletdocId=2509amplangId=engt
11 Eurostat 2018 Eurostat International Migration Statistics Available at lthttpseceuropaeueurostatcachemetadataenmigr_immi_esmshtmgt
12 Fertig M and Kahanec M 2013 Mobility in an Enlarging European Union Projections of Potential Flows from EUrsquos Eastern Neighbors and Croatia IZA Discussion Papers No 7634 Available at lthttpftpizaorgdp7634pdfgt
13 Flowerdew R and Salt J 1979 Migration between labour market areas in Great Britain 1970-1971 Journal Regional Studies 13(2) pp 211-231 httpsdoiorg10108009595237900185181
14 Grogger J and Hanson G H 2011 Income Maximization and the selection and sorting of international Migrants Journal of Development Economics 95(1) pp 42-54 httpsdoiorg101016jjdeveco201006003
15 Harris J R and Todaro M P 1970 Migration Unemployment and Devel-opment A Two-Sector Analysis The American Economic Review 60(1) pp 126-142
ivan
a dr
ažen
ov
ić ma
rin
a ku
no
vac d
om
inik pr
ipužić
dy
na
mic
s an
d deter
min
an
ts of em
igr
ation th
e ca
se of c
ro
atia an
d the ex
perien
ce
of n
ew eu m
emb
er states
pub
lic secto
r ec
on
om
ics
42 (4) 415-447 (2018)
446 16 Hazans M and Philips K 2011 The Post-Enlargement Migration Experi-ence in the Baltic Labor Markets IZA DP No 5878 Available at lthttpftpizaorgdp5878pdfgt
17 HZZ 2017 Anketa poslodavaca 2017 Zagreb Hrvatski zavod za zapošlja-vanje Available at lthttpwwwhzzhrUserDocsImagesAnketa_posloda-vaca_2017_HZZpdfgt
18 Izquierdo M Jimeno J F and Lacuesta F 2014 The Impact of the Crisis on Migration Flows in Spain Intereconomics 49(3) pp 144-151
19 Jurić T 2017 Suvremeno iseljavanje Hrvata u Njemačku karakteristike i motivi Migracijske i etničke teme 24(3) pp 337-371
20 Lamberty L 2015 Explaining Baltic Migration After EU Accession Deter-minants and Consequences Available at lthttpswwwehllusemediaehlsneepaperslambertypdfgt
21 Ordinance for the implementation of the General Tax Act OG 3017 Zagreb Official Gazzete
22 Poot J [et al] 2016 The gravity model of migration the successful come-back of an ageing superstar in regional science Investigaciones Regionales ndash Journal of Regional Research 36 pp 63-86
23 Poprawe M 2015 On the relationship between corruption and migration empirical evidence from a gravity model of migration Public Choice 163(3) pp 337-354 httpsdoiorg101007s11127-015-0255-x
24 Ramos R 2016 Gravity models A tool for migration analysis IZA World of Labor 2016 No 239 httpsdoiorg1015185izawol239
25 Santos Silva J M and Tenreyro S 2006 The log of gravity The Review of Economics and Statistics 88(4) pp 641-658 httpsdoiorg101162rest 884641
26 Sjaastad L A 1962 The Costs and Returns of Human Migration Journal of Political Economy 70(5) pp 80-93 httpsdoiorg101086258726
27 Sprenger E 2013 The Determinants of International Migration in the Euro-pean Union An Empirical Analysis IOS Working Papers No 325 Available at lthttpswwweconstoreubitstream10419792401733903029pdfgt
28 Statistics Poland 2011 The concept of the international migration statistic system in Poland Available at lthttpsstatgovplcpsrdexbcrgusp_inter_migration_stat_system_in_polandpdfgt
29 Strielkowski W Šaacuterkovaacute K and Żornaczuk T 2013 EU Enlargement and Migration Scenarios of Croatian Accession Romanian Journal of European Affairs 13(3) pp 53-63 httpsdoiorg102139ssrn2334173
30 Šonje V 2018 Nepovratna emigracija prva procjena Available at lthttparhivanalitikahrblognepovratna-emigracija-prva-procjenagt
31 Thaut L 2009 EU Integration amp Emigration Consequences The Case of Lithuania International Migration 47(1) pp 192-233 httpsdoiorg 101111j1468-2435200800501x
ivan
a dr
ažen
ov
ić ma
rin
a ku
no
vac d
om
inik pr
ipužić
dy
na
mic
s an
d deter
min
an
ts of em
igr
ation th
e ca
se of c
ro
atia an
d the ex
perien
ce
of n
ew eu m
emb
er states
pub
lic secto
r ec
on
om
ics
42 (4) 415-447 (2018)44732 Tinbergen J 1962 Shaping the World Economy Suggestions for an Interna-
tional Economic Policy New York The Twentieth Century Fund33 Vidovic H and Mara I 2015 Free Movement of Workers Transitional
Arrangements and Potential Mobility from Croatia The Vienna Institute for International Economic Studies Research Report No 402 Available at lthttpswiiwacatfree-movement-of-workers-transitional-arrangements-and-potential-mobility-from-croatia-dlp-3630pdfgt
34 Vuković V 2017 The political economy of local government in Croatia winning coalitions corruption and taxes Public Sector Economics 41(4) pp 387-421 httpsdoiorg103326pse4141
35 Župarić-Ilijć D 2016 Iseljavanje iz Republike Hrvatske nakon ulaska u Europsku uniju Zagreb Friedrich Ebert Stiftung Available at lthttpwwwfes-croatiaorgfileadminuser_uploadFES_Iseljavanje_webpdfgt
Determinants of subnational budgetfiscal transparency a review of empirical evidence
BRANKO STANIĆ MA in Economics
Review articleJEL H11 H72httpsdoiorg103326pse4244
The author would like to thank the two anonymous referees for helpful comments on the paper This study was supported by the Croatian Science Foundation (grant number IP-2014-09-3008)
Received March 22 2018 Accepted November 9 2018
Branko STANIĆInstitute of Public Finance Smičiklasova 21 10000 Zagreb Croatiae-mail brankostanicijfhrORCiD 0000-0002-8746-6764
br
an
ko sta
nić
deter
min
an
ts of su
bn
ation
al b
ud
getfisc
al tr
an
spar
enc
y a rev
iew o
f empir
ica
l evid
enc
epu
blic sec
tor
eco
no
mic
s42 (4) 449-486 (2018)
450 abstractThis paper provides a review of empirical research on the factors determining the budgetfiscal transparency of subnational governments It focuses on academic online databases by conducting keyword searches that take in papers published in the period 2000-2017 Three important observations can be made (1) there is a lack of a unique definition of budgetfiscal transparency (2) the different defini-tions lead to disharmonised budgetfiscal transparency measurements (3) there is a heterogeneity of the definition and measurement of some explanatory variables that can lead to apparent contradictions and inconsistencies in the results obtained However the paper provides a balanced account of core explanatory factors emphasizing variables that despite heterogeneity in definition and meas-urement have a significant impact on the levels of subnational government budgetfiscal transparency Since the review involves mainly online disclosure future studies might want to extend the observation period or implement systematic reviews and meta-analyses to gain additional insights on this topic
Keywords subnational governments budget transparency empirical review main determinants
1 IntroductIonIt can be said that in the past two decades and especially in the aftermath of the financial crisis enormous pressure has been put on governments to improve their communication with citizens by being more open transparent and accountable In this sense more and more attention is being paid to fiscal and budgetary issues Some of the most prominent initiatives that advocate for these issues are the Inter-national Budget Partnership (IBP) the Global Initiative for Fiscal Transparency (GIFT) and the Open Government Partnership (OGP) Due to the OGPrsquos strong advocacy a total of 75 countries have endorsed the Open Government Declaration and announced their country action plans More recently OGP was opened to subnational governments In 2016 a total of 15 subnational governments signed the declaration and submitted their action plans to be implemented throughout 2017 as part of a pilot program
Thus the discourse of budget transparency seems to be changing giving ever more importance to subnational governments (SNGs) Accordingly subnational budgets are becoming a ubiquitous topic in the field of public financial management Their importance also stems from the fact that public goods and services are particularly tangible at the subnational and especially the local level Therefore citizens may have more interest in participating in local budget processes where they can see their direct impact on local development Furthermore subnational budget transpar-ency enables ordinary citizens and civil society organizations to evaluate govern-ment services and facilities and suggest possible changes and needs in the future
The internet has provided an additional incentive for proactive publishing ena-bling large-scale publication of budget data as well as constantly improving gov-
br
an
ko sta
nić
deter
min
an
ts of su
bn
ation
al b
ud
getfisc
al tr
an
spar
enc
y a rev
iew o
f empir
ica
l evid
enc
epu
blic sec
tor
eco
no
mic
s42 (4) 449-486 (2018)
451ernment consultation processes It can be said that the rise of the internet has fur-thered budget transparency by allowing rapid and inexpensive proactive disclo-sure (Darbishire 2010) Consequently SNGs have increasingly resorted to proac-tive budget disclosure thus not only reducing demand-side pressures but also changing their attitude and way of communicating with citizens Despite the widespread availability and bidirectionality of the internet SNG websites vary greatly in the amount of information available comprehensiveness timeliness and interactiveness (Caba-Peacuterez Rodriacuteguez Boliacutevar and Loacutepez Hernaacutendez 2008) While some SNGs run open budget policies others oppose the practice and rarely use the low cost benefits of online proactive publishing
The aim of this study is hence to review the development of research conducted previously in order to understand the factors that could influence SNG budgetfiscal disclosure In other words it aims to produce a balanced account of the set of variables that significantly affect SNG budgetfiscal transparency Some previ-ous studies reviewed the various types of public sector disclosure (Bakar and Saleh 2015) However this study explores studies published in the 2000-2017 period focusing explicitly on budget or fiscal transparency The paper is organ-ized as follows Section 2 provides the methodological framework Section 3 pre-sents different definitions and measurements of budgetfiscal transparency Sec-tion 4 offers a balanced account of core determinants of SNG budgetfiscal disclo-sure Section 5 concludes with recommendations for future research
2 frameworK for analysIsThis review focuses on identifying explicitly quantitative studies on the determi-nants of SNG budgetfiscal transparency The decision for quantitative studies is because they allow for rapid analysis and replication which increases reliability validity and the greater probability of obtaining unambiguous results which con-tributes to better decision-making Subnational governments include all levels below the national government ie local regional state and provincial To identify eligible articles this study used the Summon discovery service ndash a unified search for all electronic sources of academic publications including search interfaces such as ProQuest EBSCO Host Web of Science and Scopus In addition Google Scholar and hand searches were also used This review includes studies published from 2000-2017 thus the focus is inherently on online disclosure Only studies in English are taken into consideration Search terms used were ldquocauses of budgetfiscal transparencyrdquo ldquosubnational government transparencyrdquo ldquobudgetfiscal trans-parency determinantsrdquo ldquolocal government transparencyrdquo or just ldquogovernment transparencyrdquo Since only a few studies focused solely on budget or fiscal transpar-ency it should be noted that this review includes all studies that in their transpar-ency measure have at least one dimension concerning the budget ie revenues and expenditures Although books were initially included in the search no relevant sources were generated on the determinants of subnational budgetfiscal transpar-ency This is probably due to it being an insufficiently researched topic which is why journals take the lead while books are still outdated as sources of information
br
an
ko sta
nić
deter
min
an
ts of su
bn
ation
al b
ud
getfisc
al tr
an
spar
enc
y a rev
iew o
f empir
ica
l evid
enc
epu
blic sec
tor
eco
no
mic
s42 (4) 449-486 (2018)
452 However the eligibility criteria were designed to ensure that high-quality relevant work is included specifically referring to empirical quantitative studies that employ budgetfiscal transparency as the dependent variable Finally 20 studies are included in the review All studies are peer-reviewed and published in journals with the exception of Ma and Wuʼs (2011) paper which remained as part of the 1st
Global Conference on Transparency Research held at Rutgers University
Although it is unquestionable that every paper has made a contribution this review highlights four papers on account of their narrow focus on budgetfiscal transparency strong and credible evidence and rigorous methodology used The first is a paper by Alt Lassen and Rose (2006) who used a unique panel data on the evolution of transparent budget procedures in the US states over the past three decades They used both case studies and quantitative analysis presenting robust results Serrano-Cinca Rueda-Tomaacutes and Portillo-Tarragona (2009) used multivariate logistic regression focusing exclusively on the availability of budget-related documents Although their results showed different levels of robustness they proved that size of the municipality political will and residentsrsquo income all affect budget disclosure Similarly Guillamoacuten Bastida and Benito (2011) exam-ined the determinants of budget and financial transparency using both OLS and 2SLS regression analysis After controlling for endogeneity they confirmed the robustness of the model employed Like them Esteller-Moreacute and Polo Otero (2012) remained focused on budget information disclosures They applied their analysis to a large sample of municipalities using a logit regression analysis for panel data covering a seven-year period These four papers are emphasized on the basis of measurements of the dependent variables and the credibility and quality of the evidence and method used for determining the factors of budgetfiscal trans-parency With this in mind all the papers included in the review are presented in the following chapters first by measuring the dependent variables and then by the established budgetfiscal transparency factors
3 budgetfIscal transParency ndash from defInItIon to measurement
31 defInItIonIn the literature budget transparency and fiscal transparency are often used inter-changeably which may point to the equivalence of these two concepts However budget transparency is a narrower concept focusing on the budget reports within the budget cycle On the other hand fiscal transparency also includes fiscal activ-ities undertaken outside the budget sector aiming at reducing off-budget transac-tions (IMF 1997) It often includes information on all stocks as well as flows which can hardly be found in the budget documents Still it is difficult to make a strict division between these two concepts since they are intertwined and some-times even used synonymously Therefore this paper will use both terms One of the most comprehensive definitions of fiscal transparency was offered by Kopits and Craig (19981)
br
an
ko sta
nić
deter
min
an
ts of su
bn
ation
al b
ud
getfisc
al tr
an
spar
enc
y a rev
iew o
f empir
ica
l evid
enc
epu
blic sec
tor
eco
no
mic
s42 (4) 449-486 (2018)
453ldquoFiscal transparency implies an openness toward the public at large about government structure and functions fiscal policy intentions public sector accounts and projections It involves ready access to reliable comprehen-sive timely understandable and internationally comparable information on government activities ndash whether undertaken inside or outside the gov-ernment sector ndash so that the electorate and financial markets can accurately assess the governmentrsquos financial position and the true costs and benefits of government activities including their present and future economic and social implicationsrdquo
In accordance with this definition Alt Lassen and Skilling (2002) stressed that financial documents should be informative and comprehensive but at the same time easily understandable leaving the option of independent scrutiny In order to facilitate this inspection and monitoring of economic policies by national authori-ties financial markets and international institutions the IMF has developed a Code of Good Practices on Fiscal Transparency (IMF 1998) The Code consisted of four main principles 1) clarity of roles and responsibilities 2) public availability of information 3) open budget preparation execution and reporting and 4) independent assurances of integrity
Although this Code has helped practitioners in understanding basic concepts of fiscal transparency practices it did not contain clear guidelines or standards that would facilitate the way and approach to measuring fiscal transparency However the Code was revised in 2007 pointing out that fiscal data (budget forecasts and updates annual budget and final accounts fiscal reports) should meet accepted data quality standards Similarly the OECD has developed best practices for budget transparency although their definition of budget transparency refers to broader concept of fiscal matters ldquofull disclosure of all relevant fiscal information in a timely and systematic mannerrdquo (OECD 20027) The best practices are divided into three parts ndash budget reports specific disclosures and integrity assurance (table 1) It is evident that only the first section corresponds to pure budget disclo-sure while the other two represent wider fiscal matters Still the first section can be considered the first internationally recognized standard for budget reporting
Table 1 The ldquothree pillarsrdquo of the OECDrsquos best budget transparency practices
budget reports Specific disclosures Integrity control and accountabilityThe budget Economic assumptions Accounting policiesPre-budget report Tax expenditures Systems and responsibilityMonthly reports Financial assets and liabilities AuditMid-year report Non-financial assets Public and parliamentary scrutinyYear-end report Employee pension obligationsPre-election report Contingent liabilitiesLong-term report
Source OECD (2002)
br
an
ko sta
nić
deter
min
an
ts of su
bn
ation
al b
ud
getfisc
al tr
an
spar
enc
y a rev
iew o
f empir
ica
l evid
enc
epu
blic sec
tor
eco
no
mic
s42 (4) 449-486 (2018)
454 It could be said that a number of authors have defined budgetfiscal transparency not only as the availability of budgetfiscal information but also in terms of open-ness and public accountability This can best be seen in Kopits and Craig (1998) who argue that fiscal transparency does not only imply access to fiscal reports but rather the openness of fiscal policies and procedures Similarly Andreula Chong and Guilleacuten (2009) state that fiscal transparency apart from open budget prepara-tion and availability of fiscal information also implies assurances of roles and responsibilities In this sense the IMF has indicated the difference between fiscal reporting and fiscal transparency While the first refers to the production and avail-ability of fiscal information the second relates to the ldquoclarity reliability fre-quency timeliness and relevance of public fiscal reporting and the transparency of the governmentrsquos fiscal policy-making processrdquo (IMF 20125)
One can conclude that there is no uniform definition of budgetfiscal transparency which indicates a complex understanding of this topic In other words while there are certain standards and guidelines different definitions and interpretations directly affect the approach and the way of measurement Certainly the methods and scope of measurement also depend on the context in which the research is carried out Since this review is based on the causes rather than the effects of budgetfiscal transparency the next section provides an empirical overview of dif-ferent measurements in which the budgetfiscal transparency measure appears as a dependent variable
32 VarIous aPProaches to measurIng subnatIonal budgetfIscal transParency ldquoConceptually a statistical measure of transparency is the precision of the information that is obtained ie a function of its relevance and qualityrdquo
(Vishwanath and Kaufmann 19994)
Given the specificities of different countriesrsquo laws standards procedures and con-texts one should be careful while summing comparing and interpreting different definitions and measures of budgetfiscal transparency In other words subna-tional comparisons may be most important within rather than across countries Accordingly this section seeks to present the first studies from Spain and USA ndash since most papers on this topic are focused on the SNGs of these two countries Then individual studies with samples from other countries were presented
spainThe largest body of research comes from Spanish local governments Gandiacutea and Archidona (2008) presented an extensive local government online disclosure index which consists of five sub-indices two of which provide comprehensive budget and financial information The other three dimensions include general government information web presentation and navigation and relational web to address interactivity and functionality of the web Unlike them Serrano-Cinca Rueda-Tomaacutes and Portillo-Tarragona (2009) explicitly explored budget and
br
an
ko sta
nić
deter
min
an
ts of su
bn
ation
al b
ud
getfisc
al tr
an
spar
enc
y a rev
iew o
f empir
ica
l evid
enc
epu
blic sec
tor
eco
no
mic
s42 (4) 449-486 (2018)
455financial disclosure which they measured by sending questionnaires to munici-palities regarding their online publication of nine items (based on Spanish legis-lation regarding local government financial disclosure) including consolidated and unconsolidated budgets budget and annual accounts of dependent entities Like Gandiacutea and Archidona (2008) Caba-Peacuterez Rodriacuteguez Boliacutevar and Loacutepez Hernaacutendez (2008) have also offered an extensive web financial disclosure index hoping to contribute to a more harmonized framework for the structure of budget and financial information in Spanish local governments Although the numbers of items observed are different the main sections of their disclosure indexes are quite the same including budget and financial information and web navigability The main difference is that Caba-Peacuterez Rodriacuteguez Boliacutevar and Loacutepez Hernaacutendez (2008) included non-financial information such as indicators of economy effi-ciency and effectiveness and paid more attention to the characteristics of infor-mation such as timeliness understandability or comparability rather than content of information provided Several authors used the government transparency measure calculated by Transparency International (TI) Spain (Guillamoacuten Bastida and Benito 2011 del Sol 2013 De Arauacutejo and Tejedo-Romero 2016) This index consists of five government transparency areas (a) information about the municipal corporation (b) social transparency (c) financial transparency (d) ser-vices contracting transparency (e) urban development and procurement trans-parency Among these studies Guillamoacuten Bastida and Benito (2011) have con-tributed most to the field of budgetfiscal transparency by focusing explicitly on TIrsquos financial transparency section In other words their dependent variable was based solely on financial transparency indicators including accounting and budget transparency on revenues and expenditures and information on munici-pal debt Their study inspired others to use the same transparency measure for Spanish municipalities (del Sol 2013 De Arauacutejo and Tejedo-Romero 2016)
A significant study was presented by Esteller-Moreacute and Polo Otero (2012) who employed a panel analysis by using a large sample of Catalan municipalities in the period 2001-7 They constructed their fiscal transparency index by addressing the timeliness of the mandatory disclosure of municipalities that need to submit their budget information to the Public Audit Office for Catalonia The budget informa-tion consisted of the following budget approval final budget budget balances closed settlement budgets treasury statement treasury surplus net wealth state-ment income statement and indebtedness Similarly Caamantildeo-Alegre et al (2013) have investigated Galician municipalities They based their budget transparency measure on the IMFrsquos revised Code of Good Practices on Fiscal Transparency and sent the questionnaires to government officials by using a Likert-type survey on open budget process public availability of information and assurance of integrity However unlike Esteller-Moreacute and Polo Otero (2012) who offered a large number of observations and time variation this study remained limited in this sense
A slightly different approach to measuring government transparency was provided by Gandiacutea Marrahiacute and Huguet (2016) who looked at the presence of Web 20 in
br
an
ko sta
nić
deter
min
an
ts of su
bn
ation
al b
ud
getfisc
al tr
an
spar
enc
y a rev
iew o
f empir
ica
l evid
enc
epu
blic sec
tor
eco
no
mic
s42 (4) 449-486 (2018)
456 Spanish city councils In this way they wanted to examine the existence of partici-pative and social web with the possibility of user-generated content Accordingly their disclosure index contained not only information disclosure but also relational web Similar to del Sol (2013) they observed the total index as well as three sub-indices ndash ornamental index (general and citizen information) relational index and information index which includes budgetary and financial disclosure
united statesShortly after the OECD and the IMF implemented Codes of Best Practice for Fis-cal Transparency Alt Lassen and Rose (2006) published one of the most promi-nent and influential studies on the causes of fiscal transparency They examined the determinants of US States both conceptually and empirically A conceptual section included case studies of the states that managed to make significant pro-gress towards higher transparency levels within a short time frame On the other side the transparency measure was not based on the availability of fiscal docu-ments but rather on transparency of state government budget procedures Using the 1990s cross-sectional data from the National Association of State Budget Officers and the National Conference of State Legislatures they extended the data to the beginnings of transparent budget procedures of US states covering the period 1972-2002 This enabled them to use panel analysis which to the best of my knowledge was used for the first time in analyzing the causes of subnational fiscal transparency Although this study offers a unique data set comprising sur-vey responses to a questionnaire sent to the budget officers of all fifty states because of the period covered it could not address e-government practices
However with the rapid adoption of the internet more recent studies are mainly focused on online fiscalbudget transparency usually examining transparency lev-els on governmentsrsquo official websites While Alt Lassen and Rose (2006) offered a transparency measure with a considerable time variation more recent studies looked at the budgetfiscal transparency at one point in time or with small time periods Bernick et al (2014) dropped to a lower level exploring the fiscal trans-parency practices of US counties in 2014 They measured the online availability of a comprehensive annual financial report (CAFR) and availability and compre-hensiveness of budget information (no exact document or information is indi-cated) Similarly Lowatcharin and Menifield (2015) investigated county website transparency in 2010 However their county transparency measure (conducted by the Sunshine Review) included not only fiscal disclosure but a wider spectrum of government transparency such as permits and zoning contracts lobbying etc Relying on Groff and Pitmans (2004) description of internet financial reporting for the 100 largest US municipalities Styles and Tennyson (2007) extended the findings by examining the online availability and accessibility of CAFR data for a sample of US municipalities of various sizes
br
an
ko sta
nić
deter
min
an
ts of su
bn
ation
al b
ud
getfisc
al tr
an
spar
enc
y a rev
iew o
f empir
ica
l evid
enc
epu
blic sec
tor
eco
no
mic
s42 (4) 449-486 (2018)
457other countriesWhen it comes to pioneers in dealing with voluntary internet financial reporting in subnational governments the paper by Laswad Fisher and Oyelere (2005) deserves highlighting They observed New Zealandrsquos district city and regional councils by constructing the financial transparency measure as a dichotomous variable indicating whether or not the local authority publishes financial informa-tion on the web However their definition of what is considered published may be somewhat confusing since they had four disclosure categories financial high-lights only annual reports only annual plan only and combinations of annual reports plans and financial highlights together In other words it is not clear whether there is any council that has published for example both annual plan and report in which case the analysis could change considerably Garciacutea-Tabuyo Saacuteez-Martiacuten and Caba-Peacuterez (2016) investigated online proactive disclosure of the 40 largest municipalities in each of the five countries of Central America ndash El Salvador Nicaragua Panama Guatemala and Honduras This was a valuable study since the same transparency measure was employed for local government transparency in different country contexts However their measure consists of five transparency areas where economic and financial transparency (including enacted and executed consolidated and individual budget and budget amend-ments) accounts for 20 the total index
On the other hand some studies focused explicitly on fiscal transparency either on a sample of Brazilian states (Zuccolotto and Teixeira 2014) or Chinese provincial government (Ma and Wu 2011) While Ma and Wu (2011) used the data collected from the first two years of the four-year survey by the Public Policy Research Center in Shanghai Zuccolotto and Teixeira (2014) employed a fiscal transparency measure developed by Biderman and Pottomatti (2010)1 Tavares and da Cruz (2017) used TI Portugalʼs index of municipal transparency to assess a disclosure of Portuguese municipalities The index is a comprehensive measure of local gov-ernemnt transparency comprising seven dimensions one of which is economic and financial transparency However unlike other extensive measures it only monitors the availability of a set of information items on a municipalitys website not taking into account accessibility navigability reliability or the quality of the information A study presented by Gesuele Metallo and Longobardi (2017) analyzed website disclosure of Italian and Spanish municipalities Although their contribution is valuable (very few studies with an international context) they did not sufficiently address budgetfiscal transparency except for financial statements and information about municipalitiesrsquo assets such as values location and revenue
33 the challenge of subnatIonal budgetfIscal transParency measurement
This review will outline several budgetfiscal transparency measurement chal-lenges and opportunities First the use of the same transparency measure within a
1 A study available only in Portuguese
br
an
ko sta
nić
deter
min
an
ts of su
bn
ation
al b
ud
getfisc
al tr
an
spar
enc
y a rev
iew o
f empir
ica
l evid
enc
epu
blic sec
tor
eco
no
mic
s42 (4) 449-486 (2018)
458 country would allow for a comparison of the results of different studies which could contribute to a greater understanding of inconsistent results and to the reduction or explanation of the ambiguity in the previous findings The review shows that only a few studies used the same transparency index within a country as with the TI Spain index used by De Arauacutejo and Tejedo-Romero (2016) del Sol (2013) and Guillamoacuten Bastida and Benito (2011) Second the transparency measure mainly involved one year of observation and only a few studies have had a long dataset of the dependent variable such as Alt Lassen and Rose (2006) or Esteller-Moreacute and Polo Otero (2012) The longer time span of the dependent var-iable opens the door to many methodological approaches enables a better quality analysis and gives an opportunity to observe the progress of SNG budgetfiscal transparency Third in order to improve the observation of the causes of budgetfiscal transparency it is necessary to have more studies focusing solely on budget-ary and fiscal indicators
Although strong efforts have been made to standardize fiscal transparency meas-ures at the national level this remains an empirical and contextual challenge at the local level However some studies have already examined cross-country analyses by introducing their own index on a sample of municipalities (Garciacutea-Tabuyo Saacuteez-Martiacuten and Caba-Peacuterez 2016 Gesuele Metallo and Longobardi 2017) Nonetheless to facilitate these efforts analogously to the IBP Open Budget Sur-vey one of the biggest challenges (given the diversity of the local self-government system) is to create a harmonized budgetfiscal transparency index capable of being applied to the subnational governments of various countries Results of these studies could provide more comprehensive insights into the contextual sen-sitivity but also generally in examining the causes of budgetfiscal transparency
4 determInants of subnatIonal budgetfIscal transParency ndash emPIrIcal oVerVIew
41 heterogeneIty of defInItIon and measurement of VarIablesThis review discusses the different definitions and measurements of some varia-bles While different measurements are not unexpected in different countries (bear-ing in mind different types of data) the main issue is when these arise within a single country which can lead to confusion and ldquofalserdquo variability in the results However when concluding and interpreting results of previous studies attention has to be paid to the definitions and the way of measuring variables regardless of whether they are in-country or cross-country comparisons According to the litera-ture some of the most frequently used variables that can cause confusion are lever-age debt and political competition Although the definition of leverage is quite unambiguous several studies have used different measures Laswad Fisher and Oyelere (2005) have measured it in two ways as a ratio of long-term liabilities in total assets and in total public equity On the other hand some studies have used financial expenses per capita as a proxy for leverage (Gandiacutea and Archidona 2008 Gandiacutea Marrahiacute and Huguet 2016) Gandiacutea and Archidona (2008) have equated leverage with indebtedness making it more confusing by stating that they have
br
an
ko sta
nić
deter
min
an
ts of su
bn
ation
al b
ud
getfisc
al tr
an
spar
enc
y a rev
iew o
f empir
ica
l evid
enc
epu
blic sec
tor
eco
no
mic
s42 (4) 449-486 (2018)
459used the cost of debt as a proxy of indebtedness which is measured as municipal financial expenses per capita At the same time Caba-Peacuterez Rodriacuteguez Boliacutevar and Loacutepez Hernaacutendez (2008) used funding costs of current year budget expendi-ture per capita as a proxy for the cost of debt not assigning it to leverage but rather to debt Gesuele Metallo and Longobardi (2017) have not even described their leverage measure They defined it simply as a value of leverage per capita while the measure was described just as natural logarithm thus leaving it unexplained
A unique measure for debt issuance was presented by Serrano-Cinca Rueda-Tomaacutes and Portillo-Tarragona (2009) who used a dichotomic variable which assigns the value of 1 if the town hall has municipal bonds in circulation denoting a debt issu-ance On the other side some debt measures are more straight-forward such as debt level as a percentage of the total budget (del Sol 2013) or the often-used municipal public debt per capita (Alt Lassen and Rose 2006 Styles and Tenny-son 2007 Guillamoacuten Bastida and Benito 2011 Caamantildeo-Alegre et al 2013)
While some authors argue that a governmentrsquos decision to disclose or retain infor-mation is inherently political (Wehner and de Renzio 2013) others claim that political competition is a major driver of transparency reforms (Berliner and Erlich 2015) However the mode of measurement of political competition imposes the greatest variability among political determinants There are various measures intro-duced for this variable Some studies observe it as a margin of victory measured by the difference between the percentage of votes obtained by the parties coming in first and second place (De Arauacutejo and Tejedo-Romero 2016 2017 Tavares and da Cruz 2017) Others see it as a measure of dispersion ie the standard deviation of the percentage of votes received by each political party (Caba-Peacuterez Rodriacuteguez Boliacutevar and Loacutepez Hernaacutendez 2008 Esteller-Moreacute and Polo Otero 2012) Caamantildeo-Alegre et al (2013) applied the measure developed by Laakso and Taa-gepera (1979) ndash an effective number of political parties whose calculation also contains each partys proportion of all votes Several studies focused explicitly on competition in the municipal council Laswad Fisher and Oyelere (2005) and Serrano-Cinca Rueda-Tomaacutes and Portillo-Tarragona (2009) measured almost the same thing While the first used the ratio of candidates to council positions availa-ble the latter defined it as the ratio of candidates to councillors elected However despite the different definitions it could be said that their measure is the same since it seldom happens that available council positions are not filled
By using different measures for one variable results may vary within one study let alone comparing different studies contexts or subnational international com-parisons In this sense one should be careful while summing and interpreting results because the measure always speaks more than the variable name
42 maIn determInantsIn order to provide the centrality of each variable in the literature table 2 presents the most frequently used explanatory variables It shows how many studies that
br
an
ko sta
nić
deter
min
an
ts of su
bn
ation
al b
ud
getfisc
al tr
an
spar
enc
y a rev
iew o
f empir
ica
l evid
enc
epu
blic sec
tor
eco
no
mic
s42 (4) 449-486 (2018)
460 are included in the review used a particular independent variable The complete classification and measurements of variables can be seen in the appendix
Table 2 Most frequently used explanatory variables
financial Debt 40Governmentrsquos wealth 35Budget (im)balance 35Leverage 20Intergovernmental transfers 15Municipal size 10Political Political competition 55Political ideology 55Voter turnout 45Executive features 35Governance type 20E-government achievements 15citizens and the media Population sizedensity 60Citizensrsquo characteristics (education age gender) 45Citizensrsquo wealth 35Internet access 30Unemployment 25Media use and visibility 25
Source Author
However this overview aims to analyze the most frequently used variables that have shown a significant influence with particular emphasis on those that despite heterogeneity in definition and measurement show a significant effect In this way the review strives to produce a balanced account of core variables that greatly affect the level of subnational fiscalbudget transparency (table 3) To produce this account the rule is that only variables that were used in at least two papers and which show a significant result in more than 50 of cases were included Accord-ingly three basic variable categories are distinguished financial political and citizens and the media The following section reveals these variables and focuses on the explanation of the results obtained based on some underpinnings in previ-ous studies
421 fInancIal VarIablesFinancial leverage and debt levels are the most important financial factors deter-mining subnational budgetfiscal transparency Leverage refers to the use of bor-rowed funds to finance public activities In this sense it can represent the amount of debt of the government showing the close relation of these two terms Accord-ing to Zimmerman (1977) governments want to reduce the cost of debt by increas-
br
an
ko sta
nić
deter
min
an
ts of su
bn
ation
al b
ud
getfisc
al tr
an
spar
enc
y a rev
iew o
f empir
ica
l evid
enc
epu
blic sec
tor
eco
no
mic
s42 (4) 449-486 (2018)
461ing resources available for other activities that are more efficient in increasing governmentrsquos welfare than the payment of high interest rates Accordingly politi-cians are encouraged to publish government information which in turn facilitates monitoring by creditors This can be achieved easily and at low-cost by online proactive reporting which is confirmed in several studies even if they have dif-ferent leverage measurements (Laswad Fisher and Oyelere 2005 Gandiacutea Mar-rahiacute and Huguet 2016 Gesuele Metallo and Longobardi 2017)
Table 3 Main determinants of subnational budgetfiscal transparency
category Variable different measurements
Financial
LeverageRatio of long-term liabilities to total assetsRatio of long-term liabilities to total public equity Total executed expenses per capita
Debt
Percentage of debt in total budgetPublic debt per capitaFunding costs of the current year budget expenditure per capita
Political
Political competition
Divided government gubernatorial competition legislative competition1 if city council is governed by one of the majority political parties in the countryMeasure of dispersion ie the standard deviation of the percentage of votes received by each political party Effective number of political partiesMargin of victory measured by the difference between the percentage of votes obtained by the parties coming in first and second place
Executive features
Mayorrsquos genderNumber of incumbentrsquos consecutive terms (tenure)
Governance type
1 if district councils 0 regional or city councils1 if provincial capitalsForm of government (1 if council-manager 0 commission and council-elected executive)
Citizens and the media
PopulationNumber of inhabitantsPopulation density
Internet access
Percentage of households with home internet accessFixed internet access connections over 200 kilobits per second in at least one direction per 1000 householdsInternet penetration
Unemployment Unemployment rate
Media
Intensity of use of social media measured by the number of tweetsPress visibilityInternet visibility
Source Author
br
an
ko sta
nić
deter
min
an
ts of su
bn
ation
al b
ud
getfisc
al tr
an
spar
enc
y a rev
iew o
f empir
ica
l evid
enc
epu
blic sec
tor
eco
no
mic
s42 (4) 449-486 (2018)
462 Moreover politicians are incentivized to reduce debt levels because it allows for lower property taxes that will increase their probability of re-election (Gore Sachs and Trzcinka 2004) In this way incumbents are encouraged to use internet reporting and disclose more information as this helps lenders to regularly monitor governments activities (Debreceny Gray and Rahman 2002) In other words the greater the dependence on external funding sources the greater the disclosure (Ingram 1984) Severel studies have confirmed this finding a positive relation-ship between debt levels and budgetfiscal reporting (Styles and Tennyson 2007 Caba-Peacuterez Rodriacuteguez Boliacutevar and Loacutepez Hernaacutendez 2008 Caamantildeo-Alegre et al 2013 De Arauacutejo and Tejedo-Romero 2017) However Alt Lassen and Rose (2006) found a negative association concluding that higher debt reduces fiscal transparency But it should be pointed out that they employed debt variable only as a control variable Finally given the different leverage and debt measures used the significance of these variables in determining fiscalbudgetary transparency is even greater
422 PolItIcal VarIablesPolitical competitionWhen it comes to political determinants there are three variables that contribute to explaining different levels of subnational budgetfiscal transparency ndash political competition different executive features and type of government Stronger polit-ical competition encourages incumbents to bear higher monitoring costs because if they do not keep pre-election promises they are exposed to the long-term costs of re-election failure (Evans and Patton 1987) Esteller-Moreacute and Polo Otero (2012) stressed the importance of political competition in times in which an incumbentrsquos re-election is uncertain With a strong competition agents use fiscal disclosure as their strategic instrument to have a greater chance of being re-elected However when it comes to the degree of fiscal information they wish to provide agents face a trade-off According to Ferejohn (1986) higher levels of fiscal transparency allow politicians to have higher wages since principals are now ready to pay more taxes At the same time greater information disclosure diverts agents from rent extraction Accordingly in the cases of strong competi-tion higher transparency becomes agentsrsquo instrument only if a trade-off is solved in favour of higher salaries In cases of low competition transparency becomes less important for politicians as they in this case have high expectations of staying in power (Piotrowski and Bertelli 2010)
It is argued that parties in power have greater benefits from divulging information in both a low and a high political competition environment In the case of high competition they have the incentive to show their current actions and good man-agement (Caba Peacuterez Rodriacuteguez Boliacutevar and Loacutepez Hernaacutendez 2014) while low competition makes them more confident of their position in power and so willing to reveal more information (Grimmelikhuijsen and Welch 2012) By contrast other competing parties in a high competition environment abstain from the risk of disclosure as this may reduce their ability to control their message (Caba Peacuterez Rodriacuteguez Boliacutevar and Loacutepez Hernaacutendez 2014)
br
an
ko sta
nić
deter
min
an
ts of su
bn
ation
al b
ud
getfisc
al tr
an
spar
enc
y a rev
iew o
f empir
ica
l evid
enc
epu
blic sec
tor
eco
no
mic
s42 (4) 449-486 (2018)
463In this context the empirical results on political competition are mixed While sev-eral authors proved that competition fosters subnational fiscal transparency (Caamantildeo-Alegre et al 2013 Gandiacutea and Archidona 2008 Tavares and da Cruz 2017) others disputed this showing a negative correlation (Alt Lassen and Rose 2006 De Arauacutejo and Tejedo-Romero 2016 Gandiacutea Marrahiacute and Huguet 2016) Generally it is hard to report the true effect of political competition since the con-text data used and different country characteristics may greatly affect this variabil-ity in the results However even with wide range of measurements used political competition proved to be a significant predictor of subnational fiscal transparency
executive featuresDifferent incumbent characteristics and features also affect governmentrsquos decision on divulging or withholding fiscal information The mayorrsquos gender is the first of those features showing a significant influence on subnational transparency levels Many studies have investigated the differences between women and men officials mostly favouring womenrsquos leadership style and its effect on decision-making in the public sector It is argued that female mayors are more likely than their male counterparts to actively engage citizens in the decision-making thus fostering participation communication and different inputs (Fox and Schuhmann 1999) Some studies are concerned with gender and ethics suggesting that women are less likely to behave unethically in the workplace in order to achieve greater finan-cial rewards (Bernardi and Arnold 1997 Krishnan and Parsons 2008) In addi-tion female mayors may be less likely to experience the principal-agent dilemma since they are more ethically minded than men (Khazanchi 1995) Some authors stress that the critical representation of women in governance structures can affect the way of government functioning making it more socially responsive and trans-parent (Rodriacuteguez-Garcia 2015) Several authors have empirically confirmed these underpinnings finding a positive relationship between a female mayor and budget transparency (De Arauacutejo and Tejedo-Romero 2017 Tavares and da Cruz 2017) However Gesuele Metallo and Longobardi (2017) proved the opposite but showing the significance in only one of the three models presented
It is also argued that longer tenure in office reduces pressure on the officials to disclose information Tavares and da Cruz (2017) found that the number of an incumbentrsquos consecutive terms in office is one of the factors most detrimental to transparency This is consistent with the findings by Berliner (2014) who claimed that turnover in executive office fosters the adoption of freedom of information laws which are associated with increased transparency By contrast Ma and Wu (2011) showed a positive correlation stressing that governments need more time to achieve the support needed for the implementation of administrative reforms so as to foster transparency and openness It could also be argued however that much more research is needed as only few studies have employed this variable thus limiting a better insight into the true effects of this variable
br
an
ko sta
nić
deter
min
an
ts of su
bn
ation
al b
ud
getfisc
al tr
an
spar
enc
y a rev
iew o
f empir
ica
l evid
enc
epu
blic sec
tor
eco
no
mic
s42 (4) 449-486 (2018)
464 governance typeThere has been a tendency for researchers to include a dummy variable that addresses the type or form of the government thus pointing to the governance structure This could be an important argument especially in the context of imple-mentation of the new public management (NPM) Namely within this approach citizens are viewed as customers and public servants as public managers while transparency and accountability are perceived as fundamental elements of good governance (Caba Peacuterez Rodriacuteguez Boliacutevar and Loacutepez Hernaacutendez 2008) Las-wad Fisher and Oyelere (2005) were among the first to use the variable ldquoform of local authorityrdquo by distinguishing between district city and regional councils They found that regional and city councils are more transparent than district coun-cils However it is not clear why they have not used a nominal variable rather than a dichotomous to address all three council types separately It should be noted though that the governance type may vary greatly among countries thus depending on the setting of the public administration of a country In some cases the central government has administration delegations across the country which are assigned to the several subnational units In Spain for example these are pro-vincial capitals where the central government holds offices to provide efficiently and effectively some additional services to citizens These political capitals proved to be less transparent than other Spanish cities (del Sol 2013) Since this is a spe-cific country context it would be difficult to find theoretical underpinnings that support this evidence In spite of that the author indicated that the reason for low transparency could be the capitalsrsquo privileged treatment by the central govern-ment Lowatcharin and Menifield (2015) on a sample of US counties found that council-manager governments tend to be more transparent than their mayor-coun-cil counterparts It could be argued however that council-managers are more prone to the adoption of web technologies and e-government solutions rather than mere transparency (Moon 2002) In other words higher transparency in these governments is not a goal by itself but comes as a result of their propensity for web technology implementations
423 cItIZens and the medIaPopulationOne of the variables most often used in explaining SNG fiscal transparency is the number of inhabitants It is widely discussed that larger SNGs have the extra resources and capacities to adopt technical and managerial innovations faster (Smith and Taebel 1985 Norris and Kraemer 1996) This is explained by the greater pressure they face in finding different ways for a better supply of public services In addition they may have a better trained stuff a larger budget and an established IT department which helps them to embrace e-government practices (Moon and Norris 2005) These underpinnings were strongly confirmed by sev-eral authors (del Sol 2013 Guillamoacuten Bastida and Benito 2011 Lowatcharin and Menifield 2015 Serrano-Cinca Rueda-Tomaacutes and Portillo-Tarragona 2009) However a study presented by Esteller-Moreacute and Polo Otero (2012) has revealed new insights into the population variable Given the heterogeneity of the sample
br
an
ko sta
nić
deter
min
an
ts of su
bn
ation
al b
ud
getfisc
al tr
an
spar
enc
y a rev
iew o
f empir
ica
l evid
enc
epu
blic sec
tor
eco
no
mic
s42 (4) 449-486 (2018)
465with a wide range of population size they split the sample into a large and small population They found a negative relationship in the small sample but a positive in the larger sample (for the very big municipalities) pointing to a non-linear relationship between the number of inhabitants and fiscal transparency They stressed that unlike small municipalities very large units have greater capacity to fulfil their legal obligations which could more than compensate for their potential propensity to be less transparent
Internet accessAccording to Debreceny Gray and Rahman (2002) the rise in the use of the inter-net has brought different views to fiscal transparency From the userʼs perspective it is recognized as a facilitator in the demand for fiscal transparency while from the supplierʼs perspective it is perceived as a tool for more effective dissemination of information Internet take-up has affected the behaviour of governments which are now divulging additional information and services online Thus its rise has brought about an improved transparency and financial accountability reducing the costs of dissemination (Pina Torres and Royo 2010) Several studies that investigated online (mainly website) transparency reported that greater and better internet access in the SNGs positively affects their fiscal transparency (Caba-Peacuterez Rodriacuteguez Boliacutevar and Loacutepez Hernaacutendez 2008 Gandiacutea and Archidona 2008 De Arauacutejo and Tejedo-Romero 2017) Garciacutea-Tabuyo Saacuteez-Martiacuten and Caba-Peacuterez (2016) found a positive association with mandatory disclosure but surprisingly the relationship with voluntary reporting proved to be negative Although the argument may be somewhat shallow they explained this by saying that voluntary information disclosure could be larger in municipalities with higher internet penetration and political commitment because by increasing the transpar-ency levels politicians aim to attract the votes of inactive citizens
unemploymentIt has been argued that lower economic development and associated higher unem-ployment rates are damaging to civic engagement ie the demand for greater opportunities to participate in the decision-making is lessened Some studies used unemployment as a proxy for SNG economic status and found that higher eco-nomic status (lower unemployment) positively affects transparency in public administration (Piotrowski and van Ryzin 2007) In accordance with these under-pinnings the results largely indicate that higher unemployment rates are detri-mental to fiscal transparency (Caamantildeo-Alegre et al 2013 De Arauacutejo and Tejedo-Romero 2016 del Sol 2013 Tavares and da Cruz 2017)
mediaVarious authors have stressed the importance of public media visibility in a govern-mentrsquos divulging of information (Zimmerman 1977 Ingram 1984 Laswad Fisher and Oyelere 2005) It is argued that greater visibility and frequency of press report-ing on a governments activities and work contributes to resolving the principal-agent dilemma by reducing information asymmetries between citizens and author-
br
an
ko sta
nić
deter
min
an
ts of su
bn
ation
al b
ud
getfisc
al tr
an
spar
enc
y a rev
iew o
f empir
ica
l evid
enc
epu
blic sec
tor
eco
no
mic
s42 (4) 449-486 (2018)
466 ities However it should be noted that the media citizens and politicians often have different interests In this context public media may be more interested in publish-ing exclusive information such as corruption scandals This in turn affects the governments behavior for it will limit the disclosure of information so as to avoid them being ldquomisusedrdquo in the media (Laswad Fisher and Oyelere 2005 Garciacutea and Garciacutea-Garciacutea 2010 Cuadrado-Ballesteros et al 2017) Nevertheless studies have found that press and public media visibility as well as frequency of social media usage by SNGs have a positive impact on their fiscal transparency (Laswad Fisher and Oyelere 2005 Gandiacutea and Archidona 2008 Gandiacutea Marrahiacute and Huguet 2016 Gesuele Metallo and Longobardi 2017)
5 dIscussIon and conclusIonThis paper has provided a review of empirical studies on the determinants of sub-national governmentrsquos budgetfiscal transparency in the period 2000-2017 Sev-eral important observations should be emphasized First in order to determine the factors involved it is necessary to have a clear definition of budgetfiscal transpar-ency However there is no consensus about this Moreover different definitions are interwoven leading to budgetary and fiscal transparency being used inter-changeably The lack of a clear definition conduces to an inadequate measurement of budget transparency which can significantly affect the credibility of the results of such research Thus instead of having effective transparency this lack of clar-ity leads to opaque fuzzy or zombie transparency (Fox 2007 Michener 2015) where there is a lack of disaggregation or better descriptive details Without parameters as Michener (2015) stressed the quality and comparability of trans-parency is compromised Secondly different approaches to measuring budget transparency especially within the same country reduce the effective comparison potential and lead to ambiguity Thirdly heterogeneity of the definition and meas-urement of explanatory variables can lead to apparent contradiction and inconsist-ency of the obtained results
In this paper three basic categories that determine subnational government budgetfiscal transparency are established (1) financial (leverage and debt) (2) political (political competition executive features and governance type) and (3) citizens and the media (population internet access unemployment and the media) This conclusion is based on the review of 20 selected papers following the above-mentioned methodology Looking at the wider literature some of the findings can be related to findings at the national level where the main factors of fiscal trans-parency are political namely political (electoral) competition and the level of governmental democracy (Hollyer Rosendorff and Vreeland 2011 Wehner and de Renzio 2013) Although citizens and the media and financial factors deter-mine SNG fiscal transparency at the national level its effect seems negligible This may be due to the reduced participation opportunities and pressures of citi-zens on the national government or different structures and sources of funding of national and SNGs Moreover Wehner and de Renzio (2013) have concluded that external initiatives might not play a great role in strenghtening fiscal accountabil-
br
an
ko sta
nić
deter
min
an
ts of su
bn
ation
al b
ud
getfisc
al tr
an
spar
enc
y a rev
iew o
f empir
ica
l evid
enc
epu
blic sec
tor
eco
no
mic
s42 (4) 449-486 (2018)
467ity at the national level when the internal demand (citizens media) is weak How-ever when it comes to a wider literature on other types of public sector transpar-ency all findings are highly correlated (Bakar and Saleh 2015) including all three established categories
A vast majority of studies tend to focus on local governments thus neglecting other types of public sector organizations such as federal and state governments or quasi-government bodies Very few studies involved different countries in an investigation of subnational international comparisons In this sense the chal-lenge would be to create a harmonized budget transparency measure that could be applied to subnational governments of different countries Further such research could offer a more comprehensive insight into the factors implicated in budgetfiscal transparency including different country characteristics and contexts Fur-thermore greater consistency in selecting proxy measures for certain variables could contribute to a clearer interpretation of results while the greater time span of budget transparency data would allow for richer methodology solutions and observations
Like any other studies this study has a few limitations It does not take into account research before 2000 as the focus is rather on online disclosure Future studies may extend observation time Furthermore no meta-analytic studies were included However this paper can serve as the basis and motivation for imple-menting systematic reviews and meta-analyses on this topic In spite of these limitations it is believed that the study may provide rich insights for both inter-ested researchers and practitioners
disclosure statementThe author does not have any conflict of interest
br
an
ko sta
nić
deter
min
an
ts of su
bn
ation
al b
ud
getfisc
al tr
an
spar
enc
y a rev
iew o
f empir
ica
l evid
enc
epu
blic sec
tor
eco
no
mic
s42 (4) 449-486 (2018)
468
aPP
en
dIX
Ta
bl
e a
1 Bu
dget
fisc
al tr
ansp
aren
cy m
easu
rem
ents
aut
hor(
s)sa
mpl
ed
epen
dent
var
iabl
ety
pe o
f di
sclo
sure
met
hod
for
estim
atin
g de
term
inan
ts
mai
n re
sults
(d
eter
min
ants
)m
easu
rem
ent
tim
e
peri
odu
nite
d st
ates
Alt
et a
l (2
006)
50 S
tate
s
Bas
ed o
n A
lt L
asse
n an
d Sk
illin
g (2
002)
The
y m
easu
red
stat
e go
vern
men
t bud
get p
roce
dure
s by
send
ing
ques
tionn
aire
s to
the
budg
et o
ffice
rs o
f all
50 st
ates
on
nine
dic
hoto
mou
s ite
ms r
egar
ding
bu
dget
pro
cedu
re is
sues
bas
ed o
n th
e da
ta fr
om th
e N
atio
nal A
ssoc
iatio
n of
Sta
te B
udge
t Offi
cers
and
th
e N
atio
nal C
onfe
renc
e of
Sta
te L
egis
latu
res
1972
-99
Surv
ey
resp
onse
s
Pane
l dat
a re
gres
sion
an
alys
is
Polit
ical
com
petit
ion
Po
litic
al p
olar
izat
ion
Pa
rtisa
n co
mpo
sitio
n
of g
over
nmen
t D
ebt
Bud
get i
mba
lanc
e
Styl
es a
nd
Tenn
yson
(2
007)
300
mun
icip
aliti
es
They
use
d on
ly o
ne in
dica
tor ndash
a c
ompr
ehen
sive
an
nual
fina
ncia
l rep
ort (
CA
FR)
In a
dditi
on t
hey
deve
lope
d an
acc
essi
bilit
y in
dex
to m
easu
re th
e ea
se o
f CA
FR a
cces
s ie
how
man
y st
eps a
re
requ
ired
to lo
cate
the
repo
rt
na
Onl
ine
man
dato
ry
Logi
t Reg
ress
ion
Ana
lysi
s for
pro
-vi
sion
mod
el a
nd
OLS
Reg
ress
ion
Ana
lysi
s for
ac
cess
ibili
ty
mod
el
Popu
latio
n si
ze I
ncom
e pe
r cap
ita A
ccou
ntin
g di
sclo
sure
Ber
nick
et
al (
2014
)40
0 co
untie
s
Like
Sty
les a
nd T
enny
son
(200
7) t
hey
look
ed
at a
com
preh
ensi
ve a
nnua
l fina
ncia
l rep
ort (
CA
FR)
and
avai
labi
lity
and
com
preh
ensi
vene
ss o
f bud
get
info
rmat
ion
(no
exac
t doc
umen
t or i
nfor
mat
ion
is
indi
cate
d)
2014
Onl
ine
man
dato
ryO
rder
ed lo
git
anal
ysis
Cou
ntie
s with
app
oint
ed
coun
ty m
anag
er s
ize
of
coun
ty b
oard
cou
ntie
s re
quire
d to
subm
it an
au
dit t
o th
e fe
dera
l gov
-er
nmen
t Ec
onom
ic
stre
ss P
opul
atio
n ag
e
Dem
ocra
tic a
nd m
inor
-ity
resi
dent
s H
eter
o-ge
neity
of t
he c
ount
y
br
an
ko sta
nić
deter
min
an
ts of su
bn
ation
al b
ud
getfisc
al tr
an
spar
enc
y a rev
iew o
f empir
ica
l evid
enc
epu
blic sec
tor
eco
no
mic
s42 (4) 449-486 (2018)
469a
utho
r(s)
sam
ple
dep
ende
nt v
aria
ble
type
of
disc
losu
rem
etho
d fo
r es
timat
ing
dete
rmin
ants
mai
n re
sults
(d
eter
min
ants
)m
easu
rem
ent
tim
e
peri
od
Low
atch
arin
an
d M
eni-
field
(201
5)
816
coun
ties i
n tw
elw
e U
S M
idw
este
rn st
ates
Cat
egor
ical
dat
a ta
king
the
num
bers
from
0 to
4
with
rega
rd to
the
rele
ase
of th
e fo
llow
ing
10 it
ems
bu
dget
mee
tings
ele
cted
offi
cial
s ad
min
istra
tive
offic
ials
per
mits
and
zon
ing
aud
its c
ontra
cts
lobb
ying
pub
lic re
cord
s an
d lo
cal t
axes
2010
Onl
ine
proa
ctiv
e
Ord
ered
Log
istic
R
egre
ssio
n A
naly
sis
Gov
erna
nce
type
Po
pula
tion
dens
ity
Citi
zens
edu
catio
n
Tota
l lan
d ar
ea
Min
ority
pop
ulat
ion
(mos
t ext
ensi
ve m
odel
re
sults
)sp
ain
Gan
diacutea
and
Arc
hido
na
(200
8)
130
mun
icip
aliti
es
with
mor
e th
an 5
000
0 in
habi
tant
s
Web
dis
clos
ure
inde
x c
onsi
stin
g of
88
item
s gr
oupe
d in
to fi
ve se
ctio
ns g
ener
al in
form
atio
n
budg
et in
form
atio
n fi
nanc
ial i
nfor
mat
ion
na
viga
tion
and
pres
enta
tion
rela
tiona
l web
2006
Onl
ine
volu
ntar
y
Mul
tivar
iate
R
egre
ssio
n A
naly
sis
Polit
ical
com
petit
ion
Pu
blic
med
ia v
isib
ility
In
tern
et a
cces
s
Citi
zens
edu
catio
n
Serr
ano-
Cin
ca e
t al
(200
9)
92 lo
cal g
over
nmen
ts
incl
udin
g al
l pr
ovin
cial
cap
itals
and
al
l tow
n ha
lls w
ith
over
70
000
inha
bita
nts
Dep
ende
nt v
aria
ble
base
d on
web
ava
ilabi
lity
of
nine
doc
umen
ts i
ndiv
idua
l bud
get o
f the
cou
ncil
co
nsol
idat
ed b
udge
t of t
he c
ounc
il b
udge
t of
depe
nden
t ent
ities
bud
get d
isag
greg
ated
by
eco-
nom
ic f
unct
iona
l or o
rgan
ic c
lass
ifica
tion
bud
get
info
rmat
ion
rega
rdin
g in
vest
men
t bo
rrow
ing
or
reve
nue
and
expe
nditu
re i
ndiv
idua
l ann
ual
acco
unts
con
solid
ated
ann
ual a
ccou
nts
annu
al
acco
unts
of d
epen
dent
ent
ities
and
aud
it re
port
2006
Onl
ine
volu
ntar
y
Mul
tivar
iate
Lo
gist
ic
Reg
ress
ion
Popu
latio
n si
ze B
udge
t re
venu
es P
oliti
cal w
ill
(mea
sure
d by
cou
ncils
rsquo ex
perie
nce
with
e-
dem
ocra
cy)
Dis
posa
ble
fam
ily
inco
me
per i
nhab
itant
Cab
a-Peacute
rez
et a
l (2
008)
65 S
pani
sh c
ity
coun
cils
inc
ludi
ng
larg
e ci
ties
prov
inci
al
capi
tals
aut
onom
ous
regi
on c
apita
ls a
nd
mun
icip
aliti
es w
ith
cent
ral o
ffice
s of t
he
auto
nom
ous r
egio
nsrsquo
inst
itutio
ns
Dis
clos
ure
inde
x di
vide
d in
to th
ree
sect
ions
(1
) con
tent
of i
nfor
mat
ion
supp
lied
incl
udin
g bu
dget
and
fina
ncia
l inf
orm
atio
n (2
) cha
ract
eris
tics
of th
e in
form
atio
n di
sclo
sed
ie
com
plet
enes
s tim
elin
ess
com
para
bilit
y u
nder
stan
dabi
lity
re
leva
nce
and
relia
bilit
y a
nd (3
) nav
igab
ility
de
sign
and
acc
essi
bilit
y of
pub
lic fi
nanc
ial
info
rmat
ion
on th
e w
eb si
te
2007
Onl
ine
volu
ntar
y
Mul
tivar
iabl
e Li
near
R
egre
ssio
n
Cos
t of d
ebt
Inte
rnet
ac
cess
br
an
ko sta
nić
deter
min
an
ts of su
bn
ation
al b
ud
getfisc
al tr
an
spar
enc
y a rev
iew o
f empir
ica
l evid
enc
epu
blic sec
tor
eco
no
mic
s42 (4) 449-486 (2018)
470
aut
hor(
s)sa
mpl
ed
epen
dent
var
iabl
ety
pe o
f di
sclo
sure
met
hod
for
estim
atin
g de
term
inan
ts
mai
n re
sults
(d
eter
min
ants
)m
easu
rem
ent
tim
e
peri
od
Gui
llam
oacuten
et a
l (2
011)
100
larg
est S
pani
sh
mun
icip
aliti
es
The
finan
cial
tran
spar
ency
inde
x ba
sed
on th
e da
ta
of T
rans
pare
ncy
Inte
rnat
iona
l (TI
) Spa
in 2
008
and
partl
y fr
om th
e qu
estio
nnai
re c
reat
ed b
y th
e au
thor
s Th
ey o
bser
ved
thre
e di
men
sion
s
acco
untin
g an
d bu
dget
mun
icip
al re
venu
es a
nd
expe
nditu
res
and
mun
icip
al d
ebt
2008
Proa
ctiv
e
prin
t and
on
line
OLS
and
2SL
S re
gres
sion
s
Mun
icip
al w
ealth
In
terg
over
nmen
tal
trans
fers
Pol
itica
l id
eolo
gy P
opul
atio
n si
ze
del S
ol
(201
3)
110
loca
l gov
ernm
ents
th
at p
artic
ipat
ed in
20
10 T
I Spa
in su
rvey
TI S
pain
dis
clos
ure
inde
x in
clud
ing
five
trans
pare
ncy
area
s fi
scal
(acc
ount
ing
and
budg
et
info
rmat
ion
info
rmat
ion
on re
venu
es a
nd
expe
nditu
res
info
rmat
ion
on d
ebt)
cor
pora
te
soci
al p
rocu
rem
ent a
nd c
ontra
ctin
g
2010
Onl
ine
volu
ntar
y
OLS
and
ce
nsor
ed
regr
essi
on
mod
els
Popu
latio
n si
ze
Polit
ical
ideo
logy
G
over
nanc
e ty
pe
(pro
vinc
ial c
apita
l)
Tour
ist a
ctiv
ity
Polit
ical
ideo
logy
De A
rauacutej
o an
d Te
jedo
-R
omer
o (2
016)
109
mun
icip
aliti
es
TI S
pain
dis
clos
ure
inde
x in
clud
ing
80 in
dica
tors
gr
oupe
d in
to si
x tra
nspa
renc
y ar
eas
Five
are
as
used
alre
ady
by A
lbal
ate
(201
3) a
nd a
dditi
onal
ca
tego
ry o
n ur
ban
deve
lopm
entp
ublic
wor
ks
trans
pare
ncy
2012
Onl
ine
volu
ntar
y
OLS
and
IV
2SL
S re
gres
sion
an
alys
is
Vote
r tur
nout
Pol
itica
l id
eolo
gy P
oliti
cal
com
petit
ion
Este
ller-
Mor
eacute an
d Po
lo O
tero
(2
012)
691
Cat
alan
m
unic
ipal
ities
A d
icho
tom
ous v
aria
ble
mea
surin
g bu
dget
fisc
al
trans
pare
ncy
by lo
okin
g at
the
nine
bud
get
info
rmat
ion
bud
get a
ppro
val
final
bud
get
budg
et
bala
nce
clo
sed
settl
emen
t bud
gets
tre
asur
y st
atem
ent
treas
ury
surp
lus
net w
ealth
stat
emen
t in
com
e st
atem
ent a
nd in
debt
edne
ss T
hese
in
form
atio
ns a
re p
art o
f ann
ual a
ccou
nts t
hat
Cat
alan
loca
l gov
ernm
ents
hav
e to
del
iver
to th
e Pu
blic
Aud
it O
ffice
for C
atal
onia
2001
-200
7M
anda
tory
Logi
t reg
ress
ion
anal
ysis
Polit
ical
com
petit
ion
Po
pula
tion
size
(m
easu
ring
the
degr
ee
of d
ecen
traliz
atio
n)
br
an
ko sta
nić
deter
min
an
ts of su
bn
ation
al b
ud
getfisc
al tr
an
spar
enc
y a rev
iew o
f empir
ica
l evid
enc
epu
blic sec
tor
eco
no
mic
s42 (4) 449-486 (2018)
471a
utho
r(s)
sam
ple
dep
ende
nt v
aria
ble
type
of
disc
losu
rem
etho
d fo
r es
timat
ing
dete
rmin
ants
mai
n re
sults
(d
eter
min
ants
)m
easu
rem
ent
tim
e
peri
od
Caa
mantilde
o-A
legr
e et
al
(201
3)
33 G
alic
ian
mun
icip
aliti
es
Bud
get t
rans
pare
ncy
inde
x co
ntai
ning
info
rmat
ion
on th
e op
en b
udge
t pro
cess
pub
lic a
vaila
bilit
y of
in
form
atio
n an
d as
sura
nce
of in
tegr
ity
Que
stio
nnai
res a
re se
nt to
gov
ernm
ent o
ffici
als b
y us
ing
a Li
kert-
type
surv
ey q
uest
ionn
aire
bas
ed o
n th
e IM
Frsquos r
evis
ed C
ode
of G
ood
Prac
tices
on
Fisc
al
Tran
spar
ency
na
Proa
ctiv
eO
LS re
gres
sion
an
alyi
s
Deb
t per
cap
ita B
udge
t (im
)bal
ance
Rat
io o
f m
unic
ipal
pub
lic
expe
nditu
re to
GD
P
Polit
ical
com
petit
ion
Po
litic
al id
eolo
gy
Coa
litio
n in
cum
bent
Vo
ter t
urno
ut
Une
mpl
oym
ent r
ate
Gan
diacutea
et
al (
2016
)
145
Span
ish
loca
l go
vern
men
ts w
ith
mor
e th
an 5
000
0 in
habi
tant
s
Web
20
dis
clos
ure
inde
x c
onsi
sted
of
(1) a
n or
nam
enta
l dis
clos
ure
inde
x w
hich
con
tain
s ge
nera
l and
citi
zen
info
rmat
ion
(2) i
nfor
mat
ion
disc
losu
re in
dex
incl
udin
g th
e in
form
atio
n on
pu
blic
pro
cure
men
t ad
min
istra
tive
agre
emen
ts
gove
rnm
ent s
ubsi
dies
and
aid
sta
ff a
nd b
udge
t an
d fin
anci
al in
form
atio
n (3
) rel
atio
nal d
iscl
osur
e in
dex
whi
ch re
pres
ents
the
pres
enta
tion
na
viga
bilit
y an
d in
tera
ctio
n ab
ilitie
s of t
he w
eb
na
Onl
ine
volu
ntar
y
Mul
tivar
iate
re
gres
sion
an
alys
is
Leve
rage
Mun
icip
al
wea
lth P
oliti
cal
com
petit
ion
Pol
itica
l id
eolo
gy C
itize
ns
educ
atio
n S
ocia
l med
ia
use
Pre
ss v
isib
ility
In
tern
et v
isib
ility
De A
rauj
o an
d Te
jedo
-R
omer
o (2
017)
100
larg
est S
pani
sh
mun
icip
aliti
esTI
Spa
in d
iscl
osur
e in
dex
2008
-201
0
2012
201
4O
nlin
e vo
lunt
ary
Bal
ance
d pa
nel
data
regr
essi
on
anal
ysis
May
ors
gend
er
Wom
anrsquos
repr
esen
tatio
n in
mun
icip
al c
ounc
il
br
an
ko sta
nić
deter
min
an
ts of su
bn
ation
al b
ud
getfisc
al tr
an
spar
enc
y a rev
iew o
f empir
ica
l evid
enc
epu
blic sec
tor
eco
no
mic
s42 (4) 449-486 (2018)
472
aut
hor(
s)sa
mpl
ed
epen
dent
var
iabl
ety
pe o
f di
sclo
sure
met
hod
for
estim
atin
g de
term
inan
ts
mai
n re
sults
(d
eter
min
ants
)m
easu
rem
ent
tim
e
peri
odo
ther
cou
ntri
es
Lasw
ad e
t al
(20
05)
86 lo
cal g
over
nmen
ts
in N
ew Z
eala
nd
A d
icho
tom
ous v
aria
ble
indi
catin
g w
heth
er o
r not
th
e lo
cal a
utho
rity
publ
ishe
s fina
ncia
l inf
orm
atio
n on
the
web
It i
s con
side
red
that
loca
l aut
horit
y de
liver
s inf
orm
atio
n if
at le
ast o
ne o
f fou
r do
cum
ents
that
repr
esen
t vol
unta
ry in
tern
et
finan
cial
repo
rting
was
pub
lishe
d F
our d
ocum
ents
ar
e fi
nanc
ial h
ighl
ight
s an
nual
repo
rts a
nnua
l pl
an a
nd c
ombi
natio
ns o
f ann
ual r
epor
ts p
lans
an
d fin
anci
al h
ighl
ight
s
na
Onl
ine
volu
ntar
yM
ultiv
aria
te
logi
t reg
ress
ion
Leve
rage
Mun
icip
al
wea
lth P
ress
vis
ibili
ty
Type
of c
ounc
il
Gar
ciacutea-
Tabu
yo e
t al
(20
16)
40 la
rges
t m
unic
ipal
ities
in e
ach
of th
e fiv
e C
entra
l A
mer
ica
coun
tries
ndash
El S
alva
dor
Nic
arag
ua P
anam
a
Gua
tem
ala
and
Hon
dura
s
Inde
x of
man
dato
ry a
nd in
dex
of v
olun
tary
di
sclo
sure
bas
ed o
n 94
item
s gro
uped
into
four
tra
nspa
renc
y ca
tego
ries
mun
icip
al g
over
nmen
t re
latio
ns w
ith c
itize
ns a
nd so
ciet
y e
cono
mic
-fin
anci
al tr
ansp
aren
cy a
nd se
rvic
e-pr
ocur
emen
t tra
nspa
renc
y T
he ra
tio o
f vol
unta
ry a
nd le
gal
item
s diff
ers d
epen
ding
on
the
obse
rved
cou
ntry
Salv
ador
(2
010)
G
uate
mal
a (2
008)
H
ondu
ras
(200
6)
Nic
arag
ua
(200
7)
Pana
ma
(200
2)
Onl
ine
proa
ctiv
eTo
bit R
egre
ssio
n A
naly
sis
The
mat
urity
of t
he F
OI
law
(man
dato
ry
disc
losu
re)
Inte
rnet
ac
cess
Vot
er tu
rnou
t (v
olun
tary
dis
clos
ure)
Zucc
olot
to
and
Teix
eira
(2
014)
26 B
razi
lian
stat
es
Stat
e tra
nspa
renc
y in
dex
deve
lope
d by
Bid
erm
an
and
Potto
mat
ti (2
010)
con
sist
ing
of th
ree
para
met
ers
con
tent
tim
e se
ries a
nd u
pdat
e fr
eque
ncy
and
usa
bilit
y
2010
Onl
ine
proa
ctiv
e
Mul
tiple
line
ar
regr
essi
on
anal
ysis
Soci
oeco
nom
ic fa
ctor
s
educ
atio
n e
mpl
oym
ent
and
inco
me
and
hea
lth
indi
cato
rs F
isca
l fa
ctor
s
br
an
ko sta
nić
deter
min
an
ts of su
bn
ation
al b
ud
getfisc
al tr
an
spar
enc
y a rev
iew o
f empir
ica
l evid
enc
epu
blic sec
tor
eco
no
mic
s42 (4) 449-486 (2018)
473a
utho
r(s)
sam
ple
dep
ende
nt v
aria
ble
type
of
disc
losu
rem
etho
d fo
r es
timat
ing
dete
rmin
ants
mai
n re
sults
(d
eter
min
ants
)m
easu
rem
ent
tim
e
peri
od
Ma
and
Wu
(201
1)31
Chi
nese
pro
vinc
es
Dis
clos
ure
inde
x ba
sed
on re
spos
iven
ess a
nd
info
rmat
ion
com
plet
enes
s as t
wo
basi
c di
men
sion
s It
is m
easu
red
by g
over
nmen
ts r
espo
nses
to 1
13
open
fisc
al in
form
atio
n re
ques
ts o
f citi
zens
in
clud
ing
66 it
ems f
or g
over
nmen
t acc
ount
s 30
ite
ms f
or so
cial
secu
rity
acco
unts
and
17
item
s for
st
ate
owne
d en
terp
rises
acc
ount
s
2008
-200
9R
eact
ive
Seem
ingl
y U
nrel
ated
R
egre
ssio
ns
(SU
R) m
odel
w
ith ra
ndom
ef
fect
s
Econ
omic
ope
nnes
s
Mar
ketiz
atio
n B
udge
t (im
)bal
ance
In
cum
bent
s te
nure
Ges
uele
et
al (
2017
)
287
mun
icip
aliti
es
142
Italia
n an
d 14
5 Sp
anis
h m
unic
ipal
ities
Two
inde
xes
(a) e
-dis
clos
ure
web
site
inde
x w
hich
m
easu
res i
nter
actio
n le
vel a
mon
g ci
tizen
s and
m
unic
ipal
ities
usi
ng o
ffici
al o
r man
dato
ry
disc
losu
re c
hann
el b
y lo
okin
g fo
r the
13
item
s in
clud
ing
the
publ
icat
ion
of fi
nanc
ial s
tate
men
ts
from
the
mun
icip
ality
and
from
the
cont
rolle
d co
mpa
ny a
nd m
unic
ipal
ities
ass
ets a
nd re
venu
es
(b) s
ocia
l med
ia u
sage
inde
x w
hich
mea
sure
s the
vo
lunt
ary
disc
losu
re v
ia so
cial
med
ia su
ch a
s Fa
cebo
ok a
nd T
witt
er
2013
Onl
ine
proa
ctiv
e
Tobi
t reg
ress
ion
(ste
pwis
e ap
proa
ch)
Leve
rage
Int
erne
t vi
sibi
lity
Citi
zens
w
ealth
(mea
sure
d by
ec
onom
ic a
ctiv
ity p
er
capi
ta)
Tava
res a
nd
da C
ruz
(201
7)
278
Portu
gues
e m
unic
ipal
ities
TI P
ortu
gal d
iscl
osur
e in
dex
con
sist
ing
of 7
6 in
dica
tors
gro
uped
into
the
seve
n di
men
sion
s
(1) O
rgan
izat
iona
l inf
orm
atio
n so
cial
com
posi
tion
and
oper
atio
n of
the
mun
icip
ality
(2)
Pla
ns a
nd
plan
ning
(3)
Loc
al ta
xes
rate
s se
rvic
e ch
arge
s an
d re
gula
tions
(4)
Rel
atio
nshi
p w
ith c
itize
ns
(5) P
ublic
pro
cure
men
t (6
) Eco
nom
ic a
nd fi
nanc
ial
trans
pare
ncy
and
(7) U
rban
pla
nnin
g an
d la
nd
use
man
agem
ent
2013
Onl
ine
proa
ctiv
eO
LS re
gres
sion
s
Fina
ncia
l aut
onom
y
May
ors
gend
er T
enur
e
Polit
ical
com
petit
ion
U
nem
ploy
men
t rat
e
Popu
latio
n ag
e
Sour
ce A
utho
r
br
an
ko sta
nić
deter
min
an
ts of su
bn
ation
al b
ud
getfisc
al tr
an
spar
enc
y a rev
iew o
f empir
ica
l evid
enc
epu
blic sec
tor
eco
no
mic
s42 (4) 449-486 (2018)
474
Ta
bl
e a
2Fi
nanc
ial v
aria
bles
Vari
able
na
me
Vari
able
m
easu
rem
ent
cor
rela
tion
of d
eter
min
ants
Posi
tive
neg
ativ
eN
on-s
igni
fican
tM
unic
ipal
si
zeAv
erag
e to
tal a
sset
s a
vera
ge to
tal r
even
ues
ndashndash
Lasw
ad e
t al
200
5B
udge
t rev
enue
sSe
rran
o-C
inca
et a
l 2
009
ndashndash
Leve
rage
Rat
io o
f lon
g-te
rm li
abili
ties t
o to
tal a
sset
s ra
tio
of lo
ng-te
rm li
abili
ties t
o to
tal p
ublic
equ
ityLa
swad
et a
l 2
005
ndashndash
Tota
l exe
cute
d ex
pens
es p
er c
apita
Gan
diacutea
et a
l 2
016
ndashG
andiacute
a an
d A
rchi
dona
200
8
The
leve
l of l
ever
age
(not
spec
ified
)G
esue
le e
t al
201
7ndash
ndash
Gov
ern-
men
trsquos
wea
lth
Mun
icip
ality
rsquos o
wn
reve
nue
per c
apita
Gan
diacutea
et a
l 2
016
La
swad
et a
l 2
005
ndashG
andiacute
a an
d A
rchi
dona
200
8
Bud
get r
even
ue p
er c
apita
ndashndash
Ma
and
Wu
201
1Ta
x re
venu
es p
er c
apita
Gui
llam
oacuten e
t al
201
1ndash
Caa
mantilde
o-A
legr
e et
al
201
3
GD
P pe
r cap
itandash
ndashM
a an
d W
u 2
011
(pos
itive
for c
ompl
eten
ess
but i
nsig
nific
ant f
or p
rovi
sion
of i
nfor
mat
ion)
Dic
hoto
mou
s var
iabl
e (1
if th
e ci
ty h
all h
as
mun
icip
al b
onds
in c
ircul
atio
n)ndash
ndashSe
rran
o-C
inca
et a
l 2
009
Deb
t
Perc
enta
ge o
f deb
t in
tota
l bud
get
ndashndash
del S
ol 2
013
Publ
ic d
ebt p
er c
apita
Caa
mantilde
o-A
legr
e et
al
201
3
De A
rauacutej
o an
d Te
jedo
-R
omer
o 2
017
Sty
les a
nd
Tenn
yson
200
7
Alt
et a
l
2006
De A
rauacutej
o an
d Te
jedo
-Rom
ero
201
6
Gui
llam
oacuten e
t al
201
1
Fund
ing
cost
s of t
he c
urre
nt y
ear b
udge
t exp
endi
ture
pe
r cap
itaC
aba-
Peacutere
z et
al
200
8ndash
ndash
Inte
rgov
ern-
men
tal
trans
fers
Rat
io o
f tot
al tr
ansf
ers t
o th
e to
tal a
mou
nt o
f non
-fin
anci
al re
venu
es T
hey
have
als
o ob
serv
ed c
urre
nt
and
capi
tal t
rans
fers
sepa
rate
lyndash
ndashEs
telle
r-Mor
eacute an
d Po
lo O
tero
201
2
Reg
iona
l and
cen
tral t
rans
fers
per
cap
itaG
uilla
moacuten
et a
l 2
011
ndashndash
Tota
l cur
rent
and
cap
ital t
rans
fers
ndash
ndashC
aba-
Peacutere
z et
al
200
8
br
an
ko sta
nić
deter
min
an
ts of su
bn
ation
al b
ud
getfisc
al tr
an
spar
enc
y a rev
iew o
f empir
ica
l evid
enc
epu
blic sec
tor
eco
no
mic
s42 (4) 449-486 (2018)
475Va
riab
le
nam
eVa
riab
le
mea
sure
men
tc
orre
latio
n of
det
erm
inan
tsPo
sitiv
en
egat
ive
Non
-sig
nific
ant
Bud
get
im(b
alan
ce)
Fisc
al im
bala
nce
ie
hig
her s
urpl
uses
and
defi
cits
Alt
et a
l 2
006
ndashndash
Bud
get b
alan
ce p
er c
apita
(low
erin
g de
ficit)
Caa
mantilde
o-A
legr
e et
al
201
3ndash
ndashB
udge
t defi
cit
natu
ral l
ogar
ithm
Ma
and
Wu
201
1ndash
ndash
Defi
cit p
er c
apita
ndashndash
Este
ller-M
oreacute
and
Polo
Ote
ro 2
012
G
uilla
moacuten
et a
l 2
011
Defi
cit o
r sur
plus
as a
per
cent
age
of to
tal b
udge
tndash
ndashde
l Sol
201
3
Oth
er
finan
cial
va
riabl
es
Inve
stm
ent p
c ta
x bu
rden
pc
ratio
of t
he ta
x re
venu
es
to o
pera
ting
reve
nues
rat
io o
f fina
ncia
l to
tota
l ex
pens
es r
atio
of o
pera
ting
to to
tal e
xpen
ses
ndashndash
Serr
ano-
Cin
ca e
t al
200
9
Cap
ital i
nves
tmen
t per
cap
itaD
e Ara
uacutejo
and
Teje
do-
Rom
ero
201
6ndash
ndash
Fisc
al p
ress
ure
mea
sure
d by
per
cap
ita ta
x an
d no
n-ta
x re
venu
e a
nd th
e sa
le o
f goo
ds a
nd se
rvic
es o
f the
pu
blic
adm
inis
tratio
nsndash
ndashC
aba-
Peacutere
z et
al
200
8
Fisc
al p
ress
ure
mea
sure
d by
tota
l dire
ct a
nd in
dire
ct
taxe
s per
cap
itaD
e Ara
uacutejo
and
Teje
do-
Rom
ero
201
7ndash
ndash
Inde
x of
fina
ncia
l aut
onom
y (d
eriv
ed fr
om ta
xes
and
fees
)
Ges
uele
et a
l 2
017
(sig
nific
ant i
n on
e of
thre
e m
odel
s)ndash
ndash
Fina
ncia
l pos
ition
mea
sure
d by
the
ratio
of p
rimar
y go
vern
men
trsquos u
nres
trict
ed n
et a
sset
s to
tota
l exp
ense
sSt
yles
and
Ten
nyso
n 2
007
ndashndash
Fina
ncia
l aut
onom
y (p
ropo
rtion
of l
ocal
taxe
s fe
es a
nd
othe
r cha
rges
)Ta
vare
s and
da
Cru
z 2
017
ndashndash
Rat
io o
f mun
icip
al p
ublic
exp
endi
ture
to G
DP
Caa
mantilde
o-A
legr
e et
al
201
3 ndash
ndashM
unic
ipal
ities
with
a c
ertifi
cate
of a
chie
vem
ent f
or
exce
llenc
e in
acc
ount
ing
repo
rting
Styl
es a
nd T
enny
son
200
7ndash
ndash
Sour
ce A
utho
r
br
an
ko sta
nić
deter
min
an
ts of su
bn
ation
al b
ud
getfisc
al tr
an
spar
enc
y a rev
iew o
f empir
ica
l evid
enc
epu
blic sec
tor
eco
no
mic
s42 (4) 449-486 (2018)
476
Ta
bl
e a
3 Po
litic
al v
aria
bles
Vari
able
na
me
Vari
able
m
easu
rem
ent
cor
rela
tion
of d
eter
min
ants
Posi
tive
neg
ativ
eN
on-s
igni
fican
t
Polit
ical
co
mpe
titio
n
(a) D
ivid
ed g
over
nmen
t ndash d
icho
tom
ous v
aria
ble
taki
ng th
e va
lue
1 if
diffe
rent
par
ties c
ontro
l the
ex
ecut
ive
and
legi
slat
ure
0 o
ther
wis
e
(b) G
uber
nato
rial c
ompe
titio
n m
easu
red
by th
e sh
are
of D
emoc
ratic
vot
es in
the
gube
rnat
oria
l ele
ctio
n
capt
urin
g ab
solu
te d
evia
tians
from
one
hal
f (c
) Leg
isla
tive
com
petit
ion
ndash D
emoc
ratic
seat
shar
es
in th
e up
per a
nd lo
wer
hou
ses
ndashA
lt et
al
200
6ndash
Rat
io o
f can
dida
tes t
o co
unci
l pos
ition
s ava
ilabl
endash
ndashLa
swad
et a
l 2
005
Num
ber o
f pol
itica
l par
ties i
n th
e ci
ty c
ounc
ilndash
ndashG
andiacute
a an
d A
rchi
dona
200
8D
icho
tom
ic v
aria
ble
1 if
city
cou
ncil
is g
over
ned
by
one
of t
he m
ajor
ity p
oliti
cal p
artie
s in
the
coun
tryG
andiacute
a an
d A
rchi
dona
200
8G
andiacute
a et
al
201
6ndash
Rat
io o
f can
dida
tes t
o co
unci
llors
ele
cted
ndashndash
Serr
ano-
Cin
ca e
t al
200
9R
atio
of c
ounc
illor
s ele
cted
for t
he p
arty
in p
ower
to
the
tota
l num
ber o
f ele
cted
cou
ncill
ors
ndashndash
Cab
a-Peacute
rez
et a
l 2
008
Mea
sure
of d
ispe
rsio
n i
e th
e st
anda
rd d
evia
tion
of
the
perc
enta
ge o
f vot
es re
ceiv
ed b
y ea
ch p
oliti
cal
party
(the
gre
ater
the
disp
ersi
on o
f vot
es a
mon
g po
litic
al p
artie
s th
e sm
alle
r the
ele
ctor
al c
ompe
titio
n)
Este
ller-M
oreacute
and
Polo
O
tero
201
2 (n
on-s
igni
fican
t fo
r big
mun
icip
aliti
es)
ndashC
aba-
Peacutere
z et
al
200
8
Effe
ctiv
e nu
mbe
r of p
oliti
cal p
artie
s ac
cord
ing
to
Laak
so a
nd T
aaga
pera
rsquos (1
979)
cal
cula
tion
Caa
mantilde
o-A
legr
e et
al
201
3ndash
ndash
Mar
gin
of v
icto
ry m
easu
red
by th
e di
ffere
nce
betw
een
the
perc
enta
ge o
f vot
es o
btai
ned
by th
e pa
rties
com
ing
in fi
rst a
nd se
cond
pla
ce T
he lo
wer
th
e di
ffere
nce
the
high
er th
e el
ecto
ral c
ompe
titio
n
Tava
res a
nd d
a C
ruz
201
7D
e Ara
uacutejo
and
Teje
do-R
omer
o
2016
De A
rauacutej
o an
d Te
jedo
-Rom
ero
20
17
br
an
ko sta
nić
deter
min
an
ts of su
bn
ation
al b
ud
getfisc
al tr
an
spar
enc
y a rev
iew o
f empir
ica
l evid
enc
epu
blic sec
tor
eco
no
mic
s42 (4) 449-486 (2018)
477Va
riab
le
nam
eVa
riab
le
mea
sure
men
tc
orre
latio
n of
det
erm
inan
tsPo
sitiv
en
egat
ive
Non
-sig
nific
ant
Polit
ical
id
eolo
gy
Polit
ical
orie
ntat
ion
of th
e m
unic
ipal
maj
ority
an
dor
may
orndash
ndash
Este
ller-M
oreacute
and
Polo
Ote
ro 2
012
G
arciacute
a-Ta
buyo
et a
l 2
016
Ges
uele
et
al
201
7 S
erra
no-C
inca
et a
l
2009
Tav
ares
and
da
Cru
z 2
017
1 if
left-
win
g m
unic
ipal
maj
ority
Gan
diacutea
et a
l 2
016
G
uilla
moacuten
et a
l 2
011
ndashndash
1 if
left
incu
mbe
ntC
aam
antildeo-
Ale
gre
et a
l
2013
del
Sol
201
3
De A
rauacutej
o an
d Te
jedo
-Rom
ero
20
16 2
017
ndash
Exec
utiv
e
May
orrsquos
gen
der (
1 if
fem
ale)
De A
rauacutej
o an
d Te
jedo
-R
omer
o 2
017
Tav
ares
an
d da
Cru
z 2
017
Ges
uele
et a
l 2
017
(sig
nific
ant i
n on
e of
th
ree
mod
els)
De A
rauacutej
o an
d Te
jedo
-Rom
ero
20
16 G
uilla
moacuten
et a
l 2
011
1 in
the
case
of c
oalit
ion
incu
mbe
nts
ndashC
aam
antildeo-
Ale
gre
et a
l 2
013
ndash
May
orrsquos
age
and
edu
catio
nndash
ndashTa
vare
s and
da
Cru
z 2
017
Num
ber o
f inc
umbe
ntrsquos
con
secu
tive
term
sM
a an
d W
u 2
011
Tava
res a
nd d
a C
ruz
20
17ndash
Gov
erna
nce
type
1 di
stric
t cou
ncils
0 re
gion
al o
r city
cou
ncils
ndashLa
swad
et a
l 2
005
ndash1
prov
inci
al c
apita
ls
ndashde
l Sol
201
3ndash
Form
of g
over
nmen
t (1
coun
cil-m
anag
er 0
co
mm
issi
on a
nd c
ounc
il-el
ecte
d ex
ecut
ive)
Low
atch
arin
and
Men
ifiel
d
2015
ndashndash
1 ci
ty-m
anag
er g
over
nanc
e st
ruct
ure
ndashndash
Styl
es a
nd T
enny
son
200
7
Vote
r tu
rnou
tPe
rcen
tage
of c
itize
n pa
rtici
patio
n in
loca
l ele
ctio
ns
Caa
mantilde
o-A
legr
e et
al
20
13 D
e Ara
uacutejo
and
Te
jedo
-Rom
ero
201
7 (s
impl
ified
mod
el)
Gar
ciacutea-
Tabu
yo e
t al
20
16 (v
olun
tary
di
sclo
sure
) D
e A
rauacutej
o an
d Te
jedo
-R
omer
o 2
016
De
Ara
uacutejo
and
Teje
do-
Rom
ero
201
7 (e
xten
sive
mod
els)
Gar
ciacutea-
Tabu
yo e
t al
201
6 (m
anda
tory
dis
clos
ure)
del
Sol
20
13 G
uilla
moacuten
et a
l 2
011
Se
rran
o-C
inca
et a
l 2
009
Ta
vare
s and
da
Cru
z 2
017
br
an
ko sta
nić
deter
min
an
ts of su
bn
ation
al b
ud
getfisc
al tr
an
spar
enc
y a rev
iew o
f empir
ica
l evid
enc
epu
blic sec
tor
eco
no
mic
s42 (4) 449-486 (2018)
478
Vari
able
na
me
Vari
able
m
easu
rem
ent
cor
rela
tion
of d
eter
min
ants
Posi
tive
neg
ativ
eN
on-s
igni
fican
t
Vote
r tu
rnou
tVo
ter a
bste
ntio
n re
pres
entin
g th
e pe
rcen
tage
of
popu
latio
n w
ho d
id n
ot v
ote
ndashEs
telle
r-Mor
eacute an
d Po
lo O
tero
201
2
(big
mun
icip
aliti
es)
Este
ller-M
oreacute
and
Polo
Ote
ro 2
012
(who
le sa
mpl
e an
d sm
all
mun
icip
aliti
es)
E-go
vern
-m
ent
achi
eve-
men
ts
Num
ber o
f e-d
emoc
racy
act
ions
impl
emen
ted
Serr
ano-
Cin
ca e
t al
200
9ndash
ndashE-
gove
rnm
ent d
evel
opm
ent
mea
sure
d by
the
scor
e in
op
en in
form
atio
n o
nlin
e bu
sine
ss u
ser s
atis
fact
ion
pr
oper
ties a
nd d
esig
n a
nd d
aily
ope
ratio
nndash
ndashndash
Inst
itutio
nal c
apac
ity v
aria
ble
mea
sure
d by
Ope
n G
over
nmen
t Inf
orm
atio
n (O
GI)
ndash
ndashM
a an
d W
u 2
011
(pos
itive
for
fisca
l com
plet
enes
s)M
unic
ipal
IT c
apac
ity m
easu
red
by th
e nu
mbe
r of I
T em
ploy
ees
ndashndash
Tava
res a
nd d
a C
ruz
201
7
Oth
er
polit
ical
va
riabl
es
Cou
ntie
s with
app
oint
ed c
ount
y m
anag
ers
size
of
coun
ty b
oard
cou
ntie
s req
uire
d to
subm
it an
aud
it to
th
e fe
dera
l gov
ernm
ent
Ber
nick
et a
l 2
014
ndashndash
Polit
ical
pol
ariz
atio
n (f
or m
easu
rem
ent s
ee H
anss
en
2004
)A
lt et
al
200
6ndash
ndash
Two-
party
and
mul
ti-pa
rty c
oalit
ion
in th
e ci
ty
coun
cil
ndashndash
Serr
ano-
Cin
ca e
t al
200
9
Wom
anrsquos
repr
esen
tatio
n in
mun
icip
al c
ounc
il
mea
sure
d as
a p
erce
ntag
e of
fem
ale
mem
bers
in
mun
icip
al c
ounc
il
De A
rauacutej
o an
d Te
jedo
-R
omer
o 2
017
ndashndash
1 if
incu
mbe
ntrsquos
par
ty d
oes n
ot h
old
a m
ajor
ity
of se
ats i
n th
e co
unci
lndash
ndashTa
vare
s and
da
Cru
z 2
017
The
mat
urity
of t
he F
OI l
aw i
e h
ow lo
ng h
as it
bee
n in
forc
e n
umbe
r of s
anct
ions
stip
ulat
ed in
the
FOI l
awndash
Gar
ciacutea-
Tabu
yo e
t al
20
16 (m
anda
tory
di
sclo
sure
)ndash
Sour
ce A
utho
r
br
an
ko sta
nić
deter
min
an
ts of su
bn
ation
al b
ud
getfisc
al tr
an
spar
enc
y a rev
iew o
f empir
ica
l evid
enc
epu
blic sec
tor
eco
no
mic
s42 (4) 449-486 (2018)
479T
ab
le a
4 C
itize
ns a
nd th
e m
edia
Vari
able
na
me
Vari
able
m
easu
rem
ent
cor
rela
tion
of d
eter
min
ants
Posi
tive
neg
ativ
eN
on-s
igni
fican
t
Popu
latio
nN
umbe
r of i
nhab
itant
s
De A
rauacutej
o an
d Te
jedo
-Rom
ero
20
16 d
el S
ol 2
013
Gui
llam
oacuten
et a
l 2
011
Ser
rano
-Cin
ca e
t al
20
09 S
tyle
s and
Ten
nyso
n 2
007
Este
ller-M
oreacute
and
Polo
O
tero
201
2 (n
on-li
near
re
latio
nshi
p)
Caa
mantilde
o-A
legr
e et
al
201
3
Cab
a-Peacute
rez
et a
l 2
008
Gan
diacutea
and
Arc
hido
na 2
008
Gar
ciacutea-
Tabu
yo e
t al
20
16 T
avar
es a
nd d
a C
ruz
201
7Po
pula
tion
dens
ity m
easu
red
in p
erso
ns
per s
quar
e m
ileLo
wat
char
in a
nd M
enifi
eld
201
5ndash
ndash
Inte
rnet
ac
cess
Perc
enta
ge o
f hou
seho
lds w
ith h
ome
inte
rnet
acc
ess
Gan
diacutea
and
Arc
hido
na 2
008
(bud
get d
iscl
osur
e) C
aba-
Peacutere
z et
al
200
8 D
e Ara
uacutejo
and
Teje
do-R
omer
o 2
017
ndashG
andiacute
a an
d A
rchi
dona
200
8
(fina
ncia
l dis
clos
ure)
Fixe
d in
tern
et a
cces
s con
nect
ions
ove
r 200
ki
lobi
ts p
er se
cond
in a
t lea
st o
ne d
irect
ion
per 1
000
hou
seho
lds
Low
atch
arin
and
Men
ifiel
d 2
015
(sim
ples
t mod
el)
ndashLo
wat
char
in a
nd M
enifi
eld
201
5
(mos
t ext
ensi
ve m
odel
s)
Inte
rnet
pen
etra
tion
as a
mea
sure
for t
he
deve
lopm
ent o
f IC
T in
fras
truct
ure
Gar
ciacutea-
Tabu
yo e
t al
201
6 (m
anda
tory
dis
clos
ure)
Gar
ciacutea-
Tabu
yo e
t al
20
16 (v
olun
tary
di
sclo
sure
)ndash
Perc
enta
ge o
f net
izen
sndash
ndashM
a an
d W
u 2
011
Citi
zens
rsquo ch
arac
teris
-tic
s
Citi
zen
educ
atio
n at
tain
men
t
Gan
diacutea
and
Arc
hido
na 2
008
(bud
get d
iscl
osur
e) G
andiacute
a et
al
20
16 L
owat
char
in a
nd
Men
ifiel
d 2
015
ndash
Gan
diacutea
and
Arc
hido
na 2
008
(fina
ncia
l di
sclo
sure
) C
aba-
Peacutere
z et
al
200
8
De A
rauacutej
o an
d Te
jedo
-Rom
ero
201
7
Ma
and
Wu
201
1 S
erra
no-C
inca
et a
l
2009
Tav
ares
and
da
Cru
z 2
017
Citi
zens
rsquo age
mea
sure
d by
the
perc
enta
ge
of th
e po
pula
tion
aged
65
and
over
Este
ller-M
oreacute
and
Polo
Ote
ro
2012
(who
le sa
mpl
e an
d bi
g m
unic
ipal
ities
) de
l Sol
201
3ndash
Este
ller-M
oreacute
and
Polo
Ote
ro 2
012
(sm
all m
unic
ipal
ities
)
Ma
and
Wu
201
1
br
an
ko sta
nić
deter
min
an
ts of su
bn
ation
al b
ud
getfisc
al tr
an
spar
enc
y a rev
iew o
f empir
ica
l evid
enc
epu
blic sec
tor
eco
no
mic
s42 (4) 449-486 (2018)
480
Vari
able
na
me
Vari
able
m
easu
rem
ent
cor
rela
tion
of d
eter
min
ants
Posi
tive
neg
ativ
eN
on-s
igni
fican
t
Citi
zens
rsquo ch
arac
teris
-tic
s
Citi
zens
rsquo age
mea
sure
d by
the
aver
age
age
of th
e m
unic
ipal
pop
ulat
ion
ndashTa
vare
s and
da
Cru
z
2017
ndash
Citi
zens
rsquo age
mea
sure
d by
the
med
ian
age
of p
opul
atio
nndash
ndashLo
wat
char
in a
nd M
enifi
eld
201
5
Gen
der
mea
sure
d by
the
perc
enta
ge o
f m
en o
ver t
he to
tal l
ocal
pop
ulat
ion
ndashndash
del S
ol 2
013
Citi
zens
rsquo w
ealth
Dis
posa
ble
fam
ily in
com
e pe
r inh
abita
ntSe
rran
o-C
inca
et a
l 2
009
ndashndash
Pers
onal
inco
me
per c
apita
Low
atch
arin
and
Men
ifiel
d
2015
Sty
les a
nd T
enny
son
200
7ndash
Low
atch
arin
and
Men
ifiel
d 2
015
(a
fter c
ontro
lling
for s
tate
effe
cts)
G
uilla
moacuten
et a
l 2
011
Perc
enta
ge o
f pop
ulat
ion
belo
w th
e po
verty
leve
lndash
ndashLo
wat
char
in a
nd M
enifi
eld
201
5
The
valu
e of
eco
nom
ic a
ctiv
ity p
er c
apita
Ges
uele
et a
l 2
017
ndashde
l Sol
201
3Pu
rcha
se p
ower
inde
xndash
ndashTa
vare
s and
da
Cru
z 2
017
Une
mpl
oy-
men
tU
nem
ploy
men
t rat
eD
e Ara
uacutejo
and
Teje
do-R
omer
o
2017
Caa
mantilde
o-A
legr
e et
al
20
13 D
e Ara
uacutejo
and
Teje
do-R
omer
o 2
016
de
l Sol
201
3 T
avar
es
and
da C
ruz
201
7
ndash
Med
ia
Hav
ing
Twitt
er a
ndo
r Fac
eboo
k ac
coun
tsndash
ndashG
andiacute
a et
al
201
6In
tens
ity o
f use
of s
ocia
l med
ia m
easu
red
by th
e nu
mbe
r of t
wee
tsG
andiacute
a et
al
201
6ndash
ndash
Inte
nsity
of u
se o
f soc
ial m
edia
mea
sure
d by
the
Face
book
like
sndash
ndashG
andiacute
a et
al
201
6
br
an
ko sta
nić
deter
min
an
ts of su
bn
ation
al b
ud
getfisc
al tr
an
spar
enc
y a rev
iew o
f empir
ica
l evid
enc
epu
blic sec
tor
eco
no
mic
s42 (4) 449-486 (2018)
481Va
riab
le
nam
eVa
riab
le
mea
sure
men
tc
orre
latio
n of
det
erm
inan
tsPo
sitiv
en
egat
ive
Non
-sig
nific
ant
Med
ia
Pres
s vis
ibili
tyG
andiacute
a an
d A
rchi
dona
200
8
Gan
diacutea
et a
l 2
016
Las
wad
et
al
200
5ndash
Ges
uele
et a
l 2
017
Inte
rnet
vis
ibili
tyG
andiacute
a an
d A
rchi
dona
200
8
Gan
diacutea
et a
l 2
016
Ges
uele
et
al
201
7ndash
Serr
ano-
Cin
ca e
t al
200
9
Oth
er
varia
bles
Deg
ree
of c
omm
unity
invo
lvem
ent
mea
sure
d by
the
num
ber o
f civ
ic
asso
ciat
ions
div
ided
by
the
num
ber
of in
habi
tans
ndashndash
Serr
ano-
Cin
ca e
t al
200
9
Tota
l lan
d ar
eaLo
wat
char
in a
nd M
enifi
eld
201
5 (m
ost e
xten
sive
mod
el)
ndashndash
Perc
enta
ge o
f pop
ulat
ion
chan
ge o
ver
the
year
sLo
wat
char
in a
nd M
enifi
eld
201
5 (m
ore
sim
plifi
ed m
odel
s)ndash
ndash
Min
ority
mea
sure
d by
the
perc
enta
ge
of n
onw
hite
pop
ulat
ion
Low
atch
arin
and
Men
ifiel
d 2
015
ndashndash
Inde
x of
tour
ist a
ctiv
ity p
er c
apita
ndashde
l Sol
201
3-
Sour
ce A
utho
r
br
an
ko sta
nić
deter
min
an
ts of su
bn
ation
al b
ud
getfisc
al tr
an
spar
enc
y a rev
iew o
f empir
ica
l evid
enc
epu
blic sec
tor
eco
no
mic
s42 (4) 449-486 (2018)
482 references1 Alt J E Lassen D D and Rose S 2006 The causes of fiscal transparency
evidence from the US states IMF Staff Papers 53(Spcial Issue) Available at lthttpswwwimforgExternalPubsFTstaffp200603pdfaltpdfgt
2 Alt J E Lassen D D and Skilling D 2002 Fiscal Transparency Guberna-torial Approval and the Scale of Government Evidence from the States State Politics amp Policy Quarterly 2(3) pp 230-250 httpsdoiorg101177 153244000200200302
3 Andreula N Chong A and Guillen J B 2009 Institutional Quality and Fiscal Transparency IDB Working Paper No 36 httpdxdoiorg102139ssrn1817228
4 Bakar N B A and Saleh Z 2015 Review of literature on factors influenc-ing public sector disclosure The way forward Asian Journal of Business and Accounting 8(2) pp 155-184
5 Berliner D 2014 The political origins of transparency Journal of Politics 76(2) pp 479-491 httpsdoiorg101017S0022381613001412
6 Berliner D and Erlich A 2015 Competing for Transparency Political Com-petition and Institutional Reform in Mexican States American Political Sci-ence Review 109(1) pp 110-128 httpsdoiorg101017S0003055414000616
7 Bernardi R A and Arnold D F 1997 An Examination of Moral Develop-ment within Public Accounting by Gender Staff Level and Firm Contempo-rary Accounting Research 14(4) pp 653-668 httpsdoiorg101111j1911- 38461997tb00545x
8 Bernick E L [et al] 2014 Explaining County Government Fiscal Transpar-ency in an Age of e-Government State and Local Government Review 46(3) pp 173-183 httpsdoiorg1011770160323X14556819
9 Biderman C and Pottomatti G 2010 Metodologia para construccedilatildeo de iacutendice de transparecircncia Indice de transparencia Available at lthttpindicedetrans-parenciacommetodologiagt
10 Caamantildeo-Alegre J [et al] 2013 Budget Transparency in Local Govern-ments An Empirical Analysis Local Government Studies 39(2) pp 182-207 httpsdoiorg101080030039302012693075
11 Caba-Peacuterez C Rodriacuteguez Boliacutevar M P and Loacutepez Hernaacutendez A M 2008 e-Government process and initiatives for online public financial information Online Information Review 32(3) pp 379-400 httpsdoiorg101108JFM-03-2013-0017
12 Caba Peacuterez M del C Rodriacuteguez Boliacutevar M P and Loacutepez Hernaacutendez A M 2014 The determinants of government financial reports online Transylvanian Review of Administrative Sciences (42) pp 5-31 Available at lthttpwwwrtsarotrasindexphptrasarticledownload1513gt
13 Cuadrado-Ballesteros B [et al] 2017 The Role of Media Pressure in Pro-moting Transparency of Local Governments Transylvanian Review of Admin-istrative Sciences 2017(51E) pp 20-37 httpsdoiorg1024193tras51E2
br
an
ko sta
nić
deter
min
an
ts of su
bn
ation
al b
ud
getfisc
al tr
an
spar
enc
y a rev
iew o
f empir
ica
l evid
enc
epu
blic sec
tor
eco
no
mic
s42 (4) 449-486 (2018)
48314 Darbishire H 2010 Proactive Transparency The future of the right to infor-mation World Bank Institute Working Paper No 60 httpsdoiorg 10159625031
15 De Arauacutejo J F F E and Tejedo-Romero F 2016 Local government trans-parency index determinants of municipalitiesrsquo rankings International Jour-nal of Public Sector Management 29(4) pp 327-347 httpdxdoiorg101108MRR-09-2015-0216
16 De Arauacutejo J F F E and Tejedo-Romero F 2017 Does Gender Equality Affect Municipal Transparency The Case of Spain Public Performance and Management Review 41(1) pp 69-99 httpsdoiorg1010801530957620171362350
17 Debreceny R Gray G L and Rahman A 2002 The determinants of inter-net financial reporting Journal of Accounting and Public Policy 21(4-5) pp 371-394 httpsdoiorg101016S0278-4254(02)00067-4
18 del Sol D A 2013 The institutional economic and social determinants of local government transparency Journal of Economic Policy Reform 16(1) pp 90-107 httpsdoiorg101080174878702012759422
19 Esteller-Moreacute A and Polo Otero J 2012 Fiscal Transparency (Why) does your local government respond Public Management Review 14(8) pp 1153-1173 httpsdoiorg101080147190372012657839
20 Evans J H and Patton J M 1987 Signaling and Monitoring in Public-Sector Accounting Journal of Accounting Research 25 pp 130-158 httpsdoiorg1023072491083
21 Ferejohn J 1986 Incumbent performance and electoral control Public Choice 50 pp 5-25 httpsdoiorg101007BF00124924
22 Fox J 2007 The uncertain relationship between transparency and account-ability Development in Practice 17(4-5) pp 663-671 httpsdoiorg 10108009614520701469955
23 Fox R L and Schuhmann R A 1999 Gender and Local Government A Comparison of Women and Men City Managers Public Administration Review 59(3) pp 231-242 httpsdoiorg1023073109951
24 Gandiacutea J L and Archidona M C 2008 Determinants of web site informa-tion by Spanish city councils Online Information Review 32(1) pp 35-57 httpsdoiorg10110814684520810865976
25 Gandiacutea J L Marrahiacute L and Huguet D 2016 Digital transparency and Web 20 in Spanish city councils Government Information Quarterly 33(1) pp 28-39 httpsdoiorg101016jgiq201512004
26 Garciacutea-Tabuyo M Saacuteez-Martiacuten A and Caba-Peacuterez M D C 2016 Manda-tory versus voluntary disclosures Drivers of proactive information provision by local governments in Central America Information Development 32(4) pp 1199-1215 httpsdoiorg1011770266666915595260
27 Garciacutea A C and Garciacutea-Garciacutea J 2010 Determinants of Online Reporting of Accounting Information by Spanish Local Government Authorities Local
br
an
ko sta
nić
deter
min
an
ts of su
bn
ation
al b
ud
getfisc
al tr
an
spar
enc
y a rev
iew o
f empir
ica
l evid
enc
epu
blic sec
tor
eco
no
mic
s42 (4) 449-486 (2018)
484 Government Studies Routledge 36(5) pp 679-695 httpsdoiorg101080030039302010506980
28 Gesuele B Metallo C and Longobardi S 2017 The Determinants of E-Disclosure Attitude Empirical Evidences from Italian and Spanish Munici-palities International Journal of Public Administration Routledge 20(4) pp 263-276 httpsdoiorg1010800190069220171300917
29 Gore A K Sachs K and Trzcinka C 2004 Financial disclosure and bond insurance Journal of Law and Economics 47(1) pp 275-306 httpsdoiorg 101086380472
30 Grimmelikhuijsen S G and Welch E W 2012 Developing and Testing a Theoretical Framework for Computer-Mediated Transparency of Local Gov-ernments Public Administration Review 78(1) pp 562-571 httpsdoiorg 10230741506806
31 Groff J and Pitman M 2004 Municipal financial reporting on the World Wide Web A survey of financial data displayed on the official websites of the 100 largest US municipalities Journal of Government Financial Manage-ment 53(2) pp 20-30
32 Guillamoacuten M-D Bastida F and Benito B 2011 The Determinants of Local Governmentrsquos Financial Transparency Local Government Studies 37(4) pp 391-406 httpsdoiorg101080030039302011588704
33 Hollyer J R Rosendorff B and Vreeland J R 2011 Democracy and trans-parency Journal of Politics 73(4) pp 1191-1205 httpsdoiorg101017S0022381611000880
34 IMF 1997 World Economic Outlook Washington International Monetary Fund Available at lthttpswwwimforgexternalpubsftweoweo1097pdfoctweo01pdfgt
35 IMF 1998 Code of Good Practices on Fiscal Transparency minus Declaration on Principles Washington International Monetary Fund Available at lthttpswwwimforgexternalpubsfthistory2012pdf4dpdfgt
36 IMF 2012 Fiscal Transparency Accountability and Risk Washington Inter-national Monetary Fund Available at lthttpswwwimforgexternalnpppeng2012080712pdfgt
37 Ingram R W 1984 Economic Incentives and the Choice of State Govern-ment Accounting Practices Journal of Accounting Research 22(1) pp 126-144 httpsdoiorg1023072490704
38 Khazanchi D 1995 Unethical behavior in information systems The gender factor Journal of Business Ethics 14(9) pp 741-749 httpsdoiorg101007BF00872327
39 Kopits G and Craig J 1998 Transparency in government operations IMF Occasional Papers No 158 Available at lthttpswwwimforgexternalpubsftop158op158pdfgt
40 Krishnan G V and Parsons L M 2008 Getting to the bottom line An exploration of gender and earnings quality Journal of Business Ethics 78(1-2) pp 65-76 httpsdoiorg101007s10551-006-9314-z
br
an
ko sta
nić
deter
min
an
ts of su
bn
ation
al b
ud
getfisc
al tr
an
spar
enc
y a rev
iew o
f empir
ica
l evid
enc
epu
blic sec
tor
eco
no
mic
s42 (4) 449-486 (2018)
48541 Laakso M and Taagepera R 1979 ldquoEffectiverdquo number of parties A Meas-ure with Application to West Europe Comparative Political Studies 12(1) pp 3-27 httpsdoiorg101177001041407901200101
42 Laswad F Fisher R and Oyelere P 2005 Determinants of voluntary Inter-net financial reporting by local government authorities Journal of Accounting and Public Policy 24(2) pp 101-121 httpsdoiorg101016jjaccpubpol 200412006
43 Lowatcharin G and Menifield C E 2015 Determinants of Internet-enabled Transparency at the Local Level State and Local Government Review 47(2) pp 102-115 httpsdoiorg1011770160323X15593384
44 Ma L and Wu J 2011 What Drives Fiscal Transparency Evidence from Provincial Governments in China 1st Global Conference on Transparency Research Rutgers University-Newark May 19-20 2011 httpsdoiorg 102139ssrn1807767
45 Michener G 2015 Why Policymakers Commit to Transparency Legitimacy Insurance Monitoring and the Importance of the News Media as Mediator Available at lthttpwwwfiscaltransparencynetresourcesfilesfiles2015070 2109pdfgt
46 Moon M J and Norris D F 2005 Does managerial orientation matter The adoption of reinventing government and e-government at the municipal level Information Systems Journal 15(1) pp 43-60 httpsdoiorg101111j1365- 2575200500185x
47 Moon M J 2002 The Evolution of E-Government among Municipalities Rhetoric or Reality Public Administration Review 62(4) pp 424-433 httpsdoiorg1011110033-335200196
48 Norris D F and Kraemer K L 1996 Mainframe and PC computing in American cities Myths and realities Public Administration Review 56(6) pp 568-576 httpsdoiorg102307977255
49 OECD 2002 OECD Best Practices for Budget Transparency OECD Journal on Budgeting 1 pp 7-14 httpsdoiorg101787budget-v1-art14-en
50 Pina V Torres L and Royo S 2010 Is E-Government Leading To More Accountable and Transparent Local Governments an Overall View Finan-cial Accountability amp Management 26(1) pp 3-20 httpsdoiorg 101111j1468-0408200900488x
51 Piotrowski S J and Bertelli A 2010 Measuring Municipal Transparency 14th IRSPM Conference Bern Switzerland
52 Piotrowski S J and Vanr Ryzin G G 2007 Cittizens Attitudes Toward Transparency in Local Government The American Review of Public Adminis-tration 37(3) pp 306-323 httpsdoiorg10108009638180126794
53 Rodriacuteguez-Garcia M J 2015 Local womenrsquos coalitions Critical actors and substantive representation in Spanish municipalities European Journal of Womenrsquos Studies 22(2) pp 223-240 httpsdoiorg101177 1350506814549424
br
an
ko sta
nić
deter
min
an
ts of su
bn
ation
al b
ud
getfisc
al tr
an
spar
enc
y a rev
iew o
f empir
ica
l evid
enc
epu
blic sec
tor
eco
no
mic
s42 (4) 449-486 (2018)
486 54 Serrano-Cinca C Rueda-Tomaacutes M and Portillo-Tarragona P 2009 Fac-tors Influencing E-Disclosure in Local Public Administrations Environment and Planning C Government and Policy 27(2) pp 355-378 httpsdoiorg 101068c07116r
55 Smith A C and Taebel D A 1985 Administrative innovation in municipal government International Journal of Public Administration Routledge 7(2) pp 149-177 httpsdoiorg10108001900698508524487
56 Styles A K and Tennyson M 2007 The Accessibility of Financial Report-ing of US Municipalities on the Internet Journal of Public Budgeting Accounting amp Financial Management 19(1) pp 56-92
57 Tavares A F and da Cruz N F 2017 Explaining the transparency of local government websites through a political market framework Government Information Quarterly httpsdoiorg101016jgiq201708005
58 Vishwanath T and Kaufmann D 1999 Towards transparency in finance and governance Washington DC The World Bank
59 Wehner J and de Renzio P 2013 Citizens Legislators and Executive Dis-closure The Political Determinants of Fiscal Transparency World Develop-ment 41(1) pp 96-108 httpsdoiorg101016jworlddev201206005
60 Zimmerman J L 1977 The Municipal Accounting Maze An Analysis of Political Incentives Journal of Accounting Research 15 pp 107-144 httpdxdoiorg1023072490636
61 Zuccolotto R and Teixeira M A C 2014 The Causes of Fiscal Transpar-ency Evidence in the Brazilian States Revista Contabilidade amp Financcedilas 25(66) pp 242-254 httpsdoiorg1015901808-057x201410820
Working Together Integration Institutions and the Sustainable Development Goals World Public Sector Report 2018
UNITED NATIONSUnited Nations Department of Economic and Social Affairs New York 2018 pp 161
Book review by PREDRAG BEJAKOVIĆhttpsdoiorg103326pse4245
Received October 21 2018 Accepted November 7 2018
Predrag BEJAKOVIĆ PhDInstitute of Public Finance Smičiklasova 21 10000 Zagreb Croatiae-mail predragbejakovicijfhrORCiD 0000-0002-4164-8220
un
ited natio
ns
wo
rk
ing to
geth
er integ
ratio
n institu
tion
s an
d the su
stain
ab
le dev
elopm
ent g
oa
ls w
or
ld pub
lic secto
r repo
rt 2018
pub
lic secto
r ec
on
om
ics
42 (4) 487-494 (2018)
488 In the current world although there has been a significant progress in the reduc-tion of poverty and inequality a persistent problem is the lack of improvement in integration which causes social exclusion Furthermore modern economic devel-opment is often not sustainable of the long-term while institutions are not fully adapted to the needs of social challenges A newly published release by the United Nation World Public Sector Report 20181 using a holistic approach very nicely sheds light on the additional measures that are needed to the collaborative efforts of various stakeholders in the inclusion of those that are left out This excellent report was prepared by many authors using mixed methods that combined litera-ture reviews and expert contributions The team composed of United Nations per-sonnel was led by David Le Blanc under the responsibility of Marion Bartheacutelemy
The United Nations in 2016 adopted the 2030 Agenda for Sustainable Develop-ment (the successor to its Millennium Development Goals) which should elimi-nate poverty and achieve sustainable development by 2030 (Steven Pinker in Enlightenment Now states that not even Jesus was that optimistic he told the indig-nant disciples ldquoThe poor you will always have with yourdquo) The Agenda underlines the importance of the interlinkages and integrated nature of the sustainable devel-opment goals (SDGs) Achieving possible synergies and strengthening trade-offs between the sustainable development goals and targets will enable much easier achievement of the SDGs This should boost the allocation of resources and help avoid the adverse side effects of actions aiming to hasten progress in one area on the realisation of targets in other areas
One of the goals of the report is to present the positive experience of many coun-tries with the intention of transferring the best practice in policy integration for the attainment of SDGs The authors are fully aware that different types of existing interlinkages among the SDGs can be addressed and improved from an institu-tional perspective Thus the report aims to define areas where public institutions need to work more closely together the types of measures that can be involved in this process and the broader implications for and consequences of collaboration between public institutions and public service
Improving integration involves finding ways to strengthen cooperation and com-mon approaches among institutions at various levels dealing with closely interre-lated issues Policy integration comprises the management of crosscutting actions and measures in a policy-making process that transits the boundaries of estab-lished policy fields Such measures very often do not correspond to the institu-tional responsibilities of individual units and departments
In the modern literature the term integration is used in various slightly different meanings The most common usage defines integration as a dimension variable with policies in specific issue areas being more integrated than before Otherwise
1 The report is available at httpworkspaceunpanorgsitesInternetDocumentsUNPAN98152pdf
un
ited natio
ns
wo
rk
ing to
geth
er integ
ratio
n institu
tion
s an
d the su
stain
ab
le dev
elopm
ent g
oa
ls w
or
ld pub
lic secto
r repo
rt 2018
pub
lic secto
r ec
on
om
ics
42 (4) 487-494 (2018)489integration can be deemed as the more coherent process of defining and imple-
menting policy related to a specific issue Finally integration can also denote the ideal of policies that achieve a higher degree of coherence In this report the term integration is considered in a broad sense while the potential challenges short-comings and gains of integrated policy-making are clear The challenges in the past were the lack of political legitimacy of sustainable development as a para-digm and insufficient attention of various levels of government to the issue of sustainable development Shortcomings are an inability to mainstream sustainable development principles in the work of available institutions on one hand and resistance to achieve the degree of coordination among institutions that are needed for sustainable development on the other Gains of the integrated approach are socially superior solutions that cannot be achieved by focusing only on sector-specific policies and shared visions across sectors and various actors Positive changes in relevance and legitimacy are supported by progress in the scientific researchers that fully understand the interlinkages among sustainable develop-ment topics on the one hand as well as by the development of tools analytical methods and information systems that support integration of different stakehold-ers in public and private sector on the other
The report is organized around three broad principal questions First what are from the institutional perspective the challenges to and prospects for policy integration at various policy cycle phases at the national level Second are there any positive cases of institutional and administrative organisations that can support integrated approaches to the 2030 Agenda and if so what are they Finally what are the opportunities and challenges for public administration and public institutions to ensure integrated approaches in diverse SDG or groups of closely related goals
The report consists of two main parts In the first part chapter one explains the reasons and case for integration and introduces the methodological framework The second chapter focuses on horizontal integration chapter three on vertical integration while chapter four deals with successful engagement of stakeholders The second part of the publication applies the relevant framework of integrated approaches to international migration health and integration of peace security and development in post-conflict situations
Forms of integration are explained in chapter one The modern literature distin-guishes three dimensions of integration Horizontal integration encompasses inte-gration across sectors or institutions Vertical integration expresses how the actions of various (national and sub-national) levels of government can be adjusted to achieve coherent outcomes The third dimension is engagement of all stakeholders in the integrated realisation of shared objectives Taken together these three dimen-sions of integration encompass all the relevant categories proposed by the litera-ture primarily partnerships participation and coherence The approach and content of the initiatives can be formal or informal The latter refers to joint activities that involve various stakeholders from the non-state sector in addition to the whole of
un
ited natio
ns
wo
rk
ing to
geth
er integ
ratio
n institu
tion
s an
d the su
stain
ab
le dev
elopm
ent g
oa
ls w
or
ld pub
lic secto
r repo
rt 2018
pub
lic secto
r ec
on
om
ics
42 (4) 487-494 (2018)
490 government with the state usually having a coordinating role When analysing policy integration there is a need to consider different aspects like the institutional efforts made by governments to promote integrated policy-making and policy coherence activities related to collaboration and coordination and measures of achieved integration and policy coherence regarding achieved outcomes
As the SDGs makes high demands for horizontal integration on institutions at all levels chapter two analyses the importance of effective horizontal integration for the implementation of the SDGs Such integration is critical for resolving the interconnected nature of the SDGs including synergies and trade-offs across dif-ferent goals and targets It is however well known that overcoming sectoral boundaries in the attainment of horizontal integration is a demanding and complex task In such a process governments have concrete measures and opportunities to improve integration in their structures and processes A growing number of coun-tries around the world are including SDGs into their national policies and putting in place adequate institutional frameworks While some countries have given new mandates to existing mechanisms or institutions others are establishing new coor-dination bodies and mechanisms for the implementation of the SDGs Among many vital measures and instruments the five most important are examined The first are national strategies and plans because they define the overall direction and priorities The second is the budget process that helps in implementation and real-isation of national strategies at the level of programmes and activities The third group consists of public services responsible for the implementation of govern-ment actions on the SDGs This group has a critical role in achieving effective collaboration across institutions and sectors Monitoring evaluation and review processes for the SDGs are part of the fourth group that enables governments to assess progress in the activities of integration Finally different oversight institu-tions parliaments and Supreme Audit Institutions (SAIs) have a crucial role in insuring integration The report contains many examples of integration from dif-ferent countries so this chapter presents the experiences from the Sierra Leone implementation of the Agenda for Prosperity particularly the Poverty Reduction Strategy The Budget Statement nominates the responsible stakeholders and the scope of their reporting responsibilities on the SDGs within the various govern-ment ministries and offices where resources were allocated
The realisation of the SDGs requires the coordination of actions and measures of different levels of government There are many reasons for such coordination In most cases the achievement of specific targets in each national context depends on the aggregation of local and regional outcomes making coherent action a stip-ulation Vertical integration may be an important step in promoting a shared vision and commitment to sustainable development across levels It can enhance syner-gies and improve consistency across levels of government through mutually rein-forcing and supportive actions The third chapter examines current efforts in ensuring effective vertical policy integration during the implementation and fol-low-up and review of the SDGs Vertical integration enables an opportunity for
un
ited natio
ns
wo
rk
ing to
geth
er integ
ratio
n institu
tion
s an
d the su
stain
ab
le dev
elopm
ent g
oa
ls w
or
ld pub
lic secto
r repo
rt 2018
pub
lic secto
r ec
on
om
ics
42 (4) 487-494 (2018)491political dialogue among the various parts of government providing a possibility
to generate trust and a more long-term vision across the public sector The chapter analyses the potential benefits of vertical integration and some of its challenges and barriers It also studies approaches and tools that different countries have implemented with the goal of enhancing vertical integration at different stages of the policy process underlining innovative approaches and experiences Potential challenges to vertical integration include the gap between the abstract and univer-sal nature of SDGs and the specificity of local initiatives and policies unaware-ness of SDGs by local governments organizational cultural andor ideological differences between national and local governments institutional weaknesses or poor coordination mechanisms between the different levels of government Colombia can be mentioned as a positive example of successful and advanced vertical integration With support from the Colombian national government 32 departments and 31 capital cities have adopted and implemented local develop-ment plans that include SDG localized targets
The fourth chapter presents the adoption of mechanisms for efficient stakeholder engagement at both the systemic and the sector levels It also looks at how it can affect outcomes in terms of integration Many experiences have been observed regarding processes and mechanisms for stakeholder engagement in different sec-tors at different levels of decision-making and with various constituencies Hav-ing in mind such examples governments have become fully aware of the impor-tance of stakeholder engagement in order to strengthen ownership of the SDGs and ensure their successful implementation and monitoring at all levels Included stakeholders can enhance policy performance by helping in defining problems in ways that are more accurate They can also provide information and insights rele-vant for identifying policy solutions and evaluating the implementation process Enabling policy-making process to the inclusion and interaction with non-govern-mental actors helps governments better to understand peoplersquos needs and demands Furthermore non-governmental actors can be directly included in solving policy problems and contribute additional resources through the common generation of skills knowledge policy and technology Of course there are always some prob-lems and costs Wide stakeholder engagement usually takes time and can be an obstacle to the quick policy responses that some sustainable development chal-lenges may need While including the ideas and opinions of multiple stakeholders helps gain a more comprehensive and legitimate understanding of demanding pol-icy problems engagement can make it more difficult to reconcile divergent and even opposite views in commonly agreed policy solutions It seems that the com-bination of different engagement strategies and collaboration of multiple stake-holders is more effective for increasing responsiveness and accountability than the use of one single engagement mechanism The positive Finnish example of the government-led Finnish National Commission on Sustainable Development with many stakeholders included from public and private sector and civil society illus-trates a possible way of mobilizing non-state actors that is fully consistent with government actions for SDG implementation Investing time and resources in the
un
ited natio
ns
wo
rk
ing to
geth
er integ
ratio
n institu
tion
s an
d the su
stain
ab
le dev
elopm
ent g
oa
ls w
or
ld pub
lic secto
r repo
rt 2018
pub
lic secto
r ec
on
om
ics
42 (4) 487-494 (2018)
492 selection process and having clearly defined procedures and criteria for selecting stakeholders without doubt contribute to the effectiveness and efficiency of the engagement as well as its outputs and outcomes in terms of integration
Sustainable development demands policies that are systematically oriented towards the strengthening of linkages between different economic social and environmen-tal issues The fifth chapter shows how national public institutions and administra-tions have used integrated approaches to respond to the needs of migrants and refu-gees the flows of whom have been increasing across the world The way in which the multiple linkages between migration and the SDGs are transformed into national policies and realised in practice by public institutions and public adminis-tration reflects political processes of reconciling opposite opinions and demands of different stakeholders including governments civil society and migrants them-selves The authors examine how public institutions and different stakeholders can better support integrated approaches to migration How can they sustain the inte-gration of the mentioned approaches in sustainable development measures poli-cies and institutional processes Where and how can development policies make the most impact when it comes to serving those in the worst positions among inter-national migrants How can policy-makers and policy communities connect migra-tion and socio-economic development through innovative services No single model appears intrinsically better in terms of effective and efficient policy integra-tion Elements that might perhaps impact horizontal and vertical policy integration include the type of public administration system the level of decentralisation and local governance institutional capacity previous experience and institutionaliza-tion of cooperation between various bodies of government development of leader-ship prevalence of modern technology usage including the capability and vigour of communication platforms and finally the characteristics and the numbers of actors involved in policy-making Morocco is a positive example of a country that undertook several waves of regularization of migrants in an irregular situation fol-lowed by the opening of its public services to all migrants and refugees Migrants in an irregular situation have access to public health services and can send their children to public schools Additionally regular migrants can participate in profes-sional training and assistance with job search This chapter concludes with an important statement that integration of migration and development at all levels of public administration is not only a technical or rational process but also has to encompass cultural awareness politics and perceptions As migration and refugee issues are likely to remain a significant problem in the near future there is a need for the proposal and implementation of efficient awareness and communication strategies and accountability systems in public administration
Integrated approaches to health and well-being are the subject of analysis in the sixth chapter Health is a crucial human right and an important characteristic of personal well-being Health outcomes are impacted by many factors that are usu-ally outside the health sector itself At the national level a vast array of policies and institutional settings have been developed to support the multiple linkages
un
ited natio
ns
wo
rk
ing to
geth
er integ
ratio
n institu
tion
s an
d the su
stain
ab
le dev
elopm
ent g
oa
ls w
or
ld pub
lic secto
r repo
rt 2018
pub
lic secto
r ec
on
om
ics
42 (4) 487-494 (2018)493between health and other SDG areas with the intention to support integrated
approaches However researches show that the focus of many efforts at integrated health initiatives has largely remained within the health care sector itself Attempts at integration have been oriented to finding ways to enable non-health sectors and actors to serve the goals of the health sector without necessarily considering the impact of health on those sectors and their principal objectives Thus in many countries the potential of integrated approaches to achieve synergies and minimise trade-offs across sectors and government levels may remain often unused Univer-sal healthcare for all migrants in Thailand is mentioned as a positive experience of interlinkages of health with other sectors Migrants represent more than 6 percent of the Thai population It is currently the only country in the world where illegal migrants have the same health care rights as nationals
This very nice report finishes with chapter seven which deals with the implemen-tation of the SDGs in post-conflict situations and their implications for integrated approaches that enable improvements in sustainable development and peace Conflicts annually lower a countryrsquos gross domestic product growth on average by two percentage points Trends in the world show that the gap between conflict-affected countries and other developing states is widening Countries emerging from conflict are the ones where the SDGs probably may not be obtained without some radical and innovative departures An integrated context for SDG imple-mentation involves ensuring that interventions aimed at preserving peace (includ-ing protecting human rights) and development are interlinked and mutually rein-forcing As countries in post-conflict situations face many pressing problems for them the achievement of long-term development goals is much more difficult In the face of many short and long-term priorities efficient integrated approaches become even more important than in peaceful circumstances Post-conflict situa-tions mostly vary in the nature and degree of devastation but often there is a need to mitigate the consequences of substantial physical institutional and organiza-tional destruction Conflicts usually ruin national public administration and public institutions and they have to be rebuilt often from scratch Using recent examples the authors in this chapter explore how this can be done Sustainable development aspirations can be an inspiration for a common vision for the future Such a vision needs to be transformed into coherent and integrated national policies that are future-looking inclusive and endorse partnership between the government and society and support by various stakeholders The policy integration and inclusion in Colombia achieved by the National Development Plan are provided as an example The Colombian government made efforts to provide an inclusive plat-form for policy-making at the local level giving a voice to earlier marginalized groups and supporting their participation in local elections as candidates The government also established the legal and institutional architecture for a territorial peacebuilding process The coordination between central and local levels of gov-ernment was achieved through the Inter-institutional Post-conflict Council
un
ited natio
ns
wo
rk
ing to
geth
er integ
ratio
n institu
tion
s an
d the su
stain
ab
le dev
elopm
ent g
oa
ls w
or
ld pub
lic secto
r repo
rt 2018
pub
lic secto
r ec
on
om
ics
42 (4) 487-494 (2018)
494 The report presents country efforts to foster policy integration for SDGs It pro-vides examples of measures and ways by which linkages among SDGs can be achieved from an institutional perspective and underlines the importance of inte-gration challenges and opportunities for public institutions and public administra-tion This interesting and valuable report also explains the role and importance of budgets in tracking support to specific goals The reader can only enjoy the final product and the incredible richness of the additional (more than 500) sources used in the preparation of the report

table of contents
articles 353 VLADIMIR ARČABIĆ
Fiscal convergence and sustainability in the European Union
381 OZANA NADOVEZA JELIĆ and MARGARETA GARDIJAN KEDŽO Efficiency vs effectiveness an analysis of tertiary education across Europe
415 IVANA DRAŽENOVIĆ MARINA KUNOVAC and DOMINIK PRIPUŽIĆ Dynamics and determinants of emigration the case of Croatia and the experience of new EU member states
449 BRANKO STANIĆ Determinants of subnational budgetfiscal transparency a review of empirical evidence
book review 487 UNITED NATIONS
Working Together Integration Institutions and the Sustainable Development Goals World Public Sector Report 2018 (Predrag Bejaković)
Vol 42 No 4 I pp 353-494 I December 2018 I Zagreb
Public Sector Economics
42018
Fiscal convergence and sustainability in the European Union
VLADIMIR ARČABIĆ PhD
ArticleJEL C32 C33 E62 H60httpsdoiorg103326pse4241
The author would like to thank Junsoo Lee Robert J Sonora Hrvoje Šimović Josip Tica Tomislav Globan Kyoung Tae Kim Ozana Nadoveza Jelić Irena Raguž Krištić Yu You and two anonymous referees for helpful comments on the paper This work has been supported in part by Croatian Science Foundation under the project 6785
Received June 1 2018 Accepted October 10 2018
The article was judged the best paper in the regular category in the annual competition for the Prof Dr Marijan Hanžeković Prize for 2018
Vladimir ARČABIĆUniversity of Zagreb Faculty of Economics and Business Department of Macroeconomics and Economic Development Trg J F Kennedyja 6 10000 Zagreb CroatiaE-mail varcabicefzghr ORCiD 0000-0003-4173-8637
vla
dim
ir ar
ča
bić
fisca
l co
nv
erg
enc
e an
d susta
ina
bility in th
e eur
opea
n un
ion
pub
lic secto
r ec
on
om
ics
42 (4) 353-380 (2018)
354 abstractThis paper analyzes fiscal convergence and sustainability in the European Union using data on government debt revenues and expenditures Absolute fiscal diver-gence is present in the EU especially after the sovereign debt crisis However we find evidence of fiscal club convergence when clubs are endogenously determined Club convergence is important for the EU because there is no single fiscal policy and member statesrsquo policies are heterogeneous Endogenous clubs do not share the usual geographical political or development similarities Fiscal policy in the EU is found to be unsustainable but it is countercyclical We use a policy response function where the primary surplus is a function of public debt and the output gap The primary surplus does not respond to changes in public debt and this is con-sidered to be unsustainable However it increases in expansions and decreases in recessions thus being countercyclical The countercyclical primary surplus is important for smoothing business cycles
Keywords convergence clubs fiscal sustainability public debt structural breaks log t test dynamic panel
1 IntroductIonWith the sovereign debt crisis in the Eurozone fiscal policy has become an increasingly important topic The sovereign debt crisis and the Great Recession led to many European Union countries breaching the public debt and deficit goals set by Stability and Growth Pact (SGP) The goals are for public debt not to exceed 60 of GDP and for the deficit not to exceed 3 of GDP These goals which are part of the nominal convergence criteria were established to ensure sound and sustainable public finances in the European Union However whether or not there is a convergence of member statesrsquo fiscal policies and whether fiscal policy is sustainable is still an open question
This paper analyzes fiscal convergence and tests for fiscal sustainability in the European Union We test fiscal convergence directly using government revenue expenditure and debt as key government variables instead of testing for GDP convergence as is usual in the convergence literature The paper considers both absolute convergence and convergence clubs which is important because the European Union does not have a single fiscal policy and member statesrsquo policies are heterogeneous Heterogeneous fiscal policies among member states could easily lead to different fiscal convergence clubs which are analyzed in the paper Based on the identified convergence clubs we test for fiscal sustainability in the clubs as well as in the whole of the European Union Fiscal sustainability has become an especially important topic for the EU countries after the Greek crisis
The literature on fiscal convergence is relatively scarce Economic integration common institutional factors and common policies in the EU should lead to con-vergence in key fiscal indicators On the other hand the sovereign debt crisis and the Great Recession affected member states in different ways possibly leading to
vla
dim
ir ar
ča
bić
fisca
l co
nv
erg
enc
e an
d susta
ina
bility in th
e eur
opea
n un
ion
pub
lic secto
r ec
on
om
ics
42 (4) 353-380 (2018)355fiscal divergence It seems that the observed period plays an important role Earlier
research finds some evidence of fiscal convergence in the period from the late 1960s to the early 2000s (De Bandt and Mongelli 2000 and Delgado 2006) while more recent studies such as Kočenda Kutan and Yigit (2008) show the lack of it in the period from 1995 to 2005 The mentioned papers measure convergence using the popular β- and α-convergence tests as well as cointegration tests in a time series framework
The literature does not tackle the issue of convergence clubs regarding fiscal pol-icy However the idea of convergence clubs is implicitly included in discussions on the EU core and periphery or on the two-speed Europe idea popularized by Blanchard (2010) which argues that different groups of European countries show faster and slower recoveries after the Great Recession Accordingly fiscal conver-gence and the possibility of convergence clubs are important issues for EU poli-cymakers This paper analyzes both absolute convergence and club convergence Instead of grouping countries according to ad-hoc criteria such as geographical location or EU accession date we determine convergence clubs endogenously
We also analyze fiscal sustainability within the clubs and in the whole EU 28 using a policy response function proposed by Bohn (1998 2007) Fiscal policy is sustainable if the primary government surplus increases as a response to the increase in public debt This is considered responsible and sustainable behavior because the government increases its revenue or decreases spending when faced with a higher public debt Bohn (1998 2005) concludes that US fiscal policy is sustainable Cassou Shadmani and Vaacutezquez (2017) refine this finding by showing that the US fiscal policy is sustainable only during good economic times but not in times of economic distress
The research regarding European fiscal policy is somewhat different Collignon (2012) develops a policy response function to analyze European fiscal sustainabil-ity His policy response function is adjusted to EU fiscal rules looking at the pri-mary surplus response to changes in debt and deficit Results indicate that Euro-pean fiscal policy is sustainable in this respect but conditions on financial markets and the risk of financial contagion can make it insufficient as shown by the Greek crisis Research has also focused on the cyclical behavior of fiscal policy The common understanding is that fiscal policy should be countercyclical higher gov-ernment spending in recessions followed by fiscal consolidation in expansions to smooth business cycles The countercyclical fiscal policy is sustainable in the long run when extra deficits accumulated in recessions are compensated for during times of economic growth Balassone Francese and Zotteri (2010) show that budget balance in fourteen EU countries deteriorates during recessions but does not improve to the same extent during expansions Government expenditures are responsible for the asymmetry
vla
dim
ir ar
ča
bić
fisca
l co
nv
erg
enc
e an
d susta
ina
bility in th
e eur
opea
n un
ion
pub
lic secto
r ec
on
om
ics
42 (4) 353-380 (2018)
356 Public debt sustainability has been widely analyzed for individual countries as well Babić (2003) and Mihaljek (2004) analyze the sustainability of public and external debt in Croatia This early analysis1 concluded that Croatian public debt is not too sensitive to the various shocks analyzed but credit rating and interest rate spread in Croatia are worse than those of central European countries Deskar-Škrbić and Šimović (2017) on the other hand showed that public debt level affects the effectiveness of fiscal spending by reducing the size of fiscal effects in Croatia
This paper contributes to the literature by analyzing absolute fiscal convergence and convergence clubs using quarterly data for government debt revenues and expenditures in EU member states from 20001 to 20172 We test convergence using a log t test proposed by Phillips and Sul (2007 2009) accompanied with the clustering algorithm for endogenous club classification Commonly used β- and σ-convergence tests might be biased and suffer from low power as noted in Ber-nard and Durlauf (1995 1996) among others Such tests assume linear dynamics in the convergence process Phillips and Sulrsquos (2007) log t test is based on a non-linear dynamic factor model which allows a nonlinear adjustment in parameters both over time and across different countries Therefore it is suitable in testing for convergence We check the robustness of our results by applying recently devel-oped unit root tests which control for both sharp and smooth structural breaks
The paper also contributes to the fiscal policy sustainability literature We use a policy response function proposed by Bohn (1998) in a panel framework where the primary government surplus is a function of public debt and the output gap We use a dynamic panel model and include a lagged dependent variable in the equation since there is a strong inter-temporal relationship between the govern-ment surplus and public debt Furthermore EU countries are somewhat homoge-nous and therefore there is a possibility of cross-sectional dependence Unlike the previous literature we use a dynamic panel system GMM estimator with common correlated effects proposed by Pesaran (2006) which controls for pronounced homogeneity among the EU countries
The main findings can be summarized as follows There is strong and robust evi-dence of absolute divergence in government debt revenues and expenditures among the EU countries The process of divergence was intensified during the sovereign debt crisis and the Great Recession However we find two three and four endogenous convergence clubs in government debt revenue and expendi-tures respectively The clubs are found to be quite heterogeneous club members do not share the usual geographical political or development similarities On the other hand groups of EU-15 and EU-13 countries as well as EU core and EU periphery countries are shown to diverge which suggests an important difference between endogenous and exogenous groupings
1 1997-2003 period is considered
vla
dim
ir ar
ča
bić
fisca
l co
nv
erg
enc
e an
d susta
ina
bility in th
e eur
opea
n un
ion
pub
lic secto
r ec
on
om
ics
42 (4) 353-380 (2018)357Fiscal policy is found to be unsustainable but countercyclical both in the EU as a
whole and within identified convergence clubs Our model does not show an increase in the primary surplus after debt upsurge which is identified as unsus-tainable behavior We find only limited evidence of fiscal sustainability in the EU-13 group and in a subsample with public debt higher than 90 On the other hand fiscal policy in the EU is countercyclical indicating the efforts of fiscal policy to smooth business cycles
The paper is structured as follows Section 2 explains and presents the data It describes empirical methods used in the paper namely log t test and the clustering algorithm for club convergence analysis unit root tests with structural breaks and the dynamic panel model used for the sustainability analysis Section 3 presents results on fiscal convergence and sustainability while section 4 concludes
2 data and methodology21 dataFor convergence analysis we use quarterly general government debt revenues and expenditures in a percent of GDP as our key variables Variables in current prices are divided by nominal GDP and expressed in real terms as a percent of GDP The data span from 2000q1 to 2017q2 which is the longest available period for a balanced panel for 28 EU countries For the sustainability analysis we use primary surplus public debt and the output gap data but the sample starts in 2002q1 because of the availability of primary surplus data The primary sur-plus is calculated as total surplus plus payable interest and it is expressed as a percent of GDP Public debt is expressed as a percent of GDP as well The output gap is a percent deviation of GDP from its long-run trend computed using the Hodrick and Prescott (1997) filter
All variables are seasonally adjusted using Census X11 method for Census Bureaursquos X12-ARIMA program Data are collected primarily from the Eurostat and International Financial Statistics (IFS) database For Croatia we use central government revenues and expenditures provided by the Croatian National Bank as a proxy for general government For some countries we had to reconstruct data from different sources to work with balanced panels for the analysis Details on data construction are explained in appendix Appendix also plots series of govern-ment debt revenues expenditures and primary surplus as a percent of GDP and presents basic descriptive statistics
22 the log t conVergence test and club conVergenceWe use the log t test for convergence analysis of government debt revenues and expenditures as well as for analysis of convergence clubs The test was developed by Phillips and Sul (2007 2009) who built on a neoclassical growth model with heterogeneous technology and looked for the output convergence Intuitively the test looks at cross-sectional dispersion over time If the dispersion decays over time countries are becoming more similar ie there is convergence Phillips and
vla
dim
ir ar
ča
bić
fisca
l co
nv
erg
enc
e an
d susta
ina
bility in th
e eur
opea
n un
ion
pub
lic secto
r ec
on
om
ics
42 (4) 353-380 (2018)
358 Sul (2009) introduced three sets of tools relative transition curves log t test and the clustering algorithm for testing club convergence
Allowing for a heterogeneous technology in a growth model is important because countries experience different growth paths Such a framework is reasonable for studying fiscal convergence in the EU as well because countries have both a com-mon part such as institutions and policies and an idiosyncratic part which is country-specific
Consider a neoclassical growth model with the heterogeneous technology used in Phillips and Sul (2009)
(1)
where yit is output per capita ỹi0 and ỹi are initial and steady-state levels of output
per capita respectively and Ai0 represents the initial level of technology Hetero-geneity is allowed through the convergence parameter βit and the output growth rate git since both can vary over time and across countries The model can be rewritten to show a common and country-specific component We simplify the equation (1) as log yit = ait + git t where the term ait collects all RHS variables except git t Than the model can be written as a dynamic factor model
(2)
In this dynamic factor model μt is a common component The coefficient bit explains how individual countries relate to the common component μt In this paper the focus is on fiscal convergence Instead of looking at output per capita we consider convergence in government debt revenues and expenditures The common com-ponent μt in that case are EU institutions integration process andor common policies while bit represents a share of a common trend for each EU member state
Coefficients bit could be empirically analyzed using relative transition curves hit which are simply the relative departure of country i from the average or
(3)
where xit are series on government debt revenue or expenditures2 We remove the cyclical component from the time series as suggested by Phillips and Sul (2009) by using the Hodrick and Prescott (1997) filter but the results are not very sensi-tive to cyclical smoothing Convergence is evident when hit curves for all coun-tries approach 1
2 For each variable we run a separate test
vla
dim
ir ar
ča
bić
fisca
l co
nv
erg
enc
e an
d susta
ina
bility in th
e eur
opea
n un
ion
pub
lic secto
r ec
on
om
ics
42 (4) 353-380 (2018)359The log t test is a more formal way for testing convergence The test builds on
relative transition curves and has the following form
(4)
where is a quadratic distance measure which goes to 0 when countries converge t = T0 T where T0 is the first observation after we discard the initial 30 of observations as suggested by Phillips and Sul (2009) Second term on LHS is a penalty function which improves test performance and ut is an iid error Convergence is tested with the coefficient γ When γ is negative and statistically significant we can conclude that countries diverge If 0 le γ lt 2 we can conclude there is a conditional convergence in growth rates For absolute convergence to hold γ ge 23 The critical value at 5 level significance is 165
Phillips and Sul (2007 2009) also developed a clustering algorithm for detecting endogenous convergence clubs based on the log t regression If the convergence hypothesis is rejected for the full sample club convergence can be considered The clustering algorithm has four steps Simplified in the first step we sort coun-tries in the panel and in the second step we form a core group of k countries where k lt N for which the log t regression yields the highest t-statistics4 The remaining N ndash k countries form a complementary group In the third step we add one country at the time from the complementary to the core group and for each we apply the log t test If t gt -165 the new country is added to the core group The first convergence club is obtained after all countries that satisfy the condition are added In the fourth step we apply the log t test on the group of remaining coun-tries which are not a part of the first convergence club If the t-statistic is greater than -165 the second convergence club is identified If not we repeat steps (1) to (3) on the group of remaining countries to identify other possible convergence clubs
To obtain as few clubs as possible we run separate tests for club merging Once initial clubs are identified we run the log t test on them If convergence hypothesis is not rejected for club 1 and club 2 we merge them and form a new club 1 New club 1 is then tested for merging with club 3 and so on The advantage of this procedure is that it produces fewer convergence clubs but the downside is that the evidence for convergence is less convincing because the t-statistic on the γ coef-ficient is usually insignificant
23 unIt root tests for conVergenceWe use different unit root tests for convergence analysis within identified clubs to check the robustness of our results We test for convergence in government debt revenues and expenditures both in the full sample of EU 28 and in each identified convergence club Following the approach of Bernard and Durlauf (1995) and
3 Phillips and Sul (2007 2009) provide more technical details of the test For empirical analysis we use a set of procedures described in Du (2017)4 To form a group the t-statistic for parameter γ from log t regression must be t gt -165
vla
dim
ir ar
ča
bić
fisca
l co
nv
erg
enc
e an
d susta
ina
bility in th
e eur
opea
n un
ion
pub
lic secto
r ec
on
om
ics
42 (4) 353-380 (2018)
360 Pesaran (2007) we compute a difference between country i and the average which we test for the unit root xit = xit ndash xt (5)
where xit represents government debt revenues or expenditures in country i and xt is an adjusted average excluding country i under consideration The adjusted average should prevent a bias in testing which could be large for big countries such as Germany
If the difference series xit is stationary then there is convergence in government debt revenues or expenditures Shocks to an individual countryrsquos fiscal variables may be permanent or temporary but all shocks to the difference series xit should be only temporary if country i converges to the average Rejection of unit root is evidence of convergence If our results are robust rejections should be higher within identified clubs than in the full sample of EU 28
We apply unit root tests developed by Lee and Strazicich (2003) and Enders and Lee (2012) that can control for structural breaks Structural breaks are highly pos-sible in government debt revenues and expenditures time series since they include the period of the sovereign debt crisis and the Great Recession in the EU Ignoring structural breaks might be a serious problem that reduces the power of the test as argued in Perron (1989) We also present results of a standard ADF test which does not control for structural breaks Intuitively structural breaks are abrupt changes in the data such as the Great Recession It is possible that the con-vergence was present both before and after the break but the existence of the break violates our conclusions
The Lee and Strazicich (2003) unit root test controls for two sharp breaks in the data It is a Lagrange Multiplier (LM) test with the equation
∆ xt = δʹ∆ Zt + ϕ Stndash1 + εt (6)
where St is a detrended xt series and ϕ is a coefficient of interest Under the null hypothesis of unit root ϕ = 0 and the rejection of unit root implies convergence
We use the so-called break model which allows for two breaks in both level and the trend of the series using dummy variable vector Zt = [1 t D1t D2t DT1t DT2t] Dummy variables D1t and D2t control for breaks in level and take value 1 if t ge TBj + 1 and 0 otherwise for breaks j = 1 2 where TBj are break locations On the other hand dummy variables DT1t and DT2t control for breaks in the trend where DTjt = t ndash TBj for t ge TBj + 1 and 0 otherwise for breaks j = 1 2 Break locations TB1 and TB2 are endogenously determined in a grid search which minimizes the t-sta-tistics of coefficient ϕ
Critical values for the LM test with two breaks in a level and the trend are taken from table 2 of Lee and Strazicich (2003) Number of lags in the equation (6) is chosen based on general to specific procedure
vla
dim
ir ar
ča
bić
fisca
l co
nv
erg
enc
e an
d susta
ina
bility in th
e eur
opea
n un
ion
pub
lic secto
r ec
on
om
ics
42 (4) 353-380 (2018)361We also use the Enders and Lee (2012) unit root test which controls for an
unknown number of smooth structural transitions approximated by a flexible Fou-rier function The Fourier function has proved to accommodate smooth breaks very well there is no need for a grid search as in Lee and Strazicich (2003) test and the number of estimated parameters is relatively small so the test does not lose power The test equation is simple and can be estimated by OLS
∆ xt = c (t) + ϕ Stndash1 + εt (7)
where again St is detrended xt series and ϕ is a coefficient of interest The null hypothesis of unit root assumes ϕ = 0 and again a rejection of unit root implies convergence However equation (7) includes a time-dependent deterministic term c (t) which is approximated by a single frequency Fourier function of the form
(8)
where c0 c1 and c2 are coefficients estimated by OLS t is a current time period and T is a number of observations Note that the equation (8) nests a standard linear specification when c1 and c2 are equal to zero We run the model with a sin-gle frequency equal to one and with a number of lags chosen by general to spe-cific procedure Critical values are taken from Enders and Lee (2012) table 1
24 PolIcy resPonse functIon for the sustaInabIlIty analysIsWe analyze fiscal policy sustainability using a policy response function as sug-gested by Bohn (1998 2007)5 Our model can be written as
sit = ρ sitndash1 + β1 dit + β2 yit + εit (9)
Equation (9) is a dynamic panel version of Bohnrsquos policy response function where sit is the government primary surplus in country i at time t dit is public debt and yit is the output gap eit is the residual where eit = αit + εit and αi are country fixed effects The error term εit is independent or E[εit εjk] = 0 for each i j t and k where i ne j
Fiscal policy is sustainable when β1 is positive suggesting an increase in primary surplus as a response to higher public debt Such behavior is considered sustain-able and responsible because the government tends to increase its revenue or decrease spending as a response to higher debt
Bohn (1998) stressed the importance of controlling the model with the output gap Coefficient β2 next to the output gap also tells us if the fiscal policy is pro- or countercyclical When β2 lt 0 the positive output gap decreases government sur-
5 Bohn (2005 2007) criticize fiscal sustainability analysis based on unit root and cointegration techniques popularized by Trehan and Walsh (1988) and Hamilton and Flavin (1986) He argues that such techniques are not capable of rejecting sustainability hypothesis because the relevant debt variables are necessary stationary after a finite number of differencing and thus in compliance with the intertemporal budget constraint (IBC)
vla
dim
ir ar
ča
bić
fisca
l co
nv
erg
enc
e an
d susta
ina
bility in th
e eur
opea
n un
ion
pub
lic secto
r ec
on
om
ics
42 (4) 353-380 (2018)
362 plus and fiscal policy can be considered as procyclical and vice versa (Balassone Francese and Zotteri 2010)
Our model includes a richer dynamic than initially proposed in Bohn (1998) by including a lagged primary surplus (Cassou Shadmani and Vaacutezquez 2017) This specification is more appropriate because it allows for fiscal policy persistence and because of a possible feedback effect between public debt and surplus in a panel framework accumulated government deficits (negative surpluses) are closely related to public debt
The benchmark model is estimated by a system GMM augmented with common correlated effects (CCE) proposed by Pesaran (2006) to deal with cross-sectional dependence The system GMM estimator proposed by Arellano and Bover (1995) and Blundell and Bond (1998) is often used for dynamic panel estimation and we use their two-step procedure with robust standard errors where fixed effects are removed by first differencing6
Our panel consists of European Union countries which are somewhat homoge-nous in terms of common institutions and policies and therefore a cross-sectional dependence can be an important issue affecting our results7 To deal with the issue of cross-sectional dependence we augment the system GMM estimator by adding cross-sectional means of all variables as instruments in the model from the equa-tion (9) Common correlated effects procedure is proposed by Pesaran (2006) for a group of OLS estimators However we use this principle to augment system GMM estimator Pesaran (2006) showed that adding CCE has satisfactory small sample properties for relatively small N and T even in heterogeneous models We call this model system GMM-CCE model
We confirm the robustness of the benchmark model by estimating a dynamic panel model with fixed effects (FE) using robust errors Our data set is a balanced panel with a reasonably large T = 62 and therefore the FE estimator should not be biased We refer to this model simply as the FE model
3 fIscal conVergence and sustaInabIlIty31 conVergence clubsWe do not find any evidence to support the absolute convergence of government debt revenues and expenditures in the EU using relative transition curves and log t test The relative transition curves in figure 1 show lack of convergence because they do not approach 1 in the observed period By contrast curves are scattered equally at the beginning and the end of the sample
6 We use first differencing instead of forward orthogonal deviaton (FOD) because our data set is a balanced panel Refer to Arellano and Bover (1995) and Blundell and Bond (1998) for complete technical details7 Indeed when we apply Pesaran (2015) test for weak cross-sectional dependence to the model the null hypoth-esis of cross-sectional independence can be easily rejected
vla
dim
ir ar
ča
bić
fisca
l co
nv
erg
enc
e an
d susta
ina
bility in th
e eur
opea
n un
ion
pub
lic secto
r ec
on
om
ics
42 (4) 353-380 (2018)363Figure 1
Relative transition paths(a) Gov debt (b) Gov revenues
Estonia Estonia
BelgiumGreece
05
11
52
25
Rel
ativ
e tra
nsiti
on p
aram
eter
2000q3 2004q3 2008q3 2012q3 2016q3Quarter
Transition paths for government debt
Cyprus
Ireland
SwedenFinland
68
11
21
4R
elat
ive
trans
ition
par
amet
er
2000q3 2004q3 2008q3 2012q3 2016q3Quarter
Transition paths for government revenue
(c) Gov expenditures
Ireland
Ireland
Croatia France
68
11
21
4R
elat
ive
trans
ition
par
amet
er
2000q3 2004q3 2008q3 2012q3 2016q3Quarter
Transition paths for government expenditures
This is further supported by a more formal log t test presented in table 1 Table 1 shows γ coefficient from the log t regression applied to government debt (1a) rev-enues (1b) and expenditures (1c) data Again γ lt 0 implies divergence 0 le γ lt 2 is evidence of conditional convergence and γ ge 2 implies absolute convergence in levels Table 1 shows that γ coefficient is significantly negative (marked with an asterisk) when log t test is applied to all EU countries which rejects absolute con-vergence of government debt revenues and expenditures Kočenda Kutan and Yigit (2008) also find fiscal divergence in a form of pronounced level of heteroge-neity in public debt and deficit among EU member states
We also find that the Great Recession and sovereign debt crisis further increased fiscal divergence in the EU In figure 2 we show results of estimated rolling win-dow γ coefficient for government debt revenues and expenditures We estimate the log t regression with a centered rolling window of 20 quarters (five years) together with 95 confidence intervals For all three variables estimates are sig-nificantly negative throughout the observed period which further confirms the result of fiscal divergence An interesting finding is that the estimated γ further decreases from 2008 in the case of government revenues and expenditures and from 2011 in the case of government debt Therefore it could be argued that the Great Recession and sovereign debt crisis pushed the EU further away from fiscal convergence
vla
dim
ir ar
ča
bić
fisca
l co
nv
erg
enc
e an
d susta
ina
bility in th
e eur
opea
n un
ion
pub
lic secto
r ec
on
om
ics
42 (4) 353-380 (2018)
364 Table 1log t convergence test results and convergence clubs classification
(a) government debt convergence resultslog(t) All countriesγ -0253t-stat -2213Club classificationlog(t) Club 1 [19] Club 2 [9]γ -000900 0560t-stat -0686 6100(b) government revenues convergence resultslog(t) All countriesγ -0729t-stat -3334Club classificationlog(t) Club 1 [19] Club 2 [5] Club 3 [2] Club 4 [2]γ 000700 0792 0114 -3378t-stat 0527 2275 0395 -2779(c) government expenditures convergence resultslog(t) All countriesγ -1075t-stat -1068Club classificationlog(t) Club 1 [5] Club 2 [11] Club 3 [6] Club 4 [3] Club 5 [2]γ 0284 0264 0113 0851 -0125t-stat 1016 1605 8963 9936 -0154Final classificationlog(t) Club 1 [5] Club 2 [11] Club 3 [9] Club 4 [2]γ 0284 0264 0169 -0125t-stat 1016 1605 1493 -0154
Note The table presents γ coefficient from log t regression together with t-statistics Marks a rejection of convergence at 5 level Numbers in brackets are number of countries in the club Club classification is a result of the initial clustering algorithm Final classification is a result after club merging Final classification is presented only when club merging is signifi-cant Countries that form different clubs are presented in figure 3
However we find strong evidence of club convergence Convergence clubs are implicitly included in discussions about the EU core and periphery as well as in the idea of two-speed recovery in Europe popularized by Blanchard (2010) We use the clustering algorithm of Phillips and Sul (2007 2009) to determine conver-gence clubs endogenously Results are presented in table 1 under Club classifica-tion section Countries that form convergence clubs are shown in figure 3
Table 1a presents results for government debt We find two convergence clubs one containing 19 and the other 9 countries The γ coefficient is statistically zero in the first and positive but less than 2 in the second club which indicates condi-tional convergence of clubs Similarly for government revenues three conver-
vla
dim
ir ar
ča
bić
fisca
l co
nv
erg
enc
e an
d susta
ina
bility in th
e eur
opea
n un
ion
pub
lic secto
r ec
on
om
ics
42 (4) 353-380 (2018)365gence clubs emerged and club sizes are 19 5 and 3 (table 1b) Ireland and Roma-
nia form a divergence group since they do not converge to any club For govern-ment expenditures club classification finds five clubs in total plus Ireland as a divergent group However clubs 3 and 4 can be merged together according to log t test so the final classification shows four convergence clubs plus Ireland (table 1c) Club sizes are 5 11 9 and 2 for Clubs 1 2 3 and 4 respectively In each case 0 le γ lt 2 indicating conditional convergence
Figure 2Rolling window estimation of log t regression
(a) Gov debt (b) Gov revenues
-9-8
-7-6
-5
2005q1 2008q1 2011q1 2014q1 2017q1
Time2log t coefficient
-9-8
-7-6
2005q1 2008q1 2011q1 2014q1 2017q1
Time2log t coefficient
(c) Gov expenditures
-12
-1-8
-6-4
-2
2005q1 2008q1 2011q1 2014q1 2017q1
Time2log t coefficient
Identified clubs are heterogeneous in a sense that countries within a club do not share common geographical political or development similarities In figure 3 we show countries that form different clubs The first row of figure 3 shows clubs from 1 to 4 and divergent groups The first column indicates fiscal variables gov-ernment debt revenues and expenditures Convergence clubs are in squares while divergent groups are in circles For example government debt Club 1 includes Croatia Cyprus Estonia Hungary Lithuania Romania Slovakia and Slovenia which are new member states mostly small countries and most of them experienced the transition from centrally planned to market economy However Austria Belgium Finland France Greece Ireland Italy Portugal Spain Swe-den and the UK are also members of the same club (government debt Club 1) Similar diversity can be found within other clubs
vla
dim
ir ar
ča
bić
fisca
l co
nv
erg
enc
e an
d susta
ina
bility in th
e eur
opea
n un
ion
pub
lic secto
r ec
on
om
ics
42 (4) 353-380 (2018)
366 Figure 3Convergence clubs
Club 1 Club 2
Gov
exp
endi
ture
s G
ov r
even
ues
Gov
deb
t
Club 3 Club 4 Group
Austria Belgium CroatiaCyprus Estionia FinlandFrance Greece HungaryIreland Italy Lithuania
Portugal Romania Slovakia Slovenia Spain
Sweden UK
Bulgaria CzechRepublic Denmark
Germany LatviaLuxembourg Malta
NetherlandsPoland
CyprusMaltaPoland
Spain UK
Austria CroatiaCyprus EstoniaHungary Italy
Portugal Slovakia Slovenia Spain
Sweden
Bulgaria CzechRepublic GermanyLatvia LuxembourgMalta Netherlands
Poland UK
BulgariaLithuania Ireland
Romania
Ireland
LithuaniaRomania
Austria Belgium CroatiaCzech Republic DenmarkEstionia Finland France
Germany Greece HungaryItaly Latvia Luxembourg
Netherlands Portugal Slovakia Slovenia Sweden
BelgiumDenmark
Finland FranceGreece
Note Convergence clubs are in squares non-convergent groups are in circles
We find a substantial degree of homogeneity in government debt revenues and expenditures clubs For example government debt Club 1 and government reve-nues Club 1 share 12 of 19 countries (figure 3) All eleven countries in govern-ment expenditures Club 2 are also in government debt Club 1 There is a major overlap between government debt Club 2 and government expenditures Club 3 Other similarities can also be observed in figure 3 Therefore clubs are heteroge-neous within countries but homogenous in fiscal variables
Endogenously identified clubs indeed show evidence of convergence but this is not the case for ad-hoc exogenous clubs First we group countries into EU-15 and EU-13 and apply the log t regression to government debt revenues and expendi-tures data The results reject convergence in all cases except for government debt in EU-13 where the γ coefficient is statistically equal to zero (0042 with a t-sta-tistic of 134) Next we group countries into EU core and periphery8 and use the log t test Convergence is strongly rejected in both groups for all three fiscal vari-ables It seems that countries converge to some criteria other than simply geo-graphical political or development similarities or indeed multiple similarities9 These results could be compared with Kočenda Kutan and Yigit (2008) who ana-lyze fiscal convergence in the ten EU countries that joined EU in 2004 They do not find a systematic difference among all EU countries EU core and EU periph-ery when analyzing fiscal convergence Delgado (2006) uses cluster analysis to group EU countries thus avoiding ad-hoc exogenous clubs but the paper does not tackle the issue of fiscal club convergence
8 EU core countries are Austria Belgium Denmark Finland France Germany Luxembourg Netherlands Sweden and UK Other 18 countries form EU periphery9 Analysis of factors and criteria to which countries converge is beyond the scope of this paper
vla
dim
ir ar
ča
bić
fisca
l co
nv
erg
enc
e an
d susta
ina
bility in th
e eur
opea
n un
ion
pub
lic secto
r ec
on
om
ics
42 (4) 353-380 (2018)367The log t regression improves upon the standard β-convergence tests but results are
compatible with such tests In figure 4 we show a simple scatter plot of government debt level and a growth rate which is a version of an unconditional β-convergence test For government debt Clubs 1 and 2 we estimate the equation of the form log (dTi d1i) = α + β d1i + εi where the dependent variable is the debt growth rate between the last and the first period and the independent variable is a debt level in the first period Club 1 is depicted with black circles and Club 2 with grey pluses As shown in the figure 4 regression lines for each club are negatively sloped indi-cating convergence within clubs according to the standard β-convergence test
Figure 4β-convergence in clubs
-1-5
05
11
5
Deb
t gro
wth
0 1 2 3 4 5Debt level
Club 1 Club 2
Beta convergence among clubs
32 unIt root tests of fIscal conVergenceTable 2 presents results of fiscal convergence using unit root tests for the sample of 28 EU countries and within clubs identified by the clustering algorithm For the government debt data we analyze convergence to the average for the full sample of the EU 28 then for the 19 countries of convergence club 1 and then for the 9 countries of club 2 (table 2a) A similar analysis is done for government revenues and expenditure in table 2b and 2c respectively For each club we compute a separate adjusted average Unit root rejection rates at 10 significance level are presented for ADF Lee and Strazicich (2003) and Enders and Lee (2012) test Rejection of the unit root hypothesis is considered evidence of convergence
vla
dim
ir ar
ča
bić
fisca
l co
nv
erg
enc
e an
d susta
ina
bility in th
e eur
opea
n un
ion
pub
lic secto
r ec
on
om
ics
42 (4) 353-380 (2018)
368 Table 2Club convergence using unit root tests2a Percent of countries converging to the average gov debt ()
adf lee amp strazicich enders amp leeEU [28] 357 357 714Club 1 [19] 000 526 526Club 2 [9] 2222 000 000
2b Percent of countries converging to the average gov revenues ()adf lee amp strazicich enders amp lee
EU [28] 3571 8571 4643Club 1 [19] 4211 9474 5789Club 2 [5] 4000 10000 4000Club 3 [2] 000 10000 10000
2c Percent of countries converging to the average gov expenditures ()adf lee amp strazicich enders amp lee
EU [28] 3929 7857 4643Club 1 [5] 4000 10000 4000Club 2 [11] 5455 9091 8181Club 3 [9] 3333 7778 5556Club 4 [2] 10000 10000 10000
Notes Rejection rates of unit root hypothesis at 10 level of significance are reported in the table Number of countries in a club is in brackets The rejection rate is calculated as ( of rejections of countries within a club)times100
We find neither absolute nor club convergence in government debt data because the difference of government debt against the average is stationary for just a few countries For the full sample of EU 28 unit root rejection rates are only 35 in the case of ADF and the Lee and Strazicich test and 7 for the Enders and Lee test Rejection rates within two clubs are not much different thus not supporting club convergence of government debt
In the case of government revenues and expenditures we do not find evidence of absolute convergence but club convergence is supported Almost half of countries in the EU 28 sample converge to the average ADF test has low power in the pres-ence of structural breaks but the unit root is rejected in 35 to 40 of countries for both series The Enders and Lee test has more power and rejects the unit root in 46 of countries Finally the Lee and Strazicich test with sharp structural breaks shows the biggest rejection rates of 78 and 85 For both government revenues and expenditures rejection rates within clubs are higher than in the full sample of EU 28 indicating stronger convergence within clubs This is especially true for Lee and Strazicich (2003) test where rejection rates are mostly over 90 within clubs indicating strong club convergence Enders and Lee (2012) test has rejection rates within clubs well over 50 except in government revenues club 2 and government expenditures club 1 ADF test gives somewhat mixed results but does not reject the club convergence hypothesis This confirms that convergence clubs using the Phillips and Sul (2007 2009) clustering algorithm are robust
vla
dim
ir ar
ča
bić
fisca
l co
nv
erg
enc
e an
d susta
ina
bility in th
e eur
opea
n un
ion
pub
lic secto
r ec
on
om
ics
42 (4) 353-380 (2018)369except for government debt As a comparison De Bandt and Mongelli (2000) use
cointegration techniques to analyze fiscal convergence in the Eurozone Their findings support fiscal convergence in the Eurozone over the 1970-1998 period Unit root tests which allow for nonlinearities have recently been a more popular way of analyzing convergence (see Raguž Krištić Rogić Dumančić and Arčabić (2018) and references therein)
33 fIscal (un)sustaInabIlItyNext we analyze if fiscal policy is sustainable in the European Union and within convergence clubs found in the previous section In this respect we use the policy response function from equation (9) which relates primary government surplus with public debt and the output gap If surplus increases as a response to an increase in public debt fiscal policy is considered sustainable as discussed in the methodology section
We analyze fiscal sustainability using seven different models (subsamples) Model 1 is the benchmark model which includes 28 EU countries Models 2 and 3 include subsamples of countries from government debt convergence clubs identi-fied in the previous section The first club consists of 19 and the second of 9 countries10 Next we consider fiscal policy sustainability within exogenous clubs of EU-15 and EU-13 countries with Models 4 and 5 Finally Models 6 and 7 use subsamples with government debt ge 90 (Model 6) and debt lt 90 of GDP (Model 7) This subsample analysis is motivated by the influential paper of Rein-hart and Rogoff (2010) who argue that a public debt higher than 90 of GDP depresses economic growth Maastricht criteria also require government debt below 60 of GDP However EU countries fought with the Great Recession and the sovereign debt crisis which substantially increased the level of public debt in some countries Our data show that 15 out of 28 EU countries had a government debt higher than 60 of GDP in 2017Q2 Therefore such subsample analysis is interesting from both an academic and a policy perspective The 90 level of public debt can be considered as arbitrary especially since Arčabić et al (2018) show there is no single level of public debt associated with the decrease of GDP growth However in this paper we are only interested in fiscal sustainability
Fiscal policy is found to be unsustainable in the EU We present the results of system GMM-CCE and FE estimators in tables 3 and 4 respectively Different models are numbered in the first row of each table and independent variables are in the first column In table 3 the estimated coefficient β1 next to the government debt is negative or insignificant In other words the government does not increase primary surplus as a response of higher government debt and fiscal policy is not sustainable We find weak evidence of fiscal sustainability for the EU-13 group countries and for the subsample with debt ge 90 For these two models (Models
10 We consider government debt convergence clubs only but clubs are fairly homogeneous between fiscal variables as discussed In addition some government revenues and expenditures convergence clubs include only a few countries which is impractical for panel data analysis
vla
dim
ir ar
ča
bić
fisca
l co
nv
erg
enc
e an
d susta
ina
bility in th
e eur
opea
n un
ion
pub
lic secto
r ec
on
om
ics
42 (4) 353-380 (2018)
370 5 and 6) point estimates are positive with both system GMM-CCE and FE estima-tor However coefficients are insignificant for system GMM-CCE estimator and point estimates are small in magnitude in both cases (tables 3 and 4)
Fiscal policy is countercyclical in the EU and in all subsamples considered Balas-sone Francese and Zotteri (2010) and Cassou Shadmani and Vaacutezquez (2017) use β2 coefficient next to the output gap to analyze cyclicality of fiscal policy As pre-sented in tables 3 and 4 the coefficient next to output gap is positive and statisti-cally significant in all models11 Positive output gaps are related to an increase in primary surplus which can be interpreted as a countercyclical fiscal policy This indicates that fiscal policy in the European Union tries to smooth business cycles
Fiscal policy is fairly persistent because the coefficient ρ next to the lagged sur-plus is positive statistically significant and roughly 05
11 Only Model 6 in table 4 has a positive but insignificant output gap
vla
dim
ir ar
ča
bić
fisca
l co
nv
erg
enc
e an
d susta
ina
bility in th
e eur
opea
n un
ion
pub
lic secto
r ec
on
om
ics
42 (4) 353-380 (2018)371
Ta
bl
e 3
Resu
lts o
f fisc
al su
stai
nabi
lity
anal
ysis
usi
ng sy
stem
GM
M-C
CE
mod
el
mod
els
mod
el 1
ben
chm
ark
mod
el 2
clu
b 1
mod
el 3
clu
b 2
mod
el 4
eu
-15
mod
el 5
eu
-13
mod
el 6
deb
t ge 9
0m
odel
7d
ebt lt
90
Varia
bles
Surp
lus
Surp
lus
Surp
lus
Surp
lus
Surp
lus
Surp
lus
Surp
lus
Surp
lus (
lagg
ed) (
ρ)0
502
(0
08)
041
5
(00
9)0
390
(0
10)
054
7
(00
6)0
308
(0
11)
057
3
(02
1)0
526
(0
10)
Deb
t (β 1)
-00
18(0
01)
-00
09(0
01)
-00
43(0
12)
-00
29(0
02)
004
0(0
03)
003
6(0
08)
-00
57
(00
3)
Out
put G
ap (β
2)0
286
(0
05)
041
3
(00
7)0
435
(0
13)
039
4
(00
4)0
388
(0
15)
029
7
(00
9)0
305
(0
07)
Con
stan
t0
776
(07
6)0
122
(10
6)2
030
(56
3)1
879
(12
3)-2
351
(1
15)
-42
98(8
69)
245
9
(14
4)O
bser
vatio
ns1
708
115
954
991
579
328
11
427
Num
ber o
f cou
ntrie
s28
199
15
13
926
F-te
st0
340
e-06
000
139
02
43e-
05 0
003
520
of
inst
rum
ents
2314
1114
11
11
20H
anse
n te
st0
222
010
00
371
017
50
102
050
60
166
Not
e S
tand
ard
erro
rs in
par
enth
eses
and
m
ark
stat
istic
al s
igni
fican
ce a
t 1
5
and
10
leve
l M
odel
1 is
the
benc
hmar
k m
odel
Mod
els
2 an
d 3
incl
ude
coun
trie
s fro
m e
ndog
enou
s deb
t con
verg
ence
clu
bs 1
and
2 r
espe
ctiv
ely
Mod
els 4
and
5 in
clud
e EU
-15
and
EU-1
3 co
untr
ies
and
mod
els 6
and
7 in
clud
e su
bsam
ples
with
go
vern
men
t deb
t ge 9
0 a
nd d
ebt lt
90
of G
DP
resp
ectiv
ely
vla
dim
ir ar
ča
bić
fisca
l co
nv
erg
enc
e an
d susta
ina
bility in th
e eur
opea
n un
ion
pub
lic secto
r ec
on
om
ics
42 (4) 353-380 (2018)
372
Ta
bl
e 4
Resu
lts o
f fisc
al su
stai
nabi
lity
anal
ysis
usi
ng F
E m
odel
mod
els
mod
el 1
ben
chm
ark
mod
el 2
clu
b 1
mod
el 3
clu
b 2
mod
el 4
eu
-15
mod
el 5
eu
-13
mod
el 6
deb
t ge 9
0m
odel
7d
ebt lt
90
Varia
bles
Surp
lus
Surp
lus
Surp
lus
Surp
lus
Surp
lus
Surp
lus
Surp
lus
Surp
lus (
lagg
ed) (
ρ)0
512
(0
06)
051
5
(00
7)0
491
(0
12)
063
7
(00
4)0
336
(0
07)
024
8
(01
0)0
611
(0
09)
Deb
t (β 1)
000
6(0
01)
000
4(0
01)
002
5(0
02)
000
3(0
00)
002
9
(00
1)0
031
(0
01)
-00
09(0
01)
Out
put G
ap (β
2)0
176
(0
04)
017
2
(00
4)0
209
(0
09)
022
6
(00
3)0
197
(0
05)
021
3(0
12)
013
3
(00
4)
Con
stan
t-0
614
(0
36)
-07
13(0
42)
-09
98(0
71)
-03
27(0
35)
-18
31
(0
40)
-39
51
(14
8)0
168
(06
3)O
bser
vatio
ns1
708
115
954
991
579
328
11
427
R-s
quar
ed0
304
029
80
335
045
70
173
012
30
384
Num
ber o
f cou
ntrie
s28
199
1513
926
Not
e S
tand
ard
erro
rs in
par
enth
eses
and
m
ark
stat
istic
al s
igni
fican
ce a
t 1
5
and
10
leve
l M
odel
1 is
the
benc
hmar
k m
odel
Mod
els
2 an
d 3
incl
ude
coun
trie
s fro
m e
ndog
enou
s deb
t con
verg
ence
clu
bs 1
and
2 r
espe
ctiv
ely
Mod
els 4
and
5 in
clud
e EU
-15
and
EU-1
3 co
untr
ies
and
mod
els 6
and
7 in
clud
e su
bsam
ples
with
go
vern
men
t deb
t ge 9
0 a
nd d
ebt lt
90
of G
DP
resp
ectiv
ely
vla
dim
ir ar
ča
bić
fisca
l co
nv
erg
enc
e an
d susta
ina
bility in th
e eur
opea
n un
ion
pub
lic secto
r ec
on
om
ics
42 (4) 353-380 (2018)3734 conclusIon
The Great Recession and the sovereign debt crisis in the Eurozone have shaken fiscal policies in the EU Many European countries have breached public debt and deficit goals set by the Stability and Growth Pact Therefore the issue of fiscal policy convergence and sustainability is very important for the EU
This paper analyzes fiscal policy convergence and tests for fiscal sustainability in 28 EU countries using data on government debt revenues and expenditures We show absolute divergence in fiscal policies which was further increased by the Great Recession and the sovereign debt crisis However we find strong evidence of club convergence Club convergence is important to consider because the EU does not have a single fiscal policy and member state policies are heterogeneous In general convergence clubs are implicitly included in discussions on the EU core and periphery and in the two-speed recovery idea which argues that different groups (or clubs) of European countries are characterized by faster and slower recoveries from the recession We find two government debt convergence clubs three government revenue clubs and four government expenditure clubs Endog-enously identified clubs do not have simple geographical political or development similarities They are heterogeneous within countries but homogenous between fiscal variables Exogenous grouping of EU countries into EU-15 and EU-13 or into EU core and periphery does not show evidence of fiscal convergence Conver-gence clubs are related to multiple equilibriums within the EU which makes a single fiscal policy difficult to achieve More precise fiscal rules could be consid-ered by policymakers together with corrective measures such as the Excessive Deficit Procedure Fiscal rules instead of discretionary decision making might be a step toward similar fiscal policies and fiscal convergence in the EU
Fiscal policy in the EU is found to be unsustainable but countercyclical We use a policy response function for the sustainability analysis where primary surplus is a function of government debt and the output gap We show that surplus does not respond to an increase in government debt which cannot be interpreted as sustain-able However primary government surplus increases in expansions and decreases in recession thus being countercyclical and aimed at smoothing business cycles In this respect the fiscal goals for public debt and deficit set by the Stability and Growth Pact may not be enough to ensure fiscal sustainability More precise fiscal rules together with corrective measures would be helpful for both fiscal sustaina-bility and convergence
disclosure statement No potential conflict of interest was reported by the author
vla
dim
ir ar
ča
bić
fisca
l co
nv
erg
enc
e an
d susta
ina
bility in th
e eur
opea
n un
ion
pub
lic secto
r ec
on
om
ics
42 (4) 353-380 (2018)
374 aPPendIX
data constructIon and sourcesFor the convergence analysis we use data on general government debt revenues and expenditures Variables are in millions of euro current prices We divide all by nominal GDP to express fiscal variables in real terms and in a percent of GDP The main data source is Eurostat and the International Financial Statistics data-base from the International Monetary Fund All data span the period from 2000q1 to 2017q2 but some data have been reconstructed For Germany Estonia Ire-land and Luxemburg we interpolate annual data for 2000 and 2001 since quar-terly data start from 2002q1 For Austria we interpolate annual data for 2000 since quarterly data start from 2001q1 For Croatia we reconstruct monthly data on central government expenditure and revenue based on the old methodology The data are provided by Croatian National Bank (CNB) and we use central gov-ernment data as a proxy for the general government Nominal GDP is taken from the Eurostat database except for Croatia Malta and Poland for which we take the data from IFS Public debt data are entirely taken from the Eurostat database Public debt is usually expressed as a percent of GDP on annual bases Therefore public debt is divided by a sum of GDP in a current and previous three quarters or where dt is public debt in a percent of GDP $dt and $yt are nominal debt and GDP in millions of euro We use this approach for the sustainability analysis when the sample starts in 2002q1 For the convergence analysis where the sample starts in 2000q1 we divide public debt only by current quarter GDP to maximize number of observations or dt = ($dt $yt ) times 100 For the sustainability analysis we also use primary surplus and real GDP data from Euro-stat All the data span the period from 2002q1 to 2017q2 (balanced panel) Below we plot time series of government revenues and expenditures (figure A1) and primary surplus and government debt (figure A2) in a percent of GDP Table A1 contains basic descriptive statistics
vla
dim
ir ar
ča
bić
fisca
l co
nv
erg
enc
e an
d susta
ina
bility in th
e eur
opea
n un
ion
pub
lic secto
r ec
on
om
ics
42 (4) 353-380 (2018)375
Fig
ur
e a
1G
over
nmen
t rev
enue
s and
exp
endi
ture
s as a
per
cent
of G
DP
Rev
enue
sEx
pend
iture
s
BE
L
2000
2002
2004
2006
2008
2010
2012
2014
2017
046
048
050
052
054
056
058
060
BU
L
2000
2002
2004
2006
2008
2010
2012
2014
2017
027
50
300
032
50
350
037
50
400
042
50
450
047
5C
ZE
2000
2002
2004
2006
2008
2010
2012
2014
2017
035
040
045
050
055
060
065
DE
N
2000
2002
2004
2006
2008
2010
2012
2014
2017
048
050
052
054
056
058
060
GE
R
2000
2002
2004
2006
2008
2010
2012
2014
2017
040
042
044
046
048
050
052
EST
2000
2002
2004
2006
2008
2010
2012
2014
2017
030
00
325
035
00
375
040
00
425
045
00
475
050
00
525
IRE
2000
2002
2004
2006
2008
2010
2012
2014
2017
02
03
04
05
06
07
08
GR
E
2000
2002
2004
2006
2008
2010
2012
2014
2017
035
040
045
050
055
060
065
070
075
080
SPA
2000
2002
2004
2006
2008
2010
2012
2014
2017
032
50
350
037
50
400
042
50
450
047
50
500
052
5FR
A
2000
2002
2004
2006
2008
2010
2012
2014
2017
048
050
052
054
056
058
CR
O
2000
2002
2004
2006
2008
2010
2012
2014
2017
035
040
045
050
055
060
065
ITA
2000
2002
2004
2006
2008
2010
2012
2014
2017
040
042
044
046
048
050
052
CY
P
2000
2002
2004
2006
2008
2010
2012
2014
2017
03
04
05
06
07
08
LA
T
2000
2002
2004
2006
2008
2010
2012
2014
2017
030
00
325
035
00
375
040
00
425
045
00
475
LIT
2000
2002
2004
2006
2008
2010
2012
2014
2017
030
00
325
035
00
375
040
00
425
045
00
475
050
00
525
LU
X
2000
2002
2004
2006
2008
2010
2012
2014
2017
032
50
350
037
50
400
042
50
450
047
5H
UN
2000
2002
2004
2006
2008
2010
2012
2014
2017
040
042
044
046
048
050
052
054
056
MA
L
2000
2002
2004
2006
2008
2010
2012
2014
2017
030
035
040
045
050
055
NE
T
2000
2002
2004
2006
2008
2010
2012
2014
2017
038
040
042
044
046
048
050
AU
S
2000
2002
2004
2006
2008
2010
2012
2014
2017
042
50
450
047
50
500
052
50
550
057
50
600
POL
2000
2002
2004
2006
2008
2010
2012
2014
2017
036
038
040
042
044
046
048
POR
2000
2002
2004
2006
2008
2010
2012
2014
2017
035
040
045
050
055
060
065
RO
M
2000
2002
2004
2006
2008
2010
2012
2014
2017
027
50
300
032
50
350
037
50
400
042
50
450
SLO
2000
2002
2004
2006
2008
2010
2012
2014
2017
040
045
050
055
060
065
070
075
080
085
SVK
2000
2002
2004
2006
2008
2010
2012
2014
2017
032
50
350
037
50
400
042
50
450
047
50
500
052
50
550
FIN
2000
2002
2004
2006
2008
2010
2012
2014
2017
046
048
050
052
054
056
058
060
SWE
2000
2002
2004
2006
2008
2010
2012
2014
2017
048
050
052
054
056
058
UK
2000
2002
2004
2006
2008
2010
2012
2014
2017
034
036
038
040
042
044
046
048
050
vla
dim
ir ar
ča
bić
fisca
l co
nv
erg
enc
e an
d susta
ina
bility in th
e eur
opea
n un
ion
pub
lic secto
r ec
on
om
ics
42 (4) 353-380 (2018)
376
Fig
ur
e a
2Pr
imar
y su
rplu
s and
gov
ernm
ent d
ebt a
s a p
erce
nt o
f GD
P B
EL
2002
2004
2006
2008
2010
2012
2014
2017
-75
-50
-2500
25
50
75
875
900
925
950
975
100
010
25
105
010
75
110
0B
UL
2002
2004
2006
2008
2010
2012
2014
2017
-12
5-1
00
-75
-50
-2500
25
50
75
100
10203040506070C
ZE
2002
2004
2006
2008
2010
2012
2014
2017
-12
-10-8-6-4-2024
250
275
300
325
350
375
400
425
450
475
DE
N
2002
2004
2006
2008
2010
2012
2014
2017
-4-202468
2025303540455055G
ER
2002
2004
2006
2008
2010
2012
2014
2017
-6-4-2024
55606570758085
EST
2002
2004
2006
2008
2010
2012
2014
2017
-8-6-4-202468
34567891011IR
E
2002
2004
2006
2008
2010
2012
2014
2017
-50
-40
-30
-20
-10010
20406080100
120
140
GR
E
2002
2004
2006
2008
2010
2012
2014
2017
-30
-25
-20
-15
-10-50510
100
110
120
130
140
150
160
170
180
190
SPA
2002
2004
2006
2008
2010
2012
2014
2017
-12
-10-8-6-4-20246
30405060708090100
110
FRA
2002
2004
2006
2008
2010
2012
2014
2017
-6-5-4-3-2-101
556065707580859095100
CR
O
2002
2004
2006
2008
2010
2012
2014
2017
-6-4-20246
30405060708090IT
A
2002
2004
2006
2008
2010
2012
2014
2017
-2-1012345
100
105
110
115
120
125
130
135
CY
P
2002
2004
2006
2008
2010
2012
2014
2017
-35
-30
-25
-20
-15
-10-50510
405060708090100
110
LA
T
2002
2004
2006
2008
2010
2012
2014
2017
-10-8-6-4-2024
5101520253035404550L
IT
2002
2004
2006
2008
2010
2012
2014
2017
-20
-15
-10-505
1015202530354045
LU
X
2002
2004
2006
2008
2010
2012
2014
2017
-4-20246
51015202530H
UN
2002
2004
2006
2008
2010
2012
2014
2017
-12
5-1
00
-75
-50
-2500
25
50
75
5055606570758085M
AL
2002
2004
2006
2008
2010
2012
2014
2017
-15
0-1
25
-10
0-7
5-5
0-2
500
25
50
75
550
575
600
625
650
675
700
725
NE
T
2002
2004
2006
2008
2010
2012
2014
2017
-5-4-3-2-101234
40455055606570A
US
2002
2004
2006
2008
2010
2012
2014
2017
-8-6-4-2024
60657075808590
POL
2002
2004
2006
2008
2010
2012
2014
2017
-7-6-5-4-3-2-1012
350
375
400
425
450
475
500
525
550
575
POR
2002
2004
2006
2008
2010
2012
2014
2017
-15
-10-50510
5060708090100
110
120
130
140
RO
M
2002
2004
2006
2008
2010
2012
2014
2017
-10
0-7
5-5
0-2
500
25
50
10152025303540SL
O
2002
2004
2006
2008
2010
2012
2014
2017
-35
-30
-25
-20
-15
-10-505
2030405060708090SV
K
2002
2004
2006
2008
2010
2012
2014
2017
-8-6-4-202
2530354045505560
FIN
2002
2004
2006
2008
2010
2012
2014
2017
-4-20246810
253035404550556065SW
E
2002
2004
2006
2008
2010
2012
2014
2017
-2-10123456
303540455055U
K
2002
2004
2006
2008
2010
2012
2014
2017
-10-8-6-4-202
30405060708090100
Prim
ary
surp
lus
Publ
ic d
ebt (
right
axi
s)
vla
dim
ir ar
ča
bić
fisca
l co
nv
erg
enc
e an
d susta
ina
bility in th
e eur
opea
n un
ion
pub
lic secto
r ec
on
om
ics
42 (4) 353-380 (2018)377Table a1
Descriptive statistics
country revenues expenditures debt surplusmean st dev mean st dev mean st dev mean st dev
Belgium 0498 0014 0519 0029 102371 6191 1489 2662Bulgaria 0375 0032 0378 0035 25430 12762 0809 3995Czech R 0397 0021 0427 0030 34493 6377 -1570 2538Denmark 0542 0012 0537 0025 41284 6727 2350 2937Germany 0439 0011 0453 0017 69791 6443 0853 1749Estonia 0380 0027 0376 0035 6770 2386 0605 2605Ireland 0331 0031 0374 0095 63992 35900 -3019 8925Greece 0427 0042 0501 0052 135084 31814 -2996 4643Spain 0380 0016 0417 0035 64440 24433 -1729 4398France 0506 0016 0544 0023 78400 13788 -1601 1526Croatia 0433 0030 0478 0030 56491 19248 -1880 2281Italy 0453 0019 0485 0019 115085 12457 1345 1277Cyprus 0365 0030 0395 0055 73230 21307 -0192 5510Latvia 0352 0022 0374 0036 26770 14433 -1088 3003Lithuania 0341 0013 0367 0039 28502 10293 -1275 3675Luxembourg 0434 0013 0418 0026 14941 7215 1360 1821Hungary 0444 0021 0490 0023 69585 8796 -0745 3255Malta 0384 0020 0416 0023 66048 4001 0266 2870Netherlands 0429 0009 0446 0021 56298 8245 -0165 2086Austria 0489 0012 0513 0019 76310 6738 0363 1796Poland 0395 0013 0435 0018 48860 5134 -1724 1608Portugal 0415 0021 0469 0035 92343 30325 -1906 3499Romania 0335 0016 0367 0033 25756 10096 -1550 3267Slovenia 0434 0010 0472 0048 44276 22349 -1759 4888Slovakia 0373 0024 0417 0039 43263 8989 -1969 2157Finland 0531 0013 0520 0040 46337 10241 1891 3288Sweden 0520 0019 0515 0016 42539 4814 1568 1730UK 0378 0012 0420 0036 60967 22826 -2558 2478
vla
dim
ir ar
ča
bić
fisca
l co
nv
erg
enc
e an
d susta
ina
bility in th
e eur
opea
n un
ion
pub
lic secto
r ec
on
om
ics
42 (4) 353-380 (2018)
378 references1 Arčabić V [et al] 2018 Public Debt and Economic Growth Conundrum
Nonlinearity and Inter-temporal Relationship Studies in nonlinear dynamics and econometrics 22(1) pp 1-20 httpsdoiorg101515snde-2016-0086
2 Arellano M and Bover O 1995 Another look at the instrumental variable estimation of error-components models Journal of econometrics 68(1) pp 29-51 httpsdoiorg1010160304-4076(94)01642-D
3 Babić A 2003 Dynamic analysis of Croatiarsquos fiscal and external debt Privredna kretanja i ekonomska politika 13(97) pp 77-126 Available at lthttpshrcaksrcehrfile28961gt
4 Balassone F Francese M and Zotteri S 2010 Cyclical asymmetry in fiscal variables in the EU Empirica 37(4) pp 381-402 httpsdoiorg101007s10663-009-9114-7
5 Bernard A B and Durlauf S N 1995 Convergence in international out-put Journal of applied econometrics 10(2) pp 97-108 httpsdoiorg 101002jae3950100202
6 Bernard A B and Durlauf S N 1996 Interpreting tests of the convergence hypothesis Journal of econometrics 71(1-2) pp 161-173 httpsdoiorg 1010160304-4076(94)01699-2
7 Blanchard O 2010 Interview IMF Survey Two-speed Recovery to Extend into 2011 Says IMF In International Monetary Fund December 30 2010 Available at lthttpswwwimforgenNewsArticles201509280453sonew123010agt
8 Blundell R and Bond S 1998 Initial conditions and moment restrictions in dynamic panel data models Journal of econometrics 87(1) pp 115-143 httpsdoiorg101016S0304-4076(98)00009-8
9 Bohn H 1998 The behavior of US public debt and deficits The Quarterly Journal of economics 113(3) pp 949-963 httpsdoiorg101162003355 398555793
10 Bohn H 2005 The Sustainability of Fiscal Policy in the United States CESifo Group Munich Working paper No 1446 Available at lthttpwwwcesifo-groupdeDocDLcesifo1_wp1446pdfgt
11 Bohn H 2007 Are stationarity and cointegration restrictions really neces-sary for the intertemporal budget constraint Journal of monetary economics 54(7) pp 1837-1847 httpsdoiorg101016jjmoneco200612012
12 Cassou S P Shadmani H and Vaacutezquez J 2017 Fiscal policy asymmetries and the sustainability of US government debt revisited Empirical econom-ics 53(3) pp 1193-1215 httpsdoiorg101007s00181-016-1159-4
13 Collignon S 2012 Fiscal policy rules and the sustainability of public debt in Europe International economic review 53(2) pp 539-567 httpsdoiorg 101111j1468-2354201200691x
14 De Bandt O and Mongelli F 2000 Convergence of fiscal policies in the euro area European Central Bank Working paper No 20 Available at lt https
vla
dim
ir ar
ča
bić
fisca
l co
nv
erg
enc
e an
d susta
ina
bility in th
e eur
opea
n un
ion
pub
lic secto
r ec
on
om
ics
42 (4) 353-380 (2018)379wwwecbeuropaeupubpdfscpwpsecbwp020pdffb62cab7f4d858d8e528
47b202892351gt 15 Delgado F 2006 Are the tax mix and the fiscal pressure converging in the
European Union Instituto de Estudios Fiscales Working paper No 11-0616 Deskar-Škrbić M and Šimović H 2017 Effectiveness of fiscal spending in
Croatia Slovenia and Serbia The role of trade openness and public debt level Post-communist economies 29(3) pp 336-358 httpsdoiorg1010801463137720161267972
17 Du K 2017 Econometric convergence test and club clustering using Stata Stata journal 17(4) pp 882-900 Available at lt httpsmedmahidolacthcebsitesdefaultfilespublicpdfstata_journalsj17-4pdfgt
18 Enders W and Lee J 2012 A unit root test using a Fourier series to approx-imate smooth breaks Oxford bulletin of economics and statistics 74(4) pp 574-599 httpsdoiorg101111j1468-0084201100662x
19 Hamilton J D and Flavin M A 1986 On the Limitations of Government Borrowing A Framework for Empirical Testing American economic review 76(4) pp 808-819
20 Hodrick R J and Prescott E C 1997 Postwar US business cycles an empirical investigation Journal of money credit and banking pp 1-16 httpsdoiorg1023072953682
21 Kočenda E Kutan A M and Yigit T M 2008 Fiscal convergence in the European Union The North American journal of Economics and finance 19(3) pp 319-330 httpsdoiorg101016jnajef200806003
22 Lee J and Strazicich M C 2003 Minimum Lagrange multiplier unit root test with two structural breaks Review of economics and statistics 85(4) pp 1082-1089 httpsdoiorg101162003465303772815961
23 Mihaljek D 2003 Analysis of public and external debt sustainability for Croatia Application of standard financial indicators Privredna kretanja i ekonomska politika 13(97) pp 29-75 Available at lthttpshrcaksrcehrfile28958gt
24 Perron P 1989 The great crash the oil price shock and the unit root hypoth-esis Econometrica pp 1361-1401 httpsdoiorg1023071913712
25 Pesaran M H (2006) Estimation and inference in large heterogeneous pan-els with a multifactor error structure Econometrica 74(4) pp 967-1012 httpsdoiorg101111j1468-0262200600692x
26 Pesaran M H 2007 A pair-wise approach to testing for output and growth convergence Journal of econometrics 138(1) pp 312-355 httpsdoiorg 101016jjeconom200605024
27 Pesaran M H 2015 Testing weak cross-sectional dependence in large pan-els Econometric reviews 34(6-10) pp 1089-1117 httpsdoiorg101080074749382014956623
28 Phillips P C and Sul D 2007 Transition modeling and econometric conver-gence tests Econometrica 75(6) pp 1771-1855 httpsdoiorg101111 j1468-0262200700811x
vla
dim
ir ar
ča
bić
fisca
l co
nv
erg
enc
e an
d susta
ina
bility in th
e eur
opea
n un
ion
pub
lic secto
r ec
on
om
ics
42 (4) 353-380 (2018)
380 29 Phillips P C and Sul D 2009 Economic transition and growth Journal of applied econometrics 24(7) pp 1153-1185 httpsdoiorg101002jae1080
30 Raguž Krištić I Rogić Dumančić L and Arčabić V 2018 Persistence and stochastic convergence of euro area unemployment rates Economic Model-ling httpsdoiorg101016jeconmod201807032
31 Reinhart C M and Rogoff K S 2010 Growth in a Time of Debt American economic review 100(2) pp 573-78 httpsdoiorg101257aer1002573
32 Trehan B and Walsh C E 1988 Common trends the governmentrsquos budget constraint and revenue smoothing Journal of economic dynamics and con-trol 12(2-3) pp 425-444 httpsdoiorg1010160165-1889(88)90048-6
Efficiency vs effectiveness an analysis of tertiary education across Europe
OZANA NADOVEZA JELIĆ PhDMARGARETA GARDIJAN KEDŽO PhD
ArticleJEL I21 I22 I23httpsdoiorg103326pse4242
The authors would like to thank two anonymous referees for helpful comments on the paper Received June 1 2018
Accepted October 21 2018
The article was submitted for the 2018 annual award of the Prof Dr Marijan Hanžeković Prize
Ozana NADOVEZA JELIĆUniversity of Zagreb Faculty of Economics and Business Trg J F Kennedyja 6 10000 Zagreb Croatiae-mail onadovezaefzghr ORCiD 0000-0002-3651-7795
Margareta GARDIJAN KEDŽOUniversity of Zagreb Faculty of Economics and Business Trg J F Kennedyja 6 10000 Zagreb Croatiae-mail mgardijanefzghrORCiD 0000-0001-5390-057X
oza
na n
ad
ov
eza jelić ma
rg
ar
eta ga
rd
ijan k
edžo
efficien
cy v
s effectiv
eness a
n an
aly
sis of tertia
ry edu
catio
n ac
ro
ss eur
ope
pub
lic secto
r ec
on
om
ics
42 (4) 381-414 (2018)
382 abstractThis paper deals with tertiary education efficiency and effectiveness across 24 European Union countries in four sub-periods between 2004 and 2015 The effi-ciency scores are computed using Data Envelopment Analysis (DEA) We try to raise awareness of the quality and not of the quantity of educational outputs and inputs by introducing quality-based correction of the DEA efficiency score which we regard as effectiveness Our results show that quality considerations affect the relative positions of countries regarding their efficiency scores In other words some less developed countries which are efficient in the quantity-based model fail to reach the defined efficiency border when considering some quality indica-tors of outputs On the other hand some inefficient developed countries increase their DEA-based ranking and achieve effectiveness (quality-based efficiency) The same is true for input quality considerations Since tertiary education cannot be expected to provide the same quality of outcomes with different input qualities efficiency improves (deteriorates) in the input-output quality-based model in many countries with low (high) quality student bases
Keywords tertiary education data envelopment analysis educational efficiency and effectiveness EU
1 IntroductIonIt is a well-established fact that the quality of education matters more than quan-tity Fortunato and Panizza (2015) argue that the sharp increase in cross-country average years of schooling might not accurately represent actual educational gains According to Pritchett (2013) as cited in Fortunato and Panizza (2015) an increase in years of education in less developed countries as opposed to devel-oped countries is not always transmitted into educational benefits This view is also supported by many relatively recent papers such as Hanushek and Kimko (2000) Barro (2001) Woumlszligmann (2006) Altinok Diebolt and Demeulemeester (2014) Barro (2013) whereas Barro (2013) concludes that the ldquoquality and quan-tity of schooling both matter for growth but quality is much more importantrdquo Additionally Pritchett (2001) who was not able to prove a positive association between increasing educational attainment and per capita income growth argues that it could be that the educational quality was so low that ldquoyears of schoolingrdquo have created no human capital
Due to the importance of educational services for growth attitudes and political and social awareness they are provided and publicly financed to a greater or lesser extent by practically all governments around the world Additionally educational externalities are a textbook example of market failure and one of the most impor-tant motives behind government intervention in this sector According to Szirmai (2015) after World War II expansion and improvement of education were gener-ally considered essential to development The awareness about the role of educa-tion in the development process resulted in a far reaching education expansion Over the course of time increased government expenditures on education trans-
oza
na n
ad
ov
eza jelić ma
rg
ar
eta ga
rd
ijan k
edžo
efficien
cy v
s effectiv
eness a
n an
aly
sis of tertia
ry edu
catio
n ac
ro
ss eur
ope
pub
lic secto
r ec
on
om
ics
42 (4) 381-414 (2018)383lated into higher levels of education Consequently higher education enrolments
have grown significantly over the last three decades According to World Bank (2018) data the world gross enrolment ratio in tertiary education1 grew from 13 to 35 during the 1985-2015 period Growth has been even more impressive in the European Union (EU) where the average annual growth rate of the gross enrolment ratio in tertiary education reached 35 This has led to an increase in the gross enrolment ratio in tertiary education from 25 in 1985 to 68 in 2014
However as Szirmai (2015) puts it ldquoSince the 1970s optimism about the contribu-tions of education has been shaken and more emphasis is given to improving the quality of educationrdquo This author notices that not all educational investments are effective and efficient in the development process Due to the potential ineffective-ness of educational inputs the quality of education can be unsatisfactory Thus the rising educational coverage and duration of education as well as government and even private educational expenditures are not always efficiently transmitted into higher productivity and wages growth rates and better institutions Therefore it can be argued it is not quantity that underlies the successful exploitation of all forms of educational benefits but the quality and the effectiveness of the educational inputs and investments Although efficiency and effectiveness are similar concepts they are not synonyms Viljoen (cited in Kenny 2008) defined efficiency as relating to ldquohow well an activity or operation is performedrdquo The term effectiveness relates to performing the correct activity or operation In other words ldquoefficiency measures how well an organization does what it does but effectiveness raises value questions about what the organization should be doing in the first placerdquo
There is a significant body of literature which deals with the efficiency of all levels of the national educational systems in the EU Many of those studies chose to use data envelopment analysis (DEA) in their methodological approach because DEA as a nonparametric method of mathematical programming enables the cal-culation of the relative efficiency of quite homogenous and comparable units given multiple criteria These criteria dictate the choice of certain input variables whose values are preferred to be as small as possible and certain output variables whose values are preferred to be as great as possible The choice of the criteria and consequently the choice of the variables defines the concept of the research
Conclusions of various DEA-based studies sometimes differ significantly which makes it impossible to draw general conclusions concerning tertiary educational efficiency at the EU level Differences in conclusions mostly arise from the diverse selection of inputs and outputs considered within different studies Additionally some papers deal with a narrow sample of countries (eg Ahec Šonje Deskar-Škrbić and Šonje 2018 Yotova and Stefanova 2017) ie homogenous countries with similar development levels and others deal with a broader and more or less
1 Total enrolment in tertiary education (ISCED 5 to 8) regardless of age expressed as a percentage of the total population of the five-year age group following on from secondary school leaving
oza
na n
ad
ov
eza jelić ma
rg
ar
eta ga
rd
ijan k
edžo
efficien
cy v
s effectiv
eness a
n an
aly
sis of tertia
ry edu
catio
n ac
ro
ss eur
ope
pub
lic secto
r ec
on
om
ics
42 (4) 381-414 (2018)
384 heterogeneous set of countries which can also affect the difference in the results (Aubyn et al 2009 Aristovnik and Obadić 2011 and Toth 2009)
Still most of the papers that use the DEA approach make comparisons on tertiary education between countries considering only the definition of efficiency Some papers deal with quality issues but mostly on the output side of the educational ldquoproduction functionrdquo Therefore questions regarding the quality of educational inputs and outputs and their effectiveness are usually covered only partially In this paper we argue that a greater focus on efficiency can give misleading results that could translate into flawed educational policy prescriptions
The paper is organized as follows The second section summarizes previous research findings The third section gives the rationale for selected inputs and outputs as well as a glimpse of the educational inputs and outputs in the EU The fourth section deals with the methodology and the fifth presents and discusses the main results The last part of the paper provides comments on policy implications and future research recommendations
2 lIterature oVerVIewDEA is a generally suitable method for a country-level public sector efficiency evaluation2 and it is commonly used and widely accepted as an appropriate analy-sis approach in the tertiary education efficiency research For example to rank eleven Eastern European countries according to their tertiary education efficiency during the 2005-2013 period Ahec Šonje Deskar-Škrbić and Šonje (2018) use input-oriented DEA with variable returns to scale (VRS) The authors use expend-iture on tertiary education per pupil in the percentage of GDP per capita as an input variable and the share of unemployed with tertiary education in the total number of unemployed (model 1) and World University Ranking list as an alterna-tive output measure (model 2) However the authors consider models with only one input and one output variable which limits the possibility of making more general conclusions
Yotova and Stefanova (2017) used the same method on a set of countries similar to that chosen by Ahec Šonje Deskar-Škrbić and Šonje (2018) As an input vari-able authors used total expenditures on tertiary education per student as a percent-age of per capita GDP in 2012 while the set of educational outputs variables included three indicators tertiary educational attainment (age 25-34) the employ-ment rate of the population with tertiary education outside the risk of poverty and social exclusion and the mean monthly earnings of a person with tertiary educa-tion as a share in per capita GDP in 2014 Again the analysis is limited to one input and one output It should be noted that both studies include some educa-
2 We wonrsquot go in any details regarding the broader usage of DEA in public sector efficiency evaluations How-ever interested reader can refer to the following research in this area Clements (2002) Afonso and St Aubyn (2006) Aristovnik (2013a 2013b) Aristovnik and Obadić (2014) etc
oza
na n
ad
ov
eza jelić ma
rg
ar
eta ga
rd
ijan k
edžo
efficien
cy v
s effectiv
eness a
n an
aly
sis of tertia
ry edu
catio
n ac
ro
ss eur
ope
pub
lic secto
r ec
on
om
ics
42 (4) 381-414 (2018)385tional output quality indicators but they do not consider any educational input
quality measures which could lead to biased results and conclusions
Toth (2009) analyzed the efficiency of tertiary education in 20 EU countries in 2006 using output-oriented DEA with variable returns to scale (VRS) The author used a ratio of expenditures spent on higher education to GDP as an educational input and the ratio of people with a degree to the total population as well as the employment rate of people with a degree as educational output variables Beside standard outputs and inputs the author used two non-discretionary variables (parental educational attainment and public-to-total expenditure GDP per capita in current US$) However Tothrsquos (2009) results differ significantly from other related studies that include EU countries3 She found that for example Denmark and Italy (among others) share the first position regarding tertiary education effi-ciency in 20 analyzed EU countries while Aristovnik and Obadić (2011) and Aubyn et al (2009) rank these countries as relatively inefficient
Aristovnik and Obadić (2011) used output oriented DEA with variable returns to scale (VRS) to assess tertiary education efficiency in a broad set of countries (selected group of EU and OECD countries) during the 1999-2007 period The analysis included input data on expenditure per student (tertiary of GDP per capita) school enrolment (tertiary gross) and outputoutcome data ie school enrolment (tertiary gross) labor force with a tertiary education ( of total) and the unemployed with a tertiary education ( of total unemployment) To assess technical efficiency regarding different inputs and outputsoutcome the authors tested three Two out of three considered outputs are standard educational quantity output indicators while the last can be regarded as a quality indicator In the con-clusion authors emphasize the need to consider some educational quality data
The most comprehensive study employing DEA methodology to assess the effi-ciency of the tertiary education in a broad set of countries is authored by Aubyn et al (2009) The authors used two approaches input and output-oriented DEA with variable returns to scale (VRS) The analysis is conducted over two subperiods 1998-2001 and 2002-2005 In the first model authors used a number of academic staff and students as inputs while the second model considered spending in pri-vate government-dependent institutions (in of GDP) as an input variable A weighted number of graduates and a weighted number of published articles were used as output variables in both models All educational inputs and outputs con-sidered in this paper can be regarded as quantitative However the study includes a number of non-discretionary measures such as selection of students budget autonomy staff policy output flexibility evaluation funding rules and PISA results4 which can be seen as qualitative measures (mostly) of inputs
3 See table A1 in appendix4 For detailed explanation of variables see Aubyn et al (2009)
oza
na n
ad
ov
eza jelić ma
rg
ar
eta ga
rd
ijan k
edžo
efficien
cy v
s effectiv
eness a
n an
aly
sis of tertia
ry edu
catio
n ac
ro
ss eur
ope
pub
lic secto
r ec
on
om
ics
42 (4) 381-414 (2018)
386 It should be noted that conclusions differ in the abovementioned papers which makes it impossible for us to draw any general conclusions on tertiary educational efficiency at EU level5 We suspect that differences in conclusions mostly arise from the diverse selection of inputs and outputs considered within different papers However the differences in the conclusions of the reviewed papers also arise because of the different samples of countries That is two papers deal with a nar-row sample of countries ie homogenous countries with similar development lev-els and others deal with a broader and heterogeneous set of countries which can also produce different results Still differences arise even if the samples are rela-tively similar For example Aristovnik and Obadić (2011) and Aubyn et al (2009) use the same number and coverage of countries and even time periods in different model specifications (variables) but sometimes the results differ significantly For example the first model in Aristovnik and Obadić (2011) ranks the Czech Repub-lic as the first and then as the 33rd in the second model Similarly in Aubyn et al (2009) Cyprus is ranked number one in the first model (1998-2001) and then as 27th in the second model (1998-2001)6
3 data tertIary educatIon InPuts and outPutsThis paper differentiates between quantity and quality measures of educational inputs and outputs which enables us to discriminate tertiary education efficiency and tertiary education effectiveness Since there is no consensus regarding the appropriateness of available inputs and outputs it seemed inappropriate to make an ad hoc decision to include some and to exclude other inputs and outputs that were used in the previous researches Therefore this paper uses a somewhat broader set of inputs and outputs than most of the papers presented in the literature overview It also considers quality indicators on both side of the educational pro-duction function ndash the input and the output side This decision comes with a cost as the discriminatory power of the method becomes questionable with the increase of the variables due to the inappropriate degrees of freedom (Cooper Seiford Tone 2006106) However any future research should try to detect key inputs and outputs in the tertiary education ldquoproductionrdquo process and try to synthesize them to get more information with fewer datavariables This approach could lead to more robust and more consistent DEA-based conclusions regarding tertiary edu-cation efficiency
To our knowledge there is no precise definition and delimitation of quantitative and qualitative educational inputs and outputs According to Lee in Bourguignon Elkana and Pleskovic (2007) an outcome of education is composed of both the quantity and the quality of educational capital According to him the quantity of educational capital can be measured by the number of graduates However he emphasizes that it is rather difficult to measure the quality of education accurately The author adds that the quality of education is reflected in the performance of
5 Table A1 in appendix provides a table with the previous research results6 See table A1 in appendix
oza
na n
ad
ov
eza jelić ma
rg
ar
eta ga
rd
ijan k
edžo
efficien
cy v
s effectiv
eness a
n an
aly
sis of tertia
ry edu
catio
n ac
ro
ss eur
ope
pub
lic secto
r ec
on
om
ics
42 (4) 381-414 (2018)387students and graduates as the value added of schooling can be measured by labor
market performance such as extra earnings or employment of educated workers Due to the lack of official quantity vs quality definitions regarding educational inputs and outputs in this section we provide the basic rationale behind the choices made in this paper
Before the provision of details regarding the selected inputs and outputs figure 1 gives a synthetic overview of educational inputs and outcomes as defined in Scheerens Luyten and van Ravens (2011)
Figure 1A synthetic overview of educational inputs processes and outcomes
Inputs Process outputs
System level financial material and human resources indicators
System level process indicators
output indicators bull Subject matter based bull Literacy (reading
mathematical scientific)
bull Competencies
outcomeattainment indicators bull Graduation rates bull Proportion of students
graduated without delay
bull Drop-out rates bull Class repetition rates
Impact indicators bull (For each attainment
level) of employed at a certain job level
bull of unemployed bull (For lower school
levels) enrolled in follow-up education
bull Degree of social participation (social capital)
bull Adult literacy rates bull Average income for
each attainment level
financial and material resources indicators 1 Proportion of gross
domestic product spent on education
2 Educational expenditure per student
3 Proportion of public and private investments in education
4 Public investment in educational research and development etc
human resources indicators 1 Teacher background
characteristics 2 Teacher professional
knowledge and skills 3 Teacher working
conditions 4 Teacher autonomy 5 Teacher morale and
status 6 Staff to student ratios
system level process indicators 1 Teaching time per
subject 2 Opportunity to learn 3 The locus of
decision-making 4 School autonomy 5 Education standards
by level 6 Whether formal
examinations are taken
7 The evaluation capacity of the system
8 The magnitude and diversification of an educational support structure
9 The division of private government dependent and public schools
10 Incentive-based policies to stimulate school performance
11 The degree to which school choice is free
contextual indicators (student background characteristics societal conditions antecedent conditions within the educational system the organizational infrastructure
of the local community etc)Source Scheerens Luyten and van Ravens (2011) adapted by the authors
oza
na n
ad
ov
eza jelić ma
rg
ar
eta ga
rd
ijan k
edžo
efficien
cy v
s effectiv
eness a
n an
aly
sis of tertia
ry edu
catio
n ac
ro
ss eur
ope
pub
lic secto
r ec
on
om
ics
42 (4) 381-414 (2018)
388 The selection of quality and quantity educational input and output indicators was mostly dictated by data availability (on the system level) Additionally some indi-cators that were considered as either inputs or outputs of the tertiary education system were highly correlated with other selected variables Thus we had to drop some of them The following subsections link selected variables to the definitions of input output and process indicators shown in figure 1 System-level process indicators have not been considered at all due to the lack of appropriate data
31 QuantItatIVe measures of educatIonal InPutsGeneral government expenditures on tertiary education as a percentage of GDP (financial resources indicator) are chosen as the most common measure of tertiary education public investmentsexpenditures Due to the correlation of this measure with similar measures of inputs other measures are excluded Data for this meas-ure are available for the entire analyzed period
Financial aid to students as a percentage of total public expenditure on education at the tertiary level of education (financial resources indicator) is selected as an input since it indicates public expenditures pointed directly towards students It is assumed that it adds new information regarding tertiary education financial inputs since it is not correlated with the previous financial resources indicator Data for this measure are available for the 2004-2012 period
One limitation should be noted here Namely both financial resources indicators contain only public spending on tertiary education However the structure of financing sources could also affect the efficiency since publicly financed education resources (see system level financial inputs and process indicators in figure 1) do not represent the total amount of educational spending However comparable data on private spending on education for all countries in our sample was not available
The ratio of pupils and students to teachers and academic staff in tertiary educa-tion is selected as a human resource indicator in the last analyzed sub-period (2013-2015) which was dictated by data availability
32 QualItatIVe measure of educatIonal InPutsThe percentage of underachieving 15-year-old students in the PISA survey (aver-age of all fields) is an output indicator of secondary education We assume it is a contextual indicator that measures human capital input quality at the tertiary level education since it contains information about the quality of the student population before entering the system of tertiary education Data for this measure are availa-ble for the entire analyzed period
33 QuantItatIVe measures of educatIonal outPutsTertiary education graduates (ISCED 5-6 per 1000 of population aged 20-29) and graduates aged 20-34 ( of the corresponding population) are selected as out-comeattainment indicators that are the most important and commonly used meas-
oza
na n
ad
ov
eza jelić ma
rg
ar
eta ga
rd
ijan k
edžo
efficien
cy v
s effectiv
eness a
n an
aly
sis of tertia
ry edu
catio
n ac
ro
ss eur
ope
pub
lic secto
r ec
on
om
ics
42 (4) 381-414 (2018)389ures of tertiary education outputs The first indicator is available for the 2004-
2012 period while the latter was used for the analysis in the last sub-period (2013-2015) Since both measures indicate only the number of students who successfully exit the tertiary education system and do not contain any information regarding their ldquoqualityrdquo we regard them as quantitative indicators of educational outputs
The population aged 15-64 with completed tertiary education is selected as a com-mon quantitative output indicator since it only considers the number of tertiary educated people and provides no information regarding the qualitative features of the tertiary educated population It should be noted that population with com-pleted tertiary education also reflects past spending on education while our analy-sis measures the outputs at the same time as inputs However if we considered only past spending on tertiary education we would still have a similar problem Beside historical data availability problems if we took (financial) inputs from previous periods we would neglect the potential efficiency of current expendi-tures to ldquoproducerdquo a new tertiary educated population This is because current financial resources devoted to tertiary education are spread across current stu-dents In three-year periods (for which we take averages) some of those students become part of the tertiary educated population Data for this measure are availa-ble for the entire analyzed period
The ratio of unemployment rates ( age 15-64) for all educational levels to unemployment rates ( age 15-64) of the tertiary educated labor force is selected as an impact indicator of tertiary education outcomes It measures tertiary educa-tion returns on the labor market Due to its correlation with similar labor market outcomes measures other measures are excluded Data for this measure are avail-able for the entire analyzed period Even if this indicator could be seen as a quali-tative tertiary education outcome measure we included it in both the efficiency and the effectiveness analysis We argue that a high ratio of unemployment rates for all educational levels and unemployment rates of tertiary educated labor force does not necessarily reflect the high efficiency of the tertiary education in terms of labor market outcomes but could be also a result of low activity rates of the ter-tiary educated population Therefore we correct this measure with activity rates of tertiary educated population
34 QualItatIVe measure of educatIonal outPutsFollowing the preceding paragraph the ratio of unemployment rates ( age 15-64) for all educational levels to unemployment rates ( age 15-64) of the tertiary educated labor force is multiplied by the activity rates of tertiary educated population The resulting measure is selected as a qualitative impact indicator of the tertiary education outcomes Data for this measure are available for the entire analyzed period
An average overall score of Times Higher Education university rankings is cho-sen as an output indicator of the tertiary education quality in the last sub-period
oza
na n
ad
ov
eza jelić ma
rg
ar
eta ga
rd
ijan k
edžo
efficien
cy v
s effectiv
eness a
n an
aly
sis of tertia
ry edu
catio
n ac
ro
ss eur
ope
pub
lic secto
r ec
on
om
ics
42 (4) 381-414 (2018)
390 (2013-2015) We considered other ranking lists but Times Higher Education was the only university rankings database which covered all countries in our sample in 2016 In previous sub-periods (2004-2012) we used the gross domestic product in PPS per capita ( of average) as a proxy for tertiary education outputs quality due to the incompleteness of the university rankings data and their correlation with university rankings (overall score) Anecdotal evidence presented in figure 2 justi-fies this choice Namely it seems that the correlation between the GDP per capita and the average university overall score (measure of the educational outcomes quality) using the ranking of the Times Higher Education (2017) significantly exceeds the correlation between the GDP per capita and the tertiary educated pop-ulation as a percentage of 15-64 years aged population (typical measure of educa-tional outcomes quantity)
Figure 2Quantity versus quality of education as GDP per capita correlates
Rsup2 = 025
-15
-10
-5
0
5
10
15
20
25
30
-15 -10 -5 0 5 10
Dev
iatio
n fr
om E
U 2
6 av
erag
e
GD
P p
c in
PPS
k
Deviation from EU 26 averagetertiary educated population (as of 15-64)
Rsup2 = 076
-15
-10
-5
0
5
10
15
20
25
30
-30 -20 -10 0 10 20 30
Dev
iatio
n fr
om E
U 2
6 av
erag
eG
DP
pc
in P
PSk
Deviation from EU 26 average average THE WUR overall score
Source Times Higher Education (2017) Eurostat (2018c 2018d)
The analysis is performed on a sample of 24 EU countries7 for which all the neces-sary data during the 2004-2015 period were available The entire time span has been divided into four 3-years sub-periods for which comparable data and varia-bles were available Table 1 summarizes selected inputs and outputs in efficiency and effectiveness DEA models
Figures 3 4 and 5 show educational (quantity and quality) inputs and outputs trends within the EU countries during the analyzed periods (averages for sub-periods 2004-2006 2007-2009 2010-2012 2013-2015) The figures reveal a lot of differences among EU member states regarding the educational inputs and out-puts However a few conclusions can be drawn
7 Due to data shortages Cyprus Greece Malta and Luxemburg were excluded from the dataset
oza
na n
ad
ov
eza jelić ma
rg
ar
eta ga
rd
ijan k
edžo
efficien
cy v
s effectiv
eness a
n an
aly
sis of tertia
ry edu
catio
n ac
ro
ss eur
ope
pub
lic secto
r ec
on
om
ics
42 (4) 381-414 (2018)391Table 1
Inputs outputs and quality indicators
label Definition used in periodCountries Belgium Bulgaria Czech Republic Denmark Germany Estonia Ireland Spain France Croatia Italy Latvia Lithuania Hungary Netherlands Austria Poland Portugal Romania Slovenia Slovakia Finland Sweden United KingdomInputs
(I)EX2( GDP) General government expenditure (tertiary education GDP) 2004-2015
(I)FA( EX)Financial aid to students as of total public expenditure on education at tertiary level of education (ISCED 5 6 )
2004-2012
(I)ST Ratio of pupils and students to teachers and academic staff (tertiary education levels 5-8) 2013-2015
Outputs
(O)GRAD(20-29) Tertiary education graduates (ISCED 5-6 per 1000 of population aged 20-29) 2004-2012
(O)GRADT(20-34) Graduates aged 20-34 tertiary education level ( of corresponding population) 2013-2015
(O)POPT Population aged 15-64 with completed tertiary education (levels 5-8) 2004-2015
(O)UUTUnemployment rates ( 15-64) all ISCED 2011 levelsunemployment rates ( 15-64) tertiary education (levels 5-8)
2004-2015
Quality indicators of inputs and outputs
(O)UUTACTT (O)UUT Activity rates ( of 15-64 tertiary education (levels 5-8)) 2004-2015
(O)GDP PC PPSGross domestic product at market prices current prices purchasing power standard per capita ( of average)
2004-2012
(O)UR_2016 Average overall score university rankings ndash The Higher Education 2013-2015
(I)PISA Underachieving 15-year-old students ( PISA survey an average of all fields) 2004-2015
Source Authors
Inputs ndash The more developed EU countries generally have greater direct invest-ment in students (in ) (figure 3a) Something similar is true for general govern-ment expenditure (figure 3b) However there are a few exceptions like the UK on the low expenditures side and Poland Estonia and Lithuania on the high expendi-tures side (figure 3c) Student to teacher ratio varies from 107 in Sweden to 225 in the Czech Republic
Outputs ndash Graduation rates (figure 4a) have been increasing in all countries within the period of analysis whereas a few post-transition economies which have rela-tively low incomes have relatively high graduation rates Regarding the labor market outcomes (figure 4c) the tertiary educated labor force seems to have a somewhat lower unemployment rate relative to the overall unemployment rate in
oza
na n
ad
ov
eza jelić ma
rg
ar
eta ga
rd
ijan k
edžo
efficien
cy v
s effectiv
eness a
n an
aly
sis of tertia
ry edu
catio
n ac
ro
ss eur
ope
pub
lic secto
r ec
on
om
ics
42 (4) 381-414 (2018)
392 less developed EU countries This could be due to the relative scarcity of tertiary educated labor in lower income countries which provides them with a better labor market position (figure 4b)
Quality indicators of inputs and outputs ndash After correcting the above described labor market outcomes for the tertiary educated activity rates some countries like the Netherlands Sweden Germany Ireland and Austria improve their relative position while the positions of Croatia Slovakia and Romania positions deterio-rate (figure 5a) The correlation between per capita GDP and university ranking overall score has already been commented on As we have already emphasized both of those outputs measure the quality of the tertiary education Finally figure 5c shows that the percentage of underachieving 15-year-old students (measured as the average of all fields in a PISA survey) is usually much larger in the poorest EU countries while it is the lowest in the wealthiest ones (with a few exceptions) This means that poorer countries get students of ldquolower qualityrdquo
Figure 3Tertiary education inputs (averages 2004-2006 2007-2009 2010-2012 2013-2015)
a) Financial aid to students as of total public expenditureon education at the tertiary level of
education
b) General government expenditure (tertiary education GDP)
05
10152025303540
Cze
ch R
C
roat
iaFr
ance
Fran
ce
Rom
ania
Spai
nA
ustri
aEs
toni
aLi
thua
nia
Pola
ndLa
tvia
Irel
and
Irel
and
Hun
gary
Bel
gium
Bel
gium
Finl
and
Bul
garia
Bul
garia
Portu
gal
Portu
gal
Slov
akia
EU28
EU28
Ger
man
y
Ger
man
y
Italy
Slov
enia
Slov
enia
Swed
enN
ethe
rland
s
Net
herla
nds
Den
mar
k
Den
mar
k
UK
UK
00
05
10
15
20
25
Italy
Spai
n
Slov
akia
Rom
ania
Aus
tria
Cze
ch R
Hun
gary
Latv
ia
Cro
atia
Swed
en
Esto
nia
Pola
nd
Finl
and
Lith
uani
a
c) The ratio of pupils and students to teachers and academic staff (tertiary education)
Fran
ce
Bul
garia
EU28
Ger
man
y
UK
Italy
Slov
akia
Aus
tria
Cze
ch R
Cro
atia
Pola
nd
Finl
and
0
5
10
15
20
25
Swed
en
Spai
n
Den
mar
k
Rom
ania
Portu
gal
Esto
nia
Hun
gary
Net
herla
nds
Lith
uani
a
Slov
enia
Latv
ia
Bel
gium
Source Eurostat (2018b 2018c 2018g)
oza
na n
ad
ov
eza jelić ma
rg
ar
eta ga
rd
ijan k
edžo
efficien
cy v
s effectiv
eness a
n an
aly
sis of tertia
ry edu
catio
n ac
ro
ss eur
ope
pub
lic secto
r ec
on
om
ics
42 (4) 381-414 (2018)393
Fig
ur
e 4
Terti
ary e
duca
tion
outp
uts (
aver
ages
200
4-20
06 2
007-
2009
201
0-20
12 2
013-
2015
)
a) T
ertia
ry e
duca
tion
grad
uate
s (permil
20-
29) a
nd g
radu
ates
ag
ed 2
0-34
(permil o
f cor
resp
ondi
ng p
opul
atio
n)b)
Pop
ulat
ion
aged
15-
64 w
ith c
ompl
eted
te
rtiar
y ed
ucat
ion
c) U
nem
ploy
men
t rat
es (
15-
64) a
ll IS
CED
201
1 le
vels
U
nem
ploy
men
t rat
es (
15-
64) t
ertia
ry e
duca
tion
00
05
10
15
20
25
30
35
40
HungaryLithuaniaCzech RBulgaria
GermanyLatvia
SlovakiaUK
PolandSweden
NetherlandsBelgium
IrelandFinlandCroatia
EU28Italy
SpainFrance
SloveniaEstoniaAustria
RomaniaDenmarkPortugal
020406080100
120
DenmarkIrelandPolandFrance
LithuaniaUK
FinlandSlovakiaBelgium
SpainAustria
EU28Czech RSlovenia
NetherlandsBulgaria
LatviaCroatia
PortugalSweden
RomaniaEstonia
HungaryItaly
Germany
0510152025303540
UKIrelandFinlandEstoniaSweden
BelgiumSpain
LithuaniaDenmark
NetherlandsFranceLatviaEU28
SloveniaAustria
GermanyPoland
BulgariaHungaryPortugal
Czech RCroatia
SlovakiaItaly
Romania
Sour
ce E
uros
tat (
2018
d 2
018f
201
8g 2
018h
201
8j)
oza
na n
ad
ov
eza jelić ma
rg
ar
eta ga
rd
ijan k
edžo
efficien
cy v
s effectiv
eness a
n an
aly
sis of tertia
ry edu
catio
n ac
ro
ss eur
ope
pub
lic secto
r ec
on
om
ics
42 (4) 381-414 (2018)
394 Figure 5Tertiary education quality indicators (averages 2004-2006 2007-2009 2010-2012 2013-2015)
a) Unemployment rates ( 15-64) all ISCED 2011 levelsUnemployment rates ( 15-64) tertiary
education (levels 5-8) multiplied by tertiary educated population activity rate
b) Gross domestic product at market prices current prices purchasing power standard
per capita (three-year averages)
0
50
100
150
200
250
300
Lith
uani
aH
unga
ryC
zech
R
Ger
man
yB
ulga
riaSw
eden
Latv
iaU
KN
ethe
rland
sSl
ovak
iaFi
nlan
dIr
elan
dPo
land
Spai
nB
elgi
umEU
28Fr
ance
Esto
nia
Slov
enia
Aus
tria
Cro
atia
Den
mar
kIta
lyPo
rtuga
lR
oman
ia
05000
1000015000200002500030000350004000045000
Irel
and
Net
herla
nds
Aus
tria
Den
mar
kG
erm
any
Swed
enB
elgi
umFi
nlan
dU
KFr
ance
EU28
Italy
Spai
nC
zech
R
Slov
enia
Slov
akia
Portu
gal
Esto
nia
Lith
uani
aH
unga
ryPo
land
Latv
iaC
roat
iaR
oman
iaB
ulga
ria
c) Underachieving 15-year-old students ( PISA survey average of all fields)
d) University rankings ndash Times Higher Education an average overall score
0
10
20
30
40
50
60
Bul
garia
Rom
ania
Slov
akia
Hun
gary
Cro
atia
Lith
uani
aIta
lyFr
ance
Aus
tria
Cze
ch R
EU
28Sw
eden
Bel
gium
Portu
gal
UK
Spai
nLa
tvia
Net
herla
nds
Ger
man
yPo
land
Slov
enia
Den
mar
kIr
elan
dFi
nlan
dEs
toni
a
0
10
20
30
40
50
60
70
Net
herla
nds
Swed
enB
elgi
umG
erm
any
Den
mar
kFi
nlan
dU
KA
ustri
aIr
elan
dFr
ance
Italy
Esto
nia
Spai
nPo
rtuga
lC
roat
iaSl
oven
iaH
unga
ryC
zech
R
Slov
akia
Rom
ania
Pola
ndLa
tvia
Lith
uani
aB
ulga
ria
Source Eurostat (2018a 2018e 2018i 2018j) Times Higher Education (2017)
4 methodologyThe efficiency and (what we later regard as) the effectiveness analysis of the ter-tiary education in 24 EU member states8 is conducted using data envelopment analysis (DEA) DEA is a nonparametric method of mathematical programming which is developed for evaluating the relative efficiency of units under assess-ment usually called the decision-making units (DMUs) Since its introduction by the pioneering CCR model in 1978 (Charnes Cooper and Rhodes 1978) followed by the BCC model published by Banker Charnes and Cooper in 1984 DEA has instantly been recognized as a modern tool for performance management While the CCR model assumes constant returns to scale (CRS) the BCC model assumes variable returns to scale which allows the use of DEA in problems where increases in inputs result in non-proportionate increases in outputs (and vice versa) The most appealing features of DEA are that it allows multiple criteria for determining efficiency to be used and appropriate variables to be selected which are (in most models) unit-invariant without the use of their pre-defined weights In addition all assessments are relative given the finite number of comparable DMUs Follow-
8 We excluded Cyprus Malta Luxemburg and Greece from the analysis due to the lack of data
oza
na n
ad
ov
eza jelić ma
rg
ar
eta ga
rd
ijan k
edžo
efficien
cy v
s effectiv
eness a
n an
aly
sis of tertia
ry edu
catio
n ac
ro
ss eur
ope
pub
lic secto
r ec
on
om
ics
42 (4) 381-414 (2018)395ing the specific needs of the research environment a vast number of models have
been developed within DEA to fit and capture the nature of the research problem thus providing a great tool for different kinds of efficiency analysis Additionally the popularity of DEA and the number of its applications are on the rise (Emrouzne-jad and Yang 2018)
DEA was initially developed with the idea of measuring the efficiency of produc-tion units such as factories hospitals or banks where one can unswervingly determine their inputs and their outputs Such DMUs can manage their inputs and outputs to a certain degree (thus the name decision-making units) An additional assumption is that the aim of DMUs is to use their available inputs to achieve greater outputs or try to use fewer inputs for producing the desired level of output In other words they are assumed to aim for the efficiency in a production process However the application of DEA has spread outside the production processes and researchers are using it for evaluating the relative efficiency of different kinds of (relatively homogenous) units that need to be estimated given their undesirable (input) and desirable (output) characteristics The examples are the portfolio selection the performance of companies using their financial ratio data perfor-mance of countries according to their macroeconomic indicators or different ldquopro-cessesrdquo for example fiscal policy or educational policy As is obvious such DMUs are not the ldquodecision-makingrdquo units themselves and not all of them should aim for efficiency in terms of fewer inputs to greater outputs Moreover the selec-tion of their inputs and outputs is arbitrary but this allows a researcher to define the relevant aspects of the ldquoefficiencyrdquo of DMUs
The use of DEA for estimating the relative efficiency of education at different levels (primary secondary tertiary) has been very popular over recent years The overview of some of these researches previously mentioned in the literature over-view revealed that the most frequently used model is the BCC model (with input or output orientation) which is an appropriate approach given the nature of this research problem Without questioning the great contribution and effort of past researches what we argue is that their selection of inputs and outputs gives more importance to the greater quantity of the educational output We strongly suggest that education should be assessed not only in terms of quantity but also in terms of quality Figuratively speaking a factory that manages to produce something using almost nothing should be seen as a role model and a factory that invests a lot relative to others and achieves less than the others should be recognized as poorly managed However countries that have large investments in education should not be punished in such studies if they manage to provide a high quality of education Likewise the countries that have almost negligible inputs should not be rewarded just because they managed ldquoto producerdquo any amount of outputs of low quality despite their low inputs Therefore we suggest that at the beginning of the study using DEA the crucial question should be asked ldquoAre we really aiming at the quantity or the qualityrdquo and the answer should be followed with the selec-tion of the inputs and the outputs that are relevant for the study
oza
na n
ad
ov
eza jelić ma
rg
ar
eta ga
rd
ijan k
edžo
efficien
cy v
s effectiv
eness a
n an
aly
sis of tertia
ry edu
catio
n ac
ro
ss eur
ope
pub
lic secto
r ec
on
om
ics
42 (4) 381-414 (2018)
396 In addition just as the output of the production facility is determined with the qual-ity of the inputs which cannot be always controlled certain levels of the educa-tional process are determined by the outputs of the preceding processes Figura-tively one cannot make a tasty cake using salt instead of sugar For this problem DEA allows the definition of non-discretionary inputs which are relevant but they are not controllable and are defined by the environment (Banker and Morey 1986) This approach was used in some previous studies of education using DEA How-ever as we will explain in the following paragraphs we will treat the non-discre-tionary variables as discretionary to provide results that are more informative
DEA models can be output oriented aiming at maximization of outputs for the given level of inputs input-oriented aiming at minimization of inputs for the given level of outputs or non-oriented Also the models can assume constant variable or generalized returns to scale Following the nature of the problem we are analyzing we decide to use the output-oriented model assuming variable returns to scale (BCC model) To explain the methodology we first formulate the model Let there be N decision-making units (DMUs) DMU1 DMU2hellip DMUN which are homog-enous and comparative We assume that their efficiency should be estimated in terms of a certain number of inputs ndash the variables the values of which we want to be as small as possible and a certain number of outputs ndash variables the values of which we prefer to be as big as possible Let xij ge 0 be an i-th input for some DMUj
and yrj gt 0 its r-th output Therefore each DMUj is represented by a vector of inputs and a vector of out-puts so is an input matrix and is an output matrix To make the model stable it is recommended that the number of DMUs (N) should not exceed The BCC model (Banker Charnes and Cooper 1984) can be written in the following envelopment form
(1)
(2)
(3)
(4)
where ε gt 0 and and are slack variables If we denote the optimal solution as a DMUo is efficient if and only if the efficiency score and
all DMUo is weakly efficient if and only if but or for some i and r in some alternate optima (Cooper Seiford and Zhu 2011)
Otherwise a DMU is inefficient Resulting from the optimal solution of the pro-gram (1) ndash (4) an inefficient DMU can be projected to the BCC efficiency
oza
na n
ad
ov
eza jelić ma
rg
ar
eta ga
rd
ijan k
edžo
efficien
cy v
s effectiv
eness a
n an
aly
sis of tertia
ry edu
catio
n ac
ro
ss eur
ope
pub
lic secto
r ec
on
om
ics
42 (4) 381-414 (2018)397frontier as a combination of other DMU using the formulas
and (Cooper Seiford and Zhu 2011) Therefore the lambdas allow us to identify the peer group of an inefficient DMU By observing these efficient projections we can analyze how a DMU should increase its outputs andor decrease its inputs to become relatively efficient9
The period of analysis is divided into four subperiods 2004-2006 2007-2009 2010-2012 and 2013-2015 The selection of the periods is mostly dictated by the availability of the data and the change in the data methodology As explained in table 1 subperiods within 2004-2012 and subperiod 2013-2015 are characterized by different variables due to the availability of the data Therefore a direct com-parison of results between periods is not advisable
To circumvent the problem of missing data we decided to calculate the simple three ndash years averages of data as the closest representative of the period However even this procedure resulted in some countries having missing data so our approach was to exclude countries that had more than one missing data item In order to keep as many countries as possible in the sample those countries that had only one missing data item were kept in the sample and missing inputsoutputs were assigned a pessimistic value which is largesmall enough for an objective function not to be entered as proposed by Kuosmanen (2009) We did this only for countries that had one missing data item because we did not want to affect the ldquotechnology setrdquo and worsen the relative ranking of other DMUs that had com-plete data Additionally we checked that the objective function in the solution included a multiplier of 0 for inputsoutputs variables with an arbitrary set value
After the correction of the sample the analysis includes 24 EU countries Belgium Bulgaria the Czech Republic Denmark Germany Estonia Ireland Spain France Croatia Italy Latvia Lithuania Hungary the Netherlands Austria Poland Portu-gal Romania Slovenia Slovakia Finland Sweden and the United Kingdom
In the first step we run the quantity-based models using variables expenditures (I)EX2 and financial aid (I)FA(EX) as inputs and as outputs we use the percentage of graduates (O)GRAD(20-29) the education returns on labor market (O)UUT and the percentage of highly educated population (O)POPT for the period of 2004-2012 We performed a similar analysis for the period 2013-2015 except that variable (I)FA(EX) is replaced by the ratio of students per teacher (I)(ST) and variable (O)GRAD(20-29) with (O)GRAD(20-34) As is obvious such a selection of variables led to rewarding the quantity of the educational output and reporting on the efficiency of the tertiary education
The second step was to include quality corrections for the previously obtained efficiency analysis Firstly we take account of output-quality and then we intro-
9 Some additional explanation on the BCC and other DEA models can be found in for example Cooper Sei-ford and Tone (2006) or Cooper Seiford and Zhu (2011)
oza
na n
ad
ov
eza jelić ma
rg
ar
eta ga
rd
ijan k
edžo
efficien
cy v
s effectiv
eness a
n an
aly
sis of tertia
ry edu
catio
n ac
ro
ss eur
ope
pub
lic secto
r ec
on
om
ics
42 (4) 381-414 (2018)
398 duce the input-quality correction as well For the output-quality control we replace the output variable (O)UUT by the quality-corrected variable (O)UUTACT ((O)UUT multiplied with activity rates of the tertiary educated population) Also variable (O)POPT was substituted for by (O)GDPpc in 2004-2012 and by (O)UR university ranking in 2013-2015 (as (O)GDPpc and (O)UR showed to be highly positively correlated) Afterward the input-quality control was introduced by including PISA results in the analysis Altogether we estimated 6 different models using inputs and outputs in certain subperiods as presented in table 2
Table 2Variables used in each DEA model by period
Period 2004-2012 2013-2015Model Inputs Outputs Inputs Outputs
Quantity model
(I)EX2( GDP)(I)FA( EX)
(O)GRAD(20-29)(O)UUT(O)POPT
(I)EX2( GDP)(I)ST
(O)GRAD(20-34)(O)UUT(O)POPT
Output ndash quality model
(I)EX2( GDP)(I)FA( EX)
(O)GRAD(20-29)(O)UUTACT(O)GDPpc
(I)EX2( GDP)(I)ST)
(O)GRAD(20-34)(O)UUTACT(O)UR
Input ndash output quality model
(I)EX2( GDP)(I)FA( EX)(I)PISA a
(O)GRAD(20-29)(O)UUTACT(O)GDPpc
(I)EX2( GDP)(I)ST(I)PISA
(O)GRAD(20-34)(O)UUTACT(O)UR
a Circled variables present quality correction measuresSource Authors
5 results analysIs of the effIcIency and effectIVeness of tertIary educatIon In the eu
Figures 6a-6c present our results for the period of 2004-2012 whereas figure 6d shows the results for the last period of 2013-2015 which is analyzed using differ-ent variables Therefore we do not make ready comparisons between them How-ever the results from the period of 2013-2015 mostly support our conclusions and what we also conclude is that the choice of the variables for this period is rather robust and findings can be drawn that are similar to those from the period of 2007-2012
The tables with exact DEA scores for the analyzed period are given in table A5 in appendix and here we present the rankings resulting from these scores The dark bars in figures 6a-6d indicate the rankings of the countries calculated by the quan-tity model For the sake of clarity we present the higher ranking with a higher bar In addition we rank all efficient units as 24th and a unit with the highest inefficient score as the 23rd (or the second best) etc By generally observing the results we see that approximately a similar number of countries (9 to 14) remains efficient throughout the years within each model The relatively large number of efficient countries within each period is the result of the total number of input and output variables decreasing the number of inputs and outputs would decrease the num-ber of efficient countries However we aimed to include most of the variables that
oza
na n
ad
ov
eza jelić ma
rg
ar
eta ga
rd
ijan k
edžo
efficien
cy v
s effectiv
eness a
n an
aly
sis of tertia
ry edu
catio
n ac
ro
ss eur
ope
pub
lic secto
r ec
on
om
ics
42 (4) 381-414 (2018)399were used in the previous studies and this comes at a cost Quantity-based effi-
ciency results show that some of the most developed countries in the sample like Austria and the Netherlands are not efficient while some less developed countries like Hungary Estonia and Bulgaria define the efficient frontier in some periods The change of ranking reported by the output-quality model is shown with a striped bar When output-quality control is included most of the efficient coun-tries retain their position but a significant number of them decrease in rank and the rank of some of rises Overall the number of efficient countries decreases and the overall average efficiency score decreases
Afterward we take account of the quality of the inputs In the input-output quality model we add PISA as an input In this way if underachieving PISA results are relatively low it will increase the efficiency score If the opposite PISA will decrease the score In figures 6a-6d we use a dark black bar to indicate the differ-ence between rank in output-quality and input-output-quality model If the differ-ence is positive it means that countriesrsquo tertiary education produces relatively higher quality outputs given the relatively low quality of students (inputs) meas-ured by PISA results If the difference is negative the opposite is true In this way we get an insight into how the quality of the students measured by PISA can influence educational efficiency
When we consider educational output quality in our model it becomes obvious that countries which were inefficient in the quantity-based model and which are usually perceived as countries with solid educational systems improve their rank significantly Namely output-quality based efficiency results in almost all ana-lyzed periods (figures 6a-6d) show that Austria and the Netherlands reach the efficient frontier Austria and Netherlands are the most obvious examples but the same is true for Germany (2007-2009) Denmark (2007-2009 2010-2012) Swe-den (2007-2009 2010-2012) and Belgium (2013-2015) which also experience efficiency gains in output-quality model On the other hand less developed coun-tries (like Hungary Estonia and Bulgaria) lose their efficiency in all periods in the quality-based model in comparison to the quantity model
The correction for the input-quality generally shows that at a given level of PISA results for many countries the tertiary education efficiency ranking should actu-ally be increased This is noticeable for Austria Italy France and the Netherlands within developed countries and in Bulgaria (all periods) Croatia and Hungary (slight increase in all periods except 2007-2009) within the group of the less developed countries
For example during the period of 2007-2012 Croatiarsquos relative position is slightly degraded when an output-quality control is introduced Therefore when consider-ing the relatively poor quality of students in Croatia tertiary education effective-ness is greater than the output-quality model results imply Generally Croatia has one of the lowest indicators of (O)UUTACT and (O)GDPpc but according to
oza
na n
ad
ov
eza jelić ma
rg
ar
eta ga
rd
ijan k
edžo
efficien
cy v
s effectiv
eness a
n an
aly
sis of tertia
ry edu
catio
n ac
ro
ss eur
ope
pub
lic secto
r ec
on
om
ics
42 (4) 381-414 (2018)
400 our results it is not the worst ranked country in the EU concerning tertiary educa-tion efficiency and effectiveness By observing the reference set of efficient coun-tries for Croatia (identified by λgt0 from the model (1)-(4) results shown in tables A2-A4 in appendix) for the period 2004-2012 the BCC model projects Croatia using the inputoutput vectors of the efficient Czech Republic (among others) For the purpose of comparison the Czech Republic has lower inputs in expenditures and PISA and all outputs greater than Croatia
Poland and Estonia are less developed countries that could achieve greater tertiary education effectiveness given the relatively high-quality students The same can be concluded for Finland a developed country that ineffectively uses its high-quality students
Figure 6Results of the DEA analysis
a) 2004-2006 b) 2007-2009
-24-20-16-12-8-4048
12162024
-25-20-15-10-505
10152025
Quantity based score 0406Output quality based model (change to quantity model) ndash rhs 0406 Correction for input quality ndash rhs 0406
Quantity based score 0709Output quality based model (change to quantity model) ndash rhs 0709Correction for input quality ndash rhs 0709
Bul
garia
Rom
ania
Slov
akia
Hun
gary
Cro
atia
Lith
uani
a
Italy
Fran
ce
Aus
tria
Cze
ch R
Swed
en
Bel
gium
Portu
gal
UK
Spai
n
Latv
ia
Net
herla
nds
Ger
man
y
Pola
nd
Slov
enia
Den
mar
k
Irel
and
Finl
and
Esto
nia
Bul
garia
Rom
ania
Slov
akia
Hun
gary
Cro
atia
Lith
uani
aIta
lyFr
ance
Aus
tria
Cze
ch R
Sw
eden
Bel
gium
Portu
gal
UK
Spai
nLa
tvia
Net
herla
nds
Ger
man
y
Pola
nd
Slov
enia
Den
mar
k
Irel
and
Finl
and
Esto
nia
c) 2010-2012 d) 2013-2015
-24-20-16-12-8-4048
12162024
-24-20-16-12-8-4048
12162024
Quantity based score 1012Output quality based model (change to quantity model) ndash rhs 1012Correction for input quality ndash rhs 1012
Quantity based score 1315Output quality based model (change to quantity model) ndash rhs 1315Correction for input quality ndash rhs 1315
Bul
garia
Rom
ania
Slov
akia
Hun
gary
Cro
atia
Lith
uani
a
Italy
Fran
ce
Aus
tria
Cze
ch R
Swed
en
Bel
gium
Portu
gal
UK
Spai
n
Latv
ia
Net
herla
nds
Ger
man
y
Pola
nd
Slov
enia
Den
mar
k
Irel
and
Finl
and
Esto
nia
Bul
garia
Rom
ania
Slov
akia
Hun
gary
Cro
atia
Lith
uani
aIta
lyFr
ance
Aus
tria
Cze
ch R
Sw
eden
Bel
gium
Portu
gal
UK
Spai
n
Latv
ia
Net
herla
nds
Ger
man
y
Pola
nd
Slov
enia
Den
mar
k
Irel
and
Finl
and
Esto
nia
Source Authors
The question is what could a country do to be relatively better in the area of edu-cational quality in the future and what its closest quality-led efficient role models should be The optimal results of the BCC model provide the values of the slack variables for inefficient countries The slacks indicate the shortfalls in the data of a certain country and possible suggestions for future improvements in the quality
oza
na n
ad
ov
eza jelić ma
rg
ar
eta ga
rd
ijan k
edžo
efficien
cy v
s effectiv
eness a
n an
aly
sis of tertia
ry edu
catio
n ac
ro
ss eur
ope
pub
lic secto
r ec
on
om
ics
42 (4) 381-414 (2018)401aspect However the findings are related to a certain country and the analysis is
beyond the scope of this paper Interested readers can find the results in appendix (figure A1) where the figures indicate the greatest shortfalls in the of the origi-nal data for each country
We chose not to analyze the scale of suggested corrections for each country within each model but we give some general observations and comments on the indi-vidual results (1) periods of 2007-2009 and 2010-2012 show rather similar pat-terns where output quality corrections are noticeable for Bulgaria Estonia and Denmark (2) in the period of 2007-2015 Austria and the Netherlands improve their rating after both output and input-output quality corrections (3) Poland and especially Finland and Estonia are the only countries able to utilize their high-quality students (measured by PISA results) more effectively (in terms of educa-tional outputsoutcomes quality) Finally the overall best-ranked countries after both input and output quality control for the whole period of 2004-2015 are the UK Slovakia Italy France Lithuania Ireland and Finland
6 PolIcy ImPlIcatIons and future research recommendatIonsThis paper has dealt with tertiary education efficiency and effectiveness in the EU It is a well-established fact that the quality of education matters more than the quantity Still most of the papers which use the DEA approach make tertiary edu-cation comparisons between countries considering only the definition of effi-ciency Some papers deal with quality issues but mostly on the output side of the educational ldquoproduction functionrdquo Therefore the questions regarding the quality of educational inputs and outputs and the effectiveness are usually covered only partially In this paper we argue that a greater focus on efficiency can give mis-leading results which could translate into flawed educational policy prescriptions
We performed DEA over available educational inputs and outputs during four non-overlapping periods from 2004 to 2015 in 24 EU countries DEA allowed us to rank countries regarding their tertiary education efficiencyeffectiveness in achieving favorable educational and labor market outcomes However we argued that DEA results should be interpreted with a great deal of caution and should not serve as important educational policy and strategy inputs due to the lack of the quality of educational inputs and outputs considerations as well as the decreasing returns on higher education in countries with broad coverage of the population by tertiary edu-cation To avoid a potential bias towards the low input units within the DEA educa-tional inputs and outputs were adjusted for the quality of education indicators Spe-cifically we differentiated the quantity and quality measures of educational inputs and outputs which enabled us to distinguish tertiary education efficiency from ter-tiary education effectiveness since the latter seems to matter more for growth
Our results show that many less developed EU countries achieve efficiency but not effectiveness in tertiary education The opposite is true for some developed coun-tries This is possible due to the low (high) educational inputs in less (more) devel-
oza
na n
ad
ov
eza jelić ma
rg
ar
eta ga
rd
ijan k
edžo
efficien
cy v
s effectiv
eness a
n an
aly
sis of tertia
ry edu
catio
n ac
ro
ss eur
ope
pub
lic secto
r ec
on
om
ics
42 (4) 381-414 (2018)
402 oped countries However when we consider some quality indicators of outcomesoutputs a few less developed EU countries which were characterized as efficient in the quantity model fail to reach defined efficiency border On the other hand some of the inefficient developed countries increase their DEA based ranking and achieve effectiveness (quality-based efficiency) It is not only that the quality of educational outputs matters for the results but the same is true for input quality considerations It turns out that some countries which were downgraded (upgraded) in the output quality DEA model have a lower (higher) quality student base as measured by PISA results Since it could not be expected that tertiary education provides the same quality of outcomes with different input quality efficiency improves (deteriorates) in the input-output quality-based model in many countries with a low (high) quality student base Therefore the results confirmed our hypothesis that quality considera-tions could significantly affect standard tertiary education efficiency analysis results Any future research in this area should not evaluate tertiary education effi-ciency only in terms of the quantity measures of educational inputs and outputs As already emphasized the literature on economic growth and convergence long ago acknowledged educational quality as being more important than quantity DEA based efficiencyeffectiveness research should follow this example
Future research should dig deeper into the rich set of models and results which DEA provides Questions like ldquowhat induces inefficiency in inefficient countriesrdquo (see figure A1 in appendix) and ldquowhich countries define the reference sets (role-models) for inefficient countriesrdquo (see tables A2-A4 in appendix) are especially important for countries like Croatia which proved to be inefficient and ineffective regarding tertiary education Research into the first question should illuminate potential financial black holes while the answers to the second question could shed some light on good practices which could be (easily) implemented in Croa-tian education and customized for its needs From the methodological point of view any future research should address the issues of large numbers of variables which result in too many efficient decision units (countries) as well as some tim-ing and variable selection issues
The key policy implication of our results suggests that greater emphasis should be put on the convergence of tertiary education effectiveness (and not efficiency) within the EU to enhance transmission of tertiary education outcomes into higher productivity and growth rates However since primary and secondary education define the ldquoqualityrdquo of inputs at higher educational levels such a policy task requires comprehensive educational reform in countries which are lagging behind Nevertheless it should be emphasized that the major limitations of the study fol-low from the limited data resources and some concerns about the quality of the data reported by Eurostat The inclusion of data that do not properly represent the situation might significantly change the relative results of the analysis
disclosure statement No potential conflict of interest was reported by the authors
oza
na n
ad
ov
eza jelić ma
rg
ar
eta ga
rd
ijan k
edžo
efficien
cy v
s effectiv
eness a
n an
aly
sis of tertia
ry edu
catio
n ac
ro
ss eur
ope
pub
lic secto
r ec
on
om
ics
42 (4) 381-414 (2018)403
aPP
en
dIX
Ta
bl
e a
1Pr
evio
us re
sear
ch ra
nkin
gs (D
EA)
Pape
ra
hec
Šonj
e
Des
kar-
Škrb
ić
and
Šonj
e (2
018)
toth
(2
009)
ari
stov
nik
and
Oba
dić
(201
1)a
ubyn
et a
l (2
009)
yoto
va a
nd
stef
anov
a (2
017)
year
2005
-201
3 (a
vg)
2006
1999
-200
7 (a
vg)
1998
-20
0120
02-
2005
1998
-20
0120
02-
2005
1998
-20
0120
02-
2005
1998
-20
0120
02-
2005
2012
and
201
4
mod
el1
21
12
31
12
23
34
41
23
no
of e
u c
ount
ries
1117
2222
2225
9A
ustri
a
15
13 9
11 9
10 6
9 8
B
ulga
ria3
31
10 8
10 8
2420
2325
65
5B
elgi
um
2121
2625
8 8
7 9
C
ypru
s
3727
11
1027
23
Cze
ch R
epub
lic1
111
133
717
18
14
1722
243
31
Ger
man
y
13
1516
1210
911
1011
D
enm
ark
111
1 9
111
10 8
7
Esto
nia
82
21
1619
2728
1722
1815
1716
77
6G
reec
e
18
1910
3118
2228
2719
2424
23
Spai
n
1
3217
3426
2720
2021
1818
15
Finl
and
12 1
120
1 7
1 7
1 7
1 5
Fr
ance
934
2432
1917
1611
1213
1214
C
roat
ia9
8
2632
23
Hun
gary
47
1612
28 9
2323
2426
2322
2122
88
8Ir
elan
d
1721
14 1
1 1
1 1
1 1
1
Italy
118
2322
1212
1314
1312
1312
oza
na n
ad
ov
eza jelić ma
rg
ar
eta ga
rd
ijan k
edžo
efficien
cy v
s effectiv
eness a
n an
aly
sis of tertia
ry edu
catio
n ac
ro
ss eur
ope
pub
lic secto
r ec
on
om
ics
42 (4) 381-414 (2018)
404
Pape
ra
hec
Šonj
e
Des
kar-
Škrb
ić
and
Šonj
e (2
018)
toth
(2
009)
ari
stov
nik
and
Oba
dić
(201
1)a
ubyn
et a
l (2
009)
yoto
va a
nd
stef
anov
a (2
017)
year
2005
-201
3 (a
vg)
2006
1999
-200
7 (a
vg)
1998
-20
0120
02-
2005
1998
-20
0120
02-
2005
1998
-20
0120
02-
2005
1998
-20
0120
02-
2005
2012
and
201
4
mod
el1
21
12
31
12
23
34
41
23
Lith
uani
a1
1
112
128
2621
1917
1616
171
11
Latv
ia1
1
2013
2317
11
1M
alta
16
1519
16 7
911
10
Net
herla
nds
10 1
1 1
1 1
5 1
6
Pola
nd5
117
122
1322
2018
1516
1915
185
64
Portu
gal
1425
2522
2122
2120
21
Rom
ania
26
13
3510
113
22
2Sw
eden
823
827
1 1
1 1
1 1
1 1
Sl
oven
ia7
5
113
129
1415
1825
2525
204
44
Slov
akia
64
1 1
36 1
2424
2524
1514
1919
U
nite
d K
ingd
om
7
2219
17 1
1 1
1 1
1 1
1
Sour
ce A
utho
rs
oza
na n
ad
ov
eza jelić ma
rg
ar
eta ga
rd
ijan k
edžo
efficien
cy v
s effectiv
eness a
n an
aly
sis of tertia
ry edu
catio
n ac
ro
ss eur
ope
pub
lic secto
r ec
on
om
ics
42 (4) 381-414 (2018)405Figure a1
Input and output slacks of inefficient countriesa) Quantity model results
i Output slacks () ii Input slacks ()
-45-40-35-30-25-20-15-10-50
Finl
and
Slov
enia
Net
herla
nds
Den
mar
kEs
toni
aB
elgi
umH
unga
rySw
eden
Pola
ndC
roat
iaPo
rtuga
lR
oman
iaA
ustri
aB
ulga
riaC
zech
R
Ger
man
yLa
tvia
(I)EX2( GDP) (I)FA( EX) (I)ST
0
10
20
30
40
50
60
70
Portu
gal
Aus
tria
Ger
man
yR
oman
iaB
ulga
riaSl
oven
iaSw
eden
Net
herla
nds
Hun
gary
Cro
atia
Finl
and
Esto
nia
Bel
gium
Pola
ndD
enm
ark
Cze
ch R
La
tvia
(O)GRAD(20-29) (O)POPT (O)UUT
b) Outputs quality model resultsi Output slacks () ii Input slacks ()
-60
-50
-40
-30
-20
-10
0
Finl
and
Den
mar
kR
oman
iaSl
oven
iaEs
toni
aSw
eden
Portu
gal
Hun
gary
Net
herla
nds
Cro
atia
Cze
ch R
Po
land
Bel
gium
Bul
garia
Spai
nG
erm
any
Aus
tria
Fran
ceIr
elan
dLa
tvia
(I)EX2( GDP) (I)FA( EX) (I)ST (O)GRAD(20-29) (O)UUTACTT
(O)GDPpc (O)UR
0
50
100
150
200
250
300A
ustri
aG
erm
any
Portu
gal
Spai
nEs
toni
aB
ulga
riaH
unga
rySl
oven
iaC
roat
iaSw
eden
Net
herla
nds
Rom
ania
Irel
and
Bel
gium
Finl
and
Latv
iaD
enm
ark
Cze
ch R
Fr
ance
Pola
nd
c) Inputs and outputs quality model resultsi Output slacks () ii Input slacks ()
Den
mar
kR
oman
ia
Slov
enia
Swed
enPo
rtuga
l
Hun
gary
Net
herla
nds
Cro
atia
Bel
gium
Bul
garia
Spai
n
Ger
man
yA
ustri
aIta
lyLa
tvia
Lith
uani
a
Den
mar
k
Rom
ania
Slov
enia
Swed
en
Portu
gal
Hun
gary
Net
herla
nds
Cro
atia
Bel
gium
Bul
garia
Spai
nG
erm
any
Aus
tria
Italy
Latv
ia
Lith
uani
a
(I)EX2( GDP) (I)FA( EX) (O)GRAD(20-29) (O)UUTACTT
(I)ST (I)PISA (O)GDPpc (O)UR
-60
-50
-40
-30
-20
-10
0
0
50
100
150
200
250
300
Source Authors
oza
na n
ad
ov
eza jelić ma
rg
ar
eta ga
rd
ijan k
edžo
efficien
cy v
s effectiv
eness a
n an
aly
sis of tertia
ry edu
catio
n ac
ro
ss eur
ope
pub
lic secto
r ec
on
om
ics
42 (4) 381-414 (2018)
406T
ab
le a
2Re
fere
nce
set o
f a D
MU
from
the
quan
tity-
base
d D
EA m
odel
by
peri
od
2004
-200
620
07-2
009
2010
-201
220
13-2
015
1B
elgi
umB
elgi
umB
elgi
um
Bel
gium
Irel
and-
Lith
uani
a2
Bul
garia
Bul
garia
Bel
gium
-Cze
ch R
ep-E
ston
ia-F
inla
ndB
ulga
riaC
zech
Rep
-Ger
man
y-Sl
ovak
ia-U
K3
Cze
ch R
ep
Cze
ch R
ep
Cze
ch R
ep
Cze
ch R
ep
Cze
ch R
ep
4D
enm
ark
Den
mar
kD
enm
ark
Irel
and-
Lith
uani
a-U
KIr
elan
d-Li
thua
nia
5G
erm
any
Ger
man
yB
elgi
um-S
lova
kia-
Finl
and
Bul
garia
-Hun
gary
-Fin
land
-UK
Ger
man
y6
Esto
nia
Esto
nia
Esto
nia
Esto
nia
Esto
nia
7Ir
elan
dIr
elan
dIr
elan
d Ir
elan
dIr
elan
d8
Spai
nSp
ain
Spai
n Sp
ain
Spai
n9
Fran
ceFr
ance
Fran
ce
Fran
ceFr
ance
10C
roat
iaC
roat
iaC
zech
Rep
-Spa
in-C
roat
ia-P
olan
dC
zech
Rep
-Fra
nce-
Pola
ndC
zech
Rep
-Lith
uani
a11
Italy
Italy
Italy
Ita
lyIta
ly
12La
tvia
Latv
iaLa
tvia
C
zech
Rep
-Fra
nce-
Lith
uani
a-Po
land
-Rom
ania
Cze
ch R
ep-G
erm
any-
Irel
and-
Lith
uani
a-U
K13
Lith
uani
aLi
thua
nia
Lith
uani
a Li
thua
nia
Lith
uani
a14
Hun
gary
Hun
gary
Irel
and-
Slov
akia
-Fin
land
-UK
Hun
gary
Hun
gary
15N
ethe
rland
sN
ethe
rland
sB
elgi
um-D
enm
ark-
Finl
and
Irel
and-
Finl
and-
UK
Irel
and-
Lith
uani
a16
Aus
tria
Aus
tria
Bel
gium
-Slo
vaki
a-Fi
nlan
d B
ulga
ria-S
pain
-Slo
vaki
a-U
KC
zech
Rep
-Spa
in-S
lova
kia-
UK
17Po
land
Pola
ndPo
land
Po
land
Lith
uani
a18
Portu
gal
Portu
gal
Irel
and-
Lith
uani
a-Po
land
-Slo
vaki
aFr
ance
-Lith
uani
a-R
oman
ia-U
KLi
thua
nia-
Slov
akia
19R
oman
iaR
oman
iaPo
land
-Slo
vaki
aR
oman
iaR
oman
ia20
Slov
enia
Slov
enia
Lith
uani
a-Sl
ovak
ia-U
K
Bul
garia
-Lith
uani
a-H
unga
ry-U
KIr
elan
d-Li
thua
nia
21Sl
ovak
iaSl
ovak
iaSl
ovak
ia
Slov
akia
Slov
akia
22Fi
nlan
dFi
nlan
dFi
nlan
d Fi
nlan
dIr
elan
d-Li
thua
nia
23Sw
eden
Swed
enB
elgi
um-D
enm
ark-
Finl
and
Irel
and-
Finl
and-
UK
Irel
and-
Lith
uani
a24
UK
UK
UK
U
KU
KN
ote
Effi
cien
t cou
ntri
es a
re a
pro
ject
ion
of th
emse
lves
So
urce
Aut
hors
oza
na n
ad
ov
eza jelić ma
rg
ar
eta ga
rd
ijan k
edžo
efficien
cy v
s effectiv
eness a
n an
aly
sis of tertia
ry edu
catio
n ac
ro
ss eur
ope
pub
lic secto
r ec
on
om
ics
42 (4) 381-414 (2018)407
Ta
bl
e a
3Re
fere
nce
set o
f a D
MU
from
the
outp
ut q
ualit
y-ba
sed
DEA
mod
el b
y pe
riod
2004
-200
620
07-2
009
2010
-201
220
13-2
015
1B
elgi
umIr
elan
d-Ita
ly-S
lova
kia-
UK
Irel
and-
Fran
ce-L
ithua
nia-
Slov
akia
-UK
Cze
ch R
ep-G
erm
any-
Irel
and-
Aus
tria
Ger
man
y-N
ethe
rland
s-U
K
2B
ulga
riaC
zech
Rep
-Lat
via-
Lith
uani
a-Sl
ovak
iaC
zech
Rep
-Slo
vaki
aC
zech
Rep
-Ger
man
y-Sl
ovak
iaG
erm
any-
Lith
uani
a-Sl
ovak
ia-
Swed
en3
Cze
ch R
ep
Cze
ch R
ep
Cze
ch R
ep
Cze
ch R
ep
Lith
uani
a-H
unga
ry-U
K4
Den
mar
kIr
elan
d-Li
thua
nia
Irel
and-
Lith
uani
aIr
elan
d-Li
thua
nia
Den
mar
k5
Ger
man
yC
zech
Rep
-Ire
land
Ger
man
yG
erm
any
Ger
man
y
6Es
toni
aC
zech
Rep
-Ire
land
-Pol
and-
UK
Cze
ch R
ep-I
rela
nd-L
ithua
nia-
Rom
ania
Cze
ch R
ep-G
erm
any-
Irel
and-
Lith
uani
aD
enm
ark-
Lith
uani
a-N
ethe
rland
s-Sw
eden
7Ir
elan
dIr
elan
dIr
elan
dIr
elan
dIr
elan
d
8Sp
ain
Cze
ch R
ep-I
rela
nd-F
ranc
eC
zech
Rep
-Fra
nce-
Aus
tria-
Slov
akia
Cze
ch R
ep-S
pain
-Fra
nce-
Italy
Spai
n
9Fr
ance
Fran
ceFr
ance
Fran
ceFr
ance
10C
roat
iaC
zech
Rep
-Cro
atia
-Pol
and
Cze
ch R
ep-P
olan
dC
zech
Rep
-Lith
uani
aD
enm
ark-
Lith
uani
a-Sl
ovak
ia-
Swed
en11
Italy
Italy
Italy
Italy
Italy
-UK
12La
tvia
Latv
iaC
zech
Rep
-Lith
uani
a-R
oman
ia-
Slov
akia
Cze
ch R
ep-G
erm
any-
Lith
uani
aLi
thua
nia-
Hun
gary
-UK
13Li
thua
nia
Lith
uani
aLi
thua
nia
Lith
uani
aLi
thua
nia
14H
unga
ryLi
thua
nia-
Pola
nd-S
lova
kia-
UK
Cze
ch R
ep
Cze
ch R
ep-G
erm
any
Hun
gary
15N
ethe
rland
sC
zech
Rep
-Ire
land
Net
herla
nds
Net
herla
nds
Net
herla
nds
16A
ustri
aIr
elan
d-Ita
ly-S
lova
kia-
UK
Aus
tria
Aus
tria
Den
mar
k-N
ethe
rland
s-Sw
eden
-UK
17Po
land
Pola
ndPo
land
Lith
uani
aD
enm
ark-
Irel
and-
Lith
uani
a-U
K
oza
na n
ad
ov
eza jelić ma
rg
ar
eta ga
rd
ijan k
edžo
efficien
cy v
s effectiv
eness a
n an
aly
sis of tertia
ry edu
catio
n ac
ro
ss eur
ope
pub
lic secto
r ec
on
om
ics
42 (4) 381-414 (2018)
408
2004
-200
620
07-2
009
2010
-201
220
13-2
015
18Po
rtuga
lC
zech
Rep
-Ire
land
-Fra
nce
Irel
and-
Lith
uani
a-R
oman
iaG
erm
any-
Irel
and-
Lith
uani
aD
enm
ark-
Lith
uani
a-Sl
ovak
ia-
Swed
en-U
K19
Rom
ania
Lith
uani
a-Po
land
-Slo
vaki
aR
oman
iaR
oman
iaD
enm
ark-
Spai
n-Sl
ovak
ia-U
K
20Sl
oven
iaC
zech
Rep
-Ire
land
-UK
Cze
ch R
ep-I
rela
nd-
Lith
uani
a-U
KIr
elan
d-Li
thua
nia
Den
mar
k-Ir
elan
d-Li
thua
nia-
UK
21Sl
ovak
iaSl
ovak
iaSl
ovak
iaSl
ovak
iaSl
ovak
ia
22Fi
nlan
dC
zech
Rep
-Ire
land
Cze
ch R
ep-I
rela
nd-U
KC
zech
Rep
-Ger
man
y-Ir
elan
d-A
ustri
aD
enm
ark-
Lith
uani
a-N
ethe
rland
s-Sw
eden
23Sw
eden
Cze
ch R
ep-I
rela
ndG
erm
any-
Irel
and-
Net
herla
nds
Ger
man
y-N
ethe
rland
s-A
ustri
aSw
eden
24U
KU
KU
KU
KU
KSo
urce
Aut
hors
oza
na n
ad
ov
eza jelić ma
rg
ar
eta ga
rd
ijan k
edžo
efficien
cy v
s effectiv
eness a
n an
aly
sis of tertia
ry edu
catio
n ac
ro
ss eur
ope
pub
lic secto
r ec
on
om
ics
42 (4) 381-414 (2018)409
Ta
bl
e a
4Re
fere
nce
set o
f a D
MU
from
the
inpu
t and
out
put q
ualit
y ndash
base
d D
EA m
odel
by
peri
od
2004
-200
620
07-2
009
2010
-201
220
13-2
015
1B
elgi
umIr
elan
d-Fr
ance
-Ita
ly-
Slov
akia
-UK
Bel
gium
Cze
ch R
ep-G
erm
any-
Irel
and-
Aus
tria
Ger
man
y-N
ethe
rland
s-U
K
2B
ulga
riaC
zech
Rep
-Lat
via-
Lith
uani
a-Sl
ovak
iaC
zech
Rep
-Slo
vaki
aC
zech
Rep
-Ger
man
y-Sl
ovak
iaG
erm
any-
Lith
uani
a-Sl
ovak
ia-
Swed
en3
Cze
ch R
ep
Cze
ch R
ep
Cze
ch R
ep
Cze
ch R
ep
Cze
ch R
ep
4D
enm
ark
Irel
and-
Lith
uani
aD
enm
ark
Irel
and-
Lith
uani
aD
enm
ark
5G
erm
any
Cze
ch R
ep-I
rela
ndG
erm
any
Ger
man
yG
erm
any
6Es
toni
aEs
toni
aEs
toni
aEs
toni
aEs
toni
a7
Irel
and
Irel
and
Irel
and
Irel
and
Irel
and
8Sp
ain
Cze
ch R
ep-I
rela
nd-F
ranc
eC
zech
Rep
-Ger
man
y-Fr
ance
-A
ustri
a-Sl
ovak
iaSp
ain
Spai
n
9Fr
ance
Fran
ceFr
ance
Fran
ceFr
ance
10C
roat
iaC
roat
iaC
zech
Rep
-Pol
and
Cze
ch R
ep-L
ithua
nia
Den
mar
k-Li
thua
nia-
Slov
akia
-Sw
eden
11Ita
lyIta
lyIta
lyIta
lyIta
ly
12La
tvia
Latv
iaLa
tvia
Cze
ch R
ep-L
ithua
nia-
Pola
nd-
Finl
and
Ger
man
y-Ir
elan
d-Li
thua
nia-
Finl
and-
UK
13Li
thua
nia
Lith
uani
aLi
thua
nia
Lith
uani
aLi
thua
nia
14H
unga
ryC
zech
Rep
-Ire
land
-Pol
and-
UK
Cze
ch R
ep-S
lova
kia-
Finl
and
Cze
ch R
ep-G
erm
any
Hun
gary
15N
ethe
rland
sC
zech
Rep
-Ire
land
-Fin
land
Net
herla
nds
Net
herla
nds
Net
herla
nds
16A
ustri
aIr
elan
d-Ita
ly-S
lova
kia-
UK
Aus
tria
Aus
tria
Den
mar
k-Sw
eden
-UK
17Po
land
Pola
ndPo
land
Pola
ndPo
land
18Po
rtuga
lC
zech
Rep
-Ire
land
-Fra
nce
Irel
and-
Lith
uani
a-Po
land
-R
oman
iaG
erm
any-
Irel
and-
Lith
uani
aD
enm
ark-
Spai
n-Li
thua
nia-
Slov
akia
-Sw
eden
-UK
oza
na n
ad
ov
eza jelić ma
rg
ar
eta ga
rd
ijan k
edžo
efficien
cy v
s effectiv
eness a
n an
aly
sis of tertia
ry edu
catio
n ac
ro
ss eur
ope
pub
lic secto
r ec
on
om
ics
42 (4) 381-414 (2018)
410
2004
-200
620
07-2
009
2010
-201
220
13-2
015
19R
oman
iaLi
thua
nia-
Pola
nd-S
lova
kia
Rom
ania
Rom
ania
Den
mar
k-Sp
ain-
Slov
akia
-UK
20Sl
oven
iaC
zech
Rep
-Ire
land
-Pol
and-
Finl
and
Cze
ch R
ep-I
rela
nd-
Lith
uani
a-U
KIr
elan
d-Li
thua
nia
Den
mar
k-Es
toni
a-Ir
elan
d-Fi
nlan
d-U
K21
Slov
akia
Slov
akia
Slov
akia
Slov
akia
Slov
akia
22Fi
nlan
dFi
nlan
dFi
nlan
dFi
nlan
dFi
nlan
d23
Swed
enC
zech
Rep
-Ire
land
Ger
man
y-Ir
elan
d-N
ethe
rland
sG
erm
any-
Net
herla
nds-
Aus
tria
Swed
en24
UK
UK
UK
UK
UK
Sour
ce A
utho
rs
oza
na n
ad
ov
eza jelić ma
rg
ar
eta ga
rd
ijan k
edžo
efficien
cy v
s effectiv
eness a
n an
aly
sis of tertia
ry edu
catio
n ac
ro
ss eur
ope
pub
lic secto
r ec
on
om
ics
42 (4) 381-414 (2018)411
Ta
bl
e a
5Ef
ficie
ncy
scor
es o
btai
ned
from
all
mod
els
by p
erio
d
Qua
ntity
mod
elo
utpu
t qua
lity
mod
elIn
put a
nd o
utpu
t qua
lity
mod
el20
04-2
006
2007
-200
920
10-2
012
2013
-201
520
04-2
006
2007
-200
920
10-2
012
2013
-201
520
04-2
006
2007
-200
920
10-2
012
2013
-201
51
Bel
gium
11
095
40
905
094
097
30
929
098
90
961
10
929
098
92
Bul
garia
087
91
096
41
070
70
879
086
40
986
070
70
879
086
40
986
3C
zech
Rep
1
11
095
11
11
098
11
11
4D
enm
ark
10
932
091
21
087
70
996
099
31
087
71
099
31
5G
erm
any
087
60
954
11
093
11
10
931
11
6Es
toni
a1
11
093
10
770
837
073
90
748
11
11
7Ir
elan
d1
11
11
11
11
11
18
Spai
n1
11
10
920
943
11
092
095
21
19
Fran
ce1
11
11
11
11
11
110
Cro
atia
10
803
080
60
873
10
808
080
60
821
10
808
080
60
821
11Ita
ly1
11
11
11
11
11
112
Latv
ia1
094
30
905
085
71
091
90
904
086
21
10
955
092
413
Lith
uani
a1
11
11
11
11
11
114
Hun
gary
089
81
11
081
10
847
087
91
081
60
909
087
91
15N
ethe
rland
s0
929
091
60
853
087
80
947
11
10
957
11
116
Aus
tria
071
90
805
084
10
843
097
71
10
90
977
11
09
17Po
land
11
10
995
11
10
975
11
11
18Po
rtuga
l0
591
062
80
679
072
50
742
071
30
740
733
074
20
713
074
073
719
Rom
ania
076
81
10
748
075
11
10
725
075
11
10
725
20Sl
oven
ia0
811
073
50
741
076
80
810
763
078
90
752
082
40
763
078
90
833
21Sl
ovak
ia1
11
11
11
11
11
122
Finl
and
11
099
50
997
093
50
990
967
092
41
11
123
Swed
en0
903
090
60
914
10
908
096
90
981
090
80
969
098
124
UK
11
11
11
11
11
11
Sour
ce A
utho
rs
oza
na n
ad
ov
eza jelić ma
rg
ar
eta ga
rd
ijan k
edžo
efficien
cy v
s effectiv
eness a
n an
aly
sis of tertia
ry edu
catio
n ac
ro
ss eur
ope
pub
lic secto
r ec
on
om
ics
42 (4) 381-414 (2018)
412 references1 Afonso A and St Aubyn M 2006 Cross-country efficiency of secondary
education provision A semi-parametric analysis with non-discretionary inputs Economic Modelling 23(3) pp 476-491 httpsdoiorg101016jeconmod200602003
2 Ahec Šonje A Deskar-Škrbić M and Šonje V 2018 Efficiency of public expenditure on education comparing Croatia with other NMS MPRA Paper No 85152 Available at lthttpsmpraubuni-muenchende851521MPRA_paper_85152pdfgt
3 Altinok N Diebolt C and Demeulemeester J-L 2014 A new international database on education quality 1965-2010 Applied Economics 46(11) pp 1212-1247 httpsdoiorg101080000368462013868592
4 Aristovnik A 2013a Technical Efficiency of Education Sector in the EU and OECD Countries The Case of Tertiary Education Conference Proceedings 16th Toulon-Verona Conference ldquoExcellence in Servicesrdquo Ljubljana 29-30 August 2013 pp 43-51
5 Aristovnik A 2013b Relative efficiency of education expenditures in East-ern Europe a non-parametric approach Journal of Knowledge Management Economics and Information Technology ScientificPapersorg 3(3) 1-4 Avail-able at lthttpwwwscientificpapersorgwp-contentfiles1379_ARISTOVNIK_Relative_Efficiency_of_Education_Expenditures_in_Eastern_Europepdfgt
6 Aristovnik A and Obadić A 2011 The funding and efficiency of higher education in Croatia and Slovenia a non-parametric comparison Amfiteatru Economic 13(30) pp 362-376 Available at lthttpwwwamfiteatrueco-nomicrotempArticle_1050pdfgt
7 Aristovnik A and Obadić A 2014 Measuring relative efficiency of second-ary education in selected EU and OECD countries the case of Slovenia and Croatia Technological and Economic Development of Economy 20(3) pp 419-433 httpsdoiorg103846202949132014880085
8 Aubyn M S [et al] 2008 Study on the efficiency and effectiveness of public spending on tertiary education European Economy Economic Papers No 390 httpsdoiorg10276530348
9 Banker R D Charnes A and Cooper W W 1984 Some Models for Esti-mating Technical and Scale Inefficiencies in Data Envelopment Analysis Management Science 30(9) pp 1078-1092 Available at lthttpwwwutdal-lasedu~ryoungphdseminarBCC1984pdfgt
10 Banker R D and Morey R C 1986 Efficiency Analysis for Exogenously Fixed Inputs and Outputs Operations Research 34(4) pp 513-521 httpsdoiorg101287opre344513
11 Barro R 2001 Human Capital and Growth The American Economic Review 91(2) pp 12-17 Available at lthttpswwwaeaweborgarticlesid=101257aer91212gt
12 Barro R 2013 Education and Economic Growth Annals of Economics and Finance 14(2) pp 301-328 Available at lthttpdownaefwebnetWorking-Papersw571pdfgt
oza
na n
ad
ov
eza jelić ma
rg
ar
eta ga
rd
ijan k
edžo
efficien
cy v
s effectiv
eness a
n an
aly
sis of tertia
ry edu
catio
n ac
ro
ss eur
ope
pub
lic secto
r ec
on
om
ics
42 (4) 381-414 (2018)41313 Bourguignon F Elkana Y and Pleskovic B 2007 Capacity Building in
Economics Education and Research Washington DC World Bank14 Charnes A Cooper W W and Rhodes E 1978 Measuring the efficiency of
decision making units European Journal of Operational Research 2(6) pp 429-444 httpsdoiorg1010160377-2217(78)90138-8
15 Clements B J 2002 How efficient is education spending in Europe Euro-pean review of economics and finance 1(1) pp 3-26
16 Cooper W W Seiford L M and Zhu J (eds) 2011 Handbook on Data Envelopment Analysis International Series in Operations Research amp Man-agement Science Cham Springer Science and Business Media
17 Cooper W W and Seiford L M Tone K 2006 Introduction to Data Envel-opment Analysis and Its Uses New York Springer
18 Emrouznejad A and Yang G 2018 A survey and analysis of the first 40 years of scholarly literature in DEA 1978-2016 Socio-Economic Planning Sciences Recent developments on the use of DEA in the public sector 61(March) pp 4-8 httpsdoiorg101016jseps201701008
19 Eurostat 2018a Main GDP aggregates per capita Gross domestic product at market prices Luxembourg Eurostat Available at lthttpappssoeurostateceuropaeunuishowdodataset=nama_10_pcamplang=engt
20 Eurostat 2018b Population by educational attainment level sex and age () ndash main indicators Luxembourg Eurostat Available at lthttpappssoeuro-stateceuropaeunuishowdodataset=edat_lfse_03amplang=enggt
21 Eurostat 2018c Financial aid to students by education level ndash as of total public expenditure Luxembourg Eurostat Available at lthttpseceuropaeueurostatwebproducts-datasetsproductcode=educ_uoe_fina01gt
22 Eurostat 2018d General government expenditure by function (COFOG) Luxembourg Eurostat Available at lthttpseceuropaeueurostatstatistics-explainedindexphpGovernment_expenditure_by_function_E28093_COFOGgt
23 Eurostat 2018e Ratio of pupils and students to teachers and academic staff by education level and programme orientation Luxembourg Eurostat Avail-able at lthttpsdataeuropaeueuodpdatadatasetSGGhyHTPqi7AMFH-FePHoxwgt
24 Eurostat 2018f Tertiary education graduates Luxembourg Eurostat Avail-able at lthttpseceuropaeueurostatstatistics-explainedindexphpTertiary_ education_statisticsgt
25 Eurostat 2018g Graduates by education level programme orientation com-pletion sex and age Luxembourg Eurostat Available at lthttpsdataeuropaeueuodpdatadatasetBhJ0FRyxpdrmRBlsQAkggt
26 Eurostat 2018h Unemployment rates by sex age and educational attainment level () Luxembourg Eurostat Available at lthttpappssoeurostateceuropaeunuishowdodataset=lfsq_urgaedamplang=engt
27 Eurostat 2018i Activity rates by sex age and educational attainment level () Luxembourg Eurostat Available at lthttpappssoeurostateceuropaeunuishowdodataset=lfsa_argaedamplang=engt
oza
na n
ad
ov
eza jelić ma
rg
ar
eta ga
rd
ijan k
edžo
efficien
cy v
s effectiv
eness a
n an
aly
sis of tertia
ry edu
catio
n ac
ro
ss eur
ope
pub
lic secto
r ec
on
om
ics
42 (4) 381-414 (2018)
414 28 Eurostat 2018j Underachieving 15-year-old students by sex and field ndash PISA survey Luxembourg Eurostat Available at lthttpseceuropaeueurostatwebproducts-datasetsproductcode=educ_outc_pisagt
29 Fortunato P and Panizza U 2015 Democracy education and the quality of government Journal of Economic Growth 20(4) pp 333-363 httpsdoiorg101007s10887-015-9120-5
30 Hanushek E A and Kimko D D 2000 Schooling Labor-Force Quality and the Growth of Nations American Economic Review 90(5) pp 1184-1208 httpsdoiorg101257aer9051184
31 Kenny J 2008 Efficiency and Effectiveness in Higher Education Who is Accountable for What Australian Universitiesrsquo Review 50(1) pp 11-19 Available at lthttpsfilesericedgovfulltextEJ802278pdfgt
32 Kuosmanen T 2009 Data Envelopment Analysis with Missing Data The Journal of the Operational Research Society 60(12) pp 1767-1774 httpsdoiorg101057jors2008132
33 Pritchett L 2001 Where Has All the Education Gone The World Bank Eco-nomic Review 15(3) pp 367-391 Available at lthttpdocumentsworld-bankorgcurateden859821468180273788pdf773740JRN020010l0the0Education0Gonepdfgt
34 Pritchett L 2013 The Rebirth of Education Schooling Ainrsquot Learning Center for Global Development Washington Center for Global Development
35 Scheerens J Luyten H and van Ravens J 2011 Measuring Educational Quality by Means of Indicators in J Scheerens H Luyten and J van Ravens eds Perspectives on Educational Quality Springer Netherlands Dordrecht pp 35-50 httpsdoiorg101007978-94-007-0926-3_2
36 Szirmai A 2015 Socio-Economic Development Cambridge Cambridge University Press
37 Times Higher Education 2017 World University Rankings Available at lthttpswwwtimeshighereducationcomgt
38 Toth R 2009 Using DEA to Evaluate Efficiency of Higher Education APSTRACT Applied Studies in Agribusiness and Commerce pp 79-82 Available at lthttpsageconsearchumnedubitstream53548217_Using 20DEA_Apstractpdfgt
39 World Bank 2018 Education Statistics-Gross enrolment ratio in tertiary educa-tion Washington The World Bank Available at lthttpsdataworldbankorggt
40 Woumlszligmann L 2006 Efficiency and Equity of European Education and Train-ing Policies CESifo Working Paper Series (No 1779) Available at lthttpswwwcesifo-groupdeDocDLcesifo1_wp1779pdfgt
41 Yotova L and Stefanova K 2017 Efficiency of Tertiary Education Expend-iture in CEE Countries Data Envelopment Analysis Economic Alternatives (3) pp 352-364 Available at lthttpswwwunwebguploadsAlternatives2_Alternativi_english_br_3_2017pdfgt
Dynamics and determinants of emigration the case of Croatia and the experience of new EU member states
IVANA DRAŽENOVIĆ mag oecMARINA KUNOVAC dott mag desDOMINIK PRIPUŽIĆ dipl oec
ArticleJEL J61 E65 C33httpsdoiorg103326pse4243
We would like to thank two anonymous referees and the editor for the constructive and very useful remarks We are particularly grateful to Evan Kraft Gordi Sušić Vedran Šošić Teo Matković Maja Bukovšak Nina Ranilović Davor Kunovac Marko Mrkalj Ervin Duraković Karlo Kotarac and Alan Bobetko for their valuable comments during the early stages of the research Our work also benefited a lot from the presentation and discussion during the 24th Dubrovnik Economic Conference in June 2018 The views expressed are those of the authors and do not necessarily represent those of the Croatian National Bank No financial support received
Received June 1 2018 Accepted November 4 2018
The article was submitted for the 2018 annual award of the Prof Dr Marijan Hanžeković Prize
Ivana DRAŽENOVIĆCenter for Economic Research and Graduate Education ndash Economics Institute Politickyacutech vězňů 7 111 21 Prague 1 Czech Republice-mail IvanaDrazenoviccerge-eiczORCiD 0000-0002-6738-1288
Marina KUNOVACCroatian National Bank Trg hrvatskih velikana 3 10000 Zagreb Croatiae-mail marinakunovachnbhr ORCiD 0000-0002-3200-5928
Dominik PRIPUŽIĆCroatian National Bank Trg hrvatskih velikana 3 10000 Zagreb Croatiae-mail dominikpripuzichnbhrORCiD 0000-0003-3377-9260
ivan
a dr
ažen
ov
ić ma
rin
a ku
no
vac d
om
inik pr
ipužić
dy
na
mic
s an
d deter
min
an
ts of em
igr
ation th
e ca
se of c
ro
atia an
d the ex
perien
ce
of n
ew eu m
emb
er states
pub
lic secto
r ec
on
om
ics
42 (4) 415-447 (2018)
416 abstractThis paper analyzes the emigration flows from Croatia and other new EU member states to the core EU countries after their EU accession In order to assess the magnitude and dynamics of the recent emigration wave properly we construct the series of indirect emigration flows resorting to the national statistical offices of the selected core EU destination countries We compare the Croatian experience with that of other NMS and show that the intensity of Croatiarsquos emigration flows after EU accession is proportional to that of the Romanian and Bulgarian cases Finally we empirically analyze the economic and non-economic drivers of emi-gration from NMS to the core EU in the 2000-2016 period Results show that both economic (measured by different GDP and labour market indicators) and non-economic factors (capturing the EU accession the level of corruption in the econ-omy and demographic characteristics of the origin country population) are rele-vant for emigration decisions
Keywords emigration EU accession new member states gravity model
1 IntroductIonIn mid-2013 Croatia joined the European Union (EU) and as a member state (MS) gained access to the EU single market By becoming a part of the single market the country benefits from ldquothe four freedomsrdquo ndash the free movement of goods services capital and labour which enable more efficient reallocation of domestic factors of production resulting in new business and trade opportunities and ultimately increasing MS growth prospects At the same time EU accession triggered imple-mentation of temporary transitional provisions restricting free labour mobility from Croatia to the labour markets of other MS1 Despite that one of the direct effects of EU accession and the related reallocation of domestic factors of produc-tion was also a significant emigration outflow from Croatia to other states in the EU
Such developments raised emigration-related issues to the forefront of public debate in Croatia Drawing on a mixture of anecdotal evidence ad hoc surveys and social network posts the media predominantly engaged in painting and prop-agating a bleak picture of the ldquoCroatian exodusrdquo At the same time no proper estimate of the magnitude and nature of this emigration wave has been made due to inaccurate migration statistics Official migration statistics collected by the Central Bureau of Statistics in Croatia are published with a disclaimer that the numbers of emigrants are based on the self-reporting of emigration by emigrants themselves a process clearly discouraged by a relatively burdensome procedure that results in a loss of domestic social security benefits
1 Transitional provisions do not apply on cross boarder movements of citizens for reasons other than work but only restrict free movement of citizens for work purposes According to the Accession Treaty for Croa-tia transitional provisions can apply for a maximum period of seven years (2+3+2 formula) More details are given in table A1 appendix 1
ivan
a dr
ažen
ov
ić ma
rin
a ku
no
vac d
om
inik pr
ipužić
dy
na
mic
s an
d deter
min
an
ts of em
igr
ation th
e ca
se of c
ro
atia an
d the ex
perien
ce
of n
ew eu m
emb
er states
pub
lic secto
r ec
on
om
ics
42 (4) 415-447 (2018)417Therefore in this paper we try to assess the characteristics of the recent Croatian
emigration wave to EU countries We present a comprehensive analysis of the dynamics and the main determinants of emigration from Croatia to core EU coun-tries following EU accession comparing the Croatian case with the experience of other new member states2
To our knowledge there are few analyses of the impact of the free mobility of labour on Croatian emigration flows Potential migration flows from Croatia after EU accession are ex-ante estimated in Strielkowski Šaacuterkovaacute and Żornaczuk (2013) Fertig and Kahanec (2013) and Vidovic and Mara (2015) Strielkowski Šaacuterkovaacute and Żornaczuk (2013) find that around 220 thousand residents from Croa-tia were expected to live in the EU15 by 2016 The Fertig and Kahanec (2013) estimates vary between negative net migration balance and 360 thousand residents from Croatia in the EU14 by 2020 while the Vidovic and Mara (2015) estimates are between 160 and 220 thousand residents from Croatia in the EU by 2019
Effective emigration outflows from Croatia following the EU accession are ana-lyzed in Vidovic and Mara (2015) and Župarić-Ilijić (2016) Vidovic and Mara (2015) integrate several data sources (CBS data Eurostat employment data data about the stock of Croatian citizens in EU member states and various surveys) They show that emigration patterns from Croatia in 2014 intensified significantly due to higher economic development and better quality of life in other MS as perceived by Croatian emigrants However their paper analyses emigration out-flows only up to 2014 due to data availability Another overall analysis of emigra-tion trends from Croatia is given in Župarić-Ilijć (2016) This author emphasized that Croatian net migration balance significantly worsened with the onset of the global financial crisis and in particular after the accession to the EU and argued that official Central Bureau of Statistics migration data are underestimated and should be compared with destination country data but provided no such estimate Thus in this paper we extend existing literature in time referring to the broader period integrating several data sources and analyzing the movements that were effectively observed after Croatia had joined the EU in 2013 The main contribu-tions of our paper are threefold3
First we construct indirect emigration flows from Croatia following the EU accession Currently the Central Bureau of Statistics (CBS) in Croatia collects the
2 Due to data availability core EU countries are represented by 11 countries Austria Belgium Denmark Finland Germany Ireland Italy Luxembourg Netherlands Sweden and United Kingdom New EU member states are represented by 10 countries Bulgaria Croatia Czech Republic Estonia Hungary Latvia Lithu-ania Poland Slovakia and Slovenia3 In addition several authors implement partial analyses of emigration flows from Croatia following the EU accession Šonje (2018) estimates family emigration by using primary school enrolment data and shows that in 2009-2016 period around 50 thousand young citizens with children left Croatia The Croatian Employ-ment Service uses the annual employersrsquo survey to examine the extent of migration among the employed and shows that in 2016 around 20 thousand employed persons emigrated from Croatia Finally Jurić (2017) did a detailed on line survey among Croatian emigrants in Germany and showed that although economic fac-tors are relevant for emigration decision there is a prevalence of non-economic factors among the motives of emigration for Croatian emigrants
ivan
a dr
ažen
ov
ić ma
rin
a ku
no
vac d
om
inik pr
ipužić
dy
na
mic
s an
d deter
min
an
ts of em
igr
ation th
e ca
se of c
ro
atia an
d the ex
perien
ce
of n
ew eu m
emb
er states
pub
lic secto
r ec
on
om
ics
42 (4) 415-447 (2018)
418 data about migration flows from the Ministry of the Interior which records only persons that have registered the change in their country of usual residence with the Ministry Following related literature contributions (Izquierdo Jimeno and Lac-uesta 2014 Bertoli Bruumlcker and Moraga 2013) we assume that there are no clear incentives and benefits of registering in home country offices when emigrating while on the other hand immigrants have an incentive to register when they arrive in the destination country given that access to some basic social services in a destination country (ie education and health) generally requires registration Therefore we assume that official emigration numbers from CBS could be under-estimated and resort to the European Union destination countries national statisti-cal offices to collect numbers of registered immigrants coming from Croatia The differences are striking Our indirect emigration estimates show that emigration from Croatia to the core EU countries following the accession is on average around 26 times higher than the officially registered numbers in Croatia with around 230 thousands people having left Croatia and settled in one of the analyzed core EU countries in the 2013-2016 period
Secondly we show that although emigration flows in Croatia following the acces-sion are sizeable they are not an isolated case Bulgaria and Romania also expe-rienced proportionally similar population outflows after they became member states in 2007 CEE countries that joined the EU in 2004 also saw an increase in emigration rates towards the core EU countries though to a lower extent Time series of indirect emigration flows from NMS show that higher emigration rates recorded after the EU accession persisted over the years In other words average emigration rate from NMS to the core EU countries in 2016 is on average equal to or higher than the emigration rates in the four years following accession to the EU which corroborates the strong persistency of higher emigration rates4 Such trends raise several serious sustainability concerns for Croatia which will become rele-vant in the medium term since the current population outflow to the core EU countries according to the indirect emigration flows constructed is around 2 of population each year
The third contribution of our paper consists of empirical analyses of the main economic and non-economic determinants of emigration flows from Croatia and other NMS to the core EU countries We believe that their evaluation provides insights that are highly important for policymakers in order to shape and imple-ment adequate and targeted policies to mitigate emigration flows In our analysis of relevant emigration determinants we employed a gravity model Results obtained under alternative specifications and estimation strategies of the gravity model show that the access to the single EU market (after transitional provisions were lifted) has been a main driver of emigration flows in Croatia since 2013 However current economic conditions and labour market indicators together with demographic factors and prevalence of the corruption in the country also
4 That is 12 or 8 years following EU accession
ivan
a dr
ažen
ov
ić ma
rin
a ku
no
vac d
om
inik pr
ipužić
dy
na
mic
s an
d deter
min
an
ts of em
igr
ation th
e ca
se of c
ro
atia an
d the ex
perien
ce
of n
ew eu m
emb
er states
pub
lic secto
r ec
on
om
ics
42 (4) 415-447 (2018)419turned out to be significant in the determination of emigration flows among NMS
and core EU countries implying that there is a room for policymakers to alleviate the intensity of emigration pressures in Croatia
The remainder of the paper is structured as follows in section 2 we describe in detail the major characteristics of recent Croatian emigration flows firstly by dis-cussing Croatiarsquos official emigration figures and secondly by comparing official data with data on indirect emigration from Croatia collected from national statisti-cal offices of the core EU destination countries In section 3 we present a com-parative overview of the emigration experiences of other new EU member states following their EU accession In section 4 we provide a basic overview of gravity models and their applicability in studying migration issues and describe the vari-ables used in the model In section 5 we present different specifications of the gravity models and discuss the results of the econometric analysis together with robustness checks In section 6 we emphasize the main conclusions
2 demograPhIc and geograPhIcal characterIstIcs of croatIan emIgrants
21 emIgratIon flows from croatIa accordIng to the central bureau of statIstIcs data
As a starting point we take a deeper look at the official Croatian migration statis-tics in order to improve our understanding of the migration dynamics in Croatia Notwithstanding existent methodological issues and while accepting the claim that official Croatian migrations are under-reported we nevertheless believe that they could be under-reported systematically which means that they still might contain some useful information about the underlying migration trends
Looking at the big picture we can see that prior to the global financial crisis Croatia had a positive net migration balance However migration flows reversed at the onset of the global financial crisis (net migration balance turned negative) Until the EU accession negative net migration remained relatively low and stable After Croatia became a full member of the EU in July 2013 migration flows clearly intensified (figure 1)
Figure 1 also shows that EU accession had no significant effect on the number of immigrants while emigration outflows intensified significantly with the acces-sion Thus in the remaining part of the paper we concentrate exclusively on gross emigration outflows and analyze emigrantsrsquo main characteristics
Available data provide a basis for a simple demographic analysis of Croatian emi-grants Numbers suggest that there is an almost equal share of male and female emigrants throughout the period with the share of male emigrants slightly increas-ing at times of high migration (figure 2)
ivan
a dr
ažen
ov
ić ma
rin
a ku
no
vac d
om
inik pr
ipužić
dy
na
mic
s an
d deter
min
an
ts of em
igr
ation th
e ca
se of c
ro
atia an
d the ex
perien
ce
of n
ew eu m
emb
er states
pub
lic secto
r ec
on
om
ics
42 (4) 415-447 (2018)
420 Figure 1 Net migration balance of Croatia between 2001 and 2016 Central Bureau of Statistics data net migration
-40
-30
-20
-10
0
10
20
30
2001 2002 2003 2004 2005 2006 2007 2008 2009 2010 2011 2012 2013 2014 2015 2016
In th
ousa
nds
Emigration Immigration Net migration
Note Net migration = number of immigrants ndash number of emigrants in thousandsSource CBS
Figure 2 Structure of emigrants from Croatia by sex between 2002 and 2016 Central Bureau of Statistics data gross emigration flows
0
5
10
15
20
25
30
35
40
2002 2003 2004 2005 2006 2007 2008 2009 2010 2011 2012 2013 2014 2015 2016
Num
ber o
f em
igra
nts
Males Females
Note In thousandsSource CBS
The age structure of emigrants suggests that there was a structural shift towards younger emigrants in the last emigration wave Firstly there is a striking increase in the number of youngest emigrants (age 0-15) and secondly it appears that the decrease in the average age of the emigrants is accelerating Our estimates show that the average age of emigrants in the period between 2001 and 2013 was 415
ivan
a dr
ažen
ov
ić ma
rin
a ku
no
vac d
om
inik pr
ipužić
dy
na
mic
s an
d deter
min
an
ts of em
igr
ation th
e ca
se of c
ro
atia an
d the ex
perien
ce
of n
ew eu m
emb
er states
pub
lic secto
r ec
on
om
ics
42 (4) 415-447 (2018)421years but dropped sharply over next three years and reached 336 years in 2016
(figure 3) These results are in line with Šonje (2018) The author estimates that in 2009-2016 period around 50 thousand young citizens with children left Croatia permanently5
Figure 3 (a) Relative share of different age groups of emigrants and average age of emi-grant between 2002 and 2016 (b) Number of emigrants by different age groups between 2002 and 2016 Central Bureau of Statistics data gross emigration flows
30
32
34
36
38
40
42
44
46
48
00
01
02
03
04
05
06
07
08
09
10
2002
2003
2004
2005
2006
2007
2008
2009
2010
2011
2012
2013
2014
2015
2016
Ave
rage
age
of m
igra
nt (i
n ye
ars)
sh
are
of se
lect
ed a
ge g
roup
in to
tal p
opul
atio
n
0-15 15-39 40-64 65+Average age of migrant (right)
0
4000
8000
12000
16000
20000
24000
0
1000
2000
3000
4000
5000
6000
2002
2003
2004
2005
2006
2007
2008
2009
2010
2011
2012
2013
2014
2015
2016
Num
ber o
f em
igra
nts
65+
25-49 (right)
0-15 15-24 50-64
Source CBS
Turning to the distribution of emigrants across Croatian regions again there is a very clear compositional change towards the end of the analyzed period with a growing proportion of emigrants from less-developed regions Following the rela-tively stable situation during the 2000s the deep and prolonged domestic reces-sion pushed up emigration more or less gradually in almost all regions After the EU accession there was a rapid and pronounced growth of emigration from all regions albeit at a different pace Emigration flows were much stronger in the regions with the highest unemployment As a result looking at the share of migrants in their population in 2016 Croatian regions can be broadly divided into two groups one with the ratio of migrants to domestic population close to or above 1 (Eastern Croatia Central Croatia Lika and Gorski Kotar) and other economically more advanced regions with the ratio of around 066 (figure 4) Therefore even though emigration is a country-wide problem the intensity of emigration flows (as a percentage of total population) is a much stronger phenom-enon in the economically less developed regions (figure 5)
5 Estimates are based exclusively on households with children (obtained by comparison of expected and effec-tive primary school enrolment) and are considered to represent irreversible emigration based on the assump-tion that child integration in system of destination countries strongly disincentives return-migration
ivan
a dr
ažen
ov
ić ma
rin
a ku
no
vac d
om
inik pr
ipužić
dy
na
mic
s an
d deter
min
an
ts of em
igr
ation th
e ca
se of c
ro
atia an
d the ex
perien
ce
of n
ew eu m
emb
er states
pub
lic secto
r ec
on
om
ics
42 (4) 415-447 (2018)
422 Figure 4 Structure of emigrants from Croatia by region between 2001 and 2016 Central Bureau of Statistics data gross emigration flows
00
02
04
06
08
10
12
14
16
Num
ber o
f em
igra
nts
in
of t
otal
pop
ulat
ion
Eastern Croatia Central Croatia Lika and Gorski kotar Central and Southern Adriatic
Northen Adriatic Northwestern Croatia City of Zagreb
2002
2001
2003
2004
2005
2006
2007
2008
2009
2010
2011
2012
2013
2014
2015
2016
Notes Eastern Croatia encompasses Virovitičko-podravska Požeško-slavonska Brodsko-posavska Osječko-baranjska and Vukovarsko-srijemska counties Central Croatia encompass-es Zagrebačka Sisačko-moslavačka Karlovačka and Bjelovarsko-bilogorska counties Lika and Gorski kotar encompass Primorsko-goranska and Ličko-senjska counties Central and Southern Adriatic encompass Zadarska Šibensko-kninska Splitsko-dalmatinska and Dubrovačko-neretvanska counties Northen Adriatic refers to Istarska County Northwestern Croatia encom-pass Krapinsko-zagorska Varaždinska Međimurska and Koprivničko-križevačka countiesSource CBS
Figure 5 Unemployment rate and share of emigrants by county in 2016 Central Bureau of Statistics data gross emigration flows
Sisačko-moslavačka
Virovitičko-podravska
Požeško-slavonskaBrodsko-posavska
Osječko-baranjska
Vukovarsko-srijemska
Istarska
5
10
15
20
25
30
35
40
04 06 08 10 12 14 16 18 20
Une
mpl
oym
ent r
ate
in
Emigration rate as of total population
Krapinsko-zagorska
Varaždinska Međimurska
Grad Zagreb
Splitsko-dalmatinska
Note The size of the circles correspond to the emigration rate as of total population of the countySource CBS
ivan
a dr
ažen
ov
ić ma
rin
a ku
no
vac d
om
inik pr
ipužić
dy
na
mic
s an
d deter
min
an
ts of em
igr
ation th
e ca
se of c
ro
atia an
d the ex
perien
ce
of n
ew eu m
emb
er states
pub
lic secto
r ec
on
om
ics
42 (4) 415-447 (2018)423Finally CBS data show that slightly more than 85 of emigrants from Croatia
after the EU accession was directed to three EU countries Germany Austria and Ireland Figure 6 compares main emigration destinations of Croatians in the EU before and after Croatian accession Although total emigration flows towards the EU increased significantly the composition of the main destinations remained almost unchanged from the period before accession The only exception is Ire-land since emigration to Ireland before the EU accession was almost non-existent in Croatia while in 2016 Ireland become third biggest destination for Croatian emigrants In addition EU accession caused a change in relative position between Germany and Austria two main emigration destinations with even more emi-grants going to Germany This is a direct consequence of Austriarsquos decision to extend the application of transitional provisions for Croatian citizens until June 2018 After 2018 we expect the share of Croatians heading towards Austria to increase unless Austria prolongs the application of the transitional provisions until 20206
Figure 6 (a) Main EU emigration destinations for Croatians in 2010 (b) Main EU emigra-tion destinations for Croatians in 2016 Central Bureau of Statistics data gross emigration flows
713
76
67
47
3224 24 18
457
24201
91
85
8822 14
Germany
Austria
Ireland
Other EU countries
Italy
Slovenia
Sweden
United Kingdom
Germany
Austria
Ireland
Other EU countries
Italy
Slovenia
Sweden
United Kingdom
Total emigration to EU in 2010 ndash 1697 persons Total emigration to EU in 2016 ndash 28659 persons
Note Germany and Italy lifted transitional provisions for Croatia in 2015 UK and Austria are applying transitional provisions until June 2018 with possible extension until 2020Source CBS
6 Prolongation of application of transitional provisions in the period from June 2018 until June 2020 is possi-ble only in the case of serious disturbances for the Austrian labour market that would otherwise occur
ivan
a dr
ažen
ov
ić ma
rin
a ku
no
vac d
om
inik pr
ipužić
dy
na
mic
s an
d deter
min
an
ts of em
igr
ation th
e ca
se of c
ro
atia an
d the ex
perien
ce
of n
ew eu m
emb
er states
pub
lic secto
r ec
on
om
ics
42 (4) 415-447 (2018)
424 22 emIgratIon from croatIa accordIng to natIonal statIstIcal offIces of core eu countrIes
The Croatian Central Bureau of Statistics detailed data about emigration presented so far are useful for an analysis of some main characteristics of Croatian emi-grants However as previously explained in the Introduction the official number of emigrants published by the Central Bureau of Statistics in Croatia is based on the people who voluntarily registered their departure with the authorities while standard migration theory predicts that migrants are much more likely to register in the country of destination than in the country of origin7 Therefore in addition we construct an indirect emigration flow taking as a starting point the immigration statistics from the national statistical offices of the following core EU countries Germany Denmark Austria Ireland Belgium Netherlands Italy Finland Swe-den Luxembourg and United Kingdom For UK and Ireland immigration statis-tics are not available so we use the individually appointed national insurance numbers (NINo) in the UK and personal public service numbers (PPS) in Ireland that are commonly used in the literature (Hazans and Philips 2011) We analyze the period from 2000 until 2016 and for each year in the sample we consult offi-cial immigration statistics of the selected core EU countries and take the number of immigrants coming from Croatia
Where available our preferred choice is statistics that register immigrants from Croatia according to the country of birth principle (as in Netherlands Italy UK and Belgium) or country of previous residence principle (as in Germany and Denmark)8 Immigration flows registered according to citizenship principle (as in Sweden Finland Luxembourg and Austria) could be inaccurate since they also include migrants from Bosnia and Herzegovina (and other countries) having Cro-atian (or dual) citizenship9 According to Jurić (2017) in a survey of Croatian emigrants to Germany around 20 of emigrants registered as Croatian citizens in Germany actually emigrated from Bosnia and Herzegovina This is the reason why we have avoided using migration numbers based on the citizenship principle if the country of birth principle or country of previous residence principle was also available among migration statistics Nevertheless given that for some countries migration statistics are available only based on the citizenship principle indirect emigration flows constructed with resort to the national statistical offices of core EU countries and presented in the remaining part of the paper should be inter-preted as an upper bound for emigration outflows from Croatia Detailed informa-tion about the construction of indirect emigration flows is given in appendix 1 Comparison between constructed indirect emigration flows from Croatia based on
7 Illustrative case in point is a Polish example Following the EU accession Poland experienced a strong emi-gration flows At some point policymakers realized that the official statistics grossly underestimate the extent of emigration As a result research project has been initiated in Poland in order to properly estimate the true numbers The upgraded and consolidated sources raised the official emigration numbers by a factor ten (Sta-tistics Poland 2011)8 Destination country can register immigrants according to the following principles country of birth princi-ple country of previous residence principle and citizenship principle Registration of immigrants according to the different principles is defined by Eurostat International Migration Statistics 9 For Ireland personal public service number the principle for registration of immigrants is not denoted
ivan
a dr
ažen
ov
ić ma
rin
a ku
no
vac d
om
inik pr
ipužić
dy
na
mic
s an
d deter
min
an
ts of em
igr
ation th
e ca
se of c
ro
atia an
d the ex
perien
ce
of n
ew eu m
emb
er states
pub
lic secto
r ec
on
om
ics
42 (4) 415-447 (2018)425data published by national statistical offices of the core EU countries and official
Central Bureau of Statistics data are represented in figure 7 1011
Figure 7 Indirect emigration flows from Croatia to the core EU countries according to national statistical offices of core EU countries compared to the official emigra-tion numbers to EU 27 countries according to Central Bureau of Statistics gross emigration flow
0
10
20
30
40
50
60
70
80
2000 2001 2002 2003 2004 2005 2006 2007 2008 2009 2010 2011 2012 2013 2014 2015 2016
Num
ber o
f em
igra
nts
Indirect emigration numbers ndash from national statistical offices of core EU countres
Official Croatian Bureau of Statistics emigration to EU 27
Note Official Central Bureau of Statistics emigration number for emigration in EU 27 Core EU countries are represented by 11 countries due to data availability Austria Belgium Denmark Finland Germany Ireland Italy Luxembourg Netherlands Sweden and United Kingdom in thousandsSource CBS national statistical offices of the core EU countries
The differences in emigration outflows between the two sources are striking According to the indirect estimates of emigration 230 thousand persons emigrated from Croatia to the core EU countries in the period from 2013-2016 On the other hand official data report 61 thousand emigrants in 2013-2016 period directed towards the selected core EU countries and 102 thousand emigrants in total during the same time period However the difference between the mirror statistics of Cro-atia and core EU destination countries is expected to decrease in the future This would reflect the fact that by the end-2016 the Croatian Tax Administration encour-aged Croatian migrants to change their residency status with authorities in order to
10 According to the Central Bureau of Statistics national statistical offices of the selected core EU countries represent broadly around 90 of total emigration to the European Union from Croatia over the entire sam-ple period which makes them a valid and representative indicator of total emigration flows towards the EU11 We have also estimated total emigration flows from Croatia by putting together (1) indirectly constructed emigration flows to the core EU countries and (2) Central Bureau of Statistics official emigration data for all other emigration destinations ie ldquothe rest of the worldrdquo The same approach is followed in order to construct an approximation of total immigration flows in Croatia Calculation details of total net emigration are given in appendix 2 According to our discretional combination of different data sources net emigration from Cro-atia is estimated to be around 155 thousands person in the 2013-2016 period
ivan
a dr
ažen
ov
ić ma
rin
a ku
no
vac d
om
inik pr
ipužić
dy
na
mic
s an
d deter
min
an
ts of em
igr
ation th
e ca
se of c
ro
atia an
d the ex
perien
ce
of n
ew eu m
emb
er states
pub
lic secto
r ec
on
om
ics
42 (4) 415-447 (2018)
426 avoid double taxation of their income12 The threat of double taxation of income probably incentivized migrants to be more prompt in registering their departure and changing their residence in their origin country offices13
Overall the discrepancies between the mirror statistics of origin and destination countries are common in migration statistics and most other countries are also faced with similar challenges Thus in our analysis we will adopt the same prin-ciple for other NMS Bulgaria Romania Poland Czech Republic Slovakia Slo-venia Hungary Latvia Lithuania and Estonia and construct indirect emigration flows for these countries referring to the immigration statistics of national statisti-cal offices of the core EU countries
3 mIgratIon flows In other new eu member states after the eu accessIon
In this section by looking into the emigration experience of other new EU mem-bers we tried to gain additional insight about some additional characteristics of emigration flows caused by EU accession such as the average structure of emi-grants (according to main demographic attributes) stability of the flows number of years after the accession needed to reach a plateau the likely duration of an emigration wave and possible reversal points
Detailed migration data from national statistical offices of the new EU member states allow us to analyze the main attributes of emigrants from NMS in order to look for some substantial differences or similarities in migration flows between countries According to figure 8 data about the age structure of emigrants does not follow any single path across countries However for all countries in the sample the average age of emigrant in 2016 is similar ranging broadly from the low to the mid-thirties At the same time the median age of the total population is rapidly increasing which in most countries widens the gap between the average popula-tion and average emigrant age This situation makes the emigration outflows of relatively younger citizens even more concerning in terms of the long-term sus-tainability of social services (such as public pensions and health)
Comparison of top emigration destinations for emigrants coming from NMS reveals that Germany is ranked among the top three emigration destinations for all countries in the sample The Croatian main emigration destinations Austria and the United Kingdom are also the second most frequent EU destinations for emi-grants from NMS in 2016 (table 1)14
12 At the beginning of 2017 Croatian government adopted the Ordinance for the implementation of the Gen-eral Tax Act (OG 3017) that clarified the process of determination of residency status for tax purposes and induced migrants to register their change of residency within authorities to avoid double income taxation 13 CBS is constantly working on improving migration data sources so part of the observed developments might reflect underlying methodological changes For example in 2011 the CBS changed its definition of migrants from people who registered their departurearrival to people who are absent from their usual place of residence in a one year period14 Nevertheless there are some peculiarities among main emigration destinations between NMS Finland was the main destination for emigrants from Estonia and Spain for emigrants from Romania in 2016 reflecting their cultural and historical linkages
ivan
a dr
ažen
ov
ić ma
rin
a ku
no
vac d
om
inik pr
ipužić
dy
na
mic
s an
d deter
min
an
ts of em
igr
ation th
e ca
se of c
ro
atia an
d the ex
perien
ce
of n
ew eu m
emb
er states
pub
lic secto
r ec
on
om
ics
42 (4) 415-447 (2018)427Figure 8
New MS emigrantsrsquo average age and median age of population 2000-2016 national statistical offices of NMS countries gross emigration flows
20
25
30
35
40
45
50
20
25
30
35
40
45
50
BGEE CZ RO LT LV SK PL HU SI HR
Average migrant age Median population age
Sources CBS national statistical offices and Eurostat authorsrsquo calculations
Table 1 Main EU emigration destinations for NMS in 2016 (in of total EU emigration) national statistical offices of NMS countries gross emigration flows
origin country top 3 emigration destinations in eu as of total eu emigrationBulgaria na na naCroatia Germany 71 Austria 8 Ireland 7Czech Republic Slovakia 60 Germany 9 Poland 6Estonia Finland 63 United Kingdom 8 Germany 7Hungary Germany 32 Austria 27 United Kingdom 17Latvia na na naLithuania United Kingdom 60 Ireland 11 Germany 10Poland Germany 43 United Kingdom 28 Netherlands 8Romaniaa Spain 24 Germany 17 Italy 16Slovakia Czech Republic 38 Austria 27 Germany 10Slovenia Germany 27 Austria 27 Croatia 12
a Percentage of total emigrationSources CBS national statistical offices and Eurostat
Given that similar core EU countries dominate as the main emigration destinations to Europe for NMS this corroborates our decision to construct indirect emigration flows for NMS by resorting to the national statistical offices of core EU countries as we did for Croatia Thus in the remaining part of this section we use data about indirect emigration flows from NMS to the core EU countries and employ them to compare the dynamics and intensity of migration outflows among the NMS
Comparison of the indirect emigration flows from other NMS to core EU coun-tries shows that the intensity of emigration flows from Croatia following the accession is not unique in its size given the experience of other economically less
ivan
a dr
ažen
ov
ić ma
rin
a ku
no
vac d
om
inik pr
ipužić
dy
na
mic
s an
d deter
min
an
ts of em
igr
ation th
e ca
se of c
ro
atia an
d the ex
perien
ce
of n
ew eu m
emb
er states
pub
lic secto
r ec
on
om
ics
42 (4) 415-447 (2018)
428 developed member states (Bulgaria and Romania) but also that emigration flows from NMS following the EU accession in 2004 were significantly lower (figure 9) Another important pattern arises from the analysis of NMS emigration flows since it is visible that a rise in the average migration rate towards the core EU countries following EU accession is not a temporary one-off reaction to accession to the common EU market According to figure 10 the average emigration rate in 2016 is equal to or higher than the average emigration rate in four years following the EU accession pointing to the persistence of intensive emigration flows15
Figure 9 Indirect emigration flows from NMS to the core EU countries national statistical offices of core EU countries gross emigration flows
0002040608101214161820
2000
2001
2002
2003
2004
2005
2006
2007
2008
2009
2010
2011
2012
2013
2014
2015
2016
In
of t
otal
pop
ulat
ion
Czech R Hungary PolandSlovakia Slovenia Baltics
0002040608101214161820
2000
2001
2002
2003
2004
2005
2006
2007
2008
2009
2010
2011
2012
2013
2014
2015
2016
In
of t
otal
pop
ulat
ion
Bulgaria Croatia Romania
Note Dashed lines denote the years of EU accessionSource National statistical offices of the core EU countries
Figure 10 Indirect emigration flows of NMS in time national statistical offices of core EU countries gross emigration flows
00
02
04
06
08
10
12
14
16
18
20
SI CZ HU LV EE SK LT BG PL RO
In
of t
otal
pop
ulat
ion
Avg migration rate in 4 years following EU accession Avg migration rate in 2016
Source National statistical offices of the core EU countries
15 However all member states but Croatia gained access to the common EU market prior to the onset of the global crisis Only Croatia joined the EU after six consecutive years of economic distress This might have created an additional pressure on migration outflows from Croatia However proper evaluation of this phe-nomenon will be possible only with some time delay
ivan
a dr
ažen
ov
ić ma
rin
a ku
no
vac d
om
inik pr
ipužić
dy
na
mic
s an
d deter
min
an
ts of em
igr
ation th
e ca
se of c
ro
atia an
d the ex
perien
ce
of n
ew eu m
emb
er states
pub
lic secto
r ec
on
om
ics
42 (4) 415-447 (2018)429A careful consideration must also be given to the influence of the economic cycle
on emigration Persistence of increased emigration flows from NMS to core EU countries in the decade following EU accession could reflect the impact of the economic crisis that started in 2009 on emigration decisions Figure 11 in both panel (a) and (b) shows that economic conditions are indeed related to intensity of emigration
Figure 11Average emigration flow as in total population from 2011 to 2016 compared to average unemployment rate (a) and average GDP PC in PPS (b) national statis-tical offices of core EU countries gross emigration flows
BG
HR
CZ
EEHU
LV
LT
PL
RO
SK
SI
10000
12000
14000
16000
18000
20000
22000
24000
00 05 10 15
GD
P PC
in P
PS (2
008-
2016
)
Emigration flow as in total population
BG
HR
CZ EE
HU
LVLT
PL ROSKSI
50
55
60
65
70
75
00 02 04 06 08 10 12 14 16 18
Emigration flow as in total population (2013-2016)
Empl
oym
ent r
ate
in
(201
3-20
16)
y = -68574x + 69749Rsup2 = 04745
y = -63306x + 23269Rsup2 = 07714
Source Eurostat and national statistical offices of the core EU countries
The NMS had rather different crisis and post-crisis experiences Poland experi-enced no recession but faced sizable emigration flows some countries recovered rather quickly after the initial shock (the Baltics Slovakia) while others experi-enced a double-dip recession (Slovenia) or a very deep and prolonged recession (Croatia) In addition the economic slack was global in nature ie the worsening of economic conditions was not restricted only to NMS but was also present in most of the core EU countries thus altering to some extent the relative benefits between origin and destination countries As a result a simple comparison of var-ious economic performance indicators and the intensity of emigration flows can provide only a partial and limited insight into the relative importance of different economic and non-economic determinants of migration flows In the next section we thus resort to formal econometric analysis using a gravity model to examine the main determinants of emigration in Croatia and other new EU member states to the core EU countries in the 2000-2016 period
4 graVIty model of mIgratIonThe application of Newtonian physics in economics started with Tinbergen (1962) who used a gravity model to explain international trade flows Flowerdew and Salt (1979) introduced the gravity model in the context of migration analysis and it soon become widely used to analyze different migration determinants However some authors claim that the first application of a gravity model to explain migration patterns goes back to Ravenstein who used it to analyze migra-tion patterns in 19th century Britain (Anderson 2011)
ivan
a dr
ažen
ov
ić ma
rin
a ku
no
vac d
om
inik pr
ipužić
dy
na
mic
s an
d deter
min
an
ts of em
igr
ation th
e ca
se of c
ro
atia an
d the ex
perien
ce
of n
ew eu m
emb
er states
pub
lic secto
r ec
on
om
ics
42 (4) 415-447 (2018)
430 Notwithstanding their long history gravity models have experienced a revival since the early 2000s due to much improved bilateral migration data (Ramos 2016) and the emergence of statistical theories appropriate for studying spatial interaction The reasons for the popularity of gravity models in migration analysis are trifold intuitive consistency with migration theories ease of estimation in its simplest form goodness of fit in most applications (Poot et al 2016) Gravity models assume migration flows (M) between the origin country i and destination country j in time t are proportional to the product of their populations (P) (which are in migration contexts used as proxies for the concept of mass from standard gravity model) and inversely proportional to the distance (D) between them
(1)
Gravity models in their original form are purely non-theoretical so they are usu-ally enriched with different variables capturing traditional pull and push factors of migration following human capital theory approach to migration developed by Sjaastad (1962) and Harris and Todaro (1970) The authors consider migration decision as a complex form of investment in human capital that is influenced by future expected income levels and the relative probability of employment oppor-tunities in destination and origin countries16 More formal arguments for the use of an extended vector of explanatory variables in migration analysis can be derived from the Random utility model introduced in migration literature by Borjas (1987) and Grogger and Hanson (2011) that provided micro foundations in the context of migration analysis Reflecting these considerations the gravity model used in this paper is augmented by an additional set of explanatory variables covering differ-ent economic demographic and educational factors as well as the level of corrup-tion in the country
The dependent variable is the gross flow of emigrants from NMS to the core EU country in each year for 2000-2016 period In order to trace emigration flows accurately we rely on immigration statistics of the selected receiving countries as available from national statistical offices of the core EU countries as explained in section 2
Explanatory variables used in the analysis are related to traditional pull and push factors of migration presented in literature The basic specification of our model contains GDP per capita in purchasing power parity of origin and destination country relative size of populations between countries based on Eurostat data and geographical distance between capitals of destination and origin countries down-loaded from CEPIIrsquos geo-distance database Moreover our basic specification also contains the variable capturing the effect of EU accession The variable is based on transitional provisions on the free movement of workers from new EU
16 Income levels are usually approximated by GDP per capita in PPP terms given that wage data are not com-parable across countries
ivan
a dr
ažen
ov
ić ma
rin
a ku
no
vac d
om
inik pr
ipužić
dy
na
mic
s an
d deter
min
an
ts of em
igr
ation th
e ca
se of c
ro
atia an
d the ex
perien
ce
of n
ew eu m
emb
er states
pub
lic secto
r ec
on
om
ics
42 (4) 415-447 (2018)431member states following the EU enlargement in 2004 2007 and 2013 as reported
by the European Commission Following the EU enlargement several core EU states decided to apply transitional provisions on the free movement of workers from NMS and effectively postpone the full liberalization of their labour markets Thus for each pair of origin and destination countries in the sample the dummy variable associated to transitional provisions takes the value 1 in the year that the core EU country lifted its restrictions on the free movement of workers coming from the respective NMS
In the extended version of our model we include additional variables accounting for some additional characteristics of origin and destination countries Following Lamberty (2015) we use data from the World Governance Index (WGI) database and include a corruption index for origin and destination country as explanatory variables in our analysis to evaluate if differences in corruption between coun-tries are a relevant factor in explaining observed emigration patterns From among the different WGI indexes evaluating the quality of governance and institutions from different aspects we have opted for the inclusion of the corruption index in our main specification following Poprawe (2015) who shows that corruption increases emigration since it retards the economic development of the country and creates an insecure living and economic environment1718 We also evaluate the impact of origin country population attributes on migration outflows Following Sprenger (2013) we include the share of persons educated to tertiary level in total population of origin country to test whether higher emigration flows are associ-ated with higher skill levels The impact of demographic characteristics of origin population on emigration flows is measured through the share of young people (persons aged 20-34) in total population of origin country as an approximation of the potential emigration pool
Finally we include alternative variables for economic performance of the country We find this relevant since Bertoli Bruumlcker and Moraga (2013) and Beine et al (2017) argue that relative difference in GDP per capita in purchasing power stand-ard represents a difference in level of economic development between two coun-tries which is relevant for emigration decisions but that current and future eco-nomic prospects not captured by relative GDP per capita in PPS are also impor-tant Bertoli Bruumlcker and Moraga (2013) and Beine et al (2017) argue that dif-ferences in GDP per capita in PPS are already captured by the inclusion of origin and destination fixed effects Additionally economic distress arising during the crisis period causes changes in future economic prospects that not reflected in a timely way in the level of GDP per capita in PPS Therefore in the extended specification of our model we substitute for GDP per capita in PPS with short-
17 Vukovic (2017) shows that the Croatian economy is permeated by corruption since the political system is characterized by systematic corruption on national and local levels Also WGI corruption index data point to a substantial gap in corruption incidence between most NMS and core EU countries in general18 As a main alternative to the corruption index we could have used the governance index from the same data-base Estimation results obtained with the governance index as independent variable are shown in appendix 3
ivan
a dr
ažen
ov
ić ma
rin
a ku
no
vac d
om
inik pr
ipužić
dy
na
mic
s an
d deter
min
an
ts of em
igr
ation th
e ca
se of c
ro
atia an
d the ex
perien
ce
of n
ew eu m
emb
er states
pub
lic secto
r ec
on
om
ics
42 (4) 415-447 (2018)
432 term indicators of economic activity ndash employment rate and output gap of origin and destination country19 These variables capture how changing growth prospects and labour market opportunities affect emigration across countries
Detailed descriptions of all variables and respective data sources are provided in appendix 1
In order to evaluate the main determinants of migration flows from NMS into the core EU countries we apply the Poisson pseudo maximum likelihood estimator Numerous literature contributions examine the main drivers of migration by using a fixed effects model as a baseline methodology20 However a fixed effect model does not allow for the estimation of variables that are constant in time (such as the distance between two countries) Moreover Santos-Silva and Tenreyro (2006) in their paper show that parameters in log-linearized models estimated by OLS in the presence of heteroscedasticity could lead to biased estimates The authors alterna-tively propose application of the Poisson pseudo maximum likelihood (PPML) estimator and argue that the PPML estimator is more suitable given its consist-ency in presence of heteroscedasticity Moreover the PPML estimator will allow us to properly account for zero migration flows between two countries since the dependent variable in PPML is not in logarithmic form but is assumed to take positive integer values Given this advantages of the PPML estimator over the standard panel fixed effects estimator we transform our basic gravity model from equation (1) and extend it by additional explanatory variables
(2)
where mijt represents migration from origin country i into destination country j in a year t xit is a vector of explanatory variables characteristic for origin country economic political geographical and demographic factors yjt is vector of explan-atory variables representing destination country characteristics in time and δi and ϑj are respectively origin and destination country specific effects
5 results ndash maIn determInants of emIgratIon The main results of the estimation of equation (2) using the PPML estimator are presented in table 2 As a robustness check estimates obtained by the application of the fixed effect model are also presented in table 2 but are not discussed explic-itly According to the results of the baseline model (Model 1) population and dis-tance parameters are in line with gravity model predictions An increase in distance between destination and origin country by 1 will decrease emigration flows by 15 all other factors being equal confirming the theoretical predictions of the
19 We opt for the exclusion of GDP per capita in PPS from the extended model specification since inclusion of GDP PC in PPS and short term economic indicators could result in multicollinearity Instead differences in level of economic development are captured by origin and destination fixed effects20 A detailed overview of different estimation strategies and models used in assessment of impact of EU acces-sion for CEE countries in 2004 is given in Bruumlcker et al (2009)
ivan
a dr
ažen
ov
ić ma
rin
a ku
no
vac d
om
inik pr
ipužić
dy
na
mic
s an
d deter
min
an
ts of em
igr
ation th
e ca
se of c
ro
atia an
d the ex
perien
ce
of n
ew eu m
emb
er states
pub
lic secto
r ec
on
om
ics
42 (4) 415-447 (2018)433standard gravity model implying that migration flows between two countries are
inversely proportional to the distance between them This interesting result sug-gests that importance of transportation and information costs that are approximated with physical distance between countries still remains relevant in migration deci-sions irrespective of the decrease in transportation costs and the development of the internet since the rather different world around the time of the pioneer application of gravity models in migration analysis in the late 1970s The positive coefficient associated with the relative difference between population of destination and origin country suggests that countries with bigger populations have more intensive migra-tion flows However this result is not statistically significant Secondly our base-line model shows GDP per capita in PPS in destination country increases migration flows directed toward the country confirming the theories arguing that a positive difference in the level of economic conditions will increase emigration flows from origin to destination country Estimated parameters show that an increase in GDP per capita in PPS in a destination country of 1 will lead to an increase in emigra-tion flows from origin to destination country by 22 assuming all other factors remain unchanged On other hand the coefficients associated to GDP PC in PPS in origin country are not statistically significant
Finally the variable transitional provisions measuring the impact of the accession to the principle of free movement of persons across borders going from new EU member states (origin countries) to the core EU (destination countries) is statisti-cally significant and large in its value increasing migration flow by 4021
The results of the extended model specification (Model 2) show that short-term economic indicators represented by different labour market indicators and cycli-cal position of the economy of origin and destination countries are statistically significant and thus affect emigration decisions An increase in employment opportunities in a destination country by 1 will increase emigration flows from origin to destination countries by 82 all other factors being equal At the same time an increase in employment opportunities in origin country by 1 will decrease emigration flows by 5 Results indicate that cyclical position of the economy is also important for migration decisions An improvement in cyclical position of a destination country by 1 percentage point (ie positive output gap) will increase emigration flows from origin to destination countries by 2 if all other factors remain constant
21 Changes in the predicted emigration flow for dummy variable representing transitional provisions are calu-lated according to the formula -1
ivan
a dr
ažen
ov
ić ma
rin
a ku
no
vac d
om
inik pr
ipužić
dy
na
mic
s an
d deter
min
an
ts of em
igr
ation th
e ca
se of c
ro
atia an
d the ex
perien
ce
of n
ew eu m
emb
er states
pub
lic secto
r ec
on
om
ics
42 (4) 415-447 (2018)
434 Table 2 Determinants of emigration flows from new EU member states to the core EU countries between 2000 and 2016 Fixed effects estimator (FE) and Poisson pseudo maximum likelihood estimator (PPML)
model 1 (baseline) fe
model 1 (baseline) PPml
model 2 fe
model 2 PPml
Distance ndashndash
-148(000)
ndashndash
-154(000)
Population 059(017)
141(035)
099(002)
585(000)
GDP PC in PPS (origin)
011(059)
027(046)
GDP PC in PPS (destination)
155(000)
215(001)
Transitional provisions
054(000)
034(000)
046(000)
046(000)
Employment rate (origin)
-145(000)
-504(000)
Employment rate (destination)
12(006)
815(000)
Output gap (origin)
-227(000)
307(02)
Output gap (destination)
374(000)
203(004)
Corruption index (origin)
003(089)
-166(000)
Corruption index (destination)
378(000)
246(009)
Share of youth (20-34) origin
15(000)
019(08)
Share of tertiary educated (origin)
025(014)
058(007)
Cons -1191 023 -1365 551Number of observations 1958 1972 1958 1972
R2 046 078 053 082Note and refer to 10 5 and 1 statistical significance levels respectively P-values are in parenthesis All specifications include origin and destination fixed effects dum-mies Parameters associated to output gap for origin and destination country are multiplied by 100 since the output gap enters the model specification in levels instead of being transformed into logarithms due to negative valuesSource Authorsrsquo elaboration based on national statistical offices of the core EU countries immi-gration data and on the data presented appendix 1
Moreover we find an importance in the level of education of the workforce in the origin country since the coefficient associated to the variable denoting the share of those with tertiary education in the total population of origin country assumes a positive significant value The estimates imply that an increase in the share of the tertiary educated in an origin population will increase migration flows from
ivan
a dr
ažen
ov
ić ma
rin
a ku
no
vac d
om
inik pr
ipužić
dy
na
mic
s an
d deter
min
an
ts of em
igr
ation th
e ca
se of c
ro
atia an
d the ex
perien
ce
of n
ew eu m
emb
er states
pub
lic secto
r ec
on
om
ics
42 (4) 415-447 (2018)435the origin country by 06 The share of young population in an origin country is
also found to be positively correlated with the intensity of migration from the origin country but the results are not statistically significant Finally the differ-ence in corruption between destination and origin countries is also significant for emigration decisions An increase in the corruption index in the origin country by 1 (an increase in WGI corruption index represents a decrease of level of corrup-tion in the economy given the construction of corruption index) will lead to lower emigration from origin country by 17 At the same time an increase in the cor-ruption index of destination country by 1 (implying a lower corruption level in destination country) will increase emigration flows from origin to destination country on average by 25 all other factors being equal
As a final step in our analysis we compare results of the extended model specifi-cation with the baseline model specification and confirm the relevance of gravity model predictions for migration flows The importance of EU accession meas-ured through the transitional provisions dummy variable again proved statistically significant and large in its value suggesting that EU accession could raise emigra-tion flows by 60 if all other factors remain unchanged Overall baseline and extended model specification results show that the possibility of free movement of people across borders gained with EU accession is the main trigger of intensifica-tion of emigration flows from NMS to the core EU countries However the new higher level of emigration flows from NMS towards the core EU countries follow-ing EU accession differs among countries ranging from 02 of the population as in the Czech Republic to almost 2 of population in Romania According to the estimates of the gravity model apart from the EU accession significant determi-nants in explaining the magnitude of migration outflows are represented by the characteristics of origin country population itself economic development and per-formance of short term economic indicators and level of institutional quality assessed through the corruption incidence of both origin (NMS) and destination countries (the core EU)
51 robustness checKsIn addition to static estimation models as a robustness check we also estimate a dynamic model We apply the Arellano and Bond (1991) and Blundell and Bond (1998) generalized method of moments estimator which is suitable for datasets characterized by short-time periods and large cross sectional dimension with endogenous independent variable and in presence of fixed effects and heterosce-dasticity and autocorrelation within observations Inclusion of a lagged dependent variable is also relevant for assessment of network effect on emigration decisions since lagged migration flow can be interpreted as network approximation Con-trolling for network effect is important since networks offer support and an addi-tional information set for migrants reducing migration costs and associated risks (Beine Docquier and Ozden 2009) In line with previous model specifications the dynamic model also contains origin dummies and destination dummies to take into account all unobservable time invariant origin and destination specific varia-
ivan
a dr
ažen
ov
ić ma
rin
a ku
no
vac d
om
inik pr
ipužić
dy
na
mic
s an
d deter
min
an
ts of em
igr
ation th
e ca
se of c
ro
atia an
d the ex
perien
ce
of n
ew eu m
emb
er states
pub
lic secto
r ec
on
om
ics
42 (4) 415-447 (2018)
436 bles that were not captured by the set of variables included in the model but are relevant for migration decisions and the intensity of migration flows The results of the dynamic model corroborate the main findings from the previous section The estimates confirm the importance of gravity model variables in the determina-tion of emigration flows Moreover EU accession assessed through the transi-tional provisions variable again resulted as sizable and significant increasing average emigration flows by 30 Finally we confirm the importance of short-term economic conditions ndash employment opportunities in origin country and changes in cyclical economic position in destination country as determinants of migration flows Contrary to the static model specification the impacts of the educational level of population in the origin country and the degree of corruption in the economy have the expected signs but are not statistically significant The results of dynamic model specification are presented in appendix 3
6 conclusIonThis paper aimed to clarify some basic facts about the dynamics and main deter-minants of emigration from Croatia following EU accession To that purpose extensive data analysis was conducted capturing and comparing different emigra-tion data sources Further the application of panel gravity model to Croatian and other NMS indirect emigration data enabled us to detect and discuss the main determinants of emigration from Croatia and other NMS to the core EU countries and their importance in making decisions about emigration
As a first contribution to the discussion of the issue of the current emigration wave in Croatia we use mirror statistics from core EU national statistical offices and compare them to the official emigration numbers of CBS Construction of an alter-native emigration dataset using immigration data from the national statistical offices of the core EU countries showed that emigration flows from Croatia following EU accession are on average 26 times as high as those recorded in official statistical data amounting to 230 thousand people leaving Croatia in the 2013-2016 period If we relate our results to a priori projections of emigration from Croatia after EU accession our estimates can be placed in between Vidovic and Mara (2015) and Strielkowski Šaacuterkovaacute and Żornaczuk (2013)22 Similar proportional population out-flows were observed in less developed new member states following their EU acces-sion (Romania and Bulgaria) while new member states from the initial wave of enlargement experienced less pronounced rises in their emigration flows
Analysis of detailed migration data available at national statistical offices of the new EU member states statistical offices showed that average characteristics of emigrants from NMS are similar across countries and point to a balanced emigra-tion with respect to the sex of the emigrants The main destination country for most countries in the sample was Germany Finally data also show that the aver-age emigrant from NMS in 2016 was between 31 and 37 years old indicating that emigration affects the young part of the population Emigration of mostly young
22 Direct comparison is not possible since the aforementioned authors estimate net migration potential while our analysis is based on gross emigration flows
ivan
a dr
ažen
ov
ić ma
rin
a ku
no
vac d
om
inik pr
ipužić
dy
na
mic
s an
d deter
min
an
ts of em
igr
ation th
e ca
se of c
ro
atia an
d the ex
perien
ce
of n
ew eu m
emb
er states
pub
lic secto
r ec
on
om
ics
42 (4) 415-447 (2018)437citizens is indisputably a human capital loss for origin countries However long-
term overall effects of emigration flows on origin countries should be interpreted with caution Emigration leads to improvement of knowledge and skills of emi-grants given that their skills increase due to exposure to international competi-tion instead of gradually deteriorating in the low capacity domestic labour mar-ket In the case of reverse migration this can result in a brain-gain for origin economies Moreover the effect of migration on the labour markets of origin countries is also twofold According to the extensive migration literature (Thaut 2009) the employment opportunities and wages of those who stay in origin coun-tries increase and the unemployment rate decreases causing the activation of long-term unemployed people On other hand labour market shortages in some sectors inevitably arise and sustainability of public pensions and other social ser-vice are threatened The overall effects will depend on synchronization of educa-tional policies with origin country labour market requirements overall degree of economic development and future economic performance in origin country
In fact the analysis of main determinants of migration showed the most significant factor in explaining emigration flows between NMS and the core EU countries is the accession to the principle of free movement of workers obtained by EU acces-sion which increased emigration flows in the range from 30 to 60 This is in line with other relevant studies about labour mobility within the EU where EU membership is found to increase labour mobility significantly23 However estima-tion of the gravity model revealed that there exist other significant determinants in explaining migration outflows such as the characteristics of origin country popu-lations itself economic development performance of short-term economic indica-tors and level of institutional quality assessed through the corruption incidence of both origin (NMS) and destination countries (the core EU) These findings imply that policies that promote broad and solid economic development can influence emigration flows which raises several implications for policymakers
Emigration phenomena will probably have a strong impact on the Croatian econ-omy in the medium-run Accordingly we would like to emphasise the importance of further research in this field Potential research topics encompass the assess-ment of the impact of the last emigration wave on the potential growth prospects of the Croatian economy the effect of increasing remittances on the Croatian economy sustainability of the current setup of social policies (pension funds health system new infrastructure investment existing infrastructure mainte-nance) required immigration flows in order to alleviate negative emigration con-sequences and finally the implications of emigration flows for the conduct of monetary fiscal and structural policy in the broadest sense
disclosure statementNo conflict of interest
23 For more details about relationship between EU membership and labour mobility see Arpaia et al (2016)
ivan
a dr
ažen
ov
ić ma
rin
a ku
no
vac d
om
inik pr
ipužić
dy
na
mic
s an
d deter
min
an
ts of em
igr
ation th
e ca
se of c
ro
atia an
d the ex
perien
ce
of n
ew eu m
emb
er states
pub
lic secto
r ec
on
om
ics
42 (4) 415-447 (2018)
438 aPPendIX 1
Table a1 Data sources and details independent variables
data sources and details for set of independent variables
Variable description source estimation details
GDP PC in PPS
Gross domestic product at market prices current prices PPS per capita
Eurostat online statistical database
Destination and origin country in log
Unemployment rate
Yearly unemployment rates from 15 to 64 years percentage
Eurostat online statistical database
Destination and origin country in log
Population Population on 1 January total
Eurostat online statistical database
Relative values between destination and origin country in log
Distance
ldquoDistance between two countries is calculated based on latitudes and longitudes of the most important citiesagglomerations (in terms of population) Mayer and Zignago (2011)rdquo
CEPII database In log
Youth population number
Population on 1 January from 20 to 34 years
Eurostat online statistical database
Origin country as a share in total population in log
Tertiary educated
Population by educational attainment level from 15 to 64 years tertiary education (levels 5-8)
Eurostat online statistical database
Origin country as a share in total population 1000 in log
Corruption index
Control of corruption captures perceptions of the extent to which public power is exercised for private gain including both petty and grand forms of corruption as well as ldquocapturerdquo of the state by elites and private interests (httpinfoworldbankorggovernanceWGIdoc)
Worldwide Governance Indicators (WGI) The World Bank
Destination and origin country in log
ivan
a dr
ažen
ov
ić ma
rin
a ku
no
vac d
om
inik pr
ipužić
dy
na
mic
s an
d deter
min
an
ts of em
igr
ation th
e ca
se of c
ro
atia an
d the ex
perien
ce
of n
ew eu m
emb
er states
pub
lic secto
r ec
on
om
ics
42 (4) 415-447 (2018)439data sources and details for set of independent variables
Variable description source estimation details
Governance index
ldquoGovernment effectiveness captures perceptions of the quality of public services the quality of the civil service and the degree of its independence from political pressures the quality of policy formulation and implementation and the credibility of the governments commitment to such policies (httpinfoworldbankorggovernanceWGIdoc)rdquo
Worldwide Governance Indicators (WGI) The World Bank
Destination and origin country in log
Output gap Output gaps ( of potential output) HP filter
European Commission CIRCAB II autum fore-cast
Destination and origin country
Employment rates
Yearly employment rates from 15 to 64 years percentage
Eurostat online statistical database
Destination and origin country in log
Transitional provisions
Variable representing the access to common free EU market for BG and RO takes value 1 for FI SE from 2007 for DK from 2009 for IT and IE from 2012 and for all other countries from 2014 Variable representing the access to common free EU market for HR takes value 1 for DK FI IR SE from 2013 for BE IT DE LU from 2015 while NL AT and UK apply transitional provisions for HR during the entire sample period (sample is ending in 2016 while transitional provisions applied by NL AT and UK should be lifted by June 2018) Variable representing the access to common free EU market for CZ SK SI PL HU LV LT EE takes value 1 for UK SE IE from 2004 for IT FI from 2006 for NL LU from 2007 for BE DK from 2009 and for AT DE from 2011
European Commission
Set of dummy variables
ivan
a dr
ažen
ov
ić ma
rin
a ku
no
vac d
om
inik pr
ipužić
dy
na
mic
s an
d deter
min
an
ts of em
igr
ation th
e ca
se of c
ro
atia an
d the ex
perien
ce
of n
ew eu m
emb
er states
pub
lic secto
r ec
on
om
ics
42 (4) 415-447 (2018)
440 Table a2 Data sources and details dependent variable
data sources and details for set of independent variablesVariable description source estimation details
Emigration flows
Data for IR NL FI SE IT AT LU DK avaliable on line Data for DE BE UK obtained on email request Data for UK and IE refers to immigration numbers and not to official migration statistics
National statistical offices websites of core EU countries
For static models ndash emigration from origin country i into destination country j in time t for dynamic model ndash share of emigrants in total population of origin country in log
Data for Germany and Denmark are based on country of previous residence principle Data for Netherlands Italy United Kingdom and Belgium on country of birth principle while data for Sweden Finland Luxemburg and Austria are based on citizenship principleCore EU countries are represented by 11 countries due to data availability Austria Belgium Denmark Finland Germany Ireland Italy Luxemburg Netherlands Sweden and United Kingdom Usually Portugal Greece Spain and France are also included in core EU countries Required immigration data are not publicaly available on their website Statistical office of Portugal delivered the data from our customized request Since data are starting in 2008 we do not include them in main specifications Upon conclusion of this paper we have not managed to receive required data from customized requests sent to other statistical offices
ivan
a dr
ažen
ov
ić ma
rin
a ku
no
vac d
om
inik pr
ipužić
dy
na
mic
s an
d deter
min
an
ts of em
igr
ation th
e ca
se of c
ro
atia an
d the ex
perien
ce
of n
ew eu m
emb
er states
pub
lic secto
r ec
on
om
ics
42 (4) 415-447 (2018)441aPPendIX 2
Table a3 Total migration flow in Croatia ndash approximation based on discretional combination of different data sources
emigration from and to croatia following the eu accession 2013 2014 2015 2016 2013-2016(1) Emigration to core EU countries from national statistical offices of core EU countries
31655 53666 72528 71314 229163
(2) Emigration to ldquorest of the worldrdquo according to CBS 11220 9049 11116 9238 40623
(3) Total emigration = (1) + (2) 42875 62715 83644 80552 269786(4) CNB total emigration 15262 20858 29651 36436 102207(5) Emigration coefficient 28 30 28 22 26(6) Immigration from core EU countries according to national statistical offices of core EU countries
14164 19346 23261 23422 80193
(7) Immigration from ldquorest of the worldrdquo according to CBS 8676 8540 8512 9705 35433
(8) Total immigration = (6) + (7) 22840 27886 31773 33127 115626(9) CBS total immigration 10378 10638 11706 13985 46707(10) Immigration coefficient 22 26 27 24 25(11) Net emigration = (3) ndash (8) 20035 34829 51871 47425 154160(12) CNB net emigration 4884 10220 17945 22451 55500(13) Net emigration coefficient 41 34 29 21 28
Note UK and Ireland not included in immigration numbersSource CBS and national statistical offices of the core EU countries
ivan
a dr
ažen
ov
ić ma
rin
a ku
no
vac d
om
inik pr
ipužić
dy
na
mic
s an
d deter
min
an
ts of em
igr
ation th
e ca
se of c
ro
atia an
d the ex
perien
ce
of n
ew eu m
emb
er states
pub
lic secto
r ec
on
om
ics
42 (4) 415-447 (2018)
442 aPPendIX 3
Table a4 Determinants of emigration flows from new EU member states to the core EU coun-tries between 2000 and 2016 dynamic estimation Arellano-Bond GMM estimator
model 3 dynamic model (gmm)
Distance -049(000)
Population 029(059)
Transitional provisions 025(000)
Employment rate (origin) -201(000)
Employment rate (destination) 053(047)
Output gap (origin) 372(036)
Output gap (destination) 218(000)
Corruption index (origin) -037(040)
Corruption index (destination) 057(055)
Share of youth (20-34) origin -032 (059)
Share of tertiary educated (origin) 035 (012)
ln(m t-1) 066(000)
Cons 74 Note and refer to 10 5 and 1 statistical significance levels respectively P-values are in parenthesis All specifications include origin and destination fixed effects dum-mies Parameters associated to output gap for origin and destination country are multiplied by 100 since the output gap enters the model specification in levels instead of being transformed into logarithms due to negative valuesSource Authorsrsquo elaboration based on national statistical offices of the core EU countries immi-gration data and on the data presented in appendix 1
ivan
a dr
ažen
ov
ić ma
rin
a ku
no
vac d
om
inik pr
ipužić
dy
na
mic
s an
d deter
min
an
ts of em
igr
ation th
e ca
se of c
ro
atia an
d the ex
perien
ce
of n
ew eu m
emb
er states
pub
lic secto
r ec
on
om
ics
42 (4) 415-447 (2018)443Table a5
Determinants of emigration flows from new EU member states to the core EU countries between 2000 and 2016 Poisson pseudo maximum likelihood estimator extended specification Model 4
model 4 fe model 4 PPml
Distance ndashndash
-152(000)
Population 169(000)
663(000)
Transitional provisions 047(000)
042(000)
Unemployment rate (origin) 019(003)
069(000)
Unemployment rate (destination) -003(066)
-109(000)
Output gap (origin) 218(001)
153(034)
Output gap (destination) 464(000)
252(009)
Governance index (origin) -022(052)
-229(000)
Governance index (destination) 089(011)
-271(040)
Share of youth (20-34) origin 171(000)
134(011)
Share of tertiary educated (origin) 041(002)
069(001)
Cons -104 422Number of observations 1958 1972R2 051 082
Note and refer to 10 5 and 1 statistical significance levels respectively P-values are in parenthesis All specifications include origin and destination fixed effects dum-mies Parameters associated to output gap for origin and destination country are multiplied by 100 since the output gap enters the model specification in levels instead of being transformed into logarithms due to negative valuesSource Authorsrsquo elaboration based on national statistical offices of the core EU countries immi-gration data and on the data presented in appendix 1
ivan
a dr
ažen
ov
ić ma
rin
a ku
no
vac d
om
inik pr
ipužić
dy
na
mic
s an
d deter
min
an
ts of em
igr
ation th
e ca
se of c
ro
atia an
d the ex
perien
ce
of n
ew eu m
emb
er states
pub
lic secto
r ec
on
om
ics
42 (4) 415-447 (2018)
444
aPP
en
dIX
4
Ta
bl
e a
6 Nu
mbe
r of e
mig
rant
s fro
m C
roat
ia b
y re
gion
(as
of t
otal
pop
ulat
ion
of th
e re
gion
) bet
ween
200
1 an
d 20
16 C
entra
l Bur
eau
of S
tatis
tics d
ata
gro
ss
emig
ratio
n flo
ws
20
0120
0220
0320
0420
0520
0620
0720
0820
0920
1020
1120
1220
1320
1420
1520
16Ea
ster
n C
roat
ia0
20
20
20
30
20
30
30
20
40
30
30
30
40
61
01
4C
entra
l Cro
atia
02
02
02
02
02
02
03
03
03
03
04
03
05
06
08
10
Lika
and
Gor
ski k
otar
02
02
02
01
01
02
02
02
02
02
03
03
04
06
09
10
Cen
tral a
nd S
outh
ern
Adr
iatic
01
02
01
01
01
01
02
02
02
03
04
04
05
05
06
07
Nor
then
Adr
iatic
02
02
01
01
01
01
01
01
01
02
05
04
03
04
06
07
Nor
thw
este
rn C
roat
ia0
10
10
10
10
00
10
10
00
00
00
10
10
10
30
40
6C
ity o
f Zag
reb
02
06
02
01
01
01
01
01
01
02
03
03
03
04
06
06
Not
es E
aste
rn C
roat
ia e
ncom
pass
es V
irovi
tičko
-pod
ravs
ka P
ožeš
ko-s
lavo
nska
Bro
dsko
-pos
avsk
a O
sječk
o-ba
ranj
ska
and
Vuko
vars
ko-s
rijem
ska
coun
ties
Cent
ral C
roat
ia
enco
mpa
sses
Zag
reba
čka
Sis
ačko
-mos
lava
čka
Kar
lova
čka
and
Bjel
ovar
sko-
bilo
gors
ka c
ount
ies
Lika
and
Gor
ski k
otar
enc
ompa
ss P
rim
orsk
o-go
rans
ka a
nd L
ičko
-sen
jska
co
untie
s C
entr
al a
nd S
outh
ern
Adri
atic
enc
ompa
ss Z
adar
ska
Šib
ensk
o-kn
insk
a S
plits
ko-d
alm
atin
ska
and
Dub
rova
čko-
nere
tvan
ska
coun
ties
Nor
then
Adr
iatic
refe
rs to
Is
tars
ka C
ount
y N
orth
wes
tern
Cro
atia
enc
ompa
ss K
rapi
nsko
-zag
orsk
a V
araž
dins
ka M
eđim
ursk
a an
d K
opri
vnič
ko-k
riže
vačk
a co
untie
sSo
urce
CBS
ivan
a dr
ažen
ov
ić ma
rin
a ku
no
vac d
om
inik pr
ipužić
dy
na
mic
s an
d deter
min
an
ts of em
igr
ation th
e ca
se of c
ro
atia an
d the ex
perien
ce
of n
ew eu m
emb
er states
pub
lic secto
r ec
on
om
ics
42 (4) 415-447 (2018)445references
1 Anderson J E 2011 The Gravity Model Annual Review of Economics Annual Reviews 3(1) pp 133-160
2 Arellano M and Bond S 1991 Some tests of specification for panel data Monte Carlo evidence and an application to employment equations Review of Economic Studies 58(2) pp 277-297 httpsdoiorg1023072297968
3 Arpaia A [et al] 2016 Labour mobility and labour market adjustment in the EU IZA Journal of Devlopment and Migration 5(21) pp 1-37 httpsdoiorg101186s40176-016-0069-8
4 Beine M Bourgeon P and Bricongne J C 2017 Aggregate Fluctuations and International Migration Scand Journal of Economics Accepted Author Manuscript httpsdoiorg101111sjoe12258
5 Beine M Docquier F and Ozden C 2009 Diasporas Journal of Develop-ment Economics 95(1) pp 30-41 httpsdoiorg101016jjdeveco2009 11004
6 Bertoli S Bruumlcker H and Fernaacutendez-Huertas Moraga J 2013 The Euro-pean Crisis and Migration to Germany Expectations and the Diversion of Migration Flows IZA Discussion Papers No 7170 Available at lthttpftpizaorgdp7170pdfgt
7 Blundell R and Bond S 1998 Initial conditions and moment restrictions in dynamic panel data models Journal of Econometrics 87(1) pp 115-143 httpsdoiorg101016S0304-4076(98)00009-8
8 Borjas G J 1987 Self-Selection and the Earnings of Immigrants The Amer-ican Economic Review 77(4) pp 531-553
9 Božić S and Burić B 2005 Migracijski potencijal Hrvatske ndash mikroanalitički aspekti Migracijske i etničke teme 21(1-2) pp 9-33
10 Bruumlcker H [et al] 2009 Labour mobility within the EU in the context of enlargement and the functioning of the transitional arrangements Nurem-berg European Integration Consortium Final Report Available at lthttpeceuropaeusocialBlobServletdocId=2509amplangId=engt
11 Eurostat 2018 Eurostat International Migration Statistics Available at lthttpseceuropaeueurostatcachemetadataenmigr_immi_esmshtmgt
12 Fertig M and Kahanec M 2013 Mobility in an Enlarging European Union Projections of Potential Flows from EUrsquos Eastern Neighbors and Croatia IZA Discussion Papers No 7634 Available at lthttpftpizaorgdp7634pdfgt
13 Flowerdew R and Salt J 1979 Migration between labour market areas in Great Britain 1970-1971 Journal Regional Studies 13(2) pp 211-231 httpsdoiorg10108009595237900185181
14 Grogger J and Hanson G H 2011 Income Maximization and the selection and sorting of international Migrants Journal of Development Economics 95(1) pp 42-54 httpsdoiorg101016jjdeveco201006003
15 Harris J R and Todaro M P 1970 Migration Unemployment and Devel-opment A Two-Sector Analysis The American Economic Review 60(1) pp 126-142
ivan
a dr
ažen
ov
ić ma
rin
a ku
no
vac d
om
inik pr
ipužić
dy
na
mic
s an
d deter
min
an
ts of em
igr
ation th
e ca
se of c
ro
atia an
d the ex
perien
ce
of n
ew eu m
emb
er states
pub
lic secto
r ec
on
om
ics
42 (4) 415-447 (2018)
446 16 Hazans M and Philips K 2011 The Post-Enlargement Migration Experi-ence in the Baltic Labor Markets IZA DP No 5878 Available at lthttpftpizaorgdp5878pdfgt
17 HZZ 2017 Anketa poslodavaca 2017 Zagreb Hrvatski zavod za zapošlja-vanje Available at lthttpwwwhzzhrUserDocsImagesAnketa_posloda-vaca_2017_HZZpdfgt
18 Izquierdo M Jimeno J F and Lacuesta F 2014 The Impact of the Crisis on Migration Flows in Spain Intereconomics 49(3) pp 144-151
19 Jurić T 2017 Suvremeno iseljavanje Hrvata u Njemačku karakteristike i motivi Migracijske i etničke teme 24(3) pp 337-371
20 Lamberty L 2015 Explaining Baltic Migration After EU Accession Deter-minants and Consequences Available at lthttpswwwehllusemediaehlsneepaperslambertypdfgt
21 Ordinance for the implementation of the General Tax Act OG 3017 Zagreb Official Gazzete
22 Poot J [et al] 2016 The gravity model of migration the successful come-back of an ageing superstar in regional science Investigaciones Regionales ndash Journal of Regional Research 36 pp 63-86
23 Poprawe M 2015 On the relationship between corruption and migration empirical evidence from a gravity model of migration Public Choice 163(3) pp 337-354 httpsdoiorg101007s11127-015-0255-x
24 Ramos R 2016 Gravity models A tool for migration analysis IZA World of Labor 2016 No 239 httpsdoiorg1015185izawol239
25 Santos Silva J M and Tenreyro S 2006 The log of gravity The Review of Economics and Statistics 88(4) pp 641-658 httpsdoiorg101162rest 884641
26 Sjaastad L A 1962 The Costs and Returns of Human Migration Journal of Political Economy 70(5) pp 80-93 httpsdoiorg101086258726
27 Sprenger E 2013 The Determinants of International Migration in the Euro-pean Union An Empirical Analysis IOS Working Papers No 325 Available at lthttpswwweconstoreubitstream10419792401733903029pdfgt
28 Statistics Poland 2011 The concept of the international migration statistic system in Poland Available at lthttpsstatgovplcpsrdexbcrgusp_inter_migration_stat_system_in_polandpdfgt
29 Strielkowski W Šaacuterkovaacute K and Żornaczuk T 2013 EU Enlargement and Migration Scenarios of Croatian Accession Romanian Journal of European Affairs 13(3) pp 53-63 httpsdoiorg102139ssrn2334173
30 Šonje V 2018 Nepovratna emigracija prva procjena Available at lthttparhivanalitikahrblognepovratna-emigracija-prva-procjenagt
31 Thaut L 2009 EU Integration amp Emigration Consequences The Case of Lithuania International Migration 47(1) pp 192-233 httpsdoiorg 101111j1468-2435200800501x
ivan
a dr
ažen
ov
ić ma
rin
a ku
no
vac d
om
inik pr
ipužić
dy
na
mic
s an
d deter
min
an
ts of em
igr
ation th
e ca
se of c
ro
atia an
d the ex
perien
ce
of n
ew eu m
emb
er states
pub
lic secto
r ec
on
om
ics
42 (4) 415-447 (2018)44732 Tinbergen J 1962 Shaping the World Economy Suggestions for an Interna-
tional Economic Policy New York The Twentieth Century Fund33 Vidovic H and Mara I 2015 Free Movement of Workers Transitional
Arrangements and Potential Mobility from Croatia The Vienna Institute for International Economic Studies Research Report No 402 Available at lthttpswiiwacatfree-movement-of-workers-transitional-arrangements-and-potential-mobility-from-croatia-dlp-3630pdfgt
34 Vuković V 2017 The political economy of local government in Croatia winning coalitions corruption and taxes Public Sector Economics 41(4) pp 387-421 httpsdoiorg103326pse4141
35 Župarić-Ilijć D 2016 Iseljavanje iz Republike Hrvatske nakon ulaska u Europsku uniju Zagreb Friedrich Ebert Stiftung Available at lthttpwwwfes-croatiaorgfileadminuser_uploadFES_Iseljavanje_webpdfgt
Determinants of subnational budgetfiscal transparency a review of empirical evidence
BRANKO STANIĆ MA in Economics
Review articleJEL H11 H72httpsdoiorg103326pse4244
The author would like to thank the two anonymous referees for helpful comments on the paper This study was supported by the Croatian Science Foundation (grant number IP-2014-09-3008)
Received March 22 2018 Accepted November 9 2018
Branko STANIĆInstitute of Public Finance Smičiklasova 21 10000 Zagreb Croatiae-mail brankostanicijfhrORCiD 0000-0002-8746-6764
br
an
ko sta
nić
deter
min
an
ts of su
bn
ation
al b
ud
getfisc
al tr
an
spar
enc
y a rev
iew o
f empir
ica
l evid
enc
epu
blic sec
tor
eco
no
mic
s42 (4) 449-486 (2018)
450 abstractThis paper provides a review of empirical research on the factors determining the budgetfiscal transparency of subnational governments It focuses on academic online databases by conducting keyword searches that take in papers published in the period 2000-2017 Three important observations can be made (1) there is a lack of a unique definition of budgetfiscal transparency (2) the different defini-tions lead to disharmonised budgetfiscal transparency measurements (3) there is a heterogeneity of the definition and measurement of some explanatory variables that can lead to apparent contradictions and inconsistencies in the results obtained However the paper provides a balanced account of core explanatory factors emphasizing variables that despite heterogeneity in definition and meas-urement have a significant impact on the levels of subnational government budgetfiscal transparency Since the review involves mainly online disclosure future studies might want to extend the observation period or implement systematic reviews and meta-analyses to gain additional insights on this topic
Keywords subnational governments budget transparency empirical review main determinants
1 IntroductIonIt can be said that in the past two decades and especially in the aftermath of the financial crisis enormous pressure has been put on governments to improve their communication with citizens by being more open transparent and accountable In this sense more and more attention is being paid to fiscal and budgetary issues Some of the most prominent initiatives that advocate for these issues are the Inter-national Budget Partnership (IBP) the Global Initiative for Fiscal Transparency (GIFT) and the Open Government Partnership (OGP) Due to the OGPrsquos strong advocacy a total of 75 countries have endorsed the Open Government Declaration and announced their country action plans More recently OGP was opened to subnational governments In 2016 a total of 15 subnational governments signed the declaration and submitted their action plans to be implemented throughout 2017 as part of a pilot program
Thus the discourse of budget transparency seems to be changing giving ever more importance to subnational governments (SNGs) Accordingly subnational budgets are becoming a ubiquitous topic in the field of public financial management Their importance also stems from the fact that public goods and services are particularly tangible at the subnational and especially the local level Therefore citizens may have more interest in participating in local budget processes where they can see their direct impact on local development Furthermore subnational budget transpar-ency enables ordinary citizens and civil society organizations to evaluate govern-ment services and facilities and suggest possible changes and needs in the future
The internet has provided an additional incentive for proactive publishing ena-bling large-scale publication of budget data as well as constantly improving gov-
br
an
ko sta
nić
deter
min
an
ts of su
bn
ation
al b
ud
getfisc
al tr
an
spar
enc
y a rev
iew o
f empir
ica
l evid
enc
epu
blic sec
tor
eco
no
mic
s42 (4) 449-486 (2018)
451ernment consultation processes It can be said that the rise of the internet has fur-thered budget transparency by allowing rapid and inexpensive proactive disclo-sure (Darbishire 2010) Consequently SNGs have increasingly resorted to proac-tive budget disclosure thus not only reducing demand-side pressures but also changing their attitude and way of communicating with citizens Despite the widespread availability and bidirectionality of the internet SNG websites vary greatly in the amount of information available comprehensiveness timeliness and interactiveness (Caba-Peacuterez Rodriacuteguez Boliacutevar and Loacutepez Hernaacutendez 2008) While some SNGs run open budget policies others oppose the practice and rarely use the low cost benefits of online proactive publishing
The aim of this study is hence to review the development of research conducted previously in order to understand the factors that could influence SNG budgetfiscal disclosure In other words it aims to produce a balanced account of the set of variables that significantly affect SNG budgetfiscal transparency Some previ-ous studies reviewed the various types of public sector disclosure (Bakar and Saleh 2015) However this study explores studies published in the 2000-2017 period focusing explicitly on budget or fiscal transparency The paper is organ-ized as follows Section 2 provides the methodological framework Section 3 pre-sents different definitions and measurements of budgetfiscal transparency Sec-tion 4 offers a balanced account of core determinants of SNG budgetfiscal disclo-sure Section 5 concludes with recommendations for future research
2 frameworK for analysIsThis review focuses on identifying explicitly quantitative studies on the determi-nants of SNG budgetfiscal transparency The decision for quantitative studies is because they allow for rapid analysis and replication which increases reliability validity and the greater probability of obtaining unambiguous results which con-tributes to better decision-making Subnational governments include all levels below the national government ie local regional state and provincial To identify eligible articles this study used the Summon discovery service ndash a unified search for all electronic sources of academic publications including search interfaces such as ProQuest EBSCO Host Web of Science and Scopus In addition Google Scholar and hand searches were also used This review includes studies published from 2000-2017 thus the focus is inherently on online disclosure Only studies in English are taken into consideration Search terms used were ldquocauses of budgetfiscal transparencyrdquo ldquosubnational government transparencyrdquo ldquobudgetfiscal trans-parency determinantsrdquo ldquolocal government transparencyrdquo or just ldquogovernment transparencyrdquo Since only a few studies focused solely on budget or fiscal transpar-ency it should be noted that this review includes all studies that in their transpar-ency measure have at least one dimension concerning the budget ie revenues and expenditures Although books were initially included in the search no relevant sources were generated on the determinants of subnational budgetfiscal transpar-ency This is probably due to it being an insufficiently researched topic which is why journals take the lead while books are still outdated as sources of information
br
an
ko sta
nić
deter
min
an
ts of su
bn
ation
al b
ud
getfisc
al tr
an
spar
enc
y a rev
iew o
f empir
ica
l evid
enc
epu
blic sec
tor
eco
no
mic
s42 (4) 449-486 (2018)
452 However the eligibility criteria were designed to ensure that high-quality relevant work is included specifically referring to empirical quantitative studies that employ budgetfiscal transparency as the dependent variable Finally 20 studies are included in the review All studies are peer-reviewed and published in journals with the exception of Ma and Wuʼs (2011) paper which remained as part of the 1st
Global Conference on Transparency Research held at Rutgers University
Although it is unquestionable that every paper has made a contribution this review highlights four papers on account of their narrow focus on budgetfiscal transparency strong and credible evidence and rigorous methodology used The first is a paper by Alt Lassen and Rose (2006) who used a unique panel data on the evolution of transparent budget procedures in the US states over the past three decades They used both case studies and quantitative analysis presenting robust results Serrano-Cinca Rueda-Tomaacutes and Portillo-Tarragona (2009) used multivariate logistic regression focusing exclusively on the availability of budget-related documents Although their results showed different levels of robustness they proved that size of the municipality political will and residentsrsquo income all affect budget disclosure Similarly Guillamoacuten Bastida and Benito (2011) exam-ined the determinants of budget and financial transparency using both OLS and 2SLS regression analysis After controlling for endogeneity they confirmed the robustness of the model employed Like them Esteller-Moreacute and Polo Otero (2012) remained focused on budget information disclosures They applied their analysis to a large sample of municipalities using a logit regression analysis for panel data covering a seven-year period These four papers are emphasized on the basis of measurements of the dependent variables and the credibility and quality of the evidence and method used for determining the factors of budgetfiscal trans-parency With this in mind all the papers included in the review are presented in the following chapters first by measuring the dependent variables and then by the established budgetfiscal transparency factors
3 budgetfIscal transParency ndash from defInItIon to measurement
31 defInItIonIn the literature budget transparency and fiscal transparency are often used inter-changeably which may point to the equivalence of these two concepts However budget transparency is a narrower concept focusing on the budget reports within the budget cycle On the other hand fiscal transparency also includes fiscal activ-ities undertaken outside the budget sector aiming at reducing off-budget transac-tions (IMF 1997) It often includes information on all stocks as well as flows which can hardly be found in the budget documents Still it is difficult to make a strict division between these two concepts since they are intertwined and some-times even used synonymously Therefore this paper will use both terms One of the most comprehensive definitions of fiscal transparency was offered by Kopits and Craig (19981)
br
an
ko sta
nić
deter
min
an
ts of su
bn
ation
al b
ud
getfisc
al tr
an
spar
enc
y a rev
iew o
f empir
ica
l evid
enc
epu
blic sec
tor
eco
no
mic
s42 (4) 449-486 (2018)
453ldquoFiscal transparency implies an openness toward the public at large about government structure and functions fiscal policy intentions public sector accounts and projections It involves ready access to reliable comprehen-sive timely understandable and internationally comparable information on government activities ndash whether undertaken inside or outside the gov-ernment sector ndash so that the electorate and financial markets can accurately assess the governmentrsquos financial position and the true costs and benefits of government activities including their present and future economic and social implicationsrdquo
In accordance with this definition Alt Lassen and Skilling (2002) stressed that financial documents should be informative and comprehensive but at the same time easily understandable leaving the option of independent scrutiny In order to facilitate this inspection and monitoring of economic policies by national authori-ties financial markets and international institutions the IMF has developed a Code of Good Practices on Fiscal Transparency (IMF 1998) The Code consisted of four main principles 1) clarity of roles and responsibilities 2) public availability of information 3) open budget preparation execution and reporting and 4) independent assurances of integrity
Although this Code has helped practitioners in understanding basic concepts of fiscal transparency practices it did not contain clear guidelines or standards that would facilitate the way and approach to measuring fiscal transparency However the Code was revised in 2007 pointing out that fiscal data (budget forecasts and updates annual budget and final accounts fiscal reports) should meet accepted data quality standards Similarly the OECD has developed best practices for budget transparency although their definition of budget transparency refers to broader concept of fiscal matters ldquofull disclosure of all relevant fiscal information in a timely and systematic mannerrdquo (OECD 20027) The best practices are divided into three parts ndash budget reports specific disclosures and integrity assurance (table 1) It is evident that only the first section corresponds to pure budget disclo-sure while the other two represent wider fiscal matters Still the first section can be considered the first internationally recognized standard for budget reporting
Table 1 The ldquothree pillarsrdquo of the OECDrsquos best budget transparency practices
budget reports Specific disclosures Integrity control and accountabilityThe budget Economic assumptions Accounting policiesPre-budget report Tax expenditures Systems and responsibilityMonthly reports Financial assets and liabilities AuditMid-year report Non-financial assets Public and parliamentary scrutinyYear-end report Employee pension obligationsPre-election report Contingent liabilitiesLong-term report
Source OECD (2002)
br
an
ko sta
nić
deter
min
an
ts of su
bn
ation
al b
ud
getfisc
al tr
an
spar
enc
y a rev
iew o
f empir
ica
l evid
enc
epu
blic sec
tor
eco
no
mic
s42 (4) 449-486 (2018)
454 It could be said that a number of authors have defined budgetfiscal transparency not only as the availability of budgetfiscal information but also in terms of open-ness and public accountability This can best be seen in Kopits and Craig (1998) who argue that fiscal transparency does not only imply access to fiscal reports but rather the openness of fiscal policies and procedures Similarly Andreula Chong and Guilleacuten (2009) state that fiscal transparency apart from open budget prepara-tion and availability of fiscal information also implies assurances of roles and responsibilities In this sense the IMF has indicated the difference between fiscal reporting and fiscal transparency While the first refers to the production and avail-ability of fiscal information the second relates to the ldquoclarity reliability fre-quency timeliness and relevance of public fiscal reporting and the transparency of the governmentrsquos fiscal policy-making processrdquo (IMF 20125)
One can conclude that there is no uniform definition of budgetfiscal transparency which indicates a complex understanding of this topic In other words while there are certain standards and guidelines different definitions and interpretations directly affect the approach and the way of measurement Certainly the methods and scope of measurement also depend on the context in which the research is carried out Since this review is based on the causes rather than the effects of budgetfiscal transparency the next section provides an empirical overview of dif-ferent measurements in which the budgetfiscal transparency measure appears as a dependent variable
32 VarIous aPProaches to measurIng subnatIonal budgetfIscal transParency ldquoConceptually a statistical measure of transparency is the precision of the information that is obtained ie a function of its relevance and qualityrdquo
(Vishwanath and Kaufmann 19994)
Given the specificities of different countriesrsquo laws standards procedures and con-texts one should be careful while summing comparing and interpreting different definitions and measures of budgetfiscal transparency In other words subna-tional comparisons may be most important within rather than across countries Accordingly this section seeks to present the first studies from Spain and USA ndash since most papers on this topic are focused on the SNGs of these two countries Then individual studies with samples from other countries were presented
spainThe largest body of research comes from Spanish local governments Gandiacutea and Archidona (2008) presented an extensive local government online disclosure index which consists of five sub-indices two of which provide comprehensive budget and financial information The other three dimensions include general government information web presentation and navigation and relational web to address interactivity and functionality of the web Unlike them Serrano-Cinca Rueda-Tomaacutes and Portillo-Tarragona (2009) explicitly explored budget and
br
an
ko sta
nić
deter
min
an
ts of su
bn
ation
al b
ud
getfisc
al tr
an
spar
enc
y a rev
iew o
f empir
ica
l evid
enc
epu
blic sec
tor
eco
no
mic
s42 (4) 449-486 (2018)
455financial disclosure which they measured by sending questionnaires to munici-palities regarding their online publication of nine items (based on Spanish legis-lation regarding local government financial disclosure) including consolidated and unconsolidated budgets budget and annual accounts of dependent entities Like Gandiacutea and Archidona (2008) Caba-Peacuterez Rodriacuteguez Boliacutevar and Loacutepez Hernaacutendez (2008) have also offered an extensive web financial disclosure index hoping to contribute to a more harmonized framework for the structure of budget and financial information in Spanish local governments Although the numbers of items observed are different the main sections of their disclosure indexes are quite the same including budget and financial information and web navigability The main difference is that Caba-Peacuterez Rodriacuteguez Boliacutevar and Loacutepez Hernaacutendez (2008) included non-financial information such as indicators of economy effi-ciency and effectiveness and paid more attention to the characteristics of infor-mation such as timeliness understandability or comparability rather than content of information provided Several authors used the government transparency measure calculated by Transparency International (TI) Spain (Guillamoacuten Bastida and Benito 2011 del Sol 2013 De Arauacutejo and Tejedo-Romero 2016) This index consists of five government transparency areas (a) information about the municipal corporation (b) social transparency (c) financial transparency (d) ser-vices contracting transparency (e) urban development and procurement trans-parency Among these studies Guillamoacuten Bastida and Benito (2011) have con-tributed most to the field of budgetfiscal transparency by focusing explicitly on TIrsquos financial transparency section In other words their dependent variable was based solely on financial transparency indicators including accounting and budget transparency on revenues and expenditures and information on munici-pal debt Their study inspired others to use the same transparency measure for Spanish municipalities (del Sol 2013 De Arauacutejo and Tejedo-Romero 2016)
A significant study was presented by Esteller-Moreacute and Polo Otero (2012) who employed a panel analysis by using a large sample of Catalan municipalities in the period 2001-7 They constructed their fiscal transparency index by addressing the timeliness of the mandatory disclosure of municipalities that need to submit their budget information to the Public Audit Office for Catalonia The budget informa-tion consisted of the following budget approval final budget budget balances closed settlement budgets treasury statement treasury surplus net wealth state-ment income statement and indebtedness Similarly Caamantildeo-Alegre et al (2013) have investigated Galician municipalities They based their budget transparency measure on the IMFrsquos revised Code of Good Practices on Fiscal Transparency and sent the questionnaires to government officials by using a Likert-type survey on open budget process public availability of information and assurance of integrity However unlike Esteller-Moreacute and Polo Otero (2012) who offered a large number of observations and time variation this study remained limited in this sense
A slightly different approach to measuring government transparency was provided by Gandiacutea Marrahiacute and Huguet (2016) who looked at the presence of Web 20 in
br
an
ko sta
nić
deter
min
an
ts of su
bn
ation
al b
ud
getfisc
al tr
an
spar
enc
y a rev
iew o
f empir
ica
l evid
enc
epu
blic sec
tor
eco
no
mic
s42 (4) 449-486 (2018)
456 Spanish city councils In this way they wanted to examine the existence of partici-pative and social web with the possibility of user-generated content Accordingly their disclosure index contained not only information disclosure but also relational web Similar to del Sol (2013) they observed the total index as well as three sub-indices ndash ornamental index (general and citizen information) relational index and information index which includes budgetary and financial disclosure
united statesShortly after the OECD and the IMF implemented Codes of Best Practice for Fis-cal Transparency Alt Lassen and Rose (2006) published one of the most promi-nent and influential studies on the causes of fiscal transparency They examined the determinants of US States both conceptually and empirically A conceptual section included case studies of the states that managed to make significant pro-gress towards higher transparency levels within a short time frame On the other side the transparency measure was not based on the availability of fiscal docu-ments but rather on transparency of state government budget procedures Using the 1990s cross-sectional data from the National Association of State Budget Officers and the National Conference of State Legislatures they extended the data to the beginnings of transparent budget procedures of US states covering the period 1972-2002 This enabled them to use panel analysis which to the best of my knowledge was used for the first time in analyzing the causes of subnational fiscal transparency Although this study offers a unique data set comprising sur-vey responses to a questionnaire sent to the budget officers of all fifty states because of the period covered it could not address e-government practices
However with the rapid adoption of the internet more recent studies are mainly focused on online fiscalbudget transparency usually examining transparency lev-els on governmentsrsquo official websites While Alt Lassen and Rose (2006) offered a transparency measure with a considerable time variation more recent studies looked at the budgetfiscal transparency at one point in time or with small time periods Bernick et al (2014) dropped to a lower level exploring the fiscal trans-parency practices of US counties in 2014 They measured the online availability of a comprehensive annual financial report (CAFR) and availability and compre-hensiveness of budget information (no exact document or information is indi-cated) Similarly Lowatcharin and Menifield (2015) investigated county website transparency in 2010 However their county transparency measure (conducted by the Sunshine Review) included not only fiscal disclosure but a wider spectrum of government transparency such as permits and zoning contracts lobbying etc Relying on Groff and Pitmans (2004) description of internet financial reporting for the 100 largest US municipalities Styles and Tennyson (2007) extended the findings by examining the online availability and accessibility of CAFR data for a sample of US municipalities of various sizes
br
an
ko sta
nić
deter
min
an
ts of su
bn
ation
al b
ud
getfisc
al tr
an
spar
enc
y a rev
iew o
f empir
ica
l evid
enc
epu
blic sec
tor
eco
no
mic
s42 (4) 449-486 (2018)
457other countriesWhen it comes to pioneers in dealing with voluntary internet financial reporting in subnational governments the paper by Laswad Fisher and Oyelere (2005) deserves highlighting They observed New Zealandrsquos district city and regional councils by constructing the financial transparency measure as a dichotomous variable indicating whether or not the local authority publishes financial informa-tion on the web However their definition of what is considered published may be somewhat confusing since they had four disclosure categories financial high-lights only annual reports only annual plan only and combinations of annual reports plans and financial highlights together In other words it is not clear whether there is any council that has published for example both annual plan and report in which case the analysis could change considerably Garciacutea-Tabuyo Saacuteez-Martiacuten and Caba-Peacuterez (2016) investigated online proactive disclosure of the 40 largest municipalities in each of the five countries of Central America ndash El Salvador Nicaragua Panama Guatemala and Honduras This was a valuable study since the same transparency measure was employed for local government transparency in different country contexts However their measure consists of five transparency areas where economic and financial transparency (including enacted and executed consolidated and individual budget and budget amend-ments) accounts for 20 the total index
On the other hand some studies focused explicitly on fiscal transparency either on a sample of Brazilian states (Zuccolotto and Teixeira 2014) or Chinese provincial government (Ma and Wu 2011) While Ma and Wu (2011) used the data collected from the first two years of the four-year survey by the Public Policy Research Center in Shanghai Zuccolotto and Teixeira (2014) employed a fiscal transparency measure developed by Biderman and Pottomatti (2010)1 Tavares and da Cruz (2017) used TI Portugalʼs index of municipal transparency to assess a disclosure of Portuguese municipalities The index is a comprehensive measure of local gov-ernemnt transparency comprising seven dimensions one of which is economic and financial transparency However unlike other extensive measures it only monitors the availability of a set of information items on a municipalitys website not taking into account accessibility navigability reliability or the quality of the information A study presented by Gesuele Metallo and Longobardi (2017) analyzed website disclosure of Italian and Spanish municipalities Although their contribution is valuable (very few studies with an international context) they did not sufficiently address budgetfiscal transparency except for financial statements and information about municipalitiesrsquo assets such as values location and revenue
33 the challenge of subnatIonal budgetfIscal transParency measurement
This review will outline several budgetfiscal transparency measurement chal-lenges and opportunities First the use of the same transparency measure within a
1 A study available only in Portuguese
br
an
ko sta
nić
deter
min
an
ts of su
bn
ation
al b
ud
getfisc
al tr
an
spar
enc
y a rev
iew o
f empir
ica
l evid
enc
epu
blic sec
tor
eco
no
mic
s42 (4) 449-486 (2018)
458 country would allow for a comparison of the results of different studies which could contribute to a greater understanding of inconsistent results and to the reduction or explanation of the ambiguity in the previous findings The review shows that only a few studies used the same transparency index within a country as with the TI Spain index used by De Arauacutejo and Tejedo-Romero (2016) del Sol (2013) and Guillamoacuten Bastida and Benito (2011) Second the transparency measure mainly involved one year of observation and only a few studies have had a long dataset of the dependent variable such as Alt Lassen and Rose (2006) or Esteller-Moreacute and Polo Otero (2012) The longer time span of the dependent var-iable opens the door to many methodological approaches enables a better quality analysis and gives an opportunity to observe the progress of SNG budgetfiscal transparency Third in order to improve the observation of the causes of budgetfiscal transparency it is necessary to have more studies focusing solely on budget-ary and fiscal indicators
Although strong efforts have been made to standardize fiscal transparency meas-ures at the national level this remains an empirical and contextual challenge at the local level However some studies have already examined cross-country analyses by introducing their own index on a sample of municipalities (Garciacutea-Tabuyo Saacuteez-Martiacuten and Caba-Peacuterez 2016 Gesuele Metallo and Longobardi 2017) Nonetheless to facilitate these efforts analogously to the IBP Open Budget Sur-vey one of the biggest challenges (given the diversity of the local self-government system) is to create a harmonized budgetfiscal transparency index capable of being applied to the subnational governments of various countries Results of these studies could provide more comprehensive insights into the contextual sen-sitivity but also generally in examining the causes of budgetfiscal transparency
4 determInants of subnatIonal budgetfIscal transParency ndash emPIrIcal oVerVIew
41 heterogeneIty of defInItIon and measurement of VarIablesThis review discusses the different definitions and measurements of some varia-bles While different measurements are not unexpected in different countries (bear-ing in mind different types of data) the main issue is when these arise within a single country which can lead to confusion and ldquofalserdquo variability in the results However when concluding and interpreting results of previous studies attention has to be paid to the definitions and the way of measuring variables regardless of whether they are in-country or cross-country comparisons According to the litera-ture some of the most frequently used variables that can cause confusion are lever-age debt and political competition Although the definition of leverage is quite unambiguous several studies have used different measures Laswad Fisher and Oyelere (2005) have measured it in two ways as a ratio of long-term liabilities in total assets and in total public equity On the other hand some studies have used financial expenses per capita as a proxy for leverage (Gandiacutea and Archidona 2008 Gandiacutea Marrahiacute and Huguet 2016) Gandiacutea and Archidona (2008) have equated leverage with indebtedness making it more confusing by stating that they have
br
an
ko sta
nić
deter
min
an
ts of su
bn
ation
al b
ud
getfisc
al tr
an
spar
enc
y a rev
iew o
f empir
ica
l evid
enc
epu
blic sec
tor
eco
no
mic
s42 (4) 449-486 (2018)
459used the cost of debt as a proxy of indebtedness which is measured as municipal financial expenses per capita At the same time Caba-Peacuterez Rodriacuteguez Boliacutevar and Loacutepez Hernaacutendez (2008) used funding costs of current year budget expendi-ture per capita as a proxy for the cost of debt not assigning it to leverage but rather to debt Gesuele Metallo and Longobardi (2017) have not even described their leverage measure They defined it simply as a value of leverage per capita while the measure was described just as natural logarithm thus leaving it unexplained
A unique measure for debt issuance was presented by Serrano-Cinca Rueda-Tomaacutes and Portillo-Tarragona (2009) who used a dichotomic variable which assigns the value of 1 if the town hall has municipal bonds in circulation denoting a debt issu-ance On the other side some debt measures are more straight-forward such as debt level as a percentage of the total budget (del Sol 2013) or the often-used municipal public debt per capita (Alt Lassen and Rose 2006 Styles and Tenny-son 2007 Guillamoacuten Bastida and Benito 2011 Caamantildeo-Alegre et al 2013)
While some authors argue that a governmentrsquos decision to disclose or retain infor-mation is inherently political (Wehner and de Renzio 2013) others claim that political competition is a major driver of transparency reforms (Berliner and Erlich 2015) However the mode of measurement of political competition imposes the greatest variability among political determinants There are various measures intro-duced for this variable Some studies observe it as a margin of victory measured by the difference between the percentage of votes obtained by the parties coming in first and second place (De Arauacutejo and Tejedo-Romero 2016 2017 Tavares and da Cruz 2017) Others see it as a measure of dispersion ie the standard deviation of the percentage of votes received by each political party (Caba-Peacuterez Rodriacuteguez Boliacutevar and Loacutepez Hernaacutendez 2008 Esteller-Moreacute and Polo Otero 2012) Caamantildeo-Alegre et al (2013) applied the measure developed by Laakso and Taa-gepera (1979) ndash an effective number of political parties whose calculation also contains each partys proportion of all votes Several studies focused explicitly on competition in the municipal council Laswad Fisher and Oyelere (2005) and Serrano-Cinca Rueda-Tomaacutes and Portillo-Tarragona (2009) measured almost the same thing While the first used the ratio of candidates to council positions availa-ble the latter defined it as the ratio of candidates to councillors elected However despite the different definitions it could be said that their measure is the same since it seldom happens that available council positions are not filled
By using different measures for one variable results may vary within one study let alone comparing different studies contexts or subnational international com-parisons In this sense one should be careful while summing and interpreting results because the measure always speaks more than the variable name
42 maIn determInantsIn order to provide the centrality of each variable in the literature table 2 presents the most frequently used explanatory variables It shows how many studies that
br
an
ko sta
nić
deter
min
an
ts of su
bn
ation
al b
ud
getfisc
al tr
an
spar
enc
y a rev
iew o
f empir
ica
l evid
enc
epu
blic sec
tor
eco
no
mic
s42 (4) 449-486 (2018)
460 are included in the review used a particular independent variable The complete classification and measurements of variables can be seen in the appendix
Table 2 Most frequently used explanatory variables
financial Debt 40Governmentrsquos wealth 35Budget (im)balance 35Leverage 20Intergovernmental transfers 15Municipal size 10Political Political competition 55Political ideology 55Voter turnout 45Executive features 35Governance type 20E-government achievements 15citizens and the media Population sizedensity 60Citizensrsquo characteristics (education age gender) 45Citizensrsquo wealth 35Internet access 30Unemployment 25Media use and visibility 25
Source Author
However this overview aims to analyze the most frequently used variables that have shown a significant influence with particular emphasis on those that despite heterogeneity in definition and measurement show a significant effect In this way the review strives to produce a balanced account of core variables that greatly affect the level of subnational fiscalbudget transparency (table 3) To produce this account the rule is that only variables that were used in at least two papers and which show a significant result in more than 50 of cases were included Accord-ingly three basic variable categories are distinguished financial political and citizens and the media The following section reveals these variables and focuses on the explanation of the results obtained based on some underpinnings in previ-ous studies
421 fInancIal VarIablesFinancial leverage and debt levels are the most important financial factors deter-mining subnational budgetfiscal transparency Leverage refers to the use of bor-rowed funds to finance public activities In this sense it can represent the amount of debt of the government showing the close relation of these two terms Accord-ing to Zimmerman (1977) governments want to reduce the cost of debt by increas-
br
an
ko sta
nić
deter
min
an
ts of su
bn
ation
al b
ud
getfisc
al tr
an
spar
enc
y a rev
iew o
f empir
ica
l evid
enc
epu
blic sec
tor
eco
no
mic
s42 (4) 449-486 (2018)
461ing resources available for other activities that are more efficient in increasing governmentrsquos welfare than the payment of high interest rates Accordingly politi-cians are encouraged to publish government information which in turn facilitates monitoring by creditors This can be achieved easily and at low-cost by online proactive reporting which is confirmed in several studies even if they have dif-ferent leverage measurements (Laswad Fisher and Oyelere 2005 Gandiacutea Mar-rahiacute and Huguet 2016 Gesuele Metallo and Longobardi 2017)
Table 3 Main determinants of subnational budgetfiscal transparency
category Variable different measurements
Financial
LeverageRatio of long-term liabilities to total assetsRatio of long-term liabilities to total public equity Total executed expenses per capita
Debt
Percentage of debt in total budgetPublic debt per capitaFunding costs of the current year budget expenditure per capita
Political
Political competition
Divided government gubernatorial competition legislative competition1 if city council is governed by one of the majority political parties in the countryMeasure of dispersion ie the standard deviation of the percentage of votes received by each political party Effective number of political partiesMargin of victory measured by the difference between the percentage of votes obtained by the parties coming in first and second place
Executive features
Mayorrsquos genderNumber of incumbentrsquos consecutive terms (tenure)
Governance type
1 if district councils 0 regional or city councils1 if provincial capitalsForm of government (1 if council-manager 0 commission and council-elected executive)
Citizens and the media
PopulationNumber of inhabitantsPopulation density
Internet access
Percentage of households with home internet accessFixed internet access connections over 200 kilobits per second in at least one direction per 1000 householdsInternet penetration
Unemployment Unemployment rate
Media
Intensity of use of social media measured by the number of tweetsPress visibilityInternet visibility
Source Author
br
an
ko sta
nić
deter
min
an
ts of su
bn
ation
al b
ud
getfisc
al tr
an
spar
enc
y a rev
iew o
f empir
ica
l evid
enc
epu
blic sec
tor
eco
no
mic
s42 (4) 449-486 (2018)
462 Moreover politicians are incentivized to reduce debt levels because it allows for lower property taxes that will increase their probability of re-election (Gore Sachs and Trzcinka 2004) In this way incumbents are encouraged to use internet reporting and disclose more information as this helps lenders to regularly monitor governments activities (Debreceny Gray and Rahman 2002) In other words the greater the dependence on external funding sources the greater the disclosure (Ingram 1984) Severel studies have confirmed this finding a positive relation-ship between debt levels and budgetfiscal reporting (Styles and Tennyson 2007 Caba-Peacuterez Rodriacuteguez Boliacutevar and Loacutepez Hernaacutendez 2008 Caamantildeo-Alegre et al 2013 De Arauacutejo and Tejedo-Romero 2017) However Alt Lassen and Rose (2006) found a negative association concluding that higher debt reduces fiscal transparency But it should be pointed out that they employed debt variable only as a control variable Finally given the different leverage and debt measures used the significance of these variables in determining fiscalbudgetary transparency is even greater
422 PolItIcal VarIablesPolitical competitionWhen it comes to political determinants there are three variables that contribute to explaining different levels of subnational budgetfiscal transparency ndash political competition different executive features and type of government Stronger polit-ical competition encourages incumbents to bear higher monitoring costs because if they do not keep pre-election promises they are exposed to the long-term costs of re-election failure (Evans and Patton 1987) Esteller-Moreacute and Polo Otero (2012) stressed the importance of political competition in times in which an incumbentrsquos re-election is uncertain With a strong competition agents use fiscal disclosure as their strategic instrument to have a greater chance of being re-elected However when it comes to the degree of fiscal information they wish to provide agents face a trade-off According to Ferejohn (1986) higher levels of fiscal transparency allow politicians to have higher wages since principals are now ready to pay more taxes At the same time greater information disclosure diverts agents from rent extraction Accordingly in the cases of strong competi-tion higher transparency becomes agentsrsquo instrument only if a trade-off is solved in favour of higher salaries In cases of low competition transparency becomes less important for politicians as they in this case have high expectations of staying in power (Piotrowski and Bertelli 2010)
It is argued that parties in power have greater benefits from divulging information in both a low and a high political competition environment In the case of high competition they have the incentive to show their current actions and good man-agement (Caba Peacuterez Rodriacuteguez Boliacutevar and Loacutepez Hernaacutendez 2014) while low competition makes them more confident of their position in power and so willing to reveal more information (Grimmelikhuijsen and Welch 2012) By contrast other competing parties in a high competition environment abstain from the risk of disclosure as this may reduce their ability to control their message (Caba Peacuterez Rodriacuteguez Boliacutevar and Loacutepez Hernaacutendez 2014)
br
an
ko sta
nić
deter
min
an
ts of su
bn
ation
al b
ud
getfisc
al tr
an
spar
enc
y a rev
iew o
f empir
ica
l evid
enc
epu
blic sec
tor
eco
no
mic
s42 (4) 449-486 (2018)
463In this context the empirical results on political competition are mixed While sev-eral authors proved that competition fosters subnational fiscal transparency (Caamantildeo-Alegre et al 2013 Gandiacutea and Archidona 2008 Tavares and da Cruz 2017) others disputed this showing a negative correlation (Alt Lassen and Rose 2006 De Arauacutejo and Tejedo-Romero 2016 Gandiacutea Marrahiacute and Huguet 2016) Generally it is hard to report the true effect of political competition since the con-text data used and different country characteristics may greatly affect this variabil-ity in the results However even with wide range of measurements used political competition proved to be a significant predictor of subnational fiscal transparency
executive featuresDifferent incumbent characteristics and features also affect governmentrsquos decision on divulging or withholding fiscal information The mayorrsquos gender is the first of those features showing a significant influence on subnational transparency levels Many studies have investigated the differences between women and men officials mostly favouring womenrsquos leadership style and its effect on decision-making in the public sector It is argued that female mayors are more likely than their male counterparts to actively engage citizens in the decision-making thus fostering participation communication and different inputs (Fox and Schuhmann 1999) Some studies are concerned with gender and ethics suggesting that women are less likely to behave unethically in the workplace in order to achieve greater finan-cial rewards (Bernardi and Arnold 1997 Krishnan and Parsons 2008) In addi-tion female mayors may be less likely to experience the principal-agent dilemma since they are more ethically minded than men (Khazanchi 1995) Some authors stress that the critical representation of women in governance structures can affect the way of government functioning making it more socially responsive and trans-parent (Rodriacuteguez-Garcia 2015) Several authors have empirically confirmed these underpinnings finding a positive relationship between a female mayor and budget transparency (De Arauacutejo and Tejedo-Romero 2017 Tavares and da Cruz 2017) However Gesuele Metallo and Longobardi (2017) proved the opposite but showing the significance in only one of the three models presented
It is also argued that longer tenure in office reduces pressure on the officials to disclose information Tavares and da Cruz (2017) found that the number of an incumbentrsquos consecutive terms in office is one of the factors most detrimental to transparency This is consistent with the findings by Berliner (2014) who claimed that turnover in executive office fosters the adoption of freedom of information laws which are associated with increased transparency By contrast Ma and Wu (2011) showed a positive correlation stressing that governments need more time to achieve the support needed for the implementation of administrative reforms so as to foster transparency and openness It could also be argued however that much more research is needed as only few studies have employed this variable thus limiting a better insight into the true effects of this variable
br
an
ko sta
nić
deter
min
an
ts of su
bn
ation
al b
ud
getfisc
al tr
an
spar
enc
y a rev
iew o
f empir
ica
l evid
enc
epu
blic sec
tor
eco
no
mic
s42 (4) 449-486 (2018)
464 governance typeThere has been a tendency for researchers to include a dummy variable that addresses the type or form of the government thus pointing to the governance structure This could be an important argument especially in the context of imple-mentation of the new public management (NPM) Namely within this approach citizens are viewed as customers and public servants as public managers while transparency and accountability are perceived as fundamental elements of good governance (Caba Peacuterez Rodriacuteguez Boliacutevar and Loacutepez Hernaacutendez 2008) Las-wad Fisher and Oyelere (2005) were among the first to use the variable ldquoform of local authorityrdquo by distinguishing between district city and regional councils They found that regional and city councils are more transparent than district coun-cils However it is not clear why they have not used a nominal variable rather than a dichotomous to address all three council types separately It should be noted though that the governance type may vary greatly among countries thus depending on the setting of the public administration of a country In some cases the central government has administration delegations across the country which are assigned to the several subnational units In Spain for example these are pro-vincial capitals where the central government holds offices to provide efficiently and effectively some additional services to citizens These political capitals proved to be less transparent than other Spanish cities (del Sol 2013) Since this is a spe-cific country context it would be difficult to find theoretical underpinnings that support this evidence In spite of that the author indicated that the reason for low transparency could be the capitalsrsquo privileged treatment by the central govern-ment Lowatcharin and Menifield (2015) on a sample of US counties found that council-manager governments tend to be more transparent than their mayor-coun-cil counterparts It could be argued however that council-managers are more prone to the adoption of web technologies and e-government solutions rather than mere transparency (Moon 2002) In other words higher transparency in these governments is not a goal by itself but comes as a result of their propensity for web technology implementations
423 cItIZens and the medIaPopulationOne of the variables most often used in explaining SNG fiscal transparency is the number of inhabitants It is widely discussed that larger SNGs have the extra resources and capacities to adopt technical and managerial innovations faster (Smith and Taebel 1985 Norris and Kraemer 1996) This is explained by the greater pressure they face in finding different ways for a better supply of public services In addition they may have a better trained stuff a larger budget and an established IT department which helps them to embrace e-government practices (Moon and Norris 2005) These underpinnings were strongly confirmed by sev-eral authors (del Sol 2013 Guillamoacuten Bastida and Benito 2011 Lowatcharin and Menifield 2015 Serrano-Cinca Rueda-Tomaacutes and Portillo-Tarragona 2009) However a study presented by Esteller-Moreacute and Polo Otero (2012) has revealed new insights into the population variable Given the heterogeneity of the sample
br
an
ko sta
nić
deter
min
an
ts of su
bn
ation
al b
ud
getfisc
al tr
an
spar
enc
y a rev
iew o
f empir
ica
l evid
enc
epu
blic sec
tor
eco
no
mic
s42 (4) 449-486 (2018)
465with a wide range of population size they split the sample into a large and small population They found a negative relationship in the small sample but a positive in the larger sample (for the very big municipalities) pointing to a non-linear relationship between the number of inhabitants and fiscal transparency They stressed that unlike small municipalities very large units have greater capacity to fulfil their legal obligations which could more than compensate for their potential propensity to be less transparent
Internet accessAccording to Debreceny Gray and Rahman (2002) the rise in the use of the inter-net has brought different views to fiscal transparency From the userʼs perspective it is recognized as a facilitator in the demand for fiscal transparency while from the supplierʼs perspective it is perceived as a tool for more effective dissemination of information Internet take-up has affected the behaviour of governments which are now divulging additional information and services online Thus its rise has brought about an improved transparency and financial accountability reducing the costs of dissemination (Pina Torres and Royo 2010) Several studies that investigated online (mainly website) transparency reported that greater and better internet access in the SNGs positively affects their fiscal transparency (Caba-Peacuterez Rodriacuteguez Boliacutevar and Loacutepez Hernaacutendez 2008 Gandiacutea and Archidona 2008 De Arauacutejo and Tejedo-Romero 2017) Garciacutea-Tabuyo Saacuteez-Martiacuten and Caba-Peacuterez (2016) found a positive association with mandatory disclosure but surprisingly the relationship with voluntary reporting proved to be negative Although the argument may be somewhat shallow they explained this by saying that voluntary information disclosure could be larger in municipalities with higher internet penetration and political commitment because by increasing the transpar-ency levels politicians aim to attract the votes of inactive citizens
unemploymentIt has been argued that lower economic development and associated higher unem-ployment rates are damaging to civic engagement ie the demand for greater opportunities to participate in the decision-making is lessened Some studies used unemployment as a proxy for SNG economic status and found that higher eco-nomic status (lower unemployment) positively affects transparency in public administration (Piotrowski and van Ryzin 2007) In accordance with these under-pinnings the results largely indicate that higher unemployment rates are detri-mental to fiscal transparency (Caamantildeo-Alegre et al 2013 De Arauacutejo and Tejedo-Romero 2016 del Sol 2013 Tavares and da Cruz 2017)
mediaVarious authors have stressed the importance of public media visibility in a govern-mentrsquos divulging of information (Zimmerman 1977 Ingram 1984 Laswad Fisher and Oyelere 2005) It is argued that greater visibility and frequency of press report-ing on a governments activities and work contributes to resolving the principal-agent dilemma by reducing information asymmetries between citizens and author-
br
an
ko sta
nić
deter
min
an
ts of su
bn
ation
al b
ud
getfisc
al tr
an
spar
enc
y a rev
iew o
f empir
ica
l evid
enc
epu
blic sec
tor
eco
no
mic
s42 (4) 449-486 (2018)
466 ities However it should be noted that the media citizens and politicians often have different interests In this context public media may be more interested in publish-ing exclusive information such as corruption scandals This in turn affects the governments behavior for it will limit the disclosure of information so as to avoid them being ldquomisusedrdquo in the media (Laswad Fisher and Oyelere 2005 Garciacutea and Garciacutea-Garciacutea 2010 Cuadrado-Ballesteros et al 2017) Nevertheless studies have found that press and public media visibility as well as frequency of social media usage by SNGs have a positive impact on their fiscal transparency (Laswad Fisher and Oyelere 2005 Gandiacutea and Archidona 2008 Gandiacutea Marrahiacute and Huguet 2016 Gesuele Metallo and Longobardi 2017)
5 dIscussIon and conclusIonThis paper has provided a review of empirical studies on the determinants of sub-national governmentrsquos budgetfiscal transparency in the period 2000-2017 Sev-eral important observations should be emphasized First in order to determine the factors involved it is necessary to have a clear definition of budgetfiscal transpar-ency However there is no consensus about this Moreover different definitions are interwoven leading to budgetary and fiscal transparency being used inter-changeably The lack of a clear definition conduces to an inadequate measurement of budget transparency which can significantly affect the credibility of the results of such research Thus instead of having effective transparency this lack of clar-ity leads to opaque fuzzy or zombie transparency (Fox 2007 Michener 2015) where there is a lack of disaggregation or better descriptive details Without parameters as Michener (2015) stressed the quality and comparability of trans-parency is compromised Secondly different approaches to measuring budget transparency especially within the same country reduce the effective comparison potential and lead to ambiguity Thirdly heterogeneity of the definition and meas-urement of explanatory variables can lead to apparent contradiction and inconsist-ency of the obtained results
In this paper three basic categories that determine subnational government budgetfiscal transparency are established (1) financial (leverage and debt) (2) political (political competition executive features and governance type) and (3) citizens and the media (population internet access unemployment and the media) This conclusion is based on the review of 20 selected papers following the above-mentioned methodology Looking at the wider literature some of the findings can be related to findings at the national level where the main factors of fiscal trans-parency are political namely political (electoral) competition and the level of governmental democracy (Hollyer Rosendorff and Vreeland 2011 Wehner and de Renzio 2013) Although citizens and the media and financial factors deter-mine SNG fiscal transparency at the national level its effect seems negligible This may be due to the reduced participation opportunities and pressures of citi-zens on the national government or different structures and sources of funding of national and SNGs Moreover Wehner and de Renzio (2013) have concluded that external initiatives might not play a great role in strenghtening fiscal accountabil-
br
an
ko sta
nić
deter
min
an
ts of su
bn
ation
al b
ud
getfisc
al tr
an
spar
enc
y a rev
iew o
f empir
ica
l evid
enc
epu
blic sec
tor
eco
no
mic
s42 (4) 449-486 (2018)
467ity at the national level when the internal demand (citizens media) is weak How-ever when it comes to a wider literature on other types of public sector transpar-ency all findings are highly correlated (Bakar and Saleh 2015) including all three established categories
A vast majority of studies tend to focus on local governments thus neglecting other types of public sector organizations such as federal and state governments or quasi-government bodies Very few studies involved different countries in an investigation of subnational international comparisons In this sense the chal-lenge would be to create a harmonized budget transparency measure that could be applied to subnational governments of different countries Further such research could offer a more comprehensive insight into the factors implicated in budgetfiscal transparency including different country characteristics and contexts Fur-thermore greater consistency in selecting proxy measures for certain variables could contribute to a clearer interpretation of results while the greater time span of budget transparency data would allow for richer methodology solutions and observations
Like any other studies this study has a few limitations It does not take into account research before 2000 as the focus is rather on online disclosure Future studies may extend observation time Furthermore no meta-analytic studies were included However this paper can serve as the basis and motivation for imple-menting systematic reviews and meta-analyses on this topic In spite of these limitations it is believed that the study may provide rich insights for both inter-ested researchers and practitioners
disclosure statementThe author does not have any conflict of interest
br
an
ko sta
nić
deter
min
an
ts of su
bn
ation
al b
ud
getfisc
al tr
an
spar
enc
y a rev
iew o
f empir
ica
l evid
enc
epu
blic sec
tor
eco
no
mic
s42 (4) 449-486 (2018)
468
aPP
en
dIX
Ta
bl
e a
1 Bu
dget
fisc
al tr
ansp
aren
cy m
easu
rem
ents
aut
hor(
s)sa
mpl
ed
epen
dent
var
iabl
ety
pe o
f di
sclo
sure
met
hod
for
estim
atin
g de
term
inan
ts
mai
n re
sults
(d
eter
min
ants
)m
easu
rem
ent
tim
e
peri
odu
nite
d st
ates
Alt
et a
l (2
006)
50 S
tate
s
Bas
ed o
n A
lt L
asse
n an
d Sk
illin
g (2
002)
The
y m
easu
red
stat
e go
vern
men
t bud
get p
roce
dure
s by
send
ing
ques
tionn
aire
s to
the
budg
et o
ffice
rs o
f all
50 st
ates
on
nine
dic
hoto
mou
s ite
ms r
egar
ding
bu
dget
pro
cedu
re is
sues
bas
ed o
n th
e da
ta fr
om th
e N
atio
nal A
ssoc
iatio
n of
Sta
te B
udge
t Offi
cers
and
th
e N
atio
nal C
onfe
renc
e of
Sta
te L
egis
latu
res
1972
-99
Surv
ey
resp
onse
s
Pane
l dat
a re
gres
sion
an
alys
is
Polit
ical
com
petit
ion
Po
litic
al p
olar
izat
ion
Pa
rtisa
n co
mpo
sitio
n
of g
over
nmen
t D
ebt
Bud
get i
mba
lanc
e
Styl
es a
nd
Tenn
yson
(2
007)
300
mun
icip
aliti
es
They
use
d on
ly o
ne in
dica
tor ndash
a c
ompr
ehen
sive
an
nual
fina
ncia
l rep
ort (
CA
FR)
In a
dditi
on t
hey
deve
lope
d an
acc
essi
bilit
y in
dex
to m
easu
re th
e ea
se o
f CA
FR a
cces
s ie
how
man
y st
eps a
re
requ
ired
to lo
cate
the
repo
rt
na
Onl
ine
man
dato
ry
Logi
t Reg
ress
ion
Ana
lysi
s for
pro
-vi
sion
mod
el a
nd
OLS
Reg
ress
ion
Ana
lysi
s for
ac
cess
ibili
ty
mod
el
Popu
latio
n si
ze I
ncom
e pe
r cap
ita A
ccou
ntin
g di
sclo
sure
Ber
nick
et
al (
2014
)40
0 co
untie
s
Like
Sty
les a
nd T
enny
son
(200
7) t
hey
look
ed
at a
com
preh
ensi
ve a
nnua
l fina
ncia
l rep
ort (
CA
FR)
and
avai
labi
lity
and
com
preh
ensi
vene
ss o
f bud
get
info
rmat
ion
(no
exac
t doc
umen
t or i
nfor
mat
ion
is
indi
cate
d)
2014
Onl
ine
man
dato
ryO
rder
ed lo
git
anal
ysis
Cou
ntie
s with
app
oint
ed
coun
ty m
anag
er s
ize
of
coun
ty b
oard
cou
ntie
s re
quire
d to
subm
it an
au
dit t
o th
e fe
dera
l gov
-er
nmen
t Ec
onom
ic
stre
ss P
opul
atio
n ag
e
Dem
ocra
tic a
nd m
inor
-ity
resi
dent
s H
eter
o-ge
neity
of t
he c
ount
y
br
an
ko sta
nić
deter
min
an
ts of su
bn
ation
al b
ud
getfisc
al tr
an
spar
enc
y a rev
iew o
f empir
ica
l evid
enc
epu
blic sec
tor
eco
no
mic
s42 (4) 449-486 (2018)
469a
utho
r(s)
sam
ple
dep
ende
nt v
aria
ble
type
of
disc
losu
rem
etho
d fo
r es
timat
ing
dete
rmin
ants
mai
n re
sults
(d
eter
min
ants
)m
easu
rem
ent
tim
e
peri
od
Low
atch
arin
an
d M
eni-
field
(201
5)
816
coun
ties i
n tw
elw
e U
S M
idw
este
rn st
ates
Cat
egor
ical
dat
a ta
king
the
num
bers
from
0 to
4
with
rega
rd to
the
rele
ase
of th
e fo
llow
ing
10 it
ems
bu
dget
mee
tings
ele
cted
offi
cial
s ad
min
istra
tive
offic
ials
per
mits
and
zon
ing
aud
its c
ontra
cts
lobb
ying
pub
lic re
cord
s an
d lo
cal t
axes
2010
Onl
ine
proa
ctiv
e
Ord
ered
Log
istic
R
egre
ssio
n A
naly
sis
Gov
erna
nce
type
Po
pula
tion
dens
ity
Citi
zens
edu
catio
n
Tota
l lan
d ar
ea
Min
ority
pop
ulat
ion
(mos
t ext
ensi
ve m
odel
re
sults
)sp
ain
Gan
diacutea
and
Arc
hido
na
(200
8)
130
mun
icip
aliti
es
with
mor
e th
an 5
000
0 in
habi
tant
s
Web
dis
clos
ure
inde
x c
onsi
stin
g of
88
item
s gr
oupe
d in
to fi
ve se
ctio
ns g
ener
al in
form
atio
n
budg
et in
form
atio
n fi
nanc
ial i
nfor
mat
ion
na
viga
tion
and
pres
enta
tion
rela
tiona
l web
2006
Onl
ine
volu
ntar
y
Mul
tivar
iate
R
egre
ssio
n A
naly
sis
Polit
ical
com
petit
ion
Pu
blic
med
ia v
isib
ility
In
tern
et a
cces
s
Citi
zens
edu
catio
n
Serr
ano-
Cin
ca e
t al
(200
9)
92 lo
cal g
over
nmen
ts
incl
udin
g al
l pr
ovin
cial
cap
itals
and
al
l tow
n ha
lls w
ith
over
70
000
inha
bita
nts
Dep
ende
nt v
aria
ble
base
d on
web
ava
ilabi
lity
of
nine
doc
umen
ts i
ndiv
idua
l bud
get o
f the
cou
ncil
co
nsol
idat
ed b
udge
t of t
he c
ounc
il b
udge
t of
depe
nden
t ent
ities
bud
get d
isag
greg
ated
by
eco-
nom
ic f
unct
iona
l or o
rgan
ic c
lass
ifica
tion
bud
get
info
rmat
ion
rega
rdin
g in
vest
men
t bo
rrow
ing
or
reve
nue
and
expe
nditu
re i
ndiv
idua
l ann
ual
acco
unts
con
solid
ated
ann
ual a
ccou
nts
annu
al
acco
unts
of d
epen
dent
ent
ities
and
aud
it re
port
2006
Onl
ine
volu
ntar
y
Mul
tivar
iate
Lo
gist
ic
Reg
ress
ion
Popu
latio
n si
ze B
udge
t re
venu
es P
oliti
cal w
ill
(mea
sure
d by
cou
ncils
rsquo ex
perie
nce
with
e-
dem
ocra
cy)
Dis
posa
ble
fam
ily
inco
me
per i
nhab
itant
Cab
a-Peacute
rez
et a
l (2
008)
65 S
pani
sh c
ity
coun
cils
inc
ludi
ng
larg
e ci
ties
prov
inci
al
capi
tals
aut
onom
ous
regi
on c
apita
ls a
nd
mun
icip
aliti
es w
ith
cent
ral o
ffice
s of t
he
auto
nom
ous r
egio
nsrsquo
inst
itutio
ns
Dis
clos
ure
inde
x di
vide
d in
to th
ree
sect
ions
(1
) con
tent
of i
nfor
mat
ion
supp
lied
incl
udin
g bu
dget
and
fina
ncia
l inf
orm
atio
n (2
) cha
ract
eris
tics
of th
e in
form
atio
n di
sclo
sed
ie
com
plet
enes
s tim
elin
ess
com
para
bilit
y u
nder
stan
dabi
lity
re
leva
nce
and
relia
bilit
y a
nd (3
) nav
igab
ility
de
sign
and
acc
essi
bilit
y of
pub
lic fi
nanc
ial
info
rmat
ion
on th
e w
eb si
te
2007
Onl
ine
volu
ntar
y
Mul
tivar
iabl
e Li
near
R
egre
ssio
n
Cos
t of d
ebt
Inte
rnet
ac
cess
br
an
ko sta
nić
deter
min
an
ts of su
bn
ation
al b
ud
getfisc
al tr
an
spar
enc
y a rev
iew o
f empir
ica
l evid
enc
epu
blic sec
tor
eco
no
mic
s42 (4) 449-486 (2018)
470
aut
hor(
s)sa
mpl
ed
epen
dent
var
iabl
ety
pe o
f di
sclo
sure
met
hod
for
estim
atin
g de
term
inan
ts
mai
n re
sults
(d
eter
min
ants
)m
easu
rem
ent
tim
e
peri
od
Gui
llam
oacuten
et a
l (2
011)
100
larg
est S
pani
sh
mun
icip
aliti
es
The
finan
cial
tran
spar
ency
inde
x ba
sed
on th
e da
ta
of T
rans
pare
ncy
Inte
rnat
iona
l (TI
) Spa
in 2
008
and
partl
y fr
om th
e qu
estio
nnai
re c
reat
ed b
y th
e au
thor
s Th
ey o
bser
ved
thre
e di
men
sion
s
acco
untin
g an
d bu
dget
mun
icip
al re
venu
es a
nd
expe
nditu
res
and
mun
icip
al d
ebt
2008
Proa
ctiv
e
prin
t and
on
line
OLS
and
2SL
S re
gres
sion
s
Mun
icip
al w
ealth
In
terg
over
nmen
tal
trans
fers
Pol
itica
l id
eolo
gy P
opul
atio
n si
ze
del S
ol
(201
3)
110
loca
l gov
ernm
ents
th
at p
artic
ipat
ed in
20
10 T
I Spa
in su
rvey
TI S
pain
dis
clos
ure
inde
x in
clud
ing
five
trans
pare
ncy
area
s fi
scal
(acc
ount
ing
and
budg
et
info
rmat
ion
info
rmat
ion
on re
venu
es a
nd
expe
nditu
res
info
rmat
ion
on d
ebt)
cor
pora
te
soci
al p
rocu
rem
ent a
nd c
ontra
ctin
g
2010
Onl
ine
volu
ntar
y
OLS
and
ce
nsor
ed
regr
essi
on
mod
els
Popu
latio
n si
ze
Polit
ical
ideo
logy
G
over
nanc
e ty
pe
(pro
vinc
ial c
apita
l)
Tour
ist a
ctiv
ity
Polit
ical
ideo
logy
De A
rauacutej
o an
d Te
jedo
-R
omer
o (2
016)
109
mun
icip
aliti
es
TI S
pain
dis
clos
ure
inde
x in
clud
ing
80 in
dica
tors
gr
oupe
d in
to si
x tra
nspa
renc
y ar
eas
Five
are
as
used
alre
ady
by A
lbal
ate
(201
3) a
nd a
dditi
onal
ca
tego
ry o
n ur
ban
deve
lopm
entp
ublic
wor
ks
trans
pare
ncy
2012
Onl
ine
volu
ntar
y
OLS
and
IV
2SL
S re
gres
sion
an
alys
is
Vote
r tur
nout
Pol
itica
l id
eolo
gy P
oliti
cal
com
petit
ion
Este
ller-
Mor
eacute an
d Po
lo O
tero
(2
012)
691
Cat
alan
m
unic
ipal
ities
A d
icho
tom
ous v
aria
ble
mea
surin
g bu
dget
fisc
al
trans
pare
ncy
by lo
okin
g at
the
nine
bud
get
info
rmat
ion
bud
get a
ppro
val
final
bud
get
budg
et
bala
nce
clo
sed
settl
emen
t bud
gets
tre
asur
y st
atem
ent
treas
ury
surp
lus
net w
ealth
stat
emen
t in
com
e st
atem
ent a
nd in
debt
edne
ss T
hese
in
form
atio
ns a
re p
art o
f ann
ual a
ccou
nts t
hat
Cat
alan
loca
l gov
ernm
ents
hav
e to
del
iver
to th
e Pu
blic
Aud
it O
ffice
for C
atal
onia
2001
-200
7M
anda
tory
Logi
t reg
ress
ion
anal
ysis
Polit
ical
com
petit
ion
Po
pula
tion
size
(m
easu
ring
the
degr
ee
of d
ecen
traliz
atio
n)
br
an
ko sta
nić
deter
min
an
ts of su
bn
ation
al b
ud
getfisc
al tr
an
spar
enc
y a rev
iew o
f empir
ica
l evid
enc
epu
blic sec
tor
eco
no
mic
s42 (4) 449-486 (2018)
471a
utho
r(s)
sam
ple
dep
ende
nt v
aria
ble
type
of
disc
losu
rem
etho
d fo
r es
timat
ing
dete
rmin
ants
mai
n re
sults
(d
eter
min
ants
)m
easu
rem
ent
tim
e
peri
od
Caa
mantilde
o-A
legr
e et
al
(201
3)
33 G
alic
ian
mun
icip
aliti
es
Bud
get t
rans
pare
ncy
inde
x co
ntai
ning
info
rmat
ion
on th
e op
en b
udge
t pro
cess
pub
lic a
vaila
bilit
y of
in
form
atio
n an
d as
sura
nce
of in
tegr
ity
Que
stio
nnai
res a
re se
nt to
gov
ernm
ent o
ffici
als b
y us
ing
a Li
kert-
type
surv
ey q
uest
ionn
aire
bas
ed o
n th
e IM
Frsquos r
evis
ed C
ode
of G
ood
Prac
tices
on
Fisc
al
Tran
spar
ency
na
Proa
ctiv
eO
LS re
gres
sion
an
alyi
s
Deb
t per
cap
ita B
udge
t (im
)bal
ance
Rat
io o
f m
unic
ipal
pub
lic
expe
nditu
re to
GD
P
Polit
ical
com
petit
ion
Po
litic
al id
eolo
gy
Coa
litio
n in
cum
bent
Vo
ter t
urno
ut
Une
mpl
oym
ent r
ate
Gan
diacutea
et
al (
2016
)
145
Span
ish
loca
l go
vern
men
ts w
ith
mor
e th
an 5
000
0 in
habi
tant
s
Web
20
dis
clos
ure
inde
x c
onsi
sted
of
(1) a
n or
nam
enta
l dis
clos
ure
inde
x w
hich
con
tain
s ge
nera
l and
citi
zen
info
rmat
ion
(2) i
nfor
mat
ion
disc
losu
re in
dex
incl
udin
g th
e in
form
atio
n on
pu
blic
pro
cure
men
t ad
min
istra
tive
agre
emen
ts
gove
rnm
ent s
ubsi
dies
and
aid
sta
ff a
nd b
udge
t an
d fin
anci
al in
form
atio
n (3
) rel
atio
nal d
iscl
osur
e in
dex
whi
ch re
pres
ents
the
pres
enta
tion
na
viga
bilit
y an
d in
tera
ctio
n ab
ilitie
s of t
he w
eb
na
Onl
ine
volu
ntar
y
Mul
tivar
iate
re
gres
sion
an
alys
is
Leve
rage
Mun
icip
al
wea
lth P
oliti
cal
com
petit
ion
Pol
itica
l id
eolo
gy C
itize
ns
educ
atio
n S
ocia
l med
ia
use
Pre
ss v
isib
ility
In
tern
et v
isib
ility
De A
rauj
o an
d Te
jedo
-R
omer
o (2
017)
100
larg
est S
pani
sh
mun
icip
aliti
esTI
Spa
in d
iscl
osur
e in
dex
2008
-201
0
2012
201
4O
nlin
e vo
lunt
ary
Bal
ance
d pa
nel
data
regr
essi
on
anal
ysis
May
ors
gend
er
Wom
anrsquos
repr
esen
tatio
n in
mun
icip
al c
ounc
il
br
an
ko sta
nić
deter
min
an
ts of su
bn
ation
al b
ud
getfisc
al tr
an
spar
enc
y a rev
iew o
f empir
ica
l evid
enc
epu
blic sec
tor
eco
no
mic
s42 (4) 449-486 (2018)
472
aut
hor(
s)sa
mpl
ed
epen
dent
var
iabl
ety
pe o
f di
sclo
sure
met
hod
for
estim
atin
g de
term
inan
ts
mai
n re
sults
(d
eter
min
ants
)m
easu
rem
ent
tim
e
peri
odo
ther
cou
ntri
es
Lasw
ad e
t al
(20
05)
86 lo
cal g
over
nmen
ts
in N
ew Z
eala
nd
A d
icho
tom
ous v
aria
ble
indi
catin
g w
heth
er o
r not
th
e lo
cal a
utho
rity
publ
ishe
s fina
ncia
l inf
orm
atio
n on
the
web
It i
s con
side
red
that
loca
l aut
horit
y de
liver
s inf
orm
atio
n if
at le
ast o
ne o
f fou
r do
cum
ents
that
repr
esen
t vol
unta
ry in
tern
et
finan
cial
repo
rting
was
pub
lishe
d F
our d
ocum
ents
ar
e fi
nanc
ial h
ighl
ight
s an
nual
repo
rts a
nnua
l pl
an a
nd c
ombi
natio
ns o
f ann
ual r
epor
ts p
lans
an
d fin
anci
al h
ighl
ight
s
na
Onl
ine
volu
ntar
yM
ultiv
aria
te
logi
t reg
ress
ion
Leve
rage
Mun
icip
al
wea
lth P
ress
vis
ibili
ty
Type
of c
ounc
il
Gar
ciacutea-
Tabu
yo e
t al
(20
16)
40 la
rges
t m
unic
ipal
ities
in e
ach
of th
e fiv
e C
entra
l A
mer
ica
coun
tries
ndash
El S
alva
dor
Nic
arag
ua P
anam
a
Gua
tem
ala
and
Hon
dura
s
Inde
x of
man
dato
ry a
nd in
dex
of v
olun
tary
di
sclo
sure
bas
ed o
n 94
item
s gro
uped
into
four
tra
nspa
renc
y ca
tego
ries
mun
icip
al g
over
nmen
t re
latio
ns w
ith c
itize
ns a
nd so
ciet
y e
cono
mic
-fin
anci
al tr
ansp
aren
cy a
nd se
rvic
e-pr
ocur
emen
t tra
nspa
renc
y T
he ra
tio o
f vol
unta
ry a
nd le
gal
item
s diff
ers d
epen
ding
on
the
obse
rved
cou
ntry
Salv
ador
(2
010)
G
uate
mal
a (2
008)
H
ondu
ras
(200
6)
Nic
arag
ua
(200
7)
Pana
ma
(200
2)
Onl
ine
proa
ctiv
eTo
bit R
egre
ssio
n A
naly
sis
The
mat
urity
of t
he F
OI
law
(man
dato
ry
disc
losu
re)
Inte
rnet
ac
cess
Vot
er tu
rnou
t (v
olun
tary
dis
clos
ure)
Zucc
olot
to
and
Teix
eira
(2
014)
26 B
razi
lian
stat
es
Stat
e tra
nspa
renc
y in
dex
deve
lope
d by
Bid
erm
an
and
Potto
mat
ti (2
010)
con
sist
ing
of th
ree
para
met
ers
con
tent
tim
e se
ries a
nd u
pdat
e fr
eque
ncy
and
usa
bilit
y
2010
Onl
ine
proa
ctiv
e
Mul
tiple
line
ar
regr
essi
on
anal
ysis
Soci
oeco
nom
ic fa
ctor
s
educ
atio
n e
mpl
oym
ent
and
inco
me
and
hea
lth
indi
cato
rs F
isca
l fa
ctor
s
br
an
ko sta
nić
deter
min
an
ts of su
bn
ation
al b
ud
getfisc
al tr
an
spar
enc
y a rev
iew o
f empir
ica
l evid
enc
epu
blic sec
tor
eco
no
mic
s42 (4) 449-486 (2018)
473a
utho
r(s)
sam
ple
dep
ende
nt v
aria
ble
type
of
disc
losu
rem
etho
d fo
r es
timat
ing
dete
rmin
ants
mai
n re
sults
(d
eter
min
ants
)m
easu
rem
ent
tim
e
peri
od
Ma
and
Wu
(201
1)31
Chi
nese
pro
vinc
es
Dis
clos
ure
inde
x ba
sed
on re
spos
iven
ess a
nd
info
rmat
ion
com
plet
enes
s as t
wo
basi
c di
men
sion
s It
is m
easu
red
by g
over
nmen
ts r
espo
nses
to 1
13
open
fisc
al in
form
atio
n re
ques
ts o
f citi
zens
in
clud
ing
66 it
ems f
or g
over
nmen
t acc
ount
s 30
ite
ms f
or so
cial
secu
rity
acco
unts
and
17
item
s for
st
ate
owne
d en
terp
rises
acc
ount
s
2008
-200
9R
eact
ive
Seem
ingl
y U
nrel
ated
R
egre
ssio
ns
(SU
R) m
odel
w
ith ra
ndom
ef
fect
s
Econ
omic
ope
nnes
s
Mar
ketiz
atio
n B
udge
t (im
)bal
ance
In
cum
bent
s te
nure
Ges
uele
et
al (
2017
)
287
mun
icip
aliti
es
142
Italia
n an
d 14
5 Sp
anis
h m
unic
ipal
ities
Two
inde
xes
(a) e
-dis
clos
ure
web
site
inde
x w
hich
m
easu
res i
nter
actio
n le
vel a
mon
g ci
tizen
s and
m
unic
ipal
ities
usi
ng o
ffici
al o
r man
dato
ry
disc
losu
re c
hann
el b
y lo
okin
g fo
r the
13
item
s in
clud
ing
the
publ
icat
ion
of fi
nanc
ial s
tate
men
ts
from
the
mun
icip
ality
and
from
the
cont
rolle
d co
mpa
ny a
nd m
unic
ipal
ities
ass
ets a
nd re
venu
es
(b) s
ocia
l med
ia u
sage
inde
x w
hich
mea
sure
s the
vo
lunt
ary
disc
losu
re v
ia so
cial
med
ia su
ch a
s Fa
cebo
ok a
nd T
witt
er
2013
Onl
ine
proa
ctiv
e
Tobi
t reg
ress
ion
(ste
pwis
e ap
proa
ch)
Leve
rage
Int
erne
t vi
sibi
lity
Citi
zens
w
ealth
(mea
sure
d by
ec
onom
ic a
ctiv
ity p
er
capi
ta)
Tava
res a
nd
da C
ruz
(201
7)
278
Portu
gues
e m
unic
ipal
ities
TI P
ortu
gal d
iscl
osur
e in
dex
con
sist
ing
of 7
6 in
dica
tors
gro
uped
into
the
seve
n di
men
sion
s
(1) O
rgan
izat
iona
l inf
orm
atio
n so
cial
com
posi
tion
and
oper
atio
n of
the
mun
icip
ality
(2)
Pla
ns a
nd
plan
ning
(3)
Loc
al ta
xes
rate
s se
rvic
e ch
arge
s an
d re
gula
tions
(4)
Rel
atio
nshi
p w
ith c
itize
ns
(5) P
ublic
pro
cure
men
t (6
) Eco
nom
ic a
nd fi
nanc
ial
trans
pare
ncy
and
(7) U
rban
pla
nnin
g an
d la
nd
use
man
agem
ent
2013
Onl
ine
proa
ctiv
eO
LS re
gres
sion
s
Fina
ncia
l aut
onom
y
May
ors
gend
er T
enur
e
Polit
ical
com
petit
ion
U
nem
ploy
men
t rat
e
Popu
latio
n ag
e
Sour
ce A
utho
r
br
an
ko sta
nić
deter
min
an
ts of su
bn
ation
al b
ud
getfisc
al tr
an
spar
enc
y a rev
iew o
f empir
ica
l evid
enc
epu
blic sec
tor
eco
no
mic
s42 (4) 449-486 (2018)
474
Ta
bl
e a
2Fi
nanc
ial v
aria
bles
Vari
able
na
me
Vari
able
m
easu
rem
ent
cor
rela
tion
of d
eter
min
ants
Posi
tive
neg
ativ
eN
on-s
igni
fican
tM
unic
ipal
si
zeAv
erag
e to
tal a
sset
s a
vera
ge to
tal r
even
ues
ndashndash
Lasw
ad e
t al
200
5B
udge
t rev
enue
sSe
rran
o-C
inca
et a
l 2
009
ndashndash
Leve
rage
Rat
io o
f lon
g-te
rm li
abili
ties t
o to
tal a
sset
s ra
tio
of lo
ng-te
rm li
abili
ties t
o to
tal p
ublic
equ
ityLa
swad
et a
l 2
005
ndashndash
Tota
l exe
cute
d ex
pens
es p
er c
apita
Gan
diacutea
et a
l 2
016
ndashG
andiacute
a an
d A
rchi
dona
200
8
The
leve
l of l
ever
age
(not
spec
ified
)G
esue
le e
t al
201
7ndash
ndash
Gov
ern-
men
trsquos
wea
lth
Mun
icip
ality
rsquos o
wn
reve
nue
per c
apita
Gan
diacutea
et a
l 2
016
La
swad
et a
l 2
005
ndashG
andiacute
a an
d A
rchi
dona
200
8
Bud
get r
even
ue p
er c
apita
ndashndash
Ma
and
Wu
201
1Ta
x re
venu
es p
er c
apita
Gui
llam
oacuten e
t al
201
1ndash
Caa
mantilde
o-A
legr
e et
al
201
3
GD
P pe
r cap
itandash
ndashM
a an
d W
u 2
011
(pos
itive
for c
ompl
eten
ess
but i
nsig
nific
ant f
or p
rovi
sion
of i
nfor
mat
ion)
Dic
hoto
mou
s var
iabl
e (1
if th
e ci
ty h
all h
as
mun
icip
al b
onds
in c
ircul
atio
n)ndash
ndashSe
rran
o-C
inca
et a
l 2
009
Deb
t
Perc
enta
ge o
f deb
t in
tota
l bud
get
ndashndash
del S
ol 2
013
Publ
ic d
ebt p
er c
apita
Caa
mantilde
o-A
legr
e et
al
201
3
De A
rauacutej
o an
d Te
jedo
-R
omer
o 2
017
Sty
les a
nd
Tenn
yson
200
7
Alt
et a
l
2006
De A
rauacutej
o an
d Te
jedo
-Rom
ero
201
6
Gui
llam
oacuten e
t al
201
1
Fund
ing
cost
s of t
he c
urre
nt y
ear b
udge
t exp
endi
ture
pe
r cap
itaC
aba-
Peacutere
z et
al
200
8ndash
ndash
Inte
rgov
ern-
men
tal
trans
fers
Rat
io o
f tot
al tr
ansf
ers t
o th
e to
tal a
mou
nt o
f non
-fin
anci
al re
venu
es T
hey
have
als
o ob
serv
ed c
urre
nt
and
capi
tal t
rans
fers
sepa
rate
lyndash
ndashEs
telle
r-Mor
eacute an
d Po
lo O
tero
201
2
Reg
iona
l and
cen
tral t
rans
fers
per
cap
itaG
uilla
moacuten
et a
l 2
011
ndashndash
Tota
l cur
rent
and
cap
ital t
rans
fers
ndash
ndashC
aba-
Peacutere
z et
al
200
8
br
an
ko sta
nić
deter
min
an
ts of su
bn
ation
al b
ud
getfisc
al tr
an
spar
enc
y a rev
iew o
f empir
ica
l evid
enc
epu
blic sec
tor
eco
no
mic
s42 (4) 449-486 (2018)
475Va
riab
le
nam
eVa
riab
le
mea
sure
men
tc
orre
latio
n of
det
erm
inan
tsPo
sitiv
en
egat
ive
Non
-sig
nific
ant
Bud
get
im(b
alan
ce)
Fisc
al im
bala
nce
ie
hig
her s
urpl
uses
and
defi
cits
Alt
et a
l 2
006
ndashndash
Bud
get b
alan
ce p
er c
apita
(low
erin
g de
ficit)
Caa
mantilde
o-A
legr
e et
al
201
3ndash
ndashB
udge
t defi
cit
natu
ral l
ogar
ithm
Ma
and
Wu
201
1ndash
ndash
Defi
cit p
er c
apita
ndashndash
Este
ller-M
oreacute
and
Polo
Ote
ro 2
012
G
uilla
moacuten
et a
l 2
011
Defi
cit o
r sur
plus
as a
per
cent
age
of to
tal b
udge
tndash
ndashde
l Sol
201
3
Oth
er
finan
cial
va
riabl
es
Inve
stm
ent p
c ta
x bu
rden
pc
ratio
of t
he ta
x re
venu
es
to o
pera
ting
reve
nues
rat
io o
f fina
ncia
l to
tota
l ex
pens
es r
atio
of o
pera
ting
to to
tal e
xpen
ses
ndashndash
Serr
ano-
Cin
ca e
t al
200
9
Cap
ital i
nves
tmen
t per
cap
itaD
e Ara
uacutejo
and
Teje
do-
Rom
ero
201
6ndash
ndash
Fisc
al p
ress
ure
mea
sure
d by
per
cap
ita ta
x an
d no
n-ta
x re
venu
e a
nd th
e sa
le o
f goo
ds a
nd se
rvic
es o
f the
pu
blic
adm
inis
tratio
nsndash
ndashC
aba-
Peacutere
z et
al
200
8
Fisc
al p
ress
ure
mea
sure
d by
tota
l dire
ct a
nd in
dire
ct
taxe
s per
cap
itaD
e Ara
uacutejo
and
Teje
do-
Rom
ero
201
7ndash
ndash
Inde
x of
fina
ncia
l aut
onom
y (d
eriv
ed fr
om ta
xes
and
fees
)
Ges
uele
et a
l 2
017
(sig
nific
ant i
n on
e of
thre
e m
odel
s)ndash
ndash
Fina
ncia
l pos
ition
mea
sure
d by
the
ratio
of p
rimar
y go
vern
men
trsquos u
nres
trict
ed n
et a
sset
s to
tota
l exp
ense
sSt
yles
and
Ten
nyso
n 2
007
ndashndash
Fina
ncia
l aut
onom
y (p
ropo
rtion
of l
ocal
taxe
s fe
es a
nd
othe
r cha
rges
)Ta
vare
s and
da
Cru
z 2
017
ndashndash
Rat
io o
f mun
icip
al p
ublic
exp
endi
ture
to G
DP
Caa
mantilde
o-A
legr
e et
al
201
3 ndash
ndashM
unic
ipal
ities
with
a c
ertifi
cate
of a
chie
vem
ent f
or
exce
llenc
e in
acc
ount
ing
repo
rting
Styl
es a
nd T
enny
son
200
7ndash
ndash
Sour
ce A
utho
r
br
an
ko sta
nić
deter
min
an
ts of su
bn
ation
al b
ud
getfisc
al tr
an
spar
enc
y a rev
iew o
f empir
ica
l evid
enc
epu
blic sec
tor
eco
no
mic
s42 (4) 449-486 (2018)
476
Ta
bl
e a
3 Po
litic
al v
aria
bles
Vari
able
na
me
Vari
able
m
easu
rem
ent
cor
rela
tion
of d
eter
min
ants
Posi
tive
neg
ativ
eN
on-s
igni
fican
t
Polit
ical
co
mpe
titio
n
(a) D
ivid
ed g
over
nmen
t ndash d
icho
tom
ous v
aria
ble
taki
ng th
e va
lue
1 if
diffe
rent
par
ties c
ontro
l the
ex
ecut
ive
and
legi
slat
ure
0 o
ther
wis
e
(b) G
uber
nato
rial c
ompe
titio
n m
easu
red
by th
e sh
are
of D
emoc
ratic
vot
es in
the
gube
rnat
oria
l ele
ctio
n
capt
urin
g ab
solu
te d
evia
tians
from
one
hal
f (c
) Leg
isla
tive
com
petit
ion
ndash D
emoc
ratic
seat
shar
es
in th
e up
per a
nd lo
wer
hou
ses
ndashA
lt et
al
200
6ndash
Rat
io o
f can
dida
tes t
o co
unci
l pos
ition
s ava
ilabl
endash
ndashLa
swad
et a
l 2
005
Num
ber o
f pol
itica
l par
ties i
n th
e ci
ty c
ounc
ilndash
ndashG
andiacute
a an
d A
rchi
dona
200
8D
icho
tom
ic v
aria
ble
1 if
city
cou
ncil
is g
over
ned
by
one
of t
he m
ajor
ity p
oliti
cal p
artie
s in
the
coun
tryG
andiacute
a an
d A
rchi
dona
200
8G
andiacute
a et
al
201
6ndash
Rat
io o
f can
dida
tes t
o co
unci
llors
ele
cted
ndashndash
Serr
ano-
Cin
ca e
t al
200
9R
atio
of c
ounc
illor
s ele
cted
for t
he p
arty
in p
ower
to
the
tota
l num
ber o
f ele
cted
cou
ncill
ors
ndashndash
Cab
a-Peacute
rez
et a
l 2
008
Mea
sure
of d
ispe
rsio
n i
e th
e st
anda
rd d
evia
tion
of
the
perc
enta
ge o
f vot
es re
ceiv
ed b
y ea
ch p
oliti
cal
party
(the
gre
ater
the
disp
ersi
on o
f vot
es a
mon
g po
litic
al p
artie
s th
e sm
alle
r the
ele
ctor
al c
ompe
titio
n)
Este
ller-M
oreacute
and
Polo
O
tero
201
2 (n
on-s
igni
fican
t fo
r big
mun
icip
aliti
es)
ndashC
aba-
Peacutere
z et
al
200
8
Effe
ctiv
e nu
mbe
r of p
oliti
cal p
artie
s ac
cord
ing
to
Laak
so a
nd T
aaga
pera
rsquos (1
979)
cal
cula
tion
Caa
mantilde
o-A
legr
e et
al
201
3ndash
ndash
Mar
gin
of v
icto
ry m
easu
red
by th
e di
ffere
nce
betw
een
the
perc
enta
ge o
f vot
es o
btai
ned
by th
e pa
rties
com
ing
in fi
rst a
nd se
cond
pla
ce T
he lo
wer
th
e di
ffere
nce
the
high
er th
e el
ecto
ral c
ompe
titio
n
Tava
res a
nd d
a C
ruz
201
7D
e Ara
uacutejo
and
Teje
do-R
omer
o
2016
De A
rauacutej
o an
d Te
jedo
-Rom
ero
20
17
br
an
ko sta
nić
deter
min
an
ts of su
bn
ation
al b
ud
getfisc
al tr
an
spar
enc
y a rev
iew o
f empir
ica
l evid
enc
epu
blic sec
tor
eco
no
mic
s42 (4) 449-486 (2018)
477Va
riab
le
nam
eVa
riab
le
mea
sure
men
tc
orre
latio
n of
det
erm
inan
tsPo
sitiv
en
egat
ive
Non
-sig
nific
ant
Polit
ical
id
eolo
gy
Polit
ical
orie
ntat
ion
of th
e m
unic
ipal
maj
ority
an
dor
may
orndash
ndash
Este
ller-M
oreacute
and
Polo
Ote
ro 2
012
G
arciacute
a-Ta
buyo
et a
l 2
016
Ges
uele
et
al
201
7 S
erra
no-C
inca
et a
l
2009
Tav
ares
and
da
Cru
z 2
017
1 if
left-
win
g m
unic
ipal
maj
ority
Gan
diacutea
et a
l 2
016
G
uilla
moacuten
et a
l 2
011
ndashndash
1 if
left
incu
mbe
ntC
aam
antildeo-
Ale
gre
et a
l
2013
del
Sol
201
3
De A
rauacutej
o an
d Te
jedo
-Rom
ero
20
16 2
017
ndash
Exec
utiv
e
May
orrsquos
gen
der (
1 if
fem
ale)
De A
rauacutej
o an
d Te
jedo
-R
omer
o 2
017
Tav
ares
an
d da
Cru
z 2
017
Ges
uele
et a
l 2
017
(sig
nific
ant i
n on
e of
th
ree
mod
els)
De A
rauacutej
o an
d Te
jedo
-Rom
ero
20
16 G
uilla
moacuten
et a
l 2
011
1 in
the
case
of c
oalit
ion
incu
mbe
nts
ndashC
aam
antildeo-
Ale
gre
et a
l 2
013
ndash
May
orrsquos
age
and
edu
catio
nndash
ndashTa
vare
s and
da
Cru
z 2
017
Num
ber o
f inc
umbe
ntrsquos
con
secu
tive
term
sM
a an
d W
u 2
011
Tava
res a
nd d
a C
ruz
20
17ndash
Gov
erna
nce
type
1 di
stric
t cou
ncils
0 re
gion
al o
r city
cou
ncils
ndashLa
swad
et a
l 2
005
ndash1
prov
inci
al c
apita
ls
ndashde
l Sol
201
3ndash
Form
of g
over
nmen
t (1
coun
cil-m
anag
er 0
co
mm
issi
on a
nd c
ounc
il-el
ecte
d ex
ecut
ive)
Low
atch
arin
and
Men
ifiel
d
2015
ndashndash
1 ci
ty-m
anag
er g
over
nanc
e st
ruct
ure
ndashndash
Styl
es a
nd T
enny
son
200
7
Vote
r tu
rnou
tPe
rcen
tage
of c
itize
n pa
rtici
patio
n in
loca
l ele
ctio
ns
Caa
mantilde
o-A
legr
e et
al
20
13 D
e Ara
uacutejo
and
Te
jedo
-Rom
ero
201
7 (s
impl
ified
mod
el)
Gar
ciacutea-
Tabu
yo e
t al
20
16 (v
olun
tary
di
sclo
sure
) D
e A
rauacutej
o an
d Te
jedo
-R
omer
o 2
016
De
Ara
uacutejo
and
Teje
do-
Rom
ero
201
7 (e
xten
sive
mod
els)
Gar
ciacutea-
Tabu
yo e
t al
201
6 (m
anda
tory
dis
clos
ure)
del
Sol
20
13 G
uilla
moacuten
et a
l 2
011
Se
rran
o-C
inca
et a
l 2
009
Ta
vare
s and
da
Cru
z 2
017
br
an
ko sta
nić
deter
min
an
ts of su
bn
ation
al b
ud
getfisc
al tr
an
spar
enc
y a rev
iew o
f empir
ica
l evid
enc
epu
blic sec
tor
eco
no
mic
s42 (4) 449-486 (2018)
478
Vari
able
na
me
Vari
able
m
easu
rem
ent
cor
rela
tion
of d
eter
min
ants
Posi
tive
neg
ativ
eN
on-s
igni
fican
t
Vote
r tu
rnou
tVo
ter a
bste
ntio
n re
pres
entin
g th
e pe
rcen
tage
of
popu
latio
n w
ho d
id n
ot v
ote
ndashEs
telle
r-Mor
eacute an
d Po
lo O
tero
201
2
(big
mun
icip
aliti
es)
Este
ller-M
oreacute
and
Polo
Ote
ro 2
012
(who
le sa
mpl
e an
d sm
all
mun
icip
aliti
es)
E-go
vern
-m
ent
achi
eve-
men
ts
Num
ber o
f e-d
emoc
racy
act
ions
impl
emen
ted
Serr
ano-
Cin
ca e
t al
200
9ndash
ndashE-
gove
rnm
ent d
evel
opm
ent
mea
sure
d by
the
scor
e in
op
en in
form
atio
n o
nlin
e bu
sine
ss u
ser s
atis
fact
ion
pr
oper
ties a
nd d
esig
n a
nd d
aily
ope
ratio
nndash
ndashndash
Inst
itutio
nal c
apac
ity v
aria
ble
mea
sure
d by
Ope
n G
over
nmen
t Inf
orm
atio
n (O
GI)
ndash
ndashM
a an
d W
u 2
011
(pos
itive
for
fisca
l com
plet
enes
s)M
unic
ipal
IT c
apac
ity m
easu
red
by th
e nu
mbe
r of I
T em
ploy
ees
ndashndash
Tava
res a
nd d
a C
ruz
201
7
Oth
er
polit
ical
va
riabl
es
Cou
ntie
s with
app
oint
ed c
ount
y m
anag
ers
size
of
coun
ty b
oard
cou
ntie
s req
uire
d to
subm
it an
aud
it to
th
e fe
dera
l gov
ernm
ent
Ber
nick
et a
l 2
014
ndashndash
Polit
ical
pol
ariz
atio
n (f
or m
easu
rem
ent s
ee H
anss
en
2004
)A
lt et
al
200
6ndash
ndash
Two-
party
and
mul
ti-pa
rty c
oalit
ion
in th
e ci
ty
coun
cil
ndashndash
Serr
ano-
Cin
ca e
t al
200
9
Wom
anrsquos
repr
esen
tatio
n in
mun
icip
al c
ounc
il
mea
sure
d as
a p
erce
ntag
e of
fem
ale
mem
bers
in
mun
icip
al c
ounc
il
De A
rauacutej
o an
d Te
jedo
-R
omer
o 2
017
ndashndash
1 if
incu
mbe
ntrsquos
par
ty d
oes n
ot h
old
a m
ajor
ity
of se
ats i
n th
e co
unci
lndash
ndashTa
vare
s and
da
Cru
z 2
017
The
mat
urity
of t
he F
OI l
aw i
e h
ow lo
ng h
as it
bee
n in
forc
e n
umbe
r of s
anct
ions
stip
ulat
ed in
the
FOI l
awndash
Gar
ciacutea-
Tabu
yo e
t al
20
16 (m
anda
tory
di
sclo
sure
)ndash
Sour
ce A
utho
r
br
an
ko sta
nić
deter
min
an
ts of su
bn
ation
al b
ud
getfisc
al tr
an
spar
enc
y a rev
iew o
f empir
ica
l evid
enc
epu
blic sec
tor
eco
no
mic
s42 (4) 449-486 (2018)
479T
ab
le a
4 C
itize
ns a
nd th
e m
edia
Vari
able
na
me
Vari
able
m
easu
rem
ent
cor
rela
tion
of d
eter
min
ants
Posi
tive
neg
ativ
eN
on-s
igni
fican
t
Popu
latio
nN
umbe
r of i
nhab
itant
s
De A
rauacutej
o an
d Te
jedo
-Rom
ero
20
16 d
el S
ol 2
013
Gui
llam
oacuten
et a
l 2
011
Ser
rano
-Cin
ca e
t al
20
09 S
tyle
s and
Ten
nyso
n 2
007
Este
ller-M
oreacute
and
Polo
O
tero
201
2 (n
on-li
near
re
latio
nshi
p)
Caa
mantilde
o-A
legr
e et
al
201
3
Cab
a-Peacute
rez
et a
l 2
008
Gan
diacutea
and
Arc
hido
na 2
008
Gar
ciacutea-
Tabu
yo e
t al
20
16 T
avar
es a
nd d
a C
ruz
201
7Po
pula
tion
dens
ity m
easu
red
in p
erso
ns
per s
quar
e m
ileLo
wat
char
in a
nd M
enifi
eld
201
5ndash
ndash
Inte
rnet
ac
cess
Perc
enta
ge o
f hou
seho
lds w
ith h
ome
inte
rnet
acc
ess
Gan
diacutea
and
Arc
hido
na 2
008
(bud
get d
iscl
osur
e) C
aba-
Peacutere
z et
al
200
8 D
e Ara
uacutejo
and
Teje
do-R
omer
o 2
017
ndashG
andiacute
a an
d A
rchi
dona
200
8
(fina
ncia
l dis
clos
ure)
Fixe
d in
tern
et a
cces
s con
nect
ions
ove
r 200
ki
lobi
ts p
er se
cond
in a
t lea
st o
ne d
irect
ion
per 1
000
hou
seho
lds
Low
atch
arin
and
Men
ifiel
d 2
015
(sim
ples
t mod
el)
ndashLo
wat
char
in a
nd M
enifi
eld
201
5
(mos
t ext
ensi
ve m
odel
s)
Inte
rnet
pen
etra
tion
as a
mea
sure
for t
he
deve
lopm
ent o
f IC
T in
fras
truct
ure
Gar
ciacutea-
Tabu
yo e
t al
201
6 (m
anda
tory
dis
clos
ure)
Gar
ciacutea-
Tabu
yo e
t al
20
16 (v
olun
tary
di
sclo
sure
)ndash
Perc
enta
ge o
f net
izen
sndash
ndashM
a an
d W
u 2
011
Citi
zens
rsquo ch
arac
teris
-tic
s
Citi
zen
educ
atio
n at
tain
men
t
Gan
diacutea
and
Arc
hido
na 2
008
(bud
get d
iscl
osur
e) G
andiacute
a et
al
20
16 L
owat
char
in a
nd
Men
ifiel
d 2
015
ndash
Gan
diacutea
and
Arc
hido
na 2
008
(fina
ncia
l di
sclo
sure
) C
aba-
Peacutere
z et
al
200
8
De A
rauacutej
o an
d Te
jedo
-Rom
ero
201
7
Ma
and
Wu
201
1 S
erra
no-C
inca
et a
l
2009
Tav
ares
and
da
Cru
z 2
017
Citi
zens
rsquo age
mea
sure
d by
the
perc
enta
ge
of th
e po
pula
tion
aged
65
and
over
Este
ller-M
oreacute
and
Polo
Ote
ro
2012
(who
le sa
mpl
e an
d bi
g m
unic
ipal
ities
) de
l Sol
201
3ndash
Este
ller-M
oreacute
and
Polo
Ote
ro 2
012
(sm
all m
unic
ipal
ities
)
Ma
and
Wu
201
1
br
an
ko sta
nić
deter
min
an
ts of su
bn
ation
al b
ud
getfisc
al tr
an
spar
enc
y a rev
iew o
f empir
ica
l evid
enc
epu
blic sec
tor
eco
no
mic
s42 (4) 449-486 (2018)
480
Vari
able
na
me
Vari
able
m
easu
rem
ent
cor
rela
tion
of d
eter
min
ants
Posi
tive
neg
ativ
eN
on-s
igni
fican
t
Citi
zens
rsquo ch
arac
teris
-tic
s
Citi
zens
rsquo age
mea
sure
d by
the
aver
age
age
of th
e m
unic
ipal
pop
ulat
ion
ndashTa
vare
s and
da
Cru
z
2017
ndash
Citi
zens
rsquo age
mea
sure
d by
the
med
ian
age
of p
opul
atio
nndash
ndashLo
wat
char
in a
nd M
enifi
eld
201
5
Gen
der
mea
sure
d by
the
perc
enta
ge o
f m
en o
ver t
he to
tal l
ocal
pop
ulat
ion
ndashndash
del S
ol 2
013
Citi
zens
rsquo w
ealth
Dis
posa
ble
fam
ily in
com
e pe
r inh
abita
ntSe
rran
o-C
inca
et a
l 2
009
ndashndash
Pers
onal
inco
me
per c
apita
Low
atch
arin
and
Men
ifiel
d
2015
Sty
les a
nd T
enny
son
200
7ndash
Low
atch
arin
and
Men
ifiel
d 2
015
(a
fter c
ontro
lling
for s
tate
effe
cts)
G
uilla
moacuten
et a
l 2
011
Perc
enta
ge o
f pop
ulat
ion
belo
w th
e po
verty
leve
lndash
ndashLo
wat
char
in a
nd M
enifi
eld
201
5
The
valu
e of
eco
nom
ic a
ctiv
ity p
er c
apita
Ges
uele
et a
l 2
017
ndashde
l Sol
201
3Pu
rcha
se p
ower
inde
xndash
ndashTa
vare
s and
da
Cru
z 2
017
Une
mpl
oy-
men
tU
nem
ploy
men
t rat
eD
e Ara
uacutejo
and
Teje
do-R
omer
o
2017
Caa
mantilde
o-A
legr
e et
al
20
13 D
e Ara
uacutejo
and
Teje
do-R
omer
o 2
016
de
l Sol
201
3 T
avar
es
and
da C
ruz
201
7
ndash
Med
ia
Hav
ing
Twitt
er a
ndo
r Fac
eboo
k ac
coun
tsndash
ndashG
andiacute
a et
al
201
6In
tens
ity o
f use
of s
ocia
l med
ia m
easu
red
by th
e nu
mbe
r of t
wee
tsG
andiacute
a et
al
201
6ndash
ndash
Inte
nsity
of u
se o
f soc
ial m
edia
mea
sure
d by
the
Face
book
like
sndash
ndashG
andiacute
a et
al
201
6
br
an
ko sta
nić
deter
min
an
ts of su
bn
ation
al b
ud
getfisc
al tr
an
spar
enc
y a rev
iew o
f empir
ica
l evid
enc
epu
blic sec
tor
eco
no
mic
s42 (4) 449-486 (2018)
481Va
riab
le
nam
eVa
riab
le
mea
sure
men
tc
orre
latio
n of
det
erm
inan
tsPo
sitiv
en
egat
ive
Non
-sig
nific
ant
Med
ia
Pres
s vis
ibili
tyG
andiacute
a an
d A
rchi
dona
200
8
Gan
diacutea
et a
l 2
016
Las
wad
et
al
200
5ndash
Ges
uele
et a
l 2
017
Inte
rnet
vis
ibili
tyG
andiacute
a an
d A
rchi
dona
200
8
Gan
diacutea
et a
l 2
016
Ges
uele
et
al
201
7ndash
Serr
ano-
Cin
ca e
t al
200
9
Oth
er
varia
bles
Deg
ree
of c
omm
unity
invo
lvem
ent
mea
sure
d by
the
num
ber o
f civ
ic
asso
ciat
ions
div
ided
by
the
num
ber
of in
habi
tans
ndashndash
Serr
ano-
Cin
ca e
t al
200
9
Tota
l lan
d ar
eaLo
wat
char
in a
nd M
enifi
eld
201
5 (m
ost e
xten
sive
mod
el)
ndashndash
Perc
enta
ge o
f pop
ulat
ion
chan
ge o
ver
the
year
sLo
wat
char
in a
nd M
enifi
eld
201
5 (m
ore
sim
plifi
ed m
odel
s)ndash
ndash
Min
ority
mea
sure
d by
the
perc
enta
ge
of n
onw
hite
pop
ulat
ion
Low
atch
arin
and
Men
ifiel
d 2
015
ndashndash
Inde
x of
tour
ist a
ctiv
ity p
er c
apita
ndashde
l Sol
201
3-
Sour
ce A
utho
r
br
an
ko sta
nić
deter
min
an
ts of su
bn
ation
al b
ud
getfisc
al tr
an
spar
enc
y a rev
iew o
f empir
ica
l evid
enc
epu
blic sec
tor
eco
no
mic
s42 (4) 449-486 (2018)
482 references1 Alt J E Lassen D D and Rose S 2006 The causes of fiscal transparency
evidence from the US states IMF Staff Papers 53(Spcial Issue) Available at lthttpswwwimforgExternalPubsFTstaffp200603pdfaltpdfgt
2 Alt J E Lassen D D and Skilling D 2002 Fiscal Transparency Guberna-torial Approval and the Scale of Government Evidence from the States State Politics amp Policy Quarterly 2(3) pp 230-250 httpsdoiorg101177 153244000200200302
3 Andreula N Chong A and Guillen J B 2009 Institutional Quality and Fiscal Transparency IDB Working Paper No 36 httpdxdoiorg102139ssrn1817228
4 Bakar N B A and Saleh Z 2015 Review of literature on factors influenc-ing public sector disclosure The way forward Asian Journal of Business and Accounting 8(2) pp 155-184
5 Berliner D 2014 The political origins of transparency Journal of Politics 76(2) pp 479-491 httpsdoiorg101017S0022381613001412
6 Berliner D and Erlich A 2015 Competing for Transparency Political Com-petition and Institutional Reform in Mexican States American Political Sci-ence Review 109(1) pp 110-128 httpsdoiorg101017S0003055414000616
7 Bernardi R A and Arnold D F 1997 An Examination of Moral Develop-ment within Public Accounting by Gender Staff Level and Firm Contempo-rary Accounting Research 14(4) pp 653-668 httpsdoiorg101111j1911- 38461997tb00545x
8 Bernick E L [et al] 2014 Explaining County Government Fiscal Transpar-ency in an Age of e-Government State and Local Government Review 46(3) pp 173-183 httpsdoiorg1011770160323X14556819
9 Biderman C and Pottomatti G 2010 Metodologia para construccedilatildeo de iacutendice de transparecircncia Indice de transparencia Available at lthttpindicedetrans-parenciacommetodologiagt
10 Caamantildeo-Alegre J [et al] 2013 Budget Transparency in Local Govern-ments An Empirical Analysis Local Government Studies 39(2) pp 182-207 httpsdoiorg101080030039302012693075
11 Caba-Peacuterez C Rodriacuteguez Boliacutevar M P and Loacutepez Hernaacutendez A M 2008 e-Government process and initiatives for online public financial information Online Information Review 32(3) pp 379-400 httpsdoiorg101108JFM-03-2013-0017
12 Caba Peacuterez M del C Rodriacuteguez Boliacutevar M P and Loacutepez Hernaacutendez A M 2014 The determinants of government financial reports online Transylvanian Review of Administrative Sciences (42) pp 5-31 Available at lthttpwwwrtsarotrasindexphptrasarticledownload1513gt
13 Cuadrado-Ballesteros B [et al] 2017 The Role of Media Pressure in Pro-moting Transparency of Local Governments Transylvanian Review of Admin-istrative Sciences 2017(51E) pp 20-37 httpsdoiorg1024193tras51E2
br
an
ko sta
nić
deter
min
an
ts of su
bn
ation
al b
ud
getfisc
al tr
an
spar
enc
y a rev
iew o
f empir
ica
l evid
enc
epu
blic sec
tor
eco
no
mic
s42 (4) 449-486 (2018)
48314 Darbishire H 2010 Proactive Transparency The future of the right to infor-mation World Bank Institute Working Paper No 60 httpsdoiorg 10159625031
15 De Arauacutejo J F F E and Tejedo-Romero F 2016 Local government trans-parency index determinants of municipalitiesrsquo rankings International Jour-nal of Public Sector Management 29(4) pp 327-347 httpdxdoiorg101108MRR-09-2015-0216
16 De Arauacutejo J F F E and Tejedo-Romero F 2017 Does Gender Equality Affect Municipal Transparency The Case of Spain Public Performance and Management Review 41(1) pp 69-99 httpsdoiorg1010801530957620171362350
17 Debreceny R Gray G L and Rahman A 2002 The determinants of inter-net financial reporting Journal of Accounting and Public Policy 21(4-5) pp 371-394 httpsdoiorg101016S0278-4254(02)00067-4
18 del Sol D A 2013 The institutional economic and social determinants of local government transparency Journal of Economic Policy Reform 16(1) pp 90-107 httpsdoiorg101080174878702012759422
19 Esteller-Moreacute A and Polo Otero J 2012 Fiscal Transparency (Why) does your local government respond Public Management Review 14(8) pp 1153-1173 httpsdoiorg101080147190372012657839
20 Evans J H and Patton J M 1987 Signaling and Monitoring in Public-Sector Accounting Journal of Accounting Research 25 pp 130-158 httpsdoiorg1023072491083
21 Ferejohn J 1986 Incumbent performance and electoral control Public Choice 50 pp 5-25 httpsdoiorg101007BF00124924
22 Fox J 2007 The uncertain relationship between transparency and account-ability Development in Practice 17(4-5) pp 663-671 httpsdoiorg 10108009614520701469955
23 Fox R L and Schuhmann R A 1999 Gender and Local Government A Comparison of Women and Men City Managers Public Administration Review 59(3) pp 231-242 httpsdoiorg1023073109951
24 Gandiacutea J L and Archidona M C 2008 Determinants of web site informa-tion by Spanish city councils Online Information Review 32(1) pp 35-57 httpsdoiorg10110814684520810865976
25 Gandiacutea J L Marrahiacute L and Huguet D 2016 Digital transparency and Web 20 in Spanish city councils Government Information Quarterly 33(1) pp 28-39 httpsdoiorg101016jgiq201512004
26 Garciacutea-Tabuyo M Saacuteez-Martiacuten A and Caba-Peacuterez M D C 2016 Manda-tory versus voluntary disclosures Drivers of proactive information provision by local governments in Central America Information Development 32(4) pp 1199-1215 httpsdoiorg1011770266666915595260
27 Garciacutea A C and Garciacutea-Garciacutea J 2010 Determinants of Online Reporting of Accounting Information by Spanish Local Government Authorities Local
br
an
ko sta
nić
deter
min
an
ts of su
bn
ation
al b
ud
getfisc
al tr
an
spar
enc
y a rev
iew o
f empir
ica
l evid
enc
epu
blic sec
tor
eco
no
mic
s42 (4) 449-486 (2018)
484 Government Studies Routledge 36(5) pp 679-695 httpsdoiorg101080030039302010506980
28 Gesuele B Metallo C and Longobardi S 2017 The Determinants of E-Disclosure Attitude Empirical Evidences from Italian and Spanish Munici-palities International Journal of Public Administration Routledge 20(4) pp 263-276 httpsdoiorg1010800190069220171300917
29 Gore A K Sachs K and Trzcinka C 2004 Financial disclosure and bond insurance Journal of Law and Economics 47(1) pp 275-306 httpsdoiorg 101086380472
30 Grimmelikhuijsen S G and Welch E W 2012 Developing and Testing a Theoretical Framework for Computer-Mediated Transparency of Local Gov-ernments Public Administration Review 78(1) pp 562-571 httpsdoiorg 10230741506806
31 Groff J and Pitman M 2004 Municipal financial reporting on the World Wide Web A survey of financial data displayed on the official websites of the 100 largest US municipalities Journal of Government Financial Manage-ment 53(2) pp 20-30
32 Guillamoacuten M-D Bastida F and Benito B 2011 The Determinants of Local Governmentrsquos Financial Transparency Local Government Studies 37(4) pp 391-406 httpsdoiorg101080030039302011588704
33 Hollyer J R Rosendorff B and Vreeland J R 2011 Democracy and trans-parency Journal of Politics 73(4) pp 1191-1205 httpsdoiorg101017S0022381611000880
34 IMF 1997 World Economic Outlook Washington International Monetary Fund Available at lthttpswwwimforgexternalpubsftweoweo1097pdfoctweo01pdfgt
35 IMF 1998 Code of Good Practices on Fiscal Transparency minus Declaration on Principles Washington International Monetary Fund Available at lthttpswwwimforgexternalpubsfthistory2012pdf4dpdfgt
36 IMF 2012 Fiscal Transparency Accountability and Risk Washington Inter-national Monetary Fund Available at lthttpswwwimforgexternalnpppeng2012080712pdfgt
37 Ingram R W 1984 Economic Incentives and the Choice of State Govern-ment Accounting Practices Journal of Accounting Research 22(1) pp 126-144 httpsdoiorg1023072490704
38 Khazanchi D 1995 Unethical behavior in information systems The gender factor Journal of Business Ethics 14(9) pp 741-749 httpsdoiorg101007BF00872327
39 Kopits G and Craig J 1998 Transparency in government operations IMF Occasional Papers No 158 Available at lthttpswwwimforgexternalpubsftop158op158pdfgt
40 Krishnan G V and Parsons L M 2008 Getting to the bottom line An exploration of gender and earnings quality Journal of Business Ethics 78(1-2) pp 65-76 httpsdoiorg101007s10551-006-9314-z
br
an
ko sta
nić
deter
min
an
ts of su
bn
ation
al b
ud
getfisc
al tr
an
spar
enc
y a rev
iew o
f empir
ica
l evid
enc
epu
blic sec
tor
eco
no
mic
s42 (4) 449-486 (2018)
48541 Laakso M and Taagepera R 1979 ldquoEffectiverdquo number of parties A Meas-ure with Application to West Europe Comparative Political Studies 12(1) pp 3-27 httpsdoiorg101177001041407901200101
42 Laswad F Fisher R and Oyelere P 2005 Determinants of voluntary Inter-net financial reporting by local government authorities Journal of Accounting and Public Policy 24(2) pp 101-121 httpsdoiorg101016jjaccpubpol 200412006
43 Lowatcharin G and Menifield C E 2015 Determinants of Internet-enabled Transparency at the Local Level State and Local Government Review 47(2) pp 102-115 httpsdoiorg1011770160323X15593384
44 Ma L and Wu J 2011 What Drives Fiscal Transparency Evidence from Provincial Governments in China 1st Global Conference on Transparency Research Rutgers University-Newark May 19-20 2011 httpsdoiorg 102139ssrn1807767
45 Michener G 2015 Why Policymakers Commit to Transparency Legitimacy Insurance Monitoring and the Importance of the News Media as Mediator Available at lthttpwwwfiscaltransparencynetresourcesfilesfiles2015070 2109pdfgt
46 Moon M J and Norris D F 2005 Does managerial orientation matter The adoption of reinventing government and e-government at the municipal level Information Systems Journal 15(1) pp 43-60 httpsdoiorg101111j1365- 2575200500185x
47 Moon M J 2002 The Evolution of E-Government among Municipalities Rhetoric or Reality Public Administration Review 62(4) pp 424-433 httpsdoiorg1011110033-335200196
48 Norris D F and Kraemer K L 1996 Mainframe and PC computing in American cities Myths and realities Public Administration Review 56(6) pp 568-576 httpsdoiorg102307977255
49 OECD 2002 OECD Best Practices for Budget Transparency OECD Journal on Budgeting 1 pp 7-14 httpsdoiorg101787budget-v1-art14-en
50 Pina V Torres L and Royo S 2010 Is E-Government Leading To More Accountable and Transparent Local Governments an Overall View Finan-cial Accountability amp Management 26(1) pp 3-20 httpsdoiorg 101111j1468-0408200900488x
51 Piotrowski S J and Bertelli A 2010 Measuring Municipal Transparency 14th IRSPM Conference Bern Switzerland
52 Piotrowski S J and Vanr Ryzin G G 2007 Cittizens Attitudes Toward Transparency in Local Government The American Review of Public Adminis-tration 37(3) pp 306-323 httpsdoiorg10108009638180126794
53 Rodriacuteguez-Garcia M J 2015 Local womenrsquos coalitions Critical actors and substantive representation in Spanish municipalities European Journal of Womenrsquos Studies 22(2) pp 223-240 httpsdoiorg101177 1350506814549424
br
an
ko sta
nić
deter
min
an
ts of su
bn
ation
al b
ud
getfisc
al tr
an
spar
enc
y a rev
iew o
f empir
ica
l evid
enc
epu
blic sec
tor
eco
no
mic
s42 (4) 449-486 (2018)
486 54 Serrano-Cinca C Rueda-Tomaacutes M and Portillo-Tarragona P 2009 Fac-tors Influencing E-Disclosure in Local Public Administrations Environment and Planning C Government and Policy 27(2) pp 355-378 httpsdoiorg 101068c07116r
55 Smith A C and Taebel D A 1985 Administrative innovation in municipal government International Journal of Public Administration Routledge 7(2) pp 149-177 httpsdoiorg10108001900698508524487
56 Styles A K and Tennyson M 2007 The Accessibility of Financial Report-ing of US Municipalities on the Internet Journal of Public Budgeting Accounting amp Financial Management 19(1) pp 56-92
57 Tavares A F and da Cruz N F 2017 Explaining the transparency of local government websites through a political market framework Government Information Quarterly httpsdoiorg101016jgiq201708005
58 Vishwanath T and Kaufmann D 1999 Towards transparency in finance and governance Washington DC The World Bank
59 Wehner J and de Renzio P 2013 Citizens Legislators and Executive Dis-closure The Political Determinants of Fiscal Transparency World Develop-ment 41(1) pp 96-108 httpsdoiorg101016jworlddev201206005
60 Zimmerman J L 1977 The Municipal Accounting Maze An Analysis of Political Incentives Journal of Accounting Research 15 pp 107-144 httpdxdoiorg1023072490636
61 Zuccolotto R and Teixeira M A C 2014 The Causes of Fiscal Transpar-ency Evidence in the Brazilian States Revista Contabilidade amp Financcedilas 25(66) pp 242-254 httpsdoiorg1015901808-057x201410820
Working Together Integration Institutions and the Sustainable Development Goals World Public Sector Report 2018
UNITED NATIONSUnited Nations Department of Economic and Social Affairs New York 2018 pp 161
Book review by PREDRAG BEJAKOVIĆhttpsdoiorg103326pse4245
Received October 21 2018 Accepted November 7 2018
Predrag BEJAKOVIĆ PhDInstitute of Public Finance Smičiklasova 21 10000 Zagreb Croatiae-mail predragbejakovicijfhrORCiD 0000-0002-4164-8220
un
ited natio
ns
wo
rk
ing to
geth
er integ
ratio
n institu
tion
s an
d the su
stain
ab
le dev
elopm
ent g
oa
ls w
or
ld pub
lic secto
r repo
rt 2018
pub
lic secto
r ec
on
om
ics
42 (4) 487-494 (2018)
488 In the current world although there has been a significant progress in the reduc-tion of poverty and inequality a persistent problem is the lack of improvement in integration which causes social exclusion Furthermore modern economic devel-opment is often not sustainable of the long-term while institutions are not fully adapted to the needs of social challenges A newly published release by the United Nation World Public Sector Report 20181 using a holistic approach very nicely sheds light on the additional measures that are needed to the collaborative efforts of various stakeholders in the inclusion of those that are left out This excellent report was prepared by many authors using mixed methods that combined litera-ture reviews and expert contributions The team composed of United Nations per-sonnel was led by David Le Blanc under the responsibility of Marion Bartheacutelemy
The United Nations in 2016 adopted the 2030 Agenda for Sustainable Develop-ment (the successor to its Millennium Development Goals) which should elimi-nate poverty and achieve sustainable development by 2030 (Steven Pinker in Enlightenment Now states that not even Jesus was that optimistic he told the indig-nant disciples ldquoThe poor you will always have with yourdquo) The Agenda underlines the importance of the interlinkages and integrated nature of the sustainable devel-opment goals (SDGs) Achieving possible synergies and strengthening trade-offs between the sustainable development goals and targets will enable much easier achievement of the SDGs This should boost the allocation of resources and help avoid the adverse side effects of actions aiming to hasten progress in one area on the realisation of targets in other areas
One of the goals of the report is to present the positive experience of many coun-tries with the intention of transferring the best practice in policy integration for the attainment of SDGs The authors are fully aware that different types of existing interlinkages among the SDGs can be addressed and improved from an institu-tional perspective Thus the report aims to define areas where public institutions need to work more closely together the types of measures that can be involved in this process and the broader implications for and consequences of collaboration between public institutions and public service
Improving integration involves finding ways to strengthen cooperation and com-mon approaches among institutions at various levels dealing with closely interre-lated issues Policy integration comprises the management of crosscutting actions and measures in a policy-making process that transits the boundaries of estab-lished policy fields Such measures very often do not correspond to the institu-tional responsibilities of individual units and departments
In the modern literature the term integration is used in various slightly different meanings The most common usage defines integration as a dimension variable with policies in specific issue areas being more integrated than before Otherwise
1 The report is available at httpworkspaceunpanorgsitesInternetDocumentsUNPAN98152pdf
un
ited natio
ns
wo
rk
ing to
geth
er integ
ratio
n institu
tion
s an
d the su
stain
ab
le dev
elopm
ent g
oa
ls w
or
ld pub
lic secto
r repo
rt 2018
pub
lic secto
r ec
on
om
ics
42 (4) 487-494 (2018)489integration can be deemed as the more coherent process of defining and imple-
menting policy related to a specific issue Finally integration can also denote the ideal of policies that achieve a higher degree of coherence In this report the term integration is considered in a broad sense while the potential challenges short-comings and gains of integrated policy-making are clear The challenges in the past were the lack of political legitimacy of sustainable development as a para-digm and insufficient attention of various levels of government to the issue of sustainable development Shortcomings are an inability to mainstream sustainable development principles in the work of available institutions on one hand and resistance to achieve the degree of coordination among institutions that are needed for sustainable development on the other Gains of the integrated approach are socially superior solutions that cannot be achieved by focusing only on sector-specific policies and shared visions across sectors and various actors Positive changes in relevance and legitimacy are supported by progress in the scientific researchers that fully understand the interlinkages among sustainable develop-ment topics on the one hand as well as by the development of tools analytical methods and information systems that support integration of different stakehold-ers in public and private sector on the other
The report is organized around three broad principal questions First what are from the institutional perspective the challenges to and prospects for policy integration at various policy cycle phases at the national level Second are there any positive cases of institutional and administrative organisations that can support integrated approaches to the 2030 Agenda and if so what are they Finally what are the opportunities and challenges for public administration and public institutions to ensure integrated approaches in diverse SDG or groups of closely related goals
The report consists of two main parts In the first part chapter one explains the reasons and case for integration and introduces the methodological framework The second chapter focuses on horizontal integration chapter three on vertical integration while chapter four deals with successful engagement of stakeholders The second part of the publication applies the relevant framework of integrated approaches to international migration health and integration of peace security and development in post-conflict situations
Forms of integration are explained in chapter one The modern literature distin-guishes three dimensions of integration Horizontal integration encompasses inte-gration across sectors or institutions Vertical integration expresses how the actions of various (national and sub-national) levels of government can be adjusted to achieve coherent outcomes The third dimension is engagement of all stakeholders in the integrated realisation of shared objectives Taken together these three dimen-sions of integration encompass all the relevant categories proposed by the litera-ture primarily partnerships participation and coherence The approach and content of the initiatives can be formal or informal The latter refers to joint activities that involve various stakeholders from the non-state sector in addition to the whole of
un
ited natio
ns
wo
rk
ing to
geth
er integ
ratio
n institu
tion
s an
d the su
stain
ab
le dev
elopm
ent g
oa
ls w
or
ld pub
lic secto
r repo
rt 2018
pub
lic secto
r ec
on
om
ics
42 (4) 487-494 (2018)
490 government with the state usually having a coordinating role When analysing policy integration there is a need to consider different aspects like the institutional efforts made by governments to promote integrated policy-making and policy coherence activities related to collaboration and coordination and measures of achieved integration and policy coherence regarding achieved outcomes
As the SDGs makes high demands for horizontal integration on institutions at all levels chapter two analyses the importance of effective horizontal integration for the implementation of the SDGs Such integration is critical for resolving the interconnected nature of the SDGs including synergies and trade-offs across dif-ferent goals and targets It is however well known that overcoming sectoral boundaries in the attainment of horizontal integration is a demanding and complex task In such a process governments have concrete measures and opportunities to improve integration in their structures and processes A growing number of coun-tries around the world are including SDGs into their national policies and putting in place adequate institutional frameworks While some countries have given new mandates to existing mechanisms or institutions others are establishing new coor-dination bodies and mechanisms for the implementation of the SDGs Among many vital measures and instruments the five most important are examined The first are national strategies and plans because they define the overall direction and priorities The second is the budget process that helps in implementation and real-isation of national strategies at the level of programmes and activities The third group consists of public services responsible for the implementation of govern-ment actions on the SDGs This group has a critical role in achieving effective collaboration across institutions and sectors Monitoring evaluation and review processes for the SDGs are part of the fourth group that enables governments to assess progress in the activities of integration Finally different oversight institu-tions parliaments and Supreme Audit Institutions (SAIs) have a crucial role in insuring integration The report contains many examples of integration from dif-ferent countries so this chapter presents the experiences from the Sierra Leone implementation of the Agenda for Prosperity particularly the Poverty Reduction Strategy The Budget Statement nominates the responsible stakeholders and the scope of their reporting responsibilities on the SDGs within the various govern-ment ministries and offices where resources were allocated
The realisation of the SDGs requires the coordination of actions and measures of different levels of government There are many reasons for such coordination In most cases the achievement of specific targets in each national context depends on the aggregation of local and regional outcomes making coherent action a stip-ulation Vertical integration may be an important step in promoting a shared vision and commitment to sustainable development across levels It can enhance syner-gies and improve consistency across levels of government through mutually rein-forcing and supportive actions The third chapter examines current efforts in ensuring effective vertical policy integration during the implementation and fol-low-up and review of the SDGs Vertical integration enables an opportunity for
un
ited natio
ns
wo
rk
ing to
geth
er integ
ratio
n institu
tion
s an
d the su
stain
ab
le dev
elopm
ent g
oa
ls w
or
ld pub
lic secto
r repo
rt 2018
pub
lic secto
r ec
on
om
ics
42 (4) 487-494 (2018)491political dialogue among the various parts of government providing a possibility
to generate trust and a more long-term vision across the public sector The chapter analyses the potential benefits of vertical integration and some of its challenges and barriers It also studies approaches and tools that different countries have implemented with the goal of enhancing vertical integration at different stages of the policy process underlining innovative approaches and experiences Potential challenges to vertical integration include the gap between the abstract and univer-sal nature of SDGs and the specificity of local initiatives and policies unaware-ness of SDGs by local governments organizational cultural andor ideological differences between national and local governments institutional weaknesses or poor coordination mechanisms between the different levels of government Colombia can be mentioned as a positive example of successful and advanced vertical integration With support from the Colombian national government 32 departments and 31 capital cities have adopted and implemented local develop-ment plans that include SDG localized targets
The fourth chapter presents the adoption of mechanisms for efficient stakeholder engagement at both the systemic and the sector levels It also looks at how it can affect outcomes in terms of integration Many experiences have been observed regarding processes and mechanisms for stakeholder engagement in different sec-tors at different levels of decision-making and with various constituencies Hav-ing in mind such examples governments have become fully aware of the impor-tance of stakeholder engagement in order to strengthen ownership of the SDGs and ensure their successful implementation and monitoring at all levels Included stakeholders can enhance policy performance by helping in defining problems in ways that are more accurate They can also provide information and insights rele-vant for identifying policy solutions and evaluating the implementation process Enabling policy-making process to the inclusion and interaction with non-govern-mental actors helps governments better to understand peoplersquos needs and demands Furthermore non-governmental actors can be directly included in solving policy problems and contribute additional resources through the common generation of skills knowledge policy and technology Of course there are always some prob-lems and costs Wide stakeholder engagement usually takes time and can be an obstacle to the quick policy responses that some sustainable development chal-lenges may need While including the ideas and opinions of multiple stakeholders helps gain a more comprehensive and legitimate understanding of demanding pol-icy problems engagement can make it more difficult to reconcile divergent and even opposite views in commonly agreed policy solutions It seems that the com-bination of different engagement strategies and collaboration of multiple stake-holders is more effective for increasing responsiveness and accountability than the use of one single engagement mechanism The positive Finnish example of the government-led Finnish National Commission on Sustainable Development with many stakeholders included from public and private sector and civil society illus-trates a possible way of mobilizing non-state actors that is fully consistent with government actions for SDG implementation Investing time and resources in the
un
ited natio
ns
wo
rk
ing to
geth
er integ
ratio
n institu
tion
s an
d the su
stain
ab
le dev
elopm
ent g
oa
ls w
or
ld pub
lic secto
r repo
rt 2018
pub
lic secto
r ec
on
om
ics
42 (4) 487-494 (2018)
492 selection process and having clearly defined procedures and criteria for selecting stakeholders without doubt contribute to the effectiveness and efficiency of the engagement as well as its outputs and outcomes in terms of integration
Sustainable development demands policies that are systematically oriented towards the strengthening of linkages between different economic social and environmen-tal issues The fifth chapter shows how national public institutions and administra-tions have used integrated approaches to respond to the needs of migrants and refu-gees the flows of whom have been increasing across the world The way in which the multiple linkages between migration and the SDGs are transformed into national policies and realised in practice by public institutions and public adminis-tration reflects political processes of reconciling opposite opinions and demands of different stakeholders including governments civil society and migrants them-selves The authors examine how public institutions and different stakeholders can better support integrated approaches to migration How can they sustain the inte-gration of the mentioned approaches in sustainable development measures poli-cies and institutional processes Where and how can development policies make the most impact when it comes to serving those in the worst positions among inter-national migrants How can policy-makers and policy communities connect migra-tion and socio-economic development through innovative services No single model appears intrinsically better in terms of effective and efficient policy integra-tion Elements that might perhaps impact horizontal and vertical policy integration include the type of public administration system the level of decentralisation and local governance institutional capacity previous experience and institutionaliza-tion of cooperation between various bodies of government development of leader-ship prevalence of modern technology usage including the capability and vigour of communication platforms and finally the characteristics and the numbers of actors involved in policy-making Morocco is a positive example of a country that undertook several waves of regularization of migrants in an irregular situation fol-lowed by the opening of its public services to all migrants and refugees Migrants in an irregular situation have access to public health services and can send their children to public schools Additionally regular migrants can participate in profes-sional training and assistance with job search This chapter concludes with an important statement that integration of migration and development at all levels of public administration is not only a technical or rational process but also has to encompass cultural awareness politics and perceptions As migration and refugee issues are likely to remain a significant problem in the near future there is a need for the proposal and implementation of efficient awareness and communication strategies and accountability systems in public administration
Integrated approaches to health and well-being are the subject of analysis in the sixth chapter Health is a crucial human right and an important characteristic of personal well-being Health outcomes are impacted by many factors that are usu-ally outside the health sector itself At the national level a vast array of policies and institutional settings have been developed to support the multiple linkages
un
ited natio
ns
wo
rk
ing to
geth
er integ
ratio
n institu
tion
s an
d the su
stain
ab
le dev
elopm
ent g
oa
ls w
or
ld pub
lic secto
r repo
rt 2018
pub
lic secto
r ec
on
om
ics
42 (4) 487-494 (2018)493between health and other SDG areas with the intention to support integrated
approaches However researches show that the focus of many efforts at integrated health initiatives has largely remained within the health care sector itself Attempts at integration have been oriented to finding ways to enable non-health sectors and actors to serve the goals of the health sector without necessarily considering the impact of health on those sectors and their principal objectives Thus in many countries the potential of integrated approaches to achieve synergies and minimise trade-offs across sectors and government levels may remain often unused Univer-sal healthcare for all migrants in Thailand is mentioned as a positive experience of interlinkages of health with other sectors Migrants represent more than 6 percent of the Thai population It is currently the only country in the world where illegal migrants have the same health care rights as nationals
This very nice report finishes with chapter seven which deals with the implemen-tation of the SDGs in post-conflict situations and their implications for integrated approaches that enable improvements in sustainable development and peace Conflicts annually lower a countryrsquos gross domestic product growth on average by two percentage points Trends in the world show that the gap between conflict-affected countries and other developing states is widening Countries emerging from conflict are the ones where the SDGs probably may not be obtained without some radical and innovative departures An integrated context for SDG imple-mentation involves ensuring that interventions aimed at preserving peace (includ-ing protecting human rights) and development are interlinked and mutually rein-forcing As countries in post-conflict situations face many pressing problems for them the achievement of long-term development goals is much more difficult In the face of many short and long-term priorities efficient integrated approaches become even more important than in peaceful circumstances Post-conflict situa-tions mostly vary in the nature and degree of devastation but often there is a need to mitigate the consequences of substantial physical institutional and organiza-tional destruction Conflicts usually ruin national public administration and public institutions and they have to be rebuilt often from scratch Using recent examples the authors in this chapter explore how this can be done Sustainable development aspirations can be an inspiration for a common vision for the future Such a vision needs to be transformed into coherent and integrated national policies that are future-looking inclusive and endorse partnership between the government and society and support by various stakeholders The policy integration and inclusion in Colombia achieved by the National Development Plan are provided as an example The Colombian government made efforts to provide an inclusive plat-form for policy-making at the local level giving a voice to earlier marginalized groups and supporting their participation in local elections as candidates The government also established the legal and institutional architecture for a territorial peacebuilding process The coordination between central and local levels of gov-ernment was achieved through the Inter-institutional Post-conflict Council
un
ited natio
ns
wo
rk
ing to
geth
er integ
ratio
n institu
tion
s an
d the su
stain
ab
le dev
elopm
ent g
oa
ls w
or
ld pub
lic secto
r repo
rt 2018
pub
lic secto
r ec
on
om
ics
42 (4) 487-494 (2018)
494 The report presents country efforts to foster policy integration for SDGs It pro-vides examples of measures and ways by which linkages among SDGs can be achieved from an institutional perspective and underlines the importance of inte-gration challenges and opportunities for public institutions and public administra-tion This interesting and valuable report also explains the role and importance of budgets in tracking support to specific goals The reader can only enjoy the final product and the incredible richness of the additional (more than 500) sources used in the preparation of the report

vla
dim
ir ar
ča
bić
fisca
l co
nv
erg
enc
e an
d susta
ina
bility in th
e eur
opea
n un
ion
pub
lic secto
r ec
on
om
ics
42 (4) 353-380 (2018)
354 abstractThis paper analyzes fiscal convergence and sustainability in the European Union using data on government debt revenues and expenditures Absolute fiscal diver-gence is present in the EU especially after the sovereign debt crisis However we find evidence of fiscal club convergence when clubs are endogenously determined Club convergence is important for the EU because there is no single fiscal policy and member statesrsquo policies are heterogeneous Endogenous clubs do not share the usual geographical political or development similarities Fiscal policy in the EU is found to be unsustainable but it is countercyclical We use a policy response function where the primary surplus is a function of public debt and the output gap The primary surplus does not respond to changes in public debt and this is con-sidered to be unsustainable However it increases in expansions and decreases in recessions thus being countercyclical The countercyclical primary surplus is important for smoothing business cycles
Keywords convergence clubs fiscal sustainability public debt structural breaks log t test dynamic panel
1 IntroductIonWith the sovereign debt crisis in the Eurozone fiscal policy has become an increasingly important topic The sovereign debt crisis and the Great Recession led to many European Union countries breaching the public debt and deficit goals set by Stability and Growth Pact (SGP) The goals are for public debt not to exceed 60 of GDP and for the deficit not to exceed 3 of GDP These goals which are part of the nominal convergence criteria were established to ensure sound and sustainable public finances in the European Union However whether or not there is a convergence of member statesrsquo fiscal policies and whether fiscal policy is sustainable is still an open question
This paper analyzes fiscal convergence and tests for fiscal sustainability in the European Union We test fiscal convergence directly using government revenue expenditure and debt as key government variables instead of testing for GDP convergence as is usual in the convergence literature The paper considers both absolute convergence and convergence clubs which is important because the European Union does not have a single fiscal policy and member statesrsquo policies are heterogeneous Heterogeneous fiscal policies among member states could easily lead to different fiscal convergence clubs which are analyzed in the paper Based on the identified convergence clubs we test for fiscal sustainability in the clubs as well as in the whole of the European Union Fiscal sustainability has become an especially important topic for the EU countries after the Greek crisis
The literature on fiscal convergence is relatively scarce Economic integration common institutional factors and common policies in the EU should lead to con-vergence in key fiscal indicators On the other hand the sovereign debt crisis and the Great Recession affected member states in different ways possibly leading to
vla
dim
ir ar
ča
bić
fisca
l co
nv
erg
enc
e an
d susta
ina
bility in th
e eur
opea
n un
ion
pub
lic secto
r ec
on
om
ics
42 (4) 353-380 (2018)355fiscal divergence It seems that the observed period plays an important role Earlier
research finds some evidence of fiscal convergence in the period from the late 1960s to the early 2000s (De Bandt and Mongelli 2000 and Delgado 2006) while more recent studies such as Kočenda Kutan and Yigit (2008) show the lack of it in the period from 1995 to 2005 The mentioned papers measure convergence using the popular β- and α-convergence tests as well as cointegration tests in a time series framework
The literature does not tackle the issue of convergence clubs regarding fiscal pol-icy However the idea of convergence clubs is implicitly included in discussions on the EU core and periphery or on the two-speed Europe idea popularized by Blanchard (2010) which argues that different groups of European countries show faster and slower recoveries after the Great Recession Accordingly fiscal conver-gence and the possibility of convergence clubs are important issues for EU poli-cymakers This paper analyzes both absolute convergence and club convergence Instead of grouping countries according to ad-hoc criteria such as geographical location or EU accession date we determine convergence clubs endogenously
We also analyze fiscal sustainability within the clubs and in the whole EU 28 using a policy response function proposed by Bohn (1998 2007) Fiscal policy is sustainable if the primary government surplus increases as a response to the increase in public debt This is considered responsible and sustainable behavior because the government increases its revenue or decreases spending when faced with a higher public debt Bohn (1998 2005) concludes that US fiscal policy is sustainable Cassou Shadmani and Vaacutezquez (2017) refine this finding by showing that the US fiscal policy is sustainable only during good economic times but not in times of economic distress
The research regarding European fiscal policy is somewhat different Collignon (2012) develops a policy response function to analyze European fiscal sustainabil-ity His policy response function is adjusted to EU fiscal rules looking at the pri-mary surplus response to changes in debt and deficit Results indicate that Euro-pean fiscal policy is sustainable in this respect but conditions on financial markets and the risk of financial contagion can make it insufficient as shown by the Greek crisis Research has also focused on the cyclical behavior of fiscal policy The common understanding is that fiscal policy should be countercyclical higher gov-ernment spending in recessions followed by fiscal consolidation in expansions to smooth business cycles The countercyclical fiscal policy is sustainable in the long run when extra deficits accumulated in recessions are compensated for during times of economic growth Balassone Francese and Zotteri (2010) show that budget balance in fourteen EU countries deteriorates during recessions but does not improve to the same extent during expansions Government expenditures are responsible for the asymmetry
vla
dim
ir ar
ča
bić
fisca
l co
nv
erg
enc
e an
d susta
ina
bility in th
e eur
opea
n un
ion
pub
lic secto
r ec
on
om
ics
42 (4) 353-380 (2018)
356 Public debt sustainability has been widely analyzed for individual countries as well Babić (2003) and Mihaljek (2004) analyze the sustainability of public and external debt in Croatia This early analysis1 concluded that Croatian public debt is not too sensitive to the various shocks analyzed but credit rating and interest rate spread in Croatia are worse than those of central European countries Deskar-Škrbić and Šimović (2017) on the other hand showed that public debt level affects the effectiveness of fiscal spending by reducing the size of fiscal effects in Croatia
This paper contributes to the literature by analyzing absolute fiscal convergence and convergence clubs using quarterly data for government debt revenues and expenditures in EU member states from 20001 to 20172 We test convergence using a log t test proposed by Phillips and Sul (2007 2009) accompanied with the clustering algorithm for endogenous club classification Commonly used β- and σ-convergence tests might be biased and suffer from low power as noted in Ber-nard and Durlauf (1995 1996) among others Such tests assume linear dynamics in the convergence process Phillips and Sulrsquos (2007) log t test is based on a non-linear dynamic factor model which allows a nonlinear adjustment in parameters both over time and across different countries Therefore it is suitable in testing for convergence We check the robustness of our results by applying recently devel-oped unit root tests which control for both sharp and smooth structural breaks
The paper also contributes to the fiscal policy sustainability literature We use a policy response function proposed by Bohn (1998) in a panel framework where the primary government surplus is a function of public debt and the output gap We use a dynamic panel model and include a lagged dependent variable in the equation since there is a strong inter-temporal relationship between the govern-ment surplus and public debt Furthermore EU countries are somewhat homoge-nous and therefore there is a possibility of cross-sectional dependence Unlike the previous literature we use a dynamic panel system GMM estimator with common correlated effects proposed by Pesaran (2006) which controls for pronounced homogeneity among the EU countries
The main findings can be summarized as follows There is strong and robust evi-dence of absolute divergence in government debt revenues and expenditures among the EU countries The process of divergence was intensified during the sovereign debt crisis and the Great Recession However we find two three and four endogenous convergence clubs in government debt revenue and expendi-tures respectively The clubs are found to be quite heterogeneous club members do not share the usual geographical political or development similarities On the other hand groups of EU-15 and EU-13 countries as well as EU core and EU periphery countries are shown to diverge which suggests an important difference between endogenous and exogenous groupings
1 1997-2003 period is considered
vla
dim
ir ar
ča
bić
fisca
l co
nv
erg
enc
e an
d susta
ina
bility in th
e eur
opea
n un
ion
pub
lic secto
r ec
on
om
ics
42 (4) 353-380 (2018)357Fiscal policy is found to be unsustainable but countercyclical both in the EU as a
whole and within identified convergence clubs Our model does not show an increase in the primary surplus after debt upsurge which is identified as unsus-tainable behavior We find only limited evidence of fiscal sustainability in the EU-13 group and in a subsample with public debt higher than 90 On the other hand fiscal policy in the EU is countercyclical indicating the efforts of fiscal policy to smooth business cycles
The paper is structured as follows Section 2 explains and presents the data It describes empirical methods used in the paper namely log t test and the clustering algorithm for club convergence analysis unit root tests with structural breaks and the dynamic panel model used for the sustainability analysis Section 3 presents results on fiscal convergence and sustainability while section 4 concludes
2 data and methodology21 dataFor convergence analysis we use quarterly general government debt revenues and expenditures in a percent of GDP as our key variables Variables in current prices are divided by nominal GDP and expressed in real terms as a percent of GDP The data span from 2000q1 to 2017q2 which is the longest available period for a balanced panel for 28 EU countries For the sustainability analysis we use primary surplus public debt and the output gap data but the sample starts in 2002q1 because of the availability of primary surplus data The primary sur-plus is calculated as total surplus plus payable interest and it is expressed as a percent of GDP Public debt is expressed as a percent of GDP as well The output gap is a percent deviation of GDP from its long-run trend computed using the Hodrick and Prescott (1997) filter
All variables are seasonally adjusted using Census X11 method for Census Bureaursquos X12-ARIMA program Data are collected primarily from the Eurostat and International Financial Statistics (IFS) database For Croatia we use central government revenues and expenditures provided by the Croatian National Bank as a proxy for general government For some countries we had to reconstruct data from different sources to work with balanced panels for the analysis Details on data construction are explained in appendix Appendix also plots series of govern-ment debt revenues expenditures and primary surplus as a percent of GDP and presents basic descriptive statistics
22 the log t conVergence test and club conVergenceWe use the log t test for convergence analysis of government debt revenues and expenditures as well as for analysis of convergence clubs The test was developed by Phillips and Sul (2007 2009) who built on a neoclassical growth model with heterogeneous technology and looked for the output convergence Intuitively the test looks at cross-sectional dispersion over time If the dispersion decays over time countries are becoming more similar ie there is convergence Phillips and
vla
dim
ir ar
ča
bić
fisca
l co
nv
erg
enc
e an
d susta
ina
bility in th
e eur
opea
n un
ion
pub
lic secto
r ec
on
om
ics
42 (4) 353-380 (2018)
358 Sul (2009) introduced three sets of tools relative transition curves log t test and the clustering algorithm for testing club convergence
Allowing for a heterogeneous technology in a growth model is important because countries experience different growth paths Such a framework is reasonable for studying fiscal convergence in the EU as well because countries have both a com-mon part such as institutions and policies and an idiosyncratic part which is country-specific
Consider a neoclassical growth model with the heterogeneous technology used in Phillips and Sul (2009)
(1)
where yit is output per capita ỹi0 and ỹi are initial and steady-state levels of output
per capita respectively and Ai0 represents the initial level of technology Hetero-geneity is allowed through the convergence parameter βit and the output growth rate git since both can vary over time and across countries The model can be rewritten to show a common and country-specific component We simplify the equation (1) as log yit = ait + git t where the term ait collects all RHS variables except git t Than the model can be written as a dynamic factor model
(2)
In this dynamic factor model μt is a common component The coefficient bit explains how individual countries relate to the common component μt In this paper the focus is on fiscal convergence Instead of looking at output per capita we consider convergence in government debt revenues and expenditures The common com-ponent μt in that case are EU institutions integration process andor common policies while bit represents a share of a common trend for each EU member state
Coefficients bit could be empirically analyzed using relative transition curves hit which are simply the relative departure of country i from the average or
(3)
where xit are series on government debt revenue or expenditures2 We remove the cyclical component from the time series as suggested by Phillips and Sul (2009) by using the Hodrick and Prescott (1997) filter but the results are not very sensi-tive to cyclical smoothing Convergence is evident when hit curves for all coun-tries approach 1
2 For each variable we run a separate test
vla
dim
ir ar
ča
bić
fisca
l co
nv
erg
enc
e an
d susta
ina
bility in th
e eur
opea
n un
ion
pub
lic secto
r ec
on
om
ics
42 (4) 353-380 (2018)359The log t test is a more formal way for testing convergence The test builds on
relative transition curves and has the following form
(4)
where is a quadratic distance measure which goes to 0 when countries converge t = T0 T where T0 is the first observation after we discard the initial 30 of observations as suggested by Phillips and Sul (2009) Second term on LHS is a penalty function which improves test performance and ut is an iid error Convergence is tested with the coefficient γ When γ is negative and statistically significant we can conclude that countries diverge If 0 le γ lt 2 we can conclude there is a conditional convergence in growth rates For absolute convergence to hold γ ge 23 The critical value at 5 level significance is 165
Phillips and Sul (2007 2009) also developed a clustering algorithm for detecting endogenous convergence clubs based on the log t regression If the convergence hypothesis is rejected for the full sample club convergence can be considered The clustering algorithm has four steps Simplified in the first step we sort coun-tries in the panel and in the second step we form a core group of k countries where k lt N for which the log t regression yields the highest t-statistics4 The remaining N ndash k countries form a complementary group In the third step we add one country at the time from the complementary to the core group and for each we apply the log t test If t gt -165 the new country is added to the core group The first convergence club is obtained after all countries that satisfy the condition are added In the fourth step we apply the log t test on the group of remaining coun-tries which are not a part of the first convergence club If the t-statistic is greater than -165 the second convergence club is identified If not we repeat steps (1) to (3) on the group of remaining countries to identify other possible convergence clubs
To obtain as few clubs as possible we run separate tests for club merging Once initial clubs are identified we run the log t test on them If convergence hypothesis is not rejected for club 1 and club 2 we merge them and form a new club 1 New club 1 is then tested for merging with club 3 and so on The advantage of this procedure is that it produces fewer convergence clubs but the downside is that the evidence for convergence is less convincing because the t-statistic on the γ coef-ficient is usually insignificant
23 unIt root tests for conVergenceWe use different unit root tests for convergence analysis within identified clubs to check the robustness of our results We test for convergence in government debt revenues and expenditures both in the full sample of EU 28 and in each identified convergence club Following the approach of Bernard and Durlauf (1995) and
3 Phillips and Sul (2007 2009) provide more technical details of the test For empirical analysis we use a set of procedures described in Du (2017)4 To form a group the t-statistic for parameter γ from log t regression must be t gt -165
vla
dim
ir ar
ča
bić
fisca
l co
nv
erg
enc
e an
d susta
ina
bility in th
e eur
opea
n un
ion
pub
lic secto
r ec
on
om
ics
42 (4) 353-380 (2018)
360 Pesaran (2007) we compute a difference between country i and the average which we test for the unit root xit = xit ndash xt (5)
where xit represents government debt revenues or expenditures in country i and xt is an adjusted average excluding country i under consideration The adjusted average should prevent a bias in testing which could be large for big countries such as Germany
If the difference series xit is stationary then there is convergence in government debt revenues or expenditures Shocks to an individual countryrsquos fiscal variables may be permanent or temporary but all shocks to the difference series xit should be only temporary if country i converges to the average Rejection of unit root is evidence of convergence If our results are robust rejections should be higher within identified clubs than in the full sample of EU 28
We apply unit root tests developed by Lee and Strazicich (2003) and Enders and Lee (2012) that can control for structural breaks Structural breaks are highly pos-sible in government debt revenues and expenditures time series since they include the period of the sovereign debt crisis and the Great Recession in the EU Ignoring structural breaks might be a serious problem that reduces the power of the test as argued in Perron (1989) We also present results of a standard ADF test which does not control for structural breaks Intuitively structural breaks are abrupt changes in the data such as the Great Recession It is possible that the con-vergence was present both before and after the break but the existence of the break violates our conclusions
The Lee and Strazicich (2003) unit root test controls for two sharp breaks in the data It is a Lagrange Multiplier (LM) test with the equation
∆ xt = δʹ∆ Zt + ϕ Stndash1 + εt (6)
where St is a detrended xt series and ϕ is a coefficient of interest Under the null hypothesis of unit root ϕ = 0 and the rejection of unit root implies convergence
We use the so-called break model which allows for two breaks in both level and the trend of the series using dummy variable vector Zt = [1 t D1t D2t DT1t DT2t] Dummy variables D1t and D2t control for breaks in level and take value 1 if t ge TBj + 1 and 0 otherwise for breaks j = 1 2 where TBj are break locations On the other hand dummy variables DT1t and DT2t control for breaks in the trend where DTjt = t ndash TBj for t ge TBj + 1 and 0 otherwise for breaks j = 1 2 Break locations TB1 and TB2 are endogenously determined in a grid search which minimizes the t-sta-tistics of coefficient ϕ
Critical values for the LM test with two breaks in a level and the trend are taken from table 2 of Lee and Strazicich (2003) Number of lags in the equation (6) is chosen based on general to specific procedure
vla
dim
ir ar
ča
bić
fisca
l co
nv
erg
enc
e an
d susta
ina
bility in th
e eur
opea
n un
ion
pub
lic secto
r ec
on
om
ics
42 (4) 353-380 (2018)361We also use the Enders and Lee (2012) unit root test which controls for an
unknown number of smooth structural transitions approximated by a flexible Fou-rier function The Fourier function has proved to accommodate smooth breaks very well there is no need for a grid search as in Lee and Strazicich (2003) test and the number of estimated parameters is relatively small so the test does not lose power The test equation is simple and can be estimated by OLS
∆ xt = c (t) + ϕ Stndash1 + εt (7)
where again St is detrended xt series and ϕ is a coefficient of interest The null hypothesis of unit root assumes ϕ = 0 and again a rejection of unit root implies convergence However equation (7) includes a time-dependent deterministic term c (t) which is approximated by a single frequency Fourier function of the form
(8)
where c0 c1 and c2 are coefficients estimated by OLS t is a current time period and T is a number of observations Note that the equation (8) nests a standard linear specification when c1 and c2 are equal to zero We run the model with a sin-gle frequency equal to one and with a number of lags chosen by general to spe-cific procedure Critical values are taken from Enders and Lee (2012) table 1
24 PolIcy resPonse functIon for the sustaInabIlIty analysIsWe analyze fiscal policy sustainability using a policy response function as sug-gested by Bohn (1998 2007)5 Our model can be written as
sit = ρ sitndash1 + β1 dit + β2 yit + εit (9)
Equation (9) is a dynamic panel version of Bohnrsquos policy response function where sit is the government primary surplus in country i at time t dit is public debt and yit is the output gap eit is the residual where eit = αit + εit and αi are country fixed effects The error term εit is independent or E[εit εjk] = 0 for each i j t and k where i ne j
Fiscal policy is sustainable when β1 is positive suggesting an increase in primary surplus as a response to higher public debt Such behavior is considered sustain-able and responsible because the government tends to increase its revenue or decrease spending as a response to higher debt
Bohn (1998) stressed the importance of controlling the model with the output gap Coefficient β2 next to the output gap also tells us if the fiscal policy is pro- or countercyclical When β2 lt 0 the positive output gap decreases government sur-
5 Bohn (2005 2007) criticize fiscal sustainability analysis based on unit root and cointegration techniques popularized by Trehan and Walsh (1988) and Hamilton and Flavin (1986) He argues that such techniques are not capable of rejecting sustainability hypothesis because the relevant debt variables are necessary stationary after a finite number of differencing and thus in compliance with the intertemporal budget constraint (IBC)
vla
dim
ir ar
ča
bić
fisca
l co
nv
erg
enc
e an
d susta
ina
bility in th
e eur
opea
n un
ion
pub
lic secto
r ec
on
om
ics
42 (4) 353-380 (2018)
362 plus and fiscal policy can be considered as procyclical and vice versa (Balassone Francese and Zotteri 2010)
Our model includes a richer dynamic than initially proposed in Bohn (1998) by including a lagged primary surplus (Cassou Shadmani and Vaacutezquez 2017) This specification is more appropriate because it allows for fiscal policy persistence and because of a possible feedback effect between public debt and surplus in a panel framework accumulated government deficits (negative surpluses) are closely related to public debt
The benchmark model is estimated by a system GMM augmented with common correlated effects (CCE) proposed by Pesaran (2006) to deal with cross-sectional dependence The system GMM estimator proposed by Arellano and Bover (1995) and Blundell and Bond (1998) is often used for dynamic panel estimation and we use their two-step procedure with robust standard errors where fixed effects are removed by first differencing6
Our panel consists of European Union countries which are somewhat homoge-nous in terms of common institutions and policies and therefore a cross-sectional dependence can be an important issue affecting our results7 To deal with the issue of cross-sectional dependence we augment the system GMM estimator by adding cross-sectional means of all variables as instruments in the model from the equa-tion (9) Common correlated effects procedure is proposed by Pesaran (2006) for a group of OLS estimators However we use this principle to augment system GMM estimator Pesaran (2006) showed that adding CCE has satisfactory small sample properties for relatively small N and T even in heterogeneous models We call this model system GMM-CCE model
We confirm the robustness of the benchmark model by estimating a dynamic panel model with fixed effects (FE) using robust errors Our data set is a balanced panel with a reasonably large T = 62 and therefore the FE estimator should not be biased We refer to this model simply as the FE model
3 fIscal conVergence and sustaInabIlIty31 conVergence clubsWe do not find any evidence to support the absolute convergence of government debt revenues and expenditures in the EU using relative transition curves and log t test The relative transition curves in figure 1 show lack of convergence because they do not approach 1 in the observed period By contrast curves are scattered equally at the beginning and the end of the sample
6 We use first differencing instead of forward orthogonal deviaton (FOD) because our data set is a balanced panel Refer to Arellano and Bover (1995) and Blundell and Bond (1998) for complete technical details7 Indeed when we apply Pesaran (2015) test for weak cross-sectional dependence to the model the null hypoth-esis of cross-sectional independence can be easily rejected
vla
dim
ir ar
ča
bić
fisca
l co
nv
erg
enc
e an
d susta
ina
bility in th
e eur
opea
n un
ion
pub
lic secto
r ec
on
om
ics
42 (4) 353-380 (2018)363Figure 1
Relative transition paths(a) Gov debt (b) Gov revenues
Estonia Estonia
BelgiumGreece
05
11
52
25
Rel
ativ
e tra
nsiti
on p
aram
eter
2000q3 2004q3 2008q3 2012q3 2016q3Quarter
Transition paths for government debt
Cyprus
Ireland
SwedenFinland
68
11
21
4R
elat
ive
trans
ition
par
amet
er
2000q3 2004q3 2008q3 2012q3 2016q3Quarter
Transition paths for government revenue
(c) Gov expenditures
Ireland
Ireland
Croatia France
68
11
21
4R
elat
ive
trans
ition
par
amet
er
2000q3 2004q3 2008q3 2012q3 2016q3Quarter
Transition paths for government expenditures
This is further supported by a more formal log t test presented in table 1 Table 1 shows γ coefficient from the log t regression applied to government debt (1a) rev-enues (1b) and expenditures (1c) data Again γ lt 0 implies divergence 0 le γ lt 2 is evidence of conditional convergence and γ ge 2 implies absolute convergence in levels Table 1 shows that γ coefficient is significantly negative (marked with an asterisk) when log t test is applied to all EU countries which rejects absolute con-vergence of government debt revenues and expenditures Kočenda Kutan and Yigit (2008) also find fiscal divergence in a form of pronounced level of heteroge-neity in public debt and deficit among EU member states
We also find that the Great Recession and sovereign debt crisis further increased fiscal divergence in the EU In figure 2 we show results of estimated rolling win-dow γ coefficient for government debt revenues and expenditures We estimate the log t regression with a centered rolling window of 20 quarters (five years) together with 95 confidence intervals For all three variables estimates are sig-nificantly negative throughout the observed period which further confirms the result of fiscal divergence An interesting finding is that the estimated γ further decreases from 2008 in the case of government revenues and expenditures and from 2011 in the case of government debt Therefore it could be argued that the Great Recession and sovereign debt crisis pushed the EU further away from fiscal convergence
vla
dim
ir ar
ča
bić
fisca
l co
nv
erg
enc
e an
d susta
ina
bility in th
e eur
opea
n un
ion
pub
lic secto
r ec
on
om
ics
42 (4) 353-380 (2018)
364 Table 1log t convergence test results and convergence clubs classification
(a) government debt convergence resultslog(t) All countriesγ -0253t-stat -2213Club classificationlog(t) Club 1 [19] Club 2 [9]γ -000900 0560t-stat -0686 6100(b) government revenues convergence resultslog(t) All countriesγ -0729t-stat -3334Club classificationlog(t) Club 1 [19] Club 2 [5] Club 3 [2] Club 4 [2]γ 000700 0792 0114 -3378t-stat 0527 2275 0395 -2779(c) government expenditures convergence resultslog(t) All countriesγ -1075t-stat -1068Club classificationlog(t) Club 1 [5] Club 2 [11] Club 3 [6] Club 4 [3] Club 5 [2]γ 0284 0264 0113 0851 -0125t-stat 1016 1605 8963 9936 -0154Final classificationlog(t) Club 1 [5] Club 2 [11] Club 3 [9] Club 4 [2]γ 0284 0264 0169 -0125t-stat 1016 1605 1493 -0154
Note The table presents γ coefficient from log t regression together with t-statistics Marks a rejection of convergence at 5 level Numbers in brackets are number of countries in the club Club classification is a result of the initial clustering algorithm Final classification is a result after club merging Final classification is presented only when club merging is signifi-cant Countries that form different clubs are presented in figure 3
However we find strong evidence of club convergence Convergence clubs are implicitly included in discussions about the EU core and periphery as well as in the idea of two-speed recovery in Europe popularized by Blanchard (2010) We use the clustering algorithm of Phillips and Sul (2007 2009) to determine conver-gence clubs endogenously Results are presented in table 1 under Club classifica-tion section Countries that form convergence clubs are shown in figure 3
Table 1a presents results for government debt We find two convergence clubs one containing 19 and the other 9 countries The γ coefficient is statistically zero in the first and positive but less than 2 in the second club which indicates condi-tional convergence of clubs Similarly for government revenues three conver-
vla
dim
ir ar
ča
bić
fisca
l co
nv
erg
enc
e an
d susta
ina
bility in th
e eur
opea
n un
ion
pub
lic secto
r ec
on
om
ics
42 (4) 353-380 (2018)365gence clubs emerged and club sizes are 19 5 and 3 (table 1b) Ireland and Roma-
nia form a divergence group since they do not converge to any club For govern-ment expenditures club classification finds five clubs in total plus Ireland as a divergent group However clubs 3 and 4 can be merged together according to log t test so the final classification shows four convergence clubs plus Ireland (table 1c) Club sizes are 5 11 9 and 2 for Clubs 1 2 3 and 4 respectively In each case 0 le γ lt 2 indicating conditional convergence
Figure 2Rolling window estimation of log t regression
(a) Gov debt (b) Gov revenues
-9-8
-7-6
-5
2005q1 2008q1 2011q1 2014q1 2017q1
Time2log t coefficient
-9-8
-7-6
2005q1 2008q1 2011q1 2014q1 2017q1
Time2log t coefficient
(c) Gov expenditures
-12
-1-8
-6-4
-2
2005q1 2008q1 2011q1 2014q1 2017q1
Time2log t coefficient
Identified clubs are heterogeneous in a sense that countries within a club do not share common geographical political or development similarities In figure 3 we show countries that form different clubs The first row of figure 3 shows clubs from 1 to 4 and divergent groups The first column indicates fiscal variables gov-ernment debt revenues and expenditures Convergence clubs are in squares while divergent groups are in circles For example government debt Club 1 includes Croatia Cyprus Estonia Hungary Lithuania Romania Slovakia and Slovenia which are new member states mostly small countries and most of them experienced the transition from centrally planned to market economy However Austria Belgium Finland France Greece Ireland Italy Portugal Spain Swe-den and the UK are also members of the same club (government debt Club 1) Similar diversity can be found within other clubs
vla
dim
ir ar
ča
bić
fisca
l co
nv
erg
enc
e an
d susta
ina
bility in th
e eur
opea
n un
ion
pub
lic secto
r ec
on
om
ics
42 (4) 353-380 (2018)
366 Figure 3Convergence clubs
Club 1 Club 2
Gov
exp
endi
ture
s G
ov r
even
ues
Gov
deb
t
Club 3 Club 4 Group
Austria Belgium CroatiaCyprus Estionia FinlandFrance Greece HungaryIreland Italy Lithuania
Portugal Romania Slovakia Slovenia Spain
Sweden UK
Bulgaria CzechRepublic Denmark
Germany LatviaLuxembourg Malta
NetherlandsPoland
CyprusMaltaPoland
Spain UK
Austria CroatiaCyprus EstoniaHungary Italy
Portugal Slovakia Slovenia Spain
Sweden
Bulgaria CzechRepublic GermanyLatvia LuxembourgMalta Netherlands
Poland UK
BulgariaLithuania Ireland
Romania
Ireland
LithuaniaRomania
Austria Belgium CroatiaCzech Republic DenmarkEstionia Finland France
Germany Greece HungaryItaly Latvia Luxembourg
Netherlands Portugal Slovakia Slovenia Sweden
BelgiumDenmark
Finland FranceGreece
Note Convergence clubs are in squares non-convergent groups are in circles
We find a substantial degree of homogeneity in government debt revenues and expenditures clubs For example government debt Club 1 and government reve-nues Club 1 share 12 of 19 countries (figure 3) All eleven countries in govern-ment expenditures Club 2 are also in government debt Club 1 There is a major overlap between government debt Club 2 and government expenditures Club 3 Other similarities can also be observed in figure 3 Therefore clubs are heteroge-neous within countries but homogenous in fiscal variables
Endogenously identified clubs indeed show evidence of convergence but this is not the case for ad-hoc exogenous clubs First we group countries into EU-15 and EU-13 and apply the log t regression to government debt revenues and expendi-tures data The results reject convergence in all cases except for government debt in EU-13 where the γ coefficient is statistically equal to zero (0042 with a t-sta-tistic of 134) Next we group countries into EU core and periphery8 and use the log t test Convergence is strongly rejected in both groups for all three fiscal vari-ables It seems that countries converge to some criteria other than simply geo-graphical political or development similarities or indeed multiple similarities9 These results could be compared with Kočenda Kutan and Yigit (2008) who ana-lyze fiscal convergence in the ten EU countries that joined EU in 2004 They do not find a systematic difference among all EU countries EU core and EU periph-ery when analyzing fiscal convergence Delgado (2006) uses cluster analysis to group EU countries thus avoiding ad-hoc exogenous clubs but the paper does not tackle the issue of fiscal club convergence
8 EU core countries are Austria Belgium Denmark Finland France Germany Luxembourg Netherlands Sweden and UK Other 18 countries form EU periphery9 Analysis of factors and criteria to which countries converge is beyond the scope of this paper
vla
dim
ir ar
ča
bić
fisca
l co
nv
erg
enc
e an
d susta
ina
bility in th
e eur
opea
n un
ion
pub
lic secto
r ec
on
om
ics
42 (4) 353-380 (2018)367The log t regression improves upon the standard β-convergence tests but results are
compatible with such tests In figure 4 we show a simple scatter plot of government debt level and a growth rate which is a version of an unconditional β-convergence test For government debt Clubs 1 and 2 we estimate the equation of the form log (dTi d1i) = α + β d1i + εi where the dependent variable is the debt growth rate between the last and the first period and the independent variable is a debt level in the first period Club 1 is depicted with black circles and Club 2 with grey pluses As shown in the figure 4 regression lines for each club are negatively sloped indi-cating convergence within clubs according to the standard β-convergence test
Figure 4β-convergence in clubs
-1-5
05
11
5
Deb
t gro
wth
0 1 2 3 4 5Debt level
Club 1 Club 2
Beta convergence among clubs
32 unIt root tests of fIscal conVergenceTable 2 presents results of fiscal convergence using unit root tests for the sample of 28 EU countries and within clubs identified by the clustering algorithm For the government debt data we analyze convergence to the average for the full sample of the EU 28 then for the 19 countries of convergence club 1 and then for the 9 countries of club 2 (table 2a) A similar analysis is done for government revenues and expenditure in table 2b and 2c respectively For each club we compute a separate adjusted average Unit root rejection rates at 10 significance level are presented for ADF Lee and Strazicich (2003) and Enders and Lee (2012) test Rejection of the unit root hypothesis is considered evidence of convergence
vla
dim
ir ar
ča
bić
fisca
l co
nv
erg
enc
e an
d susta
ina
bility in th
e eur
opea
n un
ion
pub
lic secto
r ec
on
om
ics
42 (4) 353-380 (2018)
368 Table 2Club convergence using unit root tests2a Percent of countries converging to the average gov debt ()
adf lee amp strazicich enders amp leeEU [28] 357 357 714Club 1 [19] 000 526 526Club 2 [9] 2222 000 000
2b Percent of countries converging to the average gov revenues ()adf lee amp strazicich enders amp lee
EU [28] 3571 8571 4643Club 1 [19] 4211 9474 5789Club 2 [5] 4000 10000 4000Club 3 [2] 000 10000 10000
2c Percent of countries converging to the average gov expenditures ()adf lee amp strazicich enders amp lee
EU [28] 3929 7857 4643Club 1 [5] 4000 10000 4000Club 2 [11] 5455 9091 8181Club 3 [9] 3333 7778 5556Club 4 [2] 10000 10000 10000
Notes Rejection rates of unit root hypothesis at 10 level of significance are reported in the table Number of countries in a club is in brackets The rejection rate is calculated as ( of rejections of countries within a club)times100
We find neither absolute nor club convergence in government debt data because the difference of government debt against the average is stationary for just a few countries For the full sample of EU 28 unit root rejection rates are only 35 in the case of ADF and the Lee and Strazicich test and 7 for the Enders and Lee test Rejection rates within two clubs are not much different thus not supporting club convergence of government debt
In the case of government revenues and expenditures we do not find evidence of absolute convergence but club convergence is supported Almost half of countries in the EU 28 sample converge to the average ADF test has low power in the pres-ence of structural breaks but the unit root is rejected in 35 to 40 of countries for both series The Enders and Lee test has more power and rejects the unit root in 46 of countries Finally the Lee and Strazicich test with sharp structural breaks shows the biggest rejection rates of 78 and 85 For both government revenues and expenditures rejection rates within clubs are higher than in the full sample of EU 28 indicating stronger convergence within clubs This is especially true for Lee and Strazicich (2003) test where rejection rates are mostly over 90 within clubs indicating strong club convergence Enders and Lee (2012) test has rejection rates within clubs well over 50 except in government revenues club 2 and government expenditures club 1 ADF test gives somewhat mixed results but does not reject the club convergence hypothesis This confirms that convergence clubs using the Phillips and Sul (2007 2009) clustering algorithm are robust
vla
dim
ir ar
ča
bić
fisca
l co
nv
erg
enc
e an
d susta
ina
bility in th
e eur
opea
n un
ion
pub
lic secto
r ec
on
om
ics
42 (4) 353-380 (2018)369except for government debt As a comparison De Bandt and Mongelli (2000) use
cointegration techniques to analyze fiscal convergence in the Eurozone Their findings support fiscal convergence in the Eurozone over the 1970-1998 period Unit root tests which allow for nonlinearities have recently been a more popular way of analyzing convergence (see Raguž Krištić Rogić Dumančić and Arčabić (2018) and references therein)
33 fIscal (un)sustaInabIlItyNext we analyze if fiscal policy is sustainable in the European Union and within convergence clubs found in the previous section In this respect we use the policy response function from equation (9) which relates primary government surplus with public debt and the output gap If surplus increases as a response to an increase in public debt fiscal policy is considered sustainable as discussed in the methodology section
We analyze fiscal sustainability using seven different models (subsamples) Model 1 is the benchmark model which includes 28 EU countries Models 2 and 3 include subsamples of countries from government debt convergence clubs identi-fied in the previous section The first club consists of 19 and the second of 9 countries10 Next we consider fiscal policy sustainability within exogenous clubs of EU-15 and EU-13 countries with Models 4 and 5 Finally Models 6 and 7 use subsamples with government debt ge 90 (Model 6) and debt lt 90 of GDP (Model 7) This subsample analysis is motivated by the influential paper of Rein-hart and Rogoff (2010) who argue that a public debt higher than 90 of GDP depresses economic growth Maastricht criteria also require government debt below 60 of GDP However EU countries fought with the Great Recession and the sovereign debt crisis which substantially increased the level of public debt in some countries Our data show that 15 out of 28 EU countries had a government debt higher than 60 of GDP in 2017Q2 Therefore such subsample analysis is interesting from both an academic and a policy perspective The 90 level of public debt can be considered as arbitrary especially since Arčabić et al (2018) show there is no single level of public debt associated with the decrease of GDP growth However in this paper we are only interested in fiscal sustainability
Fiscal policy is found to be unsustainable in the EU We present the results of system GMM-CCE and FE estimators in tables 3 and 4 respectively Different models are numbered in the first row of each table and independent variables are in the first column In table 3 the estimated coefficient β1 next to the government debt is negative or insignificant In other words the government does not increase primary surplus as a response of higher government debt and fiscal policy is not sustainable We find weak evidence of fiscal sustainability for the EU-13 group countries and for the subsample with debt ge 90 For these two models (Models
10 We consider government debt convergence clubs only but clubs are fairly homogeneous between fiscal variables as discussed In addition some government revenues and expenditures convergence clubs include only a few countries which is impractical for panel data analysis
vla
dim
ir ar
ča
bić
fisca
l co
nv
erg
enc
e an
d susta
ina
bility in th
e eur
opea
n un
ion
pub
lic secto
r ec
on
om
ics
42 (4) 353-380 (2018)
370 5 and 6) point estimates are positive with both system GMM-CCE and FE estima-tor However coefficients are insignificant for system GMM-CCE estimator and point estimates are small in magnitude in both cases (tables 3 and 4)
Fiscal policy is countercyclical in the EU and in all subsamples considered Balas-sone Francese and Zotteri (2010) and Cassou Shadmani and Vaacutezquez (2017) use β2 coefficient next to the output gap to analyze cyclicality of fiscal policy As pre-sented in tables 3 and 4 the coefficient next to output gap is positive and statisti-cally significant in all models11 Positive output gaps are related to an increase in primary surplus which can be interpreted as a countercyclical fiscal policy This indicates that fiscal policy in the European Union tries to smooth business cycles
Fiscal policy is fairly persistent because the coefficient ρ next to the lagged sur-plus is positive statistically significant and roughly 05
11 Only Model 6 in table 4 has a positive but insignificant output gap
vla
dim
ir ar
ča
bić
fisca
l co
nv
erg
enc
e an
d susta
ina
bility in th
e eur
opea
n un
ion
pub
lic secto
r ec
on
om
ics
42 (4) 353-380 (2018)371
Ta
bl
e 3
Resu
lts o
f fisc
al su
stai
nabi
lity
anal
ysis
usi
ng sy
stem
GM
M-C
CE
mod
el
mod
els
mod
el 1
ben
chm
ark
mod
el 2
clu
b 1
mod
el 3
clu
b 2
mod
el 4
eu
-15
mod
el 5
eu
-13
mod
el 6
deb
t ge 9
0m
odel
7d
ebt lt
90
Varia
bles
Surp
lus
Surp
lus
Surp
lus
Surp
lus
Surp
lus
Surp
lus
Surp
lus
Surp
lus (
lagg
ed) (
ρ)0
502
(0
08)
041
5
(00
9)0
390
(0
10)
054
7
(00
6)0
308
(0
11)
057
3
(02
1)0
526
(0
10)
Deb
t (β 1)
-00
18(0
01)
-00
09(0
01)
-00
43(0
12)
-00
29(0
02)
004
0(0
03)
003
6(0
08)
-00
57
(00
3)
Out
put G
ap (β
2)0
286
(0
05)
041
3
(00
7)0
435
(0
13)
039
4
(00
4)0
388
(0
15)
029
7
(00
9)0
305
(0
07)
Con
stan
t0
776
(07
6)0
122
(10
6)2
030
(56
3)1
879
(12
3)-2
351
(1
15)
-42
98(8
69)
245
9
(14
4)O
bser
vatio
ns1
708
115
954
991
579
328
11
427
Num
ber o
f cou
ntrie
s28
199
15
13
926
F-te
st0
340
e-06
000
139
02
43e-
05 0
003
520
of
inst
rum
ents
2314
1114
11
11
20H
anse
n te
st0
222
010
00
371
017
50
102
050
60
166
Not
e S
tand
ard
erro
rs in
par
enth
eses
and
m
ark
stat
istic
al s
igni
fican
ce a
t 1
5
and
10
leve
l M
odel
1 is
the
benc
hmar
k m
odel
Mod
els
2 an
d 3
incl
ude
coun
trie
s fro
m e
ndog
enou
s deb
t con
verg
ence
clu
bs 1
and
2 r
espe
ctiv
ely
Mod
els 4
and
5 in
clud
e EU
-15
and
EU-1
3 co
untr
ies
and
mod
els 6
and
7 in
clud
e su
bsam
ples
with
go
vern
men
t deb
t ge 9
0 a
nd d
ebt lt
90
of G
DP
resp
ectiv
ely
vla
dim
ir ar
ča
bić
fisca
l co
nv
erg
enc
e an
d susta
ina
bility in th
e eur
opea
n un
ion
pub
lic secto
r ec
on
om
ics
42 (4) 353-380 (2018)
372
Ta
bl
e 4
Resu
lts o
f fisc
al su
stai
nabi
lity
anal
ysis
usi
ng F
E m
odel
mod
els
mod
el 1
ben
chm
ark
mod
el 2
clu
b 1
mod
el 3
clu
b 2
mod
el 4
eu
-15
mod
el 5
eu
-13
mod
el 6
deb
t ge 9
0m
odel
7d
ebt lt
90
Varia
bles
Surp
lus
Surp
lus
Surp
lus
Surp
lus
Surp
lus
Surp
lus
Surp
lus
Surp
lus (
lagg
ed) (
ρ)0
512
(0
06)
051
5
(00
7)0
491
(0
12)
063
7
(00
4)0
336
(0
07)
024
8
(01
0)0
611
(0
09)
Deb
t (β 1)
000
6(0
01)
000
4(0
01)
002
5(0
02)
000
3(0
00)
002
9
(00
1)0
031
(0
01)
-00
09(0
01)
Out
put G
ap (β
2)0
176
(0
04)
017
2
(00
4)0
209
(0
09)
022
6
(00
3)0
197
(0
05)
021
3(0
12)
013
3
(00
4)
Con
stan
t-0
614
(0
36)
-07
13(0
42)
-09
98(0
71)
-03
27(0
35)
-18
31
(0
40)
-39
51
(14
8)0
168
(06
3)O
bser
vatio
ns1
708
115
954
991
579
328
11
427
R-s
quar
ed0
304
029
80
335
045
70
173
012
30
384
Num
ber o
f cou
ntrie
s28
199
1513
926
Not
e S
tand
ard
erro
rs in
par
enth
eses
and
m
ark
stat
istic
al s
igni
fican
ce a
t 1
5
and
10
leve
l M
odel
1 is
the
benc
hmar
k m
odel
Mod
els
2 an
d 3
incl
ude
coun
trie
s fro
m e
ndog
enou
s deb
t con
verg
ence
clu
bs 1
and
2 r
espe
ctiv
ely
Mod
els 4
and
5 in
clud
e EU
-15
and
EU-1
3 co
untr
ies
and
mod
els 6
and
7 in
clud
e su
bsam
ples
with
go
vern
men
t deb
t ge 9
0 a
nd d
ebt lt
90
of G
DP
resp
ectiv
ely
vla
dim
ir ar
ča
bić
fisca
l co
nv
erg
enc
e an
d susta
ina
bility in th
e eur
opea
n un
ion
pub
lic secto
r ec
on
om
ics
42 (4) 353-380 (2018)3734 conclusIon
The Great Recession and the sovereign debt crisis in the Eurozone have shaken fiscal policies in the EU Many European countries have breached public debt and deficit goals set by the Stability and Growth Pact Therefore the issue of fiscal policy convergence and sustainability is very important for the EU
This paper analyzes fiscal policy convergence and tests for fiscal sustainability in 28 EU countries using data on government debt revenues and expenditures We show absolute divergence in fiscal policies which was further increased by the Great Recession and the sovereign debt crisis However we find strong evidence of club convergence Club convergence is important to consider because the EU does not have a single fiscal policy and member state policies are heterogeneous In general convergence clubs are implicitly included in discussions on the EU core and periphery and in the two-speed recovery idea which argues that different groups (or clubs) of European countries are characterized by faster and slower recoveries from the recession We find two government debt convergence clubs three government revenue clubs and four government expenditure clubs Endog-enously identified clubs do not have simple geographical political or development similarities They are heterogeneous within countries but homogenous between fiscal variables Exogenous grouping of EU countries into EU-15 and EU-13 or into EU core and periphery does not show evidence of fiscal convergence Conver-gence clubs are related to multiple equilibriums within the EU which makes a single fiscal policy difficult to achieve More precise fiscal rules could be consid-ered by policymakers together with corrective measures such as the Excessive Deficit Procedure Fiscal rules instead of discretionary decision making might be a step toward similar fiscal policies and fiscal convergence in the EU
Fiscal policy in the EU is found to be unsustainable but countercyclical We use a policy response function for the sustainability analysis where primary surplus is a function of government debt and the output gap We show that surplus does not respond to an increase in government debt which cannot be interpreted as sustain-able However primary government surplus increases in expansions and decreases in recession thus being countercyclical and aimed at smoothing business cycles In this respect the fiscal goals for public debt and deficit set by the Stability and Growth Pact may not be enough to ensure fiscal sustainability More precise fiscal rules together with corrective measures would be helpful for both fiscal sustaina-bility and convergence
disclosure statement No potential conflict of interest was reported by the author
vla
dim
ir ar
ča
bić
fisca
l co
nv
erg
enc
e an
d susta
ina
bility in th
e eur
opea
n un
ion
pub
lic secto
r ec
on
om
ics
42 (4) 353-380 (2018)
374 aPPendIX
data constructIon and sourcesFor the convergence analysis we use data on general government debt revenues and expenditures Variables are in millions of euro current prices We divide all by nominal GDP to express fiscal variables in real terms and in a percent of GDP The main data source is Eurostat and the International Financial Statistics data-base from the International Monetary Fund All data span the period from 2000q1 to 2017q2 but some data have been reconstructed For Germany Estonia Ire-land and Luxemburg we interpolate annual data for 2000 and 2001 since quar-terly data start from 2002q1 For Austria we interpolate annual data for 2000 since quarterly data start from 2001q1 For Croatia we reconstruct monthly data on central government expenditure and revenue based on the old methodology The data are provided by Croatian National Bank (CNB) and we use central gov-ernment data as a proxy for the general government Nominal GDP is taken from the Eurostat database except for Croatia Malta and Poland for which we take the data from IFS Public debt data are entirely taken from the Eurostat database Public debt is usually expressed as a percent of GDP on annual bases Therefore public debt is divided by a sum of GDP in a current and previous three quarters or where dt is public debt in a percent of GDP $dt and $yt are nominal debt and GDP in millions of euro We use this approach for the sustainability analysis when the sample starts in 2002q1 For the convergence analysis where the sample starts in 2000q1 we divide public debt only by current quarter GDP to maximize number of observations or dt = ($dt $yt ) times 100 For the sustainability analysis we also use primary surplus and real GDP data from Euro-stat All the data span the period from 2002q1 to 2017q2 (balanced panel) Below we plot time series of government revenues and expenditures (figure A1) and primary surplus and government debt (figure A2) in a percent of GDP Table A1 contains basic descriptive statistics
vla
dim
ir ar
ča
bić
fisca
l co
nv
erg
enc
e an
d susta
ina
bility in th
e eur
opea
n un
ion
pub
lic secto
r ec
on
om
ics
42 (4) 353-380 (2018)375
Fig
ur
e a
1G
over
nmen
t rev
enue
s and
exp
endi
ture
s as a
per
cent
of G
DP
Rev
enue
sEx
pend
iture
s
BE
L
2000
2002
2004
2006
2008
2010
2012
2014
2017
046
048
050
052
054
056
058
060
BU
L
2000
2002
2004
2006
2008
2010
2012
2014
2017
027
50
300
032
50
350
037
50
400
042
50
450
047
5C
ZE
2000
2002
2004
2006
2008
2010
2012
2014
2017
035
040
045
050
055
060
065
DE
N
2000
2002
2004
2006
2008
2010
2012
2014
2017
048
050
052
054
056
058
060
GE
R
2000
2002
2004
2006
2008
2010
2012
2014
2017
040
042
044
046
048
050
052
EST
2000
2002
2004
2006
2008
2010
2012
2014
2017
030
00
325
035
00
375
040
00
425
045
00
475
050
00
525
IRE
2000
2002
2004
2006
2008
2010
2012
2014
2017
02
03
04
05
06
07
08
GR
E
2000
2002
2004
2006
2008
2010
2012
2014
2017
035
040
045
050
055
060
065
070
075
080
SPA
2000
2002
2004
2006
2008
2010
2012
2014
2017
032
50
350
037
50
400
042
50
450
047
50
500
052
5FR
A
2000
2002
2004
2006
2008
2010
2012
2014
2017
048
050
052
054
056
058
CR
O
2000
2002
2004
2006
2008
2010
2012
2014
2017
035
040
045
050
055
060
065
ITA
2000
2002
2004
2006
2008
2010
2012
2014
2017
040
042
044
046
048
050
052
CY
P
2000
2002
2004
2006
2008
2010
2012
2014
2017
03
04
05
06
07
08
LA
T
2000
2002
2004
2006
2008
2010
2012
2014
2017
030
00
325
035
00
375
040
00
425
045
00
475
LIT
2000
2002
2004
2006
2008
2010
2012
2014
2017
030
00
325
035
00
375
040
00
425
045
00
475
050
00
525
LU
X
2000
2002
2004
2006
2008
2010
2012
2014
2017
032
50
350
037
50
400
042
50
450
047
5H
UN
2000
2002
2004
2006
2008
2010
2012
2014
2017
040
042
044
046
048
050
052
054
056
MA
L
2000
2002
2004
2006
2008
2010
2012
2014
2017
030
035
040
045
050
055
NE
T
2000
2002
2004
2006
2008
2010
2012
2014
2017
038
040
042
044
046
048
050
AU
S
2000
2002
2004
2006
2008
2010
2012
2014
2017
042
50
450
047
50
500
052
50
550
057
50
600
POL
2000
2002
2004
2006
2008
2010
2012
2014
2017
036
038
040
042
044
046
048
POR
2000
2002
2004
2006
2008
2010
2012
2014
2017
035
040
045
050
055
060
065
RO
M
2000
2002
2004
2006
2008
2010
2012
2014
2017
027
50
300
032
50
350
037
50
400
042
50
450
SLO
2000
2002
2004
2006
2008
2010
2012
2014
2017
040
045
050
055
060
065
070
075
080
085
SVK
2000
2002
2004
2006
2008
2010
2012
2014
2017
032
50
350
037
50
400
042
50
450
047
50
500
052
50
550
FIN
2000
2002
2004
2006
2008
2010
2012
2014
2017
046
048
050
052
054
056
058
060
SWE
2000
2002
2004
2006
2008
2010
2012
2014
2017
048
050
052
054
056
058
UK
2000
2002
2004
2006
2008
2010
2012
2014
2017
034
036
038
040
042
044
046
048
050
vla
dim
ir ar
ča
bić
fisca
l co
nv
erg
enc
e an
d susta
ina
bility in th
e eur
opea
n un
ion
pub
lic secto
r ec
on
om
ics
42 (4) 353-380 (2018)
376
Fig
ur
e a
2Pr
imar
y su
rplu
s and
gov
ernm
ent d
ebt a
s a p
erce
nt o
f GD
P B
EL
2002
2004
2006
2008
2010
2012
2014
2017
-75
-50
-2500
25
50
75
875
900
925
950
975
100
010
25
105
010
75
110
0B
UL
2002
2004
2006
2008
2010
2012
2014
2017
-12
5-1
00
-75
-50
-2500
25
50
75
100
10203040506070C
ZE
2002
2004
2006
2008
2010
2012
2014
2017
-12
-10-8-6-4-2024
250
275
300
325
350
375
400
425
450
475
DE
N
2002
2004
2006
2008
2010
2012
2014
2017
-4-202468
2025303540455055G
ER
2002
2004
2006
2008
2010
2012
2014
2017
-6-4-2024
55606570758085
EST
2002
2004
2006
2008
2010
2012
2014
2017
-8-6-4-202468
34567891011IR
E
2002
2004
2006
2008
2010
2012
2014
2017
-50
-40
-30
-20
-10010
20406080100
120
140
GR
E
2002
2004
2006
2008
2010
2012
2014
2017
-30
-25
-20
-15
-10-50510
100
110
120
130
140
150
160
170
180
190
SPA
2002
2004
2006
2008
2010
2012
2014
2017
-12
-10-8-6-4-20246
30405060708090100
110
FRA
2002
2004
2006
2008
2010
2012
2014
2017
-6-5-4-3-2-101
556065707580859095100
CR
O
2002
2004
2006
2008
2010
2012
2014
2017
-6-4-20246
30405060708090IT
A
2002
2004
2006
2008
2010
2012
2014
2017
-2-1012345
100
105
110
115
120
125
130
135
CY
P
2002
2004
2006
2008
2010
2012
2014
2017
-35
-30
-25
-20
-15
-10-50510
405060708090100
110
LA
T
2002
2004
2006
2008
2010
2012
2014
2017
-10-8-6-4-2024
5101520253035404550L
IT
2002
2004
2006
2008
2010
2012
2014
2017
-20
-15
-10-505
1015202530354045
LU
X
2002
2004
2006
2008
2010
2012
2014
2017
-4-20246
51015202530H
UN
2002
2004
2006
2008
2010
2012
2014
2017
-12
5-1
00
-75
-50
-2500
25
50
75
5055606570758085M
AL
2002
2004
2006
2008
2010
2012
2014
2017
-15
0-1
25
-10
0-7
5-5
0-2
500
25
50
75
550
575
600
625
650
675
700
725
NE
T
2002
2004
2006
2008
2010
2012
2014
2017
-5-4-3-2-101234
40455055606570A
US
2002
2004
2006
2008
2010
2012
2014
2017
-8-6-4-2024
60657075808590
POL
2002
2004
2006
2008
2010
2012
2014
2017
-7-6-5-4-3-2-1012
350
375
400
425
450
475
500
525
550
575
POR
2002
2004
2006
2008
2010
2012
2014
2017
-15
-10-50510
5060708090100
110
120
130
140
RO
M
2002
2004
2006
2008
2010
2012
2014
2017
-10
0-7
5-5
0-2
500
25
50
10152025303540SL
O
2002
2004
2006
2008
2010
2012
2014
2017
-35
-30
-25
-20
-15
-10-505
2030405060708090SV
K
2002
2004
2006
2008
2010
2012
2014
2017
-8-6-4-202
2530354045505560
FIN
2002
2004
2006
2008
2010
2012
2014
2017
-4-20246810
253035404550556065SW
E
2002
2004
2006
2008
2010
2012
2014
2017
-2-10123456
303540455055U
K
2002
2004
2006
2008
2010
2012
2014
2017
-10-8-6-4-202
30405060708090100
Prim
ary
surp
lus
Publ
ic d
ebt (
right
axi
s)
vla
dim
ir ar
ča
bić
fisca
l co
nv
erg
enc
e an
d susta
ina
bility in th
e eur
opea
n un
ion
pub
lic secto
r ec
on
om
ics
42 (4) 353-380 (2018)377Table a1
Descriptive statistics
country revenues expenditures debt surplusmean st dev mean st dev mean st dev mean st dev
Belgium 0498 0014 0519 0029 102371 6191 1489 2662Bulgaria 0375 0032 0378 0035 25430 12762 0809 3995Czech R 0397 0021 0427 0030 34493 6377 -1570 2538Denmark 0542 0012 0537 0025 41284 6727 2350 2937Germany 0439 0011 0453 0017 69791 6443 0853 1749Estonia 0380 0027 0376 0035 6770 2386 0605 2605Ireland 0331 0031 0374 0095 63992 35900 -3019 8925Greece 0427 0042 0501 0052 135084 31814 -2996 4643Spain 0380 0016 0417 0035 64440 24433 -1729 4398France 0506 0016 0544 0023 78400 13788 -1601 1526Croatia 0433 0030 0478 0030 56491 19248 -1880 2281Italy 0453 0019 0485 0019 115085 12457 1345 1277Cyprus 0365 0030 0395 0055 73230 21307 -0192 5510Latvia 0352 0022 0374 0036 26770 14433 -1088 3003Lithuania 0341 0013 0367 0039 28502 10293 -1275 3675Luxembourg 0434 0013 0418 0026 14941 7215 1360 1821Hungary 0444 0021 0490 0023 69585 8796 -0745 3255Malta 0384 0020 0416 0023 66048 4001 0266 2870Netherlands 0429 0009 0446 0021 56298 8245 -0165 2086Austria 0489 0012 0513 0019 76310 6738 0363 1796Poland 0395 0013 0435 0018 48860 5134 -1724 1608Portugal 0415 0021 0469 0035 92343 30325 -1906 3499Romania 0335 0016 0367 0033 25756 10096 -1550 3267Slovenia 0434 0010 0472 0048 44276 22349 -1759 4888Slovakia 0373 0024 0417 0039 43263 8989 -1969 2157Finland 0531 0013 0520 0040 46337 10241 1891 3288Sweden 0520 0019 0515 0016 42539 4814 1568 1730UK 0378 0012 0420 0036 60967 22826 -2558 2478
vla
dim
ir ar
ča
bić
fisca
l co
nv
erg
enc
e an
d susta
ina
bility in th
e eur
opea
n un
ion
pub
lic secto
r ec
on
om
ics
42 (4) 353-380 (2018)
378 references1 Arčabić V [et al] 2018 Public Debt and Economic Growth Conundrum
Nonlinearity and Inter-temporal Relationship Studies in nonlinear dynamics and econometrics 22(1) pp 1-20 httpsdoiorg101515snde-2016-0086
2 Arellano M and Bover O 1995 Another look at the instrumental variable estimation of error-components models Journal of econometrics 68(1) pp 29-51 httpsdoiorg1010160304-4076(94)01642-D
3 Babić A 2003 Dynamic analysis of Croatiarsquos fiscal and external debt Privredna kretanja i ekonomska politika 13(97) pp 77-126 Available at lthttpshrcaksrcehrfile28961gt
4 Balassone F Francese M and Zotteri S 2010 Cyclical asymmetry in fiscal variables in the EU Empirica 37(4) pp 381-402 httpsdoiorg101007s10663-009-9114-7
5 Bernard A B and Durlauf S N 1995 Convergence in international out-put Journal of applied econometrics 10(2) pp 97-108 httpsdoiorg 101002jae3950100202
6 Bernard A B and Durlauf S N 1996 Interpreting tests of the convergence hypothesis Journal of econometrics 71(1-2) pp 161-173 httpsdoiorg 1010160304-4076(94)01699-2
7 Blanchard O 2010 Interview IMF Survey Two-speed Recovery to Extend into 2011 Says IMF In International Monetary Fund December 30 2010 Available at lthttpswwwimforgenNewsArticles201509280453sonew123010agt
8 Blundell R and Bond S 1998 Initial conditions and moment restrictions in dynamic panel data models Journal of econometrics 87(1) pp 115-143 httpsdoiorg101016S0304-4076(98)00009-8
9 Bohn H 1998 The behavior of US public debt and deficits The Quarterly Journal of economics 113(3) pp 949-963 httpsdoiorg101162003355 398555793
10 Bohn H 2005 The Sustainability of Fiscal Policy in the United States CESifo Group Munich Working paper No 1446 Available at lthttpwwwcesifo-groupdeDocDLcesifo1_wp1446pdfgt
11 Bohn H 2007 Are stationarity and cointegration restrictions really neces-sary for the intertemporal budget constraint Journal of monetary economics 54(7) pp 1837-1847 httpsdoiorg101016jjmoneco200612012
12 Cassou S P Shadmani H and Vaacutezquez J 2017 Fiscal policy asymmetries and the sustainability of US government debt revisited Empirical econom-ics 53(3) pp 1193-1215 httpsdoiorg101007s00181-016-1159-4
13 Collignon S 2012 Fiscal policy rules and the sustainability of public debt in Europe International economic review 53(2) pp 539-567 httpsdoiorg 101111j1468-2354201200691x
14 De Bandt O and Mongelli F 2000 Convergence of fiscal policies in the euro area European Central Bank Working paper No 20 Available at lt https
vla
dim
ir ar
ča
bić
fisca
l co
nv
erg
enc
e an
d susta
ina
bility in th
e eur
opea
n un
ion
pub
lic secto
r ec
on
om
ics
42 (4) 353-380 (2018)379wwwecbeuropaeupubpdfscpwpsecbwp020pdffb62cab7f4d858d8e528
47b202892351gt 15 Delgado F 2006 Are the tax mix and the fiscal pressure converging in the
European Union Instituto de Estudios Fiscales Working paper No 11-0616 Deskar-Škrbić M and Šimović H 2017 Effectiveness of fiscal spending in
Croatia Slovenia and Serbia The role of trade openness and public debt level Post-communist economies 29(3) pp 336-358 httpsdoiorg1010801463137720161267972
17 Du K 2017 Econometric convergence test and club clustering using Stata Stata journal 17(4) pp 882-900 Available at lt httpsmedmahidolacthcebsitesdefaultfilespublicpdfstata_journalsj17-4pdfgt
18 Enders W and Lee J 2012 A unit root test using a Fourier series to approx-imate smooth breaks Oxford bulletin of economics and statistics 74(4) pp 574-599 httpsdoiorg101111j1468-0084201100662x
19 Hamilton J D and Flavin M A 1986 On the Limitations of Government Borrowing A Framework for Empirical Testing American economic review 76(4) pp 808-819
20 Hodrick R J and Prescott E C 1997 Postwar US business cycles an empirical investigation Journal of money credit and banking pp 1-16 httpsdoiorg1023072953682
21 Kočenda E Kutan A M and Yigit T M 2008 Fiscal convergence in the European Union The North American journal of Economics and finance 19(3) pp 319-330 httpsdoiorg101016jnajef200806003
22 Lee J and Strazicich M C 2003 Minimum Lagrange multiplier unit root test with two structural breaks Review of economics and statistics 85(4) pp 1082-1089 httpsdoiorg101162003465303772815961
23 Mihaljek D 2003 Analysis of public and external debt sustainability for Croatia Application of standard financial indicators Privredna kretanja i ekonomska politika 13(97) pp 29-75 Available at lthttpshrcaksrcehrfile28958gt
24 Perron P 1989 The great crash the oil price shock and the unit root hypoth-esis Econometrica pp 1361-1401 httpsdoiorg1023071913712
25 Pesaran M H (2006) Estimation and inference in large heterogeneous pan-els with a multifactor error structure Econometrica 74(4) pp 967-1012 httpsdoiorg101111j1468-0262200600692x
26 Pesaran M H 2007 A pair-wise approach to testing for output and growth convergence Journal of econometrics 138(1) pp 312-355 httpsdoiorg 101016jjeconom200605024
27 Pesaran M H 2015 Testing weak cross-sectional dependence in large pan-els Econometric reviews 34(6-10) pp 1089-1117 httpsdoiorg101080074749382014956623
28 Phillips P C and Sul D 2007 Transition modeling and econometric conver-gence tests Econometrica 75(6) pp 1771-1855 httpsdoiorg101111 j1468-0262200700811x
vla
dim
ir ar
ča
bić
fisca
l co
nv
erg
enc
e an
d susta
ina
bility in th
e eur
opea
n un
ion
pub
lic secto
r ec
on
om
ics
42 (4) 353-380 (2018)
380 29 Phillips P C and Sul D 2009 Economic transition and growth Journal of applied econometrics 24(7) pp 1153-1185 httpsdoiorg101002jae1080
30 Raguž Krištić I Rogić Dumančić L and Arčabić V 2018 Persistence and stochastic convergence of euro area unemployment rates Economic Model-ling httpsdoiorg101016jeconmod201807032
31 Reinhart C M and Rogoff K S 2010 Growth in a Time of Debt American economic review 100(2) pp 573-78 httpsdoiorg101257aer1002573
32 Trehan B and Walsh C E 1988 Common trends the governmentrsquos budget constraint and revenue smoothing Journal of economic dynamics and con-trol 12(2-3) pp 425-444 httpsdoiorg1010160165-1889(88)90048-6
Efficiency vs effectiveness an analysis of tertiary education across Europe
OZANA NADOVEZA JELIĆ PhDMARGARETA GARDIJAN KEDŽO PhD
ArticleJEL I21 I22 I23httpsdoiorg103326pse4242
The authors would like to thank two anonymous referees for helpful comments on the paper Received June 1 2018
Accepted October 21 2018
The article was submitted for the 2018 annual award of the Prof Dr Marijan Hanžeković Prize
Ozana NADOVEZA JELIĆUniversity of Zagreb Faculty of Economics and Business Trg J F Kennedyja 6 10000 Zagreb Croatiae-mail onadovezaefzghr ORCiD 0000-0002-3651-7795
Margareta GARDIJAN KEDŽOUniversity of Zagreb Faculty of Economics and Business Trg J F Kennedyja 6 10000 Zagreb Croatiae-mail mgardijanefzghrORCiD 0000-0001-5390-057X
oza
na n
ad
ov
eza jelić ma
rg
ar
eta ga
rd
ijan k
edžo
efficien
cy v
s effectiv
eness a
n an
aly
sis of tertia
ry edu
catio
n ac
ro
ss eur
ope
pub
lic secto
r ec
on
om
ics
42 (4) 381-414 (2018)
382 abstractThis paper deals with tertiary education efficiency and effectiveness across 24 European Union countries in four sub-periods between 2004 and 2015 The effi-ciency scores are computed using Data Envelopment Analysis (DEA) We try to raise awareness of the quality and not of the quantity of educational outputs and inputs by introducing quality-based correction of the DEA efficiency score which we regard as effectiveness Our results show that quality considerations affect the relative positions of countries regarding their efficiency scores In other words some less developed countries which are efficient in the quantity-based model fail to reach the defined efficiency border when considering some quality indica-tors of outputs On the other hand some inefficient developed countries increase their DEA-based ranking and achieve effectiveness (quality-based efficiency) The same is true for input quality considerations Since tertiary education cannot be expected to provide the same quality of outcomes with different input qualities efficiency improves (deteriorates) in the input-output quality-based model in many countries with low (high) quality student bases
Keywords tertiary education data envelopment analysis educational efficiency and effectiveness EU
1 IntroductIonIt is a well-established fact that the quality of education matters more than quan-tity Fortunato and Panizza (2015) argue that the sharp increase in cross-country average years of schooling might not accurately represent actual educational gains According to Pritchett (2013) as cited in Fortunato and Panizza (2015) an increase in years of education in less developed countries as opposed to devel-oped countries is not always transmitted into educational benefits This view is also supported by many relatively recent papers such as Hanushek and Kimko (2000) Barro (2001) Woumlszligmann (2006) Altinok Diebolt and Demeulemeester (2014) Barro (2013) whereas Barro (2013) concludes that the ldquoquality and quan-tity of schooling both matter for growth but quality is much more importantrdquo Additionally Pritchett (2001) who was not able to prove a positive association between increasing educational attainment and per capita income growth argues that it could be that the educational quality was so low that ldquoyears of schoolingrdquo have created no human capital
Due to the importance of educational services for growth attitudes and political and social awareness they are provided and publicly financed to a greater or lesser extent by practically all governments around the world Additionally educational externalities are a textbook example of market failure and one of the most impor-tant motives behind government intervention in this sector According to Szirmai (2015) after World War II expansion and improvement of education were gener-ally considered essential to development The awareness about the role of educa-tion in the development process resulted in a far reaching education expansion Over the course of time increased government expenditures on education trans-
oza
na n
ad
ov
eza jelić ma
rg
ar
eta ga
rd
ijan k
edžo
efficien
cy v
s effectiv
eness a
n an
aly
sis of tertia
ry edu
catio
n ac
ro
ss eur
ope
pub
lic secto
r ec
on
om
ics
42 (4) 381-414 (2018)383lated into higher levels of education Consequently higher education enrolments
have grown significantly over the last three decades According to World Bank (2018) data the world gross enrolment ratio in tertiary education1 grew from 13 to 35 during the 1985-2015 period Growth has been even more impressive in the European Union (EU) where the average annual growth rate of the gross enrolment ratio in tertiary education reached 35 This has led to an increase in the gross enrolment ratio in tertiary education from 25 in 1985 to 68 in 2014
However as Szirmai (2015) puts it ldquoSince the 1970s optimism about the contribu-tions of education has been shaken and more emphasis is given to improving the quality of educationrdquo This author notices that not all educational investments are effective and efficient in the development process Due to the potential ineffective-ness of educational inputs the quality of education can be unsatisfactory Thus the rising educational coverage and duration of education as well as government and even private educational expenditures are not always efficiently transmitted into higher productivity and wages growth rates and better institutions Therefore it can be argued it is not quantity that underlies the successful exploitation of all forms of educational benefits but the quality and the effectiveness of the educational inputs and investments Although efficiency and effectiveness are similar concepts they are not synonyms Viljoen (cited in Kenny 2008) defined efficiency as relating to ldquohow well an activity or operation is performedrdquo The term effectiveness relates to performing the correct activity or operation In other words ldquoefficiency measures how well an organization does what it does but effectiveness raises value questions about what the organization should be doing in the first placerdquo
There is a significant body of literature which deals with the efficiency of all levels of the national educational systems in the EU Many of those studies chose to use data envelopment analysis (DEA) in their methodological approach because DEA as a nonparametric method of mathematical programming enables the cal-culation of the relative efficiency of quite homogenous and comparable units given multiple criteria These criteria dictate the choice of certain input variables whose values are preferred to be as small as possible and certain output variables whose values are preferred to be as great as possible The choice of the criteria and consequently the choice of the variables defines the concept of the research
Conclusions of various DEA-based studies sometimes differ significantly which makes it impossible to draw general conclusions concerning tertiary educational efficiency at the EU level Differences in conclusions mostly arise from the diverse selection of inputs and outputs considered within different studies Additionally some papers deal with a narrow sample of countries (eg Ahec Šonje Deskar-Škrbić and Šonje 2018 Yotova and Stefanova 2017) ie homogenous countries with similar development levels and others deal with a broader and more or less
1 Total enrolment in tertiary education (ISCED 5 to 8) regardless of age expressed as a percentage of the total population of the five-year age group following on from secondary school leaving
oza
na n
ad
ov
eza jelić ma
rg
ar
eta ga
rd
ijan k
edžo
efficien
cy v
s effectiv
eness a
n an
aly
sis of tertia
ry edu
catio
n ac
ro
ss eur
ope
pub
lic secto
r ec
on
om
ics
42 (4) 381-414 (2018)
384 heterogeneous set of countries which can also affect the difference in the results (Aubyn et al 2009 Aristovnik and Obadić 2011 and Toth 2009)
Still most of the papers that use the DEA approach make comparisons on tertiary education between countries considering only the definition of efficiency Some papers deal with quality issues but mostly on the output side of the educational ldquoproduction functionrdquo Therefore questions regarding the quality of educational inputs and outputs and their effectiveness are usually covered only partially In this paper we argue that a greater focus on efficiency can give misleading results that could translate into flawed educational policy prescriptions
The paper is organized as follows The second section summarizes previous research findings The third section gives the rationale for selected inputs and outputs as well as a glimpse of the educational inputs and outputs in the EU The fourth section deals with the methodology and the fifth presents and discusses the main results The last part of the paper provides comments on policy implications and future research recommendations
2 lIterature oVerVIewDEA is a generally suitable method for a country-level public sector efficiency evaluation2 and it is commonly used and widely accepted as an appropriate analy-sis approach in the tertiary education efficiency research For example to rank eleven Eastern European countries according to their tertiary education efficiency during the 2005-2013 period Ahec Šonje Deskar-Škrbić and Šonje (2018) use input-oriented DEA with variable returns to scale (VRS) The authors use expend-iture on tertiary education per pupil in the percentage of GDP per capita as an input variable and the share of unemployed with tertiary education in the total number of unemployed (model 1) and World University Ranking list as an alterna-tive output measure (model 2) However the authors consider models with only one input and one output variable which limits the possibility of making more general conclusions
Yotova and Stefanova (2017) used the same method on a set of countries similar to that chosen by Ahec Šonje Deskar-Škrbić and Šonje (2018) As an input vari-able authors used total expenditures on tertiary education per student as a percent-age of per capita GDP in 2012 while the set of educational outputs variables included three indicators tertiary educational attainment (age 25-34) the employ-ment rate of the population with tertiary education outside the risk of poverty and social exclusion and the mean monthly earnings of a person with tertiary educa-tion as a share in per capita GDP in 2014 Again the analysis is limited to one input and one output It should be noted that both studies include some educa-
2 We wonrsquot go in any details regarding the broader usage of DEA in public sector efficiency evaluations How-ever interested reader can refer to the following research in this area Clements (2002) Afonso and St Aubyn (2006) Aristovnik (2013a 2013b) Aristovnik and Obadić (2014) etc
oza
na n
ad
ov
eza jelić ma
rg
ar
eta ga
rd
ijan k
edžo
efficien
cy v
s effectiv
eness a
n an
aly
sis of tertia
ry edu
catio
n ac
ro
ss eur
ope
pub
lic secto
r ec
on
om
ics
42 (4) 381-414 (2018)385tional output quality indicators but they do not consider any educational input
quality measures which could lead to biased results and conclusions
Toth (2009) analyzed the efficiency of tertiary education in 20 EU countries in 2006 using output-oriented DEA with variable returns to scale (VRS) The author used a ratio of expenditures spent on higher education to GDP as an educational input and the ratio of people with a degree to the total population as well as the employment rate of people with a degree as educational output variables Beside standard outputs and inputs the author used two non-discretionary variables (parental educational attainment and public-to-total expenditure GDP per capita in current US$) However Tothrsquos (2009) results differ significantly from other related studies that include EU countries3 She found that for example Denmark and Italy (among others) share the first position regarding tertiary education effi-ciency in 20 analyzed EU countries while Aristovnik and Obadić (2011) and Aubyn et al (2009) rank these countries as relatively inefficient
Aristovnik and Obadić (2011) used output oriented DEA with variable returns to scale (VRS) to assess tertiary education efficiency in a broad set of countries (selected group of EU and OECD countries) during the 1999-2007 period The analysis included input data on expenditure per student (tertiary of GDP per capita) school enrolment (tertiary gross) and outputoutcome data ie school enrolment (tertiary gross) labor force with a tertiary education ( of total) and the unemployed with a tertiary education ( of total unemployment) To assess technical efficiency regarding different inputs and outputsoutcome the authors tested three Two out of three considered outputs are standard educational quantity output indicators while the last can be regarded as a quality indicator In the con-clusion authors emphasize the need to consider some educational quality data
The most comprehensive study employing DEA methodology to assess the effi-ciency of the tertiary education in a broad set of countries is authored by Aubyn et al (2009) The authors used two approaches input and output-oriented DEA with variable returns to scale (VRS) The analysis is conducted over two subperiods 1998-2001 and 2002-2005 In the first model authors used a number of academic staff and students as inputs while the second model considered spending in pri-vate government-dependent institutions (in of GDP) as an input variable A weighted number of graduates and a weighted number of published articles were used as output variables in both models All educational inputs and outputs con-sidered in this paper can be regarded as quantitative However the study includes a number of non-discretionary measures such as selection of students budget autonomy staff policy output flexibility evaluation funding rules and PISA results4 which can be seen as qualitative measures (mostly) of inputs
3 See table A1 in appendix4 For detailed explanation of variables see Aubyn et al (2009)
oza
na n
ad
ov
eza jelić ma
rg
ar
eta ga
rd
ijan k
edžo
efficien
cy v
s effectiv
eness a
n an
aly
sis of tertia
ry edu
catio
n ac
ro
ss eur
ope
pub
lic secto
r ec
on
om
ics
42 (4) 381-414 (2018)
386 It should be noted that conclusions differ in the abovementioned papers which makes it impossible for us to draw any general conclusions on tertiary educational efficiency at EU level5 We suspect that differences in conclusions mostly arise from the diverse selection of inputs and outputs considered within different papers However the differences in the conclusions of the reviewed papers also arise because of the different samples of countries That is two papers deal with a nar-row sample of countries ie homogenous countries with similar development lev-els and others deal with a broader and heterogeneous set of countries which can also produce different results Still differences arise even if the samples are rela-tively similar For example Aristovnik and Obadić (2011) and Aubyn et al (2009) use the same number and coverage of countries and even time periods in different model specifications (variables) but sometimes the results differ significantly For example the first model in Aristovnik and Obadić (2011) ranks the Czech Repub-lic as the first and then as the 33rd in the second model Similarly in Aubyn et al (2009) Cyprus is ranked number one in the first model (1998-2001) and then as 27th in the second model (1998-2001)6
3 data tertIary educatIon InPuts and outPutsThis paper differentiates between quantity and quality measures of educational inputs and outputs which enables us to discriminate tertiary education efficiency and tertiary education effectiveness Since there is no consensus regarding the appropriateness of available inputs and outputs it seemed inappropriate to make an ad hoc decision to include some and to exclude other inputs and outputs that were used in the previous researches Therefore this paper uses a somewhat broader set of inputs and outputs than most of the papers presented in the literature overview It also considers quality indicators on both side of the educational pro-duction function ndash the input and the output side This decision comes with a cost as the discriminatory power of the method becomes questionable with the increase of the variables due to the inappropriate degrees of freedom (Cooper Seiford Tone 2006106) However any future research should try to detect key inputs and outputs in the tertiary education ldquoproductionrdquo process and try to synthesize them to get more information with fewer datavariables This approach could lead to more robust and more consistent DEA-based conclusions regarding tertiary edu-cation efficiency
To our knowledge there is no precise definition and delimitation of quantitative and qualitative educational inputs and outputs According to Lee in Bourguignon Elkana and Pleskovic (2007) an outcome of education is composed of both the quantity and the quality of educational capital According to him the quantity of educational capital can be measured by the number of graduates However he emphasizes that it is rather difficult to measure the quality of education accurately The author adds that the quality of education is reflected in the performance of
5 Table A1 in appendix provides a table with the previous research results6 See table A1 in appendix
oza
na n
ad
ov
eza jelić ma
rg
ar
eta ga
rd
ijan k
edžo
efficien
cy v
s effectiv
eness a
n an
aly
sis of tertia
ry edu
catio
n ac
ro
ss eur
ope
pub
lic secto
r ec
on
om
ics
42 (4) 381-414 (2018)387students and graduates as the value added of schooling can be measured by labor
market performance such as extra earnings or employment of educated workers Due to the lack of official quantity vs quality definitions regarding educational inputs and outputs in this section we provide the basic rationale behind the choices made in this paper
Before the provision of details regarding the selected inputs and outputs figure 1 gives a synthetic overview of educational inputs and outcomes as defined in Scheerens Luyten and van Ravens (2011)
Figure 1A synthetic overview of educational inputs processes and outcomes
Inputs Process outputs
System level financial material and human resources indicators
System level process indicators
output indicators bull Subject matter based bull Literacy (reading
mathematical scientific)
bull Competencies
outcomeattainment indicators bull Graduation rates bull Proportion of students
graduated without delay
bull Drop-out rates bull Class repetition rates
Impact indicators bull (For each attainment
level) of employed at a certain job level
bull of unemployed bull (For lower school
levels) enrolled in follow-up education
bull Degree of social participation (social capital)
bull Adult literacy rates bull Average income for
each attainment level
financial and material resources indicators 1 Proportion of gross
domestic product spent on education
2 Educational expenditure per student
3 Proportion of public and private investments in education
4 Public investment in educational research and development etc
human resources indicators 1 Teacher background
characteristics 2 Teacher professional
knowledge and skills 3 Teacher working
conditions 4 Teacher autonomy 5 Teacher morale and
status 6 Staff to student ratios
system level process indicators 1 Teaching time per
subject 2 Opportunity to learn 3 The locus of
decision-making 4 School autonomy 5 Education standards
by level 6 Whether formal
examinations are taken
7 The evaluation capacity of the system
8 The magnitude and diversification of an educational support structure
9 The division of private government dependent and public schools
10 Incentive-based policies to stimulate school performance
11 The degree to which school choice is free
contextual indicators (student background characteristics societal conditions antecedent conditions within the educational system the organizational infrastructure
of the local community etc)Source Scheerens Luyten and van Ravens (2011) adapted by the authors
oza
na n
ad
ov
eza jelić ma
rg
ar
eta ga
rd
ijan k
edžo
efficien
cy v
s effectiv
eness a
n an
aly
sis of tertia
ry edu
catio
n ac
ro
ss eur
ope
pub
lic secto
r ec
on
om
ics
42 (4) 381-414 (2018)
388 The selection of quality and quantity educational input and output indicators was mostly dictated by data availability (on the system level) Additionally some indi-cators that were considered as either inputs or outputs of the tertiary education system were highly correlated with other selected variables Thus we had to drop some of them The following subsections link selected variables to the definitions of input output and process indicators shown in figure 1 System-level process indicators have not been considered at all due to the lack of appropriate data
31 QuantItatIVe measures of educatIonal InPutsGeneral government expenditures on tertiary education as a percentage of GDP (financial resources indicator) are chosen as the most common measure of tertiary education public investmentsexpenditures Due to the correlation of this measure with similar measures of inputs other measures are excluded Data for this meas-ure are available for the entire analyzed period
Financial aid to students as a percentage of total public expenditure on education at the tertiary level of education (financial resources indicator) is selected as an input since it indicates public expenditures pointed directly towards students It is assumed that it adds new information regarding tertiary education financial inputs since it is not correlated with the previous financial resources indicator Data for this measure are available for the 2004-2012 period
One limitation should be noted here Namely both financial resources indicators contain only public spending on tertiary education However the structure of financing sources could also affect the efficiency since publicly financed education resources (see system level financial inputs and process indicators in figure 1) do not represent the total amount of educational spending However comparable data on private spending on education for all countries in our sample was not available
The ratio of pupils and students to teachers and academic staff in tertiary educa-tion is selected as a human resource indicator in the last analyzed sub-period (2013-2015) which was dictated by data availability
32 QualItatIVe measure of educatIonal InPutsThe percentage of underachieving 15-year-old students in the PISA survey (aver-age of all fields) is an output indicator of secondary education We assume it is a contextual indicator that measures human capital input quality at the tertiary level education since it contains information about the quality of the student population before entering the system of tertiary education Data for this measure are availa-ble for the entire analyzed period
33 QuantItatIVe measures of educatIonal outPutsTertiary education graduates (ISCED 5-6 per 1000 of population aged 20-29) and graduates aged 20-34 ( of the corresponding population) are selected as out-comeattainment indicators that are the most important and commonly used meas-
oza
na n
ad
ov
eza jelić ma
rg
ar
eta ga
rd
ijan k
edžo
efficien
cy v
s effectiv
eness a
n an
aly
sis of tertia
ry edu
catio
n ac
ro
ss eur
ope
pub
lic secto
r ec
on
om
ics
42 (4) 381-414 (2018)389ures of tertiary education outputs The first indicator is available for the 2004-
2012 period while the latter was used for the analysis in the last sub-period (2013-2015) Since both measures indicate only the number of students who successfully exit the tertiary education system and do not contain any information regarding their ldquoqualityrdquo we regard them as quantitative indicators of educational outputs
The population aged 15-64 with completed tertiary education is selected as a com-mon quantitative output indicator since it only considers the number of tertiary educated people and provides no information regarding the qualitative features of the tertiary educated population It should be noted that population with com-pleted tertiary education also reflects past spending on education while our analy-sis measures the outputs at the same time as inputs However if we considered only past spending on tertiary education we would still have a similar problem Beside historical data availability problems if we took (financial) inputs from previous periods we would neglect the potential efficiency of current expendi-tures to ldquoproducerdquo a new tertiary educated population This is because current financial resources devoted to tertiary education are spread across current stu-dents In three-year periods (for which we take averages) some of those students become part of the tertiary educated population Data for this measure are availa-ble for the entire analyzed period
The ratio of unemployment rates ( age 15-64) for all educational levels to unemployment rates ( age 15-64) of the tertiary educated labor force is selected as an impact indicator of tertiary education outcomes It measures tertiary educa-tion returns on the labor market Due to its correlation with similar labor market outcomes measures other measures are excluded Data for this measure are avail-able for the entire analyzed period Even if this indicator could be seen as a quali-tative tertiary education outcome measure we included it in both the efficiency and the effectiveness analysis We argue that a high ratio of unemployment rates for all educational levels and unemployment rates of tertiary educated labor force does not necessarily reflect the high efficiency of the tertiary education in terms of labor market outcomes but could be also a result of low activity rates of the ter-tiary educated population Therefore we correct this measure with activity rates of tertiary educated population
34 QualItatIVe measure of educatIonal outPutsFollowing the preceding paragraph the ratio of unemployment rates ( age 15-64) for all educational levels to unemployment rates ( age 15-64) of the tertiary educated labor force is multiplied by the activity rates of tertiary educated population The resulting measure is selected as a qualitative impact indicator of the tertiary education outcomes Data for this measure are available for the entire analyzed period
An average overall score of Times Higher Education university rankings is cho-sen as an output indicator of the tertiary education quality in the last sub-period
oza
na n
ad
ov
eza jelić ma
rg
ar
eta ga
rd
ijan k
edžo
efficien
cy v
s effectiv
eness a
n an
aly
sis of tertia
ry edu
catio
n ac
ro
ss eur
ope
pub
lic secto
r ec
on
om
ics
42 (4) 381-414 (2018)
390 (2013-2015) We considered other ranking lists but Times Higher Education was the only university rankings database which covered all countries in our sample in 2016 In previous sub-periods (2004-2012) we used the gross domestic product in PPS per capita ( of average) as a proxy for tertiary education outputs quality due to the incompleteness of the university rankings data and their correlation with university rankings (overall score) Anecdotal evidence presented in figure 2 justi-fies this choice Namely it seems that the correlation between the GDP per capita and the average university overall score (measure of the educational outcomes quality) using the ranking of the Times Higher Education (2017) significantly exceeds the correlation between the GDP per capita and the tertiary educated pop-ulation as a percentage of 15-64 years aged population (typical measure of educa-tional outcomes quantity)
Figure 2Quantity versus quality of education as GDP per capita correlates
Rsup2 = 025
-15
-10
-5
0
5
10
15
20
25
30
-15 -10 -5 0 5 10
Dev
iatio
n fr
om E
U 2
6 av
erag
e
GD
P p
c in
PPS
k
Deviation from EU 26 averagetertiary educated population (as of 15-64)
Rsup2 = 076
-15
-10
-5
0
5
10
15
20
25
30
-30 -20 -10 0 10 20 30
Dev
iatio
n fr
om E
U 2
6 av
erag
eG
DP
pc
in P
PSk
Deviation from EU 26 average average THE WUR overall score
Source Times Higher Education (2017) Eurostat (2018c 2018d)
The analysis is performed on a sample of 24 EU countries7 for which all the neces-sary data during the 2004-2015 period were available The entire time span has been divided into four 3-years sub-periods for which comparable data and varia-bles were available Table 1 summarizes selected inputs and outputs in efficiency and effectiveness DEA models
Figures 3 4 and 5 show educational (quantity and quality) inputs and outputs trends within the EU countries during the analyzed periods (averages for sub-periods 2004-2006 2007-2009 2010-2012 2013-2015) The figures reveal a lot of differences among EU member states regarding the educational inputs and out-puts However a few conclusions can be drawn
7 Due to data shortages Cyprus Greece Malta and Luxemburg were excluded from the dataset
oza
na n
ad
ov
eza jelić ma
rg
ar
eta ga
rd
ijan k
edžo
efficien
cy v
s effectiv
eness a
n an
aly
sis of tertia
ry edu
catio
n ac
ro
ss eur
ope
pub
lic secto
r ec
on
om
ics
42 (4) 381-414 (2018)391Table 1
Inputs outputs and quality indicators
label Definition used in periodCountries Belgium Bulgaria Czech Republic Denmark Germany Estonia Ireland Spain France Croatia Italy Latvia Lithuania Hungary Netherlands Austria Poland Portugal Romania Slovenia Slovakia Finland Sweden United KingdomInputs
(I)EX2( GDP) General government expenditure (tertiary education GDP) 2004-2015
(I)FA( EX)Financial aid to students as of total public expenditure on education at tertiary level of education (ISCED 5 6 )
2004-2012
(I)ST Ratio of pupils and students to teachers and academic staff (tertiary education levels 5-8) 2013-2015
Outputs
(O)GRAD(20-29) Tertiary education graduates (ISCED 5-6 per 1000 of population aged 20-29) 2004-2012
(O)GRADT(20-34) Graduates aged 20-34 tertiary education level ( of corresponding population) 2013-2015
(O)POPT Population aged 15-64 with completed tertiary education (levels 5-8) 2004-2015
(O)UUTUnemployment rates ( 15-64) all ISCED 2011 levelsunemployment rates ( 15-64) tertiary education (levels 5-8)
2004-2015
Quality indicators of inputs and outputs
(O)UUTACTT (O)UUT Activity rates ( of 15-64 tertiary education (levels 5-8)) 2004-2015
(O)GDP PC PPSGross domestic product at market prices current prices purchasing power standard per capita ( of average)
2004-2012
(O)UR_2016 Average overall score university rankings ndash The Higher Education 2013-2015
(I)PISA Underachieving 15-year-old students ( PISA survey an average of all fields) 2004-2015
Source Authors
Inputs ndash The more developed EU countries generally have greater direct invest-ment in students (in ) (figure 3a) Something similar is true for general govern-ment expenditure (figure 3b) However there are a few exceptions like the UK on the low expenditures side and Poland Estonia and Lithuania on the high expendi-tures side (figure 3c) Student to teacher ratio varies from 107 in Sweden to 225 in the Czech Republic
Outputs ndash Graduation rates (figure 4a) have been increasing in all countries within the period of analysis whereas a few post-transition economies which have rela-tively low incomes have relatively high graduation rates Regarding the labor market outcomes (figure 4c) the tertiary educated labor force seems to have a somewhat lower unemployment rate relative to the overall unemployment rate in
oza
na n
ad
ov
eza jelić ma
rg
ar
eta ga
rd
ijan k
edžo
efficien
cy v
s effectiv
eness a
n an
aly
sis of tertia
ry edu
catio
n ac
ro
ss eur
ope
pub
lic secto
r ec
on
om
ics
42 (4) 381-414 (2018)
392 less developed EU countries This could be due to the relative scarcity of tertiary educated labor in lower income countries which provides them with a better labor market position (figure 4b)
Quality indicators of inputs and outputs ndash After correcting the above described labor market outcomes for the tertiary educated activity rates some countries like the Netherlands Sweden Germany Ireland and Austria improve their relative position while the positions of Croatia Slovakia and Romania positions deterio-rate (figure 5a) The correlation between per capita GDP and university ranking overall score has already been commented on As we have already emphasized both of those outputs measure the quality of the tertiary education Finally figure 5c shows that the percentage of underachieving 15-year-old students (measured as the average of all fields in a PISA survey) is usually much larger in the poorest EU countries while it is the lowest in the wealthiest ones (with a few exceptions) This means that poorer countries get students of ldquolower qualityrdquo
Figure 3Tertiary education inputs (averages 2004-2006 2007-2009 2010-2012 2013-2015)
a) Financial aid to students as of total public expenditureon education at the tertiary level of
education
b) General government expenditure (tertiary education GDP)
05
10152025303540
Cze
ch R
C
roat
iaFr
ance
Fran
ce
Rom
ania
Spai
nA
ustri
aEs
toni
aLi
thua
nia
Pola
ndLa
tvia
Irel
and
Irel
and
Hun
gary
Bel
gium
Bel
gium
Finl
and
Bul
garia
Bul
garia
Portu
gal
Portu
gal
Slov
akia
EU28
EU28
Ger
man
y
Ger
man
y
Italy
Slov
enia
Slov
enia
Swed
enN
ethe
rland
s
Net
herla
nds
Den
mar
k
Den
mar
k
UK
UK
00
05
10
15
20
25
Italy
Spai
n
Slov
akia
Rom
ania
Aus
tria
Cze
ch R
Hun
gary
Latv
ia
Cro
atia
Swed
en
Esto
nia
Pola
nd
Finl
and
Lith
uani
a
c) The ratio of pupils and students to teachers and academic staff (tertiary education)
Fran
ce
Bul
garia
EU28
Ger
man
y
UK
Italy
Slov
akia
Aus
tria
Cze
ch R
Cro
atia
Pola
nd
Finl
and
0
5
10
15
20
25
Swed
en
Spai
n
Den
mar
k
Rom
ania
Portu
gal
Esto
nia
Hun
gary
Net
herla
nds
Lith
uani
a
Slov
enia
Latv
ia
Bel
gium
Source Eurostat (2018b 2018c 2018g)
oza
na n
ad
ov
eza jelić ma
rg
ar
eta ga
rd
ijan k
edžo
efficien
cy v
s effectiv
eness a
n an
aly
sis of tertia
ry edu
catio
n ac
ro
ss eur
ope
pub
lic secto
r ec
on
om
ics
42 (4) 381-414 (2018)393
Fig
ur
e 4
Terti
ary e
duca
tion
outp
uts (
aver
ages
200
4-20
06 2
007-
2009
201
0-20
12 2
013-
2015
)
a) T
ertia
ry e
duca
tion
grad
uate
s (permil
20-
29) a
nd g
radu
ates
ag
ed 2
0-34
(permil o
f cor
resp
ondi
ng p
opul
atio
n)b)
Pop
ulat
ion
aged
15-
64 w
ith c
ompl
eted
te
rtiar
y ed
ucat
ion
c) U
nem
ploy
men
t rat
es (
15-
64) a
ll IS
CED
201
1 le
vels
U
nem
ploy
men
t rat
es (
15-
64) t
ertia
ry e
duca
tion
00
05
10
15
20
25
30
35
40
HungaryLithuaniaCzech RBulgaria
GermanyLatvia
SlovakiaUK
PolandSweden
NetherlandsBelgium
IrelandFinlandCroatia
EU28Italy
SpainFrance
SloveniaEstoniaAustria
RomaniaDenmarkPortugal
020406080100
120
DenmarkIrelandPolandFrance
LithuaniaUK
FinlandSlovakiaBelgium
SpainAustria
EU28Czech RSlovenia
NetherlandsBulgaria
LatviaCroatia
PortugalSweden
RomaniaEstonia
HungaryItaly
Germany
0510152025303540
UKIrelandFinlandEstoniaSweden
BelgiumSpain
LithuaniaDenmark
NetherlandsFranceLatviaEU28
SloveniaAustria
GermanyPoland
BulgariaHungaryPortugal
Czech RCroatia
SlovakiaItaly
Romania
Sour
ce E
uros
tat (
2018
d 2
018f
201
8g 2
018h
201
8j)
oza
na n
ad
ov
eza jelić ma
rg
ar
eta ga
rd
ijan k
edžo
efficien
cy v
s effectiv
eness a
n an
aly
sis of tertia
ry edu
catio
n ac
ro
ss eur
ope
pub
lic secto
r ec
on
om
ics
42 (4) 381-414 (2018)
394 Figure 5Tertiary education quality indicators (averages 2004-2006 2007-2009 2010-2012 2013-2015)
a) Unemployment rates ( 15-64) all ISCED 2011 levelsUnemployment rates ( 15-64) tertiary
education (levels 5-8) multiplied by tertiary educated population activity rate
b) Gross domestic product at market prices current prices purchasing power standard
per capita (three-year averages)
0
50
100
150
200
250
300
Lith
uani
aH
unga
ryC
zech
R
Ger
man
yB
ulga
riaSw
eden
Latv
iaU
KN
ethe
rland
sSl
ovak
iaFi
nlan
dIr
elan
dPo
land
Spai
nB
elgi
umEU
28Fr
ance
Esto
nia
Slov
enia
Aus
tria
Cro
atia
Den
mar
kIta
lyPo
rtuga
lR
oman
ia
05000
1000015000200002500030000350004000045000
Irel
and
Net
herla
nds
Aus
tria
Den
mar
kG
erm
any
Swed
enB
elgi
umFi
nlan
dU
KFr
ance
EU28
Italy
Spai
nC
zech
R
Slov
enia
Slov
akia
Portu
gal
Esto
nia
Lith
uani
aH
unga
ryPo
land
Latv
iaC
roat
iaR
oman
iaB
ulga
ria
c) Underachieving 15-year-old students ( PISA survey average of all fields)
d) University rankings ndash Times Higher Education an average overall score
0
10
20
30
40
50
60
Bul
garia
Rom
ania
Slov
akia
Hun
gary
Cro
atia
Lith
uani
aIta
lyFr
ance
Aus
tria
Cze
ch R
EU
28Sw
eden
Bel
gium
Portu
gal
UK
Spai
nLa
tvia
Net
herla
nds
Ger
man
yPo
land
Slov
enia
Den
mar
kIr
elan
dFi
nlan
dEs
toni
a
0
10
20
30
40
50
60
70
Net
herla
nds
Swed
enB
elgi
umG
erm
any
Den
mar
kFi
nlan
dU
KA
ustri
aIr
elan
dFr
ance
Italy
Esto
nia
Spai
nPo
rtuga
lC
roat
iaSl
oven
iaH
unga
ryC
zech
R
Slov
akia
Rom
ania
Pola
ndLa
tvia
Lith
uani
aB
ulga
ria
Source Eurostat (2018a 2018e 2018i 2018j) Times Higher Education (2017)
4 methodologyThe efficiency and (what we later regard as) the effectiveness analysis of the ter-tiary education in 24 EU member states8 is conducted using data envelopment analysis (DEA) DEA is a nonparametric method of mathematical programming which is developed for evaluating the relative efficiency of units under assess-ment usually called the decision-making units (DMUs) Since its introduction by the pioneering CCR model in 1978 (Charnes Cooper and Rhodes 1978) followed by the BCC model published by Banker Charnes and Cooper in 1984 DEA has instantly been recognized as a modern tool for performance management While the CCR model assumes constant returns to scale (CRS) the BCC model assumes variable returns to scale which allows the use of DEA in problems where increases in inputs result in non-proportionate increases in outputs (and vice versa) The most appealing features of DEA are that it allows multiple criteria for determining efficiency to be used and appropriate variables to be selected which are (in most models) unit-invariant without the use of their pre-defined weights In addition all assessments are relative given the finite number of comparable DMUs Follow-
8 We excluded Cyprus Malta Luxemburg and Greece from the analysis due to the lack of data
oza
na n
ad
ov
eza jelić ma
rg
ar
eta ga
rd
ijan k
edžo
efficien
cy v
s effectiv
eness a
n an
aly
sis of tertia
ry edu
catio
n ac
ro
ss eur
ope
pub
lic secto
r ec
on
om
ics
42 (4) 381-414 (2018)395ing the specific needs of the research environment a vast number of models have
been developed within DEA to fit and capture the nature of the research problem thus providing a great tool for different kinds of efficiency analysis Additionally the popularity of DEA and the number of its applications are on the rise (Emrouzne-jad and Yang 2018)
DEA was initially developed with the idea of measuring the efficiency of produc-tion units such as factories hospitals or banks where one can unswervingly determine their inputs and their outputs Such DMUs can manage their inputs and outputs to a certain degree (thus the name decision-making units) An additional assumption is that the aim of DMUs is to use their available inputs to achieve greater outputs or try to use fewer inputs for producing the desired level of output In other words they are assumed to aim for the efficiency in a production process However the application of DEA has spread outside the production processes and researchers are using it for evaluating the relative efficiency of different kinds of (relatively homogenous) units that need to be estimated given their undesirable (input) and desirable (output) characteristics The examples are the portfolio selection the performance of companies using their financial ratio data perfor-mance of countries according to their macroeconomic indicators or different ldquopro-cessesrdquo for example fiscal policy or educational policy As is obvious such DMUs are not the ldquodecision-makingrdquo units themselves and not all of them should aim for efficiency in terms of fewer inputs to greater outputs Moreover the selec-tion of their inputs and outputs is arbitrary but this allows a researcher to define the relevant aspects of the ldquoefficiencyrdquo of DMUs
The use of DEA for estimating the relative efficiency of education at different levels (primary secondary tertiary) has been very popular over recent years The overview of some of these researches previously mentioned in the literature over-view revealed that the most frequently used model is the BCC model (with input or output orientation) which is an appropriate approach given the nature of this research problem Without questioning the great contribution and effort of past researches what we argue is that their selection of inputs and outputs gives more importance to the greater quantity of the educational output We strongly suggest that education should be assessed not only in terms of quantity but also in terms of quality Figuratively speaking a factory that manages to produce something using almost nothing should be seen as a role model and a factory that invests a lot relative to others and achieves less than the others should be recognized as poorly managed However countries that have large investments in education should not be punished in such studies if they manage to provide a high quality of education Likewise the countries that have almost negligible inputs should not be rewarded just because they managed ldquoto producerdquo any amount of outputs of low quality despite their low inputs Therefore we suggest that at the beginning of the study using DEA the crucial question should be asked ldquoAre we really aiming at the quantity or the qualityrdquo and the answer should be followed with the selec-tion of the inputs and the outputs that are relevant for the study
oza
na n
ad
ov
eza jelić ma
rg
ar
eta ga
rd
ijan k
edžo
efficien
cy v
s effectiv
eness a
n an
aly
sis of tertia
ry edu
catio
n ac
ro
ss eur
ope
pub
lic secto
r ec
on
om
ics
42 (4) 381-414 (2018)
396 In addition just as the output of the production facility is determined with the qual-ity of the inputs which cannot be always controlled certain levels of the educa-tional process are determined by the outputs of the preceding processes Figura-tively one cannot make a tasty cake using salt instead of sugar For this problem DEA allows the definition of non-discretionary inputs which are relevant but they are not controllable and are defined by the environment (Banker and Morey 1986) This approach was used in some previous studies of education using DEA How-ever as we will explain in the following paragraphs we will treat the non-discre-tionary variables as discretionary to provide results that are more informative
DEA models can be output oriented aiming at maximization of outputs for the given level of inputs input-oriented aiming at minimization of inputs for the given level of outputs or non-oriented Also the models can assume constant variable or generalized returns to scale Following the nature of the problem we are analyzing we decide to use the output-oriented model assuming variable returns to scale (BCC model) To explain the methodology we first formulate the model Let there be N decision-making units (DMUs) DMU1 DMU2hellip DMUN which are homog-enous and comparative We assume that their efficiency should be estimated in terms of a certain number of inputs ndash the variables the values of which we want to be as small as possible and a certain number of outputs ndash variables the values of which we prefer to be as big as possible Let xij ge 0 be an i-th input for some DMUj
and yrj gt 0 its r-th output Therefore each DMUj is represented by a vector of inputs and a vector of out-puts so is an input matrix and is an output matrix To make the model stable it is recommended that the number of DMUs (N) should not exceed The BCC model (Banker Charnes and Cooper 1984) can be written in the following envelopment form
(1)
(2)
(3)
(4)
where ε gt 0 and and are slack variables If we denote the optimal solution as a DMUo is efficient if and only if the efficiency score and
all DMUo is weakly efficient if and only if but or for some i and r in some alternate optima (Cooper Seiford and Zhu 2011)
Otherwise a DMU is inefficient Resulting from the optimal solution of the pro-gram (1) ndash (4) an inefficient DMU can be projected to the BCC efficiency
oza
na n
ad
ov
eza jelić ma
rg
ar
eta ga
rd
ijan k
edžo
efficien
cy v
s effectiv
eness a
n an
aly
sis of tertia
ry edu
catio
n ac
ro
ss eur
ope
pub
lic secto
r ec
on
om
ics
42 (4) 381-414 (2018)397frontier as a combination of other DMU using the formulas
and (Cooper Seiford and Zhu 2011) Therefore the lambdas allow us to identify the peer group of an inefficient DMU By observing these efficient projections we can analyze how a DMU should increase its outputs andor decrease its inputs to become relatively efficient9
The period of analysis is divided into four subperiods 2004-2006 2007-2009 2010-2012 and 2013-2015 The selection of the periods is mostly dictated by the availability of the data and the change in the data methodology As explained in table 1 subperiods within 2004-2012 and subperiod 2013-2015 are characterized by different variables due to the availability of the data Therefore a direct com-parison of results between periods is not advisable
To circumvent the problem of missing data we decided to calculate the simple three ndash years averages of data as the closest representative of the period However even this procedure resulted in some countries having missing data so our approach was to exclude countries that had more than one missing data item In order to keep as many countries as possible in the sample those countries that had only one missing data item were kept in the sample and missing inputsoutputs were assigned a pessimistic value which is largesmall enough for an objective function not to be entered as proposed by Kuosmanen (2009) We did this only for countries that had one missing data item because we did not want to affect the ldquotechnology setrdquo and worsen the relative ranking of other DMUs that had com-plete data Additionally we checked that the objective function in the solution included a multiplier of 0 for inputsoutputs variables with an arbitrary set value
After the correction of the sample the analysis includes 24 EU countries Belgium Bulgaria the Czech Republic Denmark Germany Estonia Ireland Spain France Croatia Italy Latvia Lithuania Hungary the Netherlands Austria Poland Portu-gal Romania Slovenia Slovakia Finland Sweden and the United Kingdom
In the first step we run the quantity-based models using variables expenditures (I)EX2 and financial aid (I)FA(EX) as inputs and as outputs we use the percentage of graduates (O)GRAD(20-29) the education returns on labor market (O)UUT and the percentage of highly educated population (O)POPT for the period of 2004-2012 We performed a similar analysis for the period 2013-2015 except that variable (I)FA(EX) is replaced by the ratio of students per teacher (I)(ST) and variable (O)GRAD(20-29) with (O)GRAD(20-34) As is obvious such a selection of variables led to rewarding the quantity of the educational output and reporting on the efficiency of the tertiary education
The second step was to include quality corrections for the previously obtained efficiency analysis Firstly we take account of output-quality and then we intro-
9 Some additional explanation on the BCC and other DEA models can be found in for example Cooper Sei-ford and Tone (2006) or Cooper Seiford and Zhu (2011)
oza
na n
ad
ov
eza jelić ma
rg
ar
eta ga
rd
ijan k
edžo
efficien
cy v
s effectiv
eness a
n an
aly
sis of tertia
ry edu
catio
n ac
ro
ss eur
ope
pub
lic secto
r ec
on
om
ics
42 (4) 381-414 (2018)
398 duce the input-quality correction as well For the output-quality control we replace the output variable (O)UUT by the quality-corrected variable (O)UUTACT ((O)UUT multiplied with activity rates of the tertiary educated population) Also variable (O)POPT was substituted for by (O)GDPpc in 2004-2012 and by (O)UR university ranking in 2013-2015 (as (O)GDPpc and (O)UR showed to be highly positively correlated) Afterward the input-quality control was introduced by including PISA results in the analysis Altogether we estimated 6 different models using inputs and outputs in certain subperiods as presented in table 2
Table 2Variables used in each DEA model by period
Period 2004-2012 2013-2015Model Inputs Outputs Inputs Outputs
Quantity model
(I)EX2( GDP)(I)FA( EX)
(O)GRAD(20-29)(O)UUT(O)POPT
(I)EX2( GDP)(I)ST
(O)GRAD(20-34)(O)UUT(O)POPT
Output ndash quality model
(I)EX2( GDP)(I)FA( EX)
(O)GRAD(20-29)(O)UUTACT(O)GDPpc
(I)EX2( GDP)(I)ST)
(O)GRAD(20-34)(O)UUTACT(O)UR
Input ndash output quality model
(I)EX2( GDP)(I)FA( EX)(I)PISA a
(O)GRAD(20-29)(O)UUTACT(O)GDPpc
(I)EX2( GDP)(I)ST(I)PISA
(O)GRAD(20-34)(O)UUTACT(O)UR
a Circled variables present quality correction measuresSource Authors
5 results analysIs of the effIcIency and effectIVeness of tertIary educatIon In the eu
Figures 6a-6c present our results for the period of 2004-2012 whereas figure 6d shows the results for the last period of 2013-2015 which is analyzed using differ-ent variables Therefore we do not make ready comparisons between them How-ever the results from the period of 2013-2015 mostly support our conclusions and what we also conclude is that the choice of the variables for this period is rather robust and findings can be drawn that are similar to those from the period of 2007-2012
The tables with exact DEA scores for the analyzed period are given in table A5 in appendix and here we present the rankings resulting from these scores The dark bars in figures 6a-6d indicate the rankings of the countries calculated by the quan-tity model For the sake of clarity we present the higher ranking with a higher bar In addition we rank all efficient units as 24th and a unit with the highest inefficient score as the 23rd (or the second best) etc By generally observing the results we see that approximately a similar number of countries (9 to 14) remains efficient throughout the years within each model The relatively large number of efficient countries within each period is the result of the total number of input and output variables decreasing the number of inputs and outputs would decrease the num-ber of efficient countries However we aimed to include most of the variables that
oza
na n
ad
ov
eza jelić ma
rg
ar
eta ga
rd
ijan k
edžo
efficien
cy v
s effectiv
eness a
n an
aly
sis of tertia
ry edu
catio
n ac
ro
ss eur
ope
pub
lic secto
r ec
on
om
ics
42 (4) 381-414 (2018)399were used in the previous studies and this comes at a cost Quantity-based effi-
ciency results show that some of the most developed countries in the sample like Austria and the Netherlands are not efficient while some less developed countries like Hungary Estonia and Bulgaria define the efficient frontier in some periods The change of ranking reported by the output-quality model is shown with a striped bar When output-quality control is included most of the efficient coun-tries retain their position but a significant number of them decrease in rank and the rank of some of rises Overall the number of efficient countries decreases and the overall average efficiency score decreases
Afterward we take account of the quality of the inputs In the input-output quality model we add PISA as an input In this way if underachieving PISA results are relatively low it will increase the efficiency score If the opposite PISA will decrease the score In figures 6a-6d we use a dark black bar to indicate the differ-ence between rank in output-quality and input-output-quality model If the differ-ence is positive it means that countriesrsquo tertiary education produces relatively higher quality outputs given the relatively low quality of students (inputs) meas-ured by PISA results If the difference is negative the opposite is true In this way we get an insight into how the quality of the students measured by PISA can influence educational efficiency
When we consider educational output quality in our model it becomes obvious that countries which were inefficient in the quantity-based model and which are usually perceived as countries with solid educational systems improve their rank significantly Namely output-quality based efficiency results in almost all ana-lyzed periods (figures 6a-6d) show that Austria and the Netherlands reach the efficient frontier Austria and Netherlands are the most obvious examples but the same is true for Germany (2007-2009) Denmark (2007-2009 2010-2012) Swe-den (2007-2009 2010-2012) and Belgium (2013-2015) which also experience efficiency gains in output-quality model On the other hand less developed coun-tries (like Hungary Estonia and Bulgaria) lose their efficiency in all periods in the quality-based model in comparison to the quantity model
The correction for the input-quality generally shows that at a given level of PISA results for many countries the tertiary education efficiency ranking should actu-ally be increased This is noticeable for Austria Italy France and the Netherlands within developed countries and in Bulgaria (all periods) Croatia and Hungary (slight increase in all periods except 2007-2009) within the group of the less developed countries
For example during the period of 2007-2012 Croatiarsquos relative position is slightly degraded when an output-quality control is introduced Therefore when consider-ing the relatively poor quality of students in Croatia tertiary education effective-ness is greater than the output-quality model results imply Generally Croatia has one of the lowest indicators of (O)UUTACT and (O)GDPpc but according to
oza
na n
ad
ov
eza jelić ma
rg
ar
eta ga
rd
ijan k
edžo
efficien
cy v
s effectiv
eness a
n an
aly
sis of tertia
ry edu
catio
n ac
ro
ss eur
ope
pub
lic secto
r ec
on
om
ics
42 (4) 381-414 (2018)
400 our results it is not the worst ranked country in the EU concerning tertiary educa-tion efficiency and effectiveness By observing the reference set of efficient coun-tries for Croatia (identified by λgt0 from the model (1)-(4) results shown in tables A2-A4 in appendix) for the period 2004-2012 the BCC model projects Croatia using the inputoutput vectors of the efficient Czech Republic (among others) For the purpose of comparison the Czech Republic has lower inputs in expenditures and PISA and all outputs greater than Croatia
Poland and Estonia are less developed countries that could achieve greater tertiary education effectiveness given the relatively high-quality students The same can be concluded for Finland a developed country that ineffectively uses its high-quality students
Figure 6Results of the DEA analysis
a) 2004-2006 b) 2007-2009
-24-20-16-12-8-4048
12162024
-25-20-15-10-505
10152025
Quantity based score 0406Output quality based model (change to quantity model) ndash rhs 0406 Correction for input quality ndash rhs 0406
Quantity based score 0709Output quality based model (change to quantity model) ndash rhs 0709Correction for input quality ndash rhs 0709
Bul
garia
Rom
ania
Slov
akia
Hun
gary
Cro
atia
Lith
uani
a
Italy
Fran
ce
Aus
tria
Cze
ch R
Swed
en
Bel
gium
Portu
gal
UK
Spai
n
Latv
ia
Net
herla
nds
Ger
man
y
Pola
nd
Slov
enia
Den
mar
k
Irel
and
Finl
and
Esto
nia
Bul
garia
Rom
ania
Slov
akia
Hun
gary
Cro
atia
Lith
uani
aIta
lyFr
ance
Aus
tria
Cze
ch R
Sw
eden
Bel
gium
Portu
gal
UK
Spai
nLa
tvia
Net
herla
nds
Ger
man
y
Pola
nd
Slov
enia
Den
mar
k
Irel
and
Finl
and
Esto
nia
c) 2010-2012 d) 2013-2015
-24-20-16-12-8-4048
12162024
-24-20-16-12-8-4048
12162024
Quantity based score 1012Output quality based model (change to quantity model) ndash rhs 1012Correction for input quality ndash rhs 1012
Quantity based score 1315Output quality based model (change to quantity model) ndash rhs 1315Correction for input quality ndash rhs 1315
Bul
garia
Rom
ania
Slov
akia
Hun
gary
Cro
atia
Lith
uani
a
Italy
Fran
ce
Aus
tria
Cze
ch R
Swed
en
Bel
gium
Portu
gal
UK
Spai
n
Latv
ia
Net
herla
nds
Ger
man
y
Pola
nd
Slov
enia
Den
mar
k
Irel
and
Finl
and
Esto
nia
Bul
garia
Rom
ania
Slov
akia
Hun
gary
Cro
atia
Lith
uani
aIta
lyFr
ance
Aus
tria
Cze
ch R
Sw
eden
Bel
gium
Portu
gal
UK
Spai
n
Latv
ia
Net
herla
nds
Ger
man
y
Pola
nd
Slov
enia
Den
mar
k
Irel
and
Finl
and
Esto
nia
Source Authors
The question is what could a country do to be relatively better in the area of edu-cational quality in the future and what its closest quality-led efficient role models should be The optimal results of the BCC model provide the values of the slack variables for inefficient countries The slacks indicate the shortfalls in the data of a certain country and possible suggestions for future improvements in the quality
oza
na n
ad
ov
eza jelić ma
rg
ar
eta ga
rd
ijan k
edžo
efficien
cy v
s effectiv
eness a
n an
aly
sis of tertia
ry edu
catio
n ac
ro
ss eur
ope
pub
lic secto
r ec
on
om
ics
42 (4) 381-414 (2018)401aspect However the findings are related to a certain country and the analysis is
beyond the scope of this paper Interested readers can find the results in appendix (figure A1) where the figures indicate the greatest shortfalls in the of the origi-nal data for each country
We chose not to analyze the scale of suggested corrections for each country within each model but we give some general observations and comments on the indi-vidual results (1) periods of 2007-2009 and 2010-2012 show rather similar pat-terns where output quality corrections are noticeable for Bulgaria Estonia and Denmark (2) in the period of 2007-2015 Austria and the Netherlands improve their rating after both output and input-output quality corrections (3) Poland and especially Finland and Estonia are the only countries able to utilize their high-quality students (measured by PISA results) more effectively (in terms of educa-tional outputsoutcomes quality) Finally the overall best-ranked countries after both input and output quality control for the whole period of 2004-2015 are the UK Slovakia Italy France Lithuania Ireland and Finland
6 PolIcy ImPlIcatIons and future research recommendatIonsThis paper has dealt with tertiary education efficiency and effectiveness in the EU It is a well-established fact that the quality of education matters more than the quantity Still most of the papers which use the DEA approach make tertiary edu-cation comparisons between countries considering only the definition of effi-ciency Some papers deal with quality issues but mostly on the output side of the educational ldquoproduction functionrdquo Therefore the questions regarding the quality of educational inputs and outputs and the effectiveness are usually covered only partially In this paper we argue that a greater focus on efficiency can give mis-leading results which could translate into flawed educational policy prescriptions
We performed DEA over available educational inputs and outputs during four non-overlapping periods from 2004 to 2015 in 24 EU countries DEA allowed us to rank countries regarding their tertiary education efficiencyeffectiveness in achieving favorable educational and labor market outcomes However we argued that DEA results should be interpreted with a great deal of caution and should not serve as important educational policy and strategy inputs due to the lack of the quality of educational inputs and outputs considerations as well as the decreasing returns on higher education in countries with broad coverage of the population by tertiary edu-cation To avoid a potential bias towards the low input units within the DEA educa-tional inputs and outputs were adjusted for the quality of education indicators Spe-cifically we differentiated the quantity and quality measures of educational inputs and outputs which enabled us to distinguish tertiary education efficiency from ter-tiary education effectiveness since the latter seems to matter more for growth
Our results show that many less developed EU countries achieve efficiency but not effectiveness in tertiary education The opposite is true for some developed coun-tries This is possible due to the low (high) educational inputs in less (more) devel-
oza
na n
ad
ov
eza jelić ma
rg
ar
eta ga
rd
ijan k
edžo
efficien
cy v
s effectiv
eness a
n an
aly
sis of tertia
ry edu
catio
n ac
ro
ss eur
ope
pub
lic secto
r ec
on
om
ics
42 (4) 381-414 (2018)
402 oped countries However when we consider some quality indicators of outcomesoutputs a few less developed EU countries which were characterized as efficient in the quantity model fail to reach defined efficiency border On the other hand some of the inefficient developed countries increase their DEA based ranking and achieve effectiveness (quality-based efficiency) It is not only that the quality of educational outputs matters for the results but the same is true for input quality considerations It turns out that some countries which were downgraded (upgraded) in the output quality DEA model have a lower (higher) quality student base as measured by PISA results Since it could not be expected that tertiary education provides the same quality of outcomes with different input quality efficiency improves (deteriorates) in the input-output quality-based model in many countries with a low (high) quality student base Therefore the results confirmed our hypothesis that quality considera-tions could significantly affect standard tertiary education efficiency analysis results Any future research in this area should not evaluate tertiary education effi-ciency only in terms of the quantity measures of educational inputs and outputs As already emphasized the literature on economic growth and convergence long ago acknowledged educational quality as being more important than quantity DEA based efficiencyeffectiveness research should follow this example
Future research should dig deeper into the rich set of models and results which DEA provides Questions like ldquowhat induces inefficiency in inefficient countriesrdquo (see figure A1 in appendix) and ldquowhich countries define the reference sets (role-models) for inefficient countriesrdquo (see tables A2-A4 in appendix) are especially important for countries like Croatia which proved to be inefficient and ineffective regarding tertiary education Research into the first question should illuminate potential financial black holes while the answers to the second question could shed some light on good practices which could be (easily) implemented in Croa-tian education and customized for its needs From the methodological point of view any future research should address the issues of large numbers of variables which result in too many efficient decision units (countries) as well as some tim-ing and variable selection issues
The key policy implication of our results suggests that greater emphasis should be put on the convergence of tertiary education effectiveness (and not efficiency) within the EU to enhance transmission of tertiary education outcomes into higher productivity and growth rates However since primary and secondary education define the ldquoqualityrdquo of inputs at higher educational levels such a policy task requires comprehensive educational reform in countries which are lagging behind Nevertheless it should be emphasized that the major limitations of the study fol-low from the limited data resources and some concerns about the quality of the data reported by Eurostat The inclusion of data that do not properly represent the situation might significantly change the relative results of the analysis
disclosure statement No potential conflict of interest was reported by the authors
oza
na n
ad
ov
eza jelić ma
rg
ar
eta ga
rd
ijan k
edžo
efficien
cy v
s effectiv
eness a
n an
aly
sis of tertia
ry edu
catio
n ac
ro
ss eur
ope
pub
lic secto
r ec
on
om
ics
42 (4) 381-414 (2018)403
aPP
en
dIX
Ta
bl
e a
1Pr
evio
us re
sear
ch ra
nkin
gs (D
EA)
Pape
ra
hec
Šonj
e
Des
kar-
Škrb
ić
and
Šonj
e (2
018)
toth
(2
009)
ari
stov
nik
and
Oba
dić
(201
1)a
ubyn
et a
l (2
009)
yoto
va a
nd
stef
anov
a (2
017)
year
2005
-201
3 (a
vg)
2006
1999
-200
7 (a
vg)
1998
-20
0120
02-
2005
1998
-20
0120
02-
2005
1998
-20
0120
02-
2005
1998
-20
0120
02-
2005
2012
and
201
4
mod
el1
21
12
31
12
23
34
41
23
no
of e
u c
ount
ries
1117
2222
2225
9A
ustri
a
15
13 9
11 9
10 6
9 8
B
ulga
ria3
31
10 8
10 8
2420
2325
65
5B
elgi
um
2121
2625
8 8
7 9
C
ypru
s
3727
11
1027
23
Cze
ch R
epub
lic1
111
133
717
18
14
1722
243
31
Ger
man
y
13
1516
1210
911
1011
D
enm
ark
111
1 9
111
10 8
7
Esto
nia
82
21
1619
2728
1722
1815
1716
77
6G
reec
e
18
1910
3118
2228
2719
2424
23
Spai
n
1
3217
3426
2720
2021
1818
15
Finl
and
12 1
120
1 7
1 7
1 7
1 5
Fr
ance
934
2432
1917
1611
1213
1214
C
roat
ia9
8
2632
23
Hun
gary
47
1612
28 9
2323
2426
2322
2122
88
8Ir
elan
d
1721
14 1
1 1
1 1
1 1
1
Italy
118
2322
1212
1314
1312
1312
oza
na n
ad
ov
eza jelić ma
rg
ar
eta ga
rd
ijan k
edžo
efficien
cy v
s effectiv
eness a
n an
aly
sis of tertia
ry edu
catio
n ac
ro
ss eur
ope
pub
lic secto
r ec
on
om
ics
42 (4) 381-414 (2018)
404
Pape
ra
hec
Šonj
e
Des
kar-
Škrb
ić
and
Šonj
e (2
018)
toth
(2
009)
ari
stov
nik
and
Oba
dić
(201
1)a
ubyn
et a
l (2
009)
yoto
va a
nd
stef
anov
a (2
017)
year
2005
-201
3 (a
vg)
2006
1999
-200
7 (a
vg)
1998
-20
0120
02-
2005
1998
-20
0120
02-
2005
1998
-20
0120
02-
2005
1998
-20
0120
02-
2005
2012
and
201
4
mod
el1
21
12
31
12
23
34
41
23
Lith
uani
a1
1
112
128
2621
1917
1616
171
11
Latv
ia1
1
2013
2317
11
1M
alta
16
1519
16 7
911
10
Net
herla
nds
10 1
1 1
1 1
5 1
6
Pola
nd5
117
122
1322
2018
1516
1915
185
64
Portu
gal
1425
2522
2122
2120
21
Rom
ania
26
13
3510
113
22
2Sw
eden
823
827
1 1
1 1
1 1
1 1
Sl
oven
ia7
5
113
129
1415
1825
2525
204
44
Slov
akia
64
1 1
36 1
2424
2524
1514
1919
U
nite
d K
ingd
om
7
2219
17 1
1 1
1 1
1 1
1
Sour
ce A
utho
rs
oza
na n
ad
ov
eza jelić ma
rg
ar
eta ga
rd
ijan k
edžo
efficien
cy v
s effectiv
eness a
n an
aly
sis of tertia
ry edu
catio
n ac
ro
ss eur
ope
pub
lic secto
r ec
on
om
ics
42 (4) 381-414 (2018)405Figure a1
Input and output slacks of inefficient countriesa) Quantity model results
i Output slacks () ii Input slacks ()
-45-40-35-30-25-20-15-10-50
Finl
and
Slov
enia
Net
herla
nds
Den
mar
kEs
toni
aB
elgi
umH
unga
rySw
eden
Pola
ndC
roat
iaPo
rtuga
lR
oman
iaA
ustri
aB
ulga
riaC
zech
R
Ger
man
yLa
tvia
(I)EX2( GDP) (I)FA( EX) (I)ST
0
10
20
30
40
50
60
70
Portu
gal
Aus
tria
Ger
man
yR
oman
iaB
ulga
riaSl
oven
iaSw
eden
Net
herla
nds
Hun
gary
Cro
atia
Finl
and
Esto
nia
Bel
gium
Pola
ndD
enm
ark
Cze
ch R
La
tvia
(O)GRAD(20-29) (O)POPT (O)UUT
b) Outputs quality model resultsi Output slacks () ii Input slacks ()
-60
-50
-40
-30
-20
-10
0
Finl
and
Den
mar
kR
oman
iaSl
oven
iaEs
toni
aSw
eden
Portu
gal
Hun
gary
Net
herla
nds
Cro
atia
Cze
ch R
Po
land
Bel
gium
Bul
garia
Spai
nG
erm
any
Aus
tria
Fran
ceIr
elan
dLa
tvia
(I)EX2( GDP) (I)FA( EX) (I)ST (O)GRAD(20-29) (O)UUTACTT
(O)GDPpc (O)UR
0
50
100
150
200
250
300A
ustri
aG
erm
any
Portu
gal
Spai
nEs
toni
aB
ulga
riaH
unga
rySl
oven
iaC
roat
iaSw
eden
Net
herla
nds
Rom
ania
Irel
and
Bel
gium
Finl
and
Latv
iaD
enm
ark
Cze
ch R
Fr
ance
Pola
nd
c) Inputs and outputs quality model resultsi Output slacks () ii Input slacks ()
Den
mar
kR
oman
ia
Slov
enia
Swed
enPo
rtuga
l
Hun
gary
Net
herla
nds
Cro
atia
Bel
gium
Bul
garia
Spai
n
Ger
man
yA
ustri
aIta
lyLa
tvia
Lith
uani
a
Den
mar
k
Rom
ania
Slov
enia
Swed
en
Portu
gal
Hun
gary
Net
herla
nds
Cro
atia
Bel
gium
Bul
garia
Spai
nG
erm
any
Aus
tria
Italy
Latv
ia
Lith
uani
a
(I)EX2( GDP) (I)FA( EX) (O)GRAD(20-29) (O)UUTACTT
(I)ST (I)PISA (O)GDPpc (O)UR
-60
-50
-40
-30
-20
-10
0
0
50
100
150
200
250
300
Source Authors
oza
na n
ad
ov
eza jelić ma
rg
ar
eta ga
rd
ijan k
edžo
efficien
cy v
s effectiv
eness a
n an
aly
sis of tertia
ry edu
catio
n ac
ro
ss eur
ope
pub
lic secto
r ec
on
om
ics
42 (4) 381-414 (2018)
406T
ab
le a
2Re
fere
nce
set o
f a D
MU
from
the
quan
tity-
base
d D
EA m
odel
by
peri
od
2004
-200
620
07-2
009
2010
-201
220
13-2
015
1B
elgi
umB
elgi
umB
elgi
um
Bel
gium
Irel
and-
Lith
uani
a2
Bul
garia
Bul
garia
Bel
gium
-Cze
ch R
ep-E
ston
ia-F
inla
ndB
ulga
riaC
zech
Rep
-Ger
man
y-Sl
ovak
ia-U
K3
Cze
ch R
ep
Cze
ch R
ep
Cze
ch R
ep
Cze
ch R
ep
Cze
ch R
ep
4D
enm
ark
Den
mar
kD
enm
ark
Irel
and-
Lith
uani
a-U
KIr
elan
d-Li
thua
nia
5G
erm
any
Ger
man
yB
elgi
um-S
lova
kia-
Finl
and
Bul
garia
-Hun
gary
-Fin
land
-UK
Ger
man
y6
Esto
nia
Esto
nia
Esto
nia
Esto
nia
Esto
nia
7Ir
elan
dIr
elan
dIr
elan
d Ir
elan
dIr
elan
d8
Spai
nSp
ain
Spai
n Sp
ain
Spai
n9
Fran
ceFr
ance
Fran
ce
Fran
ceFr
ance
10C
roat
iaC
roat
iaC
zech
Rep
-Spa
in-C
roat
ia-P
olan
dC
zech
Rep
-Fra
nce-
Pola
ndC
zech
Rep
-Lith
uani
a11
Italy
Italy
Italy
Ita
lyIta
ly
12La
tvia
Latv
iaLa
tvia
C
zech
Rep
-Fra
nce-
Lith
uani
a-Po
land
-Rom
ania
Cze
ch R
ep-G
erm
any-
Irel
and-
Lith
uani
a-U
K13
Lith
uani
aLi
thua
nia
Lith
uani
a Li
thua
nia
Lith
uani
a14
Hun
gary
Hun
gary
Irel
and-
Slov
akia
-Fin
land
-UK
Hun
gary
Hun
gary
15N
ethe
rland
sN
ethe
rland
sB
elgi
um-D
enm
ark-
Finl
and
Irel
and-
Finl
and-
UK
Irel
and-
Lith
uani
a16
Aus
tria
Aus
tria
Bel
gium
-Slo
vaki
a-Fi
nlan
d B
ulga
ria-S
pain
-Slo
vaki
a-U
KC
zech
Rep
-Spa
in-S
lova
kia-
UK
17Po
land
Pola
ndPo
land
Po
land
Lith
uani
a18
Portu
gal
Portu
gal
Irel
and-
Lith
uani
a-Po
land
-Slo
vaki
aFr
ance
-Lith
uani
a-R
oman
ia-U
KLi
thua
nia-
Slov
akia
19R
oman
iaR
oman
iaPo
land
-Slo
vaki
aR
oman
iaR
oman
ia20
Slov
enia
Slov
enia
Lith
uani
a-Sl
ovak
ia-U
K
Bul
garia
-Lith
uani
a-H
unga
ry-U
KIr
elan
d-Li
thua
nia
21Sl
ovak
iaSl
ovak
iaSl
ovak
ia
Slov
akia
Slov
akia
22Fi
nlan
dFi
nlan
dFi
nlan
d Fi
nlan
dIr
elan
d-Li
thua
nia
23Sw
eden
Swed
enB
elgi
um-D
enm
ark-
Finl
and
Irel
and-
Finl
and-
UK
Irel
and-
Lith
uani
a24
UK
UK
UK
U
KU
KN
ote
Effi
cien
t cou
ntri
es a
re a
pro
ject
ion
of th
emse
lves
So
urce
Aut
hors
oza
na n
ad
ov
eza jelić ma
rg
ar
eta ga
rd
ijan k
edžo
efficien
cy v
s effectiv
eness a
n an
aly
sis of tertia
ry edu
catio
n ac
ro
ss eur
ope
pub
lic secto
r ec
on
om
ics
42 (4) 381-414 (2018)407
Ta
bl
e a
3Re
fere
nce
set o
f a D
MU
from
the
outp
ut q
ualit
y-ba
sed
DEA
mod
el b
y pe
riod
2004
-200
620
07-2
009
2010
-201
220
13-2
015
1B
elgi
umIr
elan
d-Ita
ly-S
lova
kia-
UK
Irel
and-
Fran
ce-L
ithua
nia-
Slov
akia
-UK
Cze
ch R
ep-G
erm
any-
Irel
and-
Aus
tria
Ger
man
y-N
ethe
rland
s-U
K
2B
ulga
riaC
zech
Rep
-Lat
via-
Lith
uani
a-Sl
ovak
iaC
zech
Rep
-Slo
vaki
aC
zech
Rep
-Ger
man
y-Sl
ovak
iaG
erm
any-
Lith
uani
a-Sl
ovak
ia-
Swed
en3
Cze
ch R
ep
Cze
ch R
ep
Cze
ch R
ep
Cze
ch R
ep
Lith
uani
a-H
unga
ry-U
K4
Den
mar
kIr
elan
d-Li
thua
nia
Irel
and-
Lith
uani
aIr
elan
d-Li
thua
nia
Den
mar
k5
Ger
man
yC
zech
Rep
-Ire
land
Ger
man
yG
erm
any
Ger
man
y
6Es
toni
aC
zech
Rep
-Ire
land
-Pol
and-
UK
Cze
ch R
ep-I
rela
nd-L
ithua
nia-
Rom
ania
Cze
ch R
ep-G
erm
any-
Irel
and-
Lith
uani
aD
enm
ark-
Lith
uani
a-N
ethe
rland
s-Sw
eden
7Ir
elan
dIr
elan
dIr
elan
dIr
elan
dIr
elan
d
8Sp
ain
Cze
ch R
ep-I
rela
nd-F
ranc
eC
zech
Rep
-Fra
nce-
Aus
tria-
Slov
akia
Cze
ch R
ep-S
pain
-Fra
nce-
Italy
Spai
n
9Fr
ance
Fran
ceFr
ance
Fran
ceFr
ance
10C
roat
iaC
zech
Rep
-Cro
atia
-Pol
and
Cze
ch R
ep-P
olan
dC
zech
Rep
-Lith
uani
aD
enm
ark-
Lith
uani
a-Sl
ovak
ia-
Swed
en11
Italy
Italy
Italy
Italy
Italy
-UK
12La
tvia
Latv
iaC
zech
Rep
-Lith
uani
a-R
oman
ia-
Slov
akia
Cze
ch R
ep-G
erm
any-
Lith
uani
aLi
thua
nia-
Hun
gary
-UK
13Li
thua
nia
Lith
uani
aLi
thua
nia
Lith
uani
aLi
thua
nia
14H
unga
ryLi
thua
nia-
Pola
nd-S
lova
kia-
UK
Cze
ch R
ep
Cze
ch R
ep-G
erm
any
Hun
gary
15N
ethe
rland
sC
zech
Rep
-Ire
land
Net
herla
nds
Net
herla
nds
Net
herla
nds
16A
ustri
aIr
elan
d-Ita
ly-S
lova
kia-
UK
Aus
tria
Aus
tria
Den
mar
k-N
ethe
rland
s-Sw
eden
-UK
17Po
land
Pola
ndPo
land
Lith
uani
aD
enm
ark-
Irel
and-
Lith
uani
a-U
K
oza
na n
ad
ov
eza jelić ma
rg
ar
eta ga
rd
ijan k
edžo
efficien
cy v
s effectiv
eness a
n an
aly
sis of tertia
ry edu
catio
n ac
ro
ss eur
ope
pub
lic secto
r ec
on
om
ics
42 (4) 381-414 (2018)
408
2004
-200
620
07-2
009
2010
-201
220
13-2
015
18Po
rtuga
lC
zech
Rep
-Ire
land
-Fra
nce
Irel
and-
Lith
uani
a-R
oman
iaG
erm
any-
Irel
and-
Lith
uani
aD
enm
ark-
Lith
uani
a-Sl
ovak
ia-
Swed
en-U
K19
Rom
ania
Lith
uani
a-Po
land
-Slo
vaki
aR
oman
iaR
oman
iaD
enm
ark-
Spai
n-Sl
ovak
ia-U
K
20Sl
oven
iaC
zech
Rep
-Ire
land
-UK
Cze
ch R
ep-I
rela
nd-
Lith
uani
a-U
KIr
elan
d-Li
thua
nia
Den
mar
k-Ir
elan
d-Li
thua
nia-
UK
21Sl
ovak
iaSl
ovak
iaSl
ovak
iaSl
ovak
iaSl
ovak
ia
22Fi
nlan
dC
zech
Rep
-Ire
land
Cze
ch R
ep-I
rela
nd-U
KC
zech
Rep
-Ger
man
y-Ir
elan
d-A
ustri
aD
enm
ark-
Lith
uani
a-N
ethe
rland
s-Sw
eden
23Sw
eden
Cze
ch R
ep-I
rela
ndG
erm
any-
Irel
and-
Net
herla
nds
Ger
man
y-N
ethe
rland
s-A
ustri
aSw
eden
24U
KU
KU
KU
KU
KSo
urce
Aut
hors
oza
na n
ad
ov
eza jelić ma
rg
ar
eta ga
rd
ijan k
edžo
efficien
cy v
s effectiv
eness a
n an
aly
sis of tertia
ry edu
catio
n ac
ro
ss eur
ope
pub
lic secto
r ec
on
om
ics
42 (4) 381-414 (2018)409
Ta
bl
e a
4Re
fere
nce
set o
f a D
MU
from
the
inpu
t and
out
put q
ualit
y ndash
base
d D
EA m
odel
by
peri
od
2004
-200
620
07-2
009
2010
-201
220
13-2
015
1B
elgi
umIr
elan
d-Fr
ance
-Ita
ly-
Slov
akia
-UK
Bel
gium
Cze
ch R
ep-G
erm
any-
Irel
and-
Aus
tria
Ger
man
y-N
ethe
rland
s-U
K
2B
ulga
riaC
zech
Rep
-Lat
via-
Lith
uani
a-Sl
ovak
iaC
zech
Rep
-Slo
vaki
aC
zech
Rep
-Ger
man
y-Sl
ovak
iaG
erm
any-
Lith
uani
a-Sl
ovak
ia-
Swed
en3
Cze
ch R
ep
Cze
ch R
ep
Cze
ch R
ep
Cze
ch R
ep
Cze
ch R
ep
4D
enm
ark
Irel
and-
Lith
uani
aD
enm
ark
Irel
and-
Lith
uani
aD
enm
ark
5G
erm
any
Cze
ch R
ep-I
rela
ndG
erm
any
Ger
man
yG
erm
any
6Es
toni
aEs
toni
aEs
toni
aEs
toni
aEs
toni
a7
Irel
and
Irel
and
Irel
and
Irel
and
Irel
and
8Sp
ain
Cze
ch R
ep-I
rela
nd-F
ranc
eC
zech
Rep
-Ger
man
y-Fr
ance
-A
ustri
a-Sl
ovak
iaSp
ain
Spai
n
9Fr
ance
Fran
ceFr
ance
Fran
ceFr
ance
10C
roat
iaC
roat
iaC
zech
Rep
-Pol
and
Cze
ch R
ep-L
ithua
nia
Den
mar
k-Li
thua
nia-
Slov
akia
-Sw
eden
11Ita
lyIta
lyIta
lyIta
lyIta
ly
12La
tvia
Latv
iaLa
tvia
Cze
ch R
ep-L
ithua
nia-
Pola
nd-
Finl
and
Ger
man
y-Ir
elan
d-Li
thua
nia-
Finl
and-
UK
13Li
thua
nia
Lith
uani
aLi
thua
nia
Lith
uani
aLi
thua
nia
14H
unga
ryC
zech
Rep
-Ire
land
-Pol
and-
UK
Cze
ch R
ep-S
lova
kia-
Finl
and
Cze
ch R
ep-G
erm
any
Hun
gary
15N
ethe
rland
sC
zech
Rep
-Ire
land
-Fin
land
Net
herla
nds
Net
herla
nds
Net
herla
nds
16A
ustri
aIr
elan
d-Ita
ly-S
lova
kia-
UK
Aus
tria
Aus
tria
Den
mar
k-Sw
eden
-UK
17Po
land
Pola
ndPo
land
Pola
ndPo
land
18Po
rtuga
lC
zech
Rep
-Ire
land
-Fra
nce
Irel
and-
Lith
uani
a-Po
land
-R
oman
iaG
erm
any-
Irel
and-
Lith
uani
aD
enm
ark-
Spai
n-Li
thua
nia-
Slov
akia
-Sw
eden
-UK
oza
na n
ad
ov
eza jelić ma
rg
ar
eta ga
rd
ijan k
edžo
efficien
cy v
s effectiv
eness a
n an
aly
sis of tertia
ry edu
catio
n ac
ro
ss eur
ope
pub
lic secto
r ec
on
om
ics
42 (4) 381-414 (2018)
410
2004
-200
620
07-2
009
2010
-201
220
13-2
015
19R
oman
iaLi
thua
nia-
Pola
nd-S
lova
kia
Rom
ania
Rom
ania
Den
mar
k-Sp
ain-
Slov
akia
-UK
20Sl
oven
iaC
zech
Rep
-Ire
land
-Pol
and-
Finl
and
Cze
ch R
ep-I
rela
nd-
Lith
uani
a-U
KIr
elan
d-Li
thua
nia
Den
mar
k-Es
toni
a-Ir
elan
d-Fi
nlan
d-U
K21
Slov
akia
Slov
akia
Slov
akia
Slov
akia
Slov
akia
22Fi
nlan
dFi
nlan
dFi
nlan
dFi
nlan
dFi
nlan
d23
Swed
enC
zech
Rep
-Ire
land
Ger
man
y-Ir
elan
d-N
ethe
rland
sG
erm
any-
Net
herla
nds-
Aus
tria
Swed
en24
UK
UK
UK
UK
UK
Sour
ce A
utho
rs
oza
na n
ad
ov
eza jelić ma
rg
ar
eta ga
rd
ijan k
edžo
efficien
cy v
s effectiv
eness a
n an
aly
sis of tertia
ry edu
catio
n ac
ro
ss eur
ope
pub
lic secto
r ec
on
om
ics
42 (4) 381-414 (2018)411
Ta
bl
e a
5Ef
ficie
ncy
scor
es o
btai
ned
from
all
mod
els
by p
erio
d
Qua
ntity
mod
elo
utpu
t qua
lity
mod
elIn
put a
nd o
utpu
t qua
lity
mod
el20
04-2
006
2007
-200
920
10-2
012
2013
-201
520
04-2
006
2007
-200
920
10-2
012
2013
-201
520
04-2
006
2007
-200
920
10-2
012
2013
-201
51
Bel
gium
11
095
40
905
094
097
30
929
098
90
961
10
929
098
92
Bul
garia
087
91
096
41
070
70
879
086
40
986
070
70
879
086
40
986
3C
zech
Rep
1
11
095
11
11
098
11
11
4D
enm
ark
10
932
091
21
087
70
996
099
31
087
71
099
31
5G
erm
any
087
60
954
11
093
11
10
931
11
6Es
toni
a1
11
093
10
770
837
073
90
748
11
11
7Ir
elan
d1
11
11
11
11
11
18
Spai
n1
11
10
920
943
11
092
095
21
19
Fran
ce1
11
11
11
11
11
110
Cro
atia
10
803
080
60
873
10
808
080
60
821
10
808
080
60
821
11Ita
ly1
11
11
11
11
11
112
Latv
ia1
094
30
905
085
71
091
90
904
086
21
10
955
092
413
Lith
uani
a1
11
11
11
11
11
114
Hun
gary
089
81
11
081
10
847
087
91
081
60
909
087
91
15N
ethe
rland
s0
929
091
60
853
087
80
947
11
10
957
11
116
Aus
tria
071
90
805
084
10
843
097
71
10
90
977
11
09
17Po
land
11
10
995
11
10
975
11
11
18Po
rtuga
l0
591
062
80
679
072
50
742
071
30
740
733
074
20
713
074
073
719
Rom
ania
076
81
10
748
075
11
10
725
075
11
10
725
20Sl
oven
ia0
811
073
50
741
076
80
810
763
078
90
752
082
40
763
078
90
833
21Sl
ovak
ia1
11
11
11
11
11
122
Finl
and
11
099
50
997
093
50
990
967
092
41
11
123
Swed
en0
903
090
60
914
10
908
096
90
981
090
80
969
098
124
UK
11
11
11
11
11
11
Sour
ce A
utho
rs
oza
na n
ad
ov
eza jelić ma
rg
ar
eta ga
rd
ijan k
edžo
efficien
cy v
s effectiv
eness a
n an
aly
sis of tertia
ry edu
catio
n ac
ro
ss eur
ope
pub
lic secto
r ec
on
om
ics
42 (4) 381-414 (2018)
412 references1 Afonso A and St Aubyn M 2006 Cross-country efficiency of secondary
education provision A semi-parametric analysis with non-discretionary inputs Economic Modelling 23(3) pp 476-491 httpsdoiorg101016jeconmod200602003
2 Ahec Šonje A Deskar-Škrbić M and Šonje V 2018 Efficiency of public expenditure on education comparing Croatia with other NMS MPRA Paper No 85152 Available at lthttpsmpraubuni-muenchende851521MPRA_paper_85152pdfgt
3 Altinok N Diebolt C and Demeulemeester J-L 2014 A new international database on education quality 1965-2010 Applied Economics 46(11) pp 1212-1247 httpsdoiorg101080000368462013868592
4 Aristovnik A 2013a Technical Efficiency of Education Sector in the EU and OECD Countries The Case of Tertiary Education Conference Proceedings 16th Toulon-Verona Conference ldquoExcellence in Servicesrdquo Ljubljana 29-30 August 2013 pp 43-51
5 Aristovnik A 2013b Relative efficiency of education expenditures in East-ern Europe a non-parametric approach Journal of Knowledge Management Economics and Information Technology ScientificPapersorg 3(3) 1-4 Avail-able at lthttpwwwscientificpapersorgwp-contentfiles1379_ARISTOVNIK_Relative_Efficiency_of_Education_Expenditures_in_Eastern_Europepdfgt
6 Aristovnik A and Obadić A 2011 The funding and efficiency of higher education in Croatia and Slovenia a non-parametric comparison Amfiteatru Economic 13(30) pp 362-376 Available at lthttpwwwamfiteatrueco-nomicrotempArticle_1050pdfgt
7 Aristovnik A and Obadić A 2014 Measuring relative efficiency of second-ary education in selected EU and OECD countries the case of Slovenia and Croatia Technological and Economic Development of Economy 20(3) pp 419-433 httpsdoiorg103846202949132014880085
8 Aubyn M S [et al] 2008 Study on the efficiency and effectiveness of public spending on tertiary education European Economy Economic Papers No 390 httpsdoiorg10276530348
9 Banker R D Charnes A and Cooper W W 1984 Some Models for Esti-mating Technical and Scale Inefficiencies in Data Envelopment Analysis Management Science 30(9) pp 1078-1092 Available at lthttpwwwutdal-lasedu~ryoungphdseminarBCC1984pdfgt
10 Banker R D and Morey R C 1986 Efficiency Analysis for Exogenously Fixed Inputs and Outputs Operations Research 34(4) pp 513-521 httpsdoiorg101287opre344513
11 Barro R 2001 Human Capital and Growth The American Economic Review 91(2) pp 12-17 Available at lthttpswwwaeaweborgarticlesid=101257aer91212gt
12 Barro R 2013 Education and Economic Growth Annals of Economics and Finance 14(2) pp 301-328 Available at lthttpdownaefwebnetWorking-Papersw571pdfgt
oza
na n
ad
ov
eza jelić ma
rg
ar
eta ga
rd
ijan k
edžo
efficien
cy v
s effectiv
eness a
n an
aly
sis of tertia
ry edu
catio
n ac
ro
ss eur
ope
pub
lic secto
r ec
on
om
ics
42 (4) 381-414 (2018)41313 Bourguignon F Elkana Y and Pleskovic B 2007 Capacity Building in
Economics Education and Research Washington DC World Bank14 Charnes A Cooper W W and Rhodes E 1978 Measuring the efficiency of
decision making units European Journal of Operational Research 2(6) pp 429-444 httpsdoiorg1010160377-2217(78)90138-8
15 Clements B J 2002 How efficient is education spending in Europe Euro-pean review of economics and finance 1(1) pp 3-26
16 Cooper W W Seiford L M and Zhu J (eds) 2011 Handbook on Data Envelopment Analysis International Series in Operations Research amp Man-agement Science Cham Springer Science and Business Media
17 Cooper W W and Seiford L M Tone K 2006 Introduction to Data Envel-opment Analysis and Its Uses New York Springer
18 Emrouznejad A and Yang G 2018 A survey and analysis of the first 40 years of scholarly literature in DEA 1978-2016 Socio-Economic Planning Sciences Recent developments on the use of DEA in the public sector 61(March) pp 4-8 httpsdoiorg101016jseps201701008
19 Eurostat 2018a Main GDP aggregates per capita Gross domestic product at market prices Luxembourg Eurostat Available at lthttpappssoeurostateceuropaeunuishowdodataset=nama_10_pcamplang=engt
20 Eurostat 2018b Population by educational attainment level sex and age () ndash main indicators Luxembourg Eurostat Available at lthttpappssoeuro-stateceuropaeunuishowdodataset=edat_lfse_03amplang=enggt
21 Eurostat 2018c Financial aid to students by education level ndash as of total public expenditure Luxembourg Eurostat Available at lthttpseceuropaeueurostatwebproducts-datasetsproductcode=educ_uoe_fina01gt
22 Eurostat 2018d General government expenditure by function (COFOG) Luxembourg Eurostat Available at lthttpseceuropaeueurostatstatistics-explainedindexphpGovernment_expenditure_by_function_E28093_COFOGgt
23 Eurostat 2018e Ratio of pupils and students to teachers and academic staff by education level and programme orientation Luxembourg Eurostat Avail-able at lthttpsdataeuropaeueuodpdatadatasetSGGhyHTPqi7AMFH-FePHoxwgt
24 Eurostat 2018f Tertiary education graduates Luxembourg Eurostat Avail-able at lthttpseceuropaeueurostatstatistics-explainedindexphpTertiary_ education_statisticsgt
25 Eurostat 2018g Graduates by education level programme orientation com-pletion sex and age Luxembourg Eurostat Available at lthttpsdataeuropaeueuodpdatadatasetBhJ0FRyxpdrmRBlsQAkggt
26 Eurostat 2018h Unemployment rates by sex age and educational attainment level () Luxembourg Eurostat Available at lthttpappssoeurostateceuropaeunuishowdodataset=lfsq_urgaedamplang=engt
27 Eurostat 2018i Activity rates by sex age and educational attainment level () Luxembourg Eurostat Available at lthttpappssoeurostateceuropaeunuishowdodataset=lfsa_argaedamplang=engt
oza
na n
ad
ov
eza jelić ma
rg
ar
eta ga
rd
ijan k
edžo
efficien
cy v
s effectiv
eness a
n an
aly
sis of tertia
ry edu
catio
n ac
ro
ss eur
ope
pub
lic secto
r ec
on
om
ics
42 (4) 381-414 (2018)
414 28 Eurostat 2018j Underachieving 15-year-old students by sex and field ndash PISA survey Luxembourg Eurostat Available at lthttpseceuropaeueurostatwebproducts-datasetsproductcode=educ_outc_pisagt
29 Fortunato P and Panizza U 2015 Democracy education and the quality of government Journal of Economic Growth 20(4) pp 333-363 httpsdoiorg101007s10887-015-9120-5
30 Hanushek E A and Kimko D D 2000 Schooling Labor-Force Quality and the Growth of Nations American Economic Review 90(5) pp 1184-1208 httpsdoiorg101257aer9051184
31 Kenny J 2008 Efficiency and Effectiveness in Higher Education Who is Accountable for What Australian Universitiesrsquo Review 50(1) pp 11-19 Available at lthttpsfilesericedgovfulltextEJ802278pdfgt
32 Kuosmanen T 2009 Data Envelopment Analysis with Missing Data The Journal of the Operational Research Society 60(12) pp 1767-1774 httpsdoiorg101057jors2008132
33 Pritchett L 2001 Where Has All the Education Gone The World Bank Eco-nomic Review 15(3) pp 367-391 Available at lthttpdocumentsworld-bankorgcurateden859821468180273788pdf773740JRN020010l0the0Education0Gonepdfgt
34 Pritchett L 2013 The Rebirth of Education Schooling Ainrsquot Learning Center for Global Development Washington Center for Global Development
35 Scheerens J Luyten H and van Ravens J 2011 Measuring Educational Quality by Means of Indicators in J Scheerens H Luyten and J van Ravens eds Perspectives on Educational Quality Springer Netherlands Dordrecht pp 35-50 httpsdoiorg101007978-94-007-0926-3_2
36 Szirmai A 2015 Socio-Economic Development Cambridge Cambridge University Press
37 Times Higher Education 2017 World University Rankings Available at lthttpswwwtimeshighereducationcomgt
38 Toth R 2009 Using DEA to Evaluate Efficiency of Higher Education APSTRACT Applied Studies in Agribusiness and Commerce pp 79-82 Available at lthttpsageconsearchumnedubitstream53548217_Using 20DEA_Apstractpdfgt
39 World Bank 2018 Education Statistics-Gross enrolment ratio in tertiary educa-tion Washington The World Bank Available at lthttpsdataworldbankorggt
40 Woumlszligmann L 2006 Efficiency and Equity of European Education and Train-ing Policies CESifo Working Paper Series (No 1779) Available at lthttpswwwcesifo-groupdeDocDLcesifo1_wp1779pdfgt
41 Yotova L and Stefanova K 2017 Efficiency of Tertiary Education Expend-iture in CEE Countries Data Envelopment Analysis Economic Alternatives (3) pp 352-364 Available at lthttpswwwunwebguploadsAlternatives2_Alternativi_english_br_3_2017pdfgt
Dynamics and determinants of emigration the case of Croatia and the experience of new EU member states
IVANA DRAŽENOVIĆ mag oecMARINA KUNOVAC dott mag desDOMINIK PRIPUŽIĆ dipl oec
ArticleJEL J61 E65 C33httpsdoiorg103326pse4243
We would like to thank two anonymous referees and the editor for the constructive and very useful remarks We are particularly grateful to Evan Kraft Gordi Sušić Vedran Šošić Teo Matković Maja Bukovšak Nina Ranilović Davor Kunovac Marko Mrkalj Ervin Duraković Karlo Kotarac and Alan Bobetko for their valuable comments during the early stages of the research Our work also benefited a lot from the presentation and discussion during the 24th Dubrovnik Economic Conference in June 2018 The views expressed are those of the authors and do not necessarily represent those of the Croatian National Bank No financial support received
Received June 1 2018 Accepted November 4 2018
The article was submitted for the 2018 annual award of the Prof Dr Marijan Hanžeković Prize
Ivana DRAŽENOVIĆCenter for Economic Research and Graduate Education ndash Economics Institute Politickyacutech vězňů 7 111 21 Prague 1 Czech Republice-mail IvanaDrazenoviccerge-eiczORCiD 0000-0002-6738-1288
Marina KUNOVACCroatian National Bank Trg hrvatskih velikana 3 10000 Zagreb Croatiae-mail marinakunovachnbhr ORCiD 0000-0002-3200-5928
Dominik PRIPUŽIĆCroatian National Bank Trg hrvatskih velikana 3 10000 Zagreb Croatiae-mail dominikpripuzichnbhrORCiD 0000-0003-3377-9260
ivan
a dr
ažen
ov
ić ma
rin
a ku
no
vac d
om
inik pr
ipužić
dy
na
mic
s an
d deter
min
an
ts of em
igr
ation th
e ca
se of c
ro
atia an
d the ex
perien
ce
of n
ew eu m
emb
er states
pub
lic secto
r ec
on
om
ics
42 (4) 415-447 (2018)
416 abstractThis paper analyzes the emigration flows from Croatia and other new EU member states to the core EU countries after their EU accession In order to assess the magnitude and dynamics of the recent emigration wave properly we construct the series of indirect emigration flows resorting to the national statistical offices of the selected core EU destination countries We compare the Croatian experience with that of other NMS and show that the intensity of Croatiarsquos emigration flows after EU accession is proportional to that of the Romanian and Bulgarian cases Finally we empirically analyze the economic and non-economic drivers of emi-gration from NMS to the core EU in the 2000-2016 period Results show that both economic (measured by different GDP and labour market indicators) and non-economic factors (capturing the EU accession the level of corruption in the econ-omy and demographic characteristics of the origin country population) are rele-vant for emigration decisions
Keywords emigration EU accession new member states gravity model
1 IntroductIonIn mid-2013 Croatia joined the European Union (EU) and as a member state (MS) gained access to the EU single market By becoming a part of the single market the country benefits from ldquothe four freedomsrdquo ndash the free movement of goods services capital and labour which enable more efficient reallocation of domestic factors of production resulting in new business and trade opportunities and ultimately increasing MS growth prospects At the same time EU accession triggered imple-mentation of temporary transitional provisions restricting free labour mobility from Croatia to the labour markets of other MS1 Despite that one of the direct effects of EU accession and the related reallocation of domestic factors of produc-tion was also a significant emigration outflow from Croatia to other states in the EU
Such developments raised emigration-related issues to the forefront of public debate in Croatia Drawing on a mixture of anecdotal evidence ad hoc surveys and social network posts the media predominantly engaged in painting and prop-agating a bleak picture of the ldquoCroatian exodusrdquo At the same time no proper estimate of the magnitude and nature of this emigration wave has been made due to inaccurate migration statistics Official migration statistics collected by the Central Bureau of Statistics in Croatia are published with a disclaimer that the numbers of emigrants are based on the self-reporting of emigration by emigrants themselves a process clearly discouraged by a relatively burdensome procedure that results in a loss of domestic social security benefits
1 Transitional provisions do not apply on cross boarder movements of citizens for reasons other than work but only restrict free movement of citizens for work purposes According to the Accession Treaty for Croa-tia transitional provisions can apply for a maximum period of seven years (2+3+2 formula) More details are given in table A1 appendix 1
ivan
a dr
ažen
ov
ić ma
rin
a ku
no
vac d
om
inik pr
ipužić
dy
na
mic
s an
d deter
min
an
ts of em
igr
ation th
e ca
se of c
ro
atia an
d the ex
perien
ce
of n
ew eu m
emb
er states
pub
lic secto
r ec
on
om
ics
42 (4) 415-447 (2018)417Therefore in this paper we try to assess the characteristics of the recent Croatian
emigration wave to EU countries We present a comprehensive analysis of the dynamics and the main determinants of emigration from Croatia to core EU coun-tries following EU accession comparing the Croatian case with the experience of other new member states2
To our knowledge there are few analyses of the impact of the free mobility of labour on Croatian emigration flows Potential migration flows from Croatia after EU accession are ex-ante estimated in Strielkowski Šaacuterkovaacute and Żornaczuk (2013) Fertig and Kahanec (2013) and Vidovic and Mara (2015) Strielkowski Šaacuterkovaacute and Żornaczuk (2013) find that around 220 thousand residents from Croa-tia were expected to live in the EU15 by 2016 The Fertig and Kahanec (2013) estimates vary between negative net migration balance and 360 thousand residents from Croatia in the EU14 by 2020 while the Vidovic and Mara (2015) estimates are between 160 and 220 thousand residents from Croatia in the EU by 2019
Effective emigration outflows from Croatia following the EU accession are ana-lyzed in Vidovic and Mara (2015) and Župarić-Ilijić (2016) Vidovic and Mara (2015) integrate several data sources (CBS data Eurostat employment data data about the stock of Croatian citizens in EU member states and various surveys) They show that emigration patterns from Croatia in 2014 intensified significantly due to higher economic development and better quality of life in other MS as perceived by Croatian emigrants However their paper analyses emigration out-flows only up to 2014 due to data availability Another overall analysis of emigra-tion trends from Croatia is given in Župarić-Ilijć (2016) This author emphasized that Croatian net migration balance significantly worsened with the onset of the global financial crisis and in particular after the accession to the EU and argued that official Central Bureau of Statistics migration data are underestimated and should be compared with destination country data but provided no such estimate Thus in this paper we extend existing literature in time referring to the broader period integrating several data sources and analyzing the movements that were effectively observed after Croatia had joined the EU in 2013 The main contribu-tions of our paper are threefold3
First we construct indirect emigration flows from Croatia following the EU accession Currently the Central Bureau of Statistics (CBS) in Croatia collects the
2 Due to data availability core EU countries are represented by 11 countries Austria Belgium Denmark Finland Germany Ireland Italy Luxembourg Netherlands Sweden and United Kingdom New EU member states are represented by 10 countries Bulgaria Croatia Czech Republic Estonia Hungary Latvia Lithu-ania Poland Slovakia and Slovenia3 In addition several authors implement partial analyses of emigration flows from Croatia following the EU accession Šonje (2018) estimates family emigration by using primary school enrolment data and shows that in 2009-2016 period around 50 thousand young citizens with children left Croatia The Croatian Employ-ment Service uses the annual employersrsquo survey to examine the extent of migration among the employed and shows that in 2016 around 20 thousand employed persons emigrated from Croatia Finally Jurić (2017) did a detailed on line survey among Croatian emigrants in Germany and showed that although economic fac-tors are relevant for emigration decision there is a prevalence of non-economic factors among the motives of emigration for Croatian emigrants
ivan
a dr
ažen
ov
ić ma
rin
a ku
no
vac d
om
inik pr
ipužić
dy
na
mic
s an
d deter
min
an
ts of em
igr
ation th
e ca
se of c
ro
atia an
d the ex
perien
ce
of n
ew eu m
emb
er states
pub
lic secto
r ec
on
om
ics
42 (4) 415-447 (2018)
418 data about migration flows from the Ministry of the Interior which records only persons that have registered the change in their country of usual residence with the Ministry Following related literature contributions (Izquierdo Jimeno and Lac-uesta 2014 Bertoli Bruumlcker and Moraga 2013) we assume that there are no clear incentives and benefits of registering in home country offices when emigrating while on the other hand immigrants have an incentive to register when they arrive in the destination country given that access to some basic social services in a destination country (ie education and health) generally requires registration Therefore we assume that official emigration numbers from CBS could be under-estimated and resort to the European Union destination countries national statisti-cal offices to collect numbers of registered immigrants coming from Croatia The differences are striking Our indirect emigration estimates show that emigration from Croatia to the core EU countries following the accession is on average around 26 times higher than the officially registered numbers in Croatia with around 230 thousands people having left Croatia and settled in one of the analyzed core EU countries in the 2013-2016 period
Secondly we show that although emigration flows in Croatia following the acces-sion are sizeable they are not an isolated case Bulgaria and Romania also expe-rienced proportionally similar population outflows after they became member states in 2007 CEE countries that joined the EU in 2004 also saw an increase in emigration rates towards the core EU countries though to a lower extent Time series of indirect emigration flows from NMS show that higher emigration rates recorded after the EU accession persisted over the years In other words average emigration rate from NMS to the core EU countries in 2016 is on average equal to or higher than the emigration rates in the four years following accession to the EU which corroborates the strong persistency of higher emigration rates4 Such trends raise several serious sustainability concerns for Croatia which will become rele-vant in the medium term since the current population outflow to the core EU countries according to the indirect emigration flows constructed is around 2 of population each year
The third contribution of our paper consists of empirical analyses of the main economic and non-economic determinants of emigration flows from Croatia and other NMS to the core EU countries We believe that their evaluation provides insights that are highly important for policymakers in order to shape and imple-ment adequate and targeted policies to mitigate emigration flows In our analysis of relevant emigration determinants we employed a gravity model Results obtained under alternative specifications and estimation strategies of the gravity model show that the access to the single EU market (after transitional provisions were lifted) has been a main driver of emigration flows in Croatia since 2013 However current economic conditions and labour market indicators together with demographic factors and prevalence of the corruption in the country also
4 That is 12 or 8 years following EU accession
ivan
a dr
ažen
ov
ić ma
rin
a ku
no
vac d
om
inik pr
ipužić
dy
na
mic
s an
d deter
min
an
ts of em
igr
ation th
e ca
se of c
ro
atia an
d the ex
perien
ce
of n
ew eu m
emb
er states
pub
lic secto
r ec
on
om
ics
42 (4) 415-447 (2018)419turned out to be significant in the determination of emigration flows among NMS
and core EU countries implying that there is a room for policymakers to alleviate the intensity of emigration pressures in Croatia
The remainder of the paper is structured as follows in section 2 we describe in detail the major characteristics of recent Croatian emigration flows firstly by dis-cussing Croatiarsquos official emigration figures and secondly by comparing official data with data on indirect emigration from Croatia collected from national statisti-cal offices of the core EU destination countries In section 3 we present a com-parative overview of the emigration experiences of other new EU member states following their EU accession In section 4 we provide a basic overview of gravity models and their applicability in studying migration issues and describe the vari-ables used in the model In section 5 we present different specifications of the gravity models and discuss the results of the econometric analysis together with robustness checks In section 6 we emphasize the main conclusions
2 demograPhIc and geograPhIcal characterIstIcs of croatIan emIgrants
21 emIgratIon flows from croatIa accordIng to the central bureau of statIstIcs data
As a starting point we take a deeper look at the official Croatian migration statis-tics in order to improve our understanding of the migration dynamics in Croatia Notwithstanding existent methodological issues and while accepting the claim that official Croatian migrations are under-reported we nevertheless believe that they could be under-reported systematically which means that they still might contain some useful information about the underlying migration trends
Looking at the big picture we can see that prior to the global financial crisis Croatia had a positive net migration balance However migration flows reversed at the onset of the global financial crisis (net migration balance turned negative) Until the EU accession negative net migration remained relatively low and stable After Croatia became a full member of the EU in July 2013 migration flows clearly intensified (figure 1)
Figure 1 also shows that EU accession had no significant effect on the number of immigrants while emigration outflows intensified significantly with the acces-sion Thus in the remaining part of the paper we concentrate exclusively on gross emigration outflows and analyze emigrantsrsquo main characteristics
Available data provide a basis for a simple demographic analysis of Croatian emi-grants Numbers suggest that there is an almost equal share of male and female emigrants throughout the period with the share of male emigrants slightly increas-ing at times of high migration (figure 2)
ivan
a dr
ažen
ov
ić ma
rin
a ku
no
vac d
om
inik pr
ipužić
dy
na
mic
s an
d deter
min
an
ts of em
igr
ation th
e ca
se of c
ro
atia an
d the ex
perien
ce
of n
ew eu m
emb
er states
pub
lic secto
r ec
on
om
ics
42 (4) 415-447 (2018)
420 Figure 1 Net migration balance of Croatia between 2001 and 2016 Central Bureau of Statistics data net migration
-40
-30
-20
-10
0
10
20
30
2001 2002 2003 2004 2005 2006 2007 2008 2009 2010 2011 2012 2013 2014 2015 2016
In th
ousa
nds
Emigration Immigration Net migration
Note Net migration = number of immigrants ndash number of emigrants in thousandsSource CBS
Figure 2 Structure of emigrants from Croatia by sex between 2002 and 2016 Central Bureau of Statistics data gross emigration flows
0
5
10
15
20
25
30
35
40
2002 2003 2004 2005 2006 2007 2008 2009 2010 2011 2012 2013 2014 2015 2016
Num
ber o
f em
igra
nts
Males Females
Note In thousandsSource CBS
The age structure of emigrants suggests that there was a structural shift towards younger emigrants in the last emigration wave Firstly there is a striking increase in the number of youngest emigrants (age 0-15) and secondly it appears that the decrease in the average age of the emigrants is accelerating Our estimates show that the average age of emigrants in the period between 2001 and 2013 was 415
ivan
a dr
ažen
ov
ić ma
rin
a ku
no
vac d
om
inik pr
ipužić
dy
na
mic
s an
d deter
min
an
ts of em
igr
ation th
e ca
se of c
ro
atia an
d the ex
perien
ce
of n
ew eu m
emb
er states
pub
lic secto
r ec
on
om
ics
42 (4) 415-447 (2018)421years but dropped sharply over next three years and reached 336 years in 2016
(figure 3) These results are in line with Šonje (2018) The author estimates that in 2009-2016 period around 50 thousand young citizens with children left Croatia permanently5
Figure 3 (a) Relative share of different age groups of emigrants and average age of emi-grant between 2002 and 2016 (b) Number of emigrants by different age groups between 2002 and 2016 Central Bureau of Statistics data gross emigration flows
30
32
34
36
38
40
42
44
46
48
00
01
02
03
04
05
06
07
08
09
10
2002
2003
2004
2005
2006
2007
2008
2009
2010
2011
2012
2013
2014
2015
2016
Ave
rage
age
of m
igra
nt (i
n ye
ars)
sh
are
of se
lect
ed a
ge g
roup
in to
tal p
opul
atio
n
0-15 15-39 40-64 65+Average age of migrant (right)
0
4000
8000
12000
16000
20000
24000
0
1000
2000
3000
4000
5000
6000
2002
2003
2004
2005
2006
2007
2008
2009
2010
2011
2012
2013
2014
2015
2016
Num
ber o
f em
igra
nts
65+
25-49 (right)
0-15 15-24 50-64
Source CBS
Turning to the distribution of emigrants across Croatian regions again there is a very clear compositional change towards the end of the analyzed period with a growing proportion of emigrants from less-developed regions Following the rela-tively stable situation during the 2000s the deep and prolonged domestic reces-sion pushed up emigration more or less gradually in almost all regions After the EU accession there was a rapid and pronounced growth of emigration from all regions albeit at a different pace Emigration flows were much stronger in the regions with the highest unemployment As a result looking at the share of migrants in their population in 2016 Croatian regions can be broadly divided into two groups one with the ratio of migrants to domestic population close to or above 1 (Eastern Croatia Central Croatia Lika and Gorski Kotar) and other economically more advanced regions with the ratio of around 066 (figure 4) Therefore even though emigration is a country-wide problem the intensity of emigration flows (as a percentage of total population) is a much stronger phenom-enon in the economically less developed regions (figure 5)
5 Estimates are based exclusively on households with children (obtained by comparison of expected and effec-tive primary school enrolment) and are considered to represent irreversible emigration based on the assump-tion that child integration in system of destination countries strongly disincentives return-migration
ivan
a dr
ažen
ov
ić ma
rin
a ku
no
vac d
om
inik pr
ipužić
dy
na
mic
s an
d deter
min
an
ts of em
igr
ation th
e ca
se of c
ro
atia an
d the ex
perien
ce
of n
ew eu m
emb
er states
pub
lic secto
r ec
on
om
ics
42 (4) 415-447 (2018)
422 Figure 4 Structure of emigrants from Croatia by region between 2001 and 2016 Central Bureau of Statistics data gross emigration flows
00
02
04
06
08
10
12
14
16
Num
ber o
f em
igra
nts
in
of t
otal
pop
ulat
ion
Eastern Croatia Central Croatia Lika and Gorski kotar Central and Southern Adriatic
Northen Adriatic Northwestern Croatia City of Zagreb
2002
2001
2003
2004
2005
2006
2007
2008
2009
2010
2011
2012
2013
2014
2015
2016
Notes Eastern Croatia encompasses Virovitičko-podravska Požeško-slavonska Brodsko-posavska Osječko-baranjska and Vukovarsko-srijemska counties Central Croatia encompass-es Zagrebačka Sisačko-moslavačka Karlovačka and Bjelovarsko-bilogorska counties Lika and Gorski kotar encompass Primorsko-goranska and Ličko-senjska counties Central and Southern Adriatic encompass Zadarska Šibensko-kninska Splitsko-dalmatinska and Dubrovačko-neretvanska counties Northen Adriatic refers to Istarska County Northwestern Croatia encom-pass Krapinsko-zagorska Varaždinska Međimurska and Koprivničko-križevačka countiesSource CBS
Figure 5 Unemployment rate and share of emigrants by county in 2016 Central Bureau of Statistics data gross emigration flows
Sisačko-moslavačka
Virovitičko-podravska
Požeško-slavonskaBrodsko-posavska
Osječko-baranjska
Vukovarsko-srijemska
Istarska
5
10
15
20
25
30
35
40
04 06 08 10 12 14 16 18 20
Une
mpl
oym
ent r
ate
in
Emigration rate as of total population
Krapinsko-zagorska
Varaždinska Međimurska
Grad Zagreb
Splitsko-dalmatinska
Note The size of the circles correspond to the emigration rate as of total population of the countySource CBS
ivan
a dr
ažen
ov
ić ma
rin
a ku
no
vac d
om
inik pr
ipužić
dy
na
mic
s an
d deter
min
an
ts of em
igr
ation th
e ca
se of c
ro
atia an
d the ex
perien
ce
of n
ew eu m
emb
er states
pub
lic secto
r ec
on
om
ics
42 (4) 415-447 (2018)423Finally CBS data show that slightly more than 85 of emigrants from Croatia
after the EU accession was directed to three EU countries Germany Austria and Ireland Figure 6 compares main emigration destinations of Croatians in the EU before and after Croatian accession Although total emigration flows towards the EU increased significantly the composition of the main destinations remained almost unchanged from the period before accession The only exception is Ire-land since emigration to Ireland before the EU accession was almost non-existent in Croatia while in 2016 Ireland become third biggest destination for Croatian emigrants In addition EU accession caused a change in relative position between Germany and Austria two main emigration destinations with even more emi-grants going to Germany This is a direct consequence of Austriarsquos decision to extend the application of transitional provisions for Croatian citizens until June 2018 After 2018 we expect the share of Croatians heading towards Austria to increase unless Austria prolongs the application of the transitional provisions until 20206
Figure 6 (a) Main EU emigration destinations for Croatians in 2010 (b) Main EU emigra-tion destinations for Croatians in 2016 Central Bureau of Statistics data gross emigration flows
713
76
67
47
3224 24 18
457
24201
91
85
8822 14
Germany
Austria
Ireland
Other EU countries
Italy
Slovenia
Sweden
United Kingdom
Germany
Austria
Ireland
Other EU countries
Italy
Slovenia
Sweden
United Kingdom
Total emigration to EU in 2010 ndash 1697 persons Total emigration to EU in 2016 ndash 28659 persons
Note Germany and Italy lifted transitional provisions for Croatia in 2015 UK and Austria are applying transitional provisions until June 2018 with possible extension until 2020Source CBS
6 Prolongation of application of transitional provisions in the period from June 2018 until June 2020 is possi-ble only in the case of serious disturbances for the Austrian labour market that would otherwise occur
ivan
a dr
ažen
ov
ić ma
rin
a ku
no
vac d
om
inik pr
ipužić
dy
na
mic
s an
d deter
min
an
ts of em
igr
ation th
e ca
se of c
ro
atia an
d the ex
perien
ce
of n
ew eu m
emb
er states
pub
lic secto
r ec
on
om
ics
42 (4) 415-447 (2018)
424 22 emIgratIon from croatIa accordIng to natIonal statIstIcal offIces of core eu countrIes
The Croatian Central Bureau of Statistics detailed data about emigration presented so far are useful for an analysis of some main characteristics of Croatian emi-grants However as previously explained in the Introduction the official number of emigrants published by the Central Bureau of Statistics in Croatia is based on the people who voluntarily registered their departure with the authorities while standard migration theory predicts that migrants are much more likely to register in the country of destination than in the country of origin7 Therefore in addition we construct an indirect emigration flow taking as a starting point the immigration statistics from the national statistical offices of the following core EU countries Germany Denmark Austria Ireland Belgium Netherlands Italy Finland Swe-den Luxembourg and United Kingdom For UK and Ireland immigration statis-tics are not available so we use the individually appointed national insurance numbers (NINo) in the UK and personal public service numbers (PPS) in Ireland that are commonly used in the literature (Hazans and Philips 2011) We analyze the period from 2000 until 2016 and for each year in the sample we consult offi-cial immigration statistics of the selected core EU countries and take the number of immigrants coming from Croatia
Where available our preferred choice is statistics that register immigrants from Croatia according to the country of birth principle (as in Netherlands Italy UK and Belgium) or country of previous residence principle (as in Germany and Denmark)8 Immigration flows registered according to citizenship principle (as in Sweden Finland Luxembourg and Austria) could be inaccurate since they also include migrants from Bosnia and Herzegovina (and other countries) having Cro-atian (or dual) citizenship9 According to Jurić (2017) in a survey of Croatian emigrants to Germany around 20 of emigrants registered as Croatian citizens in Germany actually emigrated from Bosnia and Herzegovina This is the reason why we have avoided using migration numbers based on the citizenship principle if the country of birth principle or country of previous residence principle was also available among migration statistics Nevertheless given that for some countries migration statistics are available only based on the citizenship principle indirect emigration flows constructed with resort to the national statistical offices of core EU countries and presented in the remaining part of the paper should be inter-preted as an upper bound for emigration outflows from Croatia Detailed informa-tion about the construction of indirect emigration flows is given in appendix 1 Comparison between constructed indirect emigration flows from Croatia based on
7 Illustrative case in point is a Polish example Following the EU accession Poland experienced a strong emi-gration flows At some point policymakers realized that the official statistics grossly underestimate the extent of emigration As a result research project has been initiated in Poland in order to properly estimate the true numbers The upgraded and consolidated sources raised the official emigration numbers by a factor ten (Sta-tistics Poland 2011)8 Destination country can register immigrants according to the following principles country of birth princi-ple country of previous residence principle and citizenship principle Registration of immigrants according to the different principles is defined by Eurostat International Migration Statistics 9 For Ireland personal public service number the principle for registration of immigrants is not denoted
ivan
a dr
ažen
ov
ić ma
rin
a ku
no
vac d
om
inik pr
ipužić
dy
na
mic
s an
d deter
min
an
ts of em
igr
ation th
e ca
se of c
ro
atia an
d the ex
perien
ce
of n
ew eu m
emb
er states
pub
lic secto
r ec
on
om
ics
42 (4) 415-447 (2018)425data published by national statistical offices of the core EU countries and official
Central Bureau of Statistics data are represented in figure 7 1011
Figure 7 Indirect emigration flows from Croatia to the core EU countries according to national statistical offices of core EU countries compared to the official emigra-tion numbers to EU 27 countries according to Central Bureau of Statistics gross emigration flow
0
10
20
30
40
50
60
70
80
2000 2001 2002 2003 2004 2005 2006 2007 2008 2009 2010 2011 2012 2013 2014 2015 2016
Num
ber o
f em
igra
nts
Indirect emigration numbers ndash from national statistical offices of core EU countres
Official Croatian Bureau of Statistics emigration to EU 27
Note Official Central Bureau of Statistics emigration number for emigration in EU 27 Core EU countries are represented by 11 countries due to data availability Austria Belgium Denmark Finland Germany Ireland Italy Luxembourg Netherlands Sweden and United Kingdom in thousandsSource CBS national statistical offices of the core EU countries
The differences in emigration outflows between the two sources are striking According to the indirect estimates of emigration 230 thousand persons emigrated from Croatia to the core EU countries in the period from 2013-2016 On the other hand official data report 61 thousand emigrants in 2013-2016 period directed towards the selected core EU countries and 102 thousand emigrants in total during the same time period However the difference between the mirror statistics of Cro-atia and core EU destination countries is expected to decrease in the future This would reflect the fact that by the end-2016 the Croatian Tax Administration encour-aged Croatian migrants to change their residency status with authorities in order to
10 According to the Central Bureau of Statistics national statistical offices of the selected core EU countries represent broadly around 90 of total emigration to the European Union from Croatia over the entire sam-ple period which makes them a valid and representative indicator of total emigration flows towards the EU11 We have also estimated total emigration flows from Croatia by putting together (1) indirectly constructed emigration flows to the core EU countries and (2) Central Bureau of Statistics official emigration data for all other emigration destinations ie ldquothe rest of the worldrdquo The same approach is followed in order to construct an approximation of total immigration flows in Croatia Calculation details of total net emigration are given in appendix 2 According to our discretional combination of different data sources net emigration from Cro-atia is estimated to be around 155 thousands person in the 2013-2016 period
ivan
a dr
ažen
ov
ić ma
rin
a ku
no
vac d
om
inik pr
ipužić
dy
na
mic
s an
d deter
min
an
ts of em
igr
ation th
e ca
se of c
ro
atia an
d the ex
perien
ce
of n
ew eu m
emb
er states
pub
lic secto
r ec
on
om
ics
42 (4) 415-447 (2018)
426 avoid double taxation of their income12 The threat of double taxation of income probably incentivized migrants to be more prompt in registering their departure and changing their residence in their origin country offices13
Overall the discrepancies between the mirror statistics of origin and destination countries are common in migration statistics and most other countries are also faced with similar challenges Thus in our analysis we will adopt the same prin-ciple for other NMS Bulgaria Romania Poland Czech Republic Slovakia Slo-venia Hungary Latvia Lithuania and Estonia and construct indirect emigration flows for these countries referring to the immigration statistics of national statisti-cal offices of the core EU countries
3 mIgratIon flows In other new eu member states after the eu accessIon
In this section by looking into the emigration experience of other new EU mem-bers we tried to gain additional insight about some additional characteristics of emigration flows caused by EU accession such as the average structure of emi-grants (according to main demographic attributes) stability of the flows number of years after the accession needed to reach a plateau the likely duration of an emigration wave and possible reversal points
Detailed migration data from national statistical offices of the new EU member states allow us to analyze the main attributes of emigrants from NMS in order to look for some substantial differences or similarities in migration flows between countries According to figure 8 data about the age structure of emigrants does not follow any single path across countries However for all countries in the sample the average age of emigrant in 2016 is similar ranging broadly from the low to the mid-thirties At the same time the median age of the total population is rapidly increasing which in most countries widens the gap between the average popula-tion and average emigrant age This situation makes the emigration outflows of relatively younger citizens even more concerning in terms of the long-term sus-tainability of social services (such as public pensions and health)
Comparison of top emigration destinations for emigrants coming from NMS reveals that Germany is ranked among the top three emigration destinations for all countries in the sample The Croatian main emigration destinations Austria and the United Kingdom are also the second most frequent EU destinations for emi-grants from NMS in 2016 (table 1)14
12 At the beginning of 2017 Croatian government adopted the Ordinance for the implementation of the Gen-eral Tax Act (OG 3017) that clarified the process of determination of residency status for tax purposes and induced migrants to register their change of residency within authorities to avoid double income taxation 13 CBS is constantly working on improving migration data sources so part of the observed developments might reflect underlying methodological changes For example in 2011 the CBS changed its definition of migrants from people who registered their departurearrival to people who are absent from their usual place of residence in a one year period14 Nevertheless there are some peculiarities among main emigration destinations between NMS Finland was the main destination for emigrants from Estonia and Spain for emigrants from Romania in 2016 reflecting their cultural and historical linkages
ivan
a dr
ažen
ov
ić ma
rin
a ku
no
vac d
om
inik pr
ipužić
dy
na
mic
s an
d deter
min
an
ts of em
igr
ation th
e ca
se of c
ro
atia an
d the ex
perien
ce
of n
ew eu m
emb
er states
pub
lic secto
r ec
on
om
ics
42 (4) 415-447 (2018)427Figure 8
New MS emigrantsrsquo average age and median age of population 2000-2016 national statistical offices of NMS countries gross emigration flows
20
25
30
35
40
45
50
20
25
30
35
40
45
50
BGEE CZ RO LT LV SK PL HU SI HR
Average migrant age Median population age
Sources CBS national statistical offices and Eurostat authorsrsquo calculations
Table 1 Main EU emigration destinations for NMS in 2016 (in of total EU emigration) national statistical offices of NMS countries gross emigration flows
origin country top 3 emigration destinations in eu as of total eu emigrationBulgaria na na naCroatia Germany 71 Austria 8 Ireland 7Czech Republic Slovakia 60 Germany 9 Poland 6Estonia Finland 63 United Kingdom 8 Germany 7Hungary Germany 32 Austria 27 United Kingdom 17Latvia na na naLithuania United Kingdom 60 Ireland 11 Germany 10Poland Germany 43 United Kingdom 28 Netherlands 8Romaniaa Spain 24 Germany 17 Italy 16Slovakia Czech Republic 38 Austria 27 Germany 10Slovenia Germany 27 Austria 27 Croatia 12
a Percentage of total emigrationSources CBS national statistical offices and Eurostat
Given that similar core EU countries dominate as the main emigration destinations to Europe for NMS this corroborates our decision to construct indirect emigration flows for NMS by resorting to the national statistical offices of core EU countries as we did for Croatia Thus in the remaining part of this section we use data about indirect emigration flows from NMS to the core EU countries and employ them to compare the dynamics and intensity of migration outflows among the NMS
Comparison of the indirect emigration flows from other NMS to core EU coun-tries shows that the intensity of emigration flows from Croatia following the accession is not unique in its size given the experience of other economically less
ivan
a dr
ažen
ov
ić ma
rin
a ku
no
vac d
om
inik pr
ipužić
dy
na
mic
s an
d deter
min
an
ts of em
igr
ation th
e ca
se of c
ro
atia an
d the ex
perien
ce
of n
ew eu m
emb
er states
pub
lic secto
r ec
on
om
ics
42 (4) 415-447 (2018)
428 developed member states (Bulgaria and Romania) but also that emigration flows from NMS following the EU accession in 2004 were significantly lower (figure 9) Another important pattern arises from the analysis of NMS emigration flows since it is visible that a rise in the average migration rate towards the core EU countries following EU accession is not a temporary one-off reaction to accession to the common EU market According to figure 10 the average emigration rate in 2016 is equal to or higher than the average emigration rate in four years following the EU accession pointing to the persistence of intensive emigration flows15
Figure 9 Indirect emigration flows from NMS to the core EU countries national statistical offices of core EU countries gross emigration flows
0002040608101214161820
2000
2001
2002
2003
2004
2005
2006
2007
2008
2009
2010
2011
2012
2013
2014
2015
2016
In
of t
otal
pop
ulat
ion
Czech R Hungary PolandSlovakia Slovenia Baltics
0002040608101214161820
2000
2001
2002
2003
2004
2005
2006
2007
2008
2009
2010
2011
2012
2013
2014
2015
2016
In
of t
otal
pop
ulat
ion
Bulgaria Croatia Romania
Note Dashed lines denote the years of EU accessionSource National statistical offices of the core EU countries
Figure 10 Indirect emigration flows of NMS in time national statistical offices of core EU countries gross emigration flows
00
02
04
06
08
10
12
14
16
18
20
SI CZ HU LV EE SK LT BG PL RO
In
of t
otal
pop
ulat
ion
Avg migration rate in 4 years following EU accession Avg migration rate in 2016
Source National statistical offices of the core EU countries
15 However all member states but Croatia gained access to the common EU market prior to the onset of the global crisis Only Croatia joined the EU after six consecutive years of economic distress This might have created an additional pressure on migration outflows from Croatia However proper evaluation of this phe-nomenon will be possible only with some time delay
ivan
a dr
ažen
ov
ić ma
rin
a ku
no
vac d
om
inik pr
ipužić
dy
na
mic
s an
d deter
min
an
ts of em
igr
ation th
e ca
se of c
ro
atia an
d the ex
perien
ce
of n
ew eu m
emb
er states
pub
lic secto
r ec
on
om
ics
42 (4) 415-447 (2018)429A careful consideration must also be given to the influence of the economic cycle
on emigration Persistence of increased emigration flows from NMS to core EU countries in the decade following EU accession could reflect the impact of the economic crisis that started in 2009 on emigration decisions Figure 11 in both panel (a) and (b) shows that economic conditions are indeed related to intensity of emigration
Figure 11Average emigration flow as in total population from 2011 to 2016 compared to average unemployment rate (a) and average GDP PC in PPS (b) national statis-tical offices of core EU countries gross emigration flows
BG
HR
CZ
EEHU
LV
LT
PL
RO
SK
SI
10000
12000
14000
16000
18000
20000
22000
24000
00 05 10 15
GD
P PC
in P
PS (2
008-
2016
)
Emigration flow as in total population
BG
HR
CZ EE
HU
LVLT
PL ROSKSI
50
55
60
65
70
75
00 02 04 06 08 10 12 14 16 18
Emigration flow as in total population (2013-2016)
Empl
oym
ent r
ate
in
(201
3-20
16)
y = -68574x + 69749Rsup2 = 04745
y = -63306x + 23269Rsup2 = 07714
Source Eurostat and national statistical offices of the core EU countries
The NMS had rather different crisis and post-crisis experiences Poland experi-enced no recession but faced sizable emigration flows some countries recovered rather quickly after the initial shock (the Baltics Slovakia) while others experi-enced a double-dip recession (Slovenia) or a very deep and prolonged recession (Croatia) In addition the economic slack was global in nature ie the worsening of economic conditions was not restricted only to NMS but was also present in most of the core EU countries thus altering to some extent the relative benefits between origin and destination countries As a result a simple comparison of var-ious economic performance indicators and the intensity of emigration flows can provide only a partial and limited insight into the relative importance of different economic and non-economic determinants of migration flows In the next section we thus resort to formal econometric analysis using a gravity model to examine the main determinants of emigration in Croatia and other new EU member states to the core EU countries in the 2000-2016 period
4 graVIty model of mIgratIonThe application of Newtonian physics in economics started with Tinbergen (1962) who used a gravity model to explain international trade flows Flowerdew and Salt (1979) introduced the gravity model in the context of migration analysis and it soon become widely used to analyze different migration determinants However some authors claim that the first application of a gravity model to explain migration patterns goes back to Ravenstein who used it to analyze migra-tion patterns in 19th century Britain (Anderson 2011)
ivan
a dr
ažen
ov
ić ma
rin
a ku
no
vac d
om
inik pr
ipužić
dy
na
mic
s an
d deter
min
an
ts of em
igr
ation th
e ca
se of c
ro
atia an
d the ex
perien
ce
of n
ew eu m
emb
er states
pub
lic secto
r ec
on
om
ics
42 (4) 415-447 (2018)
430 Notwithstanding their long history gravity models have experienced a revival since the early 2000s due to much improved bilateral migration data (Ramos 2016) and the emergence of statistical theories appropriate for studying spatial interaction The reasons for the popularity of gravity models in migration analysis are trifold intuitive consistency with migration theories ease of estimation in its simplest form goodness of fit in most applications (Poot et al 2016) Gravity models assume migration flows (M) between the origin country i and destination country j in time t are proportional to the product of their populations (P) (which are in migration contexts used as proxies for the concept of mass from standard gravity model) and inversely proportional to the distance (D) between them
(1)
Gravity models in their original form are purely non-theoretical so they are usu-ally enriched with different variables capturing traditional pull and push factors of migration following human capital theory approach to migration developed by Sjaastad (1962) and Harris and Todaro (1970) The authors consider migration decision as a complex form of investment in human capital that is influenced by future expected income levels and the relative probability of employment oppor-tunities in destination and origin countries16 More formal arguments for the use of an extended vector of explanatory variables in migration analysis can be derived from the Random utility model introduced in migration literature by Borjas (1987) and Grogger and Hanson (2011) that provided micro foundations in the context of migration analysis Reflecting these considerations the gravity model used in this paper is augmented by an additional set of explanatory variables covering differ-ent economic demographic and educational factors as well as the level of corrup-tion in the country
The dependent variable is the gross flow of emigrants from NMS to the core EU country in each year for 2000-2016 period In order to trace emigration flows accurately we rely on immigration statistics of the selected receiving countries as available from national statistical offices of the core EU countries as explained in section 2
Explanatory variables used in the analysis are related to traditional pull and push factors of migration presented in literature The basic specification of our model contains GDP per capita in purchasing power parity of origin and destination country relative size of populations between countries based on Eurostat data and geographical distance between capitals of destination and origin countries down-loaded from CEPIIrsquos geo-distance database Moreover our basic specification also contains the variable capturing the effect of EU accession The variable is based on transitional provisions on the free movement of workers from new EU
16 Income levels are usually approximated by GDP per capita in PPP terms given that wage data are not com-parable across countries
ivan
a dr
ažen
ov
ić ma
rin
a ku
no
vac d
om
inik pr
ipužić
dy
na
mic
s an
d deter
min
an
ts of em
igr
ation th
e ca
se of c
ro
atia an
d the ex
perien
ce
of n
ew eu m
emb
er states
pub
lic secto
r ec
on
om
ics
42 (4) 415-447 (2018)431member states following the EU enlargement in 2004 2007 and 2013 as reported
by the European Commission Following the EU enlargement several core EU states decided to apply transitional provisions on the free movement of workers from NMS and effectively postpone the full liberalization of their labour markets Thus for each pair of origin and destination countries in the sample the dummy variable associated to transitional provisions takes the value 1 in the year that the core EU country lifted its restrictions on the free movement of workers coming from the respective NMS
In the extended version of our model we include additional variables accounting for some additional characteristics of origin and destination countries Following Lamberty (2015) we use data from the World Governance Index (WGI) database and include a corruption index for origin and destination country as explanatory variables in our analysis to evaluate if differences in corruption between coun-tries are a relevant factor in explaining observed emigration patterns From among the different WGI indexes evaluating the quality of governance and institutions from different aspects we have opted for the inclusion of the corruption index in our main specification following Poprawe (2015) who shows that corruption increases emigration since it retards the economic development of the country and creates an insecure living and economic environment1718 We also evaluate the impact of origin country population attributes on migration outflows Following Sprenger (2013) we include the share of persons educated to tertiary level in total population of origin country to test whether higher emigration flows are associ-ated with higher skill levels The impact of demographic characteristics of origin population on emigration flows is measured through the share of young people (persons aged 20-34) in total population of origin country as an approximation of the potential emigration pool
Finally we include alternative variables for economic performance of the country We find this relevant since Bertoli Bruumlcker and Moraga (2013) and Beine et al (2017) argue that relative difference in GDP per capita in purchasing power stand-ard represents a difference in level of economic development between two coun-tries which is relevant for emigration decisions but that current and future eco-nomic prospects not captured by relative GDP per capita in PPS are also impor-tant Bertoli Bruumlcker and Moraga (2013) and Beine et al (2017) argue that dif-ferences in GDP per capita in PPS are already captured by the inclusion of origin and destination fixed effects Additionally economic distress arising during the crisis period causes changes in future economic prospects that not reflected in a timely way in the level of GDP per capita in PPS Therefore in the extended specification of our model we substitute for GDP per capita in PPS with short-
17 Vukovic (2017) shows that the Croatian economy is permeated by corruption since the political system is characterized by systematic corruption on national and local levels Also WGI corruption index data point to a substantial gap in corruption incidence between most NMS and core EU countries in general18 As a main alternative to the corruption index we could have used the governance index from the same data-base Estimation results obtained with the governance index as independent variable are shown in appendix 3
ivan
a dr
ažen
ov
ić ma
rin
a ku
no
vac d
om
inik pr
ipužić
dy
na
mic
s an
d deter
min
an
ts of em
igr
ation th
e ca
se of c
ro
atia an
d the ex
perien
ce
of n
ew eu m
emb
er states
pub
lic secto
r ec
on
om
ics
42 (4) 415-447 (2018)
432 term indicators of economic activity ndash employment rate and output gap of origin and destination country19 These variables capture how changing growth prospects and labour market opportunities affect emigration across countries
Detailed descriptions of all variables and respective data sources are provided in appendix 1
In order to evaluate the main determinants of migration flows from NMS into the core EU countries we apply the Poisson pseudo maximum likelihood estimator Numerous literature contributions examine the main drivers of migration by using a fixed effects model as a baseline methodology20 However a fixed effect model does not allow for the estimation of variables that are constant in time (such as the distance between two countries) Moreover Santos-Silva and Tenreyro (2006) in their paper show that parameters in log-linearized models estimated by OLS in the presence of heteroscedasticity could lead to biased estimates The authors alterna-tively propose application of the Poisson pseudo maximum likelihood (PPML) estimator and argue that the PPML estimator is more suitable given its consist-ency in presence of heteroscedasticity Moreover the PPML estimator will allow us to properly account for zero migration flows between two countries since the dependent variable in PPML is not in logarithmic form but is assumed to take positive integer values Given this advantages of the PPML estimator over the standard panel fixed effects estimator we transform our basic gravity model from equation (1) and extend it by additional explanatory variables
(2)
where mijt represents migration from origin country i into destination country j in a year t xit is a vector of explanatory variables characteristic for origin country economic political geographical and demographic factors yjt is vector of explan-atory variables representing destination country characteristics in time and δi and ϑj are respectively origin and destination country specific effects
5 results ndash maIn determInants of emIgratIon The main results of the estimation of equation (2) using the PPML estimator are presented in table 2 As a robustness check estimates obtained by the application of the fixed effect model are also presented in table 2 but are not discussed explic-itly According to the results of the baseline model (Model 1) population and dis-tance parameters are in line with gravity model predictions An increase in distance between destination and origin country by 1 will decrease emigration flows by 15 all other factors being equal confirming the theoretical predictions of the
19 We opt for the exclusion of GDP per capita in PPS from the extended model specification since inclusion of GDP PC in PPS and short term economic indicators could result in multicollinearity Instead differences in level of economic development are captured by origin and destination fixed effects20 A detailed overview of different estimation strategies and models used in assessment of impact of EU acces-sion for CEE countries in 2004 is given in Bruumlcker et al (2009)
ivan
a dr
ažen
ov
ić ma
rin
a ku
no
vac d
om
inik pr
ipužić
dy
na
mic
s an
d deter
min
an
ts of em
igr
ation th
e ca
se of c
ro
atia an
d the ex
perien
ce
of n
ew eu m
emb
er states
pub
lic secto
r ec
on
om
ics
42 (4) 415-447 (2018)433standard gravity model implying that migration flows between two countries are
inversely proportional to the distance between them This interesting result sug-gests that importance of transportation and information costs that are approximated with physical distance between countries still remains relevant in migration deci-sions irrespective of the decrease in transportation costs and the development of the internet since the rather different world around the time of the pioneer application of gravity models in migration analysis in the late 1970s The positive coefficient associated with the relative difference between population of destination and origin country suggests that countries with bigger populations have more intensive migra-tion flows However this result is not statistically significant Secondly our base-line model shows GDP per capita in PPS in destination country increases migration flows directed toward the country confirming the theories arguing that a positive difference in the level of economic conditions will increase emigration flows from origin to destination country Estimated parameters show that an increase in GDP per capita in PPS in a destination country of 1 will lead to an increase in emigra-tion flows from origin to destination country by 22 assuming all other factors remain unchanged On other hand the coefficients associated to GDP PC in PPS in origin country are not statistically significant
Finally the variable transitional provisions measuring the impact of the accession to the principle of free movement of persons across borders going from new EU member states (origin countries) to the core EU (destination countries) is statisti-cally significant and large in its value increasing migration flow by 4021
The results of the extended model specification (Model 2) show that short-term economic indicators represented by different labour market indicators and cycli-cal position of the economy of origin and destination countries are statistically significant and thus affect emigration decisions An increase in employment opportunities in a destination country by 1 will increase emigration flows from origin to destination countries by 82 all other factors being equal At the same time an increase in employment opportunities in origin country by 1 will decrease emigration flows by 5 Results indicate that cyclical position of the economy is also important for migration decisions An improvement in cyclical position of a destination country by 1 percentage point (ie positive output gap) will increase emigration flows from origin to destination countries by 2 if all other factors remain constant
21 Changes in the predicted emigration flow for dummy variable representing transitional provisions are calu-lated according to the formula -1
ivan
a dr
ažen
ov
ić ma
rin
a ku
no
vac d
om
inik pr
ipužić
dy
na
mic
s an
d deter
min
an
ts of em
igr
ation th
e ca
se of c
ro
atia an
d the ex
perien
ce
of n
ew eu m
emb
er states
pub
lic secto
r ec
on
om
ics
42 (4) 415-447 (2018)
434 Table 2 Determinants of emigration flows from new EU member states to the core EU countries between 2000 and 2016 Fixed effects estimator (FE) and Poisson pseudo maximum likelihood estimator (PPML)
model 1 (baseline) fe
model 1 (baseline) PPml
model 2 fe
model 2 PPml
Distance ndashndash
-148(000)
ndashndash
-154(000)
Population 059(017)
141(035)
099(002)
585(000)
GDP PC in PPS (origin)
011(059)
027(046)
GDP PC in PPS (destination)
155(000)
215(001)
Transitional provisions
054(000)
034(000)
046(000)
046(000)
Employment rate (origin)
-145(000)
-504(000)
Employment rate (destination)
12(006)
815(000)
Output gap (origin)
-227(000)
307(02)
Output gap (destination)
374(000)
203(004)
Corruption index (origin)
003(089)
-166(000)
Corruption index (destination)
378(000)
246(009)
Share of youth (20-34) origin
15(000)
019(08)
Share of tertiary educated (origin)
025(014)
058(007)
Cons -1191 023 -1365 551Number of observations 1958 1972 1958 1972
R2 046 078 053 082Note and refer to 10 5 and 1 statistical significance levels respectively P-values are in parenthesis All specifications include origin and destination fixed effects dum-mies Parameters associated to output gap for origin and destination country are multiplied by 100 since the output gap enters the model specification in levels instead of being transformed into logarithms due to negative valuesSource Authorsrsquo elaboration based on national statistical offices of the core EU countries immi-gration data and on the data presented appendix 1
Moreover we find an importance in the level of education of the workforce in the origin country since the coefficient associated to the variable denoting the share of those with tertiary education in the total population of origin country assumes a positive significant value The estimates imply that an increase in the share of the tertiary educated in an origin population will increase migration flows from
ivan
a dr
ažen
ov
ić ma
rin
a ku
no
vac d
om
inik pr
ipužić
dy
na
mic
s an
d deter
min
an
ts of em
igr
ation th
e ca
se of c
ro
atia an
d the ex
perien
ce
of n
ew eu m
emb
er states
pub
lic secto
r ec
on
om
ics
42 (4) 415-447 (2018)435the origin country by 06 The share of young population in an origin country is
also found to be positively correlated with the intensity of migration from the origin country but the results are not statistically significant Finally the differ-ence in corruption between destination and origin countries is also significant for emigration decisions An increase in the corruption index in the origin country by 1 (an increase in WGI corruption index represents a decrease of level of corrup-tion in the economy given the construction of corruption index) will lead to lower emigration from origin country by 17 At the same time an increase in the cor-ruption index of destination country by 1 (implying a lower corruption level in destination country) will increase emigration flows from origin to destination country on average by 25 all other factors being equal
As a final step in our analysis we compare results of the extended model specifi-cation with the baseline model specification and confirm the relevance of gravity model predictions for migration flows The importance of EU accession meas-ured through the transitional provisions dummy variable again proved statistically significant and large in its value suggesting that EU accession could raise emigra-tion flows by 60 if all other factors remain unchanged Overall baseline and extended model specification results show that the possibility of free movement of people across borders gained with EU accession is the main trigger of intensifica-tion of emigration flows from NMS to the core EU countries However the new higher level of emigration flows from NMS towards the core EU countries follow-ing EU accession differs among countries ranging from 02 of the population as in the Czech Republic to almost 2 of population in Romania According to the estimates of the gravity model apart from the EU accession significant determi-nants in explaining the magnitude of migration outflows are represented by the characteristics of origin country population itself economic development and per-formance of short term economic indicators and level of institutional quality assessed through the corruption incidence of both origin (NMS) and destination countries (the core EU)
51 robustness checKsIn addition to static estimation models as a robustness check we also estimate a dynamic model We apply the Arellano and Bond (1991) and Blundell and Bond (1998) generalized method of moments estimator which is suitable for datasets characterized by short-time periods and large cross sectional dimension with endogenous independent variable and in presence of fixed effects and heterosce-dasticity and autocorrelation within observations Inclusion of a lagged dependent variable is also relevant for assessment of network effect on emigration decisions since lagged migration flow can be interpreted as network approximation Con-trolling for network effect is important since networks offer support and an addi-tional information set for migrants reducing migration costs and associated risks (Beine Docquier and Ozden 2009) In line with previous model specifications the dynamic model also contains origin dummies and destination dummies to take into account all unobservable time invariant origin and destination specific varia-
ivan
a dr
ažen
ov
ić ma
rin
a ku
no
vac d
om
inik pr
ipužić
dy
na
mic
s an
d deter
min
an
ts of em
igr
ation th
e ca
se of c
ro
atia an
d the ex
perien
ce
of n
ew eu m
emb
er states
pub
lic secto
r ec
on
om
ics
42 (4) 415-447 (2018)
436 bles that were not captured by the set of variables included in the model but are relevant for migration decisions and the intensity of migration flows The results of the dynamic model corroborate the main findings from the previous section The estimates confirm the importance of gravity model variables in the determina-tion of emigration flows Moreover EU accession assessed through the transi-tional provisions variable again resulted as sizable and significant increasing average emigration flows by 30 Finally we confirm the importance of short-term economic conditions ndash employment opportunities in origin country and changes in cyclical economic position in destination country as determinants of migration flows Contrary to the static model specification the impacts of the educational level of population in the origin country and the degree of corruption in the economy have the expected signs but are not statistically significant The results of dynamic model specification are presented in appendix 3
6 conclusIonThis paper aimed to clarify some basic facts about the dynamics and main deter-minants of emigration from Croatia following EU accession To that purpose extensive data analysis was conducted capturing and comparing different emigra-tion data sources Further the application of panel gravity model to Croatian and other NMS indirect emigration data enabled us to detect and discuss the main determinants of emigration from Croatia and other NMS to the core EU countries and their importance in making decisions about emigration
As a first contribution to the discussion of the issue of the current emigration wave in Croatia we use mirror statistics from core EU national statistical offices and compare them to the official emigration numbers of CBS Construction of an alter-native emigration dataset using immigration data from the national statistical offices of the core EU countries showed that emigration flows from Croatia following EU accession are on average 26 times as high as those recorded in official statistical data amounting to 230 thousand people leaving Croatia in the 2013-2016 period If we relate our results to a priori projections of emigration from Croatia after EU accession our estimates can be placed in between Vidovic and Mara (2015) and Strielkowski Šaacuterkovaacute and Żornaczuk (2013)22 Similar proportional population out-flows were observed in less developed new member states following their EU acces-sion (Romania and Bulgaria) while new member states from the initial wave of enlargement experienced less pronounced rises in their emigration flows
Analysis of detailed migration data available at national statistical offices of the new EU member states statistical offices showed that average characteristics of emigrants from NMS are similar across countries and point to a balanced emigra-tion with respect to the sex of the emigrants The main destination country for most countries in the sample was Germany Finally data also show that the aver-age emigrant from NMS in 2016 was between 31 and 37 years old indicating that emigration affects the young part of the population Emigration of mostly young
22 Direct comparison is not possible since the aforementioned authors estimate net migration potential while our analysis is based on gross emigration flows
ivan
a dr
ažen
ov
ić ma
rin
a ku
no
vac d
om
inik pr
ipužić
dy
na
mic
s an
d deter
min
an
ts of em
igr
ation th
e ca
se of c
ro
atia an
d the ex
perien
ce
of n
ew eu m
emb
er states
pub
lic secto
r ec
on
om
ics
42 (4) 415-447 (2018)437citizens is indisputably a human capital loss for origin countries However long-
term overall effects of emigration flows on origin countries should be interpreted with caution Emigration leads to improvement of knowledge and skills of emi-grants given that their skills increase due to exposure to international competi-tion instead of gradually deteriorating in the low capacity domestic labour mar-ket In the case of reverse migration this can result in a brain-gain for origin economies Moreover the effect of migration on the labour markets of origin countries is also twofold According to the extensive migration literature (Thaut 2009) the employment opportunities and wages of those who stay in origin coun-tries increase and the unemployment rate decreases causing the activation of long-term unemployed people On other hand labour market shortages in some sectors inevitably arise and sustainability of public pensions and other social ser-vice are threatened The overall effects will depend on synchronization of educa-tional policies with origin country labour market requirements overall degree of economic development and future economic performance in origin country
In fact the analysis of main determinants of migration showed the most significant factor in explaining emigration flows between NMS and the core EU countries is the accession to the principle of free movement of workers obtained by EU acces-sion which increased emigration flows in the range from 30 to 60 This is in line with other relevant studies about labour mobility within the EU where EU membership is found to increase labour mobility significantly23 However estima-tion of the gravity model revealed that there exist other significant determinants in explaining migration outflows such as the characteristics of origin country popu-lations itself economic development performance of short-term economic indica-tors and level of institutional quality assessed through the corruption incidence of both origin (NMS) and destination countries (the core EU) These findings imply that policies that promote broad and solid economic development can influence emigration flows which raises several implications for policymakers
Emigration phenomena will probably have a strong impact on the Croatian econ-omy in the medium-run Accordingly we would like to emphasise the importance of further research in this field Potential research topics encompass the assess-ment of the impact of the last emigration wave on the potential growth prospects of the Croatian economy the effect of increasing remittances on the Croatian economy sustainability of the current setup of social policies (pension funds health system new infrastructure investment existing infrastructure mainte-nance) required immigration flows in order to alleviate negative emigration con-sequences and finally the implications of emigration flows for the conduct of monetary fiscal and structural policy in the broadest sense
disclosure statementNo conflict of interest
23 For more details about relationship between EU membership and labour mobility see Arpaia et al (2016)
ivan
a dr
ažen
ov
ić ma
rin
a ku
no
vac d
om
inik pr
ipužić
dy
na
mic
s an
d deter
min
an
ts of em
igr
ation th
e ca
se of c
ro
atia an
d the ex
perien
ce
of n
ew eu m
emb
er states
pub
lic secto
r ec
on
om
ics
42 (4) 415-447 (2018)
438 aPPendIX 1
Table a1 Data sources and details independent variables
data sources and details for set of independent variables
Variable description source estimation details
GDP PC in PPS
Gross domestic product at market prices current prices PPS per capita
Eurostat online statistical database
Destination and origin country in log
Unemployment rate
Yearly unemployment rates from 15 to 64 years percentage
Eurostat online statistical database
Destination and origin country in log
Population Population on 1 January total
Eurostat online statistical database
Relative values between destination and origin country in log
Distance
ldquoDistance between two countries is calculated based on latitudes and longitudes of the most important citiesagglomerations (in terms of population) Mayer and Zignago (2011)rdquo
CEPII database In log
Youth population number
Population on 1 January from 20 to 34 years
Eurostat online statistical database
Origin country as a share in total population in log
Tertiary educated
Population by educational attainment level from 15 to 64 years tertiary education (levels 5-8)
Eurostat online statistical database
Origin country as a share in total population 1000 in log
Corruption index
Control of corruption captures perceptions of the extent to which public power is exercised for private gain including both petty and grand forms of corruption as well as ldquocapturerdquo of the state by elites and private interests (httpinfoworldbankorggovernanceWGIdoc)
Worldwide Governance Indicators (WGI) The World Bank
Destination and origin country in log
ivan
a dr
ažen
ov
ić ma
rin
a ku
no
vac d
om
inik pr
ipužić
dy
na
mic
s an
d deter
min
an
ts of em
igr
ation th
e ca
se of c
ro
atia an
d the ex
perien
ce
of n
ew eu m
emb
er states
pub
lic secto
r ec
on
om
ics
42 (4) 415-447 (2018)439data sources and details for set of independent variables
Variable description source estimation details
Governance index
ldquoGovernment effectiveness captures perceptions of the quality of public services the quality of the civil service and the degree of its independence from political pressures the quality of policy formulation and implementation and the credibility of the governments commitment to such policies (httpinfoworldbankorggovernanceWGIdoc)rdquo
Worldwide Governance Indicators (WGI) The World Bank
Destination and origin country in log
Output gap Output gaps ( of potential output) HP filter
European Commission CIRCAB II autum fore-cast
Destination and origin country
Employment rates
Yearly employment rates from 15 to 64 years percentage
Eurostat online statistical database
Destination and origin country in log
Transitional provisions
Variable representing the access to common free EU market for BG and RO takes value 1 for FI SE from 2007 for DK from 2009 for IT and IE from 2012 and for all other countries from 2014 Variable representing the access to common free EU market for HR takes value 1 for DK FI IR SE from 2013 for BE IT DE LU from 2015 while NL AT and UK apply transitional provisions for HR during the entire sample period (sample is ending in 2016 while transitional provisions applied by NL AT and UK should be lifted by June 2018) Variable representing the access to common free EU market for CZ SK SI PL HU LV LT EE takes value 1 for UK SE IE from 2004 for IT FI from 2006 for NL LU from 2007 for BE DK from 2009 and for AT DE from 2011
European Commission
Set of dummy variables
ivan
a dr
ažen
ov
ić ma
rin
a ku
no
vac d
om
inik pr
ipužić
dy
na
mic
s an
d deter
min
an
ts of em
igr
ation th
e ca
se of c
ro
atia an
d the ex
perien
ce
of n
ew eu m
emb
er states
pub
lic secto
r ec
on
om
ics
42 (4) 415-447 (2018)
440 Table a2 Data sources and details dependent variable
data sources and details for set of independent variablesVariable description source estimation details
Emigration flows
Data for IR NL FI SE IT AT LU DK avaliable on line Data for DE BE UK obtained on email request Data for UK and IE refers to immigration numbers and not to official migration statistics
National statistical offices websites of core EU countries
For static models ndash emigration from origin country i into destination country j in time t for dynamic model ndash share of emigrants in total population of origin country in log
Data for Germany and Denmark are based on country of previous residence principle Data for Netherlands Italy United Kingdom and Belgium on country of birth principle while data for Sweden Finland Luxemburg and Austria are based on citizenship principleCore EU countries are represented by 11 countries due to data availability Austria Belgium Denmark Finland Germany Ireland Italy Luxemburg Netherlands Sweden and United Kingdom Usually Portugal Greece Spain and France are also included in core EU countries Required immigration data are not publicaly available on their website Statistical office of Portugal delivered the data from our customized request Since data are starting in 2008 we do not include them in main specifications Upon conclusion of this paper we have not managed to receive required data from customized requests sent to other statistical offices
ivan
a dr
ažen
ov
ić ma
rin
a ku
no
vac d
om
inik pr
ipužić
dy
na
mic
s an
d deter
min
an
ts of em
igr
ation th
e ca
se of c
ro
atia an
d the ex
perien
ce
of n
ew eu m
emb
er states
pub
lic secto
r ec
on
om
ics
42 (4) 415-447 (2018)441aPPendIX 2
Table a3 Total migration flow in Croatia ndash approximation based on discretional combination of different data sources
emigration from and to croatia following the eu accession 2013 2014 2015 2016 2013-2016(1) Emigration to core EU countries from national statistical offices of core EU countries
31655 53666 72528 71314 229163
(2) Emigration to ldquorest of the worldrdquo according to CBS 11220 9049 11116 9238 40623
(3) Total emigration = (1) + (2) 42875 62715 83644 80552 269786(4) CNB total emigration 15262 20858 29651 36436 102207(5) Emigration coefficient 28 30 28 22 26(6) Immigration from core EU countries according to national statistical offices of core EU countries
14164 19346 23261 23422 80193
(7) Immigration from ldquorest of the worldrdquo according to CBS 8676 8540 8512 9705 35433
(8) Total immigration = (6) + (7) 22840 27886 31773 33127 115626(9) CBS total immigration 10378 10638 11706 13985 46707(10) Immigration coefficient 22 26 27 24 25(11) Net emigration = (3) ndash (8) 20035 34829 51871 47425 154160(12) CNB net emigration 4884 10220 17945 22451 55500(13) Net emigration coefficient 41 34 29 21 28
Note UK and Ireland not included in immigration numbersSource CBS and national statistical offices of the core EU countries
ivan
a dr
ažen
ov
ić ma
rin
a ku
no
vac d
om
inik pr
ipužić
dy
na
mic
s an
d deter
min
an
ts of em
igr
ation th
e ca
se of c
ro
atia an
d the ex
perien
ce
of n
ew eu m
emb
er states
pub
lic secto
r ec
on
om
ics
42 (4) 415-447 (2018)
442 aPPendIX 3
Table a4 Determinants of emigration flows from new EU member states to the core EU coun-tries between 2000 and 2016 dynamic estimation Arellano-Bond GMM estimator
model 3 dynamic model (gmm)
Distance -049(000)
Population 029(059)
Transitional provisions 025(000)
Employment rate (origin) -201(000)
Employment rate (destination) 053(047)
Output gap (origin) 372(036)
Output gap (destination) 218(000)
Corruption index (origin) -037(040)
Corruption index (destination) 057(055)
Share of youth (20-34) origin -032 (059)
Share of tertiary educated (origin) 035 (012)
ln(m t-1) 066(000)
Cons 74 Note and refer to 10 5 and 1 statistical significance levels respectively P-values are in parenthesis All specifications include origin and destination fixed effects dum-mies Parameters associated to output gap for origin and destination country are multiplied by 100 since the output gap enters the model specification in levels instead of being transformed into logarithms due to negative valuesSource Authorsrsquo elaboration based on national statistical offices of the core EU countries immi-gration data and on the data presented in appendix 1
ivan
a dr
ažen
ov
ić ma
rin
a ku
no
vac d
om
inik pr
ipužić
dy
na
mic
s an
d deter
min
an
ts of em
igr
ation th
e ca
se of c
ro
atia an
d the ex
perien
ce
of n
ew eu m
emb
er states
pub
lic secto
r ec
on
om
ics
42 (4) 415-447 (2018)443Table a5
Determinants of emigration flows from new EU member states to the core EU countries between 2000 and 2016 Poisson pseudo maximum likelihood estimator extended specification Model 4
model 4 fe model 4 PPml
Distance ndashndash
-152(000)
Population 169(000)
663(000)
Transitional provisions 047(000)
042(000)
Unemployment rate (origin) 019(003)
069(000)
Unemployment rate (destination) -003(066)
-109(000)
Output gap (origin) 218(001)
153(034)
Output gap (destination) 464(000)
252(009)
Governance index (origin) -022(052)
-229(000)
Governance index (destination) 089(011)
-271(040)
Share of youth (20-34) origin 171(000)
134(011)
Share of tertiary educated (origin) 041(002)
069(001)
Cons -104 422Number of observations 1958 1972R2 051 082
Note and refer to 10 5 and 1 statistical significance levels respectively P-values are in parenthesis All specifications include origin and destination fixed effects dum-mies Parameters associated to output gap for origin and destination country are multiplied by 100 since the output gap enters the model specification in levels instead of being transformed into logarithms due to negative valuesSource Authorsrsquo elaboration based on national statistical offices of the core EU countries immi-gration data and on the data presented in appendix 1
ivan
a dr
ažen
ov
ić ma
rin
a ku
no
vac d
om
inik pr
ipužić
dy
na
mic
s an
d deter
min
an
ts of em
igr
ation th
e ca
se of c
ro
atia an
d the ex
perien
ce
of n
ew eu m
emb
er states
pub
lic secto
r ec
on
om
ics
42 (4) 415-447 (2018)
444
aPP
en
dIX
4
Ta
bl
e a
6 Nu
mbe
r of e
mig
rant
s fro
m C
roat
ia b
y re
gion
(as
of t
otal
pop
ulat
ion
of th
e re
gion
) bet
ween
200
1 an
d 20
16 C
entra
l Bur
eau
of S
tatis
tics d
ata
gro
ss
emig
ratio
n flo
ws
20
0120
0220
0320
0420
0520
0620
0720
0820
0920
1020
1120
1220
1320
1420
1520
16Ea
ster
n C
roat
ia0
20
20
20
30
20
30
30
20
40
30
30
30
40
61
01
4C
entra
l Cro
atia
02
02
02
02
02
02
03
03
03
03
04
03
05
06
08
10
Lika
and
Gor
ski k
otar
02
02
02
01
01
02
02
02
02
02
03
03
04
06
09
10
Cen
tral a
nd S
outh
ern
Adr
iatic
01
02
01
01
01
01
02
02
02
03
04
04
05
05
06
07
Nor
then
Adr
iatic
02
02
01
01
01
01
01
01
01
02
05
04
03
04
06
07
Nor
thw
este
rn C
roat
ia0
10
10
10
10
00
10
10
00
00
00
10
10
10
30
40
6C
ity o
f Zag
reb
02
06
02
01
01
01
01
01
01
02
03
03
03
04
06
06
Not
es E
aste
rn C
roat
ia e
ncom
pass
es V
irovi
tičko
-pod
ravs
ka P
ožeš
ko-s
lavo
nska
Bro
dsko
-pos
avsk
a O
sječk
o-ba
ranj
ska
and
Vuko
vars
ko-s
rijem
ska
coun
ties
Cent
ral C
roat
ia
enco
mpa
sses
Zag
reba
čka
Sis
ačko
-mos
lava
čka
Kar
lova
čka
and
Bjel
ovar
sko-
bilo
gors
ka c
ount
ies
Lika
and
Gor
ski k
otar
enc
ompa
ss P
rim
orsk
o-go
rans
ka a
nd L
ičko
-sen
jska
co
untie
s C
entr
al a
nd S
outh
ern
Adri
atic
enc
ompa
ss Z
adar
ska
Šib
ensk
o-kn
insk
a S
plits
ko-d
alm
atin
ska
and
Dub
rova
čko-
nere
tvan
ska
coun
ties
Nor
then
Adr
iatic
refe
rs to
Is
tars
ka C
ount
y N
orth
wes
tern
Cro
atia
enc
ompa
ss K
rapi
nsko
-zag
orsk
a V
araž
dins
ka M
eđim
ursk
a an
d K
opri
vnič
ko-k
riže
vačk
a co
untie
sSo
urce
CBS
ivan
a dr
ažen
ov
ić ma
rin
a ku
no
vac d
om
inik pr
ipužić
dy
na
mic
s an
d deter
min
an
ts of em
igr
ation th
e ca
se of c
ro
atia an
d the ex
perien
ce
of n
ew eu m
emb
er states
pub
lic secto
r ec
on
om
ics
42 (4) 415-447 (2018)445references
1 Anderson J E 2011 The Gravity Model Annual Review of Economics Annual Reviews 3(1) pp 133-160
2 Arellano M and Bond S 1991 Some tests of specification for panel data Monte Carlo evidence and an application to employment equations Review of Economic Studies 58(2) pp 277-297 httpsdoiorg1023072297968
3 Arpaia A [et al] 2016 Labour mobility and labour market adjustment in the EU IZA Journal of Devlopment and Migration 5(21) pp 1-37 httpsdoiorg101186s40176-016-0069-8
4 Beine M Bourgeon P and Bricongne J C 2017 Aggregate Fluctuations and International Migration Scand Journal of Economics Accepted Author Manuscript httpsdoiorg101111sjoe12258
5 Beine M Docquier F and Ozden C 2009 Diasporas Journal of Develop-ment Economics 95(1) pp 30-41 httpsdoiorg101016jjdeveco2009 11004
6 Bertoli S Bruumlcker H and Fernaacutendez-Huertas Moraga J 2013 The Euro-pean Crisis and Migration to Germany Expectations and the Diversion of Migration Flows IZA Discussion Papers No 7170 Available at lthttpftpizaorgdp7170pdfgt
7 Blundell R and Bond S 1998 Initial conditions and moment restrictions in dynamic panel data models Journal of Econometrics 87(1) pp 115-143 httpsdoiorg101016S0304-4076(98)00009-8
8 Borjas G J 1987 Self-Selection and the Earnings of Immigrants The Amer-ican Economic Review 77(4) pp 531-553
9 Božić S and Burić B 2005 Migracijski potencijal Hrvatske ndash mikroanalitički aspekti Migracijske i etničke teme 21(1-2) pp 9-33
10 Bruumlcker H [et al] 2009 Labour mobility within the EU in the context of enlargement and the functioning of the transitional arrangements Nurem-berg European Integration Consortium Final Report Available at lthttpeceuropaeusocialBlobServletdocId=2509amplangId=engt
11 Eurostat 2018 Eurostat International Migration Statistics Available at lthttpseceuropaeueurostatcachemetadataenmigr_immi_esmshtmgt
12 Fertig M and Kahanec M 2013 Mobility in an Enlarging European Union Projections of Potential Flows from EUrsquos Eastern Neighbors and Croatia IZA Discussion Papers No 7634 Available at lthttpftpizaorgdp7634pdfgt
13 Flowerdew R and Salt J 1979 Migration between labour market areas in Great Britain 1970-1971 Journal Regional Studies 13(2) pp 211-231 httpsdoiorg10108009595237900185181
14 Grogger J and Hanson G H 2011 Income Maximization and the selection and sorting of international Migrants Journal of Development Economics 95(1) pp 42-54 httpsdoiorg101016jjdeveco201006003
15 Harris J R and Todaro M P 1970 Migration Unemployment and Devel-opment A Two-Sector Analysis The American Economic Review 60(1) pp 126-142
ivan
a dr
ažen
ov
ić ma
rin
a ku
no
vac d
om
inik pr
ipužić
dy
na
mic
s an
d deter
min
an
ts of em
igr
ation th
e ca
se of c
ro
atia an
d the ex
perien
ce
of n
ew eu m
emb
er states
pub
lic secto
r ec
on
om
ics
42 (4) 415-447 (2018)
446 16 Hazans M and Philips K 2011 The Post-Enlargement Migration Experi-ence in the Baltic Labor Markets IZA DP No 5878 Available at lthttpftpizaorgdp5878pdfgt
17 HZZ 2017 Anketa poslodavaca 2017 Zagreb Hrvatski zavod za zapošlja-vanje Available at lthttpwwwhzzhrUserDocsImagesAnketa_posloda-vaca_2017_HZZpdfgt
18 Izquierdo M Jimeno J F and Lacuesta F 2014 The Impact of the Crisis on Migration Flows in Spain Intereconomics 49(3) pp 144-151
19 Jurić T 2017 Suvremeno iseljavanje Hrvata u Njemačku karakteristike i motivi Migracijske i etničke teme 24(3) pp 337-371
20 Lamberty L 2015 Explaining Baltic Migration After EU Accession Deter-minants and Consequences Available at lthttpswwwehllusemediaehlsneepaperslambertypdfgt
21 Ordinance for the implementation of the General Tax Act OG 3017 Zagreb Official Gazzete
22 Poot J [et al] 2016 The gravity model of migration the successful come-back of an ageing superstar in regional science Investigaciones Regionales ndash Journal of Regional Research 36 pp 63-86
23 Poprawe M 2015 On the relationship between corruption and migration empirical evidence from a gravity model of migration Public Choice 163(3) pp 337-354 httpsdoiorg101007s11127-015-0255-x
24 Ramos R 2016 Gravity models A tool for migration analysis IZA World of Labor 2016 No 239 httpsdoiorg1015185izawol239
25 Santos Silva J M and Tenreyro S 2006 The log of gravity The Review of Economics and Statistics 88(4) pp 641-658 httpsdoiorg101162rest 884641
26 Sjaastad L A 1962 The Costs and Returns of Human Migration Journal of Political Economy 70(5) pp 80-93 httpsdoiorg101086258726
27 Sprenger E 2013 The Determinants of International Migration in the Euro-pean Union An Empirical Analysis IOS Working Papers No 325 Available at lthttpswwweconstoreubitstream10419792401733903029pdfgt
28 Statistics Poland 2011 The concept of the international migration statistic system in Poland Available at lthttpsstatgovplcpsrdexbcrgusp_inter_migration_stat_system_in_polandpdfgt
29 Strielkowski W Šaacuterkovaacute K and Żornaczuk T 2013 EU Enlargement and Migration Scenarios of Croatian Accession Romanian Journal of European Affairs 13(3) pp 53-63 httpsdoiorg102139ssrn2334173
30 Šonje V 2018 Nepovratna emigracija prva procjena Available at lthttparhivanalitikahrblognepovratna-emigracija-prva-procjenagt
31 Thaut L 2009 EU Integration amp Emigration Consequences The Case of Lithuania International Migration 47(1) pp 192-233 httpsdoiorg 101111j1468-2435200800501x
ivan
a dr
ažen
ov
ić ma
rin
a ku
no
vac d
om
inik pr
ipužić
dy
na
mic
s an
d deter
min
an
ts of em
igr
ation th
e ca
se of c
ro
atia an
d the ex
perien
ce
of n
ew eu m
emb
er states
pub
lic secto
r ec
on
om
ics
42 (4) 415-447 (2018)44732 Tinbergen J 1962 Shaping the World Economy Suggestions for an Interna-
tional Economic Policy New York The Twentieth Century Fund33 Vidovic H and Mara I 2015 Free Movement of Workers Transitional
Arrangements and Potential Mobility from Croatia The Vienna Institute for International Economic Studies Research Report No 402 Available at lthttpswiiwacatfree-movement-of-workers-transitional-arrangements-and-potential-mobility-from-croatia-dlp-3630pdfgt
34 Vuković V 2017 The political economy of local government in Croatia winning coalitions corruption and taxes Public Sector Economics 41(4) pp 387-421 httpsdoiorg103326pse4141
35 Župarić-Ilijć D 2016 Iseljavanje iz Republike Hrvatske nakon ulaska u Europsku uniju Zagreb Friedrich Ebert Stiftung Available at lthttpwwwfes-croatiaorgfileadminuser_uploadFES_Iseljavanje_webpdfgt
Determinants of subnational budgetfiscal transparency a review of empirical evidence
BRANKO STANIĆ MA in Economics
Review articleJEL H11 H72httpsdoiorg103326pse4244
The author would like to thank the two anonymous referees for helpful comments on the paper This study was supported by the Croatian Science Foundation (grant number IP-2014-09-3008)
Received March 22 2018 Accepted November 9 2018
Branko STANIĆInstitute of Public Finance Smičiklasova 21 10000 Zagreb Croatiae-mail brankostanicijfhrORCiD 0000-0002-8746-6764
br
an
ko sta
nić
deter
min
an
ts of su
bn
ation
al b
ud
getfisc
al tr
an
spar
enc
y a rev
iew o
f empir
ica
l evid
enc
epu
blic sec
tor
eco
no
mic
s42 (4) 449-486 (2018)
450 abstractThis paper provides a review of empirical research on the factors determining the budgetfiscal transparency of subnational governments It focuses on academic online databases by conducting keyword searches that take in papers published in the period 2000-2017 Three important observations can be made (1) there is a lack of a unique definition of budgetfiscal transparency (2) the different defini-tions lead to disharmonised budgetfiscal transparency measurements (3) there is a heterogeneity of the definition and measurement of some explanatory variables that can lead to apparent contradictions and inconsistencies in the results obtained However the paper provides a balanced account of core explanatory factors emphasizing variables that despite heterogeneity in definition and meas-urement have a significant impact on the levels of subnational government budgetfiscal transparency Since the review involves mainly online disclosure future studies might want to extend the observation period or implement systematic reviews and meta-analyses to gain additional insights on this topic
Keywords subnational governments budget transparency empirical review main determinants
1 IntroductIonIt can be said that in the past two decades and especially in the aftermath of the financial crisis enormous pressure has been put on governments to improve their communication with citizens by being more open transparent and accountable In this sense more and more attention is being paid to fiscal and budgetary issues Some of the most prominent initiatives that advocate for these issues are the Inter-national Budget Partnership (IBP) the Global Initiative for Fiscal Transparency (GIFT) and the Open Government Partnership (OGP) Due to the OGPrsquos strong advocacy a total of 75 countries have endorsed the Open Government Declaration and announced their country action plans More recently OGP was opened to subnational governments In 2016 a total of 15 subnational governments signed the declaration and submitted their action plans to be implemented throughout 2017 as part of a pilot program
Thus the discourse of budget transparency seems to be changing giving ever more importance to subnational governments (SNGs) Accordingly subnational budgets are becoming a ubiquitous topic in the field of public financial management Their importance also stems from the fact that public goods and services are particularly tangible at the subnational and especially the local level Therefore citizens may have more interest in participating in local budget processes where they can see their direct impact on local development Furthermore subnational budget transpar-ency enables ordinary citizens and civil society organizations to evaluate govern-ment services and facilities and suggest possible changes and needs in the future
The internet has provided an additional incentive for proactive publishing ena-bling large-scale publication of budget data as well as constantly improving gov-
br
an
ko sta
nić
deter
min
an
ts of su
bn
ation
al b
ud
getfisc
al tr
an
spar
enc
y a rev
iew o
f empir
ica
l evid
enc
epu
blic sec
tor
eco
no
mic
s42 (4) 449-486 (2018)
451ernment consultation processes It can be said that the rise of the internet has fur-thered budget transparency by allowing rapid and inexpensive proactive disclo-sure (Darbishire 2010) Consequently SNGs have increasingly resorted to proac-tive budget disclosure thus not only reducing demand-side pressures but also changing their attitude and way of communicating with citizens Despite the widespread availability and bidirectionality of the internet SNG websites vary greatly in the amount of information available comprehensiveness timeliness and interactiveness (Caba-Peacuterez Rodriacuteguez Boliacutevar and Loacutepez Hernaacutendez 2008) While some SNGs run open budget policies others oppose the practice and rarely use the low cost benefits of online proactive publishing
The aim of this study is hence to review the development of research conducted previously in order to understand the factors that could influence SNG budgetfiscal disclosure In other words it aims to produce a balanced account of the set of variables that significantly affect SNG budgetfiscal transparency Some previ-ous studies reviewed the various types of public sector disclosure (Bakar and Saleh 2015) However this study explores studies published in the 2000-2017 period focusing explicitly on budget or fiscal transparency The paper is organ-ized as follows Section 2 provides the methodological framework Section 3 pre-sents different definitions and measurements of budgetfiscal transparency Sec-tion 4 offers a balanced account of core determinants of SNG budgetfiscal disclo-sure Section 5 concludes with recommendations for future research
2 frameworK for analysIsThis review focuses on identifying explicitly quantitative studies on the determi-nants of SNG budgetfiscal transparency The decision for quantitative studies is because they allow for rapid analysis and replication which increases reliability validity and the greater probability of obtaining unambiguous results which con-tributes to better decision-making Subnational governments include all levels below the national government ie local regional state and provincial To identify eligible articles this study used the Summon discovery service ndash a unified search for all electronic sources of academic publications including search interfaces such as ProQuest EBSCO Host Web of Science and Scopus In addition Google Scholar and hand searches were also used This review includes studies published from 2000-2017 thus the focus is inherently on online disclosure Only studies in English are taken into consideration Search terms used were ldquocauses of budgetfiscal transparencyrdquo ldquosubnational government transparencyrdquo ldquobudgetfiscal trans-parency determinantsrdquo ldquolocal government transparencyrdquo or just ldquogovernment transparencyrdquo Since only a few studies focused solely on budget or fiscal transpar-ency it should be noted that this review includes all studies that in their transpar-ency measure have at least one dimension concerning the budget ie revenues and expenditures Although books were initially included in the search no relevant sources were generated on the determinants of subnational budgetfiscal transpar-ency This is probably due to it being an insufficiently researched topic which is why journals take the lead while books are still outdated as sources of information
br
an
ko sta
nić
deter
min
an
ts of su
bn
ation
al b
ud
getfisc
al tr
an
spar
enc
y a rev
iew o
f empir
ica
l evid
enc
epu
blic sec
tor
eco
no
mic
s42 (4) 449-486 (2018)
452 However the eligibility criteria were designed to ensure that high-quality relevant work is included specifically referring to empirical quantitative studies that employ budgetfiscal transparency as the dependent variable Finally 20 studies are included in the review All studies are peer-reviewed and published in journals with the exception of Ma and Wuʼs (2011) paper which remained as part of the 1st
Global Conference on Transparency Research held at Rutgers University
Although it is unquestionable that every paper has made a contribution this review highlights four papers on account of their narrow focus on budgetfiscal transparency strong and credible evidence and rigorous methodology used The first is a paper by Alt Lassen and Rose (2006) who used a unique panel data on the evolution of transparent budget procedures in the US states over the past three decades They used both case studies and quantitative analysis presenting robust results Serrano-Cinca Rueda-Tomaacutes and Portillo-Tarragona (2009) used multivariate logistic regression focusing exclusively on the availability of budget-related documents Although their results showed different levels of robustness they proved that size of the municipality political will and residentsrsquo income all affect budget disclosure Similarly Guillamoacuten Bastida and Benito (2011) exam-ined the determinants of budget and financial transparency using both OLS and 2SLS regression analysis After controlling for endogeneity they confirmed the robustness of the model employed Like them Esteller-Moreacute and Polo Otero (2012) remained focused on budget information disclosures They applied their analysis to a large sample of municipalities using a logit regression analysis for panel data covering a seven-year period These four papers are emphasized on the basis of measurements of the dependent variables and the credibility and quality of the evidence and method used for determining the factors of budgetfiscal trans-parency With this in mind all the papers included in the review are presented in the following chapters first by measuring the dependent variables and then by the established budgetfiscal transparency factors
3 budgetfIscal transParency ndash from defInItIon to measurement
31 defInItIonIn the literature budget transparency and fiscal transparency are often used inter-changeably which may point to the equivalence of these two concepts However budget transparency is a narrower concept focusing on the budget reports within the budget cycle On the other hand fiscal transparency also includes fiscal activ-ities undertaken outside the budget sector aiming at reducing off-budget transac-tions (IMF 1997) It often includes information on all stocks as well as flows which can hardly be found in the budget documents Still it is difficult to make a strict division between these two concepts since they are intertwined and some-times even used synonymously Therefore this paper will use both terms One of the most comprehensive definitions of fiscal transparency was offered by Kopits and Craig (19981)
br
an
ko sta
nić
deter
min
an
ts of su
bn
ation
al b
ud
getfisc
al tr
an
spar
enc
y a rev
iew o
f empir
ica
l evid
enc
epu
blic sec
tor
eco
no
mic
s42 (4) 449-486 (2018)
453ldquoFiscal transparency implies an openness toward the public at large about government structure and functions fiscal policy intentions public sector accounts and projections It involves ready access to reliable comprehen-sive timely understandable and internationally comparable information on government activities ndash whether undertaken inside or outside the gov-ernment sector ndash so that the electorate and financial markets can accurately assess the governmentrsquos financial position and the true costs and benefits of government activities including their present and future economic and social implicationsrdquo
In accordance with this definition Alt Lassen and Skilling (2002) stressed that financial documents should be informative and comprehensive but at the same time easily understandable leaving the option of independent scrutiny In order to facilitate this inspection and monitoring of economic policies by national authori-ties financial markets and international institutions the IMF has developed a Code of Good Practices on Fiscal Transparency (IMF 1998) The Code consisted of four main principles 1) clarity of roles and responsibilities 2) public availability of information 3) open budget preparation execution and reporting and 4) independent assurances of integrity
Although this Code has helped practitioners in understanding basic concepts of fiscal transparency practices it did not contain clear guidelines or standards that would facilitate the way and approach to measuring fiscal transparency However the Code was revised in 2007 pointing out that fiscal data (budget forecasts and updates annual budget and final accounts fiscal reports) should meet accepted data quality standards Similarly the OECD has developed best practices for budget transparency although their definition of budget transparency refers to broader concept of fiscal matters ldquofull disclosure of all relevant fiscal information in a timely and systematic mannerrdquo (OECD 20027) The best practices are divided into three parts ndash budget reports specific disclosures and integrity assurance (table 1) It is evident that only the first section corresponds to pure budget disclo-sure while the other two represent wider fiscal matters Still the first section can be considered the first internationally recognized standard for budget reporting
Table 1 The ldquothree pillarsrdquo of the OECDrsquos best budget transparency practices
budget reports Specific disclosures Integrity control and accountabilityThe budget Economic assumptions Accounting policiesPre-budget report Tax expenditures Systems and responsibilityMonthly reports Financial assets and liabilities AuditMid-year report Non-financial assets Public and parliamentary scrutinyYear-end report Employee pension obligationsPre-election report Contingent liabilitiesLong-term report
Source OECD (2002)
br
an
ko sta
nić
deter
min
an
ts of su
bn
ation
al b
ud
getfisc
al tr
an
spar
enc
y a rev
iew o
f empir
ica
l evid
enc
epu
blic sec
tor
eco
no
mic
s42 (4) 449-486 (2018)
454 It could be said that a number of authors have defined budgetfiscal transparency not only as the availability of budgetfiscal information but also in terms of open-ness and public accountability This can best be seen in Kopits and Craig (1998) who argue that fiscal transparency does not only imply access to fiscal reports but rather the openness of fiscal policies and procedures Similarly Andreula Chong and Guilleacuten (2009) state that fiscal transparency apart from open budget prepara-tion and availability of fiscal information also implies assurances of roles and responsibilities In this sense the IMF has indicated the difference between fiscal reporting and fiscal transparency While the first refers to the production and avail-ability of fiscal information the second relates to the ldquoclarity reliability fre-quency timeliness and relevance of public fiscal reporting and the transparency of the governmentrsquos fiscal policy-making processrdquo (IMF 20125)
One can conclude that there is no uniform definition of budgetfiscal transparency which indicates a complex understanding of this topic In other words while there are certain standards and guidelines different definitions and interpretations directly affect the approach and the way of measurement Certainly the methods and scope of measurement also depend on the context in which the research is carried out Since this review is based on the causes rather than the effects of budgetfiscal transparency the next section provides an empirical overview of dif-ferent measurements in which the budgetfiscal transparency measure appears as a dependent variable
32 VarIous aPProaches to measurIng subnatIonal budgetfIscal transParency ldquoConceptually a statistical measure of transparency is the precision of the information that is obtained ie a function of its relevance and qualityrdquo
(Vishwanath and Kaufmann 19994)
Given the specificities of different countriesrsquo laws standards procedures and con-texts one should be careful while summing comparing and interpreting different definitions and measures of budgetfiscal transparency In other words subna-tional comparisons may be most important within rather than across countries Accordingly this section seeks to present the first studies from Spain and USA ndash since most papers on this topic are focused on the SNGs of these two countries Then individual studies with samples from other countries were presented
spainThe largest body of research comes from Spanish local governments Gandiacutea and Archidona (2008) presented an extensive local government online disclosure index which consists of five sub-indices two of which provide comprehensive budget and financial information The other three dimensions include general government information web presentation and navigation and relational web to address interactivity and functionality of the web Unlike them Serrano-Cinca Rueda-Tomaacutes and Portillo-Tarragona (2009) explicitly explored budget and
br
an
ko sta
nić
deter
min
an
ts of su
bn
ation
al b
ud
getfisc
al tr
an
spar
enc
y a rev
iew o
f empir
ica
l evid
enc
epu
blic sec
tor
eco
no
mic
s42 (4) 449-486 (2018)
455financial disclosure which they measured by sending questionnaires to munici-palities regarding their online publication of nine items (based on Spanish legis-lation regarding local government financial disclosure) including consolidated and unconsolidated budgets budget and annual accounts of dependent entities Like Gandiacutea and Archidona (2008) Caba-Peacuterez Rodriacuteguez Boliacutevar and Loacutepez Hernaacutendez (2008) have also offered an extensive web financial disclosure index hoping to contribute to a more harmonized framework for the structure of budget and financial information in Spanish local governments Although the numbers of items observed are different the main sections of their disclosure indexes are quite the same including budget and financial information and web navigability The main difference is that Caba-Peacuterez Rodriacuteguez Boliacutevar and Loacutepez Hernaacutendez (2008) included non-financial information such as indicators of economy effi-ciency and effectiveness and paid more attention to the characteristics of infor-mation such as timeliness understandability or comparability rather than content of information provided Several authors used the government transparency measure calculated by Transparency International (TI) Spain (Guillamoacuten Bastida and Benito 2011 del Sol 2013 De Arauacutejo and Tejedo-Romero 2016) This index consists of five government transparency areas (a) information about the municipal corporation (b) social transparency (c) financial transparency (d) ser-vices contracting transparency (e) urban development and procurement trans-parency Among these studies Guillamoacuten Bastida and Benito (2011) have con-tributed most to the field of budgetfiscal transparency by focusing explicitly on TIrsquos financial transparency section In other words their dependent variable was based solely on financial transparency indicators including accounting and budget transparency on revenues and expenditures and information on munici-pal debt Their study inspired others to use the same transparency measure for Spanish municipalities (del Sol 2013 De Arauacutejo and Tejedo-Romero 2016)
A significant study was presented by Esteller-Moreacute and Polo Otero (2012) who employed a panel analysis by using a large sample of Catalan municipalities in the period 2001-7 They constructed their fiscal transparency index by addressing the timeliness of the mandatory disclosure of municipalities that need to submit their budget information to the Public Audit Office for Catalonia The budget informa-tion consisted of the following budget approval final budget budget balances closed settlement budgets treasury statement treasury surplus net wealth state-ment income statement and indebtedness Similarly Caamantildeo-Alegre et al (2013) have investigated Galician municipalities They based their budget transparency measure on the IMFrsquos revised Code of Good Practices on Fiscal Transparency and sent the questionnaires to government officials by using a Likert-type survey on open budget process public availability of information and assurance of integrity However unlike Esteller-Moreacute and Polo Otero (2012) who offered a large number of observations and time variation this study remained limited in this sense
A slightly different approach to measuring government transparency was provided by Gandiacutea Marrahiacute and Huguet (2016) who looked at the presence of Web 20 in
br
an
ko sta
nić
deter
min
an
ts of su
bn
ation
al b
ud
getfisc
al tr
an
spar
enc
y a rev
iew o
f empir
ica
l evid
enc
epu
blic sec
tor
eco
no
mic
s42 (4) 449-486 (2018)
456 Spanish city councils In this way they wanted to examine the existence of partici-pative and social web with the possibility of user-generated content Accordingly their disclosure index contained not only information disclosure but also relational web Similar to del Sol (2013) they observed the total index as well as three sub-indices ndash ornamental index (general and citizen information) relational index and information index which includes budgetary and financial disclosure
united statesShortly after the OECD and the IMF implemented Codes of Best Practice for Fis-cal Transparency Alt Lassen and Rose (2006) published one of the most promi-nent and influential studies on the causes of fiscal transparency They examined the determinants of US States both conceptually and empirically A conceptual section included case studies of the states that managed to make significant pro-gress towards higher transparency levels within a short time frame On the other side the transparency measure was not based on the availability of fiscal docu-ments but rather on transparency of state government budget procedures Using the 1990s cross-sectional data from the National Association of State Budget Officers and the National Conference of State Legislatures they extended the data to the beginnings of transparent budget procedures of US states covering the period 1972-2002 This enabled them to use panel analysis which to the best of my knowledge was used for the first time in analyzing the causes of subnational fiscal transparency Although this study offers a unique data set comprising sur-vey responses to a questionnaire sent to the budget officers of all fifty states because of the period covered it could not address e-government practices
However with the rapid adoption of the internet more recent studies are mainly focused on online fiscalbudget transparency usually examining transparency lev-els on governmentsrsquo official websites While Alt Lassen and Rose (2006) offered a transparency measure with a considerable time variation more recent studies looked at the budgetfiscal transparency at one point in time or with small time periods Bernick et al (2014) dropped to a lower level exploring the fiscal trans-parency practices of US counties in 2014 They measured the online availability of a comprehensive annual financial report (CAFR) and availability and compre-hensiveness of budget information (no exact document or information is indi-cated) Similarly Lowatcharin and Menifield (2015) investigated county website transparency in 2010 However their county transparency measure (conducted by the Sunshine Review) included not only fiscal disclosure but a wider spectrum of government transparency such as permits and zoning contracts lobbying etc Relying on Groff and Pitmans (2004) description of internet financial reporting for the 100 largest US municipalities Styles and Tennyson (2007) extended the findings by examining the online availability and accessibility of CAFR data for a sample of US municipalities of various sizes
br
an
ko sta
nić
deter
min
an
ts of su
bn
ation
al b
ud
getfisc
al tr
an
spar
enc
y a rev
iew o
f empir
ica
l evid
enc
epu
blic sec
tor
eco
no
mic
s42 (4) 449-486 (2018)
457other countriesWhen it comes to pioneers in dealing with voluntary internet financial reporting in subnational governments the paper by Laswad Fisher and Oyelere (2005) deserves highlighting They observed New Zealandrsquos district city and regional councils by constructing the financial transparency measure as a dichotomous variable indicating whether or not the local authority publishes financial informa-tion on the web However their definition of what is considered published may be somewhat confusing since they had four disclosure categories financial high-lights only annual reports only annual plan only and combinations of annual reports plans and financial highlights together In other words it is not clear whether there is any council that has published for example both annual plan and report in which case the analysis could change considerably Garciacutea-Tabuyo Saacuteez-Martiacuten and Caba-Peacuterez (2016) investigated online proactive disclosure of the 40 largest municipalities in each of the five countries of Central America ndash El Salvador Nicaragua Panama Guatemala and Honduras This was a valuable study since the same transparency measure was employed for local government transparency in different country contexts However their measure consists of five transparency areas where economic and financial transparency (including enacted and executed consolidated and individual budget and budget amend-ments) accounts for 20 the total index
On the other hand some studies focused explicitly on fiscal transparency either on a sample of Brazilian states (Zuccolotto and Teixeira 2014) or Chinese provincial government (Ma and Wu 2011) While Ma and Wu (2011) used the data collected from the first two years of the four-year survey by the Public Policy Research Center in Shanghai Zuccolotto and Teixeira (2014) employed a fiscal transparency measure developed by Biderman and Pottomatti (2010)1 Tavares and da Cruz (2017) used TI Portugalʼs index of municipal transparency to assess a disclosure of Portuguese municipalities The index is a comprehensive measure of local gov-ernemnt transparency comprising seven dimensions one of which is economic and financial transparency However unlike other extensive measures it only monitors the availability of a set of information items on a municipalitys website not taking into account accessibility navigability reliability or the quality of the information A study presented by Gesuele Metallo and Longobardi (2017) analyzed website disclosure of Italian and Spanish municipalities Although their contribution is valuable (very few studies with an international context) they did not sufficiently address budgetfiscal transparency except for financial statements and information about municipalitiesrsquo assets such as values location and revenue
33 the challenge of subnatIonal budgetfIscal transParency measurement
This review will outline several budgetfiscal transparency measurement chal-lenges and opportunities First the use of the same transparency measure within a
1 A study available only in Portuguese
br
an
ko sta
nić
deter
min
an
ts of su
bn
ation
al b
ud
getfisc
al tr
an
spar
enc
y a rev
iew o
f empir
ica
l evid
enc
epu
blic sec
tor
eco
no
mic
s42 (4) 449-486 (2018)
458 country would allow for a comparison of the results of different studies which could contribute to a greater understanding of inconsistent results and to the reduction or explanation of the ambiguity in the previous findings The review shows that only a few studies used the same transparency index within a country as with the TI Spain index used by De Arauacutejo and Tejedo-Romero (2016) del Sol (2013) and Guillamoacuten Bastida and Benito (2011) Second the transparency measure mainly involved one year of observation and only a few studies have had a long dataset of the dependent variable such as Alt Lassen and Rose (2006) or Esteller-Moreacute and Polo Otero (2012) The longer time span of the dependent var-iable opens the door to many methodological approaches enables a better quality analysis and gives an opportunity to observe the progress of SNG budgetfiscal transparency Third in order to improve the observation of the causes of budgetfiscal transparency it is necessary to have more studies focusing solely on budget-ary and fiscal indicators
Although strong efforts have been made to standardize fiscal transparency meas-ures at the national level this remains an empirical and contextual challenge at the local level However some studies have already examined cross-country analyses by introducing their own index on a sample of municipalities (Garciacutea-Tabuyo Saacuteez-Martiacuten and Caba-Peacuterez 2016 Gesuele Metallo and Longobardi 2017) Nonetheless to facilitate these efforts analogously to the IBP Open Budget Sur-vey one of the biggest challenges (given the diversity of the local self-government system) is to create a harmonized budgetfiscal transparency index capable of being applied to the subnational governments of various countries Results of these studies could provide more comprehensive insights into the contextual sen-sitivity but also generally in examining the causes of budgetfiscal transparency
4 determInants of subnatIonal budgetfIscal transParency ndash emPIrIcal oVerVIew
41 heterogeneIty of defInItIon and measurement of VarIablesThis review discusses the different definitions and measurements of some varia-bles While different measurements are not unexpected in different countries (bear-ing in mind different types of data) the main issue is when these arise within a single country which can lead to confusion and ldquofalserdquo variability in the results However when concluding and interpreting results of previous studies attention has to be paid to the definitions and the way of measuring variables regardless of whether they are in-country or cross-country comparisons According to the litera-ture some of the most frequently used variables that can cause confusion are lever-age debt and political competition Although the definition of leverage is quite unambiguous several studies have used different measures Laswad Fisher and Oyelere (2005) have measured it in two ways as a ratio of long-term liabilities in total assets and in total public equity On the other hand some studies have used financial expenses per capita as a proxy for leverage (Gandiacutea and Archidona 2008 Gandiacutea Marrahiacute and Huguet 2016) Gandiacutea and Archidona (2008) have equated leverage with indebtedness making it more confusing by stating that they have
br
an
ko sta
nić
deter
min
an
ts of su
bn
ation
al b
ud
getfisc
al tr
an
spar
enc
y a rev
iew o
f empir
ica
l evid
enc
epu
blic sec
tor
eco
no
mic
s42 (4) 449-486 (2018)
459used the cost of debt as a proxy of indebtedness which is measured as municipal financial expenses per capita At the same time Caba-Peacuterez Rodriacuteguez Boliacutevar and Loacutepez Hernaacutendez (2008) used funding costs of current year budget expendi-ture per capita as a proxy for the cost of debt not assigning it to leverage but rather to debt Gesuele Metallo and Longobardi (2017) have not even described their leverage measure They defined it simply as a value of leverage per capita while the measure was described just as natural logarithm thus leaving it unexplained
A unique measure for debt issuance was presented by Serrano-Cinca Rueda-Tomaacutes and Portillo-Tarragona (2009) who used a dichotomic variable which assigns the value of 1 if the town hall has municipal bonds in circulation denoting a debt issu-ance On the other side some debt measures are more straight-forward such as debt level as a percentage of the total budget (del Sol 2013) or the often-used municipal public debt per capita (Alt Lassen and Rose 2006 Styles and Tenny-son 2007 Guillamoacuten Bastida and Benito 2011 Caamantildeo-Alegre et al 2013)
While some authors argue that a governmentrsquos decision to disclose or retain infor-mation is inherently political (Wehner and de Renzio 2013) others claim that political competition is a major driver of transparency reforms (Berliner and Erlich 2015) However the mode of measurement of political competition imposes the greatest variability among political determinants There are various measures intro-duced for this variable Some studies observe it as a margin of victory measured by the difference between the percentage of votes obtained by the parties coming in first and second place (De Arauacutejo and Tejedo-Romero 2016 2017 Tavares and da Cruz 2017) Others see it as a measure of dispersion ie the standard deviation of the percentage of votes received by each political party (Caba-Peacuterez Rodriacuteguez Boliacutevar and Loacutepez Hernaacutendez 2008 Esteller-Moreacute and Polo Otero 2012) Caamantildeo-Alegre et al (2013) applied the measure developed by Laakso and Taa-gepera (1979) ndash an effective number of political parties whose calculation also contains each partys proportion of all votes Several studies focused explicitly on competition in the municipal council Laswad Fisher and Oyelere (2005) and Serrano-Cinca Rueda-Tomaacutes and Portillo-Tarragona (2009) measured almost the same thing While the first used the ratio of candidates to council positions availa-ble the latter defined it as the ratio of candidates to councillors elected However despite the different definitions it could be said that their measure is the same since it seldom happens that available council positions are not filled
By using different measures for one variable results may vary within one study let alone comparing different studies contexts or subnational international com-parisons In this sense one should be careful while summing and interpreting results because the measure always speaks more than the variable name
42 maIn determInantsIn order to provide the centrality of each variable in the literature table 2 presents the most frequently used explanatory variables It shows how many studies that
br
an
ko sta
nić
deter
min
an
ts of su
bn
ation
al b
ud
getfisc
al tr
an
spar
enc
y a rev
iew o
f empir
ica
l evid
enc
epu
blic sec
tor
eco
no
mic
s42 (4) 449-486 (2018)
460 are included in the review used a particular independent variable The complete classification and measurements of variables can be seen in the appendix
Table 2 Most frequently used explanatory variables
financial Debt 40Governmentrsquos wealth 35Budget (im)balance 35Leverage 20Intergovernmental transfers 15Municipal size 10Political Political competition 55Political ideology 55Voter turnout 45Executive features 35Governance type 20E-government achievements 15citizens and the media Population sizedensity 60Citizensrsquo characteristics (education age gender) 45Citizensrsquo wealth 35Internet access 30Unemployment 25Media use and visibility 25
Source Author
However this overview aims to analyze the most frequently used variables that have shown a significant influence with particular emphasis on those that despite heterogeneity in definition and measurement show a significant effect In this way the review strives to produce a balanced account of core variables that greatly affect the level of subnational fiscalbudget transparency (table 3) To produce this account the rule is that only variables that were used in at least two papers and which show a significant result in more than 50 of cases were included Accord-ingly three basic variable categories are distinguished financial political and citizens and the media The following section reveals these variables and focuses on the explanation of the results obtained based on some underpinnings in previ-ous studies
421 fInancIal VarIablesFinancial leverage and debt levels are the most important financial factors deter-mining subnational budgetfiscal transparency Leverage refers to the use of bor-rowed funds to finance public activities In this sense it can represent the amount of debt of the government showing the close relation of these two terms Accord-ing to Zimmerman (1977) governments want to reduce the cost of debt by increas-
br
an
ko sta
nić
deter
min
an
ts of su
bn
ation
al b
ud
getfisc
al tr
an
spar
enc
y a rev
iew o
f empir
ica
l evid
enc
epu
blic sec
tor
eco
no
mic
s42 (4) 449-486 (2018)
461ing resources available for other activities that are more efficient in increasing governmentrsquos welfare than the payment of high interest rates Accordingly politi-cians are encouraged to publish government information which in turn facilitates monitoring by creditors This can be achieved easily and at low-cost by online proactive reporting which is confirmed in several studies even if they have dif-ferent leverage measurements (Laswad Fisher and Oyelere 2005 Gandiacutea Mar-rahiacute and Huguet 2016 Gesuele Metallo and Longobardi 2017)
Table 3 Main determinants of subnational budgetfiscal transparency
category Variable different measurements
Financial
LeverageRatio of long-term liabilities to total assetsRatio of long-term liabilities to total public equity Total executed expenses per capita
Debt
Percentage of debt in total budgetPublic debt per capitaFunding costs of the current year budget expenditure per capita
Political
Political competition
Divided government gubernatorial competition legislative competition1 if city council is governed by one of the majority political parties in the countryMeasure of dispersion ie the standard deviation of the percentage of votes received by each political party Effective number of political partiesMargin of victory measured by the difference between the percentage of votes obtained by the parties coming in first and second place
Executive features
Mayorrsquos genderNumber of incumbentrsquos consecutive terms (tenure)
Governance type
1 if district councils 0 regional or city councils1 if provincial capitalsForm of government (1 if council-manager 0 commission and council-elected executive)
Citizens and the media
PopulationNumber of inhabitantsPopulation density
Internet access
Percentage of households with home internet accessFixed internet access connections over 200 kilobits per second in at least one direction per 1000 householdsInternet penetration
Unemployment Unemployment rate
Media
Intensity of use of social media measured by the number of tweetsPress visibilityInternet visibility
Source Author
br
an
ko sta
nić
deter
min
an
ts of su
bn
ation
al b
ud
getfisc
al tr
an
spar
enc
y a rev
iew o
f empir
ica
l evid
enc
epu
blic sec
tor
eco
no
mic
s42 (4) 449-486 (2018)
462 Moreover politicians are incentivized to reduce debt levels because it allows for lower property taxes that will increase their probability of re-election (Gore Sachs and Trzcinka 2004) In this way incumbents are encouraged to use internet reporting and disclose more information as this helps lenders to regularly monitor governments activities (Debreceny Gray and Rahman 2002) In other words the greater the dependence on external funding sources the greater the disclosure (Ingram 1984) Severel studies have confirmed this finding a positive relation-ship between debt levels and budgetfiscal reporting (Styles and Tennyson 2007 Caba-Peacuterez Rodriacuteguez Boliacutevar and Loacutepez Hernaacutendez 2008 Caamantildeo-Alegre et al 2013 De Arauacutejo and Tejedo-Romero 2017) However Alt Lassen and Rose (2006) found a negative association concluding that higher debt reduces fiscal transparency But it should be pointed out that they employed debt variable only as a control variable Finally given the different leverage and debt measures used the significance of these variables in determining fiscalbudgetary transparency is even greater
422 PolItIcal VarIablesPolitical competitionWhen it comes to political determinants there are three variables that contribute to explaining different levels of subnational budgetfiscal transparency ndash political competition different executive features and type of government Stronger polit-ical competition encourages incumbents to bear higher monitoring costs because if they do not keep pre-election promises they are exposed to the long-term costs of re-election failure (Evans and Patton 1987) Esteller-Moreacute and Polo Otero (2012) stressed the importance of political competition in times in which an incumbentrsquos re-election is uncertain With a strong competition agents use fiscal disclosure as their strategic instrument to have a greater chance of being re-elected However when it comes to the degree of fiscal information they wish to provide agents face a trade-off According to Ferejohn (1986) higher levels of fiscal transparency allow politicians to have higher wages since principals are now ready to pay more taxes At the same time greater information disclosure diverts agents from rent extraction Accordingly in the cases of strong competi-tion higher transparency becomes agentsrsquo instrument only if a trade-off is solved in favour of higher salaries In cases of low competition transparency becomes less important for politicians as they in this case have high expectations of staying in power (Piotrowski and Bertelli 2010)
It is argued that parties in power have greater benefits from divulging information in both a low and a high political competition environment In the case of high competition they have the incentive to show their current actions and good man-agement (Caba Peacuterez Rodriacuteguez Boliacutevar and Loacutepez Hernaacutendez 2014) while low competition makes them more confident of their position in power and so willing to reveal more information (Grimmelikhuijsen and Welch 2012) By contrast other competing parties in a high competition environment abstain from the risk of disclosure as this may reduce their ability to control their message (Caba Peacuterez Rodriacuteguez Boliacutevar and Loacutepez Hernaacutendez 2014)
br
an
ko sta
nić
deter
min
an
ts of su
bn
ation
al b
ud
getfisc
al tr
an
spar
enc
y a rev
iew o
f empir
ica
l evid
enc
epu
blic sec
tor
eco
no
mic
s42 (4) 449-486 (2018)
463In this context the empirical results on political competition are mixed While sev-eral authors proved that competition fosters subnational fiscal transparency (Caamantildeo-Alegre et al 2013 Gandiacutea and Archidona 2008 Tavares and da Cruz 2017) others disputed this showing a negative correlation (Alt Lassen and Rose 2006 De Arauacutejo and Tejedo-Romero 2016 Gandiacutea Marrahiacute and Huguet 2016) Generally it is hard to report the true effect of political competition since the con-text data used and different country characteristics may greatly affect this variabil-ity in the results However even with wide range of measurements used political competition proved to be a significant predictor of subnational fiscal transparency
executive featuresDifferent incumbent characteristics and features also affect governmentrsquos decision on divulging or withholding fiscal information The mayorrsquos gender is the first of those features showing a significant influence on subnational transparency levels Many studies have investigated the differences between women and men officials mostly favouring womenrsquos leadership style and its effect on decision-making in the public sector It is argued that female mayors are more likely than their male counterparts to actively engage citizens in the decision-making thus fostering participation communication and different inputs (Fox and Schuhmann 1999) Some studies are concerned with gender and ethics suggesting that women are less likely to behave unethically in the workplace in order to achieve greater finan-cial rewards (Bernardi and Arnold 1997 Krishnan and Parsons 2008) In addi-tion female mayors may be less likely to experience the principal-agent dilemma since they are more ethically minded than men (Khazanchi 1995) Some authors stress that the critical representation of women in governance structures can affect the way of government functioning making it more socially responsive and trans-parent (Rodriacuteguez-Garcia 2015) Several authors have empirically confirmed these underpinnings finding a positive relationship between a female mayor and budget transparency (De Arauacutejo and Tejedo-Romero 2017 Tavares and da Cruz 2017) However Gesuele Metallo and Longobardi (2017) proved the opposite but showing the significance in only one of the three models presented
It is also argued that longer tenure in office reduces pressure on the officials to disclose information Tavares and da Cruz (2017) found that the number of an incumbentrsquos consecutive terms in office is one of the factors most detrimental to transparency This is consistent with the findings by Berliner (2014) who claimed that turnover in executive office fosters the adoption of freedom of information laws which are associated with increased transparency By contrast Ma and Wu (2011) showed a positive correlation stressing that governments need more time to achieve the support needed for the implementation of administrative reforms so as to foster transparency and openness It could also be argued however that much more research is needed as only few studies have employed this variable thus limiting a better insight into the true effects of this variable
br
an
ko sta
nić
deter
min
an
ts of su
bn
ation
al b
ud
getfisc
al tr
an
spar
enc
y a rev
iew o
f empir
ica
l evid
enc
epu
blic sec
tor
eco
no
mic
s42 (4) 449-486 (2018)
464 governance typeThere has been a tendency for researchers to include a dummy variable that addresses the type or form of the government thus pointing to the governance structure This could be an important argument especially in the context of imple-mentation of the new public management (NPM) Namely within this approach citizens are viewed as customers and public servants as public managers while transparency and accountability are perceived as fundamental elements of good governance (Caba Peacuterez Rodriacuteguez Boliacutevar and Loacutepez Hernaacutendez 2008) Las-wad Fisher and Oyelere (2005) were among the first to use the variable ldquoform of local authorityrdquo by distinguishing between district city and regional councils They found that regional and city councils are more transparent than district coun-cils However it is not clear why they have not used a nominal variable rather than a dichotomous to address all three council types separately It should be noted though that the governance type may vary greatly among countries thus depending on the setting of the public administration of a country In some cases the central government has administration delegations across the country which are assigned to the several subnational units In Spain for example these are pro-vincial capitals where the central government holds offices to provide efficiently and effectively some additional services to citizens These political capitals proved to be less transparent than other Spanish cities (del Sol 2013) Since this is a spe-cific country context it would be difficult to find theoretical underpinnings that support this evidence In spite of that the author indicated that the reason for low transparency could be the capitalsrsquo privileged treatment by the central govern-ment Lowatcharin and Menifield (2015) on a sample of US counties found that council-manager governments tend to be more transparent than their mayor-coun-cil counterparts It could be argued however that council-managers are more prone to the adoption of web technologies and e-government solutions rather than mere transparency (Moon 2002) In other words higher transparency in these governments is not a goal by itself but comes as a result of their propensity for web technology implementations
423 cItIZens and the medIaPopulationOne of the variables most often used in explaining SNG fiscal transparency is the number of inhabitants It is widely discussed that larger SNGs have the extra resources and capacities to adopt technical and managerial innovations faster (Smith and Taebel 1985 Norris and Kraemer 1996) This is explained by the greater pressure they face in finding different ways for a better supply of public services In addition they may have a better trained stuff a larger budget and an established IT department which helps them to embrace e-government practices (Moon and Norris 2005) These underpinnings were strongly confirmed by sev-eral authors (del Sol 2013 Guillamoacuten Bastida and Benito 2011 Lowatcharin and Menifield 2015 Serrano-Cinca Rueda-Tomaacutes and Portillo-Tarragona 2009) However a study presented by Esteller-Moreacute and Polo Otero (2012) has revealed new insights into the population variable Given the heterogeneity of the sample
br
an
ko sta
nić
deter
min
an
ts of su
bn
ation
al b
ud
getfisc
al tr
an
spar
enc
y a rev
iew o
f empir
ica
l evid
enc
epu
blic sec
tor
eco
no
mic
s42 (4) 449-486 (2018)
465with a wide range of population size they split the sample into a large and small population They found a negative relationship in the small sample but a positive in the larger sample (for the very big municipalities) pointing to a non-linear relationship between the number of inhabitants and fiscal transparency They stressed that unlike small municipalities very large units have greater capacity to fulfil their legal obligations which could more than compensate for their potential propensity to be less transparent
Internet accessAccording to Debreceny Gray and Rahman (2002) the rise in the use of the inter-net has brought different views to fiscal transparency From the userʼs perspective it is recognized as a facilitator in the demand for fiscal transparency while from the supplierʼs perspective it is perceived as a tool for more effective dissemination of information Internet take-up has affected the behaviour of governments which are now divulging additional information and services online Thus its rise has brought about an improved transparency and financial accountability reducing the costs of dissemination (Pina Torres and Royo 2010) Several studies that investigated online (mainly website) transparency reported that greater and better internet access in the SNGs positively affects their fiscal transparency (Caba-Peacuterez Rodriacuteguez Boliacutevar and Loacutepez Hernaacutendez 2008 Gandiacutea and Archidona 2008 De Arauacutejo and Tejedo-Romero 2017) Garciacutea-Tabuyo Saacuteez-Martiacuten and Caba-Peacuterez (2016) found a positive association with mandatory disclosure but surprisingly the relationship with voluntary reporting proved to be negative Although the argument may be somewhat shallow they explained this by saying that voluntary information disclosure could be larger in municipalities with higher internet penetration and political commitment because by increasing the transpar-ency levels politicians aim to attract the votes of inactive citizens
unemploymentIt has been argued that lower economic development and associated higher unem-ployment rates are damaging to civic engagement ie the demand for greater opportunities to participate in the decision-making is lessened Some studies used unemployment as a proxy for SNG economic status and found that higher eco-nomic status (lower unemployment) positively affects transparency in public administration (Piotrowski and van Ryzin 2007) In accordance with these under-pinnings the results largely indicate that higher unemployment rates are detri-mental to fiscal transparency (Caamantildeo-Alegre et al 2013 De Arauacutejo and Tejedo-Romero 2016 del Sol 2013 Tavares and da Cruz 2017)
mediaVarious authors have stressed the importance of public media visibility in a govern-mentrsquos divulging of information (Zimmerman 1977 Ingram 1984 Laswad Fisher and Oyelere 2005) It is argued that greater visibility and frequency of press report-ing on a governments activities and work contributes to resolving the principal-agent dilemma by reducing information asymmetries between citizens and author-
br
an
ko sta
nić
deter
min
an
ts of su
bn
ation
al b
ud
getfisc
al tr
an
spar
enc
y a rev
iew o
f empir
ica
l evid
enc
epu
blic sec
tor
eco
no
mic
s42 (4) 449-486 (2018)
466 ities However it should be noted that the media citizens and politicians often have different interests In this context public media may be more interested in publish-ing exclusive information such as corruption scandals This in turn affects the governments behavior for it will limit the disclosure of information so as to avoid them being ldquomisusedrdquo in the media (Laswad Fisher and Oyelere 2005 Garciacutea and Garciacutea-Garciacutea 2010 Cuadrado-Ballesteros et al 2017) Nevertheless studies have found that press and public media visibility as well as frequency of social media usage by SNGs have a positive impact on their fiscal transparency (Laswad Fisher and Oyelere 2005 Gandiacutea and Archidona 2008 Gandiacutea Marrahiacute and Huguet 2016 Gesuele Metallo and Longobardi 2017)
5 dIscussIon and conclusIonThis paper has provided a review of empirical studies on the determinants of sub-national governmentrsquos budgetfiscal transparency in the period 2000-2017 Sev-eral important observations should be emphasized First in order to determine the factors involved it is necessary to have a clear definition of budgetfiscal transpar-ency However there is no consensus about this Moreover different definitions are interwoven leading to budgetary and fiscal transparency being used inter-changeably The lack of a clear definition conduces to an inadequate measurement of budget transparency which can significantly affect the credibility of the results of such research Thus instead of having effective transparency this lack of clar-ity leads to opaque fuzzy or zombie transparency (Fox 2007 Michener 2015) where there is a lack of disaggregation or better descriptive details Without parameters as Michener (2015) stressed the quality and comparability of trans-parency is compromised Secondly different approaches to measuring budget transparency especially within the same country reduce the effective comparison potential and lead to ambiguity Thirdly heterogeneity of the definition and meas-urement of explanatory variables can lead to apparent contradiction and inconsist-ency of the obtained results
In this paper three basic categories that determine subnational government budgetfiscal transparency are established (1) financial (leverage and debt) (2) political (political competition executive features and governance type) and (3) citizens and the media (population internet access unemployment and the media) This conclusion is based on the review of 20 selected papers following the above-mentioned methodology Looking at the wider literature some of the findings can be related to findings at the national level where the main factors of fiscal trans-parency are political namely political (electoral) competition and the level of governmental democracy (Hollyer Rosendorff and Vreeland 2011 Wehner and de Renzio 2013) Although citizens and the media and financial factors deter-mine SNG fiscal transparency at the national level its effect seems negligible This may be due to the reduced participation opportunities and pressures of citi-zens on the national government or different structures and sources of funding of national and SNGs Moreover Wehner and de Renzio (2013) have concluded that external initiatives might not play a great role in strenghtening fiscal accountabil-
br
an
ko sta
nić
deter
min
an
ts of su
bn
ation
al b
ud
getfisc
al tr
an
spar
enc
y a rev
iew o
f empir
ica
l evid
enc
epu
blic sec
tor
eco
no
mic
s42 (4) 449-486 (2018)
467ity at the national level when the internal demand (citizens media) is weak How-ever when it comes to a wider literature on other types of public sector transpar-ency all findings are highly correlated (Bakar and Saleh 2015) including all three established categories
A vast majority of studies tend to focus on local governments thus neglecting other types of public sector organizations such as federal and state governments or quasi-government bodies Very few studies involved different countries in an investigation of subnational international comparisons In this sense the chal-lenge would be to create a harmonized budget transparency measure that could be applied to subnational governments of different countries Further such research could offer a more comprehensive insight into the factors implicated in budgetfiscal transparency including different country characteristics and contexts Fur-thermore greater consistency in selecting proxy measures for certain variables could contribute to a clearer interpretation of results while the greater time span of budget transparency data would allow for richer methodology solutions and observations
Like any other studies this study has a few limitations It does not take into account research before 2000 as the focus is rather on online disclosure Future studies may extend observation time Furthermore no meta-analytic studies were included However this paper can serve as the basis and motivation for imple-menting systematic reviews and meta-analyses on this topic In spite of these limitations it is believed that the study may provide rich insights for both inter-ested researchers and practitioners
disclosure statementThe author does not have any conflict of interest
br
an
ko sta
nić
deter
min
an
ts of su
bn
ation
al b
ud
getfisc
al tr
an
spar
enc
y a rev
iew o
f empir
ica
l evid
enc
epu
blic sec
tor
eco
no
mic
s42 (4) 449-486 (2018)
468
aPP
en
dIX
Ta
bl
e a
1 Bu
dget
fisc
al tr
ansp
aren
cy m
easu
rem
ents
aut
hor(
s)sa
mpl
ed
epen
dent
var
iabl
ety
pe o
f di
sclo
sure
met
hod
for
estim
atin
g de
term
inan
ts
mai
n re
sults
(d
eter
min
ants
)m
easu
rem
ent
tim
e
peri
odu
nite
d st
ates
Alt
et a
l (2
006)
50 S
tate
s
Bas
ed o
n A
lt L
asse
n an
d Sk
illin
g (2
002)
The
y m
easu
red
stat
e go
vern
men
t bud
get p
roce
dure
s by
send
ing
ques
tionn
aire
s to
the
budg
et o
ffice
rs o
f all
50 st
ates
on
nine
dic
hoto
mou
s ite
ms r
egar
ding
bu
dget
pro
cedu
re is
sues
bas
ed o
n th
e da
ta fr
om th
e N
atio
nal A
ssoc
iatio
n of
Sta
te B
udge
t Offi
cers
and
th
e N
atio
nal C
onfe
renc
e of
Sta
te L
egis
latu
res
1972
-99
Surv
ey
resp
onse
s
Pane
l dat
a re
gres
sion
an
alys
is
Polit
ical
com
petit
ion
Po
litic
al p
olar
izat
ion
Pa
rtisa
n co
mpo
sitio
n
of g
over
nmen
t D
ebt
Bud
get i
mba
lanc
e
Styl
es a
nd
Tenn
yson
(2
007)
300
mun
icip
aliti
es
They
use
d on
ly o
ne in
dica
tor ndash
a c
ompr
ehen
sive
an
nual
fina
ncia
l rep
ort (
CA
FR)
In a
dditi
on t
hey
deve
lope
d an
acc
essi
bilit
y in
dex
to m
easu
re th
e ea
se o
f CA
FR a
cces
s ie
how
man
y st
eps a
re
requ
ired
to lo
cate
the
repo
rt
na
Onl
ine
man
dato
ry
Logi
t Reg
ress
ion
Ana
lysi
s for
pro
-vi
sion
mod
el a
nd
OLS
Reg
ress
ion
Ana
lysi
s for
ac
cess
ibili
ty
mod
el
Popu
latio
n si
ze I
ncom
e pe
r cap
ita A
ccou
ntin
g di
sclo
sure
Ber
nick
et
al (
2014
)40
0 co
untie
s
Like
Sty
les a
nd T
enny
son
(200
7) t
hey
look
ed
at a
com
preh
ensi
ve a
nnua
l fina
ncia
l rep
ort (
CA
FR)
and
avai
labi
lity
and
com
preh
ensi
vene
ss o
f bud
get
info
rmat
ion
(no
exac
t doc
umen
t or i
nfor
mat
ion
is
indi
cate
d)
2014
Onl
ine
man
dato
ryO
rder
ed lo
git
anal
ysis
Cou
ntie
s with
app
oint
ed
coun
ty m
anag
er s
ize
of
coun
ty b
oard
cou
ntie
s re
quire
d to
subm
it an
au
dit t
o th
e fe
dera
l gov
-er
nmen
t Ec
onom
ic
stre
ss P
opul
atio
n ag
e
Dem
ocra
tic a
nd m
inor
-ity
resi
dent
s H
eter
o-ge
neity
of t
he c
ount
y
br
an
ko sta
nić
deter
min
an
ts of su
bn
ation
al b
ud
getfisc
al tr
an
spar
enc
y a rev
iew o
f empir
ica
l evid
enc
epu
blic sec
tor
eco
no
mic
s42 (4) 449-486 (2018)
469a
utho
r(s)
sam
ple
dep
ende
nt v
aria
ble
type
of
disc
losu
rem
etho
d fo
r es
timat
ing
dete
rmin
ants
mai
n re
sults
(d
eter
min
ants
)m
easu
rem
ent
tim
e
peri
od
Low
atch
arin
an
d M
eni-
field
(201
5)
816
coun
ties i
n tw
elw
e U
S M
idw
este
rn st
ates
Cat
egor
ical
dat
a ta
king
the
num
bers
from
0 to
4
with
rega
rd to
the
rele
ase
of th
e fo
llow
ing
10 it
ems
bu
dget
mee
tings
ele
cted
offi
cial
s ad
min
istra
tive
offic
ials
per
mits
and
zon
ing
aud
its c
ontra
cts
lobb
ying
pub
lic re
cord
s an
d lo
cal t
axes
2010
Onl
ine
proa
ctiv
e
Ord
ered
Log
istic
R
egre
ssio
n A
naly
sis
Gov
erna
nce
type
Po
pula
tion
dens
ity
Citi
zens
edu
catio
n
Tota
l lan
d ar
ea
Min
ority
pop
ulat
ion
(mos
t ext
ensi
ve m
odel
re
sults
)sp
ain
Gan
diacutea
and
Arc
hido
na
(200
8)
130
mun
icip
aliti
es
with
mor
e th
an 5
000
0 in
habi
tant
s
Web
dis
clos
ure
inde
x c
onsi
stin
g of
88
item
s gr
oupe
d in
to fi
ve se
ctio
ns g
ener
al in
form
atio
n
budg
et in
form
atio
n fi
nanc
ial i
nfor
mat
ion
na
viga
tion
and
pres
enta
tion
rela
tiona
l web
2006
Onl
ine
volu
ntar
y
Mul
tivar
iate
R
egre
ssio
n A
naly
sis
Polit
ical
com
petit
ion
Pu
blic
med
ia v
isib
ility
In
tern
et a
cces
s
Citi
zens
edu
catio
n
Serr
ano-
Cin
ca e
t al
(200
9)
92 lo
cal g
over
nmen
ts
incl
udin
g al
l pr
ovin
cial
cap
itals
and
al
l tow
n ha
lls w
ith
over
70
000
inha
bita
nts
Dep
ende
nt v
aria
ble
base
d on
web
ava
ilabi
lity
of
nine
doc
umen
ts i
ndiv
idua
l bud
get o
f the
cou
ncil
co
nsol
idat
ed b
udge
t of t
he c
ounc
il b
udge
t of
depe
nden
t ent
ities
bud
get d
isag
greg
ated
by
eco-
nom
ic f
unct
iona
l or o
rgan
ic c
lass
ifica
tion
bud
get
info
rmat
ion
rega
rdin
g in
vest
men
t bo
rrow
ing
or
reve
nue
and
expe
nditu
re i
ndiv
idua
l ann
ual
acco
unts
con
solid
ated
ann
ual a
ccou
nts
annu
al
acco
unts
of d
epen
dent
ent
ities
and
aud
it re
port
2006
Onl
ine
volu
ntar
y
Mul
tivar
iate
Lo
gist
ic
Reg
ress
ion
Popu
latio
n si
ze B
udge
t re
venu
es P
oliti
cal w
ill
(mea
sure
d by
cou
ncils
rsquo ex
perie
nce
with
e-
dem
ocra
cy)
Dis
posa
ble
fam
ily
inco
me
per i
nhab
itant
Cab
a-Peacute
rez
et a
l (2
008)
65 S
pani
sh c
ity
coun
cils
inc
ludi
ng
larg
e ci
ties
prov
inci
al
capi
tals
aut
onom
ous
regi
on c
apita
ls a
nd
mun
icip
aliti
es w
ith
cent
ral o
ffice
s of t
he
auto
nom
ous r
egio
nsrsquo
inst
itutio
ns
Dis
clos
ure
inde
x di
vide
d in
to th
ree
sect
ions
(1
) con
tent
of i
nfor
mat
ion
supp
lied
incl
udin
g bu
dget
and
fina
ncia
l inf
orm
atio
n (2
) cha
ract
eris
tics
of th
e in
form
atio
n di
sclo
sed
ie
com
plet
enes
s tim
elin
ess
com
para
bilit
y u
nder
stan
dabi
lity
re
leva
nce
and
relia
bilit
y a
nd (3
) nav
igab
ility
de
sign
and
acc
essi
bilit
y of
pub
lic fi
nanc
ial
info
rmat
ion
on th
e w
eb si
te
2007
Onl
ine
volu
ntar
y
Mul
tivar
iabl
e Li
near
R
egre
ssio
n
Cos
t of d
ebt
Inte
rnet
ac
cess
br
an
ko sta
nić
deter
min
an
ts of su
bn
ation
al b
ud
getfisc
al tr
an
spar
enc
y a rev
iew o
f empir
ica
l evid
enc
epu
blic sec
tor
eco
no
mic
s42 (4) 449-486 (2018)
470
aut
hor(
s)sa
mpl
ed
epen
dent
var
iabl
ety
pe o
f di
sclo
sure
met
hod
for
estim
atin
g de
term
inan
ts
mai
n re
sults
(d
eter
min
ants
)m
easu
rem
ent
tim
e
peri
od
Gui
llam
oacuten
et a
l (2
011)
100
larg
est S
pani
sh
mun
icip
aliti
es
The
finan
cial
tran
spar
ency
inde
x ba
sed
on th
e da
ta
of T
rans
pare
ncy
Inte
rnat
iona
l (TI
) Spa
in 2
008
and
partl
y fr
om th
e qu
estio
nnai
re c
reat
ed b
y th
e au
thor
s Th
ey o
bser
ved
thre
e di
men
sion
s
acco
untin
g an
d bu
dget
mun
icip
al re
venu
es a
nd
expe
nditu
res
and
mun
icip
al d
ebt
2008
Proa
ctiv
e
prin
t and
on
line
OLS
and
2SL
S re
gres
sion
s
Mun
icip
al w
ealth
In
terg
over
nmen
tal
trans
fers
Pol
itica
l id
eolo
gy P
opul
atio
n si
ze
del S
ol
(201
3)
110
loca
l gov
ernm
ents
th
at p
artic
ipat
ed in
20
10 T
I Spa
in su
rvey
TI S
pain
dis
clos
ure
inde
x in
clud
ing
five
trans
pare
ncy
area
s fi
scal
(acc
ount
ing
and
budg
et
info
rmat
ion
info
rmat
ion
on re
venu
es a
nd
expe
nditu
res
info
rmat
ion
on d
ebt)
cor
pora
te
soci
al p
rocu
rem
ent a
nd c
ontra
ctin
g
2010
Onl
ine
volu
ntar
y
OLS
and
ce
nsor
ed
regr
essi
on
mod
els
Popu
latio
n si
ze
Polit
ical
ideo
logy
G
over
nanc
e ty
pe
(pro
vinc
ial c
apita
l)
Tour
ist a
ctiv
ity
Polit
ical
ideo
logy
De A
rauacutej
o an
d Te
jedo
-R
omer
o (2
016)
109
mun
icip
aliti
es
TI S
pain
dis
clos
ure
inde
x in
clud
ing
80 in
dica
tors
gr
oupe
d in
to si
x tra
nspa
renc
y ar
eas
Five
are
as
used
alre
ady
by A
lbal
ate
(201
3) a
nd a
dditi
onal
ca
tego
ry o
n ur
ban
deve
lopm
entp
ublic
wor
ks
trans
pare
ncy
2012
Onl
ine
volu
ntar
y
OLS
and
IV
2SL
S re
gres
sion
an
alys
is
Vote
r tur
nout
Pol
itica
l id
eolo
gy P
oliti
cal
com
petit
ion
Este
ller-
Mor
eacute an
d Po
lo O
tero
(2
012)
691
Cat
alan
m
unic
ipal
ities
A d
icho
tom
ous v
aria
ble
mea
surin
g bu
dget
fisc
al
trans
pare
ncy
by lo
okin
g at
the
nine
bud
get
info
rmat
ion
bud
get a
ppro
val
final
bud
get
budg
et
bala
nce
clo
sed
settl
emen
t bud
gets
tre
asur
y st
atem
ent
treas
ury
surp
lus
net w
ealth
stat
emen
t in
com
e st
atem
ent a
nd in
debt
edne
ss T
hese
in
form
atio
ns a
re p
art o
f ann
ual a
ccou
nts t
hat
Cat
alan
loca
l gov
ernm
ents
hav
e to
del
iver
to th
e Pu
blic
Aud
it O
ffice
for C
atal
onia
2001
-200
7M
anda
tory
Logi
t reg
ress
ion
anal
ysis
Polit
ical
com
petit
ion
Po
pula
tion
size
(m
easu
ring
the
degr
ee
of d
ecen
traliz
atio
n)
br
an
ko sta
nić
deter
min
an
ts of su
bn
ation
al b
ud
getfisc
al tr
an
spar
enc
y a rev
iew o
f empir
ica
l evid
enc
epu
blic sec
tor
eco
no
mic
s42 (4) 449-486 (2018)
471a
utho
r(s)
sam
ple
dep
ende
nt v
aria
ble
type
of
disc
losu
rem
etho
d fo
r es
timat
ing
dete
rmin
ants
mai
n re
sults
(d
eter
min
ants
)m
easu
rem
ent
tim
e
peri
od
Caa
mantilde
o-A
legr
e et
al
(201
3)
33 G
alic
ian
mun
icip
aliti
es
Bud
get t
rans
pare
ncy
inde
x co
ntai
ning
info
rmat
ion
on th
e op
en b
udge
t pro
cess
pub
lic a
vaila
bilit
y of
in
form
atio
n an
d as
sura
nce
of in
tegr
ity
Que
stio
nnai
res a
re se
nt to
gov
ernm
ent o
ffici
als b
y us
ing
a Li
kert-
type
surv
ey q
uest
ionn
aire
bas
ed o
n th
e IM
Frsquos r
evis
ed C
ode
of G
ood
Prac
tices
on
Fisc
al
Tran
spar
ency
na
Proa
ctiv
eO
LS re
gres
sion
an
alyi
s
Deb
t per
cap
ita B
udge
t (im
)bal
ance
Rat
io o
f m
unic
ipal
pub
lic
expe
nditu
re to
GD
P
Polit
ical
com
petit
ion
Po
litic
al id
eolo
gy
Coa
litio
n in
cum
bent
Vo
ter t
urno
ut
Une
mpl
oym
ent r
ate
Gan
diacutea
et
al (
2016
)
145
Span
ish
loca
l go
vern
men
ts w
ith
mor
e th
an 5
000
0 in
habi
tant
s
Web
20
dis
clos
ure
inde
x c
onsi
sted
of
(1) a
n or
nam
enta
l dis
clos
ure
inde
x w
hich
con
tain
s ge
nera
l and
citi
zen
info
rmat
ion
(2) i
nfor
mat
ion
disc
losu
re in
dex
incl
udin
g th
e in
form
atio
n on
pu
blic
pro
cure
men
t ad
min
istra
tive
agre
emen
ts
gove
rnm
ent s
ubsi
dies
and
aid
sta
ff a
nd b
udge
t an
d fin
anci
al in
form
atio
n (3
) rel
atio
nal d
iscl
osur
e in
dex
whi
ch re
pres
ents
the
pres
enta
tion
na
viga
bilit
y an
d in
tera
ctio
n ab
ilitie
s of t
he w
eb
na
Onl
ine
volu
ntar
y
Mul
tivar
iate
re
gres
sion
an
alys
is
Leve
rage
Mun
icip
al
wea
lth P
oliti
cal
com
petit
ion
Pol
itica
l id
eolo
gy C
itize
ns
educ
atio
n S
ocia
l med
ia
use
Pre
ss v
isib
ility
In
tern
et v
isib
ility
De A
rauj
o an
d Te
jedo
-R
omer
o (2
017)
100
larg
est S
pani
sh
mun
icip
aliti
esTI
Spa
in d
iscl
osur
e in
dex
2008
-201
0
2012
201
4O
nlin
e vo
lunt
ary
Bal
ance
d pa
nel
data
regr
essi
on
anal
ysis
May
ors
gend
er
Wom
anrsquos
repr
esen
tatio
n in
mun
icip
al c
ounc
il
br
an
ko sta
nić
deter
min
an
ts of su
bn
ation
al b
ud
getfisc
al tr
an
spar
enc
y a rev
iew o
f empir
ica
l evid
enc
epu
blic sec
tor
eco
no
mic
s42 (4) 449-486 (2018)
472
aut
hor(
s)sa
mpl
ed
epen
dent
var
iabl
ety
pe o
f di
sclo
sure
met
hod
for
estim
atin
g de
term
inan
ts
mai
n re
sults
(d
eter
min
ants
)m
easu
rem
ent
tim
e
peri
odo
ther
cou
ntri
es
Lasw
ad e
t al
(20
05)
86 lo
cal g
over
nmen
ts
in N
ew Z
eala
nd
A d
icho
tom
ous v
aria
ble
indi
catin
g w
heth
er o
r not
th
e lo
cal a
utho
rity
publ
ishe
s fina
ncia
l inf
orm
atio
n on
the
web
It i
s con
side
red
that
loca
l aut
horit
y de
liver
s inf
orm
atio
n if
at le
ast o
ne o
f fou
r do
cum
ents
that
repr
esen
t vol
unta
ry in
tern
et
finan
cial
repo
rting
was
pub
lishe
d F
our d
ocum
ents
ar
e fi
nanc
ial h
ighl
ight
s an
nual
repo
rts a
nnua
l pl
an a
nd c
ombi
natio
ns o
f ann
ual r
epor
ts p
lans
an
d fin
anci
al h
ighl
ight
s
na
Onl
ine
volu
ntar
yM
ultiv
aria
te
logi
t reg
ress
ion
Leve
rage
Mun
icip
al
wea
lth P
ress
vis
ibili
ty
Type
of c
ounc
il
Gar
ciacutea-
Tabu
yo e
t al
(20
16)
40 la
rges
t m
unic
ipal
ities
in e
ach
of th
e fiv
e C
entra
l A
mer
ica
coun
tries
ndash
El S
alva
dor
Nic
arag
ua P
anam
a
Gua
tem
ala
and
Hon
dura
s
Inde
x of
man
dato
ry a
nd in
dex
of v
olun
tary
di
sclo
sure
bas
ed o
n 94
item
s gro
uped
into
four
tra
nspa
renc
y ca
tego
ries
mun
icip
al g
over
nmen
t re
latio
ns w
ith c
itize
ns a
nd so
ciet
y e
cono
mic
-fin
anci
al tr
ansp
aren
cy a
nd se
rvic
e-pr
ocur
emen
t tra
nspa
renc
y T
he ra
tio o
f vol
unta
ry a
nd le
gal
item
s diff
ers d
epen
ding
on
the
obse
rved
cou
ntry
Salv
ador
(2
010)
G
uate
mal
a (2
008)
H
ondu
ras
(200
6)
Nic
arag
ua
(200
7)
Pana
ma
(200
2)
Onl
ine
proa
ctiv
eTo
bit R
egre
ssio
n A
naly
sis
The
mat
urity
of t
he F
OI
law
(man
dato
ry
disc
losu
re)
Inte
rnet
ac
cess
Vot
er tu
rnou
t (v
olun
tary
dis
clos
ure)
Zucc
olot
to
and
Teix
eira
(2
014)
26 B
razi
lian
stat
es
Stat
e tra
nspa
renc
y in
dex
deve
lope
d by
Bid
erm
an
and
Potto
mat
ti (2
010)
con
sist
ing
of th
ree
para
met
ers
con
tent
tim
e se
ries a
nd u
pdat
e fr
eque
ncy
and
usa
bilit
y
2010
Onl
ine
proa
ctiv
e
Mul
tiple
line
ar
regr
essi
on
anal
ysis
Soci
oeco
nom
ic fa
ctor
s
educ
atio
n e
mpl
oym
ent
and
inco
me
and
hea
lth
indi
cato
rs F
isca
l fa
ctor
s
br
an
ko sta
nić
deter
min
an
ts of su
bn
ation
al b
ud
getfisc
al tr
an
spar
enc
y a rev
iew o
f empir
ica
l evid
enc
epu
blic sec
tor
eco
no
mic
s42 (4) 449-486 (2018)
473a
utho
r(s)
sam
ple
dep
ende
nt v
aria
ble
type
of
disc
losu
rem
etho
d fo
r es
timat
ing
dete
rmin
ants
mai
n re
sults
(d
eter
min
ants
)m
easu
rem
ent
tim
e
peri
od
Ma
and
Wu
(201
1)31
Chi
nese
pro
vinc
es
Dis
clos
ure
inde
x ba
sed
on re
spos
iven
ess a
nd
info
rmat
ion
com
plet
enes
s as t
wo
basi
c di
men
sion
s It
is m
easu
red
by g
over
nmen
ts r
espo
nses
to 1
13
open
fisc
al in
form
atio
n re
ques
ts o
f citi
zens
in
clud
ing
66 it
ems f
or g
over
nmen
t acc
ount
s 30
ite
ms f
or so
cial
secu
rity
acco
unts
and
17
item
s for
st
ate
owne
d en
terp
rises
acc
ount
s
2008
-200
9R
eact
ive
Seem
ingl
y U
nrel
ated
R
egre
ssio
ns
(SU
R) m
odel
w
ith ra
ndom
ef
fect
s
Econ
omic
ope
nnes
s
Mar
ketiz
atio
n B
udge
t (im
)bal
ance
In
cum
bent
s te
nure
Ges
uele
et
al (
2017
)
287
mun
icip
aliti
es
142
Italia
n an
d 14
5 Sp
anis
h m
unic
ipal
ities
Two
inde
xes
(a) e
-dis
clos
ure
web
site
inde
x w
hich
m
easu
res i
nter
actio
n le
vel a
mon
g ci
tizen
s and
m
unic
ipal
ities
usi
ng o
ffici
al o
r man
dato
ry
disc
losu
re c
hann
el b
y lo
okin
g fo
r the
13
item
s in
clud
ing
the
publ
icat
ion
of fi
nanc
ial s
tate
men
ts
from
the
mun
icip
ality
and
from
the
cont
rolle
d co
mpa
ny a
nd m
unic
ipal
ities
ass
ets a
nd re
venu
es
(b) s
ocia
l med
ia u
sage
inde
x w
hich
mea
sure
s the
vo
lunt
ary
disc
losu
re v
ia so
cial
med
ia su
ch a
s Fa
cebo
ok a
nd T
witt
er
2013
Onl
ine
proa
ctiv
e
Tobi
t reg
ress
ion
(ste
pwis
e ap
proa
ch)
Leve
rage
Int
erne
t vi
sibi
lity
Citi
zens
w
ealth
(mea
sure
d by
ec
onom
ic a
ctiv
ity p
er
capi
ta)
Tava
res a
nd
da C
ruz
(201
7)
278
Portu
gues
e m
unic
ipal
ities
TI P
ortu
gal d
iscl
osur
e in
dex
con
sist
ing
of 7
6 in
dica
tors
gro
uped
into
the
seve
n di
men
sion
s
(1) O
rgan
izat
iona
l inf
orm
atio
n so
cial
com
posi
tion
and
oper
atio
n of
the
mun
icip
ality
(2)
Pla
ns a
nd
plan
ning
(3)
Loc
al ta
xes
rate
s se
rvic
e ch
arge
s an
d re
gula
tions
(4)
Rel
atio
nshi
p w
ith c
itize
ns
(5) P
ublic
pro
cure
men
t (6
) Eco
nom
ic a
nd fi
nanc
ial
trans
pare
ncy
and
(7) U
rban
pla
nnin
g an
d la
nd
use
man
agem
ent
2013
Onl
ine
proa
ctiv
eO
LS re
gres
sion
s
Fina
ncia
l aut
onom
y
May
ors
gend
er T
enur
e
Polit
ical
com
petit
ion
U
nem
ploy
men
t rat
e
Popu
latio
n ag
e
Sour
ce A
utho
r
br
an
ko sta
nić
deter
min
an
ts of su
bn
ation
al b
ud
getfisc
al tr
an
spar
enc
y a rev
iew o
f empir
ica
l evid
enc
epu
blic sec
tor
eco
no
mic
s42 (4) 449-486 (2018)
474
Ta
bl
e a
2Fi
nanc
ial v
aria
bles
Vari
able
na
me
Vari
able
m
easu
rem
ent
cor
rela
tion
of d
eter
min
ants
Posi
tive
neg
ativ
eN
on-s
igni
fican
tM
unic
ipal
si
zeAv
erag
e to
tal a
sset
s a
vera
ge to
tal r
even
ues
ndashndash
Lasw
ad e
t al
200
5B
udge
t rev
enue
sSe
rran
o-C
inca
et a
l 2
009
ndashndash
Leve
rage
Rat
io o
f lon
g-te
rm li
abili
ties t
o to
tal a
sset
s ra
tio
of lo
ng-te
rm li
abili
ties t
o to
tal p
ublic
equ
ityLa
swad
et a
l 2
005
ndashndash
Tota
l exe
cute
d ex
pens
es p
er c
apita
Gan
diacutea
et a
l 2
016
ndashG
andiacute
a an
d A
rchi
dona
200
8
The
leve
l of l
ever
age
(not
spec
ified
)G
esue
le e
t al
201
7ndash
ndash
Gov
ern-
men
trsquos
wea
lth
Mun
icip
ality
rsquos o
wn
reve
nue
per c
apita
Gan
diacutea
et a
l 2
016
La
swad
et a
l 2
005
ndashG
andiacute
a an
d A
rchi
dona
200
8
Bud
get r
even
ue p
er c
apita
ndashndash
Ma
and
Wu
201
1Ta
x re
venu
es p
er c
apita
Gui
llam
oacuten e
t al
201
1ndash
Caa
mantilde
o-A
legr
e et
al
201
3
GD
P pe
r cap
itandash
ndashM
a an
d W
u 2
011
(pos
itive
for c
ompl
eten
ess
but i
nsig
nific
ant f
or p
rovi
sion
of i
nfor
mat
ion)
Dic
hoto
mou
s var
iabl
e (1
if th
e ci
ty h
all h
as
mun
icip
al b
onds
in c
ircul
atio
n)ndash
ndashSe
rran
o-C
inca
et a
l 2
009
Deb
t
Perc
enta
ge o
f deb
t in
tota
l bud
get
ndashndash
del S
ol 2
013
Publ
ic d
ebt p
er c
apita
Caa
mantilde
o-A
legr
e et
al
201
3
De A
rauacutej
o an
d Te
jedo
-R
omer
o 2
017
Sty
les a
nd
Tenn
yson
200
7
Alt
et a
l
2006
De A
rauacutej
o an
d Te
jedo
-Rom
ero
201
6
Gui
llam
oacuten e
t al
201
1
Fund
ing
cost
s of t
he c
urre
nt y
ear b
udge
t exp
endi
ture
pe
r cap
itaC
aba-
Peacutere
z et
al
200
8ndash
ndash
Inte
rgov
ern-
men
tal
trans
fers
Rat
io o
f tot
al tr
ansf
ers t
o th
e to
tal a
mou
nt o
f non
-fin
anci
al re
venu
es T
hey
have
als
o ob
serv
ed c
urre
nt
and
capi
tal t
rans
fers
sepa
rate
lyndash
ndashEs
telle
r-Mor
eacute an
d Po
lo O
tero
201
2
Reg
iona
l and
cen
tral t
rans
fers
per
cap
itaG
uilla
moacuten
et a
l 2
011
ndashndash
Tota
l cur
rent
and
cap
ital t
rans
fers
ndash
ndashC
aba-
Peacutere
z et
al
200
8
br
an
ko sta
nić
deter
min
an
ts of su
bn
ation
al b
ud
getfisc
al tr
an
spar
enc
y a rev
iew o
f empir
ica
l evid
enc
epu
blic sec
tor
eco
no
mic
s42 (4) 449-486 (2018)
475Va
riab
le
nam
eVa
riab
le
mea
sure
men
tc
orre
latio
n of
det
erm
inan
tsPo
sitiv
en
egat
ive
Non
-sig
nific
ant
Bud
get
im(b
alan
ce)
Fisc
al im
bala
nce
ie
hig
her s
urpl
uses
and
defi
cits
Alt
et a
l 2
006
ndashndash
Bud
get b
alan
ce p
er c
apita
(low
erin
g de
ficit)
Caa
mantilde
o-A
legr
e et
al
201
3ndash
ndashB
udge
t defi
cit
natu
ral l
ogar
ithm
Ma
and
Wu
201
1ndash
ndash
Defi
cit p
er c
apita
ndashndash
Este
ller-M
oreacute
and
Polo
Ote
ro 2
012
G
uilla
moacuten
et a
l 2
011
Defi
cit o
r sur
plus
as a
per
cent
age
of to
tal b
udge
tndash
ndashde
l Sol
201
3
Oth
er
finan
cial
va
riabl
es
Inve
stm
ent p
c ta
x bu
rden
pc
ratio
of t
he ta
x re
venu
es
to o
pera
ting
reve
nues
rat
io o
f fina
ncia
l to
tota
l ex
pens
es r
atio
of o
pera
ting
to to
tal e
xpen
ses
ndashndash
Serr
ano-
Cin
ca e
t al
200
9
Cap
ital i
nves
tmen
t per
cap
itaD
e Ara
uacutejo
and
Teje
do-
Rom
ero
201
6ndash
ndash
Fisc
al p
ress
ure
mea
sure
d by
per
cap
ita ta
x an
d no
n-ta
x re
venu
e a
nd th
e sa
le o
f goo
ds a
nd se
rvic
es o
f the
pu
blic
adm
inis
tratio
nsndash
ndashC
aba-
Peacutere
z et
al
200
8
Fisc
al p
ress
ure
mea
sure
d by
tota
l dire
ct a
nd in
dire
ct
taxe
s per
cap
itaD
e Ara
uacutejo
and
Teje
do-
Rom
ero
201
7ndash
ndash
Inde
x of
fina
ncia
l aut
onom
y (d
eriv
ed fr
om ta
xes
and
fees
)
Ges
uele
et a
l 2
017
(sig
nific
ant i
n on
e of
thre
e m
odel
s)ndash
ndash
Fina
ncia
l pos
ition
mea
sure
d by
the
ratio
of p
rimar
y go
vern
men
trsquos u
nres
trict
ed n
et a
sset
s to
tota
l exp
ense
sSt
yles
and
Ten
nyso
n 2
007
ndashndash
Fina
ncia
l aut
onom
y (p
ropo
rtion
of l
ocal
taxe
s fe
es a
nd
othe
r cha
rges
)Ta
vare
s and
da
Cru
z 2
017
ndashndash
Rat
io o
f mun
icip
al p
ublic
exp
endi
ture
to G
DP
Caa
mantilde
o-A
legr
e et
al
201
3 ndash
ndashM
unic
ipal
ities
with
a c
ertifi
cate
of a
chie
vem
ent f
or
exce
llenc
e in
acc
ount
ing
repo
rting
Styl
es a
nd T
enny
son
200
7ndash
ndash
Sour
ce A
utho
r
br
an
ko sta
nić
deter
min
an
ts of su
bn
ation
al b
ud
getfisc
al tr
an
spar
enc
y a rev
iew o
f empir
ica
l evid
enc
epu
blic sec
tor
eco
no
mic
s42 (4) 449-486 (2018)
476
Ta
bl
e a
3 Po
litic
al v
aria
bles
Vari
able
na
me
Vari
able
m
easu
rem
ent
cor
rela
tion
of d
eter
min
ants
Posi
tive
neg
ativ
eN
on-s
igni
fican
t
Polit
ical
co
mpe
titio
n
(a) D
ivid
ed g
over
nmen
t ndash d
icho
tom
ous v
aria
ble
taki
ng th
e va
lue
1 if
diffe
rent
par
ties c
ontro
l the
ex
ecut
ive
and
legi
slat
ure
0 o
ther
wis
e
(b) G
uber
nato
rial c
ompe
titio
n m
easu
red
by th
e sh
are
of D
emoc
ratic
vot
es in
the
gube
rnat
oria
l ele
ctio
n
capt
urin
g ab
solu
te d
evia
tians
from
one
hal
f (c
) Leg
isla
tive
com
petit
ion
ndash D
emoc
ratic
seat
shar
es
in th
e up
per a
nd lo
wer
hou
ses
ndashA
lt et
al
200
6ndash
Rat
io o
f can
dida
tes t
o co
unci
l pos
ition
s ava
ilabl
endash
ndashLa
swad
et a
l 2
005
Num
ber o
f pol
itica
l par
ties i
n th
e ci
ty c
ounc
ilndash
ndashG
andiacute
a an
d A
rchi
dona
200
8D
icho
tom
ic v
aria
ble
1 if
city
cou
ncil
is g
over
ned
by
one
of t
he m
ajor
ity p
oliti
cal p
artie
s in
the
coun
tryG
andiacute
a an
d A
rchi
dona
200
8G
andiacute
a et
al
201
6ndash
Rat
io o
f can
dida
tes t
o co
unci
llors
ele
cted
ndashndash
Serr
ano-
Cin
ca e
t al
200
9R
atio
of c
ounc
illor
s ele
cted
for t
he p
arty
in p
ower
to
the
tota
l num
ber o
f ele
cted
cou
ncill
ors
ndashndash
Cab
a-Peacute
rez
et a
l 2
008
Mea
sure
of d
ispe
rsio
n i
e th
e st
anda
rd d
evia
tion
of
the
perc
enta
ge o
f vot
es re
ceiv
ed b
y ea
ch p
oliti
cal
party
(the
gre
ater
the
disp
ersi
on o
f vot
es a
mon
g po
litic
al p
artie
s th
e sm
alle
r the
ele
ctor
al c
ompe
titio
n)
Este
ller-M
oreacute
and
Polo
O
tero
201
2 (n
on-s
igni
fican
t fo
r big
mun
icip
aliti
es)
ndashC
aba-
Peacutere
z et
al
200
8
Effe
ctiv
e nu
mbe
r of p
oliti
cal p
artie
s ac
cord
ing
to
Laak
so a
nd T
aaga
pera
rsquos (1
979)
cal
cula
tion
Caa
mantilde
o-A
legr
e et
al
201
3ndash
ndash
Mar
gin
of v
icto
ry m
easu
red
by th
e di
ffere
nce
betw
een
the
perc
enta
ge o
f vot
es o
btai
ned
by th
e pa
rties
com
ing
in fi
rst a
nd se
cond
pla
ce T
he lo
wer
th
e di
ffere
nce
the
high
er th
e el
ecto
ral c
ompe
titio
n
Tava
res a
nd d
a C
ruz
201
7D
e Ara
uacutejo
and
Teje
do-R
omer
o
2016
De A
rauacutej
o an
d Te
jedo
-Rom
ero
20
17
br
an
ko sta
nić
deter
min
an
ts of su
bn
ation
al b
ud
getfisc
al tr
an
spar
enc
y a rev
iew o
f empir
ica
l evid
enc
epu
blic sec
tor
eco
no
mic
s42 (4) 449-486 (2018)
477Va
riab
le
nam
eVa
riab
le
mea
sure
men
tc
orre
latio
n of
det
erm
inan
tsPo
sitiv
en
egat
ive
Non
-sig
nific
ant
Polit
ical
id
eolo
gy
Polit
ical
orie
ntat
ion
of th
e m
unic
ipal
maj
ority
an
dor
may
orndash
ndash
Este
ller-M
oreacute
and
Polo
Ote
ro 2
012
G
arciacute
a-Ta
buyo
et a
l 2
016
Ges
uele
et
al
201
7 S
erra
no-C
inca
et a
l
2009
Tav
ares
and
da
Cru
z 2
017
1 if
left-
win
g m
unic
ipal
maj
ority
Gan
diacutea
et a
l 2
016
G
uilla
moacuten
et a
l 2
011
ndashndash
1 if
left
incu
mbe
ntC
aam
antildeo-
Ale
gre
et a
l
2013
del
Sol
201
3
De A
rauacutej
o an
d Te
jedo
-Rom
ero
20
16 2
017
ndash
Exec
utiv
e
May
orrsquos
gen
der (
1 if
fem
ale)
De A
rauacutej
o an
d Te
jedo
-R
omer
o 2
017
Tav
ares
an
d da
Cru
z 2
017
Ges
uele
et a
l 2
017
(sig
nific
ant i
n on
e of
th
ree
mod
els)
De A
rauacutej
o an
d Te
jedo
-Rom
ero
20
16 G
uilla
moacuten
et a
l 2
011
1 in
the
case
of c
oalit
ion
incu
mbe
nts
ndashC
aam
antildeo-
Ale
gre
et a
l 2
013
ndash
May
orrsquos
age
and
edu
catio
nndash
ndashTa
vare
s and
da
Cru
z 2
017
Num
ber o
f inc
umbe
ntrsquos
con
secu
tive
term
sM
a an
d W
u 2
011
Tava
res a
nd d
a C
ruz
20
17ndash
Gov
erna
nce
type
1 di
stric
t cou
ncils
0 re
gion
al o
r city
cou
ncils
ndashLa
swad
et a
l 2
005
ndash1
prov
inci
al c
apita
ls
ndashde
l Sol
201
3ndash
Form
of g
over
nmen
t (1
coun
cil-m
anag
er 0
co
mm
issi
on a
nd c
ounc
il-el
ecte
d ex
ecut
ive)
Low
atch
arin
and
Men
ifiel
d
2015
ndashndash
1 ci
ty-m
anag
er g
over
nanc
e st
ruct
ure
ndashndash
Styl
es a
nd T
enny
son
200
7
Vote
r tu
rnou
tPe
rcen
tage
of c
itize
n pa
rtici
patio
n in
loca
l ele
ctio
ns
Caa
mantilde
o-A
legr
e et
al
20
13 D
e Ara
uacutejo
and
Te
jedo
-Rom
ero
201
7 (s
impl
ified
mod
el)
Gar
ciacutea-
Tabu
yo e
t al
20
16 (v
olun
tary
di
sclo
sure
) D
e A
rauacutej
o an
d Te
jedo
-R
omer
o 2
016
De
Ara
uacutejo
and
Teje
do-
Rom
ero
201
7 (e
xten
sive
mod
els)
Gar
ciacutea-
Tabu
yo e
t al
201
6 (m
anda
tory
dis
clos
ure)
del
Sol
20
13 G
uilla
moacuten
et a
l 2
011
Se
rran
o-C
inca
et a
l 2
009
Ta
vare
s and
da
Cru
z 2
017
br
an
ko sta
nić
deter
min
an
ts of su
bn
ation
al b
ud
getfisc
al tr
an
spar
enc
y a rev
iew o
f empir
ica
l evid
enc
epu
blic sec
tor
eco
no
mic
s42 (4) 449-486 (2018)
478
Vari
able
na
me
Vari
able
m
easu
rem
ent
cor
rela
tion
of d
eter
min
ants
Posi
tive
neg
ativ
eN
on-s
igni
fican
t
Vote
r tu
rnou
tVo
ter a
bste
ntio
n re
pres
entin
g th
e pe
rcen
tage
of
popu
latio
n w
ho d
id n
ot v
ote
ndashEs
telle
r-Mor
eacute an
d Po
lo O
tero
201
2
(big
mun
icip
aliti
es)
Este
ller-M
oreacute
and
Polo
Ote
ro 2
012
(who
le sa
mpl
e an
d sm
all
mun
icip
aliti
es)
E-go
vern
-m
ent
achi
eve-
men
ts
Num
ber o
f e-d
emoc
racy
act
ions
impl
emen
ted
Serr
ano-
Cin
ca e
t al
200
9ndash
ndashE-
gove
rnm
ent d
evel
opm
ent
mea
sure
d by
the
scor
e in
op
en in
form
atio
n o
nlin
e bu
sine
ss u
ser s
atis
fact
ion
pr
oper
ties a
nd d
esig
n a
nd d
aily
ope
ratio
nndash
ndashndash
Inst
itutio
nal c
apac
ity v
aria
ble
mea
sure
d by
Ope
n G
over
nmen
t Inf
orm
atio
n (O
GI)
ndash
ndashM
a an
d W
u 2
011
(pos
itive
for
fisca
l com
plet
enes
s)M
unic
ipal
IT c
apac
ity m
easu
red
by th
e nu
mbe
r of I
T em
ploy
ees
ndashndash
Tava
res a
nd d
a C
ruz
201
7
Oth
er
polit
ical
va
riabl
es
Cou
ntie
s with
app
oint
ed c
ount
y m
anag
ers
size
of
coun
ty b
oard
cou
ntie
s req
uire
d to
subm
it an
aud
it to
th
e fe
dera
l gov
ernm
ent
Ber
nick
et a
l 2
014
ndashndash
Polit
ical
pol
ariz
atio
n (f
or m
easu
rem
ent s
ee H
anss
en
2004
)A
lt et
al
200
6ndash
ndash
Two-
party
and
mul
ti-pa
rty c
oalit
ion
in th
e ci
ty
coun
cil
ndashndash
Serr
ano-
Cin
ca e
t al
200
9
Wom
anrsquos
repr
esen
tatio
n in
mun
icip
al c
ounc
il
mea
sure
d as
a p
erce
ntag
e of
fem
ale
mem
bers
in
mun
icip
al c
ounc
il
De A
rauacutej
o an
d Te
jedo
-R
omer
o 2
017
ndashndash
1 if
incu
mbe
ntrsquos
par
ty d
oes n
ot h
old
a m
ajor
ity
of se
ats i
n th
e co
unci
lndash
ndashTa
vare
s and
da
Cru
z 2
017
The
mat
urity
of t
he F
OI l
aw i
e h
ow lo
ng h
as it
bee
n in
forc
e n
umbe
r of s
anct
ions
stip
ulat
ed in
the
FOI l
awndash
Gar
ciacutea-
Tabu
yo e
t al
20
16 (m
anda
tory
di
sclo
sure
)ndash
Sour
ce A
utho
r
br
an
ko sta
nić
deter
min
an
ts of su
bn
ation
al b
ud
getfisc
al tr
an
spar
enc
y a rev
iew o
f empir
ica
l evid
enc
epu
blic sec
tor
eco
no
mic
s42 (4) 449-486 (2018)
479T
ab
le a
4 C
itize
ns a
nd th
e m
edia
Vari
able
na
me
Vari
able
m
easu
rem
ent
cor
rela
tion
of d
eter
min
ants
Posi
tive
neg
ativ
eN
on-s
igni
fican
t
Popu
latio
nN
umbe
r of i
nhab
itant
s
De A
rauacutej
o an
d Te
jedo
-Rom
ero
20
16 d
el S
ol 2
013
Gui
llam
oacuten
et a
l 2
011
Ser
rano
-Cin
ca e
t al
20
09 S
tyle
s and
Ten
nyso
n 2
007
Este
ller-M
oreacute
and
Polo
O
tero
201
2 (n
on-li
near
re
latio
nshi
p)
Caa
mantilde
o-A
legr
e et
al
201
3
Cab
a-Peacute
rez
et a
l 2
008
Gan
diacutea
and
Arc
hido
na 2
008
Gar
ciacutea-
Tabu
yo e
t al
20
16 T
avar
es a
nd d
a C
ruz
201
7Po
pula
tion
dens
ity m
easu
red
in p
erso
ns
per s
quar
e m
ileLo
wat
char
in a
nd M
enifi
eld
201
5ndash
ndash
Inte
rnet
ac
cess
Perc
enta
ge o
f hou
seho
lds w
ith h
ome
inte
rnet
acc
ess
Gan
diacutea
and
Arc
hido
na 2
008
(bud
get d
iscl
osur
e) C
aba-
Peacutere
z et
al
200
8 D
e Ara
uacutejo
and
Teje
do-R
omer
o 2
017
ndashG
andiacute
a an
d A
rchi
dona
200
8
(fina
ncia
l dis
clos
ure)
Fixe
d in
tern
et a
cces
s con
nect
ions
ove
r 200
ki
lobi
ts p
er se
cond
in a
t lea
st o
ne d
irect
ion
per 1
000
hou
seho
lds
Low
atch
arin
and
Men
ifiel
d 2
015
(sim
ples
t mod
el)
ndashLo
wat
char
in a
nd M
enifi
eld
201
5
(mos
t ext
ensi
ve m
odel
s)
Inte
rnet
pen
etra
tion
as a
mea
sure
for t
he
deve
lopm
ent o
f IC
T in
fras
truct
ure
Gar
ciacutea-
Tabu
yo e
t al
201
6 (m
anda
tory
dis
clos
ure)
Gar
ciacutea-
Tabu
yo e
t al
20
16 (v
olun
tary
di
sclo
sure
)ndash
Perc
enta
ge o
f net
izen
sndash
ndashM
a an
d W
u 2
011
Citi
zens
rsquo ch
arac
teris
-tic
s
Citi
zen
educ
atio
n at
tain
men
t
Gan
diacutea
and
Arc
hido
na 2
008
(bud
get d
iscl
osur
e) G
andiacute
a et
al
20
16 L
owat
char
in a
nd
Men
ifiel
d 2
015
ndash
Gan
diacutea
and
Arc
hido
na 2
008
(fina
ncia
l di
sclo
sure
) C
aba-
Peacutere
z et
al
200
8
De A
rauacutej
o an
d Te
jedo
-Rom
ero
201
7
Ma
and
Wu
201
1 S
erra
no-C
inca
et a
l
2009
Tav
ares
and
da
Cru
z 2
017
Citi
zens
rsquo age
mea
sure
d by
the
perc
enta
ge
of th
e po
pula
tion
aged
65
and
over
Este
ller-M
oreacute
and
Polo
Ote
ro
2012
(who
le sa
mpl
e an
d bi
g m
unic
ipal
ities
) de
l Sol
201
3ndash
Este
ller-M
oreacute
and
Polo
Ote
ro 2
012
(sm
all m
unic
ipal
ities
)
Ma
and
Wu
201
1
br
an
ko sta
nić
deter
min
an
ts of su
bn
ation
al b
ud
getfisc
al tr
an
spar
enc
y a rev
iew o
f empir
ica
l evid
enc
epu
blic sec
tor
eco
no
mic
s42 (4) 449-486 (2018)
480
Vari
able
na
me
Vari
able
m
easu
rem
ent
cor
rela
tion
of d
eter
min
ants
Posi
tive
neg
ativ
eN
on-s
igni
fican
t
Citi
zens
rsquo ch
arac
teris
-tic
s
Citi
zens
rsquo age
mea
sure
d by
the
aver
age
age
of th
e m
unic
ipal
pop
ulat
ion
ndashTa
vare
s and
da
Cru
z
2017
ndash
Citi
zens
rsquo age
mea
sure
d by
the
med
ian
age
of p
opul
atio
nndash
ndashLo
wat
char
in a
nd M
enifi
eld
201
5
Gen
der
mea
sure
d by
the
perc
enta
ge o
f m
en o
ver t
he to
tal l
ocal
pop
ulat
ion
ndashndash
del S
ol 2
013
Citi
zens
rsquo w
ealth
Dis
posa
ble
fam
ily in
com
e pe
r inh
abita
ntSe
rran
o-C
inca
et a
l 2
009
ndashndash
Pers
onal
inco
me
per c
apita
Low
atch
arin
and
Men
ifiel
d
2015
Sty
les a
nd T
enny
son
200
7ndash
Low
atch
arin
and
Men
ifiel
d 2
015
(a
fter c
ontro
lling
for s
tate
effe
cts)
G
uilla
moacuten
et a
l 2
011
Perc
enta
ge o
f pop
ulat
ion
belo
w th
e po
verty
leve
lndash
ndashLo
wat
char
in a
nd M
enifi
eld
201
5
The
valu
e of
eco
nom
ic a
ctiv
ity p
er c
apita
Ges
uele
et a
l 2
017
ndashde
l Sol
201
3Pu
rcha
se p
ower
inde
xndash
ndashTa
vare
s and
da
Cru
z 2
017
Une
mpl
oy-
men
tU
nem
ploy
men
t rat
eD
e Ara
uacutejo
and
Teje
do-R
omer
o
2017
Caa
mantilde
o-A
legr
e et
al
20
13 D
e Ara
uacutejo
and
Teje
do-R
omer
o 2
016
de
l Sol
201
3 T
avar
es
and
da C
ruz
201
7
ndash
Med
ia
Hav
ing
Twitt
er a
ndo
r Fac
eboo
k ac
coun
tsndash
ndashG
andiacute
a et
al
201
6In
tens
ity o
f use
of s
ocia
l med
ia m
easu
red
by th
e nu
mbe
r of t
wee
tsG
andiacute
a et
al
201
6ndash
ndash
Inte
nsity
of u
se o
f soc
ial m
edia
mea
sure
d by
the
Face
book
like
sndash
ndashG
andiacute
a et
al
201
6
br
an
ko sta
nić
deter
min
an
ts of su
bn
ation
al b
ud
getfisc
al tr
an
spar
enc
y a rev
iew o
f empir
ica
l evid
enc
epu
blic sec
tor
eco
no
mic
s42 (4) 449-486 (2018)
481Va
riab
le
nam
eVa
riab
le
mea
sure
men
tc
orre
latio
n of
det
erm
inan
tsPo
sitiv
en
egat
ive
Non
-sig
nific
ant
Med
ia
Pres
s vis
ibili
tyG
andiacute
a an
d A
rchi
dona
200
8
Gan
diacutea
et a
l 2
016
Las
wad
et
al
200
5ndash
Ges
uele
et a
l 2
017
Inte
rnet
vis
ibili
tyG
andiacute
a an
d A
rchi
dona
200
8
Gan
diacutea
et a
l 2
016
Ges
uele
et
al
201
7ndash
Serr
ano-
Cin
ca e
t al
200
9
Oth
er
varia
bles
Deg
ree
of c
omm
unity
invo
lvem
ent
mea
sure
d by
the
num
ber o
f civ
ic
asso
ciat
ions
div
ided
by
the
num
ber
of in
habi
tans
ndashndash
Serr
ano-
Cin
ca e
t al
200
9
Tota
l lan
d ar
eaLo
wat
char
in a
nd M
enifi
eld
201
5 (m
ost e
xten
sive
mod
el)
ndashndash
Perc
enta
ge o
f pop
ulat
ion
chan
ge o
ver
the
year
sLo
wat
char
in a
nd M
enifi
eld
201
5 (m
ore
sim
plifi
ed m
odel
s)ndash
ndash
Min
ority
mea
sure
d by
the
perc
enta
ge
of n
onw
hite
pop
ulat
ion
Low
atch
arin
and
Men
ifiel
d 2
015
ndashndash
Inde
x of
tour
ist a
ctiv
ity p
er c
apita
ndashde
l Sol
201
3-
Sour
ce A
utho
r
br
an
ko sta
nić
deter
min
an
ts of su
bn
ation
al b
ud
getfisc
al tr
an
spar
enc
y a rev
iew o
f empir
ica
l evid
enc
epu
blic sec
tor
eco
no
mic
s42 (4) 449-486 (2018)
482 references1 Alt J E Lassen D D and Rose S 2006 The causes of fiscal transparency
evidence from the US states IMF Staff Papers 53(Spcial Issue) Available at lthttpswwwimforgExternalPubsFTstaffp200603pdfaltpdfgt
2 Alt J E Lassen D D and Skilling D 2002 Fiscal Transparency Guberna-torial Approval and the Scale of Government Evidence from the States State Politics amp Policy Quarterly 2(3) pp 230-250 httpsdoiorg101177 153244000200200302
3 Andreula N Chong A and Guillen J B 2009 Institutional Quality and Fiscal Transparency IDB Working Paper No 36 httpdxdoiorg102139ssrn1817228
4 Bakar N B A and Saleh Z 2015 Review of literature on factors influenc-ing public sector disclosure The way forward Asian Journal of Business and Accounting 8(2) pp 155-184
5 Berliner D 2014 The political origins of transparency Journal of Politics 76(2) pp 479-491 httpsdoiorg101017S0022381613001412
6 Berliner D and Erlich A 2015 Competing for Transparency Political Com-petition and Institutional Reform in Mexican States American Political Sci-ence Review 109(1) pp 110-128 httpsdoiorg101017S0003055414000616
7 Bernardi R A and Arnold D F 1997 An Examination of Moral Develop-ment within Public Accounting by Gender Staff Level and Firm Contempo-rary Accounting Research 14(4) pp 653-668 httpsdoiorg101111j1911- 38461997tb00545x
8 Bernick E L [et al] 2014 Explaining County Government Fiscal Transpar-ency in an Age of e-Government State and Local Government Review 46(3) pp 173-183 httpsdoiorg1011770160323X14556819
9 Biderman C and Pottomatti G 2010 Metodologia para construccedilatildeo de iacutendice de transparecircncia Indice de transparencia Available at lthttpindicedetrans-parenciacommetodologiagt
10 Caamantildeo-Alegre J [et al] 2013 Budget Transparency in Local Govern-ments An Empirical Analysis Local Government Studies 39(2) pp 182-207 httpsdoiorg101080030039302012693075
11 Caba-Peacuterez C Rodriacuteguez Boliacutevar M P and Loacutepez Hernaacutendez A M 2008 e-Government process and initiatives for online public financial information Online Information Review 32(3) pp 379-400 httpsdoiorg101108JFM-03-2013-0017
12 Caba Peacuterez M del C Rodriacuteguez Boliacutevar M P and Loacutepez Hernaacutendez A M 2014 The determinants of government financial reports online Transylvanian Review of Administrative Sciences (42) pp 5-31 Available at lthttpwwwrtsarotrasindexphptrasarticledownload1513gt
13 Cuadrado-Ballesteros B [et al] 2017 The Role of Media Pressure in Pro-moting Transparency of Local Governments Transylvanian Review of Admin-istrative Sciences 2017(51E) pp 20-37 httpsdoiorg1024193tras51E2
br
an
ko sta
nić
deter
min
an
ts of su
bn
ation
al b
ud
getfisc
al tr
an
spar
enc
y a rev
iew o
f empir
ica
l evid
enc
epu
blic sec
tor
eco
no
mic
s42 (4) 449-486 (2018)
48314 Darbishire H 2010 Proactive Transparency The future of the right to infor-mation World Bank Institute Working Paper No 60 httpsdoiorg 10159625031
15 De Arauacutejo J F F E and Tejedo-Romero F 2016 Local government trans-parency index determinants of municipalitiesrsquo rankings International Jour-nal of Public Sector Management 29(4) pp 327-347 httpdxdoiorg101108MRR-09-2015-0216
16 De Arauacutejo J F F E and Tejedo-Romero F 2017 Does Gender Equality Affect Municipal Transparency The Case of Spain Public Performance and Management Review 41(1) pp 69-99 httpsdoiorg1010801530957620171362350
17 Debreceny R Gray G L and Rahman A 2002 The determinants of inter-net financial reporting Journal of Accounting and Public Policy 21(4-5) pp 371-394 httpsdoiorg101016S0278-4254(02)00067-4
18 del Sol D A 2013 The institutional economic and social determinants of local government transparency Journal of Economic Policy Reform 16(1) pp 90-107 httpsdoiorg101080174878702012759422
19 Esteller-Moreacute A and Polo Otero J 2012 Fiscal Transparency (Why) does your local government respond Public Management Review 14(8) pp 1153-1173 httpsdoiorg101080147190372012657839
20 Evans J H and Patton J M 1987 Signaling and Monitoring in Public-Sector Accounting Journal of Accounting Research 25 pp 130-158 httpsdoiorg1023072491083
21 Ferejohn J 1986 Incumbent performance and electoral control Public Choice 50 pp 5-25 httpsdoiorg101007BF00124924
22 Fox J 2007 The uncertain relationship between transparency and account-ability Development in Practice 17(4-5) pp 663-671 httpsdoiorg 10108009614520701469955
23 Fox R L and Schuhmann R A 1999 Gender and Local Government A Comparison of Women and Men City Managers Public Administration Review 59(3) pp 231-242 httpsdoiorg1023073109951
24 Gandiacutea J L and Archidona M C 2008 Determinants of web site informa-tion by Spanish city councils Online Information Review 32(1) pp 35-57 httpsdoiorg10110814684520810865976
25 Gandiacutea J L Marrahiacute L and Huguet D 2016 Digital transparency and Web 20 in Spanish city councils Government Information Quarterly 33(1) pp 28-39 httpsdoiorg101016jgiq201512004
26 Garciacutea-Tabuyo M Saacuteez-Martiacuten A and Caba-Peacuterez M D C 2016 Manda-tory versus voluntary disclosures Drivers of proactive information provision by local governments in Central America Information Development 32(4) pp 1199-1215 httpsdoiorg1011770266666915595260
27 Garciacutea A C and Garciacutea-Garciacutea J 2010 Determinants of Online Reporting of Accounting Information by Spanish Local Government Authorities Local
br
an
ko sta
nić
deter
min
an
ts of su
bn
ation
al b
ud
getfisc
al tr
an
spar
enc
y a rev
iew o
f empir
ica
l evid
enc
epu
blic sec
tor
eco
no
mic
s42 (4) 449-486 (2018)
484 Government Studies Routledge 36(5) pp 679-695 httpsdoiorg101080030039302010506980
28 Gesuele B Metallo C and Longobardi S 2017 The Determinants of E-Disclosure Attitude Empirical Evidences from Italian and Spanish Munici-palities International Journal of Public Administration Routledge 20(4) pp 263-276 httpsdoiorg1010800190069220171300917
29 Gore A K Sachs K and Trzcinka C 2004 Financial disclosure and bond insurance Journal of Law and Economics 47(1) pp 275-306 httpsdoiorg 101086380472
30 Grimmelikhuijsen S G and Welch E W 2012 Developing and Testing a Theoretical Framework for Computer-Mediated Transparency of Local Gov-ernments Public Administration Review 78(1) pp 562-571 httpsdoiorg 10230741506806
31 Groff J and Pitman M 2004 Municipal financial reporting on the World Wide Web A survey of financial data displayed on the official websites of the 100 largest US municipalities Journal of Government Financial Manage-ment 53(2) pp 20-30
32 Guillamoacuten M-D Bastida F and Benito B 2011 The Determinants of Local Governmentrsquos Financial Transparency Local Government Studies 37(4) pp 391-406 httpsdoiorg101080030039302011588704
33 Hollyer J R Rosendorff B and Vreeland J R 2011 Democracy and trans-parency Journal of Politics 73(4) pp 1191-1205 httpsdoiorg101017S0022381611000880
34 IMF 1997 World Economic Outlook Washington International Monetary Fund Available at lthttpswwwimforgexternalpubsftweoweo1097pdfoctweo01pdfgt
35 IMF 1998 Code of Good Practices on Fiscal Transparency minus Declaration on Principles Washington International Monetary Fund Available at lthttpswwwimforgexternalpubsfthistory2012pdf4dpdfgt
36 IMF 2012 Fiscal Transparency Accountability and Risk Washington Inter-national Monetary Fund Available at lthttpswwwimforgexternalnpppeng2012080712pdfgt
37 Ingram R W 1984 Economic Incentives and the Choice of State Govern-ment Accounting Practices Journal of Accounting Research 22(1) pp 126-144 httpsdoiorg1023072490704
38 Khazanchi D 1995 Unethical behavior in information systems The gender factor Journal of Business Ethics 14(9) pp 741-749 httpsdoiorg101007BF00872327
39 Kopits G and Craig J 1998 Transparency in government operations IMF Occasional Papers No 158 Available at lthttpswwwimforgexternalpubsftop158op158pdfgt
40 Krishnan G V and Parsons L M 2008 Getting to the bottom line An exploration of gender and earnings quality Journal of Business Ethics 78(1-2) pp 65-76 httpsdoiorg101007s10551-006-9314-z
br
an
ko sta
nić
deter
min
an
ts of su
bn
ation
al b
ud
getfisc
al tr
an
spar
enc
y a rev
iew o
f empir
ica
l evid
enc
epu
blic sec
tor
eco
no
mic
s42 (4) 449-486 (2018)
48541 Laakso M and Taagepera R 1979 ldquoEffectiverdquo number of parties A Meas-ure with Application to West Europe Comparative Political Studies 12(1) pp 3-27 httpsdoiorg101177001041407901200101
42 Laswad F Fisher R and Oyelere P 2005 Determinants of voluntary Inter-net financial reporting by local government authorities Journal of Accounting and Public Policy 24(2) pp 101-121 httpsdoiorg101016jjaccpubpol 200412006
43 Lowatcharin G and Menifield C E 2015 Determinants of Internet-enabled Transparency at the Local Level State and Local Government Review 47(2) pp 102-115 httpsdoiorg1011770160323X15593384
44 Ma L and Wu J 2011 What Drives Fiscal Transparency Evidence from Provincial Governments in China 1st Global Conference on Transparency Research Rutgers University-Newark May 19-20 2011 httpsdoiorg 102139ssrn1807767
45 Michener G 2015 Why Policymakers Commit to Transparency Legitimacy Insurance Monitoring and the Importance of the News Media as Mediator Available at lthttpwwwfiscaltransparencynetresourcesfilesfiles2015070 2109pdfgt
46 Moon M J and Norris D F 2005 Does managerial orientation matter The adoption of reinventing government and e-government at the municipal level Information Systems Journal 15(1) pp 43-60 httpsdoiorg101111j1365- 2575200500185x
47 Moon M J 2002 The Evolution of E-Government among Municipalities Rhetoric or Reality Public Administration Review 62(4) pp 424-433 httpsdoiorg1011110033-335200196
48 Norris D F and Kraemer K L 1996 Mainframe and PC computing in American cities Myths and realities Public Administration Review 56(6) pp 568-576 httpsdoiorg102307977255
49 OECD 2002 OECD Best Practices for Budget Transparency OECD Journal on Budgeting 1 pp 7-14 httpsdoiorg101787budget-v1-art14-en
50 Pina V Torres L and Royo S 2010 Is E-Government Leading To More Accountable and Transparent Local Governments an Overall View Finan-cial Accountability amp Management 26(1) pp 3-20 httpsdoiorg 101111j1468-0408200900488x
51 Piotrowski S J and Bertelli A 2010 Measuring Municipal Transparency 14th IRSPM Conference Bern Switzerland
52 Piotrowski S J and Vanr Ryzin G G 2007 Cittizens Attitudes Toward Transparency in Local Government The American Review of Public Adminis-tration 37(3) pp 306-323 httpsdoiorg10108009638180126794
53 Rodriacuteguez-Garcia M J 2015 Local womenrsquos coalitions Critical actors and substantive representation in Spanish municipalities European Journal of Womenrsquos Studies 22(2) pp 223-240 httpsdoiorg101177 1350506814549424
br
an
ko sta
nić
deter
min
an
ts of su
bn
ation
al b
ud
getfisc
al tr
an
spar
enc
y a rev
iew o
f empir
ica
l evid
enc
epu
blic sec
tor
eco
no
mic
s42 (4) 449-486 (2018)
486 54 Serrano-Cinca C Rueda-Tomaacutes M and Portillo-Tarragona P 2009 Fac-tors Influencing E-Disclosure in Local Public Administrations Environment and Planning C Government and Policy 27(2) pp 355-378 httpsdoiorg 101068c07116r
55 Smith A C and Taebel D A 1985 Administrative innovation in municipal government International Journal of Public Administration Routledge 7(2) pp 149-177 httpsdoiorg10108001900698508524487
56 Styles A K and Tennyson M 2007 The Accessibility of Financial Report-ing of US Municipalities on the Internet Journal of Public Budgeting Accounting amp Financial Management 19(1) pp 56-92
57 Tavares A F and da Cruz N F 2017 Explaining the transparency of local government websites through a political market framework Government Information Quarterly httpsdoiorg101016jgiq201708005
58 Vishwanath T and Kaufmann D 1999 Towards transparency in finance and governance Washington DC The World Bank
59 Wehner J and de Renzio P 2013 Citizens Legislators and Executive Dis-closure The Political Determinants of Fiscal Transparency World Develop-ment 41(1) pp 96-108 httpsdoiorg101016jworlddev201206005
60 Zimmerman J L 1977 The Municipal Accounting Maze An Analysis of Political Incentives Journal of Accounting Research 15 pp 107-144 httpdxdoiorg1023072490636
61 Zuccolotto R and Teixeira M A C 2014 The Causes of Fiscal Transpar-ency Evidence in the Brazilian States Revista Contabilidade amp Financcedilas 25(66) pp 242-254 httpsdoiorg1015901808-057x201410820
Working Together Integration Institutions and the Sustainable Development Goals World Public Sector Report 2018
UNITED NATIONSUnited Nations Department of Economic and Social Affairs New York 2018 pp 161
Book review by PREDRAG BEJAKOVIĆhttpsdoiorg103326pse4245
Received October 21 2018 Accepted November 7 2018
Predrag BEJAKOVIĆ PhDInstitute of Public Finance Smičiklasova 21 10000 Zagreb Croatiae-mail predragbejakovicijfhrORCiD 0000-0002-4164-8220
un
ited natio
ns
wo
rk
ing to
geth
er integ
ratio
n institu
tion
s an
d the su
stain
ab
le dev
elopm
ent g
oa
ls w
or
ld pub
lic secto
r repo
rt 2018
pub
lic secto
r ec
on
om
ics
42 (4) 487-494 (2018)
488 In the current world although there has been a significant progress in the reduc-tion of poverty and inequality a persistent problem is the lack of improvement in integration which causes social exclusion Furthermore modern economic devel-opment is often not sustainable of the long-term while institutions are not fully adapted to the needs of social challenges A newly published release by the United Nation World Public Sector Report 20181 using a holistic approach very nicely sheds light on the additional measures that are needed to the collaborative efforts of various stakeholders in the inclusion of those that are left out This excellent report was prepared by many authors using mixed methods that combined litera-ture reviews and expert contributions The team composed of United Nations per-sonnel was led by David Le Blanc under the responsibility of Marion Bartheacutelemy
The United Nations in 2016 adopted the 2030 Agenda for Sustainable Develop-ment (the successor to its Millennium Development Goals) which should elimi-nate poverty and achieve sustainable development by 2030 (Steven Pinker in Enlightenment Now states that not even Jesus was that optimistic he told the indig-nant disciples ldquoThe poor you will always have with yourdquo) The Agenda underlines the importance of the interlinkages and integrated nature of the sustainable devel-opment goals (SDGs) Achieving possible synergies and strengthening trade-offs between the sustainable development goals and targets will enable much easier achievement of the SDGs This should boost the allocation of resources and help avoid the adverse side effects of actions aiming to hasten progress in one area on the realisation of targets in other areas
One of the goals of the report is to present the positive experience of many coun-tries with the intention of transferring the best practice in policy integration for the attainment of SDGs The authors are fully aware that different types of existing interlinkages among the SDGs can be addressed and improved from an institu-tional perspective Thus the report aims to define areas where public institutions need to work more closely together the types of measures that can be involved in this process and the broader implications for and consequences of collaboration between public institutions and public service
Improving integration involves finding ways to strengthen cooperation and com-mon approaches among institutions at various levels dealing with closely interre-lated issues Policy integration comprises the management of crosscutting actions and measures in a policy-making process that transits the boundaries of estab-lished policy fields Such measures very often do not correspond to the institu-tional responsibilities of individual units and departments
In the modern literature the term integration is used in various slightly different meanings The most common usage defines integration as a dimension variable with policies in specific issue areas being more integrated than before Otherwise
1 The report is available at httpworkspaceunpanorgsitesInternetDocumentsUNPAN98152pdf
un
ited natio
ns
wo
rk
ing to
geth
er integ
ratio
n institu
tion
s an
d the su
stain
ab
le dev
elopm
ent g
oa
ls w
or
ld pub
lic secto
r repo
rt 2018
pub
lic secto
r ec
on
om
ics
42 (4) 487-494 (2018)489integration can be deemed as the more coherent process of defining and imple-
menting policy related to a specific issue Finally integration can also denote the ideal of policies that achieve a higher degree of coherence In this report the term integration is considered in a broad sense while the potential challenges short-comings and gains of integrated policy-making are clear The challenges in the past were the lack of political legitimacy of sustainable development as a para-digm and insufficient attention of various levels of government to the issue of sustainable development Shortcomings are an inability to mainstream sustainable development principles in the work of available institutions on one hand and resistance to achieve the degree of coordination among institutions that are needed for sustainable development on the other Gains of the integrated approach are socially superior solutions that cannot be achieved by focusing only on sector-specific policies and shared visions across sectors and various actors Positive changes in relevance and legitimacy are supported by progress in the scientific researchers that fully understand the interlinkages among sustainable develop-ment topics on the one hand as well as by the development of tools analytical methods and information systems that support integration of different stakehold-ers in public and private sector on the other
The report is organized around three broad principal questions First what are from the institutional perspective the challenges to and prospects for policy integration at various policy cycle phases at the national level Second are there any positive cases of institutional and administrative organisations that can support integrated approaches to the 2030 Agenda and if so what are they Finally what are the opportunities and challenges for public administration and public institutions to ensure integrated approaches in diverse SDG or groups of closely related goals
The report consists of two main parts In the first part chapter one explains the reasons and case for integration and introduces the methodological framework The second chapter focuses on horizontal integration chapter three on vertical integration while chapter four deals with successful engagement of stakeholders The second part of the publication applies the relevant framework of integrated approaches to international migration health and integration of peace security and development in post-conflict situations
Forms of integration are explained in chapter one The modern literature distin-guishes three dimensions of integration Horizontal integration encompasses inte-gration across sectors or institutions Vertical integration expresses how the actions of various (national and sub-national) levels of government can be adjusted to achieve coherent outcomes The third dimension is engagement of all stakeholders in the integrated realisation of shared objectives Taken together these three dimen-sions of integration encompass all the relevant categories proposed by the litera-ture primarily partnerships participation and coherence The approach and content of the initiatives can be formal or informal The latter refers to joint activities that involve various stakeholders from the non-state sector in addition to the whole of
un
ited natio
ns
wo
rk
ing to
geth
er integ
ratio
n institu
tion
s an
d the su
stain
ab
le dev
elopm
ent g
oa
ls w
or
ld pub
lic secto
r repo
rt 2018
pub
lic secto
r ec
on
om
ics
42 (4) 487-494 (2018)
490 government with the state usually having a coordinating role When analysing policy integration there is a need to consider different aspects like the institutional efforts made by governments to promote integrated policy-making and policy coherence activities related to collaboration and coordination and measures of achieved integration and policy coherence regarding achieved outcomes
As the SDGs makes high demands for horizontal integration on institutions at all levels chapter two analyses the importance of effective horizontal integration for the implementation of the SDGs Such integration is critical for resolving the interconnected nature of the SDGs including synergies and trade-offs across dif-ferent goals and targets It is however well known that overcoming sectoral boundaries in the attainment of horizontal integration is a demanding and complex task In such a process governments have concrete measures and opportunities to improve integration in their structures and processes A growing number of coun-tries around the world are including SDGs into their national policies and putting in place adequate institutional frameworks While some countries have given new mandates to existing mechanisms or institutions others are establishing new coor-dination bodies and mechanisms for the implementation of the SDGs Among many vital measures and instruments the five most important are examined The first are national strategies and plans because they define the overall direction and priorities The second is the budget process that helps in implementation and real-isation of national strategies at the level of programmes and activities The third group consists of public services responsible for the implementation of govern-ment actions on the SDGs This group has a critical role in achieving effective collaboration across institutions and sectors Monitoring evaluation and review processes for the SDGs are part of the fourth group that enables governments to assess progress in the activities of integration Finally different oversight institu-tions parliaments and Supreme Audit Institutions (SAIs) have a crucial role in insuring integration The report contains many examples of integration from dif-ferent countries so this chapter presents the experiences from the Sierra Leone implementation of the Agenda for Prosperity particularly the Poverty Reduction Strategy The Budget Statement nominates the responsible stakeholders and the scope of their reporting responsibilities on the SDGs within the various govern-ment ministries and offices where resources were allocated
The realisation of the SDGs requires the coordination of actions and measures of different levels of government There are many reasons for such coordination In most cases the achievement of specific targets in each national context depends on the aggregation of local and regional outcomes making coherent action a stip-ulation Vertical integration may be an important step in promoting a shared vision and commitment to sustainable development across levels It can enhance syner-gies and improve consistency across levels of government through mutually rein-forcing and supportive actions The third chapter examines current efforts in ensuring effective vertical policy integration during the implementation and fol-low-up and review of the SDGs Vertical integration enables an opportunity for
un
ited natio
ns
wo
rk
ing to
geth
er integ
ratio
n institu
tion
s an
d the su
stain
ab
le dev
elopm
ent g
oa
ls w
or
ld pub
lic secto
r repo
rt 2018
pub
lic secto
r ec
on
om
ics
42 (4) 487-494 (2018)491political dialogue among the various parts of government providing a possibility
to generate trust and a more long-term vision across the public sector The chapter analyses the potential benefits of vertical integration and some of its challenges and barriers It also studies approaches and tools that different countries have implemented with the goal of enhancing vertical integration at different stages of the policy process underlining innovative approaches and experiences Potential challenges to vertical integration include the gap between the abstract and univer-sal nature of SDGs and the specificity of local initiatives and policies unaware-ness of SDGs by local governments organizational cultural andor ideological differences between national and local governments institutional weaknesses or poor coordination mechanisms between the different levels of government Colombia can be mentioned as a positive example of successful and advanced vertical integration With support from the Colombian national government 32 departments and 31 capital cities have adopted and implemented local develop-ment plans that include SDG localized targets
The fourth chapter presents the adoption of mechanisms for efficient stakeholder engagement at both the systemic and the sector levels It also looks at how it can affect outcomes in terms of integration Many experiences have been observed regarding processes and mechanisms for stakeholder engagement in different sec-tors at different levels of decision-making and with various constituencies Hav-ing in mind such examples governments have become fully aware of the impor-tance of stakeholder engagement in order to strengthen ownership of the SDGs and ensure their successful implementation and monitoring at all levels Included stakeholders can enhance policy performance by helping in defining problems in ways that are more accurate They can also provide information and insights rele-vant for identifying policy solutions and evaluating the implementation process Enabling policy-making process to the inclusion and interaction with non-govern-mental actors helps governments better to understand peoplersquos needs and demands Furthermore non-governmental actors can be directly included in solving policy problems and contribute additional resources through the common generation of skills knowledge policy and technology Of course there are always some prob-lems and costs Wide stakeholder engagement usually takes time and can be an obstacle to the quick policy responses that some sustainable development chal-lenges may need While including the ideas and opinions of multiple stakeholders helps gain a more comprehensive and legitimate understanding of demanding pol-icy problems engagement can make it more difficult to reconcile divergent and even opposite views in commonly agreed policy solutions It seems that the com-bination of different engagement strategies and collaboration of multiple stake-holders is more effective for increasing responsiveness and accountability than the use of one single engagement mechanism The positive Finnish example of the government-led Finnish National Commission on Sustainable Development with many stakeholders included from public and private sector and civil society illus-trates a possible way of mobilizing non-state actors that is fully consistent with government actions for SDG implementation Investing time and resources in the
un
ited natio
ns
wo
rk
ing to
geth
er integ
ratio
n institu
tion
s an
d the su
stain
ab
le dev
elopm
ent g
oa
ls w
or
ld pub
lic secto
r repo
rt 2018
pub
lic secto
r ec
on
om
ics
42 (4) 487-494 (2018)
492 selection process and having clearly defined procedures and criteria for selecting stakeholders without doubt contribute to the effectiveness and efficiency of the engagement as well as its outputs and outcomes in terms of integration
Sustainable development demands policies that are systematically oriented towards the strengthening of linkages between different economic social and environmen-tal issues The fifth chapter shows how national public institutions and administra-tions have used integrated approaches to respond to the needs of migrants and refu-gees the flows of whom have been increasing across the world The way in which the multiple linkages between migration and the SDGs are transformed into national policies and realised in practice by public institutions and public adminis-tration reflects political processes of reconciling opposite opinions and demands of different stakeholders including governments civil society and migrants them-selves The authors examine how public institutions and different stakeholders can better support integrated approaches to migration How can they sustain the inte-gration of the mentioned approaches in sustainable development measures poli-cies and institutional processes Where and how can development policies make the most impact when it comes to serving those in the worst positions among inter-national migrants How can policy-makers and policy communities connect migra-tion and socio-economic development through innovative services No single model appears intrinsically better in terms of effective and efficient policy integra-tion Elements that might perhaps impact horizontal and vertical policy integration include the type of public administration system the level of decentralisation and local governance institutional capacity previous experience and institutionaliza-tion of cooperation between various bodies of government development of leader-ship prevalence of modern technology usage including the capability and vigour of communication platforms and finally the characteristics and the numbers of actors involved in policy-making Morocco is a positive example of a country that undertook several waves of regularization of migrants in an irregular situation fol-lowed by the opening of its public services to all migrants and refugees Migrants in an irregular situation have access to public health services and can send their children to public schools Additionally regular migrants can participate in profes-sional training and assistance with job search This chapter concludes with an important statement that integration of migration and development at all levels of public administration is not only a technical or rational process but also has to encompass cultural awareness politics and perceptions As migration and refugee issues are likely to remain a significant problem in the near future there is a need for the proposal and implementation of efficient awareness and communication strategies and accountability systems in public administration
Integrated approaches to health and well-being are the subject of analysis in the sixth chapter Health is a crucial human right and an important characteristic of personal well-being Health outcomes are impacted by many factors that are usu-ally outside the health sector itself At the national level a vast array of policies and institutional settings have been developed to support the multiple linkages
un
ited natio
ns
wo
rk
ing to
geth
er integ
ratio
n institu
tion
s an
d the su
stain
ab
le dev
elopm
ent g
oa
ls w
or
ld pub
lic secto
r repo
rt 2018
pub
lic secto
r ec
on
om
ics
42 (4) 487-494 (2018)493between health and other SDG areas with the intention to support integrated
approaches However researches show that the focus of many efforts at integrated health initiatives has largely remained within the health care sector itself Attempts at integration have been oriented to finding ways to enable non-health sectors and actors to serve the goals of the health sector without necessarily considering the impact of health on those sectors and their principal objectives Thus in many countries the potential of integrated approaches to achieve synergies and minimise trade-offs across sectors and government levels may remain often unused Univer-sal healthcare for all migrants in Thailand is mentioned as a positive experience of interlinkages of health with other sectors Migrants represent more than 6 percent of the Thai population It is currently the only country in the world where illegal migrants have the same health care rights as nationals
This very nice report finishes with chapter seven which deals with the implemen-tation of the SDGs in post-conflict situations and their implications for integrated approaches that enable improvements in sustainable development and peace Conflicts annually lower a countryrsquos gross domestic product growth on average by two percentage points Trends in the world show that the gap between conflict-affected countries and other developing states is widening Countries emerging from conflict are the ones where the SDGs probably may not be obtained without some radical and innovative departures An integrated context for SDG imple-mentation involves ensuring that interventions aimed at preserving peace (includ-ing protecting human rights) and development are interlinked and mutually rein-forcing As countries in post-conflict situations face many pressing problems for them the achievement of long-term development goals is much more difficult In the face of many short and long-term priorities efficient integrated approaches become even more important than in peaceful circumstances Post-conflict situa-tions mostly vary in the nature and degree of devastation but often there is a need to mitigate the consequences of substantial physical institutional and organiza-tional destruction Conflicts usually ruin national public administration and public institutions and they have to be rebuilt often from scratch Using recent examples the authors in this chapter explore how this can be done Sustainable development aspirations can be an inspiration for a common vision for the future Such a vision needs to be transformed into coherent and integrated national policies that are future-looking inclusive and endorse partnership between the government and society and support by various stakeholders The policy integration and inclusion in Colombia achieved by the National Development Plan are provided as an example The Colombian government made efforts to provide an inclusive plat-form for policy-making at the local level giving a voice to earlier marginalized groups and supporting their participation in local elections as candidates The government also established the legal and institutional architecture for a territorial peacebuilding process The coordination between central and local levels of gov-ernment was achieved through the Inter-institutional Post-conflict Council
un
ited natio
ns
wo
rk
ing to
geth
er integ
ratio
n institu
tion
s an
d the su
stain
ab
le dev
elopm
ent g
oa
ls w
or
ld pub
lic secto
r repo
rt 2018
pub
lic secto
r ec
on
om
ics
42 (4) 487-494 (2018)
494 The report presents country efforts to foster policy integration for SDGs It pro-vides examples of measures and ways by which linkages among SDGs can be achieved from an institutional perspective and underlines the importance of inte-gration challenges and opportunities for public institutions and public administra-tion This interesting and valuable report also explains the role and importance of budgets in tracking support to specific goals The reader can only enjoy the final product and the incredible richness of the additional (more than 500) sources used in the preparation of the report

vla
dim
ir ar
ča
bić
fisca
l co
nv
erg
enc
e an
d susta
ina
bility in th
e eur
opea
n un
ion
pub
lic secto
r ec
on
om
ics
42 (4) 353-380 (2018)355fiscal divergence It seems that the observed period plays an important role Earlier
research finds some evidence of fiscal convergence in the period from the late 1960s to the early 2000s (De Bandt and Mongelli 2000 and Delgado 2006) while more recent studies such as Kočenda Kutan and Yigit (2008) show the lack of it in the period from 1995 to 2005 The mentioned papers measure convergence using the popular β- and α-convergence tests as well as cointegration tests in a time series framework
The literature does not tackle the issue of convergence clubs regarding fiscal pol-icy However the idea of convergence clubs is implicitly included in discussions on the EU core and periphery or on the two-speed Europe idea popularized by Blanchard (2010) which argues that different groups of European countries show faster and slower recoveries after the Great Recession Accordingly fiscal conver-gence and the possibility of convergence clubs are important issues for EU poli-cymakers This paper analyzes both absolute convergence and club convergence Instead of grouping countries according to ad-hoc criteria such as geographical location or EU accession date we determine convergence clubs endogenously
We also analyze fiscal sustainability within the clubs and in the whole EU 28 using a policy response function proposed by Bohn (1998 2007) Fiscal policy is sustainable if the primary government surplus increases as a response to the increase in public debt This is considered responsible and sustainable behavior because the government increases its revenue or decreases spending when faced with a higher public debt Bohn (1998 2005) concludes that US fiscal policy is sustainable Cassou Shadmani and Vaacutezquez (2017) refine this finding by showing that the US fiscal policy is sustainable only during good economic times but not in times of economic distress
The research regarding European fiscal policy is somewhat different Collignon (2012) develops a policy response function to analyze European fiscal sustainabil-ity His policy response function is adjusted to EU fiscal rules looking at the pri-mary surplus response to changes in debt and deficit Results indicate that Euro-pean fiscal policy is sustainable in this respect but conditions on financial markets and the risk of financial contagion can make it insufficient as shown by the Greek crisis Research has also focused on the cyclical behavior of fiscal policy The common understanding is that fiscal policy should be countercyclical higher gov-ernment spending in recessions followed by fiscal consolidation in expansions to smooth business cycles The countercyclical fiscal policy is sustainable in the long run when extra deficits accumulated in recessions are compensated for during times of economic growth Balassone Francese and Zotteri (2010) show that budget balance in fourteen EU countries deteriorates during recessions but does not improve to the same extent during expansions Government expenditures are responsible for the asymmetry
vla
dim
ir ar
ča
bić
fisca
l co
nv
erg
enc
e an
d susta
ina
bility in th
e eur
opea
n un
ion
pub
lic secto
r ec
on
om
ics
42 (4) 353-380 (2018)
356 Public debt sustainability has been widely analyzed for individual countries as well Babić (2003) and Mihaljek (2004) analyze the sustainability of public and external debt in Croatia This early analysis1 concluded that Croatian public debt is not too sensitive to the various shocks analyzed but credit rating and interest rate spread in Croatia are worse than those of central European countries Deskar-Škrbić and Šimović (2017) on the other hand showed that public debt level affects the effectiveness of fiscal spending by reducing the size of fiscal effects in Croatia
This paper contributes to the literature by analyzing absolute fiscal convergence and convergence clubs using quarterly data for government debt revenues and expenditures in EU member states from 20001 to 20172 We test convergence using a log t test proposed by Phillips and Sul (2007 2009) accompanied with the clustering algorithm for endogenous club classification Commonly used β- and σ-convergence tests might be biased and suffer from low power as noted in Ber-nard and Durlauf (1995 1996) among others Such tests assume linear dynamics in the convergence process Phillips and Sulrsquos (2007) log t test is based on a non-linear dynamic factor model which allows a nonlinear adjustment in parameters both over time and across different countries Therefore it is suitable in testing for convergence We check the robustness of our results by applying recently devel-oped unit root tests which control for both sharp and smooth structural breaks
The paper also contributes to the fiscal policy sustainability literature We use a policy response function proposed by Bohn (1998) in a panel framework where the primary government surplus is a function of public debt and the output gap We use a dynamic panel model and include a lagged dependent variable in the equation since there is a strong inter-temporal relationship between the govern-ment surplus and public debt Furthermore EU countries are somewhat homoge-nous and therefore there is a possibility of cross-sectional dependence Unlike the previous literature we use a dynamic panel system GMM estimator with common correlated effects proposed by Pesaran (2006) which controls for pronounced homogeneity among the EU countries
The main findings can be summarized as follows There is strong and robust evi-dence of absolute divergence in government debt revenues and expenditures among the EU countries The process of divergence was intensified during the sovereign debt crisis and the Great Recession However we find two three and four endogenous convergence clubs in government debt revenue and expendi-tures respectively The clubs are found to be quite heterogeneous club members do not share the usual geographical political or development similarities On the other hand groups of EU-15 and EU-13 countries as well as EU core and EU periphery countries are shown to diverge which suggests an important difference between endogenous and exogenous groupings
1 1997-2003 period is considered
vla
dim
ir ar
ča
bić
fisca
l co
nv
erg
enc
e an
d susta
ina
bility in th
e eur
opea
n un
ion
pub
lic secto
r ec
on
om
ics
42 (4) 353-380 (2018)357Fiscal policy is found to be unsustainable but countercyclical both in the EU as a
whole and within identified convergence clubs Our model does not show an increase in the primary surplus after debt upsurge which is identified as unsus-tainable behavior We find only limited evidence of fiscal sustainability in the EU-13 group and in a subsample with public debt higher than 90 On the other hand fiscal policy in the EU is countercyclical indicating the efforts of fiscal policy to smooth business cycles
The paper is structured as follows Section 2 explains and presents the data It describes empirical methods used in the paper namely log t test and the clustering algorithm for club convergence analysis unit root tests with structural breaks and the dynamic panel model used for the sustainability analysis Section 3 presents results on fiscal convergence and sustainability while section 4 concludes
2 data and methodology21 dataFor convergence analysis we use quarterly general government debt revenues and expenditures in a percent of GDP as our key variables Variables in current prices are divided by nominal GDP and expressed in real terms as a percent of GDP The data span from 2000q1 to 2017q2 which is the longest available period for a balanced panel for 28 EU countries For the sustainability analysis we use primary surplus public debt and the output gap data but the sample starts in 2002q1 because of the availability of primary surplus data The primary sur-plus is calculated as total surplus plus payable interest and it is expressed as a percent of GDP Public debt is expressed as a percent of GDP as well The output gap is a percent deviation of GDP from its long-run trend computed using the Hodrick and Prescott (1997) filter
All variables are seasonally adjusted using Census X11 method for Census Bureaursquos X12-ARIMA program Data are collected primarily from the Eurostat and International Financial Statistics (IFS) database For Croatia we use central government revenues and expenditures provided by the Croatian National Bank as a proxy for general government For some countries we had to reconstruct data from different sources to work with balanced panels for the analysis Details on data construction are explained in appendix Appendix also plots series of govern-ment debt revenues expenditures and primary surplus as a percent of GDP and presents basic descriptive statistics
22 the log t conVergence test and club conVergenceWe use the log t test for convergence analysis of government debt revenues and expenditures as well as for analysis of convergence clubs The test was developed by Phillips and Sul (2007 2009) who built on a neoclassical growth model with heterogeneous technology and looked for the output convergence Intuitively the test looks at cross-sectional dispersion over time If the dispersion decays over time countries are becoming more similar ie there is convergence Phillips and
vla
dim
ir ar
ča
bić
fisca
l co
nv
erg
enc
e an
d susta
ina
bility in th
e eur
opea
n un
ion
pub
lic secto
r ec
on
om
ics
42 (4) 353-380 (2018)
358 Sul (2009) introduced three sets of tools relative transition curves log t test and the clustering algorithm for testing club convergence
Allowing for a heterogeneous technology in a growth model is important because countries experience different growth paths Such a framework is reasonable for studying fiscal convergence in the EU as well because countries have both a com-mon part such as institutions and policies and an idiosyncratic part which is country-specific
Consider a neoclassical growth model with the heterogeneous technology used in Phillips and Sul (2009)
(1)
where yit is output per capita ỹi0 and ỹi are initial and steady-state levels of output
per capita respectively and Ai0 represents the initial level of technology Hetero-geneity is allowed through the convergence parameter βit and the output growth rate git since both can vary over time and across countries The model can be rewritten to show a common and country-specific component We simplify the equation (1) as log yit = ait + git t where the term ait collects all RHS variables except git t Than the model can be written as a dynamic factor model
(2)
In this dynamic factor model μt is a common component The coefficient bit explains how individual countries relate to the common component μt In this paper the focus is on fiscal convergence Instead of looking at output per capita we consider convergence in government debt revenues and expenditures The common com-ponent μt in that case are EU institutions integration process andor common policies while bit represents a share of a common trend for each EU member state
Coefficients bit could be empirically analyzed using relative transition curves hit which are simply the relative departure of country i from the average or
(3)
where xit are series on government debt revenue or expenditures2 We remove the cyclical component from the time series as suggested by Phillips and Sul (2009) by using the Hodrick and Prescott (1997) filter but the results are not very sensi-tive to cyclical smoothing Convergence is evident when hit curves for all coun-tries approach 1
2 For each variable we run a separate test
vla
dim
ir ar
ča
bić
fisca
l co
nv
erg
enc
e an
d susta
ina
bility in th
e eur
opea
n un
ion
pub
lic secto
r ec
on
om
ics
42 (4) 353-380 (2018)359The log t test is a more formal way for testing convergence The test builds on
relative transition curves and has the following form
(4)
where is a quadratic distance measure which goes to 0 when countries converge t = T0 T where T0 is the first observation after we discard the initial 30 of observations as suggested by Phillips and Sul (2009) Second term on LHS is a penalty function which improves test performance and ut is an iid error Convergence is tested with the coefficient γ When γ is negative and statistically significant we can conclude that countries diverge If 0 le γ lt 2 we can conclude there is a conditional convergence in growth rates For absolute convergence to hold γ ge 23 The critical value at 5 level significance is 165
Phillips and Sul (2007 2009) also developed a clustering algorithm for detecting endogenous convergence clubs based on the log t regression If the convergence hypothesis is rejected for the full sample club convergence can be considered The clustering algorithm has four steps Simplified in the first step we sort coun-tries in the panel and in the second step we form a core group of k countries where k lt N for which the log t regression yields the highest t-statistics4 The remaining N ndash k countries form a complementary group In the third step we add one country at the time from the complementary to the core group and for each we apply the log t test If t gt -165 the new country is added to the core group The first convergence club is obtained after all countries that satisfy the condition are added In the fourth step we apply the log t test on the group of remaining coun-tries which are not a part of the first convergence club If the t-statistic is greater than -165 the second convergence club is identified If not we repeat steps (1) to (3) on the group of remaining countries to identify other possible convergence clubs
To obtain as few clubs as possible we run separate tests for club merging Once initial clubs are identified we run the log t test on them If convergence hypothesis is not rejected for club 1 and club 2 we merge them and form a new club 1 New club 1 is then tested for merging with club 3 and so on The advantage of this procedure is that it produces fewer convergence clubs but the downside is that the evidence for convergence is less convincing because the t-statistic on the γ coef-ficient is usually insignificant
23 unIt root tests for conVergenceWe use different unit root tests for convergence analysis within identified clubs to check the robustness of our results We test for convergence in government debt revenues and expenditures both in the full sample of EU 28 and in each identified convergence club Following the approach of Bernard and Durlauf (1995) and
3 Phillips and Sul (2007 2009) provide more technical details of the test For empirical analysis we use a set of procedures described in Du (2017)4 To form a group the t-statistic for parameter γ from log t regression must be t gt -165
vla
dim
ir ar
ča
bić
fisca
l co
nv
erg
enc
e an
d susta
ina
bility in th
e eur
opea
n un
ion
pub
lic secto
r ec
on
om
ics
42 (4) 353-380 (2018)
360 Pesaran (2007) we compute a difference between country i and the average which we test for the unit root xit = xit ndash xt (5)
where xit represents government debt revenues or expenditures in country i and xt is an adjusted average excluding country i under consideration The adjusted average should prevent a bias in testing which could be large for big countries such as Germany
If the difference series xit is stationary then there is convergence in government debt revenues or expenditures Shocks to an individual countryrsquos fiscal variables may be permanent or temporary but all shocks to the difference series xit should be only temporary if country i converges to the average Rejection of unit root is evidence of convergence If our results are robust rejections should be higher within identified clubs than in the full sample of EU 28
We apply unit root tests developed by Lee and Strazicich (2003) and Enders and Lee (2012) that can control for structural breaks Structural breaks are highly pos-sible in government debt revenues and expenditures time series since they include the period of the sovereign debt crisis and the Great Recession in the EU Ignoring structural breaks might be a serious problem that reduces the power of the test as argued in Perron (1989) We also present results of a standard ADF test which does not control for structural breaks Intuitively structural breaks are abrupt changes in the data such as the Great Recession It is possible that the con-vergence was present both before and after the break but the existence of the break violates our conclusions
The Lee and Strazicich (2003) unit root test controls for two sharp breaks in the data It is a Lagrange Multiplier (LM) test with the equation
∆ xt = δʹ∆ Zt + ϕ Stndash1 + εt (6)
where St is a detrended xt series and ϕ is a coefficient of interest Under the null hypothesis of unit root ϕ = 0 and the rejection of unit root implies convergence
We use the so-called break model which allows for two breaks in both level and the trend of the series using dummy variable vector Zt = [1 t D1t D2t DT1t DT2t] Dummy variables D1t and D2t control for breaks in level and take value 1 if t ge TBj + 1 and 0 otherwise for breaks j = 1 2 where TBj are break locations On the other hand dummy variables DT1t and DT2t control for breaks in the trend where DTjt = t ndash TBj for t ge TBj + 1 and 0 otherwise for breaks j = 1 2 Break locations TB1 and TB2 are endogenously determined in a grid search which minimizes the t-sta-tistics of coefficient ϕ
Critical values for the LM test with two breaks in a level and the trend are taken from table 2 of Lee and Strazicich (2003) Number of lags in the equation (6) is chosen based on general to specific procedure
vla
dim
ir ar
ča
bić
fisca
l co
nv
erg
enc
e an
d susta
ina
bility in th
e eur
opea
n un
ion
pub
lic secto
r ec
on
om
ics
42 (4) 353-380 (2018)361We also use the Enders and Lee (2012) unit root test which controls for an
unknown number of smooth structural transitions approximated by a flexible Fou-rier function The Fourier function has proved to accommodate smooth breaks very well there is no need for a grid search as in Lee and Strazicich (2003) test and the number of estimated parameters is relatively small so the test does not lose power The test equation is simple and can be estimated by OLS
∆ xt = c (t) + ϕ Stndash1 + εt (7)
where again St is detrended xt series and ϕ is a coefficient of interest The null hypothesis of unit root assumes ϕ = 0 and again a rejection of unit root implies convergence However equation (7) includes a time-dependent deterministic term c (t) which is approximated by a single frequency Fourier function of the form
(8)
where c0 c1 and c2 are coefficients estimated by OLS t is a current time period and T is a number of observations Note that the equation (8) nests a standard linear specification when c1 and c2 are equal to zero We run the model with a sin-gle frequency equal to one and with a number of lags chosen by general to spe-cific procedure Critical values are taken from Enders and Lee (2012) table 1
24 PolIcy resPonse functIon for the sustaInabIlIty analysIsWe analyze fiscal policy sustainability using a policy response function as sug-gested by Bohn (1998 2007)5 Our model can be written as
sit = ρ sitndash1 + β1 dit + β2 yit + εit (9)
Equation (9) is a dynamic panel version of Bohnrsquos policy response function where sit is the government primary surplus in country i at time t dit is public debt and yit is the output gap eit is the residual where eit = αit + εit and αi are country fixed effects The error term εit is independent or E[εit εjk] = 0 for each i j t and k where i ne j
Fiscal policy is sustainable when β1 is positive suggesting an increase in primary surplus as a response to higher public debt Such behavior is considered sustain-able and responsible because the government tends to increase its revenue or decrease spending as a response to higher debt
Bohn (1998) stressed the importance of controlling the model with the output gap Coefficient β2 next to the output gap also tells us if the fiscal policy is pro- or countercyclical When β2 lt 0 the positive output gap decreases government sur-
5 Bohn (2005 2007) criticize fiscal sustainability analysis based on unit root and cointegration techniques popularized by Trehan and Walsh (1988) and Hamilton and Flavin (1986) He argues that such techniques are not capable of rejecting sustainability hypothesis because the relevant debt variables are necessary stationary after a finite number of differencing and thus in compliance with the intertemporal budget constraint (IBC)
vla
dim
ir ar
ča
bić
fisca
l co
nv
erg
enc
e an
d susta
ina
bility in th
e eur
opea
n un
ion
pub
lic secto
r ec
on
om
ics
42 (4) 353-380 (2018)
362 plus and fiscal policy can be considered as procyclical and vice versa (Balassone Francese and Zotteri 2010)
Our model includes a richer dynamic than initially proposed in Bohn (1998) by including a lagged primary surplus (Cassou Shadmani and Vaacutezquez 2017) This specification is more appropriate because it allows for fiscal policy persistence and because of a possible feedback effect between public debt and surplus in a panel framework accumulated government deficits (negative surpluses) are closely related to public debt
The benchmark model is estimated by a system GMM augmented with common correlated effects (CCE) proposed by Pesaran (2006) to deal with cross-sectional dependence The system GMM estimator proposed by Arellano and Bover (1995) and Blundell and Bond (1998) is often used for dynamic panel estimation and we use their two-step procedure with robust standard errors where fixed effects are removed by first differencing6
Our panel consists of European Union countries which are somewhat homoge-nous in terms of common institutions and policies and therefore a cross-sectional dependence can be an important issue affecting our results7 To deal with the issue of cross-sectional dependence we augment the system GMM estimator by adding cross-sectional means of all variables as instruments in the model from the equa-tion (9) Common correlated effects procedure is proposed by Pesaran (2006) for a group of OLS estimators However we use this principle to augment system GMM estimator Pesaran (2006) showed that adding CCE has satisfactory small sample properties for relatively small N and T even in heterogeneous models We call this model system GMM-CCE model
We confirm the robustness of the benchmark model by estimating a dynamic panel model with fixed effects (FE) using robust errors Our data set is a balanced panel with a reasonably large T = 62 and therefore the FE estimator should not be biased We refer to this model simply as the FE model
3 fIscal conVergence and sustaInabIlIty31 conVergence clubsWe do not find any evidence to support the absolute convergence of government debt revenues and expenditures in the EU using relative transition curves and log t test The relative transition curves in figure 1 show lack of convergence because they do not approach 1 in the observed period By contrast curves are scattered equally at the beginning and the end of the sample
6 We use first differencing instead of forward orthogonal deviaton (FOD) because our data set is a balanced panel Refer to Arellano and Bover (1995) and Blundell and Bond (1998) for complete technical details7 Indeed when we apply Pesaran (2015) test for weak cross-sectional dependence to the model the null hypoth-esis of cross-sectional independence can be easily rejected
vla
dim
ir ar
ča
bić
fisca
l co
nv
erg
enc
e an
d susta
ina
bility in th
e eur
opea
n un
ion
pub
lic secto
r ec
on
om
ics
42 (4) 353-380 (2018)363Figure 1
Relative transition paths(a) Gov debt (b) Gov revenues
Estonia Estonia
BelgiumGreece
05
11
52
25
Rel
ativ
e tra
nsiti
on p
aram
eter
2000q3 2004q3 2008q3 2012q3 2016q3Quarter
Transition paths for government debt
Cyprus
Ireland
SwedenFinland
68
11
21
4R
elat
ive
trans
ition
par
amet
er
2000q3 2004q3 2008q3 2012q3 2016q3Quarter
Transition paths for government revenue
(c) Gov expenditures
Ireland
Ireland
Croatia France
68
11
21
4R
elat
ive
trans
ition
par
amet
er
2000q3 2004q3 2008q3 2012q3 2016q3Quarter
Transition paths for government expenditures
This is further supported by a more formal log t test presented in table 1 Table 1 shows γ coefficient from the log t regression applied to government debt (1a) rev-enues (1b) and expenditures (1c) data Again γ lt 0 implies divergence 0 le γ lt 2 is evidence of conditional convergence and γ ge 2 implies absolute convergence in levels Table 1 shows that γ coefficient is significantly negative (marked with an asterisk) when log t test is applied to all EU countries which rejects absolute con-vergence of government debt revenues and expenditures Kočenda Kutan and Yigit (2008) also find fiscal divergence in a form of pronounced level of heteroge-neity in public debt and deficit among EU member states
We also find that the Great Recession and sovereign debt crisis further increased fiscal divergence in the EU In figure 2 we show results of estimated rolling win-dow γ coefficient for government debt revenues and expenditures We estimate the log t regression with a centered rolling window of 20 quarters (five years) together with 95 confidence intervals For all three variables estimates are sig-nificantly negative throughout the observed period which further confirms the result of fiscal divergence An interesting finding is that the estimated γ further decreases from 2008 in the case of government revenues and expenditures and from 2011 in the case of government debt Therefore it could be argued that the Great Recession and sovereign debt crisis pushed the EU further away from fiscal convergence
vla
dim
ir ar
ča
bić
fisca
l co
nv
erg
enc
e an
d susta
ina
bility in th
e eur
opea
n un
ion
pub
lic secto
r ec
on
om
ics
42 (4) 353-380 (2018)
364 Table 1log t convergence test results and convergence clubs classification
(a) government debt convergence resultslog(t) All countriesγ -0253t-stat -2213Club classificationlog(t) Club 1 [19] Club 2 [9]γ -000900 0560t-stat -0686 6100(b) government revenues convergence resultslog(t) All countriesγ -0729t-stat -3334Club classificationlog(t) Club 1 [19] Club 2 [5] Club 3 [2] Club 4 [2]γ 000700 0792 0114 -3378t-stat 0527 2275 0395 -2779(c) government expenditures convergence resultslog(t) All countriesγ -1075t-stat -1068Club classificationlog(t) Club 1 [5] Club 2 [11] Club 3 [6] Club 4 [3] Club 5 [2]γ 0284 0264 0113 0851 -0125t-stat 1016 1605 8963 9936 -0154Final classificationlog(t) Club 1 [5] Club 2 [11] Club 3 [9] Club 4 [2]γ 0284 0264 0169 -0125t-stat 1016 1605 1493 -0154
Note The table presents γ coefficient from log t regression together with t-statistics Marks a rejection of convergence at 5 level Numbers in brackets are number of countries in the club Club classification is a result of the initial clustering algorithm Final classification is a result after club merging Final classification is presented only when club merging is signifi-cant Countries that form different clubs are presented in figure 3
However we find strong evidence of club convergence Convergence clubs are implicitly included in discussions about the EU core and periphery as well as in the idea of two-speed recovery in Europe popularized by Blanchard (2010) We use the clustering algorithm of Phillips and Sul (2007 2009) to determine conver-gence clubs endogenously Results are presented in table 1 under Club classifica-tion section Countries that form convergence clubs are shown in figure 3
Table 1a presents results for government debt We find two convergence clubs one containing 19 and the other 9 countries The γ coefficient is statistically zero in the first and positive but less than 2 in the second club which indicates condi-tional convergence of clubs Similarly for government revenues three conver-
vla
dim
ir ar
ča
bić
fisca
l co
nv
erg
enc
e an
d susta
ina
bility in th
e eur
opea
n un
ion
pub
lic secto
r ec
on
om
ics
42 (4) 353-380 (2018)365gence clubs emerged and club sizes are 19 5 and 3 (table 1b) Ireland and Roma-
nia form a divergence group since they do not converge to any club For govern-ment expenditures club classification finds five clubs in total plus Ireland as a divergent group However clubs 3 and 4 can be merged together according to log t test so the final classification shows four convergence clubs plus Ireland (table 1c) Club sizes are 5 11 9 and 2 for Clubs 1 2 3 and 4 respectively In each case 0 le γ lt 2 indicating conditional convergence
Figure 2Rolling window estimation of log t regression
(a) Gov debt (b) Gov revenues
-9-8
-7-6
-5
2005q1 2008q1 2011q1 2014q1 2017q1
Time2log t coefficient
-9-8
-7-6
2005q1 2008q1 2011q1 2014q1 2017q1
Time2log t coefficient
(c) Gov expenditures
-12
-1-8
-6-4
-2
2005q1 2008q1 2011q1 2014q1 2017q1
Time2log t coefficient
Identified clubs are heterogeneous in a sense that countries within a club do not share common geographical political or development similarities In figure 3 we show countries that form different clubs The first row of figure 3 shows clubs from 1 to 4 and divergent groups The first column indicates fiscal variables gov-ernment debt revenues and expenditures Convergence clubs are in squares while divergent groups are in circles For example government debt Club 1 includes Croatia Cyprus Estonia Hungary Lithuania Romania Slovakia and Slovenia which are new member states mostly small countries and most of them experienced the transition from centrally planned to market economy However Austria Belgium Finland France Greece Ireland Italy Portugal Spain Swe-den and the UK are also members of the same club (government debt Club 1) Similar diversity can be found within other clubs
vla
dim
ir ar
ča
bić
fisca
l co
nv
erg
enc
e an
d susta
ina
bility in th
e eur
opea
n un
ion
pub
lic secto
r ec
on
om
ics
42 (4) 353-380 (2018)
366 Figure 3Convergence clubs
Club 1 Club 2
Gov
exp
endi
ture
s G
ov r
even
ues
Gov
deb
t
Club 3 Club 4 Group
Austria Belgium CroatiaCyprus Estionia FinlandFrance Greece HungaryIreland Italy Lithuania
Portugal Romania Slovakia Slovenia Spain
Sweden UK
Bulgaria CzechRepublic Denmark
Germany LatviaLuxembourg Malta
NetherlandsPoland
CyprusMaltaPoland
Spain UK
Austria CroatiaCyprus EstoniaHungary Italy
Portugal Slovakia Slovenia Spain
Sweden
Bulgaria CzechRepublic GermanyLatvia LuxembourgMalta Netherlands
Poland UK
BulgariaLithuania Ireland
Romania
Ireland
LithuaniaRomania
Austria Belgium CroatiaCzech Republic DenmarkEstionia Finland France
Germany Greece HungaryItaly Latvia Luxembourg
Netherlands Portugal Slovakia Slovenia Sweden
BelgiumDenmark
Finland FranceGreece
Note Convergence clubs are in squares non-convergent groups are in circles
We find a substantial degree of homogeneity in government debt revenues and expenditures clubs For example government debt Club 1 and government reve-nues Club 1 share 12 of 19 countries (figure 3) All eleven countries in govern-ment expenditures Club 2 are also in government debt Club 1 There is a major overlap between government debt Club 2 and government expenditures Club 3 Other similarities can also be observed in figure 3 Therefore clubs are heteroge-neous within countries but homogenous in fiscal variables
Endogenously identified clubs indeed show evidence of convergence but this is not the case for ad-hoc exogenous clubs First we group countries into EU-15 and EU-13 and apply the log t regression to government debt revenues and expendi-tures data The results reject convergence in all cases except for government debt in EU-13 where the γ coefficient is statistically equal to zero (0042 with a t-sta-tistic of 134) Next we group countries into EU core and periphery8 and use the log t test Convergence is strongly rejected in both groups for all three fiscal vari-ables It seems that countries converge to some criteria other than simply geo-graphical political or development similarities or indeed multiple similarities9 These results could be compared with Kočenda Kutan and Yigit (2008) who ana-lyze fiscal convergence in the ten EU countries that joined EU in 2004 They do not find a systematic difference among all EU countries EU core and EU periph-ery when analyzing fiscal convergence Delgado (2006) uses cluster analysis to group EU countries thus avoiding ad-hoc exogenous clubs but the paper does not tackle the issue of fiscal club convergence
8 EU core countries are Austria Belgium Denmark Finland France Germany Luxembourg Netherlands Sweden and UK Other 18 countries form EU periphery9 Analysis of factors and criteria to which countries converge is beyond the scope of this paper
vla
dim
ir ar
ča
bić
fisca
l co
nv
erg
enc
e an
d susta
ina
bility in th
e eur
opea
n un
ion
pub
lic secto
r ec
on
om
ics
42 (4) 353-380 (2018)367The log t regression improves upon the standard β-convergence tests but results are
compatible with such tests In figure 4 we show a simple scatter plot of government debt level and a growth rate which is a version of an unconditional β-convergence test For government debt Clubs 1 and 2 we estimate the equation of the form log (dTi d1i) = α + β d1i + εi where the dependent variable is the debt growth rate between the last and the first period and the independent variable is a debt level in the first period Club 1 is depicted with black circles and Club 2 with grey pluses As shown in the figure 4 regression lines for each club are negatively sloped indi-cating convergence within clubs according to the standard β-convergence test
Figure 4β-convergence in clubs
-1-5
05
11
5
Deb
t gro
wth
0 1 2 3 4 5Debt level
Club 1 Club 2
Beta convergence among clubs
32 unIt root tests of fIscal conVergenceTable 2 presents results of fiscal convergence using unit root tests for the sample of 28 EU countries and within clubs identified by the clustering algorithm For the government debt data we analyze convergence to the average for the full sample of the EU 28 then for the 19 countries of convergence club 1 and then for the 9 countries of club 2 (table 2a) A similar analysis is done for government revenues and expenditure in table 2b and 2c respectively For each club we compute a separate adjusted average Unit root rejection rates at 10 significance level are presented for ADF Lee and Strazicich (2003) and Enders and Lee (2012) test Rejection of the unit root hypothesis is considered evidence of convergence
vla
dim
ir ar
ča
bić
fisca
l co
nv
erg
enc
e an
d susta
ina
bility in th
e eur
opea
n un
ion
pub
lic secto
r ec
on
om
ics
42 (4) 353-380 (2018)
368 Table 2Club convergence using unit root tests2a Percent of countries converging to the average gov debt ()
adf lee amp strazicich enders amp leeEU [28] 357 357 714Club 1 [19] 000 526 526Club 2 [9] 2222 000 000
2b Percent of countries converging to the average gov revenues ()adf lee amp strazicich enders amp lee
EU [28] 3571 8571 4643Club 1 [19] 4211 9474 5789Club 2 [5] 4000 10000 4000Club 3 [2] 000 10000 10000
2c Percent of countries converging to the average gov expenditures ()adf lee amp strazicich enders amp lee
EU [28] 3929 7857 4643Club 1 [5] 4000 10000 4000Club 2 [11] 5455 9091 8181Club 3 [9] 3333 7778 5556Club 4 [2] 10000 10000 10000
Notes Rejection rates of unit root hypothesis at 10 level of significance are reported in the table Number of countries in a club is in brackets The rejection rate is calculated as ( of rejections of countries within a club)times100
We find neither absolute nor club convergence in government debt data because the difference of government debt against the average is stationary for just a few countries For the full sample of EU 28 unit root rejection rates are only 35 in the case of ADF and the Lee and Strazicich test and 7 for the Enders and Lee test Rejection rates within two clubs are not much different thus not supporting club convergence of government debt
In the case of government revenues and expenditures we do not find evidence of absolute convergence but club convergence is supported Almost half of countries in the EU 28 sample converge to the average ADF test has low power in the pres-ence of structural breaks but the unit root is rejected in 35 to 40 of countries for both series The Enders and Lee test has more power and rejects the unit root in 46 of countries Finally the Lee and Strazicich test with sharp structural breaks shows the biggest rejection rates of 78 and 85 For both government revenues and expenditures rejection rates within clubs are higher than in the full sample of EU 28 indicating stronger convergence within clubs This is especially true for Lee and Strazicich (2003) test where rejection rates are mostly over 90 within clubs indicating strong club convergence Enders and Lee (2012) test has rejection rates within clubs well over 50 except in government revenues club 2 and government expenditures club 1 ADF test gives somewhat mixed results but does not reject the club convergence hypothesis This confirms that convergence clubs using the Phillips and Sul (2007 2009) clustering algorithm are robust
vla
dim
ir ar
ča
bić
fisca
l co
nv
erg
enc
e an
d susta
ina
bility in th
e eur
opea
n un
ion
pub
lic secto
r ec
on
om
ics
42 (4) 353-380 (2018)369except for government debt As a comparison De Bandt and Mongelli (2000) use
cointegration techniques to analyze fiscal convergence in the Eurozone Their findings support fiscal convergence in the Eurozone over the 1970-1998 period Unit root tests which allow for nonlinearities have recently been a more popular way of analyzing convergence (see Raguž Krištić Rogić Dumančić and Arčabić (2018) and references therein)
33 fIscal (un)sustaInabIlItyNext we analyze if fiscal policy is sustainable in the European Union and within convergence clubs found in the previous section In this respect we use the policy response function from equation (9) which relates primary government surplus with public debt and the output gap If surplus increases as a response to an increase in public debt fiscal policy is considered sustainable as discussed in the methodology section
We analyze fiscal sustainability using seven different models (subsamples) Model 1 is the benchmark model which includes 28 EU countries Models 2 and 3 include subsamples of countries from government debt convergence clubs identi-fied in the previous section The first club consists of 19 and the second of 9 countries10 Next we consider fiscal policy sustainability within exogenous clubs of EU-15 and EU-13 countries with Models 4 and 5 Finally Models 6 and 7 use subsamples with government debt ge 90 (Model 6) and debt lt 90 of GDP (Model 7) This subsample analysis is motivated by the influential paper of Rein-hart and Rogoff (2010) who argue that a public debt higher than 90 of GDP depresses economic growth Maastricht criteria also require government debt below 60 of GDP However EU countries fought with the Great Recession and the sovereign debt crisis which substantially increased the level of public debt in some countries Our data show that 15 out of 28 EU countries had a government debt higher than 60 of GDP in 2017Q2 Therefore such subsample analysis is interesting from both an academic and a policy perspective The 90 level of public debt can be considered as arbitrary especially since Arčabić et al (2018) show there is no single level of public debt associated with the decrease of GDP growth However in this paper we are only interested in fiscal sustainability
Fiscal policy is found to be unsustainable in the EU We present the results of system GMM-CCE and FE estimators in tables 3 and 4 respectively Different models are numbered in the first row of each table and independent variables are in the first column In table 3 the estimated coefficient β1 next to the government debt is negative or insignificant In other words the government does not increase primary surplus as a response of higher government debt and fiscal policy is not sustainable We find weak evidence of fiscal sustainability for the EU-13 group countries and for the subsample with debt ge 90 For these two models (Models
10 We consider government debt convergence clubs only but clubs are fairly homogeneous between fiscal variables as discussed In addition some government revenues and expenditures convergence clubs include only a few countries which is impractical for panel data analysis
vla
dim
ir ar
ča
bić
fisca
l co
nv
erg
enc
e an
d susta
ina
bility in th
e eur
opea
n un
ion
pub
lic secto
r ec
on
om
ics
42 (4) 353-380 (2018)
370 5 and 6) point estimates are positive with both system GMM-CCE and FE estima-tor However coefficients are insignificant for system GMM-CCE estimator and point estimates are small in magnitude in both cases (tables 3 and 4)
Fiscal policy is countercyclical in the EU and in all subsamples considered Balas-sone Francese and Zotteri (2010) and Cassou Shadmani and Vaacutezquez (2017) use β2 coefficient next to the output gap to analyze cyclicality of fiscal policy As pre-sented in tables 3 and 4 the coefficient next to output gap is positive and statisti-cally significant in all models11 Positive output gaps are related to an increase in primary surplus which can be interpreted as a countercyclical fiscal policy This indicates that fiscal policy in the European Union tries to smooth business cycles
Fiscal policy is fairly persistent because the coefficient ρ next to the lagged sur-plus is positive statistically significant and roughly 05
11 Only Model 6 in table 4 has a positive but insignificant output gap
vla
dim
ir ar
ča
bić
fisca
l co
nv
erg
enc
e an
d susta
ina
bility in th
e eur
opea
n un
ion
pub
lic secto
r ec
on
om
ics
42 (4) 353-380 (2018)371
Ta
bl
e 3
Resu
lts o
f fisc
al su
stai
nabi
lity
anal
ysis
usi
ng sy
stem
GM
M-C
CE
mod
el
mod
els
mod
el 1
ben
chm
ark
mod
el 2
clu
b 1
mod
el 3
clu
b 2
mod
el 4
eu
-15
mod
el 5
eu
-13
mod
el 6
deb
t ge 9
0m
odel
7d
ebt lt
90
Varia
bles
Surp
lus
Surp
lus
Surp
lus
Surp
lus
Surp
lus
Surp
lus
Surp
lus
Surp
lus (
lagg
ed) (
ρ)0
502
(0
08)
041
5
(00
9)0
390
(0
10)
054
7
(00
6)0
308
(0
11)
057
3
(02
1)0
526
(0
10)
Deb
t (β 1)
-00
18(0
01)
-00
09(0
01)
-00
43(0
12)
-00
29(0
02)
004
0(0
03)
003
6(0
08)
-00
57
(00
3)
Out
put G
ap (β
2)0
286
(0
05)
041
3
(00
7)0
435
(0
13)
039
4
(00
4)0
388
(0
15)
029
7
(00
9)0
305
(0
07)
Con
stan
t0
776
(07
6)0
122
(10
6)2
030
(56
3)1
879
(12
3)-2
351
(1
15)
-42
98(8
69)
245
9
(14
4)O
bser
vatio
ns1
708
115
954
991
579
328
11
427
Num
ber o
f cou
ntrie
s28
199
15
13
926
F-te
st0
340
e-06
000
139
02
43e-
05 0
003
520
of
inst
rum
ents
2314
1114
11
11
20H
anse
n te
st0
222
010
00
371
017
50
102
050
60
166
Not
e S
tand
ard
erro
rs in
par
enth
eses
and
m
ark
stat
istic
al s
igni
fican
ce a
t 1
5
and
10
leve
l M
odel
1 is
the
benc
hmar
k m
odel
Mod
els
2 an
d 3
incl
ude
coun
trie
s fro
m e
ndog
enou
s deb
t con
verg
ence
clu
bs 1
and
2 r
espe
ctiv
ely
Mod
els 4
and
5 in
clud
e EU
-15
and
EU-1
3 co
untr
ies
and
mod
els 6
and
7 in
clud
e su
bsam
ples
with
go
vern
men
t deb
t ge 9
0 a
nd d
ebt lt
90
of G
DP
resp
ectiv
ely
vla
dim
ir ar
ča
bić
fisca
l co
nv
erg
enc
e an
d susta
ina
bility in th
e eur
opea
n un
ion
pub
lic secto
r ec
on
om
ics
42 (4) 353-380 (2018)
372
Ta
bl
e 4
Resu
lts o
f fisc
al su
stai
nabi
lity
anal
ysis
usi
ng F
E m
odel
mod
els
mod
el 1
ben
chm
ark
mod
el 2
clu
b 1
mod
el 3
clu
b 2
mod
el 4
eu
-15
mod
el 5
eu
-13
mod
el 6
deb
t ge 9
0m
odel
7d
ebt lt
90
Varia
bles
Surp
lus
Surp
lus
Surp
lus
Surp
lus
Surp
lus
Surp
lus
Surp
lus
Surp
lus (
lagg
ed) (
ρ)0
512
(0
06)
051
5
(00
7)0
491
(0
12)
063
7
(00
4)0
336
(0
07)
024
8
(01
0)0
611
(0
09)
Deb
t (β 1)
000
6(0
01)
000
4(0
01)
002
5(0
02)
000
3(0
00)
002
9
(00
1)0
031
(0
01)
-00
09(0
01)
Out
put G
ap (β
2)0
176
(0
04)
017
2
(00
4)0
209
(0
09)
022
6
(00
3)0
197
(0
05)
021
3(0
12)
013
3
(00
4)
Con
stan
t-0
614
(0
36)
-07
13(0
42)
-09
98(0
71)
-03
27(0
35)
-18
31
(0
40)
-39
51
(14
8)0
168
(06
3)O
bser
vatio
ns1
708
115
954
991
579
328
11
427
R-s
quar
ed0
304
029
80
335
045
70
173
012
30
384
Num
ber o
f cou
ntrie
s28
199
1513
926
Not
e S
tand
ard
erro
rs in
par
enth
eses
and
m
ark
stat
istic
al s
igni
fican
ce a
t 1
5
and
10
leve
l M
odel
1 is
the
benc
hmar
k m
odel
Mod
els
2 an
d 3
incl
ude
coun
trie
s fro
m e
ndog
enou
s deb
t con
verg
ence
clu
bs 1
and
2 r
espe
ctiv
ely
Mod
els 4
and
5 in
clud
e EU
-15
and
EU-1
3 co
untr
ies
and
mod
els 6
and
7 in
clud
e su
bsam
ples
with
go
vern
men
t deb
t ge 9
0 a
nd d
ebt lt
90
of G
DP
resp
ectiv
ely
vla
dim
ir ar
ča
bić
fisca
l co
nv
erg
enc
e an
d susta
ina
bility in th
e eur
opea
n un
ion
pub
lic secto
r ec
on
om
ics
42 (4) 353-380 (2018)3734 conclusIon
The Great Recession and the sovereign debt crisis in the Eurozone have shaken fiscal policies in the EU Many European countries have breached public debt and deficit goals set by the Stability and Growth Pact Therefore the issue of fiscal policy convergence and sustainability is very important for the EU
This paper analyzes fiscal policy convergence and tests for fiscal sustainability in 28 EU countries using data on government debt revenues and expenditures We show absolute divergence in fiscal policies which was further increased by the Great Recession and the sovereign debt crisis However we find strong evidence of club convergence Club convergence is important to consider because the EU does not have a single fiscal policy and member state policies are heterogeneous In general convergence clubs are implicitly included in discussions on the EU core and periphery and in the two-speed recovery idea which argues that different groups (or clubs) of European countries are characterized by faster and slower recoveries from the recession We find two government debt convergence clubs three government revenue clubs and four government expenditure clubs Endog-enously identified clubs do not have simple geographical political or development similarities They are heterogeneous within countries but homogenous between fiscal variables Exogenous grouping of EU countries into EU-15 and EU-13 or into EU core and periphery does not show evidence of fiscal convergence Conver-gence clubs are related to multiple equilibriums within the EU which makes a single fiscal policy difficult to achieve More precise fiscal rules could be consid-ered by policymakers together with corrective measures such as the Excessive Deficit Procedure Fiscal rules instead of discretionary decision making might be a step toward similar fiscal policies and fiscal convergence in the EU
Fiscal policy in the EU is found to be unsustainable but countercyclical We use a policy response function for the sustainability analysis where primary surplus is a function of government debt and the output gap We show that surplus does not respond to an increase in government debt which cannot be interpreted as sustain-able However primary government surplus increases in expansions and decreases in recession thus being countercyclical and aimed at smoothing business cycles In this respect the fiscal goals for public debt and deficit set by the Stability and Growth Pact may not be enough to ensure fiscal sustainability More precise fiscal rules together with corrective measures would be helpful for both fiscal sustaina-bility and convergence
disclosure statement No potential conflict of interest was reported by the author
vla
dim
ir ar
ča
bić
fisca
l co
nv
erg
enc
e an
d susta
ina
bility in th
e eur
opea
n un
ion
pub
lic secto
r ec
on
om
ics
42 (4) 353-380 (2018)
374 aPPendIX
data constructIon and sourcesFor the convergence analysis we use data on general government debt revenues and expenditures Variables are in millions of euro current prices We divide all by nominal GDP to express fiscal variables in real terms and in a percent of GDP The main data source is Eurostat and the International Financial Statistics data-base from the International Monetary Fund All data span the period from 2000q1 to 2017q2 but some data have been reconstructed For Germany Estonia Ire-land and Luxemburg we interpolate annual data for 2000 and 2001 since quar-terly data start from 2002q1 For Austria we interpolate annual data for 2000 since quarterly data start from 2001q1 For Croatia we reconstruct monthly data on central government expenditure and revenue based on the old methodology The data are provided by Croatian National Bank (CNB) and we use central gov-ernment data as a proxy for the general government Nominal GDP is taken from the Eurostat database except for Croatia Malta and Poland for which we take the data from IFS Public debt data are entirely taken from the Eurostat database Public debt is usually expressed as a percent of GDP on annual bases Therefore public debt is divided by a sum of GDP in a current and previous three quarters or where dt is public debt in a percent of GDP $dt and $yt are nominal debt and GDP in millions of euro We use this approach for the sustainability analysis when the sample starts in 2002q1 For the convergence analysis where the sample starts in 2000q1 we divide public debt only by current quarter GDP to maximize number of observations or dt = ($dt $yt ) times 100 For the sustainability analysis we also use primary surplus and real GDP data from Euro-stat All the data span the period from 2002q1 to 2017q2 (balanced panel) Below we plot time series of government revenues and expenditures (figure A1) and primary surplus and government debt (figure A2) in a percent of GDP Table A1 contains basic descriptive statistics
vla
dim
ir ar
ča
bić
fisca
l co
nv
erg
enc
e an
d susta
ina
bility in th
e eur
opea
n un
ion
pub
lic secto
r ec
on
om
ics
42 (4) 353-380 (2018)375
Fig
ur
e a
1G
over
nmen
t rev
enue
s and
exp
endi
ture
s as a
per
cent
of G
DP
Rev
enue
sEx
pend
iture
s
BE
L
2000
2002
2004
2006
2008
2010
2012
2014
2017
046
048
050
052
054
056
058
060
BU
L
2000
2002
2004
2006
2008
2010
2012
2014
2017
027
50
300
032
50
350
037
50
400
042
50
450
047
5C
ZE
2000
2002
2004
2006
2008
2010
2012
2014
2017
035
040
045
050
055
060
065
DE
N
2000
2002
2004
2006
2008
2010
2012
2014
2017
048
050
052
054
056
058
060
GE
R
2000
2002
2004
2006
2008
2010
2012
2014
2017
040
042
044
046
048
050
052
EST
2000
2002
2004
2006
2008
2010
2012
2014
2017
030
00
325
035
00
375
040
00
425
045
00
475
050
00
525
IRE
2000
2002
2004
2006
2008
2010
2012
2014
2017
02
03
04
05
06
07
08
GR
E
2000
2002
2004
2006
2008
2010
2012
2014
2017
035
040
045
050
055
060
065
070
075
080
SPA
2000
2002
2004
2006
2008
2010
2012
2014
2017
032
50
350
037
50
400
042
50
450
047
50
500
052
5FR
A
2000
2002
2004
2006
2008
2010
2012
2014
2017
048
050
052
054
056
058
CR
O
2000
2002
2004
2006
2008
2010
2012
2014
2017
035
040
045
050
055
060
065
ITA
2000
2002
2004
2006
2008
2010
2012
2014
2017
040
042
044
046
048
050
052
CY
P
2000
2002
2004
2006
2008
2010
2012
2014
2017
03
04
05
06
07
08
LA
T
2000
2002
2004
2006
2008
2010
2012
2014
2017
030
00
325
035
00
375
040
00
425
045
00
475
LIT
2000
2002
2004
2006
2008
2010
2012
2014
2017
030
00
325
035
00
375
040
00
425
045
00
475
050
00
525
LU
X
2000
2002
2004
2006
2008
2010
2012
2014
2017
032
50
350
037
50
400
042
50
450
047
5H
UN
2000
2002
2004
2006
2008
2010
2012
2014
2017
040
042
044
046
048
050
052
054
056
MA
L
2000
2002
2004
2006
2008
2010
2012
2014
2017
030
035
040
045
050
055
NE
T
2000
2002
2004
2006
2008
2010
2012
2014
2017
038
040
042
044
046
048
050
AU
S
2000
2002
2004
2006
2008
2010
2012
2014
2017
042
50
450
047
50
500
052
50
550
057
50
600
POL
2000
2002
2004
2006
2008
2010
2012
2014
2017
036
038
040
042
044
046
048
POR
2000
2002
2004
2006
2008
2010
2012
2014
2017
035
040
045
050
055
060
065
RO
M
2000
2002
2004
2006
2008
2010
2012
2014
2017
027
50
300
032
50
350
037
50
400
042
50
450
SLO
2000
2002
2004
2006
2008
2010
2012
2014
2017
040
045
050
055
060
065
070
075
080
085
SVK
2000
2002
2004
2006
2008
2010
2012
2014
2017
032
50
350
037
50
400
042
50
450
047
50
500
052
50
550
FIN
2000
2002
2004
2006
2008
2010
2012
2014
2017
046
048
050
052
054
056
058
060
SWE
2000
2002
2004
2006
2008
2010
2012
2014
2017
048
050
052
054
056
058
UK
2000
2002
2004
2006
2008
2010
2012
2014
2017
034
036
038
040
042
044
046
048
050
vla
dim
ir ar
ča
bić
fisca
l co
nv
erg
enc
e an
d susta
ina
bility in th
e eur
opea
n un
ion
pub
lic secto
r ec
on
om
ics
42 (4) 353-380 (2018)
376
Fig
ur
e a
2Pr
imar
y su
rplu
s and
gov
ernm
ent d
ebt a
s a p
erce
nt o
f GD
P B
EL
2002
2004
2006
2008
2010
2012
2014
2017
-75
-50
-2500
25
50
75
875
900
925
950
975
100
010
25
105
010
75
110
0B
UL
2002
2004
2006
2008
2010
2012
2014
2017
-12
5-1
00
-75
-50
-2500
25
50
75
100
10203040506070C
ZE
2002
2004
2006
2008
2010
2012
2014
2017
-12
-10-8-6-4-2024
250
275
300
325
350
375
400
425
450
475
DE
N
2002
2004
2006
2008
2010
2012
2014
2017
-4-202468
2025303540455055G
ER
2002
2004
2006
2008
2010
2012
2014
2017
-6-4-2024
55606570758085
EST
2002
2004
2006
2008
2010
2012
2014
2017
-8-6-4-202468
34567891011IR
E
2002
2004
2006
2008
2010
2012
2014
2017
-50
-40
-30
-20
-10010
20406080100
120
140
GR
E
2002
2004
2006
2008
2010
2012
2014
2017
-30
-25
-20
-15
-10-50510
100
110
120
130
140
150
160
170
180
190
SPA
2002
2004
2006
2008
2010
2012
2014
2017
-12
-10-8-6-4-20246
30405060708090100
110
FRA
2002
2004
2006
2008
2010
2012
2014
2017
-6-5-4-3-2-101
556065707580859095100
CR
O
2002
2004
2006
2008
2010
2012
2014
2017
-6-4-20246
30405060708090IT
A
2002
2004
2006
2008
2010
2012
2014
2017
-2-1012345
100
105
110
115
120
125
130
135
CY
P
2002
2004
2006
2008
2010
2012
2014
2017
-35
-30
-25
-20
-15
-10-50510
405060708090100
110
LA
T
2002
2004
2006
2008
2010
2012
2014
2017
-10-8-6-4-2024
5101520253035404550L
IT
2002
2004
2006
2008
2010
2012
2014
2017
-20
-15
-10-505
1015202530354045
LU
X
2002
2004
2006
2008
2010
2012
2014
2017
-4-20246
51015202530H
UN
2002
2004
2006
2008
2010
2012
2014
2017
-12
5-1
00
-75
-50
-2500
25
50
75
5055606570758085M
AL
2002
2004
2006
2008
2010
2012
2014
2017
-15
0-1
25
-10
0-7
5-5
0-2
500
25
50
75
550
575
600
625
650
675
700
725
NE
T
2002
2004
2006
2008
2010
2012
2014
2017
-5-4-3-2-101234
40455055606570A
US
2002
2004
2006
2008
2010
2012
2014
2017
-8-6-4-2024
60657075808590
POL
2002
2004
2006
2008
2010
2012
2014
2017
-7-6-5-4-3-2-1012
350
375
400
425
450
475
500
525
550
575
POR
2002
2004
2006
2008
2010
2012
2014
2017
-15
-10-50510
5060708090100
110
120
130
140
RO
M
2002
2004
2006
2008
2010
2012
2014
2017
-10
0-7
5-5
0-2
500
25
50
10152025303540SL
O
2002
2004
2006
2008
2010
2012
2014
2017
-35
-30
-25
-20
-15
-10-505
2030405060708090SV
K
2002
2004
2006
2008
2010
2012
2014
2017
-8-6-4-202
2530354045505560
FIN
2002
2004
2006
2008
2010
2012
2014
2017
-4-20246810
253035404550556065SW
E
2002
2004
2006
2008
2010
2012
2014
2017
-2-10123456
303540455055U
K
2002
2004
2006
2008
2010
2012
2014
2017
-10-8-6-4-202
30405060708090100
Prim
ary
surp
lus
Publ
ic d
ebt (
right
axi
s)
vla
dim
ir ar
ča
bić
fisca
l co
nv
erg
enc
e an
d susta
ina
bility in th
e eur
opea
n un
ion
pub
lic secto
r ec
on
om
ics
42 (4) 353-380 (2018)377Table a1
Descriptive statistics
country revenues expenditures debt surplusmean st dev mean st dev mean st dev mean st dev
Belgium 0498 0014 0519 0029 102371 6191 1489 2662Bulgaria 0375 0032 0378 0035 25430 12762 0809 3995Czech R 0397 0021 0427 0030 34493 6377 -1570 2538Denmark 0542 0012 0537 0025 41284 6727 2350 2937Germany 0439 0011 0453 0017 69791 6443 0853 1749Estonia 0380 0027 0376 0035 6770 2386 0605 2605Ireland 0331 0031 0374 0095 63992 35900 -3019 8925Greece 0427 0042 0501 0052 135084 31814 -2996 4643Spain 0380 0016 0417 0035 64440 24433 -1729 4398France 0506 0016 0544 0023 78400 13788 -1601 1526Croatia 0433 0030 0478 0030 56491 19248 -1880 2281Italy 0453 0019 0485 0019 115085 12457 1345 1277Cyprus 0365 0030 0395 0055 73230 21307 -0192 5510Latvia 0352 0022 0374 0036 26770 14433 -1088 3003Lithuania 0341 0013 0367 0039 28502 10293 -1275 3675Luxembourg 0434 0013 0418 0026 14941 7215 1360 1821Hungary 0444 0021 0490 0023 69585 8796 -0745 3255Malta 0384 0020 0416 0023 66048 4001 0266 2870Netherlands 0429 0009 0446 0021 56298 8245 -0165 2086Austria 0489 0012 0513 0019 76310 6738 0363 1796Poland 0395 0013 0435 0018 48860 5134 -1724 1608Portugal 0415 0021 0469 0035 92343 30325 -1906 3499Romania 0335 0016 0367 0033 25756 10096 -1550 3267Slovenia 0434 0010 0472 0048 44276 22349 -1759 4888Slovakia 0373 0024 0417 0039 43263 8989 -1969 2157Finland 0531 0013 0520 0040 46337 10241 1891 3288Sweden 0520 0019 0515 0016 42539 4814 1568 1730UK 0378 0012 0420 0036 60967 22826 -2558 2478
vla
dim
ir ar
ča
bić
fisca
l co
nv
erg
enc
e an
d susta
ina
bility in th
e eur
opea
n un
ion
pub
lic secto
r ec
on
om
ics
42 (4) 353-380 (2018)
378 references1 Arčabić V [et al] 2018 Public Debt and Economic Growth Conundrum
Nonlinearity and Inter-temporal Relationship Studies in nonlinear dynamics and econometrics 22(1) pp 1-20 httpsdoiorg101515snde-2016-0086
2 Arellano M and Bover O 1995 Another look at the instrumental variable estimation of error-components models Journal of econometrics 68(1) pp 29-51 httpsdoiorg1010160304-4076(94)01642-D
3 Babić A 2003 Dynamic analysis of Croatiarsquos fiscal and external debt Privredna kretanja i ekonomska politika 13(97) pp 77-126 Available at lthttpshrcaksrcehrfile28961gt
4 Balassone F Francese M and Zotteri S 2010 Cyclical asymmetry in fiscal variables in the EU Empirica 37(4) pp 381-402 httpsdoiorg101007s10663-009-9114-7
5 Bernard A B and Durlauf S N 1995 Convergence in international out-put Journal of applied econometrics 10(2) pp 97-108 httpsdoiorg 101002jae3950100202
6 Bernard A B and Durlauf S N 1996 Interpreting tests of the convergence hypothesis Journal of econometrics 71(1-2) pp 161-173 httpsdoiorg 1010160304-4076(94)01699-2
7 Blanchard O 2010 Interview IMF Survey Two-speed Recovery to Extend into 2011 Says IMF In International Monetary Fund December 30 2010 Available at lthttpswwwimforgenNewsArticles201509280453sonew123010agt
8 Blundell R and Bond S 1998 Initial conditions and moment restrictions in dynamic panel data models Journal of econometrics 87(1) pp 115-143 httpsdoiorg101016S0304-4076(98)00009-8
9 Bohn H 1998 The behavior of US public debt and deficits The Quarterly Journal of economics 113(3) pp 949-963 httpsdoiorg101162003355 398555793
10 Bohn H 2005 The Sustainability of Fiscal Policy in the United States CESifo Group Munich Working paper No 1446 Available at lthttpwwwcesifo-groupdeDocDLcesifo1_wp1446pdfgt
11 Bohn H 2007 Are stationarity and cointegration restrictions really neces-sary for the intertemporal budget constraint Journal of monetary economics 54(7) pp 1837-1847 httpsdoiorg101016jjmoneco200612012
12 Cassou S P Shadmani H and Vaacutezquez J 2017 Fiscal policy asymmetries and the sustainability of US government debt revisited Empirical econom-ics 53(3) pp 1193-1215 httpsdoiorg101007s00181-016-1159-4
13 Collignon S 2012 Fiscal policy rules and the sustainability of public debt in Europe International economic review 53(2) pp 539-567 httpsdoiorg 101111j1468-2354201200691x
14 De Bandt O and Mongelli F 2000 Convergence of fiscal policies in the euro area European Central Bank Working paper No 20 Available at lt https
vla
dim
ir ar
ča
bić
fisca
l co
nv
erg
enc
e an
d susta
ina
bility in th
e eur
opea
n un
ion
pub
lic secto
r ec
on
om
ics
42 (4) 353-380 (2018)379wwwecbeuropaeupubpdfscpwpsecbwp020pdffb62cab7f4d858d8e528
47b202892351gt 15 Delgado F 2006 Are the tax mix and the fiscal pressure converging in the
European Union Instituto de Estudios Fiscales Working paper No 11-0616 Deskar-Škrbić M and Šimović H 2017 Effectiveness of fiscal spending in
Croatia Slovenia and Serbia The role of trade openness and public debt level Post-communist economies 29(3) pp 336-358 httpsdoiorg1010801463137720161267972
17 Du K 2017 Econometric convergence test and club clustering using Stata Stata journal 17(4) pp 882-900 Available at lt httpsmedmahidolacthcebsitesdefaultfilespublicpdfstata_journalsj17-4pdfgt
18 Enders W and Lee J 2012 A unit root test using a Fourier series to approx-imate smooth breaks Oxford bulletin of economics and statistics 74(4) pp 574-599 httpsdoiorg101111j1468-0084201100662x
19 Hamilton J D and Flavin M A 1986 On the Limitations of Government Borrowing A Framework for Empirical Testing American economic review 76(4) pp 808-819
20 Hodrick R J and Prescott E C 1997 Postwar US business cycles an empirical investigation Journal of money credit and banking pp 1-16 httpsdoiorg1023072953682
21 Kočenda E Kutan A M and Yigit T M 2008 Fiscal convergence in the European Union The North American journal of Economics and finance 19(3) pp 319-330 httpsdoiorg101016jnajef200806003
22 Lee J and Strazicich M C 2003 Minimum Lagrange multiplier unit root test with two structural breaks Review of economics and statistics 85(4) pp 1082-1089 httpsdoiorg101162003465303772815961
23 Mihaljek D 2003 Analysis of public and external debt sustainability for Croatia Application of standard financial indicators Privredna kretanja i ekonomska politika 13(97) pp 29-75 Available at lthttpshrcaksrcehrfile28958gt
24 Perron P 1989 The great crash the oil price shock and the unit root hypoth-esis Econometrica pp 1361-1401 httpsdoiorg1023071913712
25 Pesaran M H (2006) Estimation and inference in large heterogeneous pan-els with a multifactor error structure Econometrica 74(4) pp 967-1012 httpsdoiorg101111j1468-0262200600692x
26 Pesaran M H 2007 A pair-wise approach to testing for output and growth convergence Journal of econometrics 138(1) pp 312-355 httpsdoiorg 101016jjeconom200605024
27 Pesaran M H 2015 Testing weak cross-sectional dependence in large pan-els Econometric reviews 34(6-10) pp 1089-1117 httpsdoiorg101080074749382014956623
28 Phillips P C and Sul D 2007 Transition modeling and econometric conver-gence tests Econometrica 75(6) pp 1771-1855 httpsdoiorg101111 j1468-0262200700811x
vla
dim
ir ar
ča
bić
fisca
l co
nv
erg
enc
e an
d susta
ina
bility in th
e eur
opea
n un
ion
pub
lic secto
r ec
on
om
ics
42 (4) 353-380 (2018)
380 29 Phillips P C and Sul D 2009 Economic transition and growth Journal of applied econometrics 24(7) pp 1153-1185 httpsdoiorg101002jae1080
30 Raguž Krištić I Rogić Dumančić L and Arčabić V 2018 Persistence and stochastic convergence of euro area unemployment rates Economic Model-ling httpsdoiorg101016jeconmod201807032
31 Reinhart C M and Rogoff K S 2010 Growth in a Time of Debt American economic review 100(2) pp 573-78 httpsdoiorg101257aer1002573
32 Trehan B and Walsh C E 1988 Common trends the governmentrsquos budget constraint and revenue smoothing Journal of economic dynamics and con-trol 12(2-3) pp 425-444 httpsdoiorg1010160165-1889(88)90048-6
Efficiency vs effectiveness an analysis of tertiary education across Europe
OZANA NADOVEZA JELIĆ PhDMARGARETA GARDIJAN KEDŽO PhD
ArticleJEL I21 I22 I23httpsdoiorg103326pse4242
The authors would like to thank two anonymous referees for helpful comments on the paper Received June 1 2018
Accepted October 21 2018
The article was submitted for the 2018 annual award of the Prof Dr Marijan Hanžeković Prize
Ozana NADOVEZA JELIĆUniversity of Zagreb Faculty of Economics and Business Trg J F Kennedyja 6 10000 Zagreb Croatiae-mail onadovezaefzghr ORCiD 0000-0002-3651-7795
Margareta GARDIJAN KEDŽOUniversity of Zagreb Faculty of Economics and Business Trg J F Kennedyja 6 10000 Zagreb Croatiae-mail mgardijanefzghrORCiD 0000-0001-5390-057X
oza
na n
ad
ov
eza jelić ma
rg
ar
eta ga
rd
ijan k
edžo
efficien
cy v
s effectiv
eness a
n an
aly
sis of tertia
ry edu
catio
n ac
ro
ss eur
ope
pub
lic secto
r ec
on
om
ics
42 (4) 381-414 (2018)
382 abstractThis paper deals with tertiary education efficiency and effectiveness across 24 European Union countries in four sub-periods between 2004 and 2015 The effi-ciency scores are computed using Data Envelopment Analysis (DEA) We try to raise awareness of the quality and not of the quantity of educational outputs and inputs by introducing quality-based correction of the DEA efficiency score which we regard as effectiveness Our results show that quality considerations affect the relative positions of countries regarding their efficiency scores In other words some less developed countries which are efficient in the quantity-based model fail to reach the defined efficiency border when considering some quality indica-tors of outputs On the other hand some inefficient developed countries increase their DEA-based ranking and achieve effectiveness (quality-based efficiency) The same is true for input quality considerations Since tertiary education cannot be expected to provide the same quality of outcomes with different input qualities efficiency improves (deteriorates) in the input-output quality-based model in many countries with low (high) quality student bases
Keywords tertiary education data envelopment analysis educational efficiency and effectiveness EU
1 IntroductIonIt is a well-established fact that the quality of education matters more than quan-tity Fortunato and Panizza (2015) argue that the sharp increase in cross-country average years of schooling might not accurately represent actual educational gains According to Pritchett (2013) as cited in Fortunato and Panizza (2015) an increase in years of education in less developed countries as opposed to devel-oped countries is not always transmitted into educational benefits This view is also supported by many relatively recent papers such as Hanushek and Kimko (2000) Barro (2001) Woumlszligmann (2006) Altinok Diebolt and Demeulemeester (2014) Barro (2013) whereas Barro (2013) concludes that the ldquoquality and quan-tity of schooling both matter for growth but quality is much more importantrdquo Additionally Pritchett (2001) who was not able to prove a positive association between increasing educational attainment and per capita income growth argues that it could be that the educational quality was so low that ldquoyears of schoolingrdquo have created no human capital
Due to the importance of educational services for growth attitudes and political and social awareness they are provided and publicly financed to a greater or lesser extent by practically all governments around the world Additionally educational externalities are a textbook example of market failure and one of the most impor-tant motives behind government intervention in this sector According to Szirmai (2015) after World War II expansion and improvement of education were gener-ally considered essential to development The awareness about the role of educa-tion in the development process resulted in a far reaching education expansion Over the course of time increased government expenditures on education trans-
oza
na n
ad
ov
eza jelić ma
rg
ar
eta ga
rd
ijan k
edžo
efficien
cy v
s effectiv
eness a
n an
aly
sis of tertia
ry edu
catio
n ac
ro
ss eur
ope
pub
lic secto
r ec
on
om
ics
42 (4) 381-414 (2018)383lated into higher levels of education Consequently higher education enrolments
have grown significantly over the last three decades According to World Bank (2018) data the world gross enrolment ratio in tertiary education1 grew from 13 to 35 during the 1985-2015 period Growth has been even more impressive in the European Union (EU) where the average annual growth rate of the gross enrolment ratio in tertiary education reached 35 This has led to an increase in the gross enrolment ratio in tertiary education from 25 in 1985 to 68 in 2014
However as Szirmai (2015) puts it ldquoSince the 1970s optimism about the contribu-tions of education has been shaken and more emphasis is given to improving the quality of educationrdquo This author notices that not all educational investments are effective and efficient in the development process Due to the potential ineffective-ness of educational inputs the quality of education can be unsatisfactory Thus the rising educational coverage and duration of education as well as government and even private educational expenditures are not always efficiently transmitted into higher productivity and wages growth rates and better institutions Therefore it can be argued it is not quantity that underlies the successful exploitation of all forms of educational benefits but the quality and the effectiveness of the educational inputs and investments Although efficiency and effectiveness are similar concepts they are not synonyms Viljoen (cited in Kenny 2008) defined efficiency as relating to ldquohow well an activity or operation is performedrdquo The term effectiveness relates to performing the correct activity or operation In other words ldquoefficiency measures how well an organization does what it does but effectiveness raises value questions about what the organization should be doing in the first placerdquo
There is a significant body of literature which deals with the efficiency of all levels of the national educational systems in the EU Many of those studies chose to use data envelopment analysis (DEA) in their methodological approach because DEA as a nonparametric method of mathematical programming enables the cal-culation of the relative efficiency of quite homogenous and comparable units given multiple criteria These criteria dictate the choice of certain input variables whose values are preferred to be as small as possible and certain output variables whose values are preferred to be as great as possible The choice of the criteria and consequently the choice of the variables defines the concept of the research
Conclusions of various DEA-based studies sometimes differ significantly which makes it impossible to draw general conclusions concerning tertiary educational efficiency at the EU level Differences in conclusions mostly arise from the diverse selection of inputs and outputs considered within different studies Additionally some papers deal with a narrow sample of countries (eg Ahec Šonje Deskar-Škrbić and Šonje 2018 Yotova and Stefanova 2017) ie homogenous countries with similar development levels and others deal with a broader and more or less
1 Total enrolment in tertiary education (ISCED 5 to 8) regardless of age expressed as a percentage of the total population of the five-year age group following on from secondary school leaving
oza
na n
ad
ov
eza jelić ma
rg
ar
eta ga
rd
ijan k
edžo
efficien
cy v
s effectiv
eness a
n an
aly
sis of tertia
ry edu
catio
n ac
ro
ss eur
ope
pub
lic secto
r ec
on
om
ics
42 (4) 381-414 (2018)
384 heterogeneous set of countries which can also affect the difference in the results (Aubyn et al 2009 Aristovnik and Obadić 2011 and Toth 2009)
Still most of the papers that use the DEA approach make comparisons on tertiary education between countries considering only the definition of efficiency Some papers deal with quality issues but mostly on the output side of the educational ldquoproduction functionrdquo Therefore questions regarding the quality of educational inputs and outputs and their effectiveness are usually covered only partially In this paper we argue that a greater focus on efficiency can give misleading results that could translate into flawed educational policy prescriptions
The paper is organized as follows The second section summarizes previous research findings The third section gives the rationale for selected inputs and outputs as well as a glimpse of the educational inputs and outputs in the EU The fourth section deals with the methodology and the fifth presents and discusses the main results The last part of the paper provides comments on policy implications and future research recommendations
2 lIterature oVerVIewDEA is a generally suitable method for a country-level public sector efficiency evaluation2 and it is commonly used and widely accepted as an appropriate analy-sis approach in the tertiary education efficiency research For example to rank eleven Eastern European countries according to their tertiary education efficiency during the 2005-2013 period Ahec Šonje Deskar-Škrbić and Šonje (2018) use input-oriented DEA with variable returns to scale (VRS) The authors use expend-iture on tertiary education per pupil in the percentage of GDP per capita as an input variable and the share of unemployed with tertiary education in the total number of unemployed (model 1) and World University Ranking list as an alterna-tive output measure (model 2) However the authors consider models with only one input and one output variable which limits the possibility of making more general conclusions
Yotova and Stefanova (2017) used the same method on a set of countries similar to that chosen by Ahec Šonje Deskar-Škrbić and Šonje (2018) As an input vari-able authors used total expenditures on tertiary education per student as a percent-age of per capita GDP in 2012 while the set of educational outputs variables included three indicators tertiary educational attainment (age 25-34) the employ-ment rate of the population with tertiary education outside the risk of poverty and social exclusion and the mean monthly earnings of a person with tertiary educa-tion as a share in per capita GDP in 2014 Again the analysis is limited to one input and one output It should be noted that both studies include some educa-
2 We wonrsquot go in any details regarding the broader usage of DEA in public sector efficiency evaluations How-ever interested reader can refer to the following research in this area Clements (2002) Afonso and St Aubyn (2006) Aristovnik (2013a 2013b) Aristovnik and Obadić (2014) etc
oza
na n
ad
ov
eza jelić ma
rg
ar
eta ga
rd
ijan k
edžo
efficien
cy v
s effectiv
eness a
n an
aly
sis of tertia
ry edu
catio
n ac
ro
ss eur
ope
pub
lic secto
r ec
on
om
ics
42 (4) 381-414 (2018)385tional output quality indicators but they do not consider any educational input
quality measures which could lead to biased results and conclusions
Toth (2009) analyzed the efficiency of tertiary education in 20 EU countries in 2006 using output-oriented DEA with variable returns to scale (VRS) The author used a ratio of expenditures spent on higher education to GDP as an educational input and the ratio of people with a degree to the total population as well as the employment rate of people with a degree as educational output variables Beside standard outputs and inputs the author used two non-discretionary variables (parental educational attainment and public-to-total expenditure GDP per capita in current US$) However Tothrsquos (2009) results differ significantly from other related studies that include EU countries3 She found that for example Denmark and Italy (among others) share the first position regarding tertiary education effi-ciency in 20 analyzed EU countries while Aristovnik and Obadić (2011) and Aubyn et al (2009) rank these countries as relatively inefficient
Aristovnik and Obadić (2011) used output oriented DEA with variable returns to scale (VRS) to assess tertiary education efficiency in a broad set of countries (selected group of EU and OECD countries) during the 1999-2007 period The analysis included input data on expenditure per student (tertiary of GDP per capita) school enrolment (tertiary gross) and outputoutcome data ie school enrolment (tertiary gross) labor force with a tertiary education ( of total) and the unemployed with a tertiary education ( of total unemployment) To assess technical efficiency regarding different inputs and outputsoutcome the authors tested three Two out of three considered outputs are standard educational quantity output indicators while the last can be regarded as a quality indicator In the con-clusion authors emphasize the need to consider some educational quality data
The most comprehensive study employing DEA methodology to assess the effi-ciency of the tertiary education in a broad set of countries is authored by Aubyn et al (2009) The authors used two approaches input and output-oriented DEA with variable returns to scale (VRS) The analysis is conducted over two subperiods 1998-2001 and 2002-2005 In the first model authors used a number of academic staff and students as inputs while the second model considered spending in pri-vate government-dependent institutions (in of GDP) as an input variable A weighted number of graduates and a weighted number of published articles were used as output variables in both models All educational inputs and outputs con-sidered in this paper can be regarded as quantitative However the study includes a number of non-discretionary measures such as selection of students budget autonomy staff policy output flexibility evaluation funding rules and PISA results4 which can be seen as qualitative measures (mostly) of inputs
3 See table A1 in appendix4 For detailed explanation of variables see Aubyn et al (2009)
oza
na n
ad
ov
eza jelić ma
rg
ar
eta ga
rd
ijan k
edžo
efficien
cy v
s effectiv
eness a
n an
aly
sis of tertia
ry edu
catio
n ac
ro
ss eur
ope
pub
lic secto
r ec
on
om
ics
42 (4) 381-414 (2018)
386 It should be noted that conclusions differ in the abovementioned papers which makes it impossible for us to draw any general conclusions on tertiary educational efficiency at EU level5 We suspect that differences in conclusions mostly arise from the diverse selection of inputs and outputs considered within different papers However the differences in the conclusions of the reviewed papers also arise because of the different samples of countries That is two papers deal with a nar-row sample of countries ie homogenous countries with similar development lev-els and others deal with a broader and heterogeneous set of countries which can also produce different results Still differences arise even if the samples are rela-tively similar For example Aristovnik and Obadić (2011) and Aubyn et al (2009) use the same number and coverage of countries and even time periods in different model specifications (variables) but sometimes the results differ significantly For example the first model in Aristovnik and Obadić (2011) ranks the Czech Repub-lic as the first and then as the 33rd in the second model Similarly in Aubyn et al (2009) Cyprus is ranked number one in the first model (1998-2001) and then as 27th in the second model (1998-2001)6
3 data tertIary educatIon InPuts and outPutsThis paper differentiates between quantity and quality measures of educational inputs and outputs which enables us to discriminate tertiary education efficiency and tertiary education effectiveness Since there is no consensus regarding the appropriateness of available inputs and outputs it seemed inappropriate to make an ad hoc decision to include some and to exclude other inputs and outputs that were used in the previous researches Therefore this paper uses a somewhat broader set of inputs and outputs than most of the papers presented in the literature overview It also considers quality indicators on both side of the educational pro-duction function ndash the input and the output side This decision comes with a cost as the discriminatory power of the method becomes questionable with the increase of the variables due to the inappropriate degrees of freedom (Cooper Seiford Tone 2006106) However any future research should try to detect key inputs and outputs in the tertiary education ldquoproductionrdquo process and try to synthesize them to get more information with fewer datavariables This approach could lead to more robust and more consistent DEA-based conclusions regarding tertiary edu-cation efficiency
To our knowledge there is no precise definition and delimitation of quantitative and qualitative educational inputs and outputs According to Lee in Bourguignon Elkana and Pleskovic (2007) an outcome of education is composed of both the quantity and the quality of educational capital According to him the quantity of educational capital can be measured by the number of graduates However he emphasizes that it is rather difficult to measure the quality of education accurately The author adds that the quality of education is reflected in the performance of
5 Table A1 in appendix provides a table with the previous research results6 See table A1 in appendix
oza
na n
ad
ov
eza jelić ma
rg
ar
eta ga
rd
ijan k
edžo
efficien
cy v
s effectiv
eness a
n an
aly
sis of tertia
ry edu
catio
n ac
ro
ss eur
ope
pub
lic secto
r ec
on
om
ics
42 (4) 381-414 (2018)387students and graduates as the value added of schooling can be measured by labor
market performance such as extra earnings or employment of educated workers Due to the lack of official quantity vs quality definitions regarding educational inputs and outputs in this section we provide the basic rationale behind the choices made in this paper
Before the provision of details regarding the selected inputs and outputs figure 1 gives a synthetic overview of educational inputs and outcomes as defined in Scheerens Luyten and van Ravens (2011)
Figure 1A synthetic overview of educational inputs processes and outcomes
Inputs Process outputs
System level financial material and human resources indicators
System level process indicators
output indicators bull Subject matter based bull Literacy (reading
mathematical scientific)
bull Competencies
outcomeattainment indicators bull Graduation rates bull Proportion of students
graduated without delay
bull Drop-out rates bull Class repetition rates
Impact indicators bull (For each attainment
level) of employed at a certain job level
bull of unemployed bull (For lower school
levels) enrolled in follow-up education
bull Degree of social participation (social capital)
bull Adult literacy rates bull Average income for
each attainment level
financial and material resources indicators 1 Proportion of gross
domestic product spent on education
2 Educational expenditure per student
3 Proportion of public and private investments in education
4 Public investment in educational research and development etc
human resources indicators 1 Teacher background
characteristics 2 Teacher professional
knowledge and skills 3 Teacher working
conditions 4 Teacher autonomy 5 Teacher morale and
status 6 Staff to student ratios
system level process indicators 1 Teaching time per
subject 2 Opportunity to learn 3 The locus of
decision-making 4 School autonomy 5 Education standards
by level 6 Whether formal
examinations are taken
7 The evaluation capacity of the system
8 The magnitude and diversification of an educational support structure
9 The division of private government dependent and public schools
10 Incentive-based policies to stimulate school performance
11 The degree to which school choice is free
contextual indicators (student background characteristics societal conditions antecedent conditions within the educational system the organizational infrastructure
of the local community etc)Source Scheerens Luyten and van Ravens (2011) adapted by the authors
oza
na n
ad
ov
eza jelić ma
rg
ar
eta ga
rd
ijan k
edžo
efficien
cy v
s effectiv
eness a
n an
aly
sis of tertia
ry edu
catio
n ac
ro
ss eur
ope
pub
lic secto
r ec
on
om
ics
42 (4) 381-414 (2018)
388 The selection of quality and quantity educational input and output indicators was mostly dictated by data availability (on the system level) Additionally some indi-cators that were considered as either inputs or outputs of the tertiary education system were highly correlated with other selected variables Thus we had to drop some of them The following subsections link selected variables to the definitions of input output and process indicators shown in figure 1 System-level process indicators have not been considered at all due to the lack of appropriate data
31 QuantItatIVe measures of educatIonal InPutsGeneral government expenditures on tertiary education as a percentage of GDP (financial resources indicator) are chosen as the most common measure of tertiary education public investmentsexpenditures Due to the correlation of this measure with similar measures of inputs other measures are excluded Data for this meas-ure are available for the entire analyzed period
Financial aid to students as a percentage of total public expenditure on education at the tertiary level of education (financial resources indicator) is selected as an input since it indicates public expenditures pointed directly towards students It is assumed that it adds new information regarding tertiary education financial inputs since it is not correlated with the previous financial resources indicator Data for this measure are available for the 2004-2012 period
One limitation should be noted here Namely both financial resources indicators contain only public spending on tertiary education However the structure of financing sources could also affect the efficiency since publicly financed education resources (see system level financial inputs and process indicators in figure 1) do not represent the total amount of educational spending However comparable data on private spending on education for all countries in our sample was not available
The ratio of pupils and students to teachers and academic staff in tertiary educa-tion is selected as a human resource indicator in the last analyzed sub-period (2013-2015) which was dictated by data availability
32 QualItatIVe measure of educatIonal InPutsThe percentage of underachieving 15-year-old students in the PISA survey (aver-age of all fields) is an output indicator of secondary education We assume it is a contextual indicator that measures human capital input quality at the tertiary level education since it contains information about the quality of the student population before entering the system of tertiary education Data for this measure are availa-ble for the entire analyzed period
33 QuantItatIVe measures of educatIonal outPutsTertiary education graduates (ISCED 5-6 per 1000 of population aged 20-29) and graduates aged 20-34 ( of the corresponding population) are selected as out-comeattainment indicators that are the most important and commonly used meas-
oza
na n
ad
ov
eza jelić ma
rg
ar
eta ga
rd
ijan k
edžo
efficien
cy v
s effectiv
eness a
n an
aly
sis of tertia
ry edu
catio
n ac
ro
ss eur
ope
pub
lic secto
r ec
on
om
ics
42 (4) 381-414 (2018)389ures of tertiary education outputs The first indicator is available for the 2004-
2012 period while the latter was used for the analysis in the last sub-period (2013-2015) Since both measures indicate only the number of students who successfully exit the tertiary education system and do not contain any information regarding their ldquoqualityrdquo we regard them as quantitative indicators of educational outputs
The population aged 15-64 with completed tertiary education is selected as a com-mon quantitative output indicator since it only considers the number of tertiary educated people and provides no information regarding the qualitative features of the tertiary educated population It should be noted that population with com-pleted tertiary education also reflects past spending on education while our analy-sis measures the outputs at the same time as inputs However if we considered only past spending on tertiary education we would still have a similar problem Beside historical data availability problems if we took (financial) inputs from previous periods we would neglect the potential efficiency of current expendi-tures to ldquoproducerdquo a new tertiary educated population This is because current financial resources devoted to tertiary education are spread across current stu-dents In three-year periods (for which we take averages) some of those students become part of the tertiary educated population Data for this measure are availa-ble for the entire analyzed period
The ratio of unemployment rates ( age 15-64) for all educational levels to unemployment rates ( age 15-64) of the tertiary educated labor force is selected as an impact indicator of tertiary education outcomes It measures tertiary educa-tion returns on the labor market Due to its correlation with similar labor market outcomes measures other measures are excluded Data for this measure are avail-able for the entire analyzed period Even if this indicator could be seen as a quali-tative tertiary education outcome measure we included it in both the efficiency and the effectiveness analysis We argue that a high ratio of unemployment rates for all educational levels and unemployment rates of tertiary educated labor force does not necessarily reflect the high efficiency of the tertiary education in terms of labor market outcomes but could be also a result of low activity rates of the ter-tiary educated population Therefore we correct this measure with activity rates of tertiary educated population
34 QualItatIVe measure of educatIonal outPutsFollowing the preceding paragraph the ratio of unemployment rates ( age 15-64) for all educational levels to unemployment rates ( age 15-64) of the tertiary educated labor force is multiplied by the activity rates of tertiary educated population The resulting measure is selected as a qualitative impact indicator of the tertiary education outcomes Data for this measure are available for the entire analyzed period
An average overall score of Times Higher Education university rankings is cho-sen as an output indicator of the tertiary education quality in the last sub-period
oza
na n
ad
ov
eza jelić ma
rg
ar
eta ga
rd
ijan k
edžo
efficien
cy v
s effectiv
eness a
n an
aly
sis of tertia
ry edu
catio
n ac
ro
ss eur
ope
pub
lic secto
r ec
on
om
ics
42 (4) 381-414 (2018)
390 (2013-2015) We considered other ranking lists but Times Higher Education was the only university rankings database which covered all countries in our sample in 2016 In previous sub-periods (2004-2012) we used the gross domestic product in PPS per capita ( of average) as a proxy for tertiary education outputs quality due to the incompleteness of the university rankings data and their correlation with university rankings (overall score) Anecdotal evidence presented in figure 2 justi-fies this choice Namely it seems that the correlation between the GDP per capita and the average university overall score (measure of the educational outcomes quality) using the ranking of the Times Higher Education (2017) significantly exceeds the correlation between the GDP per capita and the tertiary educated pop-ulation as a percentage of 15-64 years aged population (typical measure of educa-tional outcomes quantity)
Figure 2Quantity versus quality of education as GDP per capita correlates
Rsup2 = 025
-15
-10
-5
0
5
10
15
20
25
30
-15 -10 -5 0 5 10
Dev
iatio
n fr
om E
U 2
6 av
erag
e
GD
P p
c in
PPS
k
Deviation from EU 26 averagetertiary educated population (as of 15-64)
Rsup2 = 076
-15
-10
-5
0
5
10
15
20
25
30
-30 -20 -10 0 10 20 30
Dev
iatio
n fr
om E
U 2
6 av
erag
eG
DP
pc
in P
PSk
Deviation from EU 26 average average THE WUR overall score
Source Times Higher Education (2017) Eurostat (2018c 2018d)
The analysis is performed on a sample of 24 EU countries7 for which all the neces-sary data during the 2004-2015 period were available The entire time span has been divided into four 3-years sub-periods for which comparable data and varia-bles were available Table 1 summarizes selected inputs and outputs in efficiency and effectiveness DEA models
Figures 3 4 and 5 show educational (quantity and quality) inputs and outputs trends within the EU countries during the analyzed periods (averages for sub-periods 2004-2006 2007-2009 2010-2012 2013-2015) The figures reveal a lot of differences among EU member states regarding the educational inputs and out-puts However a few conclusions can be drawn
7 Due to data shortages Cyprus Greece Malta and Luxemburg were excluded from the dataset
oza
na n
ad
ov
eza jelić ma
rg
ar
eta ga
rd
ijan k
edžo
efficien
cy v
s effectiv
eness a
n an
aly
sis of tertia
ry edu
catio
n ac
ro
ss eur
ope
pub
lic secto
r ec
on
om
ics
42 (4) 381-414 (2018)391Table 1
Inputs outputs and quality indicators
label Definition used in periodCountries Belgium Bulgaria Czech Republic Denmark Germany Estonia Ireland Spain France Croatia Italy Latvia Lithuania Hungary Netherlands Austria Poland Portugal Romania Slovenia Slovakia Finland Sweden United KingdomInputs
(I)EX2( GDP) General government expenditure (tertiary education GDP) 2004-2015
(I)FA( EX)Financial aid to students as of total public expenditure on education at tertiary level of education (ISCED 5 6 )
2004-2012
(I)ST Ratio of pupils and students to teachers and academic staff (tertiary education levels 5-8) 2013-2015
Outputs
(O)GRAD(20-29) Tertiary education graduates (ISCED 5-6 per 1000 of population aged 20-29) 2004-2012
(O)GRADT(20-34) Graduates aged 20-34 tertiary education level ( of corresponding population) 2013-2015
(O)POPT Population aged 15-64 with completed tertiary education (levels 5-8) 2004-2015
(O)UUTUnemployment rates ( 15-64) all ISCED 2011 levelsunemployment rates ( 15-64) tertiary education (levels 5-8)
2004-2015
Quality indicators of inputs and outputs
(O)UUTACTT (O)UUT Activity rates ( of 15-64 tertiary education (levels 5-8)) 2004-2015
(O)GDP PC PPSGross domestic product at market prices current prices purchasing power standard per capita ( of average)
2004-2012
(O)UR_2016 Average overall score university rankings ndash The Higher Education 2013-2015
(I)PISA Underachieving 15-year-old students ( PISA survey an average of all fields) 2004-2015
Source Authors
Inputs ndash The more developed EU countries generally have greater direct invest-ment in students (in ) (figure 3a) Something similar is true for general govern-ment expenditure (figure 3b) However there are a few exceptions like the UK on the low expenditures side and Poland Estonia and Lithuania on the high expendi-tures side (figure 3c) Student to teacher ratio varies from 107 in Sweden to 225 in the Czech Republic
Outputs ndash Graduation rates (figure 4a) have been increasing in all countries within the period of analysis whereas a few post-transition economies which have rela-tively low incomes have relatively high graduation rates Regarding the labor market outcomes (figure 4c) the tertiary educated labor force seems to have a somewhat lower unemployment rate relative to the overall unemployment rate in
oza
na n
ad
ov
eza jelić ma
rg
ar
eta ga
rd
ijan k
edžo
efficien
cy v
s effectiv
eness a
n an
aly
sis of tertia
ry edu
catio
n ac
ro
ss eur
ope
pub
lic secto
r ec
on
om
ics
42 (4) 381-414 (2018)
392 less developed EU countries This could be due to the relative scarcity of tertiary educated labor in lower income countries which provides them with a better labor market position (figure 4b)
Quality indicators of inputs and outputs ndash After correcting the above described labor market outcomes for the tertiary educated activity rates some countries like the Netherlands Sweden Germany Ireland and Austria improve their relative position while the positions of Croatia Slovakia and Romania positions deterio-rate (figure 5a) The correlation between per capita GDP and university ranking overall score has already been commented on As we have already emphasized both of those outputs measure the quality of the tertiary education Finally figure 5c shows that the percentage of underachieving 15-year-old students (measured as the average of all fields in a PISA survey) is usually much larger in the poorest EU countries while it is the lowest in the wealthiest ones (with a few exceptions) This means that poorer countries get students of ldquolower qualityrdquo
Figure 3Tertiary education inputs (averages 2004-2006 2007-2009 2010-2012 2013-2015)
a) Financial aid to students as of total public expenditureon education at the tertiary level of
education
b) General government expenditure (tertiary education GDP)
05
10152025303540
Cze
ch R
C
roat
iaFr
ance
Fran
ce
Rom
ania
Spai
nA
ustri
aEs
toni
aLi
thua
nia
Pola
ndLa
tvia
Irel
and
Irel
and
Hun
gary
Bel
gium
Bel
gium
Finl
and
Bul
garia
Bul
garia
Portu
gal
Portu
gal
Slov
akia
EU28
EU28
Ger
man
y
Ger
man
y
Italy
Slov
enia
Slov
enia
Swed
enN
ethe
rland
s
Net
herla
nds
Den
mar
k
Den
mar
k
UK
UK
00
05
10
15
20
25
Italy
Spai
n
Slov
akia
Rom
ania
Aus
tria
Cze
ch R
Hun
gary
Latv
ia
Cro
atia
Swed
en
Esto
nia
Pola
nd
Finl
and
Lith
uani
a
c) The ratio of pupils and students to teachers and academic staff (tertiary education)
Fran
ce
Bul
garia
EU28
Ger
man
y
UK
Italy
Slov
akia
Aus
tria
Cze
ch R
Cro
atia
Pola
nd
Finl
and
0
5
10
15
20
25
Swed
en
Spai
n
Den
mar
k
Rom
ania
Portu
gal
Esto
nia
Hun
gary
Net
herla
nds
Lith
uani
a
Slov
enia
Latv
ia
Bel
gium
Source Eurostat (2018b 2018c 2018g)
oza
na n
ad
ov
eza jelić ma
rg
ar
eta ga
rd
ijan k
edžo
efficien
cy v
s effectiv
eness a
n an
aly
sis of tertia
ry edu
catio
n ac
ro
ss eur
ope
pub
lic secto
r ec
on
om
ics
42 (4) 381-414 (2018)393
Fig
ur
e 4
Terti
ary e
duca
tion
outp
uts (
aver
ages
200
4-20
06 2
007-
2009
201
0-20
12 2
013-
2015
)
a) T
ertia
ry e
duca
tion
grad
uate
s (permil
20-
29) a
nd g
radu
ates
ag
ed 2
0-34
(permil o
f cor
resp
ondi
ng p
opul
atio
n)b)
Pop
ulat
ion
aged
15-
64 w
ith c
ompl
eted
te
rtiar
y ed
ucat
ion
c) U
nem
ploy
men
t rat
es (
15-
64) a
ll IS
CED
201
1 le
vels
U
nem
ploy
men
t rat
es (
15-
64) t
ertia
ry e
duca
tion
00
05
10
15
20
25
30
35
40
HungaryLithuaniaCzech RBulgaria
GermanyLatvia
SlovakiaUK
PolandSweden
NetherlandsBelgium
IrelandFinlandCroatia
EU28Italy
SpainFrance
SloveniaEstoniaAustria
RomaniaDenmarkPortugal
020406080100
120
DenmarkIrelandPolandFrance
LithuaniaUK
FinlandSlovakiaBelgium
SpainAustria
EU28Czech RSlovenia
NetherlandsBulgaria
LatviaCroatia
PortugalSweden
RomaniaEstonia
HungaryItaly
Germany
0510152025303540
UKIrelandFinlandEstoniaSweden
BelgiumSpain
LithuaniaDenmark
NetherlandsFranceLatviaEU28
SloveniaAustria
GermanyPoland
BulgariaHungaryPortugal
Czech RCroatia
SlovakiaItaly
Romania
Sour
ce E
uros
tat (
2018
d 2
018f
201
8g 2
018h
201
8j)
oza
na n
ad
ov
eza jelić ma
rg
ar
eta ga
rd
ijan k
edžo
efficien
cy v
s effectiv
eness a
n an
aly
sis of tertia
ry edu
catio
n ac
ro
ss eur
ope
pub
lic secto
r ec
on
om
ics
42 (4) 381-414 (2018)
394 Figure 5Tertiary education quality indicators (averages 2004-2006 2007-2009 2010-2012 2013-2015)
a) Unemployment rates ( 15-64) all ISCED 2011 levelsUnemployment rates ( 15-64) tertiary
education (levels 5-8) multiplied by tertiary educated population activity rate
b) Gross domestic product at market prices current prices purchasing power standard
per capita (three-year averages)
0
50
100
150
200
250
300
Lith
uani
aH
unga
ryC
zech
R
Ger
man
yB
ulga
riaSw
eden
Latv
iaU
KN
ethe
rland
sSl
ovak
iaFi
nlan
dIr
elan
dPo
land
Spai
nB
elgi
umEU
28Fr
ance
Esto
nia
Slov
enia
Aus
tria
Cro
atia
Den
mar
kIta
lyPo
rtuga
lR
oman
ia
05000
1000015000200002500030000350004000045000
Irel
and
Net
herla
nds
Aus
tria
Den
mar
kG
erm
any
Swed
enB
elgi
umFi
nlan
dU
KFr
ance
EU28
Italy
Spai
nC
zech
R
Slov
enia
Slov
akia
Portu
gal
Esto
nia
Lith
uani
aH
unga
ryPo
land
Latv
iaC
roat
iaR
oman
iaB
ulga
ria
c) Underachieving 15-year-old students ( PISA survey average of all fields)
d) University rankings ndash Times Higher Education an average overall score
0
10
20
30
40
50
60
Bul
garia
Rom
ania
Slov
akia
Hun
gary
Cro
atia
Lith
uani
aIta
lyFr
ance
Aus
tria
Cze
ch R
EU
28Sw
eden
Bel
gium
Portu
gal
UK
Spai
nLa
tvia
Net
herla
nds
Ger
man
yPo
land
Slov
enia
Den
mar
kIr
elan
dFi
nlan
dEs
toni
a
0
10
20
30
40
50
60
70
Net
herla
nds
Swed
enB
elgi
umG
erm
any
Den
mar
kFi
nlan
dU
KA
ustri
aIr
elan
dFr
ance
Italy
Esto
nia
Spai
nPo
rtuga
lC
roat
iaSl
oven
iaH
unga
ryC
zech
R
Slov
akia
Rom
ania
Pola
ndLa
tvia
Lith
uani
aB
ulga
ria
Source Eurostat (2018a 2018e 2018i 2018j) Times Higher Education (2017)
4 methodologyThe efficiency and (what we later regard as) the effectiveness analysis of the ter-tiary education in 24 EU member states8 is conducted using data envelopment analysis (DEA) DEA is a nonparametric method of mathematical programming which is developed for evaluating the relative efficiency of units under assess-ment usually called the decision-making units (DMUs) Since its introduction by the pioneering CCR model in 1978 (Charnes Cooper and Rhodes 1978) followed by the BCC model published by Banker Charnes and Cooper in 1984 DEA has instantly been recognized as a modern tool for performance management While the CCR model assumes constant returns to scale (CRS) the BCC model assumes variable returns to scale which allows the use of DEA in problems where increases in inputs result in non-proportionate increases in outputs (and vice versa) The most appealing features of DEA are that it allows multiple criteria for determining efficiency to be used and appropriate variables to be selected which are (in most models) unit-invariant without the use of their pre-defined weights In addition all assessments are relative given the finite number of comparable DMUs Follow-
8 We excluded Cyprus Malta Luxemburg and Greece from the analysis due to the lack of data
oza
na n
ad
ov
eza jelić ma
rg
ar
eta ga
rd
ijan k
edžo
efficien
cy v
s effectiv
eness a
n an
aly
sis of tertia
ry edu
catio
n ac
ro
ss eur
ope
pub
lic secto
r ec
on
om
ics
42 (4) 381-414 (2018)395ing the specific needs of the research environment a vast number of models have
been developed within DEA to fit and capture the nature of the research problem thus providing a great tool for different kinds of efficiency analysis Additionally the popularity of DEA and the number of its applications are on the rise (Emrouzne-jad and Yang 2018)
DEA was initially developed with the idea of measuring the efficiency of produc-tion units such as factories hospitals or banks where one can unswervingly determine their inputs and their outputs Such DMUs can manage their inputs and outputs to a certain degree (thus the name decision-making units) An additional assumption is that the aim of DMUs is to use their available inputs to achieve greater outputs or try to use fewer inputs for producing the desired level of output In other words they are assumed to aim for the efficiency in a production process However the application of DEA has spread outside the production processes and researchers are using it for evaluating the relative efficiency of different kinds of (relatively homogenous) units that need to be estimated given their undesirable (input) and desirable (output) characteristics The examples are the portfolio selection the performance of companies using their financial ratio data perfor-mance of countries according to their macroeconomic indicators or different ldquopro-cessesrdquo for example fiscal policy or educational policy As is obvious such DMUs are not the ldquodecision-makingrdquo units themselves and not all of them should aim for efficiency in terms of fewer inputs to greater outputs Moreover the selec-tion of their inputs and outputs is arbitrary but this allows a researcher to define the relevant aspects of the ldquoefficiencyrdquo of DMUs
The use of DEA for estimating the relative efficiency of education at different levels (primary secondary tertiary) has been very popular over recent years The overview of some of these researches previously mentioned in the literature over-view revealed that the most frequently used model is the BCC model (with input or output orientation) which is an appropriate approach given the nature of this research problem Without questioning the great contribution and effort of past researches what we argue is that their selection of inputs and outputs gives more importance to the greater quantity of the educational output We strongly suggest that education should be assessed not only in terms of quantity but also in terms of quality Figuratively speaking a factory that manages to produce something using almost nothing should be seen as a role model and a factory that invests a lot relative to others and achieves less than the others should be recognized as poorly managed However countries that have large investments in education should not be punished in such studies if they manage to provide a high quality of education Likewise the countries that have almost negligible inputs should not be rewarded just because they managed ldquoto producerdquo any amount of outputs of low quality despite their low inputs Therefore we suggest that at the beginning of the study using DEA the crucial question should be asked ldquoAre we really aiming at the quantity or the qualityrdquo and the answer should be followed with the selec-tion of the inputs and the outputs that are relevant for the study
oza
na n
ad
ov
eza jelić ma
rg
ar
eta ga
rd
ijan k
edžo
efficien
cy v
s effectiv
eness a
n an
aly
sis of tertia
ry edu
catio
n ac
ro
ss eur
ope
pub
lic secto
r ec
on
om
ics
42 (4) 381-414 (2018)
396 In addition just as the output of the production facility is determined with the qual-ity of the inputs which cannot be always controlled certain levels of the educa-tional process are determined by the outputs of the preceding processes Figura-tively one cannot make a tasty cake using salt instead of sugar For this problem DEA allows the definition of non-discretionary inputs which are relevant but they are not controllable and are defined by the environment (Banker and Morey 1986) This approach was used in some previous studies of education using DEA How-ever as we will explain in the following paragraphs we will treat the non-discre-tionary variables as discretionary to provide results that are more informative
DEA models can be output oriented aiming at maximization of outputs for the given level of inputs input-oriented aiming at minimization of inputs for the given level of outputs or non-oriented Also the models can assume constant variable or generalized returns to scale Following the nature of the problem we are analyzing we decide to use the output-oriented model assuming variable returns to scale (BCC model) To explain the methodology we first formulate the model Let there be N decision-making units (DMUs) DMU1 DMU2hellip DMUN which are homog-enous and comparative We assume that their efficiency should be estimated in terms of a certain number of inputs ndash the variables the values of which we want to be as small as possible and a certain number of outputs ndash variables the values of which we prefer to be as big as possible Let xij ge 0 be an i-th input for some DMUj
and yrj gt 0 its r-th output Therefore each DMUj is represented by a vector of inputs and a vector of out-puts so is an input matrix and is an output matrix To make the model stable it is recommended that the number of DMUs (N) should not exceed The BCC model (Banker Charnes and Cooper 1984) can be written in the following envelopment form
(1)
(2)
(3)
(4)
where ε gt 0 and and are slack variables If we denote the optimal solution as a DMUo is efficient if and only if the efficiency score and
all DMUo is weakly efficient if and only if but or for some i and r in some alternate optima (Cooper Seiford and Zhu 2011)
Otherwise a DMU is inefficient Resulting from the optimal solution of the pro-gram (1) ndash (4) an inefficient DMU can be projected to the BCC efficiency
oza
na n
ad
ov
eza jelić ma
rg
ar
eta ga
rd
ijan k
edžo
efficien
cy v
s effectiv
eness a
n an
aly
sis of tertia
ry edu
catio
n ac
ro
ss eur
ope
pub
lic secto
r ec
on
om
ics
42 (4) 381-414 (2018)397frontier as a combination of other DMU using the formulas
and (Cooper Seiford and Zhu 2011) Therefore the lambdas allow us to identify the peer group of an inefficient DMU By observing these efficient projections we can analyze how a DMU should increase its outputs andor decrease its inputs to become relatively efficient9
The period of analysis is divided into four subperiods 2004-2006 2007-2009 2010-2012 and 2013-2015 The selection of the periods is mostly dictated by the availability of the data and the change in the data methodology As explained in table 1 subperiods within 2004-2012 and subperiod 2013-2015 are characterized by different variables due to the availability of the data Therefore a direct com-parison of results between periods is not advisable
To circumvent the problem of missing data we decided to calculate the simple three ndash years averages of data as the closest representative of the period However even this procedure resulted in some countries having missing data so our approach was to exclude countries that had more than one missing data item In order to keep as many countries as possible in the sample those countries that had only one missing data item were kept in the sample and missing inputsoutputs were assigned a pessimistic value which is largesmall enough for an objective function not to be entered as proposed by Kuosmanen (2009) We did this only for countries that had one missing data item because we did not want to affect the ldquotechnology setrdquo and worsen the relative ranking of other DMUs that had com-plete data Additionally we checked that the objective function in the solution included a multiplier of 0 for inputsoutputs variables with an arbitrary set value
After the correction of the sample the analysis includes 24 EU countries Belgium Bulgaria the Czech Republic Denmark Germany Estonia Ireland Spain France Croatia Italy Latvia Lithuania Hungary the Netherlands Austria Poland Portu-gal Romania Slovenia Slovakia Finland Sweden and the United Kingdom
In the first step we run the quantity-based models using variables expenditures (I)EX2 and financial aid (I)FA(EX) as inputs and as outputs we use the percentage of graduates (O)GRAD(20-29) the education returns on labor market (O)UUT and the percentage of highly educated population (O)POPT for the period of 2004-2012 We performed a similar analysis for the period 2013-2015 except that variable (I)FA(EX) is replaced by the ratio of students per teacher (I)(ST) and variable (O)GRAD(20-29) with (O)GRAD(20-34) As is obvious such a selection of variables led to rewarding the quantity of the educational output and reporting on the efficiency of the tertiary education
The second step was to include quality corrections for the previously obtained efficiency analysis Firstly we take account of output-quality and then we intro-
9 Some additional explanation on the BCC and other DEA models can be found in for example Cooper Sei-ford and Tone (2006) or Cooper Seiford and Zhu (2011)
oza
na n
ad
ov
eza jelić ma
rg
ar
eta ga
rd
ijan k
edžo
efficien
cy v
s effectiv
eness a
n an
aly
sis of tertia
ry edu
catio
n ac
ro
ss eur
ope
pub
lic secto
r ec
on
om
ics
42 (4) 381-414 (2018)
398 duce the input-quality correction as well For the output-quality control we replace the output variable (O)UUT by the quality-corrected variable (O)UUTACT ((O)UUT multiplied with activity rates of the tertiary educated population) Also variable (O)POPT was substituted for by (O)GDPpc in 2004-2012 and by (O)UR university ranking in 2013-2015 (as (O)GDPpc and (O)UR showed to be highly positively correlated) Afterward the input-quality control was introduced by including PISA results in the analysis Altogether we estimated 6 different models using inputs and outputs in certain subperiods as presented in table 2
Table 2Variables used in each DEA model by period
Period 2004-2012 2013-2015Model Inputs Outputs Inputs Outputs
Quantity model
(I)EX2( GDP)(I)FA( EX)
(O)GRAD(20-29)(O)UUT(O)POPT
(I)EX2( GDP)(I)ST
(O)GRAD(20-34)(O)UUT(O)POPT
Output ndash quality model
(I)EX2( GDP)(I)FA( EX)
(O)GRAD(20-29)(O)UUTACT(O)GDPpc
(I)EX2( GDP)(I)ST)
(O)GRAD(20-34)(O)UUTACT(O)UR
Input ndash output quality model
(I)EX2( GDP)(I)FA( EX)(I)PISA a
(O)GRAD(20-29)(O)UUTACT(O)GDPpc
(I)EX2( GDP)(I)ST(I)PISA
(O)GRAD(20-34)(O)UUTACT(O)UR
a Circled variables present quality correction measuresSource Authors
5 results analysIs of the effIcIency and effectIVeness of tertIary educatIon In the eu
Figures 6a-6c present our results for the period of 2004-2012 whereas figure 6d shows the results for the last period of 2013-2015 which is analyzed using differ-ent variables Therefore we do not make ready comparisons between them How-ever the results from the period of 2013-2015 mostly support our conclusions and what we also conclude is that the choice of the variables for this period is rather robust and findings can be drawn that are similar to those from the period of 2007-2012
The tables with exact DEA scores for the analyzed period are given in table A5 in appendix and here we present the rankings resulting from these scores The dark bars in figures 6a-6d indicate the rankings of the countries calculated by the quan-tity model For the sake of clarity we present the higher ranking with a higher bar In addition we rank all efficient units as 24th and a unit with the highest inefficient score as the 23rd (or the second best) etc By generally observing the results we see that approximately a similar number of countries (9 to 14) remains efficient throughout the years within each model The relatively large number of efficient countries within each period is the result of the total number of input and output variables decreasing the number of inputs and outputs would decrease the num-ber of efficient countries However we aimed to include most of the variables that
oza
na n
ad
ov
eza jelić ma
rg
ar
eta ga
rd
ijan k
edžo
efficien
cy v
s effectiv
eness a
n an
aly
sis of tertia
ry edu
catio
n ac
ro
ss eur
ope
pub
lic secto
r ec
on
om
ics
42 (4) 381-414 (2018)399were used in the previous studies and this comes at a cost Quantity-based effi-
ciency results show that some of the most developed countries in the sample like Austria and the Netherlands are not efficient while some less developed countries like Hungary Estonia and Bulgaria define the efficient frontier in some periods The change of ranking reported by the output-quality model is shown with a striped bar When output-quality control is included most of the efficient coun-tries retain their position but a significant number of them decrease in rank and the rank of some of rises Overall the number of efficient countries decreases and the overall average efficiency score decreases
Afterward we take account of the quality of the inputs In the input-output quality model we add PISA as an input In this way if underachieving PISA results are relatively low it will increase the efficiency score If the opposite PISA will decrease the score In figures 6a-6d we use a dark black bar to indicate the differ-ence between rank in output-quality and input-output-quality model If the differ-ence is positive it means that countriesrsquo tertiary education produces relatively higher quality outputs given the relatively low quality of students (inputs) meas-ured by PISA results If the difference is negative the opposite is true In this way we get an insight into how the quality of the students measured by PISA can influence educational efficiency
When we consider educational output quality in our model it becomes obvious that countries which were inefficient in the quantity-based model and which are usually perceived as countries with solid educational systems improve their rank significantly Namely output-quality based efficiency results in almost all ana-lyzed periods (figures 6a-6d) show that Austria and the Netherlands reach the efficient frontier Austria and Netherlands are the most obvious examples but the same is true for Germany (2007-2009) Denmark (2007-2009 2010-2012) Swe-den (2007-2009 2010-2012) and Belgium (2013-2015) which also experience efficiency gains in output-quality model On the other hand less developed coun-tries (like Hungary Estonia and Bulgaria) lose their efficiency in all periods in the quality-based model in comparison to the quantity model
The correction for the input-quality generally shows that at a given level of PISA results for many countries the tertiary education efficiency ranking should actu-ally be increased This is noticeable for Austria Italy France and the Netherlands within developed countries and in Bulgaria (all periods) Croatia and Hungary (slight increase in all periods except 2007-2009) within the group of the less developed countries
For example during the period of 2007-2012 Croatiarsquos relative position is slightly degraded when an output-quality control is introduced Therefore when consider-ing the relatively poor quality of students in Croatia tertiary education effective-ness is greater than the output-quality model results imply Generally Croatia has one of the lowest indicators of (O)UUTACT and (O)GDPpc but according to
oza
na n
ad
ov
eza jelić ma
rg
ar
eta ga
rd
ijan k
edžo
efficien
cy v
s effectiv
eness a
n an
aly
sis of tertia
ry edu
catio
n ac
ro
ss eur
ope
pub
lic secto
r ec
on
om
ics
42 (4) 381-414 (2018)
400 our results it is not the worst ranked country in the EU concerning tertiary educa-tion efficiency and effectiveness By observing the reference set of efficient coun-tries for Croatia (identified by λgt0 from the model (1)-(4) results shown in tables A2-A4 in appendix) for the period 2004-2012 the BCC model projects Croatia using the inputoutput vectors of the efficient Czech Republic (among others) For the purpose of comparison the Czech Republic has lower inputs in expenditures and PISA and all outputs greater than Croatia
Poland and Estonia are less developed countries that could achieve greater tertiary education effectiveness given the relatively high-quality students The same can be concluded for Finland a developed country that ineffectively uses its high-quality students
Figure 6Results of the DEA analysis
a) 2004-2006 b) 2007-2009
-24-20-16-12-8-4048
12162024
-25-20-15-10-505
10152025
Quantity based score 0406Output quality based model (change to quantity model) ndash rhs 0406 Correction for input quality ndash rhs 0406
Quantity based score 0709Output quality based model (change to quantity model) ndash rhs 0709Correction for input quality ndash rhs 0709
Bul
garia
Rom
ania
Slov
akia
Hun
gary
Cro
atia
Lith
uani
a
Italy
Fran
ce
Aus
tria
Cze
ch R
Swed
en
Bel
gium
Portu
gal
UK
Spai
n
Latv
ia
Net
herla
nds
Ger
man
y
Pola
nd
Slov
enia
Den
mar
k
Irel
and
Finl
and
Esto
nia
Bul
garia
Rom
ania
Slov
akia
Hun
gary
Cro
atia
Lith
uani
aIta
lyFr
ance
Aus
tria
Cze
ch R
Sw
eden
Bel
gium
Portu
gal
UK
Spai
nLa
tvia
Net
herla
nds
Ger
man
y
Pola
nd
Slov
enia
Den
mar
k
Irel
and
Finl
and
Esto
nia
c) 2010-2012 d) 2013-2015
-24-20-16-12-8-4048
12162024
-24-20-16-12-8-4048
12162024
Quantity based score 1012Output quality based model (change to quantity model) ndash rhs 1012Correction for input quality ndash rhs 1012
Quantity based score 1315Output quality based model (change to quantity model) ndash rhs 1315Correction for input quality ndash rhs 1315
Bul
garia
Rom
ania
Slov
akia
Hun
gary
Cro
atia
Lith
uani
a
Italy
Fran
ce
Aus
tria
Cze
ch R
Swed
en
Bel
gium
Portu
gal
UK
Spai
n
Latv
ia
Net
herla
nds
Ger
man
y
Pola
nd
Slov
enia
Den
mar
k
Irel
and
Finl
and
Esto
nia
Bul
garia
Rom
ania
Slov
akia
Hun
gary
Cro
atia
Lith
uani
aIta
lyFr
ance
Aus
tria
Cze
ch R
Sw
eden
Bel
gium
Portu
gal
UK
Spai
n
Latv
ia
Net
herla
nds
Ger
man
y
Pola
nd
Slov
enia
Den
mar
k
Irel
and
Finl
and
Esto
nia
Source Authors
The question is what could a country do to be relatively better in the area of edu-cational quality in the future and what its closest quality-led efficient role models should be The optimal results of the BCC model provide the values of the slack variables for inefficient countries The slacks indicate the shortfalls in the data of a certain country and possible suggestions for future improvements in the quality
oza
na n
ad
ov
eza jelić ma
rg
ar
eta ga
rd
ijan k
edžo
efficien
cy v
s effectiv
eness a
n an
aly
sis of tertia
ry edu
catio
n ac
ro
ss eur
ope
pub
lic secto
r ec
on
om
ics
42 (4) 381-414 (2018)401aspect However the findings are related to a certain country and the analysis is
beyond the scope of this paper Interested readers can find the results in appendix (figure A1) where the figures indicate the greatest shortfalls in the of the origi-nal data for each country
We chose not to analyze the scale of suggested corrections for each country within each model but we give some general observations and comments on the indi-vidual results (1) periods of 2007-2009 and 2010-2012 show rather similar pat-terns where output quality corrections are noticeable for Bulgaria Estonia and Denmark (2) in the period of 2007-2015 Austria and the Netherlands improve their rating after both output and input-output quality corrections (3) Poland and especially Finland and Estonia are the only countries able to utilize their high-quality students (measured by PISA results) more effectively (in terms of educa-tional outputsoutcomes quality) Finally the overall best-ranked countries after both input and output quality control for the whole period of 2004-2015 are the UK Slovakia Italy France Lithuania Ireland and Finland
6 PolIcy ImPlIcatIons and future research recommendatIonsThis paper has dealt with tertiary education efficiency and effectiveness in the EU It is a well-established fact that the quality of education matters more than the quantity Still most of the papers which use the DEA approach make tertiary edu-cation comparisons between countries considering only the definition of effi-ciency Some papers deal with quality issues but mostly on the output side of the educational ldquoproduction functionrdquo Therefore the questions regarding the quality of educational inputs and outputs and the effectiveness are usually covered only partially In this paper we argue that a greater focus on efficiency can give mis-leading results which could translate into flawed educational policy prescriptions
We performed DEA over available educational inputs and outputs during four non-overlapping periods from 2004 to 2015 in 24 EU countries DEA allowed us to rank countries regarding their tertiary education efficiencyeffectiveness in achieving favorable educational and labor market outcomes However we argued that DEA results should be interpreted with a great deal of caution and should not serve as important educational policy and strategy inputs due to the lack of the quality of educational inputs and outputs considerations as well as the decreasing returns on higher education in countries with broad coverage of the population by tertiary edu-cation To avoid a potential bias towards the low input units within the DEA educa-tional inputs and outputs were adjusted for the quality of education indicators Spe-cifically we differentiated the quantity and quality measures of educational inputs and outputs which enabled us to distinguish tertiary education efficiency from ter-tiary education effectiveness since the latter seems to matter more for growth
Our results show that many less developed EU countries achieve efficiency but not effectiveness in tertiary education The opposite is true for some developed coun-tries This is possible due to the low (high) educational inputs in less (more) devel-
oza
na n
ad
ov
eza jelić ma
rg
ar
eta ga
rd
ijan k
edžo
efficien
cy v
s effectiv
eness a
n an
aly
sis of tertia
ry edu
catio
n ac
ro
ss eur
ope
pub
lic secto
r ec
on
om
ics
42 (4) 381-414 (2018)
402 oped countries However when we consider some quality indicators of outcomesoutputs a few less developed EU countries which were characterized as efficient in the quantity model fail to reach defined efficiency border On the other hand some of the inefficient developed countries increase their DEA based ranking and achieve effectiveness (quality-based efficiency) It is not only that the quality of educational outputs matters for the results but the same is true for input quality considerations It turns out that some countries which were downgraded (upgraded) in the output quality DEA model have a lower (higher) quality student base as measured by PISA results Since it could not be expected that tertiary education provides the same quality of outcomes with different input quality efficiency improves (deteriorates) in the input-output quality-based model in many countries with a low (high) quality student base Therefore the results confirmed our hypothesis that quality considera-tions could significantly affect standard tertiary education efficiency analysis results Any future research in this area should not evaluate tertiary education effi-ciency only in terms of the quantity measures of educational inputs and outputs As already emphasized the literature on economic growth and convergence long ago acknowledged educational quality as being more important than quantity DEA based efficiencyeffectiveness research should follow this example
Future research should dig deeper into the rich set of models and results which DEA provides Questions like ldquowhat induces inefficiency in inefficient countriesrdquo (see figure A1 in appendix) and ldquowhich countries define the reference sets (role-models) for inefficient countriesrdquo (see tables A2-A4 in appendix) are especially important for countries like Croatia which proved to be inefficient and ineffective regarding tertiary education Research into the first question should illuminate potential financial black holes while the answers to the second question could shed some light on good practices which could be (easily) implemented in Croa-tian education and customized for its needs From the methodological point of view any future research should address the issues of large numbers of variables which result in too many efficient decision units (countries) as well as some tim-ing and variable selection issues
The key policy implication of our results suggests that greater emphasis should be put on the convergence of tertiary education effectiveness (and not efficiency) within the EU to enhance transmission of tertiary education outcomes into higher productivity and growth rates However since primary and secondary education define the ldquoqualityrdquo of inputs at higher educational levels such a policy task requires comprehensive educational reform in countries which are lagging behind Nevertheless it should be emphasized that the major limitations of the study fol-low from the limited data resources and some concerns about the quality of the data reported by Eurostat The inclusion of data that do not properly represent the situation might significantly change the relative results of the analysis
disclosure statement No potential conflict of interest was reported by the authors
oza
na n
ad
ov
eza jelić ma
rg
ar
eta ga
rd
ijan k
edžo
efficien
cy v
s effectiv
eness a
n an
aly
sis of tertia
ry edu
catio
n ac
ro
ss eur
ope
pub
lic secto
r ec
on
om
ics
42 (4) 381-414 (2018)403
aPP
en
dIX
Ta
bl
e a
1Pr
evio
us re
sear
ch ra
nkin
gs (D
EA)
Pape
ra
hec
Šonj
e
Des
kar-
Škrb
ić
and
Šonj
e (2
018)
toth
(2
009)
ari
stov
nik
and
Oba
dić
(201
1)a
ubyn
et a
l (2
009)
yoto
va a
nd
stef
anov
a (2
017)
year
2005
-201
3 (a
vg)
2006
1999
-200
7 (a
vg)
1998
-20
0120
02-
2005
1998
-20
0120
02-
2005
1998
-20
0120
02-
2005
1998
-20
0120
02-
2005
2012
and
201
4
mod
el1
21
12
31
12
23
34
41
23
no
of e
u c
ount
ries
1117
2222
2225
9A
ustri
a
15
13 9
11 9
10 6
9 8
B
ulga
ria3
31
10 8
10 8
2420
2325
65
5B
elgi
um
2121
2625
8 8
7 9
C
ypru
s
3727
11
1027
23
Cze
ch R
epub
lic1
111
133
717
18
14
1722
243
31
Ger
man
y
13
1516
1210
911
1011
D
enm
ark
111
1 9
111
10 8
7
Esto
nia
82
21
1619
2728
1722
1815
1716
77
6G
reec
e
18
1910
3118
2228
2719
2424
23
Spai
n
1
3217
3426
2720
2021
1818
15
Finl
and
12 1
120
1 7
1 7
1 7
1 5
Fr
ance
934
2432
1917
1611
1213
1214
C
roat
ia9
8
2632
23
Hun
gary
47
1612
28 9
2323
2426
2322
2122
88
8Ir
elan
d
1721
14 1
1 1
1 1
1 1
1
Italy
118
2322
1212
1314
1312
1312
oza
na n
ad
ov
eza jelić ma
rg
ar
eta ga
rd
ijan k
edžo
efficien
cy v
s effectiv
eness a
n an
aly
sis of tertia
ry edu
catio
n ac
ro
ss eur
ope
pub
lic secto
r ec
on
om
ics
42 (4) 381-414 (2018)
404
Pape
ra
hec
Šonj
e
Des
kar-
Škrb
ić
and
Šonj
e (2
018)
toth
(2
009)
ari
stov
nik
and
Oba
dić
(201
1)a
ubyn
et a
l (2
009)
yoto
va a
nd
stef
anov
a (2
017)
year
2005
-201
3 (a
vg)
2006
1999
-200
7 (a
vg)
1998
-20
0120
02-
2005
1998
-20
0120
02-
2005
1998
-20
0120
02-
2005
1998
-20
0120
02-
2005
2012
and
201
4
mod
el1
21
12
31
12
23
34
41
23
Lith
uani
a1
1
112
128
2621
1917
1616
171
11
Latv
ia1
1
2013
2317
11
1M
alta
16
1519
16 7
911
10
Net
herla
nds
10 1
1 1
1 1
5 1
6
Pola
nd5
117
122
1322
2018
1516
1915
185
64
Portu
gal
1425
2522
2122
2120
21
Rom
ania
26
13
3510
113
22
2Sw
eden
823
827
1 1
1 1
1 1
1 1
Sl
oven
ia7
5
113
129
1415
1825
2525
204
44
Slov
akia
64
1 1
36 1
2424
2524
1514
1919
U
nite
d K
ingd
om
7
2219
17 1
1 1
1 1
1 1
1
Sour
ce A
utho
rs
oza
na n
ad
ov
eza jelić ma
rg
ar
eta ga
rd
ijan k
edžo
efficien
cy v
s effectiv
eness a
n an
aly
sis of tertia
ry edu
catio
n ac
ro
ss eur
ope
pub
lic secto
r ec
on
om
ics
42 (4) 381-414 (2018)405Figure a1
Input and output slacks of inefficient countriesa) Quantity model results
i Output slacks () ii Input slacks ()
-45-40-35-30-25-20-15-10-50
Finl
and
Slov
enia
Net
herla
nds
Den
mar
kEs
toni
aB
elgi
umH
unga
rySw
eden
Pola
ndC
roat
iaPo
rtuga
lR
oman
iaA
ustri
aB
ulga
riaC
zech
R
Ger
man
yLa
tvia
(I)EX2( GDP) (I)FA( EX) (I)ST
0
10
20
30
40
50
60
70
Portu
gal
Aus
tria
Ger
man
yR
oman
iaB
ulga
riaSl
oven
iaSw
eden
Net
herla
nds
Hun
gary
Cro
atia
Finl
and
Esto
nia
Bel
gium
Pola
ndD
enm
ark
Cze
ch R
La
tvia
(O)GRAD(20-29) (O)POPT (O)UUT
b) Outputs quality model resultsi Output slacks () ii Input slacks ()
-60
-50
-40
-30
-20
-10
0
Finl
and
Den
mar
kR
oman
iaSl
oven
iaEs
toni
aSw
eden
Portu
gal
Hun
gary
Net
herla
nds
Cro
atia
Cze
ch R
Po
land
Bel
gium
Bul
garia
Spai
nG
erm
any
Aus
tria
Fran
ceIr
elan
dLa
tvia
(I)EX2( GDP) (I)FA( EX) (I)ST (O)GRAD(20-29) (O)UUTACTT
(O)GDPpc (O)UR
0
50
100
150
200
250
300A
ustri
aG
erm
any
Portu
gal
Spai
nEs
toni
aB
ulga
riaH
unga
rySl
oven
iaC
roat
iaSw
eden
Net
herla
nds
Rom
ania
Irel
and
Bel
gium
Finl
and
Latv
iaD
enm
ark
Cze
ch R
Fr
ance
Pola
nd
c) Inputs and outputs quality model resultsi Output slacks () ii Input slacks ()
Den
mar
kR
oman
ia
Slov
enia
Swed
enPo
rtuga
l
Hun
gary
Net
herla
nds
Cro
atia
Bel
gium
Bul
garia
Spai
n
Ger
man
yA
ustri
aIta
lyLa
tvia
Lith
uani
a
Den
mar
k
Rom
ania
Slov
enia
Swed
en
Portu
gal
Hun
gary
Net
herla
nds
Cro
atia
Bel
gium
Bul
garia
Spai
nG
erm
any
Aus
tria
Italy
Latv
ia
Lith
uani
a
(I)EX2( GDP) (I)FA( EX) (O)GRAD(20-29) (O)UUTACTT
(I)ST (I)PISA (O)GDPpc (O)UR
-60
-50
-40
-30
-20
-10
0
0
50
100
150
200
250
300
Source Authors
oza
na n
ad
ov
eza jelić ma
rg
ar
eta ga
rd
ijan k
edžo
efficien
cy v
s effectiv
eness a
n an
aly
sis of tertia
ry edu
catio
n ac
ro
ss eur
ope
pub
lic secto
r ec
on
om
ics
42 (4) 381-414 (2018)
406T
ab
le a
2Re
fere
nce
set o
f a D
MU
from
the
quan
tity-
base
d D
EA m
odel
by
peri
od
2004
-200
620
07-2
009
2010
-201
220
13-2
015
1B
elgi
umB
elgi
umB
elgi
um
Bel
gium
Irel
and-
Lith
uani
a2
Bul
garia
Bul
garia
Bel
gium
-Cze
ch R
ep-E
ston
ia-F
inla
ndB
ulga
riaC
zech
Rep
-Ger
man
y-Sl
ovak
ia-U
K3
Cze
ch R
ep
Cze
ch R
ep
Cze
ch R
ep
Cze
ch R
ep
Cze
ch R
ep
4D
enm
ark
Den
mar
kD
enm
ark
Irel
and-
Lith
uani
a-U
KIr
elan
d-Li
thua
nia
5G
erm
any
Ger
man
yB
elgi
um-S
lova
kia-
Finl
and
Bul
garia
-Hun
gary
-Fin
land
-UK
Ger
man
y6
Esto
nia
Esto
nia
Esto
nia
Esto
nia
Esto
nia
7Ir
elan
dIr
elan
dIr
elan
d Ir
elan
dIr
elan
d8
Spai
nSp
ain
Spai
n Sp
ain
Spai
n9
Fran
ceFr
ance
Fran
ce
Fran
ceFr
ance
10C
roat
iaC
roat
iaC
zech
Rep
-Spa
in-C
roat
ia-P
olan
dC
zech
Rep
-Fra
nce-
Pola
ndC
zech
Rep
-Lith
uani
a11
Italy
Italy
Italy
Ita
lyIta
ly
12La
tvia
Latv
iaLa
tvia
C
zech
Rep
-Fra
nce-
Lith
uani
a-Po
land
-Rom
ania
Cze
ch R
ep-G
erm
any-
Irel
and-
Lith
uani
a-U
K13
Lith
uani
aLi
thua
nia
Lith
uani
a Li
thua
nia
Lith
uani
a14
Hun
gary
Hun
gary
Irel
and-
Slov
akia
-Fin
land
-UK
Hun
gary
Hun
gary
15N
ethe
rland
sN
ethe
rland
sB
elgi
um-D
enm
ark-
Finl
and
Irel
and-
Finl
and-
UK
Irel
and-
Lith
uani
a16
Aus
tria
Aus
tria
Bel
gium
-Slo
vaki
a-Fi
nlan
d B
ulga
ria-S
pain
-Slo
vaki
a-U
KC
zech
Rep
-Spa
in-S
lova
kia-
UK
17Po
land
Pola
ndPo
land
Po
land
Lith
uani
a18
Portu
gal
Portu
gal
Irel
and-
Lith
uani
a-Po
land
-Slo
vaki
aFr
ance
-Lith
uani
a-R
oman
ia-U
KLi
thua
nia-
Slov
akia
19R
oman
iaR
oman
iaPo
land
-Slo
vaki
aR
oman
iaR
oman
ia20
Slov
enia
Slov
enia
Lith
uani
a-Sl
ovak
ia-U
K
Bul
garia
-Lith
uani
a-H
unga
ry-U
KIr
elan
d-Li
thua
nia
21Sl
ovak
iaSl
ovak
iaSl
ovak
ia
Slov
akia
Slov
akia
22Fi
nlan
dFi
nlan
dFi
nlan
d Fi
nlan
dIr
elan
d-Li
thua
nia
23Sw
eden
Swed
enB
elgi
um-D
enm
ark-
Finl
and
Irel
and-
Finl
and-
UK
Irel
and-
Lith
uani
a24
UK
UK
UK
U
KU
KN
ote
Effi
cien
t cou
ntri
es a
re a
pro
ject
ion
of th
emse
lves
So
urce
Aut
hors
oza
na n
ad
ov
eza jelić ma
rg
ar
eta ga
rd
ijan k
edžo
efficien
cy v
s effectiv
eness a
n an
aly
sis of tertia
ry edu
catio
n ac
ro
ss eur
ope
pub
lic secto
r ec
on
om
ics
42 (4) 381-414 (2018)407
Ta
bl
e a
3Re
fere
nce
set o
f a D
MU
from
the
outp
ut q
ualit
y-ba
sed
DEA
mod
el b
y pe
riod
2004
-200
620
07-2
009
2010
-201
220
13-2
015
1B
elgi
umIr
elan
d-Ita
ly-S
lova
kia-
UK
Irel
and-
Fran
ce-L
ithua
nia-
Slov
akia
-UK
Cze
ch R
ep-G
erm
any-
Irel
and-
Aus
tria
Ger
man
y-N
ethe
rland
s-U
K
2B
ulga
riaC
zech
Rep
-Lat
via-
Lith
uani
a-Sl
ovak
iaC
zech
Rep
-Slo
vaki
aC
zech
Rep
-Ger
man
y-Sl
ovak
iaG
erm
any-
Lith
uani
a-Sl
ovak
ia-
Swed
en3
Cze
ch R
ep
Cze
ch R
ep
Cze
ch R
ep
Cze
ch R
ep
Lith
uani
a-H
unga
ry-U
K4
Den
mar
kIr
elan
d-Li
thua
nia
Irel
and-
Lith
uani
aIr
elan
d-Li
thua
nia
Den
mar
k5
Ger
man
yC
zech
Rep
-Ire
land
Ger
man
yG
erm
any
Ger
man
y
6Es
toni
aC
zech
Rep
-Ire
land
-Pol
and-
UK
Cze
ch R
ep-I
rela
nd-L
ithua
nia-
Rom
ania
Cze
ch R
ep-G
erm
any-
Irel
and-
Lith
uani
aD
enm
ark-
Lith
uani
a-N
ethe
rland
s-Sw
eden
7Ir
elan
dIr
elan
dIr
elan
dIr
elan
dIr
elan
d
8Sp
ain
Cze
ch R
ep-I
rela
nd-F
ranc
eC
zech
Rep
-Fra
nce-
Aus
tria-
Slov
akia
Cze
ch R
ep-S
pain
-Fra
nce-
Italy
Spai
n
9Fr
ance
Fran
ceFr
ance
Fran
ceFr
ance
10C
roat
iaC
zech
Rep
-Cro
atia
-Pol
and
Cze
ch R
ep-P
olan
dC
zech
Rep
-Lith
uani
aD
enm
ark-
Lith
uani
a-Sl
ovak
ia-
Swed
en11
Italy
Italy
Italy
Italy
Italy
-UK
12La
tvia
Latv
iaC
zech
Rep
-Lith
uani
a-R
oman
ia-
Slov
akia
Cze
ch R
ep-G
erm
any-
Lith
uani
aLi
thua
nia-
Hun
gary
-UK
13Li
thua
nia
Lith
uani
aLi
thua
nia
Lith
uani
aLi
thua
nia
14H
unga
ryLi
thua
nia-
Pola
nd-S
lova
kia-
UK
Cze
ch R
ep
Cze
ch R
ep-G
erm
any
Hun
gary
15N
ethe
rland
sC
zech
Rep
-Ire
land
Net
herla
nds
Net
herla
nds
Net
herla
nds
16A
ustri
aIr
elan
d-Ita
ly-S
lova
kia-
UK
Aus
tria
Aus
tria
Den
mar
k-N
ethe
rland
s-Sw
eden
-UK
17Po
land
Pola
ndPo
land
Lith
uani
aD
enm
ark-
Irel
and-
Lith
uani
a-U
K
oza
na n
ad
ov
eza jelić ma
rg
ar
eta ga
rd
ijan k
edžo
efficien
cy v
s effectiv
eness a
n an
aly
sis of tertia
ry edu
catio
n ac
ro
ss eur
ope
pub
lic secto
r ec
on
om
ics
42 (4) 381-414 (2018)
408
2004
-200
620
07-2
009
2010
-201
220
13-2
015
18Po
rtuga
lC
zech
Rep
-Ire
land
-Fra
nce
Irel
and-
Lith
uani
a-R
oman
iaG
erm
any-
Irel
and-
Lith
uani
aD
enm
ark-
Lith
uani
a-Sl
ovak
ia-
Swed
en-U
K19
Rom
ania
Lith
uani
a-Po
land
-Slo
vaki
aR
oman
iaR
oman
iaD
enm
ark-
Spai
n-Sl
ovak
ia-U
K
20Sl
oven
iaC
zech
Rep
-Ire
land
-UK
Cze
ch R
ep-I
rela
nd-
Lith
uani
a-U
KIr
elan
d-Li
thua
nia
Den
mar
k-Ir
elan
d-Li
thua
nia-
UK
21Sl
ovak
iaSl
ovak
iaSl
ovak
iaSl
ovak
iaSl
ovak
ia
22Fi
nlan
dC
zech
Rep
-Ire
land
Cze
ch R
ep-I
rela
nd-U
KC
zech
Rep
-Ger
man
y-Ir
elan
d-A
ustri
aD
enm
ark-
Lith
uani
a-N
ethe
rland
s-Sw
eden
23Sw
eden
Cze
ch R
ep-I
rela
ndG
erm
any-
Irel
and-
Net
herla
nds
Ger
man
y-N
ethe
rland
s-A
ustri
aSw
eden
24U
KU
KU
KU
KU
KSo
urce
Aut
hors
oza
na n
ad
ov
eza jelić ma
rg
ar
eta ga
rd
ijan k
edžo
efficien
cy v
s effectiv
eness a
n an
aly
sis of tertia
ry edu
catio
n ac
ro
ss eur
ope
pub
lic secto
r ec
on
om
ics
42 (4) 381-414 (2018)409
Ta
bl
e a
4Re
fere
nce
set o
f a D
MU
from
the
inpu
t and
out
put q
ualit
y ndash
base
d D
EA m
odel
by
peri
od
2004
-200
620
07-2
009
2010
-201
220
13-2
015
1B
elgi
umIr
elan
d-Fr
ance
-Ita
ly-
Slov
akia
-UK
Bel
gium
Cze
ch R
ep-G
erm
any-
Irel
and-
Aus
tria
Ger
man
y-N
ethe
rland
s-U
K
2B
ulga
riaC
zech
Rep
-Lat
via-
Lith
uani
a-Sl
ovak
iaC
zech
Rep
-Slo
vaki
aC
zech
Rep
-Ger
man
y-Sl
ovak
iaG
erm
any-
Lith
uani
a-Sl
ovak
ia-
Swed
en3
Cze
ch R
ep
Cze
ch R
ep
Cze
ch R
ep
Cze
ch R
ep
Cze
ch R
ep
4D
enm
ark
Irel
and-
Lith
uani
aD
enm
ark
Irel
and-
Lith
uani
aD
enm
ark
5G
erm
any
Cze
ch R
ep-I
rela
ndG
erm
any
Ger
man
yG
erm
any
6Es
toni
aEs
toni
aEs
toni
aEs
toni
aEs
toni
a7
Irel
and
Irel
and
Irel
and
Irel
and
Irel
and
8Sp
ain
Cze
ch R
ep-I
rela
nd-F
ranc
eC
zech
Rep
-Ger
man
y-Fr
ance
-A
ustri
a-Sl
ovak
iaSp
ain
Spai
n
9Fr
ance
Fran
ceFr
ance
Fran
ceFr
ance
10C
roat
iaC
roat
iaC
zech
Rep
-Pol
and
Cze
ch R
ep-L
ithua
nia
Den
mar
k-Li
thua
nia-
Slov
akia
-Sw
eden
11Ita
lyIta
lyIta
lyIta
lyIta
ly
12La
tvia
Latv
iaLa
tvia
Cze
ch R
ep-L
ithua
nia-
Pola
nd-
Finl
and
Ger
man
y-Ir
elan
d-Li
thua
nia-
Finl
and-
UK
13Li
thua
nia
Lith
uani
aLi
thua
nia
Lith
uani
aLi
thua
nia
14H
unga
ryC
zech
Rep
-Ire
land
-Pol
and-
UK
Cze
ch R
ep-S
lova
kia-
Finl
and
Cze
ch R
ep-G
erm
any
Hun
gary
15N
ethe
rland
sC
zech
Rep
-Ire
land
-Fin
land
Net
herla
nds
Net
herla
nds
Net
herla
nds
16A
ustri
aIr
elan
d-Ita
ly-S
lova
kia-
UK
Aus
tria
Aus
tria
Den
mar
k-Sw
eden
-UK
17Po
land
Pola
ndPo
land
Pola
ndPo
land
18Po
rtuga
lC
zech
Rep
-Ire
land
-Fra
nce
Irel
and-
Lith
uani
a-Po
land
-R
oman
iaG
erm
any-
Irel
and-
Lith
uani
aD
enm
ark-
Spai
n-Li
thua
nia-
Slov
akia
-Sw
eden
-UK
oza
na n
ad
ov
eza jelić ma
rg
ar
eta ga
rd
ijan k
edžo
efficien
cy v
s effectiv
eness a
n an
aly
sis of tertia
ry edu
catio
n ac
ro
ss eur
ope
pub
lic secto
r ec
on
om
ics
42 (4) 381-414 (2018)
410
2004
-200
620
07-2
009
2010
-201
220
13-2
015
19R
oman
iaLi
thua
nia-
Pola
nd-S
lova
kia
Rom
ania
Rom
ania
Den
mar
k-Sp
ain-
Slov
akia
-UK
20Sl
oven
iaC
zech
Rep
-Ire
land
-Pol
and-
Finl
and
Cze
ch R
ep-I
rela
nd-
Lith
uani
a-U
KIr
elan
d-Li
thua
nia
Den
mar
k-Es
toni
a-Ir
elan
d-Fi
nlan
d-U
K21
Slov
akia
Slov
akia
Slov
akia
Slov
akia
Slov
akia
22Fi
nlan
dFi
nlan
dFi
nlan
dFi
nlan
dFi
nlan
d23
Swed
enC
zech
Rep
-Ire
land
Ger
man
y-Ir
elan
d-N
ethe
rland
sG
erm
any-
Net
herla
nds-
Aus
tria
Swed
en24
UK
UK
UK
UK
UK
Sour
ce A
utho
rs
oza
na n
ad
ov
eza jelić ma
rg
ar
eta ga
rd
ijan k
edžo
efficien
cy v
s effectiv
eness a
n an
aly
sis of tertia
ry edu
catio
n ac
ro
ss eur
ope
pub
lic secto
r ec
on
om
ics
42 (4) 381-414 (2018)411
Ta
bl
e a
5Ef
ficie
ncy
scor
es o
btai
ned
from
all
mod
els
by p
erio
d
Qua
ntity
mod
elo
utpu
t qua
lity
mod
elIn
put a
nd o
utpu
t qua
lity
mod
el20
04-2
006
2007
-200
920
10-2
012
2013
-201
520
04-2
006
2007
-200
920
10-2
012
2013
-201
520
04-2
006
2007
-200
920
10-2
012
2013
-201
51
Bel
gium
11
095
40
905
094
097
30
929
098
90
961
10
929
098
92
Bul
garia
087
91
096
41
070
70
879
086
40
986
070
70
879
086
40
986
3C
zech
Rep
1
11
095
11
11
098
11
11
4D
enm
ark
10
932
091
21
087
70
996
099
31
087
71
099
31
5G
erm
any
087
60
954
11
093
11
10
931
11
6Es
toni
a1
11
093
10
770
837
073
90
748
11
11
7Ir
elan
d1
11
11
11
11
11
18
Spai
n1
11
10
920
943
11
092
095
21
19
Fran
ce1
11
11
11
11
11
110
Cro
atia
10
803
080
60
873
10
808
080
60
821
10
808
080
60
821
11Ita
ly1
11
11
11
11
11
112
Latv
ia1
094
30
905
085
71
091
90
904
086
21
10
955
092
413
Lith
uani
a1
11
11
11
11
11
114
Hun
gary
089
81
11
081
10
847
087
91
081
60
909
087
91
15N
ethe
rland
s0
929
091
60
853
087
80
947
11
10
957
11
116
Aus
tria
071
90
805
084
10
843
097
71
10
90
977
11
09
17Po
land
11
10
995
11
10
975
11
11
18Po
rtuga
l0
591
062
80
679
072
50
742
071
30
740
733
074
20
713
074
073
719
Rom
ania
076
81
10
748
075
11
10
725
075
11
10
725
20Sl
oven
ia0
811
073
50
741
076
80
810
763
078
90
752
082
40
763
078
90
833
21Sl
ovak
ia1
11
11
11
11
11
122
Finl
and
11
099
50
997
093
50
990
967
092
41
11
123
Swed
en0
903
090
60
914
10
908
096
90
981
090
80
969
098
124
UK
11
11
11
11
11
11
Sour
ce A
utho
rs
oza
na n
ad
ov
eza jelić ma
rg
ar
eta ga
rd
ijan k
edžo
efficien
cy v
s effectiv
eness a
n an
aly
sis of tertia
ry edu
catio
n ac
ro
ss eur
ope
pub
lic secto
r ec
on
om
ics
42 (4) 381-414 (2018)
412 references1 Afonso A and St Aubyn M 2006 Cross-country efficiency of secondary
education provision A semi-parametric analysis with non-discretionary inputs Economic Modelling 23(3) pp 476-491 httpsdoiorg101016jeconmod200602003
2 Ahec Šonje A Deskar-Škrbić M and Šonje V 2018 Efficiency of public expenditure on education comparing Croatia with other NMS MPRA Paper No 85152 Available at lthttpsmpraubuni-muenchende851521MPRA_paper_85152pdfgt
3 Altinok N Diebolt C and Demeulemeester J-L 2014 A new international database on education quality 1965-2010 Applied Economics 46(11) pp 1212-1247 httpsdoiorg101080000368462013868592
4 Aristovnik A 2013a Technical Efficiency of Education Sector in the EU and OECD Countries The Case of Tertiary Education Conference Proceedings 16th Toulon-Verona Conference ldquoExcellence in Servicesrdquo Ljubljana 29-30 August 2013 pp 43-51
5 Aristovnik A 2013b Relative efficiency of education expenditures in East-ern Europe a non-parametric approach Journal of Knowledge Management Economics and Information Technology ScientificPapersorg 3(3) 1-4 Avail-able at lthttpwwwscientificpapersorgwp-contentfiles1379_ARISTOVNIK_Relative_Efficiency_of_Education_Expenditures_in_Eastern_Europepdfgt
6 Aristovnik A and Obadić A 2011 The funding and efficiency of higher education in Croatia and Slovenia a non-parametric comparison Amfiteatru Economic 13(30) pp 362-376 Available at lthttpwwwamfiteatrueco-nomicrotempArticle_1050pdfgt
7 Aristovnik A and Obadić A 2014 Measuring relative efficiency of second-ary education in selected EU and OECD countries the case of Slovenia and Croatia Technological and Economic Development of Economy 20(3) pp 419-433 httpsdoiorg103846202949132014880085
8 Aubyn M S [et al] 2008 Study on the efficiency and effectiveness of public spending on tertiary education European Economy Economic Papers No 390 httpsdoiorg10276530348
9 Banker R D Charnes A and Cooper W W 1984 Some Models for Esti-mating Technical and Scale Inefficiencies in Data Envelopment Analysis Management Science 30(9) pp 1078-1092 Available at lthttpwwwutdal-lasedu~ryoungphdseminarBCC1984pdfgt
10 Banker R D and Morey R C 1986 Efficiency Analysis for Exogenously Fixed Inputs and Outputs Operations Research 34(4) pp 513-521 httpsdoiorg101287opre344513
11 Barro R 2001 Human Capital and Growth The American Economic Review 91(2) pp 12-17 Available at lthttpswwwaeaweborgarticlesid=101257aer91212gt
12 Barro R 2013 Education and Economic Growth Annals of Economics and Finance 14(2) pp 301-328 Available at lthttpdownaefwebnetWorking-Papersw571pdfgt
oza
na n
ad
ov
eza jelić ma
rg
ar
eta ga
rd
ijan k
edžo
efficien
cy v
s effectiv
eness a
n an
aly
sis of tertia
ry edu
catio
n ac
ro
ss eur
ope
pub
lic secto
r ec
on
om
ics
42 (4) 381-414 (2018)41313 Bourguignon F Elkana Y and Pleskovic B 2007 Capacity Building in
Economics Education and Research Washington DC World Bank14 Charnes A Cooper W W and Rhodes E 1978 Measuring the efficiency of
decision making units European Journal of Operational Research 2(6) pp 429-444 httpsdoiorg1010160377-2217(78)90138-8
15 Clements B J 2002 How efficient is education spending in Europe Euro-pean review of economics and finance 1(1) pp 3-26
16 Cooper W W Seiford L M and Zhu J (eds) 2011 Handbook on Data Envelopment Analysis International Series in Operations Research amp Man-agement Science Cham Springer Science and Business Media
17 Cooper W W and Seiford L M Tone K 2006 Introduction to Data Envel-opment Analysis and Its Uses New York Springer
18 Emrouznejad A and Yang G 2018 A survey and analysis of the first 40 years of scholarly literature in DEA 1978-2016 Socio-Economic Planning Sciences Recent developments on the use of DEA in the public sector 61(March) pp 4-8 httpsdoiorg101016jseps201701008
19 Eurostat 2018a Main GDP aggregates per capita Gross domestic product at market prices Luxembourg Eurostat Available at lthttpappssoeurostateceuropaeunuishowdodataset=nama_10_pcamplang=engt
20 Eurostat 2018b Population by educational attainment level sex and age () ndash main indicators Luxembourg Eurostat Available at lthttpappssoeuro-stateceuropaeunuishowdodataset=edat_lfse_03amplang=enggt
21 Eurostat 2018c Financial aid to students by education level ndash as of total public expenditure Luxembourg Eurostat Available at lthttpseceuropaeueurostatwebproducts-datasetsproductcode=educ_uoe_fina01gt
22 Eurostat 2018d General government expenditure by function (COFOG) Luxembourg Eurostat Available at lthttpseceuropaeueurostatstatistics-explainedindexphpGovernment_expenditure_by_function_E28093_COFOGgt
23 Eurostat 2018e Ratio of pupils and students to teachers and academic staff by education level and programme orientation Luxembourg Eurostat Avail-able at lthttpsdataeuropaeueuodpdatadatasetSGGhyHTPqi7AMFH-FePHoxwgt
24 Eurostat 2018f Tertiary education graduates Luxembourg Eurostat Avail-able at lthttpseceuropaeueurostatstatistics-explainedindexphpTertiary_ education_statisticsgt
25 Eurostat 2018g Graduates by education level programme orientation com-pletion sex and age Luxembourg Eurostat Available at lthttpsdataeuropaeueuodpdatadatasetBhJ0FRyxpdrmRBlsQAkggt
26 Eurostat 2018h Unemployment rates by sex age and educational attainment level () Luxembourg Eurostat Available at lthttpappssoeurostateceuropaeunuishowdodataset=lfsq_urgaedamplang=engt
27 Eurostat 2018i Activity rates by sex age and educational attainment level () Luxembourg Eurostat Available at lthttpappssoeurostateceuropaeunuishowdodataset=lfsa_argaedamplang=engt
oza
na n
ad
ov
eza jelić ma
rg
ar
eta ga
rd
ijan k
edžo
efficien
cy v
s effectiv
eness a
n an
aly
sis of tertia
ry edu
catio
n ac
ro
ss eur
ope
pub
lic secto
r ec
on
om
ics
42 (4) 381-414 (2018)
414 28 Eurostat 2018j Underachieving 15-year-old students by sex and field ndash PISA survey Luxembourg Eurostat Available at lthttpseceuropaeueurostatwebproducts-datasetsproductcode=educ_outc_pisagt
29 Fortunato P and Panizza U 2015 Democracy education and the quality of government Journal of Economic Growth 20(4) pp 333-363 httpsdoiorg101007s10887-015-9120-5
30 Hanushek E A and Kimko D D 2000 Schooling Labor-Force Quality and the Growth of Nations American Economic Review 90(5) pp 1184-1208 httpsdoiorg101257aer9051184
31 Kenny J 2008 Efficiency and Effectiveness in Higher Education Who is Accountable for What Australian Universitiesrsquo Review 50(1) pp 11-19 Available at lthttpsfilesericedgovfulltextEJ802278pdfgt
32 Kuosmanen T 2009 Data Envelopment Analysis with Missing Data The Journal of the Operational Research Society 60(12) pp 1767-1774 httpsdoiorg101057jors2008132
33 Pritchett L 2001 Where Has All the Education Gone The World Bank Eco-nomic Review 15(3) pp 367-391 Available at lthttpdocumentsworld-bankorgcurateden859821468180273788pdf773740JRN020010l0the0Education0Gonepdfgt
34 Pritchett L 2013 The Rebirth of Education Schooling Ainrsquot Learning Center for Global Development Washington Center for Global Development
35 Scheerens J Luyten H and van Ravens J 2011 Measuring Educational Quality by Means of Indicators in J Scheerens H Luyten and J van Ravens eds Perspectives on Educational Quality Springer Netherlands Dordrecht pp 35-50 httpsdoiorg101007978-94-007-0926-3_2
36 Szirmai A 2015 Socio-Economic Development Cambridge Cambridge University Press
37 Times Higher Education 2017 World University Rankings Available at lthttpswwwtimeshighereducationcomgt
38 Toth R 2009 Using DEA to Evaluate Efficiency of Higher Education APSTRACT Applied Studies in Agribusiness and Commerce pp 79-82 Available at lthttpsageconsearchumnedubitstream53548217_Using 20DEA_Apstractpdfgt
39 World Bank 2018 Education Statistics-Gross enrolment ratio in tertiary educa-tion Washington The World Bank Available at lthttpsdataworldbankorggt
40 Woumlszligmann L 2006 Efficiency and Equity of European Education and Train-ing Policies CESifo Working Paper Series (No 1779) Available at lthttpswwwcesifo-groupdeDocDLcesifo1_wp1779pdfgt
41 Yotova L and Stefanova K 2017 Efficiency of Tertiary Education Expend-iture in CEE Countries Data Envelopment Analysis Economic Alternatives (3) pp 352-364 Available at lthttpswwwunwebguploadsAlternatives2_Alternativi_english_br_3_2017pdfgt
Dynamics and determinants of emigration the case of Croatia and the experience of new EU member states
IVANA DRAŽENOVIĆ mag oecMARINA KUNOVAC dott mag desDOMINIK PRIPUŽIĆ dipl oec
ArticleJEL J61 E65 C33httpsdoiorg103326pse4243
We would like to thank two anonymous referees and the editor for the constructive and very useful remarks We are particularly grateful to Evan Kraft Gordi Sušić Vedran Šošić Teo Matković Maja Bukovšak Nina Ranilović Davor Kunovac Marko Mrkalj Ervin Duraković Karlo Kotarac and Alan Bobetko for their valuable comments during the early stages of the research Our work also benefited a lot from the presentation and discussion during the 24th Dubrovnik Economic Conference in June 2018 The views expressed are those of the authors and do not necessarily represent those of the Croatian National Bank No financial support received
Received June 1 2018 Accepted November 4 2018
The article was submitted for the 2018 annual award of the Prof Dr Marijan Hanžeković Prize
Ivana DRAŽENOVIĆCenter for Economic Research and Graduate Education ndash Economics Institute Politickyacutech vězňů 7 111 21 Prague 1 Czech Republice-mail IvanaDrazenoviccerge-eiczORCiD 0000-0002-6738-1288
Marina KUNOVACCroatian National Bank Trg hrvatskih velikana 3 10000 Zagreb Croatiae-mail marinakunovachnbhr ORCiD 0000-0002-3200-5928
Dominik PRIPUŽIĆCroatian National Bank Trg hrvatskih velikana 3 10000 Zagreb Croatiae-mail dominikpripuzichnbhrORCiD 0000-0003-3377-9260
ivan
a dr
ažen
ov
ić ma
rin
a ku
no
vac d
om
inik pr
ipužić
dy
na
mic
s an
d deter
min
an
ts of em
igr
ation th
e ca
se of c
ro
atia an
d the ex
perien
ce
of n
ew eu m
emb
er states
pub
lic secto
r ec
on
om
ics
42 (4) 415-447 (2018)
416 abstractThis paper analyzes the emigration flows from Croatia and other new EU member states to the core EU countries after their EU accession In order to assess the magnitude and dynamics of the recent emigration wave properly we construct the series of indirect emigration flows resorting to the national statistical offices of the selected core EU destination countries We compare the Croatian experience with that of other NMS and show that the intensity of Croatiarsquos emigration flows after EU accession is proportional to that of the Romanian and Bulgarian cases Finally we empirically analyze the economic and non-economic drivers of emi-gration from NMS to the core EU in the 2000-2016 period Results show that both economic (measured by different GDP and labour market indicators) and non-economic factors (capturing the EU accession the level of corruption in the econ-omy and demographic characteristics of the origin country population) are rele-vant for emigration decisions
Keywords emigration EU accession new member states gravity model
1 IntroductIonIn mid-2013 Croatia joined the European Union (EU) and as a member state (MS) gained access to the EU single market By becoming a part of the single market the country benefits from ldquothe four freedomsrdquo ndash the free movement of goods services capital and labour which enable more efficient reallocation of domestic factors of production resulting in new business and trade opportunities and ultimately increasing MS growth prospects At the same time EU accession triggered imple-mentation of temporary transitional provisions restricting free labour mobility from Croatia to the labour markets of other MS1 Despite that one of the direct effects of EU accession and the related reallocation of domestic factors of produc-tion was also a significant emigration outflow from Croatia to other states in the EU
Such developments raised emigration-related issues to the forefront of public debate in Croatia Drawing on a mixture of anecdotal evidence ad hoc surveys and social network posts the media predominantly engaged in painting and prop-agating a bleak picture of the ldquoCroatian exodusrdquo At the same time no proper estimate of the magnitude and nature of this emigration wave has been made due to inaccurate migration statistics Official migration statistics collected by the Central Bureau of Statistics in Croatia are published with a disclaimer that the numbers of emigrants are based on the self-reporting of emigration by emigrants themselves a process clearly discouraged by a relatively burdensome procedure that results in a loss of domestic social security benefits
1 Transitional provisions do not apply on cross boarder movements of citizens for reasons other than work but only restrict free movement of citizens for work purposes According to the Accession Treaty for Croa-tia transitional provisions can apply for a maximum period of seven years (2+3+2 formula) More details are given in table A1 appendix 1
ivan
a dr
ažen
ov
ić ma
rin
a ku
no
vac d
om
inik pr
ipužić
dy
na
mic
s an
d deter
min
an
ts of em
igr
ation th
e ca
se of c
ro
atia an
d the ex
perien
ce
of n
ew eu m
emb
er states
pub
lic secto
r ec
on
om
ics
42 (4) 415-447 (2018)417Therefore in this paper we try to assess the characteristics of the recent Croatian
emigration wave to EU countries We present a comprehensive analysis of the dynamics and the main determinants of emigration from Croatia to core EU coun-tries following EU accession comparing the Croatian case with the experience of other new member states2
To our knowledge there are few analyses of the impact of the free mobility of labour on Croatian emigration flows Potential migration flows from Croatia after EU accession are ex-ante estimated in Strielkowski Šaacuterkovaacute and Żornaczuk (2013) Fertig and Kahanec (2013) and Vidovic and Mara (2015) Strielkowski Šaacuterkovaacute and Żornaczuk (2013) find that around 220 thousand residents from Croa-tia were expected to live in the EU15 by 2016 The Fertig and Kahanec (2013) estimates vary between negative net migration balance and 360 thousand residents from Croatia in the EU14 by 2020 while the Vidovic and Mara (2015) estimates are between 160 and 220 thousand residents from Croatia in the EU by 2019
Effective emigration outflows from Croatia following the EU accession are ana-lyzed in Vidovic and Mara (2015) and Župarić-Ilijić (2016) Vidovic and Mara (2015) integrate several data sources (CBS data Eurostat employment data data about the stock of Croatian citizens in EU member states and various surveys) They show that emigration patterns from Croatia in 2014 intensified significantly due to higher economic development and better quality of life in other MS as perceived by Croatian emigrants However their paper analyses emigration out-flows only up to 2014 due to data availability Another overall analysis of emigra-tion trends from Croatia is given in Župarić-Ilijć (2016) This author emphasized that Croatian net migration balance significantly worsened with the onset of the global financial crisis and in particular after the accession to the EU and argued that official Central Bureau of Statistics migration data are underestimated and should be compared with destination country data but provided no such estimate Thus in this paper we extend existing literature in time referring to the broader period integrating several data sources and analyzing the movements that were effectively observed after Croatia had joined the EU in 2013 The main contribu-tions of our paper are threefold3
First we construct indirect emigration flows from Croatia following the EU accession Currently the Central Bureau of Statistics (CBS) in Croatia collects the
2 Due to data availability core EU countries are represented by 11 countries Austria Belgium Denmark Finland Germany Ireland Italy Luxembourg Netherlands Sweden and United Kingdom New EU member states are represented by 10 countries Bulgaria Croatia Czech Republic Estonia Hungary Latvia Lithu-ania Poland Slovakia and Slovenia3 In addition several authors implement partial analyses of emigration flows from Croatia following the EU accession Šonje (2018) estimates family emigration by using primary school enrolment data and shows that in 2009-2016 period around 50 thousand young citizens with children left Croatia The Croatian Employ-ment Service uses the annual employersrsquo survey to examine the extent of migration among the employed and shows that in 2016 around 20 thousand employed persons emigrated from Croatia Finally Jurić (2017) did a detailed on line survey among Croatian emigrants in Germany and showed that although economic fac-tors are relevant for emigration decision there is a prevalence of non-economic factors among the motives of emigration for Croatian emigrants
ivan
a dr
ažen
ov
ić ma
rin
a ku
no
vac d
om
inik pr
ipužić
dy
na
mic
s an
d deter
min
an
ts of em
igr
ation th
e ca
se of c
ro
atia an
d the ex
perien
ce
of n
ew eu m
emb
er states
pub
lic secto
r ec
on
om
ics
42 (4) 415-447 (2018)
418 data about migration flows from the Ministry of the Interior which records only persons that have registered the change in their country of usual residence with the Ministry Following related literature contributions (Izquierdo Jimeno and Lac-uesta 2014 Bertoli Bruumlcker and Moraga 2013) we assume that there are no clear incentives and benefits of registering in home country offices when emigrating while on the other hand immigrants have an incentive to register when they arrive in the destination country given that access to some basic social services in a destination country (ie education and health) generally requires registration Therefore we assume that official emigration numbers from CBS could be under-estimated and resort to the European Union destination countries national statisti-cal offices to collect numbers of registered immigrants coming from Croatia The differences are striking Our indirect emigration estimates show that emigration from Croatia to the core EU countries following the accession is on average around 26 times higher than the officially registered numbers in Croatia with around 230 thousands people having left Croatia and settled in one of the analyzed core EU countries in the 2013-2016 period
Secondly we show that although emigration flows in Croatia following the acces-sion are sizeable they are not an isolated case Bulgaria and Romania also expe-rienced proportionally similar population outflows after they became member states in 2007 CEE countries that joined the EU in 2004 also saw an increase in emigration rates towards the core EU countries though to a lower extent Time series of indirect emigration flows from NMS show that higher emigration rates recorded after the EU accession persisted over the years In other words average emigration rate from NMS to the core EU countries in 2016 is on average equal to or higher than the emigration rates in the four years following accession to the EU which corroborates the strong persistency of higher emigration rates4 Such trends raise several serious sustainability concerns for Croatia which will become rele-vant in the medium term since the current population outflow to the core EU countries according to the indirect emigration flows constructed is around 2 of population each year
The third contribution of our paper consists of empirical analyses of the main economic and non-economic determinants of emigration flows from Croatia and other NMS to the core EU countries We believe that their evaluation provides insights that are highly important for policymakers in order to shape and imple-ment adequate and targeted policies to mitigate emigration flows In our analysis of relevant emigration determinants we employed a gravity model Results obtained under alternative specifications and estimation strategies of the gravity model show that the access to the single EU market (after transitional provisions were lifted) has been a main driver of emigration flows in Croatia since 2013 However current economic conditions and labour market indicators together with demographic factors and prevalence of the corruption in the country also
4 That is 12 or 8 years following EU accession
ivan
a dr
ažen
ov
ić ma
rin
a ku
no
vac d
om
inik pr
ipužić
dy
na
mic
s an
d deter
min
an
ts of em
igr
ation th
e ca
se of c
ro
atia an
d the ex
perien
ce
of n
ew eu m
emb
er states
pub
lic secto
r ec
on
om
ics
42 (4) 415-447 (2018)419turned out to be significant in the determination of emigration flows among NMS
and core EU countries implying that there is a room for policymakers to alleviate the intensity of emigration pressures in Croatia
The remainder of the paper is structured as follows in section 2 we describe in detail the major characteristics of recent Croatian emigration flows firstly by dis-cussing Croatiarsquos official emigration figures and secondly by comparing official data with data on indirect emigration from Croatia collected from national statisti-cal offices of the core EU destination countries In section 3 we present a com-parative overview of the emigration experiences of other new EU member states following their EU accession In section 4 we provide a basic overview of gravity models and their applicability in studying migration issues and describe the vari-ables used in the model In section 5 we present different specifications of the gravity models and discuss the results of the econometric analysis together with robustness checks In section 6 we emphasize the main conclusions
2 demograPhIc and geograPhIcal characterIstIcs of croatIan emIgrants
21 emIgratIon flows from croatIa accordIng to the central bureau of statIstIcs data
As a starting point we take a deeper look at the official Croatian migration statis-tics in order to improve our understanding of the migration dynamics in Croatia Notwithstanding existent methodological issues and while accepting the claim that official Croatian migrations are under-reported we nevertheless believe that they could be under-reported systematically which means that they still might contain some useful information about the underlying migration trends
Looking at the big picture we can see that prior to the global financial crisis Croatia had a positive net migration balance However migration flows reversed at the onset of the global financial crisis (net migration balance turned negative) Until the EU accession negative net migration remained relatively low and stable After Croatia became a full member of the EU in July 2013 migration flows clearly intensified (figure 1)
Figure 1 also shows that EU accession had no significant effect on the number of immigrants while emigration outflows intensified significantly with the acces-sion Thus in the remaining part of the paper we concentrate exclusively on gross emigration outflows and analyze emigrantsrsquo main characteristics
Available data provide a basis for a simple demographic analysis of Croatian emi-grants Numbers suggest that there is an almost equal share of male and female emigrants throughout the period with the share of male emigrants slightly increas-ing at times of high migration (figure 2)
ivan
a dr
ažen
ov
ić ma
rin
a ku
no
vac d
om
inik pr
ipužić
dy
na
mic
s an
d deter
min
an
ts of em
igr
ation th
e ca
se of c
ro
atia an
d the ex
perien
ce
of n
ew eu m
emb
er states
pub
lic secto
r ec
on
om
ics
42 (4) 415-447 (2018)
420 Figure 1 Net migration balance of Croatia between 2001 and 2016 Central Bureau of Statistics data net migration
-40
-30
-20
-10
0
10
20
30
2001 2002 2003 2004 2005 2006 2007 2008 2009 2010 2011 2012 2013 2014 2015 2016
In th
ousa
nds
Emigration Immigration Net migration
Note Net migration = number of immigrants ndash number of emigrants in thousandsSource CBS
Figure 2 Structure of emigrants from Croatia by sex between 2002 and 2016 Central Bureau of Statistics data gross emigration flows
0
5
10
15
20
25
30
35
40
2002 2003 2004 2005 2006 2007 2008 2009 2010 2011 2012 2013 2014 2015 2016
Num
ber o
f em
igra
nts
Males Females
Note In thousandsSource CBS
The age structure of emigrants suggests that there was a structural shift towards younger emigrants in the last emigration wave Firstly there is a striking increase in the number of youngest emigrants (age 0-15) and secondly it appears that the decrease in the average age of the emigrants is accelerating Our estimates show that the average age of emigrants in the period between 2001 and 2013 was 415
ivan
a dr
ažen
ov
ić ma
rin
a ku
no
vac d
om
inik pr
ipužić
dy
na
mic
s an
d deter
min
an
ts of em
igr
ation th
e ca
se of c
ro
atia an
d the ex
perien
ce
of n
ew eu m
emb
er states
pub
lic secto
r ec
on
om
ics
42 (4) 415-447 (2018)421years but dropped sharply over next three years and reached 336 years in 2016
(figure 3) These results are in line with Šonje (2018) The author estimates that in 2009-2016 period around 50 thousand young citizens with children left Croatia permanently5
Figure 3 (a) Relative share of different age groups of emigrants and average age of emi-grant between 2002 and 2016 (b) Number of emigrants by different age groups between 2002 and 2016 Central Bureau of Statistics data gross emigration flows
30
32
34
36
38
40
42
44
46
48
00
01
02
03
04
05
06
07
08
09
10
2002
2003
2004
2005
2006
2007
2008
2009
2010
2011
2012
2013
2014
2015
2016
Ave
rage
age
of m
igra
nt (i
n ye
ars)
sh
are
of se
lect
ed a
ge g
roup
in to
tal p
opul
atio
n
0-15 15-39 40-64 65+Average age of migrant (right)
0
4000
8000
12000
16000
20000
24000
0
1000
2000
3000
4000
5000
6000
2002
2003
2004
2005
2006
2007
2008
2009
2010
2011
2012
2013
2014
2015
2016
Num
ber o
f em
igra
nts
65+
25-49 (right)
0-15 15-24 50-64
Source CBS
Turning to the distribution of emigrants across Croatian regions again there is a very clear compositional change towards the end of the analyzed period with a growing proportion of emigrants from less-developed regions Following the rela-tively stable situation during the 2000s the deep and prolonged domestic reces-sion pushed up emigration more or less gradually in almost all regions After the EU accession there was a rapid and pronounced growth of emigration from all regions albeit at a different pace Emigration flows were much stronger in the regions with the highest unemployment As a result looking at the share of migrants in their population in 2016 Croatian regions can be broadly divided into two groups one with the ratio of migrants to domestic population close to or above 1 (Eastern Croatia Central Croatia Lika and Gorski Kotar) and other economically more advanced regions with the ratio of around 066 (figure 4) Therefore even though emigration is a country-wide problem the intensity of emigration flows (as a percentage of total population) is a much stronger phenom-enon in the economically less developed regions (figure 5)
5 Estimates are based exclusively on households with children (obtained by comparison of expected and effec-tive primary school enrolment) and are considered to represent irreversible emigration based on the assump-tion that child integration in system of destination countries strongly disincentives return-migration
ivan
a dr
ažen
ov
ić ma
rin
a ku
no
vac d
om
inik pr
ipužić
dy
na
mic
s an
d deter
min
an
ts of em
igr
ation th
e ca
se of c
ro
atia an
d the ex
perien
ce
of n
ew eu m
emb
er states
pub
lic secto
r ec
on
om
ics
42 (4) 415-447 (2018)
422 Figure 4 Structure of emigrants from Croatia by region between 2001 and 2016 Central Bureau of Statistics data gross emigration flows
00
02
04
06
08
10
12
14
16
Num
ber o
f em
igra
nts
in
of t
otal
pop
ulat
ion
Eastern Croatia Central Croatia Lika and Gorski kotar Central and Southern Adriatic
Northen Adriatic Northwestern Croatia City of Zagreb
2002
2001
2003
2004
2005
2006
2007
2008
2009
2010
2011
2012
2013
2014
2015
2016
Notes Eastern Croatia encompasses Virovitičko-podravska Požeško-slavonska Brodsko-posavska Osječko-baranjska and Vukovarsko-srijemska counties Central Croatia encompass-es Zagrebačka Sisačko-moslavačka Karlovačka and Bjelovarsko-bilogorska counties Lika and Gorski kotar encompass Primorsko-goranska and Ličko-senjska counties Central and Southern Adriatic encompass Zadarska Šibensko-kninska Splitsko-dalmatinska and Dubrovačko-neretvanska counties Northen Adriatic refers to Istarska County Northwestern Croatia encom-pass Krapinsko-zagorska Varaždinska Međimurska and Koprivničko-križevačka countiesSource CBS
Figure 5 Unemployment rate and share of emigrants by county in 2016 Central Bureau of Statistics data gross emigration flows
Sisačko-moslavačka
Virovitičko-podravska
Požeško-slavonskaBrodsko-posavska
Osječko-baranjska
Vukovarsko-srijemska
Istarska
5
10
15
20
25
30
35
40
04 06 08 10 12 14 16 18 20
Une
mpl
oym
ent r
ate
in
Emigration rate as of total population
Krapinsko-zagorska
Varaždinska Međimurska
Grad Zagreb
Splitsko-dalmatinska
Note The size of the circles correspond to the emigration rate as of total population of the countySource CBS
ivan
a dr
ažen
ov
ić ma
rin
a ku
no
vac d
om
inik pr
ipužić
dy
na
mic
s an
d deter
min
an
ts of em
igr
ation th
e ca
se of c
ro
atia an
d the ex
perien
ce
of n
ew eu m
emb
er states
pub
lic secto
r ec
on
om
ics
42 (4) 415-447 (2018)423Finally CBS data show that slightly more than 85 of emigrants from Croatia
after the EU accession was directed to three EU countries Germany Austria and Ireland Figure 6 compares main emigration destinations of Croatians in the EU before and after Croatian accession Although total emigration flows towards the EU increased significantly the composition of the main destinations remained almost unchanged from the period before accession The only exception is Ire-land since emigration to Ireland before the EU accession was almost non-existent in Croatia while in 2016 Ireland become third biggest destination for Croatian emigrants In addition EU accession caused a change in relative position between Germany and Austria two main emigration destinations with even more emi-grants going to Germany This is a direct consequence of Austriarsquos decision to extend the application of transitional provisions for Croatian citizens until June 2018 After 2018 we expect the share of Croatians heading towards Austria to increase unless Austria prolongs the application of the transitional provisions until 20206
Figure 6 (a) Main EU emigration destinations for Croatians in 2010 (b) Main EU emigra-tion destinations for Croatians in 2016 Central Bureau of Statistics data gross emigration flows
713
76
67
47
3224 24 18
457
24201
91
85
8822 14
Germany
Austria
Ireland
Other EU countries
Italy
Slovenia
Sweden
United Kingdom
Germany
Austria
Ireland
Other EU countries
Italy
Slovenia
Sweden
United Kingdom
Total emigration to EU in 2010 ndash 1697 persons Total emigration to EU in 2016 ndash 28659 persons
Note Germany and Italy lifted transitional provisions for Croatia in 2015 UK and Austria are applying transitional provisions until June 2018 with possible extension until 2020Source CBS
6 Prolongation of application of transitional provisions in the period from June 2018 until June 2020 is possi-ble only in the case of serious disturbances for the Austrian labour market that would otherwise occur
ivan
a dr
ažen
ov
ić ma
rin
a ku
no
vac d
om
inik pr
ipužić
dy
na
mic
s an
d deter
min
an
ts of em
igr
ation th
e ca
se of c
ro
atia an
d the ex
perien
ce
of n
ew eu m
emb
er states
pub
lic secto
r ec
on
om
ics
42 (4) 415-447 (2018)
424 22 emIgratIon from croatIa accordIng to natIonal statIstIcal offIces of core eu countrIes
The Croatian Central Bureau of Statistics detailed data about emigration presented so far are useful for an analysis of some main characteristics of Croatian emi-grants However as previously explained in the Introduction the official number of emigrants published by the Central Bureau of Statistics in Croatia is based on the people who voluntarily registered their departure with the authorities while standard migration theory predicts that migrants are much more likely to register in the country of destination than in the country of origin7 Therefore in addition we construct an indirect emigration flow taking as a starting point the immigration statistics from the national statistical offices of the following core EU countries Germany Denmark Austria Ireland Belgium Netherlands Italy Finland Swe-den Luxembourg and United Kingdom For UK and Ireland immigration statis-tics are not available so we use the individually appointed national insurance numbers (NINo) in the UK and personal public service numbers (PPS) in Ireland that are commonly used in the literature (Hazans and Philips 2011) We analyze the period from 2000 until 2016 and for each year in the sample we consult offi-cial immigration statistics of the selected core EU countries and take the number of immigrants coming from Croatia
Where available our preferred choice is statistics that register immigrants from Croatia according to the country of birth principle (as in Netherlands Italy UK and Belgium) or country of previous residence principle (as in Germany and Denmark)8 Immigration flows registered according to citizenship principle (as in Sweden Finland Luxembourg and Austria) could be inaccurate since they also include migrants from Bosnia and Herzegovina (and other countries) having Cro-atian (or dual) citizenship9 According to Jurić (2017) in a survey of Croatian emigrants to Germany around 20 of emigrants registered as Croatian citizens in Germany actually emigrated from Bosnia and Herzegovina This is the reason why we have avoided using migration numbers based on the citizenship principle if the country of birth principle or country of previous residence principle was also available among migration statistics Nevertheless given that for some countries migration statistics are available only based on the citizenship principle indirect emigration flows constructed with resort to the national statistical offices of core EU countries and presented in the remaining part of the paper should be inter-preted as an upper bound for emigration outflows from Croatia Detailed informa-tion about the construction of indirect emigration flows is given in appendix 1 Comparison between constructed indirect emigration flows from Croatia based on
7 Illustrative case in point is a Polish example Following the EU accession Poland experienced a strong emi-gration flows At some point policymakers realized that the official statistics grossly underestimate the extent of emigration As a result research project has been initiated in Poland in order to properly estimate the true numbers The upgraded and consolidated sources raised the official emigration numbers by a factor ten (Sta-tistics Poland 2011)8 Destination country can register immigrants according to the following principles country of birth princi-ple country of previous residence principle and citizenship principle Registration of immigrants according to the different principles is defined by Eurostat International Migration Statistics 9 For Ireland personal public service number the principle for registration of immigrants is not denoted
ivan
a dr
ažen
ov
ić ma
rin
a ku
no
vac d
om
inik pr
ipužić
dy
na
mic
s an
d deter
min
an
ts of em
igr
ation th
e ca
se of c
ro
atia an
d the ex
perien
ce
of n
ew eu m
emb
er states
pub
lic secto
r ec
on
om
ics
42 (4) 415-447 (2018)425data published by national statistical offices of the core EU countries and official
Central Bureau of Statistics data are represented in figure 7 1011
Figure 7 Indirect emigration flows from Croatia to the core EU countries according to national statistical offices of core EU countries compared to the official emigra-tion numbers to EU 27 countries according to Central Bureau of Statistics gross emigration flow
0
10
20
30
40
50
60
70
80
2000 2001 2002 2003 2004 2005 2006 2007 2008 2009 2010 2011 2012 2013 2014 2015 2016
Num
ber o
f em
igra
nts
Indirect emigration numbers ndash from national statistical offices of core EU countres
Official Croatian Bureau of Statistics emigration to EU 27
Note Official Central Bureau of Statistics emigration number for emigration in EU 27 Core EU countries are represented by 11 countries due to data availability Austria Belgium Denmark Finland Germany Ireland Italy Luxembourg Netherlands Sweden and United Kingdom in thousandsSource CBS national statistical offices of the core EU countries
The differences in emigration outflows between the two sources are striking According to the indirect estimates of emigration 230 thousand persons emigrated from Croatia to the core EU countries in the period from 2013-2016 On the other hand official data report 61 thousand emigrants in 2013-2016 period directed towards the selected core EU countries and 102 thousand emigrants in total during the same time period However the difference between the mirror statistics of Cro-atia and core EU destination countries is expected to decrease in the future This would reflect the fact that by the end-2016 the Croatian Tax Administration encour-aged Croatian migrants to change their residency status with authorities in order to
10 According to the Central Bureau of Statistics national statistical offices of the selected core EU countries represent broadly around 90 of total emigration to the European Union from Croatia over the entire sam-ple period which makes them a valid and representative indicator of total emigration flows towards the EU11 We have also estimated total emigration flows from Croatia by putting together (1) indirectly constructed emigration flows to the core EU countries and (2) Central Bureau of Statistics official emigration data for all other emigration destinations ie ldquothe rest of the worldrdquo The same approach is followed in order to construct an approximation of total immigration flows in Croatia Calculation details of total net emigration are given in appendix 2 According to our discretional combination of different data sources net emigration from Cro-atia is estimated to be around 155 thousands person in the 2013-2016 period
ivan
a dr
ažen
ov
ić ma
rin
a ku
no
vac d
om
inik pr
ipužić
dy
na
mic
s an
d deter
min
an
ts of em
igr
ation th
e ca
se of c
ro
atia an
d the ex
perien
ce
of n
ew eu m
emb
er states
pub
lic secto
r ec
on
om
ics
42 (4) 415-447 (2018)
426 avoid double taxation of their income12 The threat of double taxation of income probably incentivized migrants to be more prompt in registering their departure and changing their residence in their origin country offices13
Overall the discrepancies between the mirror statistics of origin and destination countries are common in migration statistics and most other countries are also faced with similar challenges Thus in our analysis we will adopt the same prin-ciple for other NMS Bulgaria Romania Poland Czech Republic Slovakia Slo-venia Hungary Latvia Lithuania and Estonia and construct indirect emigration flows for these countries referring to the immigration statistics of national statisti-cal offices of the core EU countries
3 mIgratIon flows In other new eu member states after the eu accessIon
In this section by looking into the emigration experience of other new EU mem-bers we tried to gain additional insight about some additional characteristics of emigration flows caused by EU accession such as the average structure of emi-grants (according to main demographic attributes) stability of the flows number of years after the accession needed to reach a plateau the likely duration of an emigration wave and possible reversal points
Detailed migration data from national statistical offices of the new EU member states allow us to analyze the main attributes of emigrants from NMS in order to look for some substantial differences or similarities in migration flows between countries According to figure 8 data about the age structure of emigrants does not follow any single path across countries However for all countries in the sample the average age of emigrant in 2016 is similar ranging broadly from the low to the mid-thirties At the same time the median age of the total population is rapidly increasing which in most countries widens the gap between the average popula-tion and average emigrant age This situation makes the emigration outflows of relatively younger citizens even more concerning in terms of the long-term sus-tainability of social services (such as public pensions and health)
Comparison of top emigration destinations for emigrants coming from NMS reveals that Germany is ranked among the top three emigration destinations for all countries in the sample The Croatian main emigration destinations Austria and the United Kingdom are also the second most frequent EU destinations for emi-grants from NMS in 2016 (table 1)14
12 At the beginning of 2017 Croatian government adopted the Ordinance for the implementation of the Gen-eral Tax Act (OG 3017) that clarified the process of determination of residency status for tax purposes and induced migrants to register their change of residency within authorities to avoid double income taxation 13 CBS is constantly working on improving migration data sources so part of the observed developments might reflect underlying methodological changes For example in 2011 the CBS changed its definition of migrants from people who registered their departurearrival to people who are absent from their usual place of residence in a one year period14 Nevertheless there are some peculiarities among main emigration destinations between NMS Finland was the main destination for emigrants from Estonia and Spain for emigrants from Romania in 2016 reflecting their cultural and historical linkages
ivan
a dr
ažen
ov
ić ma
rin
a ku
no
vac d
om
inik pr
ipužić
dy
na
mic
s an
d deter
min
an
ts of em
igr
ation th
e ca
se of c
ro
atia an
d the ex
perien
ce
of n
ew eu m
emb
er states
pub
lic secto
r ec
on
om
ics
42 (4) 415-447 (2018)427Figure 8
New MS emigrantsrsquo average age and median age of population 2000-2016 national statistical offices of NMS countries gross emigration flows
20
25
30
35
40
45
50
20
25
30
35
40
45
50
BGEE CZ RO LT LV SK PL HU SI HR
Average migrant age Median population age
Sources CBS national statistical offices and Eurostat authorsrsquo calculations
Table 1 Main EU emigration destinations for NMS in 2016 (in of total EU emigration) national statistical offices of NMS countries gross emigration flows
origin country top 3 emigration destinations in eu as of total eu emigrationBulgaria na na naCroatia Germany 71 Austria 8 Ireland 7Czech Republic Slovakia 60 Germany 9 Poland 6Estonia Finland 63 United Kingdom 8 Germany 7Hungary Germany 32 Austria 27 United Kingdom 17Latvia na na naLithuania United Kingdom 60 Ireland 11 Germany 10Poland Germany 43 United Kingdom 28 Netherlands 8Romaniaa Spain 24 Germany 17 Italy 16Slovakia Czech Republic 38 Austria 27 Germany 10Slovenia Germany 27 Austria 27 Croatia 12
a Percentage of total emigrationSources CBS national statistical offices and Eurostat
Given that similar core EU countries dominate as the main emigration destinations to Europe for NMS this corroborates our decision to construct indirect emigration flows for NMS by resorting to the national statistical offices of core EU countries as we did for Croatia Thus in the remaining part of this section we use data about indirect emigration flows from NMS to the core EU countries and employ them to compare the dynamics and intensity of migration outflows among the NMS
Comparison of the indirect emigration flows from other NMS to core EU coun-tries shows that the intensity of emigration flows from Croatia following the accession is not unique in its size given the experience of other economically less
ivan
a dr
ažen
ov
ić ma
rin
a ku
no
vac d
om
inik pr
ipužić
dy
na
mic
s an
d deter
min
an
ts of em
igr
ation th
e ca
se of c
ro
atia an
d the ex
perien
ce
of n
ew eu m
emb
er states
pub
lic secto
r ec
on
om
ics
42 (4) 415-447 (2018)
428 developed member states (Bulgaria and Romania) but also that emigration flows from NMS following the EU accession in 2004 were significantly lower (figure 9) Another important pattern arises from the analysis of NMS emigration flows since it is visible that a rise in the average migration rate towards the core EU countries following EU accession is not a temporary one-off reaction to accession to the common EU market According to figure 10 the average emigration rate in 2016 is equal to or higher than the average emigration rate in four years following the EU accession pointing to the persistence of intensive emigration flows15
Figure 9 Indirect emigration flows from NMS to the core EU countries national statistical offices of core EU countries gross emigration flows
0002040608101214161820
2000
2001
2002
2003
2004
2005
2006
2007
2008
2009
2010
2011
2012
2013
2014
2015
2016
In
of t
otal
pop
ulat
ion
Czech R Hungary PolandSlovakia Slovenia Baltics
0002040608101214161820
2000
2001
2002
2003
2004
2005
2006
2007
2008
2009
2010
2011
2012
2013
2014
2015
2016
In
of t
otal
pop
ulat
ion
Bulgaria Croatia Romania
Note Dashed lines denote the years of EU accessionSource National statistical offices of the core EU countries
Figure 10 Indirect emigration flows of NMS in time national statistical offices of core EU countries gross emigration flows
00
02
04
06
08
10
12
14
16
18
20
SI CZ HU LV EE SK LT BG PL RO
In
of t
otal
pop
ulat
ion
Avg migration rate in 4 years following EU accession Avg migration rate in 2016
Source National statistical offices of the core EU countries
15 However all member states but Croatia gained access to the common EU market prior to the onset of the global crisis Only Croatia joined the EU after six consecutive years of economic distress This might have created an additional pressure on migration outflows from Croatia However proper evaluation of this phe-nomenon will be possible only with some time delay
ivan
a dr
ažen
ov
ić ma
rin
a ku
no
vac d
om
inik pr
ipužić
dy
na
mic
s an
d deter
min
an
ts of em
igr
ation th
e ca
se of c
ro
atia an
d the ex
perien
ce
of n
ew eu m
emb
er states
pub
lic secto
r ec
on
om
ics
42 (4) 415-447 (2018)429A careful consideration must also be given to the influence of the economic cycle
on emigration Persistence of increased emigration flows from NMS to core EU countries in the decade following EU accession could reflect the impact of the economic crisis that started in 2009 on emigration decisions Figure 11 in both panel (a) and (b) shows that economic conditions are indeed related to intensity of emigration
Figure 11Average emigration flow as in total population from 2011 to 2016 compared to average unemployment rate (a) and average GDP PC in PPS (b) national statis-tical offices of core EU countries gross emigration flows
BG
HR
CZ
EEHU
LV
LT
PL
RO
SK
SI
10000
12000
14000
16000
18000
20000
22000
24000
00 05 10 15
GD
P PC
in P
PS (2
008-
2016
)
Emigration flow as in total population
BG
HR
CZ EE
HU
LVLT
PL ROSKSI
50
55
60
65
70
75
00 02 04 06 08 10 12 14 16 18
Emigration flow as in total population (2013-2016)
Empl
oym
ent r
ate
in
(201
3-20
16)
y = -68574x + 69749Rsup2 = 04745
y = -63306x + 23269Rsup2 = 07714
Source Eurostat and national statistical offices of the core EU countries
The NMS had rather different crisis and post-crisis experiences Poland experi-enced no recession but faced sizable emigration flows some countries recovered rather quickly after the initial shock (the Baltics Slovakia) while others experi-enced a double-dip recession (Slovenia) or a very deep and prolonged recession (Croatia) In addition the economic slack was global in nature ie the worsening of economic conditions was not restricted only to NMS but was also present in most of the core EU countries thus altering to some extent the relative benefits between origin and destination countries As a result a simple comparison of var-ious economic performance indicators and the intensity of emigration flows can provide only a partial and limited insight into the relative importance of different economic and non-economic determinants of migration flows In the next section we thus resort to formal econometric analysis using a gravity model to examine the main determinants of emigration in Croatia and other new EU member states to the core EU countries in the 2000-2016 period
4 graVIty model of mIgratIonThe application of Newtonian physics in economics started with Tinbergen (1962) who used a gravity model to explain international trade flows Flowerdew and Salt (1979) introduced the gravity model in the context of migration analysis and it soon become widely used to analyze different migration determinants However some authors claim that the first application of a gravity model to explain migration patterns goes back to Ravenstein who used it to analyze migra-tion patterns in 19th century Britain (Anderson 2011)
ivan
a dr
ažen
ov
ić ma
rin
a ku
no
vac d
om
inik pr
ipužić
dy
na
mic
s an
d deter
min
an
ts of em
igr
ation th
e ca
se of c
ro
atia an
d the ex
perien
ce
of n
ew eu m
emb
er states
pub
lic secto
r ec
on
om
ics
42 (4) 415-447 (2018)
430 Notwithstanding their long history gravity models have experienced a revival since the early 2000s due to much improved bilateral migration data (Ramos 2016) and the emergence of statistical theories appropriate for studying spatial interaction The reasons for the popularity of gravity models in migration analysis are trifold intuitive consistency with migration theories ease of estimation in its simplest form goodness of fit in most applications (Poot et al 2016) Gravity models assume migration flows (M) between the origin country i and destination country j in time t are proportional to the product of their populations (P) (which are in migration contexts used as proxies for the concept of mass from standard gravity model) and inversely proportional to the distance (D) between them
(1)
Gravity models in their original form are purely non-theoretical so they are usu-ally enriched with different variables capturing traditional pull and push factors of migration following human capital theory approach to migration developed by Sjaastad (1962) and Harris and Todaro (1970) The authors consider migration decision as a complex form of investment in human capital that is influenced by future expected income levels and the relative probability of employment oppor-tunities in destination and origin countries16 More formal arguments for the use of an extended vector of explanatory variables in migration analysis can be derived from the Random utility model introduced in migration literature by Borjas (1987) and Grogger and Hanson (2011) that provided micro foundations in the context of migration analysis Reflecting these considerations the gravity model used in this paper is augmented by an additional set of explanatory variables covering differ-ent economic demographic and educational factors as well as the level of corrup-tion in the country
The dependent variable is the gross flow of emigrants from NMS to the core EU country in each year for 2000-2016 period In order to trace emigration flows accurately we rely on immigration statistics of the selected receiving countries as available from national statistical offices of the core EU countries as explained in section 2
Explanatory variables used in the analysis are related to traditional pull and push factors of migration presented in literature The basic specification of our model contains GDP per capita in purchasing power parity of origin and destination country relative size of populations between countries based on Eurostat data and geographical distance between capitals of destination and origin countries down-loaded from CEPIIrsquos geo-distance database Moreover our basic specification also contains the variable capturing the effect of EU accession The variable is based on transitional provisions on the free movement of workers from new EU
16 Income levels are usually approximated by GDP per capita in PPP terms given that wage data are not com-parable across countries
ivan
a dr
ažen
ov
ić ma
rin
a ku
no
vac d
om
inik pr
ipužić
dy
na
mic
s an
d deter
min
an
ts of em
igr
ation th
e ca
se of c
ro
atia an
d the ex
perien
ce
of n
ew eu m
emb
er states
pub
lic secto
r ec
on
om
ics
42 (4) 415-447 (2018)431member states following the EU enlargement in 2004 2007 and 2013 as reported
by the European Commission Following the EU enlargement several core EU states decided to apply transitional provisions on the free movement of workers from NMS and effectively postpone the full liberalization of their labour markets Thus for each pair of origin and destination countries in the sample the dummy variable associated to transitional provisions takes the value 1 in the year that the core EU country lifted its restrictions on the free movement of workers coming from the respective NMS
In the extended version of our model we include additional variables accounting for some additional characteristics of origin and destination countries Following Lamberty (2015) we use data from the World Governance Index (WGI) database and include a corruption index for origin and destination country as explanatory variables in our analysis to evaluate if differences in corruption between coun-tries are a relevant factor in explaining observed emigration patterns From among the different WGI indexes evaluating the quality of governance and institutions from different aspects we have opted for the inclusion of the corruption index in our main specification following Poprawe (2015) who shows that corruption increases emigration since it retards the economic development of the country and creates an insecure living and economic environment1718 We also evaluate the impact of origin country population attributes on migration outflows Following Sprenger (2013) we include the share of persons educated to tertiary level in total population of origin country to test whether higher emigration flows are associ-ated with higher skill levels The impact of demographic characteristics of origin population on emigration flows is measured through the share of young people (persons aged 20-34) in total population of origin country as an approximation of the potential emigration pool
Finally we include alternative variables for economic performance of the country We find this relevant since Bertoli Bruumlcker and Moraga (2013) and Beine et al (2017) argue that relative difference in GDP per capita in purchasing power stand-ard represents a difference in level of economic development between two coun-tries which is relevant for emigration decisions but that current and future eco-nomic prospects not captured by relative GDP per capita in PPS are also impor-tant Bertoli Bruumlcker and Moraga (2013) and Beine et al (2017) argue that dif-ferences in GDP per capita in PPS are already captured by the inclusion of origin and destination fixed effects Additionally economic distress arising during the crisis period causes changes in future economic prospects that not reflected in a timely way in the level of GDP per capita in PPS Therefore in the extended specification of our model we substitute for GDP per capita in PPS with short-
17 Vukovic (2017) shows that the Croatian economy is permeated by corruption since the political system is characterized by systematic corruption on national and local levels Also WGI corruption index data point to a substantial gap in corruption incidence between most NMS and core EU countries in general18 As a main alternative to the corruption index we could have used the governance index from the same data-base Estimation results obtained with the governance index as independent variable are shown in appendix 3
ivan
a dr
ažen
ov
ić ma
rin
a ku
no
vac d
om
inik pr
ipužić
dy
na
mic
s an
d deter
min
an
ts of em
igr
ation th
e ca
se of c
ro
atia an
d the ex
perien
ce
of n
ew eu m
emb
er states
pub
lic secto
r ec
on
om
ics
42 (4) 415-447 (2018)
432 term indicators of economic activity ndash employment rate and output gap of origin and destination country19 These variables capture how changing growth prospects and labour market opportunities affect emigration across countries
Detailed descriptions of all variables and respective data sources are provided in appendix 1
In order to evaluate the main determinants of migration flows from NMS into the core EU countries we apply the Poisson pseudo maximum likelihood estimator Numerous literature contributions examine the main drivers of migration by using a fixed effects model as a baseline methodology20 However a fixed effect model does not allow for the estimation of variables that are constant in time (such as the distance between two countries) Moreover Santos-Silva and Tenreyro (2006) in their paper show that parameters in log-linearized models estimated by OLS in the presence of heteroscedasticity could lead to biased estimates The authors alterna-tively propose application of the Poisson pseudo maximum likelihood (PPML) estimator and argue that the PPML estimator is more suitable given its consist-ency in presence of heteroscedasticity Moreover the PPML estimator will allow us to properly account for zero migration flows between two countries since the dependent variable in PPML is not in logarithmic form but is assumed to take positive integer values Given this advantages of the PPML estimator over the standard panel fixed effects estimator we transform our basic gravity model from equation (1) and extend it by additional explanatory variables
(2)
where mijt represents migration from origin country i into destination country j in a year t xit is a vector of explanatory variables characteristic for origin country economic political geographical and demographic factors yjt is vector of explan-atory variables representing destination country characteristics in time and δi and ϑj are respectively origin and destination country specific effects
5 results ndash maIn determInants of emIgratIon The main results of the estimation of equation (2) using the PPML estimator are presented in table 2 As a robustness check estimates obtained by the application of the fixed effect model are also presented in table 2 but are not discussed explic-itly According to the results of the baseline model (Model 1) population and dis-tance parameters are in line with gravity model predictions An increase in distance between destination and origin country by 1 will decrease emigration flows by 15 all other factors being equal confirming the theoretical predictions of the
19 We opt for the exclusion of GDP per capita in PPS from the extended model specification since inclusion of GDP PC in PPS and short term economic indicators could result in multicollinearity Instead differences in level of economic development are captured by origin and destination fixed effects20 A detailed overview of different estimation strategies and models used in assessment of impact of EU acces-sion for CEE countries in 2004 is given in Bruumlcker et al (2009)
ivan
a dr
ažen
ov
ić ma
rin
a ku
no
vac d
om
inik pr
ipužić
dy
na
mic
s an
d deter
min
an
ts of em
igr
ation th
e ca
se of c
ro
atia an
d the ex
perien
ce
of n
ew eu m
emb
er states
pub
lic secto
r ec
on
om
ics
42 (4) 415-447 (2018)433standard gravity model implying that migration flows between two countries are
inversely proportional to the distance between them This interesting result sug-gests that importance of transportation and information costs that are approximated with physical distance between countries still remains relevant in migration deci-sions irrespective of the decrease in transportation costs and the development of the internet since the rather different world around the time of the pioneer application of gravity models in migration analysis in the late 1970s The positive coefficient associated with the relative difference between population of destination and origin country suggests that countries with bigger populations have more intensive migra-tion flows However this result is not statistically significant Secondly our base-line model shows GDP per capita in PPS in destination country increases migration flows directed toward the country confirming the theories arguing that a positive difference in the level of economic conditions will increase emigration flows from origin to destination country Estimated parameters show that an increase in GDP per capita in PPS in a destination country of 1 will lead to an increase in emigra-tion flows from origin to destination country by 22 assuming all other factors remain unchanged On other hand the coefficients associated to GDP PC in PPS in origin country are not statistically significant
Finally the variable transitional provisions measuring the impact of the accession to the principle of free movement of persons across borders going from new EU member states (origin countries) to the core EU (destination countries) is statisti-cally significant and large in its value increasing migration flow by 4021
The results of the extended model specification (Model 2) show that short-term economic indicators represented by different labour market indicators and cycli-cal position of the economy of origin and destination countries are statistically significant and thus affect emigration decisions An increase in employment opportunities in a destination country by 1 will increase emigration flows from origin to destination countries by 82 all other factors being equal At the same time an increase in employment opportunities in origin country by 1 will decrease emigration flows by 5 Results indicate that cyclical position of the economy is also important for migration decisions An improvement in cyclical position of a destination country by 1 percentage point (ie positive output gap) will increase emigration flows from origin to destination countries by 2 if all other factors remain constant
21 Changes in the predicted emigration flow for dummy variable representing transitional provisions are calu-lated according to the formula -1
ivan
a dr
ažen
ov
ić ma
rin
a ku
no
vac d
om
inik pr
ipužić
dy
na
mic
s an
d deter
min
an
ts of em
igr
ation th
e ca
se of c
ro
atia an
d the ex
perien
ce
of n
ew eu m
emb
er states
pub
lic secto
r ec
on
om
ics
42 (4) 415-447 (2018)
434 Table 2 Determinants of emigration flows from new EU member states to the core EU countries between 2000 and 2016 Fixed effects estimator (FE) and Poisson pseudo maximum likelihood estimator (PPML)
model 1 (baseline) fe
model 1 (baseline) PPml
model 2 fe
model 2 PPml
Distance ndashndash
-148(000)
ndashndash
-154(000)
Population 059(017)
141(035)
099(002)
585(000)
GDP PC in PPS (origin)
011(059)
027(046)
GDP PC in PPS (destination)
155(000)
215(001)
Transitional provisions
054(000)
034(000)
046(000)
046(000)
Employment rate (origin)
-145(000)
-504(000)
Employment rate (destination)
12(006)
815(000)
Output gap (origin)
-227(000)
307(02)
Output gap (destination)
374(000)
203(004)
Corruption index (origin)
003(089)
-166(000)
Corruption index (destination)
378(000)
246(009)
Share of youth (20-34) origin
15(000)
019(08)
Share of tertiary educated (origin)
025(014)
058(007)
Cons -1191 023 -1365 551Number of observations 1958 1972 1958 1972
R2 046 078 053 082Note and refer to 10 5 and 1 statistical significance levels respectively P-values are in parenthesis All specifications include origin and destination fixed effects dum-mies Parameters associated to output gap for origin and destination country are multiplied by 100 since the output gap enters the model specification in levels instead of being transformed into logarithms due to negative valuesSource Authorsrsquo elaboration based on national statistical offices of the core EU countries immi-gration data and on the data presented appendix 1
Moreover we find an importance in the level of education of the workforce in the origin country since the coefficient associated to the variable denoting the share of those with tertiary education in the total population of origin country assumes a positive significant value The estimates imply that an increase in the share of the tertiary educated in an origin population will increase migration flows from
ivan
a dr
ažen
ov
ić ma
rin
a ku
no
vac d
om
inik pr
ipužić
dy
na
mic
s an
d deter
min
an
ts of em
igr
ation th
e ca
se of c
ro
atia an
d the ex
perien
ce
of n
ew eu m
emb
er states
pub
lic secto
r ec
on
om
ics
42 (4) 415-447 (2018)435the origin country by 06 The share of young population in an origin country is
also found to be positively correlated with the intensity of migration from the origin country but the results are not statistically significant Finally the differ-ence in corruption between destination and origin countries is also significant for emigration decisions An increase in the corruption index in the origin country by 1 (an increase in WGI corruption index represents a decrease of level of corrup-tion in the economy given the construction of corruption index) will lead to lower emigration from origin country by 17 At the same time an increase in the cor-ruption index of destination country by 1 (implying a lower corruption level in destination country) will increase emigration flows from origin to destination country on average by 25 all other factors being equal
As a final step in our analysis we compare results of the extended model specifi-cation with the baseline model specification and confirm the relevance of gravity model predictions for migration flows The importance of EU accession meas-ured through the transitional provisions dummy variable again proved statistically significant and large in its value suggesting that EU accession could raise emigra-tion flows by 60 if all other factors remain unchanged Overall baseline and extended model specification results show that the possibility of free movement of people across borders gained with EU accession is the main trigger of intensifica-tion of emigration flows from NMS to the core EU countries However the new higher level of emigration flows from NMS towards the core EU countries follow-ing EU accession differs among countries ranging from 02 of the population as in the Czech Republic to almost 2 of population in Romania According to the estimates of the gravity model apart from the EU accession significant determi-nants in explaining the magnitude of migration outflows are represented by the characteristics of origin country population itself economic development and per-formance of short term economic indicators and level of institutional quality assessed through the corruption incidence of both origin (NMS) and destination countries (the core EU)
51 robustness checKsIn addition to static estimation models as a robustness check we also estimate a dynamic model We apply the Arellano and Bond (1991) and Blundell and Bond (1998) generalized method of moments estimator which is suitable for datasets characterized by short-time periods and large cross sectional dimension with endogenous independent variable and in presence of fixed effects and heterosce-dasticity and autocorrelation within observations Inclusion of a lagged dependent variable is also relevant for assessment of network effect on emigration decisions since lagged migration flow can be interpreted as network approximation Con-trolling for network effect is important since networks offer support and an addi-tional information set for migrants reducing migration costs and associated risks (Beine Docquier and Ozden 2009) In line with previous model specifications the dynamic model also contains origin dummies and destination dummies to take into account all unobservable time invariant origin and destination specific varia-
ivan
a dr
ažen
ov
ić ma
rin
a ku
no
vac d
om
inik pr
ipužić
dy
na
mic
s an
d deter
min
an
ts of em
igr
ation th
e ca
se of c
ro
atia an
d the ex
perien
ce
of n
ew eu m
emb
er states
pub
lic secto
r ec
on
om
ics
42 (4) 415-447 (2018)
436 bles that were not captured by the set of variables included in the model but are relevant for migration decisions and the intensity of migration flows The results of the dynamic model corroborate the main findings from the previous section The estimates confirm the importance of gravity model variables in the determina-tion of emigration flows Moreover EU accession assessed through the transi-tional provisions variable again resulted as sizable and significant increasing average emigration flows by 30 Finally we confirm the importance of short-term economic conditions ndash employment opportunities in origin country and changes in cyclical economic position in destination country as determinants of migration flows Contrary to the static model specification the impacts of the educational level of population in the origin country and the degree of corruption in the economy have the expected signs but are not statistically significant The results of dynamic model specification are presented in appendix 3
6 conclusIonThis paper aimed to clarify some basic facts about the dynamics and main deter-minants of emigration from Croatia following EU accession To that purpose extensive data analysis was conducted capturing and comparing different emigra-tion data sources Further the application of panel gravity model to Croatian and other NMS indirect emigration data enabled us to detect and discuss the main determinants of emigration from Croatia and other NMS to the core EU countries and their importance in making decisions about emigration
As a first contribution to the discussion of the issue of the current emigration wave in Croatia we use mirror statistics from core EU national statistical offices and compare them to the official emigration numbers of CBS Construction of an alter-native emigration dataset using immigration data from the national statistical offices of the core EU countries showed that emigration flows from Croatia following EU accession are on average 26 times as high as those recorded in official statistical data amounting to 230 thousand people leaving Croatia in the 2013-2016 period If we relate our results to a priori projections of emigration from Croatia after EU accession our estimates can be placed in between Vidovic and Mara (2015) and Strielkowski Šaacuterkovaacute and Żornaczuk (2013)22 Similar proportional population out-flows were observed in less developed new member states following their EU acces-sion (Romania and Bulgaria) while new member states from the initial wave of enlargement experienced less pronounced rises in their emigration flows
Analysis of detailed migration data available at national statistical offices of the new EU member states statistical offices showed that average characteristics of emigrants from NMS are similar across countries and point to a balanced emigra-tion with respect to the sex of the emigrants The main destination country for most countries in the sample was Germany Finally data also show that the aver-age emigrant from NMS in 2016 was between 31 and 37 years old indicating that emigration affects the young part of the population Emigration of mostly young
22 Direct comparison is not possible since the aforementioned authors estimate net migration potential while our analysis is based on gross emigration flows
ivan
a dr
ažen
ov
ić ma
rin
a ku
no
vac d
om
inik pr
ipužić
dy
na
mic
s an
d deter
min
an
ts of em
igr
ation th
e ca
se of c
ro
atia an
d the ex
perien
ce
of n
ew eu m
emb
er states
pub
lic secto
r ec
on
om
ics
42 (4) 415-447 (2018)437citizens is indisputably a human capital loss for origin countries However long-
term overall effects of emigration flows on origin countries should be interpreted with caution Emigration leads to improvement of knowledge and skills of emi-grants given that their skills increase due to exposure to international competi-tion instead of gradually deteriorating in the low capacity domestic labour mar-ket In the case of reverse migration this can result in a brain-gain for origin economies Moreover the effect of migration on the labour markets of origin countries is also twofold According to the extensive migration literature (Thaut 2009) the employment opportunities and wages of those who stay in origin coun-tries increase and the unemployment rate decreases causing the activation of long-term unemployed people On other hand labour market shortages in some sectors inevitably arise and sustainability of public pensions and other social ser-vice are threatened The overall effects will depend on synchronization of educa-tional policies with origin country labour market requirements overall degree of economic development and future economic performance in origin country
In fact the analysis of main determinants of migration showed the most significant factor in explaining emigration flows between NMS and the core EU countries is the accession to the principle of free movement of workers obtained by EU acces-sion which increased emigration flows in the range from 30 to 60 This is in line with other relevant studies about labour mobility within the EU where EU membership is found to increase labour mobility significantly23 However estima-tion of the gravity model revealed that there exist other significant determinants in explaining migration outflows such as the characteristics of origin country popu-lations itself economic development performance of short-term economic indica-tors and level of institutional quality assessed through the corruption incidence of both origin (NMS) and destination countries (the core EU) These findings imply that policies that promote broad and solid economic development can influence emigration flows which raises several implications for policymakers
Emigration phenomena will probably have a strong impact on the Croatian econ-omy in the medium-run Accordingly we would like to emphasise the importance of further research in this field Potential research topics encompass the assess-ment of the impact of the last emigration wave on the potential growth prospects of the Croatian economy the effect of increasing remittances on the Croatian economy sustainability of the current setup of social policies (pension funds health system new infrastructure investment existing infrastructure mainte-nance) required immigration flows in order to alleviate negative emigration con-sequences and finally the implications of emigration flows for the conduct of monetary fiscal and structural policy in the broadest sense
disclosure statementNo conflict of interest
23 For more details about relationship between EU membership and labour mobility see Arpaia et al (2016)
ivan
a dr
ažen
ov
ić ma
rin
a ku
no
vac d
om
inik pr
ipužić
dy
na
mic
s an
d deter
min
an
ts of em
igr
ation th
e ca
se of c
ro
atia an
d the ex
perien
ce
of n
ew eu m
emb
er states
pub
lic secto
r ec
on
om
ics
42 (4) 415-447 (2018)
438 aPPendIX 1
Table a1 Data sources and details independent variables
data sources and details for set of independent variables
Variable description source estimation details
GDP PC in PPS
Gross domestic product at market prices current prices PPS per capita
Eurostat online statistical database
Destination and origin country in log
Unemployment rate
Yearly unemployment rates from 15 to 64 years percentage
Eurostat online statistical database
Destination and origin country in log
Population Population on 1 January total
Eurostat online statistical database
Relative values between destination and origin country in log
Distance
ldquoDistance between two countries is calculated based on latitudes and longitudes of the most important citiesagglomerations (in terms of population) Mayer and Zignago (2011)rdquo
CEPII database In log
Youth population number
Population on 1 January from 20 to 34 years
Eurostat online statistical database
Origin country as a share in total population in log
Tertiary educated
Population by educational attainment level from 15 to 64 years tertiary education (levels 5-8)
Eurostat online statistical database
Origin country as a share in total population 1000 in log
Corruption index
Control of corruption captures perceptions of the extent to which public power is exercised for private gain including both petty and grand forms of corruption as well as ldquocapturerdquo of the state by elites and private interests (httpinfoworldbankorggovernanceWGIdoc)
Worldwide Governance Indicators (WGI) The World Bank
Destination and origin country in log
ivan
a dr
ažen
ov
ić ma
rin
a ku
no
vac d
om
inik pr
ipužić
dy
na
mic
s an
d deter
min
an
ts of em
igr
ation th
e ca
se of c
ro
atia an
d the ex
perien
ce
of n
ew eu m
emb
er states
pub
lic secto
r ec
on
om
ics
42 (4) 415-447 (2018)439data sources and details for set of independent variables
Variable description source estimation details
Governance index
ldquoGovernment effectiveness captures perceptions of the quality of public services the quality of the civil service and the degree of its independence from political pressures the quality of policy formulation and implementation and the credibility of the governments commitment to such policies (httpinfoworldbankorggovernanceWGIdoc)rdquo
Worldwide Governance Indicators (WGI) The World Bank
Destination and origin country in log
Output gap Output gaps ( of potential output) HP filter
European Commission CIRCAB II autum fore-cast
Destination and origin country
Employment rates
Yearly employment rates from 15 to 64 years percentage
Eurostat online statistical database
Destination and origin country in log
Transitional provisions
Variable representing the access to common free EU market for BG and RO takes value 1 for FI SE from 2007 for DK from 2009 for IT and IE from 2012 and for all other countries from 2014 Variable representing the access to common free EU market for HR takes value 1 for DK FI IR SE from 2013 for BE IT DE LU from 2015 while NL AT and UK apply transitional provisions for HR during the entire sample period (sample is ending in 2016 while transitional provisions applied by NL AT and UK should be lifted by June 2018) Variable representing the access to common free EU market for CZ SK SI PL HU LV LT EE takes value 1 for UK SE IE from 2004 for IT FI from 2006 for NL LU from 2007 for BE DK from 2009 and for AT DE from 2011
European Commission
Set of dummy variables
ivan
a dr
ažen
ov
ić ma
rin
a ku
no
vac d
om
inik pr
ipužić
dy
na
mic
s an
d deter
min
an
ts of em
igr
ation th
e ca
se of c
ro
atia an
d the ex
perien
ce
of n
ew eu m
emb
er states
pub
lic secto
r ec
on
om
ics
42 (4) 415-447 (2018)
440 Table a2 Data sources and details dependent variable
data sources and details for set of independent variablesVariable description source estimation details
Emigration flows
Data for IR NL FI SE IT AT LU DK avaliable on line Data for DE BE UK obtained on email request Data for UK and IE refers to immigration numbers and not to official migration statistics
National statistical offices websites of core EU countries
For static models ndash emigration from origin country i into destination country j in time t for dynamic model ndash share of emigrants in total population of origin country in log
Data for Germany and Denmark are based on country of previous residence principle Data for Netherlands Italy United Kingdom and Belgium on country of birth principle while data for Sweden Finland Luxemburg and Austria are based on citizenship principleCore EU countries are represented by 11 countries due to data availability Austria Belgium Denmark Finland Germany Ireland Italy Luxemburg Netherlands Sweden and United Kingdom Usually Portugal Greece Spain and France are also included in core EU countries Required immigration data are not publicaly available on their website Statistical office of Portugal delivered the data from our customized request Since data are starting in 2008 we do not include them in main specifications Upon conclusion of this paper we have not managed to receive required data from customized requests sent to other statistical offices
ivan
a dr
ažen
ov
ić ma
rin
a ku
no
vac d
om
inik pr
ipužić
dy
na
mic
s an
d deter
min
an
ts of em
igr
ation th
e ca
se of c
ro
atia an
d the ex
perien
ce
of n
ew eu m
emb
er states
pub
lic secto
r ec
on
om
ics
42 (4) 415-447 (2018)441aPPendIX 2
Table a3 Total migration flow in Croatia ndash approximation based on discretional combination of different data sources
emigration from and to croatia following the eu accession 2013 2014 2015 2016 2013-2016(1) Emigration to core EU countries from national statistical offices of core EU countries
31655 53666 72528 71314 229163
(2) Emigration to ldquorest of the worldrdquo according to CBS 11220 9049 11116 9238 40623
(3) Total emigration = (1) + (2) 42875 62715 83644 80552 269786(4) CNB total emigration 15262 20858 29651 36436 102207(5) Emigration coefficient 28 30 28 22 26(6) Immigration from core EU countries according to national statistical offices of core EU countries
14164 19346 23261 23422 80193
(7) Immigration from ldquorest of the worldrdquo according to CBS 8676 8540 8512 9705 35433
(8) Total immigration = (6) + (7) 22840 27886 31773 33127 115626(9) CBS total immigration 10378 10638 11706 13985 46707(10) Immigration coefficient 22 26 27 24 25(11) Net emigration = (3) ndash (8) 20035 34829 51871 47425 154160(12) CNB net emigration 4884 10220 17945 22451 55500(13) Net emigration coefficient 41 34 29 21 28
Note UK and Ireland not included in immigration numbersSource CBS and national statistical offices of the core EU countries
ivan
a dr
ažen
ov
ić ma
rin
a ku
no
vac d
om
inik pr
ipužić
dy
na
mic
s an
d deter
min
an
ts of em
igr
ation th
e ca
se of c
ro
atia an
d the ex
perien
ce
of n
ew eu m
emb
er states
pub
lic secto
r ec
on
om
ics
42 (4) 415-447 (2018)
442 aPPendIX 3
Table a4 Determinants of emigration flows from new EU member states to the core EU coun-tries between 2000 and 2016 dynamic estimation Arellano-Bond GMM estimator
model 3 dynamic model (gmm)
Distance -049(000)
Population 029(059)
Transitional provisions 025(000)
Employment rate (origin) -201(000)
Employment rate (destination) 053(047)
Output gap (origin) 372(036)
Output gap (destination) 218(000)
Corruption index (origin) -037(040)
Corruption index (destination) 057(055)
Share of youth (20-34) origin -032 (059)
Share of tertiary educated (origin) 035 (012)
ln(m t-1) 066(000)
Cons 74 Note and refer to 10 5 and 1 statistical significance levels respectively P-values are in parenthesis All specifications include origin and destination fixed effects dum-mies Parameters associated to output gap for origin and destination country are multiplied by 100 since the output gap enters the model specification in levels instead of being transformed into logarithms due to negative valuesSource Authorsrsquo elaboration based on national statistical offices of the core EU countries immi-gration data and on the data presented in appendix 1
ivan
a dr
ažen
ov
ić ma
rin
a ku
no
vac d
om
inik pr
ipužić
dy
na
mic
s an
d deter
min
an
ts of em
igr
ation th
e ca
se of c
ro
atia an
d the ex
perien
ce
of n
ew eu m
emb
er states
pub
lic secto
r ec
on
om
ics
42 (4) 415-447 (2018)443Table a5
Determinants of emigration flows from new EU member states to the core EU countries between 2000 and 2016 Poisson pseudo maximum likelihood estimator extended specification Model 4
model 4 fe model 4 PPml
Distance ndashndash
-152(000)
Population 169(000)
663(000)
Transitional provisions 047(000)
042(000)
Unemployment rate (origin) 019(003)
069(000)
Unemployment rate (destination) -003(066)
-109(000)
Output gap (origin) 218(001)
153(034)
Output gap (destination) 464(000)
252(009)
Governance index (origin) -022(052)
-229(000)
Governance index (destination) 089(011)
-271(040)
Share of youth (20-34) origin 171(000)
134(011)
Share of tertiary educated (origin) 041(002)
069(001)
Cons -104 422Number of observations 1958 1972R2 051 082
Note and refer to 10 5 and 1 statistical significance levels respectively P-values are in parenthesis All specifications include origin and destination fixed effects dum-mies Parameters associated to output gap for origin and destination country are multiplied by 100 since the output gap enters the model specification in levels instead of being transformed into logarithms due to negative valuesSource Authorsrsquo elaboration based on national statistical offices of the core EU countries immi-gration data and on the data presented in appendix 1
ivan
a dr
ažen
ov
ić ma
rin
a ku
no
vac d
om
inik pr
ipužić
dy
na
mic
s an
d deter
min
an
ts of em
igr
ation th
e ca
se of c
ro
atia an
d the ex
perien
ce
of n
ew eu m
emb
er states
pub
lic secto
r ec
on
om
ics
42 (4) 415-447 (2018)
444
aPP
en
dIX
4
Ta
bl
e a
6 Nu
mbe
r of e
mig
rant
s fro
m C
roat
ia b
y re
gion
(as
of t
otal
pop
ulat
ion
of th
e re
gion
) bet
ween
200
1 an
d 20
16 C
entra
l Bur
eau
of S
tatis
tics d
ata
gro
ss
emig
ratio
n flo
ws
20
0120
0220
0320
0420
0520
0620
0720
0820
0920
1020
1120
1220
1320
1420
1520
16Ea
ster
n C
roat
ia0
20
20
20
30
20
30
30
20
40
30
30
30
40
61
01
4C
entra
l Cro
atia
02
02
02
02
02
02
03
03
03
03
04
03
05
06
08
10
Lika
and
Gor
ski k
otar
02
02
02
01
01
02
02
02
02
02
03
03
04
06
09
10
Cen
tral a
nd S
outh
ern
Adr
iatic
01
02
01
01
01
01
02
02
02
03
04
04
05
05
06
07
Nor
then
Adr
iatic
02
02
01
01
01
01
01
01
01
02
05
04
03
04
06
07
Nor
thw
este
rn C
roat
ia0
10
10
10
10
00
10
10
00
00
00
10
10
10
30
40
6C
ity o
f Zag
reb
02
06
02
01
01
01
01
01
01
02
03
03
03
04
06
06
Not
es E
aste
rn C
roat
ia e
ncom
pass
es V
irovi
tičko
-pod
ravs
ka P
ožeš
ko-s
lavo
nska
Bro
dsko
-pos
avsk
a O
sječk
o-ba
ranj
ska
and
Vuko
vars
ko-s
rijem
ska
coun
ties
Cent
ral C
roat
ia
enco
mpa
sses
Zag
reba
čka
Sis
ačko
-mos
lava
čka
Kar
lova
čka
and
Bjel
ovar
sko-
bilo
gors
ka c
ount
ies
Lika
and
Gor
ski k
otar
enc
ompa
ss P
rim
orsk
o-go
rans
ka a
nd L
ičko
-sen
jska
co
untie
s C
entr
al a
nd S
outh
ern
Adri
atic
enc
ompa
ss Z
adar
ska
Šib
ensk
o-kn
insk
a S
plits
ko-d
alm
atin
ska
and
Dub
rova
čko-
nere
tvan
ska
coun
ties
Nor
then
Adr
iatic
refe
rs to
Is
tars
ka C
ount
y N
orth
wes
tern
Cro
atia
enc
ompa
ss K
rapi
nsko
-zag
orsk
a V
araž
dins
ka M
eđim
ursk
a an
d K
opri
vnič
ko-k
riže
vačk
a co
untie
sSo
urce
CBS
ivan
a dr
ažen
ov
ić ma
rin
a ku
no
vac d
om
inik pr
ipužić
dy
na
mic
s an
d deter
min
an
ts of em
igr
ation th
e ca
se of c
ro
atia an
d the ex
perien
ce
of n
ew eu m
emb
er states
pub
lic secto
r ec
on
om
ics
42 (4) 415-447 (2018)445references
1 Anderson J E 2011 The Gravity Model Annual Review of Economics Annual Reviews 3(1) pp 133-160
2 Arellano M and Bond S 1991 Some tests of specification for panel data Monte Carlo evidence and an application to employment equations Review of Economic Studies 58(2) pp 277-297 httpsdoiorg1023072297968
3 Arpaia A [et al] 2016 Labour mobility and labour market adjustment in the EU IZA Journal of Devlopment and Migration 5(21) pp 1-37 httpsdoiorg101186s40176-016-0069-8
4 Beine M Bourgeon P and Bricongne J C 2017 Aggregate Fluctuations and International Migration Scand Journal of Economics Accepted Author Manuscript httpsdoiorg101111sjoe12258
5 Beine M Docquier F and Ozden C 2009 Diasporas Journal of Develop-ment Economics 95(1) pp 30-41 httpsdoiorg101016jjdeveco2009 11004
6 Bertoli S Bruumlcker H and Fernaacutendez-Huertas Moraga J 2013 The Euro-pean Crisis and Migration to Germany Expectations and the Diversion of Migration Flows IZA Discussion Papers No 7170 Available at lthttpftpizaorgdp7170pdfgt
7 Blundell R and Bond S 1998 Initial conditions and moment restrictions in dynamic panel data models Journal of Econometrics 87(1) pp 115-143 httpsdoiorg101016S0304-4076(98)00009-8
8 Borjas G J 1987 Self-Selection and the Earnings of Immigrants The Amer-ican Economic Review 77(4) pp 531-553
9 Božić S and Burić B 2005 Migracijski potencijal Hrvatske ndash mikroanalitički aspekti Migracijske i etničke teme 21(1-2) pp 9-33
10 Bruumlcker H [et al] 2009 Labour mobility within the EU in the context of enlargement and the functioning of the transitional arrangements Nurem-berg European Integration Consortium Final Report Available at lthttpeceuropaeusocialBlobServletdocId=2509amplangId=engt
11 Eurostat 2018 Eurostat International Migration Statistics Available at lthttpseceuropaeueurostatcachemetadataenmigr_immi_esmshtmgt
12 Fertig M and Kahanec M 2013 Mobility in an Enlarging European Union Projections of Potential Flows from EUrsquos Eastern Neighbors and Croatia IZA Discussion Papers No 7634 Available at lthttpftpizaorgdp7634pdfgt
13 Flowerdew R and Salt J 1979 Migration between labour market areas in Great Britain 1970-1971 Journal Regional Studies 13(2) pp 211-231 httpsdoiorg10108009595237900185181
14 Grogger J and Hanson G H 2011 Income Maximization and the selection and sorting of international Migrants Journal of Development Economics 95(1) pp 42-54 httpsdoiorg101016jjdeveco201006003
15 Harris J R and Todaro M P 1970 Migration Unemployment and Devel-opment A Two-Sector Analysis The American Economic Review 60(1) pp 126-142
ivan
a dr
ažen
ov
ić ma
rin
a ku
no
vac d
om
inik pr
ipužić
dy
na
mic
s an
d deter
min
an
ts of em
igr
ation th
e ca
se of c
ro
atia an
d the ex
perien
ce
of n
ew eu m
emb
er states
pub
lic secto
r ec
on
om
ics
42 (4) 415-447 (2018)
446 16 Hazans M and Philips K 2011 The Post-Enlargement Migration Experi-ence in the Baltic Labor Markets IZA DP No 5878 Available at lthttpftpizaorgdp5878pdfgt
17 HZZ 2017 Anketa poslodavaca 2017 Zagreb Hrvatski zavod za zapošlja-vanje Available at lthttpwwwhzzhrUserDocsImagesAnketa_posloda-vaca_2017_HZZpdfgt
18 Izquierdo M Jimeno J F and Lacuesta F 2014 The Impact of the Crisis on Migration Flows in Spain Intereconomics 49(3) pp 144-151
19 Jurić T 2017 Suvremeno iseljavanje Hrvata u Njemačku karakteristike i motivi Migracijske i etničke teme 24(3) pp 337-371
20 Lamberty L 2015 Explaining Baltic Migration After EU Accession Deter-minants and Consequences Available at lthttpswwwehllusemediaehlsneepaperslambertypdfgt
21 Ordinance for the implementation of the General Tax Act OG 3017 Zagreb Official Gazzete
22 Poot J [et al] 2016 The gravity model of migration the successful come-back of an ageing superstar in regional science Investigaciones Regionales ndash Journal of Regional Research 36 pp 63-86
23 Poprawe M 2015 On the relationship between corruption and migration empirical evidence from a gravity model of migration Public Choice 163(3) pp 337-354 httpsdoiorg101007s11127-015-0255-x
24 Ramos R 2016 Gravity models A tool for migration analysis IZA World of Labor 2016 No 239 httpsdoiorg1015185izawol239
25 Santos Silva J M and Tenreyro S 2006 The log of gravity The Review of Economics and Statistics 88(4) pp 641-658 httpsdoiorg101162rest 884641
26 Sjaastad L A 1962 The Costs and Returns of Human Migration Journal of Political Economy 70(5) pp 80-93 httpsdoiorg101086258726
27 Sprenger E 2013 The Determinants of International Migration in the Euro-pean Union An Empirical Analysis IOS Working Papers No 325 Available at lthttpswwweconstoreubitstream10419792401733903029pdfgt
28 Statistics Poland 2011 The concept of the international migration statistic system in Poland Available at lthttpsstatgovplcpsrdexbcrgusp_inter_migration_stat_system_in_polandpdfgt
29 Strielkowski W Šaacuterkovaacute K and Żornaczuk T 2013 EU Enlargement and Migration Scenarios of Croatian Accession Romanian Journal of European Affairs 13(3) pp 53-63 httpsdoiorg102139ssrn2334173
30 Šonje V 2018 Nepovratna emigracija prva procjena Available at lthttparhivanalitikahrblognepovratna-emigracija-prva-procjenagt
31 Thaut L 2009 EU Integration amp Emigration Consequences The Case of Lithuania International Migration 47(1) pp 192-233 httpsdoiorg 101111j1468-2435200800501x
ivan
a dr
ažen
ov
ić ma
rin
a ku
no
vac d
om
inik pr
ipužić
dy
na
mic
s an
d deter
min
an
ts of em
igr
ation th
e ca
se of c
ro
atia an
d the ex
perien
ce
of n
ew eu m
emb
er states
pub
lic secto
r ec
on
om
ics
42 (4) 415-447 (2018)44732 Tinbergen J 1962 Shaping the World Economy Suggestions for an Interna-
tional Economic Policy New York The Twentieth Century Fund33 Vidovic H and Mara I 2015 Free Movement of Workers Transitional
Arrangements and Potential Mobility from Croatia The Vienna Institute for International Economic Studies Research Report No 402 Available at lthttpswiiwacatfree-movement-of-workers-transitional-arrangements-and-potential-mobility-from-croatia-dlp-3630pdfgt
34 Vuković V 2017 The political economy of local government in Croatia winning coalitions corruption and taxes Public Sector Economics 41(4) pp 387-421 httpsdoiorg103326pse4141
35 Župarić-Ilijć D 2016 Iseljavanje iz Republike Hrvatske nakon ulaska u Europsku uniju Zagreb Friedrich Ebert Stiftung Available at lthttpwwwfes-croatiaorgfileadminuser_uploadFES_Iseljavanje_webpdfgt
Determinants of subnational budgetfiscal transparency a review of empirical evidence
BRANKO STANIĆ MA in Economics
Review articleJEL H11 H72httpsdoiorg103326pse4244
The author would like to thank the two anonymous referees for helpful comments on the paper This study was supported by the Croatian Science Foundation (grant number IP-2014-09-3008)
Received March 22 2018 Accepted November 9 2018
Branko STANIĆInstitute of Public Finance Smičiklasova 21 10000 Zagreb Croatiae-mail brankostanicijfhrORCiD 0000-0002-8746-6764
br
an
ko sta
nić
deter
min
an
ts of su
bn
ation
al b
ud
getfisc
al tr
an
spar
enc
y a rev
iew o
f empir
ica
l evid
enc
epu
blic sec
tor
eco
no
mic
s42 (4) 449-486 (2018)
450 abstractThis paper provides a review of empirical research on the factors determining the budgetfiscal transparency of subnational governments It focuses on academic online databases by conducting keyword searches that take in papers published in the period 2000-2017 Three important observations can be made (1) there is a lack of a unique definition of budgetfiscal transparency (2) the different defini-tions lead to disharmonised budgetfiscal transparency measurements (3) there is a heterogeneity of the definition and measurement of some explanatory variables that can lead to apparent contradictions and inconsistencies in the results obtained However the paper provides a balanced account of core explanatory factors emphasizing variables that despite heterogeneity in definition and meas-urement have a significant impact on the levels of subnational government budgetfiscal transparency Since the review involves mainly online disclosure future studies might want to extend the observation period or implement systematic reviews and meta-analyses to gain additional insights on this topic
Keywords subnational governments budget transparency empirical review main determinants
1 IntroductIonIt can be said that in the past two decades and especially in the aftermath of the financial crisis enormous pressure has been put on governments to improve their communication with citizens by being more open transparent and accountable In this sense more and more attention is being paid to fiscal and budgetary issues Some of the most prominent initiatives that advocate for these issues are the Inter-national Budget Partnership (IBP) the Global Initiative for Fiscal Transparency (GIFT) and the Open Government Partnership (OGP) Due to the OGPrsquos strong advocacy a total of 75 countries have endorsed the Open Government Declaration and announced their country action plans More recently OGP was opened to subnational governments In 2016 a total of 15 subnational governments signed the declaration and submitted their action plans to be implemented throughout 2017 as part of a pilot program
Thus the discourse of budget transparency seems to be changing giving ever more importance to subnational governments (SNGs) Accordingly subnational budgets are becoming a ubiquitous topic in the field of public financial management Their importance also stems from the fact that public goods and services are particularly tangible at the subnational and especially the local level Therefore citizens may have more interest in participating in local budget processes where they can see their direct impact on local development Furthermore subnational budget transpar-ency enables ordinary citizens and civil society organizations to evaluate govern-ment services and facilities and suggest possible changes and needs in the future
The internet has provided an additional incentive for proactive publishing ena-bling large-scale publication of budget data as well as constantly improving gov-
br
an
ko sta
nić
deter
min
an
ts of su
bn
ation
al b
ud
getfisc
al tr
an
spar
enc
y a rev
iew o
f empir
ica
l evid
enc
epu
blic sec
tor
eco
no
mic
s42 (4) 449-486 (2018)
451ernment consultation processes It can be said that the rise of the internet has fur-thered budget transparency by allowing rapid and inexpensive proactive disclo-sure (Darbishire 2010) Consequently SNGs have increasingly resorted to proac-tive budget disclosure thus not only reducing demand-side pressures but also changing their attitude and way of communicating with citizens Despite the widespread availability and bidirectionality of the internet SNG websites vary greatly in the amount of information available comprehensiveness timeliness and interactiveness (Caba-Peacuterez Rodriacuteguez Boliacutevar and Loacutepez Hernaacutendez 2008) While some SNGs run open budget policies others oppose the practice and rarely use the low cost benefits of online proactive publishing
The aim of this study is hence to review the development of research conducted previously in order to understand the factors that could influence SNG budgetfiscal disclosure In other words it aims to produce a balanced account of the set of variables that significantly affect SNG budgetfiscal transparency Some previ-ous studies reviewed the various types of public sector disclosure (Bakar and Saleh 2015) However this study explores studies published in the 2000-2017 period focusing explicitly on budget or fiscal transparency The paper is organ-ized as follows Section 2 provides the methodological framework Section 3 pre-sents different definitions and measurements of budgetfiscal transparency Sec-tion 4 offers a balanced account of core determinants of SNG budgetfiscal disclo-sure Section 5 concludes with recommendations for future research
2 frameworK for analysIsThis review focuses on identifying explicitly quantitative studies on the determi-nants of SNG budgetfiscal transparency The decision for quantitative studies is because they allow for rapid analysis and replication which increases reliability validity and the greater probability of obtaining unambiguous results which con-tributes to better decision-making Subnational governments include all levels below the national government ie local regional state and provincial To identify eligible articles this study used the Summon discovery service ndash a unified search for all electronic sources of academic publications including search interfaces such as ProQuest EBSCO Host Web of Science and Scopus In addition Google Scholar and hand searches were also used This review includes studies published from 2000-2017 thus the focus is inherently on online disclosure Only studies in English are taken into consideration Search terms used were ldquocauses of budgetfiscal transparencyrdquo ldquosubnational government transparencyrdquo ldquobudgetfiscal trans-parency determinantsrdquo ldquolocal government transparencyrdquo or just ldquogovernment transparencyrdquo Since only a few studies focused solely on budget or fiscal transpar-ency it should be noted that this review includes all studies that in their transpar-ency measure have at least one dimension concerning the budget ie revenues and expenditures Although books were initially included in the search no relevant sources were generated on the determinants of subnational budgetfiscal transpar-ency This is probably due to it being an insufficiently researched topic which is why journals take the lead while books are still outdated as sources of information
br
an
ko sta
nić
deter
min
an
ts of su
bn
ation
al b
ud
getfisc
al tr
an
spar
enc
y a rev
iew o
f empir
ica
l evid
enc
epu
blic sec
tor
eco
no
mic
s42 (4) 449-486 (2018)
452 However the eligibility criteria were designed to ensure that high-quality relevant work is included specifically referring to empirical quantitative studies that employ budgetfiscal transparency as the dependent variable Finally 20 studies are included in the review All studies are peer-reviewed and published in journals with the exception of Ma and Wuʼs (2011) paper which remained as part of the 1st
Global Conference on Transparency Research held at Rutgers University
Although it is unquestionable that every paper has made a contribution this review highlights four papers on account of their narrow focus on budgetfiscal transparency strong and credible evidence and rigorous methodology used The first is a paper by Alt Lassen and Rose (2006) who used a unique panel data on the evolution of transparent budget procedures in the US states over the past three decades They used both case studies and quantitative analysis presenting robust results Serrano-Cinca Rueda-Tomaacutes and Portillo-Tarragona (2009) used multivariate logistic regression focusing exclusively on the availability of budget-related documents Although their results showed different levels of robustness they proved that size of the municipality political will and residentsrsquo income all affect budget disclosure Similarly Guillamoacuten Bastida and Benito (2011) exam-ined the determinants of budget and financial transparency using both OLS and 2SLS regression analysis After controlling for endogeneity they confirmed the robustness of the model employed Like them Esteller-Moreacute and Polo Otero (2012) remained focused on budget information disclosures They applied their analysis to a large sample of municipalities using a logit regression analysis for panel data covering a seven-year period These four papers are emphasized on the basis of measurements of the dependent variables and the credibility and quality of the evidence and method used for determining the factors of budgetfiscal trans-parency With this in mind all the papers included in the review are presented in the following chapters first by measuring the dependent variables and then by the established budgetfiscal transparency factors
3 budgetfIscal transParency ndash from defInItIon to measurement
31 defInItIonIn the literature budget transparency and fiscal transparency are often used inter-changeably which may point to the equivalence of these two concepts However budget transparency is a narrower concept focusing on the budget reports within the budget cycle On the other hand fiscal transparency also includes fiscal activ-ities undertaken outside the budget sector aiming at reducing off-budget transac-tions (IMF 1997) It often includes information on all stocks as well as flows which can hardly be found in the budget documents Still it is difficult to make a strict division between these two concepts since they are intertwined and some-times even used synonymously Therefore this paper will use both terms One of the most comprehensive definitions of fiscal transparency was offered by Kopits and Craig (19981)
br
an
ko sta
nić
deter
min
an
ts of su
bn
ation
al b
ud
getfisc
al tr
an
spar
enc
y a rev
iew o
f empir
ica
l evid
enc
epu
blic sec
tor
eco
no
mic
s42 (4) 449-486 (2018)
453ldquoFiscal transparency implies an openness toward the public at large about government structure and functions fiscal policy intentions public sector accounts and projections It involves ready access to reliable comprehen-sive timely understandable and internationally comparable information on government activities ndash whether undertaken inside or outside the gov-ernment sector ndash so that the electorate and financial markets can accurately assess the governmentrsquos financial position and the true costs and benefits of government activities including their present and future economic and social implicationsrdquo
In accordance with this definition Alt Lassen and Skilling (2002) stressed that financial documents should be informative and comprehensive but at the same time easily understandable leaving the option of independent scrutiny In order to facilitate this inspection and monitoring of economic policies by national authori-ties financial markets and international institutions the IMF has developed a Code of Good Practices on Fiscal Transparency (IMF 1998) The Code consisted of four main principles 1) clarity of roles and responsibilities 2) public availability of information 3) open budget preparation execution and reporting and 4) independent assurances of integrity
Although this Code has helped practitioners in understanding basic concepts of fiscal transparency practices it did not contain clear guidelines or standards that would facilitate the way and approach to measuring fiscal transparency However the Code was revised in 2007 pointing out that fiscal data (budget forecasts and updates annual budget and final accounts fiscal reports) should meet accepted data quality standards Similarly the OECD has developed best practices for budget transparency although their definition of budget transparency refers to broader concept of fiscal matters ldquofull disclosure of all relevant fiscal information in a timely and systematic mannerrdquo (OECD 20027) The best practices are divided into three parts ndash budget reports specific disclosures and integrity assurance (table 1) It is evident that only the first section corresponds to pure budget disclo-sure while the other two represent wider fiscal matters Still the first section can be considered the first internationally recognized standard for budget reporting
Table 1 The ldquothree pillarsrdquo of the OECDrsquos best budget transparency practices
budget reports Specific disclosures Integrity control and accountabilityThe budget Economic assumptions Accounting policiesPre-budget report Tax expenditures Systems and responsibilityMonthly reports Financial assets and liabilities AuditMid-year report Non-financial assets Public and parliamentary scrutinyYear-end report Employee pension obligationsPre-election report Contingent liabilitiesLong-term report
Source OECD (2002)
br
an
ko sta
nić
deter
min
an
ts of su
bn
ation
al b
ud
getfisc
al tr
an
spar
enc
y a rev
iew o
f empir
ica
l evid
enc
epu
blic sec
tor
eco
no
mic
s42 (4) 449-486 (2018)
454 It could be said that a number of authors have defined budgetfiscal transparency not only as the availability of budgetfiscal information but also in terms of open-ness and public accountability This can best be seen in Kopits and Craig (1998) who argue that fiscal transparency does not only imply access to fiscal reports but rather the openness of fiscal policies and procedures Similarly Andreula Chong and Guilleacuten (2009) state that fiscal transparency apart from open budget prepara-tion and availability of fiscal information also implies assurances of roles and responsibilities In this sense the IMF has indicated the difference between fiscal reporting and fiscal transparency While the first refers to the production and avail-ability of fiscal information the second relates to the ldquoclarity reliability fre-quency timeliness and relevance of public fiscal reporting and the transparency of the governmentrsquos fiscal policy-making processrdquo (IMF 20125)
One can conclude that there is no uniform definition of budgetfiscal transparency which indicates a complex understanding of this topic In other words while there are certain standards and guidelines different definitions and interpretations directly affect the approach and the way of measurement Certainly the methods and scope of measurement also depend on the context in which the research is carried out Since this review is based on the causes rather than the effects of budgetfiscal transparency the next section provides an empirical overview of dif-ferent measurements in which the budgetfiscal transparency measure appears as a dependent variable
32 VarIous aPProaches to measurIng subnatIonal budgetfIscal transParency ldquoConceptually a statistical measure of transparency is the precision of the information that is obtained ie a function of its relevance and qualityrdquo
(Vishwanath and Kaufmann 19994)
Given the specificities of different countriesrsquo laws standards procedures and con-texts one should be careful while summing comparing and interpreting different definitions and measures of budgetfiscal transparency In other words subna-tional comparisons may be most important within rather than across countries Accordingly this section seeks to present the first studies from Spain and USA ndash since most papers on this topic are focused on the SNGs of these two countries Then individual studies with samples from other countries were presented
spainThe largest body of research comes from Spanish local governments Gandiacutea and Archidona (2008) presented an extensive local government online disclosure index which consists of five sub-indices two of which provide comprehensive budget and financial information The other three dimensions include general government information web presentation and navigation and relational web to address interactivity and functionality of the web Unlike them Serrano-Cinca Rueda-Tomaacutes and Portillo-Tarragona (2009) explicitly explored budget and
br
an
ko sta
nić
deter
min
an
ts of su
bn
ation
al b
ud
getfisc
al tr
an
spar
enc
y a rev
iew o
f empir
ica
l evid
enc
epu
blic sec
tor
eco
no
mic
s42 (4) 449-486 (2018)
455financial disclosure which they measured by sending questionnaires to munici-palities regarding their online publication of nine items (based on Spanish legis-lation regarding local government financial disclosure) including consolidated and unconsolidated budgets budget and annual accounts of dependent entities Like Gandiacutea and Archidona (2008) Caba-Peacuterez Rodriacuteguez Boliacutevar and Loacutepez Hernaacutendez (2008) have also offered an extensive web financial disclosure index hoping to contribute to a more harmonized framework for the structure of budget and financial information in Spanish local governments Although the numbers of items observed are different the main sections of their disclosure indexes are quite the same including budget and financial information and web navigability The main difference is that Caba-Peacuterez Rodriacuteguez Boliacutevar and Loacutepez Hernaacutendez (2008) included non-financial information such as indicators of economy effi-ciency and effectiveness and paid more attention to the characteristics of infor-mation such as timeliness understandability or comparability rather than content of information provided Several authors used the government transparency measure calculated by Transparency International (TI) Spain (Guillamoacuten Bastida and Benito 2011 del Sol 2013 De Arauacutejo and Tejedo-Romero 2016) This index consists of five government transparency areas (a) information about the municipal corporation (b) social transparency (c) financial transparency (d) ser-vices contracting transparency (e) urban development and procurement trans-parency Among these studies Guillamoacuten Bastida and Benito (2011) have con-tributed most to the field of budgetfiscal transparency by focusing explicitly on TIrsquos financial transparency section In other words their dependent variable was based solely on financial transparency indicators including accounting and budget transparency on revenues and expenditures and information on munici-pal debt Their study inspired others to use the same transparency measure for Spanish municipalities (del Sol 2013 De Arauacutejo and Tejedo-Romero 2016)
A significant study was presented by Esteller-Moreacute and Polo Otero (2012) who employed a panel analysis by using a large sample of Catalan municipalities in the period 2001-7 They constructed their fiscal transparency index by addressing the timeliness of the mandatory disclosure of municipalities that need to submit their budget information to the Public Audit Office for Catalonia The budget informa-tion consisted of the following budget approval final budget budget balances closed settlement budgets treasury statement treasury surplus net wealth state-ment income statement and indebtedness Similarly Caamantildeo-Alegre et al (2013) have investigated Galician municipalities They based their budget transparency measure on the IMFrsquos revised Code of Good Practices on Fiscal Transparency and sent the questionnaires to government officials by using a Likert-type survey on open budget process public availability of information and assurance of integrity However unlike Esteller-Moreacute and Polo Otero (2012) who offered a large number of observations and time variation this study remained limited in this sense
A slightly different approach to measuring government transparency was provided by Gandiacutea Marrahiacute and Huguet (2016) who looked at the presence of Web 20 in
br
an
ko sta
nić
deter
min
an
ts of su
bn
ation
al b
ud
getfisc
al tr
an
spar
enc
y a rev
iew o
f empir
ica
l evid
enc
epu
blic sec
tor
eco
no
mic
s42 (4) 449-486 (2018)
456 Spanish city councils In this way they wanted to examine the existence of partici-pative and social web with the possibility of user-generated content Accordingly their disclosure index contained not only information disclosure but also relational web Similar to del Sol (2013) they observed the total index as well as three sub-indices ndash ornamental index (general and citizen information) relational index and information index which includes budgetary and financial disclosure
united statesShortly after the OECD and the IMF implemented Codes of Best Practice for Fis-cal Transparency Alt Lassen and Rose (2006) published one of the most promi-nent and influential studies on the causes of fiscal transparency They examined the determinants of US States both conceptually and empirically A conceptual section included case studies of the states that managed to make significant pro-gress towards higher transparency levels within a short time frame On the other side the transparency measure was not based on the availability of fiscal docu-ments but rather on transparency of state government budget procedures Using the 1990s cross-sectional data from the National Association of State Budget Officers and the National Conference of State Legislatures they extended the data to the beginnings of transparent budget procedures of US states covering the period 1972-2002 This enabled them to use panel analysis which to the best of my knowledge was used for the first time in analyzing the causes of subnational fiscal transparency Although this study offers a unique data set comprising sur-vey responses to a questionnaire sent to the budget officers of all fifty states because of the period covered it could not address e-government practices
However with the rapid adoption of the internet more recent studies are mainly focused on online fiscalbudget transparency usually examining transparency lev-els on governmentsrsquo official websites While Alt Lassen and Rose (2006) offered a transparency measure with a considerable time variation more recent studies looked at the budgetfiscal transparency at one point in time or with small time periods Bernick et al (2014) dropped to a lower level exploring the fiscal trans-parency practices of US counties in 2014 They measured the online availability of a comprehensive annual financial report (CAFR) and availability and compre-hensiveness of budget information (no exact document or information is indi-cated) Similarly Lowatcharin and Menifield (2015) investigated county website transparency in 2010 However their county transparency measure (conducted by the Sunshine Review) included not only fiscal disclosure but a wider spectrum of government transparency such as permits and zoning contracts lobbying etc Relying on Groff and Pitmans (2004) description of internet financial reporting for the 100 largest US municipalities Styles and Tennyson (2007) extended the findings by examining the online availability and accessibility of CAFR data for a sample of US municipalities of various sizes
br
an
ko sta
nić
deter
min
an
ts of su
bn
ation
al b
ud
getfisc
al tr
an
spar
enc
y a rev
iew o
f empir
ica
l evid
enc
epu
blic sec
tor
eco
no
mic
s42 (4) 449-486 (2018)
457other countriesWhen it comes to pioneers in dealing with voluntary internet financial reporting in subnational governments the paper by Laswad Fisher and Oyelere (2005) deserves highlighting They observed New Zealandrsquos district city and regional councils by constructing the financial transparency measure as a dichotomous variable indicating whether or not the local authority publishes financial informa-tion on the web However their definition of what is considered published may be somewhat confusing since they had four disclosure categories financial high-lights only annual reports only annual plan only and combinations of annual reports plans and financial highlights together In other words it is not clear whether there is any council that has published for example both annual plan and report in which case the analysis could change considerably Garciacutea-Tabuyo Saacuteez-Martiacuten and Caba-Peacuterez (2016) investigated online proactive disclosure of the 40 largest municipalities in each of the five countries of Central America ndash El Salvador Nicaragua Panama Guatemala and Honduras This was a valuable study since the same transparency measure was employed for local government transparency in different country contexts However their measure consists of five transparency areas where economic and financial transparency (including enacted and executed consolidated and individual budget and budget amend-ments) accounts for 20 the total index
On the other hand some studies focused explicitly on fiscal transparency either on a sample of Brazilian states (Zuccolotto and Teixeira 2014) or Chinese provincial government (Ma and Wu 2011) While Ma and Wu (2011) used the data collected from the first two years of the four-year survey by the Public Policy Research Center in Shanghai Zuccolotto and Teixeira (2014) employed a fiscal transparency measure developed by Biderman and Pottomatti (2010)1 Tavares and da Cruz (2017) used TI Portugalʼs index of municipal transparency to assess a disclosure of Portuguese municipalities The index is a comprehensive measure of local gov-ernemnt transparency comprising seven dimensions one of which is economic and financial transparency However unlike other extensive measures it only monitors the availability of a set of information items on a municipalitys website not taking into account accessibility navigability reliability or the quality of the information A study presented by Gesuele Metallo and Longobardi (2017) analyzed website disclosure of Italian and Spanish municipalities Although their contribution is valuable (very few studies with an international context) they did not sufficiently address budgetfiscal transparency except for financial statements and information about municipalitiesrsquo assets such as values location and revenue
33 the challenge of subnatIonal budgetfIscal transParency measurement
This review will outline several budgetfiscal transparency measurement chal-lenges and opportunities First the use of the same transparency measure within a
1 A study available only in Portuguese
br
an
ko sta
nić
deter
min
an
ts of su
bn
ation
al b
ud
getfisc
al tr
an
spar
enc
y a rev
iew o
f empir
ica
l evid
enc
epu
blic sec
tor
eco
no
mic
s42 (4) 449-486 (2018)
458 country would allow for a comparison of the results of different studies which could contribute to a greater understanding of inconsistent results and to the reduction or explanation of the ambiguity in the previous findings The review shows that only a few studies used the same transparency index within a country as with the TI Spain index used by De Arauacutejo and Tejedo-Romero (2016) del Sol (2013) and Guillamoacuten Bastida and Benito (2011) Second the transparency measure mainly involved one year of observation and only a few studies have had a long dataset of the dependent variable such as Alt Lassen and Rose (2006) or Esteller-Moreacute and Polo Otero (2012) The longer time span of the dependent var-iable opens the door to many methodological approaches enables a better quality analysis and gives an opportunity to observe the progress of SNG budgetfiscal transparency Third in order to improve the observation of the causes of budgetfiscal transparency it is necessary to have more studies focusing solely on budget-ary and fiscal indicators
Although strong efforts have been made to standardize fiscal transparency meas-ures at the national level this remains an empirical and contextual challenge at the local level However some studies have already examined cross-country analyses by introducing their own index on a sample of municipalities (Garciacutea-Tabuyo Saacuteez-Martiacuten and Caba-Peacuterez 2016 Gesuele Metallo and Longobardi 2017) Nonetheless to facilitate these efforts analogously to the IBP Open Budget Sur-vey one of the biggest challenges (given the diversity of the local self-government system) is to create a harmonized budgetfiscal transparency index capable of being applied to the subnational governments of various countries Results of these studies could provide more comprehensive insights into the contextual sen-sitivity but also generally in examining the causes of budgetfiscal transparency
4 determInants of subnatIonal budgetfIscal transParency ndash emPIrIcal oVerVIew
41 heterogeneIty of defInItIon and measurement of VarIablesThis review discusses the different definitions and measurements of some varia-bles While different measurements are not unexpected in different countries (bear-ing in mind different types of data) the main issue is when these arise within a single country which can lead to confusion and ldquofalserdquo variability in the results However when concluding and interpreting results of previous studies attention has to be paid to the definitions and the way of measuring variables regardless of whether they are in-country or cross-country comparisons According to the litera-ture some of the most frequently used variables that can cause confusion are lever-age debt and political competition Although the definition of leverage is quite unambiguous several studies have used different measures Laswad Fisher and Oyelere (2005) have measured it in two ways as a ratio of long-term liabilities in total assets and in total public equity On the other hand some studies have used financial expenses per capita as a proxy for leverage (Gandiacutea and Archidona 2008 Gandiacutea Marrahiacute and Huguet 2016) Gandiacutea and Archidona (2008) have equated leverage with indebtedness making it more confusing by stating that they have
br
an
ko sta
nić
deter
min
an
ts of su
bn
ation
al b
ud
getfisc
al tr
an
spar
enc
y a rev
iew o
f empir
ica
l evid
enc
epu
blic sec
tor
eco
no
mic
s42 (4) 449-486 (2018)
459used the cost of debt as a proxy of indebtedness which is measured as municipal financial expenses per capita At the same time Caba-Peacuterez Rodriacuteguez Boliacutevar and Loacutepez Hernaacutendez (2008) used funding costs of current year budget expendi-ture per capita as a proxy for the cost of debt not assigning it to leverage but rather to debt Gesuele Metallo and Longobardi (2017) have not even described their leverage measure They defined it simply as a value of leverage per capita while the measure was described just as natural logarithm thus leaving it unexplained
A unique measure for debt issuance was presented by Serrano-Cinca Rueda-Tomaacutes and Portillo-Tarragona (2009) who used a dichotomic variable which assigns the value of 1 if the town hall has municipal bonds in circulation denoting a debt issu-ance On the other side some debt measures are more straight-forward such as debt level as a percentage of the total budget (del Sol 2013) or the often-used municipal public debt per capita (Alt Lassen and Rose 2006 Styles and Tenny-son 2007 Guillamoacuten Bastida and Benito 2011 Caamantildeo-Alegre et al 2013)
While some authors argue that a governmentrsquos decision to disclose or retain infor-mation is inherently political (Wehner and de Renzio 2013) others claim that political competition is a major driver of transparency reforms (Berliner and Erlich 2015) However the mode of measurement of political competition imposes the greatest variability among political determinants There are various measures intro-duced for this variable Some studies observe it as a margin of victory measured by the difference between the percentage of votes obtained by the parties coming in first and second place (De Arauacutejo and Tejedo-Romero 2016 2017 Tavares and da Cruz 2017) Others see it as a measure of dispersion ie the standard deviation of the percentage of votes received by each political party (Caba-Peacuterez Rodriacuteguez Boliacutevar and Loacutepez Hernaacutendez 2008 Esteller-Moreacute and Polo Otero 2012) Caamantildeo-Alegre et al (2013) applied the measure developed by Laakso and Taa-gepera (1979) ndash an effective number of political parties whose calculation also contains each partys proportion of all votes Several studies focused explicitly on competition in the municipal council Laswad Fisher and Oyelere (2005) and Serrano-Cinca Rueda-Tomaacutes and Portillo-Tarragona (2009) measured almost the same thing While the first used the ratio of candidates to council positions availa-ble the latter defined it as the ratio of candidates to councillors elected However despite the different definitions it could be said that their measure is the same since it seldom happens that available council positions are not filled
By using different measures for one variable results may vary within one study let alone comparing different studies contexts or subnational international com-parisons In this sense one should be careful while summing and interpreting results because the measure always speaks more than the variable name
42 maIn determInantsIn order to provide the centrality of each variable in the literature table 2 presents the most frequently used explanatory variables It shows how many studies that
br
an
ko sta
nić
deter
min
an
ts of su
bn
ation
al b
ud
getfisc
al tr
an
spar
enc
y a rev
iew o
f empir
ica
l evid
enc
epu
blic sec
tor
eco
no
mic
s42 (4) 449-486 (2018)
460 are included in the review used a particular independent variable The complete classification and measurements of variables can be seen in the appendix
Table 2 Most frequently used explanatory variables
financial Debt 40Governmentrsquos wealth 35Budget (im)balance 35Leverage 20Intergovernmental transfers 15Municipal size 10Political Political competition 55Political ideology 55Voter turnout 45Executive features 35Governance type 20E-government achievements 15citizens and the media Population sizedensity 60Citizensrsquo characteristics (education age gender) 45Citizensrsquo wealth 35Internet access 30Unemployment 25Media use and visibility 25
Source Author
However this overview aims to analyze the most frequently used variables that have shown a significant influence with particular emphasis on those that despite heterogeneity in definition and measurement show a significant effect In this way the review strives to produce a balanced account of core variables that greatly affect the level of subnational fiscalbudget transparency (table 3) To produce this account the rule is that only variables that were used in at least two papers and which show a significant result in more than 50 of cases were included Accord-ingly three basic variable categories are distinguished financial political and citizens and the media The following section reveals these variables and focuses on the explanation of the results obtained based on some underpinnings in previ-ous studies
421 fInancIal VarIablesFinancial leverage and debt levels are the most important financial factors deter-mining subnational budgetfiscal transparency Leverage refers to the use of bor-rowed funds to finance public activities In this sense it can represent the amount of debt of the government showing the close relation of these two terms Accord-ing to Zimmerman (1977) governments want to reduce the cost of debt by increas-
br
an
ko sta
nić
deter
min
an
ts of su
bn
ation
al b
ud
getfisc
al tr
an
spar
enc
y a rev
iew o
f empir
ica
l evid
enc
epu
blic sec
tor
eco
no
mic
s42 (4) 449-486 (2018)
461ing resources available for other activities that are more efficient in increasing governmentrsquos welfare than the payment of high interest rates Accordingly politi-cians are encouraged to publish government information which in turn facilitates monitoring by creditors This can be achieved easily and at low-cost by online proactive reporting which is confirmed in several studies even if they have dif-ferent leverage measurements (Laswad Fisher and Oyelere 2005 Gandiacutea Mar-rahiacute and Huguet 2016 Gesuele Metallo and Longobardi 2017)
Table 3 Main determinants of subnational budgetfiscal transparency
category Variable different measurements
Financial
LeverageRatio of long-term liabilities to total assetsRatio of long-term liabilities to total public equity Total executed expenses per capita
Debt
Percentage of debt in total budgetPublic debt per capitaFunding costs of the current year budget expenditure per capita
Political
Political competition
Divided government gubernatorial competition legislative competition1 if city council is governed by one of the majority political parties in the countryMeasure of dispersion ie the standard deviation of the percentage of votes received by each political party Effective number of political partiesMargin of victory measured by the difference between the percentage of votes obtained by the parties coming in first and second place
Executive features
Mayorrsquos genderNumber of incumbentrsquos consecutive terms (tenure)
Governance type
1 if district councils 0 regional or city councils1 if provincial capitalsForm of government (1 if council-manager 0 commission and council-elected executive)
Citizens and the media
PopulationNumber of inhabitantsPopulation density
Internet access
Percentage of households with home internet accessFixed internet access connections over 200 kilobits per second in at least one direction per 1000 householdsInternet penetration
Unemployment Unemployment rate
Media
Intensity of use of social media measured by the number of tweetsPress visibilityInternet visibility
Source Author
br
an
ko sta
nić
deter
min
an
ts of su
bn
ation
al b
ud
getfisc
al tr
an
spar
enc
y a rev
iew o
f empir
ica
l evid
enc
epu
blic sec
tor
eco
no
mic
s42 (4) 449-486 (2018)
462 Moreover politicians are incentivized to reduce debt levels because it allows for lower property taxes that will increase their probability of re-election (Gore Sachs and Trzcinka 2004) In this way incumbents are encouraged to use internet reporting and disclose more information as this helps lenders to regularly monitor governments activities (Debreceny Gray and Rahman 2002) In other words the greater the dependence on external funding sources the greater the disclosure (Ingram 1984) Severel studies have confirmed this finding a positive relation-ship between debt levels and budgetfiscal reporting (Styles and Tennyson 2007 Caba-Peacuterez Rodriacuteguez Boliacutevar and Loacutepez Hernaacutendez 2008 Caamantildeo-Alegre et al 2013 De Arauacutejo and Tejedo-Romero 2017) However Alt Lassen and Rose (2006) found a negative association concluding that higher debt reduces fiscal transparency But it should be pointed out that they employed debt variable only as a control variable Finally given the different leverage and debt measures used the significance of these variables in determining fiscalbudgetary transparency is even greater
422 PolItIcal VarIablesPolitical competitionWhen it comes to political determinants there are three variables that contribute to explaining different levels of subnational budgetfiscal transparency ndash political competition different executive features and type of government Stronger polit-ical competition encourages incumbents to bear higher monitoring costs because if they do not keep pre-election promises they are exposed to the long-term costs of re-election failure (Evans and Patton 1987) Esteller-Moreacute and Polo Otero (2012) stressed the importance of political competition in times in which an incumbentrsquos re-election is uncertain With a strong competition agents use fiscal disclosure as their strategic instrument to have a greater chance of being re-elected However when it comes to the degree of fiscal information they wish to provide agents face a trade-off According to Ferejohn (1986) higher levels of fiscal transparency allow politicians to have higher wages since principals are now ready to pay more taxes At the same time greater information disclosure diverts agents from rent extraction Accordingly in the cases of strong competi-tion higher transparency becomes agentsrsquo instrument only if a trade-off is solved in favour of higher salaries In cases of low competition transparency becomes less important for politicians as they in this case have high expectations of staying in power (Piotrowski and Bertelli 2010)
It is argued that parties in power have greater benefits from divulging information in both a low and a high political competition environment In the case of high competition they have the incentive to show their current actions and good man-agement (Caba Peacuterez Rodriacuteguez Boliacutevar and Loacutepez Hernaacutendez 2014) while low competition makes them more confident of their position in power and so willing to reveal more information (Grimmelikhuijsen and Welch 2012) By contrast other competing parties in a high competition environment abstain from the risk of disclosure as this may reduce their ability to control their message (Caba Peacuterez Rodriacuteguez Boliacutevar and Loacutepez Hernaacutendez 2014)
br
an
ko sta
nić
deter
min
an
ts of su
bn
ation
al b
ud
getfisc
al tr
an
spar
enc
y a rev
iew o
f empir
ica
l evid
enc
epu
blic sec
tor
eco
no
mic
s42 (4) 449-486 (2018)
463In this context the empirical results on political competition are mixed While sev-eral authors proved that competition fosters subnational fiscal transparency (Caamantildeo-Alegre et al 2013 Gandiacutea and Archidona 2008 Tavares and da Cruz 2017) others disputed this showing a negative correlation (Alt Lassen and Rose 2006 De Arauacutejo and Tejedo-Romero 2016 Gandiacutea Marrahiacute and Huguet 2016) Generally it is hard to report the true effect of political competition since the con-text data used and different country characteristics may greatly affect this variabil-ity in the results However even with wide range of measurements used political competition proved to be a significant predictor of subnational fiscal transparency
executive featuresDifferent incumbent characteristics and features also affect governmentrsquos decision on divulging or withholding fiscal information The mayorrsquos gender is the first of those features showing a significant influence on subnational transparency levels Many studies have investigated the differences between women and men officials mostly favouring womenrsquos leadership style and its effect on decision-making in the public sector It is argued that female mayors are more likely than their male counterparts to actively engage citizens in the decision-making thus fostering participation communication and different inputs (Fox and Schuhmann 1999) Some studies are concerned with gender and ethics suggesting that women are less likely to behave unethically in the workplace in order to achieve greater finan-cial rewards (Bernardi and Arnold 1997 Krishnan and Parsons 2008) In addi-tion female mayors may be less likely to experience the principal-agent dilemma since they are more ethically minded than men (Khazanchi 1995) Some authors stress that the critical representation of women in governance structures can affect the way of government functioning making it more socially responsive and trans-parent (Rodriacuteguez-Garcia 2015) Several authors have empirically confirmed these underpinnings finding a positive relationship between a female mayor and budget transparency (De Arauacutejo and Tejedo-Romero 2017 Tavares and da Cruz 2017) However Gesuele Metallo and Longobardi (2017) proved the opposite but showing the significance in only one of the three models presented
It is also argued that longer tenure in office reduces pressure on the officials to disclose information Tavares and da Cruz (2017) found that the number of an incumbentrsquos consecutive terms in office is one of the factors most detrimental to transparency This is consistent with the findings by Berliner (2014) who claimed that turnover in executive office fosters the adoption of freedom of information laws which are associated with increased transparency By contrast Ma and Wu (2011) showed a positive correlation stressing that governments need more time to achieve the support needed for the implementation of administrative reforms so as to foster transparency and openness It could also be argued however that much more research is needed as only few studies have employed this variable thus limiting a better insight into the true effects of this variable
br
an
ko sta
nić
deter
min
an
ts of su
bn
ation
al b
ud
getfisc
al tr
an
spar
enc
y a rev
iew o
f empir
ica
l evid
enc
epu
blic sec
tor
eco
no
mic
s42 (4) 449-486 (2018)
464 governance typeThere has been a tendency for researchers to include a dummy variable that addresses the type or form of the government thus pointing to the governance structure This could be an important argument especially in the context of imple-mentation of the new public management (NPM) Namely within this approach citizens are viewed as customers and public servants as public managers while transparency and accountability are perceived as fundamental elements of good governance (Caba Peacuterez Rodriacuteguez Boliacutevar and Loacutepez Hernaacutendez 2008) Las-wad Fisher and Oyelere (2005) were among the first to use the variable ldquoform of local authorityrdquo by distinguishing between district city and regional councils They found that regional and city councils are more transparent than district coun-cils However it is not clear why they have not used a nominal variable rather than a dichotomous to address all three council types separately It should be noted though that the governance type may vary greatly among countries thus depending on the setting of the public administration of a country In some cases the central government has administration delegations across the country which are assigned to the several subnational units In Spain for example these are pro-vincial capitals where the central government holds offices to provide efficiently and effectively some additional services to citizens These political capitals proved to be less transparent than other Spanish cities (del Sol 2013) Since this is a spe-cific country context it would be difficult to find theoretical underpinnings that support this evidence In spite of that the author indicated that the reason for low transparency could be the capitalsrsquo privileged treatment by the central govern-ment Lowatcharin and Menifield (2015) on a sample of US counties found that council-manager governments tend to be more transparent than their mayor-coun-cil counterparts It could be argued however that council-managers are more prone to the adoption of web technologies and e-government solutions rather than mere transparency (Moon 2002) In other words higher transparency in these governments is not a goal by itself but comes as a result of their propensity for web technology implementations
423 cItIZens and the medIaPopulationOne of the variables most often used in explaining SNG fiscal transparency is the number of inhabitants It is widely discussed that larger SNGs have the extra resources and capacities to adopt technical and managerial innovations faster (Smith and Taebel 1985 Norris and Kraemer 1996) This is explained by the greater pressure they face in finding different ways for a better supply of public services In addition they may have a better trained stuff a larger budget and an established IT department which helps them to embrace e-government practices (Moon and Norris 2005) These underpinnings were strongly confirmed by sev-eral authors (del Sol 2013 Guillamoacuten Bastida and Benito 2011 Lowatcharin and Menifield 2015 Serrano-Cinca Rueda-Tomaacutes and Portillo-Tarragona 2009) However a study presented by Esteller-Moreacute and Polo Otero (2012) has revealed new insights into the population variable Given the heterogeneity of the sample
br
an
ko sta
nić
deter
min
an
ts of su
bn
ation
al b
ud
getfisc
al tr
an
spar
enc
y a rev
iew o
f empir
ica
l evid
enc
epu
blic sec
tor
eco
no
mic
s42 (4) 449-486 (2018)
465with a wide range of population size they split the sample into a large and small population They found a negative relationship in the small sample but a positive in the larger sample (for the very big municipalities) pointing to a non-linear relationship between the number of inhabitants and fiscal transparency They stressed that unlike small municipalities very large units have greater capacity to fulfil their legal obligations which could more than compensate for their potential propensity to be less transparent
Internet accessAccording to Debreceny Gray and Rahman (2002) the rise in the use of the inter-net has brought different views to fiscal transparency From the userʼs perspective it is recognized as a facilitator in the demand for fiscal transparency while from the supplierʼs perspective it is perceived as a tool for more effective dissemination of information Internet take-up has affected the behaviour of governments which are now divulging additional information and services online Thus its rise has brought about an improved transparency and financial accountability reducing the costs of dissemination (Pina Torres and Royo 2010) Several studies that investigated online (mainly website) transparency reported that greater and better internet access in the SNGs positively affects their fiscal transparency (Caba-Peacuterez Rodriacuteguez Boliacutevar and Loacutepez Hernaacutendez 2008 Gandiacutea and Archidona 2008 De Arauacutejo and Tejedo-Romero 2017) Garciacutea-Tabuyo Saacuteez-Martiacuten and Caba-Peacuterez (2016) found a positive association with mandatory disclosure but surprisingly the relationship with voluntary reporting proved to be negative Although the argument may be somewhat shallow they explained this by saying that voluntary information disclosure could be larger in municipalities with higher internet penetration and political commitment because by increasing the transpar-ency levels politicians aim to attract the votes of inactive citizens
unemploymentIt has been argued that lower economic development and associated higher unem-ployment rates are damaging to civic engagement ie the demand for greater opportunities to participate in the decision-making is lessened Some studies used unemployment as a proxy for SNG economic status and found that higher eco-nomic status (lower unemployment) positively affects transparency in public administration (Piotrowski and van Ryzin 2007) In accordance with these under-pinnings the results largely indicate that higher unemployment rates are detri-mental to fiscal transparency (Caamantildeo-Alegre et al 2013 De Arauacutejo and Tejedo-Romero 2016 del Sol 2013 Tavares and da Cruz 2017)
mediaVarious authors have stressed the importance of public media visibility in a govern-mentrsquos divulging of information (Zimmerman 1977 Ingram 1984 Laswad Fisher and Oyelere 2005) It is argued that greater visibility and frequency of press report-ing on a governments activities and work contributes to resolving the principal-agent dilemma by reducing information asymmetries between citizens and author-
br
an
ko sta
nić
deter
min
an
ts of su
bn
ation
al b
ud
getfisc
al tr
an
spar
enc
y a rev
iew o
f empir
ica
l evid
enc
epu
blic sec
tor
eco
no
mic
s42 (4) 449-486 (2018)
466 ities However it should be noted that the media citizens and politicians often have different interests In this context public media may be more interested in publish-ing exclusive information such as corruption scandals This in turn affects the governments behavior for it will limit the disclosure of information so as to avoid them being ldquomisusedrdquo in the media (Laswad Fisher and Oyelere 2005 Garciacutea and Garciacutea-Garciacutea 2010 Cuadrado-Ballesteros et al 2017) Nevertheless studies have found that press and public media visibility as well as frequency of social media usage by SNGs have a positive impact on their fiscal transparency (Laswad Fisher and Oyelere 2005 Gandiacutea and Archidona 2008 Gandiacutea Marrahiacute and Huguet 2016 Gesuele Metallo and Longobardi 2017)
5 dIscussIon and conclusIonThis paper has provided a review of empirical studies on the determinants of sub-national governmentrsquos budgetfiscal transparency in the period 2000-2017 Sev-eral important observations should be emphasized First in order to determine the factors involved it is necessary to have a clear definition of budgetfiscal transpar-ency However there is no consensus about this Moreover different definitions are interwoven leading to budgetary and fiscal transparency being used inter-changeably The lack of a clear definition conduces to an inadequate measurement of budget transparency which can significantly affect the credibility of the results of such research Thus instead of having effective transparency this lack of clar-ity leads to opaque fuzzy or zombie transparency (Fox 2007 Michener 2015) where there is a lack of disaggregation or better descriptive details Without parameters as Michener (2015) stressed the quality and comparability of trans-parency is compromised Secondly different approaches to measuring budget transparency especially within the same country reduce the effective comparison potential and lead to ambiguity Thirdly heterogeneity of the definition and meas-urement of explanatory variables can lead to apparent contradiction and inconsist-ency of the obtained results
In this paper three basic categories that determine subnational government budgetfiscal transparency are established (1) financial (leverage and debt) (2) political (political competition executive features and governance type) and (3) citizens and the media (population internet access unemployment and the media) This conclusion is based on the review of 20 selected papers following the above-mentioned methodology Looking at the wider literature some of the findings can be related to findings at the national level where the main factors of fiscal trans-parency are political namely political (electoral) competition and the level of governmental democracy (Hollyer Rosendorff and Vreeland 2011 Wehner and de Renzio 2013) Although citizens and the media and financial factors deter-mine SNG fiscal transparency at the national level its effect seems negligible This may be due to the reduced participation opportunities and pressures of citi-zens on the national government or different structures and sources of funding of national and SNGs Moreover Wehner and de Renzio (2013) have concluded that external initiatives might not play a great role in strenghtening fiscal accountabil-
br
an
ko sta
nić
deter
min
an
ts of su
bn
ation
al b
ud
getfisc
al tr
an
spar
enc
y a rev
iew o
f empir
ica
l evid
enc
epu
blic sec
tor
eco
no
mic
s42 (4) 449-486 (2018)
467ity at the national level when the internal demand (citizens media) is weak How-ever when it comes to a wider literature on other types of public sector transpar-ency all findings are highly correlated (Bakar and Saleh 2015) including all three established categories
A vast majority of studies tend to focus on local governments thus neglecting other types of public sector organizations such as federal and state governments or quasi-government bodies Very few studies involved different countries in an investigation of subnational international comparisons In this sense the chal-lenge would be to create a harmonized budget transparency measure that could be applied to subnational governments of different countries Further such research could offer a more comprehensive insight into the factors implicated in budgetfiscal transparency including different country characteristics and contexts Fur-thermore greater consistency in selecting proxy measures for certain variables could contribute to a clearer interpretation of results while the greater time span of budget transparency data would allow for richer methodology solutions and observations
Like any other studies this study has a few limitations It does not take into account research before 2000 as the focus is rather on online disclosure Future studies may extend observation time Furthermore no meta-analytic studies were included However this paper can serve as the basis and motivation for imple-menting systematic reviews and meta-analyses on this topic In spite of these limitations it is believed that the study may provide rich insights for both inter-ested researchers and practitioners
disclosure statementThe author does not have any conflict of interest
br
an
ko sta
nić
deter
min
an
ts of su
bn
ation
al b
ud
getfisc
al tr
an
spar
enc
y a rev
iew o
f empir
ica
l evid
enc
epu
blic sec
tor
eco
no
mic
s42 (4) 449-486 (2018)
468
aPP
en
dIX
Ta
bl
e a
1 Bu
dget
fisc
al tr
ansp
aren
cy m
easu
rem
ents
aut
hor(
s)sa
mpl
ed
epen
dent
var
iabl
ety
pe o
f di
sclo
sure
met
hod
for
estim
atin
g de
term
inan
ts
mai
n re
sults
(d
eter
min
ants
)m
easu
rem
ent
tim
e
peri
odu
nite
d st
ates
Alt
et a
l (2
006)
50 S
tate
s
Bas
ed o
n A
lt L
asse
n an
d Sk
illin
g (2
002)
The
y m
easu
red
stat
e go
vern
men
t bud
get p
roce
dure
s by
send
ing
ques
tionn
aire
s to
the
budg
et o
ffice
rs o
f all
50 st
ates
on
nine
dic
hoto
mou
s ite
ms r
egar
ding
bu
dget
pro
cedu
re is
sues
bas
ed o
n th
e da
ta fr
om th
e N
atio
nal A
ssoc
iatio
n of
Sta
te B
udge
t Offi
cers
and
th
e N
atio
nal C
onfe
renc
e of
Sta
te L
egis
latu
res
1972
-99
Surv
ey
resp
onse
s
Pane
l dat
a re
gres
sion
an
alys
is
Polit
ical
com
petit
ion
Po
litic
al p
olar
izat
ion
Pa
rtisa
n co
mpo
sitio
n
of g
over
nmen
t D
ebt
Bud
get i
mba
lanc
e
Styl
es a
nd
Tenn
yson
(2
007)
300
mun
icip
aliti
es
They
use
d on
ly o
ne in
dica
tor ndash
a c
ompr
ehen
sive
an
nual
fina
ncia
l rep
ort (
CA
FR)
In a
dditi
on t
hey
deve
lope
d an
acc
essi
bilit
y in
dex
to m
easu
re th
e ea
se o
f CA
FR a
cces
s ie
how
man
y st
eps a
re
requ
ired
to lo
cate
the
repo
rt
na
Onl
ine
man
dato
ry
Logi
t Reg
ress
ion
Ana
lysi
s for
pro
-vi
sion
mod
el a
nd
OLS
Reg
ress
ion
Ana
lysi
s for
ac
cess
ibili
ty
mod
el
Popu
latio
n si
ze I
ncom
e pe
r cap
ita A
ccou
ntin
g di
sclo
sure
Ber
nick
et
al (
2014
)40
0 co
untie
s
Like
Sty
les a
nd T
enny
son
(200
7) t
hey
look
ed
at a
com
preh
ensi
ve a
nnua
l fina
ncia
l rep
ort (
CA
FR)
and
avai
labi
lity
and
com
preh
ensi
vene
ss o
f bud
get
info
rmat
ion
(no
exac
t doc
umen
t or i
nfor
mat
ion
is
indi
cate
d)
2014
Onl
ine
man
dato
ryO
rder
ed lo
git
anal
ysis
Cou
ntie
s with
app
oint
ed
coun
ty m
anag
er s
ize
of
coun
ty b
oard
cou
ntie
s re
quire
d to
subm
it an
au
dit t
o th
e fe
dera
l gov
-er
nmen
t Ec
onom
ic
stre
ss P
opul
atio
n ag
e
Dem
ocra
tic a
nd m
inor
-ity
resi
dent
s H
eter
o-ge
neity
of t
he c
ount
y
br
an
ko sta
nić
deter
min
an
ts of su
bn
ation
al b
ud
getfisc
al tr
an
spar
enc
y a rev
iew o
f empir
ica
l evid
enc
epu
blic sec
tor
eco
no
mic
s42 (4) 449-486 (2018)
469a
utho
r(s)
sam
ple
dep
ende
nt v
aria
ble
type
of
disc
losu
rem
etho
d fo
r es
timat
ing
dete
rmin
ants
mai
n re
sults
(d
eter
min
ants
)m
easu
rem
ent
tim
e
peri
od
Low
atch
arin
an
d M
eni-
field
(201
5)
816
coun
ties i
n tw
elw
e U
S M
idw
este
rn st
ates
Cat
egor
ical
dat
a ta
king
the
num
bers
from
0 to
4
with
rega
rd to
the
rele
ase
of th
e fo
llow
ing
10 it
ems
bu
dget
mee
tings
ele
cted
offi
cial
s ad
min
istra
tive
offic
ials
per
mits
and
zon
ing
aud
its c
ontra
cts
lobb
ying
pub
lic re
cord
s an
d lo
cal t
axes
2010
Onl
ine
proa
ctiv
e
Ord
ered
Log
istic
R
egre
ssio
n A
naly
sis
Gov
erna
nce
type
Po
pula
tion
dens
ity
Citi
zens
edu
catio
n
Tota
l lan
d ar
ea
Min
ority
pop
ulat
ion
(mos
t ext
ensi
ve m
odel
re
sults
)sp
ain
Gan
diacutea
and
Arc
hido
na
(200
8)
130
mun
icip
aliti
es
with
mor
e th
an 5
000
0 in
habi
tant
s
Web
dis
clos
ure
inde
x c
onsi
stin
g of
88
item
s gr
oupe
d in
to fi
ve se
ctio
ns g
ener
al in
form
atio
n
budg
et in
form
atio
n fi
nanc
ial i
nfor
mat
ion
na
viga
tion
and
pres
enta
tion
rela
tiona
l web
2006
Onl
ine
volu
ntar
y
Mul
tivar
iate
R
egre
ssio
n A
naly
sis
Polit
ical
com
petit
ion
Pu
blic
med
ia v
isib
ility
In
tern
et a
cces
s
Citi
zens
edu
catio
n
Serr
ano-
Cin
ca e
t al
(200
9)
92 lo
cal g
over
nmen
ts
incl
udin
g al
l pr
ovin
cial
cap
itals
and
al
l tow
n ha
lls w
ith
over
70
000
inha
bita
nts
Dep
ende
nt v
aria
ble
base
d on
web
ava
ilabi
lity
of
nine
doc
umen
ts i
ndiv
idua
l bud
get o
f the
cou
ncil
co
nsol
idat
ed b
udge
t of t
he c
ounc
il b
udge
t of
depe
nden
t ent
ities
bud
get d
isag
greg
ated
by
eco-
nom
ic f
unct
iona
l or o
rgan
ic c
lass
ifica
tion
bud
get
info
rmat
ion
rega
rdin
g in
vest
men
t bo
rrow
ing
or
reve
nue
and
expe
nditu
re i
ndiv
idua
l ann
ual
acco
unts
con
solid
ated
ann
ual a
ccou
nts
annu
al
acco
unts
of d
epen
dent
ent
ities
and
aud
it re
port
2006
Onl
ine
volu
ntar
y
Mul
tivar
iate
Lo
gist
ic
Reg
ress
ion
Popu
latio
n si
ze B
udge
t re
venu
es P
oliti
cal w
ill
(mea
sure
d by
cou
ncils
rsquo ex
perie
nce
with
e-
dem
ocra
cy)
Dis
posa
ble
fam
ily
inco
me
per i
nhab
itant
Cab
a-Peacute
rez
et a
l (2
008)
65 S
pani
sh c
ity
coun
cils
inc
ludi
ng
larg
e ci
ties
prov
inci
al
capi
tals
aut
onom
ous
regi
on c
apita
ls a
nd
mun
icip
aliti
es w
ith
cent
ral o
ffice
s of t
he
auto
nom
ous r
egio
nsrsquo
inst
itutio
ns
Dis
clos
ure
inde
x di
vide
d in
to th
ree
sect
ions
(1
) con
tent
of i
nfor
mat
ion
supp
lied
incl
udin
g bu
dget
and
fina
ncia
l inf
orm
atio
n (2
) cha
ract
eris
tics
of th
e in
form
atio
n di
sclo
sed
ie
com
plet
enes
s tim
elin
ess
com
para
bilit
y u
nder
stan
dabi
lity
re
leva
nce
and
relia
bilit
y a
nd (3
) nav
igab
ility
de
sign
and
acc
essi
bilit
y of
pub
lic fi
nanc
ial
info
rmat
ion
on th
e w
eb si
te
2007
Onl
ine
volu
ntar
y
Mul
tivar
iabl
e Li
near
R
egre
ssio
n
Cos
t of d
ebt
Inte
rnet
ac
cess
br
an
ko sta
nić
deter
min
an
ts of su
bn
ation
al b
ud
getfisc
al tr
an
spar
enc
y a rev
iew o
f empir
ica
l evid
enc
epu
blic sec
tor
eco
no
mic
s42 (4) 449-486 (2018)
470
aut
hor(
s)sa
mpl
ed
epen
dent
var
iabl
ety
pe o
f di
sclo
sure
met
hod
for
estim
atin
g de
term
inan
ts
mai
n re
sults
(d
eter
min
ants
)m
easu
rem
ent
tim
e
peri
od
Gui
llam
oacuten
et a
l (2
011)
100
larg
est S
pani
sh
mun
icip
aliti
es
The
finan
cial
tran
spar
ency
inde
x ba
sed
on th
e da
ta
of T
rans
pare
ncy
Inte
rnat
iona
l (TI
) Spa
in 2
008
and
partl
y fr
om th
e qu
estio
nnai
re c
reat
ed b
y th
e au
thor
s Th
ey o
bser
ved
thre
e di
men
sion
s
acco
untin
g an
d bu
dget
mun
icip
al re
venu
es a
nd
expe
nditu
res
and
mun
icip
al d
ebt
2008
Proa
ctiv
e
prin
t and
on
line
OLS
and
2SL
S re
gres
sion
s
Mun
icip
al w
ealth
In
terg
over
nmen
tal
trans
fers
Pol
itica
l id
eolo
gy P
opul
atio
n si
ze
del S
ol
(201
3)
110
loca
l gov
ernm
ents
th
at p
artic
ipat
ed in
20
10 T
I Spa
in su
rvey
TI S
pain
dis
clos
ure
inde
x in
clud
ing
five
trans
pare
ncy
area
s fi
scal
(acc
ount
ing
and
budg
et
info
rmat
ion
info
rmat
ion
on re
venu
es a
nd
expe
nditu
res
info
rmat
ion
on d
ebt)
cor
pora
te
soci
al p
rocu
rem
ent a
nd c
ontra
ctin
g
2010
Onl
ine
volu
ntar
y
OLS
and
ce
nsor
ed
regr
essi
on
mod
els
Popu
latio
n si
ze
Polit
ical
ideo
logy
G
over
nanc
e ty
pe
(pro
vinc
ial c
apita
l)
Tour
ist a
ctiv
ity
Polit
ical
ideo
logy
De A
rauacutej
o an
d Te
jedo
-R
omer
o (2
016)
109
mun
icip
aliti
es
TI S
pain
dis
clos
ure
inde
x in
clud
ing
80 in
dica
tors
gr
oupe
d in
to si
x tra
nspa
renc
y ar
eas
Five
are
as
used
alre
ady
by A
lbal
ate
(201
3) a
nd a
dditi
onal
ca
tego
ry o
n ur
ban
deve
lopm
entp
ublic
wor
ks
trans
pare
ncy
2012
Onl
ine
volu
ntar
y
OLS
and
IV
2SL
S re
gres
sion
an
alys
is
Vote
r tur
nout
Pol
itica
l id
eolo
gy P
oliti
cal
com
petit
ion
Este
ller-
Mor
eacute an
d Po
lo O
tero
(2
012)
691
Cat
alan
m
unic
ipal
ities
A d
icho
tom
ous v
aria
ble
mea
surin
g bu
dget
fisc
al
trans
pare
ncy
by lo
okin
g at
the
nine
bud
get
info
rmat
ion
bud
get a
ppro
val
final
bud
get
budg
et
bala
nce
clo
sed
settl
emen
t bud
gets
tre
asur
y st
atem
ent
treas
ury
surp
lus
net w
ealth
stat
emen
t in
com
e st
atem
ent a
nd in
debt
edne
ss T
hese
in
form
atio
ns a
re p
art o
f ann
ual a
ccou
nts t
hat
Cat
alan
loca
l gov
ernm
ents
hav
e to
del
iver
to th
e Pu
blic
Aud
it O
ffice
for C
atal
onia
2001
-200
7M
anda
tory
Logi
t reg
ress
ion
anal
ysis
Polit
ical
com
petit
ion
Po
pula
tion
size
(m
easu
ring
the
degr
ee
of d
ecen
traliz
atio
n)
br
an
ko sta
nić
deter
min
an
ts of su
bn
ation
al b
ud
getfisc
al tr
an
spar
enc
y a rev
iew o
f empir
ica
l evid
enc
epu
blic sec
tor
eco
no
mic
s42 (4) 449-486 (2018)
471a
utho
r(s)
sam
ple
dep
ende
nt v
aria
ble
type
of
disc
losu
rem
etho
d fo
r es
timat
ing
dete
rmin
ants
mai
n re
sults
(d
eter
min
ants
)m
easu
rem
ent
tim
e
peri
od
Caa
mantilde
o-A
legr
e et
al
(201
3)
33 G
alic
ian
mun
icip
aliti
es
Bud
get t
rans
pare
ncy
inde
x co
ntai
ning
info
rmat
ion
on th
e op
en b
udge
t pro
cess
pub
lic a
vaila
bilit
y of
in
form
atio
n an
d as
sura
nce
of in
tegr
ity
Que
stio
nnai
res a
re se
nt to
gov
ernm
ent o
ffici
als b
y us
ing
a Li
kert-
type
surv
ey q
uest
ionn
aire
bas
ed o
n th
e IM
Frsquos r
evis
ed C
ode
of G
ood
Prac
tices
on
Fisc
al
Tran
spar
ency
na
Proa
ctiv
eO
LS re
gres
sion
an
alyi
s
Deb
t per
cap
ita B
udge
t (im
)bal
ance
Rat
io o
f m
unic
ipal
pub
lic
expe
nditu
re to
GD
P
Polit
ical
com
petit
ion
Po
litic
al id
eolo
gy
Coa
litio
n in
cum
bent
Vo
ter t
urno
ut
Une
mpl
oym
ent r
ate
Gan
diacutea
et
al (
2016
)
145
Span
ish
loca
l go
vern
men
ts w
ith
mor
e th
an 5
000
0 in
habi
tant
s
Web
20
dis
clos
ure
inde
x c
onsi
sted
of
(1) a
n or
nam
enta
l dis
clos
ure
inde
x w
hich
con
tain
s ge
nera
l and
citi
zen
info
rmat
ion
(2) i
nfor
mat
ion
disc
losu
re in
dex
incl
udin
g th
e in
form
atio
n on
pu
blic
pro
cure
men
t ad
min
istra
tive
agre
emen
ts
gove
rnm
ent s
ubsi
dies
and
aid
sta
ff a
nd b
udge
t an
d fin
anci
al in
form
atio
n (3
) rel
atio
nal d
iscl
osur
e in
dex
whi
ch re
pres
ents
the
pres
enta
tion
na
viga
bilit
y an
d in
tera
ctio
n ab
ilitie
s of t
he w
eb
na
Onl
ine
volu
ntar
y
Mul
tivar
iate
re
gres
sion
an
alys
is
Leve
rage
Mun
icip
al
wea
lth P
oliti
cal
com
petit
ion
Pol
itica
l id
eolo
gy C
itize
ns
educ
atio
n S
ocia
l med
ia
use
Pre
ss v
isib
ility
In
tern
et v
isib
ility
De A
rauj
o an
d Te
jedo
-R
omer
o (2
017)
100
larg
est S
pani
sh
mun
icip
aliti
esTI
Spa
in d
iscl
osur
e in
dex
2008
-201
0
2012
201
4O
nlin
e vo
lunt
ary
Bal
ance
d pa
nel
data
regr
essi
on
anal
ysis
May
ors
gend
er
Wom
anrsquos
repr
esen
tatio
n in
mun
icip
al c
ounc
il
br
an
ko sta
nić
deter
min
an
ts of su
bn
ation
al b
ud
getfisc
al tr
an
spar
enc
y a rev
iew o
f empir
ica
l evid
enc
epu
blic sec
tor
eco
no
mic
s42 (4) 449-486 (2018)
472
aut
hor(
s)sa
mpl
ed
epen
dent
var
iabl
ety
pe o
f di
sclo
sure
met
hod
for
estim
atin
g de
term
inan
ts
mai
n re
sults
(d
eter
min
ants
)m
easu
rem
ent
tim
e
peri
odo
ther
cou
ntri
es
Lasw
ad e
t al
(20
05)
86 lo
cal g
over
nmen
ts
in N
ew Z
eala
nd
A d
icho
tom
ous v
aria
ble
indi
catin
g w
heth
er o
r not
th
e lo
cal a
utho
rity
publ
ishe
s fina
ncia
l inf
orm
atio
n on
the
web
It i
s con
side
red
that
loca
l aut
horit
y de
liver
s inf
orm
atio
n if
at le
ast o
ne o
f fou
r do
cum
ents
that
repr
esen
t vol
unta
ry in
tern
et
finan
cial
repo
rting
was
pub
lishe
d F
our d
ocum
ents
ar
e fi
nanc
ial h
ighl
ight
s an
nual
repo
rts a
nnua
l pl
an a
nd c
ombi
natio
ns o
f ann
ual r
epor
ts p
lans
an
d fin
anci
al h
ighl
ight
s
na
Onl
ine
volu
ntar
yM
ultiv
aria
te
logi
t reg
ress
ion
Leve
rage
Mun
icip
al
wea
lth P
ress
vis
ibili
ty
Type
of c
ounc
il
Gar
ciacutea-
Tabu
yo e
t al
(20
16)
40 la
rges
t m
unic
ipal
ities
in e
ach
of th
e fiv
e C
entra
l A
mer
ica
coun
tries
ndash
El S
alva
dor
Nic
arag
ua P
anam
a
Gua
tem
ala
and
Hon
dura
s
Inde
x of
man
dato
ry a
nd in
dex
of v
olun
tary
di
sclo
sure
bas
ed o
n 94
item
s gro
uped
into
four
tra
nspa
renc
y ca
tego
ries
mun
icip
al g
over
nmen
t re
latio
ns w
ith c
itize
ns a
nd so
ciet
y e
cono
mic
-fin
anci
al tr
ansp
aren
cy a
nd se
rvic
e-pr
ocur
emen
t tra
nspa
renc
y T
he ra
tio o
f vol
unta
ry a
nd le
gal
item
s diff
ers d
epen
ding
on
the
obse
rved
cou
ntry
Salv
ador
(2
010)
G
uate
mal
a (2
008)
H
ondu
ras
(200
6)
Nic
arag
ua
(200
7)
Pana
ma
(200
2)
Onl
ine
proa
ctiv
eTo
bit R
egre
ssio
n A
naly
sis
The
mat
urity
of t
he F
OI
law
(man
dato
ry
disc
losu
re)
Inte
rnet
ac
cess
Vot
er tu
rnou
t (v
olun
tary
dis
clos
ure)
Zucc
olot
to
and
Teix
eira
(2
014)
26 B
razi
lian
stat
es
Stat
e tra
nspa
renc
y in
dex
deve
lope
d by
Bid
erm
an
and
Potto
mat
ti (2
010)
con
sist
ing
of th
ree
para
met
ers
con
tent
tim
e se
ries a
nd u
pdat
e fr
eque
ncy
and
usa
bilit
y
2010
Onl
ine
proa
ctiv
e
Mul
tiple
line
ar
regr
essi
on
anal
ysis
Soci
oeco
nom
ic fa
ctor
s
educ
atio
n e
mpl
oym
ent
and
inco
me
and
hea
lth
indi
cato
rs F
isca
l fa
ctor
s
br
an
ko sta
nić
deter
min
an
ts of su
bn
ation
al b
ud
getfisc
al tr
an
spar
enc
y a rev
iew o
f empir
ica
l evid
enc
epu
blic sec
tor
eco
no
mic
s42 (4) 449-486 (2018)
473a
utho
r(s)
sam
ple
dep
ende
nt v
aria
ble
type
of
disc
losu
rem
etho
d fo
r es
timat
ing
dete
rmin
ants
mai
n re
sults
(d
eter
min
ants
)m
easu
rem
ent
tim
e
peri
od
Ma
and
Wu
(201
1)31
Chi
nese
pro
vinc
es
Dis
clos
ure
inde
x ba
sed
on re
spos
iven
ess a
nd
info
rmat
ion
com
plet
enes
s as t
wo
basi
c di
men
sion
s It
is m
easu
red
by g
over
nmen
ts r
espo
nses
to 1
13
open
fisc
al in
form
atio
n re
ques
ts o
f citi
zens
in
clud
ing
66 it
ems f
or g
over
nmen
t acc
ount
s 30
ite
ms f
or so
cial
secu
rity
acco
unts
and
17
item
s for
st
ate
owne
d en
terp
rises
acc
ount
s
2008
-200
9R
eact
ive
Seem
ingl
y U
nrel
ated
R
egre
ssio
ns
(SU
R) m
odel
w
ith ra
ndom
ef
fect
s
Econ
omic
ope
nnes
s
Mar
ketiz
atio
n B
udge
t (im
)bal
ance
In
cum
bent
s te
nure
Ges
uele
et
al (
2017
)
287
mun
icip
aliti
es
142
Italia
n an
d 14
5 Sp
anis
h m
unic
ipal
ities
Two
inde
xes
(a) e
-dis
clos
ure
web
site
inde
x w
hich
m
easu
res i
nter
actio
n le
vel a
mon
g ci
tizen
s and
m
unic
ipal
ities
usi
ng o
ffici
al o
r man
dato
ry
disc
losu
re c
hann
el b
y lo
okin
g fo
r the
13
item
s in
clud
ing
the
publ
icat
ion
of fi
nanc
ial s
tate
men
ts
from
the
mun
icip
ality
and
from
the
cont
rolle
d co
mpa
ny a
nd m
unic
ipal
ities
ass
ets a
nd re
venu
es
(b) s
ocia
l med
ia u
sage
inde
x w
hich
mea
sure
s the
vo
lunt
ary
disc
losu
re v
ia so
cial
med
ia su
ch a
s Fa
cebo
ok a
nd T
witt
er
2013
Onl
ine
proa
ctiv
e
Tobi
t reg
ress
ion
(ste
pwis
e ap
proa
ch)
Leve
rage
Int
erne
t vi
sibi
lity
Citi
zens
w
ealth
(mea
sure
d by
ec
onom
ic a
ctiv
ity p
er
capi
ta)
Tava
res a
nd
da C
ruz
(201
7)
278
Portu
gues
e m
unic
ipal
ities
TI P
ortu
gal d
iscl
osur
e in
dex
con
sist
ing
of 7
6 in
dica
tors
gro
uped
into
the
seve
n di
men
sion
s
(1) O
rgan
izat
iona
l inf
orm
atio
n so
cial
com
posi
tion
and
oper
atio
n of
the
mun
icip
ality
(2)
Pla
ns a
nd
plan
ning
(3)
Loc
al ta
xes
rate
s se
rvic
e ch
arge
s an
d re
gula
tions
(4)
Rel
atio
nshi
p w
ith c
itize
ns
(5) P
ublic
pro
cure
men
t (6
) Eco
nom
ic a
nd fi
nanc
ial
trans
pare
ncy
and
(7) U
rban
pla
nnin
g an
d la
nd
use
man
agem
ent
2013
Onl
ine
proa
ctiv
eO
LS re
gres
sion
s
Fina
ncia
l aut
onom
y
May
ors
gend
er T
enur
e
Polit
ical
com
petit
ion
U
nem
ploy
men
t rat
e
Popu
latio
n ag
e
Sour
ce A
utho
r
br
an
ko sta
nić
deter
min
an
ts of su
bn
ation
al b
ud
getfisc
al tr
an
spar
enc
y a rev
iew o
f empir
ica
l evid
enc
epu
blic sec
tor
eco
no
mic
s42 (4) 449-486 (2018)
474
Ta
bl
e a
2Fi
nanc
ial v
aria
bles
Vari
able
na
me
Vari
able
m
easu
rem
ent
cor
rela
tion
of d
eter
min
ants
Posi
tive
neg
ativ
eN
on-s
igni
fican
tM
unic
ipal
si
zeAv
erag
e to
tal a
sset
s a
vera
ge to
tal r
even
ues
ndashndash
Lasw
ad e
t al
200
5B
udge
t rev
enue
sSe
rran
o-C
inca
et a
l 2
009
ndashndash
Leve
rage
Rat
io o
f lon
g-te
rm li
abili
ties t
o to
tal a
sset
s ra
tio
of lo
ng-te
rm li
abili
ties t
o to
tal p
ublic
equ
ityLa
swad
et a
l 2
005
ndashndash
Tota
l exe
cute
d ex
pens
es p
er c
apita
Gan
diacutea
et a
l 2
016
ndashG
andiacute
a an
d A
rchi
dona
200
8
The
leve
l of l
ever
age
(not
spec
ified
)G
esue
le e
t al
201
7ndash
ndash
Gov
ern-
men
trsquos
wea
lth
Mun
icip
ality
rsquos o
wn
reve
nue
per c
apita
Gan
diacutea
et a
l 2
016
La
swad
et a
l 2
005
ndashG
andiacute
a an
d A
rchi
dona
200
8
Bud
get r
even
ue p
er c
apita
ndashndash
Ma
and
Wu
201
1Ta
x re
venu
es p
er c
apita
Gui
llam
oacuten e
t al
201
1ndash
Caa
mantilde
o-A
legr
e et
al
201
3
GD
P pe
r cap
itandash
ndashM
a an
d W
u 2
011
(pos
itive
for c
ompl
eten
ess
but i
nsig
nific
ant f
or p
rovi
sion
of i
nfor
mat
ion)
Dic
hoto
mou
s var
iabl
e (1
if th
e ci
ty h
all h
as
mun
icip
al b
onds
in c
ircul
atio
n)ndash
ndashSe
rran
o-C
inca
et a
l 2
009
Deb
t
Perc
enta
ge o
f deb
t in
tota
l bud
get
ndashndash
del S
ol 2
013
Publ
ic d
ebt p
er c
apita
Caa
mantilde
o-A
legr
e et
al
201
3
De A
rauacutej
o an
d Te
jedo
-R
omer
o 2
017
Sty
les a
nd
Tenn
yson
200
7
Alt
et a
l
2006
De A
rauacutej
o an
d Te
jedo
-Rom
ero
201
6
Gui
llam
oacuten e
t al
201
1
Fund
ing
cost
s of t
he c
urre
nt y
ear b
udge
t exp
endi
ture
pe
r cap
itaC
aba-
Peacutere
z et
al
200
8ndash
ndash
Inte
rgov
ern-
men
tal
trans
fers
Rat
io o
f tot
al tr
ansf
ers t
o th
e to
tal a
mou
nt o
f non
-fin
anci
al re
venu
es T
hey
have
als
o ob
serv
ed c
urre
nt
and
capi
tal t
rans
fers
sepa
rate
lyndash
ndashEs
telle
r-Mor
eacute an
d Po
lo O
tero
201
2
Reg
iona
l and
cen
tral t
rans
fers
per
cap
itaG
uilla
moacuten
et a
l 2
011
ndashndash
Tota
l cur
rent
and
cap
ital t
rans
fers
ndash
ndashC
aba-
Peacutere
z et
al
200
8
br
an
ko sta
nić
deter
min
an
ts of su
bn
ation
al b
ud
getfisc
al tr
an
spar
enc
y a rev
iew o
f empir
ica
l evid
enc
epu
blic sec
tor
eco
no
mic
s42 (4) 449-486 (2018)
475Va
riab
le
nam
eVa
riab
le
mea
sure
men
tc
orre
latio
n of
det
erm
inan
tsPo
sitiv
en
egat
ive
Non
-sig
nific
ant
Bud
get
im(b
alan
ce)
Fisc
al im
bala
nce
ie
hig
her s
urpl
uses
and
defi
cits
Alt
et a
l 2
006
ndashndash
Bud
get b
alan
ce p
er c
apita
(low
erin
g de
ficit)
Caa
mantilde
o-A
legr
e et
al
201
3ndash
ndashB
udge
t defi
cit
natu
ral l
ogar
ithm
Ma
and
Wu
201
1ndash
ndash
Defi
cit p
er c
apita
ndashndash
Este
ller-M
oreacute
and
Polo
Ote
ro 2
012
G
uilla
moacuten
et a
l 2
011
Defi
cit o
r sur
plus
as a
per
cent
age
of to
tal b
udge
tndash
ndashde
l Sol
201
3
Oth
er
finan
cial
va
riabl
es
Inve
stm
ent p
c ta
x bu
rden
pc
ratio
of t
he ta
x re
venu
es
to o
pera
ting
reve
nues
rat
io o
f fina
ncia
l to
tota
l ex
pens
es r
atio
of o
pera
ting
to to
tal e
xpen
ses
ndashndash
Serr
ano-
Cin
ca e
t al
200
9
Cap
ital i
nves
tmen
t per
cap
itaD
e Ara
uacutejo
and
Teje
do-
Rom
ero
201
6ndash
ndash
Fisc
al p
ress
ure
mea
sure
d by
per
cap
ita ta
x an
d no
n-ta
x re
venu
e a
nd th
e sa
le o
f goo
ds a
nd se
rvic
es o
f the
pu
blic
adm
inis
tratio
nsndash
ndashC
aba-
Peacutere
z et
al
200
8
Fisc
al p
ress
ure
mea
sure
d by
tota
l dire
ct a
nd in
dire
ct
taxe
s per
cap
itaD
e Ara
uacutejo
and
Teje
do-
Rom
ero
201
7ndash
ndash
Inde
x of
fina
ncia
l aut
onom
y (d
eriv
ed fr
om ta
xes
and
fees
)
Ges
uele
et a
l 2
017
(sig
nific
ant i
n on
e of
thre
e m
odel
s)ndash
ndash
Fina
ncia
l pos
ition
mea
sure
d by
the
ratio
of p
rimar
y go
vern
men
trsquos u
nres
trict
ed n
et a
sset
s to
tota
l exp
ense
sSt
yles
and
Ten
nyso
n 2
007
ndashndash
Fina
ncia
l aut
onom
y (p
ropo
rtion
of l
ocal
taxe
s fe
es a
nd
othe
r cha
rges
)Ta
vare
s and
da
Cru
z 2
017
ndashndash
Rat
io o
f mun
icip
al p
ublic
exp
endi
ture
to G
DP
Caa
mantilde
o-A
legr
e et
al
201
3 ndash
ndashM
unic
ipal
ities
with
a c
ertifi
cate
of a
chie
vem
ent f
or
exce
llenc
e in
acc
ount
ing
repo
rting
Styl
es a
nd T
enny
son
200
7ndash
ndash
Sour
ce A
utho
r
br
an
ko sta
nić
deter
min
an
ts of su
bn
ation
al b
ud
getfisc
al tr
an
spar
enc
y a rev
iew o
f empir
ica
l evid
enc
epu
blic sec
tor
eco
no
mic
s42 (4) 449-486 (2018)
476
Ta
bl
e a
3 Po
litic
al v
aria
bles
Vari
able
na
me
Vari
able
m
easu
rem
ent
cor
rela
tion
of d
eter
min
ants
Posi
tive
neg
ativ
eN
on-s
igni
fican
t
Polit
ical
co
mpe
titio
n
(a) D
ivid
ed g
over
nmen
t ndash d
icho
tom
ous v
aria
ble
taki
ng th
e va
lue
1 if
diffe
rent
par
ties c
ontro
l the
ex
ecut
ive
and
legi
slat
ure
0 o
ther
wis
e
(b) G
uber
nato
rial c
ompe
titio
n m
easu
red
by th
e sh
are
of D
emoc
ratic
vot
es in
the
gube
rnat
oria
l ele
ctio
n
capt
urin
g ab
solu
te d
evia
tians
from
one
hal
f (c
) Leg
isla
tive
com
petit
ion
ndash D
emoc
ratic
seat
shar
es
in th
e up
per a
nd lo
wer
hou
ses
ndashA
lt et
al
200
6ndash
Rat
io o
f can
dida
tes t
o co
unci
l pos
ition
s ava
ilabl
endash
ndashLa
swad
et a
l 2
005
Num
ber o
f pol
itica
l par
ties i
n th
e ci
ty c
ounc
ilndash
ndashG
andiacute
a an
d A
rchi
dona
200
8D
icho
tom
ic v
aria
ble
1 if
city
cou
ncil
is g
over
ned
by
one
of t
he m
ajor
ity p
oliti
cal p
artie
s in
the
coun
tryG
andiacute
a an
d A
rchi
dona
200
8G
andiacute
a et
al
201
6ndash
Rat
io o
f can
dida
tes t
o co
unci
llors
ele
cted
ndashndash
Serr
ano-
Cin
ca e
t al
200
9R
atio
of c
ounc
illor
s ele
cted
for t
he p
arty
in p
ower
to
the
tota
l num
ber o
f ele
cted
cou
ncill
ors
ndashndash
Cab
a-Peacute
rez
et a
l 2
008
Mea
sure
of d
ispe
rsio
n i
e th
e st
anda
rd d
evia
tion
of
the
perc
enta
ge o
f vot
es re
ceiv
ed b
y ea
ch p
oliti
cal
party
(the
gre
ater
the
disp
ersi
on o
f vot
es a
mon
g po
litic
al p
artie
s th
e sm
alle
r the
ele
ctor
al c
ompe
titio
n)
Este
ller-M
oreacute
and
Polo
O
tero
201
2 (n
on-s
igni
fican
t fo
r big
mun
icip
aliti
es)
ndashC
aba-
Peacutere
z et
al
200
8
Effe
ctiv
e nu
mbe
r of p
oliti
cal p
artie
s ac
cord
ing
to
Laak
so a
nd T
aaga
pera
rsquos (1
979)
cal
cula
tion
Caa
mantilde
o-A
legr
e et
al
201
3ndash
ndash
Mar
gin
of v
icto
ry m
easu
red
by th
e di
ffere
nce
betw
een
the
perc
enta
ge o
f vot
es o
btai
ned
by th
e pa
rties
com
ing
in fi
rst a
nd se
cond
pla
ce T
he lo
wer
th
e di
ffere
nce
the
high
er th
e el
ecto
ral c
ompe
titio
n
Tava
res a
nd d
a C
ruz
201
7D
e Ara
uacutejo
and
Teje
do-R
omer
o
2016
De A
rauacutej
o an
d Te
jedo
-Rom
ero
20
17
br
an
ko sta
nić
deter
min
an
ts of su
bn
ation
al b
ud
getfisc
al tr
an
spar
enc
y a rev
iew o
f empir
ica
l evid
enc
epu
blic sec
tor
eco
no
mic
s42 (4) 449-486 (2018)
477Va
riab
le
nam
eVa
riab
le
mea
sure
men
tc
orre
latio
n of
det
erm
inan
tsPo
sitiv
en
egat
ive
Non
-sig
nific
ant
Polit
ical
id
eolo
gy
Polit
ical
orie
ntat
ion
of th
e m
unic
ipal
maj
ority
an
dor
may
orndash
ndash
Este
ller-M
oreacute
and
Polo
Ote
ro 2
012
G
arciacute
a-Ta
buyo
et a
l 2
016
Ges
uele
et
al
201
7 S
erra
no-C
inca
et a
l
2009
Tav
ares
and
da
Cru
z 2
017
1 if
left-
win
g m
unic
ipal
maj
ority
Gan
diacutea
et a
l 2
016
G
uilla
moacuten
et a
l 2
011
ndashndash
1 if
left
incu
mbe
ntC
aam
antildeo-
Ale
gre
et a
l
2013
del
Sol
201
3
De A
rauacutej
o an
d Te
jedo
-Rom
ero
20
16 2
017
ndash
Exec
utiv
e
May
orrsquos
gen
der (
1 if
fem
ale)
De A
rauacutej
o an
d Te
jedo
-R
omer
o 2
017
Tav
ares
an
d da
Cru
z 2
017
Ges
uele
et a
l 2
017
(sig
nific
ant i
n on
e of
th
ree
mod
els)
De A
rauacutej
o an
d Te
jedo
-Rom
ero
20
16 G
uilla
moacuten
et a
l 2
011
1 in
the
case
of c
oalit
ion
incu
mbe
nts
ndashC
aam
antildeo-
Ale
gre
et a
l 2
013
ndash
May
orrsquos
age
and
edu
catio
nndash
ndashTa
vare
s and
da
Cru
z 2
017
Num
ber o
f inc
umbe
ntrsquos
con
secu
tive
term
sM
a an
d W
u 2
011
Tava
res a
nd d
a C
ruz
20
17ndash
Gov
erna
nce
type
1 di
stric
t cou
ncils
0 re
gion
al o
r city
cou
ncils
ndashLa
swad
et a
l 2
005
ndash1
prov
inci
al c
apita
ls
ndashde
l Sol
201
3ndash
Form
of g
over
nmen
t (1
coun
cil-m
anag
er 0
co
mm
issi
on a
nd c
ounc
il-el
ecte
d ex
ecut
ive)
Low
atch
arin
and
Men
ifiel
d
2015
ndashndash
1 ci
ty-m
anag
er g
over
nanc
e st
ruct
ure
ndashndash
Styl
es a
nd T
enny
son
200
7
Vote
r tu
rnou
tPe
rcen
tage
of c
itize
n pa
rtici
patio
n in
loca
l ele
ctio
ns
Caa
mantilde
o-A
legr
e et
al
20
13 D
e Ara
uacutejo
and
Te
jedo
-Rom
ero
201
7 (s
impl
ified
mod
el)
Gar
ciacutea-
Tabu
yo e
t al
20
16 (v
olun
tary
di
sclo
sure
) D
e A
rauacutej
o an
d Te
jedo
-R
omer
o 2
016
De
Ara
uacutejo
and
Teje
do-
Rom
ero
201
7 (e
xten
sive
mod
els)
Gar
ciacutea-
Tabu
yo e
t al
201
6 (m
anda
tory
dis
clos
ure)
del
Sol
20
13 G
uilla
moacuten
et a
l 2
011
Se
rran
o-C
inca
et a
l 2
009
Ta
vare
s and
da
Cru
z 2
017
br
an
ko sta
nić
deter
min
an
ts of su
bn
ation
al b
ud
getfisc
al tr
an
spar
enc
y a rev
iew o
f empir
ica
l evid
enc
epu
blic sec
tor
eco
no
mic
s42 (4) 449-486 (2018)
478
Vari
able
na
me
Vari
able
m
easu
rem
ent
cor
rela
tion
of d
eter
min
ants
Posi
tive
neg
ativ
eN
on-s
igni
fican
t
Vote
r tu
rnou
tVo
ter a
bste
ntio
n re
pres
entin
g th
e pe
rcen
tage
of
popu
latio
n w
ho d
id n
ot v
ote
ndashEs
telle
r-Mor
eacute an
d Po
lo O
tero
201
2
(big
mun
icip
aliti
es)
Este
ller-M
oreacute
and
Polo
Ote
ro 2
012
(who
le sa
mpl
e an
d sm
all
mun
icip
aliti
es)
E-go
vern
-m
ent
achi
eve-
men
ts
Num
ber o
f e-d
emoc
racy
act
ions
impl
emen
ted
Serr
ano-
Cin
ca e
t al
200
9ndash
ndashE-
gove
rnm
ent d
evel
opm
ent
mea
sure
d by
the
scor
e in
op
en in
form
atio
n o
nlin
e bu
sine
ss u
ser s
atis
fact
ion
pr
oper
ties a
nd d
esig
n a
nd d
aily
ope
ratio
nndash
ndashndash
Inst
itutio
nal c
apac
ity v
aria
ble
mea
sure
d by
Ope
n G
over
nmen
t Inf
orm
atio
n (O
GI)
ndash
ndashM
a an
d W
u 2
011
(pos
itive
for
fisca
l com
plet
enes
s)M
unic
ipal
IT c
apac
ity m
easu
red
by th
e nu
mbe
r of I
T em
ploy
ees
ndashndash
Tava
res a
nd d
a C
ruz
201
7
Oth
er
polit
ical
va
riabl
es
Cou
ntie
s with
app
oint
ed c
ount
y m
anag
ers
size
of
coun
ty b
oard
cou
ntie
s req
uire
d to
subm
it an
aud
it to
th
e fe
dera
l gov
ernm
ent
Ber
nick
et a
l 2
014
ndashndash
Polit
ical
pol
ariz
atio
n (f
or m
easu
rem
ent s
ee H
anss
en
2004
)A
lt et
al
200
6ndash
ndash
Two-
party
and
mul
ti-pa
rty c
oalit
ion
in th
e ci
ty
coun
cil
ndashndash
Serr
ano-
Cin
ca e
t al
200
9
Wom
anrsquos
repr
esen
tatio
n in
mun
icip
al c
ounc
il
mea
sure
d as
a p
erce
ntag
e of
fem
ale
mem
bers
in
mun
icip
al c
ounc
il
De A
rauacutej
o an
d Te
jedo
-R
omer
o 2
017
ndashndash
1 if
incu
mbe
ntrsquos
par
ty d
oes n
ot h
old
a m
ajor
ity
of se
ats i
n th
e co
unci
lndash
ndashTa
vare
s and
da
Cru
z 2
017
The
mat
urity
of t
he F
OI l
aw i
e h
ow lo
ng h
as it
bee
n in
forc
e n
umbe
r of s
anct
ions
stip
ulat
ed in
the
FOI l
awndash
Gar
ciacutea-
Tabu
yo e
t al
20
16 (m
anda
tory
di
sclo
sure
)ndash
Sour
ce A
utho
r
br
an
ko sta
nić
deter
min
an
ts of su
bn
ation
al b
ud
getfisc
al tr
an
spar
enc
y a rev
iew o
f empir
ica
l evid
enc
epu
blic sec
tor
eco
no
mic
s42 (4) 449-486 (2018)
479T
ab
le a
4 C
itize
ns a
nd th
e m
edia
Vari
able
na
me
Vari
able
m
easu
rem
ent
cor
rela
tion
of d
eter
min
ants
Posi
tive
neg
ativ
eN
on-s
igni
fican
t
Popu
latio
nN
umbe
r of i
nhab
itant
s
De A
rauacutej
o an
d Te
jedo
-Rom
ero
20
16 d
el S
ol 2
013
Gui
llam
oacuten
et a
l 2
011
Ser
rano
-Cin
ca e
t al
20
09 S
tyle
s and
Ten
nyso
n 2
007
Este
ller-M
oreacute
and
Polo
O
tero
201
2 (n
on-li
near
re
latio
nshi
p)
Caa
mantilde
o-A
legr
e et
al
201
3
Cab
a-Peacute
rez
et a
l 2
008
Gan
diacutea
and
Arc
hido
na 2
008
Gar
ciacutea-
Tabu
yo e
t al
20
16 T
avar
es a
nd d
a C
ruz
201
7Po
pula
tion
dens
ity m
easu
red
in p
erso
ns
per s
quar
e m
ileLo
wat
char
in a
nd M
enifi
eld
201
5ndash
ndash
Inte
rnet
ac
cess
Perc
enta
ge o
f hou
seho
lds w
ith h
ome
inte
rnet
acc
ess
Gan
diacutea
and
Arc
hido
na 2
008
(bud
get d
iscl
osur
e) C
aba-
Peacutere
z et
al
200
8 D
e Ara
uacutejo
and
Teje
do-R
omer
o 2
017
ndashG
andiacute
a an
d A
rchi
dona
200
8
(fina
ncia
l dis
clos
ure)
Fixe
d in
tern
et a
cces
s con
nect
ions
ove
r 200
ki
lobi
ts p
er se
cond
in a
t lea
st o
ne d
irect
ion
per 1
000
hou
seho
lds
Low
atch
arin
and
Men
ifiel
d 2
015
(sim
ples
t mod
el)
ndashLo
wat
char
in a
nd M
enifi
eld
201
5
(mos
t ext
ensi
ve m
odel
s)
Inte
rnet
pen
etra
tion
as a
mea
sure
for t
he
deve
lopm
ent o
f IC
T in
fras
truct
ure
Gar
ciacutea-
Tabu
yo e
t al
201
6 (m
anda
tory
dis
clos
ure)
Gar
ciacutea-
Tabu
yo e
t al
20
16 (v
olun
tary
di
sclo
sure
)ndash
Perc
enta
ge o
f net
izen
sndash
ndashM
a an
d W
u 2
011
Citi
zens
rsquo ch
arac
teris
-tic
s
Citi
zen
educ
atio
n at
tain
men
t
Gan
diacutea
and
Arc
hido
na 2
008
(bud
get d
iscl
osur
e) G
andiacute
a et
al
20
16 L
owat
char
in a
nd
Men
ifiel
d 2
015
ndash
Gan
diacutea
and
Arc
hido
na 2
008
(fina
ncia
l di
sclo
sure
) C
aba-
Peacutere
z et
al
200
8
De A
rauacutej
o an
d Te
jedo
-Rom
ero
201
7
Ma
and
Wu
201
1 S
erra
no-C
inca
et a
l
2009
Tav
ares
and
da
Cru
z 2
017
Citi
zens
rsquo age
mea
sure
d by
the
perc
enta
ge
of th
e po
pula
tion
aged
65
and
over
Este
ller-M
oreacute
and
Polo
Ote
ro
2012
(who
le sa
mpl
e an
d bi
g m
unic
ipal
ities
) de
l Sol
201
3ndash
Este
ller-M
oreacute
and
Polo
Ote
ro 2
012
(sm
all m
unic
ipal
ities
)
Ma
and
Wu
201
1
br
an
ko sta
nić
deter
min
an
ts of su
bn
ation
al b
ud
getfisc
al tr
an
spar
enc
y a rev
iew o
f empir
ica
l evid
enc
epu
blic sec
tor
eco
no
mic
s42 (4) 449-486 (2018)
480
Vari
able
na
me
Vari
able
m
easu
rem
ent
cor
rela
tion
of d
eter
min
ants
Posi
tive
neg
ativ
eN
on-s
igni
fican
t
Citi
zens
rsquo ch
arac
teris
-tic
s
Citi
zens
rsquo age
mea
sure
d by
the
aver
age
age
of th
e m
unic
ipal
pop
ulat
ion
ndashTa
vare
s and
da
Cru
z
2017
ndash
Citi
zens
rsquo age
mea
sure
d by
the
med
ian
age
of p
opul
atio
nndash
ndashLo
wat
char
in a
nd M
enifi
eld
201
5
Gen
der
mea
sure
d by
the
perc
enta
ge o
f m
en o
ver t
he to
tal l
ocal
pop
ulat
ion
ndashndash
del S
ol 2
013
Citi
zens
rsquo w
ealth
Dis
posa
ble
fam
ily in
com
e pe
r inh
abita
ntSe
rran
o-C
inca
et a
l 2
009
ndashndash
Pers
onal
inco
me
per c
apita
Low
atch
arin
and
Men
ifiel
d
2015
Sty
les a
nd T
enny
son
200
7ndash
Low
atch
arin
and
Men
ifiel
d 2
015
(a
fter c
ontro
lling
for s
tate
effe
cts)
G
uilla
moacuten
et a
l 2
011
Perc
enta
ge o
f pop
ulat
ion
belo
w th
e po
verty
leve
lndash
ndashLo
wat
char
in a
nd M
enifi
eld
201
5
The
valu
e of
eco
nom
ic a
ctiv
ity p
er c
apita
Ges
uele
et a
l 2
017
ndashde
l Sol
201
3Pu
rcha
se p
ower
inde
xndash
ndashTa
vare
s and
da
Cru
z 2
017
Une
mpl
oy-
men
tU
nem
ploy
men
t rat
eD
e Ara
uacutejo
and
Teje
do-R
omer
o
2017
Caa
mantilde
o-A
legr
e et
al
20
13 D
e Ara
uacutejo
and
Teje
do-R
omer
o 2
016
de
l Sol
201
3 T
avar
es
and
da C
ruz
201
7
ndash
Med
ia
Hav
ing
Twitt
er a
ndo
r Fac
eboo
k ac
coun
tsndash
ndashG
andiacute
a et
al
201
6In
tens
ity o
f use
of s
ocia
l med
ia m
easu
red
by th
e nu
mbe
r of t
wee
tsG
andiacute
a et
al
201
6ndash
ndash
Inte
nsity
of u
se o
f soc
ial m
edia
mea
sure
d by
the
Face
book
like
sndash
ndashG
andiacute
a et
al
201
6
br
an
ko sta
nić
deter
min
an
ts of su
bn
ation
al b
ud
getfisc
al tr
an
spar
enc
y a rev
iew o
f empir
ica
l evid
enc
epu
blic sec
tor
eco
no
mic
s42 (4) 449-486 (2018)
481Va
riab
le
nam
eVa
riab
le
mea
sure
men
tc
orre
latio
n of
det
erm
inan
tsPo
sitiv
en
egat
ive
Non
-sig
nific
ant
Med
ia
Pres
s vis
ibili
tyG
andiacute
a an
d A
rchi
dona
200
8
Gan
diacutea
et a
l 2
016
Las
wad
et
al
200
5ndash
Ges
uele
et a
l 2
017
Inte
rnet
vis
ibili
tyG
andiacute
a an
d A
rchi
dona
200
8
Gan
diacutea
et a
l 2
016
Ges
uele
et
al
201
7ndash
Serr
ano-
Cin
ca e
t al
200
9
Oth
er
varia
bles
Deg
ree
of c
omm
unity
invo
lvem
ent
mea
sure
d by
the
num
ber o
f civ
ic
asso
ciat
ions
div
ided
by
the
num
ber
of in
habi
tans
ndashndash
Serr
ano-
Cin
ca e
t al
200
9
Tota
l lan
d ar
eaLo
wat
char
in a
nd M
enifi
eld
201
5 (m
ost e
xten
sive
mod
el)
ndashndash
Perc
enta
ge o
f pop
ulat
ion
chan
ge o
ver
the
year
sLo
wat
char
in a
nd M
enifi
eld
201
5 (m
ore
sim
plifi
ed m
odel
s)ndash
ndash
Min
ority
mea
sure
d by
the
perc
enta
ge
of n
onw
hite
pop
ulat
ion
Low
atch
arin
and
Men
ifiel
d 2
015
ndashndash
Inde
x of
tour
ist a
ctiv
ity p
er c
apita
ndashde
l Sol
201
3-
Sour
ce A
utho
r
br
an
ko sta
nić
deter
min
an
ts of su
bn
ation
al b
ud
getfisc
al tr
an
spar
enc
y a rev
iew o
f empir
ica
l evid
enc
epu
blic sec
tor
eco
no
mic
s42 (4) 449-486 (2018)
482 references1 Alt J E Lassen D D and Rose S 2006 The causes of fiscal transparency
evidence from the US states IMF Staff Papers 53(Spcial Issue) Available at lthttpswwwimforgExternalPubsFTstaffp200603pdfaltpdfgt
2 Alt J E Lassen D D and Skilling D 2002 Fiscal Transparency Guberna-torial Approval and the Scale of Government Evidence from the States State Politics amp Policy Quarterly 2(3) pp 230-250 httpsdoiorg101177 153244000200200302
3 Andreula N Chong A and Guillen J B 2009 Institutional Quality and Fiscal Transparency IDB Working Paper No 36 httpdxdoiorg102139ssrn1817228
4 Bakar N B A and Saleh Z 2015 Review of literature on factors influenc-ing public sector disclosure The way forward Asian Journal of Business and Accounting 8(2) pp 155-184
5 Berliner D 2014 The political origins of transparency Journal of Politics 76(2) pp 479-491 httpsdoiorg101017S0022381613001412
6 Berliner D and Erlich A 2015 Competing for Transparency Political Com-petition and Institutional Reform in Mexican States American Political Sci-ence Review 109(1) pp 110-128 httpsdoiorg101017S0003055414000616
7 Bernardi R A and Arnold D F 1997 An Examination of Moral Develop-ment within Public Accounting by Gender Staff Level and Firm Contempo-rary Accounting Research 14(4) pp 653-668 httpsdoiorg101111j1911- 38461997tb00545x
8 Bernick E L [et al] 2014 Explaining County Government Fiscal Transpar-ency in an Age of e-Government State and Local Government Review 46(3) pp 173-183 httpsdoiorg1011770160323X14556819
9 Biderman C and Pottomatti G 2010 Metodologia para construccedilatildeo de iacutendice de transparecircncia Indice de transparencia Available at lthttpindicedetrans-parenciacommetodologiagt
10 Caamantildeo-Alegre J [et al] 2013 Budget Transparency in Local Govern-ments An Empirical Analysis Local Government Studies 39(2) pp 182-207 httpsdoiorg101080030039302012693075
11 Caba-Peacuterez C Rodriacuteguez Boliacutevar M P and Loacutepez Hernaacutendez A M 2008 e-Government process and initiatives for online public financial information Online Information Review 32(3) pp 379-400 httpsdoiorg101108JFM-03-2013-0017
12 Caba Peacuterez M del C Rodriacuteguez Boliacutevar M P and Loacutepez Hernaacutendez A M 2014 The determinants of government financial reports online Transylvanian Review of Administrative Sciences (42) pp 5-31 Available at lthttpwwwrtsarotrasindexphptrasarticledownload1513gt
13 Cuadrado-Ballesteros B [et al] 2017 The Role of Media Pressure in Pro-moting Transparency of Local Governments Transylvanian Review of Admin-istrative Sciences 2017(51E) pp 20-37 httpsdoiorg1024193tras51E2
br
an
ko sta
nić
deter
min
an
ts of su
bn
ation
al b
ud
getfisc
al tr
an
spar
enc
y a rev
iew o
f empir
ica
l evid
enc
epu
blic sec
tor
eco
no
mic
s42 (4) 449-486 (2018)
48314 Darbishire H 2010 Proactive Transparency The future of the right to infor-mation World Bank Institute Working Paper No 60 httpsdoiorg 10159625031
15 De Arauacutejo J F F E and Tejedo-Romero F 2016 Local government trans-parency index determinants of municipalitiesrsquo rankings International Jour-nal of Public Sector Management 29(4) pp 327-347 httpdxdoiorg101108MRR-09-2015-0216
16 De Arauacutejo J F F E and Tejedo-Romero F 2017 Does Gender Equality Affect Municipal Transparency The Case of Spain Public Performance and Management Review 41(1) pp 69-99 httpsdoiorg1010801530957620171362350
17 Debreceny R Gray G L and Rahman A 2002 The determinants of inter-net financial reporting Journal of Accounting and Public Policy 21(4-5) pp 371-394 httpsdoiorg101016S0278-4254(02)00067-4
18 del Sol D A 2013 The institutional economic and social determinants of local government transparency Journal of Economic Policy Reform 16(1) pp 90-107 httpsdoiorg101080174878702012759422
19 Esteller-Moreacute A and Polo Otero J 2012 Fiscal Transparency (Why) does your local government respond Public Management Review 14(8) pp 1153-1173 httpsdoiorg101080147190372012657839
20 Evans J H and Patton J M 1987 Signaling and Monitoring in Public-Sector Accounting Journal of Accounting Research 25 pp 130-158 httpsdoiorg1023072491083
21 Ferejohn J 1986 Incumbent performance and electoral control Public Choice 50 pp 5-25 httpsdoiorg101007BF00124924
22 Fox J 2007 The uncertain relationship between transparency and account-ability Development in Practice 17(4-5) pp 663-671 httpsdoiorg 10108009614520701469955
23 Fox R L and Schuhmann R A 1999 Gender and Local Government A Comparison of Women and Men City Managers Public Administration Review 59(3) pp 231-242 httpsdoiorg1023073109951
24 Gandiacutea J L and Archidona M C 2008 Determinants of web site informa-tion by Spanish city councils Online Information Review 32(1) pp 35-57 httpsdoiorg10110814684520810865976
25 Gandiacutea J L Marrahiacute L and Huguet D 2016 Digital transparency and Web 20 in Spanish city councils Government Information Quarterly 33(1) pp 28-39 httpsdoiorg101016jgiq201512004
26 Garciacutea-Tabuyo M Saacuteez-Martiacuten A and Caba-Peacuterez M D C 2016 Manda-tory versus voluntary disclosures Drivers of proactive information provision by local governments in Central America Information Development 32(4) pp 1199-1215 httpsdoiorg1011770266666915595260
27 Garciacutea A C and Garciacutea-Garciacutea J 2010 Determinants of Online Reporting of Accounting Information by Spanish Local Government Authorities Local
br
an
ko sta
nić
deter
min
an
ts of su
bn
ation
al b
ud
getfisc
al tr
an
spar
enc
y a rev
iew o
f empir
ica
l evid
enc
epu
blic sec
tor
eco
no
mic
s42 (4) 449-486 (2018)
484 Government Studies Routledge 36(5) pp 679-695 httpsdoiorg101080030039302010506980
28 Gesuele B Metallo C and Longobardi S 2017 The Determinants of E-Disclosure Attitude Empirical Evidences from Italian and Spanish Munici-palities International Journal of Public Administration Routledge 20(4) pp 263-276 httpsdoiorg1010800190069220171300917
29 Gore A K Sachs K and Trzcinka C 2004 Financial disclosure and bond insurance Journal of Law and Economics 47(1) pp 275-306 httpsdoiorg 101086380472
30 Grimmelikhuijsen S G and Welch E W 2012 Developing and Testing a Theoretical Framework for Computer-Mediated Transparency of Local Gov-ernments Public Administration Review 78(1) pp 562-571 httpsdoiorg 10230741506806
31 Groff J and Pitman M 2004 Municipal financial reporting on the World Wide Web A survey of financial data displayed on the official websites of the 100 largest US municipalities Journal of Government Financial Manage-ment 53(2) pp 20-30
32 Guillamoacuten M-D Bastida F and Benito B 2011 The Determinants of Local Governmentrsquos Financial Transparency Local Government Studies 37(4) pp 391-406 httpsdoiorg101080030039302011588704
33 Hollyer J R Rosendorff B and Vreeland J R 2011 Democracy and trans-parency Journal of Politics 73(4) pp 1191-1205 httpsdoiorg101017S0022381611000880
34 IMF 1997 World Economic Outlook Washington International Monetary Fund Available at lthttpswwwimforgexternalpubsftweoweo1097pdfoctweo01pdfgt
35 IMF 1998 Code of Good Practices on Fiscal Transparency minus Declaration on Principles Washington International Monetary Fund Available at lthttpswwwimforgexternalpubsfthistory2012pdf4dpdfgt
36 IMF 2012 Fiscal Transparency Accountability and Risk Washington Inter-national Monetary Fund Available at lthttpswwwimforgexternalnpppeng2012080712pdfgt
37 Ingram R W 1984 Economic Incentives and the Choice of State Govern-ment Accounting Practices Journal of Accounting Research 22(1) pp 126-144 httpsdoiorg1023072490704
38 Khazanchi D 1995 Unethical behavior in information systems The gender factor Journal of Business Ethics 14(9) pp 741-749 httpsdoiorg101007BF00872327
39 Kopits G and Craig J 1998 Transparency in government operations IMF Occasional Papers No 158 Available at lthttpswwwimforgexternalpubsftop158op158pdfgt
40 Krishnan G V and Parsons L M 2008 Getting to the bottom line An exploration of gender and earnings quality Journal of Business Ethics 78(1-2) pp 65-76 httpsdoiorg101007s10551-006-9314-z
br
an
ko sta
nić
deter
min
an
ts of su
bn
ation
al b
ud
getfisc
al tr
an
spar
enc
y a rev
iew o
f empir
ica
l evid
enc
epu
blic sec
tor
eco
no
mic
s42 (4) 449-486 (2018)
48541 Laakso M and Taagepera R 1979 ldquoEffectiverdquo number of parties A Meas-ure with Application to West Europe Comparative Political Studies 12(1) pp 3-27 httpsdoiorg101177001041407901200101
42 Laswad F Fisher R and Oyelere P 2005 Determinants of voluntary Inter-net financial reporting by local government authorities Journal of Accounting and Public Policy 24(2) pp 101-121 httpsdoiorg101016jjaccpubpol 200412006
43 Lowatcharin G and Menifield C E 2015 Determinants of Internet-enabled Transparency at the Local Level State and Local Government Review 47(2) pp 102-115 httpsdoiorg1011770160323X15593384
44 Ma L and Wu J 2011 What Drives Fiscal Transparency Evidence from Provincial Governments in China 1st Global Conference on Transparency Research Rutgers University-Newark May 19-20 2011 httpsdoiorg 102139ssrn1807767
45 Michener G 2015 Why Policymakers Commit to Transparency Legitimacy Insurance Monitoring and the Importance of the News Media as Mediator Available at lthttpwwwfiscaltransparencynetresourcesfilesfiles2015070 2109pdfgt
46 Moon M J and Norris D F 2005 Does managerial orientation matter The adoption of reinventing government and e-government at the municipal level Information Systems Journal 15(1) pp 43-60 httpsdoiorg101111j1365- 2575200500185x
47 Moon M J 2002 The Evolution of E-Government among Municipalities Rhetoric or Reality Public Administration Review 62(4) pp 424-433 httpsdoiorg1011110033-335200196
48 Norris D F and Kraemer K L 1996 Mainframe and PC computing in American cities Myths and realities Public Administration Review 56(6) pp 568-576 httpsdoiorg102307977255
49 OECD 2002 OECD Best Practices for Budget Transparency OECD Journal on Budgeting 1 pp 7-14 httpsdoiorg101787budget-v1-art14-en
50 Pina V Torres L and Royo S 2010 Is E-Government Leading To More Accountable and Transparent Local Governments an Overall View Finan-cial Accountability amp Management 26(1) pp 3-20 httpsdoiorg 101111j1468-0408200900488x
51 Piotrowski S J and Bertelli A 2010 Measuring Municipal Transparency 14th IRSPM Conference Bern Switzerland
52 Piotrowski S J and Vanr Ryzin G G 2007 Cittizens Attitudes Toward Transparency in Local Government The American Review of Public Adminis-tration 37(3) pp 306-323 httpsdoiorg10108009638180126794
53 Rodriacuteguez-Garcia M J 2015 Local womenrsquos coalitions Critical actors and substantive representation in Spanish municipalities European Journal of Womenrsquos Studies 22(2) pp 223-240 httpsdoiorg101177 1350506814549424
br
an
ko sta
nić
deter
min
an
ts of su
bn
ation
al b
ud
getfisc
al tr
an
spar
enc
y a rev
iew o
f empir
ica
l evid
enc
epu
blic sec
tor
eco
no
mic
s42 (4) 449-486 (2018)
486 54 Serrano-Cinca C Rueda-Tomaacutes M and Portillo-Tarragona P 2009 Fac-tors Influencing E-Disclosure in Local Public Administrations Environment and Planning C Government and Policy 27(2) pp 355-378 httpsdoiorg 101068c07116r
55 Smith A C and Taebel D A 1985 Administrative innovation in municipal government International Journal of Public Administration Routledge 7(2) pp 149-177 httpsdoiorg10108001900698508524487
56 Styles A K and Tennyson M 2007 The Accessibility of Financial Report-ing of US Municipalities on the Internet Journal of Public Budgeting Accounting amp Financial Management 19(1) pp 56-92
57 Tavares A F and da Cruz N F 2017 Explaining the transparency of local government websites through a political market framework Government Information Quarterly httpsdoiorg101016jgiq201708005
58 Vishwanath T and Kaufmann D 1999 Towards transparency in finance and governance Washington DC The World Bank
59 Wehner J and de Renzio P 2013 Citizens Legislators and Executive Dis-closure The Political Determinants of Fiscal Transparency World Develop-ment 41(1) pp 96-108 httpsdoiorg101016jworlddev201206005
60 Zimmerman J L 1977 The Municipal Accounting Maze An Analysis of Political Incentives Journal of Accounting Research 15 pp 107-144 httpdxdoiorg1023072490636
61 Zuccolotto R and Teixeira M A C 2014 The Causes of Fiscal Transpar-ency Evidence in the Brazilian States Revista Contabilidade amp Financcedilas 25(66) pp 242-254 httpsdoiorg1015901808-057x201410820
Working Together Integration Institutions and the Sustainable Development Goals World Public Sector Report 2018
UNITED NATIONSUnited Nations Department of Economic and Social Affairs New York 2018 pp 161
Book review by PREDRAG BEJAKOVIĆhttpsdoiorg103326pse4245
Received October 21 2018 Accepted November 7 2018
Predrag BEJAKOVIĆ PhDInstitute of Public Finance Smičiklasova 21 10000 Zagreb Croatiae-mail predragbejakovicijfhrORCiD 0000-0002-4164-8220
un
ited natio
ns
wo
rk
ing to
geth
er integ
ratio
n institu
tion
s an
d the su
stain
ab
le dev
elopm
ent g
oa
ls w
or
ld pub
lic secto
r repo
rt 2018
pub
lic secto
r ec
on
om
ics
42 (4) 487-494 (2018)
488 In the current world although there has been a significant progress in the reduc-tion of poverty and inequality a persistent problem is the lack of improvement in integration which causes social exclusion Furthermore modern economic devel-opment is often not sustainable of the long-term while institutions are not fully adapted to the needs of social challenges A newly published release by the United Nation World Public Sector Report 20181 using a holistic approach very nicely sheds light on the additional measures that are needed to the collaborative efforts of various stakeholders in the inclusion of those that are left out This excellent report was prepared by many authors using mixed methods that combined litera-ture reviews and expert contributions The team composed of United Nations per-sonnel was led by David Le Blanc under the responsibility of Marion Bartheacutelemy
The United Nations in 2016 adopted the 2030 Agenda for Sustainable Develop-ment (the successor to its Millennium Development Goals) which should elimi-nate poverty and achieve sustainable development by 2030 (Steven Pinker in Enlightenment Now states that not even Jesus was that optimistic he told the indig-nant disciples ldquoThe poor you will always have with yourdquo) The Agenda underlines the importance of the interlinkages and integrated nature of the sustainable devel-opment goals (SDGs) Achieving possible synergies and strengthening trade-offs between the sustainable development goals and targets will enable much easier achievement of the SDGs This should boost the allocation of resources and help avoid the adverse side effects of actions aiming to hasten progress in one area on the realisation of targets in other areas
One of the goals of the report is to present the positive experience of many coun-tries with the intention of transferring the best practice in policy integration for the attainment of SDGs The authors are fully aware that different types of existing interlinkages among the SDGs can be addressed and improved from an institu-tional perspective Thus the report aims to define areas where public institutions need to work more closely together the types of measures that can be involved in this process and the broader implications for and consequences of collaboration between public institutions and public service
Improving integration involves finding ways to strengthen cooperation and com-mon approaches among institutions at various levels dealing with closely interre-lated issues Policy integration comprises the management of crosscutting actions and measures in a policy-making process that transits the boundaries of estab-lished policy fields Such measures very often do not correspond to the institu-tional responsibilities of individual units and departments
In the modern literature the term integration is used in various slightly different meanings The most common usage defines integration as a dimension variable with policies in specific issue areas being more integrated than before Otherwise
1 The report is available at httpworkspaceunpanorgsitesInternetDocumentsUNPAN98152pdf
un
ited natio
ns
wo
rk
ing to
geth
er integ
ratio
n institu
tion
s an
d the su
stain
ab
le dev
elopm
ent g
oa
ls w
or
ld pub
lic secto
r repo
rt 2018
pub
lic secto
r ec
on
om
ics
42 (4) 487-494 (2018)489integration can be deemed as the more coherent process of defining and imple-
menting policy related to a specific issue Finally integration can also denote the ideal of policies that achieve a higher degree of coherence In this report the term integration is considered in a broad sense while the potential challenges short-comings and gains of integrated policy-making are clear The challenges in the past were the lack of political legitimacy of sustainable development as a para-digm and insufficient attention of various levels of government to the issue of sustainable development Shortcomings are an inability to mainstream sustainable development principles in the work of available institutions on one hand and resistance to achieve the degree of coordination among institutions that are needed for sustainable development on the other Gains of the integrated approach are socially superior solutions that cannot be achieved by focusing only on sector-specific policies and shared visions across sectors and various actors Positive changes in relevance and legitimacy are supported by progress in the scientific researchers that fully understand the interlinkages among sustainable develop-ment topics on the one hand as well as by the development of tools analytical methods and information systems that support integration of different stakehold-ers in public and private sector on the other
The report is organized around three broad principal questions First what are from the institutional perspective the challenges to and prospects for policy integration at various policy cycle phases at the national level Second are there any positive cases of institutional and administrative organisations that can support integrated approaches to the 2030 Agenda and if so what are they Finally what are the opportunities and challenges for public administration and public institutions to ensure integrated approaches in diverse SDG or groups of closely related goals
The report consists of two main parts In the first part chapter one explains the reasons and case for integration and introduces the methodological framework The second chapter focuses on horizontal integration chapter three on vertical integration while chapter four deals with successful engagement of stakeholders The second part of the publication applies the relevant framework of integrated approaches to international migration health and integration of peace security and development in post-conflict situations
Forms of integration are explained in chapter one The modern literature distin-guishes three dimensions of integration Horizontal integration encompasses inte-gration across sectors or institutions Vertical integration expresses how the actions of various (national and sub-national) levels of government can be adjusted to achieve coherent outcomes The third dimension is engagement of all stakeholders in the integrated realisation of shared objectives Taken together these three dimen-sions of integration encompass all the relevant categories proposed by the litera-ture primarily partnerships participation and coherence The approach and content of the initiatives can be formal or informal The latter refers to joint activities that involve various stakeholders from the non-state sector in addition to the whole of
un
ited natio
ns
wo
rk
ing to
geth
er integ
ratio
n institu
tion
s an
d the su
stain
ab
le dev
elopm
ent g
oa
ls w
or
ld pub
lic secto
r repo
rt 2018
pub
lic secto
r ec
on
om
ics
42 (4) 487-494 (2018)
490 government with the state usually having a coordinating role When analysing policy integration there is a need to consider different aspects like the institutional efforts made by governments to promote integrated policy-making and policy coherence activities related to collaboration and coordination and measures of achieved integration and policy coherence regarding achieved outcomes
As the SDGs makes high demands for horizontal integration on institutions at all levels chapter two analyses the importance of effective horizontal integration for the implementation of the SDGs Such integration is critical for resolving the interconnected nature of the SDGs including synergies and trade-offs across dif-ferent goals and targets It is however well known that overcoming sectoral boundaries in the attainment of horizontal integration is a demanding and complex task In such a process governments have concrete measures and opportunities to improve integration in their structures and processes A growing number of coun-tries around the world are including SDGs into their national policies and putting in place adequate institutional frameworks While some countries have given new mandates to existing mechanisms or institutions others are establishing new coor-dination bodies and mechanisms for the implementation of the SDGs Among many vital measures and instruments the five most important are examined The first are national strategies and plans because they define the overall direction and priorities The second is the budget process that helps in implementation and real-isation of national strategies at the level of programmes and activities The third group consists of public services responsible for the implementation of govern-ment actions on the SDGs This group has a critical role in achieving effective collaboration across institutions and sectors Monitoring evaluation and review processes for the SDGs are part of the fourth group that enables governments to assess progress in the activities of integration Finally different oversight institu-tions parliaments and Supreme Audit Institutions (SAIs) have a crucial role in insuring integration The report contains many examples of integration from dif-ferent countries so this chapter presents the experiences from the Sierra Leone implementation of the Agenda for Prosperity particularly the Poverty Reduction Strategy The Budget Statement nominates the responsible stakeholders and the scope of their reporting responsibilities on the SDGs within the various govern-ment ministries and offices where resources were allocated
The realisation of the SDGs requires the coordination of actions and measures of different levels of government There are many reasons for such coordination In most cases the achievement of specific targets in each national context depends on the aggregation of local and regional outcomes making coherent action a stip-ulation Vertical integration may be an important step in promoting a shared vision and commitment to sustainable development across levels It can enhance syner-gies and improve consistency across levels of government through mutually rein-forcing and supportive actions The third chapter examines current efforts in ensuring effective vertical policy integration during the implementation and fol-low-up and review of the SDGs Vertical integration enables an opportunity for
un
ited natio
ns
wo
rk
ing to
geth
er integ
ratio
n institu
tion
s an
d the su
stain
ab
le dev
elopm
ent g
oa
ls w
or
ld pub
lic secto
r repo
rt 2018
pub
lic secto
r ec
on
om
ics
42 (4) 487-494 (2018)491political dialogue among the various parts of government providing a possibility
to generate trust and a more long-term vision across the public sector The chapter analyses the potential benefits of vertical integration and some of its challenges and barriers It also studies approaches and tools that different countries have implemented with the goal of enhancing vertical integration at different stages of the policy process underlining innovative approaches and experiences Potential challenges to vertical integration include the gap between the abstract and univer-sal nature of SDGs and the specificity of local initiatives and policies unaware-ness of SDGs by local governments organizational cultural andor ideological differences between national and local governments institutional weaknesses or poor coordination mechanisms between the different levels of government Colombia can be mentioned as a positive example of successful and advanced vertical integration With support from the Colombian national government 32 departments and 31 capital cities have adopted and implemented local develop-ment plans that include SDG localized targets
The fourth chapter presents the adoption of mechanisms for efficient stakeholder engagement at both the systemic and the sector levels It also looks at how it can affect outcomes in terms of integration Many experiences have been observed regarding processes and mechanisms for stakeholder engagement in different sec-tors at different levels of decision-making and with various constituencies Hav-ing in mind such examples governments have become fully aware of the impor-tance of stakeholder engagement in order to strengthen ownership of the SDGs and ensure their successful implementation and monitoring at all levels Included stakeholders can enhance policy performance by helping in defining problems in ways that are more accurate They can also provide information and insights rele-vant for identifying policy solutions and evaluating the implementation process Enabling policy-making process to the inclusion and interaction with non-govern-mental actors helps governments better to understand peoplersquos needs and demands Furthermore non-governmental actors can be directly included in solving policy problems and contribute additional resources through the common generation of skills knowledge policy and technology Of course there are always some prob-lems and costs Wide stakeholder engagement usually takes time and can be an obstacle to the quick policy responses that some sustainable development chal-lenges may need While including the ideas and opinions of multiple stakeholders helps gain a more comprehensive and legitimate understanding of demanding pol-icy problems engagement can make it more difficult to reconcile divergent and even opposite views in commonly agreed policy solutions It seems that the com-bination of different engagement strategies and collaboration of multiple stake-holders is more effective for increasing responsiveness and accountability than the use of one single engagement mechanism The positive Finnish example of the government-led Finnish National Commission on Sustainable Development with many stakeholders included from public and private sector and civil society illus-trates a possible way of mobilizing non-state actors that is fully consistent with government actions for SDG implementation Investing time and resources in the
un
ited natio
ns
wo
rk
ing to
geth
er integ
ratio
n institu
tion
s an
d the su
stain
ab
le dev
elopm
ent g
oa
ls w
or
ld pub
lic secto
r repo
rt 2018
pub
lic secto
r ec
on
om
ics
42 (4) 487-494 (2018)
492 selection process and having clearly defined procedures and criteria for selecting stakeholders without doubt contribute to the effectiveness and efficiency of the engagement as well as its outputs and outcomes in terms of integration
Sustainable development demands policies that are systematically oriented towards the strengthening of linkages between different economic social and environmen-tal issues The fifth chapter shows how national public institutions and administra-tions have used integrated approaches to respond to the needs of migrants and refu-gees the flows of whom have been increasing across the world The way in which the multiple linkages between migration and the SDGs are transformed into national policies and realised in practice by public institutions and public adminis-tration reflects political processes of reconciling opposite opinions and demands of different stakeholders including governments civil society and migrants them-selves The authors examine how public institutions and different stakeholders can better support integrated approaches to migration How can they sustain the inte-gration of the mentioned approaches in sustainable development measures poli-cies and institutional processes Where and how can development policies make the most impact when it comes to serving those in the worst positions among inter-national migrants How can policy-makers and policy communities connect migra-tion and socio-economic development through innovative services No single model appears intrinsically better in terms of effective and efficient policy integra-tion Elements that might perhaps impact horizontal and vertical policy integration include the type of public administration system the level of decentralisation and local governance institutional capacity previous experience and institutionaliza-tion of cooperation between various bodies of government development of leader-ship prevalence of modern technology usage including the capability and vigour of communication platforms and finally the characteristics and the numbers of actors involved in policy-making Morocco is a positive example of a country that undertook several waves of regularization of migrants in an irregular situation fol-lowed by the opening of its public services to all migrants and refugees Migrants in an irregular situation have access to public health services and can send their children to public schools Additionally regular migrants can participate in profes-sional training and assistance with job search This chapter concludes with an important statement that integration of migration and development at all levels of public administration is not only a technical or rational process but also has to encompass cultural awareness politics and perceptions As migration and refugee issues are likely to remain a significant problem in the near future there is a need for the proposal and implementation of efficient awareness and communication strategies and accountability systems in public administration
Integrated approaches to health and well-being are the subject of analysis in the sixth chapter Health is a crucial human right and an important characteristic of personal well-being Health outcomes are impacted by many factors that are usu-ally outside the health sector itself At the national level a vast array of policies and institutional settings have been developed to support the multiple linkages
un
ited natio
ns
wo
rk
ing to
geth
er integ
ratio
n institu
tion
s an
d the su
stain
ab
le dev
elopm
ent g
oa
ls w
or
ld pub
lic secto
r repo
rt 2018
pub
lic secto
r ec
on
om
ics
42 (4) 487-494 (2018)493between health and other SDG areas with the intention to support integrated
approaches However researches show that the focus of many efforts at integrated health initiatives has largely remained within the health care sector itself Attempts at integration have been oriented to finding ways to enable non-health sectors and actors to serve the goals of the health sector without necessarily considering the impact of health on those sectors and their principal objectives Thus in many countries the potential of integrated approaches to achieve synergies and minimise trade-offs across sectors and government levels may remain often unused Univer-sal healthcare for all migrants in Thailand is mentioned as a positive experience of interlinkages of health with other sectors Migrants represent more than 6 percent of the Thai population It is currently the only country in the world where illegal migrants have the same health care rights as nationals
This very nice report finishes with chapter seven which deals with the implemen-tation of the SDGs in post-conflict situations and their implications for integrated approaches that enable improvements in sustainable development and peace Conflicts annually lower a countryrsquos gross domestic product growth on average by two percentage points Trends in the world show that the gap between conflict-affected countries and other developing states is widening Countries emerging from conflict are the ones where the SDGs probably may not be obtained without some radical and innovative departures An integrated context for SDG imple-mentation involves ensuring that interventions aimed at preserving peace (includ-ing protecting human rights) and development are interlinked and mutually rein-forcing As countries in post-conflict situations face many pressing problems for them the achievement of long-term development goals is much more difficult In the face of many short and long-term priorities efficient integrated approaches become even more important than in peaceful circumstances Post-conflict situa-tions mostly vary in the nature and degree of devastation but often there is a need to mitigate the consequences of substantial physical institutional and organiza-tional destruction Conflicts usually ruin national public administration and public institutions and they have to be rebuilt often from scratch Using recent examples the authors in this chapter explore how this can be done Sustainable development aspirations can be an inspiration for a common vision for the future Such a vision needs to be transformed into coherent and integrated national policies that are future-looking inclusive and endorse partnership between the government and society and support by various stakeholders The policy integration and inclusion in Colombia achieved by the National Development Plan are provided as an example The Colombian government made efforts to provide an inclusive plat-form for policy-making at the local level giving a voice to earlier marginalized groups and supporting their participation in local elections as candidates The government also established the legal and institutional architecture for a territorial peacebuilding process The coordination between central and local levels of gov-ernment was achieved through the Inter-institutional Post-conflict Council
un
ited natio
ns
wo
rk
ing to
geth
er integ
ratio
n institu
tion
s an
d the su
stain
ab
le dev
elopm
ent g
oa
ls w
or
ld pub
lic secto
r repo
rt 2018
pub
lic secto
r ec
on
om
ics
42 (4) 487-494 (2018)
494 The report presents country efforts to foster policy integration for SDGs It pro-vides examples of measures and ways by which linkages among SDGs can be achieved from an institutional perspective and underlines the importance of inte-gration challenges and opportunities for public institutions and public administra-tion This interesting and valuable report also explains the role and importance of budgets in tracking support to specific goals The reader can only enjoy the final product and the incredible richness of the additional (more than 500) sources used in the preparation of the report