public debt sustainability: spain in the european...
TRANSCRIPT

29
SEFO
- Sp
anish
Eco
nom
ic a
nd F
inan
cial
Out
look
Vol.
3, N
.º 2
(Mar
ch 2
014)
Public debt sustainability: Spain in the European context
Joaquín Maudos1
As is the case of other distressed euro area countries, the impact of the crisis has deteriorated Spain´s public debt ratio, as well as its net international investment position. Current debt dynamics are raising concerns among investors over the country´s debt sustainability outlook, given growth and interest rate assumptions for the coming years, together with expected difficulty in reaching the necessary primary surplus. Market tensions have eased in the near term, but continued correction of fiscal and external imbalances will be needed.
Erosion of Spain´s fiscal accounts as a consequence of the crisis has increased the public debt to GDP level to a maximum of 93.9% in 2013 from a low of 36.3% in 2007, the seventh highest among the EU. The country´s debt sustainability outlook is worrisome, given expectations of lackluster medium-term growth rates, likely below interest rates on the debt, and projected difficulties in achieving the required primary surplus in order to stabilize or reduce the debt to GDP ratio. The crisis has had a similar impact on public debt levels in other peripheral euro area countries, which like Spain, were penalized by high risk premiums on sovereign debt relative to their non-distressed European peers. Spain´s net international investment position has also deteriorated during the crisis, making it the fourth most heavily indebted country in the EU and also placing upward pressure on borrowing rates. Recent corrections of the country´s current account balance and reduced sovereign risk spreads are helping to improve the net international investment position and reduce the public debt burden, respectively. In the longer term, however, continued fiscal consolidation is needed to ensure both debt sustainability and a return to growth.
1 Professor of Economics at the University of Valencia and Researcher at the Ivie. This article is related to the research projects ECO2010-17333 of Spanish Ministry of Science and Innovation and PROMETEO/2009/066 of the Valencian Government.
One of the most troublesome consequences of the enduring crisis affecting the Spanish economy has been the rapid growth of public sector debt. The scale of the crisis was such that plummeting revenues and the escalating costs of automatic stabilisers and interest payments soon had an impact on the public deficit. Consequently, Spain went from a government surplus of 1.9% of GDP
in 2007 to a deficit of 4.5% of GDP just one year later. The deficit then hovered around 10%-11% of GDP in subsequent years. The forecast for the end of 2013 was a deficit of over 7% of GDP – the sixth successive year of serious imbalances in the public accounts. The government´s issuance of debt to finance these deficits increased the public debt-to-GDP ratio from a low of 36.3% in 2007 to 93.9%

Joaquín Maudos
30
SEFO
- Sp
anish
Eco
nom
ic a
nd F
inan
cial
Out
look
Vol.
3, N
.º 2
(Mar
ch 2
014)
in 2013, which means that it has multiplied by 2.6 in just six years.
The state of Spain’s public sector debt needs to be viewed within the broader context of substantial increases in public debt in advanced economies in recent years, in contrast to the shrinking debt in emerging countries. A recent IMF report by the renowned authors Carmen M. Reinhart and Kenneth S. Rogoff (Reinhart and Rogoff, 2013)
finds that the government debt to GDP ratio among the advanced economies is currently over 100%, a level only reached after the end of the Second World War and the highest for two centuries. Indeed, the latest data from the IMF in its October 2013 “Fiscal Monitor” place the public debt to GDP ratio in the advanced economies at 108%, a figure three times that of other economies (35.3%). The IMF forecasts that this huge difference and the high debt level of the advanced economies will persist over the years ahead, reaching an estimated 105% in 2018, compared with 30.3% in the developing economies. There has also been a huge rise in the advanced economies’ external debt (both public and private), which has soared to 250% of GDP.
This situation is worrisome, and the sustainability of current debt levels is being called into question. This has led to proposals on alternatives ways of solving the problem of excessive debt, such as stimulating economic growth, fiscal adjustment/austerity, default/debt restructuring, generating inflation in order to erode the real value of the debt, or financial repression in conjunction with
inflation, where repression is understood to mean measures transferring wealth from savers to creditors (nationalising pension funds, new taxes, imposing capital controls, etc.).
Against this background, this article aims to analyse recent trends in the Spanish economy’s public debt in the European context. It also looks at the factors determining the debt’s sustainability, which primarily depends on the economy’s ability to achieve nominal GDP growth higher than the interest on the public debt and to generate primary surpluses. Given that the problem is not exclusive to Spain, but is shared by other distressed economies in Europe’s periphery, it is worth analysing the public debt dynamics in these countries compared to the rest of Europe.
Finally, in some countries the concern about the public debt overhang is exacerbated by their high net external debt, which has to date been a good predictor of a country’s likelihood of needing a bail out. This article therefore also examines recent trends in Spain’s international investment position relative to the euro area, contrasting the position of the distressed countries with that of their more stable peers.
The trend in Spain’s public-debt-to-GDP ratio
As Exhibit 1 shows, the Spanish economy’s growth phase prior to the outbreak of the crisis in mid-2007 allowed the public debt-to-GDP ratio to be cut by 23 percentage points (pp.), reaching a low of 36.3% in 2007. Since then, the ratio has been multiplied by a factor of 2.6, reaching a maximum of 93.9% in 2013. This implies that on average, the debt-to-GDP ratio has risen by 17% a year since 2007, increasing by almost 16 pp in just one year (2012). This debt growth is being driven by the upward trend in the public deficit also shown in the Exhibit. The deficit has gone from a relatively balanced position between 2000 and 2004 –and even a surplus between 2005 and 2007– to the complete opposite, switching from a surplus of 2%
The state of Spain’s public sector debt needs to be viewed within the broader context of substantial increases in public debt in advanced economies in recent years, in contrast to the shrinking debt in emerging countries.

Public debt sustainability: Spain in the European context
31
SEFO
- Sp
anish
Eco
nom
ic a
nd F
inan
cial
Out
look
Vol.
3, N
.º 2
(Mar
ch 2
014)
of GDP to a deficit of 4.5% of GDP in 2008 and then staying around 10% of GDP until 2012. In 2013, the forecast was for a deficit of 7% of GDP, half a point above the target set by Brussels.
The government debt sustainability equation in Spain
According to the debt sustainability equation, changes in the debt-to-GDP ratio depend on various factors: the GDP growth rate, the interest rate on the debt, the initial debt level, and the size of the primary deficit/surplus (i.e., excluding the interest on the debt). Thus, not only is a primary surplus needed in order for the ratio to drop, but GDP has to grow faster than the implicit interest rate on the public debt.
If we look at events over the past few years, during the growth period ending in 2007, as Exhibit 2 shows, the interest rate on the debt stayed below nominal GDP growth. In conjunction with the primary surplus, this allowed the public debt to shrink relative to GDP. In particular, over the period from 2000-2007, annual nominal GDP
growth averaged 7.75%, the implicit interest rate on the debt was 4.4%, and the primary surplus
2.7% of GDP. Over the same period, the debt-to-GDP ratio fell by 23 percentage points. However, during the 2008-2013 crisis, average nominal GDP growth was -0.5%, the interest rate on the debt 4.7%, and the primary deficit 6.4% of GDP. Consequently, the debt increased by 54 pp. as a share of GDP.
0
10
20
30
40
50
60
70
80
90
100
2000 2001 2002 2003 2004 2005 2006 2007 2008 2009 2010 2011 2012 2013
Public debt Public balance (r.h.s.)
Exhibit 1Public debt and public balance in Spain Percentage of GDP
Source: Eurostat.
From 2000-2007, annual nominal GDP growth averaged 7.75%, the implicit interest rate on the debt was 4.4%, and the primary surplus 2.7% of GDP. The debt-to-GDP ratio fell by 23 percentage points. However, during the 2008-2013 crisis, average nominal GDP growth was -0.5%, the interest rate on the debt 4.7%, and the primary deficit 6.4% of GDP. Consequently, the debt increased by 54 pp. as a share of GDP.

Joaquín Maudos
32
SEFO
- Sp
anish
Eco
nom
ic a
nd F
inan
cial
Out
look
Vol.
3, N
.º 2
(Mar
ch 2
014)
The latest macroeconomic forecasts do not project nominal GDP growth exceeding the interest rate on the debt. For instance, the European Commission’s February 2014 forecasts situate real GDP growth at 1% and 1.7% in 2014 and 2015, respectively. With a forecast inflation rate of less than 1% (using the GDP deflator), this would translate to nominal growth of less than 2% and 2.7%. In terms of the cost of the debt, the implicit interest rate could be around 4%, such that only with a primary surplus of at least 1.3% of GDP would it be possible to stabilise the debt. On this point, the IMF’s latest projections in its October 2013 “Fiscal Monitor” describe a scenario in which Spain will continue to run a primary deficit until 2016 (-0.6% of GDP), and only in 2017 (+0.4%) and 2018 (+1.4) will it achieve a primary surplus. Consequently, as the IMF forecasts, public debt will only halt its growth relative to GDP in 2018. This makes it essential to comply scrupulously with the deficit targets, and the incipient recovery needs to gain further traction in the coming years if the continued investor confidence necessary to allow the debt to be financed at reasonable rates is to be ensured. As the latest European Commission report on macroeconomic imbalances in European
countries (March 5th, 2014) points out, reducing Spain’s public debt over the medium term demands a permanent fiscal effort.
Public debt: Spain in the European context
As mentioned in the introduction, the Spanish economy is not alone among Europe’s economies in having a debt overhang problem, a fact that has as its origin the outbreak of the euro area sovereign-debt crisis in mid-2010.
As Exhibit 3 shows, since Greece’s first bail-out, a gulf has opened up between the cost of financing for the more heavily indebted countries and other euro area economies. In the case of public borrowing, the risk premium on sovereign debt reached unsustainable levels, with rates, on a monthly average basis, of 2,700 basis points in Greece, 970 in Ireland, 1,200 in Portugal, 555 in Spain, and 520 in Italy. As the Exhibit shows, the situation in the distressed countries was very different from that among their peers, with an
-12-10-8-6-4-202468
10
Nominal GDP growth Public debt interest rate Primary balance
Exhibit 2Nominal GDP growth, public debt interest rate (10 year bond yield) and ratio of primary balance to GDP. Spain Percentages
Sources: IMF, Eurostat, Bank of Spain and INE.

Public debt sustainability: Spain in the European context
33
SEFO
- Sp
anish
Eco
nom
ic a
nd F
inan
cial
Out
look
Vol.
3, N
.º 2
(Mar
ch 2
014)
average figure of almost 1,000 bp in the former, compared with just 200 bp in the latter. Since the ECB’s action in the summer of 2012, when it announced its OMT programme, risk premiums have dropped considerably. Thus, at the end of 2013, the risk premium was 203 bp in Spain, 211 bp in Italy, 163 bp in Ireland, 345 bp in Portugal and 642 bp in Greece. This group was joined by Slovenia, with a risk premium of 297 bp.
The origin of the crisis, as has been repeated so often, is the accumulation of an excessive debt burden. In some cases, this debt overhang has been in the public sector and in others in the private sector. The common denominator, however, tends to be excessive net external debt (international investment position), as this is basically what worries investors when they begin to question an excessively indebted country’s ability to repay its debts.
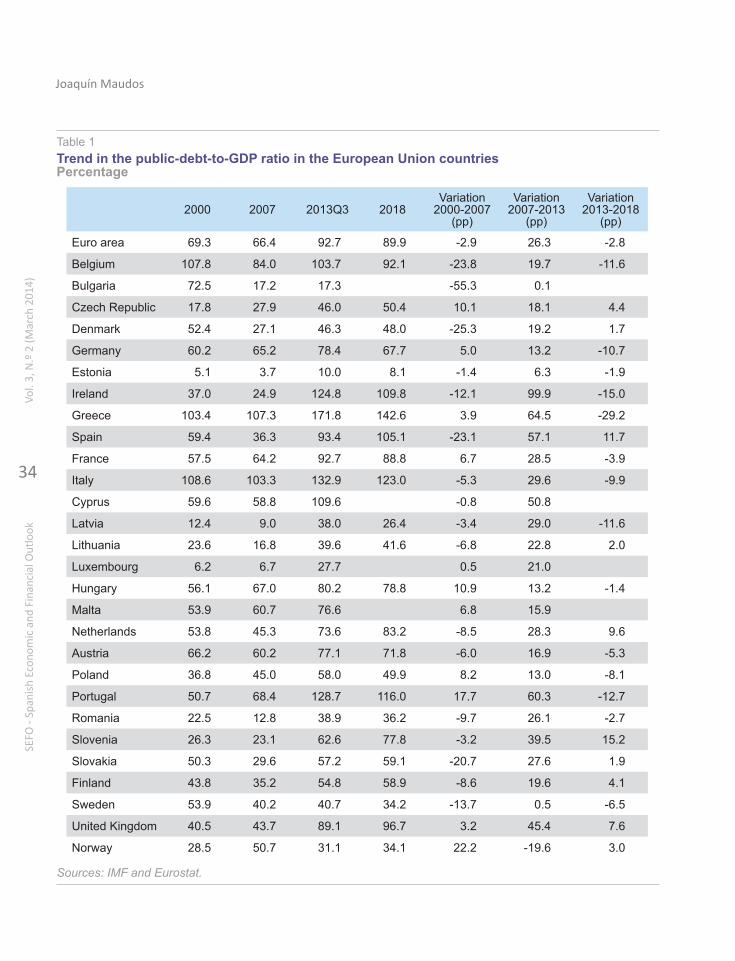
Table 1 shows how the debt-to-GDP ratio has changed in the case of public debt among the countries of the euro area over several sub-
periods: 2000 to the end of the expansion; from the start of the crisis in 2007 to 2013 (third quarter); and from 2013 to 2018, according to the IMF’s latest projections (October 2013). An analysis of the information allows the following messages to be highlighted:
■ Whereas during the pre-crisis growth period the debt-to-GDP ratio fell by 2.9 pp in the euro area, during the crisis, it rose by 26.3 pp. in the period up to 2013. Nevertheless, the trend has differed widely between countries. Thus, in Greece the increase was 64 pp, in Ireland it rose by 100 pp, in Portugal 66 pp, in Spain 57 pp, and in Italy 30 pp. By contrast, in Germany it rose by 13 pp and in Finland by 19.6 pp, for example. Spain is in fourth place in the EU in terms of growth in public debt since the start of the crisis. Outside the euro area, the 45 pp increase in the debt-to-GDP in the United Kingdom also stands out.
■ The IMF’s projections up to 2018 suggest that high public debt levels in some countries are set to persist, with Spain being the second country,
0
200
400
600
800
1,000
1,200
Jul-0
7S
ep-0
7N
ov-0
7Ja
n-08
Mar
-08
May
-08
Jul-0
8S
ep-0
8N
ov-0
8Ja
n-09
Mar
-09
May
-09
Jul-0
9S
ep-0
9N
ov-0
9Ja
n-10
Mar
-10
May
-10
Jul-1
0S
ep-1
0N
ov-1
0Ja
n-11
Mar
-11
May
-11
Jul-1
1S
ep-1
1N
ov-1
1Ja
n-12
Mar
-12
May
-12
Jul-1
2S
ep-1
2N
ov-1
2Ja
n-13
Mar
-13
May
-13
Jul-1
3S
ep-1
3N
ov-1
3
Euroarea Distressed countriesNon-distressed countries Spain
Exhibit 3Sovereign risk premium in the euro area countries. Spreads w.r.t. Germany (10 year bond yield) Basis points
Source: Eurostat.
Euro area
Joaquín Maudos
34
SEFO
- Sp
anish
Eco
nom
ic a
nd F
inan
cial
Out
look
Vol.
3, N
.º 2
(Mar
ch 2
014)
2000 2007 2013Q3 2018Variation
2000-2007 (pp)
Variation 2007-2013
(pp)
Variation 2013-2018
(pp)
Euro area 69.3 66.4 92.7 89.9 -2.9 26.3 -2.8
Belgium 107.8 84.0 103.7 92.1 -23.8 19.7 -11.6
Bulgaria 72.5 17.2 17.3 -55.3 0.1
Czech Republic 17.8 27.9 46.0 50.4 10.1 18.1 4.4
Denmark 52.4 27.1 46.3 48.0 -25.3 19.2 1.7
Germany 60.2 65.2 78.4 67.7 5.0 13.2 -10.7
Estonia 5.1 3.7 10.0 8.1 -1.4 6.3 -1.9
Ireland 37.0 24.9 124.8 109.8 -12.1 99.9 -15.0
Greece 103.4 107.3 171.8 142.6 3.9 64.5 -29.2
Spain 59.4 36.3 93.4 105.1 -23.1 57.1 11.7
France 57.5 64.2 92.7 88.8 6.7 28.5 -3.9
Italy 108.6 103.3 132.9 123.0 -5.3 29.6 -9.9
Cyprus 59.6 58.8 109.6 -0.8 50.8
Latvia 12.4 9.0 38.0 26.4 -3.4 29.0 -11.6
Lithuania 23.6 16.8 39.6 41.6 -6.8 22.8 2.0
Luxembourg 6.2 6.7 27.7 0.5 21.0
Hungary 56.1 67.0 80.2 78.8 10.9 13.2 -1.4
Malta 53.9 60.7 76.6 6.8 15.9
Netherlands 53.8 45.3 73.6 83.2 -8.5 28.3 9.6
Austria 66.2 60.2 77.1 71.8 -6.0 16.9 -5.3
Poland 36.8 45.0 58.0 49.9 8.2 13.0 -8.1
Portugal 50.7 68.4 128.7 116.0 17.7 60.3 -12.7
Romania 22.5 12.8 38.9 36.2 -9.7 26.1 -2.7
Slovenia 26.3 23.1 62.6 77.8 -3.2 39.5 15.2
Slovakia 50.3 29.6 57.2 59.1 -20.7 27.6 1.9
Finland 43.8 35.2 54.8 58.9 -8.6 19.6 4.1
Sweden 53.9 40.2 40.7 34.2 -13.7 0.5 -6.5
United Kingdom 40.5 43.7 89.1 96.7 3.2 45.4 7.6
Norway 28.5 50.7 31.1 34.1 22.2 -19.6 3.0
Table 1Trend in the public-debt-to-GDP ratio in the European Union countries Percentage
Sources: IMF and Eurostat.

Public debt sustainability: Spain in the European context
35
SEFO
- Sp
anish
Eco
nom
ic a
nd F
inan
cial
Out
look
Vol.
3, N
.º 2
(Mar
ch 2
014)
after Slovenia, in which the debt-to-GDP ratio is set to rise furthest (11.7 pp). In Germany, on the other hand, it is projected to drop by 10.7 pp.
■ More recently, the situation in the third quarter of 2013 shows a wide range of variation between countries, with a maximum value for the debt-to-GDP ratio of 171.8% in Greece and a minimum of 10% in Estonia. Of the major European economies, Italy is the most indebted, with public debt equivalent to 132.9% of GDP. The other distressed countries also have high debt ratios: 124.8% in Ireland and 128.7% in Portugal. Spain’s level of 93.4% is lower, but still above the euro area average of 92.7%. Germany (78.4%) is 14 pp below the euro area average and France is exactly in line with the average (92.7%).
Given the current public debt situation in Spain, and bearing in mind that the ultimate goal is to bring the debt-to-GDP ratio to below 60%, there is clearly a long way to go, all the more so bearing in mind that the ratio will continue to rise over the next few years. According to the IMF’s October 2013 forecasts, the ratio will reach 99% in 2014,
peak at 105.5% in 2017, then drop by just half a point in 2018. In this last year of the series (see Exhibit 4), the IMF’s projection is for Spain to have the sixth highest debt-to-GDP ratio in the EU, behind only the group of “distressed countries” (Ireland, Cyprus, Portugal, Italy and Greece).
Net external debt
The IMF paper by Reinhart and Rogoff referred to above also warns of the problems associated with the advanced economies’ excessive external debt and their consequent vulnerability. According to the paper, whereas the external debt of the advanced economies has quadrupled to levels of over 250% since the start of the growth cycle in the mid-nineties, that of the developing countries has steadily decreased and is currently around 30%. In some of these countries, the increase in external debt was driven by rapid credit growth.
However, the situation of greatest vulnerability arises when an economy has a high level of external debt in net terms, i.e., discounting its assets abroad. The analysis below therefore takes
0
20
40
60
80
100
120
140
160
Exhibit 4IMF forecasts (October 2013) for the public-debt-to-GDP ratio in 2018 in the EU countries Percentage
Source: IMF.

Joaquín Maudos
36
SEFO
- Sp
anish
Eco
nom
ic a
nd F
inan
cial
Out
look
Vol.
3, N
.º 2
(Mar
ch 2
014)
the net external debt (public and private), or net international investment position, as its reference. Basically, a country’s financial solvency depends not only on the public sector’s indebtedness, but
on the country’s net capacity (of both the public and private sectors) to repay its external debt. And it is the net position that determines the risk of lending to a country, which manifests itself in the differences in interest rates (risk premiums) between countries.
In the case of Europe, the intensity of the sovereign-debt crisis has made it necessary to
bail out the most heavily indebted countries, including both those with excessive public sector debt and those whose banks needed to be rescued. The common denominator in all the bailed out countries and those hardest hit by the crisis (with sharp rises in their risk premiums) is their economies’ high level of net external debt, with a large international investment deficit as a
percentage of GDP. As Table 2 shows, during the growth period ending in 2007, net external debt rose by between 46 and 56 pp in Greece, Portugal and Spain (together with Latvia and Bulgaria), with Spain coming in third place in the euro area in terms of the deterioration of its international investment position after several years of heavy external borrowing needs, as reflected in its large current account deficits. By contrast, net external debt decreased over the same period, in countries such as Germany, France, Austria, Sweden and Finland.
During the crisis, net external debt in a number of peripheral countries has continued to grow, with an increase of 107.7 pp in Cyprus, 87.1 pp in Ireland, 29.2 pp in Portugal, 20.9 pp in Greece, and 19.9 pp in Spain. There was also a notable increase in France’s net external debt, rising by 19.7 pp from 2007 to 2013. By contrast, in countries such as Germany, Denmark, the Netherlands, Austria, the United Kingdom, and Finland, the international investment position improved.
The most recent information referring to the third quarter of 2013 (with the exception of Italy, where the information refers to June 2013 and France and Malta, for which it refers to December 2012) shown in Exhibit 5 clearly reflects the way countries are divided into two groups, the distressed countries again being those with the largest external debt in net terms. The countries that have either been bailed out or had their banking sector rescued appear on the left of the chart. Spain, with a negative international investment position of 98% of GDP, is the fourth most heavily externally indebted country in the EU in net terms, surpassed only by the countries bailed out with European funds. By contrast, countries with a net lending position vis-à-vis the rest of the world are situated on the right-hand side of the chart. These include Luxembourg, the Netherlands, German, Denmark and Belgium. The euro area average international investment position is negative and represents 13% of GDP.
The common denominator in all the bailed out countries and those hardest hit by the crisis is their economies’ high level of net external debt, with a large international investment deficit as a percentage of GDP.
Basically, a country’s financial solvency depends not only on the public sector’s indebtedness, but on the country’s net capacity to repay its external debt. It is the net position that determines the risk of lending to a country, which manifests itself in the differences in risk premiums between countries.

Public debt sustainability: Spain in the European context
37
SEFO
- Sp
anish
Eco
nom
ic a
nd F
inan
cial
Out
look
Vol.
3, N
.º 2
(Mar
ch 2
014)
2000 2007 2013Q3 Variation 2000-2007 (pp)
Variation 2007-2013 (pp)
Euro area -7.3 -14.1 -13.3 -6.8 0.8Belgium 28.9 46.6 17.6Bulgaria -33.5 -81.1 -75.5 -47.6 5.6Czech Republic -8.6 -40.4 -49.1 -31.8 -8.7Denmark -14.3 -5.8 39.8 8.5 45.5Germany 3.3 26.5 46.1 23.2 19.6Estonia -48.2 -72.0 -50.6 -23.9 21.5Ireland -7.9 -19.5 -106.5 -11.5 -87.1Greece -39.6 -96.1 -117.0 -56.5 -20.9Spain -32.0 -78.1 -98.0 -46.1 -19.9France -7.6 -1.5 -21.1 6.1 -19.7Italy -7.2 -24.5 -27.8 -17.3 -3.3Cyprus 11.7 -96.0 -107.7Latvia -29.3 -75.1 -65.6 -45.8 9.5Lithuania -34.7 -55.8 -46.7 -21.1 9.1Luxembourg 95.5 132.5 37.0Hungary -71.2 -104.1 -96.1 -32.8 8.0Malta 5.4 17.7 24.8 12.3 7.0Netherlands -15.2 -6.0 50.6 9.2 56.6Austria -24.5 -18.2 2.3 6.3 20.5Poland -32.0 -52.8 -67.2 -20.8 -14.4Portugal -41.2 -87.9 -117.1 -46.7 -29.2Romania -22.2 -43.5 -62.8 -21.3 -19.3Slovenia -11.8 -21.8 -37.9 -10.0 -16.1Slovakia -23.1 -51.8 -64.1 -28.7 -12.3Finland -147.8 -27.9 14.5 119.9 42.4Sweden -33.4 -1.4 -4.5 31.9 -3.1United Kingdom -9.5 -21.1 6.2 -11.6 27.3
Table 2Net international investment position as percentage of GDP
Note: Data for Italy from June 2013 and data for Malta and France from December 2012.Source: Eurostat.
As Exhibit 6 shows, net external debt is a clear determinant of the level of the interest rates the country has to pay on its borrowings. Thus, based
on the most recent data available, the correlation between the international investment position (as a percentage of GDP) and the interest rate

Joaquín Maudos
38
SEFO
- Sp
anish
Eco
nom
ic a
nd F
inan
cial
Out
look
Vol.
3, N
.º 2
(Mar
ch 2
014)
on a ten-year bond is 77%. Moreover, given the close correlation between the sovereign debt risk premium and interest rates on bank loans
(given the current fragmentation of the European financial market), distressed countries’ high levels of external debt ultimately penalize them by raising
-120
-70
-20
30
80
130
Exhibit 5Net international investment position as percentage of GDP Third Quarter 2013
Note: Data for Italy from June 2013 and data for Malta and France from December 2012.Source: Eurostat.
PT
GR
IEES IT
FRSE
AT
UK FIDK
DE
BE
NL
LU
y = -0.024x + 3.3456R² = 0.5897
0
2
4
6
8
10
12
-150 -100 -50 0 50 100 150
Sec
onda
ry m
arke
t yie
lds
of g
over
nmen
t bo
nds
(ten
year
s)
Net international investment position/GDP (%)
Exhibit 6Net international investment position (% GDP) and public debt interest rate in the EU countries September 2013
Note: Data for Italy from June 2013 and data for Malta and France from December 2012.Source: Eurostat.

Public debt sustainability: Spain in the European context
39
SEFO
- Sp
anish
Eco
nom
ic a
nd F
inan
cial
Out
look
Vol.
3, N
.º 2
(Mar
ch 2
014)
their cost of accessing international finance. It is therefore essential that these countries raise savings domestically to finance their investments (i.e., generate a surplus on their current account balances), a process to which the public sector has to contribute by reducing the public deficit.
Growth, net external debt, and fiscal adjustment: A difficult balancing act
Achieving the desired objective of situating the public debt-to-GDP ratio below 60% requires the implementation of permanent long-term fiscal consolidation measures, given that the poor outlook for GDP growth, at rates below the interest rate on debt in the coming years, demands primary surpluses that will be hard to achieve in the medium term.
Not only does the public sector need to undertake reforms to achieve these primary surpluses, but the private sector also has to play its part by providing the financing capacity to reduce the economy’s high level of external debt. Indeed, the latest European Commission report on macroeconomic imbalances in European countries acknowledges the progress Spain has made towards correcting these imbalances, but warns that risks persist, which may affect growth and consequently financial stability, apart from the
alarming levels of unemployment, and high levels of domestic and external public and private debt.
If Spain improves its currently high international investment deficit position by progressively consolidating the current account surplus first achieved in 2013 after decades of deficits, international investors’ confidence could be further improved, making borrowing available at lower rates. Bringing down the cost of borrowing is essential not only to help keep the public debt sustainable (this being one of its determinants, as noted above), but also to reactivate the investment that is the key to generating jobs.
In short, budgetary discipline is necessary both to ensure debt sustainability and enable the economy´s return to growth. This difficult balancing act of achieving growth in a context of budgetary constraints would be aided by faster progress towards banking union, as the market is currently fragmented and the cost of borrowing in the distressed countries is excessive relative to the euro area as a whole. Fortunately, this gap has narrowed in recent months as the sovereign debt risk premium has dropped, and this has also helped reduce the burden of public debt (and therefore the deficit) and the cost of borrowing for households and businesses.
References
ReinhaRt, C. and K. Rogoff (2013), “Financial and Sovereign Debt Crises: Some Lessons Learned and Those Forgotten”, WP/13/266, IMF Working Paper, December.
If Spain improves its currently high international investment deficit position by progressively consolidating the current account surplus first achieved in 2013 after decades of deficits, international investors’ confidence could be further improved, making borrowing available at lower rates.
