public and private schools in rural...
TRANSCRIPT

Public and Private Schools in Rural India Karthik Muralidharan1
Michael Kremer1
March 22, 20062
1 Department of Economics, Harvard University. Please address correspondence to
[email protected] or to [email protected]
2 We thank Nazmul Chaudhury, Jeffrey Hammer, and Halsey Rogers for their collaboration and insights on
the global study that generated the data that this paper is based on, and Konstantin Styrin for valuable
research assistance. We offer thanks to the staff of the Social and Rural Research Institute, New Delhi –
and especially to Chhavi Bhargava, Navendu Shekhar, A V Surya, and Aditi Varma – for conducting and
overseeing the fieldwork for the primary surveys. We also thank participants at the PEPG conference and
Rajashri Chakrabarti and Paul Peterson for comments and suggestions. All errors are our own.

Abstract: This paper presents results from a nationally-representative survey of rural
private primary schools in India conducted in 2003. 28% of the population of rural India
has access to fee-charging private schools in the same village. Nearly 50% of the rural
private schools in our sample having been established 5 or fewer years before the time of
the survey, suggesting rapid growth in the number of private schools. Private schools are
more common in areas with poor public school performance. Richer states are less likely
to have rural private schools. Compared to public schools, private schools pay much
lower teacher salaries; have lower pupil teacher ratios; and less multi-grade teaching.
Private school teachers are 2 to 8 percentage points less likely to be absent than teachers
in public schools and 6 to 9 percentage points more likely to be engaged in teaching
activity at any given point in time. They are more likely to hold a college degree than
public-school teachers, but much less likely to have a formal teacher training certificate.
Children in private school have higher attendance rates. They have higher test scores,
even after controlling for observable family and school characteristics.
2

1. Introduction
While the focus of primary education policy in developing countries such as India has
largely centered on increasing the resource base and the number of government-run
schools, the role of private fee-charging schools in the primary education sector has not
been appreciated as much. However as several recent papers point out (Kingdon (1996),
PROBE Report (1999), De et al (2001), Tooley and Dixon (2003), and Mehta (2005))
there is reason to believe that private fee-charging schools increasingly cater to a
substantial fraction of the primary-school going population in India. Most research on
this subject to date comes from small-sample studies at the state or district-levels.3
This paper presents results from a nationally-representative survey of rural private
primary schools in India that we conducted in 2003. 28% of the population of rural India
has access to fee-charging private schools in the same village. Richer states have fewer
rural private schools. States, districts, and villages with poor public school performance
are each more likely to have private schools. Nearly 50% of the rural private schools in
our sample were established 5 or fewer years before the survey, and nearly 40% of
private-school enrollment is in these schools. This suggests rapid expansion of private
schooling, although it could also in part reflect turnover among schools in the sector.
3 Notable among these are Bashir (1994) in Tamilnadu, Kingdon (1996b) in Lucknow (Uttar Pradesh),
Govinda and Varghese (1993) in Madhya Pradesh, Tooley and Dixon (2003) in Hyderabad (Andhra
Pradesh) and Mehta (2005) in Punjab. As Kingdon (1996a) mentions, “given inter-state variations in the
structure and organization of education in India, evidence from a single state will be illustrative but not
necessarily representative.”
3

Private-school teacher salaries are typically one-fifth the salary of regular public-
school teachers (and are often as low as one-tenth of these salaries). This enables the
private schools to hire more teachers, have lower pupil teacher ratios, and reduce multi-
grade teaching. Private school teachers are significantly younger and more likely to be
from the same area as their counterparts in the public schools. They are 2-8 percentage
points less absent than teachers in public schools and 6-9 percentage points more likely to
be engaged in teaching activity at any given point in time. They are more likely to hold a
college degree than public-school teachers, but are however much less likely to have a
formal teacher training certificate. Children in private school have higher attendance
rates and superior test score performance, with the latter being true even after controlling
for family and school characteristics.
Section 2 outlines the sampling methodology and how the data was collected.
Section 3 presents results on the extent of private school prevalence and correlates of
private school existence. Section 4 discusses the economics of private unaided schools
and their sources of competitive advantage by comparing them with public schools on
various measures including infrastructure, teacher characteristics, student characteristics,
and student performance. Section 5 concludes.
2. Sampling Methodology and Data
The data used in this paper were collected as part of a multi-country study
conducted by us and co-authors on provider absence in schools and health clinics where
India was one of the countries studied (the detailed results from the cross-country study
4

are presented in Chaudhury, Hammer, Kremer, Muralidharan, and Rogers (2005)).4
Within India, 20 states were selected, representing 98 percent of the population, or
roughly one billion people. Using geographically stratified random sampling, 10 districts
were selected within each state and 10 Primary Sampling Units (PSUs) were selected in
each district. The PSUs were allocated to rural and urban sectors in accordance with the
population distribution within each sampled district5. Rural PSUs (villages) within a
sampled district were selected randomly without replacement with probability
proportional to size (PPS)6.
The survey focused on government7 primary8 schools but also covered rural
private schools in villages where they existed. In the rural sample, we covered all the
4 See Chaudhury et al (2005) for detailed results from the cross-country study.
5 Thus a district with 90% of its population in rural areas would have 9 rural PSUs and 1 urban PSU,
whereas a completely urban district (as is the case when the randomly picked district is the state capital for
example) would have 10 urban PSUs.
6 See Appendix A of Kremer et al (2004) for a detailed description of the sampling procedure.
7 The definitions of school categories that we use are similar to those detailed in the companion paper in
this volume by Kingdon. The term “government school” refers to government-funded schools that are run
by the government but does not include the government-aided schools that are privately managed. The
terms “public schools” and “government schools” are used interchangeably in this paper. The “private
schools” referred to in the rest of this paper include both recognized and unrecognized private schools that
charge fees and do not receive any financial support from the government. They do not include the
“private-aided schools” which are privately managed schools that receive funding from the government,
and are typically forbidden from charging user fees.
8 Covering grades 1-5 in most states, and grades 1-4 in some states, depending on the classification of
primary schools in the concerned state. The focus of the study was completely on primary schools, and so
the usage of the term “school” should be understood to mean primary school unless stated otherwise.
5

primary schools in the village subject to a maximum of 3 (the maximum number of
schools that could be covered during one day in the field). When the investigators
reached the village, they listed all the schools present within a radius of 2 kilometers from
the village center. In villages with less than 3 schools, all the schools were covered. In
villages with more than 3 schools, we surveyed 3 schools, randomly selecting one school
in each of the three main categories of rural schools (Government schools, Private
Schools, and Non-Formal Education Centers). In cases where there was no non-formal
school, but more than 3 schools in the village, we selected 2 government schools and 1
private school or 1 government school and 2 private schools (the latter was the case only
if there was only one government primary school but more than 2 private schools in the
village).
Thus in addition to being representative of government-run primary schools, our
dataset is also representative of the universe of private unaided primary schools in rural
India because we surveyed at least one private school in any village that had at least one
private school. As noted by Kingdon (2005) (the companion paper in this volume), there
are 2 main kinds of private unaided schools – recognized and unrecognized. While
government surveys only include the recognized private schools, our random selection
method is indifferent to the “recognition” status of the school and our sample therefore
includes both types of schools. Furthermore, the random selection of schools within a
village ensures that the distribution of school types in our sample is a reflection of the
distribution of school types in the population. 51% of the private schools in our sample
6

are “unrecognized” suggesting that official sources of data on private schools
significantly understate the extent of private school prevalence9.
Enumerators made 3 unannounced visits to each selected school over a 3 to 4-
month time period from December 2002 to March 2003. We measured teacher absence
in all surveyed schools by physically verifying the presence of teachers on the school
roster. In addition to recording teacher attendance we also collected data on student
attendance, school facilities, and teacher characteristics. We also administered a short
test10 to 10 randomly selected 4th grade children and collected basic demographic
information on these children in all the schools that we surveyed.
3. Private School Prevalence and its Correlates
28% of the villages in our sample have a private school. Since the villages were
sampled on a probability proportional to size basis (PPS), this implies that 28% of the
population of rural India has access to a private school in the same village in which they
live. But there is sharp variation in the prevalence of private schools across states with
Gujarat and Maharashtra having almost no rural private schools, while over 50% of the
sampled villages in Rajasthan, Bihar, Uttar Pradesh, Punjab, and Haryana have a private
school in the same village (Table 1). Recent household-survey based evidence presented
in the ASER Report (2005) confirms the increasing role of private schooling in rural
9 Unrecognized schools are also more recently established with an average age of 7.6 years as opposed to
recognized private schools with an average age of 9.9 years.
10 See Appendix B of Kremer et al (2004) for a detailed description of the test as well as the procedure by
which it was administered, graded, and coded
7

India by showing that 15.5% of children aged 6-10 in rural India attend a private school
and that over 20% of the children in this group attend a private school in several states.11
Table 2 presents results from OLS regressions where the binary variable of private-
school existence (at the village level) is regressed on potential predictors of private-
school existence. The first column includes the log of the village population, the log of
the mean pupil-teacher ratio in the public schools in the village, and the mean level of
teacher absence12 in the public schools in the village. The second column includes state
fixed effects. The third column replaces the state dummies with the log of state per
capita GDP. The fourth column includes district level estimates of mean per capita
consumption calculated from the 55th round of the National Sample Survey13, and the
fifth column includes district level consumption as well as state fixed effects14.
Villages with larger populations are significantly more likely to have a private school
in all specifications. The most noteworthy result is that private schools are significantly
more likely to exist in villages with high teacher absence in public schools. While the
11 These states include Andhra Pradesh, Haryana, Kerala (including private aided schools), Punjab,
Rajasthan, and Uttar Pradesh
12 A teacher was considered to be absent if, at the time of a random visit during school hours, he or she
could not be found anywhere in the school premises. See Chaudhury et al (2005) and Kremer et al (2005)
for details on how absence and teaching activity were measured and on the various steps we took to
measure these accurately.
13 We thank Petia Topalova for making her calculations of district-level consumption estimates available to
us. See Topalova (2005) for details on these calculations.
14 Robust standard errors clustered at the state level are reported for specifications with state-level right
hand side variables and likewise for district-level variables, where the standard errors are clustered at the
district level.
8

relation is very strong across Indian states, it is still significant at the 10% level after
controlling for state fixed-effects, and remains significant in all specifications. The
surprising result is that states with a higher per capita income are less likely to have
private schools in their villages. While a high Pupil-Teacher Ratio (PTR) in the public
schools in the same village is a predictor of private school existence across India, the
correlation is not significant with either state income controls or state fixed effects,
suggesting that the PTR in public schools is negatively correlated with the per-capita
GDP of the states. The final column shows that when we include state-fixed effects,
richer districts are less likely to have a private school, though villages with high public-
school teacher absence are more likely to have a private school.
Chaudhury et al (2005) shows that higher-income countries and richer Indian states
have significantly lower rates of teacher absence in schools. Thus if private schools arise
as a response to public school failure, we might expect richer states to have fewer private
schools. On the other hand, since private schooling is likely to be a normal good we
might expect the prevalence of private schools to be higher in the richer states.
The correlation between public school failure (as measured by teacher absence and
non-teaching activity) and the likelihood of the existence of private schools can be seen
clearly in Figures 1a and 1b. While the two states with the highest incidence of private
schools (Punjab and Haryana) happen to be among the richer states of India, it is quite
striking that the two states with the lowest level of teacher absence in public schools
(Gujarat and Maharashtra) have almost no rural private schools, even though these are
two of the richest states in India.
9

Table 3 shows some more evidence regarding this by comparing teacher absence rates
across different kinds of schools in India. The first column of Table 3 shows the
weighted average teacher absence by school type across the full sample of schools.
Columns 3-5 show the difference in teacher absence relative to the government-run
schools. While the weighted average all-India teacher absence in private schools of
22.8% is slightly lower than that of the 25.2% in government schools, this difference is
not significant. However, with the addition of village/town fixed effects, the teacher
absence rate is 3.8% lower in private schools relative to government schools and this is
significant at the 1% level. The addition of school, teacher demographics, and visit-level
controls increases this difference to 7.8% which is over 30% of the observed absence rate
in government schools (25.2%). This suggests that private schools are disproportionately
located in areas with poorly performing public schools and that the efficiency of the
private school (at least as measured by teacher absence) is even higher after controlling
for school facilities (which are negatively correlated with teacher absence) and teacher
demographics.
The higher prevalence of private schools in villages with high absence among public
school teachers could be interpreted as suggesting that private schools enter where public
schools are failing or as evidence that the establishment of private schools reduces
political pressure for teacher attendance in public schools. However, to the extent that
one might expect higher income states to have more private schools, the finding that
richer areas have fewer private schools suggests that the relationship is more likely to be
driven by endogenous entry of private schools in areas with poorly performing public
schools.
10

Finally, it is noteworthy that there is some evidence that large-scale prevalence of
rural private schools is a recent phenomenon. This is suggested in previous studies of
specific states such as De et al (2001), and Mehta (2005), but we are able to confirm this
on a nationwide basis. Figure 2 plots the CDF of private school formation and
enrollment over time, and we see that nearly 50% of the private schools in the sample
have been established in the 5 years before the survey. Nearly 40% of the total private-
school enrollment is in schools that were less than 5 years old and over 60% of total
enrollment is in schools that were less than 10 years old in 2003. Of course, these
numbers will exceed the net increase in private school enrolment to the extent that other
private schools exited over the period.
4. Economics of Rural Private Schools
4.1 School Infrastructure
Table 4 presents summary statistics on school infrastructure in public and private
schools. While private schools are more likely to have an electricity connection and
toilets for teachers, they are less likely to have libraries (book banks) and classrooms
without mud floors. On aggregate there doesn’t appear to be a significant difference in
the infrastructure index between private and public schools, but the results with state and
with village fixed effects suggest that conditional on being in the same village, private
schools have poorer facilities and infrastructure than the public schools.
4.2 Sources of Competitive Advantage of Private Schools
Probably the single most distinguishing feature of the private schools in rural India is
the fact that they pay much lower salaries to teachers than the government schools.
11

While we don’t directly collect data on teacher salaries, we have data on the various fees
charged by each school in our sample along with the total enrollment, which allows us to
estimate the monthly revenue for the private schools (since they typically don’t receive
any funding beyond what they raise in school fees). Median monthly revenue of a
private school in our sample is around Rs. 4,000 per month15, with the median fee being
Rs. 63 per month and the median private school having an enrollment of 72 students.
We can calculate an upper bound for teacher salaries in private schools assuming that
all the revenues of the private schools are used to pay teacher salaries. We calculate the
upper bound on median teacher salary to be less than Rs. 1,000 per month and the upper
bound on the mean teacher salary to be less than Rs. 1,750 per month. The mean salary
for a regular government school teacher in a typical state like Andhra Pradesh (where we
have actual salary data16) is around Rs 7,500 per month. We can see that the typical total
monthly revenue of a private school is often less than the monthly salary of one
government school teacher. Even conservatively, rural private school teacher salaries are
typically around one fifth that of regular government teacher salaries and they are often
as low as one tenth the salaries of regular government teachers. This allows the private
schools to hire more teachers, reduce multi-grade teaching, and have significantly lower
pupil-teacher ratios.
15 The approximate exchange rate at present is Rs. 45 = 1 US Dollar
16 Direct data on teacher salaries in Andhra Pradesh has been collected in a different ongoing study by one
of the authors. The salary figures would be even higher if we included benefits, the largest portion of
which is the present value of a defined benefits retirement pension. Private school teachers typically
receive no benefits.
12

Table 5 clearly demonstrates these points. The average pupil teacher ratio (PTR) in
the private schools of 19.2 is less than half the ratio of 43.4 in public schools. This gap of
24.3 widens to 29.6 with state fixed effects, and to 34.4 with village fixed effects. Thus
conditional on being in the same village, the private school has nearly 35 fewer pupils per
teacher than the government school in the same village. Doing the calculation using logs,
we find that the PTR of a public school is 2.85 times higher than the PTR of a private
school in the same village. The lower PTR in the private schools also translates into
lower levels of multi-grade teaching (the practice of one teacher simultaneously teaching
multiple grades in the same room).
Field interviews with parents of children attending rural private schools suggest that
two of the major attractions of private schools are the fact that they start teaching English
early, and that there is more teaching activity in these schools. The last two rows of
Table 5 confirm that these differences do exist. Private schools on average start to teach
English a whole grade earlier, with the effect being even more pronounced with state and
village fixed effects. Private schools also have significantly more teaching activity going
on, and again the magnitude of the difference increases with state and village fixed
effects.
One reason for this is likely to be that head teachers in private school are much more
likely (and able) to take disciplinary action against shirking teachers than their
counterparts in the public schools. We found that only 1 head teacher in the nearly 3000
public schools we surveyed reported ever dismissing a teacher for repeated absence17.
17 See Kingdon and Muzamil (2001) for more details on the power of public-school teacher unions and how
this has evolved over the years (based on a case study of the state of Uttar Pradesh)
13

On the other hand, 35 head teachers in a sample of around 600 private schools reported
having at some point dismissed a teacher for repeated absence and so shirking teachers in
the private sector are around 175 times more likely to have disciplinary action taken
against them!
If we consider the cases with village fixed effects (which is the relevant case when
considering the choice faced by a parent with regard to choosing between a private and
public school in the same village), we see that combining the effects of a lower pupil-
teacher ratio and a higher level of teaching activity leads to a child in the private school
having 3-4 times more “teacher-contact” time than in the public school.
The better performance of the private schools is also reflected in the fact that student
attendance rates are also substantially higher in private schools (as seen in the last row of
Table 5). Pupil attendance is 11.3% (percentage points) higher in the all-India sample,
and 13.4% higher with village fixed effects. If we think that the true measure of the
relative role of the private and public sectors is attendance as opposed to enrollment, then
the true share of rural children taught in the private sector will be even higher after
adjusting for the differential attendance rates.
4.3 Teacher Characteristics
A key question that follows the discussion on teacher pay in private schools is that of
understanding who the private school teachers are, and the reasons for their being willing
to work at such low salaries. Field visits suggest that the availability of these inexpensive
teachers in the villages is being driven by local educated youth who are typically unable
to find jobs, unwilling (and usually not needed) to work in agriculture, and not looking at
14
teaching as a long-term career. Teaching suits these youth well because the short
working day of 4-6 hours allows them the time for further study via correspondence
(distance-education) courses or in colleges that follow a different shift. The short
working days also allow them to look for other longer-term jobs on the side and finally
teaching provides them with both income and respectability while they also look at other
long-term options.
Table 6 provides summary statistics consistent with this view. The private school
teachers are on average over 10 years younger than their counterparts in the public sector
and are twice as likely to be from the same village where the school is located. They are
more likely to have a college degree but also much less likely to have a professional
teaching certificate, which suggests that even though they are more educated, they are not
looking at teaching as a long-term career option.
This probably helps to explain why teacher absence is not even lower in the private
schools given the high likelihood of action being taken for repeated absence. Since the
private-school teachers are being paid a much lower wage and are often looking at other
long term options, there is little “efficiency wage” cost of being fired. Thus, if pursuing
other opportunities requires a certain level of absence (and an accompanying probability
of action being taken) this is a trade off that the private school teachers are probably
willing to make. However, in spite of the low wages, we see that private schools have
lower teacher absence and higher teaching activity than the public schools – especially in
the same village.
15

4.4 Parent Characteristics
Given that public schools are free of cost and private schools charge fees we would
expect that the students attending the private schools come from more socio-
economically privileged backgrounds. Based on the random sample of children in the 4th
grade who we test and whom we collect demographic information on, we can compare
the family backgrounds of children in both types of schools. Table 7 provides these
comparisons and as we would expect, the children attending private schools come from
more advantaged family backgrounds. They have more educated parents and indicate
possessing a higher level of assets. However, it is worth noting that the absolute level of
education of the parents of the children attending private schools is actually quite low.
For instance, 20% of the private school students are first generation learners, which while
lower than the 30% in public schools, is still quite significant. Thus while private schools
cater to the better off in the rural areas, many of their students come from disadvantaged
backgrounds. This is consistent with the results of Tooley and Dixon (2003) who
mention that the majority of private schools in India cater to the poor (though their
observation is based on an urban study) and the findings reported by Andrabi et al (2002)
that private schools in rural Pakistan are affordable to middle and even low income
groups.
4.5 Performance of Private Schools
As discussed earlier, private schools have lower teacher absence and higher levels of
teaching activity. They also exhibit significantly superior performance on the test that
was administered. Table 8 shows the test score performance advantage of private schools
(in standard deviations). While controlling for family and other characteristics reduces
16

the size of the “private school” effect, it is still strongly significant and of considerable
magnitude (0.4 standard deviations on the test). Of course, we cannot rule out that some
of these results are being driven by unobserved heterogeneity among the students.
Similarly, as discussed earlier, student attendance is around 11 percentage points higher
in the private schools (75%) relative to the public schools (64%). This could partly be
due to artificially inflated enrollment figures in the government schools.
5. Conclusions
We find that private unaided fee-charging schools are widespread in rural India,
particularly in areas where the public system is dysfunctional. The number of such
schools appears to be growing rapidly with both demand-side variables (desire for
English-medium education, less multi-grade teaching, smaller classes, more accountable
teachers) and supply-side variables (availability of educated unemployed youth) playing
an important role in this rapid growth. Salaries paid by these schools are only about one-
fifth of those paid by public schools, but these schools have many more teachers relative
to the number of pupils, and the private-school teachers are more likely to be teaching
than public school teachers.
Our results have a number of implications. First, efforts to improve the quality of
education in India should consider the private as well as public sector – especially since
the former are disproportionately located where the public system is failing. For
example, policy makers might consider the possibility of offering short training courses
to raise skills among private school teachers.
17

Second, the disparities between private and public schools highlight some potential
areas for reform in the public sector. The huge salary differential suggests that many
public school teachers may be receiving enormous rents.
Finally, there may be scope for public private partnerships in education, whether in
the form of voucher programs or otherwise. One issue with voucher programs is whether
there will be an adequate supply response, but the evidence suggest that private schools
are already widespread in rural areas and that new schools can be created rapidly.
There is substantial scope for carefully-designed policy experiments aimed at
leveraging the private sector for universal quality education, and it is important to follow
these experiments with rigorous evaluation to provide systematic evidence for future
policy decisions in this regard. The recent draft of the “Right to Education Bill” that is
expected to be introduced in Parliament mandates that 25% of seats in private educational
institutions be reserved for “weaker sections” of society. It also goes on to say that for
each such admitted child, the “government shall reimburse to the school at a rate equal to
the per-child expenditure in state schools/fully aided schools, or the actual amount
charged per student by such school, whichever is less”. The discussion around this
legislation would be an opportune moment to think about the most efficient institutional
forms for delivery of primary education in India.
18
References
Andrabi, Tahir, Jishnu Das, and Asim Khwaja. 2002. “The Rise of Private Schooling in Pakistan: Catering to the Urban Elite or Educating the Rural Poor?” Mimeo, Kennedy School of Government, Harvard University
Annual Status of Education Report (ASER). 2005. Pratham Resource Center Bashir, Sajitha. 1994. “Public versus Private in Primary Education: Comparison of
School Effectiveness and Costs in Tamilnadu”. PhD Dissertation, London School of Economics
Chaudhury, Nazmul, Jeffrey Hammer, Michael Kremer, Karthik Muralidharan, F. Halsey
Rogers. 2005. “Missing in Action: Teacher and Health Worker Absence in Developing Countries”, forthcoming in Journal of Economic Perspectives
De, Anuradha., Claire Noronha and Meera Samson. 2001. “India: Private Schools and
Universal Elementary Education.” South Asia Education Sector, Technical Working Paper No. 3. World Bank
De, Anuradha., Manabi Majumdar, Claire Noronha and Meera Samson. 2002 “Private
Schools and Universal Elementary Education” in R. Govinda ed. India education report – a profile of basic education. New Delhi: OUP, 2002.
Govinda, R., and Varghese, N. V. 1993. Quality of primary schooling in India: a case
study of Madhya Pradesh, International Institute for Educational Planning, National Institute of Educational Planning and Administration.
Kingdon, Geeta, 1996a. “The quality and efficiency of private and public education: a
case study of urban India”, Oxford Bulletin of Economics and Statistics, 58.1, 57-81 Kingdon, Geeta, 1996b. “Private Schooling in India: Size, nature and equity effects”,
Economic and Political Weekly, 31, No. 51, December 1996. Kingdon, Geeta Gandhi and Mohd Muzammil. 2001. “A Political Economy of Education
in India- I: The Case of UP” Economic and Political Weekly, 36, No. 32, August 11-18, 2001
Kremer, Michael, Karthik Muralidharan, Nazmul Chaudhury, Jeffrey Hammer, and F.
Halsey Rogers. 2004. "Teacher Absence in India." World Bank: Washington, DC. Kremer, Michael, Karthik Muralidharan, Nazmul Chaudhury, Jeffrey Hammer, and F.
Halsey Rogers. 2005. “Teacher Absence in India: A Snapshot” Journal of the European Economic Association, Volume 3, pp 658-667.
19
Mehta, Arun. 2005. “Elementary Education in unrecognized schools in India: A study of
Punjab based on DISE 2005 data” NIEPA, New Delhi PROBE Team. 1999. Public Report on Basic Education in India. New Delhi: Oxford
University Press. Shah, Parth. 2005. “Equity in Education”. Business Standard, July 13, 2005 Tooley, James and Pauline Dixon. 2003. Private Schools for the Poor: A Case Study from
India, CfBT Research and Development Topalova, Petia. 2005. “Trade Liberalization, Poverty, and Inequality: Evidence from
Indian Districts,” NBER Working Paper 11614
20

Table 1Private School Prevalence by State
State % of Villages with a private school State % of Villages with
a private school
Gujarat 0% Andhra Pradesh 30%Maharashtra 1% Uttranchal 30%Orissa 4% Tamil Nadu 31%Kerala 6% Assam 33%Karnataka 12% Rajasthan 52%Chhatisgarh 15% Bihar 54%Himachal Pradesh 15% Uttar Pradesh 57%West Bengal 16% Punjab 65%Jharkhand 17% Haryana 68%Madhya Pradesh 23% All India 28%
Table 2
Correlates of Private School Existence at the Village LevelDependent Variable = 1 if Village Has a Private School, 0 if it does not
[1] [2] [3] [4] [5]
Log Village Population 0.114 0.157 0.125 0.11 0.159[0.012]*** [0.014]*** [0.037]*** [0.018]*** [0.017]***
Log Pupil Teacher Ratio 0.089 0.042 0.034 0.1 0.037[0.022]*** [0.026] [0.051] [0.031]*** [0.027]
Mean Public School Absence in Village
0.292 0.114 0.214 0.303 0.108[0.065]*** [0.060]* [0.103]* [0.074]*** [0.053]**
Log State GDP/Capita -0.298[0.157]*
Log District Consumption/Capita
0.07 -0.121[0.076] [0.059]**
Constant -0.962 -1.065 0.851 -1.39 -0.352[0.101]*** [0.117]*** [0.975] [0.480]*** [0.366]
State Fixed Effects No Yes No No Yes
Observations 1523 1523 1450 1523 1523R-squared 0.1 0.33 0.12 0.1 0.33Robust standard errors in brackets* significant at 10%; ** significant at 5%; *** significant at 1%
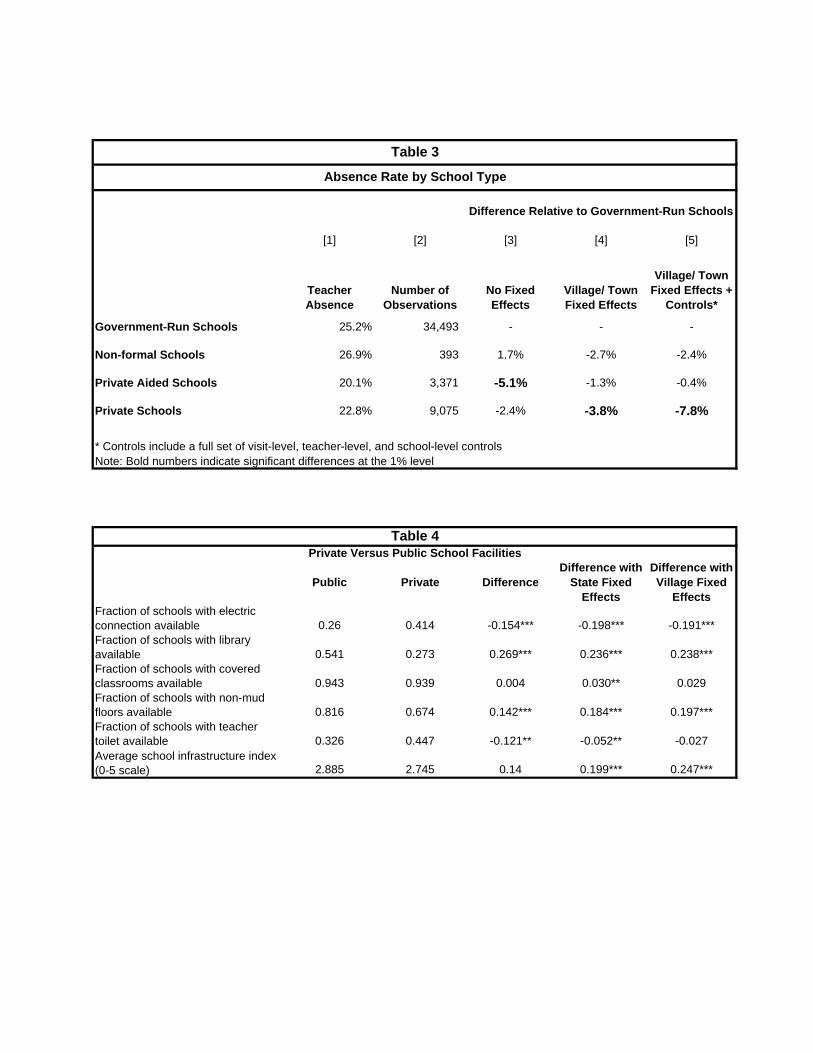
Table 3
Absence Rate by School Type
Difference Relative to Government-Run Schools
[1] [2] [3] [4] [5]
Teacher Absence
Number of Observations
No Fixed Effects
Village/ Town Fixed Effects
Village/ Town Fixed Effects +
Controls*
Government-Run Schools 25.2% 34,493 - - -
Non-formal Schools 26.9% 393 1.7% -2.7% -2.4%
Private Aided Schools 20.1% 3,371 -5.1% -1.3% -0.4%
Private Schools 22.8% 9,075 -2.4% -3.8% -7.8%
* Controls include a full set of visit-level, teacher-level, and school-level controlsNote: Bold numbers indicate significant differences at the 1% level
Table 4Private Versus Public School Facilities
Public Private DifferenceDifference with
State Fixed Effects
Difference with Village Fixed
EffectsFraction of schools with electric connection available 0.26 0.414 -0.154*** -0.198*** -0.191***Fraction of schools with library available 0.541 0.273 0.269*** 0.236*** 0.238***Fraction of schools with covered classrooms available 0.943 0.939 0.004 0.030** 0.029Fraction of schools with non-mud floors available 0.816 0.674 0.142*** 0.184*** 0.197***Fraction of schools with teacher toilet available 0.326 0.447 -0.121** -0.052** -0.027Average school infrastructure index (0-5 scale) 2.885 2.745 0.14 0.199*** 0.247***
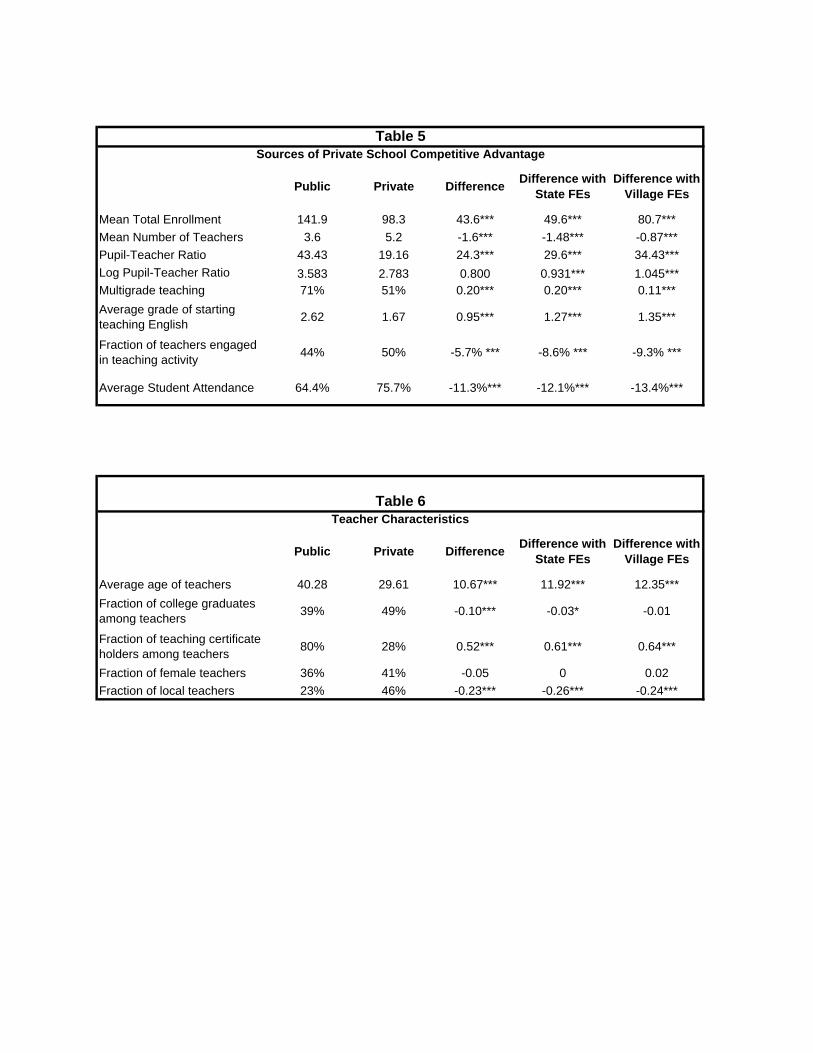
Table 5Sources of Private School Competitive Advantage
Public Private Difference Difference with State FEs
Difference with Village FEs
Mean Total Enrollment 141.9 98.3 43.6*** 49.6*** 80.7***Mean Number of Teachers 3.6 5.2 -1.6*** -1.48*** -0.87***Pupil-Teacher Ratio 43.43 19.16 24.3*** 29.6*** 34.43***Log Pupil-Teacher Ratio 3.583 2.783 0.800 0.931*** 1.045***Multigrade teaching 71% 51% 0.20*** 0.20*** 0.11***Average grade of starting teaching English 2.62 1.67 0.95*** 1.27*** 1.35***
Fraction of teachers engaged in teaching activity 44% 50% -5.7% *** -8.6% *** -9.3% ***
Average Student Attendance 64.4% 75.7% -11.3%*** -12.1%*** -13.4%***
Table 6Teacher Characteristics
Public Private Difference Difference with State FEs
Difference with Village FEs
Average age of teachers 40.28 29.61 10.67*** 11.92*** 12.35***Fraction of college graduates among teachers 39% 49% -0.10*** -0.03* -0.01
Fraction of teaching certificate holders among teachers 80% 28% 0.52*** 0.61*** 0.64***
Fraction of female teachers 36% 41% -0.05 0 0.02Fraction of local teachers 23% 46% -0.23*** -0.26*** -0.24***

Table 7Household Characteristics
Public Private Difference Difference withstate FEs
Difference
with village FEs
Average Number of Rooms in House 2.423 2.914 -0.742*** -0.574*** -0.560***Average fraction of children taking tuition 0.169 0.212 -0.043*** -0.041*** -0.066***% of literate fathers 0.71 0.804 -9.4%*** -0.118*** -0.146***% of literate mothers 0.445 0.542 -9.7%*** -0.122*** -0.163***% of fathers with education 10 grades or higher 0.242 0.432 -19%*** -0.208*** -0.236***% of mothers with education 10 grades or higher 0.087 0.197 -11%*** -0.117*** -0.129***
Table 8Performance Differentials of Private Schools
Regression of Mean Student Test Score (in Std. Deviations) on School Type and Controls[1] [2] [3] [4] [5]
Private School 0.57*** 0.50*** 0.40*** 0.38*** 0.41***ControlsFamily Demographics & Private Tuition No Yes Yes Yes YesSchool Facilities No No Yes Yes YesState Fixed Effects No No No Yes NoVillage Fixed Effects No No No No YesObservations 29462 27242 25561 25571 25571R-squared 0.05 0.09 0.1 0.14 0.43•significant at 10%; ** significant at 5%; *** significant at 1%,

Figure 1a
Figure 1b

Figure 2 - Private School Formation/Enrollment over Time (CDF)
0.2
.4.6
.81
0 20 40 60 80 100Age of School
Enrollment CDF School Formation CDF