basanta k. pradhan shalabh kumar singh -...
TRANSCRIPT

Policy Reforms and Financing of Elementary Education in India:A Study of the Quality of Service and Outcome∗∗
Basanta K. PradhanShalabh Kumar Singh
National Council of Applied Economic ResearchParisila Bhawan, 11-Indraprastha Estate
New Delhi - 110 002
∗ This paper forms a part of the MIMAP-India Project, funded by IDRC, Ottawa. An earlierversion of this paper was presented at the MIMAP-India workshop held at NCAER, NewDelhi on Novemeber 22, 2000.

Policy Reforms and Financing of Elementary Education in India:A Study of the Quality of Service and Outcome
AbstractEven as a case can be made out for public spending on elementary
education, its link with enrolment rates does not appear strong.However, once efficiency and demand-side factors are accounted for,public spending is seen to make an impact on the rate of enrolment andquality of education as measured by teacher-pupil ratio. Teacher-pupilratio and the number of schools, in turn, are seen to have a strongerimpact on the rate of enrolment in efficient states. Literacy rates as wellas state domestic product were seen to have a positive influence oneducation. The share of public expenditure on elementary education inGDP peaked in 1990-91 but never achieved the targeted level of 6 percent of GDP. The reforms brought a break in the growth rate of publicexpenditure on elementary education, from which not all the states couldrecover even over an extended period of time.

1
I. IntroductionAdjustment experiences in several parts of the world have raised
concerns that social sector expenditures are vulnerable to cuts duringperiods of financial constraint. We consider an important sub-sector ofthe social sector, namely, elementary education, to look at the questionof the impact of adjustment on public expenditure and hence onoutcome. There are three principal questions in this regard, which in ourview are crucially interlinked. First, is there a case for public spendingon elementary education? Second, does public spending make an impacton the quality of education and educational outcome, particularlyenrolment? Third, what has been the impact of adjustment on publicspending on elementary education? The third question gains relevanceonly if the answer to the first two is in the affirmative.
A rich literature has come up to answer the first question, and theanswer seems to be an undisputed yes. There are three principalarguments in support of public spending on education. The first is basedon the link between education and economic growth. Crucial factorsinclude the high rates of return to education and large externalitiesassociated with it. The second is the recognition of the public goodcharacter of education. The third is the particular historical context ofthe developing countries. These are discussed in Section II.
The second question gains relevance because of the controversy in theliterature as to which aspects of school quality influenced bygovernment policy and expenditure are relevant for determiningeducational outcomes. Hanushek has reviewed the existing research onschooling to argue that school inputs (such as teacher-pupil ratio,expenditure per pupil, teacher’s experience) do not determine schoolingoutcomes either in developed countries (1986) or in developingcountries (1995). While it is admitted that schools do differ in quality,i.e. in their ability to improve student differences (Harbison andHanushek 1992), these differences are not seen to be highly correlatedwith measured characteristics of teachers and schools. Moreover, asKremer (1995) in his comment on Hanushek (1995) notes, most studies

2
were designed to give a small probability of falsely detecting asignificant effect of educational inputs so that chances of obtaining aninsignificant effect are large even if the true correlation is positive. Thus,with reference to 12 studies on expenditure per pupil quoted byHanushek, Kremer notes that assuming a 5 per cent chance of each studyyielding a significantly positive result if the true coefficient was zero,the chances of six or more studies out of twelve being significantlypositive would be only one in a million. Dearden, Ferri, and Meghir(2002) found that after controlling for ability and family background,pupil-teacher ratio (a measure often used for education quality) does notaffect educational qualifications or men’s wages though it has an impacton women’s wages at the age of 33. Feinstein and James (1999) find thatparenting is more important than pupil-teacher ratio for educationalattainments. On the other hand, Singh and Santiago (1997) find evidencefrom Mexico that policy variables, government expenditure, and pupil-teacher ratio are strong determinants of chidren’s attainment of primaryschooling. Similarly, controlling for household background variables,Case and Deaton (1999) find strong and significant effects of pupil-teacher ratios on enrolment, educational achievement, and on test scoresfor numeracy. In the Indian case, Sipahimalani (1999), and Dreze andKingdon (1999) report that school quality matters a lot in explainingschool participation even after controlling for household characteristics.Sipahimalani presents evidence in favour of school quality affectingschool participation. Dreze and Kingdon’s study shows that child-teacher ratio seems to matter more in the case of the enrolment of girlsthan that of boys, where it explains initial enrolment (ever been toschool) but not current enrolment. In India, most studies tend to concurthat mid-day meals have a significant positive influence on schoolparticipation and, probably, more so in the case of girls. However,tracing the precise influence of specific aspects of school quality turnsout to be a difficult task. According to Dreze and Kingdon, this ispartially to be expected, because the crucial school quality variables (e.g.teacher motivation) remain unobserved. Tilak (2002) reports thathousehold expenditure on education is nearly unitary elastic togovernment expenditure on education, but the effect of pupil-teacher

3
ratio is not statistically significant. However, other school-relatedvariables such as the availability of school within the habitation andincentives for attending school (mid-day meal, textbooks, uniform) arefound to reduce household expenditure considerably and, hence, mayaffect demand for schooling positively. The question of participation ornon-participation in schooling is not examined here.
Our results suggest that wide variation in school participation acrossIndian states may be because of two factors: the efficiency of publicexpenditure and the influence of the demand-side factors. Anotherimportant feature is the scale of funding with respect to child populationand the size of the state. This question is discussed in the Indian contextin Sections III, IV, and V. Section III starts by exploring the linkbetween the rate of growth of expenditure and educational outcomes for16 major states of India. Then, it explores whether public expenditureper child over a period makes an impact on educational outcomes. Theresults do not show a strong link with enrolment ratios. To explain this,the demand-side factors for enrolment, as shown by the MIMAP-Indiasurvey results for the reference year 1994-95, are explored. In SectionIV we look at the link between public expenditure and privateexpenditure by households. Again the link does not turn out to be strong.Based on the discussion in Sections III and IV, we segregate the 32states and Union Territories in terms of the technical efficiency ofexpenditure into 16 efficient and 16 inefficient geographical regions(states and Union Territories) and try and explore the link betweenpublic spending and educational outcomes. The results suggest a linkbetween public spending and the quality of education, and from there tothe rate of enrolment for efficient states. Thus, the efficiency ofexpenditure and the demand-side factors tend to explain the lack of linkbetween public spending and educational outcomes. It also seemsplausible that in efficient states, public activism due to a higher level ofawareness results in ensuring greater public spending and also possiblymaintaining the higher level of efficiency of expenditure.
4
The point raised in the third question, too, has seen a growth inliterature in terms of the broader issue of impact of adjustment on publicspending. Studies of public expenditure patterns and their outcomesacross regions, and at times even within regions, have shown vastlydiffering results. Bourguignon and Morrisson (1992) report that theinter-country picture with respect to social expenditures is more diversefor the African countries, as compared to the Latin American and Asianones. In Morocco, social expenditure as a percentage of GDP fell in theadjustment years (1983 to 1986), although the share of socialexpenditure in the total government spending did not decline. In bothIndonesia and Malaysia, social expenditures were protected during thereform period. The study presents a confusing picture regarding theimpact of reforms on the social sector, because of its choice of the sameperiod for all the three sets of indicators, i.e. expenditure, maintenanceof service, and outcome indicators. According to Hicks and Kubisch(1984), the overall picture is that the social sector was comparativelyless vulnerable (subject to smaller reduction as compared to that in thetotal expenditure) to public expenditure reduction in a number ofcountries during the seventies and the eighties. Social sector expenditureincreased in Brazil, Indonesia, and the Philippines during this period,despite cuts in government spending. In the case of Turkey, Guyana, andSudan, social expenditures were found to be vulnerable. In times ofausterity, social sectors, administration, and defence were generallyprotected, while infrastructure and production sectors were subject tolarge reductions. Whenever a cut was needed in the social sector, capitalexpenditure was affected more than recurrent expenditure. But,empirical evidence after the eighties does not support all the findings ofHicks and Kubisch. Taylor (1993) observed that countries affected byshocks adjusted in significantly different ways, depending on bothinternal and external factors such as institutions, macroeconomicstructures, and their socio-economic environments (Bourguignon andMorrisson 1992; Sahn 1987). Therefore, outcomes, including those withrespect to expenditure changes (not necessarily cuts), were bound todiffer. Moreover, the level of public spending has not always beenrelated to development. This difference is sought to be captured in this
5
study by looking at the divergent performances of the states withinIndia. We begin by looking at the overall expenditure on elementaryeducation in India in Section VI, and then at the variations across 16major states of India in Section VII. Section VIII concludes the paper.
II. Is there a case for public spending on elementary education?In order to answer this question we look at the vast literature on
linking education to growth, in recognising the political factors indeveloping countries that emphasised education at the time ofindependence, and in establishing the public good character ofeducation.
Elementary education and economic growthElementary education is considered an important contributor toeconomic growth. With the work of Schultz (1961), the investmentapproach to education gained currency, over-riding Keynes’ influencethat considered education as consumption good, based on who made thedecision to purchase. The instrumental role of education in achievingeconomic development is now widely acknowledged. Various estimatesof rates of return to education suggest that investment in education maybe more productive than investment in physical capital, and the rates ofreturn are higher at lower levels of education (Psacharopoulos 1993;Tilak 1987; Blaug et al. 1969). The literature indicates that a substantialproportion of the rate of growth of the economies may be attributed tothe rise in the educational level of the workforce. The New Growththeories have tried to explain sustained long-run growth by an unceasingaccumulation of knowledge based on the argument that investment inhuman capital is likely to yield constant or increasing returns (Romer1986; Lucas 1988). This has been held to explain the divergent growthprofiles of nations, whereby the less developed economies have failed tocatch up with the developed economies. In 1950, a threshold adultliteracy rate of 40 per cent was found to be a necessary, though notsufficient, condition for attaining a per capita income above $200 byBowman and Anderson (1963). Lau et al. (1993) attributed nearly aquarter of Brazil’s economic growth during the 1970s to the increase in

6
the average education of the workforce. Mathur (1993) also found apositive association between stocks of human capital and economicdevelopment that was stronger at increasingly higher levels of education.Even in terms of reduction in income inequality, the contribution ofprimary education is more significant. In agriculture, primary schoolingaffects productivity positively, especially when technology is changingrapidly (Chaudhri 1979). The level of education in a society (i.e. theproportion of population receiving some education) has also been foundto be positively correlated to decline in fertility, improved child health,reduced infant mortality, and greater social and gender equity (WorldBank 1997). Education, particularly mass primary education, has beenprojected as one of the vital ingredients in the success of East Asianeconomies (World Bank 1993). Therefore, most governments adopt apro-elementary education strategy in their development plans.
Historical factorsDuring their struggle for independence, most of the Third Worldcountries had realised the need for broad-based mass education and wereacutely aware of the gap between them and the developed countries.Education was accorded high priority by the governments of the ThirdWorld countries and the subsequent explosion in education narrowed thegap considerably. The most impressive increase took place in enrolmentin higher education, which grew from less than a million in 1950 to 18million in 1981, at almost 19.8 per cent per year (Patel 1985).
After independence, the political leadership in India sought to makemass education a basis of the national reconstruction, the aim being acarryover from the objectives of the struggle for independence.Education would not only serve as a vehicle for the economicindependence of the individual but would be a harbinger of socialchange, assuming a special role in breaking economic and caste barriers.The Directive Principles of the Indian Constitution enshrined theobjective of free compulsory education for all children till the age of 14,and protective discrimination in favour of the weaker sections of thepopulation. There has been an improvement in literacy rates as well as

7
other indicators of human development over time, but in comparisonwith some of the other Asian economies like South Korea, Sri Lanka andChina, it fades into insignificance (Table I). But even within India, wefind a wide diversity in human development profiles across states. WhileKerala’s performance is comparable to Asian countries with a highhuman development record, states like Uttar Pradesh and Bihar showlevels of human development comparable to sub-Saharan Africa. Thisfurther makes it important to look at the role of the state in improvingeducation.
Table I: Indicators of Human Development, 1997Country
Lifeexpectancyat birth(years)
Infant mortalityrate (per thousandlive births)
Adultliteracy rate(per cent)
India 62.4 71 62Kerala 72.0 12 93China 69.8 38 83Korea 72.4 6 97Thailand
68.8 31 95
Source: Govt. of India (2000).
Some of the least developed countries today spend as much, if nothigher, a share of their GDP and national budgets on social services asthe industrialised countries (United Nations 1996). The problem is notjust reduction or misallocation in resources across sectors of theeconomy, but is also one of misallocation within sectors and of theinefficiency of their use. It is in this context that the review of the impactof reforms initiated in India since 1991 on public expenditure onelementary education, and its link with educational quality andoutcomes, gains relevance. Differing economic structures andperformances prior to adjustment can result in disparate outcomes ofreform programmes, social and otherwise, expenditure levelsnotwithstanding.

8
Is education a public good or a private good?We have seen the importance of expenditure on education for the
growth of the economy and also noted the growing perception that itmay be of greater relevance to the developing countries. But in thecurrent atmosphere of growing scrutiny of the nature of stateexpenditures, we have to consider whether education is to be treated as apublic or a private good, and whether expenditure on education is to betreated as consumption or investment. If it is seen as consumption good,that is, private in nature, then the market mechanism may be regarded asthe most effective means of ensuring its adequate supply and stateexpenditure on it must be reduced to increase investment in other areasof greater importance like infrastructure. However, education not onlyoffers private monetary as well as non-monetary benefits to itsconsumers but also has externalities associated with it, which conferbenefits to society at large, even to those who have not had anyeducation. Externalities associated with an average level of humancapital affect a worker’s productivity as much as the effect of her ownhuman capital (Lucas 1988). Thus, it combines in it the nature of both aninvestment good and a consumption good (Blaug 1970) and public aswell as private good (Musgrave 1959). Apart from its intrinsicimportance, education serves certain instrumental roles in ensuring thefreedom of a person (Dreze and Sen 1995), which not only guaranteespersonal gains but also possesses social ramifications includingempowering the disadvantaged and reducing inequality.
There are a few practical problems in which the economist has amore direct interest than those relating to the principles on which theexpense of the education of children should be divided between the stateand the parents (Marshall 1910: 217). The objective of the state inincurring expenditure on education is linked to the macro effects ofeducation over a much longer time horizon, and so is different from thatof the individual who is concerned with the immediate returns ofeducation to him and his family over a lifetime. Education can not onlyensure economic growth with equity but also has externalities associated
9
with it, which make the public financing of education imperative (Tilak1989). The benefits that accrue to the individual in terms of higherearnings are a reason why the individual should pick up a part of thecost. If we look at the state as a supplier of education and the individualas a buyer of it, then investments by both appear to be complementary;and this may be the best model on grounds of equity1. Hence, the rightbalance between public and private expenditures is crucial to the successof any educational policy or programme (Psacharapoulos and Woodhall1985; Majumdar 1983).
III. Public expenditure on elementary education and outcomeA question often asked with respect to public spending is the rate
of growth of expenditure. Assuming that public spending affectseducational outcomes with a lag of a couple of years, we try to seewhether there is any link between the rate of growth of expenditureduring 1991-92 and 1993-94 and the change in educational outcomebetween 1992 and 1996. Next we look at the influence of averagespending per child over the period 1985-86 to 1993-94 on educationaloutcomes in 1996. Then we include a discussion on the demand side toexplain the results.
Table II presents four indicators, namely, enrolment ratio anddropout rate for educational achievements, and pupil-teacher ratio, alongwith the number of schools per 100 sq. km, for the level and quality ofeducational services. However, we were unable to find any relationshipbetween the rate of growth of expenditure and the educationalachievements of the state during the reforms period. For example, if wecompare the rate of growth in expenditure during the period 1991-92 to1993-94 (given in Table XIII) with the difference in enrolment ratiobetween 1992 and 1996, we find that Kerala, with a negative growth ratein expenditure, experienced a tremendous increase in enrolment ratio.But Orissa, Gujarat, and Andhra Pradesh, even with a positive rate of 1 Milton Friedman (1955) has presented a laissez-faire view of financing education where the primary responsibilityof the state is to enforce contracts, prevent coercion and keep markets free. There can be three reasons for makingan exception: when monopoly or market imperfections exist, where external or neighbourhood effects are important,and thirdly, in favour of those who cannot take responsible decisions like children.

10
growth in expenditure, experienced a decline in enrolment ratio. Even ifwe include 1994-95 and 1995-96 on the expenditure side, the story doesnot change much since Gujarat and Madhya Pradesh show a higher rateof growth in expenditure than Kerala. Similar results are found in thecase of dropout. Assam, Gujarat, and Punjab experienced an increasedespite a positive rate of growth of expenditure, while Uttar Pradesh andWest Bengal experienced a decline despite a negative rate of growth ofexpenditure. Similarly, when we look at the level of services, we findthat Orissa, with a very high rate of growth of expenditure, shows noimprovement in the level of services. States like Haryana and UttarPradesh, with much lower or even negative rates of growth inexpenditure, show substantial improvement.
A variety of reasons may explain the results. One important factoris the demand side, which may have much greater impact on theoutcome than the supply side (Pradhan and Roy 2003). Secondly, theefficiency of expenditure may be different across states. Thus, while weconcentrate merely on pupil-teacher ratio, what may remain hidden isthe quality of teachers themselves. For example, in 1992 Tamil Nadushowed a much better performance than Bihar in terms of enrolment andliteracy in rural areas even though Bihar had a higher percentage ofqualified primary school teachers and primary schools within habitation.But when we take “trained matriculate and above” for teachers, we findthe figures to be 26 per cent for Bihar and 51 per cent for Tamil Nadu.Similarly, when we consider that only 30 per cent of the rural primaryschools in Bihar had usable blackboards, while the figure for TamilNadu was 75 per cent, we find the reason for this apparent paradox (Paland Pant 1995). Thirdly, indicators like enrolment ratio and dropout rateare also dependent on the rate of growth in population. If the rate is low,even a low rate of growth of expenditure may influence the outcomemuch more substantially, as seen in the case of Kerala and Tamil Nadu.

11
Table II: Educational attainment and quality of servicesEnrolment
ratioDropout
ratePupil–
Teacherratio
No. of elementaryschools per 100 sq.
km.State 1992 1996 1992
*1996 1992 1996 1992 1996
AndhraPradesh
72.8 69.6 75.94 62.82 65 52 20.6 20.6
Assam 81.3 96.3 69.22 70.96 40 36 44.1 47.7Bihar 60.7 59.0 78.61 79.07 54 48 38.4 38.8Gujarat 100.8 96.5 58.36 59.39 44 42 16.4 17.1Haryana 39.9 73.1 35.56 23.91 88 43 14.3 16.5HimachalPradesh
85.8 89.0 19.61 15.77 39 31 15.5 15.8
Karnataka 89.1 89.8 61.09 60.96 46 52 21.0 21.6Kerala 63.8 92.0 2.4 1.96 48 32 25.0 25.0MadhyaPradesh
89.0 85.0 53.52 44.68 41 41 19.0 22.1
Maharashtra 82.6 100.8
51.21 47.38 49 39 20.0 20.5
Orissa 88.8 77.3 69.24 61.21 35 35 34.0 34.8Punjab 64.1 74.2 45.37 46.44 55 37 27.6 30.1Rajasthan 67.2 81.0 81.88 64.77 47 40 11.9 13.6Tamil Nadu 95.3 100.
638.85 34.74 57 47 27.5 27.8
UttarPradesh
69.4 65.1 48.39 37.93 60 53 32.0 37.7
West Bengal 124.3 97.9 74.29 46.67 76 70 62.0 61.0Total 80.1 80.8 52 46 24.2 25.8All India 79.0 80.7 61.1 52.74 51 45 22.1 23.6Source: Calculated from Govt. of India, 1993, and 1997b.* Govt. of India, 1998b.

12
Keeping in mind the above factors, a more relevant analysis maybe to relate the final outcome in 1996 to expenditures incurred by stategovernments per child in the few years prior to that. The results havebeen presented in Table III. Even here we do not find a very highcorrelation between enrolment rate and public expenditure per child.Again, the demand side and the efficiency of expenditure becomeimportant variables that would help the transformation of expenditureinto a better outcome. The correlation with dropout rate is higher,suggesting that public expenditure has a much higher impact onretaining children at school rather than bringing about greater enrolment.The impact on pupil-teacher ratio is the highest. The negative value is tobe expected, because pupil-teacher ratio shows the number of studentsper teacher that would be expected to decline with greater expenditure.Thus, public expenditure has a higher impact on improving the qualityof services. However, so far as infrastructure in terms of the number ofschools per 100 sq. km is concerned, we find a small but negativecorrelation with expenditure. This is much more difficult to explain, butit may be argued that the link is reverse; the states with limitededucational infrastructure are spending more in order to overcome thelimitations of infrastructure, to catch up with the more advanced states.Or due to political reasons, in some states there may be greater emphasison generating employment by increasing the number of teachers, whileless funds are available for building schools.
Table III: Correlation between per child expenditure andeducational attainment
State Averageexpenditure per child1985-86 to1993-94*
Enrolment
1996
Dropout rate1996
Pupil -Teach
erratio1996
No. ofelementaryschools per100 sq. km.
1996AndhraPradesh
128.8 69.6 62.82 52 20.6
Assam 205.8 96.3 70.96 36 47.7

13
Bihar 137.4 59.0 79.07 48 38.8Gujarat 215.6 96.5 59.39 42 17.1Haryana 149.7 73.1 23.91 43 16.5HimachalPradesh
360.8 89.0 15.77 31 15.8
Karnataka 182.1 89.8 60.96 52 21.6Kerala 303.4 92.0 1.96 32 25.0MadhyaPradesh
137.5 85.0 44.68 41 22.1
Maharashtra 186.0 100.8 47.38 39 20.5Orissa 157.0 77.3 61.21 35 34.8Punjab 161.5 74.2 46.44 37 30.1Rajasthan 149.2 81.0 64.77 40 13.6Tamil Nadu 213.5 100.6 34.74 47 27.8UttarPradesh
117.8 65.1 37.93 53 37.7
West Bengal 114.4 97.9 46.67 70 61.0Total 156.8 80.8 46 25.8All India 165.0 80.7 52.74 45 23.6Correlation 0.46
(10%)-0.58(2%)
-0.63(1%)
-0.34
Source: Government of India, 1993 and 1997a.* Government of India, 1995: Average expenditure for 1985-86to 1993-94 has been divided by child population in 1991.
Thus, merely public expenditure on education does not explaindifferences across states in educational achievements. While it does tendto explain the differences in the quality of education to some extent, itdoes not explain the educational achievements to the same extent. Thereis a need to look at the demand side and to analyse whether public andprivate expenditures on education are complementary. Also, animportant feature of state financing is the proportion of spending thatgoes to elementary education.

14
Given these factors, along with the above analysis, which shows thatthere is more to educational attainment than merely a public supply ofeducation, it is necessary to look at the causes of non-enrolment asinvestigated by the MIMAP-India Survey (Pradhan and Roy 2003). Inthe case of rural areas, the household response (Figure I) shows that themajor reasons for non-enrolment are unconstrained demand (interest-related factors being 51 per cent) and constrained demand (economicfactors accounting for 39 per cent). The NSSO results of the 35th roundfor 1980-81 also confirmed these two as important factors in non-enrolment. This re-establishes that demand reasons, and more so theinterest-related factors rather than economic factors, are more importantthan other reasons in explaining non-enrolment and dropouts in India.Supply-related factors such as “school too far”, “school dysfunctional”,and “teacher’s attitude discouraging”, account for only 2 per cent.Similarly, custom- and health-related factors each account for only 4 percent. As compared to the above-poverty-line group (48 per cent), alarger percentage (52 per cent) of the population in the below-poverty-line category (Figures II and III) attribute their non-enrolment tounconstrained demand (interest-related factors). However, constraineddemand is the next prominent reason of non-enrolment for both above-poverty-line and below-poverty-line categories of population, althoughthe degree is less for the former (38 per cent) than the latter (40 percent). The state has to deal with the interest-related factors in moreinnovative ways; merely an increase in state funding may not be enough.This seems to be one of the primary reasons why we do not find a closelink between state expenditure and educational attainment. Hence, inrural areas, the major reason for non-enrolment is unconstraineddemand, which negates the popular perception that poverty or financialconstraint is the major factor for poor households.
In urban areas, however, constrained demand (52 per cent) is themajor reason for non-enrolment (Figure IV). But, a contrast is observedbetween the poor and non-poor in urban areas. While constraineddemand (57 per cent) is the major reason for the non-enrolment of thepoor (Figure V), unconstrained demand (45 per cent) is the major reason

15
Fig. 2: Reasons for Non-enrolment for BPL Group in Rural-India
1%
52%
40%
4%3%
Supply Related Factors Demand Related FactorsInterest Related Factors Custom Related FactorsHealth Related Factors
for the non-enrolment of the non-poor (Figure VI). Thus, based on theabove data, among the reasons for the non-enrolment of various groupsof population on the basis of places of residence and the level ofpoverty, the primacy of demand factors (either unconstrained orconstrained) is established beyond any doubt. On the contrary, supply-,custom- and health-related factors, which are no doubt important, ranklower as reasons of non-enrolment as stated by the respondents of theMIMAP-India Survey.
In this context, it is important to note that most studies for Indiahave estimated the returns to primary education to be low (Kingdon1999). The returns to education are generally seen to go up with thelevel of education, contrary to the conventional worldwide pattern. AsKingdon notes, this seems to be consistent with the suggestion that overtime the rates of return to primary education may have collapsed inmany countries. This may explain the low interest in acquiringeducation. Pradhan and Subramanian examine the role of returns toeducation in the household decision-making process on schoolparticipation in a modelling framework by explicitly taking “the lack ofinterest” as a proxy for returns to education. They also find that even aftercontrolling for household variables, wage rates remain significant inexplaining school participation. Another important conclusion from theirstudy is that education-based welfare programmes not only havesignificant impact on the decision to send children to school, but alsoimprove the performance of the expected returns to education.The importance of demand-side factors does not imply that the state hasno role to play in expanding the educational base. What it implies is thatgovernment spending on education has to be accompanied by otherprogrammes to address non-monetary constraints that individuals face intheir decision to attend school (Inchauste 2000). Public expenditure hasto be directed towards inducing thedemand for elementary education. Forexample, education-based welfareprogrammes such as mid-day mealsand improvements in the quality of

16
Fig. 5: Reasons for Non-enrolment for BPL Group in Urban-India
10%
5%3%
57%
25%
Supply Related Factors Demand Related FactorsInterest Related Factors Custom Related FactorsHealth Related Factors
Fig. 3: Reasons for Non-enrolment for APL Group in Rural-India
4%
5%
5%
38%
48%
Supply Related Factors Demand Related Factors
Interest Related Factors Custom Related Factors
Health Related Factors
schools may be demand-inducing. The link between education andemployment opportunities has to be made stronger and needs to beclearly perceived by the population. Besides, custom- and health-relatedfactors might also be a cause of lack of interest that can be taken care ofby the state. In the case of the poor, the state can also bring about achange by easing the economic constraints, particularly in the urbanareas.
IV. The role of private expenditureon education
At this stage, it may also be worthwhileto examine the link between public
expenditure and private expenditure on elementary education. Doeshigher spending by the government bring forth higher spending by thehouseholds? The correlation between the two turns out to be very small,suggesting no link between public and private expenditure on
Fig. 6: Reasons for Non-enrolment for APL Group in Urban-India
10%
45%
31%
11%
3%
Supply Related Factors Demand Related Factors
Interest Related Factors Custom Related FactorsHealth Related Factors
Fig. 4: Reasons for Non-enrolment in Urban-India
10%
5%
4%52%
29%
Supply Related Factors Demand Related Factors
Interest Related Factors Custom Related FactorsHealth Related Factors
Fig. 1: Reasons for Non-enrolment in Rural-India
2%
51%
39%
4%
4%
Supply Related Factors Demand Related FactorsInterest Related Factors Custom Related FactorsHealth Related Factors

17
elementary education across states (Table IV). However, we may notethat household expenditure on elementary education is very high,contrary to the popular perception that education is mostly free in India.Even households in rural areas belonging to the lower socio-economicgroup spend considerable amount on books, uniform and fees (includingexamination and other fees) (Tilak 2002). This, coupled with low ratesof return to lower levels of education, suggests why there is a lack ofinterest in acquiring education. The positive response to welfareprogrammes such as mid-day meals, noted by a number of studies,suggests that government spending in these areas is likely to inducedemand for education and increase enrolments.
Taking a log of both the variables and then regressing privatehousehold expenditure (primary) per student on public expenditure(elementary) per child, we find a strong and statistically significantpositive relationship between the two [Table IV, regression (1)]. This issimilar to Tilak’s (2002) observation that there is nearly unitaryelasticity between government and private household expenditure,suggesting complementarity between the two. It must be noted that theexercises conducted in these two studies are different because thevariables considered are very different. One, Tilak takes the averagehousehold expenditure per student on elementary education, calculatedfrom HDI survey data for rural households. We take the averagehousehold expenditure per primary class student taken from the NSSOsurvey. The advantage of using the NSSO survey is that the sample sizeis very large and includes urban and rural population. However, it doesnot provide the average expenditure of households on elementary schoolstudents. Second, public expenditure in our case is per child in order toreflect the scale of funding for the state, whereas Tilak has taken publicexpenditure per student. Also, Tilak relates household expenditure inrural areas to the total state expenditure per student. Rural householdsare much more dependent on state education facilities, and so may beaffected much more by state expenditure than urban households. Theconclusions, however, are not very different. The ideal method forlooking at substitutatibility or complementarity between government and

18
private expenditure on education would be to do a time series analysis.The results could be substantially different for different states over time.However, the paucity of data with respect to household expenditure oneducation does not allow this. An interesting feature is that elasticitywith respect to per capita state domestic product, which may be taken asa proxy for household incomes, comes out to be lower than that forpublic expenditure, though more significant [Table IV, regression (2)].Tilak too reports a very low elasticity of household expenditure oneducation in general, and elementary education to household incomes.Thus, if government expenditure on elementary education is reduced, theresult may be a decline in household expenditure, affecting enrolmentsnegatively.
Reflecting the highly significant relationship we found between thelog of per capita state domestic product and private expenditure perstudent, a much higher level of correlation is observed between thesetwo than with public expenditure (Table V). This suggests that economicfactors do play a role in higher demand for education. Again, comparingwith the results obtained by Tilak, the link is clearly in the samedirection. It has to be noted that state domestic per capita is not merelyan indicator of household income. It is likely to be related to the level ofdevelopment of the state, measured by such factors as the share ofindustry in total employment and state domestic product (SDP). Thus,the relationship between household expenditure and SDP per capita mayalso be indirect, through the perception of increased opportunity toexploit the employment potential.
Table IV: Ranking of states in descending order by expenditureper child
States ranked bypublicexpenditure perchild onelementaryeducation
Publicexpenditure perchild (averagefor 1993-94 to1995-96)*
States ranked byprivateexpenditure perstudent onprimaryeducation
Privateexpenditureper student(1995-96)**

19
Himachal Pradesh 1344 Punjab 1162Kerala 1209 Haryana 953Gujarat 917 Kerala 725Assam 871 Himachal
Pradesh573
Tamil Nadu 846 Maharashtra 540Rajasthan 701 Rajasthan 518Karnataka 701 Uttar Pradesh 507Maharashtra 697 Tamil Nadu 464Orissa 654 West Bengal 433Haryana 605 Andhra Pradesh 430Madhya Pradesh 557 Gujarat 423Punjab 545 Madhya Pradesh 333Bihar 474 Bihar 330Andhra Pradesh 446 Karnataka 294Uttar Pradesh 431 Orissa 284West Bengal 376 Assam 251Simple correlation between public and private expenditure = 0.06Regression:(1) ln (priexp) = b1 ln (govexp)Elasticity coefficient(b1) = 0.943(t –value = 46.749)Adj R-squared = 0.9927
(2) ln (priexp) = b2 ln (income)Elasticity coefficient(b2) = 0.678(t –value = 74.241)Adj R-squared = 0.9971
Source: * Govt. of India, 1993 & 1998a (Average publicexpenditure for the period has been divided by the estimated childpopulation in Sep., 1993). ** NSSO, 1998.
Education constraints may be divided into resources, values,incentives, and institutions (Dreze & Saran 1993). A higher level ofgeneral education in a state is likely to strengthen the institutionalmechanism to demand more resources and better education from thestate, thus creating a positive impact on all the above factors mentionedby Dreze and Saran. The correlation between the literacy rate in 1991and public expenditure per child comes out to be fairly high (Table V).
20
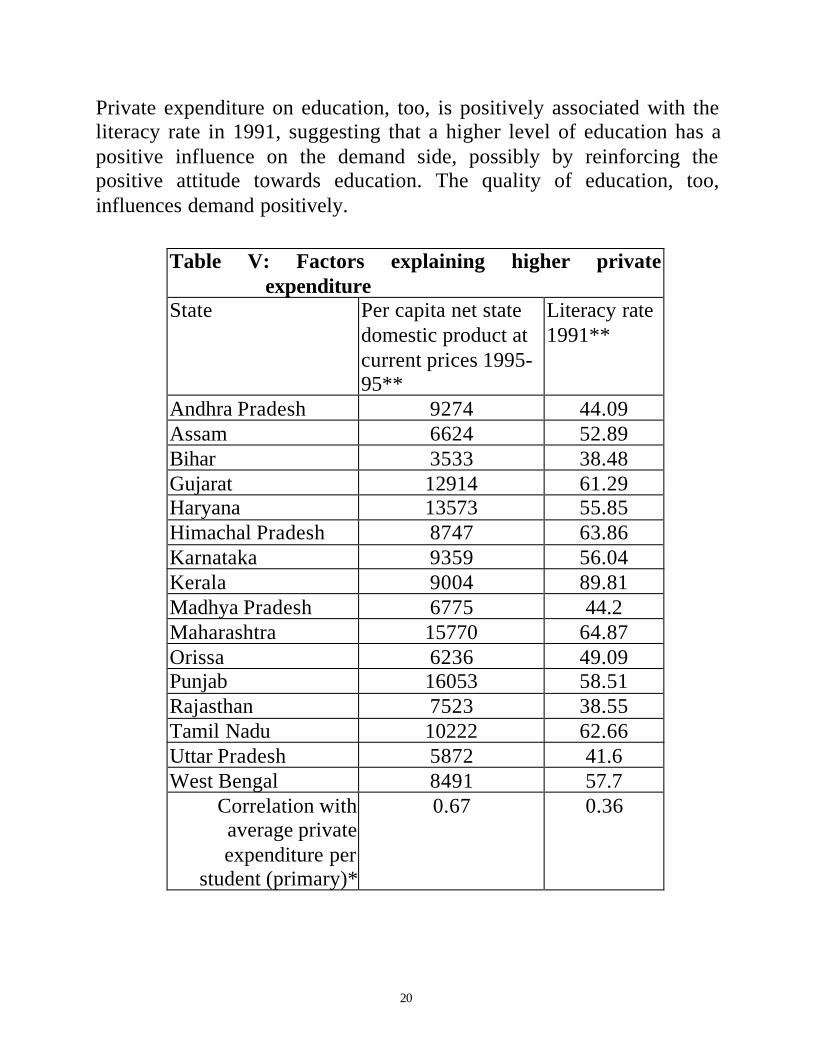
Private expenditure on education, too, is positively associated with theliteracy rate in 1991, suggesting that a higher level of education has apositive influence on the demand side, possibly by reinforcing thepositive attitude towards education. The quality of education, too,influences demand positively.
Table V: Factors explaining higher privateexpenditure
State Per capita net statedomestic product atcurrent prices 1995-95**
Literacy rate1991**
Andhra Pradesh 9274 44.09Assam 6624 52.89Bihar 3533 38.48Gujarat 12914 61.29Haryana 13573 55.85Himachal Pradesh 8747 63.86Karnataka 9359 56.04Kerala 9004 89.81Madhya Pradesh 6775 44.2Maharashtra 15770 64.87Orissa 6236 49.09Punjab 16053 58.51Rajasthan 7523 38.55Tamil Nadu 10222 62.66Uttar Pradesh 5872 41.6West Bengal 8491 57.7
Correlation withaverage privateexpenditure per
student (primary)*
0.67 0.36

21
Correlation withaverage public
expenditure per child(elementary)*
0.10 0.68
Source: * Same as table 4 above ** Economic Survey, 1999-2000.
V. Technical efficiency of elementary education across statesHaving seen that the efficiency of expenditure can be an important
factor in explaining the divergent performances of states in terms ofenrolment and dropout, this section considers the technical efficiency ofstates based on two inputs: schools, as a measure of the capacity, and thenumber of teachers. The efficiency of factor inputs in generatingeducational output (such as enrolment and dropout) can be low due to avariety of factors. One of the problems can be the need to reach out to alarger population over a wider geographical region. Inefficiency wouldcome due to decreasing returns to scale. Hence, factor productivitywould appear to go down. The other can be inefficiency, because factorinputs that should be measured by technical efficiency are not beingutilised properly. It must be noted here that this technical efficiency cancome also due to a lack of certain complementary inputs or because thequality of inputs is bad, which may not have been accounted for. Forexample, schools may not have roofs or blackboards; in certain areasthere might be teachers but schools may not have been built; and theteachers may not be trained and hence may not be good. There isevidence that these reasons are important in the Indian context. ThePROBE (1999) survey, for instance, found the following with respect togovernment schools: (a) only a fourth of the sample schools had at leasttwo teachers, two all-weather classrooms, and some teaching aids; (b) atthe time of the investigator’s visit, one-third of the headmasters wereabsent, one-third of the schools had a single teacher present, and abouthalf of the schools had no teaching activity; (c) in many schools class Istudents were systematically neglected. These represent serious flaws inthe schooling process. If teachers are absent from schools or do notteach, the overall teacher-pupil ratio would not be of any meaning.

22
Similarly, since education is a cumulative process, a systematic neglectof education at the early stage implies that students’ current level ofachievement as well as interest in schooling would decline.
It is difficult to account for all the factors that go into educationaloutput, due to lack of data. Hence, the results presented here can be onlytaken to be indicative and not conclusive. The ranking is expected to bedue to the aggregate effect of all the factors mentioned above and more.However, it is precisely these effects that we are not able to trace whenwe deal with aggregate data across states. So the conclusion that with thesame level of inputs some states would do better is important.
The method adopted was input-oriented Data EnvelopmentAnalysis (DEA) with variable returns to scale. DEA makes noassumption about production function and hence is more appropriate forstudying the efficiency of conversion of inputs into outputs with respectto education, because no good estimate of appropriate frontier foreducation is available (Harbison and Hanushek 1992). It measuresefficiency by ranking the “producers” from within the sample in order toestablish the production frontier based on certain very unrestrictiveassumptions such as convex production frontier. A parametric approachbased on the assumption of a functional form of the production functioncan be considered doubtful, given the small sample. DEA also is betterthan Free Disposable Hull (FDH) analysis, used by Gupta, Honjo, andVerhoeven (1997), and Clements (1999), because the latter, with norestrictions on the shape of the frontier, can identify very smallobservations as inefficient. In the case of multiple inputs and outputs,FDH is even more limited.
Table VI ranks the states in terms of technical efficiency withvariable returns to scale and then by scale efficiency. West Bengal andDelhi turn out to be the most efficient. Maharashtra and Uttar Pradesh,both large states, turn out to have the problem of scale inefficiency.Thus, the size of the state matters, because a larger area, particularlyrural, would imply spreading the resources thin, resulting in decreasing

23
returns to scale. The usage of inputs, therefore, would also showinefficiency, because reaching the last child involves a much largerincrease in input than may be shown by the performance of states withrelatively low enrolment levels. Kerala and Himachal Pradesh areranked among relatively inefficient states, but that is primarily becausethe inputs by the states are very high, which has helped in creating veryhigh levels of enrolments in these states2. But the interesting feature isthat most of the states are in the region of increasing returns to scale,implying that they can expand enrolments faster if they increase theinputs.
Having so distinguished the states by the level of technicalefficiency, we test the hypothesis that the relatively efficient stateswould show a stronger link between enrolment and public expenditure.One of the channels through which this would work is the impact ofpublic expenditure on the quality of education, and hence outcome. Ascan be seen from Table VII, public expenditure per child does determinethe rate of enrolment across states. The coefficient for the efficient statesis higher than for the inefficient states, suggesting that it makes greaterimpact on enrolment depending upon the efficiency of expenditure.However, it explains less of the variation in rates of enrolment acrossefficient states than the inefficient states, as seen from a lower value ofadj-R2. The reason becomes clear from the next regression, where weinclude the household annual expenditure per student. They togetherexplain a higher amount of variation in enrolment across efficient statesthan inefficient states. The household expenditure term is insignificantfor inefficient states, while both public expenditure and privateexpenditure turn out to be significant in explaining enrolment in efficientstates. The coefficients are also higher for the efficient states. Thissuggests that where public expenditure is efficient, private expendituretends to complement it in increasing the educational outcome.
2 These states have extremely low dropout rates (see Table II). Hence, if we account for dropout rates and look atretention rates, these states will turn out as relatively efficient. On the other hand, a state like Bihar, with the highestdropout rate, would move down in the rankings. These states may be considered as outliers.

24
Table VI: Ranking of states by technical efficiency(constant returns)State Crste Vrste ScaleWest Bengal 1 1 1Delhi 0.92 0.943 0.976 irsUttar Pradesh 0.619 1 0.619 drsMadhya Pradesh 0.615 0.615 1Andhra Pradesh 0.611 0.612 0.999 irsPunjab 0.532 0.538 0.988 irsMaharashtra 0.507 0.606 0.836 drsKarnataka 0.495 0.496 0.998 irsHaryana 0.478 0.484 0.987 irsBihar 0.476 0.476 0.999Orissa 0.463 0.466 0.994 irsRajasthan 0.462 0.463 0.998 irsTamil Nadu 0.459 0.46 0.999 irsAssam 0.431 0.434 0.994 irsGujarat 0.389 0.39 0.997 irsTripura 0.346 0.374 0.925 irsPondicherry 0.321 0.41 0.783 irsDaman & Diu 0.313 1 0.313 irsJ&K 0.31 0.32 0.968 irsD&N Haveli 0.309 0.819 0.377 irsGoa 0.303 0.372 0.815 irsHimachal Pradesh 0.295 0.307 0.962 irsKerala 0.293 0.296 0.993 irsChandigarh 0.289 0.432 0.668 irsMeghalaya 0.278 0.312 0.892 irsManipur 0.223 0.254 0.88 irsNagaland 0.216 0.245 0.879 irsArunachal Pradesh 0.204 0.253 0.804 irsMizoram 0.191 0.244 0.783 irsSikkim 0.187 0.27 0.693 irsA & N 0.156 0.269 0.581 irs

25
Lakshadweep 0.137 0.678 0.202 irsSource: Calculated on the basis of data provided in Government ofIndia, 1997a.Note: crste = technical efficiency from CRS (Constant Returns to Scale)DEA vrste = technical efficiency from VRS (Variable Returns to Scale)DEA scale = scale efficiency = crste/vrste irs = increasing returns to scale drs = decreasing returns to scale
Looking at the impact of public expenditure per child on the quality ofeducation, as measured by the number of teachers per 1,000 students, wefind that the impact is insignificant in inefficient states and significant inefficient states. The small value of the coefficients is to be expected,because we are dealing with the ratios of very large numbers. Thus,whether or not public expenditure affects the quality of educationdepends on the efficiency of utilisation of public funds and hence, sodoes the impact of this expenditure on educational outcome. The nextstage is to look at whether the quality of education makes an impact onthe rate of enrolment or not. As can be seen from the regression resultspresented in Table VIII, teacher–pupil ratio and the number of schoolsper sq. km are significant in explaining the rate of enrolment in efficientstates but both the variables are completely insignificant in the case ofinefficient states. The high value of the constant term, along with thefact that it remains significant in both the cases, may be taken to reflectthe importance of demand-side factors. If we rank efficiency based onvariable returns to scale, it turns out that in the case of efficient statesteacher–pupil ratio becomes the most significant and the constant termbecomes insignificant. The value of adj-R2 also improves. However, inthe case of inefficient states, the results do not change much. It may beargued that enrolment depends to a great extent on the demand-sidefactors, but the quality of education and infrastructure, which can beinfluenced by government policy and expenditure, can increase the rateof enrolment and can even push demand for education.
26
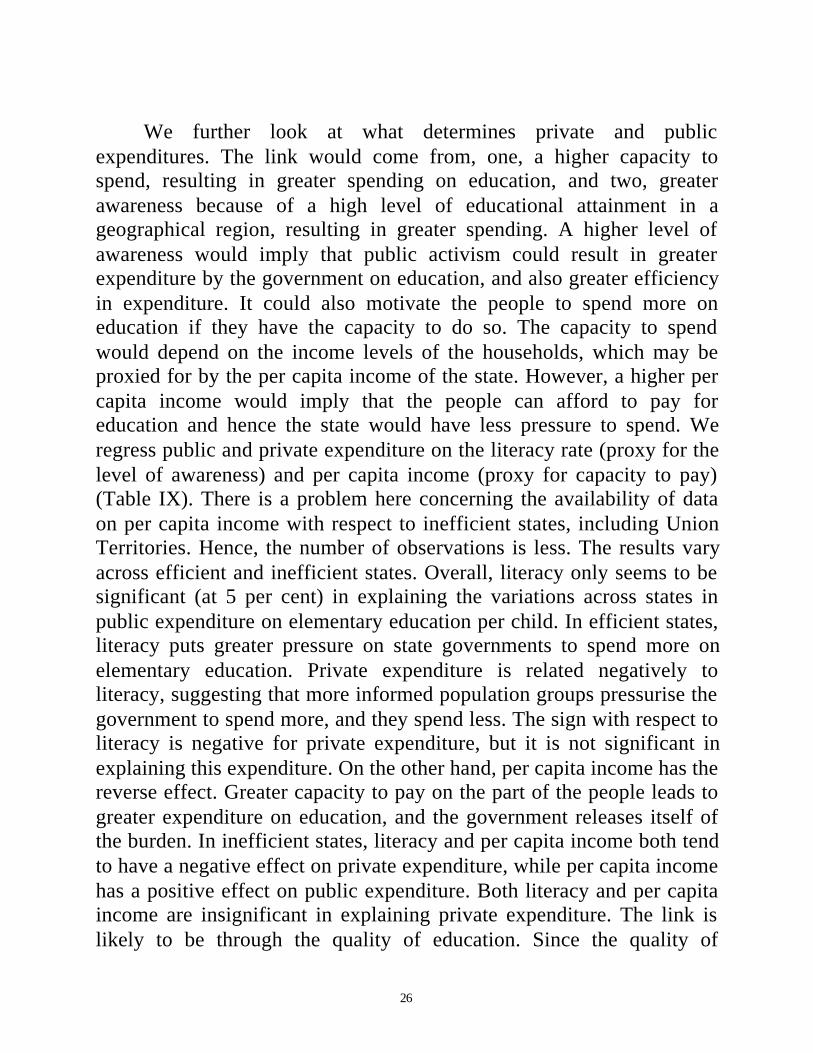
We further look at what determines private and publicexpenditures. The link would come from, one, a higher capacity tospend, resulting in greater spending on education, and two, greaterawareness because of a high level of educational attainment in ageographical region, resulting in greater spending. A higher level ofawareness would imply that public activism could result in greaterexpenditure by the government on education, and also greater efficiencyin expenditure. It could also motivate the people to spend more oneducation if they have the capacity to do so. The capacity to spendwould depend on the income levels of the households, which may beproxied for by the per capita income of the state. However, a higher percapita income would imply that the people can afford to pay foreducation and hence the state would have less pressure to spend. Weregress public and private expenditure on the literacy rate (proxy for thelevel of awareness) and per capita income (proxy for capacity to pay)(Table IX). There is a problem here concerning the availability of dataon per capita income with respect to inefficient states, including UnionTerritories. Hence, the number of observations is less. The results varyacross efficient and inefficient states. Overall, literacy only seems to besignificant (at 5 per cent) in explaining the variations across states inpublic expenditure on elementary education per child. In efficient states,literacy puts greater pressure on state governments to spend more onelementary education. Private expenditure is related negatively toliteracy, suggesting that more informed population groups pressurise thegovernment to spend more, and they spend less. The sign with respect toliteracy is negative for private expenditure, but it is not significant inexplaining this expenditure. On the other hand, per capita income has thereverse effect. Greater capacity to pay on the part of the people leads togreater expenditure on education, and the government releases itself ofthe burden. In inefficient states, literacy and per capita income both tendto have a negative effect on private expenditure, while per capita incomehas a positive effect on public expenditure. Both literacy and per capitaincome are insignificant in explaining private expenditure. The link islikely to be through the quality of education. Since the quality of

27
education is bad, there might be a satisfaction with relatively a smallamount of education so that population groups with some educationalattainment do not put pressure on the government to increaseexpenditure. They themselves would not be interested in spending oneducation, because they do not perceive adequate benefits from it.
It may also be noted here that merely looking at pupil-teacher ratioand its impact on school participation or attainment is not enough. Partof the reason that pupil-teacher ratios do not seem to affect schooling isthat variations in pupil-teacher ratios, in general, are small. The issue isalso related to what the case would be if the demand for schoolingincreases and also over time the absolute number of children gettingenrolled increases. There is hence a need to increase expenditure onelementary education in order to meet the demand that may grow fromtwo sides: (1) an increase in the rate of enrolment, and (2) to keep upwith the rise in child population and hence an increase in absolutenumbers seeking education at the same level of rate of enrolment.
Table VII: Expenditure as a determinant of rate of enrolmentand quality of education
Dependent variableIndependentvariables 1. Rate of
enrolment(1996)
2. Rate ofenrolment(1996)
3. Teachers-per-1000-pupil
Constant 67.85 (9.26) 59.79 (6.26) 18.30 (6.82)Publicexpenditure perchild (averagefor 1993-94 to1995-96) (pubexppe)
0.0328 (8.72) 0.0326 (8.77) .0043 (3.11)

28
Average annualexpenditure perstudent inprimary schoolin 1995-96(households)(average)
- 0.010 (1.29) -
2R (N=32) 0.7075 0.7139 0.2187Efficient statesConstant 60.51 (5.31) 45.05 (3.99) 12.11 (3.87)Pub exppe 0.0416 (2.49) 0.05 (3.47) .0126 (2.75)Average -- 0.017 (2.60) -
2R (N=16) 0.2581 0.4737 0.3038Inefficient statesConstant 76.80 (3.68) 69.06 (1.93)Pub exppe 0.0298 (3.81) 0.031 (3.38) .0026 (0.899)Average -- 0.005 (0.27) --
2R (N=16) 0.4734 0.4360 -0.0129Note: Figures in parenthesis show the t-statistics.Table VIII: The impact of quality variables on the rate ofenrolmentIndependent variables Dependent variable: Rate of
enrolment (1996)Constant 73.16 (2.905)Teachers-per-1000-pupil 1.67 (2.065)Number of schools per sq.km.
0.11 (0.456)
2R (N=32) 0.0687Efficient states Based on crste Based on vrsteConstant 54.62 (3.246) 23.63 (0.881)Teachers-per-1000-pupils 1.25 (1.578) 2.94 (2.247)Number of Schools per sq.km.
0.19 (2.044) 0.28 (1.807)
2R (N=16) 0.2412 0.3534

29
Inefficient statesConstant 160.19 (3.459) 153.379 (3.132)Teachers-per-1000-pupils -0.155 (-0.131) -0.104 (-0.082)Number of schools per sq.km.
-0.196 (-0.388) -0.361 (-0.584)
2R (N=16) -0.1402 -0.1188Note: Figures in parenthesis show the t-statistics..
Table IX: The determinants of public and private expenditureon elementary educationIndependentvariables
Dependent variable:
Pub exppe AverageConstant -74.65 (0.075) -76.42 (0.24)Literacy (1991) 24.37 (1.288) 3.19 (0.527)Per capita income(1995-96)
0.004 (0.067) 0.056 (2.971)
2R (N=27) 0.0116 0.3167Efficient statesConstant -143.88 (0.504) -120.07 (0.238)Literacy (1991) 22.25 (3.169) -3.37 (0.272)Per capita income(1995-96)
-0.041 (2.737) 0.092 (3.465)
2R (N=16) 0.3561 0.6088Inefficient statesConstant 2862.933 (1.928) 1068.55 (2.264)Literacy (1991) -29.899 (1.439) -1.88 (0.285)Per capita income(1995-96)
0.154 (1.803) -0.015 (0.551)
2R (N=11) 0.1907 0.1789Note: Figures in parenthesis show the t-statistics..
VI. Public expenditure on education in India

30
The sources of finance for education in India are the central andthe state governments, local bodies, consumers of education (fees, etc.),and foreign aid. Primary among these is the source of state governments.However, the role of the central government is crucial because itsexpenditure is of strategic importance. It not only expands existingprogrammes, but also funds new programmes and initiatives.
The share of expenditure on education in GDP increased from 1.19 percent in 1951 (not given in the table) to 2.78 per cent in 1975-76 (TableX), i.e. more than double the share. It peaked at 3.87 per cent in 1990-91, after which it suffered a decline, from which it never recovered till1998-99, and it even fell below the levels achieved in the eighties. Thetarget of 6 per cent of GDP (Government of India 1968) was neverachieved. Elementary education was always accorded the highestpriority in government budgets, but could never reach 50 per cent of thetotal central and state government budgets on education (revenueaccount).
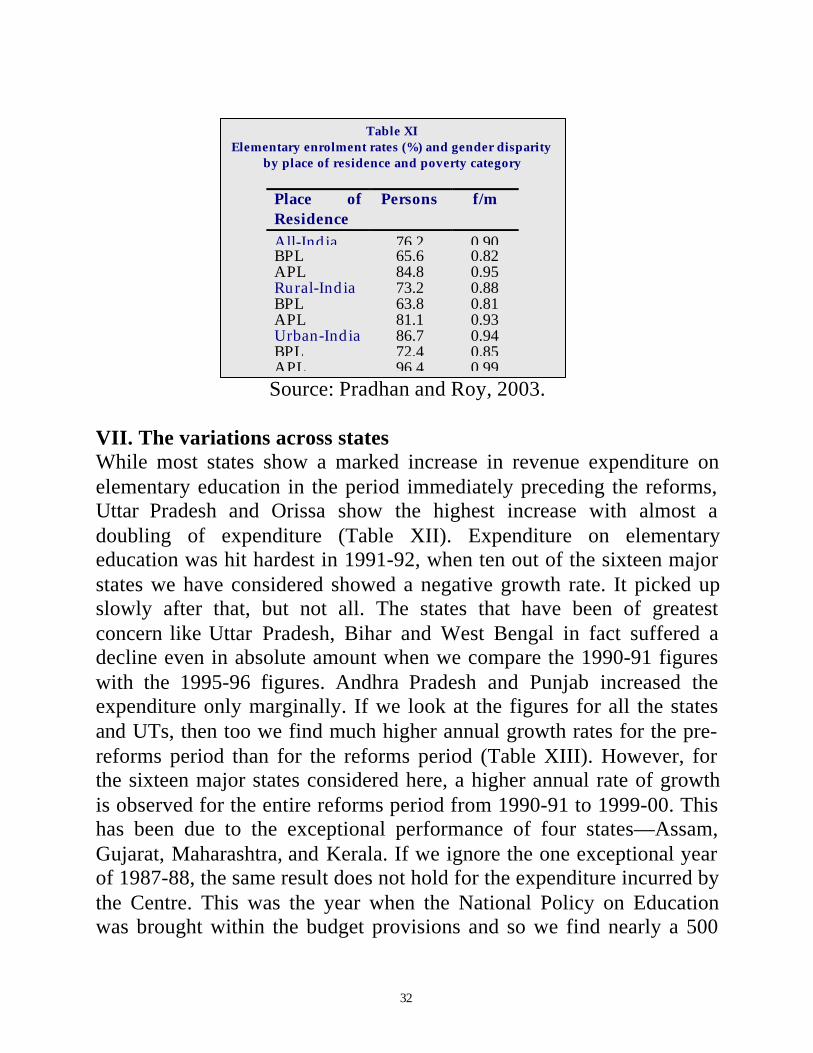
The target of free and compulsory education for all below 14 yearsof age—set in 1950, the target was to be attained by 1960—is yet to befulfilled till date. Although there has been progress, the current levels ofelementary enrolment continue to be low (Table XI). The fact that theenrolment rates are lower for the below-poverty-line (BPL) householdsas against the above-poverty-line (APL) households, and that they arelower for rural areas as compared to urban areas, lays further emphasison the role of the state. The state needs to take care of the specialproblems that the vulnerable groups may face to improve the educationalstatus of the population. Of special concern here is the status of women,particularly so because their education has the most crucial effect on thehealth and education of children. As can be seen from Table XI, theirposition is worse in the case of the BPL group and in rural areas.
Table X: Trends in expenditure on educationYear Educational
expenditure asPercentage allocation of
total (Centre+state) budget

31
percentage of GDP -All India
to elementary education
1975-76 2.78 46.21980-81 2.96 45.51985-86 3.53 46.21990-91 3.87 46.31991-92 3.72 46.31992-93 3.67 45.21993-94 3.52 46.21994-95 3.50 46.41995-96 3.46 48.31996-97 3.46 49.11997-98 3.53 49.61998-99 3.90 49.11999-2000
4.07 48.1
Source: Government of India, 2003.
A study by the Institute of Applied Manpower Research (IAMR) of thelevel of educational deprivation for 1991 and 1996 in sixteen majorstates has considered financial allocation as one of the major variables inmeasuring the educational status of the states (IAMR 1999). The studyconcludes that per capita allocations were low for the states with higherdeprivation values and high for the states with lower deprivation valuesand that a substantial increase is necessary to reduce deprivation levels.Since a greater part of the spending effort is undertaken by the states,their expenditure patterns need to be reviewed. This needs to becomplemented by the pattern of household spending. Since educationexpenditure on the capital account is very small, the expenditure on therevenue account alone has been considered.
32
Source: Pradhan and Roy, 2003.
VII. The variations across statesWhile most states show a marked increase in revenue expenditure onelementary education in the period immediately preceding the reforms,Uttar Pradesh and Orissa show the highest increase with almost adoubling of expenditure (Table XII). Expenditure on elementaryeducation was hit hardest in 1991-92, when ten out of the sixteen majorstates we have considered showed a negative growth rate. It picked upslowly after that, but not all. The states that have been of greatestconcern like Uttar Pradesh, Bihar and West Bengal in fact suffered adecline even in absolute amount when we compare the 1990-91 figureswith the 1995-96 figures. Andhra Pradesh and Punjab increased theexpenditure only marginally. If we look at the figures for all the statesand UTs, then too we find much higher annual growth rates for the pre-reforms period than for the reforms period (Table XIII). However, forthe sixteen major states considered here, a higher annual rate of growthis observed for the entire reforms period from 1990-91 to 1999-00. Thishas been due to the exceptional performance of four states—Assam,Gujarat, Maharashtra, and Kerala. If we ignore the one exceptional yearof 1987-88, the same result does not hold for the expenditure incurred bythe Centre. This was the year when the National Policy on Educationwas brought within the budget provisions and so we find nearly a 500
Table XIElementary enrolment rates (%) and gender disparity
by place of residence and poverty category
Place ofResidence
Persons f/m
All-India 76.2 0.90BPL 65.6 0.82APL 84.8 0.95Rural-India 73.2 0.88BPL 63.8 0.81APL 81.1 0.93Urban-India 86.7 0.94BPL 72.4 0.85APL 96.4 0.99
33
per cent increase in expenditure. Barring this exception, the Centre’scontribution to elementary education seems to have increased steadily inthe reforms period. But such stability is not found in the contributionsmade by the states. West Bengal shows a negative growth rate for theperiod 1990-91 to 1995-96 and a small 2 per cent rate of growth for theentire reforms period. For the ten-year period from 1985-86 to 1995-96,Andhra Pradesh, Bihar and West Bengal have shown the greatestinstability in expenditure, in that comparatively there were many yearsin which there was a negative growth rate (not shown in the table). In thecase of West Bengal, as already noted above, it was entirelyconcentrated in the reforms period.
Comparing the average annual growth rates for the pre-reformsand the reforms periods (Table XIII), we generally find a sharp declinein the rate of growth of revenue expenditure on elementary education inthe period immediately following the introduction of reforms (viz. 1991-92 to 1993-94). That tends to get corrected when we consider a longerperiod in the reforms period up to 1995-96. The exceptions are Gujarat,which shows a continuous increase, and Karnataka, which shows anincrease in the initial period of reforms and a subsequent decline (can beseen from Table XII). Maharashtra, Gujarat, and Assam managed toovercome the initial shock of reforms and the rates of growth from1991-92 to 1995-96 turn out to be higher than from 1985-86 to 1990-91.On the other hand, Andhra Pradesh, Himachal Pradesh, Karnataka, andPunjab have shown a lower rate of growth for the period 1990-91 to1995-96 than in the initial years of reforms. But Bihar, Uttar Pradesh,and West Bengal show a negative growth rate for the reforms period upto 1995-96. Even considering the period up to 1999-00, since theintroduction of reforms only six states show a higher annual growth ratethan the pre-reforms period. Overall, reforms have had a negative impacton the rate of growth of revenue expenditure on elementary education,and the recovery has not been strong enough even over a longer timehorizon except for Kerala, Maharashtra, Gujarat, and Assam.

34
If we look at the period between 1985-86 and 1993-94, Orissa, HimachalPradesh, and Karnataka had the highest rates of growth. Gujarat, WestBengal, and Kerala had the lowest rates of growth of elementaryeducation expenditure, in that order. However, the period up to 1995-96shows that Orissa, Rajasthan, and Himachal Pradesh had the highestgrowth rates while Andhra Pradesh, West Bengal and Punjab had thelowest. For the period up to 1999-00, it is found that Punjab comes tothe bottom of the list and Himachal Pradesh moves to the secondposition. Punjab and West Bengal, thus, were affected the most by theintroduction of reforms in terms of expenditure on elementary education.But looking merely at rates of growth of public expenditure on educationis not enough. What we need to do is to complement the analysis oftrends in financing elementary education with the results in terms ofeducational achievements and the level as well as quality of services.
Table XII: Public expenditure Index with base year 1985-86as 100
State 1985-86
1990-91
1991-92
1993-94
1995-96
1996-97
1999-00
Andhra Pradesh 100 123.3 119.2 130.2 124.2 120.8 188.3Assam 100 132.7 144.6 157.5 194.6 209.0 298.6
Bihar 100 157.6 145.9 146.6 154.3 179.3 282.4Gujarat 100 111.7 114.1 121.8 143.0 148.9 196.8Haryana 100 155.7 148.1 159.4 191.4 178.0 225.1HimachalPradesh
100 180.6 155.3 211.5 197.1 210.8 316.4
Karnataka 100 136.4 137.8 185.8 169.9 191.1 249.7Kerala 100 125.5 113.3 124.3 153.4 159.7 213.8Madhya Pradesh 100 151.1 151.1 161.0 186.1 188.2 201.1Maharashtra 100 127.1 143.5 134.0 183.6 164.2 239.2Orissa 100 186.1 209.5 228.8 271.6 264.2 377.2Punjab 100 133.7 122.0 144.2 136.4 141.0 164.7Rajasthan 100 165.3 151.9 165.2 216.1 225.4 313.3

35
Tamil Nadu 100 150.7 156.1 157.3 163.4 170.8 203.2Uttar Pradesh 100 210.1 162.5 170.4 180.2 215.6 278.1West Bengal 100 150.9 131.8 124.4 129.2 123.3 180.2Total 100 149.0 142.1 150.6 201.1 225.6 366.7Total (All States& UTs)
100 148.8 142.2 150.2 169.6 177.1 239.6
Centre (Total) 100 627.7 691.2 916.2 2471.5
3612.1
4046.1
Grand Total 100 148.4 142.4 151.6 180.9 195.8 259.2Source: Government of India, 1995, and Government of India, Analysis
of Budgeted Expenditure on Education, various years.
We arrived at the inter-state differences in public expenditure perchild, by taking the average of expenditures at constant prices (base1993-94) for the period 1993-94 to 1995-96 and dividing it by the 6–14year child population on September 30, 1993. The highest spender cameout to be Himachal Pradesh, while the lowest was West Bengal. Of the16 major states considered here, seven states had expenditure less thanthe average of Rs 654. Orissa is just at the average when expenditure bythe Centre is included and slightly above the average when only thecombined average for states and Union Territories is considered. Theworst performers turn out to be West Bengal, Uttar Pradesh, AndhraPradesh and Bihar, in that order. The best are Himachal Pradesh,Kerala, Gujarat, Assam, and Tamil Nadu, in a descending order.
Table XIII: Average annual growth rate of public expenditureon elementary educationState Pre
reforms
Reforms period Including both prereforms andreforms period

36
1985-86 to1990-91
1991-92 to1993-94
1991-92 to1995-96
1991-92 to1999-00
1985-86 to1993-94
1985-86 to1995-96
1985-86 to1999-00
Andhra Pradesh 4.27 1.85 0.15 4.82 3.36 2.19 4.62Assam 5.82 5.86 7.95 9.43 5.84 6.88 8.13Bihar 9.52 -2.37 -0.42 6.69 4.90 4.44 7.70Gujarat 2.24 2.92 5.06 6.50 2.50 3.64 4.96Haryana 9.26 0.78 4.22 4.18 6.00 6.71 5.97HimachalPradesh
12.54 5.41 1.77 6.43 9.81 7.02 8.58
Karnataka 6.41 10.84 4.49 6.95 8.05 5.45 6.75Kerala 4.66 -0.32 4.09 6.09 2.76 4.37 5.58MadhyaPradesh
8.60 2.15 4.25 3.23 6.14 6.41 5.12
Maharashtra 4.91 1.79 7.64 7.28 3.73 6.26 6.43Orissa 13.22 7.14 7.86 8.17 10.90 10.51 9.95Punjab 5.98 2.55 0.40 2.34 4.68 3.15 3.63Rajasthan 10.57 -0.01 5.51 7.36 6.48 8.01 8.50Tamil Nadu 8.54 1.45 1.64 3.38 5.83 5.03 5.20Uttar Pradesh 16.01 -6.75 -3.02 3.16 6.89 6.07 7.58West Bengal 8.58 -6.23 -3.06 1.99 2.77 2.59 4.29Total 8.30 0.37 6.18 10.53 5.25 7.23 9.72Total (All states& UTs)
8.28 0.30 2.65 5.43 5.21 5.43 6.44
Centre (Total) 44.39 13.43 31.54 23.00 31.90 37.81 30.25Grand total 8.21 0.72 4.04 6.40 5.34 6.11 7.04Source: Calculations based on Govt. of India, 1995 and Analysis ofBudgeted Expenditure on Education, various years.
It must be noted here that Kerala and Himachal Pradesh show thelowest dropout rates and the best teacher–pupil ratio in 1996—the twoindicators, our analysis shows, are affected the most by publicexpenditure. An interesting case is that of Rajasthan, which is often

37
clubbed with Uttar Pradesh and Bihar. Rajasthan features among thehigher-than-average spenders on elementary education. Figure VIIshows the percentage of the total (plan + non-plan) budgeted revenueexpenditures that goes to elementary education for the worst performersmentioned above. Bihar does provide a large share to elementaryeducation (although the absolute amount is very low). While it has goneup for Uttar Pradesh, it has been declining for Haryana and WestBengal. There seems to be an effort being made by Bihar and UttarPradesh to take care of elementary education. Figure VIII presents theshare of elementary education on the revenue account in the totalbudgeted expenditure on education for the better-performing states.Orissa, which comes closest to the all-India average, has put in a highershare for elementary education. Gujarat shows an increasing trend ingeneral. Himachal Pradesh has maintained a more than 50 per cent shareof elementary education. Kerala and Tamil Nadu show almost the samelevels of share of elementary education that is tending towards the 50per cent level. Thus, in the reforms period there seems to be greaterstress being placed by the low-performing states of Bihar and UttarPradesh on basic education in terms of allocation to elementaryeducation. West Bengal, on the other hand, not only spends less onelementary education per child but is also reducing the share ofelementary education in the total expenditure on education. This couldlead to a dismal state of the education sector in this state.
Figure VII: Percentage share of elementary education in total expenditure (revenue account) on education for bad performers
0
10
20
30
40
50
60
70
80
1992-93 1993-94 1994-95 1995-96 1996-97 1997-98 1998-99 1999-00
Year
Per
cen
tag
e o
f T
ota
l R
even
ue
Exp
end
itu
re
on
Ed
uc
ati
on
AndhraPradesh
Bihar
WestBengal
UttarPradesh
Haryana

38
Source: Government of India, Analysis of Budgeted Expenditure, variousyears. Figures for 1999-00 are Budget Estimates.
Source: Government of India, Analysis of Budgeted Expenditure, variousyears. Figures for 1999-00 are Budget Estimates.
VIII. ConclusionElementary education gains relevance because it is the base of the
educational pyramid, and the success of East Asian economies has givenfurther credence to the idea of having a wider educational base. Sinceeducation has the nature of both a public and private good, there is acase for the cost of education to be shared by both the state as well as theindividual. Further, in a poor country like India, elementary educationneeds to be fully financed by the state, especially for the poorer groups.
The importance of public expenditure cannot be gainsaid,particularly in retaining children in school and improving the quality ofservices. Public expenditure per child and the rate of growth ofexpenditure did not seem to have a strong influence on the rate ofenrolment for 16 major states of India. However, the argument that thequality of schooling and public expenditure on education does not affecteducational output may be due to the fact that the efficiency of thisexpenditure is ignored. Once the efficiency of expenditure is taken note
Figure VI I I : Percentage share o f e lementary educat ion in to ta l expend i ture ( revenue accoun t ) on educa t ion fo r good per fo rmers
0
1 0
2 0
3 0
4 0
5 0
6 0
7 0
1 9 9 2 -9 3
1 9 9 3 -9 4
1 9 9 4 -9 5
1 9 9 5 -9 6
1 9 9 6 -9 7
1 9 9 7 -9 8
1 9 9 8 -9 9
1 9 9 9 -0 0
Y e a r
Pe
rce
nta
ge
Sh
are
in
To
tal
Ex
pe
nd
itu
re o
n E
du
ca
ton
H i m a c h a l P r a d e s h
Kera la
O r i s s a
T a m i l N a d u
Gu ja ra t

39
of, the effect is seen to be stronger. In general, it may be argued thatsome states employ better educational processes so that the link betweenschool input and educational outcome becomes stronger. In these states,increases and decreases in public expenditure would influence outcomestrongly. While public expenditure may not directly influence privateexpenditure on education, it certainly does have an effect via improvedquality and greater expenditure efficiency. Literacy rates as well as statedomestic product were seen to have a positive influence on education. Ahigher level of education is seen to positively influence publicexpenditure on education and may influence the government to improvethe quality of services. Higher per capita income has a strong link withprivate expenditure on education, which may be related to both—ahigher capacity to incur expenditure as well as a perception of returnsfrom education. Thus, a virtuous cycle is likely to start with the demand-and supply-side factors positively influencing each other. The state thenneeds to take care of factors that influence demand for education, moreimportantly, non-monetary constraints that generate interest ineducation. The low rates of return to lower levels of education, noted inthe literature in the Indian context, coupled with the high expenditurethat households incur, tend to explain the lack of interest shown byhouseholds in providing education for children. It also suggests thatgovernment expenditure directed at reducing the expenditure ofhouseholds on books, uniform and examination and other fees mayprove to be demand-inducing, and hence, increase enrolments.
Although elementary education has been given high priority by thestate in India in terms of the share of expenditure on elementaryeducation in GDP, the targeted level of 6 per cent was never achieved.What is of great concern is that the enrolment rates remain low evenafter 50 years of independence, particularly in the case of the poor,women and those residing in rural areas. Public expenditure, thus,assumes a very significant role, keeping in mind the externalitiesassociated with education. The state governments incur a major part ofthe spending. Since spending is related to deprivation levels, the stategovernments assume a special role in improving the educational level.

40
The regional variations in educational achievements also suggest thesame conclusion. Kerala and Himachal Pradesh, with the highest perchild public expenditure, have the lowest dropout rates and the lowestnumber of students per teacher. The level of 50 per cent of the totalbudgeted expenditure on education may be the level that other statesneed to target.
The reforms brought a break in the growth rates of publicexpenditure on elementary education, from which not all the states couldrecover. Only the Centre maintained a continuous growth in expenditure.The worst performers such as Uttar Pradesh and Bihar showed thegreatest negative impact of reforms. The worst affected was WestBengal. What is important is that the laggards in terms of educationalachievements seem to be spending more on elementary education inorder to correct the historical anomaly. This is an encouraging sign.
References
Blaug, M (1970): Introduction to Economics of Education, Allen Lanethe Penguin, London.
Blaug, M, P R G Layard, and M Woodhall (1969): The causes ofGraduate Unemployment in India, Allen Lane the Penguin,London.
Bowman, M J, and C A Anderson (1963): “Concerning the role ofEducation in Development,” in C Geertz (ed.), Old Societies andNew States: The Quest of Modernity in Asia and Africa, Free Press,Glencoe, Ill.
Bourguignon, Francois, and Christian Morrisson (1992): Adjustment andEquity in Developing Countries: A New Approach, Organisation forEconomic Co-operation and Development, Paris.

41
Caldwell, John C (1980): “Mass Education as a Determinant of theTiming of Fertility Decline,” Population and Development Review,6(2), pp. 225-55.
Case, Anne, and Angus Deaton (1999): “School Inputs and EducationalOutcomes in South Africa,” The Quarterly Journal of Economics,Vol. 114(3), August, 1047-84.
Chaudhri, D P (1979): Education, Innovations, and AgriculturalDevelopment, Croom Helm, London.
Clements, Benedict (1999): “The Efficiency of Educational Expenditurein Portugal,” IMF Working Paper, WP/99/179, December.
Dearden, Lorraine, Javier Ferri, and Costas Meghir (2002): “The Effect ofSchool Quality on Educational Attainment and Wages,” The Reviewof Economics and Statistics, February, 84 (1), 1-20.
Dreze, J, and Geeta G Kingdon (1999): “School Participation in RuralIndia,” Development Economics Discussion Paper Series No. 18,STICERD, London School of Economics, London.
Dreze, J, and A Sen (1995): India: Economic Development and SocialOpportunity, Oxford University Press, New Delhi.
Dreze, J, and M Saran (1993): “Primary Education and EconomicDevelopment in China and India: Overview and Two CaseStudies,” Development Economics Research Programme,STICERD, London School of Economics, London, DEP No. 47,Sep.
Feinstein, Leon, and James Symons (1999): “Attainment in SecondarySchool,” Oxford Economic Papers, 51, 300-321.

42
Friedman, Milton (1955): The Role of Government in Education, in RSolow (ed.) Economics and the Public Interest, Rutgers UniversityPress, New Brunswick, NJ, 124-25.
Government of India (1968): National Policy on Education 1968,Ministry of Education, New Delhi.
Government of India (1993): Selected Educational Statistics, Ministry ofHuman Resources Development, New Delhi.
Government of India (1995): Budgetary Resources for Education (1951-52 to 1993-94), Department of Education, Ministry of HumanResources Development, New Delhi.
Government of India, Analysis of Budgeted Expenditure on Education,Ministry of Human Resource Development, New Delhi, variousyears.
Government of India (1997a): Selected Educational Statistics, Ministryof Human Resources Development, New Delhi.
Government of India (1997b): Analysis of Budgeted Expenditure onEducation, 1993-94 to 1995-96, Ministry of Human ResourceDevelopment, New Delhi.
Government of India (1998a): Analysis of Budgeted Expenditure onEducation, 1994-95 to 1996-97, Ministry of Human ResourceDevelopment, New Delhi.
Government of India (1998b): Education in India, Vol. I (S), Ministry ofHuman Resource Development, New Delhi.
Government of India (2000): Economic Survey 1999-2000, Ministry ofFinance, New Delhi.

43
Government of India (2003): Selected Socio-economic Statisitcs India2001, Ministry of Statistics and Programme Implementation, NewDelhi.
Gupta, Sanjeev, and Marjin Verhoeven (2001): “The Efficiency ofGovernment Expenditure: Experiences from South Africa,”Journal of Policy Modelling, 23 (4), May, 433–67.
Hanushek, Erik (1986): “The Economics of Schooling: Production andEfficiency in Public Schools,” Journal of Economic Literature,XXIV, 1141–1177.
Hanushek, Erik (1995): “Interpreting Recent Research on Schooling inDeveloping Countries,” World Bank Research Observer, X (2),August, 227–246.
Harbison, Ralph, and Eric Hanushek (1994): Educational Performanceof the Poor: Lessons from Rural Northeast Brazil, OxfordUniversity Press, Oxford.
Hicks, N, and A Kubisch (1984): “Cutting Government Expenditures inLDCs,” Finance and Development, Vol. 21, No. 3.
Inchauste, G (2000): Educational Choices and Educational Constraints:Evidence from Bolivia, IMF Working Paper, WP/00/42, March2000.
Institute of Applied Manpower Research (1999): EducationalDeprivation Index, New Delhi, March 1999.
Kingdon, Geeta Gandhi (1998): “Does the Labour Market Explain LowerFemale Schooling in India?”, The Journal of Development Studies,Vol. 35, No. 1
44
Kremer, Michael R (1995): “Research on Schooling: What We Knowand What We Don’t A Comment on Hanushek”, World BankResearch Observer, Vol 10, No. 2, 247-54.
Lau, L J, D T Jamison, S C Liu, and S Rivkin (1993): “Education andEconomic Growth: Some Cross-Sectional Evidence from Brazil,”Journal of Development Economics, Vol. 41, 45–70.
Lucas, R E (1988): “On the Mechanics of Economic Development,”Journal of Monetary Economics, Vol. 22, 3–22.
Majumdar, Tapas (1983): Investment in Education and Social Choice,Cambridge University Press, Cambridge.
Marshall, Alfred (1890): Principles of Economics, sixth edition, 1910, p.217
Mathur, A (1993): “The Human Capital Stock and Regional EconomicDevelopment in India,” in S C Nuna (ed.) Regional Disparities inEducational Development, South Asian Publishers, New Delhi.
Musgrave (1959): The Theory of Public Finance, McGraw Hill, NewYork.
National Sample Survey Organisation (NSSO) (1998): Attending anEducational Institution in India: Its Level, Nature and Cost, NSSFifty-second Round, July 1995–June 1996, Department ofStatistics, Government of India, 432 (52/25.2/1).
NCERT (1997): Educational Facilities in Rural and Urban Areas, SixthAll India Educational Survey, National Tables, Volume I, NewDelhi.

45
Pal, S P, and D K Pant (1995): “Strategies to Improve School EnrolmentRate in India,” Journal of Educational Planning andAdministration, Vol. IX, No. 2, April, New Delhi.
Patel, S J (1985): “Educational ‘Miracle’ in Third World, 1950 to 1981,”Economic and Political Weekly, Aug 3, Vol XX, No. 31: 1312–17.
Pradhan, B K, and P K Roy (2003): The Well Being of Indian Households:MIMAP-India Survey Report, Tata-McGraw Hill, New Delhi.
Pradhan, B K, & A Subramanian: “Education and the Poor: Evidencefrom a Household Survey,” A previous version of the paper waspresented at “A Regional Consultation on WDR 2001 for SouthAsia,” April 4–6, 1999, Rajendrapur, Bangladesh, jointly organisedby the Bangladesh Institute of Development Studies and the WorldBank.
PROBE Team (1999): Public Report on Basic Education in India,Oxford University Press, New Delhi
Psacharopoulos, G (1993): “Returns to Investment in Education: AGlobal Update,” PPR Working Paper No. WPS 1067, World Bank,Washington D.C.
Psacharapoulos, G, and M Woodhall (1985): Education forDevelopment: An Analysis of Investment Choices, Oxford for theWorld Bank, New York.
Romer, P M (1986): “Increasing Returns and Long-Run Growth,”Journal of Political Economy, Vol. 94, 1002–37.

46
Sahn, David E (1987): “Changes in the Living Standards of the Poor in SriLanka during a Period of Macroeconomic Restructuring,” WorldDevelopment, Vol. 15, No. 6, pp. 809-830.
Sahn, David E (1992): Public Expenditures in Sub-Saharan Africa duringa Period of Economic Reforms, World Development, Vol. 20, No. 5,pp. 673-693.
Singh, Ram D, and Maria Santiago (1997): “Farm Earnings, EducationalAttainment and Role of Public Policy: Some Evidence fromMexico,” World Development, 25 (12), December, 2143–54.
Sipahimalani, Vandana (1999): “Education in the Rural Indian Household:A Gender Based Perspective,” NCAER Working Paper No. 68,June.
Taylor, L (1993): “Stabilisation, Adjustment and Reform,” in L Taylor(ed.), The Rocky Road to Reform, MIT Press, Cambridge.
Tilak, Jandhyala B G (1987): Economics of Inequality in Education,Sage Publications/ Institute of Economic Growth, New Delhi.
Tilak, Jandhyala B G (1989): “Education and its Relation to EconomicGrowth, Poverty and Income Distribution”, Discussion Paper no.46, World Bank, Washington D.C.
Tilak, Jandhyala B G (2002): “Determinants of Household Expenditureon Education in India, Working Paper Series No. 88, NationalCouncil of Applied Economic Research, New Delhi.
United Nations (1996): Economic and Social Survey of Asia and thePacific 1996, New York.
World Bank (1993): The East Asian Miracle, Oxford University Press,New York.