protect school meal programs: provide … school meal programs: provide commonsense flexibility so...
TRANSCRIPT

120 Waterfront St. | Suite 300 | National Harbor, MD 20745 | phone: 301.686.3100 • 800.877.8822 | fax: 301.686.3115 | www.schoolnutrition.org
PROTECT SCHOOL MEAL PROGRAMS: Provide commonsense flexibility so schools can prepare healthy meals
that students will eat!
The School Nutrition Association (SNA) represents 55,000 school nutrition professionals nationwide who know firsthand how USDA’s new school meal regulations have impacted school menus, student acceptance of school meals and school district budgets. SNA members continue to support strong federal nutrition standards. We are seeking commonsense flexibility to help students adjust to healthy changes in their school cafeterias, to increase the number of children who benefit from healthy school meals, and to keep meal programs financially stable.
Since the new standards were implemented in 2012, more than one million fewer students choose school lunch each day, diminishing the intent of Healthy, Hunger-Free Kids Act (HHFKA) to promote healthier diets for students. SNA’s “School Nutrition Operations Report: The State of School Nutrition 2014,” found that this decline in lunch participation has occurred at the elementary, middle and high school levels, despite an increase in enrollment in schools participating in the National School Lunch Program (NSLP). This decrease in participation significantly reduces revenue for school meal programs already struggling with the higher cost of preparing meals that meet the new standards. USDA estimates that the new rules will force schools to absorb $1.22 billion in new costs in FY 2015, with increased food and labor costs equivalent to about $.10 for each reimbursable school lunch and $.27 for breakfast. To manage these costs, schools were only provided an additional $.06 for lunch and no additional support for breakfast. When school meal programs cannot cover their losses, school districts must pick up the tab. SNA is requesting commonsense flexibility under the new standards to help students adjust to these changes, increase the number of children participating in the school lunch program and keep school meal programs financially stable. Specifically, SNA is asking:
• Retain the 2012 requirement that half of grains offered with school meals be whole grain rich rather than mandating that all grains be whole grain rich;
• Retain the Target 1 sodium levels, and suspend implementation of further reductions unless and until scientific research supports such limits for children;
• Offer, but don’t require that students take a fruit or vegetable as part of a reimbursable meal, as this requirement has increased food waste; and
• Allow healthy foods served with school meals to be sold at any time as an a la carte item.
120 Waterfront St. | Suite 300 | National Harbor, MD 20745 | phone: 301.686.3100 • 800.877.8822 | fax: 301.686.3115 | www.schoolnutrition.org
SNA is asking Congress and USDA to: 1. Retain the 2012 requirement that half of grains offered with school meals be whole grain rich rather than
mandating that all grains be whole grain rich.
As of July 2014, all grains offered with school meals must be whole grain rich, compared to the 2012 standard where only half of all grains offered had to be whole grain rich. Many students have adjusted to whole grain rich breads; however, schools nationwide have struggled to find acceptable specialty whole grain rich items, such as tortillas and biscuits. Challenges include limited availability of whole grain rich products in rural areas, higher costs and strong regional preferences for refined grains such as white rice or tortillas. While the 2010 Dietary Guidelines for Americans encourages whole grains, guidance allows for consumption of refined grains.
2. Retain the Target 1 sodium levels, and suspend implementation of further sodium levels unless and until scientific research supports such reductions for children.
Schools have already made significant reductions in the sodium levels on school menus to meet the first sodium reduction target, which went into effect in July 2014. Before school meal programs are forced to make additional costly changes, more scientific research should be done into the efficacy of further reducing children’s sodium intake. The Institute of Medicine states that before advancing to Target 2, “it would be appropriate to assess progress and effects of the actions on student participation rates, food cost, safety and food service operations to determine a reasonable target for the next period. The committee recognizes that reducing the sodium content of school meals as specified and in a way that is well accepted by students will present major challenges and may not be possible.” (School Meals: Building Blocks for Healthy Children) Naturally occurring sodium present in milk, meats and other foods, make the later sodium targets extremely difficult to achieve. Popular and healthy choices such as low-fat, whole grain cheese pizza, many Asian dishes and deli sandwiches could be stripped from school menus if manufacturers are unable to develop products that meet these extreme standards.
3. Offer, but don’t require that students take a fruit or vegetable as part of a reimbursable meal, as this
requirement has increased food waste.
SNA supports requirements to offer larger servings and a wider variety of fruits and vegetables with school meals. Through nutrition education programs, student taste tests and other cafeteria initiatives, schools are encouraging students to choose the produce available with school meals. However, some students simply do not want to take a fruit or vegetable with every single meal. The new mandate forcing students to take a food they don’t want on their tray has led to increased program costs, plate waste, and a decline in student participation.
120 Waterfront St. | Suite 300 | National Harbor, MD 20745 | phone: 301.686.3100 • 800.877.8822 | fax: 301.686.3115 | www.schoolnutrition.org
A recent study in Public Health and Nutrition found that this mandate to serve results in a nearly 100% increase in wasted fruits and vegetables or $3.8 million thrown into the trash each day.1 That adds up to $684 million in wasted produce each school year, which is enough to serve complete reimbursable school lunches to more than 228 million students, or three times the total budget of the Fresh Fruit and Vegetable Program, designed to introduce and promote produce to low income students.
4. Allow healthy foods served with school meals be sold at any time as an a la carte item.
As required by HHFKA, the Smart Snacks in School rule establishes new nutrition standards for “competitive” foods and beverages sold a la carte, in vending machines and in snack bars during the school day. As a result, before school cafeteria professionals can sell healthy school meal entrees or sides as a la carte choices, they must re-evaluate those foods based on different set of complex nutrition standards, adding another cumbersome and unnecessary layer to menu planning and purchasing. A food that is nutritious enough to meet strict school meal standards is nutritious enough to be sold as a competitive food. Based on recommendations from the Institute of Medicine, school meal standards gradually phase in sodium reductions in school meals over a 10 year period. The Smart Snack rules do not – forcing competitive foods to meet excessively low sodium limits this year. The Smart Snacks sodium limit for an entrée is 480mg. Two ounces of USDA’s reduced sodium ham nearly exceeds this limit with 476mg of sodium. Schools have reported having to take deli sandwiches and even salads off the menu because the sodium in cheese or dressing often exceeds the Smart Snacks limits. Many students are not hungry enough to eat a complete school meal, while others rely on competitive food choices to supplement food brought from home. Excessively limiting the healthy foods available for sale in the school cafeteria frustrates students, and could drive many students to seek unhealthy options from fast food or convenience stores. By allowing foods that meet nutrition standards for school meals to be sold as daily competitive food choices, USDA can help preserve the financial stability of school meal programs, reduce administrative burdens for meal program operators, and ensure students can choose from a variety of healthy choices in the cafeteria.
1 David Just and Joseph Price (2013). Default options, incentives and food choices: evidence from elementary-school children. Public Health Nutrition, 16, pp 2281-2288. doi:10.1017/S1368980013001468.

Myth vs. Fact on Healthy, Hunger-Free Kids Act School Meals Implementation
The School Nutrition Association (SNA), representing 55,000 school nutrition professionals working in cafeterias nationwide, is calling on Congress to provide reasonable flexibility to help schools plan healthy meals that students will eat. Some critics of providing relief to struggling school meal programs have released misleading information about the challenges schools have faced under the new regulations: MYTH: “Over 90 percent of schools report that they are successfully meeting the updated nutrition standards.” FACT: No school has been certified as meeting the updated nutrition standards that took effect July 1, 2014, including sodium limits, the requirement that 100% of grains be whole grain rich, and the mandate to offer a full cup of fruit at breakfast. In addition, schools must meet the Smart Snacks in Schools rule, which limits the calories, fat, sodium and portion sizes for foods and beverages sold in school vending machines, snack bars and a la carte lines. However, even before then, the US Department of Agriculture (USDA) had no data to show that 90% of schools were “successfully” meeting standards. Schools were not asked to report on how new standards have impacted student participation, costs, revenues and food waste. USDA only evaluated one week of school menus to determine if schools are “compliant” with the standards, and does not require schools to report on whether menu adjustments are sustainable and accepted by students. While there have been many successes, such as offering a wider variety of vegetables and exposing students to more whole grains, the significant challenges and unintended negative consequences of meeting the standards are a reality for schools across the country. MYTH: “School lunch revenue is up.” FACT: School meal programs are not required to report revenues and expenditures to USDA. There has not been any USDA data released indicating adjustments to federal reimbursements have compensated for the significant increased costs associated with meeting the new nutrition standards, as well as escalating food prices. USDA acknowledged in the final regulations that under the new standards “estimated increases in food and labor costs are equivalent to about 10 cents for each reimbursable school lunch and about 27 cents for each reimbursable breakfast in FY 2015.” While no support is provided for breakfast, these rough estimates far exceed the 6 cents per lunch that schools have been provided to meet the new standards. SNA’s 2013 Back to School Trends Survey found that in the 2012-2013 school year 47% of school meal programs reported revenue declined while more than nine of ten reported food costs were up. In addition, 54.3% of school nutrition district directors anticipated that reimbursement rates would be
insufficient to cover the costs of producing school lunches this school year, with another 23.6% reporting they were “not sure” reimbursements would cover costs. Here are specific examples of school meal program budgetary challenges under the new standards:
Since the new standards took effect, Mead School District (Washington) student lunch
participation is down by 4.5% while produce costs have increased over $30,000. This year the
program budget will be in the red for the first time in 5 years, forcing the program to reduce
labor.
This year, Shawnee Public Schools (Oklahoma) has experienced an 80% increase in costs of their
produce and grain purchases.
In an effort to combat student plate waste, Alexandria Public Schools (Virginia) switched from
serving whole apples to sliced apples. The change cost the meal program $10,000 per year.
One Connecticut school district with an enrollment of 9,800 students and 17 percent
free/reduced price meal eligibility is losing money for the first time in decades. Last month, the
program operated at a $98,000 loss, down from a surplus of $198,000 in 2011.
Spring Independent School District’s (Texas) annual produce bill has increased $290,400 since
last year. At the same time, their annual paid lunch participation has declined by 14,672 meals.
During the 2012-13 school year, Seattle Public Schools (Washington) experienced a $117,839
annual increase in produce costs, which contributed to an end of the year loss of $257,668. In
school year 2011-12, before the new standards took effect, the district enjoyed a $83,531
surplus.
MYTH: “Participation is increasing substantially in many areas of the country.” FACT: USDA’s national and state level participation data highlight the challenges school meal programs have faced under the new regulations. After thirty years of steady growth in the National School Lunch Program (NSLP), student participation is abruptly down in 49 states. Under the new standards more than one million fewer students choose school lunch each day even though student enrollment in NSLP schools has increased by over a million students just in the last year. MYTH: “Healthy food standards have not increased food waste.” FACT: Researchers from Cornell and Brigham Young Universities published a study in Public Health and Nutrition1 showing that the mandate to serve a fruit or vegetable with each school meal results in a nearly 100% increase in waste with about $3.8 million worth of produce being thrown the trash each day, or $684 million in food waste per year.
1 David Just and Joseph Price (2013). Default options, incentives and food choices: evidence from elementary-
school children. Public Health Nutrition, 16, pp 2281-2288. doi:10.1017/S1368980013001468.
$684 million is enough to serve complete reimbursable school lunches to more than 228 million students or three times the total budget of the Fresh Fruit and Vegetable Program, designed to
introduce and promote produce to low income students.
School cafeteria staff have been offering a wide variety of produce and encouraging students to eat it, but forcing students to take food that they don’t want is a recipe for failure. A recent Harvard School of Public Health study revealed a slight increase in student consumption of fruits and vegetables under the new standards, but the study’s limited sample, taken from four school cafeterias on two school days, does not indicate a wide-spread trend. This same study also revealed that "students discarded roughly 60 to 75% of the vegetables and 40% of the fruits on their trays," further supporting the widespread plate waste issue reported by the Government Accountability Office. It its February 2014 report, the GAO shows most states reported that their school meal programs faced challenges with plate waste and food costs under the new standards. MYTH: School meal programs just need technical assistance, training and guidance to successfully implement the new standards. FACT: The new nutrition standards for school meals are so complex that since October 2010, USDA has released approximately 200 policy memos to clarify the regulations. The Q&A document on the Final Rule on the “Nutrition Standards in the National School Lunch and School Breakfast Programs” is in its 7th iteration and is 62 pages long. This is just one of several Q&A documents pertaining to the new regulations. SNA has also provided school meal programs with extensive assistance and resources to help them understand and implement the new standards, share ideas, recipes and successes. Since the Healthy, Hunger-Free Kids Act was passed, SNA has hosted hundreds of education sessions at numerous conferences, culinary demonstrations, webinars and web pages featuring toolkits and resources detailing all aspects of the new standards. SNA has promoted all USDA resources to members and has worked closely with USDA throughout implementation to share feedback and insight from school meal program operators on challenges with implementation. Unfortunately, no amount of technical assistance, training or guidance will solve the financial and operational problems facing meal programs.
About School Nutrition Association: The School Nutrition Association (SNA) is a national, non-profit professional organization representing 55,000 school nutrition professionals across the country. Founded in 1946, SNA and its members are dedicated to making healthy school meals and nutrition education available to all students. To find out more about today’s school meals, visit www.SchoolNutrition.org/SchoolMeals.

Copyright © 2014 School Nutrition Association. All Rights Reserved. www.schoolnutrition.org
NLSP Program Participation
Source: USDA Child Nutrition Tables: http://www.fns.usda.gov/pd/child-nutrition-tables

National School Lunch Program
Data Source: USDA FNS Key Program Data Report, July 2014 & USDA FNS Key Program Data Report, November 20121. Totals are averaged. Computations are based on monthly data from September-May 2011, 2012, 2013, 2014. 2
August 12, 2014
18.69 18.90 19.07
2.76 2.60 2.50
10.27 9.23 8.78
SY 2011-12 SY 2012-13 SY 2013-14
Average Student ParticipationSeptember - May
Free Reduced Paid
31.7230.36
Overall1.19% decrease since SY 2012-134.31% decrease since SY 2011-12
Paid4.83% decrease since SY 2012-1314.53% decrease since SY 2011-12
Reduced-Price3.52% decrease since SY 2012-139.23% decrease since SY 2011-12
Free0.92% increase since SY 2012-132.03% increase since SY 2011-12
Sept 2011- May 2012 Sept 2013- May 2014Sept 2012- May 2013
Ave
rage
Stu
de
nt
Par
tici
pat
ion
Pe
r D
ay (
in m
illio
ns)
30.72
Participation Changes
Copyright © 2014 School Nutrition Association. All Rights Reserved. www.schoolnutrition.org
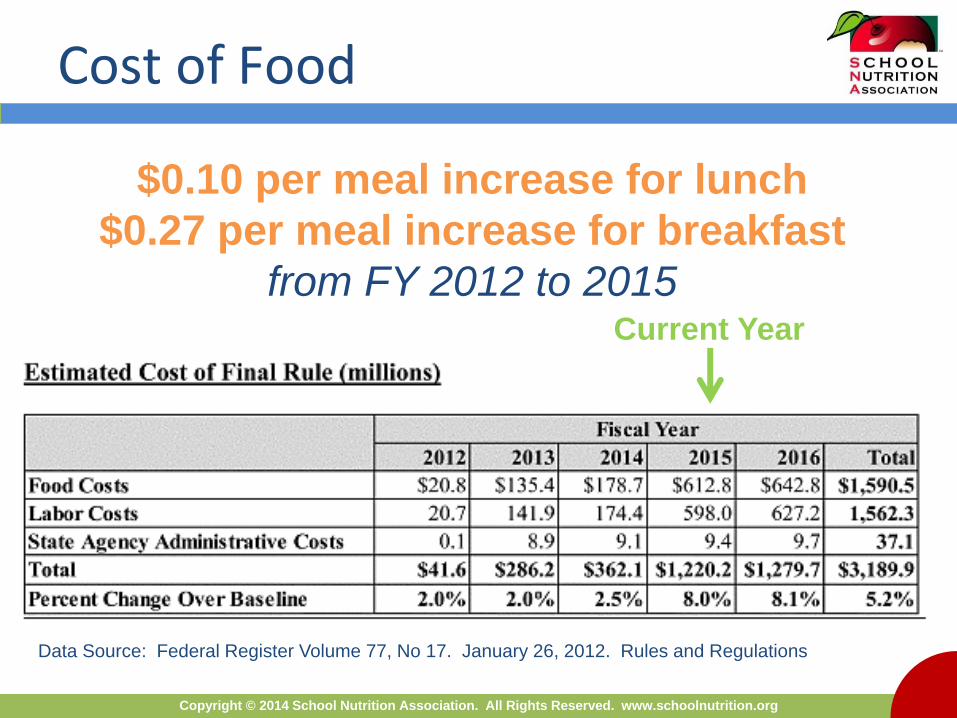
Cost of Food
Data Source: Federal Register Volume 77, No 17. January 26, 2012. Rules and Regulations
$0.10 per meal increase for lunch
$0.27 per meal increase for breakfast
from FY 2012 to 2015 Current Year