usda food and nutrition service school meal programs/media/files/activity files... · usda food and...
TRANSCRIPT

USDA Food and Nutrition Service
School Meal Programs:
Nutrition Policy, Progress and Challenges
Presentation toInstitute of Medicine
Food and Nutrition BoardCommittee on Nutrition Standards in Schools
October 26, 2005Washington, DC
USDA Food and Nutrition Service
Robert Eadie, ChiefPolicy and Program
Development BranchChild Nutrition Division
Clare Miller, M.S., R.D.Senior NutritionistChild Nutrition Division
Jay Hirschman, M.P.H., C.N.S.Director, Special Nutrition StaffOffice of Analysis, Nutrition and
Evaluation

Overview of Presentation
• NSLP and SBP meals
√ Widely accepted
√ Nutritious
√ Have improved
√ Still have room for further improvement
√ Are being updated for the 2005 DGAs and the new DRIs

Overview of Presentation (cont’d)
• USDA is leading continuous NSLP and SBP improvement√ Requirements linked to DGAs & RDAs
√ Periodic measurement & assessments
√ Routine monitoring requirements & training for states
√ Currently reviewing to update to 2005 DGAs and DRIs
√ Promoting further improvement with Team Nutrition

Overview of Presentation (cont’d)
• USDA is promoting improvements within and beyond reimbursable meals in schools
√ Changing the Scene
√ Making it Happen
√ HealthierUS Schools Challenge
√ Promoting local wellness policies
Overview of Presentation (cont’d)
• USDA has legal limitations in what can be required– Define competitive foods
– FMNV applies only to school food service areas during meal periods due to law & court decision
• How this IOM expert panel can help
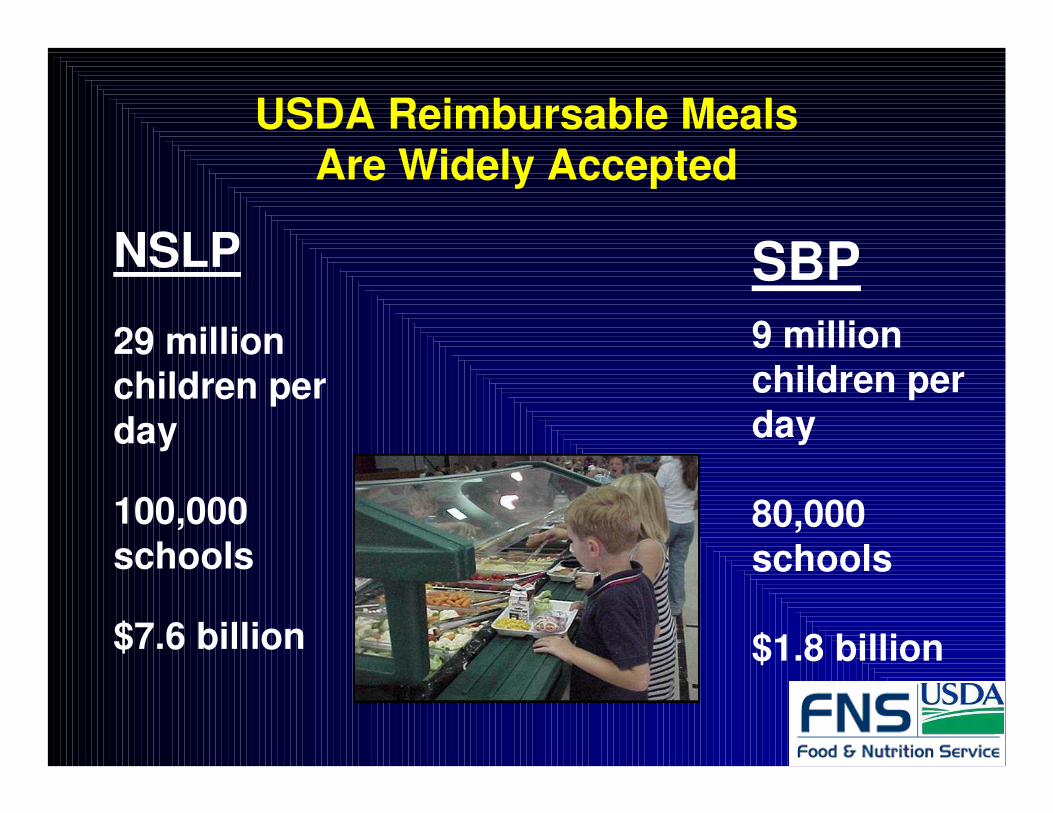
USDA Reimbursable Meals Are Widely Accepted
NSLP
29 million children per day
100,000 schools
$7.6 billion
SBP
9 million children per day
80,000 schools
$1.8 billion

NSLP Meals Are Widely Accepted60% of students on an average day
including 12 million not receiving free/reduced price meals
50%
9.6%
41%40% 60%
Not NSLP Paid Reduced Price Free
ReceiveNSLP Meal
Of those receiving NSLP meal
Of all students attending NSLP schools
12m

NSLP Lunches Are (still) NutritiousProvide One-third Or More Of The Daily RDA
33
91
59 5852
41
0
10
20
30
40
50
60
70
80
90
100
Calories Protein Vitamin
A
Vitamin
C
Calcium Iron
Percent of RDA
Target
For
Lunches:
33%
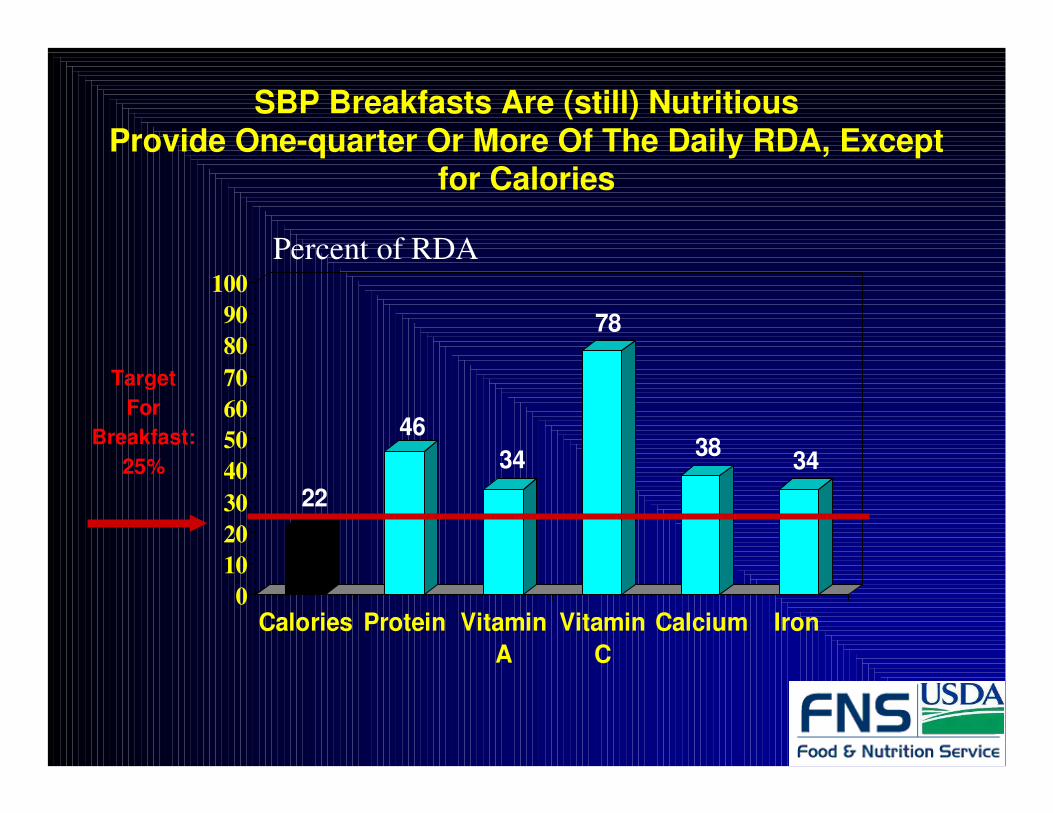
SBP Breakfasts Are (still) NutritiousProvide One-quarter Or More Of The Daily RDA, Except
for Calories
22
46
34
78
3834
0
10
20
30
40
50
60
70
80
90
100
Calories Protein Vitamin
A
Vitamin
C
Calcium Iron
Percent of RDA
Target
For
Breakfast:
25%

School Meals ImprovedSchool Lunches Offered in 1998-99 Were Significantly
Lower in Fat and Saturated Fat
3834
1512
0
5
10
15
20
25
30
35
40
Total Fat Saturated Fat
SY 1991-92
SY 1998-99
Perc
en
t o
f C
alo
ries
Target: 30% or
less
Target: less than
10%

School Breakfasts Offered in 1998-99 Were Significantly Lower in Fat and Saturated Fat
31
26
14
9.8
0
5
10
15
20
25
30
35
40
Total Fat Saturated Fat
SY 1991-92
SY 1998-99
Perc
en
t o
f C
alo
ries
Target: 30% or
less
Target:
less than
10%
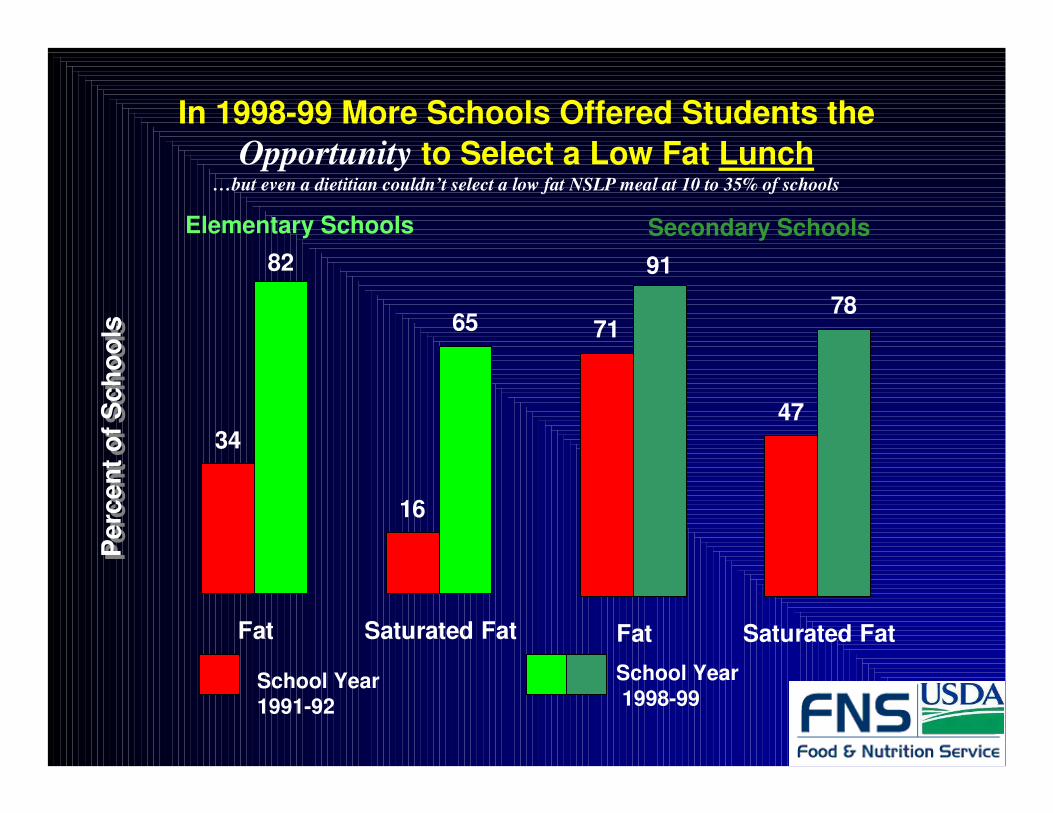
In 1998-99 More Schools Offered Students the
Opportunity to Select a Low Fat Lunch…but even a dietitian couldn’t select a low fat NSLP meal at 10 to 35% of schools
71
47
91
78
Fat Saturated Fat
Elementary Schools Secondary Schools
School Year 1991-92
School Year1998-99
Pe
rce
nt
of
Sc
ho
ols
Pe
rce
nt
of
Sc
ho
ols
34
16
82
65
Fat Saturated Fat
1% 0%
15%18%
Fat Saturated Fat
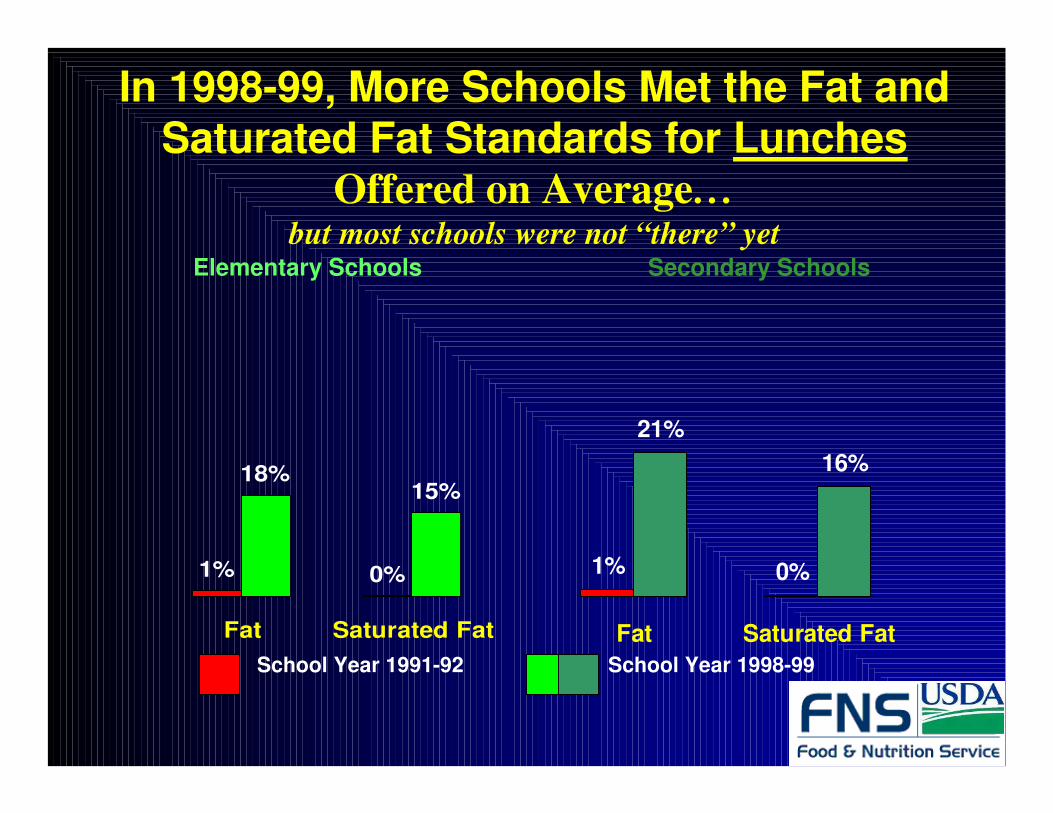
In 1998-99, More Schools Met the Fat and Saturated Fat Standards for Lunches
Offered on Average…but most schools were not “there” yet
1% 0%
21%
16%
Fat Saturated Fat
Elementary Schools Secondary Schools
School Year 1991-92 School Year 1998-99

NSLP/SBP: Reimbursable Meals
• Key issue is defining the food and nutrient requirements for a reimbursable meal
• Reimbursable meals– NSLP and SBP meal service that meets the food
and nutrient requirements outlined in regulation are eligible for federal reimbursements;
– foods served outside of NSLP/SBP (e.g. a la carte, vending) are not reimbursable.

NSLP/SBP: Current Requirements for Reimbursable Meals
• Nutrients in meals are averaged over a school week; weekly averages must meet regulatory standards
– 1/3 of RDA for protein, calcium, iron, vitamin A and vitamin C at lunch; § 1/4 of RDA for these nutrients at breakfast
– Appropriate level of calories for age/grade groups
– Consistent with the DGA§ Limit the percent of calories from total fat to 30% of the
actual number of calories offered, or less
§ Limit the percent of calories from saturated fat to less than 10% of the actual number of calories offered
§ Reduce sodium and cholesterol levels
§ Increase the level of dietary fiber

• Four menu planning options
– Two food-based systems
§ schools must offer at least five food items
§ specified quantities of milk, meat/meat alternates, fruits/vegetables, and grains
– Two nutrient-based systems
§ reimbursable meals must contain a minimum of three menu items
§ specific food requirements include an entrée and fluid milk
• Offer vs. Serve (OVS)
– Students may refuse certain menu items, as long as they accept the minimum number of components
NSLP/SBP: Current Requirements for Reimbursable Meals

School Nutrition : Select Events Chronology 1989-present
1989 NRC Diet and Health Report
1990 Dietary Guidelines for Americans, 3rd edition (fat & sat.fat)
1991-92: SNDA-1 data collected (RDAs good; fat/sat.fat average: 38%/15%)
1992-93: Dietary Guidelines implementation funding began ($2m)
1993: SNDA-1 findings published; work begins on SMI rule
1994: SMI proposed rule published for comment
1995: DGA 1995; SMI final rule published; Team Nutrition begins
1996: NET Program appropriations end
1997-98: SMI Implementation Study began 3 year data collection
1998-99: SNDA-2 data collected
1999: FNS Healthy School Nutrition Environment forum
2000: Call to Action (USDA, 5 leading medical associations)
DGA 2000; Changing the Scene toolkit published by USDA
2001: SNDA-2 report published
2002: SMI Implementation Study 3rd & final report published
2004: CN & WIC Reauthorization (June 30, 2004)
2005: DGA 2005; HealthierUS School Challenge;
Making it Happen; SNDA-3 Data Collected
Up
da te R
DA
s t o D
RIs

SMI Reviews Promote Compliance • The School Meals Initiative for Healthy Children (SMI) requires
states to monitor local school food authority (SFA) compliance with NSLP/SBP – Menu planning requirements– Food and nutrition standards
• All SFAs are reviewed at least once every 5 years
• Corrective action plans and follow-up are required to correct deficiencies
• FNS monitors state compliance with the SMI review requirements
• FNS provided a nationwide series of regional SMI trainings for the States in FY 2005
• In FY 2006, FNS will provide SMI field training for state reviewteams

Competitive FoodsNSLP Definition
(as a result of a Court decision)
• Competitive foods means any foods sold in competition with the Program to children in food service areas during the lunch (breakfast) periods.
ŁŁŁŁ Mary McKenna will discuss the broader
definition for this IOM study

USDA Authority to Regulate School Foods is Legally Limited to
NSLP/SBP Meal Times and Eating Areas
School Grounds
School Building
Midnight
Noon
3:00 p.m.
7:00 a.m.
8:00 a.m.
11:00 a.m. 1:00 p.m.
Cafeteria
Lunch PeriodBreakfast Period

Foods of Minimal Nutritional Value (FMNV)
• Regulations define four categories of FMNV
1. Soda water
2. Water ices
3. Chewing gum
4. Certain candies
§ Hard candies; jellies and gums; marshmallow candies; fondant, licorice; spun candy; candy-coated popcorn
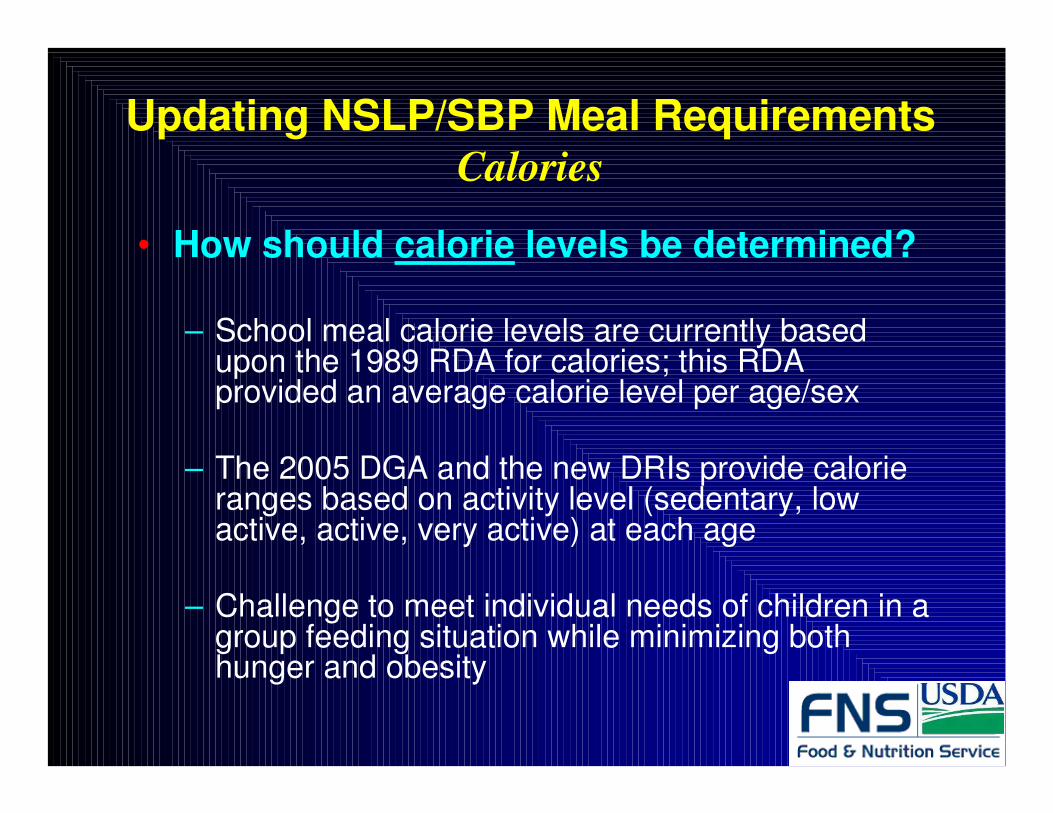
Updating NSLP/SBP Meal Requirements Calories
• How should calorie levels be determined?
– School meal calorie levels are currently based upon the 1989 RDA for calories; this RDA provided an average calorie level per age/sex
– The 2005 DGA and the new DRIs provide calorie ranges based on activity level (sedentary, low active, active, very active) at each age
– Challenge to meet individual needs of children in a group feeding situation while minimizing both hunger and obesity

DRI Estimated Energy Requirements (EER) by Activity Level, Ages 6 to 11 Years
vs.Current Basis for NSLP/SBP Calories (1989 RDA)
0
500
1000
1500
2000
2500
6 7 8 9 10 11
Sedentary F
Sedentary M
Low Active F
Low Active M
Active F
Active M
Very Active F
Very Active M
Current
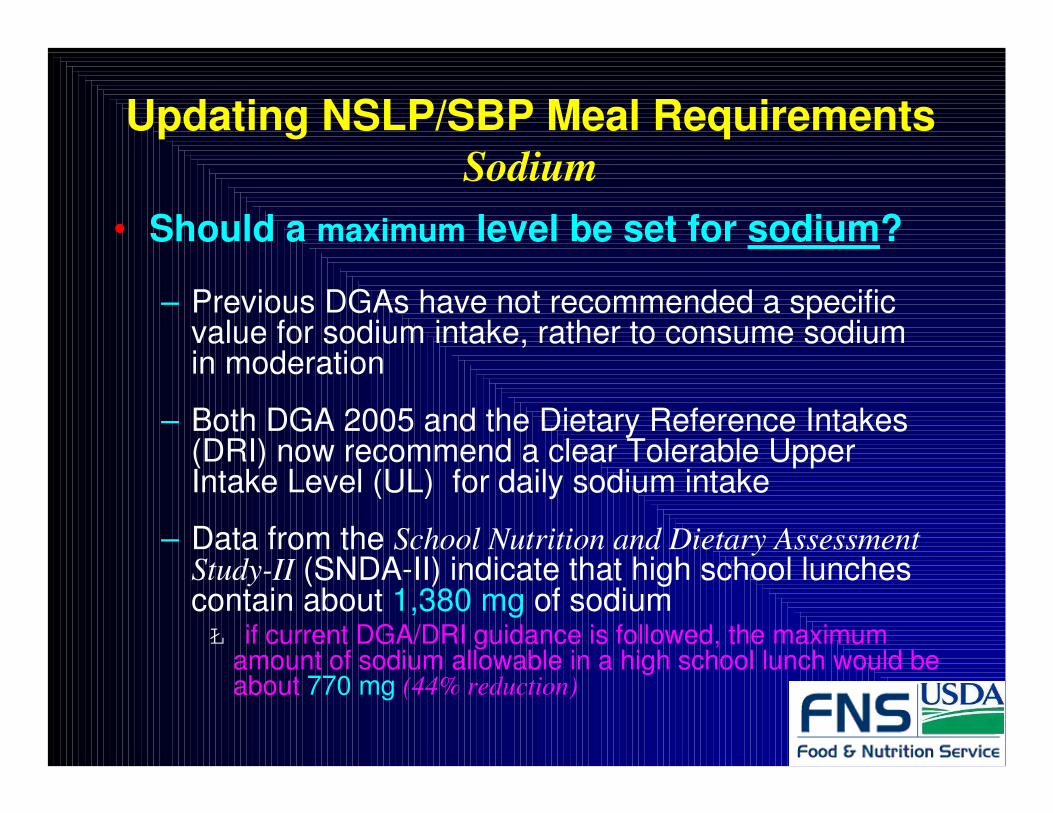
• Should a maximum level be set for sodium?
– Previous DGAs have not recommended a specific value for sodium intake, rather to consume sodium in moderation
– Both DGA 2005 and the Dietary Reference Intakes (DRI) now recommend a clear Tolerable Upper Intake Level (UL) for daily sodium intake
– Data from the School Nutrition and Dietary Assessment Study-II (SNDA-II) indicate that high school lunches contain about 1,380 mg of sodiumŁ if current DGA/DRI guidance is followed, the maximum
amount of sodium allowable in a high school lunch would be about 770 mg (44% reduction)
Updating NSLP/SBP Meal Requirements Sodium

Current Sodium Intake
Source:
http://www.cdc.gov/nchs/data/nhanes/databriefs/calories.pdf
3877
2896
3500
2993

Recommended Sodium Intake
719 - 12782,3001,800 – 3,20014-18
846 - 13752,2001,600 – 2,6009-13
950 - 15831,9001,200 – 2,0004-8
Sodium Density
(mg/1000 kcal)
Recommended Upper Limit for Sodium (mg)
Recommended Calorie Range
(kcal)
Age

FNS is also carefully considering§Trans fats – interpreting “minimize”
§Fiber – now quantified DGA 14g/1000kcal
§Which nutrients should be regulated– Three of the “nutrients of concern” for children
in the 2005 DGA are not on the nutrition facts panel
» magnesium» potassium» vitamin E
– Challenge:§ determining which nutrients are the best “proxies”
for overall diet quality among school children
§ how to reliably estimate the content of nutrients not on the nutrition facts panel of school foods
Updating NSLP/SBP Meal Requirements

Team Nutrition
v Nutrition education for students and training for school foodservice professionals
v Initiatives to promote healthier school nutrition environments
v Focused on voluntary, community-level changes

HealthierUS School Challenge
v USDA has challenged schools to improve the school environment.
v HealthierUS School Challenge recognizes and awards schools that meet voluntary nutrition, physical activity, and nutrition education standards

Local Wellness Policy Provisions
Local wellness policies must:
v Include goals for nutrition education, physical activity, nutrition for all foods
v Involve a broad group of individuals in policy development
v Include a plan for measuring policy implementation.

How this IOM expert panel can help
• Practical recommendations
§ Easily implemented and monitored by the schools
– Can you tell just by looking at the foods? Food labels?
• Provide transparent explanation of the logic underpinning the
recommendations
• Promote recommendations to state and local school
community
ŁŁŁŁ Remember that to be successful, changes must be supported by many
groups, including
– parents, school administrators, and
– the students themselves
• Encourage periodic state/local reviews

Team Nutrition
www.fns.usda.gov/tn or
teamnutrition.usda.gov/healthy-schools.html
Healthy School Meals Resource Systemschoolmeals.nal.usda.gov/
Local Wellness Policy Informationwww.fns.usda.gov/tn/Healthy/wellness_policyrequirements.html
USDA School Nutrition Dietary Assessment and Other Studieswww.fns.usda.gov/oane/MENU/Published/CNP/cnp.htm
www.ers.usda.gov/Briefing/ChildNutrition/
Measuring Competitive Foods in Schools (methodology report)www.fns.usda.gov/oane/MENU/Published/CNP/FILES/CompFoodSum.pdf
Questions