proposed prairie lane hdd cores d7-a and d7-b · pdf filethe existing ground cover in the area...
TRANSCRIPT

Geotechnical Data ReportProposed Prairie Lane HDD Cores D7-A and D7-B
Wayne County, OhioFebruary 14, 2015
Terracon Project No. N4149328
Prepared for:Project Consulting Services, Inc.
Prepared by:Terracon Consultants, Inc.
Columbus, Ohio

Terracon Consul tants, Inc. 800 Morr ison Road Columbus, Ohio 43230P [614] 863 3113 F [614] 863 0475 terracon.com
February 14, 2015
Project Consulting Services, Inc.155 Lafayette RoadSuite 2New Hampton, NH 03862
Attn: Mr. Ronald P. Gourgeot, Jr., P.E. P: [603] 379 6490 E: [email protected]
Re: Geotechnical Data ReportProposed Prairie Lane HDD Cores D7-A and D7-BWayne County, OhioTerracon Project No. N4149328
Dear Mr. Gourgeot:
Terracon Consultants, Inc. (Terracon) has completed the geotechnical field and laboratoryservices for the proposed Prairie Lane HDD Cores D7-A and D7-B project. This report presentsthe findings of the subsurface exploration and results of laboratory tests performed on selectedsoil and rock samples.
We appreciate the opportunity to be of service to you on this project. If you have any questionsconcerning this report, or if we may be of further service, please contact us.
Sincerely,Terracon Consultants, Inc.
Mohammad Kayser Prasad S. Rege, P.E.Staff Engineer Office Manager/Senior Principal
Steven B. LarimerStaff Geologist

Responsive ■ Resourceful ■ Reliable
TABLE OF CONTENTSPage
1.0 INTRODUCTION ............................................................................................................. 12.0 PROJECT DESCRIPTION .............................................................................................. 13.0 SUBSURFACE CONDITIONS ........................................................................................ 2
3.1 Geology ............................................................................................................... 23.2 Typical Subsurface Profile ................................................................................... 23.3 Water Level Observations .................................................................................... 3
4.0 GEOTECHNICAL DESIGN PARAMETERS.................................................................... 44.1 Soil Parameters ................................................................................................... 4
5.0 GENERAL COMMENTS ................................................................................................. 4
APPENDIX A – FIELD EXPLORATIONField Exploration Description ............................................................................Exhibit A-1Boring Location Plan ........................................................................................Exhibit A-2Boring Logs ........................................................................................... Exhibit A-3 to A-4Subsurface Profile ............................................................................................Exhibit A-5
APPENDIX B – LABORATORY TESTINGLaboratory Testing............................................................................................Exhibit B-1Laboratory Test Results....................................................................... Exhibit B-2 to B-26
APPENDIX C – SUPPORTING DOCUMENTSGeneral Notes ................................................................................................ Exhibit C-1Unified Soil Classification System .................................................................... Exhibit C-2Soil Sample Photos ......................................................................................... Exhibit C-3
Responsive ■ Resourceful ■ Reliable 1
GEOTECHNICAL DATA REPORTPROPOSED PRAIRIE LANE HDD CORES D7-A AND D7-B
WAYNE COUNTY, OHIOTerracon Project No. N4149328
February 14, 2015
1.0 INTRODUCTION
This report presents the results of our geotechnical field and laboratory services performed for theproposed Prairie lane HDD Cores D7-A and D7-B located in Wayne County, Ohio. Our scopeof work for this project included the advancement of two (2) borings, designated D7-A and D7-Bto depths ranging from approximately 70 to 80 feet below the existing ground surface, visualclassification and laboratory testing of representative soil samples, groundwater sample lab results(if applicable) and preparation of this geotechnical data report. Logs of the borings and a boringlocation plan are included in Appendix A of this report.
2.0 PROJECT DESCRIPTION
The project consists of crossing Prairie lane road using horizontal directional drilling means andmethods for the Rover Pipeline Project. Details are presented below for your information.
Item Description
Locations
Boring D7-A (40°44'40.65"N, 81°56'27.15"W) is located on theeast side of the Prairie lane road and W. Messner Roadintersection. Boring D7-B (40°44'54.29"N, 81°56'41.05"W) locatedon the west side of the intersection. An oil well is located in thevicinity of the HDD alignment.
Current Ground CoverThe existing ground cover in the area of the proposed HDDcrossing is mainly mowed grass fields, agricultural fields, largewater bodies and wooded areas.
Existing Topography
Based on provided survey information, the ground surfaceelevation across the proposed HDD pipeline alignment rangesfrom about elevation 845 to 850 feet. Some large water bodies runin a generally northwest-southeast direction across the proposedHDD alignment.
Structures Horizontally directionally drilled (HDD) natural gas pipelinecrossings.
Geotechnical Data ReportProposed Prairie Lane HDD Cores D7-A and D7-B■ Wayne County, OhioFebruary 14, 2015 ■ Terracon Project No. N4149328
Responsive ■ Resourceful ■ Reliable
3.0 SUBSURFACE CONDITIONS
3.1 Geology
The project area is located in the physiographic region known as the Central Lowland Till Plaingenerally characterized as having Pleistocene-age cohesive till and, more specifically, within theKillbuck-Glaciated Pittsburgh Plateau (Ridges and flat uplands generally above 1200 feet,covered with thin drift and dissected by steep valleys; valley segments alternate between broaddrift-filled and narrow rock-walled reaches; elevation 600 -1505 feet) overlying Mississippian-age sedimentary bedrock from the Maxville Limestone; Rushville, Logan, and CuyhogaFormations, Undivided. Bedrock was not encountered in the borings at this site.
D7-A Luray Silty Clay LoamThe Luray series consists of very deep, very poorly drained soils formed in silty lacustrinematerial or slack water sediments located in slight depressions or on level areas on lake plains,terraces, outwash plains, and in small local areas on till plains. The soils formed in stratifiedlacustrine material or slack water sediments of Wisconsinan age with dominant textures of siltloam and silty clay loam. Slope ranges from 0 to 2 percent.
D7-BLinwood Muck and Gravel pits are located immediately east and south of the boring locationand include the Linwood series consisting of very deep, very poorly drained soils formed inhighly decomposed woody, organic materials underlain by loamy till at depths of 16 to 51inches. These soils are in drainage-ways and depressions on end moraines, end moraines,ground moraines, outwash plains, and lake plains. Linwood soils formed in former lakes orponds that range in size from a few acres to several hundred acres. Slope ranges from 0 to 2percent.
The boring location is bordered along the east side by the:Wallkill silt Loam (flood plains)The Wallkill series consists of very deep, very poorly drained soils formed in alluvium overlyingorganic soil material. They are nearly level soils that occur on flood plains or around margins oforganic soils adjacent to uplands. Wallkill soils formed in alluvial mineral soil deposits overorganic soil materials. They occur along streams that run through organic soil areas and alongthe margins of depressional areas adjacent to upland mineral soils. Saturated hydraulicconducticity of the mineral portion is moderately high to high, and the organic portion is high tovery high. Slope ranges from 0 to 3 percent.
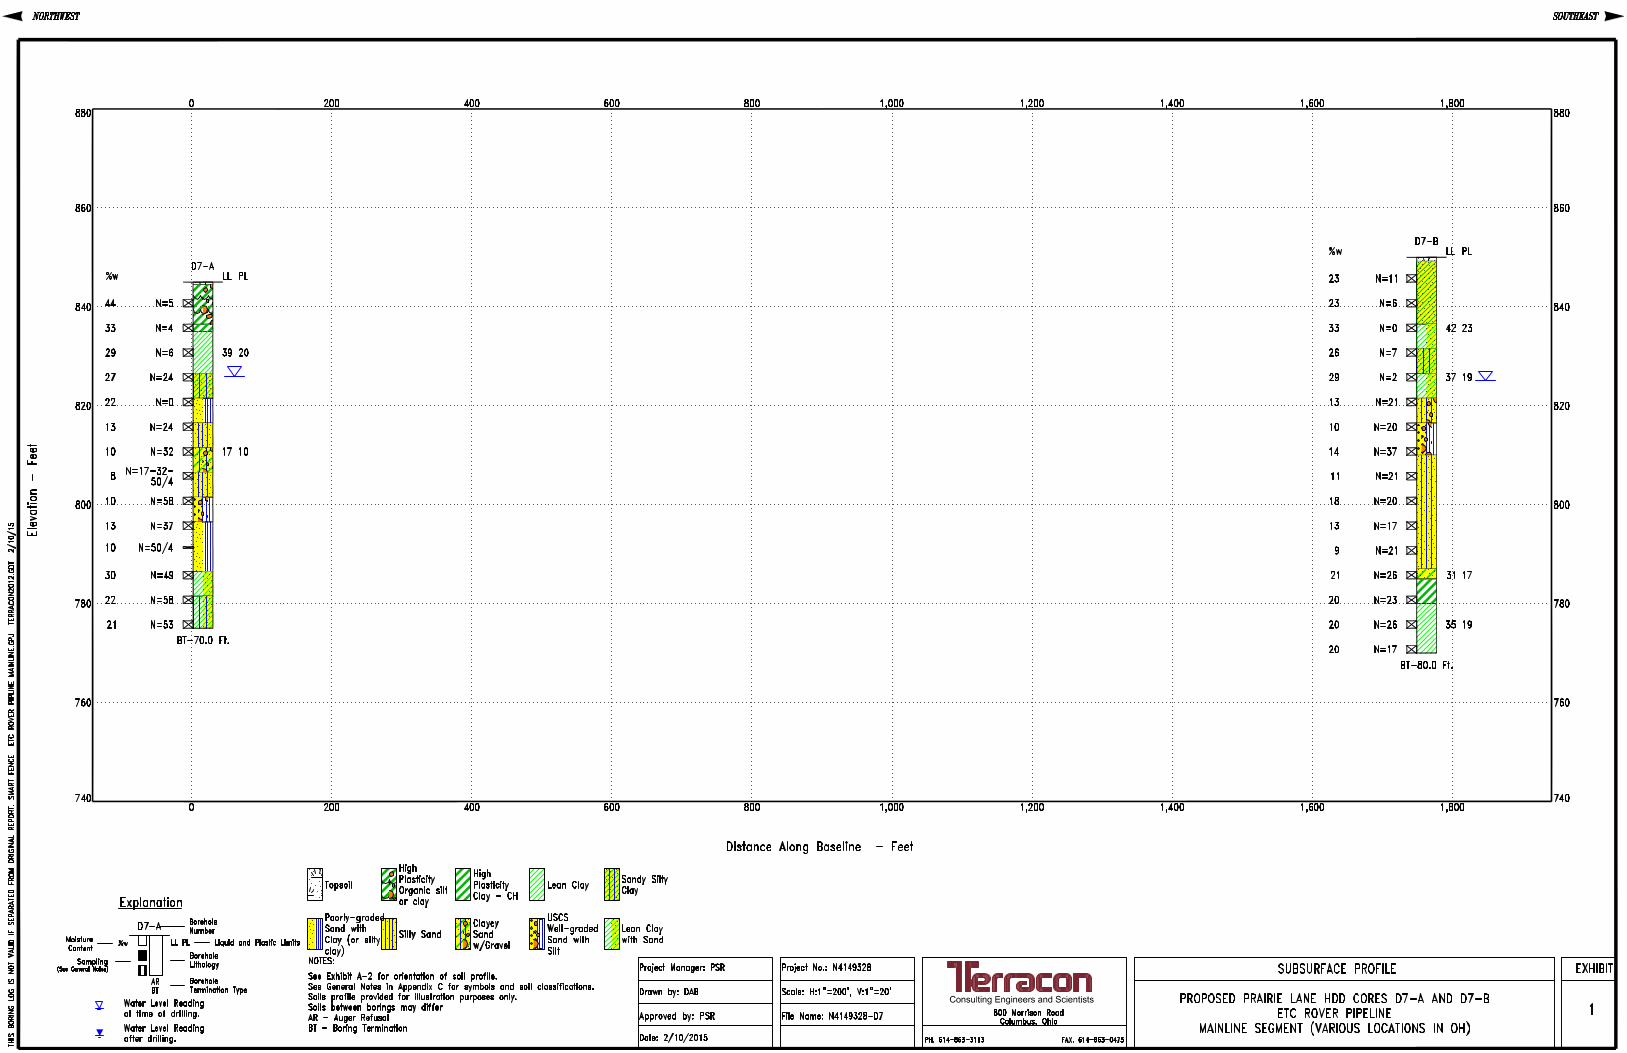
3.2 Typical Subsurface Profile
Boring D7-A initially penetrated an organic clay of medium stiff consistency to an approximatedepth of 8.5 feet. This soil layer was underlain by native cohesive soils (fat clay, lean clay and
Geotechnical Data ReportProposed Prairie Lane HDD Cores D7-A and D7-B■ Wayne County, OhioFebruary 14, 2015 ■ Terracon Project No. N4149328
Responsive ■ Resourceful ■ Reliable
sandy silty clay) of medium stiff to very stiff consistency which extended to an approximate depth of23.5 feet below the existing ground surface. Native granular soils (poorly graded sand with silt,silty sand, silty clayey sand with gravel, well graded sand with silt and gravel; and sandy silt) of veryloose to very dense relative density were encountered below the native cohesive soils. These soilsextended to an approximate depth of 58.5 feet below the existing ground surface. The granularsoils, in turn, were underlain by native cohesive soils (lean clay with sand and silty clay with sand)of hard consistency which extended to the test boring termination depth of 70 feet below theexisting ground surface.
Boring D7-B encountered native cohesive soils (sandy lean clay, lean clay with sand and sandysilty clay) of very soft to medium stiff consistency to an approximate depth of 28.5 feet below theexisting ground surface. These cohesive soils were underlain by native granular soils (clayey sandwith gravel, silty sand with gravel, silty sand, clayey sand, well graded sand with silt and gravel;and poorly graded sand with silt) of medium dense to dense relative density which extended to anapproximate depth of 65 feet below the existing ground surface. The granular soils were underlainby native cohesive soil layer (fat clay and lean clay) to the termination depth of approximately 80feet below the existing ground surface.
Specific conditions encountered at each boring location are indicated on the individual boring logs.Stratification boundaries on the boring logs represent the approximate location of changes in soiltypes; in-situ, the transition between materials may be gradual. Details for each of the borings canbe found on the boring logs included in Appendix A of this report.
3.3 Water Level Observations
The boreholes were observed while drilling for the presence and level of groundwater.Groundwater encountered within the sandy silty clay layer in borings D7-A and lean clay with sandlayer in boring D7-B at a depth interval of about 25 to 28.5 feet.
Groundwater level fluctuations occur due to seasonal variations in the amount of rainfall, runoffand other factors not evident at the time the borings were performed. In addition, perched ortrapped water can develop over low permeability soils. Therefore, groundwater levels duringconstruction or at other times in the life of the structure may be higher or lower than the levelsindicated on the boring logs. The possibility of groundwater level fluctuations should beconsidered when developing the design and construction plans for the project.
Geotechnical Data ReportProposed Prairie Lane HDD Cores D7-A and D7-B■ Wayne County, OhioFebruary 14, 2015 ■ Terracon Project No. N4149328
Responsive ■ Resourceful ■ Reliable
4.0 GEOTECHNICAL DESIGN PARAMETERS
4.1 Soil Parameters
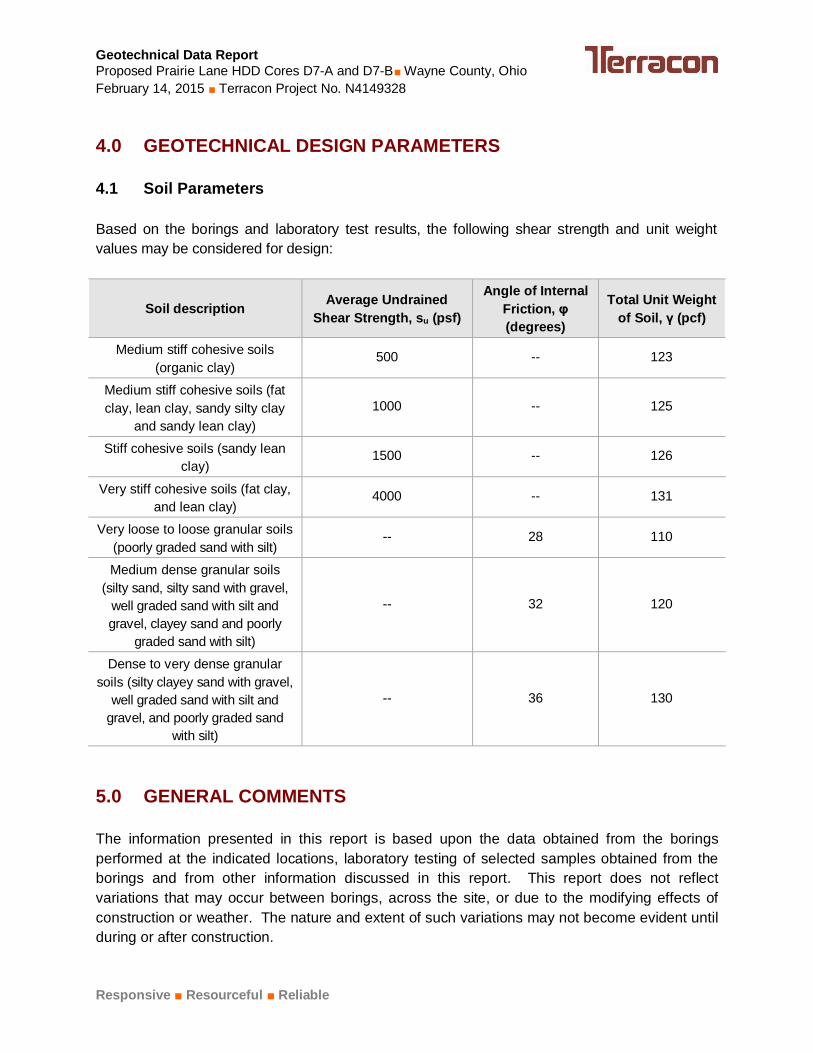
Based on the borings and laboratory test results, the following shear strength and unit weightvalues may be considered for design:
Soil description Average UndrainedShear Strength, su (psf)
Angle of InternalFriction, φ(degrees)
Total Unit Weightof Soil, γ (pcf)
Medium stiff cohesive soils(organic clay)
500 -- 123
Medium stiff cohesive soils (fatclay, lean clay, sandy silty clay
and sandy lean clay)1000 -- 125
Stiff cohesive soils (sandy leanclay)
1500 -- 126
Very stiff cohesive soils (fat clay,and lean clay)
4000 -- 131
Very loose to loose granular soils(poorly graded sand with silt)
-- 28 110
Medium dense granular soils(silty sand, silty sand with gravel,
well graded sand with silt andgravel, clayey sand and poorly
graded sand with silt)
-- 32 120
Dense to very dense granularsoils (silty clayey sand with gravel,
well graded sand with silt andgravel, and poorly graded sand
with silt)
-- 36 130
5.0 GENERAL COMMENTS
The information presented in this report is based upon the data obtained from the boringsperformed at the indicated locations, laboratory testing of selected samples obtained from theborings and from other information discussed in this report. This report does not reflectvariations that may occur between borings, across the site, or due to the modifying effects ofconstruction or weather. The nature and extent of such variations may not become evident untilduring or after construction.

Geotechnical Data ReportProposed Prairie Lane HDD Cores D7-A and D7-B■ Wayne County, OhioFebruary 14, 2015 ■ Terracon Project No. N4149328
Responsive ■ Resourceful ■ Reliable
The scope of services for this project does not include either specifically or by implication anyenvironmental or biological (e.g., mold, fungi, bacteria) assessment of the site or identification orprevention of pollutants, hazardous materials or conditions. If the owner is concerned about thepotential for such contamination or pollution, other studies should be undertaken.
This data report has been prepared for the exclusive use of our client for specific application tothe project discussed and has been prepared in accordance with generally acceptedgeotechnical engineering practices. No warranties, either express or implied, are intended ormade. Site safety, excavation support, and dewatering requirements are the responsibility ofothers. In the event that changes in the nature, design, or location of the project as outlined inthis report are planned, the conclusions and recommendations contained in this report shall notbe considered valid unless Terracon reviews the changes and either verifies or modifies theconclusions of this report in writing.

APPENDIX AFIELD EXPLORATION

Geotechnical Data ReportProposed Prairie Lane HDD Cores D7-A and D7-B ■ Wayne County, OhioFebruary 14, 2015 ■ Terracon Project No. N4149328
Responsive ■ Resourceful ■ Reliable Exhibit A-1
Field Exploration DescriptionThe subsurface exploration consisted of drilling and sampling two (2) borings at the site to adepth range of about 70 to 80 feet below existing grades. The boring locations were staked inthe field by the Rover Pipeline surveyor. The approximate boring locations are indicated on theattached Boring Location Plan. Surveyed elevations at the ground surface were provided by thesurveyor. Elevations are rounded to the nearest foot. The locations and elevations of the boringsshould be considered accurate only to the degree implied by the means and methods used todefine them.
The borings were drilled with a track-mounted rotary drill rig using continuous flight hollow-stemaugers to advance the boreholes. Samples of the soil encountered in the borings were obtainedusing the split barrel sampling procedures. Water was added at 25 feet in both borings to assistdrilling.
In the split-barrel sampling procedure, the number of blows required to advance a standard 2-inchO.D. split-barrel sampler the last 12 inches of the typical total 18-inch penetration by means of a140-pound auto-hammer with a free fall of 30 inches, is the standard penetration resistance value(SPT-N). This value is used to estimate the in-situ relative density of cohesionless soils andconsistency of cohesive soils. An automatic SPT hammer was used to advance the split-barrelsampler in the borings performed on this site. A significantly greater efficiency is achieved withthe automatic hammer compared to the conventional safety hammer operated with a cathead andrope. This higher efficiency has an appreciable effect on the SPT-N value. The effect of theautomatic hammer's efficiency has been considered in the interpretation and analysis of thesubsurface information for this report.
The samples were tagged for identification, sealed to reduce moisture loss, and taken to ourlaboratory for further examination, testing, and classification. Information provided on the boringlogs attached to this report includes soil descriptions, consistency evaluations, boring depths,sampling intervals, and any groundwater conditions. The borings were backfilled with cementbentonite grout prior to the drill crew leaving the site.
A field log of each boring was prepared by the field engineer/geologist. These logs included visualclassifications of the materials encountered during drilling, as well as, the engineer/geologist’sinterpretation of the subsurface conditions between samples. Final boring logs included with thisreport represent the geologist's interpretation of the field logs and include modifications based onlaboratory observation and tests of the samples.

TEST BORING LOCATION PLANPrairie Lane HDD Cores D7-A and D7-B
Various Locations in OhioWayne County, Ohio800 Morrison Road Columbus, Ohio 43230
PH. (614) 863-3113 FAX. (614) 863-0475
N4149328
FEB. 2015
PSR
MK
PSR
PSR
N.T.S.
Project Manager:
Drawn by:
Checked by:
Approved by:
Project No.
Scale:
File Name:
Date:
Exhibit
N4149328 BLPDIAGRAM IS FOR GENERAL LOCATIONONLY, AND IS NOT INTENDED FOR
CONSTRUCTION PURPOSES
A-2
APPROXIMATEBORINGLOCATION
D7-B
D7-A
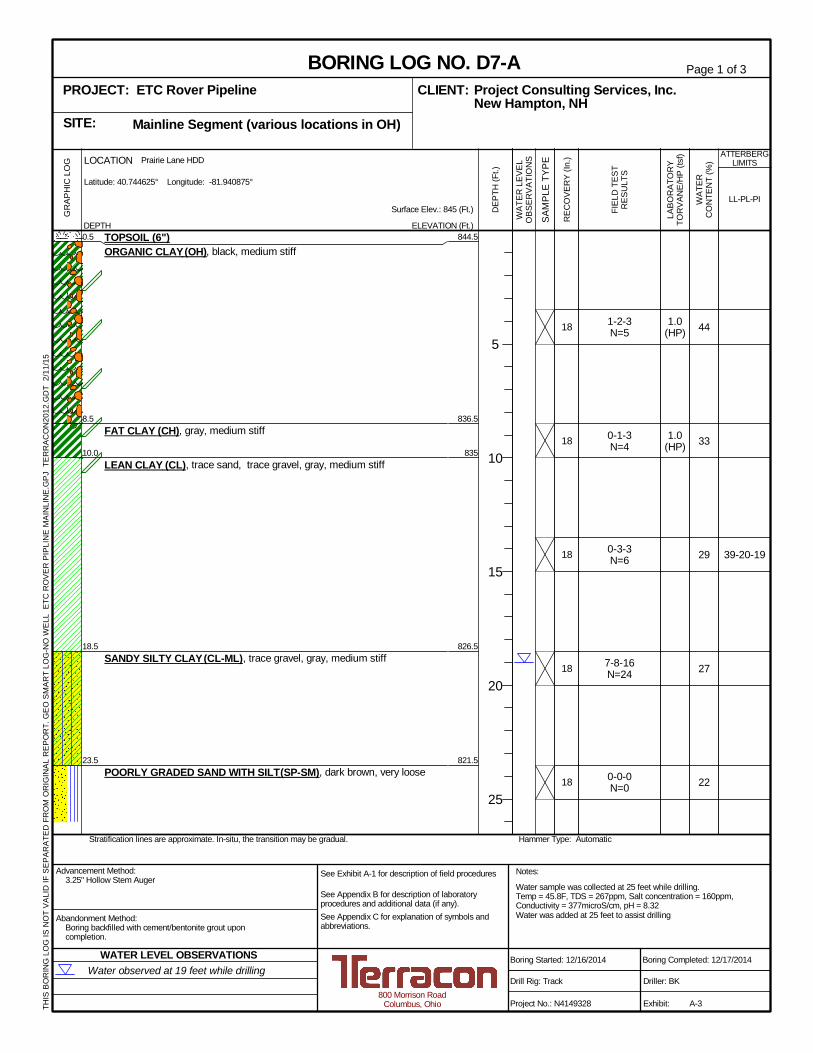
0.5
8.5
10.0
18.5
23.5
TOPSOIL (6")ORGANIC CLAY (OH), black, medium stiff
FAT CLAY (CH), gray, medium stiff
LEAN CLAY (CL), trace sand, trace gravel, gray, medium stiff
SANDY SILTY CLAY (CL-ML), trace gravel, gray, medium stiff
POORLY GRADED SAND WITH SILT (SP-SM), dark brown, very loose
Water sample was collected at 25 feet while drilling.Temp = 45.8F, TDS = 267ppm, Salt concentration = 160ppm,Conductivity = 377microS/cm, pH = 8.32Water was added at 25 feet to assist drilling
1-2-3N=5
0-1-3N=4
0-3-3N=6
7-8-16N=24
0-0-0N=0
1.0(HP)
1.0(HP)
44
33
29
27
22
39-20-19
844.5
836.5
835
826.5
821.5
18
18
18
18
18
Hammer Type: AutomaticStratification lines are approximate. In-situ, the transition may be gradual.
LOCATION
DEPTH
Latitude: 40.744625° Longitude: -81.940875°
GR
APH
ICLO
G Prairie Lane HDD
THIS
BOR
ING
LOG
ISN
OT
VALI
DIF
SEPA
RAT
EDFR
OM
OR
IGIN
ALR
EPO
RT.
GEO
SMAR
TLO
G-N
OW
ELL
ETC
RO
VER
PIPL
INE
MAI
NLI
NE.
GPJ
TER
RAC
ON
2012
.GD
T2/
11/1
5
Mainline Segment (various locations in OH)SITE:
Page 1 of 3
Advancement Method:3.25" Hollow Stem Auger
Abandonment Method:Boring backfilled with cement/bentonite grout uponcompletion.
800 Morrison RoadColumbus, Ohio
Notes:
Project No.: N4149328
Drill Rig: Track
Boring Started: 12/16/2014
BORING LOG NO. D7-AProject Consulting Services, Inc.CLIENT:New Hampton, NH
Driller: BK
Boring Completed: 12/17/2014
Exhibit: A-3
See Exhibit A-1 for description of field procedures
See Appendix B for description of laboratoryprocedures and additional data (if any).See Appendix C for explanation of symbols andabbreviations.
PROJECT: ETC Rover Pipeline
FIEL
DTE
STR
ESU
LTS
LABO
RAT
OR
YTO
RVA
NE/
HP
(tsf)
WAT
ERC
ON
TEN
T(%
)
ATTERBERGLIMITS
LL-PL-PISurface Elev.: 845 (Ft.)
ELEVATION (Ft.) SAM
PLE
TYPE
WAT
ERLE
VEL
OBS
ERVA
TIO
NS
DEP
TH(F
t.)
5
10
15
20
25
REC
OVE
RY
(In.)
Water observed at 19 feet while drillingWATER LEVEL OBSERVATIONS

28.5
33.5
38.5
43.5
48.5
POORLY GRADED SAND WITH SILT (SP-SM), dark brown, very loose(continued)
SILTY SAND (SM), trace gravel, gray, medium dense
SILTY CLAYEY SAND WITH GRAVEL (SC-SM), gray, dense
SILTY SAND (SM), trace gravel, gray, very dense
WELL GRADED SAND WITH SILT AND GRAVEL (SW-SM), darkbrown, very dense
POORLY GRADED SAND WITH SILT (SP-SM), trace gravel, darkbrown, very dense
6-11-13N=24
6-12-20N=32
17-32-50/4"
19-26-32N=58
0-0-37N=37
13
10
8
10
13
17-10-7
816.5
811.5
806.5
801.5
796.5
18
18
18
18
18
Hammer Type: AutomaticStratification lines are approximate. In-situ, the transition may be gradual.
LOCATION
DEPTH
Latitude: 40.744625° Longitude: -81.940875°
GR
APH
ICLO
G Prairie Lane HDD
THIS
BOR
ING
LOG
ISN
OT
VALI
DIF
SEPA
RAT
EDFR
OM
OR
IGIN
ALR
EPO
RT.
GEO
SMAR
TLO
G-N
OW
ELL
ETC
RO
VER
PIPL
INE
MAI
NLI
NE.
GPJ
TER
RAC
ON
2012
.GD
T2/
11/1
5
Mainline Segment (various locations in OH)SITE:
Page 2 of 3
Advancement Method:3.25" Hollow Stem Auger
Abandonment Method:Boring backfilled with cement/bentonite grout uponcompletion.
800 Morrison RoadColumbus, Ohio
Notes:
Project No.: N4149328
Drill Rig: Track
Boring Started: 12/16/2014
BORING LOG NO. D7-AProject Consulting Services, Inc.CLIENT:New Hampton, NH
Driller: BK
Boring Completed: 12/17/2014
Exhibit: A-3
See Exhibit A-1 for description of field procedures
See Appendix B for description of laboratoryprocedures and additional data (if any).See Appendix C for explanation of symbols andabbreviations.
PROJECT: ETC Rover Pipeline
FIEL
DTE
STR
ESU
LTS
LABO
RAT
OR
YTO
RVA
NE/
HP
(tsf)
WAT
ERC
ON
TEN
T(%
)
ATTERBERGLIMITS
LL-PL-PISurface Elev.: 845 (Ft.)
ELEVATION (Ft.) SAM
PLE
TYPE
WAT
ERLE
VEL
OBS
ERVA
TIO
NS
DEP
TH(F
t.)
30
35
40
45
50
REC
OVE
RY
(In.)
Water observed at 19 feet while drillingWATER LEVEL OBSERVATIONS
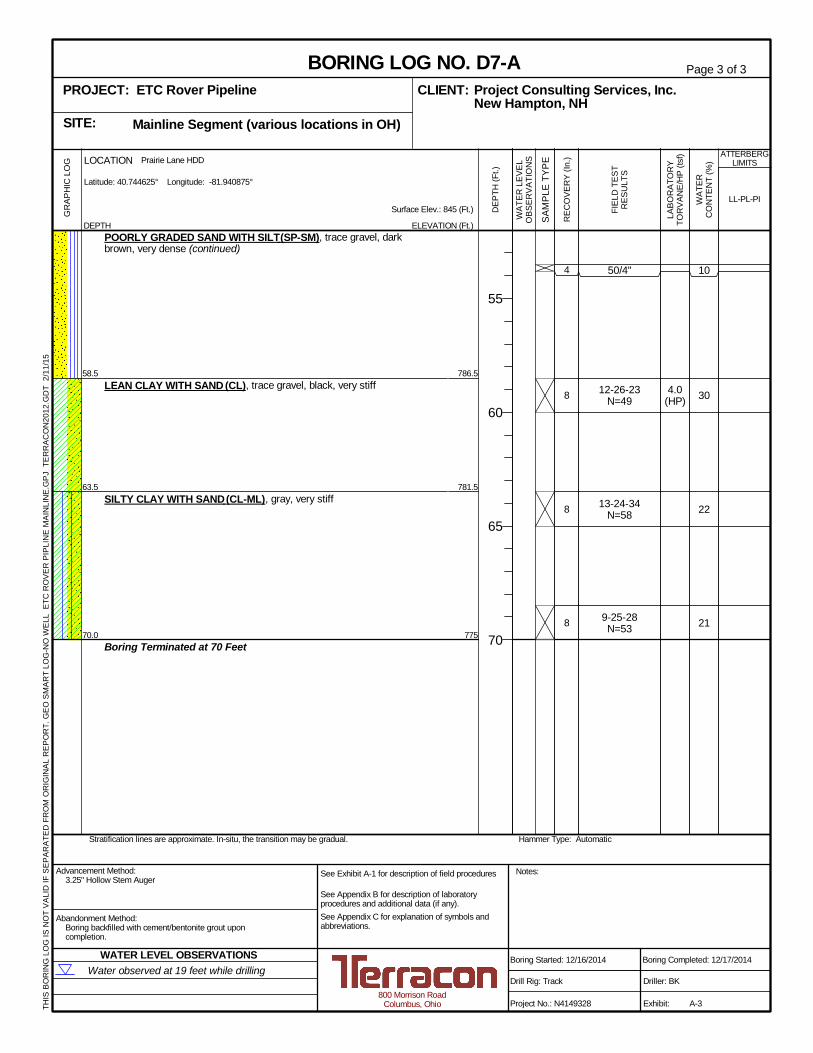
58.5
63.5
70.0
POORLY GRADED SAND WITH SILT (SP-SM), trace gravel, darkbrown, very dense (continued)
LEAN CLAY WITH SAND (CL), trace gravel, black, very stiff
SILTY CLAY WITH SAND (CL-ML), gray, very stiff
Boring Terminated at 70 Feet
50/4"
12-26-23N=49
13-24-34N=58
9-25-28N=53
4.0(HP)
10
30
22
21
786.5
781.5
775
4
8
8
8
Hammer Type: AutomaticStratification lines are approximate. In-situ, the transition may be gradual.
LOCATION
DEPTH
Latitude: 40.744625° Longitude: -81.940875°
GR
APH
ICLO
G Prairie Lane HDD
THIS
BOR
ING
LOG
ISN
OT
VALI
DIF
SEPA
RAT
EDFR
OM
OR
IGIN
ALR
EPO
RT.
GEO
SMAR
TLO
G-N
OW
ELL
ETC
RO
VER
PIPL
INE
MAI
NLI
NE.
GPJ
TER
RAC
ON
2012
.GD
T2/
11/1
5
Mainline Segment (various locations in OH)SITE:
Page 3 of 3
Advancement Method:3.25" Hollow Stem Auger
Abandonment Method:Boring backfilled with cement/bentonite grout uponcompletion.
800 Morrison RoadColumbus, Ohio
Notes:
Project No.: N4149328
Drill Rig: Track
Boring Started: 12/16/2014
BORING LOG NO. D7-AProject Consulting Services, Inc.CLIENT:New Hampton, NH
Driller: BK
Boring Completed: 12/17/2014
Exhibit: A-3
See Exhibit A-1 for description of field procedures
See Appendix B for description of laboratoryprocedures and additional data (if any).See Appendix C for explanation of symbols andabbreviations.
PROJECT: ETC Rover Pipeline
FIEL
DTE
STR
ESU
LTS
LABO
RAT
OR
YTO
RVA
NE/
HP
(tsf)
WAT
ERC
ON
TEN
T(%
)
ATTERBERGLIMITS
LL-PL-PISurface Elev.: 845 (Ft.)
ELEVATION (Ft.) SAM
PLE
TYPE
WAT
ERLE
VEL
OBS
ERVA
TIO
NS
DEP
TH(F
t.)
55
60
65
70
REC
OVE
RY
(In.)
Water observed at 19 feet while drillingWATER LEVEL OBSERVATIONS
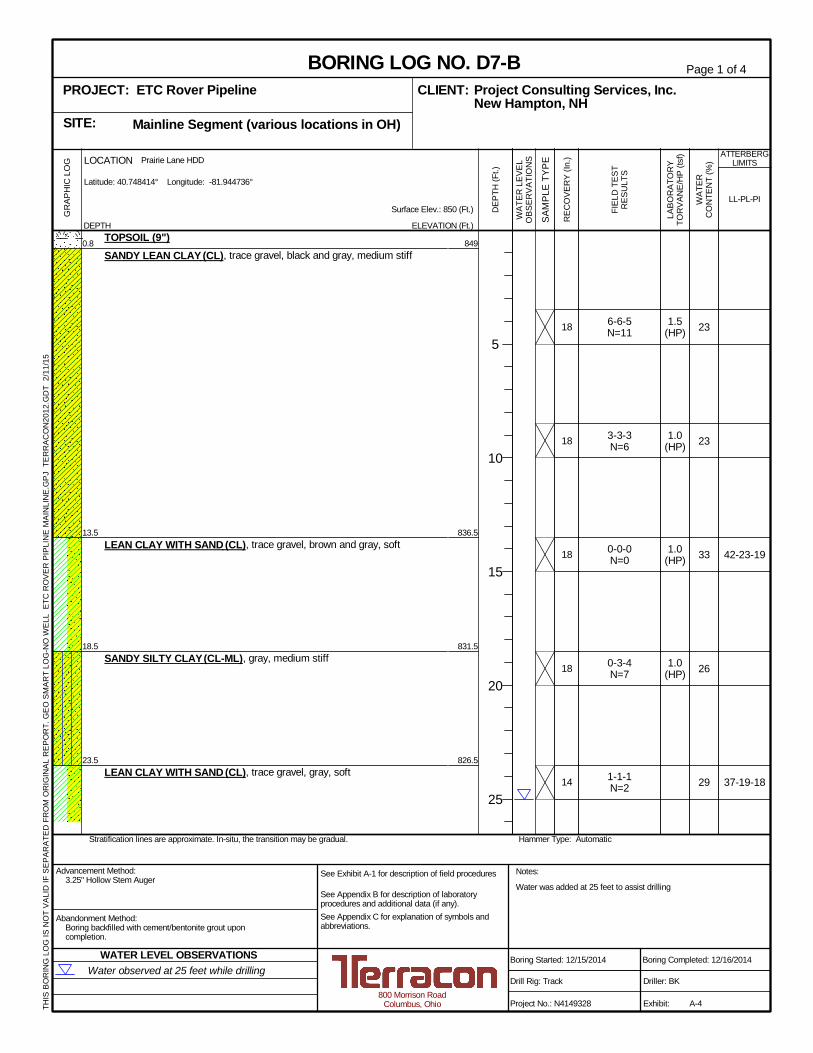
0.8
13.5
18.5
23.5
TOPSOIL (9")SANDY LEAN CLAY (CL), trace gravel, black and gray, medium stiff
LEAN CLAY WITH SAND (CL), trace gravel, brown and gray, soft
SANDY SILTY CLAY (CL-ML), gray, medium stiff
LEAN CLAY WITH SAND (CL), trace gravel, gray, soft
Water was added at 25 feet to assist drilling
6-6-5N=11
3-3-3N=6
0-0-0N=0
0-3-4N=7
1-1-1N=2
1.5(HP)
1.0(HP)
1.0(HP)
1.0(HP)
23
23
33
26
29
42-23-19
37-19-18
849
836.5
831.5
826.5
18
18
18
18
14
Hammer Type: AutomaticStratification lines are approximate. In-situ, the transition may be gradual.
LOCATION
DEPTH
Latitude: 40.748414° Longitude: -81.944736°
GR
APH
ICLO
G Prairie Lane HDD
THIS
BOR
ING
LOG
ISN
OT
VALI
DIF
SEPA
RAT
EDFR
OM
OR
IGIN
ALR
EPO
RT.
GEO
SMAR
TLO
G-N
OW
ELL
ETC
RO
VER
PIPL
INE
MAI
NLI
NE.
GPJ
TER
RAC
ON
2012
.GD
T2/
11/1
5
Mainline Segment (various locations in OH)SITE:
Page 1 of 4
Advancement Method:3.25" Hollow Stem Auger
Abandonment Method:Boring backfilled with cement/bentonite grout uponcompletion.
800 Morrison RoadColumbus, Ohio
Notes:
Project No.: N4149328
Drill Rig: Track
Boring Started: 12/15/2014
BORING LOG NO. D7-BProject Consulting Services, Inc.CLIENT:New Hampton, NH
Driller: BK
Boring Completed: 12/16/2014
Exhibit: A-4
See Exhibit A-1 for description of field procedures
See Appendix B for description of laboratoryprocedures and additional data (if any).See Appendix C for explanation of symbols andabbreviations.
PROJECT: ETC Rover Pipeline
FIEL
DTE
STR
ESU
LTS
LABO
RAT
OR
YTO
RVA
NE/
HP
(tsf)
WAT
ERC
ON
TEN
T(%
)
ATTERBERGLIMITS
LL-PL-PISurface Elev.: 850 (Ft.)
ELEVATION (Ft.) SAM
PLE
TYPE
WAT
ERLE
VEL
OBS
ERVA
TIO
NS
DEP
TH(F
t.)
5
10
15
20
25
REC
OVE
RY
(In.)
Water observed at 25 feet while drillingWATER LEVEL OBSERVATIONS

28.5
33.5
40.0
LEAN CLAY WITH SAND (CL), trace gravel, gray, soft (continued)
SILTY SAND WITH GRAVEL (SM), gray, medium dense
WELL GRADED SAND WITH SILT AND GRAVEL (SW-SM), darkbrown, medium dense
SILTY SAND (SM), trace gravel, dark brown, medium dense
Water sample was collected at 28.5 feet while drilling.Temp = 42.5F, TDS = 526ppm, Salt concentration = 351ppm,Conductivity = 736microS/cm, pH = 6.53
7-9-12N=21
17-9-11N=20
14-22-15N=37
0-6-15N=21
1-7-13N=20
13
10
14
11
18
821.5
816.5
810
18
18
18
18
18
Hammer Type: AutomaticStratification lines are approximate. In-situ, the transition may be gradual.
LOCATION
DEPTH
Latitude: 40.748414° Longitude: -81.944736°
GR
APH
ICLO
G Prairie Lane HDD
THIS
BOR
ING
LOG
ISN
OT
VALI
DIF
SEPA
RAT
EDFR
OM
OR
IGIN
ALR
EPO
RT.
GEO
SMAR
TLO
G-N
OW
ELL
ETC
RO
VER
PIPL
INE
MAI
NLI
NE.
GPJ
TER
RAC
ON
2012
.GD
T2/
11/1
5
Mainline Segment (various locations in OH)SITE:
Page 2 of 4
Advancement Method:3.25" Hollow Stem Auger
Abandonment Method:Boring backfilled with cement/bentonite grout uponcompletion.
800 Morrison RoadColumbus, Ohio
Notes:
Project No.: N4149328
Drill Rig: Track
Boring Started: 12/15/2014
BORING LOG NO. D7-BProject Consulting Services, Inc.CLIENT:New Hampton, NH
Driller: BK
Boring Completed: 12/16/2014
Exhibit: A-4
See Exhibit A-1 for description of field procedures
See Appendix B for description of laboratoryprocedures and additional data (if any).See Appendix C for explanation of symbols andabbreviations.
PROJECT: ETC Rover Pipeline
FIEL
DTE
STR
ESU
LTS
LABO
RAT
OR
YTO
RVA
NE/
HP
(tsf)
WAT
ERC
ON
TEN
T(%
)
ATTERBERGLIMITS
LL-PL-PISurface Elev.: 850 (Ft.)
ELEVATION (Ft.) SAM
PLE
TYPE
WAT
ERLE
VEL
OBS
ERVA
TIO
NS
DEP
TH(F
t.)
30
35
40
45
50
REC
OVE
RY
(In.)
Water observed at 25 feet while drillingWATER LEVEL OBSERVATIONS
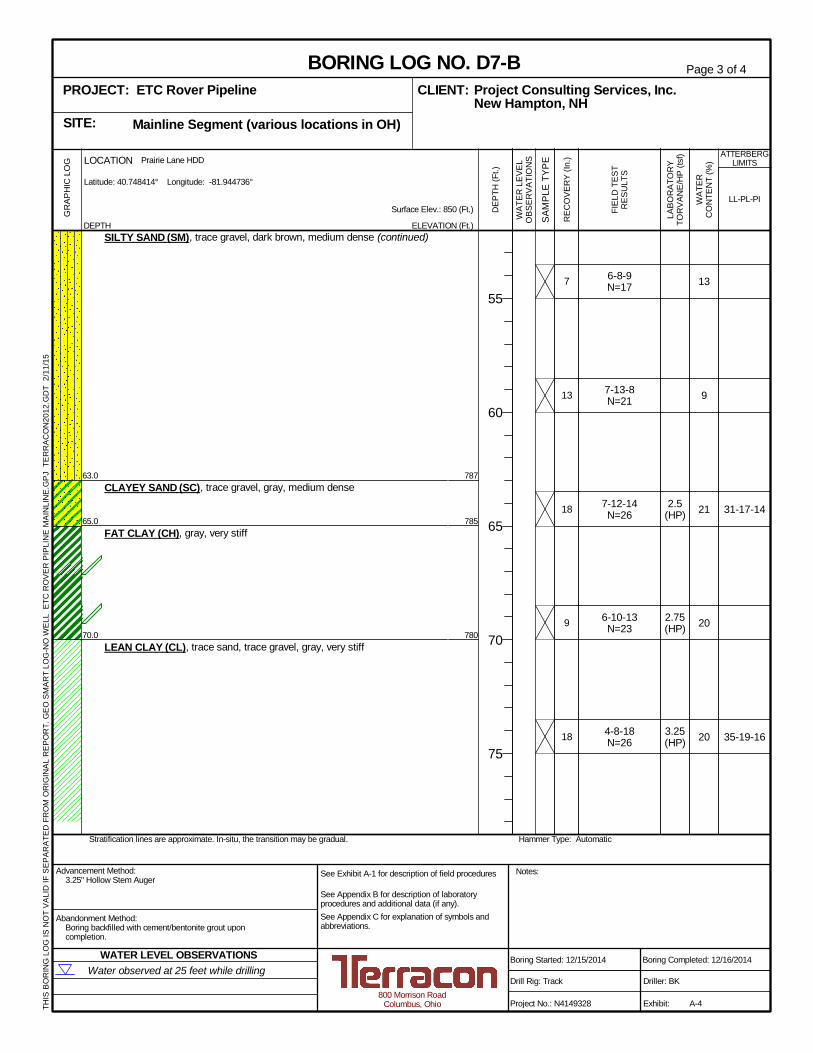
63.0
65.0
70.0
SILTY SAND (SM), trace gravel, dark brown, medium dense (continued)
CLAYEY SAND (SC), trace gravel, gray, medium dense
FAT CLAY (CH), gray, very stiff
LEAN CLAY (CL), trace sand, trace gravel, gray, very stiff
6-8-9N=17
7-13-8N=21
7-12-14N=26
6-10-13N=23
4-8-18N=26
2.5(HP)
2.75(HP)
3.25(HP)
13
9
21
20
20
31-17-14
35-19-16
787
785
780
7
13
18
9
18
Hammer Type: AutomaticStratification lines are approximate. In-situ, the transition may be gradual.
LOCATION
DEPTH
Latitude: 40.748414° Longitude: -81.944736°
GR
APH
ICLO
G Prairie Lane HDD
THIS
BOR
ING
LOG
ISN
OT
VALI
DIF
SEPA
RAT
EDFR
OM
OR
IGIN
ALR
EPO
RT.
GEO
SMAR
TLO
G-N
OW
ELL
ETC
RO
VER
PIPL
INE
MAI
NLI
NE.
GPJ
TER
RAC
ON
2012
.GD
T2/
11/1
5
Mainline Segment (various locations in OH)SITE:
Page 3 of 4
Advancement Method:3.25" Hollow Stem Auger
Abandonment Method:Boring backfilled with cement/bentonite grout uponcompletion.
800 Morrison RoadColumbus, Ohio
Notes:
Project No.: N4149328
Drill Rig: Track
Boring Started: 12/15/2014
BORING LOG NO. D7-BProject Consulting Services, Inc.CLIENT:New Hampton, NH
Driller: BK
Boring Completed: 12/16/2014
Exhibit: A-4
See Exhibit A-1 for description of field procedures
See Appendix B for description of laboratoryprocedures and additional data (if any).See Appendix C for explanation of symbols andabbreviations.
PROJECT: ETC Rover Pipeline
FIEL
DTE
STR
ESU
LTS
LABO
RAT
OR
YTO
RVA
NE/
HP
(tsf)
WAT
ERC
ON
TEN
T(%
)
ATTERBERGLIMITS
LL-PL-PISurface Elev.: 850 (Ft.)
ELEVATION (Ft.) SAM
PLE
TYPE
WAT
ERLE
VEL
OBS
ERVA
TIO
NS
DEP
TH(F
t.)
55
60
65
70
75
REC
OVE
RY
(In.)
Water observed at 25 feet while drillingWATER LEVEL OBSERVATIONS

80.0
LEAN CLAY (CL), trace sand, trace gravel, gray, very stiff (continued)
Boring Terminated at 80 Feet
4-8-9N=17 20
77018
Hammer Type: AutomaticStratification lines are approximate. In-situ, the transition may be gradual.
LOCATION
DEPTH
Latitude: 40.748414° Longitude: -81.944736°
GR
APH
ICLO
G Prairie Lane HDD
THIS
BOR
ING
LOG
ISN
OT
VALI
DIF
SEPA
RAT
EDFR
OM
OR
IGIN
ALR
EPO
RT.
GEO
SMAR
TLO
G-N
OW
ELL
ETC
RO
VER
PIPL
INE
MAI
NLI
NE.
GPJ
TER
RAC
ON
2012
.GD
T2/
11/1
5
Mainline Segment (various locations in OH)SITE:
Page 4 of 4
Advancement Method:3.25" Hollow Stem Auger
Abandonment Method:Boring backfilled with cement/bentonite grout uponcompletion.
800 Morrison RoadColumbus, Ohio
Notes:
Project No.: N4149328
Drill Rig: Track
Boring Started: 12/15/2014
BORING LOG NO. D7-BProject Consulting Services, Inc.CLIENT:New Hampton, NH
Driller: BK
Boring Completed: 12/16/2014
Exhibit: A-4
See Exhibit A-1 for description of field procedures
See Appendix B for description of laboratoryprocedures and additional data (if any).See Appendix C for explanation of symbols andabbreviations.
PROJECT: ETC Rover Pipeline
FIEL
DTE
STR
ESU
LTS
LABO
RAT
OR
YTO
RVA
NE/
HP
(tsf)
WAT
ERC
ON
TEN
T(%
)
ATTERBERGLIMITS
LL-PL-PISurface Elev.: 850 (Ft.)
ELEVATION (Ft.) SAM
PLE
TYPE
WAT
ERLE
VEL
OBS
ERVA
TIO
NS
DEP
TH(F
t.)
80
REC
OVE
RY
(In.)
Water observed at 25 feet while drillingWATER LEVEL OBSERVATIONS

APPENDIX BLABORATORY TESTING

Geotechnical Data ReportProposed Prairie Lane HDD Cores D7-A and D7-B ■ Wayne County, OhioFebruary 14, 2015 ■ Terracon Project No. N4149328
Responsive ■ Resourceful ■ Reliable Exhibit B-1
Laboratory TestingAs a part of the laboratory testing program, the soil samples were classified in the laboratory basedon visual observation, and texture. The soil descriptions presented on the boring logs for nativesoils are in accordance with our enclosed General Notes and Unified Soil Classification System(USCS). A brief description of the Unified System is included in this report. Classification waspredominantly by visual manual procedures. Moisture content, grain size analysis, and Atterberglimit tests were performed on selected samples. Chloride corrosivity testing was also performed ongroundwater sample. The results of this laboratory testing are presented on the boring logs andlaboratory data sheets included in Appendix B.

Tested By: DS Checked By: AM
TERRACONCONSULTANTS, INC.
Columbus, Ohio
1-26-15
(no specification provided)
PL= LL= PI=
D90= D85= D60=D50= D30= D15=D10= Cu= Cc=
USCS= AASHTO=
*
Gray LEAN CLAY, trace sand, trace gravel3/8#4#10#20#40
#100#200
0.0267 mm.0.0180 mm.0.0111 mm.0.0081 mm.0.0058 mm.0.0034 mm.
100.099.993.193.193.092.891.370.660.348.341.936.429.3
20 39 19
0.0664 0.0489 0.01780.0119 0.0036
CL A-6(18)
F.M.=0.34
Project Consulting Services, Inc.
Proposed Rover ETC Pipeline Project - "MAIN LINE SEGMENT"
N4149328
Soil Description
Atterberg Limits
Coefficients
Classification
Remarks
Source of Sample: D7-A Depth: 13.5'-15.0'Sample Number: S-3 Date:
Client:
Project:
Project No:
SIEVE PERCENT SPEC.* PASS?
SIZE FINER PERCENT (X=NO)
PE
RC
EN
T F
INE
R
0
10
20
30
40
50
60
70
80
90
100
GRAIN SIZE - mm.
0.0010.010.1110100
% +3"Coarse
% Gravel
Fine Coarse Medium
% Sand
Fine Silt
% Fines
Clay
0.0 0.0 0.1 6.8 0.1 1.7 57.1 34.2
6 in.
3 in.
2 in.
1½
in.
1 in.
¾ in.
½ in.
3/8
in.
#4
#10
#20
#30
#40
#60
#100
#140
#200
Particle Size Distribution Report
Exhibit B-2
Tested By: DS Checked By: AM
LIQUID AND PLASTIC LIMITS TEST REPORTP
LA
ST
ICIT
Y I
ND
EX
0
10
20
30
40
50
60
LIQUID LIMIT0 10 20 30 40 50 60 70 80 90 100 110
CL-ML
CL or OL
CH or OH
ML or OL MH or OH
Dashed line indicates the approximateupper limit boundary for natural soils
4
7
WA
TE
R C
ON
TE
NT
37.2
37.6
38
38.4
38.8
39.2
39.6
40
40.4
40.8
41.2
NUMBER OF BLOWS5 6 7 8 9 10 20 25 30 40
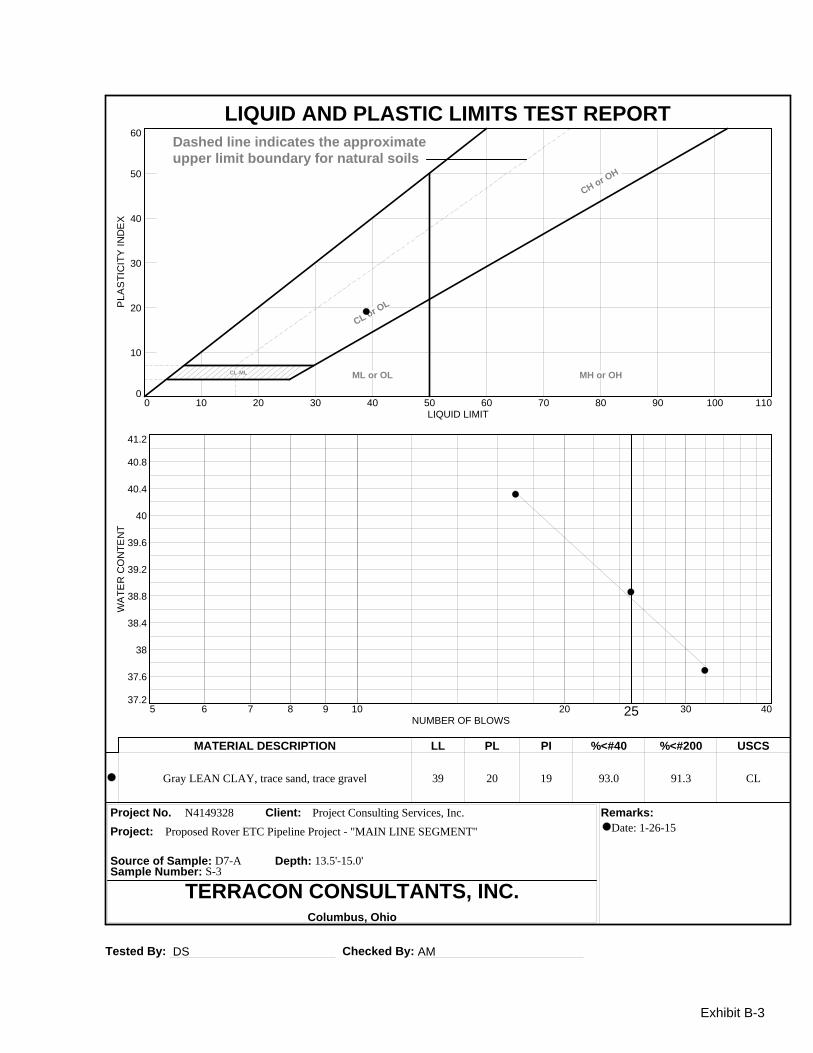
MATERIAL DESCRIPTION LL PL PI %<#40 %<#200 USCS
Project No. Client: Remarks:
Project:
Source of Sample: D7-A Depth: 13.5'-15.0'Sample Number: S-3
TERRACON CONSULTANTS, INC.Columbus, Ohio
Gray LEAN CLAY, trace sand, trace gravel 39 20 19 93.0 91.3 CL
N4149328 Project Consulting Services, Inc.
Date: 1-26-15Proposed Rover ETC Pipeline Project - "MAIN LINE SEGMENT"
Exhibit B-3

Tested By: DS Checked By: AM
TERRACONCONSULTANTS, INC.
Columbus, Ohio
1-26-15
(no specification provided)
PL= LL= PI=
D90= D85= D60=D50= D30= D15=D10= Cu= Cc=
USCS= AASHTO=
*
Dark brown poorly graded SAND with silt#4#10#20#40
#100#200
0.0351 mm.0.0222 mm.0.0129 mm.0.0092 mm.0.0064 mm.0.0037 mm.
100.099.296.979.519.4
9.68.18.17.16.16.25.3
NP NP NP
0.5687 0.4854 0.30270.2598 0.1882 0.13000.0859 3.52 1.36
SP-SM A-3
F.M.=1.32
Project Consulting Services, Inc.
Proposed Rover ETC Pipeline Project - "MAIN LINE SEGMENT"
N4149328
Soil Description
Atterberg Limits
Coefficients
Classification
Remarks
Source of Sample: D7-A Depth: 23.5'-25.0'Sample Number: S-5 Date:
Client:
Project:
Project No:
SIEVE PERCENT SPEC.* PASS?
SIZE FINER PERCENT (X=NO)
PE
RC
EN
T F
INE
R
0
10
20
30
40
50
60
70
80
90
100
GRAIN SIZE - mm.
0.0010.010.1110100
% +3"Coarse
% Gravel
Fine Coarse Medium
% Sand
Fine Silt
% Fines
Clay
0.0 0.0 0.0 0.8 19.7 69.9 3.7 5.9
6 in.
3 in.
2 in.
1½
in.
1 in.
¾ in.
½ in.
3/8
in.
#4
#10
#20
#30
#40
#60
#100
#140
#200
Particle Size Distribution Report
Exhibit B-4
Tested By: DS Checked By: AM
TERRACONCONSULTANTS, INC.
Columbus, Ohio
1-26-15
(no specification provided)
PL= LL= PI=
D90= D85= D60=D50= D30= D15=D10= Cu= Cc=
USCS= AASHTO=
*
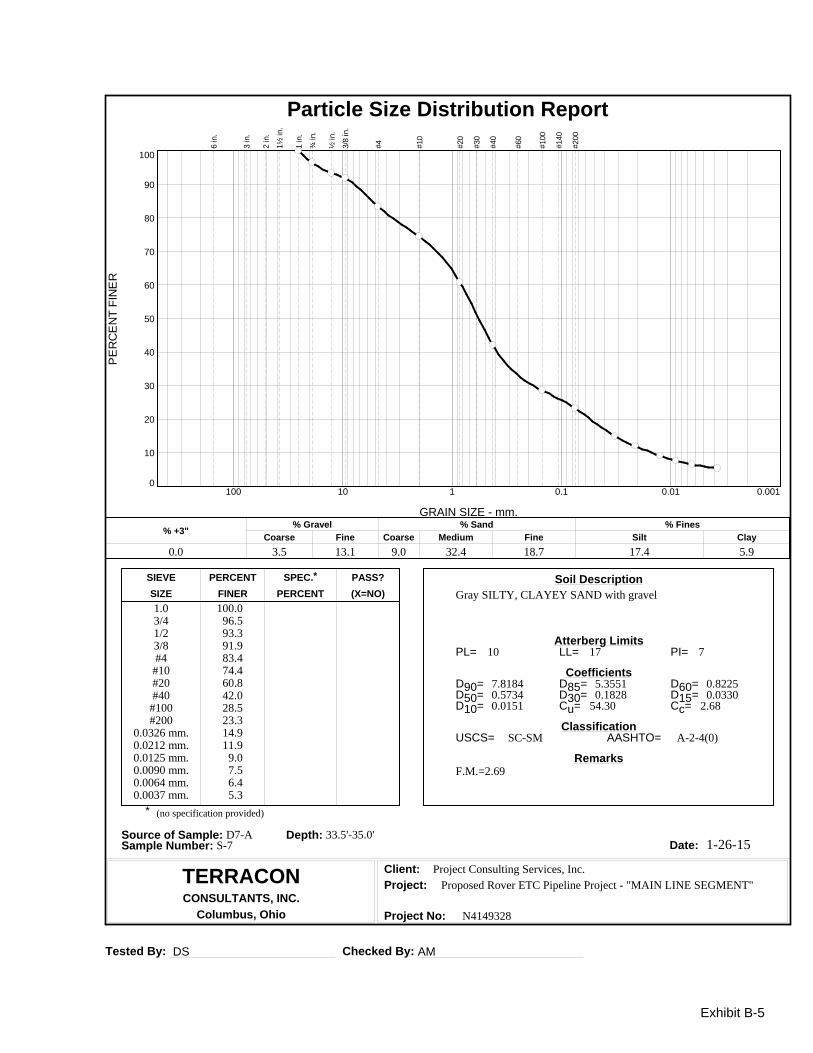
Gray SILTY, CLAYEY SAND with gravel1.03/41/23/8#4#10#20#40
#100#200
0.0326 mm.0.0212 mm.0.0125 mm.0.0090 mm.0.0064 mm.0.0037 mm.
100.096.593.391.983.474.460.842.028.523.314.911.9
9.07.56.45.3
10 17 7
7.8184 5.3551 0.82250.5734 0.1828 0.03300.0151 54.30 2.68
SC-SM A-2-4(0)
F.M.=2.69
Project Consulting Services, Inc.
Proposed Rover ETC Pipeline Project - "MAIN LINE SEGMENT"
N4149328
Soil Description
Atterberg Limits
Coefficients
Classification
Remarks
Source of Sample: D7-A Depth: 33.5'-35.0'Sample Number: S-7 Date:
Client:
Project:
Project No:
SIEVE PERCENT SPEC.* PASS?
SIZE FINER PERCENT (X=NO)
PE
RC
EN
T F
INE
R
0
10
20
30
40
50
60
70
80
90
100
GRAIN SIZE - mm.
0.0010.010.1110100
% +3"Coarse
% Gravel
Fine Coarse Medium
% Sand
Fine Silt
% Fines
Clay
0.0 3.5 13.1 9.0 32.4 18.7 17.4 5.9
6 in.
3 in.
2 in.
1½
in.
1 in.
¾ in.
½ in.
3/8
in.
#4
#10
#20
#30
#40
#60
#100
#140
#200
Particle Size Distribution Report
Exhibit B-5
Tested By: DS Checked By: AM
LIQUID AND PLASTIC LIMITS TEST REPORTP
LA
ST
ICIT
Y I
ND
EX
0
10
20
30
40
50
60
LIQUID LIMIT0 10 20 30 40 50 60 70 80 90 100 110
CL-ML
CL or OL
CH or OH
ML or OL MH or OH
Dashed line indicates the approximateupper limit boundary for natural soils
4
7
WA
TE
R C
ON
TE
NT
16.2
16.3
16.4
16.5
16.6
16.7
16.8
16.9
17
17.1
17.2
NUMBER OF BLOWS5 6 7 8 9 10 20 25 30 40
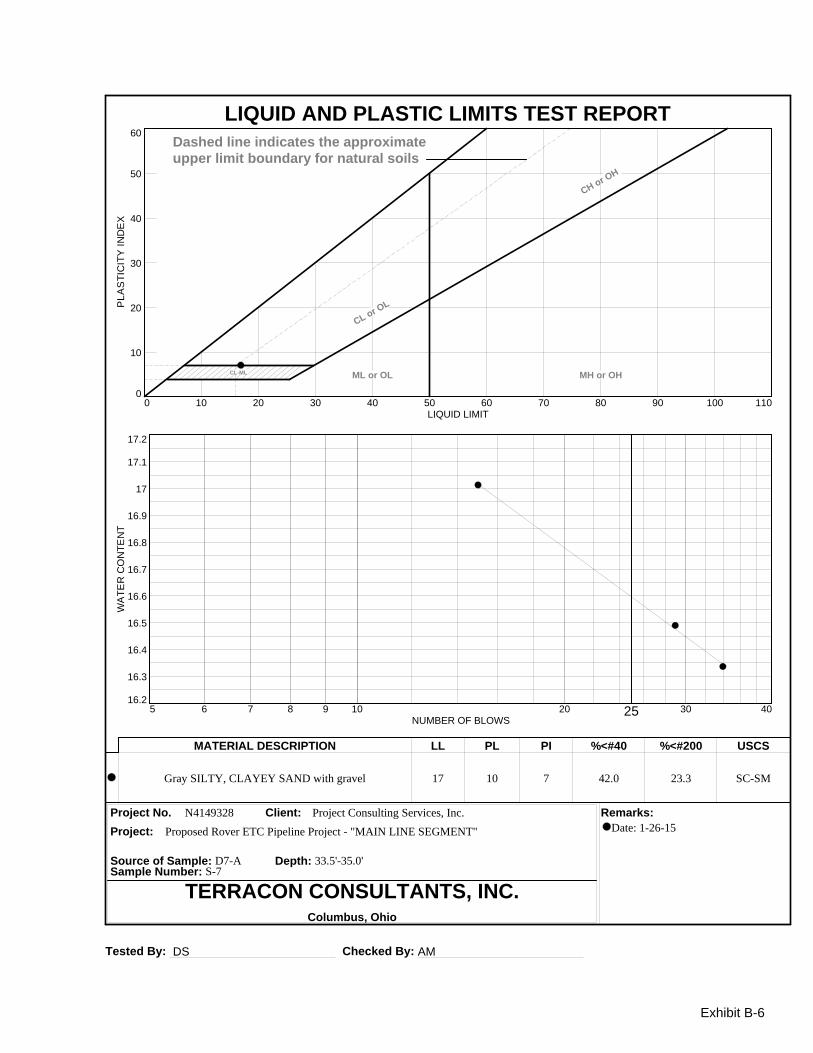
MATERIAL DESCRIPTION LL PL PI %<#40 %<#200 USCS
Project No. Client: Remarks:
Project:
Source of Sample: D7-A Depth: 33.5'-35.0'Sample Number: S-7
TERRACON CONSULTANTS, INC.Columbus, Ohio
Gray SILTY, CLAYEY SAND with gravel 17 10 7 42.0 23.3 SC-SM
N4149328 Project Consulting Services, Inc.
Date: 1-26-15Proposed Rover ETC Pipeline Project - "MAIN LINE SEGMENT"
Exhibit B-6
Tested By: DS Checked By: AM
TERRACONCONSULTANTS, INC.
Columbus, Ohio
1-26-15
(no specification provided)
PL= LL= PI=
D90= D85= D60=D50= D30= D15=D10= Cu= Cc=
USCS= AASHTO=
*
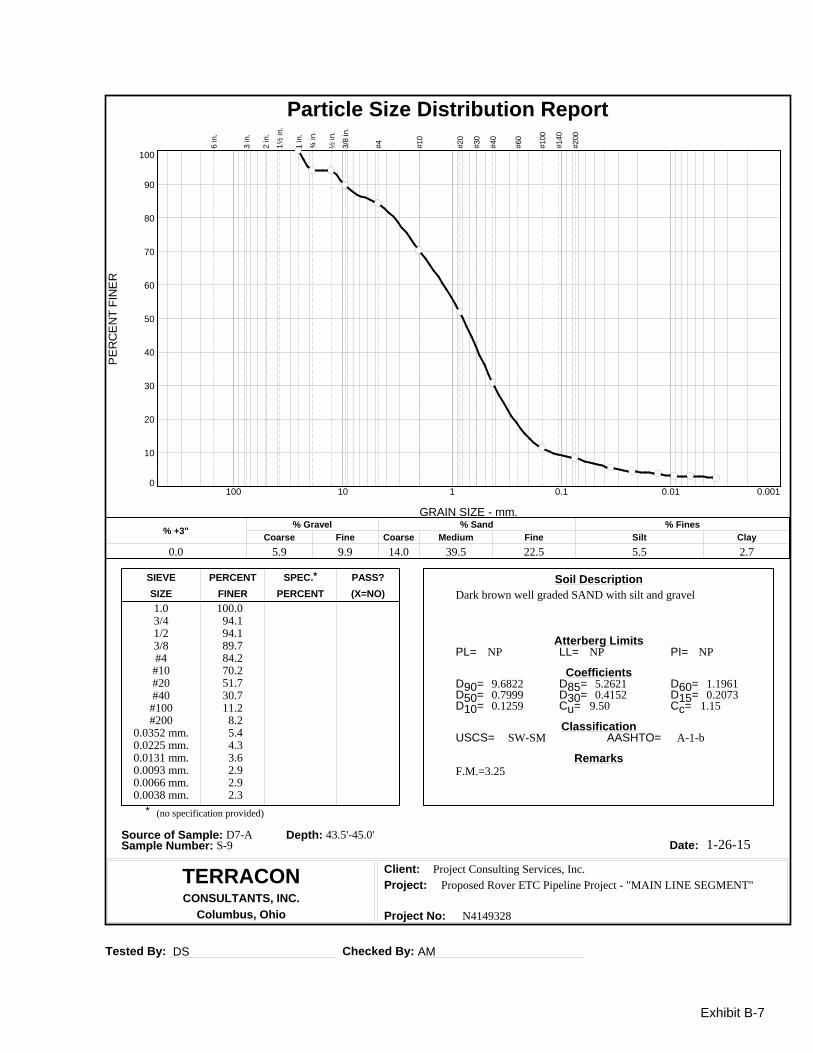
Dark brown well graded SAND with silt and gravel1.03/41/23/8#4#10#20#40
#100#200
0.0352 mm.0.0225 mm.0.0131 mm.0.0093 mm.0.0066 mm.0.0038 mm.
100.094.194.189.784.270.251.730.711.2
8.25.44.33.62.92.92.3
NP NP NP
9.6822 5.2621 1.19610.7999 0.4152 0.20730.1259 9.50 1.15
SW-SM A-1-b
F.M.=3.25
Project Consulting Services, Inc.
Proposed Rover ETC Pipeline Project - "MAIN LINE SEGMENT"
N4149328
Soil Description
Atterberg Limits
Coefficients
Classification
Remarks
Source of Sample: D7-A Depth: 43.5'-45.0'Sample Number: S-9 Date:
Client:
Project:
Project No:
SIEVE PERCENT SPEC.* PASS?
SIZE FINER PERCENT (X=NO)
PE
RC
EN
T F
INE
R
0
10
20
30
40
50
60
70
80
90
100
GRAIN SIZE - mm.
0.0010.010.1110100
% +3"Coarse
% Gravel
Fine Coarse Medium
% Sand
Fine Silt
% Fines
Clay
0.0 5.9 9.9 14.0 39.5 22.5 5.5 2.7
6 in.
3 in.
2 in.
1½
in.
1 in.
¾ in.
½ in.
3/8
in.
#4
#10
#20
#30
#40
#60
#100
#140
#200
Particle Size Distribution Report
Exhibit B-7
Tested By: DS Checked By: AM
TERRACONCONSULTANTS, INC.
Columbus, Ohio
1-26-15
(no specification provided)
PL= LL= PI=
D90= D85= D60=D50= D30= D15=D10= Cu= Cc=
USCS= AASHTO=
*
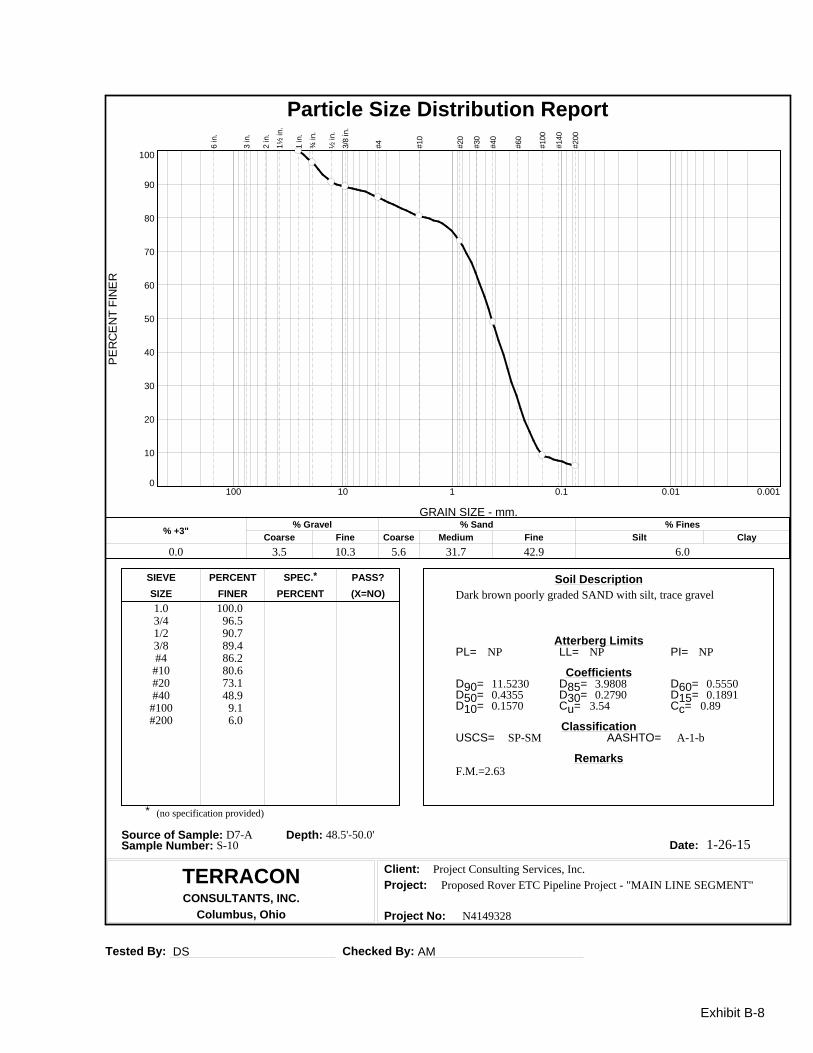
Dark brown poorly graded SAND with silt, trace gravel1.03/41/23/8#4#10#20#40
#100#200
100.096.590.789.486.280.673.148.9
9.16.0
NP NP NP
11.5230 3.9808 0.55500.4355 0.2790 0.18910.1570 3.54 0.89
SP-SM A-1-b
F.M.=2.63
Project Consulting Services, Inc.
Proposed Rover ETC Pipeline Project - "MAIN LINE SEGMENT"
N4149328
Soil Description
Atterberg Limits
Coefficients
Classification
Remarks
Source of Sample: D7-A Depth: 48.5'-50.0'Sample Number: S-10 Date:
Client:
Project:
Project No:
SIEVE PERCENT SPEC.* PASS?
SIZE FINER PERCENT (X=NO)
PE
RC
EN
T F
INE
R
0
10
20
30
40
50
60
70
80
90
100
GRAIN SIZE - mm.
0.0010.010.1110100
% +3"Coarse
% Gravel
Fine Coarse Medium
% Sand
Fine Silt
% Fines
Clay
0.0 3.5 10.3 5.6 31.7 42.9 6.0
6 in.
3 in.
2 in.
1½
in.
1 in.
¾ in.
½ in.
3/8
in.
#4
#10
#20
#30
#40
#60
#100
#140
#200
Particle Size Distribution Report
Exhibit B-8

Tested By: DS Checked By: AM
TERRACONCONSULTANTS, INC.
Columbus, Ohio
1-26-15
(no specification provided)
PL= LL= PI=
D90= D85= D60=D50= D30= D15=D10= Cu= Cc=
USCS= AASHTO=
*
Black LEAN CLAY with sand, trace gravel3/8#4#10#20#40
#100#200
100.099.998.996.593.487.781.5 0.2138 0.1088
F.M.=0.29
Project Consulting Services, Inc.
Proposed Rover ETC Pipeline Project - "MAIN LINE SEGMENT"
N4149328
Soil Description
Atterberg Limits
Coefficients
Classification
Remarks
Source of Sample: D7-A Depth: 58.5'-60.0'Sample Number: S-12 Date:
Client:
Project:
Project No:
SIEVE PERCENT SPEC.* PASS?
SIZE FINER PERCENT (X=NO)
PE
RC
EN
T F
INE
R
0
10
20
30
40
50
60
70
80
90
100
GRAIN SIZE - mm.
0.0010.010.1110100
% +3"Coarse
% Gravel
Fine Coarse Medium
% Sand
Fine Silt
% Fines
Clay
0.0 0.0 0.1 1.0 5.5 11.9 81.5
6 in.
3 in.
2 in.
1½
in.
1 in.
¾ in.
½ in.
3/8
in.
#4
#10
#20
#30
#40
#60
#100
#140
#200
Particle Size Distribution Report
Exhibit B-9
Tested By: DS Checked By: AM
TERRACONCONSULTANTS, INC.
Columbus, Ohio
1-26-15
(no specification provided)
PL= LL= PI=
D90= D85= D60=D50= D30= D15=D10= Cu= Cc=
USCS= AASHTO=
*
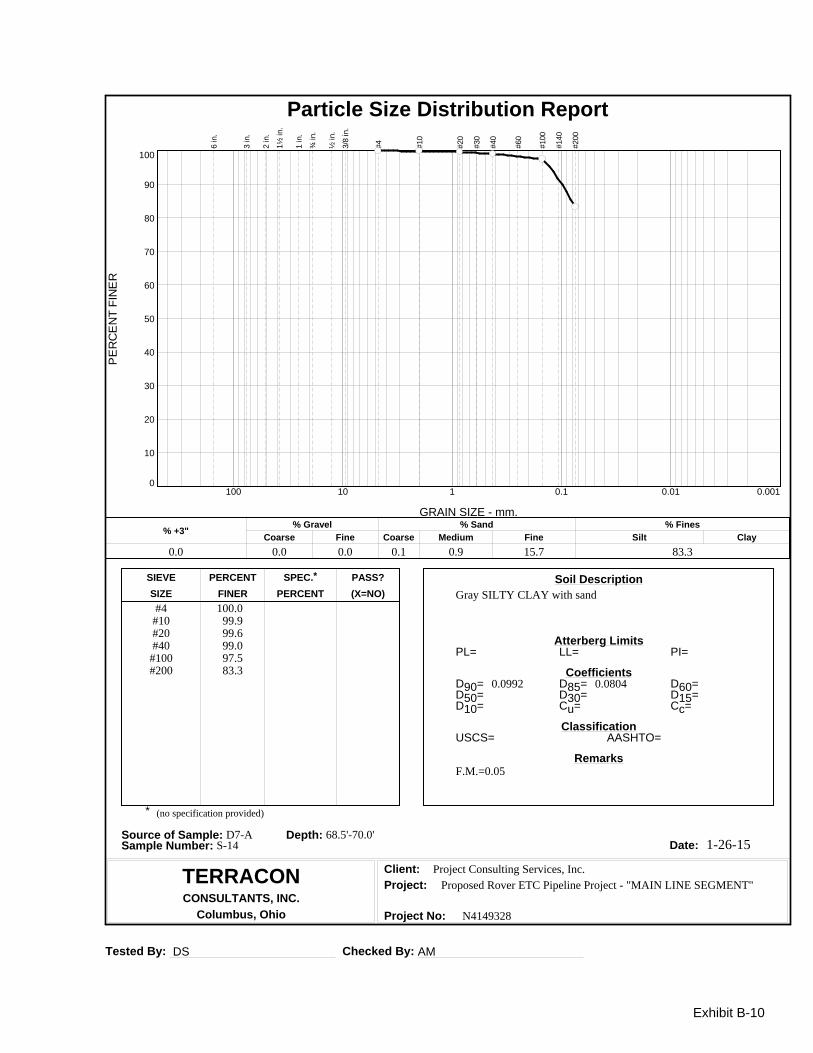
Gray SILTY CLAY with sand#4#10#20#40
#100#200
100.099.999.699.097.583.3
0.0992 0.0804
F.M.=0.05
Project Consulting Services, Inc.
Proposed Rover ETC Pipeline Project - "MAIN LINE SEGMENT"
N4149328
Soil Description
Atterberg Limits
Coefficients
Classification
Remarks
Source of Sample: D7-A Depth: 68.5'-70.0'Sample Number: S-14 Date:
Client:
Project:
Project No:
SIEVE PERCENT SPEC.* PASS?
SIZE FINER PERCENT (X=NO)
PE
RC
EN
T F
INE
R
0
10
20
30
40
50
60
70
80
90
100
GRAIN SIZE - mm.
0.0010.010.1110100
% +3"Coarse
% Gravel
Fine Coarse Medium
% Sand
Fine Silt
% Fines
Clay
0.0 0.0 0.0 0.1 0.9 15.7 83.3
6 in.
3 in.
2 in.
1½
in.
1 in.
¾ in.
½ in.
3/8
in.
#4
#10
#20
#30
#40
#60
#100
#140
#200
Particle Size Distribution Report
Exhibit B-10

Tested By: DS Checked By: AM
TERRACONCONSULTANTS, INC.
Columbus, Ohio
1-26-15
(no specification provided)
PL= LL= PI=
D90= D85= D60=D50= D30= D15=D10= Cu= Cc=
USCS= AASHTO=
*
Brown and gray LEAN CLAY with sand, trace gravel3/8#4#10#20#40
#100#200
0.0256 mm.0.0171 mm.0.0106 mm.0.0078 mm.0.0056 mm.0.0033 mm.
100.099.988.488.287.586.183.470.963.552.545.940.132.9
23 42 19
2.3189 0.1015 0.01450.0094
CL A-7-6(16)
F.M.=0.61
Project Consulting Services, Inc.
Proposed Rover ETC Pipeline Project - "MAIN LINE SEGMENT"
N4149328
Soil Description
Atterberg Limits
Coefficients
Classification
Remarks
Source of Sample: D7-B Depth: 13.5'-15.0'Sample Number: S-3 Date:
Client:
Project:
Project No:
SIEVE PERCENT SPEC.* PASS?
SIZE FINER PERCENT (X=NO)
PE
RC
EN
T F
INE
R
0
10
20
30
40
50
60
70
80
90
100
GRAIN SIZE - mm.
0.0010.010.1110100
% +3"Coarse
% Gravel
Fine Coarse Medium
% Sand
Fine Silt
% Fines
Clay
0.0 0.0 0.1 11.5 0.9 4.1 45.1 38.3
6 in.
3 in.
2 in.
1½
in.
1 in.
¾ in.
½ in.
3/8
in.
#4
#10
#20
#30
#40
#60
#100
#140
#200
Particle Size Distribution Report
Exhibit B-11

Tested By: DS Checked By: AM
LIQUID AND PLASTIC LIMITS TEST REPORTP
LA
ST
ICIT
Y I
ND
EX
0
10
20
30
40
50
60
LIQUID LIMIT0 10 20 30 40 50 60 70 80 90 100 110
CL-ML
CL or OL
CH or OH
ML or OL MH or OH
Dashed line indicates the approximateupper limit boundary for natural soils
4
7
WA
TE
R C
ON
TE
NT
41.3
41.5
41.7
41.9
42.1
42.3
42.5
42.7
42.9
43.1
43.3
NUMBER OF BLOWS5 6 7 8 9 10 20 25 30 40
MATERIAL DESCRIPTION LL PL PI %<#40 %<#200 USCS
Project No. Client: Remarks:
Project:
Source of Sample: D7-B Depth: 13.5'-15.0'Sample Number: S-3
TERRACON CONSULTANTS, INC.Columbus, Ohio
Brown and gray LEAN CLAY with sand, trace gravel 42 23 19 87.5 83.4 CL
N4149328 Project Consulting Services, Inc.
Date: 1-26-15Proposed Rover ETC Pipeline Project - "MAIN LINE SEGMENT"
Exhibit B-12
Tested By: DS Checked By: AM
TERRACONCONSULTANTS, INC.
Columbus, Ohio
1-26-15
(no specification provided)
PL= LL= PI=
D90= D85= D60=D50= D30= D15=D10= Cu= Cc=
USCS= AASHTO=
*
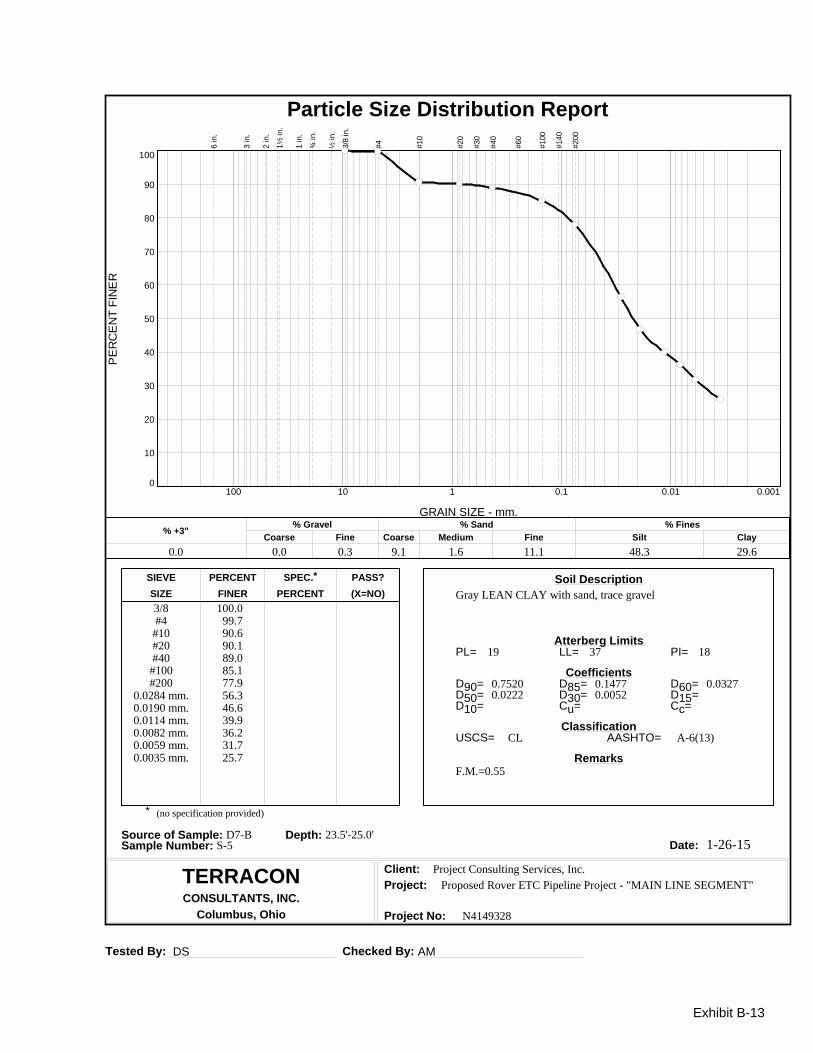
Gray LEAN CLAY with sand, trace gravel3/8#4#10#20#40
#100#200
0.0284 mm.0.0190 mm.0.0114 mm.0.0082 mm.0.0059 mm.0.0035 mm.
100.099.790.690.189.085.177.956.346.639.936.231.725.7
19 37 18
0.7520 0.1477 0.03270.0222 0.0052
CL A-6(13)
F.M.=0.55
Project Consulting Services, Inc.
Proposed Rover ETC Pipeline Project - "MAIN LINE SEGMENT"
N4149328
Soil Description
Atterberg Limits
Coefficients
Classification
Remarks
Source of Sample: D7-B Depth: 23.5'-25.0'Sample Number: S-5 Date:
Client:
Project:
Project No:
SIEVE PERCENT SPEC.* PASS?
SIZE FINER PERCENT (X=NO)
PE
RC
EN
T F
INE
R
0
10
20
30
40
50
60
70
80
90
100
GRAIN SIZE - mm.
0.0010.010.1110100
% +3"Coarse
% Gravel
Fine Coarse Medium
% Sand
Fine Silt
% Fines
Clay
0.0 0.0 0.3 9.1 1.6 11.1 48.3 29.6
6 in.
3 in.
2 in.
1½
in.
1 in.
¾ in.
½ in.
3/8
in.
#4
#10
#20
#30
#40
#60
#100
#140
#200
Particle Size Distribution Report
Exhibit B-13

Tested By: DS Checked By: AM
LIQUID AND PLASTIC LIMITS TEST REPORTP
LA
ST
ICIT
Y I
ND
EX
0
10
20
30
40
50
60
LIQUID LIMIT0 10 20 30 40 50 60 70 80 90 100 110
CL-ML
CL or OL
CH or OH
ML or OL MH or OH
Dashed line indicates the approximateupper limit boundary for natural soils
4
7
WA
TE
R C
ON
TE
NT
34.7
35.2
35.7
36.2
36.7
37.2
37.7
38.2
38.7
39.2
39.7
NUMBER OF BLOWS5 6 7 8 9 10 20 25 30 40
MATERIAL DESCRIPTION LL PL PI %<#40 %<#200 USCS
Project No. Client: Remarks:
Project:
Source of Sample: D7-B Depth: 23.5'-25.0'Sample Number: S-5
TERRACON CONSULTANTS, INC.Columbus, Ohio
Gray LEAN CLAY with sand, trace gravel 37 19 18 89.0 77.9 CL
N4149328 Project Consulting Services, Inc.
Date: 1-26-15Proposed Rover ETC Pipeline Project - "MAIN LINE SEGMENT"
Exhibit B-14
Tested By: DS Checked By: AM
TERRACONCONSULTANTS, INC.
Columbus, Ohio
1-26-15
(no specification provided)
PL= LL= PI=
D90= D85= D60=D50= D30= D15=D10= Cu= Cc=
USCS= AASHTO=
*
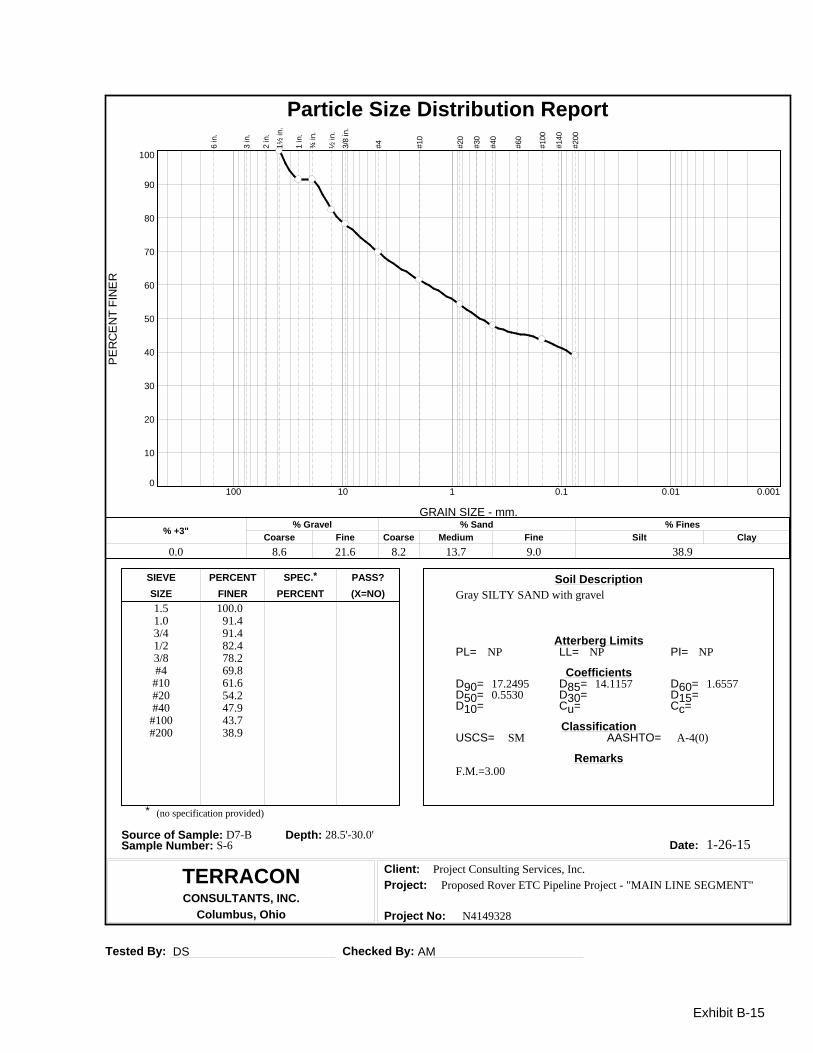
Gray SILTY SAND with gravel1.51.03/41/23/8#4#10#20#40
#100#200
100.091.491.482.478.269.861.654.247.943.738.9
NP NP NP
17.2495 14.1157 1.65570.5530
SM A-4(0)
F.M.=3.00
Project Consulting Services, Inc.
Proposed Rover ETC Pipeline Project - "MAIN LINE SEGMENT"
N4149328
Soil Description
Atterberg Limits
Coefficients
Classification
Remarks
Source of Sample: D7-B Depth: 28.5'-30.0'Sample Number: S-6 Date:
Client:
Project:
Project No:
SIEVE PERCENT SPEC.* PASS?
SIZE FINER PERCENT (X=NO)
PE
RC
EN
T F
INE
R
0
10
20
30
40
50
60
70
80
90
100
GRAIN SIZE - mm.
0.0010.010.1110100
% +3"Coarse
% Gravel
Fine Coarse Medium
% Sand
Fine Silt
% Fines
Clay
0.0 8.6 21.6 8.2 13.7 9.0 38.9
6 in.
3 in.
2 in.
1½
in.
1 in.
¾ in.
½ in.
3/8
in.
#4
#10
#20
#30
#40
#60
#100
#140
#200
Particle Size Distribution Report
Exhibit B-15

Tested By: DS Checked By: AM
TERRACONCONSULTANTS, INC.
Columbus, Ohio
1-26-15
(no specification provided)
PL= LL= PI=
D90= D85= D60=D50= D30= D15=D10= Cu= Cc=
USCS= AASHTO=
*
Dark brown well graded SAND with silt and gravel3/41/23/8#4#10#20#40
#100#200
100.099.194.982.562.548.225.612.510.0
NP NP NP
7.0602 5.3525 1.71520.9136 0.4908 0.23030.0754 22.74 1.86
SW-SM A-1-b
F.M.=3.34
Project Consulting Services, Inc.
Proposed Rover ETC Pipeline Project - "MAIN LINE SEGMENT"
N4149328
Soil Description
Atterberg Limits
Coefficients
Classification
Remarks
Source of Sample: D7-B Depth: 38.5'-40.0'Sample Number: S-8 Date:
Client:
Project:
Project No:
SIEVE PERCENT SPEC.* PASS?
SIZE FINER PERCENT (X=NO)
PE
RC
EN
T F
INE
R
0
10
20
30
40
50
60
70
80
90
100
GRAIN SIZE - mm.
0.0010.010.1110100
% +3"Coarse
% Gravel
Fine Coarse Medium
% Sand
Fine Silt
% Fines
Clay
0.0 0.0 17.5 20.0 36.9 15.6 10.0
6 in.
3 in.
2 in.
1½
in.
1 in.
¾ in.
½ in.
3/8
in.
#4
#10
#20
#30
#40
#60
#100
#140
#200
Particle Size Distribution Report
Exhibit B-16

Tested By: DS Checked By: AM
TERRACONCONSULTANTS, INC.
Columbus, Ohio
1-26-15
(no specification provided)
PL= LL= PI=
D90= D85= D60=D50= D30= D15=D10= Cu= Cc=
USCS= AASHTO=
*
Dark brown SILTY SAND, trace gravel3/8#4#10#20#40
#100#200
100.098.297.296.376.527.718.9
NP NP NP
0.6207 0.5280 0.30450.2518 0.1612
SM A-2-4(0)
F.M.=1.32
Project Consulting Services, Inc.
Proposed Rover ETC Pipeline Project - "MAIN LINE SEGMENT"
N4149328
Soil Description
Atterberg Limits
Coefficients
Classification
Remarks
Source of Sample: D7-B Depth: 48.5'-50.0'Sample Number: S-10 Date:
Client:
Project:
Project No:
SIEVE PERCENT SPEC.* PASS?
SIZE FINER PERCENT (X=NO)
PE
RC
EN
T F
INE
R
0
10
20
30
40
50
60
70
80
90
100
GRAIN SIZE - mm.
0.0010.010.1110100
% +3"Coarse
% Gravel
Fine Coarse Medium
% Sand
Fine Silt
% Fines
Clay
0.0 0.0 1.8 1.0 20.7 57.6 18.9
6 in.
3 in.
2 in.
1½
in.
1 in.
¾ in.
½ in.
3/8
in.
#4
#10
#20
#30
#40
#60
#100
#140
#200
Particle Size Distribution Report
Exhibit B-17
Tested By: DS Checked By: AM
TERRACONCONSULTANTS, INC.
Columbus, Ohio
1-26-15
(no specification provided)
PL= LL= PI=
D90= D85= D60=D50= D30= D15=D10= Cu= Cc=
USCS= AASHTO=
*
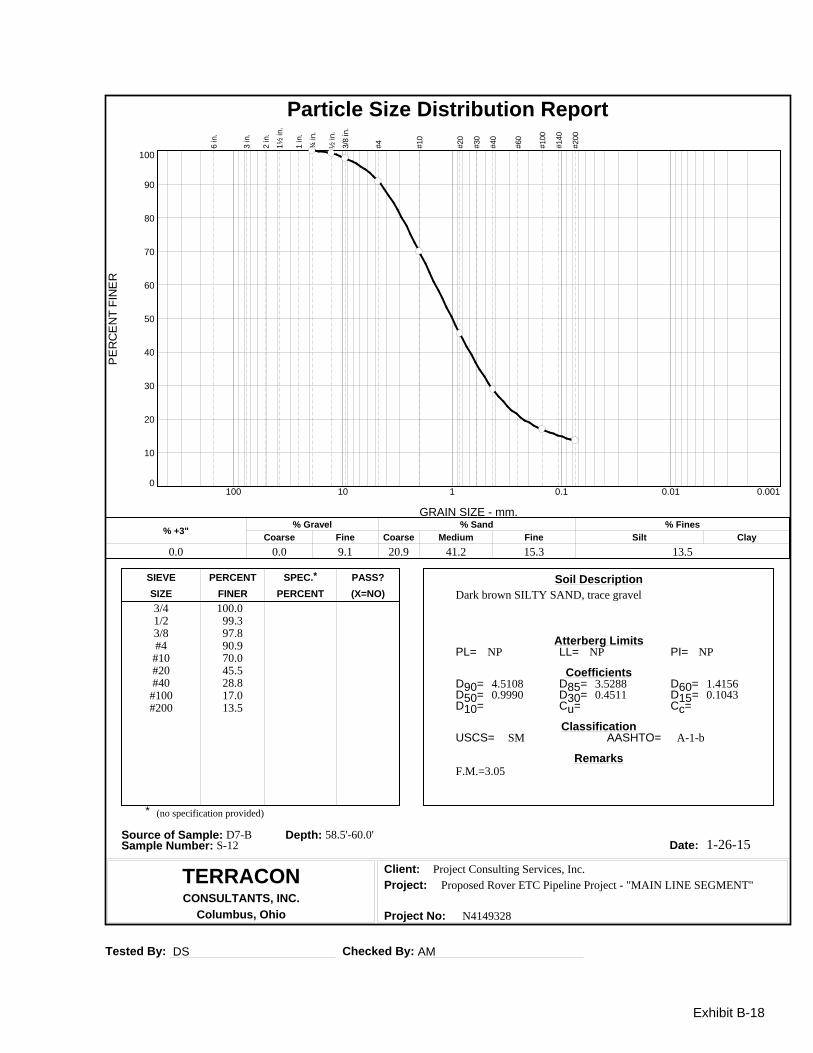
Dark brown SILTY SAND, trace gravel3/41/23/8#4#10#20#40
#100#200
100.099.397.890.970.045.528.817.013.5
NP NP NP
4.5108 3.5288 1.41560.9990 0.4511 0.1043
SM A-1-b
F.M.=3.05
Project Consulting Services, Inc.
Proposed Rover ETC Pipeline Project - "MAIN LINE SEGMENT"
N4149328
Soil Description
Atterberg Limits
Coefficients
Classification
Remarks
Source of Sample: D7-B Depth: 58.5'-60.0'Sample Number: S-12 Date:
Client:
Project:
Project No:
SIEVE PERCENT SPEC.* PASS?
SIZE FINER PERCENT (X=NO)
PE
RC
EN
T F
INE
R
0
10
20
30
40
50
60
70
80
90
100
GRAIN SIZE - mm.
0.0010.010.1110100
% +3"Coarse
% Gravel
Fine Coarse Medium
% Sand
Fine Silt
% Fines
Clay
0.0 0.0 9.1 20.9 41.2 15.3 13.5
6 in.
3 in.
2 in.
1½
in.
1 in.
¾ in.
½ in.
3/8
in.
#4
#10
#20
#30
#40
#60
#100
#140
#200
Particle Size Distribution Report
Exhibit B-18

Tested By: DS Checked By: AM
TERRACONCONSULTANTS, INC.
Columbus, Ohio
1-26-15
(no specification provided)
PL= LL= PI=
D90= D85= D60=D50= D30= D15=D10= Cu= Cc=
USCS= AASHTO=
*
Gray CLAYEY SAND, trace gravel3/41/23/8#4#10#20#40
#100#200
0.0293 mm.0.0189 mm.0.0112 mm.0.0081 mm.0.0059 mm.0.0035 mm.
100.096.994.389.175.261.854.649.748.342.439.335.030.726.419.7
17 31 14
5.1935 3.4978 0.73610.1726 0.0078
SC A-6(3)
F.M.=2.12
Project Consulting Services, Inc.
Proposed Rover ETC Pipeline Project - "MAIN LINE SEGMENT"
N4149328
Soil Description
Atterberg Limits
Coefficients
Classification
Remarks
Source of Sample: D7-B Depth: 63.5'-65.0'Sample Number: S-13 Date:
Client:
Project:
Project No:
SIEVE PERCENT SPEC.* PASS?
SIZE FINER PERCENT (X=NO)
PE
RC
EN
T F
INE
R
0
10
20
30
40
50
60
70
80
90
100
GRAIN SIZE - mm.
0.0010.010.1110100
% +3"Coarse
% Gravel
Fine Coarse Medium
% Sand
Fine Silt
% Fines
Clay
0.0 0.0 10.9 13.9 20.6 6.3 24.0 24.3
6 in.
3 in.
2 in.
1½
in.
1 in.
¾ in.
½ in.
3/8
in.
#4
#10
#20
#30
#40
#60
#100
#140
#200
Particle Size Distribution Report
Exhibit B-19

Tested By: DS Checked By: AM
LIQUID AND PLASTIC LIMITS TEST REPORTP
LA
ST
ICIT
Y I
ND
EX
0
10
20
30
40
50
60
LIQUID LIMIT0 10 20 30 40 50 60 70 80 90 100 110
CL-ML
CL or OL
CH or OH
ML or OL MH or OH
Dashed line indicates the approximateupper limit boundary for natural soils
4
7
WA
TE
R C
ON
TE
NT
29.2
29.6
30
30.4
30.8
31.2
31.6
32
32.4
32.8
33.2
NUMBER OF BLOWS5 6 7 8 9 10 20 25 30 40
MATERIAL DESCRIPTION LL PL PI %<#40 %<#200 USCS
Project No. Client: Remarks:
Project:
Source of Sample: D7-B Depth: 63.5'-65.0'Sample Number: S-13
TERRACON CONSULTANTS, INC.Columbus, Ohio
Gray CLAYEY SAND, trace gravel 31 17 14 54.6 48.3 SC
N4149328 Project Consulting Services, Inc.
Date: 1-26-15Proposed Rover ETC Pipeline Project - "MAIN LINE SEGMENT"
Exhibit B-20

Tested By: DS Checked By: AM
TERRACONCONSULTANTS, INC.
Columbus, Ohio
1-26-15
(no specification provided)
PL= LL= PI=
D90= D85= D60=D50= D30= D15=D10= Cu= Cc=
USCS= AASHTO=
*
Gray LEAN CLAY, trace sand, trace gravel3/8#4#10#20#40
#100#200
0.0232 mm.0.0155 mm.0.0096 mm.0.0071 mm.0.0053 mm.0.0033 mm.
100.099.998.998.597.797.096.191.885.375.567.355.942.8
19 35 16
0.0204 0.0152 0.00590.0045
CL A-6(16)
F.M.=0.10
Project Consulting Services, Inc.
Proposed Rover ETC Pipeline Project - "MAIN LINE SEGMENT"
N4149328
Soil Description
Atterberg Limits
Coefficients
Classification
Remarks
Source of Sample: D7-B Depth: 73.5'-75.0'Sample Number: S-15 Date:
Client:
Project:
Project No:
SIEVE PERCENT SPEC.* PASS?
SIZE FINER PERCENT (X=NO)
PE
RC
EN
T F
INE
R
0
10
20
30
40
50
60
70
80
90
100
GRAIN SIZE - mm.
0.0010.010.1110100
% +3"Coarse
% Gravel
Fine Coarse Medium
% Sand
Fine Silt
% Fines
Clay
0.0 0.0 0.1 1.0 1.2 1.6 42.6 53.5
6 in.
3 in.
2 in.
1½
in.
1 in.
¾ in.
½ in.
3/8
in.
#4
#10
#20
#30
#40
#60
#100
#140
#200
Particle Size Distribution Report
Exhibit B-21

Tested By: DS Checked By: AM
LIQUID AND PLASTIC LIMITS TEST REPORTP
LA
ST
ICIT
Y I
ND
EX
0
10
20
30
40
50
60
LIQUID LIMIT0 10 20 30 40 50 60 70 80 90 100 110
CL-ML
CL or OL
CH or OH
ML or OL MH or OH
Dashed line indicates the approximateupper limit boundary for natural soils
4
7
WA
TE
R C
ON
TE
NT
33.2
33.6
34
34.4
34.8
35.2
35.6
36
36.4
36.8
37.2
NUMBER OF BLOWS5 6 7 8 9 10 20 25 30 40
MATERIAL DESCRIPTION LL PL PI %<#40 %<#200 USCS
Project No. Client: Remarks:
Project:
Source of Sample: D7-B Depth: 73.5'-75.0'Sample Number: S-15
TERRACON CONSULTANTS, INC.Columbus, Ohio
Gray LEAN CLAY, trace sand, trace gravel 35 19 16 97.7 96.1 CL
N4149328 Project Consulting Services, Inc.
Date: 1-26-15Proposed Rover ETC Pipeline Project - "MAIN LINE SEGMENT"
Exhibit B-22

#=AR#
ANALYTICAL RESULTS
Pace Project No.:Project:
50110856Geotechnical Investigation
Sample: D7-A Lab ID: 50110856007 Collected: 12/17/14 09:30 Received: 01/16/15 10:22 Matrix: Water
Parameters Results Units DF Prepared Analyzed CAS No. QualReport Limit
Analytical Method: SM 4500-Cl-E4500 Chloride
Chloride 16.2 mg/L 01/20/15 15:06 16887-00-6 H31.0 1
REPORT OF LABORATORY ANALYSISThis report shall not be reproduced, except in full,
without the written consent of Pace Analytical Services, Inc..Date: 01/26/2015 02:36 PM
Pace Analytical Services, Inc.7726 Moller Road
Indianapolis, IN 46268(317)228-3100
Pace Analytical Services, Inc.Not NELAP Accredited
4860 Blazer ParkwayDublin, OH 43017
(614)486-5421
Exhibit B-23
#=AR#
ANALYTICAL RESULTS
Pace Project No.:Project:
50110856Geotechnical Investigation
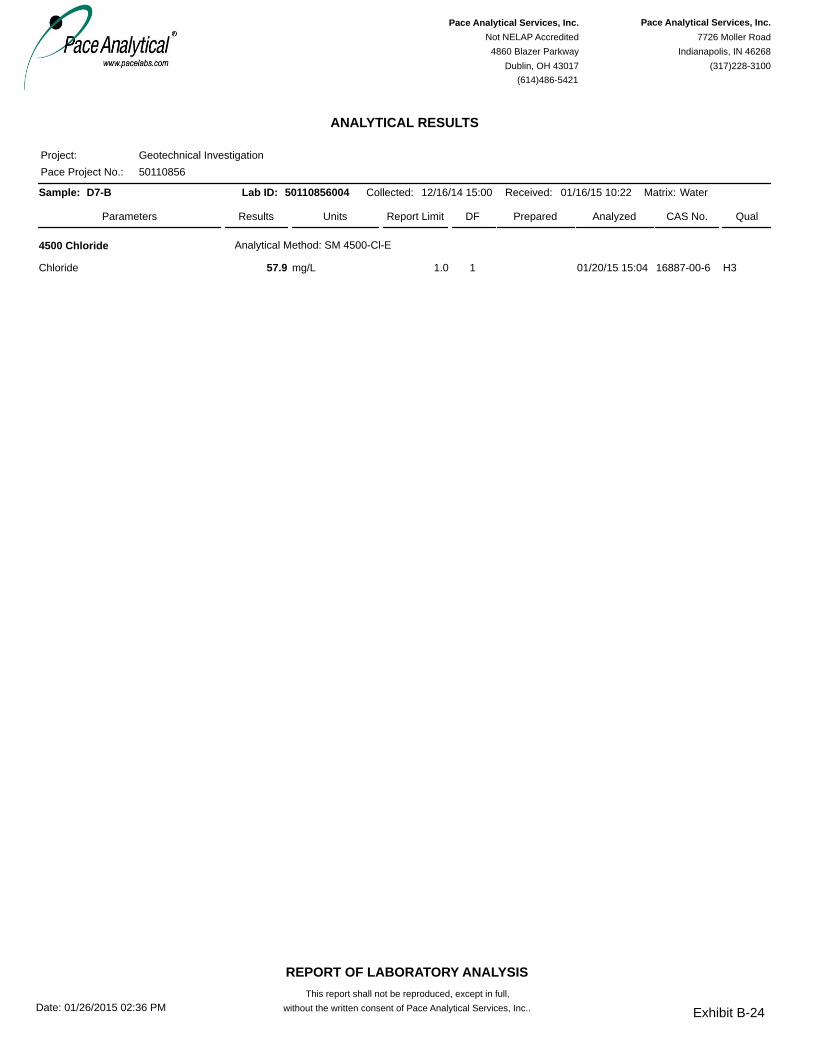
Sample: D7-B Lab ID: 50110856004 Collected: 12/16/14 15:00 Received: 01/16/15 10:22 Matrix: Water
Parameters Results Units DF Prepared Analyzed CAS No. QualReport Limit
Analytical Method: SM 4500-Cl-E4500 Chloride
Chloride 57.9 mg/L 01/20/15 15:04 16887-00-6 H31.0 1
REPORT OF LABORATORY ANALYSISThis report shall not be reproduced, except in full,
without the written consent of Pace Analytical Services, Inc..Date: 01/26/2015 02:36 PM
Pace Analytical Services, Inc.7726 Moller Road
Indianapolis, IN 46268(317)228-3100
Pace Analytical Services, Inc.Not NELAP Accredited
4860 Blazer ParkwayDublin, OH 43017
(614)486-5421
Exhibit B-24

#=QC#
QUALITY CONTROL DATA
Pace Project No.:Project:
50110856Geotechnical Investigation
Results presented on this page are in the units indicated by the "Units" column except where an alternate unit is presented to the right of the result.
QC Batch:QC Batch Method:
Analysis Method:Analysis Description:
WETA/14386SM 4500-Cl-E
SM 4500-Cl-E4500 Chloride
Associated Lab Samples: 50110856001, 50110856003, 50110856004, 50110856005, 50110856007
Parameter UnitsBlankResult
ReportingLimit Qualifiers
METHOD BLANK: 1225239Associated Lab Samples: 50110856001, 50110856003, 50110856004, 50110856005, 50110856007
Matrix: Water
Analyzed
Chloride mg/L ND 1.0 01/20/15 15:02
Parameter UnitsLCS
Result% RecLimits Qualifiers% RecConc.
1225240LABORATORY CONTROL SAMPLE:LCSSpike
Chloride mg/L 19.720 99 90-110
Parameter UnitsMS
Result% RecLimits Qualifiers% RecConc.
1225241MATRIX SPIKE SAMPLE:MSSpike
Result50110856004
Chloride mg/L 77.720 99 90-11057.9
Parameter UnitsMS
Result% RecLimits Qual% RecConc.
1225242MATRIX SPIKE & MATRIX SPIKE DUPLICATE:
MSSpikeResult
50110545001
1225243
MSDResult
MSD% Rec RPD RPD
MaxMSDMSSpikeConc.
Chloride mg/L 20 104 90-110104 0 20203.2 24.0 23.9
REPORT OF LABORATORY ANALYSISThis report shall not be reproduced, except in full,
without the written consent of Pace Analytical Services, Inc..Date: 01/26/2015 02:36 PM
Pace Analytical Services, Inc.7726 Moller Road
Indianapolis, IN 46268(317)228-3100
Pace Analytical Services, Inc.Not NELAP Accredited
4860 Blazer ParkwayDublin, OH 43017
(614)486-5421
Exhibit B-25

#=QL#
QUALIFIERS
Pace Project No.:Project:
50110856Geotechnical Investigation
DEFINITIONS
DF - Dilution Factor, if reported, represents the factor applied to the reported data due to changes in sample preparation, dilution ofthe sample aliquot, or moisture content.ND - Not Detected at or above adjusted reporting limit.J - Estimated concentration above the adjusted method detection limit and below the adjusted reporting limit.MDL - Adjusted Method Detection Limit.PQL - Practical Quantitation Limit.RL - Reporting Limit.S - Surrogate1,2-Diphenylhydrazine (8270 listed analyte) decomposes to Azobenzene.Consistent with EPA guidelines, unrounded data are displayed and have been used to calculate % recovery and RPD values.LCS(D) - Laboratory Control Sample (Duplicate)MS(D) - Matrix Spike (Duplicate)DUP - Sample DuplicateRPD - Relative Percent DifferenceNC - Not Calculable.SG - Silica Gel - Clean-UpU - Indicates the compound was analyzed for, but not detected.N-Nitrosodiphenylamine decomposes and cannot be separated from Diphenylamine using Method 8270. The result reported foreach analyte is a combined concentration.Pace Analytical is TNI accredited. Contact your Pace PM for the current list of accredited analytes.TNI - The NELAC Institute.
ANALYTE QUALIFIERS
Sample was received or analysis requested beyond the recognized method holding time.H3Matrix spike recovery was outside laboratory control limits due to a parent sample concentration notably higher than thespike level.
P6
REPORT OF LABORATORY ANALYSISThis report shall not be reproduced, except in full,
without the written consent of Pace Analytical Services, Inc..Date: 01/26/2015 02:36 PM
Pace Analytical Services, Inc.7726 Moller Road
Indianapolis, IN 46268(317)228-3100
Pace Analytical Services, Inc.Not NELAP Accredited
4860 Blazer ParkwayDublin, OH 43017
(614)486-5421
Exhibit B-26
APPENDIX CSUPPORTING DOCUMENTS


Exhibit C-2
UNIFIED SOIL CLASSIFICATION SYSTEM
Criteria for Assigning Group Symbols and Group Names Using Laboratory Tests ASoil Classification
GroupSymbol Group Name B
Coarse Grained Soils:More than 50% retainedon No. 200 sieve
Gravels:More than 50% ofcoarse fraction retainedon No. 4 sieve
Clean Gravels:Less than 5% fines C
Cu 4 and 1 Cc 3 E GW Well-graded gravel F
Cu 4 and/or 1 Cc 3 E GP Poorly graded gravel F
Gravels with Fines:More than 12% fines C
Fines classify as ML or MH GM Silty gravel F,G,H
Fines classify as CL or CH GC Clayey gravel F,G,H
Sands:50% or more of coarsefraction passes No. 4sieve
Clean Sands:Less than 5% fines D
Cu 6 and 1 Cc 3 E SW Well-graded sand I
Cu 6 and/or 1 Cc 3 E SP Poorly graded sand I
Sands with Fines:More than 12% fines D
Fines classify as ML or MH SM Silty sand G,H,I
Fines classify as CL or CH SC Clayey sand G,H,I
Fine-Grained Soils:50% or more passes theNo. 200 sieve
Silts and Clays:Liquid limit less than 50
Inorganic:PI 7 and plots on or above “A” line J CL Lean clay K,L,M
PI 4 or plots below “A” line J ML Silt K,L,M
Organic:Liquid limit - oven dried
0.75 OLOrganic clay K,L,M,N
Liquid limit - not dried Organic silt K,L,M,O
Silts and Clays:Liquid limit 50 or more
Inorganic:PI plots on or above “A” line CH Fat clay K,L,M
PI plots below “A” line MH Elastic Silt K,L,M
Organic:Liquid limit - oven dried
0.75 OHOrganic clay K,L,M,P
Liquid limit - not dried Organic silt K,L,M,Q
Highly organic soils: Primarily organic matter, dark in color, and organic odor PT Peat
A Based on the material passing the 3-inch (75-mm) sieveB If field sample contained cobbles or boulders, or both, add “with cobbles
or boulders, or both” to group name.C Gravels with 5 to 12% fines require dual symbols: GW-GM well-graded
gravel with silt, GW-GC well-graded gravel with clay, GP-GM poorlygraded gravel with silt, GP-GC poorly graded gravel with clay.
D Sands with 5 to 12% fines require dual symbols: SW-SM well-gradedsand with silt, SW-SC well-graded sand with clay, SP-SM poorly gradedsand with silt, SP-SC poorly graded sand with clay
E Cu = D60/D10 Cc =6010
230
DxD
)(D
F If soil contains 15% sand, add “with sand” to group name.G If fines classify as CL-ML, use dual symbol GC-GM, or SC-SM.
H If fines are organic, add “with organic fines” to group name.I If soil contains 15% gravel, add “with gravel” to group name.J If Atterberg limits plot in shaded area, soil is a CL-ML, silty clay.K If soil contains 15 to 29% plus No. 200, add “with sand” or “with gravel,”
whichever is predominant.L If soil contains 30% plus No. 200 predominantly sand, add “sandy” to
group name.M If soil contains 30% plus No. 200, predominantly gravel, add
“gravelly” to group name.N PI 4 and plots on or above “A” line.O PI 4 or plots below “A” line.P PI plots on or above “A” line.Q PI plots below “A” line.

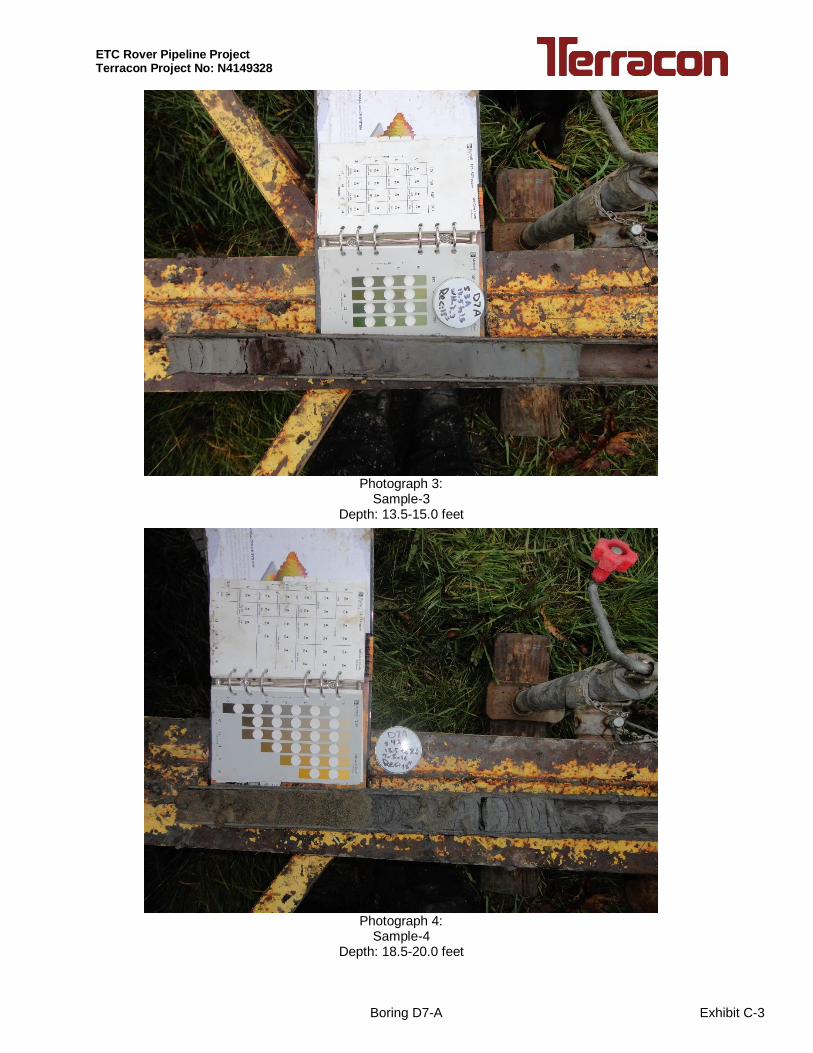
ETC Rover Pipeline ProjectTerracon Project No: N4149328
Photograph 1:Sample-1
Depth: 3.5-5.0 feet
Photograph 2:Sample-2
Depth: 8.5-10.0 feet
Exhibit C-3Boring D7-A
ETC Rover Pipeline ProjectTerracon Project No: N4149328
Photograph 3:Sample-3
Depth: 13.5-15.0 feet
Photograph 4:Sample-4
Depth: 18.5-20.0 feet
Exhibit C-3Boring D7-A
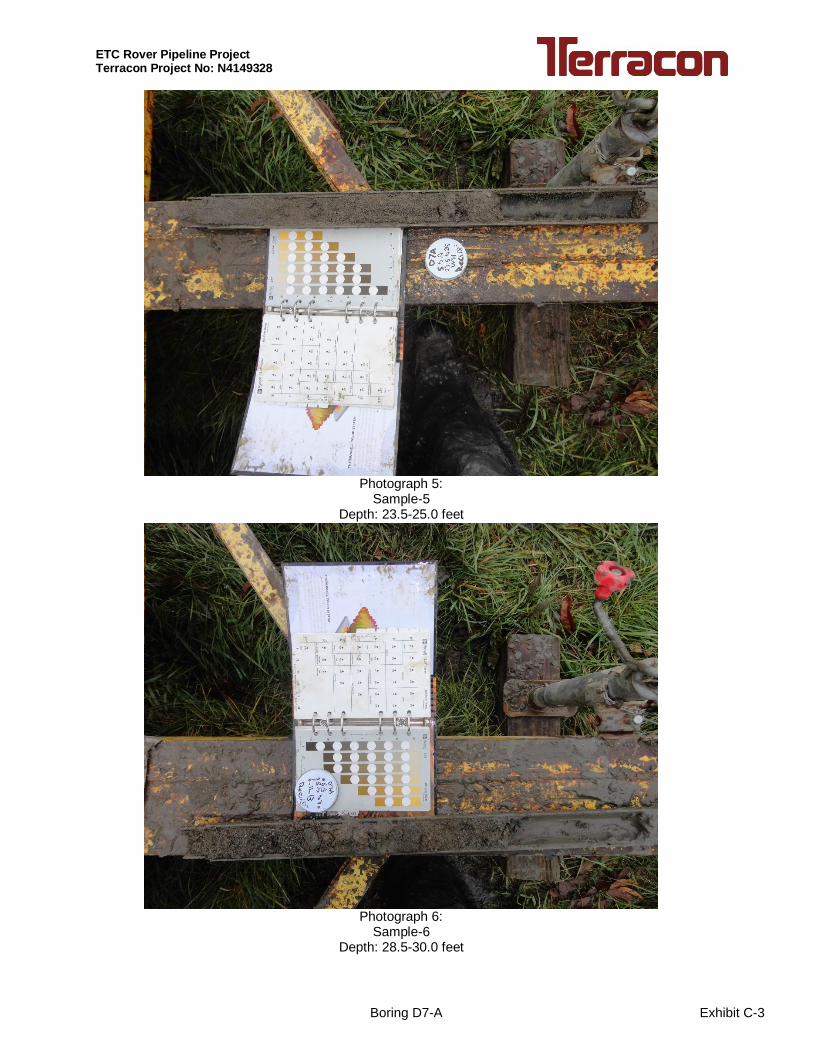
ETC Rover Pipeline ProjectTerracon Project No: N4149328
Photograph 5:Sample-5
Depth: 23.5-25.0 feet
Photograph 6:Sample-6
Depth: 28.5-30.0 feet
Exhibit C-3Boring D7-A
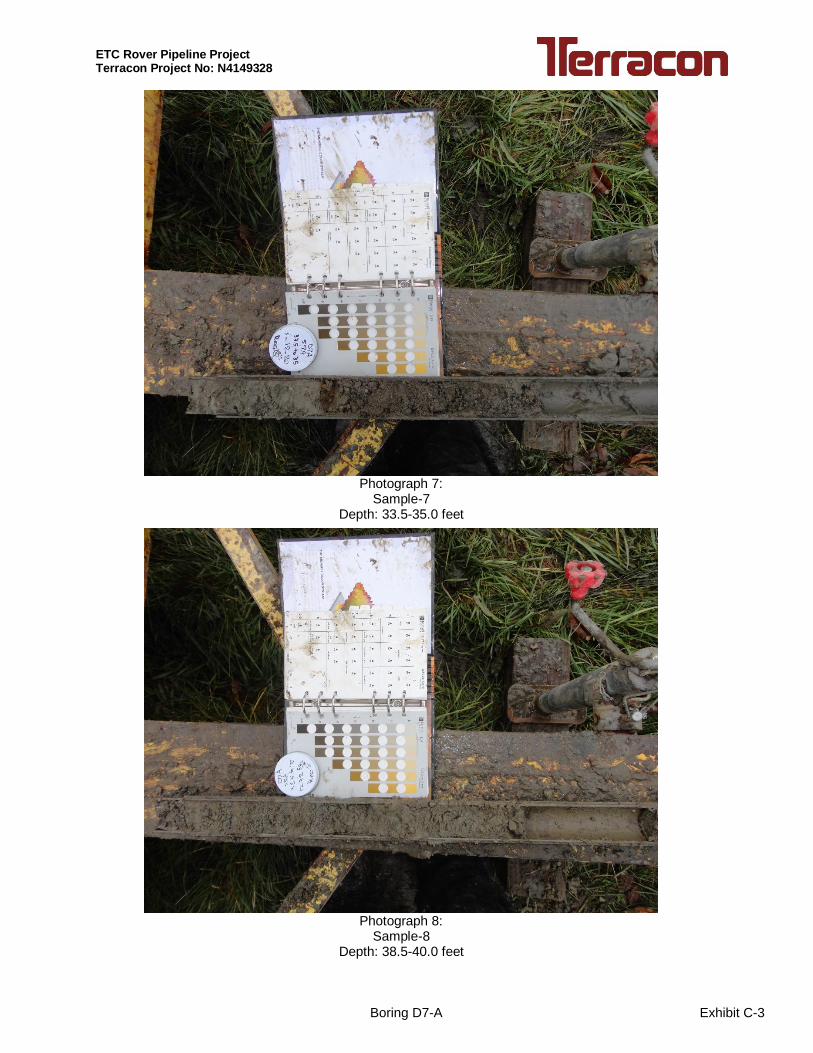
ETC Rover Pipeline ProjectTerracon Project No: N4149328
Photograph 7:Sample-7
Depth: 33.5-35.0 feet
Photograph 8:Sample-8
Depth: 38.5-40.0 feet
Exhibit C-3Boring D7-A
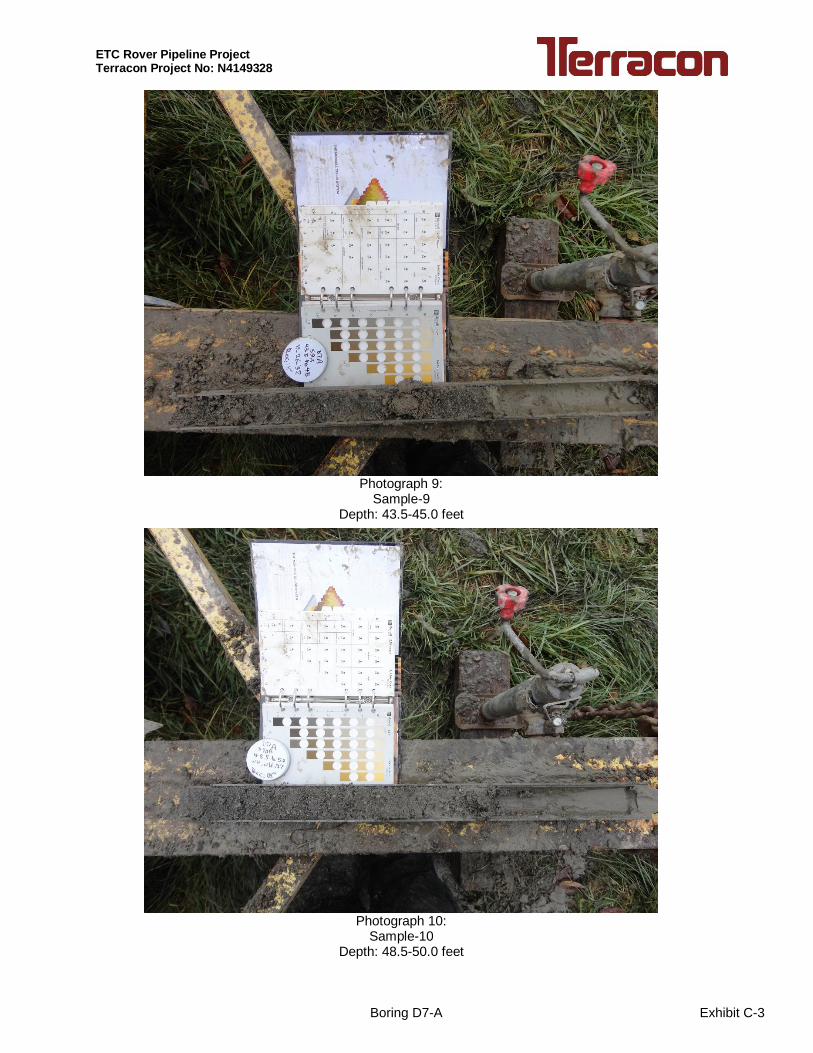
ETC Rover Pipeline ProjectTerracon Project No: N4149328
Photograph 9:Sample-9
Depth: 43.5-45.0 feet
Photograph 10:Sample-10
Depth: 48.5-50.0 feet
Exhibit C-3Boring D7-A

ETC Rover Pipeline ProjectTerracon Project No: N4149328
Photograph 11:Sample-11
Depth: 53.5-55.0 feet
Photograph 12:Sample-12
Depth: 58.5-60.0 feet
Exhibit C-3Boring D7-A

ETC Rover Pipeline ProjectTerracon Project No: N4149328
Photograph 13:Sample-13
Depth: 63.5-65.0 feet
Photograph 14:Sample-14
Depth: 68.5-70.0 feet
Exhibit C-3Boring D7-A

ETC Rover Pipeline ProjectTerracon Project No: N4149328
Photograph 1:Sample-1
Depth: 3.5-5.0 feet
Photograph 2:Sample-2
Depth: 8.5-10.0 feet
Exhibit C-3Boring D7-B

ETC Rover Pipeline ProjectTerracon Project No: N4149328
Photograph 3:Sample-3
Depth: 13.5-15.0 feet
Photograph 4:Sample-4
Depth: 18.5-20.0 feet
Exhibit C-3Boring D7-B

ETC Rover Pipeline ProjectTerracon Project No: N4149328
Photograph 5:Sample-5
Depth: 23.5-25.0 feet
Photograph 6:Sample-6
Depth: 28.5-30.0 feet
Exhibit C-3Boring D7-B

ETC Rover Pipeline ProjectTerracon Project No: N4149328
Photograph 7:Sample-7
Depth: 33.5-35.0 feet
Photograph 8:Sample-8
Depth: 38.5-40.0 feet
Exhibit C-3Boring D7-B
ETC Rover Pipeline ProjectTerracon Project No: N4149328
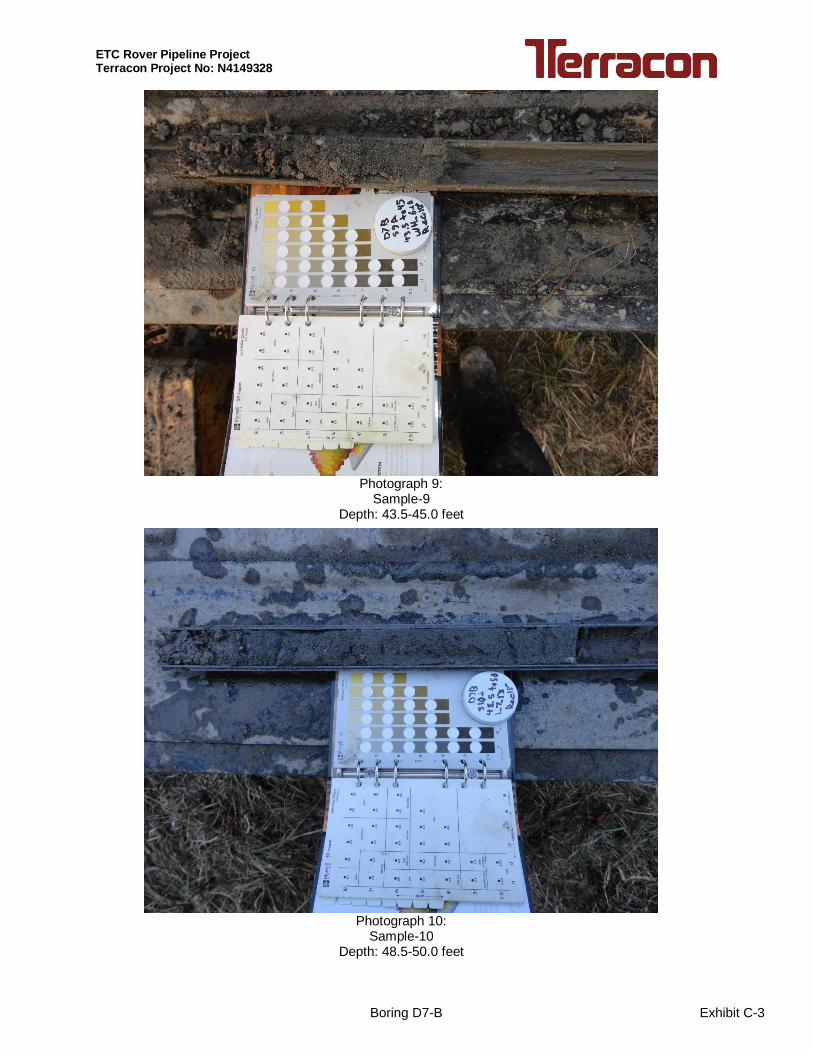
Photograph 9:Sample-9
Depth: 43.5-45.0 feet
Photograph 10:Sample-10
Depth: 48.5-50.0 feet
Exhibit C-3Boring D7-B

ETC Rover Pipeline ProjectTerracon Project No: N4149328
Photograph 11:Sample-11
Depth: 53.5-55.0 feet
Photograph 12:Sample-12
Depth: 58.5-60.0 feet
Exhibit C-3Boring D7-B
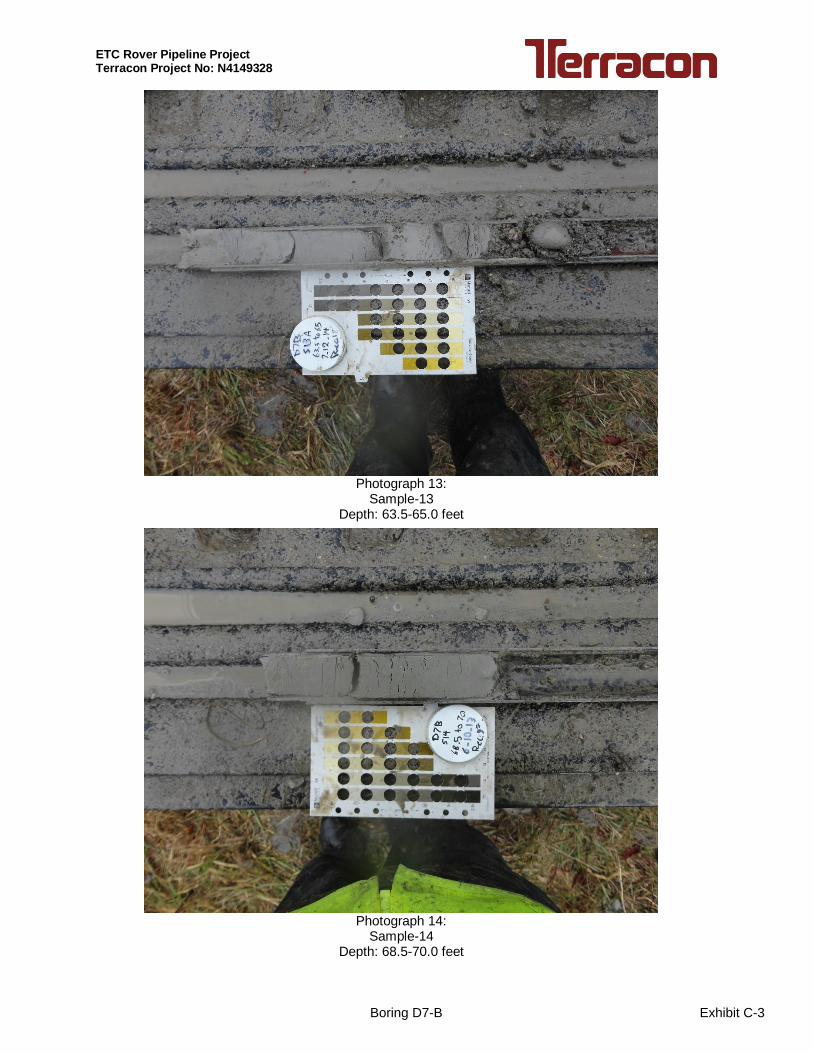
ETC Rover Pipeline ProjectTerracon Project No: N4149328
Photograph 13:Sample-13
Depth: 63.5-65.0 feet
Photograph 14:Sample-14
Depth: 68.5-70.0 feet
Exhibit C-3Boring D7-B

ETC Rover Pipeline ProjectTerracon Project No: N4149328
Photograph 15:Sample-15
Depth: 73.5-75.0 feet
Exhibit C-3Boring D7-B