project report
TRANSCRIPT

Design of a Pico-hydro system to electrify rural villages in North East India
B C U
B E n g M e c h a n i c a l E n g i n e e r i n g
T h i r d Y e a r
U n d e r g r a d u a t e P r o j e c t -
S u p e r v i s o r : P r o f . M i c h e a l
W a r d
S t u d e n t I D : S 1 1 7 3 6 6 0 9
8 / 5 / 2 0 1 5
Mohammed Ouji

Contents
Abstract ................................................................................................................................................... 3
Problem statement ................................................................................................................................... 3
Scope ....................................................................................................................................................... 4
Chapter one ............................................................................................................................................. 5
Introduction ......................................................................................................................................... 5
Rationale ............................................................................................................................................. 7
Aim ..................................................................................................................................................... 7
Objectives ........................................................................................................................................... 7
Methodology ....................................................................................................................................... 8
Research methodology .................................................................................................................... 8
Design methodology ....................................................................................................................... 9
Chapter two – Country profile .............................................................................................................. 10
India .................................................................................................................................................. 10
Socioeconomic factors ...................................................................................................................... 11
North East India ................................................................................................................................ 12
Climate .......................................................................................................................................... 12
Economy ....................................................................................................................................... 14
Living standards ............................................................................................................................ 16
Summary ........................................................................................................................................... 19
Outcome ............................................................................................................................................ 20
Chapter three – Rural electrification ..................................................................................................... 21
Current state of rural electrification .................................................................................................. 21
Options .............................................................................................................................................. 24
Renewables ................................................................................................................................... 24
Non-renewable .............................................................................................................................. 29
Impact of rural electrification ........................................................................................................... 30

Summary ........................................................................................................................................... 33
Outcome ............................................................................................................................................ 33
Chapter four – Hydro-power ................................................................................................................. 33
Why Pico hydro?............................................................................................................................... 35
Principles of Pico hydro-power......................................................................................................... 36
Fluid dynamics .............................................................................................................................. 38
Basic components ......................................................................................................................... 44
Types of Pico-hydro schemes ....................................................................................................... 48
Summary ........................................................................................................................................... 50
Outcome ............................................................................................................................................ 51
Chapter five – Design ........................................................................................................................... 51
Design requirements ......................................................................................................................... 51
Turbine selection ............................................................................................................................... 52
Design Idea ....................................................................................................................................... 56
Cost considerations ........................................................................................................................... 58
CAD modelling and 3D printing ....................................................................................................... 60
Testing methodology ........................................................................................................................ 61
Summary ........................................................................................................................................... 62
Chapter six – Discussion ....................................................................................................................... 63
Discussion.......................................................................................................................................... 63
Chapter seven – Conclusions and recommendations ........................................................................... 64
Conclusion ........................................................................................................................................ 64
Recommendations ............................................................................................................................. 64
References ............................................................................................................................................. 65

Abstract
In this report a Pico-hydro Pelton wheel design is developed by: (1) studying the socio-economic
background of Northeast India such as climate, economy, and the living standards; (2) research of
sources of electrification and their individual capabilities in the Northeast Region (NER); and (3) the
foundations of Pico-hydro systems including the typical components and schemes. This is done by
obtaining information from census data, Government websites, past reports, journals and articles; and
henceforth critically analysing the information to eliminate waffle material and produce relevant
material. Following the literature review, a list of design requirements is defined and the design is
modelled according to the PDS. From this, a 3D printed Pelton wheel is fabricated.
Problem statement
Energy Deficiency - More than 68% of the total population of India live in rural areas.
According to The World Bank (2013), India is the 36th
most rural country in the world. As of
2014, there are a total of more than 590,000 inhabited villages existing in India: 19,000 of
which are un-electrified. More than one million homes in India have no lighting (Rural:
897,000; Urban: 267,000). Meanwhile, more than 77 million Indian homes use kerosene
lamps as their primary source of lighting; while 990,000 homes use coal, lignite, and oil.
India has vast potential in solar, wind, and small hydropower, nevertheless only thirty percent
of electricity is produced using renewable energy, while fifty-nine percent is produced by
coal. (World Bank, 2014)
Gridding Complications - Grid extension into rural areas is an expensive ordeal as the grid
may need to cover many miles before reaching the households: this increases the wiring cost
and the arrangement of the many electric pylons required to build the transmission network.
This requires a substantial amount of planning and preparation making it a labour intensive
and financially demanding venture. Even after placing the effort to grid a rural stretch, these

regions have fewer consumption of electricity per person than in urban areas: making such a
scheme hugely uneconomical. In addition to this, maintenance and operation of the grid poses
more problems due to its inaccessible location.
Large Scale hydro - The environmental impact of large scale hydro is profound. Large scale
hydro projects produce a vast amount of electricity; however they require large amount of
land space to be flooded. This leads to the displacement of villages, businesses, and cultural
sites; as well as ecological changes such as the loss of certain species of fish and the
subsequent disruption of the food chain. Tourists and locals also complain about the visual
and sound pollution that hydro dams have on the scenery of certain locations.
Nevertheless, studies conducted by the Independent Evaluation Group, 2008 have shown that
rural electrification boosts morale, provides people with a sense of security, and enhances
productivity and learning as well as giving access to information, healthcare and
entertainment. As a consequence this will speed up development and improve the local and
national GDP growth. Implementing small scale hydro systems to electrify rural Indian
villages will therefore significantly improve the life quality of a rural population, without the
drawbacks of large scale hydro and gridding.
Scope
This project will focus its interests on two parts specifically: the research of the potential of
hydro power in North East India; and the design of a Pico hydro system to work in N.E.
India. The research phase is also split into two parts: Researching the climate, economy,
agriculture and the living standards of the North Eastern states; and applying this knowledge
to state why electrification will benefit these states. The second phase is the exploration of
Pico hydro power including its core principles; the different schemes used worldwide; and its
development throughout the span of twenty years. A brief summary of other useful methods

of electrification such as solar, wind and so on will also be discussed and compared against
Pico hydro power. Finally, an assessment of the load bearing capability of the system will be
conducted against what Indian villagers view as essential appliances such as lighting, TV,
radio, mobile phone charger and a fan.
This report will be constrained to the design of the Pico hydro system only. Following Pugh’s
total design methodology, the design phase is split up into market research, specification,
concept design, detail design, manufacture and the sale of the product. The implementation of
the system will be covered in the recommendations briefly. It will cover the total cost (land
cost, financial cost) of placing the finished design in a rural Indian village.
Chapter one
Introduction
Electricity is vital for completing everyday activities, is a catalyst to learning and allows income
generation in rural areas. It is a necessary, but insufficient step towards economic development: it
must be complemented by socio-economic integration (Kamalapur, 2011). India’s demand for
electricity is enormous and is expected to grow over coming years. By 2020 it is estimated that India’s
power requirements may exceed 400,000 MW (Sharma et al, 2012). In its current state the country has
severe energy shortage as well as constant power outages. In some regions this power outage lasts 12
hours a day (Rao, 2013). In addition to this a large percentage of households use kerosene as their
primary light source, and wood as cooking fuel. This has adverse effect on health and takes up a
significant portion of their income. In a nation with 20% of population below poverty line, access to
energy must be provided to everyone in order to alleviate poverty and grow as an economy.
Renewable energy is one way to solve this energy crisis. Solar, wind and hydropower are proven
technologies that have been implemented worldwide to electrify even the most remote settlements. In

addition to this utilizing renewable energy in rural electrification could reduce up to 99% of Carbon
Dioxide (CO2) emissions (Frauke et al, 2009). India is known for its use of hydroelectric power with
more than 20% of its national electricity coming from this clean and abundant resource. India has a
combined potential of over 84,000MW at 60% load factor which is one of the best in the world
(Sharma et al, 2012). Micro and Pico hydro-power in particular are the most cost effective option for
electrifying rural areas in India (Lahimer et al, 2012; Maher, 2002). Pico-hydro (<5kWe) is especially
cost effective in remote rural areas and has already proven itself in many developing countries such
as Kenya, Mozambique, Tanzania, Lao PDR, Philippines, Nepal, Sri Lanka, and Colombia (Ahlborg,
2014, 2015; Arriaga, 2010; Bekele, 2012; Borhanazad, 2013; Dorji, 2012; Martin, 2014; Mainali,
2012). Entire Nepalese towns are lit thanks to Pico-hydro power and further research on making this
resource widely available will mean more locations around the world will benefit from it (Lahimer et
al, 2012).
The Government of India have set up several initiatives to bridge the gap between rural and urban
energy access, albeit with a small success rate. Government initiatives such as RGGVY; JNNSM;
Electricity Act 2003; NEP, 2005; NTP, 2006; and NREP, 2006 were started to encourage
development of rural electrification; however due to resource limitations, poor planning, delays and
vagueness with respect to policies, shortcomings in programmes and poverty, India has failed to meet
their initial target of full household electrification by 2012 (Kamalapur,2011; Sharma et al, 2012;
Balachandra, 2011). RGGVY aims specifically to electrify Below Poverty Line (BPL) households but
disregards Above Poverty Line (APL) households. The government of India classifies a village as
electrified if only 10% of households have access to electricity. An assessment carried out by
P.Balachandra on the energy access of different income classes and regions found that successful
states (Punjab, Tamil Nadu) had 3 times more electricity access than failure states (Assam, West
Bengal, Bihar). This study also suggests annual growth rates for rural access have actually decreased
from double digits in 1991 to only about 4%. It can be said therefore that current policies should be
reviewed and a radical new action needs to be implemented by the Government to provide fair and
equal share of energy access to all regions of India.

One of the key issues in rural electrification is the disparity of settlements which makes grid extension
into remote areas difficult. Bambawale, 2010 suggests that prior to deciding between gridding or
decentralizing a certain region, the socio-economic and geographic information must be obtained. For
this reason a comprehensive country profile of India has been produced detailing the socio-economic
factors of Northeast India.
Rationale
One the key issues in developing countries, including India, is a shortage of electricity
supply. The author believes that electricity should be a common commodity however a
majority of Indian population have no access to electricity. Electricity is a catalyst to poverty
alleviation, welfare improvement and economy growth. The rationale of this project is to
make the reader aware of the energy crisis, and to increase their knowledge of why rural
electrification is important to the lives of millions. In addition, it is intended to increase the
reader’s understanding of Pico-hydro power and its principles. Ultimately, the purpose of this
report is to guide and motivate the reader to contribute to the cause and innovate the field of
rural electrification.
Aim
To design a Pico-hydro power system to electrify rural villages in Northeast India
Objectives
Conduct research on India in order to gain understanding of socio-economic dynamics
of Northeast region (NER)
Develop ideas on how to best approach rural electrification by investigating potential
of renewable and non-renewable energy resources in the region
Acquire in-depth knowledge on the principles, components and types of schemes of
Pico-hydro systems using books, journals and past reports

Consider design aspects of the pico-hydro system and design to meet the needs of the
local population based on the literature review
Design, using CATIA software, Pelton wheel used in the Pico-hydro scheme
Utilize 3D printing technology to print the CAD model and realize the design
Methodology
Research methodology
Initially, background research on the subject is studied, leading to a more refined view of the
topics which are split into:
socioeconomic factors in rural India,
Pico hydro power and
fluid dynamics
The topics were directly linked to minimise irrelevant “waffle” material. The initial review
was conducted on online articles, peer reviewed past reports, and journals which fed in
relevant information about the topics. Qualitative data relating to the socioeconomic factors
was obtained using the Indian Government websites and the World Bank. Quantitative and
qualitative data regarding the principles of Pico hydroelectric power and fluid dynamics are
obtained via books, reports, and journals.
Consequently, the information learnt is applied into the literature review section which gives
a detailed view of the past work conducted on the subject of electrification of rural areas. The
literature review is conducted on a reasonable sample (25) of past reports which compares
and contrasts the past work covered in other studies in the same subject. For quality of
information, reports more than ten years old are not included.

Design methodology
The design is conducted according to the Pugh’s total design methodology. The design procedure
follows two distinct steps: conducting a needs analysis based on socioeconomic factors of rural
households in India and consequently designing to meet those needs. The design is evaluated using
quantitative studies with a small element of qualitative. The quantitative consists of laboratory
experiments and the qualitative is the quality factor of the finished product. It assesses the aesthetic
properties of the final product and the quality of finish. A rough sketch of the product, followed by a
Computer Aided Designing (CAD) model of the product will deliver the final product, a Pelton wheel,
as a 3D printed replica.
Initial research – books, reports, online articles, journals
Literature review – reports, books and journals. Publish date range
2010 – 2015
Formulate design – based on information gathered from literature
review and socioeconomic factors
CAD modelling – based on the formulated design. Use CATIA software
to model 3D design and 3D print final design.
Discuss results and form conclusions
Give recommendations
Figure 1.1:
Methodology flowchart

Chapter two – Country profile
India
Consists of twenty nine states.
the world’s seventh largest country – total land size 3,060,500 km2
the second most populous country in the world after China – population of 1.2 billion
Average population density - 420 people per km2
(The World Bank, 2013)
East is densely populated with up to 12,000 people living in one km2
as shown in the
figure to the right
Figure 2.1: State-wise population
densities per 2011 census. (Source:
Wikimedia)

Socioeconomic factors
India has a booming economy
India has the world’s tenth largest economy (CNN money, 2014)
also ranked ninth by nominal Gross Domestic Product (GDP)
Third by Purchasing Power Parity (PPP).
India is also forecasted to have the world’s 4th
largest GDP growth in 2015
(Bloomberg)
Agriculture employs 53% of India’s workforce, yet it only contributes 14% to India’s
GDP (Planning commission, Government of India, 2014).
The services sector accounts for 57% of GDP in 2012, only employs 27% of the
workforce.
This suggests that the agricultural industry is the least profitable.
Figure 2.2 (left) and figure 2.3 (right): Sector wise employment, and sector contribution to GDP
(source: Wikimedia)

On the other hand
India is ranked 147th
by GDP per capita
125th
by PPP per capita (The World Bank 2013).
Monthly average wages in India are 803 PPP GBP which is among the lowest in the
world.
In agricultural regions workers can earn as little as 67p per day
More than 20% (269,783 people) of the Indian population live under the poverty line
in 2011-12. (Reserve Bank of India, 2013)
This suggests that the agricultural workers are the most likely to be under the poverty
line.
North East India
Consists of eight states: Arunachal Pradesh, Assam, Manipur, Meghalaya, Mizoram,
Nagaland, and Tripura
Makes up approximately 8% (262 thousand km2) of India’s total land space
Accounts for 3.2% (40 million) of the Indian population
The largest state is Assam which covers 30% of the land and has 77% of the total
population.
Assam has a population density of 390 inhabitants per km2
Climate
Varies between humid subtropical and montane
Humid subtropical - Extremely wet monsoon seasons followed by exceedingly dry
winters.
Summer - 20 °C - 25°C

Figure 2.4: Statewise Average rainfall
in centimetres Source: maps of India,
2012
Winter - 0°C - 15°C
The monsoon season lasts from May to September
Supplies about 80% of the annual rain
Majority of North East India receives about 200 - 400cm of annual rainfall
In Southern Meghalaya average annual rainfall exceeds 800cm
Mawsynram is the current record holder for most rainfall in a year with annual rainfall
of 1187cm, followed by Cherrapunji with 1143cm. (Guinness World Records, 2015)
Table 1: Rainfall level in Mawsynram and Cherrapunji. Source:
Guinness world records
Despite heavy rainfall for most of the year, the Northeast is in increased risk of drought from
October to January when there is almost no rainfall. As North East India, particularly Assam
relies on agriculture alone for income; a weak or failed monsoon season can have a
devastating effect on the local economy.
Year Cherrapunji Rainfall
(mm)
Mawsynram Rainfall
(mm)
2010 13,472 13,300
2009 9,070 13,965
2008 11,415 14,985

In conclusion, there is a large potential in hydro-power to electrify rural villages in North
East India particularly owing to the strong monsoon season. The rainwater can also be
captured and filtered for drinking water during the dry season. In addition, solar energy may
also be exploited.
Economy
The economy of North East India is agrarian (dependent on agriculture) and remains the least
developed and most financially stunned. There are a number of factors which contribute to
this lack of financial growth:
1. The terrain which is largely inaccessible and difficult to cultivate crops on. This
means that little land is available for settled agriculture.
As it can be seen by figure x, the majority of the North East consists of scrub and forests with
Assam and parts of Tripura used for agricultural purposes. Figure x shows the GDP per capita
in each state. It is evident that Eastern Indian states have the least GDP per capita compared
to West India around Maharashtra which has the highest.
Fig. 2.5 (left) and 2.6 (right): Map depicting major commercial crop areas; and the statewise
GDP per capita. (Source: Maps of India)

The reason for low profit from farming is possibly due to the primitive farming methods such
as slash-and-burn which takes place in the hills and leads to soil degradation in the long term;
in addition to traditional single crop farming which takes place in the plains. The food grain
produced using these methods are hardly adequate to feed the local population; and as a result
there is few crops remaining for trade. Natives are left with little choice but to import food
from other states, using up what little GDP they have.
2. India’s ‘Look East’ policy was introduced in 1991 as part of a strategic and economic
bond between India and neighbouring far Eastern countries. Due to its rich natural
resources, the North East is seen as the pinnacle of the Look East movement: natural
resources including coal, oil, and uranium have been exploited by the Indian
government over the many years; while neglecting the economic state and flooding
the area with immigrants. This reason, fuelled by the isolation from the rest of India,
has caused much turmoil between the North East and the Indian Government.
3. Industrialisation in North East India has been a difficult task to achieve mainly due to
a weak economic foundation. Lack of market accessibility, an adequate road network,
and communications continue to hinder the economic progress of the North Eastern
states: it is not seen as feasible to establish an industry here because of these reasons.
Fig. 2.7: Statewise poverty levels
(source: Maps of India)

Living standards
Healthcare
The healthcare status in NER India has improved across the rural states thanks to the
implementation of the National Rural Health Mission (NRHM) since its launch in 2005. Prior
to its launch the NER was one of the regions with “weak public health indicators and/or weak
infrastructure” (Ministry of Health and Family Welfare, Gov. of India). This initiative
introduced many new healthcare centres across the North Eastern region. Tripura and
Nagaland in particular received more healthcare centres as can be seen from the table below:
Fig. 2.8: Progress of rural health centres in NER.
Source: Dilip Saikia, 2014
Conversely, the facilities and educated manpower employed in the health care centres is poor.
From the tables shown below it is clear that in terms of facilities Manipur suffers the most
while Mizoram enjoys the best facilities. In terms of electric supply, a massive 67.5% of sub
centres in Assam do not have an electric supply, followed by Meghalaya and Manipur with
65.4% and 63.8% respectively. Lack of sub centre electrification is also an issue in Nagaland
and Tripura. With respect to manpower, a general shortfall is apparent in Arunachal Pradesh,
while in Manipur the manpower is the strongest. However Manipur suffers from the least
amount of facilities and electricity hence the manpower cannot be fully utilised.

Fig 2.9: Facilities and Manpower status of healthcare in NER India.
Source: Dilip Saika, 2014
Education
Education is fundamental in order to expand as an economy. Many studies (Madigan, 1981;
Saunders et al, 1978; Herring, 1979) have shown that rural electrification, income and
education have a strong positive relationship. Education can contribute to better lifestyle,
higher wages, a better healthcare system and a solid economy. The Northeast suffers from a
flawed educational infrastructure, low teacher wages, absence of facilities and unmanageable
class sizes. In addition, many NER private and public schools are largely inaccessible for
many children as there is no established road network. In regions such as Assam people have
such meagre incomes that they simply cannot afford to send their children to school and
instead keep their children as extra hands on the farm. Figure x below (left) shows the
literacy rate per state in 2011. Clearly, the NER, particularly Assam, Meghalaya and
Arunachal Pradesh has a below average literacy level. Conversely, the government-run states
of Tripura and Mizoram have the highest literacy level.

Fig. 2.10 (left) and 2.11 (right): statewise literacy levels; and the impact of electricity over
time on literacy levels (Souce: Maps of India; Barnes et al, 1988)
Figure x above shows the correlation between number of years a village has been electrified
and its literacy levels. Evidently, the literacy levels grew as years passed with electricity
supply. This suggests that at the bare minimum, electrification is a catalyst for village
children to become literate and lead the way to build a stronger economy. (Barnes, 1988)
Wages
How strong a regional economy is affects the wages workers receive. A recent study by the
labour bureau of India (2013-14) showed that amongst agricultural roles, logging and wood
cutting was identified as top-paid position for men with an average daily wage of £3.31;
whereas for women the top-paid occupations were ploughing & tilling workers which earned
an average daily wage of £2.09. Child workers earned up to £1.70 for harvesting crops and
£1.50 for sowing. This equates to 40p an hour for a wood cutter, 26p for a ploughing worker,
and 21p an hour for a harvester (assuming 8 hours of business time).
In non-agricultural jobs, men who worked as a plumber, electrician or mason received the
highest daily pay. The plumbing occupation brought in £4.25 of daily income for men. For
women, the highest paid profession was masonry which gained £2.86 of daily living income.
Children who laboured as construction workers were likely to earn the highest pay of £1.57.

To place this into perspective, the ‘big mac index’ can be adopted. This measure the working
hours required to buy a big mac in different countries.
Fig. 2.12: Big Mac Index comparison by
country. Source: Lisa Mahapatra,
International business times, 2013
Summary
The key points from chapter two are as follows:
India has a strong overall economy, yet 20% of the population are below poverty line.
This indicates poor state-level economy hence poor wages.
Humid-subtropical climate of the Northeast means very heavy rainfall from April to
September which could be harnessed using hydro-power technology
The regional economy is agrarian
The economic growth of the Northeast region is staggered by a poor socio-economic
framework, undeveloped road networks, inadequate communication services and the
unavailability of agricultural land. Also a failed monsoon causes a shortage of
commercial crops.

The poor economy therefore has a direct impact on living standards such as
healthcare, education, and wages of the local population which are insufficient to
serve the population.
Outcome
Supplying the Northeast region with electricity will provide the region with new
opportunities to expand and grow as an economy. The Gross Domestic Product of the region
will increase, which has a direct positive impact on income. When household income
increases the population will be able to afford better healthcare and education for their
children. A radical action must be taken also to subsidise the cost of electrification to make it
affordable to all, including BPL households.

Chapter three – Rural electrification
Current state of rural electrification
Rural electrification is the process of supplying electricity to sparse remote areas. Compared
to urban populations, rural populations have lower annual earnings and work more hours, as
discussed above. Rural areas often have difficult and treacherous terrain which means
unfeasibility of employing an electrical grid. In addition, these regions suffer from an
undeveloped road network, absence of communication and isolation from the peer states
makes maintenance of electricity sources difficult to achieve.
Current definition of rural electrification from Government of India:
“The basic infrastructure (distribution transformer and/or distribution lines)
The number of households electrified should be at least 10% of the total households in
the village.”
Under this definition, NER have made significant progress on the electrification on the region
thanks to Rural Electrification Corporation Ltd. (REC) as the prime mover. As of 2015, there
are about 89% of NER villages electrified with a goal to achieve complete rural
electrification by 2025.

Table 2: Village electrification rate by North Eastern state as of January 2015
State Number of inhabited
villages as per 2011
census
Percentage of electrified
villages
No. of unelectrified
villages
Sikkim 425 100 0
Tripura 863 97 26
Assam 25372 96.8 803
Mizoram 704 91.1 63
Nagaland 1400 90.8 129
Manipur 2379 86.6 318
Meghalaya 6459 80.1 1284
Arunachal Pradesh 5258 70.3 1564
Source: Central Electricity Authority CEA, India, 2015
The data above shows good electricity coverage to villages in NER states. It is clear from the
statistics above that Sikkim is the most electrified state with 100% of the villages receiving
electricity; whereas fewer of the villages in the state of Arunachal Pradesh are electrified
(70%). In terms of households however, the above figures are considerably lower. According
to the 2011 census of India, less than 60% of households in the states of Assam, Tripura,
Manipur, Meghalaya and Arunachal Pradesh have electricity as a means of lighting; and in
Arunachal Pradesh a massive 14% of households have no access to lighting. The state of
Assam in particular has the lowest percentage of household electrification at 28.4%
(1524221), although table 2 implies that village electrification levels in this state are some of
the highest at 96.8%.

State Meghalaya Assam Sikkim Nagaland Tripura Arunachal
Pd.
Mizoram Manipur
No. of
houses
with
electric
lighting
217739 1524221 83277 214319 361573 108550 72138 205444
% 51.6 28.4 90.2 75.2 59.5 55.5 68.8 61.2
No. of
houses
with no
lighting
3768 10221 527 4231 2147 27321 500 2286
% 0.9 0.2 0.6 1.5 0.4 14 0.5 0.7
Table 3: Household lighting sources.
Source: CensusInfo India 2011
From this data it can be concluded that although a large number of NER villages have been
electrified, there is yet a large quantity of houses with no electrical powered lighting, or no
lighting of any kind. This is largely due to the arrangement of Indian villages which can be
dispersed making it difficult to build a common grid. Furthermore as discussed in chapter x,
education has a substantial effect on income: where the higher educated states can earn more
income and can therefore afford electrification and vice versa. This is mostly apparent in
Kerala which has mostly skilled workers who receive higher pay; whereas in Arunachal
Pradesh which has the lowest literacy rates in the NER, workers earn less income: leading to
a shortage of electricity. Other obstacles hindering the electrification of households in NE
India include poor planning, lack of political drive, poverty, and power theft.

Options
Village electrification programmes take the form of renewable energy sources such as solar,
small hydropower, and non-renewable resources such as coal and biofuel. The potential, uses,
advantages and challenges of these will be discussed below.
Renewables
Solar
The main principle of solar energy is: Photovoltaic (PV) cells extract energy from the sun
using photon particles contained in ultraviolet (UV) rays from the sun to excite the silicon
atoms within the cell. Excitation of silicon cells causes them to emit electrons which generate
electricity. In another variety of solar cell, the sun’s energy is used directly to heat water
flowing through coiled pipes via a heat exchanger surface.
India has a vast potential for solar energy: more than 300 sunny days guarantees an enormous
solar power potential. The potential for solar energy is lower in North East India due to its
cooler tropical humid climate, however in certain states which have clearer skies, such as
Assam the potential for solar is higher.
Solar potential is directly related to the temperature of the
region and the number of sunshine hours. Figure 3.1 to the
right (Ganesh, 2007) shows the average temperature for
each NER state. It can be seen that the majority of the
NER have annual temperature range of 22.5 - 25°C, while
some regions around Meghalaya, Sikkim and the state of
Arunachala Pradesh have cooler climate ranging from
below 20°C to 22°C.

The table given below shows the state-wise solar power potential in NER India.
State Solar power potential (GWp)
Assam 13.76
Manipur 10.63
Mizoram 9.09
Arunachal Pradesh 8.65
Nagaland 7.29
Meghalaya 5.86
Sikkim 4.94
Tripura 2.08
Rajasthan 142.31
Table 4: Statewise solar potential. Source: MNRE, 2015
As it can be seen by the data shown above the solar potential in Assam is greater than solar
potential in Manipur by a factor of 3% (13.76 GWp compared to 10.63 GWp). Yet Assam’s
great solar energy potential remains untapped, although the Indian power company North
Eastern Electric Power Company (NEEPCO) have plans to build a 5MW solar plant in Hojai-
Lanka, Assam (NEEPCO, 2014). For comparison, the state of Rajasthan with its arid climate
and scorching heat has 142.31 GW of solar potential. Conversely Sharma et al, 2011 argues
that more than 3600 remote villages in India, including those in NER have been successfully
electrified through solar. Therefore JNNSM initiative has been successful in designing and
implementing solar systems. Next steps would be to standardise systems so that they are
locally manufactured and to subsidise the cost to make it more affordable for poor houses.

Uses
Solar energy has a variety of uses that range from domestic lighting to district-level water
heating purposes. According to the data collected by The World Bank (2014) based on the
2011 census, that 2.9% of the houses in Arunachal Pradesh use solar powered lighting;
followed by Tripura and Manipur (1.9%). The data below shows the different uses for which
solar energy was employed for in March 1998. It is clear that Assam had employed solar
energy for every purpose, mostly for solar home systems and Solar Water Heating System
(SWHS). The rich state of Tripura could afford to build more solar home systems and power
plants, whereas poorer region of Nagaland could not afford to put solar energy to many uses.
Fig. 3.2: Statewise applications of solar energy devices.
Source: North Eastern Council Shillong
Advantages
Renewable energy – never runs out
Produces no pollution during operation
Requires little maintenance – no moving parts
Silent
Can feed excess energy generated back to grid for money – feed-in tariff

Disadvantages
High initial investment
Costly energy source – 25p/kWh (25+ Rupees). Few states can afford these prices.
Intermittent – Only works when there is sunlight
Needs to be facing the sun for best efficiency
Inefficient – 20% conversion efficiency
Wind
The potential for wind energy is limited in the Northeast, except for the minor red areas on
the map on the right which indicate a power density at 50m altitude of between 200-
250W/km2. This area is well covered from the strong winds by the Himalayas so little of the
wind actually escapes into the NER states. There is therefore no real investment in Wind
power in this region for this fact.
Fig 3.3: statewise wind power potential. Source: Infographics, 2010

Small hydro
Hydropower is a very attractive energy source in this region due to its high rainfall and
sloping hills which make great natural sites for micro (5-100kWe) and Pico (<5kWe) hydro
power. As it can be seen from the map below Arunachal Pradesh has over 831MW of
potential in small hydro, whereas Assam, Meghalaya and Sikkim have up to 300MW of
hydropower resources. This is supported by the table given below.
Fig. 3.4: statewise Small hydro potential. Source:
Thelearningpoint
Much of this potential remains unharnessed. According to the Central Electricity Authority of
India, Assam has harnessed almost 60% of its 680MW hydropower capacity; whereas
Tripura and Mizoram have captured none of their hydropower capacity. The state of
Meghalaya, despite its abundance of rainfall, has captured only 12% of its 2.4GW capacity.
Arunachal Pradesh has by far the best potential for hydropower (50GW), however due to
inaccessibility of the region and the resulting impracticality of projects; the majority of the
capacity is unused.

State Total Capacity (MW) Installed capacity
(MW)
Installed capacity
(%)
Meghalaya 2394 282 12.27
Tripura 15 0 0
Assam 680 375 57.69
Manipur 1784 105 5.96
Nagaland 1574 75 5.17
Arunachal Pradesh 50328 405 0.81
Mizoram 2196 0 0
Table 5: Statewise small hydro total and installed capacity
Source: Central Electricity Authority, Gov. of India (2015)
However Government of India has set goals for 2020 to encourage the utilization of this plentiful
resource. Application of SHP is especially economical at sites where there is no access to the grid, or
it is uneconomical to serve from the grid due to the dissemination of rural households.
Non-renewable
Thermal
The only thermal plant in the North East region exists in Tripura state called “Palatana Power
Plant”. It is capable of producing 726.3MW of electrical output which is then shared amongst
the neighbouring states. The plant is a combined cycle gas system which means it is twice as
efficient as a coal power plant, and uses half the fuel.

Advantages:
Reliable – can be in constant operation
Flexible – can meet different energy demands
Efficient – up to 65%
Large scale – Can feed electricity to many households
Disadvantages
Environmentally polluting – releases sulphur, CO, and CO2 into the atmosphere
Requires a non-renewable energy source
High capital cost
Power has to be transmitted via grid
Large use of land space
Impact of rural electrification
The impact of supplying electricity to Northeast India could be substantially positive. Routine
activities of a typical North eastern family could be made dramatically simpler by providing
electricity. Arduous tasks such as fetching water, buying kerosene fuel, collecting wood for
fuel, may be eliminated completely and cooking made considerably shorter: freeing up more
time for leisure and family time. An evaluative study on the impact of access to electricity in
India (Pereira et al, 2011) found that household electrification will affect women and children
more than men. Women will be left with more time to read books, watch TV and do their
hobbies; and children will be under less pressure to perform chores or help on the farm: hence
longer study time. Evidently from the table below women who had electricity expended
considerably less time gathering fuel (0.32 compared to 0.90 hours) and more time reading
(0.32 hours) and watching TV (1.63 hours). Moreover, the study found that women

performed less labour when they had electricity compared to women without energy access.
This could suggest agricultural improvements as women are typically occupied on the farm.
In addition to this the study found a strong positive correlation between an increased interest
in reading and electricity supply.
Fig. 3. 5: Comparison of allocation of time on activities for women with and without
electricity.
Source: Pereira et al, 2011
Benefits can also be seen in well-being factors such as healthcare and education. According
to Ahmad et al, 2014 the entitlement to electricity had a strong positive correlation to well-
being indicators. It found that fewer children were absent and more were enrolled in regions
or households with electricity than those without. Absenteeism in children from non-
electrified households occurred 0.3 days per month more often than it did with children from
electrified households. A possible explanation for this pattern could be that children from
electrified households are expected to perform fewer chores and can therefore spend
additional time studying. These children may consequently have increased confidence and
morale during class owing to the extra study time. Also, there was a reduced illness rate in
electrified households.

Furthermore agriculture may benefit immensely from electricity. Oda, 2011 concludes from
the survey of 80 villages in five districts in Bihar that energy access has direct impact on the
cost of irrigation and processing of crops and storage of said crops. It also found that
electrified villages had more irrigated land than ones without: showing that agricultural
activities are made simpler and performed at a faster pace. Moreover, Hirashima et al (2011)
suggested that energy access increased the probability that rural development programs were
implemented in a village; adding that electrified villages had more opportunity due to
simplification of developing the village.
Another key issue with rural electrification is that the electricity supply from national grid is
unreliable with a high outage rate which continues for prolonged hours. Although grid
connection increases non-agricultural household incomes by 9%, a higher quality electricity
source boosts household incomes more than threefold (29%) (Charavoty et al, 2014). Rao,
2013 proves that the quality of electricity supplies, in terms of hours a day and outage rate,
has a strong impact on household income. Rao conducted a survey on 42000 households and
found that 16 hours a day of electricity supply was optimum for increasing household
earnings. It is estimated that Indian GDP value could grow by 0.1% (equivalent to £650
million) if every household Non-farm enterprise (NFE) was provided with a stable electricity
supply. This survey is limited to NFE’s and does not consider the economic development if
all households were to be provided with the same electricity supply. Therefore to apply this to
all Indian households the gain in GDP will be considerably larger.

Summary
The key findings of chapter three are as follows:
Village electrification has been successful on a vast scale (up to 90%), whereas based
on household electrification the success rate is low (less than 60%).
Options for rural electrification were assessed. Small-hydro has the largest potential in
Northeast India (almost 60GW), although a large percentage remains unused.
The impact of realizing rural electrification in Northeast India was discussed. Women
and children benefit most from rural electrification, as well as the disposable
household income which could increase to 29% on the basis of stable electricity (16h
a day) and minimum shortages.
Outcome
From the knowledge found in this chapter, it is evident that small-hydro has the greatest
potential in supplying electricity to the Northeast region, as well as being the most cost
effective. For this reason, Pico hydropower will be discussed extensively in the following
chapter.
Chapter four – Hydro-power
Hydro power is the conversion of the potential, kinetic and pressure energy of falling water to
mechanical energy in the turbine and then to electrical energy in the generator. According to
the laws of physics, any physical body with a mass (m) that is higher than ground level
possesses a potential energy from the pull of gravity.
This basic principle is used in hydro-power when a body of water is stored (usually in a dam
or a forebay tank) above the ground with a static head (h), and then released towards the
ground under gravitational pull. This fluid travels in pipes with large diameter which become

small as they pass out through a nozzle and exert a force on the hydroelectric wheel which
spins a shaft fixed to a generator.
The fluid flowing in the pipes also possesses kinetic and pressure energy. The kinetic energy
arises from the velocity of the fluid and the gravitational pull of the Earth. The pressure
energy is caused by the flow of a volume of fluid through a small diameter pipe: The smaller
the pipe area, the greater the pressure energy.
The relationship between potential, kinetic and pressure energy is described by Bernoulli’s
theorem:
𝑬𝒏𝒆𝒓𝒈𝒚 𝑯𝒆𝒂𝒅 𝒑𝒆𝒓 𝒖𝒏𝒊𝒕 𝒘𝒆𝒊𝒈𝒉𝒕 (𝑯) = 𝒉 +𝑷
𝜸+
𝑽𝟐
𝟐𝒈 - (1)
Where:
h = static head (m)
P = Pressure
𝛾= Specific weight of the water (𝛾 = 𝑔. ℎ)
V = Velocity of the water (m/s)
g = Gravity (m/s2)
The power in Watts (P) generated from the turbine is given by:
𝑷 = ƞ𝝆𝑸𝒈𝒉 - (2)
Where:
Ƞ = Efficiency of the turbine (%)
𝜌 = Density in kg/m3
𝑄= Volumetric flow rate in m3/s

𝑊ℎ𝑒𝑟𝑒 𝑄 = 𝐽𝑒𝑡 𝑎𝑟𝑒𝑎 × 𝑗𝑒𝑡 𝑣𝑒𝑙𝑜𝑐𝑖𝑡𝑦
Why Pico hydro?
Pico hydro represents any form of hydro power station that is capable of producing up to five kilo
Watts of electrical output. It is the smallest form of hydro available. Typically five kilo watts are
sufficient to power an entire village depending on the population and the electrical demand of that
village.
Most household in NER have basic electrical needs such as TV, radio and lighting. Their heat
source for cooking comes from burning wood, and for cleaning they use nearby sources of
water. During the day cooling may be necessary so a fan could be installed. Also, mobile
phones have recently become prevalent in villages therefore a source to charge them has to
follow.
Overall, a typical Indian village household consumes up to 300W of electrical energy. A
typical Pico hydro runner can generate 300W of electrical energy with ease. It only requires
a stable source of water, and a sufficient drop in height.
Benefits:
Little to no planning
Up to 75% efficiency
Little use of land
Environmentally-friendly technology
Low sound and visual pollution
Low cost per kWh
Low maintenance – Can be maintained by the local community

Principles of Pico hydro-power
In essence, Pico hydro is a smaller version of large scale hydro without the need for
damming: this significantly reduces costs and environmental damage. Pico hydro uses fewer
components and shrinks the size of a hydro system so that it is versatile and can be used
anywhere as long as there is a constant flow of water and an adequate drop in height.
Power generated (W)
The power delivered by the system in Watts is derived using:
𝑷 = ƞ𝝆𝑸𝒈𝒉 - (2)
Frictional head loss (hf)
Head loss can be described as the loss of available height drop through friction in the pipe.
The greater the head loss, the less the energy passed on to the turbine. This is used to
calculate the net head: the available head after losses have been accounted for.
𝒉𝒇 = 𝒇 × [𝑳
𝑫] ×
𝑽𝟐
𝟐𝒈 -(4)
Where:
L= Length of pipe; D= Diameter of pipe; V= Velocity of fluid; g= Gravity (9.81m/s2)
F = friction factor which can be directly computed using
𝟔𝟒×𝒗
𝑽×𝑫=
𝟔𝟒
𝑹𝒆 Where Re is the Reynold’s number and 𝑣 is the kinematic viscosity -(5)

𝑹𝒆 =𝑫×𝑽
𝒗
𝒗 =𝝁
𝝆
Substituting friction factor into (4) gives:
ℎ𝑓 =64×𝑣
𝑉×𝐷×
𝐿
𝐷×
𝑉2
2𝑔=
32×𝑣×𝐿×𝑉
𝑔×𝐷2 -(6)
Torque applied to the turbine
𝑇 = 𝜌𝑄𝑉𝑗2𝑟 -(7)
Where r = runner radius and Vj = Jet velocity
Power developed from the turbine
𝑃 = 𝑇𝜔 𝑜𝑟 𝜌𝑄𝑉𝑗2𝑟𝜔 -(8)
Where 𝜔 = Angular velocity of the wheel
Efficiency (ƞ)
ƞ =𝑂𝑢𝑡𝑝𝑢𝑡 𝑠ℎ𝑎𝑓𝑡 𝑝𝑜𝑤𝑒𝑟
𝐼𝑛𝑝𝑢𝑡 𝑝𝑜𝑤𝑒𝑟=
𝑇𝜔
𝛾𝑄ℎ -(9)

Fluid dynamics
Kinematics
Ideal fluid
In such a fluid it is assumed that there is no viscosity: particles are flowing adjacent and with
uniform velocity. This is hypothetical and does not exist, however there are cases where
assuming ideal fluid flow may help.
Real fluid flow
In a real fluid viscosity is introduced into the problem. A real fluid displays characteristics of
shear stress caused by viscous forces between neighbouring particles. In the case of real fluid
flow in a pipe, the velocity at the pipe wall will be zero: this will increase dramatically as it
nears the centre of the pipe and induces a velocity gradient as shown below.
Fig 4.1: Ideal and viscous fluid velocity profile
Source: www.anbg.gov.au, 2013
Incompressible/compressible
An incompressible fluid is assumed to have constant density. Although liquids display minor
fluctuations in density, most fluids can be described as wholly incompressible. Gases may be
classified as compressible as their density changes with absolute temperature and absolute
pressure.

Gravity or pressure flow
When a fluid flows through a partly full pipe under the force of gravity it is called gravity
flow because gravity is the prime moving force. However if it moves in a full flowing pipe
then pressure flow is introduced into the equation as the flow is under pressure.
Laminar flow
When a fine coloured liquid is injected into a stream of water travelling at a slow velocity, the
particles can be observed to travel as parallel straight lines and there will be no mixing of the
particles. The particles can be said to be sliding in thin layers adjacent to each other so that
there is a definite and observable path. This is also known as viscous flow as it is
characteristic of a viscous fluid.
Turbulent flow
As the velocity of the stream is increased, at a certain velocity the water and injected fluid
begin to mix so that there is no definite path. An irregular motion can be observed as large
swirls. On a microscopic level packets of particles called “eddies” form all with fluctuating
velocities and they collide in a random manner. Every particle follows a random path and no
two particles follow the same pattern. This is the reason for the mixing action.
Fig. 4.2: Laminar and turbulent flow behaviour.
Source: edu-cdn.com, 2012

Dynamics
Reynold’s number (Re) - (10)
The Reynold’s number is the ratio of inertia force to viscous force of a fluid. In fluid flow the
inertia force is the force opposing the flow of water caused by friction between the pipe
walls. Viscous force is the measure of shear stress τ caused by the velocity gradient in a
fluid travelling in a pipe. As discussed above viscous force is apparent in all real fluid flows.
The Reynold’s number with respect to velocity (V), pipe diameter (D), and kinematic
viscosity (𝒗) can be determined using:
𝑹𝒆 =𝑫×𝑽
𝒗 - (11)
The Reynold’s number is an indicator of whether the flow is laminar or turbulent: laminar
flow occurs at low Reynold’s numbers, while a high Reynold number is characteristic of a
turbulent flow (Re >2000).
Viscosity
Viscosity is a fluid’s resistance to shear stress. The viscous force is caused by cohesion of the
fluid particles against the friction between the pipe walls.
In fluids, viscosity decreases by raising the temperature. Below is a diagram that depicts how
viscous liquids react to increasing temperature.
Effect of viscosity on fluid flow
Consider a space containing water sandwiched between two sheets: one stationary plate and
one moving plate with a velocity V. At the top boundary (u=V, y=h) there is a velocity V
which gradually decreases as it nears the bottom (stationary) boundary at which point V= 0 at
y = 0: where y refers to the distance from the datum boundary and u refers to the velocity at a

point along the y axis. This forms a velocity profile. Velocity relative to the boundaries is
zero as the particles adhere to the walls as is the case for all viscous fluids: this is called the
no-slip condition.
Fig. 4.3: Velocity
profile through shear
between two plates
Since the shearing stress between the two plates 𝝉 = 𝝁𝒅𝒖
𝒅𝒚 - (12)
The dynamic viscosity or simply viscosity 𝝁 = 𝝉/(𝒅𝒖/𝒅𝒚) - (13)
The kinematic viscosity does not involve force and is computed using
𝒗 =𝝁
𝝆 - (14)
The viscosity (dynamic) of water = 1.002 kgm-1
s-1
(Pa s) at 20°C.
Density, specific weight and gravity
Density ρ of a fluid is the mass per unit volume or kg/m3. Specific weight 𝛾 is the weight per
unit volume of the fluid (N/m3). This unit is not absolute and is dependent on the gravity
which changes with location and mean height above sea level. For this report gravity is
assumed as 9.81m/s2.

The relationship between these three values gives:
𝝆 =𝜸
𝒈 - (15)
Where specific weight 𝛾 of water at 20°C = 9790 N/m3
or 9.79 kN/m3
Kinetic energy
A body of mass m that is in motion with a velocity V has a KE of 1/2 𝑚𝑉^2 . For unit
weight of the fluid this can be expressed as: 𝑉2/2𝑔. For unit mass: 𝑉2/2 ; and for unit
volume: 𝜌𝑉2/2 .
Potential energy
The energy contained in the weight of an x amount of fluid depends on the height above a
datum plane (h). This can be taken as ground level. Therefore the potential energy in a gallon
(4.5kg) of water at height difference h from ground level is computed as:
PE = mgh = 4.5 x 9.81 x h
Jet velocity and pressure
Upon reaching a jet orifice a stream converges and continues to do so until it reaches a point
called vena contracta. This is known as the minimum area of the streamline. This area is
commonly 0.5Do where Do is the diameter of the orifice. Beyond this section the stream
proceeds to deviate due to frictional effects. An orifice with a rounded entry has no vena
contracta as it allows the streamline to converge gradually to the cross section of the orifice.

Fig 4.4: Vena contracta of an orifice
Source: diracdelta, 2010
Coefficient of contraction Cc
This is the ratio between the area A of the Jet and the area of the orifice Ao and is calculated
by using:
A = Cc Ao - (16)
It can be determined by measuring the jet diameter at the vena contracta by using calipers and
comparing the area of orifice by the jet area.
Coefficient of velocity Cv
This is used to describe the ratio between ideal velocity of the jet Vi and the actual average
velocity V. The ideal velocity is a figure assumed if there was no friction in the jet: however
this is not the case.
V = CvVi - (17)
Coefficient of discharge Cd
The ratio between the ideal discharge Qi of the water and the actual discharge Q is known
as coefficient of discharge Cd.

Q = CdQi - (18)
If Q = AV, then Qi = AoVi where: Q = rate of discharge, A = Area of Jet and V = actual
velocity
Therefore coefficient of discharge is a product of coeff. Of contraction and coeff of velocity
and it can be determined using:
Cd = CcCv - (19)
The pressure imposed on the impulse wheel casing is atmospheric therefore jet pressure will
also be atmospheric. Hence it will be assumed the jet pressure is discharged at 1atm or 1×10⁵
N/m2.
The power of the jet emerging from the needle nozzle can be determined by:
𝑷𝒋𝒆𝒕 = 𝜸𝑸𝑽𝒋
𝟐
𝟐𝒈 - (20)
Basic components
A typical Pico hydro scheme comprises of the following components:
Forebay tank
Penstock
Valves
Water jets
Powerhouse - This encases the turbine and the generator
Load controller
The forebay tank is the main storage area for the water. It is placed at a height h above the
datum plane which is usually taken as the centreline of the water nozzle.

The penstock is a special type of reinforced pipe which is designed to minimize the effects
of water hammer. Water hammer is the build-up of pressure and stress in the pipe due to
blockage in the pipe or a sudden valve closing. It is required to direct the water downstream
from the forebay tank to the hydroelectric wheel. To minimize head losses in the penstock
they are usually large in diameter and made of a material with high internal wall smoothness
such as PVC or HDPE.
Valves are used to control the flow of water in a particular direction and/or control the
amount of flow rate. They are useful during maintenance or to meet fluctuating energy
demands, but can also have disastrous water hammer effect when closed suddenly.
The water jet, otherwise known as the needle nozzle varies the water flow to match the
required speed of rotation. The electrical load applied to the system is directly proportional to
the speed of gyration of the wheel. It is vital to maintain a steady rotational speed and this is
done by varying the position of the needle in the needle nozzle. As the opening of the nozzle
is expanded, the discharge of the water jet is increased; however the jet velocity is decreased.
Turbine is the general term for a turbine runner, the needle nozzle, and the casing. There are
two types of turbine runners: impulse and reaction. An impulse runner revolves as a free jet
of water impact on the buckets around its circumference. As the jet strikes the centre of the
bucket, it is split into two by the ridge in the centre of the bucket and is then diverted away
from the upcoming bucket so that momentum is not lost. Below is a diagram explaining the
action of the Pelton buckets.

Fig 4.5: Action of Pelton wheel and needle nozzle
Source: Fastonline, 2012
In a reaction runner the intake flow takes place in a closed chamber under pressure. There are
two general types of reaction runners: Francis, Kaplan and Axial type. There are many ways
that the flow through the turbine takes place such as radially inward, axial and mixed. In
summary, these runners are suitable for low-head applications (less than 15 metres) however
they are less efficient and also more expensive than a Pelton wheel.
The generator is connected on the end shaft horizontally between two bearings while the
runner is fixed to the protruding end. This configuration is known as the single overhung. A
double overhung system has two runners connected to the same generator. This is to balance
the bearing loads on both sides.
In a horizontal arrangement other machinery may be operated from the torque of the runner
using simple v notch belts and gearing. The efficiency in this case is lower due to friction in

the moving parts. In a vertical arrangement, the generator is below the turbine runner and the
complexity of bearing and shaft design is greatly reduced.
An electronic load controller (ELC) is vital in a hydro system to regulate the voltage to the
load applied to the system. Failure to incorporate a load controller can lead to malfunction
and damage to the electrical appliances drawing the current from the hydro system.
Fig. 4.6: Diagram showing how Pico hydro works
(Source: Practical Action, 2010)

Types of Pico-hydro schemes
In general there are three types of Pico hydro power schemes:
Run-of-river
Powerhouse situated at the bottom of a dam
Incorporated into a canal or into a water supply line
Run-of-river schemes
In a run of river system water from a flowing river is diverted by weir to the intake and
transported to the turbine via a penstock. Penstock pipe is expensive so for a high head run of
the river system low slope canals are used and then a short penstock to carry the water down
[ESHA, 2004].
Source: Worldwatch.com
Powerhouse situated at the bottom of a dam
Large dams that have been built for other intended purposes such as flood control, land
irrigation, recreation may be used as a potential site for a Pico-hydro plant. In this plant a

portion of the water flow is taken by the intake and transported below the dam by penstock to
the powerhouse. The water intake is usually an outlet at the bottom of the dam that can be
converted to an intake for a pico-hydro power plant.
Source: ESHA, 2004
Incorporated into a canal or water supply line
A Pico hydro station may be fitted into an enlarged canal which accommodates the turbine,
the drive shaft and a submerged powerhouse. Often in these schemes a Kaplan turbine is
used. A bypass parallel to the irrigation canal is also designed to ensure water supply for
irrigation while the turbine is in operation.
Source: ESHA, 2004

Drinking water supply usually comes from high head source such as a water tower or a
reservoir. A pipe carries this water down to supply the town with water. Fitting a turbine into
the supply pipe is an attractive option for generating electricity, so long as the water hammer
phenomenon is prevented.
Source: ESHA, 2004
Summary
The key points from chapter four are as follows:
The fundamentals of pico-hydro power were introduced and the subject of fluid
dynamics was described in detail. The basic components of a pico-hydro plant were
specified and their functions in the plant were defined. Finally the types of pico-hydro
schemes were identified and a description of each given.
Pipe inner wall surface smoothness and pipe diameter affects head loss therefore
choosing a larger diameter pipe with a lower pipe surface roughness coefficient
prevents energy being dissipated through friction.
Choosing a suitable turbine-generator set is dependent on the site conditions and the
measured head, and flow rate. A Pelton runner performs acceptably under all
conditions, although it is most efficient in high head, low flow applications.

Outcome
Using the background knowledge on Pico-hydro power plants obtained in this chapter
combined with the understanding of socioeconomic and geographical information of the NER
in chapter two; a design idea will be proposed to meet the requirements of the NER rural
population for electricity supply and drinking water, by harnessing the power of rainfall.
Chapter five – Design
Prior starting to design the following factors must first be considered:
The suitable sites – and head and flow rate of said sites
The turbine type
The penstock material
The local technical and manufacture capability
Start-up, operation and maintenance costs
Reliability
Standardization
The design is based on the highest annual rainfall figures in the North East India of
11,800mm. Assumptions are made that the rain is continuous and lasts the entire monsoon
season (April to September), and from October to January there is no rain.
Design requirements
Capacity of minimum 200W, medium head, low flow rate
Reliable - able to produce electricity for most of the year
Easy maintenance and running
Minimum start-up cost
Locally manufacturable

Standardised
Efficient
Affordable
Decentralized/off grid solution
Turbine selection
Williamson et al, 2012 proposed a method of turbine selection by defining the quantitative
and qualitative conditions, subsequently using Pugh’s matrix method to rate Pico runner
design to select the most suitable one. Below is a flowchart depicting the Williamson method
for turbine selection.
Source: Williamson et al, 2012

Source: Cobb et al, 2011 (adapted from Paish, 2002)
As it can be seen by the above table impulse turbine for a medium head applications consist of
Crossflow, Turgo, and Pelton runner. Therefore this restricts the selection to three possible turbine
runners.
Source: Elbatran et al, 2014
The table above shows all the possible selection criteria that can be used in the study. For
simplification, in this project the cost and efficiency quantitative criteria will be considered, and the
reliability, ease of manufacture and the maintainability qualitative conditions will be sought.
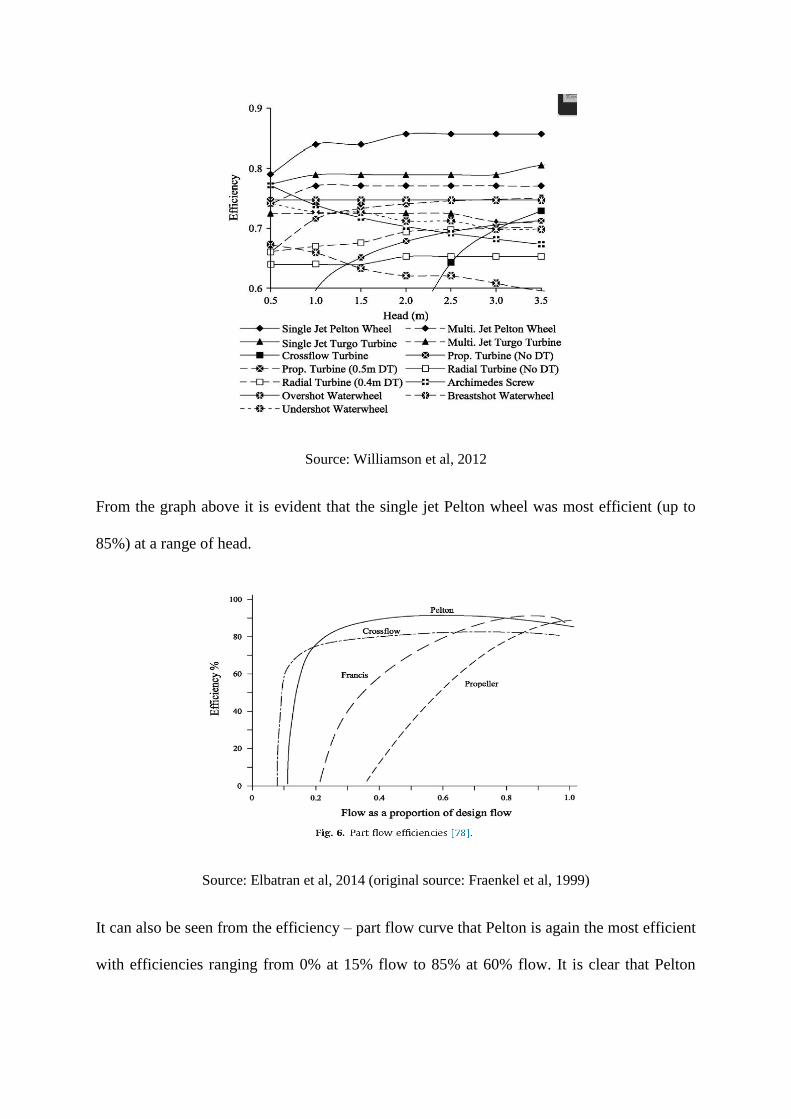
Source: Williamson et al, 2012
From the graph above it is evident that the single jet Pelton wheel was most efficient (up to
85%) at a range of head.
Source: Elbatran et al, 2014 (original source: Fraenkel et al, 1999)
It can also be seen from the efficiency – part flow curve that Pelton is again the most efficient
with efficiencies ranging from 0% at 15% flow to 85% at 60% flow. It is clear that Pelton

wheel is the most efficient runner, and Elbatran et al, 2014 recommends Pelton turbines due
to numerous other advantages including:
predictable performance under different conditions
ease of manufacture and maintenance
resistant to water contaminants such as sand particles which have low impact on the
runner performance
simple geometry
cost effectiveness
This information is adequate to conclude that a Pelton runner is most suitable to use in the
design. Moreover from the chart below it can be seen that at a 10m head, the optimum runner
size is 120mm pitch centre diameter (PCD) and best efficiency turbine speed is 1000 rpm.
Source: Maher et al, 2002

Design Idea
Below is a schematic of the dual rainfall harvesting and Pico hydro power generating design
idea. This device captures the unharnessed power of rainfall and converts it into electricity. It
features five needle nozzles to maximize the rotational velocity of the runner. The runner is a
Pelton type with a pitch centre diameter (PCD) of 120mm. The pitch centre diameter is the
diameter to the centre of the buckets which is tangential to the jet emerging from the nozzles.
The runner shaft can be coupled to a DC car/truck alternator or a 2/4/6 pole 3-phase
induction motor which are both largely manufactured in India and are inexpensive and
robust. The tailwater from the turbine is then stored in a tank which has two outlets: one
outlet is connected to houses and delivers filtrated water; while the other outlet allows water
to be pumped manually upwards to be recycled into the system.

Graph above shows that at a 10m head and 10m3
volume of storage tank it is possible to
extract up to 28 hours of electricity from the system when applying a load of 10W, equivalent
to two five watt ultra-bright LED spotlights producing sufficient light to illuminate a room.
Furthermore the capacity for 20W electrical load is high with a 14 hour lifetime. Typical
appliances and their electrical loads are given below. (Source: McKay, 2008)
02468
1012141618202224262830
0 1 2 3 4 5 6 7 8 9 10 11
No
. of
ho
urs
Volume of tank m3
Time - volume graph with 10 m head
10W
20W
30W
50W
100W
200W

Advantages:
Inexpensive and cost effective
Produces no environmental pollution
Provides houses with electricity and clean drinking water (which can be scarce in the dry
season)
Can be used as a secondary power source
Can be used during a blackout
Water storage tank can be used as an energy store: removing need for batteries
Allows the user to generate electricity to suit their demands
Can be delivered flat pack and constructed on site
Drawbacks:
Produces enough electricity to electrify one house
Intermittent – Depends on the precipitation level
May be visually polluting due to height of the structure
the motor may emit sound pollution
Cost considerations
In any hydro-power scheme it is vital to consider the costs in order to make it affordable to
the rural population. Here are some ways to reduce costs and increase the viability and
feasibility of pico-hydro schemes.
Low cost Penstock
HDPE or wood penstock is a suitable replacement for mild steel for head less than 75m.
Wood has been used successfully in Germany with a lifetime of 50-100 years. Since it is
abundant in India and inexpensive, wooden penstock may be used (Kusakana, 2013)

Locally manufacture turbine
Since the turbine is the main powerhouse of the system, it is also the most expensive
component. The cost can be reduced by locally manufacturing the turbine which also helps to
create jobs (Elbatran, 2014). The high success rate of locally manufactured parts particularly
in Nepal supports the viability of the process. Furthermore principles of sand casting can be
adapted to the manufacturing process so that Pelton runners can be single cast: reducing costs
further (Ho-Yan, 2012).
Standardisation of components
Cost of components represents a significant portion of the cost of any Pico-hydro system.
Standardizing the Pelton wheel geometry and manufacturing process will be particularly
beneficial in NER as the manufacturing technology and capability is limited in this region.
Furthermore, innovating the design of expensive components by combining them into a
single unit could lower civil, installation and transport costs. Turbine-generator sets such as
low cost DC power pc-hydro pack; the Peltric set; the Pico power pack have been developed
and manufactured in bulk in Colombia and Nepal with huge success (Maher, 2002; Lahimer
et al, 2012).
Community involvement
Community can get involved with all processes of the implementation of the design to reduce
cost and create jobs. Furthermore, energy suppliers may give bonus subsidisations to village
population who contributed to the employment of the pico-hydro plant (Elbatran, 2014)

CAD modelling and 3D printing
Below figures show the CAD model produced on CATIA, converted into stl file and imported into the
3D printing machine ready for preliminary error check and commencing printing. Figure 3 shows the
complete 3D printed runner and shaft. Figure 4 shows the dynamo circuit board which testing would
be conducted on.
(1)
(2)
(3)
(4)

Testing methodology
The testing element will not be conducted as planned due to timing restrictions however if they were
to be conducted the tests would determine the effects of:-
varying head (1m, 2m, 3m)
varying pipe diameter (10mm, 20mm, 30mm)
On:
Discharge (m3/s)
Power out (P)
Torque (T)
Efficiency (ƞ)
Voltage (V)
Amperes (A)
The testing will be conducted on a standard gallon (4.5kg) of water. The testing will determine the
values needed to calculate:
Jet velocity (Vj)
Kinetic energy (KE)
Potential energy (PE)
Energy Head (H)
Head loss (hf)
The experimentation would be supervised by a senior member of staff and all health and safety
regulations abided. Health and safety concerns include: drop of bucket onto personnel head and the
risk of falling from height.

The simple schematic below shows the experimental set up as it was planned.
Summary
The key points in chapter five are as follows:
Turbine selection criteria were defined and utilizing Williamson method a Pelton turbine with
a PCD of 120mm was selected as most suitable
Design idea was introduced and pros/cons of the device were reviewed
Cost reducing techniques were outlined for affordability of the scheme in rural India
CAD modelling and 3D printed Pelton runner was shown and the testing arrangement was
depicted.
Bu
cket
Var
yin
g H
ead
Dynamo
Nozzle
Pelton runner

Chapter six – Discussion
Discussion
In this report a Pico-hydro Pelton wheel design was developed by: (1) studying the socio-economic
background of Northeast India such as climate, economy, and the living standards; (2) research of
sources of electrification and their individual capabilities in the Northeast Region (NER); and (3) the
foundations of Pico-hydro systems including the typical components and schemes.
Initial socio-economic research was gathered using India census 2011 data which was analysed to
observe trends and pitfalls. The data suggested poor economy (GDP under £400 per capita) due to low
profits from commercial crops, and a weak communication and transport infrastructure. Furthermore,
the information hinted that electricity shortage negatively impacted welfare factors, especially wages
by as much as 29%. This suggested a large market for rural electrification henceforth an assessment of
the capabilities of different renewable and non-renewable energy sources were conducted using
figures from official Indian Government sources.
This assessment found no real potential for wind power or solar energy in NER, conversely small
hydro-power was found as the most viable particularly in the Arunachal Pradesh with a capacity of
80GW. Inaccessibility of the region due to harsh terrain limits this value to an estimated 15GW of
usable hydro-power: which is nevertheless a substantial amount awaiting to be harnessed.
The large potential of hydro-power led to research in the field and found that pico-hydro to be most
cost effective in rural regions: since Northeast is mainly rural it was decided that pico-hydro would be
the ideal source of electrification. Hence principles, scheme components, and scheme types of Pico
hydro were studied. Consequently the design was formulated around these three study areas and
design requirement was defined. The Pelton wheel was modelled using CATIA software and printed
using 3D printing machine. The finished product is shown in chapter five.

Chapter seven – Conclusions and recommendations
Conclusion
It can be concluded that electricity is a vital commodity that has a strong positive impact on
people’s lives. Electricity supply is a catalyst to growth and development and contributor to
quality of welfare development. It is income generating and will improve GDP growth and
household incomes of a region after implementation. Observing the data and figures gathered
in the report a meaningful conclusion would be although Pico hydropower is site-dependent,
it is the future for rural electrification, particularly in India. Pico-hydro has many suitable
sites in India, as well as globally and could one day be used to power all tropical rural regions
of the world.
Experimental results were not obtained however this report is a useful tool for anyone who
wishes to familiarise themselves with pico-hydro and its foundations. Also it is a good
starting guide for anyone who wishes to implement their own pico-hydro station or carry out
further research into pico-hydro in Northeast India.
Recommendations
One of the issues associated with rural electrification found in the report is the unfeasibility
of extending grid into remote rural areas. This issue can be resolved by using renewable
energy, namely solar and small hydro-power to decentralize remote areas. Hence villages can
be independent of the central grid and create their own electricity.
The regional population may also be unwilling to pay for electricity due to poor wages (as
discussed in chapter three) therefore subsidies to reduce the charge of schemes and cost
reducing techniques can be employed. Government grants can also be paid out to financially
aid the citizens for paying the electricity bills.

Further Research and Development is vital to standardise components, which simplifies and
reduces the cost of the manufacturing process. Thus components can be locally manufactured
instead of imported.
References
1. A.A. Lahimer et al. (2012). Research and development aspects of Pico-hydro power.
Renewable and sustainable energy reviews. 16 (1), 5861-5878.
2. A.H. Elbatran et al. (2014). Operation, performance and economic analysis of low head
micro-hydropower turbines for rural and remote areas: A review. Renewable and
sustainable energy reviews. 43 (1), 40-50.
3. Cobb, B. (2012). Impulse (Turgo and Pelton) turbine performance characteristics and
their impact on pico-hydro installations. Renewable energy. 50 (1), 959-964.
4. Coxworth, B. (2015). Rainwater used to generate electricity. [online] Gizmag.com.
Available at: http://www.gizmag.com/pluvia-rainwater-microturbine/31379/ [Accessed 7
May 2015].
5. D. Rao (2013). Does (better) electricity supply increase household enterprise income in
India?. [online] Available at:
http://www.sciencedirect.com/science/article/pii/S0301421513001109 [Accessed 8 May
2015].
6. European Small Hydropower Association (ESHA) (2004). [online] Available at:
http://www.esha.be/fileadmin/esha_files/documents/publications/GUIDES/GUIDE_SHP/
GUIDE_SHP_EN.pdf [Accessed 7 May 2015].
7. Evolo.us, (2010). Rain Collector Skyscraper-eVolo | Architecture Magazine. [online]
Available at: http://www.evolo.us/competition/rain-collector-skyscraper/ [Accessed 7
May 2015]

8. Hirmer et al (2014). The user-value of rural electrification: An analysis and adoption of
existing models and theories. [online] Available at:
http://www.sciencedirect.com/science/article/pii/S1364032114001622 [Accessed 8 May
2015].
9. Indexmundi.com, (2015). [online] Available at: http://www.indexmundi.com/blog/wp-
content/uploads/2013/08/minutes-of-work-for-a-big-mac.png [Accessed 7 May 2015].
10. Kamalapour et al (2011). Rural electrification in India and feasibility of Photovoltaic
Solar Home Systems. [online] Available at:
http://www.sciencedirect.com/science/article/pii/S0142061510002310 [Accessed 8 May
2015].
11. Kusakana, K. (2014). A survey of innovative technologies increasing the viability of
micro-hydropower as a cost effective rural electrification option in South Africa.
Renewable and sustainable energy reviews. 37 (1), 370-379.
12. Lahimer et al (2013). Publications. [online] Available at:
http://nowshadamin.webs.com/publications.htm [Accessed 8 May 2015].
13. Maher et al (2002). Assessment of pico hydro as an option for off-grid electrification in
Kenya. [online] Available at:
http://www.sciencedirect.com/science/article/pii/S0960148102002161 [Accessed 8 May
2015].
14. Oda et al (2013). The determinants of rural electrification: The case of Bihar, India.
[online] Available at:
http://www.sciencedirect.com/science/article/pii/S0301421511000905 [Accessed 8 May
2015].
15. P. Balachandra (2011). Dynamics of rural energy access in India: An assessment.
[Accessed 8 May 2015].

16. P. Maher. Pico hydro for Village Power (2002). [online] Available at:
https://energypedia.info/images/9/92/Ph_manual_s.pdf [Accessed 7 May 2015].
17. Palit et al (2011). Off-grid rural electrification experiences from South Asia: Status and
best practices. [online] Available at:
http://www.sciencedirect.com/science/article/pii/S0973082611000500 [Accessed 8 May
2015].
18. Pereira et al (2011). Evaluation of the impact of access to electricity: A comparative
analysis of South Africa, China, India and Brazil. Renewable and Sustainable Energy
Reviews, 15(3), pp.1427-1441.
19. practicalaction.org, (2015). [online] Available at:
https://practicalaction.org/docs/technical_information_service/micro_hydro_power.pdf
[Accessed 7 May 2015].
20. S. Ahmad et al (2014). Household electricity access, availability and human well-being:
Evidence from India. [online] Available at:
http://www.sciencedirect.com/science/article/pii/S0301421514000913 [Accessed 8 May
2015].
21. S.J. Willaimson et al. (2014). Low head Pico hydro turbine selection using a multi
criteria analysis. Renewable energy. 61 (1), 43-50.
22. Sharma et al (2013). A comprehensive analysis of strategies, policies and development of
hydropower in India: Special emphasis on small hydro power. [online] Available at:
http://www.sciencedirect.com/science/article/pii/S136403211200559X [Accessed 8 May
2015].
23. Sharma et al (2013). Solar energy in India: Strategies, policies, perspectives and future
potential. [Accessed 8 May 2015].

24. T. Ekholm et al (2010). Determinants of household energy consumption in India. [online]
Available at: http://www.sciencedirect.com/science/article/pii/S0301421510003885
[Accessed 8 May 2015].
25. U. Chakravorty et al (2014). Does the quality of electricity matter? Evidence from rural
India. [online] Available at:
http://www.sciencedirect.com/science/article/pii/S0167268114001164 [Accessed 8 May
2015].
26. Urban et al (2009). Energy for rural India. [Accessed 8 May 2015].