production resources status times and … · purpose to define the production resources status...
TRANSCRIPT
© RENAULT 2009 Source : PEGI Renault Page : 1 / 27
Production resources status times and performance monitoring indicators
E41.50.505.R /H ________________________________________
Standard ________________________________________
Status Binding Important Note: This document has been translated from the French. In the event of any dispute, only the
French version is referred to as the reference text and is binding on the parties Purpose To define the production resources status times and performance monitoring indicators
to be specified/used during: the course of a business transaction production monitoring capitalisation
This document must be applied by vendors for the creation and acceptance of their means of production and manufacture and by maintenance personnel in the factories for monitoring performance and production means and by all persons concerned with capitalisation.
Scope Renault group Issuer 65931 - Maintenance Engineering and Means Performance Confidentiality Non-confidential Approved by Function Signature Date of application
T. Géniteau Department 65931 Manager 05/2009
E41.50.505.R /H
© RENAULT 2007 Source : PEGI Renault Page : 2 / 27
Version history
Version Update Subject of the main modifications Author A 09/1985 Creation. L. Bernat 65931 H 05/2009 RGU :
• Creation of § 3.2.2" Overall Factory Output Efficiency RGU " and abolition of the indications relative to the RGU in § 3.2.1
• Addition of the RGU, in the table of § 3.2 · • Addition of the RGU in § 2.2.
RPM : • complete reformulation complete of § 3.2.4.4" Actual Assembly Output
Efficiency RPM " OEE : Abolition of the notion of OEE in miscellaneous §, so as § 7
The § modified are marked by a vertical line in the margin
L. Bernat 65931
Replaces Same number version G of 11/2007 Available from Inside Renault, on the Intranet: http://gdxpegi.ava.tcr.renault.fr
Outside Renault, on the Internet: www.cnomo.com Email: [email protected]
Documents quoted Regulations : International : European : EN 15341 French : X 60-500 CNOMO : Renault : EB03.05.010, GE41-024, GE41-025. Other in-house doc. : Other external doc. : Codification ICS : 01.040.03 ; 03.100.50 ; 03.120.01 ; 21.020 Class E41 Key words temps état, indicateur, fmd, fiabilité, disponibilité, maintenabilité, sûreté de fonctionnement,
time, indicator, reliability, availability, capability to maintain, operating safety Language English (1) Assisted in authoring the document Site ou Direction Service Nom
E41.50.505.R /H
© RENAULT 2007 Source : PEGI Renault Page : 3 / 27
Contents
Page
Foreword ..................................................................................................................................... 4 1 General Topics............................................................................................................................ 4 2 Table of management performance indicators by usage phases.......................................... 5 2.1 Principles of construction of the tables..........................................................................................................5 2.2 Construction and performance management logic. ......................................................................................5 2.3 Indicator usage Tables ..................................................................................................................................6 3 Indicator Definition ..................................................................................................................... 9 3.1 Reference data..............................................................................................................................................9 3.2 Output Efficiency .........................................................................................................................................10 3.3 Availability....................................................................................................................................................12 3.4 Stoppage frequency ....................................................................................................................................13 3.5 Stoppage time .............................................................................................................................................14 3.6 Specific Indicators .......................................................................................................................................16 3.7 Other indicators ...........................................................................................................................................17 4 Definition of installation status times..................................................................................... 19 4.1 Total time -----------------------------------------------------------------------------> Tt................................................20 4.2 Requisite Time ----------------------------------------------------------------------> TR ..............................................20 4.3 Non-Requisite Time---------------------------------------------------------------- > TNR ...........................................20 4.4 Operating Time ----------------------------------------------------------------------> TF..............................................20 4.5 Actual Stoppage Time ------------------------------------------------------------> TAP.............................................21 4.6 Induced Stoppage Time -----------------------------------------------------------> TAI.............................................22 4.7 Flow Rupture ...............................................................................................................................................22 4.8 Filling – Emptying ........................................................................................................................................22 5 Other notions ............................................................................................................................ 23 5.1 Opening time ------------------------------------------------------------------------> To ...............................................23 5.2 Free time ------------------------------------------------------------------------------> Tl ...............................................23 6 Cycle time.................................................................................................................................. 23 6.1 Repetitive Excess Time of theoretical cycle ---------------------------------->TDRTcyth .....................................23 6.2 Actual cycle time -------------------------------------------------------------------->Tcyr ............................................23 7 Relationships between the indicators .................................................................................... 23 8 Cycle time measurement in monitoring systems .................................................................. 25 9 List of documents quoted........................................................................................................ 25 Appendix 1: Lexicon of abbreviations.................................................................................................. 26

E41.50.505.R /H
© RENAULT 2007 Source : PEGI Renault Page : 4 / 27
Foreword The French standards EN 15341 and X 60-500 cannot be used in their current state since they are not sufficiently complete for the monitoring of our production resources.
1 General Topics The object of this standard is to define:
✦ The rationale of how the physical performance of an installation is made up and the selection of indicators allowing the best representation possible of all the contributors, and the principal phases of the life cycle.
✦ The definitions of, and principal cases where recommended indicators are employed to translate the notions of : entry data, output, availability, frequency and times of stoppages.
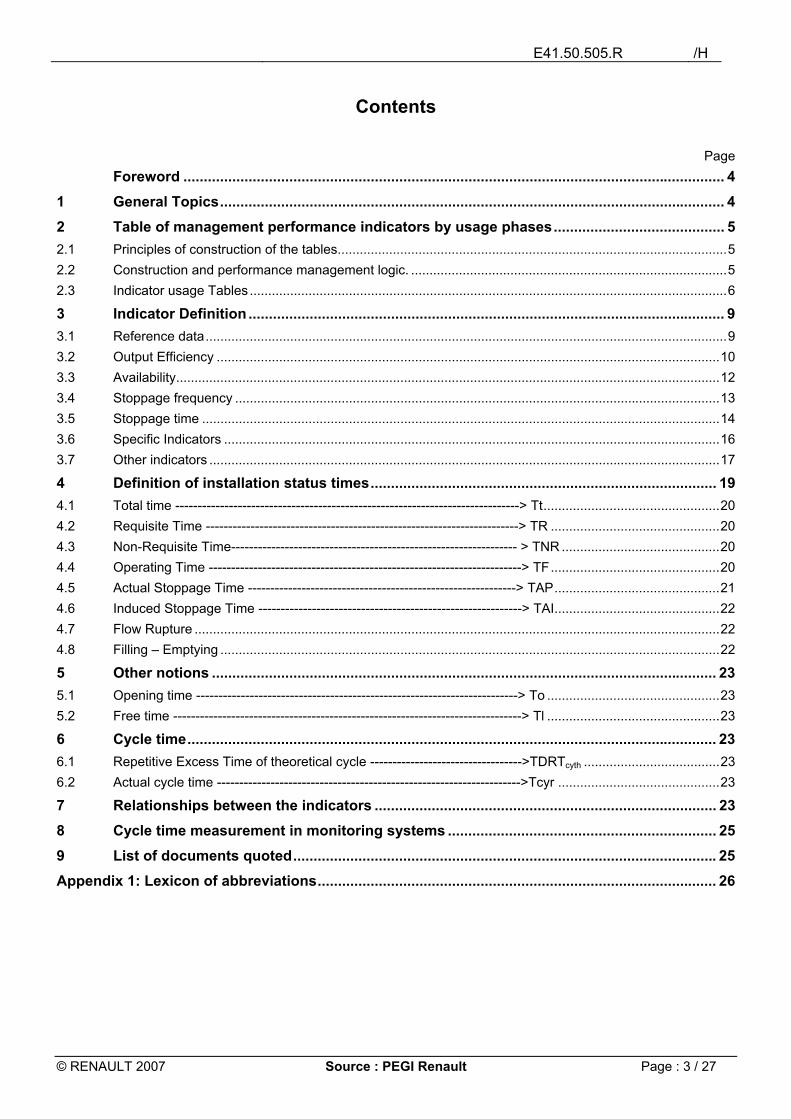
✦ The different status times of an installation, (see diagram below) Note : An installation can be : • a means of production::
- a robotised island, - a machine, - a booth, an oven, .. - a machining or assembly transfer line,
• a piece of handling equipment - a roller table, - an overhead conveyor, - a ground-level assembly line,...
✦ other indicators translating the notions of : • productivity, • reliability, • quality rate. • maintainability, • cycle time, • rapidity in re-starting,
✦ The relationships which exist between these indicators.
Diagram showing the status times
Failure linked to toolsFailure linked to the machine
Change of toolPeriodically scheduledadjustementInspectionChange of operating sequenceSharpening of electrodesPeriodically schedulemaintenance,..
Operating Time (TF)
Requisite Time (TR)
Induced Stoppage Time (TAI)
Functionale StoppageTime (TAF)
CorrectOperating Time (TBF)
Part of TNR during which theoperator could use his productionresource tu produce
Potential availableTime (Td)
Unavailable time (Ti)
Breakdown Time (TP)
Total time (Tt)
Rest break, snack, ...Production ressource not performingProgrammed preventive maintenance actionsDeferred corrective maintenance actions
Actual Stoppage Teme (TAP)
Stoppage Time inducedby Lack of parts (TAIm)
Stoppage Time Inducedby saturation (TAIs)
Non RequisiteTime (TNR)
Stoppage Time Inducedby other causes (TAIa)
Lack of external resources :fluids, pallet, support, operator,manual or automatic partsprovisioning
Operating StoppageTime (TAe)
Defective OperatingTime (TFD)
Problem of quailityAccidental cutting of a unitFailure linked to the product
A malfunctioning facilityproduces faulty parts
Reference Cycle time overshoot (TDTC)

E41.50.505.R /H
© RENAULT 2007 Source : PEGI Renault Page : 5 / 27
2 Table of management performance indicators by usage phases
2.1 Principles of construction of the tables Table 1 on page 7 shows the principal recommended indicators for the different phases of an installation’s life cycle. An installation can be limited to one machine, but can also be a line, or a complete manufacturing workshop. As far as an industrial project is concerned, the installation is the contract scope most frequently used when dealing with Capital Goods Suppliers (FdBEs). The two columns in the table which describe the recommended indicators for defining the contract objectives with a supplier are:
Capital Goods Supplier bought performance services specifications and Capital Goods Supplier acceptance
Table 2 shows the use of other indicators which are not included with the list of recommended indicators. NOT ALLOWED This entry signifies that the use of the indicator concerned is not suitable because of what it takes into account of the independent results of sampling for the capital goods supplier. Its contractual use can risk serious disagreements with the supplier during the acceptance phases, leading to the strong possibility that expected results will not be achieved. NO This entry means that the indicator is not recommended for the phase concerned. Its use is not forbidden, but is generally of no interest for the performance management of the phase concerned.
2.2 Construction and performance management logic. The principal mission of an industrial manufacturing system is to produce a given volume of acceptable products, in a given requisite time, for the best possible complete cost. The physical performance of the system is one of the important components in fulfilling this mission.
2.2.1 Reference data Quite often, the entry data in a new project is as follows:
✦ Required time example : 1270min/day, 5,33 days/week, 5000h/year, defined by Renault
✦ Hourly actual and operating capacity This means the system working at its best to produce the expected output. These capacities are essential for Renault, but too global to be contractual with a capital goods supplier.
✦ Quality rate Can be partially contractual with a capital goods supplier.
✦ Nominal cycle time It is a fundamental item of data in the contract with a supplier of production engineering equipment (FdBE). It is updated whenever technical modifications result in its evolution.
✦ Theoretical cycle time The theoretical cycle time is the cycle time committed to officially and durably by the system operator for its production equipment. It can be identical to or above the nominal cycle time, e.g. in period of low activity, but cannot be below it.
All this data is generally specified in the planning phase and afterwards monitored regularly, at the start using projections, and after using actual measurements to ensure objectives are met.
E41.50.505.R /H
© RENAULT 2007 Source : PEGI Renault Page : 6 / 27
2.2.2 Output Efficiency Indicators There are three output efficiency indicators for the operational piloting of factories:
✦ Operating output efficiency
It shows the real production capacity for the requisite time with respect to a capacity without loss functioning in the theoretical cycle time, adapting itself, every time necessities, in the long-lasting changes of the conditions of exploitation.
✦ Actual Sectorial Output
It is based on th same principle as operational output efficiency, but does not consider production loss induced by the environment of the measurement perimeter In an asynchronous area, this output efficiency cannot generally be measured because of the “breathing” of materials undergoing processing which smoothes out the impact of any unpriming along the principal flow. However, an estimate by approximation can be made, and in a more refined way, by simulating the flow.
✦ Overall Factory Output Efficiency It characterizes the global performance of a plant
Note: Finally, to assess an industrial investment’s commitment, we can use the synthetic output efficiency (TRS) which measures output efficiency over total time (24/7) and based on the nominal cycle time (Tcy defined by Methods).
2.2.3 Stoppage frequencies and times Stoppage frequencies and times are the most common indicators.
✦ Frequencies for 1000 parts and mean stoppage time these are the most practical for management in the field.
✦ Stoppage times for 1000 parts
these show most clearly the real impact of the stoppages.
It is preferable to use stoppage frequencies and times per work unit when comparing different workshops and sites with each other. It is not desirable to permanently use all the indicators simultaneously, but according to the situation at any given moment, each of them can show the effectiveness of an action plan.
2.2.4 Other indicators recommended They are all the indicators recommended which cannot be classified in the categories above.
2.3 Indicator usage Tables The chapter numbers indicated in the charts are those giving the definition of indicators.

E
41.5
0.50
5.R
/H
©
RE
NA
ULT
200
9 So
urce
: PE
GI R
enau
lt P
age
: 7
/ 27
Tabl
e 1
Ref
eren
ce d
ata
and
reco
mm
ende
d in
dica
tors
for p
erfo
rman
ce m
anag
emen
t by
usag
e ph
ase
Indi
cato
rs
* Th
e U
O (W
ork
Uni
ts) a
re :
UPS
TREA
M
TRAD
E
CO
NTR
ACTU
AL
PR
OJE
CT
CO
NTR
ACTU
AL S
UPP
LIE
R
BU
SIN
ES
S
ND
ICAT
OR
S PR
OJE
CT
BU
SIN
ES
S
IND
ICAT
OR
S LI
NE
pres
sing
: 10
000
line
pre
sses
,
pa
nels
: 1
mill
ion
equi
vale
nt s
olde
r poi
nts,
pa
int a
nd a
ssem
bly
: 100
0 ve
hicl
es
Def
initi
on
mac
ro
perfo
rman
ce
Ben
chm
ark.
CdC
P
erfo
rman
ce
sold
Pro
ject
M
anag
emen
t
Pro
ject
A
ccep
tanc
eC
dC
Per
form
ance
bo
ught
FdB
E
FdB
E
Acc
epta
nce
Per
form
ance
co
nstru
ctio
n an
d si
mul
atio
n
Sta
rtup
show
n as
a
pace
Line
O
pera
tion
Feed
back
Syn
onym
s an
d ob
serv
atio
ns
4.1
Ref
eren
ce d
ata
CdC
: se
rvic
e sp
ecifi
catio
ns
FdB
E :
Cap
ital G
oods
Sup
plie
r 3.
1.1
Req
uisi
te T
ime
TRYE
S
YES
YE
S
YES
YE
S
YES
N
O
YES
YE
S
3.
1.2
Hou
rly c
apac
ity
ac
tual
C
hpYE
S
YES
YE
S
NO
T AL
LOW
ED
N
OT
ALLO
WE
DYE
S
YES
YE
S
YES
3.1.
3 H
ourly
Cap
acity
op
erat
ing
Cho
YES
N
OT
ALLO
WE
D
NO
T AL
LOW
ED
YES
YE
S
3.
1.4
Qua
lity
rate
TqYE
S
YES
YE
S
YES
YE
S
YES
YE
S
YES
YE
S
3.
1.5
Cyc
le ti
me
nom
inal
Tc
yYE
S
YES
YE
S
YES
YE
S
YES
YE
S
YES
YE
S
3.
1.6
Cyc
le ti
me
theo
retic
al
Tcyt
hYE
S
NO
N
O
NO
N
O
NO
YE
S
YES
YE
S
Pac
ing
time
3.2
Out
put e
ffici
ency
3.2.
1 O
pera
ting
outp
ut e
ffici
ency
, Out
put e
ffici
ency
in p
ract
ice
Ro
YES
YE
S
YES
N
OT
ALLO
WE
D
NO
T AL
LOW
ED
YES
YE
S
YES
YE
S
3.
2.3
Act
ual s
ecto
rial o
utpu
t effi
cien
cy
RP
SYE
S
YES
YE
S
YES
YE
S
YES
YE
S
YES
YE
S
Dis
play
act
ual o
utpu
t effi
cien
cy.
§3.2
.2.4
. 3.
2.2
Ove
rall
Fact
ory
Out
put E
ffici
ency
R
GU
YES
YE
S
YES
N
OT
ALLO
WE
D
NO
T AL
LOW
ED
YES
YE
S
YES
YE
S
3.
3 A
vaila
bilit
ies
3.
3.1
Act
ual
avai
labi
lity
D
pYE
S
YES
YE
S
NO
T AL
LOW
ED
N
OT
ALLO
WE
DN
O
YES
YE
S
YES
ex
cept
war
ehou
sing
type
1
3.3.
2 A
vaila
bilit
y
for b
reak
dow
n D
paYE
S
YES
YE
S
NO
T AL
LOW
ED
N
OT
ALLO
WE
DYE
S
YES
YE
S
YES
ex
cept
war
ehou
sing
type
1
3.4
Stop
page
freq
uenc
ies
3.4.
1 A
ctua
l sto
ppag
e fre
quen
cy p
er 1
,000
par
ts
Fpm
YES
YE
S
YES
N
OT
ALLO
WE
D
NO
T AL
LOW
ED
YES
YE
S
YES
YE
S
3.
4.2
Num
ber
actu
al s
topp
age
by w
ork
unit*
N
AP
/ U
O
3.
4.3
Act
ual s
topp
age
frequ
ency
for b
reak
dow
n pe
r 1,0
00 p
arts
Fp
pmYE
S
YES
YE
S
YES
YE
S
YES
YE
S
YES
YE
S
3.
4.4
Num
ber
brea
kdow
n
by w
ork
unit
* N
P /
UO
3.4.
5 A
ctua
l fu
nctio
nal s
topp
age
frequ
ency
per
1,0
00 p
arts
Ff
pmYE
S
YES
YE
S
Con
tract
dep
end.
C
ontra
ct d
epen
d.YE
S
YES
YE
S
YES
3.4.
6 N
umbe
r fu
nctio
nal s
topp
age
by w
ork
unit
* N
AF
/ UO
3.4.
7 F
requ
ency
ac
tual
ope
ratin
g st
oppa
ge fo
r 100
0 pa
rts
Fepm
YES
YE
S
YES
N
OT
ALLO
WE
D
NO
T AL
LOW
ED
YES
YE
S
YES
YE
S
3.
4.8
Num
ber
oper
atin
g st
oppa
ge b
y w
ork
unit*
N
Ae
/ UO
3.5
Stop
page
Tim
es
3.5.
1 A
vera
ge A
ctua
l Sto
ppag
e Ti
me
TAP
M
3.
5.2
Act
ual S
topp
age
Tim
e fo
r 1,0
00 p
arts
TA
Ppm
YES
YE
S
YES
N
OT
ALLO
WE
D
NO
T AL
LOW
ED
YES
YE
S
YES
YE
S
3.
5.3
Act
ual s
topp
age
time
by w
ork
unit
* TA
P /
UO
3.5.
4 A
vera
ge B
reak
dow
n Ti
me
(= M
TTR
) TM
P
3.
5.5
Bre
akdo
wn
Tim
e fo
r 1,0
00 p
arts
TP
pmYE
S
YES
YE
S
YES
YE
S
YES
YE
S
YES
YE
S
3.
5.6
Bre
akdo
wn
time
by
Wor
k U
nit *
TP
/ U
O
3.
5.7
Ave
rage
Fun
ctio
nal S
topp
age
Tim
e TM
AF
3.5.
8 F
unct
iona
l Sto
ppag
e Ti
me
for 1
,000
par
ts
TAFp
mYE
S
YES
YE
S
Dep
end
cont
ract
Dep
end
cont
ract
YES
YE
S
YES
YE
S
3.
5.9
Fun
ctio
nal s
topp
age
time
b
y w
ork
unit
* TA
F / U
O
3.
5.10
Mea
n op
erat
ing
stop
page
tim
e TM
Ae
3.5.
11 O
pera
ting
Sto
ppag
e Ti
me
for 1
,000
par
ts
TAep
mYE
S
YES
YE
S
NO
T AL
LOW
ED
N
OT
ALLO
WE
DYE
S
YES
YE
S
YES
3.5.
12 O
pera
ting
stop
page
tim
e
by w
ork
unit
* TA
e / U
O
E
41.5
0.50
5.R
/H
©
RE
NA
ULT
200
9 So
urce
: PE
GI R
enau
lt P
age
: 8
/ 27
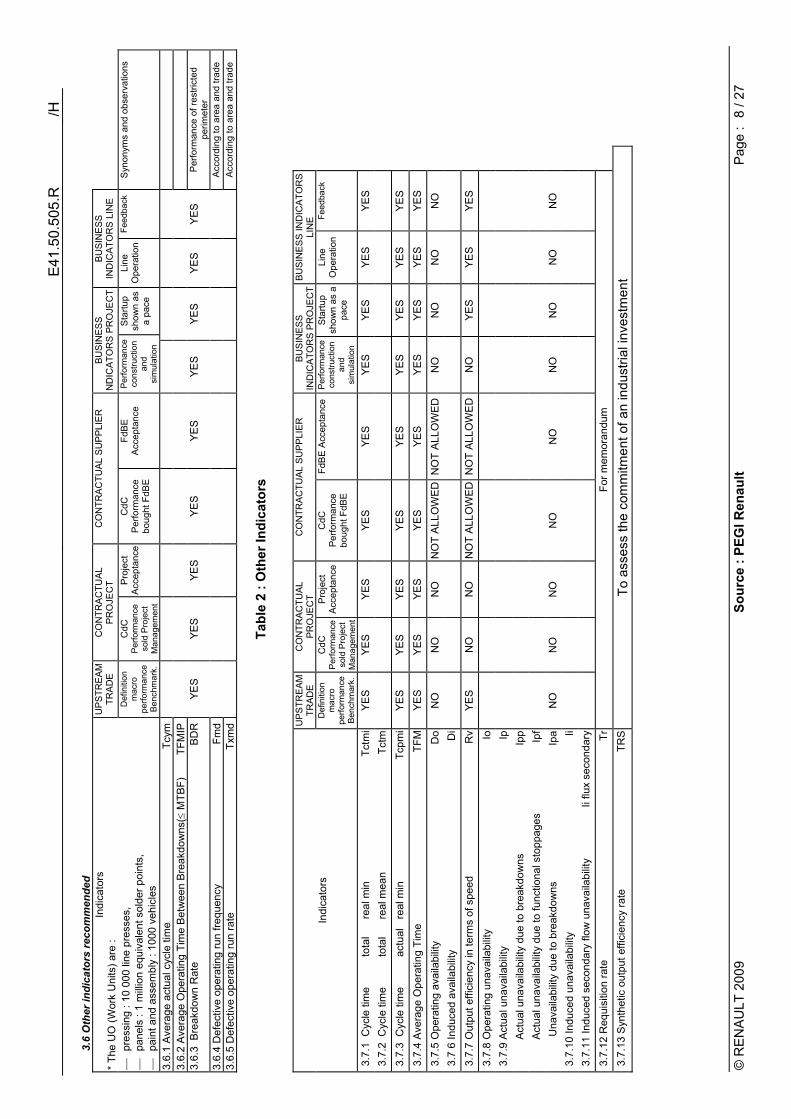
3.6
Oth
er in
dica
tors
reco
mm
ende
d In
dica
tors
*
The
UO
(Wor
k U
nits
) are
: U
PSTR
EAM
TR
ADE
C
ON
TRAC
TUAL
P
RO
JEC
T C
ON
TRAC
TUAL
SU
PPLI
ER
B
US
INE
SS
N
DIC
ATO
RS
PRO
JEC
TB
US
INE
SS
IN
DIC
ATO
RS
LIN
E
pres
sing
: 10
000
line
pre
sses
,
pa
nels
: 1
mill
ion
equi
vale
nt s
olde
r poi
nts,
pa
int a
nd a
ssem
bly
: 100
0 ve
hicl
es
Def
initi
on
mac
ro
perfo
rman
ce
Ben
chm
ark.
CdC
P
erfo
rman
ce
sold
Pro
ject
M
anag
emen
t
Pro
ject
A
ccep
tanc
eC
dC
Per
form
ance
bo
ught
FdB
E
FdB
E
Acc
epta
nce
Per
form
ance
co
nstru
ctio
n an
d si
mul
atio
n
Sta
rtup
show
n as
a
pace
Line
O
pera
tion
Feed
back
Syn
onym
s an
d ob
serv
atio
ns
3.6.
1 A
vera
ge a
ctua
l cyc
le ti
me
Tcym
3.6.
2 A
vera
ge O
pera
ting
Tim
e B
etw
een
Bre
akdo
wns
(≤ M
TBF)
TF
MIP
3.6.
3 B
reak
dow
n R
ate
BD
RYE
S
YES
YE
S
YES
YE
S
YES
YE
S
YES
YE
S
Per
form
ance
of r
estri
cted
pe
rimet
er
3.6.
4 D
efec
tive
oper
atin
g ru
n fre
quen
cy
Fmd
A
ccor
ding
to a
rea
and
trade
3.
6.5
Def
ectiv
e op
erat
ing
run
rate
Tx
md
A
ccor
ding
to a
rea
and
trade
Ta
ble
2 : O
ther
Indi
cato
rs
UPS
TREA
M
TRAD
E
CO
NTR
ACTU
AL
PR
OJE
CT
CO
NTR
ACTU
AL S
UPP
LIE
R
BU
SIN
ES
S
IND
ICAT
OR
S PR
OJE
CT
BU
SIN
ES
S IN
DIC
ATO
RS
LI
NE
In
dica
tors
D
efin
ition
m
acro
pe
rform
ance
B
ench
mar
k.
CdC
P
erfo
rman
ce
sold
Pro
ject
M
anag
emen
t
Pro
ject
A
ccep
tanc
eC
dC
Per
form
ance
bo
ught
FdB
E
FdB
E A
ccep
tanc
e P
erfo
rman
ce
cons
truct
ion
and
sim
ulat
ion
Sta
rtup
show
n as
a
pace
Line
O
pera
tion
Feed
back
3.7.
1 C
ycle
tim
e
tota
l re
al m
in
Tctm
iYE
S
YES
YE
S
YES
YE
S
YES
YE
S
YES
YE
S
3.7.
2 C
ycle
tim
e
tota
l re
al m
ean
Tctm
3.
7.3
Cyc
le ti
me
ac
tual
re
al m
in
Tcpm
iYE
S
YES
YE
S
YES
YE
S
YES
YE
S
YES
YE
S
3.7.
4 A
vera
ge O
pera
ting
Tim
e TF
MYE
S
YES
YE
S
YES
YE
S
YES
YE
S
YES
YE
S
3.7.
5 O
pera
ting
avai
labi
lity
Do
NO
N
O
NO
N
OT
ALL
OW
ED
NO
T A
LLO
WE
DN
O
NO
N
O
NO
3.
7 6
Indu
ced
avai
labi
lity
Di
3.
7.7
Out
put e
ffici
ency
in te
rms
of s
peed
R
vYE
S
NO
N
O
NO
T A
LLO
WE
D N
OT
ALL
OW
ED
NO
YE
S
YES
YE
S
3.7.
8 O
pera
ting
unav
aila
bilit
y Io
3.
7.9
Act
ual u
nava
ilabi
lity
Ip
A
ctua
l una
vaila
bilit
y du
e to
bre
akdo
wns
Ip
p
A
ctua
l una
vaila
bilit
y du
e to
func
tiona
l sto
ppag
es
Ipf
Una
vaila
bilit
y du
e to
bre
akdo
wns
Ip
aN
O
NO
N
O
NO
N
O
NO
N
O
NO
N
O
3.7.
10 In
duce
d un
avai
labi
lity
Ii
3.7.
11 In
duce
d se
cond
ary
flow
una
vaila
bilit
y Ii
flux
seco
ndar
y
3.7.
12 R
equi
sitio
n ra
te
TrFo
r mem
oran
dum
3.
7.13
Syn
thet
ic o
utpu
t effi
cien
cy ra
te
TRS
To a
sses
s th
e co
mm
itmen
t of a
n in
dust
rial i
nves
tmen
t
E41.50.505.R /H
© RENAULT 2009 Source : PEGI Renault Page : 9 / 27
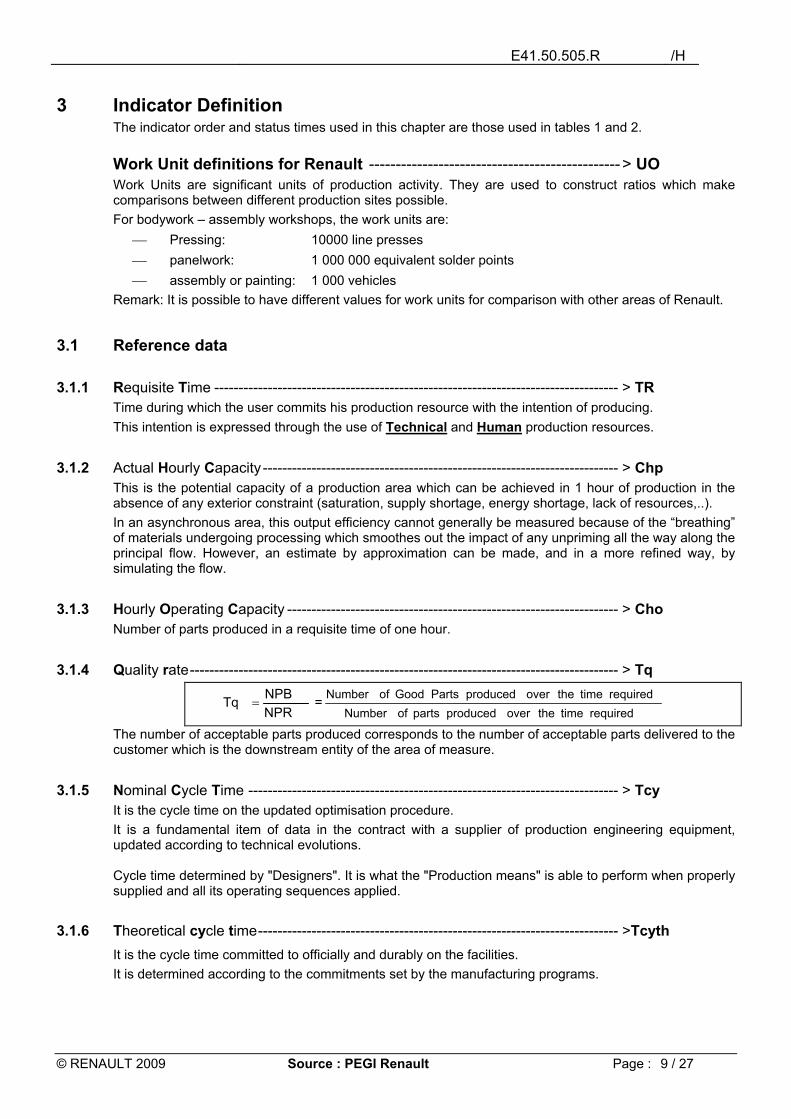
3 Indicator Definition The indicator order and status times used in this chapter are those used in tables 1 and 2. Work Unit definitions for Renault -----------------------------------------------> UO Work Units are significant units of production activity. They are used to construct ratios which make comparisons between different production sites possible. For bodywork – assembly workshops, the work units are:
Pressing: 10000 line presses panelwork: 1 000 000 equivalent solder points assembly or painting: 1 000 vehicles
Remark: It is possible to have different values for work units for comparison with other areas of Renault.
3.1 Reference data
3.1.1 Requisite Time ----------------------------------------------------------------------------------- > TR Time during which the user commits his production resource with the intention of producing. This intention is expressed through the use of Technical and Human production resources.
3.1.2 Actual Hourly Capacity ------------------------------------------------------------------------- > Chp This is the potential capacity of a production area which can be achieved in 1 hour of production in the absence of any exterior constraint (saturation, supply shortage, energy shortage, lack of resources,..). In an asynchronous area, this output efficiency cannot generally be measured because of the “breathing” of materials undergoing processing which smoothes out the impact of any unpriming all the way along the principal flow. However, an estimate by approximation can be made, and in a more refined way, by simulating the flow.
3.1.3 Hourly Operating Capacity -------------------------------------------------------------------- > Cho Number of parts produced in a requisite time of one hour.
3.1.4 Quality rate---------------------------------------------------------------------------------------- > Tq
NPRNPBTq = =
required time the over produced parts of Numberrequired time the over produced Parts Good of Number
The number of acceptable parts produced corresponds to the number of acceptable parts delivered to the customer which is the downstream entity of the area of measure.
3.1.5 Nominal Cycle Time ---------------------------------------------------------------------------- > Tcy It is the cycle time on the updated optimisation procedure. It is a fundamental item of data in the contract with a supplier of production engineering equipment, updated according to technical evolutions. Cycle time determined by "Designers". It is what the "Production means" is able to perform when properly supplied and all its operating sequences applied.
3.1.6 Theoretical cycle time-------------------------------------------------------------------------- >Tcyth It is the cycle time committed to officially and durably on the facilities. It is determined according to the commitments set by the manufacturing programs.

E41.50.505.R /H
© RENAULT 2009 Source : PEGI Renault Page : 10 / 27
3.2 Output Efficiency
3.2.1 Operating output efficiency ---------------------------------------------------------------- > Rop The updated definition of the Operational output efficicency makes it fully equivalent to the existing sectorial global output efficiencies. Consequently, these are no longer required, and are replaced by the Operational output efficiency (Ro).
Ro = NPBNPTR
= Number of acceptable parts producedNumber of parts which can be produced in theory
For the NPPR, the parts count is carried out on the last workstation of the area.
with: NPTR = TcythTR =
time cycle lTheoreticatime Requisite
Number of parts which can theoretically be produced (NPTR): number of parts which the production resource (or the system) can theoretically produce if the production resource (or if all the components of the system) operated without any stoppage, operated fully in keeping with the theoretical cycle time (Tcyth) and did not produce any scrap during the requisite time. The following breakdowns are used to start identifying the principal causes of losses with a view to a global performance improvement plan.
Ro = Do x Rv x Tq
Ro = required time
time Operatingx
time cycle actual Averagetime cycle l Theoretica x
produced parts of Numberparts acceptable of Number
Ro = Dp x Di x Rv x Tq
Ro=TAPTF
TF+
x TR
TAITR − xTcymTcyth x
produced parts of Numberparts acceptable of Number
3.2.2 Overall Factory Output Efficiency-------------------------------------------------------- > RGU
RGU = NVTR
NV =
Tcyth
TRNV
The RGU is the ratio between the Number of Vehicles realized and the Number of Theory practicable Vehicles, this at the level of the TCM and during the requisite time NV : Number of realized vehicles taken out of TCM (Fallen from mechanics line) during the requisite time (TR),
with or without defect, complete or incomplete NVTR : Number of in theory practicable Vehicles during the requisite time :
NVTR = time) cycle al(Theoretic Tcyth
Time) (Requisite TR
The theoretical cycle time is the one of the last front section TCM.

E41.50.505.R /H
© RENAULT 2009 Source : PEGI Renault Page : 11 / 27
3.2.3 Operational output efficiency on stamping lines Details on calculating Ro
possible strokes of NumberRework) (Scrap - performed strokes of NumberRo +
=
With Number of strokes possible = ∑oceduresPr
[(Rate TOP5) x ∑BatchesTR ]
for a given product/process mix. With TR: Time required per batch, from last good part to last good part TOP5 rate: It is the product-process rate (Cpp). It is the rate measured over 5 minutes (also called TOP5 or TOP10, as certain sites, the measurement over 10 minutes) without incidents nor saturated line. The purpose of this rate is to qualify the product and process (tool, specific automation). The TOP5 rate is expressed in strokes/hour.
3.2.4 Actual Sectorial Output Efficiency----------------------------------------------------------- > RPS
RPS = stops induced Loss - NPTR
NPB
NPB = Number of acceptable parts produced in the requisite time The parts count is carried out on the last workstation of the area. NPTR = Number of parts theoretically possible (at theoretical cycle time) The parts count is carried out on the last workstation of the area. Induced stoppage losses = (Upstream losses)* + (Provisioning losses)* + (Downstream losses) * The effect of upstream and provisioning losses when leaving the area. In an asynchronous area, these losses are not measured but estimated in the number of lost parts.
This indicator is used a lot in the factory, but equally in flow simulations. It can be used for a sector area, for example:
Pressing Department: the RPS is equal to: ----------------------------------------------> RPE Panelling Department: the RPS is equal to: ---------------------------------------------> RPT Paint Department: the RPS is equal to: ---------------------------------------------------> RPP Assembly Department: the RPS is equal to ----------------------------------------------> RPM
For practical purposes, all parts delivered to the customer are considered acceptable for these output efficiency measurements (Quality Assurance principle).
3.2.4.1 RPE : Actual Output Efficiency for Pressing We use the formula of the RPS NPB : Number of good strokes. NPTR : Number of in theory practicable strokes. The induced loss fonctionning is estimated in number of lost strokes.
RPE = stops induced Loss - NPTR
NPB
E41.50.505.R /H
© RENAULT 2009 Source : PEGI Renault Page : 12 / 27
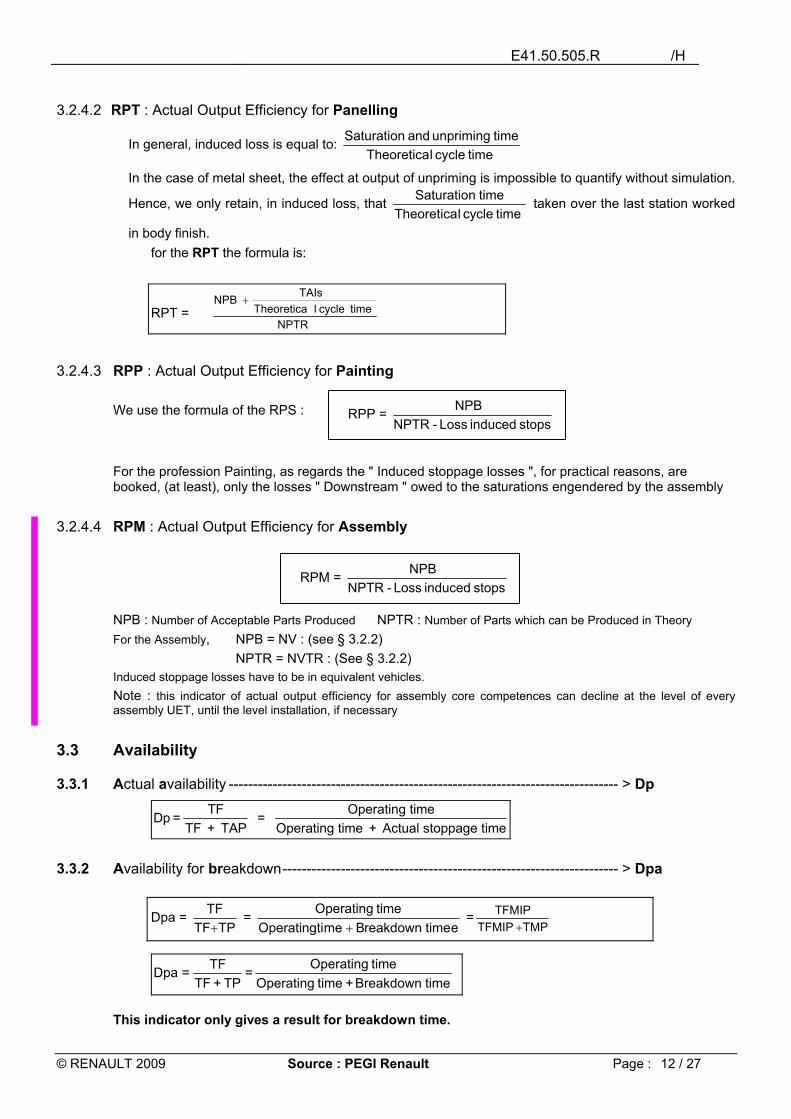
3.2.4.2 RPT : Actual Output Efficiency for Panelling
In general, induced loss is equal to: time cycle lTheoreticatime unpriming and Saturation
In the case of metal sheet, the effect at output of unpriming is impossible to quantify without simulation.
Hence, we only retain, in induced loss, that time cycle lTheoretica
time Saturation taken over the last station worked
in body finish. for the RPT the formula is:
RPT = NPTR
time cycle lTheoretica TAIs NPB +
3.2.4.3 RPP : Actual Output Efficiency for Painting
We use the formula of the RPS : For the profession Painting, as regards the " Induced stoppage losses ", for practical reasons, are booked, (at least), only the losses " Downstream " owed to the saturations engendered by the assembly
3.2.4.4 RPM : Actual Output Efficiency for Assembly NPB : Number of Acceptable Parts Produced NPTR : Number of Parts which can be Produced in Theory For the Assembly, NPB = NV : (see § 3.2.2) NPTR = NVTR : (See § 3.2.2) Induced stoppage losses have to be in equivalent vehicles. Note : this indicator of actual output efficiency for assembly core competences can decline at the level of every assembly UET, until the level installation, if necessary
3.3 Availability
3.3.1 Actual availability -------------------------------------------------------------------------------- > Dp
Dp = TFTF + TAP
= Operating timeOperating time + Actual stoppage time
3.3.2 Availability for breakdown--------------------------------------------------------------------- > Dpa
Dpa = TPTF
TF+
= etime eakdownrBmeperatingtiO
time Operating+
=TMPTFMIP
TFMIP+
time Breakdown + time Operating
time Operating = TP + TF
TF=Dpa
This indicator only gives a result for breakdown time.
RPM = stops induced Loss - NPTR
NPB
RPP = stops induced Loss - NPTR
NPB

E41.50.505.R /H
© RENAULT 2009 Source : PEGI Renault Page : 13 / 27
3.4 Stoppage frequency On a consolidated area of measure (a collection of several areas of measure), the frequencies are added and no mean is taken. This allows the best comparisons between areas. The Work Unit (UO) indicators are particularly useful in panelling and pressing where the number of parts produced isn’t always representative of a production activity which can be compared between sites.
3.4.1 Actual stoppage frequency for 1000 parts ------------------------------------------------ > Fpm
Fpm = 1000xNPRNAP = 1000x
time requisite during produced parts of Numberstoppages actual of Number
3.4.2 Number of stoppages per work unit -------------------------------------------------------- > NAP / UO NAP = Actual number of stoppages UO = Work unit : See § 3
3.4.3 Actual stoppage frequency for breakdown per 1,000 parts -------------------------- > Fppm
Fppm = 1000xNPRNP = 1000x
time requisite during produced parts of Numberbreakdows of Number
3.4.4 Number of breakdowns per work unit ------------------------------------------------------ > NP / UO NP = Number of breakdowns UO = Work unit : See § 3
3.4.5 Actual functional stoppage frequency per 1,000 parts -------------------------------- > Ffpm
Ffpm = 1000xNPRNAF = 1000x
time requisite during produced parts of Numberstoppages lfunctionna of Number
3.4.6 Number of functional stoppages per work unit------------------------------------------- > NAF / UO NAF = Number of functional stoppages UO = Work unit : See § 3
E41.50.505.R /H
© RENAULT 2009 Source : PEGI Renault Page : 14 / 27
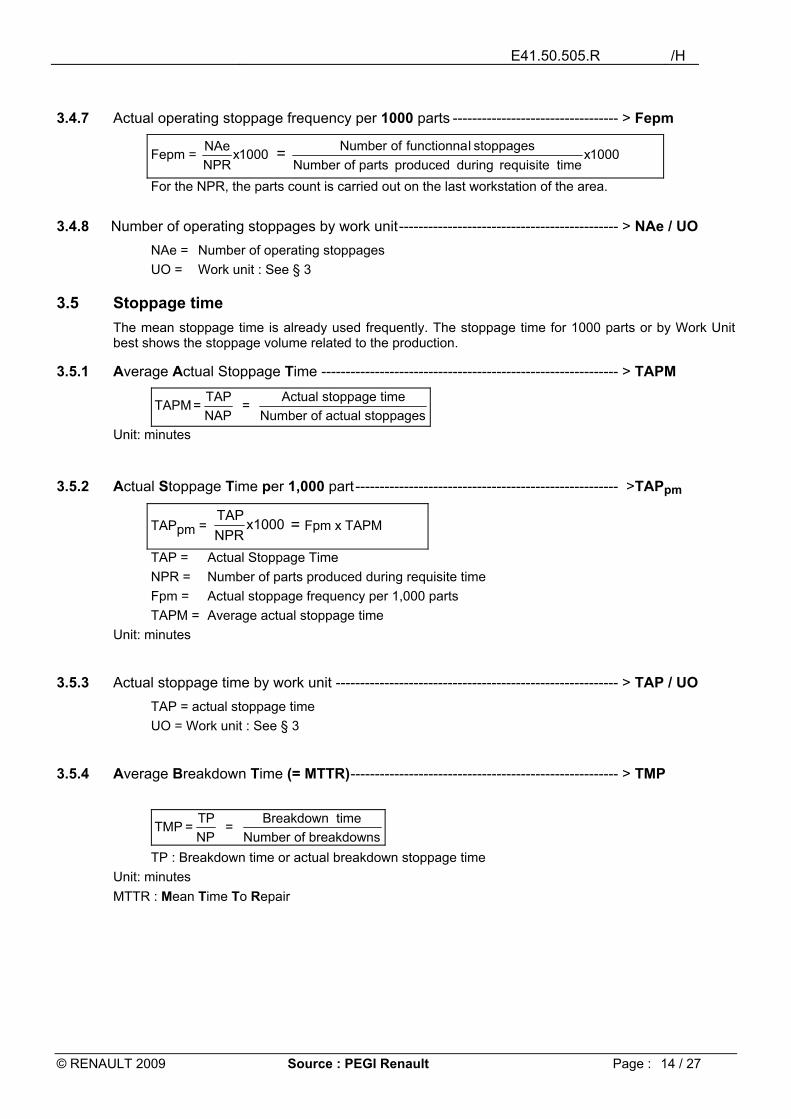
3.4.7 Actual operating stoppage frequency per 1000 parts ---------------------------------- > Fepm
Fepm = 1000xNPRNAe = 1000x
time requisite during produced parts of Numberstoppages lfunctionna of Number
For the NPR, the parts count is carried out on the last workstation of the area.
3.4.8 Number of operating stoppages by work unit--------------------------------------------- > NAe / UO NAe = Number of operating stoppages UO = Work unit : See § 3
3.5 Stoppage time The mean stoppage time is already used frequently. The stoppage time for 1000 parts or by Work Unit best shows the stoppage volume related to the production.
3.5.1 Average Actual Stoppage Time ------------------------------------------------------------- > TAPM
TAPM = TAPNAP
= Actual stoppage timeNumber of actual stoppages
Unit: minutes
3.5.2 Actual Stoppage Time per 1,000 part------------------------------------------------------ >TAPpm
TAPpm = 1000xNPRTAP = Fpm x TAPM
TAP = Actual Stoppage Time NPR = Number of parts produced during requisite time Fpm = Actual stoppage frequency per 1,000 parts TAPM = Average actual stoppage time
Unit: minutes
3.5.3 Actual stoppage time by work unit ---------------------------------------------------------- > TAP / UO TAP = actual stoppage time UO = Work unit : See § 3
3.5.4 Average Breakdown Time (= MTTR)------------------------------------------------------- > TMP
TMP = TPNP
= Breakdown timeNumber of breakdowns
TP : Breakdown time or actual breakdown stoppage time Unit: minutes MTTR : Mean Time To Repair
E41.50.505.R /H
© RENAULT 2009 Source : PEGI Renault Page : 15 / 27
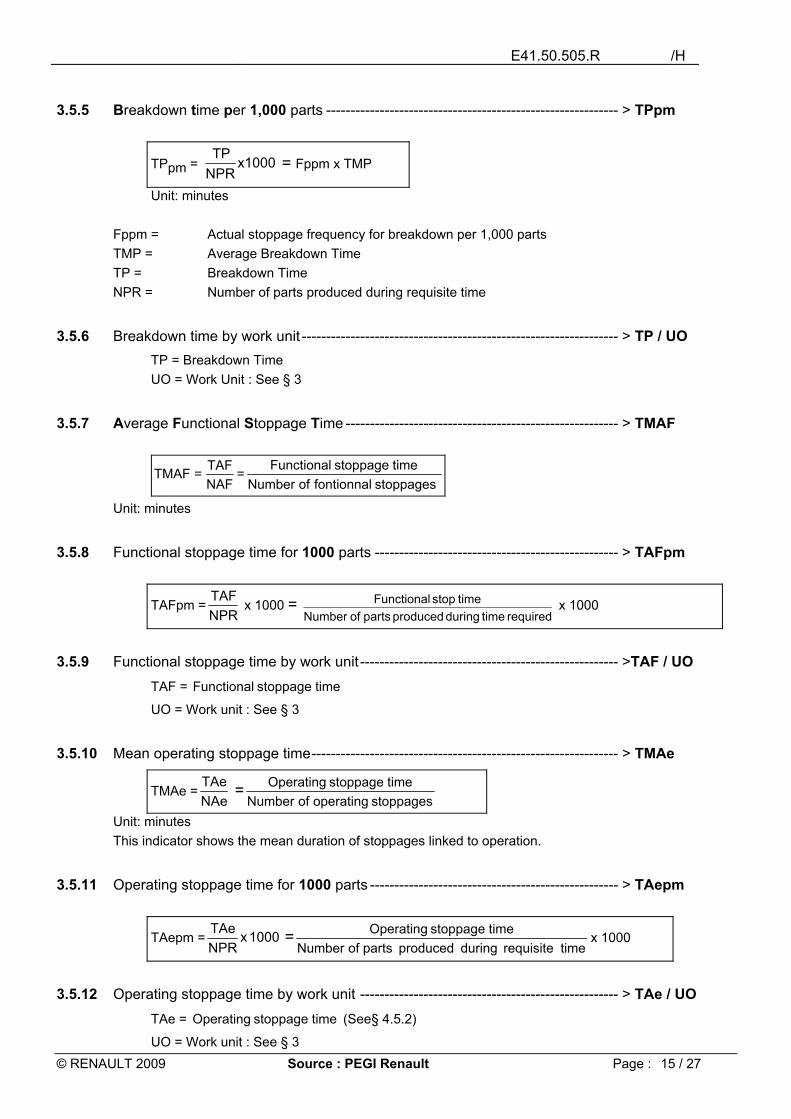
3.5.5 Breakdown time per 1,000 parts ------------------------------------------------------------ > TPpm
TPpm = 1000xNPRTP = Fppm x TMP
Unit: minutes
Fppm = Actual stoppage frequency for breakdown per 1,000 parts TMP = Average Breakdown Time TP = Breakdown Time NPR = Number of parts produced during requisite time
3.5.6 Breakdown time by work unit ----------------------------------------------------------------- > TP / UO TP = Breakdown Time UO = Work Unit : See § 3
3.5.7 Average Functional Stoppage Time -------------------------------------------------------- > TMAF
stoppages fontionnal of Numbertime stoppage Functional =
NAFTAF=TMAF
Unit: minutes
3.5.8 Functional stoppage time for 1000 parts -------------------------------------------------- > TAFpm
TAFpm =NPRTAF
x 1000 = required time during produced parts of Number
time stop Functional x 1000
3.5.9 Functional stoppage time by work unit----------------------------------------------------- >TAF / UO TAF = time stoppage Functional
UO = Work unit : See § 3
3.5.10 Mean operating stoppage time--------------------------------------------------------------- > TMAe
TMAe =NAeTAe
=stoppages operating of Number
time stoppage Operating
Unit: minutes This indicator shows the mean duration of stoppages linked to operation.
3.5.11 Operating stoppage time for 1000 parts --------------------------------------------------- > TAepm
TAepm = 1000x NPRTAe
=time requisite during produced parts of Number
time stoppage Operating x 1000
3.5.12 Operating stoppage time by work unit ----------------------------------------------------- > TAe / UO TAe = time stoppage Operating (See§ 4.5.2)
UO = Work unit : See § 3
E41.50.505.R /H
© RENAULT 2009 Source : PEGI Renault Page : 16 / 27
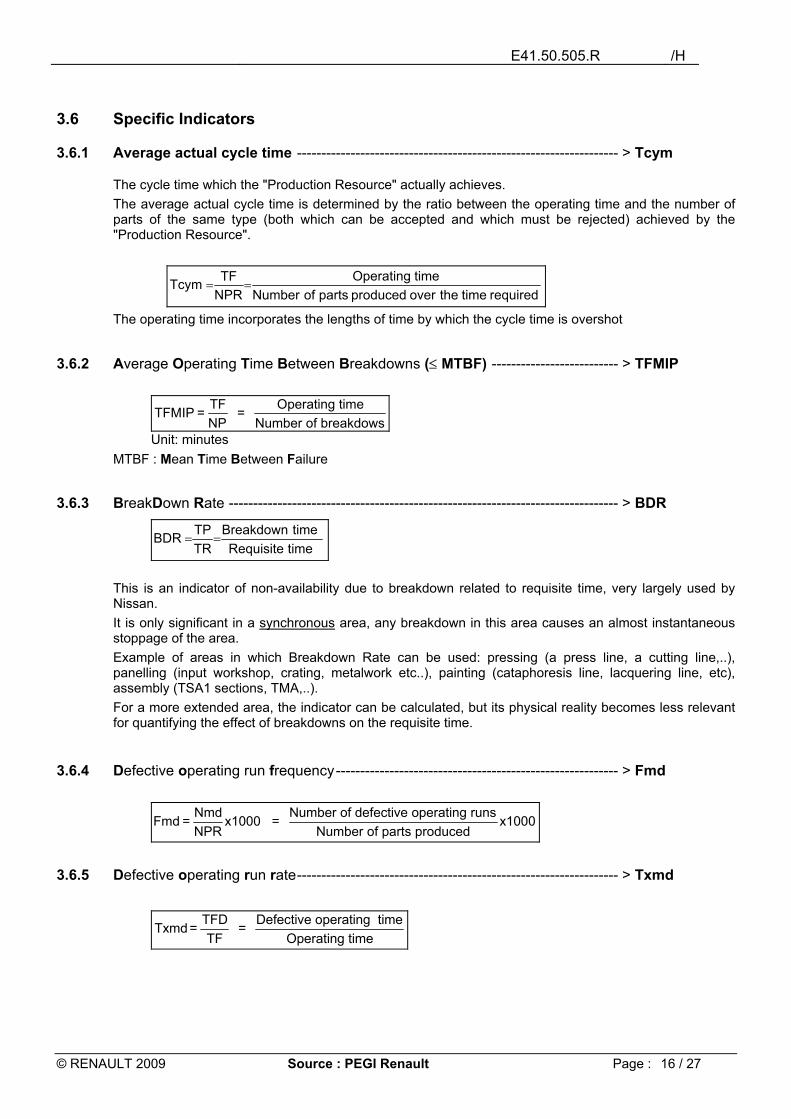
3.6 Specific Indicators
3.6.1 Average actual cycle time ------------------------------------------------------------------ > Tcym
The cycle time which the "Production Resource" actually achieves. The average actual cycle time is determined by the ratio between the operating time and the number of parts of the same type (both which can be accepted and which must be rejected) achieved by the "Production Resource".
required time the over produced parts of Numbertime Operating
NPRTFTcym ==
The operating time incorporates the lengths of time by which the cycle time is overshot
3.6.2 Average Operating Time Between Breakdowns (≤ MTBF) -------------------------- > TFMIP
TFMIP = TFNP
= Operating timeNumber of breakdows
Unit: minutes MTBF : Mean Time Between Failure
3.6.3 BreakDown Rate -------------------------------------------------------------------------------- > BDR
time Requisite time Breakdown
TRTP BDR ==
This is an indicator of non-availability due to breakdown related to requisite time, very largely used by Nissan. It is only significant in a synchronous area, any breakdown in this area causes an almost instantaneous stoppage of the area. Example of areas in which Breakdown Rate can be used: pressing (a press line, a cutting line,..), panelling (input workshop, crating, metalwork etc..), painting (cataphoresis line, lacquering line, etc), assembly (TSA1 sections, TMA,..). For a more extended area, the indicator can be calculated, but its physical reality becomes less relevant for quantifying the effect of breakdowns on the requisite time.
3.6.4 Defective operating run frequency---------------------------------------------------------- > Fmd
Fmd = NmdNPR
x1000 = Number of defective operating runsNumber of parts produced
x1000
3.6.5 Defective operating run rate------------------------------------------------------------------ > Txmd
Txmd= TFDTF
= Defective operating timeOperating time
E41.50.505.R /H
© RENAULT 2009 Source : PEGI Renault Page : 17 / 27
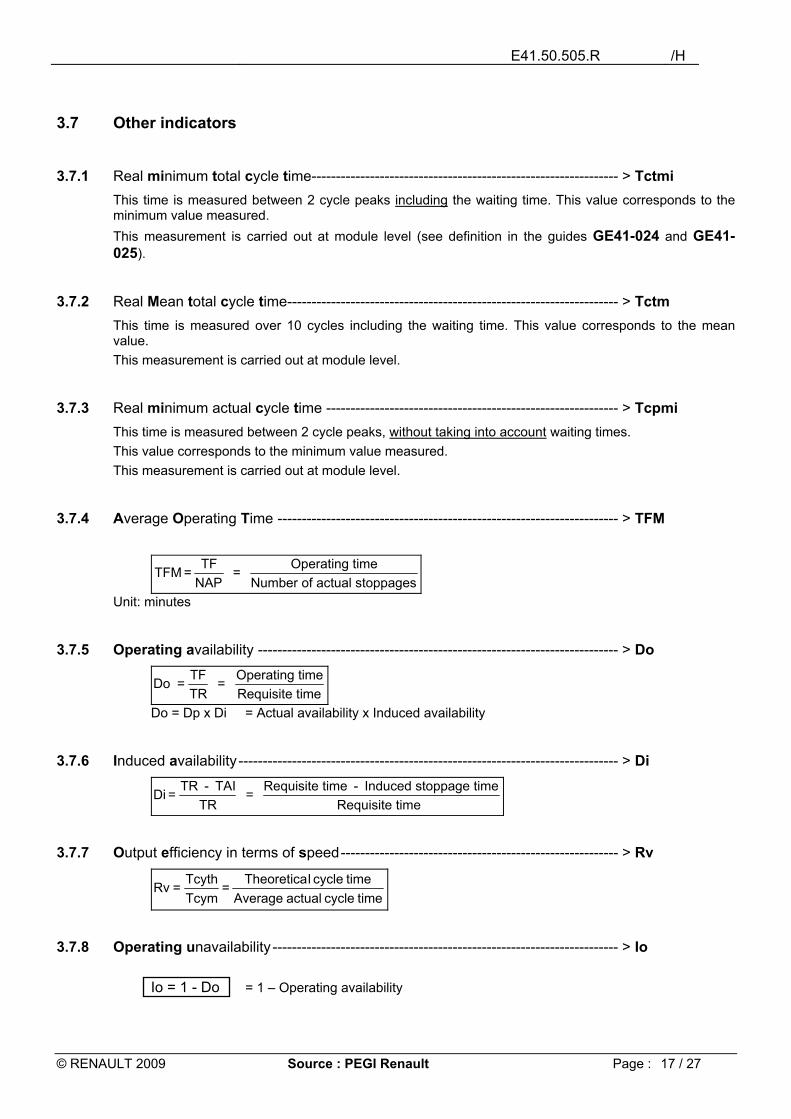
3.7 Other indicators
3.7.1 Real minimum total cycle time--------------------------------------------------------------- > Tctmi This time is measured between 2 cycle peaks including the waiting time. This value corresponds to the minimum value measured. This measurement is carried out at module level (see definition in the guides GE41-024 and GE41-025).
3.7.2 Real Mean total cycle time-------------------------------------------------------------------- > Tctm This time is measured over 10 cycles including the waiting time. This value corresponds to the mean value. This measurement is carried out at module level.
3.7.3 Real minimum actual cycle time ------------------------------------------------------------ > Tcpmi This time is measured between 2 cycle peaks, without taking into account waiting times. This value corresponds to the minimum value measured. This measurement is carried out at module level.
3.7.4 Average Operating Time ---------------------------------------------------------------------- > TFM
TFM = TFNAP
= Operating timeNumber of actual stoppages
Unit: minutes
3.7.5 Operating availability -------------------------------------------------------------------------- > Do
Do = TFTR
= Operating timeRequisite time
Do = Dp x Di = Actual availability x Induced availability
3.7.6 Induced availability ------------------------------------------------------------------------------ > Di
Di = TR - TAITR
= Requisite time - Induced stoppage timeRequisite time
3.7.7 Output efficiency in terms of speed--------------------------------------------------------- > Rv
time cycle actual Averagetime cycle lTheoretica =
TcymTcyth= Rv
3.7.8 Operating unavailability ----------------------------------------------------------------------- > Io
Io = 1 - Do = 1 – Operating availability
E41.50.505.R /H
© RENAULT 2009 Source : PEGI Renault Page : 18 / 27
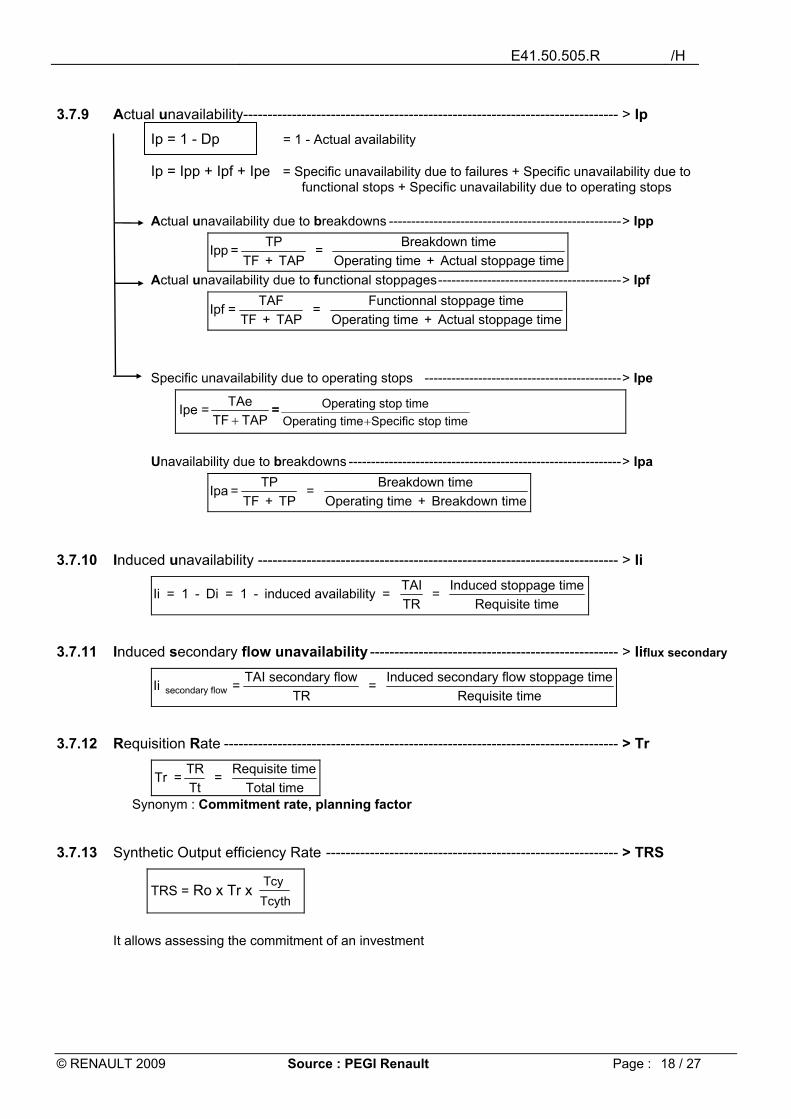
3.7.9 Actual unavailability----------------------------------------------------------------------------- > Ip Ip = 1 - Dp = 1 - Actual availability Ip = Ipp + Ipf + Ipe = Specific unavailability due to failures + Specific unavailability due to
functional stops + Specific unavailability due to operating stops
Actual unavailability due to breakdowns ----------------------------------------------------> Ipp
Ipp = TPTF + TAP
= Breakdown timeOperating time + Actual stoppage time
Actual unavailability due to functional stoppages-----------------------------------------> Ipf
Ipf = TAFTF + TAP
= Functionnal stoppage timeOperating time + Actual stoppage time
Specific unavailability due to operating stops --------------------------------------------> Ipe
Ipe =TAPTF
TAe+
=time stopSpecific time Operating
time stop Operating+
Unavailability due to breakdowns -------------------------------------------------------------> Ipa
Ipa = TPTF + TP
= Breakdown timeOperating time + Breakdown time
3.7.10 Induced unavailability -------------------------------------------------------------------------- > Ii
Ii = 1 - Di = 1 - induced availability = TAITR
= Induced stoppage timeRequisite time
3.7.11 Induced secondary flow unavailability --------------------------------------------------- > Iiflux secondary
Ii = TAI secondary flowTR
= Induced secondary flow stoppage timeRequisite timesecondary flow
3.7.12 Requisition Rate --------------------------------------------------------------------------------- > Tr
Tr = TRTt
= Requisite timeTotal time
Synonym : Commitment rate, planning factor
3.7.13 Synthetic Output efficiency Rate ------------------------------------------------------------ > TRS
TRS = Ro x Tr x Tcyth
cyT
It allows assessing the commitment of an investment
E41.50.505.R /H
© RENAULT 2009 Source : PEGI Renault Page : 19 / 27
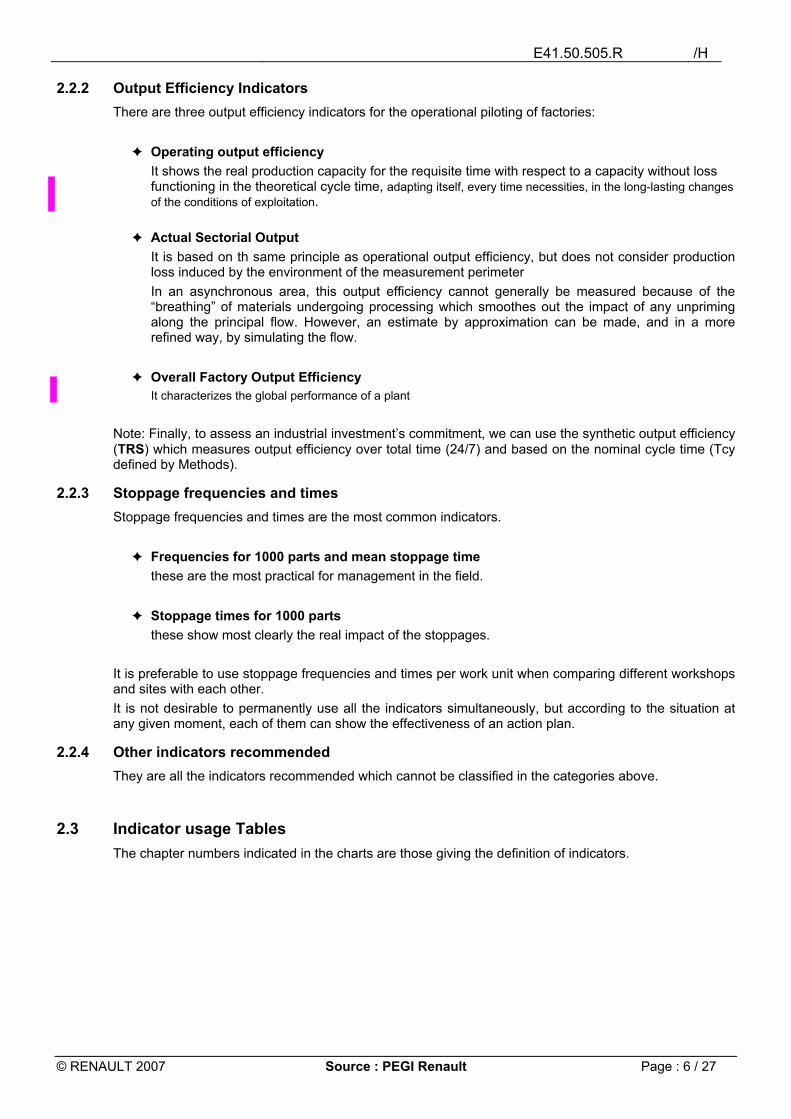
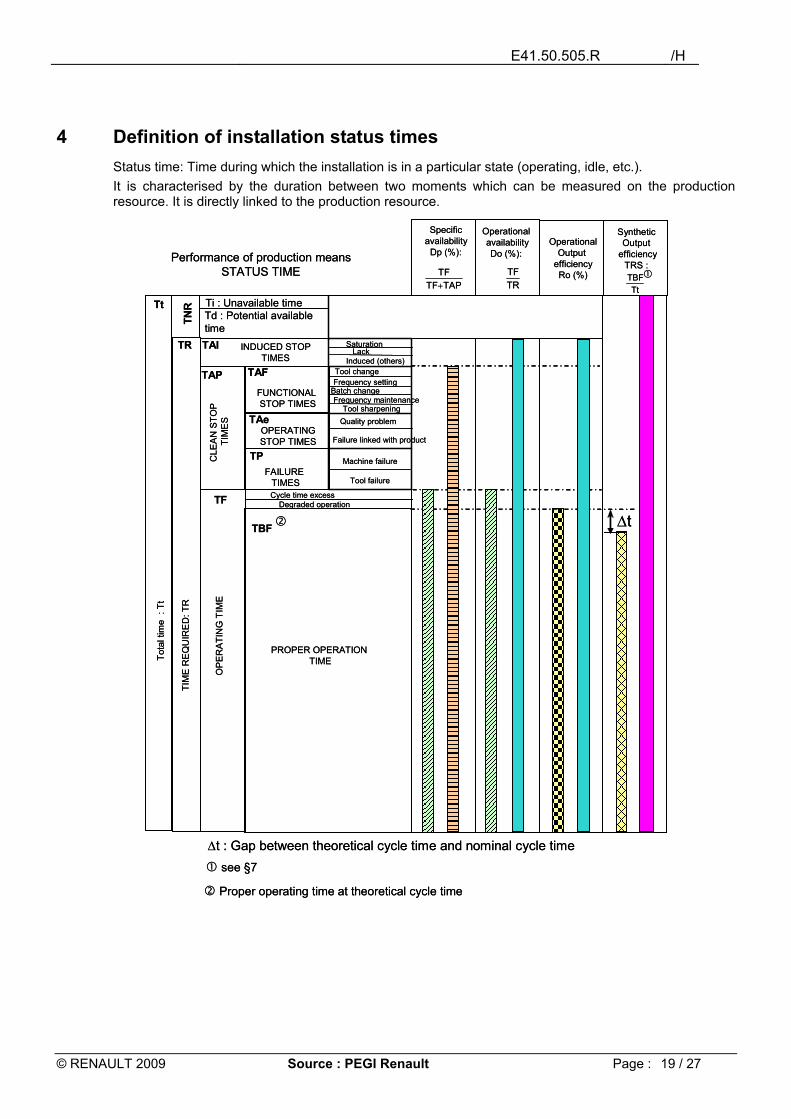
4 Definition of installation status times Status time: Time during which the installation is in a particular state (operating, idle, etc.). It is characterised by the duration between two moments which can be measured on the production resource. It is directly linked to the production resource.
Performance of production meansSTATUS TIME
Specific availability
Dp (%):
Operational availabilityDo (%):
OperationalOutput
efficiencyRo (%)
PROPER OPERATION TIME
OP
ER
ATI
NG
TIM
E
TIM
E R
EQ
UIR
ED
:TR
CLE
AN
STO
P TI
ME
S
INDUCED STOP TIMES
FUNCTIONAL STOP TIMES
OPERATINGSTOP TIMES
FAILURE TIMES
TAITR
TAP TAF
TAe
TP
TBF
TF Cycle time excessDegraded operation
SaturationLack
Frequency settingTool change
Induced (others)
Batch changeFrequency maintenance
Tool sharpening
Failure linked with product
Machine failure
Quality problem
Tool failure
Tota
l tim
e: T
t
Tt
TNR
Synthetic Output
efficiencyTRS :
∆t
∆t : Gap between theoretical cycle time and nominal cycle time
TAPTFTF+ TR
TF
TtTBF
see §7
Proper operating time at theoretical cycle time
Ti : Unavailable timeTd : Potential available time

E41.50.505.R /H
© RENAULT 2009 Source : PEGI Renault Page : 20 / 27
4.1 Total time ---------------------------------------------------------------------------------> Tt Reference time incorporating all the statuses possible for the installation (for a day: 24 hours, for a week: 168 hours, etc.).
4.2 Requisite Time --------------------------------------------------------------------------> TR Time committed to by the user for his means to produce at Theoretical cycle time (Tcyth). This translates into using Technical and Human means.
4.3 Non-Requisite Time > TNR Time added to the requisite time in relation to the total time: time during which the user does not have the intention to produce.
4.3.1 Potential available time --------------------------------------------------------- > Td Part of the non-requisite time during which the operator could use his production resource to produce. This is the complement of unavailability time / TNR.
4.3.2 Unavailable time------------------------------------------------------------------ > Ti Part of non-requisite time during which the operator could not produce because of constraints necessitating resource stoppage (cleaning, maintenance,..)
4.4 Operating Time--------------------------------------------------------------------------> TF Period of time during which the production resource produces parts (accepted or rejected), with or without due regard for the cycle time and with all or a part of its functions operating.
4.4.1 Correct Operating Time -------------------------------------------------------- > TBF
Period of time during which the production resource produces correctly manufactured parts within the reference cycle time and with all its functions operating.
4.4.2 Cycle time overshoot----------------------------------------------------------- > TDTC Overshoot of the reference cycle time less than a parameterable threshold which does not cause resource stoppage.
4.4.3 Defective Operating Time----------------------------------------------------- > TFD Period of time during which the resource:
- is operating defectively with at least one function out of order and at least one function working.
or - produces incorrectly manufactured parts
Example of a function out of order: A paint-spraying machine, one cup of which is out of action. It is nevertheless considered to be operating, and is taken into account when the indicators are interpreted.
E41.50.505.R /H
© RENAULT 2009 Source : PEGI Renault Page : 21 / 27
4.5 Actual Stoppage Time-----------------------------------------------------------------> TAP Stoppage time of which the cause is internal to the area of measure. The cause of this type of stoppage can be attributed to the production resource, its tooling, the component product, to a functional cause or operation of the resource.. Any fault for which the duration is less than a parameterable threshold will be considered as Operating Time.
4.5.1 Breakdown Time ---------------------------------------------------------------- > TP Time within actual stoppage time due to a malfunction of the installation. The cause of this stoppage can be assigned to a breakdown linked to the resource, to its tooling.
4.5.2 Operating Stoppage Time ---------------------------------------------------- > TAe Period of time within the actual stoppage time caused by the operator or the input product. This is the case with interruptions, which can have a large number of causes:
- bad hygiene, - problem of quality,... - accidental cutting of a unit,
4.5.3 Functional Stoppage Time---------------------------------------------------- > TAF Period of time within the actual stoppage time due to a functional cause. This is the programmed part of the actual stoppage time which includes the time allowed for:
- changing tools, - adjusting frequencies, - change of operating sequence, - inspecting the production resource or the manufactured product, - periodically scheduled maintenance (self-maintenance).
Part of the actual stoppage time necessary carrying out periodically scheduled maintenance of the production resource. First and foremost, this heading encompasses the time allowed for cleaning, removing chips, various inspections (temperature, pressure), calibration.
Programmed maintenance (Systematic visits, systematic preventive, programmed work) The conditions taken into account will be specified in the next update of this standard
E41.50.505.R /H
© RENAULT 2009 Source : PEGI Renault Page : 22 / 27
4.6 Induced Stoppage Time---------------------------------------------------------------> TAI Period of time during which the production resource cannot accomplish its function due to external causes. Examples:
Lack of spare parts or de-energisation, Saturation of parts, Shortage of personnel, Lack of external resources, Power fault.
4.6.1 Stoppage Time Induced by Saturation ---------------------------------- > TAIs Production resource stoppage time due to a cause coming from outside the perimeter of the production resource, on the downstream part of the production resource considered in the direction of flow.
4.6.2 Stoppage Time Induced by Lack of parts or De-energisation ----- > TAIm Production resource stoppage time due to a cause coming from outside the perimeter of the production resource, on the upstream part of the production resource considered in the direction of flow.
4.6.3 Stoppage Time Induced by other causes------------------------------- > TAIa Production resource stoppage time due to a cause coming from outside the perimeter of the production resource, which can be: a lack of secondary flow provisioning
The secondary flow can be: ☞ a provisioning of parts carried out manually by an operator or by automatic means ☞ the product-process added value of one or more operators
a lack of external resources (fluids, pallet, support, etc.)
4.7 Flow Rupture
4.7.1 Saturation Flow Rupture ------------------------------------------------------ > RFS Saturation Flow Rupture (RFS) allows counting over the main flow the time during which the means was saturated beyond theoretical cycle time (Tcyth). The RFS time is not a status time.
4.7.2 Unpriming Flow Rupture ------------------------------------------------------ > RFD
Unpriming Flow Rupture allows counting, over the main flow, the time the means was in unpriming beyond theoretical cycle time (Tcyth ). The RFD time is not a status time.
Note: Standard EB03.05.010 (§2.3 and appendix 1) specifies the management rules of flow
ruptures in monitoring the means.
4.8 Filling – Emptying These operating modes (Filling and emptying) are described in standard EB03.05.010 (Appendix 1). Rating in status times (Functional stops, induced,…) is specificed upon implementing monitoring of the means (Base of profession stop cause)

E41.50.505.R /H
© RENAULT 2009 Source : PEGI Renault Page : 23 / 27
5 Other notions
These periods of time are not installation status times.
5.1 Opening time ----------------------------------------------------------------------------> To Period of time during which the operating personnel are present. For example, over a period of 24 hours, for an installation performing non-stop for two 8-hour shifts, this is the period of time between the arrival of the morning shift and the departure of the evening shift.
5.2 Free time----------------------------------------------------------------------------------> Tl Time added to the opening time in relation to the total time. Free time = Tt - To
6 Cycle time
6.1 Repetitive Excess Time of theoretical cycle --------------------------------->TDRTcyth Repetitive excess time of the theoretical cycle time: gap between average actual cycle measured in the field and the theoretical cycle time.
Repetitive excess time of theoretical cycle time = Tcym – Tcyth
6.2 Actual cycle time ------------------------------------------------------------------------->Tcyr
This cycle time corresponds to an effective measurement of the cycle time on the operating machine, by timing over several consecutive cycles (e.g. 10 cycles) without clean stop, part wait, nor saturation of the production means.
7 Relationships between the indicators
Clean stop frequency for failure for 1000 parts ------------------------------------- > Fppm
Fppm = TFMIP
Tcyth X 1000 = failures between time operating Average
time cycle l Theoretica X 1000
Operating Productivity(Po) - Actual Productivity(Pp)----------------------------------- > Po and Pp
time cycle actual Averagetyavailabili lOperationa =
TcymDo= Po
Unit: parts / unit of time.
time cycle actual Averagetyavailabili Actual =
TcymDp= Pp
Unit: parts / unit of time. Remark: These relationships are only valid if the Po, Pp and Tcm units are homogeneous. Remark: When the time unit is : 1 hour : Po = Cho Pp = Chp
E41.50.505.R /H
© RENAULT 2009 Source : PEGI Renault Page : 24 / 27
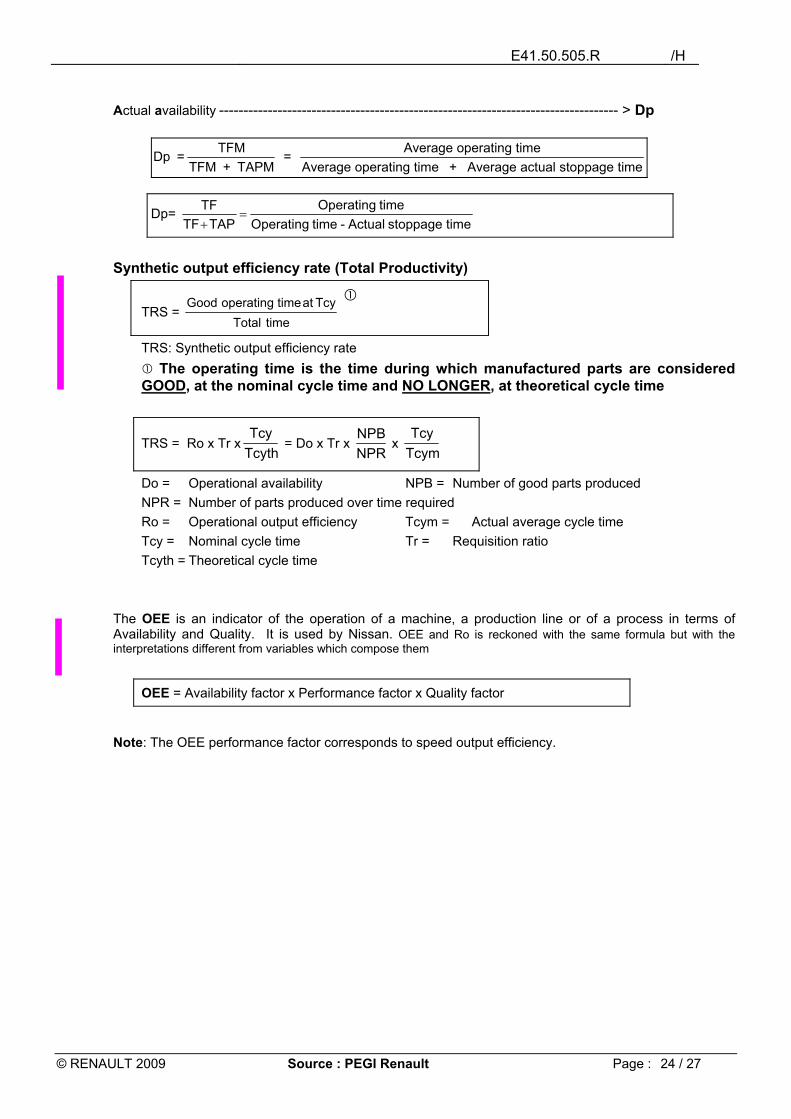
Actual availability ---------------------------------------------------------------------------------- > Dp
Dp = TFMTFM + TAPM
= Average operating timeAverage operating time + Average actual stoppage time
Dp= time stoppage Actual- time Operating
time Operating TAPTF
TF=
+
Synthetic output efficiency rate (Total Productivity)
TRS = time Total
Tcy at time operating Good
TRS: Synthetic output efficiency rate The operating time is the time during which manufactured parts are considered
GOOD, at the nominal cycle time and NO LONGER, at theoretical cycle time
TRS = Ro x Tr xTcythTcy
= Do x Tr x NPRNPB
x TcymTcy
Do = Operational availability NPB = Number of good parts produced NPR = Number of parts produced over time required Ro = Operational output efficiency Tcym = Actual average cycle time Tcy = Nominal cycle time Tr = Requisition ratio Tcyth = Theoretical cycle time
The OEE is an indicator of the operation of a machine, a production line or of a process in terms of Availability and Quality. It is used by Nissan. OEE and Ro is reckoned with the same formula but with the interpretations different from variables which compose them
OEE = Availability factor x Performance factor x Quality factor
Note: The OEE performance factor corresponds to speed output efficiency.

E41.50.505.R /H
© RENAULT 2009 Source : PEGI Renault Page : 25 / 27
8 Cycle time measurement in monitoring systems
PRINCIPLE The time unit used is the TENTH OF A SECOND, but in numerous cases the 1/100th minute is used. This function is independent of all the other functions.
The cycle time counters are used to monitor, at module level
the actual cycle time = time between 2 cycle peaks – the waits, the total cycle time = time between 2 cycle peaks.
Note: the module can be a work station, i.e. a table module with which is associated 1 or n robots working on this table.
At each cycle end, the API enters in the exchange block the 2 cycle times which he has just measured as well as the type code of the part produced, and resets the corresponding counters in the exchange block.
Steps
1. Take note of the cycle number supplied by the API and check for previous measurements for this cycle. Bring back previous measurements if they exist.
2. Calculate the average of the “N” previous values (N being an installation parameter). 3. Save for the current workstation:
+ the smallest measurement + the largest measurement + the best mean
4. All the counters are archived by WORKSTATION for a duration of “N” days (in general, two rolling weeks). They can be consulted by workstation, preferably thanks to means monitoring.
9 List of documents quoted NOTE : For undated documents, the latest version in force applies EN 15341 : Maintenance - Maintenance Key Performance Indicators X 60-500 : Terminology relating to Reliability - Maintainability – Availability EB03.05.010 : Implementation of means monitoring and supervision in automatons GE41-024 : Definition of the perimeters of follow-up of the performances of the means of
production GE41-025 : Rules of choice of indicators associated to the perimeters of follow-up of the
performances of the means of production

E41.50.505.R /H Appendix 1 Normative
© RENAULT 2009 Source : PEGI Renault Page : 26 / 27
Appendix 1: Lexicon of abbreviations Acronym Wording Chapter /Page
BDR Breakdown rate 3.6.3 p16Cadence Top5 Stamping profession specific rate 3.2.3 p11Cho Hourly capacity operational 3.1.3 p9 Chp Hourly capacity actual 3.1.2 p9 Cpp Product process rate 3.2.3 p11Di Induced availability 3.7.6 p17Do Operating availability 3.7.5 p17Dp Actual availability 3.3.1 p12
7 p24Dpa Availability for breakdown 3.3.2 p12Fepm Actual operating stoppage frequency per 1000 parts 3.4.7 p14Ffpm Actual functional stoppage frequency per 1,000 parts 3.4.5 p13Fmd Frequency of degraded working 3.6.4 p16Fpm Actual stoppage frequency per 1,000 parts 3.4.1 p13Fppm Actual stoppage frequency for breakdown per 1,000 parts 3.4.3 p13
7 P23Ii Induced unavailability 3.7.10 p18Ii flux secondary Induced secondary flow unavailability 3.7.11 p18Io Operating unavailability 3.7.8 p17Ip Actual unavailability 3.7.9 p18Ipa Actual Unavailability due to breakdowns 3.7.9 p18Ipe Specific unavailability to operating stoppages 3.7.9 p18Ipf Actual unavailability due to functional stoppages 3.7.9 p18Ipp Actual unavailability due to breakdowns 3.7.9 p18MTBF Mean time between failure 3.6.2 p16MTTR Mean time to repair 3.5.4 p14NAe Number of operating stoppages 3.4.7 p14NAe /UO Number of operating stoppages per work unit 3.4.8 p14NAF Number of Functional Stoppages 3.4.5 p13NAF /UO Number of functional stoppages per work unit 3.4.6 p13NAP Number of Actual Stoppages 3.4.1 p13NAP / UO Number of Actual stoppages per work unit 3.4.2 p13Nmd Number of defective operating runs 3.6.4 p15NP Number of Breakdowns 3.4.3 p13NP / UO Number of breakdowns per work unit 3.4.4 p13NPB Number of Acceptable Parts Produced 3.1.4 p9
3.2.4 p11NPR Number of Parts Produced during Requisite Time 3.1.4 p9 NPTR Number of Parts which can be Produced in Theory 3.2.1 p10
3.2.3 p11
NV Number of finished vehicles is the Number of finished vehicles realized in TCM, good or with quality defects, complete or incomplete during the requisite time
3.2.2 p10
NVTR Number of in theory practicable Vehicles 3.2.2 p10OEE Overall equipment efficiency 7 p24pf Planning factor 3.7.12 p18
7 p24Po Operating productivity 7 p23Pp Actual productivity 7 p21RFD Flow rupture unpriming 4.7.2 p22RFS Flow rupture saturation 4.7.1 p22RGU Overall Factory Output Efficiency 3.2.2 p10Ro Operating output efficiency 3.2.1 p10Ro Operational output efficiency for stamping lines 3.2.3 p11RPE Actual output efficiency for pressing 3.2.4.1 p11RPM Actual Assembly Output Efficiency 3.2.4.4 p12RPP Actual output efficiency for painting 3.2.4.3 p12RPS Actual output efficiency sectorial 3.2.4 p11

E41.50.505.R /H Appendix 1 Normative
© RENAULT 2009 Source : PEGI Renault Page : 27 / 27
Acronym Wording Chapter /PageRPT Actual output efficiency for panelwork 3.2.4.2 p12Rv Output efficiency in terms of speed 3.7.7 p17
See TR Commitment rate 3.7.12 p18TAe Operating Stoppage Time 4.5.2 p21TAe /UO Operating Stoppage time per work unit 3.5.12 p15TAepm Operating Stoppage time per 1,000 parts 3.5.11 p15TAF Functional Stoppage Time 4.5.3 p21TAF / UO Functional Stoppage time per work unit 3.5.9 p15TAFpm Functional Stoppage Time per 1,000 parts 3.5.8 p15TAI Induced Stoppage Time 4.6 p22TAI flux secondary Induced Stoppage Time for secondary flow 3.7.11 p18TAIa Stoppage Time Induced by other causes 4.6.3 p22TAIs Induced Stoppage Time caused by saturation 4.6.1 p22TAIm Stoppage Time Induced by lack of part or De-energisation 4.6.2 p22TAP Actual Stoppage Time 4.5 p21TAPM Average Actual Stoppage Time 3.5.1 p14
See TP Actual Stoppage Time for breakdown 3.5.4 P14TAPpm Actual Stoppage Time for 1,000 parts 3.5.2 p14TAP /UO Actual Stoppage Time for work unit 3.5.3 p14TBF Correct Operating Time 4.4.1 p20Tcpmi Real minimum actual cycle time 3.7.3 p17Tctm Real mean total cycle time 3.7.2 p17Tctmi Real minimum total cycle time 3.7.1 p17Tcy Nominal cycle time 3.1.5 p9 Tcym Actual average cycle time 3.6.1 p16Tcyr Actual cycle time 6.2 p23Tcyth Theoretical cycle time 3.1.6 p9 Td Potential available time 4.3.1 p20TDRT cyth- Repetitive excess time of theoretical time 6.1 p23TDTC Cycle time overshoot 4.4.2 p20TF Operating Time 4.4 p20TFD Defective Operating Time 4.4.3 p20TFM Average Operating Time 3.7.4 p17TFMIP Average Operating Time Between Breakdowns 3.6.2 p16Ti Time unavailable 4.3.2 p20Tl Time free 5.2 p23TMAe Average operating stoppage time 3.5.10 p15TMAF Average Functional Stoppage Time 3.5.7 p15TMP Average Breakdown Time 3.5.4 p14TNR Non- Requisite Time 4.3 p20To Opening time 5.1 p23TOP5 / TOP10 3.2.3 p11TP Breakdown Time (or actual breakdown stoppage time) 3.5.4 p14
4.5.1 p21TP / UO Breakdown time per work unit 3.5.6 p15TPpm Breakdown Time for 1,000 parts 3.5.5 p15Tq Quality rate 3.1.4 p9 TR Requisite Time 3.1.1 p9
3.2.3 p114.2 p20
Tr Requisition rate 3.7.12 p18TRS Artificial output efficiency rate 3.7.13 p18
7 p24Tt Total time 4.1 p20Txmd Defective operating run rate 3.6.5 p16
- Total productivity 7 p24UO Work unit 3 p9