engineering tradeoff studies - infohouseinfohouse.p2ric.org/ref/16/15341.pdf · 2.2 overview of...
TRANSCRIPT

LIFE
CYCLE
ASSET
M ANAGEMENT
Good Practice GuideGPG-FM-003
Engineering Tradeoff Studies
March 1996
Department of EnergyOffice of Field Management
Office of Project and Fixed Asset Management

Contents GPG-FM-003
March 1996 iii
1. INTRODUCTION . . . . . . . . . . . . . . . . . . . . . . . . . . . . . . . . . . . . . . . . . . . . . . . . . . . . . . . 1
2. PRINCIPLES AND PROCESSES . . . . . . . . . . . . . . . . . . . . . . . . . . . . . . . . . . . . . . . . . . 32.1 Review of Alternative Development Process. . . . . . . . . . . . . . . . . . . . . . . . . . . . . . . . 42.2 Overview of Engineering Tradeoff Study Method. . . . . . . . . . . . . . . . . . . . . . . . . . . . 6
2.2.1 Identify Viable Alternatives. . . . . . . . . . . . . . . . . . . . . . . . . . . . . . . . . . . . . . . 62.2.2 Define Goals, Objectives, and Values. . . . . . . . . . . . . . . . . . . . . . . . . . . . . . . 72.2.3 Formulate Decision Criteria. . . . . . . . . . . . . . . . . . . . . . . . . . . . . . . . . . . . . . . 72.2.4 Assign Weight Factors to Decision Criteria. . . . . . . . . . . . . . . . . . . . . . . . . . . 82.2.5 Prepare Utility Functions. . . . . . . . . . . . . . . . . . . . . . . . . . . . . . . . . . . . . . . . . 82.2.6 Evaluate Alternatives. . . . . . . . . . . . . . . . . . . . . . . . . . . . . . . . . . . . . . . . . . . . 92.2.7 Perform Sensitivity Check. . . . . . . . . . . . . . . . . . . . . . . . . . . . . . . . . . . . . . . 102.2.8 Select Preferred Alternative. . . . . . . . . . . . . . . . . . . . . . . . . . . . . . . . . . . . . . 112.2.9 Document Results. . . . . . . . . . . . . . . . . . . . . . . . . . . . . . . . . . . . . . . . . . . . . 112.2.10 Risk Considerations in Tradeoff Studies. . . . . . . . . . . . . . . . . . . . . . . . . . . . 12
2.3 Planning and the Project Life Cycle. . . . . . . . . . . . . . . . . . . . . . . . . . . . . . . . . . . . . . 132.3.1 Planning Considerations. . . . . . . . . . . . . . . . . . . . . . . . . . . . . . . . . . . . . . . . 13
2.3.1.1 Planning Approaches. . . . . . . . . . . . . . . . . . . . . . . . . . . . . . . . . . . . 142.3.1.2 Procedures to be Included. . . . . . . . . . . . . . . . . . . . . . . . . . . . . . . . 142.3.1.3 Planning Documentation. . . . . . . . . . . . . . . . . . . . . . . . . . . . . . . . . 14
2.3.2 Preconceptual Activities. . . . . . . . . . . . . . . . . . . . . . . . . . . . . . . . . . . . . . . . 152.3.3 Conceptual Phase. . . . . . . . . . . . . . . . . . . . . . . . . . . . . . . . . . . . . . . . . . . . . 152.3.4 Execution Phase. . . . . . . . . . . . . . . . . . . . . . . . . . . . . . . . . . . . . . . . . . . . . . 16
2.4 Change Control. . . . . . . . . . . . . . . . . . . . . . . . . . . . . . . . . . . . . . . . . . . . . . . . . . . . . 172.5 Analysis and Modeling Considerations. . . . . . . . . . . . . . . . . . . . . . . . . . . . . . . . . . . . 17
2.5.1 Life Cycle Cost Analyses. . . . . . . . . . . . . . . . . . . . . . . . . . . . . . . . . . . . . . . . 172.5.2 End Product(s) Effectiveness and Cost Effectiveness Analyses. . . . . . . . . . . 182.5.3 Environmental Analyses. . . . . . . . . . . . . . . . . . . . . . . . . . . . . . . . . . . . . . . . 182.5.4 Risk Analysis. . . . . . . . . . . . . . . . . . . . . . . . . . . . . . . . . . . . . . . . . . . . . . . . . 192.5.5 Types of Analysis and Modeling Techniques. . . . . . . . . . . . . . . . . . . . . . . . . 19
2.5.1.1 Economic Analysis. . . . . . . . . . . . . . . . . . . . . . . . . . . . . . . . . . . . . 192.5.5.2 Mathematical Modeling and Optimization. . . . . . . . . . . . . . . . . . . . 212.5.5.3 Probability and Statistical Models. . . . . . . . . . . . . . . . . . . . . . . . . . 222.5.5.4 Monte Carlo Analysis. . . . . . . . . . . . . . . . . . . . . . . . . . . . . . . . . . . 232.5.5.5 Queuing Theory and Analysis. . . . . . . . . . . . . . . . . . . . . . . . . . . . . 232.5.5.6 Control Concepts and Techniques. . . . . . . . . . . . . . . . . . . . . . . . . . 232.5.5.7 Heuristic Method. . . . . . . . . . . . . . . . . . . . . . . . . . . . . . . . . . . . . . 24
3. GRADED APPROACH . . . . . . . . . . . . . . . . . . . . . . . . . . . . . . . . . . . . . . . . . . . . . . . . . 25
Contents GPG-FM-003
March 1996 iv
4. MEASURING RESULTS . . . . . . . . . . . . . . . . . . . . . . . . . . . . . . . . . . . . . . . . . . . . . . . . 27
5. SUGGESTED READING . . . . . . . . . . . . . . . . . . . . . . . . . . . . . . . . . . . . . . . . . . . . . . . . 29
6. ASSISTANCE . . . . . . . . . . . . . . . . . . . . . . . . . . . . . . . . . . . . . . . . . . . . . . . . . . . . . . . . . 31
Table 1. Tradeoff Study Roles in the Project Life Cycle. . . . . . . . . . . . . . . . . . . . . . . . . . . . . 33Table 2. Example Weighted Summary. . . . . . . . . . . . . . . . . . . . . . . . . . . . . . . . . . . . . . . . . . . 34Table 3. Extreme Case Changes in Raw Scores. . . . . . . . . . . . . . . . . . . . . . . . . . . . . . . . . . . . 35
Figure 1. Tradeoff Study Steps. . . . . . . . . . . . . . . . . . . . . . . . . . . . . . . . . . . . . . . . . . . . . . . . 37Figure 2. Example Utility Function for Life Cycle Cost. . . . . . . . . . . . . . . . . . . . . . . . . . . . . . 38Figure 3. Tradeoff Study Activities by Phase. . . . . . . . . . . . . . . . . . . . . . . . . . . . . . . . . . . . . . 39Figure 4. Tradeoff Study Tree Example. . . . . . . . . . . . . . . . . . . . . . . . . . . . . . . . . . . . . . . . . 40
Attachment A - Further Reading. . . . . . . . . . . . . . . . . . . . . . . . . . . . . . . . . . . . . . . . . . . . . . . 41
Introduction GPG-FM-003
In addition, note that Value Engineering (VE) is by nature a tradeoff methodology and may1
be used in many cases to make selections. See the Value Engineering Guide, GPG-FM-011.
March 1996 1
1. INTRODUCTION
Engineering tradeoff studies should be performed to select from two or more options anytime during the program or project life cycle. Simple projects may need only simpletradeoff studies, which can be conducted at low cost; however, complex projects mayrequire complex tradeoff studies, which can consume a large portion of the engineeringdevelopment time and budget. Such complex tradeoff studies require careful planning andimplementation. Tradeoff study planning should use a graded approach to ensure cost-effective implementation. (See section 3.) Tradeoff studies are a systematic approach tosupport management. Such a systematic management approach should be based on theassimilation, correlation, and/or distillation, of available information in a timely manner, sothat responsible staff, including program and project management, can integrateinformation to make effective decisions.
Tradeoff studies are part of the larger systems engineering process, which consists ofseven steps: mission analysis, functions definition, requirements identification,architecture development, alternative identification, engineering tradeoff studies based onprepared decision criteria, and test and evaluation.1
The primary users of this Guide are Department of Energy (DOE) Headquarters and FieldElement managers and their staffs and contractors performing project activities for DOE. DOE project managers should either assume or assign the responsibilities and authoritiesfor implementing the tradeoff study process. When DOE prime contractor(s) willcomplete the project or project activities, DOE project managers and contracting officersshould consider incorporating the principles and processes in this Guide into contractstatements of work. If multiple contractors provide direct support on the project, theDOE project manager should coordinate their tradeoff study efforts. This arrangementmay require DOE to evaluate end product(s) from the contractors and verify them againstend product(s) requirements to determine if the principles in this Guide have beenintegrated into the project satisfactorily.
This Guide is one of several guides for implementing DOE O 430.1, LIFE-CYCLEASSET MANAGEMENT. (See Guide to the Guides, GPG-FM-000, for a synopsis ofthe information in each Guide.) DOE O 430.1 provides requirements for the DOE, inpartnership with its contractors, to plan, acquire, operate, maintain, and dispose of
Introduction GPG-FM-003
March 1996 2
physical assets. Requirements within the Order focus on "what must be done" and not on"how it must be done."
The next section of this Guide, Principles and Processes, consists of five major parts,which together form a practical Guide to the use of tradeoff studies.
C Section 2.1, Review of Alternative Development Process, summarizes informationfrom the Project Execution and Engineering Management Planning (PEAEMP)Guide, GPG-FM-010, dealing with steps in the systems engineering process. Thissection explains how tradeoff studies fit into this larger process.
C Section 2.2, Overview of the Engineering Tradeoff Method, outlines the varioussteps in the complex tradeoff method process, using selection of a projectarchitecture as an example of its application.
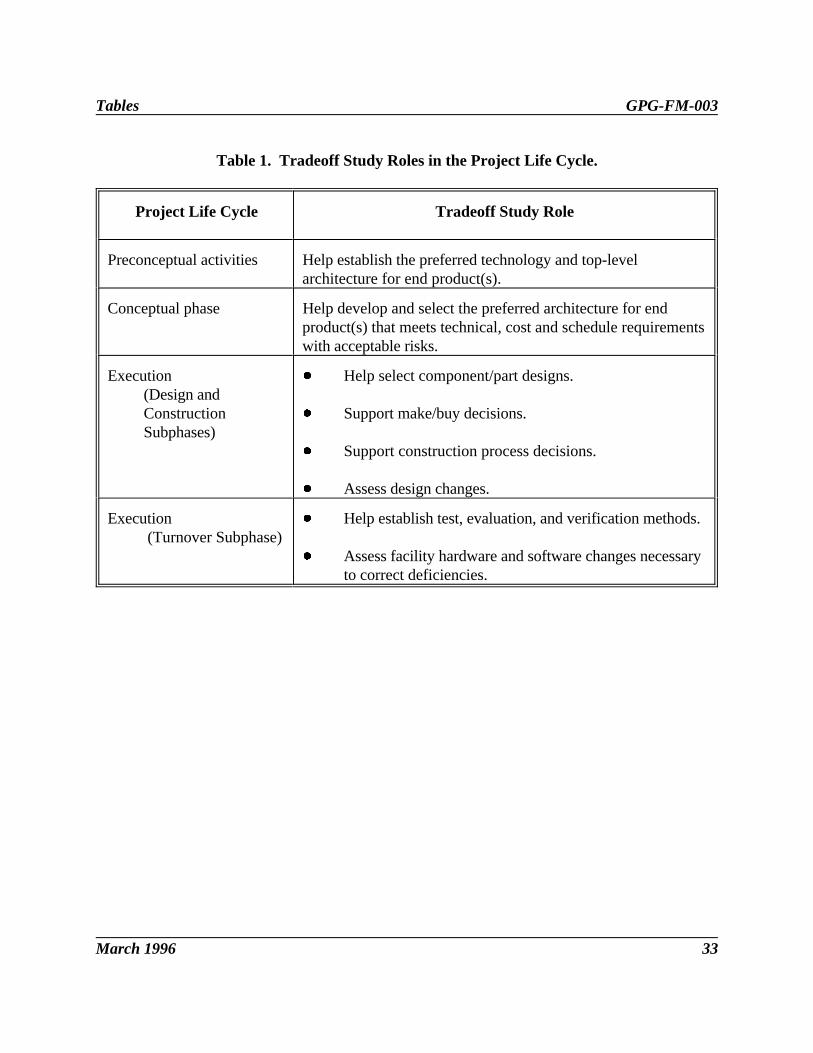
C Section 2.3, Planning and the Project Life-Cycle, explains how tradeoff studiesevolve throughout the project. (See Table 1.) Engineering tradeoff studies may beuseful throughout the project life cycle and can be essential in supportingengineering management's decision process. Several years can separate the variousproject phases; tradeoff studies should therefore use a configuration managementprocess to ensure change control and to archive decisions and the rationale forthose decisions, including risk management considerations. (See Risk Analysis andManagement Guide, GPG-FM-007.)
C Section 2.4, Change Control, explains how tradeoff studies and the changes theyeffect are controlled and integrated into the project.
C Section 2.5, Analysis and Modeling Considerations, explains some techniques usedto develop decision criteria, which are the cornerstone of the tradeoff study.
Principles and Processes GPG-FM-003
As defined in the PEAEMP Guide (GPG-FM-010), the term "end product(s)" is synonymous2
with "unique product, facility, system, or environmental condition." It is also synonymous with"structures, systems, and components" as used in contemporary configuration managementliterature.
March 1996 3
2. PRINCIPLES AND PROCESSES
For the purposes of this Guide, three general categories of tradeoff study are identified.
C A mental tradeoff study is a simple process of selection among options where oneoption is clearly better based on sound engineering judgment; a mental tradeoffstudy requires no formal analysis. Mental tradeoff studies should be reserved forselections that management has determined will have little or no risk to cost andschedule of the end product(s).2
C An informal tradeoff study follows the methodology of a formal tradeoff study butis not documented as formally. This type of tradeoff study is reserved for optionsthat pose medium to little risk to cost and schedule.
C A formal tradeoff study follows a structured and systematic approach forcomparison of options/alternatives via formal analysis. Formal tradeoff studiesshould be based on a focused set of critical parameters that pose medium to highrisk to cost and schedule.
Although tradeoff studies should be performed whenever the project manager must selectfrom two or more options, most tradeoff studies fall in the mental or informal category. Whatever category of tradeoff study is employed, all should, at least in principle, followthe formal tradeoff study process described in section 2.2 below. For the mental category,this method provides a disciplined approach in which sound engineering judgment issubstituted for detailed modeling and analysis. (Section 3 discusses informal tradeoffstudies.)
Formal tradeoff studies are generally conducted only when complex options confront theproject manager. It is up to the project manager to identify those tradeoff studies thatmust be formalized. One of the most complex uses of tradeoff studies is the evaluation ofalternative architectures and selection of the preferred architecture. (Architecture as usedin this Guide refers to the solutions or end product(s) that satisfy the requirements andmeet the functions of the project.) Therefore, selection of the preferred architecture is anexcellent example to use to explain the tradeoff study process in a meaningful context and
Principles and Processes GPG-FM-003
March 1996 4
in adequate detail. Accordingly, this Guide focuses on formal tradeoff studies used toselect a preferred project architecture. Bear in mind that selection of the preferredarchitecture is but one use of the tradeoff study.
2.1 Review of Alternative Development Process
As stated above, tradeoff studies are part of the larger systems engineering process. Thisprocess involves the iteration of a series of steps: mission analysis, functions definition,requirements identification, architecture development, alternative identification,engineering tradeoff studies based on prepared decision criteria, and test and evaluation. See the PEAEMP Guide, GPG-FM-010, which discusses this process in section 3.2.2,Systems Engineering Principles. This discussion is supported by a set of key definitions inPEAEMP Table 3.1.1 - 1. Selected parts of the PEAEMP Guide are repeated here asguidance for the use of formal tradeoff studies.
Generally, the starting point of the systems engineering process is development of the highlevel mission statement, followed by each of the listed steps. This process establishes thelevel-1 baseline. Another iteration of the same steps follows, performed at the next levelof detail, which may be based on logical allocation of the mission statement, functions,requirements, or architecture. The second iteration of the steps establishes the startingpoint for developing the level-2 baseline. The steps are then repeated at the next level ofdetail.
At each subsequent level, functions from the previous level are evaluated and subdivided(allocated) to identify all the sub-functions necessary and sufficient to accomplish theparent function (previous level). For example, the parent function, remediate waste, mightbe allocated to three sub-functions: retrieve waste, process waste, and store waste. Aftercompleting the functional analysis to a new level, the project manager evaluatesrequirements from the previous level, allocates them to sub-functions, and identifiesadditional requirements. The remaining steps of the systems engineering process are thenperformed before going to the next level.
Once the requirements and functions have been established, the next step is to search forviable alternatives to perform the functions and meet the requirements. The systemsengineering process places great emphasis on verification and quantitative data to showthat these alternatives, which may be very creative and innovative, are, in fact, viablemeans for performing the functions and do, in fact, meet the requirements. Selectionfrom among the viable alternatives should be based on predetermined criteria. Themission analysis should identify goals, objectives, and values that will help determine theselection criteria. In most cases, the criteria are obvious considerations like cost,
Principles and Processes GPG-FM-003
March 1996 5
schedule, and risk. During the selection process, less obvious criteria like organization orstakeholder values should be included.
Preferred alternatives resulting from the selection process become the technical baselinefor the project. Iterative refinement of this technical baseline will add details andeventually yield end product(s) that have been verified to ensure they are capable ofperforming the functions and meeting the requirements.
Where to stop the iteration is a key question. High-level mission statements (e.g., cleanup a site) usually stop with the identification of systems (e.g., a preprocessing plant or ahigh-level waste vitrification plant). Each system may then be handed off to anotherorganization, which repeats the system engineering process to identify the designrequirements for each system. The same basic steps are used over again.
Some general guides for stopping the iteration process include the following situations.
C A well bounded end product(s) is identified.
C There are no more practical functional allocations.
C End product(s) can be provided with existing technology.
C End product(s) is affordable.
C For the level of allocation, available information is sufficient to make the requireddecisions for the next set of activities (i.e., to continue to the next phase or stopproject work).
C The complexity and quantity of data has reached a point that one organizationcannot manage the information effectively. As a result, discrete systems areidentified, which may be worked by different organizations.
C An organization has allocated to a level at which it performs a make-buy analysis. A buy decision is made and the requirements are included in a contract.
Many opportunities exist for the use of tradeoff studies in arriving at the situations listedabove. Most of the time, engineering judgment and a mental tradeoff study are all that arenecessary. The project manager should consider the following conditions as the minimumin deciding if a formal tradeoff study is required.
Principles and Processes GPG-FM-003
March 1996 6
C A preferred architecture must be selected from various alternative architectures.
C A technology must be selected.
C Risk is a key factor for cost, schedule, or scope. (See Table 1.)
C Like elements of an allocation process must be combined to allow more effectivedevelopment.
C Combinations of the above.
2.2 Overview of Engineering Tradeoff Study Method
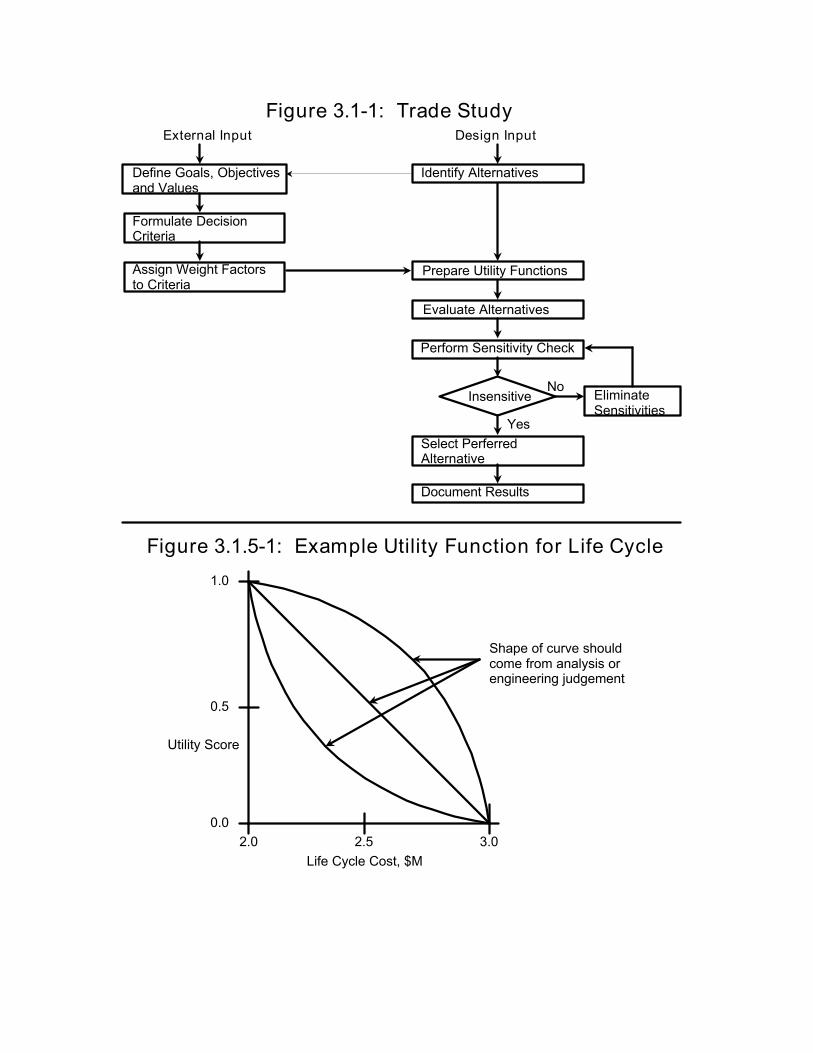
The engineering tradeoff study method provides a structured, analytical framework forevaluating alternative architectures, designs, component selections, and test approaches. Figure 1 shows one step-by-step method for approaching a tradeoff study. Each step isdiscussed in the following paragraphs. When performed to select the preferredarchitecture, this process assumes that functions and requirements are go/no-goconstraints. To qualify as an alternative, an architecture must perform all identifiedfunctions and meet all identified requirements.
2.2.1 Identify Viable Alternatives
Alternative architectures will be either predetermined (by initial design considerations orby DOE prescription) or developed specifically for the engineering tradeoff studies. Candidate architectures should represent the widest practical range of distinctly differentalternatives, screened to include only those that can perform satisfactorily. A secondscreening may be desirable on the basis of attainability and affordability. (That is, is thecandidate alternative achievable within time and budgetary constraints?)
Alternative architectures must be described in enough detail that the relative worth of eachcan be judged reliably and accurately. If an insufficient number of candidates survive thescreening process, the screening criteria can be liberalized or the system engineeringprocess repeated to generate additional, acceptable alternatives. An insufficient number ofalternatives may indicate that the lowest level of allocation has been reached and theprocess should be stopped.
Principles and Processes GPG-FM-003
March 1996 7
2.2.2 Define Goals, Objectives, and Values
The project's mission analysis should be the primary source for identifying goals,objectives, requirements, and DOE and stakeholder values, which the project managershould use as the basis for establishing decision criteria. At deeper levels of allocation, theengineering process may generate additional goals and objectives to help differentiateamong segments, components and parts, and other, lower-level architectures.
Goals, objectives, and values are graded judgments useful in differentiating amongalternative architectures. In contrast, requirements are usually go/no-go judgments; if anarchitecture cannot meet the requirements, it cannot become an alternative. Decisioncriteria should reflect these graded judgments, and a decision process should formalize thedifferentiation among alternatives, eventually resulting in the clear identification of apreferred alternative.
2.2.3 Formulate Decision Criteria
Decision criteria are standards for differentiating an alternative's performance relative toproject goals, objectives, and values. Good decision criteria may be objective orsubjective, but should:
C differentiate meaningfully among alternatives without bias;
C relate directly to project goals, objectives, and values of DOE and stakeholders;
C be measurable or estimable at reasonable cost;
C be independent of each other at all levels of allocation; and
C be universally understood by evaluators.
Objectives commonly deal with risk, cost, and schedule. Most projects will haveadditional objectives that are mission-specific. For example, a project with an objective to"ensure acceptable technical risk" or "ensure acceptable manufacturing risk" could resultin a set of decision criteria consisting of (1) the estimated risk value and (2) any costs, ifnecessary, to mitigate risk to an acceptable level.
On the other hand, the objective "achieve minimum costs" could result in a set of decisioncriteria consisting of (1) funding profile, (2) total project cost, and (3) life cycle cost. Subsequent steps would evaluate each alternative for each of these decision criteria, and
Principles and Processes GPG-FM-003
March 1996 8
the decision process would ultimately assign a score for each alternative based on its costperformance. The alternative with the smallest cost profile, lowest project cost, andlowest life cycle cost would receive the most desirable score, or greatest differentiation,and would become the preferred alternative.
A more likely outcome would be that one alternative would have the smallest cost profile,a second would have the lowest project cost, and possibly a third, the lowest life cyclecost. To differentiate among the three alternatives, the decision process must assign aweight factor to each decision criterion.
2.2.4 Assign Weight Factors to Decision Criteria
The project manager should assign numerical weights to the decision criteria according totheir importance in determining which alternative to select. This Guide recommends anapproach that sums all weight factors to 1.0, a "unity sum."
Weight factors may be determined by conducting either an objective or subjective analysis. Subjective analyses should be rendered more reliable by the use of group consensus ordecision support techniques such as Pareto charts, histograms, or cause and effectdiagrams.
To help ensure objectivity of subsequent evaluations, management may withhold theweight factors from the analysts who perform the evaluations.
2.2.5 Prepare Utility Functions
Comparisons are difficult for diverse criteria such as cost (dollars), schedule (years),technical performance (widgets per year), and risk (high, medium, or low) unless they cansomehow share the same units. Utility functions provide a mediating capability totransform diverse criteria to a common, dimensionless scale. They are not necessary forevery tradeoff study application, however.
Utility functions assume that the performance associated with a particular decisioncriterion can be transformed into a utility score. A recommended approach is for theutility score to range from 0 to 1, with the expected lower bound of the criterioncorresponding to a utility score of 0 and the upper bound, to a utility score of 1. Thescoring range of 0-1 is arbitrary in this Guide, and an analyst might elect to use a scoringrange of 0-10, 0-50, 0-100, or whatever range is appropriate for a project. Whatever thescore range, the lower and upper bounds of performance for the entire set of alternativescorrespond to the lowest possible utility score (usually 0) and the highest possible score.
Principles and Processes GPG-FM-003
March 1996 9
For example, if cost analyses determine that the life cycle costs for a set of alternativesrange from $2M to $3M, the $2M alternative would have a utility score of 1, and the $3Malternative would have a score of 0. The utility function would thus appear as shown inFigure 2.
The shape of the utility function curve could result from an objective analysis, or it couldreflect good engineering judgment. But the utility functions for a given tradeoff studymust always use consistent scales (e.g., between 0 and 1) so as not to weight the scoresinadvertently. The zero point of each curve indicates the level of performance that nolonger provides value. In the above example, alternatives with life cycle costs exceeding$3M are not worth pursuing.
Graphic utility functions of the type shown in Figure 2 are not necessary for everycriterion. In some studies, the functions may be in the form of analytic expressionsinstead. Spreadsheet tables can be used to demonstrate project performance bytransforming the analytic expressions to a utility score for each decision criterion.
2.2.6 Evaluate Alternatives
Analysts should evaluate the performance of each alternative for each decision criterion. These performance evaluations may result from vendor test data, parametric analyses,simulations, analogous experiences, or other available and affordable methods.
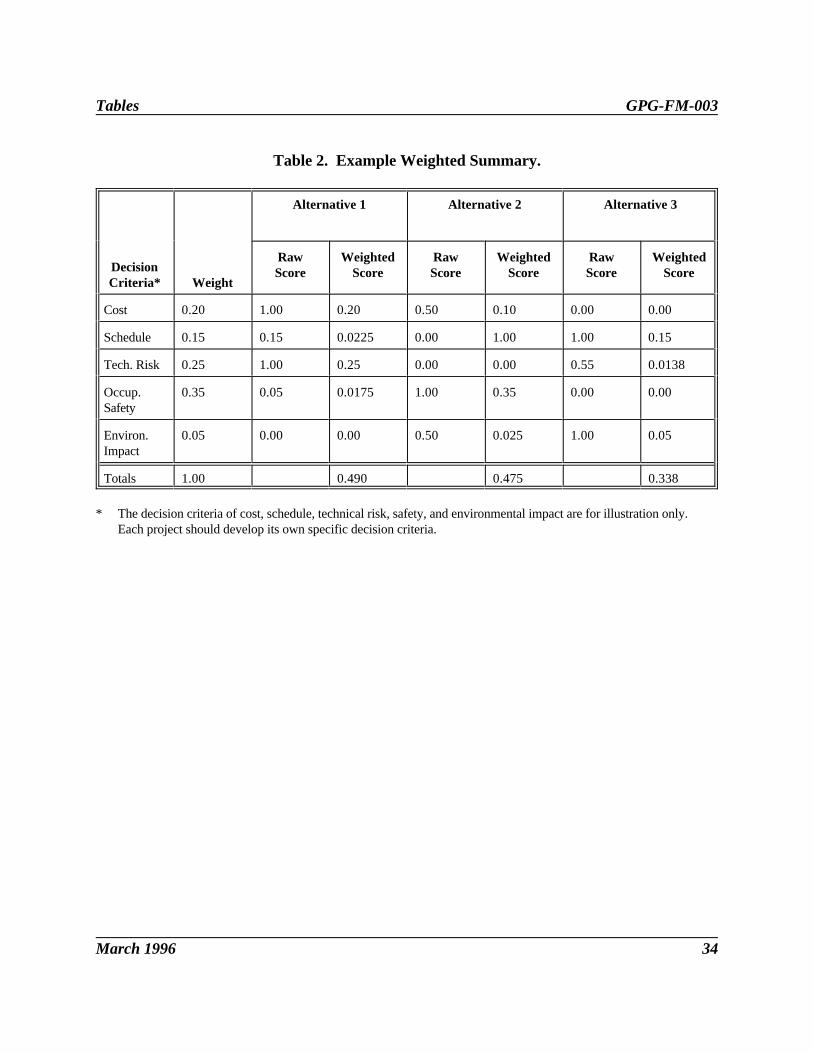
As described above, analysts use utility functions to convert performance estimates intodimensionless utility scores. A table should then be developed to display and summarizethe raw utility scores. The project manager (or decision maker) applies the weightingfactors to each raw score, thereby determining the weighted scores and completing theeffort. An example is shown in Table 2, which evaluates three alternatives.
This example preserves the utility function range of 0 to 1. For each criterion, the bestperformer of the three alternatives receives a raw utility score of 1.0, while the poorestreceives a 0.00. The intermediate alternative, performing somewhere between the poorestand the best, receives a score between 0 and 1 as determined by the utility function curve.
Alternative 1 has the greatest weighted score, and therefore might be designated thepreferred architecture. But alternative 2 has a high score too, nearly as high as alternative1. Therefore, a sensitivity check should be used to validate these scores beforedesignating a preferred alternative.
Principles and Processes GPG-FM-003
March 1996 10
2.2.7 Perform Sensitivity Check
The purpose of the sensitivity check is to validate the ranking that results from thedecision process by demonstrating that small changes do not alter the ranking. Such smallchanges could occur for raw scores, weight factors, requirements, or technical capabilities. If the sensitivity check reveals that small changes could reverse a decision, the decisionprocess must be adjusted to make it insensitive.
A minor change in requirements or technical capabilities could permit additionalalternatives to pass the go/no-go judgment, qualifying them for inclusion into the selectionprocess. Likewise, a minor change in technical capability can sometimes cause a majorchange in estimated cost, significantly changing the raw score for a cost criterion. Suchsensitivities indicate that the selection process may not reflect the true objectives of themission.
The sensitivity analysis should evaluate the impacts of relaxing requirements, improvingtechnical capabilities, or reducing uncertainties in cost estimates. The analysis should alsoidentify the changes that will appropriately desensitize the selection process formanagement's consideration and approval.
In the example shown in Table 2, the weighted scores for two alternatives are so close thatan informal examination cannot validate the ranking order. A sensitivity check is thereforewarranted.
The first step is to examine how small changes in the raw scores, typically less than 10%,would affect selection of the preferred alternative. The raw scores of 1.00 and 0.00, foralternatives at the extreme high or low end of the performance range, will not incur smallchanges unless such changes will cause another alternative to replace either the high orlow alternative. In the example, no replacement of alternatives will occur at theperformance extremes.
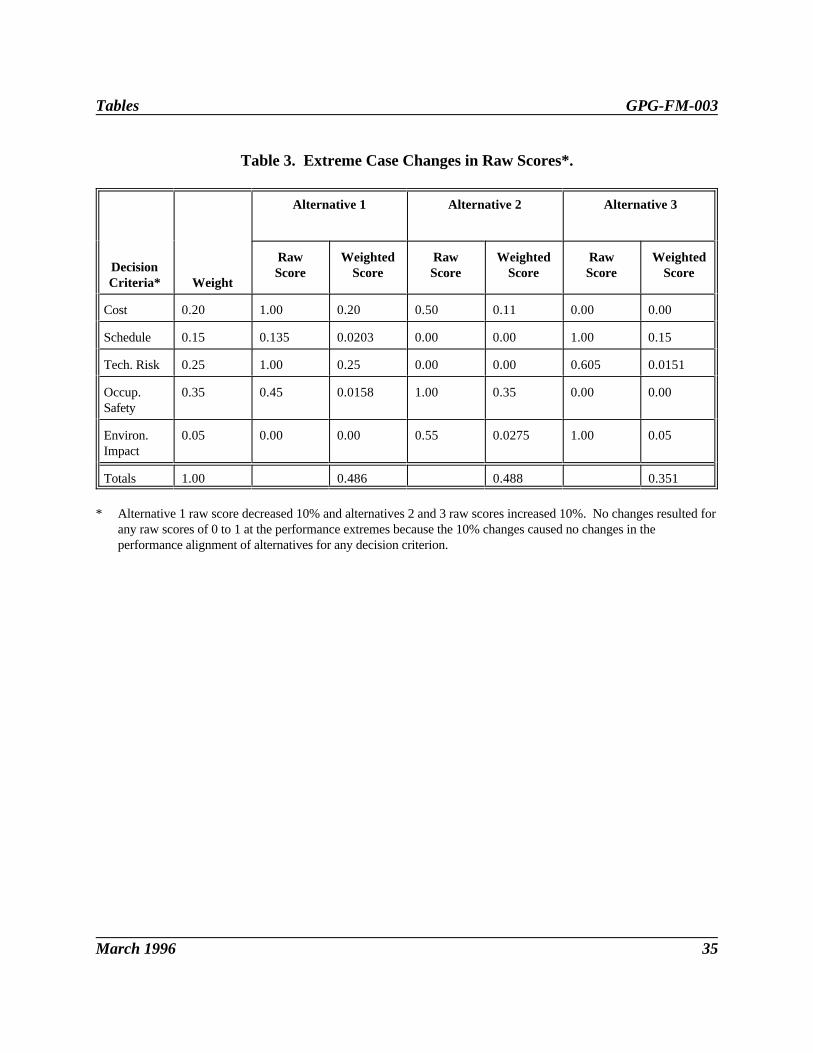
Inserting raw score changes of -10% for alternative 1 also does not alter the ranking. Thecalculated change is shown in Table 3. If a concurrent change of +10% occurs for thesecond and third-ranked alternatives, the ranking is altered, but the alteration is notconsidered significant because the change that has occurred is extreme.
At this point, the sensitivity analysis has established confidence in the ranking. Aconfirmatory check, if desired, would retain the original raw scores, but would introducesmall changes in the weight factors while retaining the unity sum of the weight factors.
Principles and Processes GPG-FM-003
March 1996 11
If the sensitivity analysis does not validate the ranking, several options are available to theproject manager or decision maker.
C Delay the decision until research, development, or other additional information isavailable to improve estimates or reduce uncertainty allowances.
C Acquire better tools to improve estimates and reduce uncertainties.
C Modify the decision criteria or weight factors to desensitize the selection processsufficiently for a valid decision.
C Reduce risk by pursuing a parallel path that develops at least one additionalalternative until a valid selection is possible.
2.2.8 Select Preferred Alternative
Once validated, the decision process results should clearly identify the preferredalternative. Note that the preferred alternative (the preferred architecture, for example)may not be selected if cost, schedule, and technical constraints rule it out. In each case,selection of the preferred alternative prompts the project manager or analyst to begin thenext level of allocation.
In the example described in section 2.2.6, alternative 1 received the highest weighted scoreand withstood a sensitivity analysis; it was therefore designated the preferred alternative. Had the decision process been structured differently, however, with different decisioncriteria, the preferred alternative selected might have received the lowest score, rather thanthe highest. Other decision structures might, for example, select a preferred alternativebased on maximum scores for one set of decision criteria and minimum scores for anotherset (the max-min process).
2.2.9 Document Results
Tradeoff study reports should be prepared to document the decision process, including the rationale used in the decision process and risk assessment and risk managementconsiderations. At a minimum, each report should describe analysis results and rationale,alternatives considered, decision criteria, weight factors, and results of the sensitivityanalysis.
Principles and Processes GPG-FM-003
March 1996 12
2.2.10 Risk Considerations in Tradeoff Studies
Tradeoff studies should cover a broad spectrum of important parameters duringpreconceptual activities and each of the project phases. Risk should be one of thoseparameters for selecting preferred architectures to meet mission needs and also for fine-tuning selected concepts during later project phases.
Achieving acceptable technical, cost, and schedule risks is an obvious and commonobjective for many projects. Tradeoff studies may use this objective to develop decisioncriteria, which may include:
C the calculated risk value,
C the confidence level that any necessary risk mitigation programs successfullyreduce unacceptable risks to an acceptable value within the required timing, and
C the cost of the risk mitigation programs.
Alternative architectures with acceptable risks should receive better utility scores thanprojects requiring mitigation programs to achieve acceptable risks. But, if all alternativesrequire risk mitigation programs, the confidence level and costs for those mitigationprograms could be major factors in the selection process. Tradeoff studies should alsoconsider the risks associated with each project phase.
Execution Phase. Tradeoff studies should reduce construction risk by giving preferenceto designs that:
C are simple,
C use open architectures with commercially available components,
C are compatible with available construction infrastructures,
C are easy to test at factory and field sites, and
C are supportable with existing logistics infrastructure.
Operation and Maintenance Phase. Tradeoff studies should focus on reducingoperational risks by giving preference to designs that:
Principles and Processes GPG-FM-003
March 1996 13
C facilitate in situ testing and maintenance as well as in-service inspections,
C have flexibility to accommodate changes in the operational environment, and
C adapt easily to periodic upgrades to state-of-the-art equipment and modificationsfor mission changes.
Closeout Phase. Tradeoff studies should focus on reducing close-out risks by givingpreference to designs that:
C facilitate post-operations using available technology for remote or in situmonitoring and control of facility status and
C incorporate features that accommodate available technologies or emergingtechnologies to perform cost-effective decontamination and decommissioning.
2.3 Planning and the Project Life-Cycle
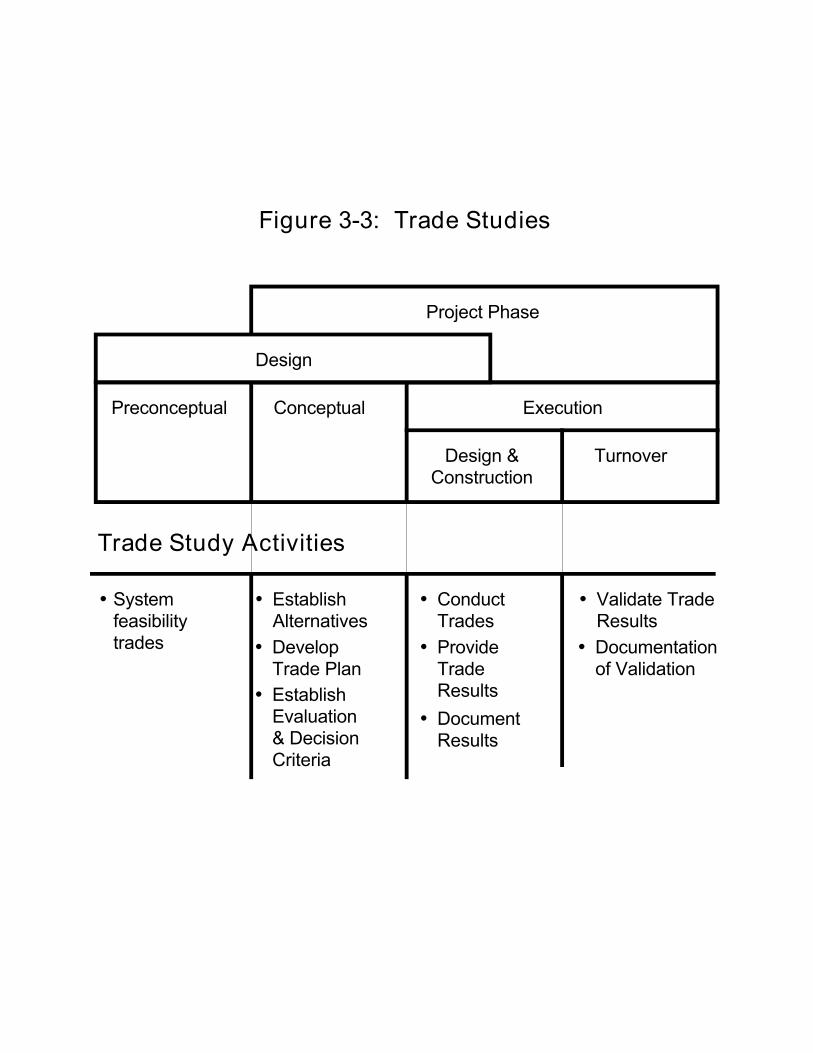
The following subsections present guidance for tradeoff study planning and activitiesduring each phase of the life cycle, as shown in Figure 3. The project manager isresponsible for identifying appropriate combinations of tradeoff study methods and levelsof tradeoff study to help ensure project performance. One tool that the project managershould consider is a tradeoff study plan, which relates the effort to the project's technicalrisks, operability, performance criteria, reliability, availability, and maintainability.
2.3.1 Planning Considerations
Tradeoff study planning is an important part of implementing effective and efficient designactivities. Important considerations of tradeoff study planning include:
C need for tradeoff studies,C approach to use,C methods selected,C identification of alternatives for consideration,C goals and objectives for the decision criteria,C weighting factors if used,C documented results, andC resources to accomplish the tradeoff studies.
Principles and Processes GPG-FM-003
March 1996 14
2.3.1.1 Planning Approaches. A number of approaches can be used to plan the tradeoffstudy. Common approaches can be by requirement, function, schedule, technology, orcost. To facilitate project planning, management and engineering should establish theapproach during the preconceptual activities. A recommended example approach is toorganize the tradeoff study activities by requirement; that is, state the requirement, specifythe tradeoff study method(s) that will be used to compare and choose the alternatives, andidentify the decision criteria that will be used.
Selected requirements (i.e., those management believes will have the greatest impact onproject cost, schedule, and risk) should be addressed in the tradeoff study planning andwould include requirement types based on performance parameters, codes and standards,and laws and regulations. For projects with complex end products, the requirementscould be an extensive data set requiring extensive maintenance. A number of softwaretools are commercially available to support this effort. Other approaches that can also beused include general data bases or table entries in the planning documentation. Theproject manager should consider the use of such tools.
2.3.1.2 Procedures to be Included. Responsible organizations usually have standardizedprocedures for such verification activities as analysis, design reviews, and softwaredevelopment activities (required for verification/validation of simulation models). Wherethey are used, the most cost-effective approach should be selected.
For simulations, procedures are generally necessary to specify, at a minimum, thesimulation objective, the "how to" for completing the simulation, the method for recordingthe simulation data/results, and the method for evaluating the results. The simulation andtradeoff study procedures, the documentation of the verification activity results, and anassessment of the results are important products from the tradeoff study effort.
2.3.1.3 Planning Documentation. The complexity of the desired end product(s) shouldbe a determining factor in the level of tradeoff study planning and the level ofdocumentation. On projects with limited tradeoff study activities, tradeoff study planningcan be documented in the Project Execution Plan. On projects requiring extensiveidentification and verification activities, a separate tradeoff study plan is recommended.
Any appropriate format for the tradeoff study plan is acceptable. However, the planshould address each requirement for which a tradeoff study will be used, the tradeoff studymethods to be used, the decision criteria, the performance period for the tradeoffactivities, and the estimated cost of the tradeoff activity if it is estimated separately fromother project events. Items that may require separate scheduling would be general designreviews and simulation verification/validation activities. The detailed planning effort
Principles and Processes GPG-FM-003
March 1996 15
should include the preparation of procedures showing how the various tradeoff studyactivities will be completed.
2.3.2 Preconceptual Activities
During the preconceptual activities, tradeoff studies should be used to select thetechnology and architecture capable of meeting end product(s) functions andrequirements. Evaluations conducted during this phase are typically based on summarylevel detail and are used with such decision criteria as safety, protection of human healthand the environment, cost, schedule, reliability, maintainability, and supportability. Techniques like parametric analysis, modeling, or comparisons to similar DOE projects,either ongoing or completed, should be used to perform tradeoff studies. GPG-FM-028,Productivity Tools: Automated, Models, and Simulations, provides additional information. Decisions based on the information generated by tradeoff studies during the preconceptualactivities can establish the foundation for all subsequent tradeoff studies and the decisionsupon which they are based.
2.3.3 Conceptual Phase
During the conceptual phase of the project, the project manager should develop thetradeoff study plan, if needed, to identify and coordinate specific tradeoff study activitiesthat may be necessary to select a preferred architecture for the project.
At the start of this phase, as shown in Figure 3, many of the decision criteria should havebeen developed, reviewed, and approved. The conceptual phase may, however, introduceadditional decision criteria and possibly discard some criteria developed during thepreconceptual activities. Some initial portions of the engineering tradeoff study planactivities, which are based on approved portions of the plan, may be executed during theconceptual phase even while other portions of the plan are still being developed, reviewed,or approved.
During the conceptual phase, tradeoff studies should focus on defining alternativearchitectures at the conceptual levels of allocation, developing a list of decision criteria forthe conceptual architectures, and selecting the preferred architecture. The conceptualphase level of allocation, and its corresponding tradeoff studies, must have sufficient depthto permit definition of end product(s) with enough detail to support cost estimates andevaluations of budget quality.
Tradeoff study activities that should occur during the conceptual phase include theinitiation of tradeoff study planning and establishment of a tradeoff study tree,
Principles and Processes GPG-FM-003
March 1996 16
establishment of alternatives at deeper levels of allocation, establishment of decisioncriteria for each level (which may differ from the criteria used during preconceptualactivities), development of tradeoff analyses, and preparation of tradeoff study reviews. Tradeoff study products created during the conceptual phase include the tradeoff studytree and tradeoff study reports, which should be documented and preserved for potentialuse during later phases of the project. An example of a tradeoff study tree is shown inFigure 4.
2.3.4 Execution Phase
At the initiation of the execution phase, the remaining portions of the tradeoff study planshould be finalized, reviewed, and approved. Tradeoff study activities generally peakduring the execution phase as alternative designs are screened and a detailed designselected.
During the execution phase, tradeoff studies should focus on defining alternativearchitectures down to the component and part level, developing a list of decision criteriafor these architectures, and selecting the final architecture. Tradeoff studies will also beused to assess design changes and help ensure risks are acceptable during construction,operations and maintenance, and closeout.
Tradeoff study and evaluation activities that should occur during the execution phaseinclude the finalization of tradeoff studies and tradeoff study reviews, including peerreviews, analysis, and a final assessment of the tradeoff study evaluation results. Thetradeoff study and evaluation products would include tradeoff study simulations and a finalassessment report. As in earlier phases, results of tradeoff study activities should berecorded for use during the next phase.
Tradeoff study activities generally decline toward the end of the execution phase asfunctional and operational performance tests are completed. Generally, tradeoff studieswill: (1) help establish test, evaluation, and verification methods and (2) assess endproduct(s) changes that might be necessary to correct deficiencies revealed in the tests andevaluations.
2.4 Change Control
Tradeoff study activities must be integrated into the change control process for theproject. Change control requests may occur for a variety of reasons, including changes inproject requirements or changes based on the results of tradeoff study activities. Theproject manager should clearly define the process for proposing changes due to tradeoff
Principles and Processes GPG-FM-003
March 1996 17
study activities, ensuring those changes are integrated into the project and communicatedeffectively to project participants. (See the Configuration and Data Management Guide(GPG-FM-012.)
Project changes should be evaluated to determine their effect on tradeoff study activities. Changes to performance requirements, variance limits, system configuration, etc. shouldbe evaluated for potential impacts, including the impact on cost. Normally, a ChangeControl Board is established to decide if a change should be made once the potentialimpact of the change is well defined and documented. Changes that are accepted shouldbe incorporated into the tradeoff study plan and should be performed.
Each tradeoff study should be documented in an engineering report, which should beintegrated into the configuration management system. The engineering report includes thetradeoff study tree; describes the alternative candidates, evaluation criteria, and modelused, if applicable; provides justification for the decision; and describes changes inweights, scoring, or requirements that would affect the selection. Engineering reportsshould be numbered sequentially so they can be traced (through a traceability tool) to therequirement from which they originated and to the new requirements that they imposeupon the system.
2.5 Analysis and Modeling Considerations
To help the user begin the tradeoff study process, some considerations for developingdecision criteria based on analysis and modeling approaches are presented in the followingsubsections. This is by no means a complete list, and not all of these techniques should beused on every project. The selected techniques should be graded to the projectrequirements.
2.5.1 Life-Cycle Cost Analyses
Life-cycle cost tradeoff studies are used to evaluate the cost of each alternative and toprovide input in evaluating the alternatives' effectiveness. Life-cycle cost studies providethe following cost information to support tradeoff study decisions.
C Cost information for system effectiveness assessments.
C Cost of development, manufacturing, test, operations, support, training, anddisposal.
Principles and Processes GPG-FM-003
March 1996 18
C Design-to-cost goals, current estimate of these costs, any projected change in theestimate of these costs, and known uncertainties in these costs.
C Impacts on the life-cycle cost of proposed changes.
2.5.2 End Product(s) Effectiveness and Cost Effectiveness Analyses
End product(s) effectiveness and cost effectiveness analyses are conducted on life-cycleprocesses of test, distribution, operations, support, training, and disposal. These analysesare conducted to support (1) inclusion of life-cycle quality factors into the end product(s)designs and (2) the definition of functional and performance requirements for life cycleprocesses. The results of these analyses are used in evaluating tradeoff studies andassessing end product(s) effectiveness.
2.5.3 Environmental Analyses
Environmental analyses identify and ensure compliance of the alternative selected with allFederal, State, municipal, and international environmental statutes and hazardous materiallists that apply to the project. Environmental analyses include environmental impactstudies performed to determine the impact of the architecture selected during the entirelife cycle of the system on the infrastructure, land and ocean, atmosphere, water sources,and human, animal, and plant life. Use of material or generation of by-products thatpresent known hazards to the environment are to be avoided to the extent possible;otherwise, provisions must be established for properly handling, storing, and disposing ofhazardous materials or by-products. The results of these analyses are used to evaluatetradeoff study alternatives and assess system effectiveness.
Analyses performed while evaluating and selecting project alternatives must be integratedand synchronized with activities that support NEPA documentation; specifically,Environmental Assessments (EAs) and Environmental Impact Statements (EISs), whichare generated to comply with the NEPA requirements specified under 10 CFR 1021 forthe evaluation of major Federal actions. This is accomplished through the sharing ofalternative evaluations and EIS analysis results. The Environmental Interfaces Guide(GPG-FM-021) describes how environmental considerations and processes are integratedwith project planning and execution.
2.5.4 Risk Analysis
A risk analysis is performed to quantify the impact of an undesirable consequence. Risk isquantified based on the likelihood of occurrence (probability) and consequences of an
Principles and Processes GPG-FM-003
March 1996 19
occurrence. For system effectiveness assessments, each element of the system architecturedeveloped to date is assessed to determine what can go wrong and what impact it willhave on the system if it does go wrong. For tradeoff studies, risk levels assessed duringthe estimate of life-cycle costs, evaluation of system cost effectiveness, and developmentof environmental impact analyses are prioritized and reported as part of tradeoff studyrecommendations.
2.5.5 Types of Analysis and Modeling Techniques
During systems development, the following analyses and models may be employed:economic analysis, mathematical modeling and optimization, probability and statisticalmodels, queuing theory and analysis, control concepts and techniques, and the heuristicmethod.
2.5.5.1 Economic Analysis. The purpose of performing an economic analysis is tocompare each identified alternative by eliminating as many cost biases as possible. Forexample, the system that is the least expensive to create and design may be the mostexpensive to dispose of in the future. During economic analysis, models of the alternativesare constructed to evaluate all known costs of a system from the preconceptual activitiesthrough the operational and closeout phases. A brief discussion of the various economicanalyses available to the user follows.
2.5.5.1.1 Equivalence Evaluations. If two or more alternatives are to be compared,their characteristics must be placed on an equivalent basis. Two things are said to beequivalent when they have the same effect. Two monetary amounts are equivalent whenthey have the same value in exchange. Three factors are involved in the equivalence ofsums of money: (1) the amount of the sums, (2) the time of occurrence of the sums, and(3) the interest rates. Two useful techniques for calculating equivalence are the following.
Three types of equivalence evaluations may be conducted.
C Equivalent function diagrams. The present value is plotted as a function of theinterest rate.
C Determining the equivalent "should" cost of an asset. The cost of any asset ismade up of the cost of depreciation plus the cost of interest on the undepreciatedbalance. Therefore, the "should" cost of an asset is the annual equivalent first costless the annual equivalent salvage value. This annual equivalent cost is the amountan asset must earn each year if the invested capital is to be recovered along with areturn on the investment.
Principles and Processes GPG-FM-003
March 1996 20
Present-Worth Evaluation - In a system evaluation, the anticipated positive gain or benefitof the system must be compared with a feeling or opinion regarding nonspecifiedopportunities that may present themselves. A present-worth evaluation is conducted tofind the present worth of future savings and disbursements and is one technique forevaluating the positive gain or benefit of a system.
Rate of Return Evaluations - Because the rate of return is a universal measure ofeconomic success, this technique is one of the best methods for comparing a specificproposal with other, less well-defined alternatives. Rate of return is determined byequating either present worth or equivalent annual receipts with disbursements at a giveninterest rate. The results are plotted. The point at which the disbursement values intersectthe receipts values is the rate of return on the system.
Payout Evaluations - Payout evaluations are used to determine the time required for thesystem to pay for itself. The payout period is the time required for the difference in thepresent value of receipts to equal the present value of disbursements (or the annualequivalent receipts and disbursements) for given increments of time. The results of thecalculations are plotted. The point at which the present worth of the savings anddisbursements intersect is the time required for the system to pay for itself.
2.5.5.1.2 Break-Even Evaluations. Break-even evaluations are useful in relating fixedand variable costs to the measures of operational activity (i.e., hours of operation ornumber of units produced). The break-even point identifies the range of the decisionvariable within which the most desirable economic outcome may occur. Two types ofbreak-even evaluations may be conducted.
Make-Buy Evaluations - In designing a system, a project manager (or contractor) mustdecide if it is more cost effective to make a subsystem or component or buy the subsystemor component. It is the responsibility of the program manager to include in the evaluationthe availability of assets at other DOE operations.
The first step of such an evaluation is to determine the total annual cost as a function ofthe number of units for the make alternative. The total annual cost of the make alternativeis the fixed costs plus the variable costs incurred in the manufacturing of each unit. Thesecond step is to calculate the total annual cost as a function of the number of units for thebuy alternative. The break-even point occurs when the total annual cost of the makealternative equals the buy alternative. The answer is usually in the number of unitsrequired to reach the break even point. If the number of units required is greater than thenumber of units required to complete the project, the choice would be to buy the numberof required units.
Principles and Processes GPG-FM-003
March 1996 21
Lease-Buy Evaluations - In designing a system, a project manager must decide if it is morecost effective to lease a piece of support equipment or to buy the support equipment. Thefirst step of a lease-buy evaluation is to determine the total annual cost as a function of thenumber of days that the support equipment is to be used. The total annual cost of thelease alternative is the cost of leasing the equipment plus the cost of operating theequipment. The second step is to calculate the total of the buy option. The total cost ofthe buy option is the initial cost minus the salvage rate times the capital recovery factor (afactor based on the interest rate and the expected life time of the equipment) plus thesalvage value times the interest rate plus the maintenance cost plus the operating cost. The break-even point occurs when the total annual cost of the lease alternative equals thebuy alternative. The answer is usually in the number of days required to reach the breakeven point. If the number of days required is greater than the number of days that thesupport equipment is to be used, the choice would be to lease the equipment.
2.5.5.2 Mathematical Modeling and Optimization. Tradeoff studies are facilitatedthrough the use of various types of mathematical models or a series of models to describea system. The output of one model may be the input of another, depending on thecomplexity and depth of the modeling effort. A model is a simplified representation of thereal world that abstracts the features of the situation relative to the problem beinganalyzed. Models allow the analyst to combine the parameters under study to determinethe relative merits and effects of the various combinations of parameters on the entiresystem. Such simulations do not make decisions but are a useful tool to assist in thedecision process.
The four types of models are physical, analog, schematic, and mathematical. Physicalmodels look like what they represent, analog models behave like what they represent,schematic models graphically describe a situation or process, and mathematical modelssymbolically represent the principles of a situation being studied. Mathematical modelsused to study operational systems must often incorporate probabilistic elements to explainthe random behavior of systems.
Mathematical modeling and optimization involves the formulation of effectivenessfunctions embracing two classes of variables. (An effectiveness function is a mathematicalstatement formally linking a measure of effectiveness with variables under the directcontrol of the decision maker and variables not directly under the control of the decisionmaker.) Mathematical modeling and optimization provide a means whereby variousvalues for controllable variables, designated xi, can be tested in the light of uncontrollablevalues, designated yi. For a tradeoff study, different values of xi are substituted while theyi value remains constant. The functional relationship is expressed as
Principles and Processes GPG-FM-003
March 1996 22
E = f (xi, yi)
where E = the measure of effectiveness.
In an ideal situation, all variables of the system or subsystem for which the model is beingdeveloped would be included in the effectiveness function. In reality, only the variablesassumed to be drivers in system effectiveness measures are used as variables.
If the effectiveness function can be differentiated, basic calculus may be used to find themaximum or minimum values. If the first derivative of a stationary value is equal to zero,it cannot be stated that the function is at an optimum point because the stationary valuemay be an inflection point of the function. To determine if the stationary point is amaximum or minimum, the second derivative is taken. If the value of the secondderivative at the stationary point is positive, the stationary point is a minimum. If it isnegative, the stationary point is a maximum.
For non-steady state functions, the mathematical models are constructed to represent asteady state function. Control variables are introduced to change the environment forcomparison. This is a simplification technique.
Various types of mathematical techniques are available for the decision maker to use. These techniques include but are not limited to Lagrange multipliers, graphical methods,and various linear and dynamic programming methods.
2.5.5.3 Probability and Statistical Models. Most systems are not static but changeunder different and random conditions. The rate of change and the conditions that makesystems change can be described using a probability distribution. Probability distributionsare generally expressed mathematically as functions of the mean (an indication of centraltendency) and the variance (a measure of dispersion). In conducting tradeoff studies, themean and variance of the alternative options are compared and used as a decisioncriterion.
2.5.5.4 Monte Carlo Analysis. A commonly used model for tradeoff studies is theMonte Carlo analysis, which entails comparison of multiple random variables. Thismethod is used to determine the sensitivity of the system to random processes and tocharacterize alternatives under differing operational conditions.
2.5.5.5 Queuing Theory and Analysis. Queuing theory is beneficial in performingtradeoff studies when the alternatives under consideration are facilities designed to servicea population in which the population forms a waiting line (queue) and receives service in
Principles and Processes GPG-FM-003
March 1996 23
accordance with a predetermined waiting-line discipline. After receiving service, thepopulation may enter yet another queue or leave the system. The objective of queuinganalysis is to determine the capacity of the service facility to minimize the total cost of thequeuing system, taking into consideration the relevant costs and characteristics of thearrival population. Queuing models frequently are evaluated using the Monte Carlotechniques as described above.
2.5.5.6 Control Concepts and Techniques. Most systems are deployed and mustoperate in an environment that changes over time. Control of portions or all of a systemcan help maintain system performance within specified tolerances or increase the worth ofthe system output. Control variables must be related in some way to the systemcharacteristic or condition being controlled.
Every control system has four basic elements.
C A controlled characteristic or condition.
C A sensory device or method for measuring the characteristic or condition.
C A control device that compares measured performance with planned performance.
C An activating device that alters the system to bring about a change in the outputcharacteristic or condition being controlled.
In tradeoff studies, alternatives are evaluated to determine the extent of the control systemrequired for the system. Alternatives are studied in different combinations to determinethe most cost-effective system for producing the system effectiveness desired. Theeffectiveness of the controls may be evaluated using Monte Carlo Methods from which thestatistical history of the controls can be derived.
2.5.5.7 Heuristic Method. The main purpose of some projects is to define requirementsand decision criteria for the customer. In these cases, the customer may not be able to setfirm requirements for one or more of the following reasons.
C The customer is not a monolith and cannot agree on a common set ofrequirements.
C Requirements are set by an exterior force that is ambiguous or fluid.
C The objectives of the customer are general and not specific enough to measure.
Principles and Processes GPG-FM-003
March 1996 24
In such cases, alternative approaches are required to assist the customer in establishing aset of requirements clear enough to serve as the basis for project development. One suchapproach is called the heuristic method in which tradeoff studies begin with models, whichare used and adjusted until the customer and the project manager can agree on the desiredperformance. Once agreement is reached, the model defines the requirements and aproduction version of the model becomes the main purpose of the project.

Graded Approach GPG-FM-003
March 1996 25
3. GRADED APPROACH
Management should carefully consider the type of tradeoff study required when initiating aproject. Not every selection performed during the project life cycle will require a formaltradeoff study. In fact, most tradeoff studies fall in the mental or informal category. Therefore, a graded (i.e., tailored) approach should be used to ensure tradeoff studyprinciples and practices are incorporated in each project commensurate with projectfactors such as complexity, visibility, and uncertainties. These factors provide the basis foridentifying the category of tradeoff study necessary to ensure successful projectcompletion. Some minimum level of tradeoff study activity is necessary to demonstratethat the alternative chosen is the best alternative based on the decision criteria. Withoutthis minimum set of activities, the project manager has no basis to defend the alternativechoice.
Mental tradeoff studies, described at the beginning of section 2, are simple and aretherefore the type used for most projects. The following example for selecting a generalpurpose pump illustrates this type of tradeoff study. The project designer should have thefollowing information, based on a top down requirements and architecture allocationprocess:
C An established basis for the pump being the preferred solution.
C Requirements for the pump functions, including the following:
- flow, volume, pressure, lift, particle suspension, etc.;- safety criteria (i.e., radiation, hazardous material, etc.);- operating environment including maintenance support; and- reliability.
The construction engineer would ask the procurement department for all themanufacturers' specification sheets for pumps that meet this application. He/she wouldthen review the pump data sheets and select the pump based on cost and delivery scheduleinformation. The selected pump would be entered into the as built documentation andmaintenance requirements identified for operations.
In applying this Guide to the preparation of the tradeoff study portions of contractsolicitation documents, the DOE project manager should grade the principles and practicesto the specific characteristics of a particular project. Tradeoff study tasks should bedeleted, altered, or expanded as necessary. The project manager should define the depth
Graded Approach GPG-FM-003
March 1996 26
of detail and level of effort required and the intermediate and final engineering dataexpected. The contractor and the Government may tailor the tradeoff study approachfurther during contract negotiations. The agreed-upon tradeoff study approach should bereflected in the resulting contract. Guidance is provided throughout this Guide on theappropriate level of the tradeoff study effort.
Measuring Results GPG-FM-003
March 1996 27
4. MEASURING RESULTS
The ability of tradeoff studies to demonstrate that the alternative architecture performs themission functions and meets the requirements should be measured throughout the project. Tradeoff study plans and procedures should be thoroughly evaluated for completeness,currency, and accuracy. Tradeoff study reports should be reviewed to determine if thetradeoff study results adequately substantiate the determination that performancerequirements are met by the alternative chosen.

Measuring Results GPG-FM-003
March 1996 28
This page intentionally left blank.

Suggested Reading GPG-FM-003
March 1996 29
5. SUGGESTED READING
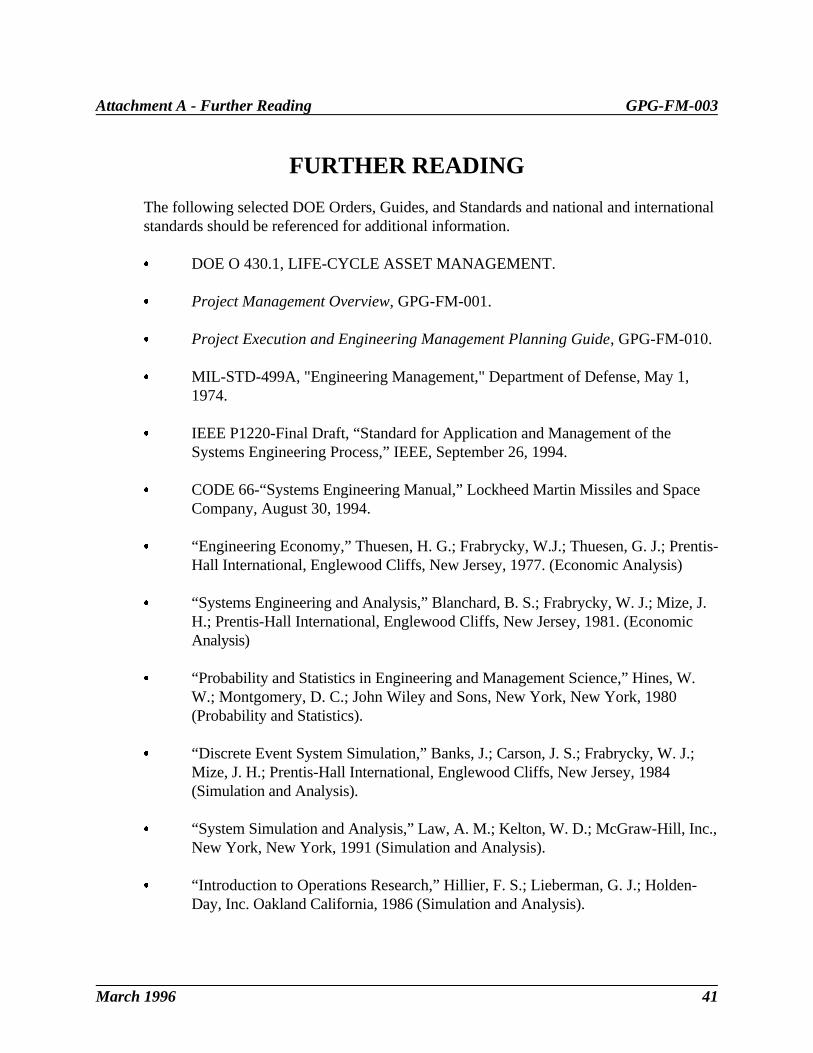
For further information on the topics covered in this Guide, see Attachment A.

Suggested Reading GPG-FM-003
March 1996 30
This page intentionally left blank.

Assistance GPG-FM-003
March 1996 31
6. ASSISTANCE
Questions concerning this Guide may be referred to the Office of Field Management inWashington, D.C. at (202) 586-4041.

Assistance GPG-FM-003
March 1996 32
This page intentionally left blank.
Tables GPG-FM-003
March 1996 33
Table 1. Tradeoff Study Roles in the Project Life Cycle.
Project Life Cycle Tradeoff Study Role
Preconceptual activities Help establish the preferred technology and top-levelarchitecture for end product(s).
Conceptual phase Help develop and select the preferred architecture for endproduct(s) that meets technical, cost and schedule requirementswith acceptable risks.
Execution ! Help select component/part designs.(Design andConstruction ! Support make/buy decisions.Subphases)
! Support construction process decisions.
! Assess design changes.
Execution ! Help establish test, evaluation, and verification methods.(Turnover Subphase)
! Assess facility hardware and software changes necessaryto correct deficiencies.
Tables GPG-FM-003
March 1996 34
Table 2. Example Weighted Summary.
DecisionCriteria* Weight
Alternative 1 Alternative 2 Alternative 3
Raw Weighted Raw Weighted Raw WeightedScore Score Score Score Score Score
Cost 0.20 1.00 0.20 0.50 0.10 0.00 0.00
Schedule 0.15 0.15 0.0225 0.00 1.00 1.00 0.15
Tech. Risk 0.25 1.00 0.25 0.00 0.00 0.55 0.0138
Occup. 0.35 0.05 0.0175 1.00 0.35 0.00 0.00Safety
Environ. 0.05 0.00 0.00 0.50 0.025 1.00 0.05Impact
Totals 1.00 0.490 0.475 0.338
* The decision criteria of cost, schedule, technical risk, safety, and environmental impact are for illustration only. Each project should develop its own specific decision criteria.
Tables GPG-FM-003
March 1996 35
Table 3. Extreme Case Changes in Raw Scores*.
DecisionCriteria* Weight
Alternative 1 Alternative 2 Alternative 3
Raw Weighted Raw Weighted Raw WeightedScore Score Score Score Score Score
Cost 0.20 1.00 0.20 0.50 0.11 0.00 0.00
Schedule 0.15 0.135 0.0203 0.00 0.00 1.00 0.15
Tech. Risk 0.25 1.00 0.25 0.00 0.00 0.605 0.0151
Occup. 0.35 0.45 0.0158 1.00 0.35 0.00 0.00Safety
Environ. 0.05 0.00 0.00 0.55 0.0275 1.00 0.05Impact
Totals 1.00 0.486 0.488 0.351
* Alternative 1 raw score decreased 10% and alternatives 2 and 3 raw scores increased 10%. No changes resulted forany raw scores of 0 to 1 at the performance extremes because the 10% changes caused no changes in theperformance alignment of alternatives for any decision criterion.

Tables GPG-FM-003
March 1996 36
This page intentionally left blank.
External Input Design Input
Prepare Utility Functions
Evaluate Alternatives
Perform Sensitivity Check
Define Goals, Objectivesand Values
Formulate DecisionCriteria
Assign Weight Factorsto Criteria
Identify Alternatives
Select PerferredAlternative
Document Results
Insensitive EliminateSensitivities
Figure 3.1.5-1: Example Utility Function for Life Cycle
Yes
No
Figure 3.1-1: Trade Study
Shape of curve shouldcome from analysis orengineering judgement
1.0
0.5
0.02.0 3.02.5
Utility Score
Life Cycle Cost, $M
Project Phase
Preconceptual Conceptual Execution
Design & Construction
Turnover
System feasibility trades Develop
Trade PlanEstablish Evaluation & Decision Criteria
Conduct TradesProvide Trade ResultsDocument Results
Validate Trade Results
Trade Study Activities
Figure 3-3: Trade Studies
Documentation of Validation
Design
Establish Alternatives
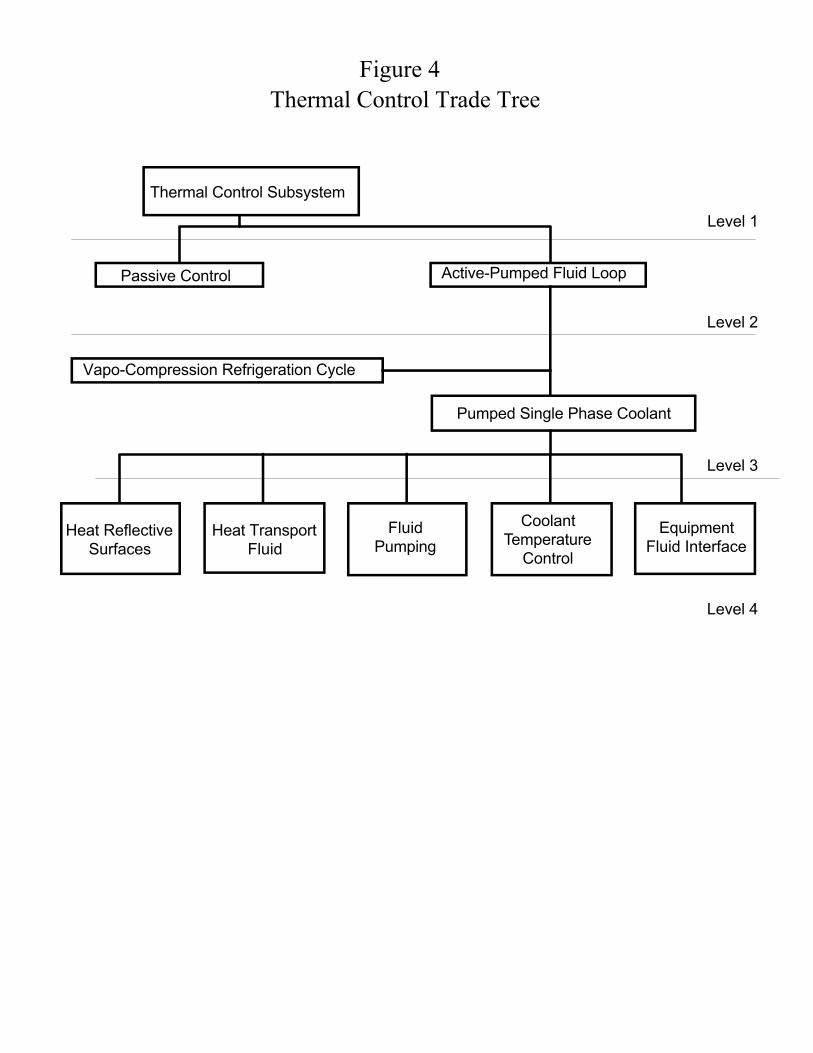
Figure 4Thermal Control Trade Tree
Passive Control
Thermal Control Subsystem
Active-Pumped Fluid Loop
Pumped Single Phase Coolant
Heat Reflective Surfaces
Heat Transport Fluid
Fluid Pumping
Coolant Temperature
Control
Equipment Fluid Interface
Vapo-Compression Refrigeration Cycle
Level 1
Level 2
Level 3
Level 4

Figures GPG-FM-003
March 1996 40
Figure 4. Tradeoff Study Tree Example.
Attachment A - Further Reading GPG-FM-003
March 1996 41
FURTHER READING
The following selected DOE Orders, Guides, and Standards and national and internationalstandards should be referenced for additional information.
C DOE O 430.1, LIFE-CYCLE ASSET MANAGEMENT.
C Project Management Overview, GPG-FM-001.
C Project Execution and Engineering Management Planning Guide, GPG-FM-010.
C MIL-STD-499A, "Engineering Management," Department of Defense, May 1,1974.
C IEEE P1220-Final Draft, “Standard for Application and Management of theSystems Engineering Process,” IEEE, September 26, 1994.
C CODE 66-“Systems Engineering Manual,” Lockheed Martin Missiles and SpaceCompany, August 30, 1994.
C “Engineering Economy,” Thuesen, H. G.; Frabrycky, W.J.; Thuesen, G. J.; Prentis-Hall International, Englewood Cliffs, New Jersey, 1977. (Economic Analysis)
C “Systems Engineering and Analysis,” Blanchard, B. S.; Frabrycky, W. J.; Mize, J.H.; Prentis-Hall International, Englewood Cliffs, New Jersey, 1981. (EconomicAnalysis)
C “Probability and Statistics in Engineering and Management Science,” Hines, W.W.; Montgomery, D. C.; John Wiley and Sons, New York, New York, 1980(Probability and Statistics).
C “Discrete Event System Simulation,” Banks, J.; Carson, J. S.; Frabrycky, W. J.;Mize, J. H.; Prentis-Hall International, Englewood Cliffs, New Jersey, 1984(Simulation and Analysis).
C “System Simulation and Analysis,” Law, A. M.; Kelton, W. D.; McGraw-Hill, Inc.,New York, New York, 1991 (Simulation and Analysis).
C “Introduction to Operations Research,” Hillier, F. S.; Lieberman, G. J.; Holden-Day, Inc. Oakland California, 1986 (Simulation and Analysis).