process eco-innovation: assessing meso-level eco ...oro.open.ac.uk/41858/1/ll_process...
TRANSCRIPT
lable at ScienceDirect
Journal of Cleaner Production xxx (2015) 1e12
Contents lists avai
Journal of Cleaner Production
journal homepage: www.elsevier .com/locate/ jc lepro
Process eco-innovation: assessing meso-level eco-efficiency inindustrial water-service systems
Les Levidow a, *, Palle Lindgaard-Jørgensen b, Åsa Nilsson c, Sara Alongi Skenhall c,Dionysis Assimacopoulos d
a Open University, Milton Keynes, MK7 6AA, UKb DHI, Agern All�e 5, Copenhagen, DK-2970, Denmarkc IVL, Valhallav€agen 81, 114 28, Stockholm, Swedend National Technical University of Athens (NTUA), School of Chemical Engineering, Environmental and Energy Management Research Unit, 9, HeroonPolytechneiou, Zografou Campus, 15780, Athens, Greece
a r t i c l e i n f o
Article history:Received 31 January 2014Received in revised form4 December 2014Accepted 18 December 2014Available online xxx
Keywords:Eco-efficiencyMeso level (whole system)Eco-innovationValue chainVolvo TrucksArla Foods
* Corresponding author.E-mail addresses: [email protected] (L. L
(P. Lindgaard-Jørgensen), [email protected] (Å. Nilsso(S.A. Skenhall), [email protected] (D. Assimaco
http://dx.doi.org/10.1016/j.jclepro.2014.12.0860959-6526/© 2014 Elsevier Ltd. All rights reserved.
Please cite this article in press as: Levidow,systems, Journal of Cleaner Production (201
a b s t r a c t
Eco-innovation combines economic advantage with lower ecological-resource burdens. Eco-innovationhas been generally directed at energy input-substitutes, component recycling, etc. Some companieshave made investments reducing resource burdens in the production process. This study investigatedoptions for eco-efficiency improvement in two large manufacturing companies, Volvo and Arla Foods.Their impetus for eco-innovation comes from the companies' environmental policies, as well as fromexternal drivers such as future higher costs and resource scarcity. Relative to their respective industrialsector, these companies represent strong prospects for reducing resource burdens in water-serviceprocesses, especially from chemical inputs and wastewater. Such eco-innovations involve more com-plex interactions beyond the production site, so the options warrant a whole-system comparativeassessment.
The EcoWater project has analysed the entire water-service value chain through meso-level in-teractions among heterogeneous actors (process-water users, providers and wastewater treatmentcompanies). The project has developed a methodology to obtain the necessary information, to involvestakeholders in the assessment and to facilitate their discussion on alternative options. Each studystimulated internal company discussions on the need and means to evaluate whole-system effects ofinvestment decisions. Inter-organisational cooperation helped to anticipate how meso-level resource-efficiency relates to lower burdens in wastewater treatment.
The assessment method can be extended to any water-service system. By comparing options, themethod can facilitate better decisions improving meso-level resource efficiency. As wider implications,some improvement options may complicate ‘eco-innovation’ as double-eco benefits: winewin forwhom, where and what level?
© 2014 Elsevier Ltd. All rights reserved.
1. Introduction: meso-level eco-efficiency
Eco-innovation encompasses various innovative practicescombining economic and ecological-resource benefits. Common-place examples have been renewable energy or (more recently)biomass as an input-substitute for fossil fuels. Going further,
evidow), [email protected]), [email protected]).
L., et al., Process eco-innova5), http://dx.doi.org/10.1016/j
production-process upgrading has lowered resource burdens, e.g.by substituting less harmful chemical inputs, internally treatingwastewater, reusing water and/or wastes, etc. Such improvementsgenerate relatively greater changes beyond a specific productionsite, e.g. through its relation with a wastewater treatment plant.
To evaluate such improvement options, eco-efficiency denotes aratio between economic benefits and ecological-resource burdens.This ratio helps to compare any current or future changes with abaseline. Eco-efficiency has been generally assessed in a micro-level system, e.g. at a specific site in a company's production pro-cesses. This focus neglects wider effects, warranting assessment at
tion: assessing meso-level eco-efficiency in industrial water-service.jclepro.2014.12.086
L. Levidow et al. / Journal of Cleaner Production xxx (2015) 1e122
the meso-level, which has also been called the whole system. Someexperts and practitioners have emphasised the need for such anassessment, encompassing the entire value chain of a productionprocess, alongside shared responsibility for whole-systemimprovement. From an inter-organisational perspective, thewhole-system or meso level can be defined as interactions amongheterogeneous actors across the entire value chain (see Methodssection).
This paper addresses two main questions:
� For whole-system effects on eco-efficiency, what methods canassess and compare eco-innovations?
� What is the role of inter-organisational cooperation in suchcomparisons?
These questions will be addressed through preliminary resultsof the EcoWater research project. As a literature survey, Section 2explains the concepts of eco-innovation and its eco-efficiencyassessment, as subsequently integrated in Section 3 on researchmethods. Then Sections 4 and 5 show how the project appliedthose methods and concepts in two case studies. On that basis, theconclusion answers the above question and suggests widerrelevance.
2. Eco-efficiency through eco-innovation: analytical concepts
This section links analytical perspectives on eco-innovation andeco-efficiency, as a basis for the methodological novelty presentedin the subsequent section on Methods.
2.1. Eco-innovation: forms and options
Eco-innovation encompasses various innovative practiceswhich enhance resource efficiency by combining economic valuewith environmental performance (see Fig. 1). By combining suchbenefits, it has been widely seen as ‘enabling winewin synergies’(OECD, 2012). But motives may be diverse and ambiguous. Casescan be distinguished ‘where environmental motives are as impor-tant as (or less important than) economic motives’. Where thelatter are most important, environmental improvements can beunintentional effects of investment decisions (Markusson, 2011:300). Primarily economic motives may stimulate resource-efficiency improvements which incidentally reduce emissions(Clayton et al., 1999).
Fig. 1. Eco-innovation through new technologies (Credit: IVL).
Please cite this article in press as: Levidow, L., et al., Process eco-innovasystems, Journal of Cleaner Production (2015), http://dx.doi.org/10.1016/
Giving ‘eco’ a double meaning, eco-innovation has been definedmore broadly as ‘a change in economic activities that improves boththe economic performance and the environmental performance ofsociety’ (Huppes et al., 2008: 29). According to the Europe INNOVAPanel on Eco-innovation:
Eco-innovation means the creation of novel and competitivelypriced goods, processes, systems, services, and procedures thatcan satisfy human needs and bring quality of life to all peoplewith a life-cycle-wide minimal use of natural resources (mate-rial including energy carriers, and surface area) per unit output,and a minimal release of toxic substances (quoted in Reid andMiedzinski, 2008: i).
According to most definitions, eco-innovation reduces theenvironmental impact caused by consumption and production ac-tivities, regardless of whether this is the main motivation. Takingmany forms, eco-innovation varies from incremental eco-efficiencyimprovements to fundamental change replacing a system (Carrillo-Hermosilla et al., 2010: 1073e74). Towards the latter improve-ments, the European Commission has promoted an IntegratedProduct Policy, aiming to support the realisation of environmentalproduct innovations which broadly reduce all environmental im-pacts throughout a product's life cycle. This has been conceptual-ized as ‘integrated environmental product innovation’(Triebswetter andWackerbauer, 2008). Innovation has several rolesin resource efficiency (EIO, 2011b: 12).
Manufacturing industry has introduced such innovations, e.g.through water-efficient technologies reducing water demand andpollution. A closed-cycle process ‘maximises the useful life ofproducts and minimises the waste and loss of valuable and scarcemetals’ (Ayres and van der Lugt, 2011). Eco-innovation has been‘closing the loop’ between water and energy management in aCleaner Production perspective, e.g. through WW reuse: ‘once-through cooling, where the water is used once for cooling and thendirectly is discharged, is replaced by closed-loop systems andcleaning-in-place (CIP) systems, where cascading is part of thecleaning process’ (WssTP, 2013: 41).
Eco-innovation depends on parallel socio-institutional innova-tion, as academic studies have emphasised (Rennings, 2000).Accordingly, eco-innovation is understood more broadly thantechnologies:
The scope of eco-innovation may go beyond the conventionalorganisational boundaries of the innovating organisation andinvolve broader social arrangements that trigger changes inexisting socio-cultural norms and institutional structures(OECD, 2009: 2).
Eco-innovation is influenced by interactions among regulators,firms and other actors. Understanding such interactions is essentialfor facilitating eco-innovation (Del Río et al., 2010: 552). Indeed,inter-organisational cooperation can facilitate assessment ofimprovement options, as discussed next.
2.2. Eco-efficiency assessment: meso-level novelty
Various eco-innovations can be compared by assessing theirrelative eco-efficiency. According to a report from the EuropeanEnvironment Agency, ‘eco-efficiency is a strategy or an approachaimed at de-coupling resource use and pollutant release fromeconomic activity’ (Mol and Gee, 1999: 24). To be operationalized,the concept denotes a quantifiable ratio between the economicvalue and resource burdens of a process (e.g. Seppala et al., 2005).
tion: assessing meso-level eco-efficiency in industrial water-servicej.jclepro.2014.12.086

L. Levidow et al. / Journal of Cleaner Production xxx (2015) 1e12 3
In this way, it means the efficiency of economic activities ingenerating added value from resources usage, including wasteemissions (UNESCAP, 2009: 1).
Although eco-efficiency assessments are sometimes regarded as‘green-washing’, recent guidance internationally harmonizes theassessment, thus making it more transparent and credible (ISO,2012). According to the leader of an international team of experts,Bengt Steen,
The goal of eco-efficiency assessment is to optimize the per-formance value of the product system, for example, its resource,production, delivery or use efficiency, or a combination of these.The value may be expressed in monetary terms or other valueaspects. The result: doing more with less (ISO, 2012).
Improvement need not mean an increase in production. Beyondthe resource-saving efforts of European companies (‘achievingmore with less’), more radical innovations are needed: ‘wemust dobetter with less’ (EIO, 2011a: xii). The latter canmean a qualitativelybetter and/or economically more valuable product, not simply anincrease in the same production as before.
Eco-efficiency has been generally assessed at the micro level,e.g. at a specific site in a company's production processes (e.g.Michelsen et al., 2006; van Caneghem et al., 2010). Improvingmicro-level eco-efficiency may not enhance sustainability and mayeven increase resource burdens (e.g. UNEP, 2013: 13). A micro-levelfocus neglects wider external effects, especially through in-teractions between water suppliers, water users and wastewatertreatment providers.
By contrast, macro-level studies have quantified wider changesin an entire industrial sector or region (e.g. Hoffr�en, 2001; Jollandset al., 2004; Seppala et al., 2005;Wursthorn et al., 2011), but cannotidentify which processes generated them. For promoting strongsustainability as a societal goal of eco-efficiency improvements,‘There is no easy link between micro-level decisions and this ulti-matemacro-societal reference’ (Huppes and Ishikawa, 2009: 1698).
As another limitation, eco-efficiency assessments often neglectwider economic aspects, especially changes in value chains (VCs).
Conversely, business studies lack the more comprehensiveanalysis of VCs which extend the focus to external stakeholders,including customers and suppliers other than regulators,
Fig. 2. Stages along the meso-level water-servic
Please cite this article in press as: Levidow, L., et al., Process eco-innovasystems, Journal of Cleaner Production (2015), http://dx.doi.org/10.1016/j
demonstrated to be, in many contributions, the key players inencouraging environmental strategies … the point is to under-stand how firms may reduce the impact of all the activitiesperformed to realize their products, including those of suppliersand sub-suppliers, therefore moving the focus from firm-levelstrategies to VC-level strategies (De Marchi et al., 2013: 64).
These difficult links have a knowledge gap. It can be filled byidentifying causal linkages between innovative practices and theeco-efficiency of a whole system or industrial sub-system. Alsocalled the meso level, this encompasses all the actors and processesresulting in a product, as shown in Fig. 2 below. According to onestudy, ‘the meso level is the most challenging from the point ofview of gathering evidence, as it requires information from manyagents’ (Reid and Miedzinski, 2008: 22).
As a ratio, ‘eco-efficiency’ implies that economic and environ-mental aspects will (or at least should) be considered together inorganisational decisions. However, responsibilities may be frag-mented across a water-service value chain, even within the sameorganisation. Better decision-making needs cooperation among allsuch agents across many sites. Optimal eco-efficiency improve-ments depend on shared responsibility among stakeholders acrossthe value chain, according to the World Business Council for Sus-tainable Development:
Business undoubtedly has many opportunities to increase itseco-efficient performance and thereby to help de-couple use ofnature from overall economic growth … Establishing frame-work conditions which foster innovation and transparency andwhich allow sharing responsibility among stakeholders willamplify eco-efficiency for the entire economy and deliverprogress toward sustainability (WBCSD, 2000: 6e7).
Multi-stakeholder responsibility depends on broadening as-sessments, as elaborated in the next section.
3. Methods and research focus
An EU-funded research project, EcoWater, has developed aconceptual framework and methodology for assessing eco-efficiency on the meso level. This level is defined as interactions
e and production chains (EcoWater, 2013a).
tion: assessing meso-level eco-efficiency in industrial water-service.jclepro.2014.12.086
L. Levidow et al. / Journal of Cleaner Production xxx (2015) 1e124
and interdependencies among heterogeneous actors across theentire value chain, linking the water-service and production chains(EcoWater, 2012a; see Fig. 2). The project compares options forinnovative practices, including technology adoption, within a spe-cific water-service system, which denotes:
a system which includes the entire range of water servicesrequired to render water suitable for a specific water-use pur-pose, and safely discharging it to the water environment; thissystem also includes water-using processes and economic ac-tivities (EcoWater, 2012b: 45).
Such uses include drinking, cooling, industrial processing, irri-gation, etc. ‘Water-service system’ overlaps with the ‘process water’concept from the chemical industry: ‘In many cases, water is spe-cifically treated to produce the quality of water needed for theprocess’ (Chemwater, 2013: 13).
Thus a methodological novelty lies in a whole-system (meso-level) eco-efficiency assessment of a water-service system. Byoperationalizing those concepts, the EcoWater project aims: toassess the eco-efficiency of various options for innovative practices(including technologies), to analyse factors influencing decisions toadopt such practices, to inform better decision-making, and thus toinform policy frameworks which could facilitate decisions towardsgreater eco-efficiency. To explore those issues, several case studiesinvestigate key actors' perspectives through interviews andworkshops.
Within a meso-level value chain, innovative practices can haveseveral sites and roles:
� Water or production chain, as shown in Fig. 2: An innovation canupgrade the water-service chain, e.g. the water supply orsewerage system, at stages in the horizontal axis. Or it can up-grade the production chain e e.g. through lower resource-inputs, lower emissions (to water, air or soil) or less harmfulby-products e at stages in the vertical axis. In the diagram,‘technologies’ is short-hand for innovative practices whichdepend on more than technologies.
� Process or product upgrading: Within the production chain,process upgrading uses resources in more efficient ways, whileproduction-chain upgrading increases the market value ofproducts.
Such improvements can have synergies. For example processupgrading can reduce emissions in wastewater, in turn facilitating
Fig. 3. Economic and resource flows in the meso-
Please cite this article in press as: Levidow, L., et al., Process eco-innovasystems, Journal of Cleaner Production (2015), http://dx.doi.org/10.1016/
improvements in the water-supply chain, e.g. through in-housewastewater treatment (henceforth abbreviated as WWT), reuse,recycling, etc.
Eco-efficiency is usually calculated as a ratio: total value-added(income minus costs) is divided by resource burdens from inputsand emissions. A baseline eco-efficiency assessment identified theprocesses or sites which have the greatest resource burdens in eachcase study, e.g. in a production plant. These sites became the focusfor comparing improvement options with the baseline situationand with each other.
Defined as interdependencies among heterogeneous actors, themeso level lies at the nexus between two value chains and theiractors:
� the product value chain (Fig. 3, vertical sequence), includingresource inputs, potential reuse of emissions or energy; and
� the water-service value chain (horizontal sequence), includingwater supply, WW emissions, WWT, WW reuse, etc.
The diagram indicates relations among actors who are directlyinvolved in the water-service value chain:
Directly involved actors, referring to the organizations and/orindividuals that manage the corresponding stages (or elements),have direct economic benefits and costs, and take decisions.Directly involved actors are the main source of the requiredinformation on economic and environmental performance(EcoWater, 2012b: 14).
Those actors had priority for research interviews, whichexplored improvement options, responsibility for them, relationswith other actors, etc. Indirectly involved actors, e.g. governmentdepartments and regulatory authorities, may influence decisions bythe directly involved ones. All those actors were invited to attendworkshops; most did so.
As a factor in selecting companies as case studies, they alreadymade significant investment in eco-innovation, were consideringfurther improvements in process upgrading and showed interest incooperating with the project. Each case study initially mapped themeso-level value chain in order to identify the flow of resourcesand money amongst interdependent actors. Each case study alsoidentified the processes which incur the greatest resource burdensand water-based emissions, seen as the environmentally weakeststages, e.g. from a production process to a WWT plant. This modeststudy selected one or two WW sources as the focus for options
level water-service system (EcoWater, 2013a).
tion: assessing meso-level eco-efficiency in industrial water-servicej.jclepro.2014.12.086
L. Levidow et al. / Journal of Cleaner Production xxx (2015) 1e12 5
which could improve eco-efficiency. From discussions with thecompany, each case-study team initially focused on one or twoimprovement options to adapt and refine the eco-efficiencyassessment method, especially in preparing the first multi-stakeholder workshop.
An eco-efficiency ratio has two main components, each with itsown indicators:
� Economic indicators: Total Value Added (TVA) by the water-service system and related production process in the valuechain. ‘Total’ denotes the economic value minus various costs ofinputs, water abstraction, treatment, WWT, etc.
� Environmental indicators: a standard set of midpoint impactcategories, e.g. climate change, ozone depletion, eutrophication,human toxicity, eco-toxicity, acidification, resource depletion,etc. (JRC, 2011). For each case study, data were collected on themost important environmental parameters (e.g. material inputs,energy inputs and their source, pollutants, etc.) and were con-verted into the JRC mid-point indicators. Impacts were adjustedto each context; for example, water abstraction per se has arelatively lower ‘freshwater ecosystem impact’ in a water-abundant context.
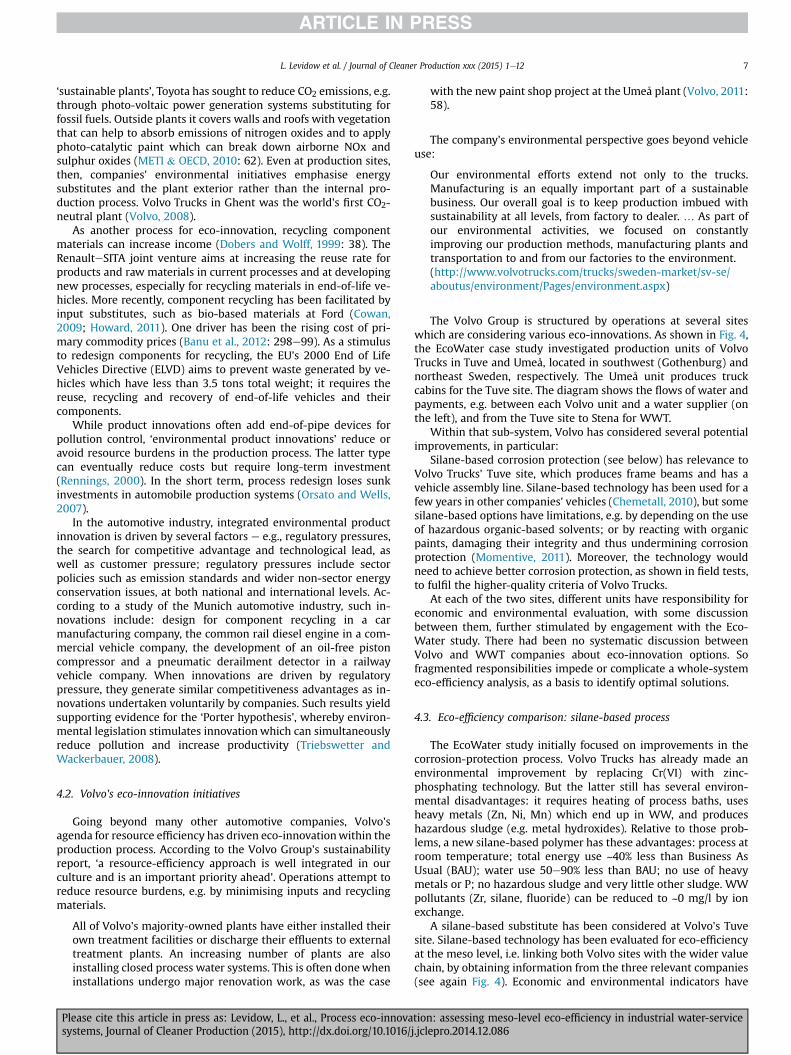
For each case study, both indicators encompass potentialchanges and their effects at multiple sites in a value chain. Datacamemainly from company sources where available and otherwisefrom LCA documents (EcoWater, 2012a). Each production site wasthe focus for comparing improvement options with the baselinesituation and with each other. Results were depicted in spider-typediagrams, comparing the resource burdens of each option with thebaseline situation (e.g. Figs. 5 and 6).
A meso-level assessment has different boundaries thanmethods which encompass all stages of a product's origin and fate.In particular, green supply-chain management means ‘integratingenvironmental thinking into supply chain management, includingproduct design, material sourcing and selection, manufacturingprocess, delivery of the final product to the consumers as well asend-of-life management of the product after its useful life’(Srivastava, 2007: 55). LCA likewise encompasses product use anddisposal.
By contrast to a product focus, a meso-level eco-efficiencyassessment compares options for upgrading a production processand/or a product's value through interactions among heteroge-neous actors. More specifically, the EcoWater method assesses thevalue added by the water-service role, divided by all its resourceburdens, e.g. of producing inputs and treating effluents. The meso-level assessment generally excludes product use and disposal,whose effects lie beyond potential improvements in or from the
Fig. 4. Meso-level water-service system acros
Please cite this article in press as: Levidow, L., et al., Process eco-innovasystems, Journal of Cleaner Production (2015), http://dx.doi.org/10.1016/j
water-service value chain. An exception is an urban water-supplysystem, where the water itself is the main product; its disposalvia wastewater and thus the resource burdens could be changed byearlier stages (e.g., Ribarova et al., 2014, also from the EcoWaterproject).
A related methodological issue, which could be either a limita-tion or a flexible advantage, is where to set the meso-level (whole-system) boundary; this was not initially obvious. The boundaryjudgement depends partly on the resource burdens being priori-tised, the improvement options being assessed and their in-teractions with a wider value chain, as in the case studies below.Where a motor vehicle's cabin is transferred across sites in a pro-duction process, a broad system boundary helps to compareimprovement options at both sites and to identify any interactivechanges in resource burdens (Fig. 4 below; EcoWater, 2014a: 39).Dairies depend on a large transport of milk, milk powder and othermilk ingredients by other companies, so a broad system boundaryhelps to identify options to reduce such transport and its resourceburdens (EcoWater, 2014a: 29). Such boundary judgements relateto how eco-innovation potentially improves a meso-level system.
Another methodological issue has been how to obtain adequate,relevant data. Its availability has sometimes guided the choice of aspecific site for a case study. Applying the method can be morestraightforward for the baseline situation, which already has reli-able data from operational experience. For a new technology, bycontrast, data may depend on some assumptions and extrapola-tions, so this poses a methodological limitation. By estimating therange of uncertainty for indicators, the assessment can knowwhether or how uncertainty affects the comparison of technologyoptions e the main aim.
To explore the above issues, this paper draws on two casestudies of manufacturing processes e Volvo Trucks and Arla Foods.Each has internal drivers beyond any regulatory requirements.Relative to its wider industrial sector, each company representsstrong prospects for eco-innovation in water-service processes.
Each case will be presented along the following lines:
� the sector-wide context for the company's eco-innovationagenda;
� the company's internal drivers and responsibilities for linkingeconomic value with lower resource burdens;
� the company's eco-innovation already adopted or beingconsidered;
� meso-level eco-efficiency assessment of one option as a meth-odological example;
� multi-stakeholder involvement in evaluating options.
Let us examine the above aspects of our two case studies in turn.
s two Volvo plants Credit: IVL, Goteborg.
tion: assessing meso-level eco-efficiency in industrial water-service.jclepro.2014.12.086
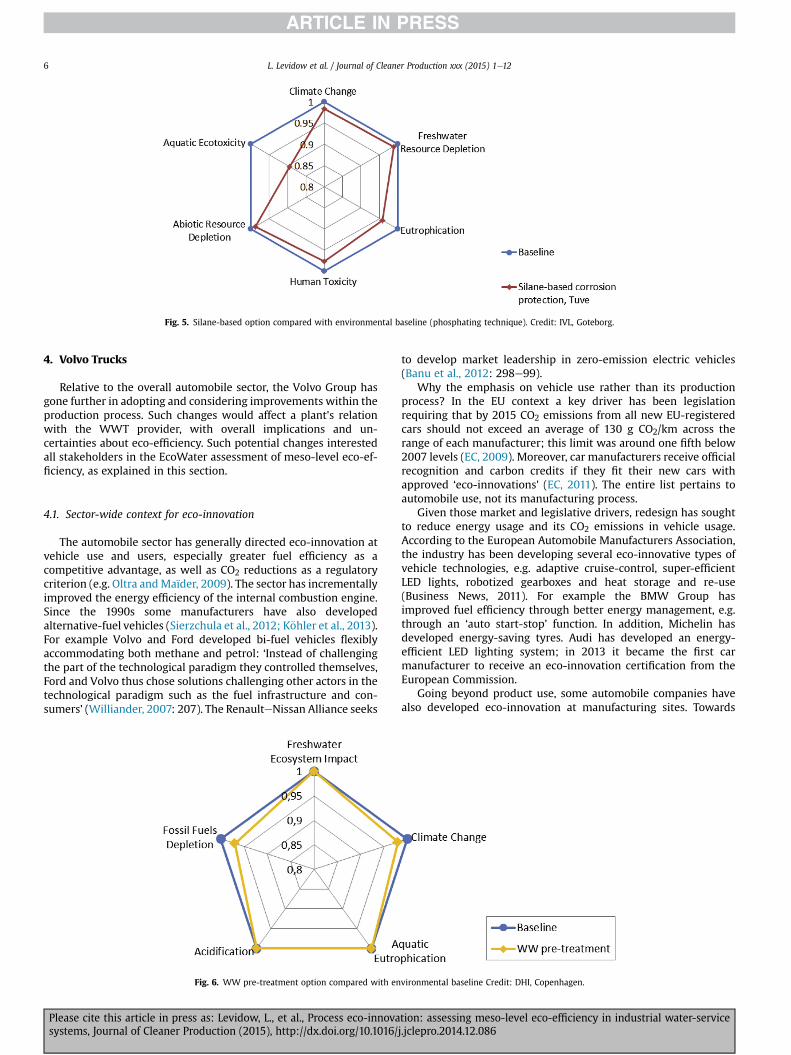
Fig. 5. Silane-based option compared with environmental baseline (phosphating technique). Credit: IVL, Goteborg.
L. Levidow et al. / Journal of Cleaner Production xxx (2015) 1e126
4. Volvo Trucks
Relative to the overall automobile sector, the Volvo Group hasgone further in adopting and considering improvements within theproduction process. Such changes would affect a plant's relationwith the WWT provider, with overall implications and un-certainties about eco-efficiency. Such potential changes interestedall stakeholders in the EcoWater assessment of meso-level eco-ef-ficiency, as explained in this section.
4.1. Sector-wide context for eco-innovation
The automobile sector has generally directed eco-innovation atvehicle use and users, especially greater fuel efficiency as acompetitive advantage, as well as CO2 reductions as a regulatorycriterion (e.g. Oltra andMaïder, 2009). The sector has incrementallyimproved the energy efficiency of the internal combustion engine.Since the 1990s some manufacturers have also developedalternative-fuel vehicles (Sierzchula et al., 2012; K€ohler et al., 2013).For example Volvo and Ford developed bi-fuel vehicles flexiblyaccommodating both methane and petrol: ‘Instead of challengingthe part of the technological paradigm they controlled themselves,Ford and Volvo thus chose solutions challenging other actors in thetechnological paradigm such as the fuel infrastructure and con-sumers’ (Williander, 2007: 207). The RenaulteNissan Alliance seeks
Fig. 6. WW pre-treatment option compared with en
Please cite this article in press as: Levidow, L., et al., Process eco-innovasystems, Journal of Cleaner Production (2015), http://dx.doi.org/10.1016/
to develop market leadership in zero-emission electric vehicles(Banu et al., 2012: 298e99).
Why the emphasis on vehicle use rather than its productionprocess? In the EU context a key driver has been legislationrequiring that by 2015 CO2 emissions from all new EU-registeredcars should not exceed an average of 130 g CO2/km across therange of each manufacturer; this limit was around one fifth below2007 levels (EC, 2009). Moreover, car manufacturers receive officialrecognition and carbon credits if they fit their new cars withapproved ‘eco-innovations' (EC, 2011). The entire list pertains toautomobile use, not its manufacturing process.
Given those market and legislative drivers, redesign has soughtto reduce energy usage and its CO2 emissions in vehicle usage.According to the European Automobile Manufacturers Association,the industry has been developing several eco-innovative types ofvehicle technologies, e.g. adaptive cruise-control, super-efficientLED lights, robotized gearboxes and heat storage and re-use(Business News, 2011). For example the BMW Group hasimproved fuel efficiency through better energy management, e.g.through an ‘auto start-stop’ function. In addition, Michelin hasdeveloped energy-saving tyres. Audi has developed an energy-efficient LED lighting system; in 2013 it became the first carmanufacturer to receive an eco-innovation certification from theEuropean Commission.
Going beyond product use, some automobile companies havealso developed eco-innovation at manufacturing sites. Towards
vironmental baseline Credit: DHI, Copenhagen.
tion: assessing meso-level eco-efficiency in industrial water-servicej.jclepro.2014.12.086
L. Levidow et al. / Journal of Cleaner Production xxx (2015) 1e12 7
‘sustainable plants’, Toyota has sought to reduce CO2 emissions, e.g.through photo-voltaic power generation systems substituting forfossil fuels. Outside plants it covers walls and roofs with vegetationthat can help to absorb emissions of nitrogen oxides and to applyphoto-catalytic paint which can break down airborne NOx andsulphur oxides (METI & OECD, 2010: 62). Even at production sites,then, companies' environmental initiatives emphasise energysubstitutes and the plant exterior rather than the internal pro-duction process. Volvo Trucks in Ghent was the world's first CO2-neutral plant (Volvo, 2008).
As another process for eco-innovation, recycling componentmaterials can increase income (Dobers and Wolff, 1999: 38). TheRenaulteSITA joint venture aims at increasing the reuse rate forproducts and raw materials in current processes and at developingnew processes, especially for recycling materials in end-of-life ve-hicles. More recently, component recycling has been facilitated byinput substitutes, such as bio-based materials at Ford (Cowan,2009; Howard, 2011). One driver has been the rising cost of pri-mary commodity prices (Banu et al., 2012: 298e99). As a stimulusto redesign components for recycling, the EU's 2000 End of LifeVehicles Directive (ELVD) aims to prevent waste generated by ve-hicles which have less than 3.5 tons total weight; it requires thereuse, recycling and recovery of end-of-life vehicles and theircomponents.
While product innovations often add end-of-pipe devices forpollution control, ‘environmental product innovations’ reduce oravoid resource burdens in the production process. The latter typecan eventually reduce costs but require long-term investment(Rennings, 2000). In the short term, process redesign loses sunkinvestments in automobile production systems (Orsato and Wells,2007).
In the automotive industry, integrated environmental productinnovation is driven by several factors e e.g., regulatory pressures,the search for competitive advantage and technological lead, aswell as customer pressure; regulatory pressures include sectorpolicies such as emission standards and wider non-sector energyconservation issues, at both national and international levels. Ac-cording to a study of the Munich automotive industry, such in-novations include: design for component recycling in a carmanufacturing company, the common rail diesel engine in a com-mercial vehicle company, the development of an oil-free pistoncompressor and a pneumatic derailment detector in a railwayvehicle company. When innovations are driven by regulatorypressure, they generate similar competitiveness advantages as in-novations undertaken voluntarily by companies. Such results yieldsupporting evidence for the ‘Porter hypothesis’, whereby environ-mental legislation stimulates innovationwhich can simultaneouslyreduce pollution and increase productivity (Triebswetter andWackerbauer, 2008).
4.2. Volvo's eco-innovation initiatives
Going beyond many other automotive companies, Volvo'sagenda for resource efficiency has driven eco-innovationwithin theproduction process. According to the Volvo Group's sustainabilityreport, ‘a resource-efficiency approach is well integrated in ourculture and is an important priority ahead’. Operations attempt toreduce resource burdens, e.g. by minimising inputs and recyclingmaterials.
All of Volvo's majority-owned plants have either installed theirown treatment facilities or discharge their effluents to externaltreatment plants. An increasing number of plants are alsoinstalling closed process water systems. This is often donewheninstallations undergo major renovation work, as was the case
Please cite this article in press as: Levidow, L., et al., Process eco-innovasystems, Journal of Cleaner Production (2015), http://dx.doi.org/10.1016/j
with the new paint shop project at the Umeå plant (Volvo, 2011:58).
The company's environmental perspective goes beyond vehicleuse:
Our environmental efforts extend not only to the trucks.Manufacturing is an equally important part of a sustainablebusiness. Our overall goal is to keep production imbued withsustainability at all levels, from factory to dealer. … As part ofour environmental activities, we focused on constantlyimproving our production methods, manufacturing plants andtransportation to and from our factories to the environment.(http://www.volvotrucks.com/trucks/sweden-market/sv-se/aboutus/environment/Pages/environment.aspx)
The Volvo Group is structured by operations at several siteswhich are considering various eco-innovations. As shown in Fig. 4,the EcoWater case study investigated production units of VolvoTrucks in Tuve and Umeå, located in southwest (Gothenburg) andnortheast Sweden, respectively. The Umeå unit produces truckcabins for the Tuve site. The diagram shows the flows of water andpayments, e.g. between each Volvo unit and a water supplier (onthe left), and from the Tuve site to Stena for WWT.
Within that sub-system, Volvo has considered several potentialimprovements, in particular:
Silane-based corrosion protection (see below) has relevance toVolvo Trucks' Tuve site, which produces frame beams and has avehicle assembly line. Silane-based technology has been used for afew years in other companies' vehicles (Chemetall, 2010), but somesilane-based options have limitations, e.g. by depending on the useof hazardous organic-based solvents; or by reacting with organicpaints, damaging their integrity and thus undermining corrosionprotection (Momentive, 2011). Moreover, the technology wouldneed to achieve better corrosion protection, as shown in field tests,to fulfil the higher-quality criteria of Volvo Trucks.
At each of the two sites, different units have responsibility foreconomic and environmental evaluation, with some discussionbetween them, further stimulated by engagement with the Eco-Water study. There had been no systematic discussion betweenVolvo and WWT companies about eco-innovation options. Sofragmented responsibilities impede or complicate a whole-systemeco-efficiency analysis, as a basis to identify optimal solutions.
4.3. Eco-efficiency comparison: silane-based process
The EcoWater study initially focused on improvements in thecorrosion-protection process. Volvo Trucks has already made anenvironmental improvement by replacing Cr(VI) with zinc-phosphating technology. But the latter still has several environ-mental disadvantages: it requires heating of process baths, usesheavy metals (Zn, Ni, Mn) which end up in WW, and produceshazardous sludge (e.g. metal hydroxides). Relative to those prob-lems, a new silane-based polymer has these advantages: process atroom temperature; total energy use ~40% less than Business AsUsual (BAU); water use 50e90% less than BAU; no use of heavymetals or P; no hazardous sludge and very little other sludge. WWpollutants (Zr, silane, fluoride) can be reduced to ~0 mg/l by ionexchange.
A silane-based substitute has been considered at Volvo's Tuvesite. Silane-based technology has been evaluated for eco-efficiencyat the meso level, i.e. linking both Volvo sites with the wider valuechain, by obtaining information from the three relevant companies(see again Fig. 4). Economic and environmental indicators have
tion: assessing meso-level eco-efficiency in industrial water-service.jclepro.2014.12.086

L. Levidow et al. / Journal of Cleaner Production xxx (2015) 1e128
been selected and elaborated as follows (for details see EcoWater,2014b).
4.3.1. Economic assessmentTVA is generally the water-service value minus costs of inputs
and WWT across the meso-level system. The former would remainthe same with the silane-based option, assuming that trucks wouldhave the same product quality and thus the same economic value asbefore (EcoWater, 2014a). Silane-based technology could use thesame infrastructure (baths and pipes) as the current process; thedifferent chemical inputs have costs comparable with the currentchemicals.
WWTcosts generally depend onWWcomposition and quantity,sludge disposal costs and energy costs; data for the baseline contextcame from the WWT company and from the LCA database Ecoin-vent. The silane-based option would reduce water use, as well astheWWquantity and emissions content. The lower quantity wouldsave WWT costs for the Tuve site e and thus lose such income forStena. There is no information (and thus uncertainty) aboutwhether the lower-emission content would lower Stena's unit feefor WWT.
The total costs of water and water-related inputs would besomewhat reduced for all three companies (Volvo, its water sup-plier andWWT) because lower-quantity water use andWWTmeana lower electricity demand for pumps and less use of chemicals. Onthe above assumptions about the silane-based option, the TVAslightly rises through lower costs for water-inputs.
More significantly, the TVA would be redistributed across themeso-level value chain. The Tuve site would pay the water-supplycompany for less water and would pay the WWT company Stenafor much less WW to treat. Both water-service companies wouldlose income, especially Stena; each company's change in net eco-nomic performance is shown in Table 1 below. These distributionalissues highlight the importance of stakeholder discussions on eco-efficiency improvements before any investment decisions.
4.3.2. Environmental assessmentFor the midpoint impact indicators (JRC, 2011), data came from
Volvo Trucks' tests and Open Access data sources. Fig. 5 comparesthe silane-based option (diamond-shaped nodes) with the baselinesituation (circle-shaped nodes); the former offers environmentalimprovements through several parameters, i.e. specific compo-nents or contributors to the above environmental indicators. Im-provements appear mainly in aquatic ecotoxicity andeutrophication, due to reduced emissions to water of heavy metalsand phosphorus. Although the silane process significantly reducesthe water input, the overall improvement appears negligiblebecause the Umeå site uses relatively much more water and theabundant freshwater sources have a low exploitation index.
4.4. Volvo workshops
In March 2013 the EcoWater project held a Gothenburg work-shopwhich brought together representatives from themain actors:
Table 1Redistribution of economic value and environmental burdens in the silane-basedoption.
Kretslopp & Vatten:water supply
Volvo Trucks:water supply,use and WWT
Stena Recycling:WWT
Eco-efficiencyof total valuechain
Econ. D Econ. � Econ. þ Econ. � IncreaseEnv. D Env. þ Env. þ Env. þ
Positive signs denote greater economic value or environmental improvement.
Please cite this article in press as: Levidow, L., et al., Process eco-innovasystems, Journal of Cleaner Production (2015), http://dx.doi.org/10.1016/
Volvo Technology (VTEC), Volvo Trucks, Stena Recycling (the latter'scontractor for WWT) and the Swedish Agency for Marine andWater Management (HaV). As reported in a presentation, VolvoTrucks has been adopting or considering various innovative pro-cesses within a holistic view of resources, emissions, quality, andsafety. It attempts to ‘Avoid-reduce-recycle’ waste. Closed-loopsystems have several advantages in cost savings, resource recy-cling and product quality (Lindskog, 2013).
The VTEC representative described resource interdependenciesamong the various stages, as summarised in the workshop report:
Water and energy demands at the Umeå production site dependpartly on the scheduling between the different steps of the anti-corrosion surface treatment process, while water use efficiencydepends on the overall process design and the selected tech-nologies … The largest water consumption is associated withthe pre-treatment step metal surface treatment before painting,including degreasing and methods for corrosion protection),and the painting processes which use liquid coatings (EcoWater,2013b: 33e34).
In the discussion a VTEC participant noted: When evaluatingeco-efficiency of a technology, a whole-systems perspective willreduce the risk of sub-optimization.
Stena described the two companies' interdependencies, makingcooperation more important:
Volvo provides information on the generated wastewater, thussimplifying the treatment processes, while Stena Recycling in-forms Volvo concerning the quality of the received wastewater,thus providing feedback on the production processes. If Volvoimproved its environmental performance and generated efflu-ents of better quality, it would be easier for Stena Recycling tocomply with the regulations. Highly polluted effluents increasethe cost of the treatment process. The set-up of businessagreements with Volvo, which would benefit both sides, can beenhanced by working more closely together as part of a com-mon system e e.g. variable rate, flat rate, fee for extra pollution(EcoWater, 2013b: 35e36).
According to the company, silane-based technology would haveseveral advantages, allowing ‘lower resource consumption and lesswaste’, if the technology is shown to protect the truck bodies suf-ficiently from corrosion (Lindskog, 2013). An EcoWater presenta-tion compared the eco-efficiency of silane technology with thebaseline scenario (as in Fig. 5 above).
For the silane-based alternative, workshop comments identifiedtwo different uncertainties e about efficacy and regulatory stan-dards. The technology needs to demonstrate adequate efficacy forVolvo Trucks before commercial use. Volvo is putting its trucksthrough a commercial test for at least two years; if the corrosion-protection is proven adequate, then costs are already known. Therelevant Bref document compares Cr(VI) with phosphating tech-niques; it briefly mentions silane-based alternatives, without anevaluation regarding BAT standards (CEC, 2006). As this gap illus-trates, companies face uncertainty about whether the authoritieswill accept such alternative as ‘best available’ technology. AlthoughBAT standards have provided a common minimum, future uncer-tainty potentially serves as a limit of eco-innovation.
Workshop conclusions emphasised the need for multi-stakeholder cooperation to optimise whole-system improve-ments. In particular:
The proposed silane-based technology can improve eco-efficiency of the Volvo Trucks water system.
tion: assessing meso-level eco-efficiency in industrial water-servicej.jclepro.2014.12.086

L. Levidow et al. / Journal of Cleaner Production xxx (2015) 1e12 9
Water recycling is a promising option for improving the per-formance of water-consuming production processes.
Case-specific indicators that take into account the potentialdrawbacks from adopting new technologies should be consid-ered in the analysis. This is to avoid introducing a problem thatdid not exist in the initial technology and so lay outside thebaseline evaluation.
Technologies should be selected for improving the whole sys-tem, not only in the specific processes where they are imple-mented, in order to avoid sub-optimisation. Sub-optimisationcan be more easily avoided through stakeholder cooperation inevaluating the overall system. Organization of the different‘players’ towards a common goal can increase cooperationamong actors that perhaps unknowingly share a mutual interestin environmental protection (EcoWater, 2013: 37e38).
Thus both major stakeholders showed interest in jointlyassessing the eco-efficiency of options for improving the meso-level sub-system.
Held in May 2014, a follow-up workshop discussed moreimprovement options and stakeholder cooperation on investmentdecisions. The EcoWater case-study team presented spider dia-grams of environmental impact and eco-efficiency, showing smallimprovements in most indicators but also slightly worse result insome indicators, unlike the silane-based option. Stena Recyclingasked Volvo for early information about test runs of any newtechnology and for WW samples, in order to plan well before achange happens (IVL, 2014).
At that workshop an interactive exercise explored barriers anddrivers of potential improvements by considering standard cate-gories from scenario-analysis (Van der Heijden, 2005). Among themost important factors, participants identified the following: Eco-nomic: electricity price, Environmental: use and regulation ofpersistent chemicals, Political: policy on scarce resources, espe-cially phosphorous and metals. The exercise anticipated plausiblevariations in their future trends and how these may drive orimpede innovative practices at Volvo Trucks (IVL, 2014). A follow-up exercise could analyse whether each technological optionwould be robust across the various potential futures.
5. Arla Foods
Relative to the overall dairy sector, Arla Foods has gone furtherin adopting and assessing fundamental improvements in water-based processes, which would also change a plant's relation withthe water supply and WWT provider. Such potential changesinterested all stakeholders in the EcoWater assessment of meso-level eco-efficiency, as explained in this section.
5.1. Sector-wide context for eco-innovation
Dairies have many opportunities for linking economic valuewith environmental benefits. Initial energy savings have beenmade with minimal capital investment. Dairies have reduced en-ergy usage for membrane filtration, heating and cooling of prod-ucts, and spray drying. Greater energy savings may depend on new,more energy-efficient technologies through a process change.Some dairies have been ‘reducing the amount of milk that is lost tothe effluent stream and reducing the amount of water used forcleaning’, as well as reducing chemical usage (COWI, 2000: 28).
Some modest improvements have been stimulated by EU reg-ulations, which give priority to pollution prevention over treatment(EC, 1996). Permits authorise specific technologies and/or
Please cite this article in press as: Levidow, L., et al., Process eco-innovasystems, Journal of Cleaner Production (2015), http://dx.doi.org/10.1016/j
emissions (Honkasalo et al., 2005). In many member states such asDenmark, environmental licences set limits on water use anddischarge.
Dairies still have great potential to reuse water, especially frommilk, which has a water content of more than 85%. Reuse can beexpanded if the water quality can be assured through extra treat-ment technologies for upgrading rinse-water,, cleaning-in-place(CIP) rinse water, cooling water, pump and separator seal water,condensate, casein wash water and membrane-system permeates(Rad and Lewis, 2014: 5).
The UK dairy and food industries jointly launched a 2008roadmap to take resource efficiency beyond conventionalmeasures:
Dairy companies worked with a number of other bodies andsectors throughout 2010 in exploring future technology toreduce further the impact on the environment. One of theseinitiatives will take dairy processing beyond the traditionalcarbon management and energy efficiency approach. This willlook in detail at production strategies, processes and equipmentto identify and implement innovative and novel technologies indairy processing. (Dairy Supply Chain Forum, 2011: 18).
A report on the Irish dairy industry emphasised reductions inenergy use and GHG emissions (Enterprise Ireland, 2011). Accord-ing to a recent report, Arla took the lead in water-process im-provements, i.e. anaerobic digestion of wastewater at some UKplants (Dairy Roadmap, 2013: 49).
5.2. Arla's eco-innovation initiatives
As the broader context for eco-innovation, Arla Foods has beenundergoing some restructuring, which may result in fewer, largerand more specialised dairies. Greater concentration poses the issueof cleaner production: whether or how the process design couldinternalise and/or recycle resource-flows among production units.Relative to eco-innovation in the European dairy industry, ArlaFoods has already been adopting and considering major changes inthe water-service process.
Arla Dairies own approx. 40% of dairies in Denmark and manyabroad, especially resulting from an expansion policy (Arla Foods,2013: 2). EU milk quotas may be relaxed, thus increasing the sup-ply, yet extra milk products cannot find consumers on a static Eu-ropean market. Given those limits, Arla's expansion aims to exporthigh-quality or speciality milk powder. For example, arrangementswith China aim to expand markets there: ‘The milk powder facilityat Vimmerby in Sweden will also be extended to allow for moreproduction to increase export to non-European countries’ (ArlaFoods, 2013: 2). But powder production requires enormousextraction of water and thus energy inputs.
Arla plants have already adopted resource-efficiency measures,e.g. CIP systems to minimise water use and effluent. Waterextracted from milk is reused in rinsing casein protein eand in CIP.Expanding renewable energy sources, ‘the milk powder plant inVisby now receives about 40 per cent of its energy as biogas, whichis purchased from a unit that generates biogas mainly frommanurefrom farms’ (Arla Foods, 2013: 27). Biogas is also produced fromArla's biosolids and from the municipal WW sludge treating thedairy's WW. Lorries transfer large amounts of milk and milk in-gredients among Arla Foods dairies, so reducing water content iningredients would also reduce transport costs and emissions.
Such innovations have been driven by several factors e thecompany's environmental strategy, the need for cost-efficientproduction processes and its consumer reputation. Owned byfarmers and accountable to their representatives, Arla also aims to
tion: assessing meso-level eco-efficiency in industrial water-service.jclepro.2014.12.086

L. Levidow et al. / Journal of Cleaner Production xxx (2015) 1e1210
counter the recent trend towards lower farm-gate milk prices (ArlaFoods, 2013: 3).
Since at least 2008 Arla Foods has adopted and implemented astrategy, ‘Closer to Nature’, emphasising its commitment to envi-ronmentally sustainable methods. Its Environmental Strategy 2020sets various targets for resource efficiency and conservation. Inparticular, the company will reduce GHG emissions by 25% inproduction and transport by 2020, as well as reducing energy andwater use in production processes by 3% every year (Arla Foods,2011).
Those sustainability targets have become performance targets,to be implemented by each dairy plant in the economically bestway. So environmental and economic aspects are combined in in-vestment decisions. Arla Foods has specialist teams which alreadydeveloped previous innovative practices. But there has been littlesystematic discussion with external actors across the water-servicevalue chain for comparing options.
The EcoWater case study focused on one Arla Foods plant whoseproducts include milk powder. The plant management hasconsidered options to reduce the use of water and energy, along-side the related payments for supply of water, energy and WWT.Options include the following:
anaerobically pre-treating waste water to generate biogas at theplant site reducing water use for pump-sealing water;
removing organic material and microbial growth potential inwater from CIP;
reusing condensate from the water evaporation during powderproduction.
5.3. Eco-efficiency comparison: WW pre-treatment option
For the above option of in-house WW pre-treatment, anaerobicdigestion transforms organic waste products (mainly fats, proteinsand sugars) into energy by producing biogas, which can substitutefor natural gas usage or generate heat and power. The pre-treatment also reduces the organic-waste load on the WWTP andthus its energy usage. Potential changes in eco-efficiency have beenevaluated with the following indicators.
5.3.1. Economic analysisFor the TVA, indicators are freshwater abstracted and process
energy (electricity costs), chemical-input costs, WWT costs (inter-nal or external) and O&M costs. The savings in external paymentsfor WWT would be significantly countered by the extra investmentcost, so the TVA shows a small increase over the baseline scenario(Andersen, 2013). As regards the redistribution, the dairy gainsmost of the increase, while the biogas plant incurs a large loss, asshown in Table 2 (based on EcoWater, 2014b).
Table 2Redistribution of economic value and environmental burdens in the WW pre-treatment option.
Dairy: water use andWWT pre-treatment
WWToperator
Biogasplant
Eco-efficiencyof total value chain
Econ. D Econ. þ Econ. þ Econ. � IncreaseEnv. D Env. þ Env. þ Env. �
5.3.2. Environmental analysisMidpoint impact indicators are: freshwater abstracted, process
energy (GHG emissions), chemicals used (esp. salt and HNO3),pollutant-emissions.
For a meso-level eco-efficiency analysis, the EcoWater studydrew on information from Arla and water companies. Based on thatinformation, the above optionwould have the following changes inresource usage and burdens:
� Production of biogas to substitute natural gas / reduced fossilfuel depletion and CO2 emissions
Please cite this article in press as: Levidow, L., et al., Process eco-innovasystems, Journal of Cleaner Production (2015), http://dx.doi.org/10.1016/
� Reduced load on WWTP / reduced power consumption andCO2 emissions
� Reduced biogas production / reduced downstream power andheat production (Andersen, 2013).
Regarding the latter point, in-house anaerobic pre-treatmentwould reduce the biogas supply to district heating, which thenwould need more fossil fuels. This decrease is compensated by thetotal energy savings in the dairy and WWTP (EcoWater, 2014b).
The result would be a modest reduction in fossil-fuel usage andGHG emissions (by 11%) relative to the baseline scenario. The Fig. 6spider diagram compares the in-house WWT option (diamond-shaped nodes) with the baseline situation (circle-shaped nodes).The former offers modest benefits from a whole-system value-chain perspective; by contrast, benefits would appear greater in amicro-level focus on the dairy per se. So a whole-system assess-ment adds information about how an optionwould affect the largersystem.
5.4. Arla workshops
In October 2013 the EcoWater project held a workshop at thecase-study Arla plant. This started with presentations on thecompany's resource-efficiency objective. For its ‘Closer to Nature’motto, ‘We want to appear as a sustainable and responsible com-pany in balance with our surroundings.’ This effort runs from thefarmer supply chain to the processing plants. For example, Arla'sinnovation seeks a ‘natural’ milk-protein ingredient through a newcaseine process avoiding use of acid hydroxides (Hansesgaard,2013).
Such innovations have been driven by the company's need forcost-efficient production processes and its consumer reputation.The company also anticipates higher environmental taxes, scarcerwater and higher costs in the future. Such drivers have converged inthe company's Environmental Strategy 2020 and specific in-vestments (Nørgaard, 2013).
After those presentations, the EcoWater team presented itswhole-system value-chain assessment of in-house WW pre-treatment, which would offer modest benefits (Andersen, 2013,Fig. 6 above). Arla representatives agreed with that assessment.They saw the EcoWater eco-efficiency assessment method as moregenerally helpful for considering whole-system effects. Theyexpressed interest in several follow-up steps, e.g. applying the eco-efficiency assessment method jointly with the WWT company toother innovative options, and applying the method to a milk-producing dairy plant. The workshop also discussed how the ben-efits of Arla's technological improvementsmay be scale-dependent,e.g. depending on whether they multiply small-scale changes inmany places or else enlarge a centralised operation, requiringlonger-distance transport.
In June 2014 a follow-up workshop discussed the application ofthe eco-efficiency concept to more Danish dairies, both within andoutside the Arla group, with the aim to generate a benchmarkwhich can guide the sector towards higher eco-efficiency. As a firststep towards benchmarking eco-efficiency, workshop participantsagreed to include five cheese-producing dairies through new
tion: assessing meso-level eco-efficiency in industrial water-servicej.jclepro.2014.12.086
L. Levidow et al. / Journal of Cleaner Production xxx (2015) 1e12 11
research activities on water-efficient dairies. The value-chainassessment would enable the dairies (i) to start a discussion oneco-efficient solutions with the water and wastewater utilities and(ii) to assess whether eco-innovative technologies identified inmilkpowder-producing dairies can be applied also in cheese-producingdairies.
6. Discussion and conclusion
Eco-innovation combines economic advantage with lowerresource burdens by various means, including process upgrading inwater-service processes. This study investigated the potential forsuch process improvements in two large manufacturing com-panies, Volvo and Arla. Relative to their respective industrial sector,these companies represent strong prospects for improvements inwater-service processes, especially regarding chemical inputs andwastewater. Impetus comes from the companies' environmentalpolicies, as well as from external drivers such as future higher costsand resource scarcity, beyond legislative requirements. Thesevarious drivers link the companies' efforts towards greater resourceefficiency and lower resource burdens; such improvements resultfrom more than economic motives alone (cf. Clayton et al., 1999;Markusson, 2011).
In particular: The automotive industry has generally directedeco-innovation at fuel efficiency or alternative fuels, or on pollutioncontrol outsidemanufacturing plants; Volvo has also been adoptingor considering changes which lower resource burdens in themanufacturing process. The dairy industry has generally directedeco-innovation at CO2 reductions from renewable energy sources,or on more efficient transport; Arla Foods also has been adopting orconsidering changes which lower resource burdens in water-service processes.
Such eco-innovations involve more complex interactionsbeyond the production site, so the options warrant a whole-systemcomparative assessment. The well-known eco-efficiency concepthelps to evaluate potential improvements by comparison with thebaseline situation. But such evaluation has generally focused onspecific production sites, while neglectingwider effects; thismicro-level focus reinforces sub-optimal solutions and neglects betteropportunities. To address the methodological gap, the EcoWaterproject has analysed the entire water-service value chain throughmeso-level interactions among heterogeneous actors such asprocess-water users, providers and WWT companies.
The project has developed a methodology to obtain the neces-sary information, to involve stakeholders in the assessment and tofacilitate their joint discussion on alternative options. To assessmeso-level eco-efficiency, each study combined information fromrelevant stakeholders and LCA databases, as a knowledge-basis forcomparing specific alternative options with the baseline situation.As methodological limitations, some data depend on assumptionsand extrapolations from past experience. The method also involvesjudgements about where to set the meso-level boundary; this de-pends partly on the resource burdens being prioritised, theimprovement options being assessed and their interactions with awider value chain.
Each study stimulated internal company discussions on theneed and means to evaluate whole-system effects of investmentdecisions. Prior discussions with stakeholders attracted theirattendance at workshops to discuss improvement options and themeso-level eco-efficiency assessment for comparing them. Inter-organisational cooperation helped to anticipate how meso-levelresource-efficiency relates to lower burdens in WWT, e.g. byreducing energy demands and climate impacts.
Multi-stakeholder discussion identified potential benefits orlimitations which have wider relevance. As in the Volvo case, more
Please cite this article in press as: Levidow, L., et al., Process eco-innovasystems, Journal of Cleaner Production (2015), http://dx.doi.org/10.1016/j
advance information would help the WWT company to realise thefull benefits of process improvements in the main company. As inthe Arla case, a company-level improvement can be deceptive asregards resource efficiency. Stakeholders expressed interest injointly discussing investment strategies, as well as extending thewhole-system method to more options and contexts.
The EcoWater assessment method can be extended to anywater-service system which has adequate data for the main aim e
to compare economic and environmental indicators of differentoptions. By involving stakeholders in such comparisons, themethod can facilitate better decisions improving meso-levelresource efficiency. Progress will depend on stakeholders sharingknowledge and responsibility, thus overcoming fragmentationwithin and across companies.
As wider implications, the two improvement options herecomplicate ‘eco-innovation’ as double-eco benefits: winewin forwhom, where and what level? (cf. OECD, 2012). In the Volvo silane-based option, the TVA increases but would be redistributed infavour of the investor company, at the expense of other value-chainactors (see again Table 1). In the Arla WW pre-treatment optionsubstituting biogas for fossil-fuel inputs, likewise the TVA increasesbut is gained mainly by the investor company, at the great expenseof the biogas company. Resource efficiency increases at the dairy'smicro level but little at the meso level, mainly because resourcebenefits are shifted from the biogas company to the investorcompany; WW pre-treatment also somewhat reduces energy useby the WWT operator.
Thus potential benefits have tensions between different stages,actors, micro vs meso levels, etc. These tensions have been revealedthrough a meso-level eco-efficiency assessment, informing multi-stakeholder discussion of each others' perspectives (cf. Grin et al.,2010: 273). Such discussions can help stakeholders to developmutual interests and shared responsibility towards better options.
Acknowledgements
This paper arises from ‘EcoWater: Meso-level eco-efficiencyindicators to assess technologies & their uptake in water use sec-tors’, a collaborative research project of the 7th Framework Pro-gramme, grant agreement no. 282882, coordinated by the NationalTechnical University of Athens (NTUA), http://environ.chemeng.ntua.gr/ecowater/
References
Andersen, M., 2013. The EcoWater approach applied on Arla HOCO. PPt Presentationat Ecowater Workshop, Arla HOCO, Holstebro, 20 September.
Arla Foods, 2011. Environmental Strategy 2020. Arla Foods, Viby, Denmark, andLeeds, UK. http://www.arla.com/about-us/responsibility/nature-and-environment/environmental-strategy.
Arla Foods, 2013. Our Responsibility: Arla Foods' Corporate Social ResponsibilityReport. http://www.arla.com/Global/responsibility/pdf/csr/2013/ArlaCSR_Our%20Responsibility2013_ENG.pdf.
Ayres, R., van der Lugt, F., 2011. Manufacturing: Investing in Energy and ResourceEfficiency. UNEP.
Banu, E., Paraschiv, D., Dorobantu, R., 2012. Achieving eco-innovation throughstrategic alliances: case study of Renault strategic alliances. Rom. Econ. J. 46,291e301.
Carrillo-Hermosilla, J., del Río, P., K€onn€ol€a, T., 2010. Diversity of eco-innovations:reflections from selected case studies. J. Clean. Prod. 18, 1073e1083.
CEC, 2006. Integrated Pollution Prevention and Control Reference Document [Bref]on Best Available Techniques for the Surface Treatment of Metals and Plastics.European Commission, Brussels.
Chemetall, 2010. Oxsilan: Update, by Thomas Willumeit. http://www.materialsfinishing.org/attach/CAT%20OXSILAN%20internet.pdf.
Chemwater, 2013. Report on Chemistry-Water Synergies Based on the Analysis ofWssTP and SusChem Documents Including a Basic Analysis and the Analysis ofthe Other Relevant ETPs, NoEs, Networks. Report 2.1&2.2 of Project, ‘Coordi-nating European Strategies on Sustainable Materials, Processes and EmergingTechnologies Development in Chemical Process and Water Industry across
tion: assessing meso-level eco-efficiency in industrial water-service.jclepro.2014.12.086
L. Levidow et al. / Journal of Cleaner Production xxx (2015) 1e1212
Technology Platforms. http://chemwater.eu/index.php/Chemistry-Water-synergies/Chemistry-Water-synergies.html.
Clayton, A., Spinardi, G., Williams, R., 1999. Policies for Cleaner Technology: a NewAgenda for Government and Industry. Earthscan, London.
Cowan, L. 2009. Ford investigates coconuts as replacement for petroleum in carparts, Inhabitat, 11 October, http://inhabitat.com/ford-investigates-coconuts-as-replacement-for-petroleum-in-car-parts/.
COWI, 2000. Cleaner Production Assessment in Dairy Processing. Prepared by COWIConsulting Engineers and Planners AS, Denmark, for UNEP Division of Tech-nology, Industry and Economics and Danish EPA. http://www.unep.fr/shared/publications/pdf/2480-CpDairy.pdf.
Dairy Roadmap, 2013. Dairy Roadmap: Environmental Sustainability Report 2013.http://www.dairyco.org.uk/resources-library/research-development/environment/dairy-roadmap-2013/.
Dairy Supply Chain Forum, 2011. Dairy Roadmap: Our Route Towards Environ-mental Success, (UK) Dairy Supply Chain Forum's Sustainable Consumption andProduction Taskforce.
De Marchi, V., Di Maria, E., Micelli, S., 2013. Environmental strategies, upgradingand competitive advantage in global value chains. Bus. Strategy Environ. 22,62e72.
Del Río, P., Carrillo-Hermosilla, J., K€onn€ol€a, T., 2010. Policy strategies to promoteeco-innovation. J. Ind. Ecol. 14 (4), 541e557.
Dobers, Wolff, R., 1999. Eco-efficiency and dematerialization: scenarios for newindustrial logics in recycling industries, automobile and household appliances.Bus. Strategy Environ. 8 (1), 31e45.
EC, 1996. Council Directive 96/61/EC of 24 September 1996 concerning integratedpollution prevention and control. Off.J. L 257, 1e26.
EC, 2009. Regulation 443/2009 of the European Parliament and of the Council of 23April 2009 Setting Emission Performance Standards for New Passenger Cars asPart of the Community's Integrated Approach to Reduce CO2 Emissions fromLight-duty Vehicles.
EC, 2011. Commission Implementing Regulation (EU) No 725/2011 of 25 July 2011Establishing a Procedure for the Approval and Certification of InnovativeTechnologies for Reducing CO2 Emissions from Passenger Cars Pursuant toRegulation (EC) No 443/2009 of the European Parliament and of the CouncilText with EEA Relevance.
EcoWater, 2012a. D1.1: Review and Selection of Eco-efficiency Indicators to be usedin the EcoWater Case Studies. http://environ.chemeng.ntua.gr/ecowater/UserFiles/files/D1_1_Review_and_selection_of_eco-efficiency_indicators.pdf.
EcoWater, 2012b. D1.8: Roadmap for Case Study Development [Restricted dissem-ination level].
EcoWater, 2013a. Upgrading the Water Use Value. Innovative Technologies in theWater Use Sector: a Proposal for the EcoWater Case Studies [Restricteddissemination].
EcoWater, 2013b. D6.1 Synthesis Report from the 1st Round of Case Study Events.http://environ.chemeng.ntua.gr/ecoWater/UserFiles/files/D6_1_Final%281%29.pdf.
EcoWater, 2014a. D4.2 Baseline Eco-efficiency Assessment of Water Use in Indus-trial Sectors (Case Study 5-8). http://environ.chemeng.ntua.gr/ecoWater/UserFiles/files/D4_2%20Baseline%20eco-efficiency%20assessment%20of%20water%20use%20in%20industrial%20sectors.pdf.
EcoWater, 2014b. D4.4 Technology Assessment and Scenario Analysis for IndustryCase Studies [forthcoming].
EIO, 2011a. Eco-innovation Challenge: Pathways to a Resource Efficient Europe. Eco-Innovation Observatory (EIO), Brussels. Funded by the European Commission,DG Environment.
EIO., 2011b. Water Innovation: How Eco-innovation Can Contribute to the Sus-tainability of Europe‘s Water Resources. Eco-Innovation Observatory (EIO),Brussels. Funded by the European Commission, DG Environment.
Enterprise Ireland, 2011. Resource Efficiency in Ireland's Dairy Processing Sector.http://www.dairy-sustainability-initiative.org/Public/CaseStudy.php?ID¼2834.
Grin, J., Rotmans, J., Schot, J.W. (Eds.), 2010. Transitions to Sustainable Development:New Directions in the Study of Long Term Transformative Change. Routledge,London.
Hansesgaard, K., 2013. PPt Presentation at Ecowater Workshop, Arla HOCO, Hol-stebro, 20 September.
Hoffr�en, J., 2001. Measuring the Eco-efficiency of Welfare Generation in a NationalEconomy: the Case of Finland. Academic Dissertation. Univ. of Tampere.
Honkasalo, N., Rodhe, H., Dalhammar, C., 2005. Environmental permitting as adriver for eco-efficiency in the dairy industry: a closer look at the IPPC direc-tive,. J. Clean. Prod. 13 (10e11), 1049e1060.
Howard, B., 2011. Ford to Complement Soy Car Seats with Coconut-composite BodyParts, Extreme Tech, 10 October. http://www.extremetech.com/extreme/99249-ford-to-complement-soy-car-seats-with-coconut-composite-body-parts.
Huppes, G., Ishikawa, M., 2009. Eco-efficiency guiding micro-level actions towardssustainability: ten basic steps for analysis. Ecol. Econ. 68, 1687e1700.
Huppes, G., Kleijn, R., Huele, R., Ekins, P., Shaw, B., Esders, M., Schaltegger, S., 2008.Measuring Eco-innovation: Framework and Typology of Indicators Based onCausal Chains. Final Report of the ECODRIVE Project, CML. University of Leiden.http://www.eco-innovation.eu/wiki/images/Ecodrive_final_report.pdf.
ISO, 2012. ISO 14045: Environmental Management - Eco-efficiency Assessment ofProduct Systems - Principles, Requirements and Guidelines. International Stan-dards Organisation. http://www.iso.org/iso/catalogue_detail?csnumber¼43262.
Please cite this article in press as: Levidow, L., et al., Process eco-innovasystems, Journal of Cleaner Production (2015), http://dx.doi.org/10.1016/
IVL, 2014. Outcomes and discussions of the second Automotive Industry (Volvo)Workshop, Gothenburg held on 6 May 2014.
Jollands, N., Lermit, J., Patterson, M., 2004. Aggregate eco-efficiency indicators forNew Zealand: a principal components analysis. J. Environ. Manag. 73 (4),293e305. http://www.ncbi.nlm.nih.gov/pubmed/15531388.
JRC, 2011. International Reference Life Cycle Data System (ILCD) Handbook: Rec-ommendations for Life Cycle Impact Assessment in the European Context, Firsted. Publication Office of the European Union, Luxembourg. European Com-mission e Joint Research Centre e Institute for Environment and Sustainability.
K€ohler, J., Schade, Wolfgang, Leduc, Guillaume, Wiesenthal, Tobias,Schade, Burkhard, Tercero Espinoza, Luis, 2013. Leaving fossil fuels behind? aninnovation system analysis of low carbon cars. J. Clean. Prod. 48, 176e186.
Lindskog, N., 2013. Volvo Trucks Water Consuming Processes (VTEC), Ppt presen-tation at EcoWater workshop, Goteburg. Volvo Technology, ATR, Sweden.
Markusson, N., 2011. Unpacking the black box of cleaner technology. J. Clean. Prod.19, 294e302.
METI, OECD, 2010. Analysing National Policies and Business Best Practices on Eco-innovation. Ministry of Economy, Trade and Industry (METI) & OECD, Tokyo.
Michelsen, O., Fet, A., Dahlsrud, A., 2006. Eco-efficiency in extended supply chains:a case study of furniture production. J. Environ. Manag. 79 (3), 290e297.
Mol, S., Gee, D., 1999. Making Sustainability Accountable: Eco-efficiency, ResourceProductivity and Innovation. Topic report No.11. European Environment Agency,Copenhagen.
Momentive, 2011. Waterborne Silane Conversion Coating for Replacement ofPhosphate/Chromate Pretreatments. Marketing Bulletin. www.momentive.com.
Nørgaard, R., 2013. Arla Foods’ Environmental Strategy 2020. PPt presentation [andextra comments] at Ecowater workshop, Arla HOCO, Holstebro, 20 September.
OECD., 2009. Sustainable Manufacturing and Eco-innovation: Towards a GreenEconomy. Policy Brief, June.
OECD., 2012. The Future of Eco-innovation: the Role of Business Models in GreenTransformation. http://www.oecd.org/innovation/inno/49537036.pdf.
Oltra, V., Maïder, S.-J., 2009. Sectoral systems of environmental innovation: anapplication to the French automotive industry. Technol. Forecast. Soc. Change76 (4), 567e583.
Orsato, R.J., Wells, P., 2007. U-turn: the rise and demise of the automobile industry.J. Clean. Prod. 15, 994e1006.
Rad, S.J., Lewis, M.J., 2014. Water utilisation, energy utilisation and waste watermanagement in the dairy industry: a review. Int. J. Dairy Technol. 67 (1), 1e20.http://onlinelibrary.wiley.com/doi/10.1111/1471-0307.12096/pdf.
Reid, A., Miedzinski, M., 2008. Eco-innovation: Final Report for Sectoral InnovationWatch. Technopolis. http://www.technopolis-group.com/resources/downloads/661_report_final.pdf.
Rennings, K., 2000. Redefining innovation: eco-innovation research and thecontribution from ecological economics. Ecol. Econ. 32 (2), 319e332.
Ribarova, I., Stanchev, P., Dimova, G., Assimacopoulos, A., 2014. A first iteration of aneco-efficiency assessment of Sofia's urban water system. Procedia Eng. 70,1411e1420. http://dx.doi.org/10.1016/j.proeng.2014.02.156.
Seppala, J., et al., 2005. How can the eco-efficiency of a region be measured andmonitored? J. Ind. Ecol. 9 (4), 117e130.
Sierzchula, W., Bakker, S., Maat, K., van Wee, B., 2012. Technological diversity ofemerging eco-innovations: a case study of the automobile industry. J. Clean.Prod. 37, 211e220.
Srivastava, S.K., 2007. Green supply-chain management: a state-of-the-art literaturereview. Int. J. Manag. Rev. 9 (1), 53e80.
Triebswetter, U., Wackerbauer, J., 2008. Integrated environmental product innova-tion and impacts on company competitiveness: a case study of the automotiveindustry in the region of Munich. Eur. Environ. 18 (1), 30e44.
UNESCAP, 2009. Eco-efficiency Indicators: Measuring Resource-use Efficiency andthe Impact of Economic Activities on the Environment. United Nations.
UNEP., 2013. Water Efficiency. Information Brief prepared by UNEP and UN-DESAwith the support of UNW-DPAC with the collaboration of OECD and GWP.
van Caneghem, J., Block, C., Cramm, P., Mortier, R., Vandecasteele, C., 2010.Improving eco-efficiency in the steel industry: the ArcelorMittal Gent case.J. Clean. Prod. 18 (8), 807e814.
Van der Heijden, K.A., 2005. Scenarios: the Art of Strategic Conversation, second ed.Wiley, Chichester.
Volvo, 2008. World's First Carbon-neutral Plant. http://www.volvotrucks.com/trucks/global/en-gb/Pages/article.aspx?article¼19.
Volvo, 2011. Sustainability Report 2010. Volvo Group, G€oteborg. http://reports.volvogroup.com/en/EnvironmentalResponsibility/EnvironmentalPerformanceinProduction.html.
WBCSD., 2000. Eco-efficiency: Creating More Value with Less Impact. World Busi-ness Council for Sustainable Development, Geneva. http://www.wbcsd.org/web/publications/eco_efficiency_creating_more_value.pdf.
Williander, M., 2007. Absorptive capacity and interpretation system's impact when‘going green’: an empirical study of Ford, Volvo cars and Toyota. Bus. StrategyEnviron. 16, 202e213.
WssTP, 2013. Water Reuse: Research and Technology Development Needs for WaterReuse. European Technology Platform for Water, Brussels summary at. http://www.wsstp.eu/files/WSSTPX0001/Water%20Reuse%20Ex.Summary%20online.pdf.
Wursthorn, S., Poganietz, W.-R., Schebek, L., 2011. Economiceenvironmentalmonitoring indicators for European countries: a disaggregated sector-basedapproach for monitoring eco-efficiency. Ecol. Econ. 70 (3), 487e496.
tion: assessing meso-level eco-efficiency in industrial water-servicej.jclepro.2014.12.086