process considerations for changing times
TRANSCRIPT
Ron Latimer, PE
Process Considerations for Changing Times:
Process optimization and doing more with less
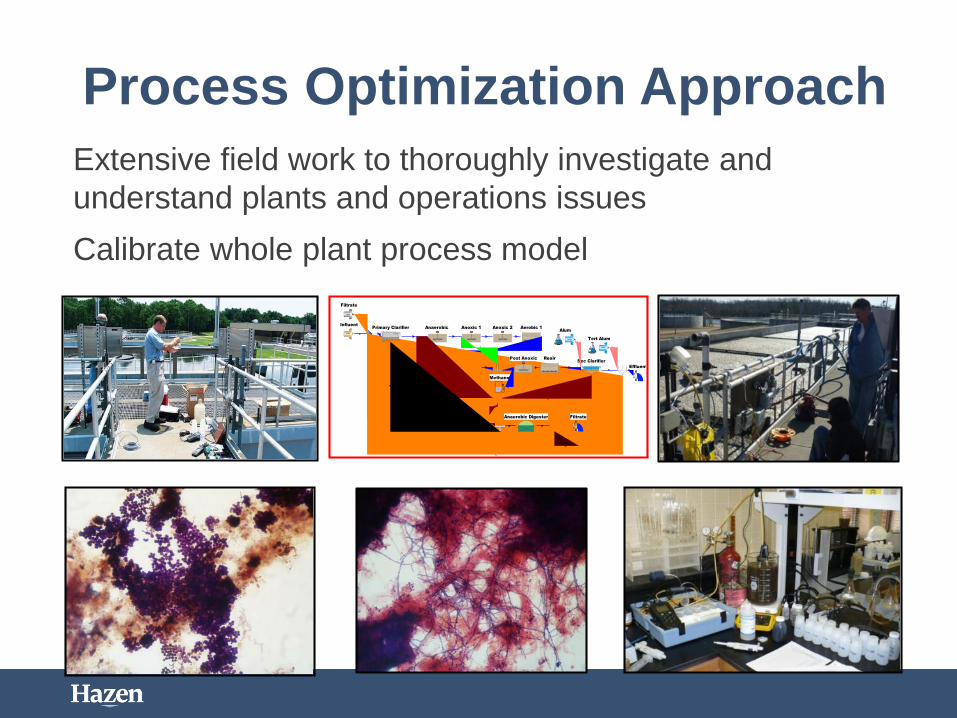
Process Optimization Approach
Extensive field work to thoroughly investigate and
understand plants and operations issues
Calibrate whole plant process model
Influent
Filtrate
Anaerobic Anoxic 1 Anoxic 2 Aerobic 1
Aerobic 2 Aerobic 3
Effluent
Dewatered Sludge
Filtrate
Sec Clarifier
Alum
Tert Alum
Post Anoxic Reair
Methanol
Primary Clarifier
Anaerobic Digester

Whole Plant Process Simulators
Whole Plant Simulations – BioWin, GPS-X
Steady State and Dynamic Modeling
Powerful tool with PROPER CALIBRATION and
APPLICATION

Mason Farm WWTP, OWASA North
Carolina
14.5 mgd WWTP (7.5 mgd current ADF)
Field sampling and BioWin model application to optimization
Process converted to step feed at zero cost to optimize use of influent
carbon
Nov 2008 –
May 2010
June 2010 –
Oct 2012
%
Reduced
Cost
($/gallon)
Annual
Savings
48% Alum (gpd) 915 671 27% $0.66 $59,000
25% Sodium
Hydroxide (gpd)1,360 535 61% $0.74 $223,000
20% Acetic Acid (gpd) 622 438 30% $1.08 $73,000
Total Annual Savings - - $355,000
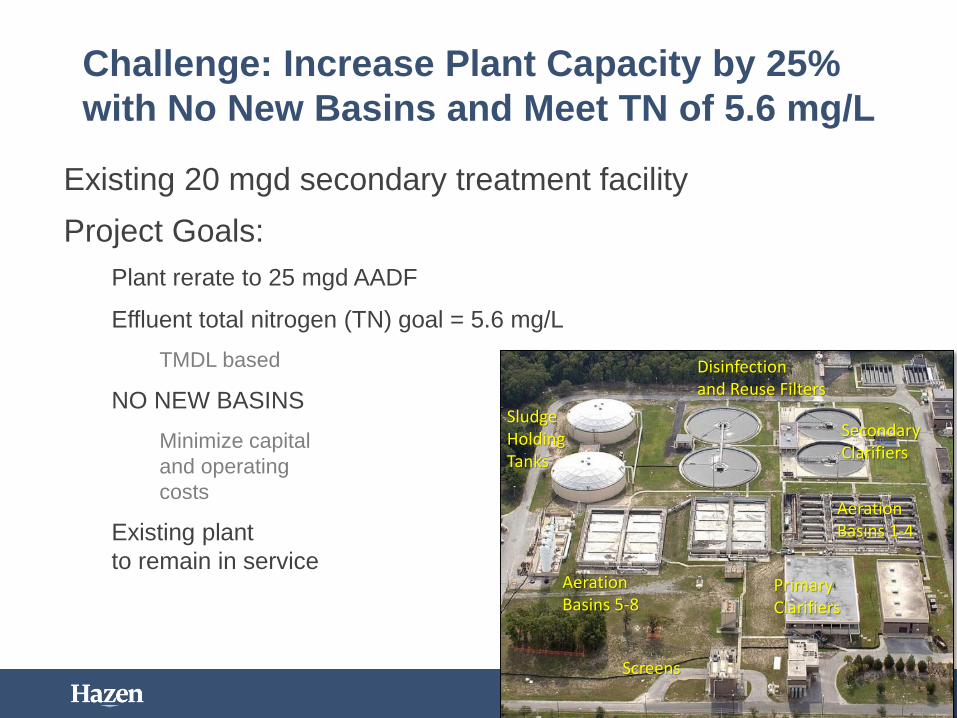
Challenge: Increase Plant Capacity by 25%
with No New Basins and Meet TN of 5.6 mg/L
Existing 20 mgd secondary treatment facility
Project Goals:
Plant rerate to 25 mgd AADF
Effluent total nitrogen (TN) goal = 5.6 mg/L
TMDL based
NO NEW BASINS
Minimize capital
and operating
costs
Existing plant
to remain in service
Screens
Primary Clarifiers
Aeration Basins 5-8
Aeration Basins 1-4
Secondary Clarifiers
Sludge Holding Tanks
Disinfection and Reuse Filters
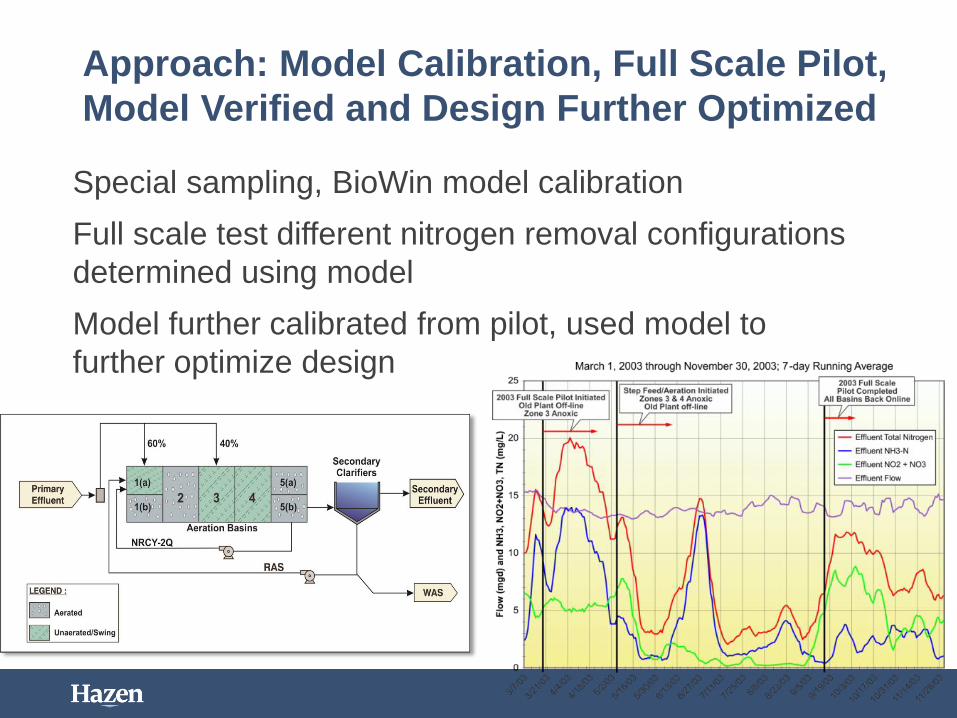
Approach: Model Calibration, Full Scale Pilot,
Model Verified and Design Further Optimized
Special sampling, BioWin model calibration
Full scale test different nitrogen removal configurations
determined using model
Model further calibrated from pilot, used model to
further optimize design
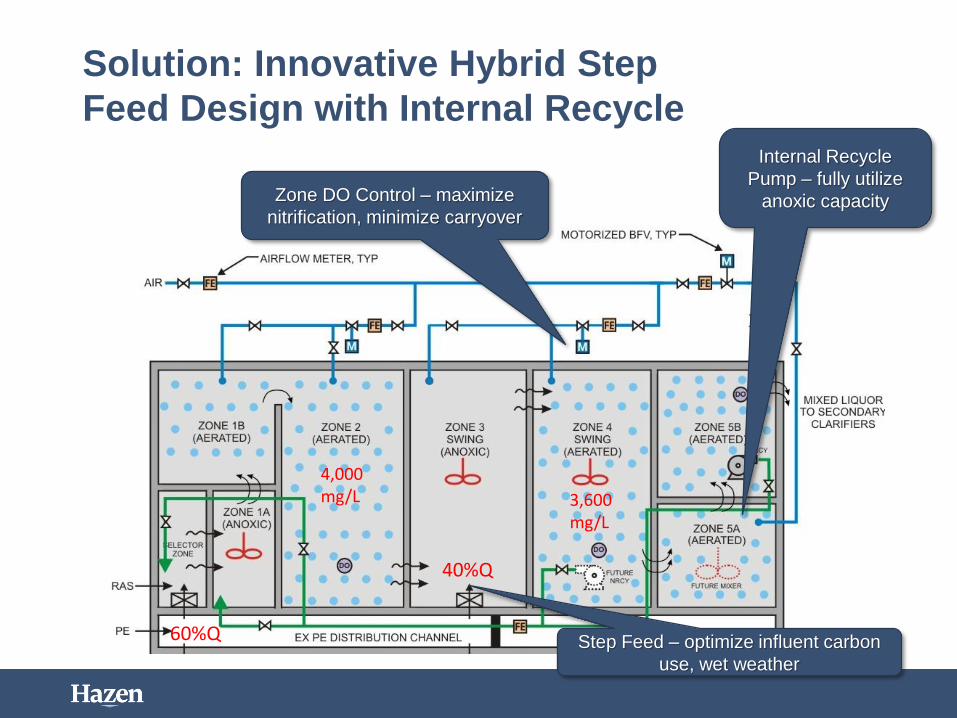
Solution: Innovative Hybrid Step
Feed Design with Internal Recycle
Zone DO Control – maximize
nitrification, minimize carryover
Internal Recycle
Pump – fully utilize
anoxic capacity
Step Feed – optimize influent carbon
use, wet weather
60%Q
40%Q
4,000 mg/L 3,600
mg/L
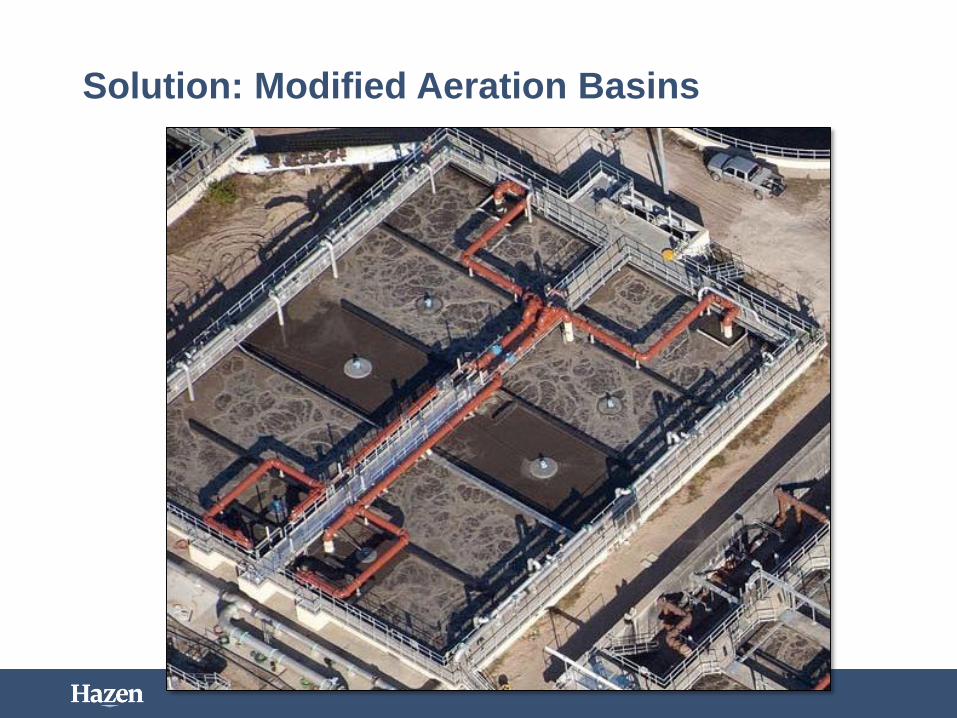
Solution: Modified Aeration Basins
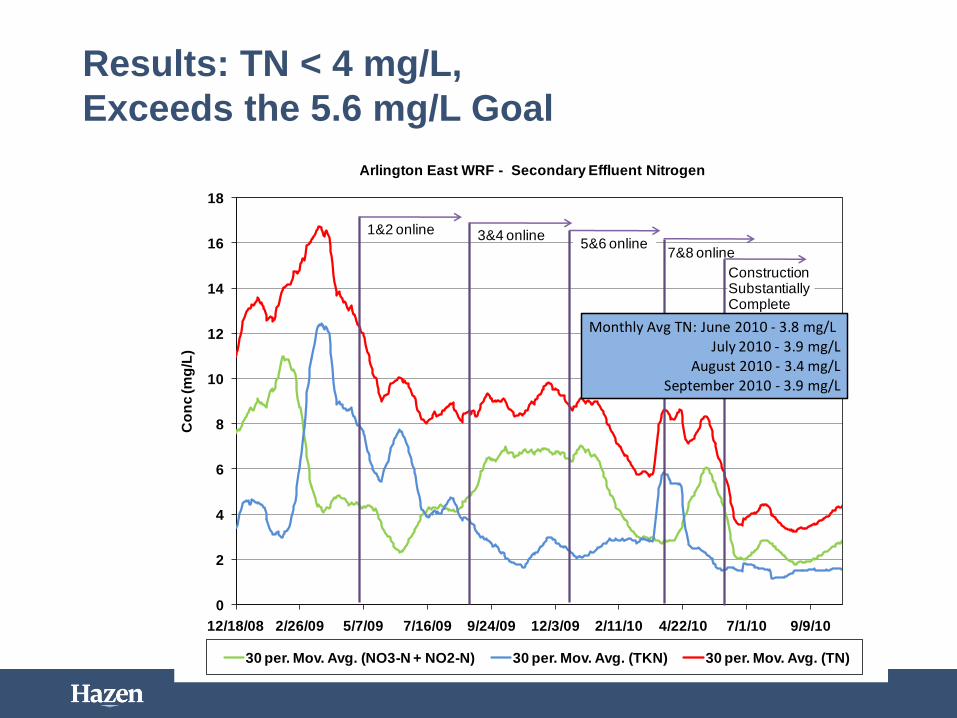
Results: TN < 4 mg/L,
Exceeds the 5.6 mg/L Goal
0
2
4
6
8
10
12
14
16
18
12/18/08 2/26/09 5/7/09 7/16/09 9/24/09 12/3/09 2/11/10 4/22/10 7/1/10 9/9/10
Co
nc
(m
g/L
)Arlington East WRF - Secondary Effluent Nitrogen
30 per. Mov. Avg. (NO3-N + NO2-N) 30 per. Mov. Avg. (TKN) 30 per. Mov. Avg. (TN)
1&2 online 3&4 online5&6 online
7&8 online
Construction SubstantiallyComplete
Monthly Avg TN: June 2010 - 3.8 mg/LJuly 2010 - 3.9 mg/L
August 2010 - 3.4 mg/LSeptember 2010 - 3.9 mg/L
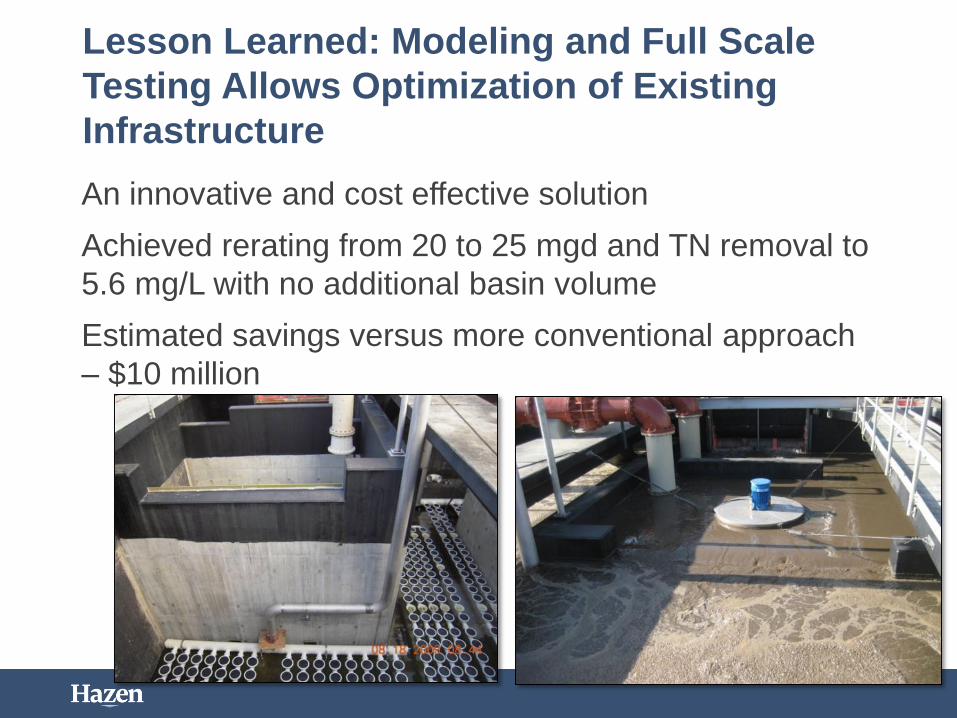
Lesson Learned: Modeling and Full Scale
Testing Allows Optimization of Existing
Infrastructure
An innovative and cost effective solution
Achieved rerating from 20 to 25 mgd and TN removal to
5.6 mg/L with no additional basin volume
Estimated savings versus more conventional approach
– $10 million
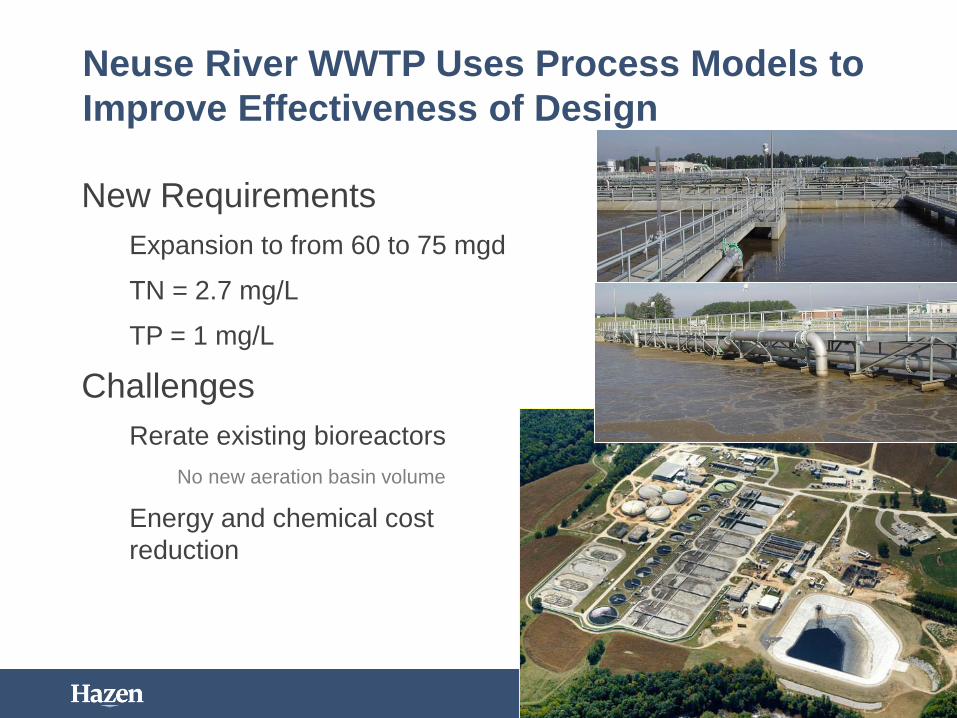
Neuse River WWTP Uses Process Models to
Improve Effectiveness of Design
New Requirements
Expansion to from 60 to 75 mgd
TN = 2.7 mg/L
TP = 1 mg/L
Challenges
Rerate existing bioreactors
No new aeration basin volume
Energy and chemical cost
reduction

Existing Plant Rerated to 75 mgd
Raw INF
Grit + PI Channel
Prim Clar
AX 1 AX 2Aerobic 1 Aerobic 2 Aerobic 3 Aerobic 4
Post AX ReairML Channel
Sec Clar
Effluent
RAS Channel
Methanol
TWAS
Filtrate
Primary Sludge
WWTP Sludge
Alum Tert
Alum
Extensive Special Sampling and BioWin Model Calibration
Full Scale Verification
Secondary Clarifier Stress Testing CFD Model Calibration
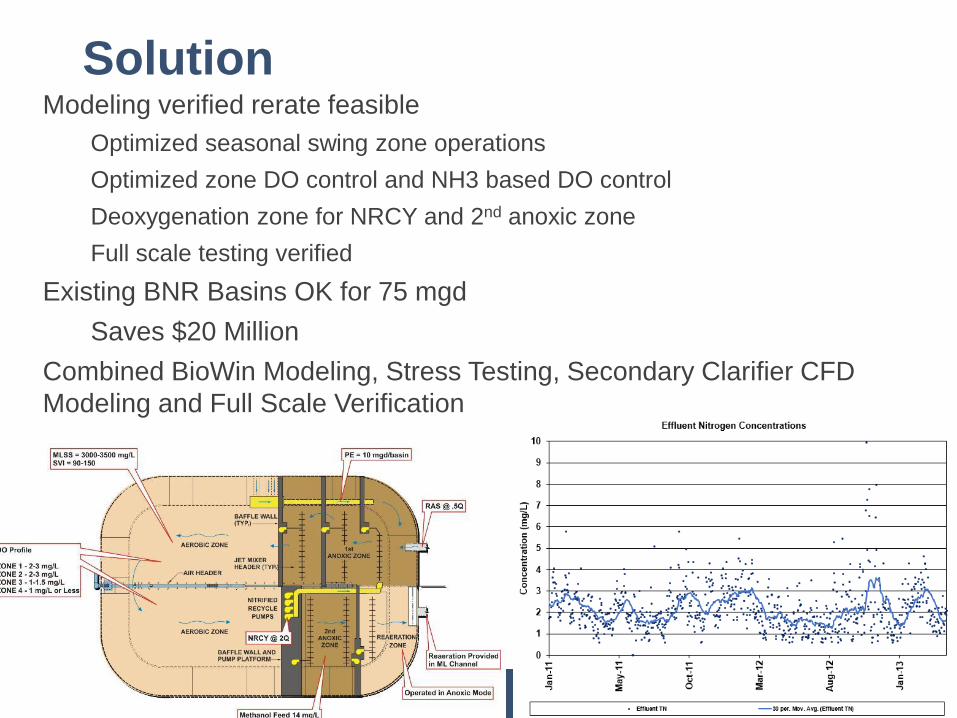
SolutionModeling verified rerate feasible
Optimized seasonal swing zone operations
Optimized zone DO control and NH3 based DO control
Deoxygenation zone for NRCY and 2nd anoxic zone
Full scale testing verified
Existing BNR Basins OK for 75 mgd
Saves $20 Million
Combined BioWin Modeling, Stress Testing, Secondary Clarifier CFD
Modeling and Full Scale Verification
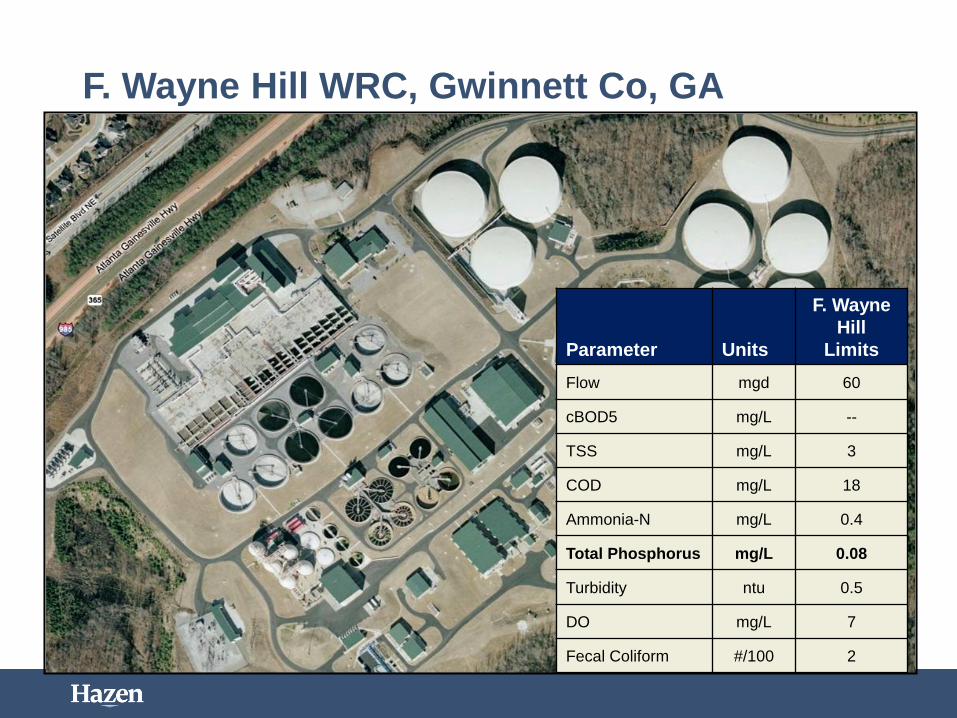
F. Wayne Hill WRC, Gwinnett Co, GA
Parameter Units
F. Wayne
Hill
Limits
Flow mgd 60
cBOD5 mg/L --
TSS mg/L 3
COD mg/L 18
Ammonia-N mg/L 0.4
Total Phosphorus mg/L 0.08
Turbidity ntu 0.5
DO mg/L 7
Fecal Coliform #/100 2
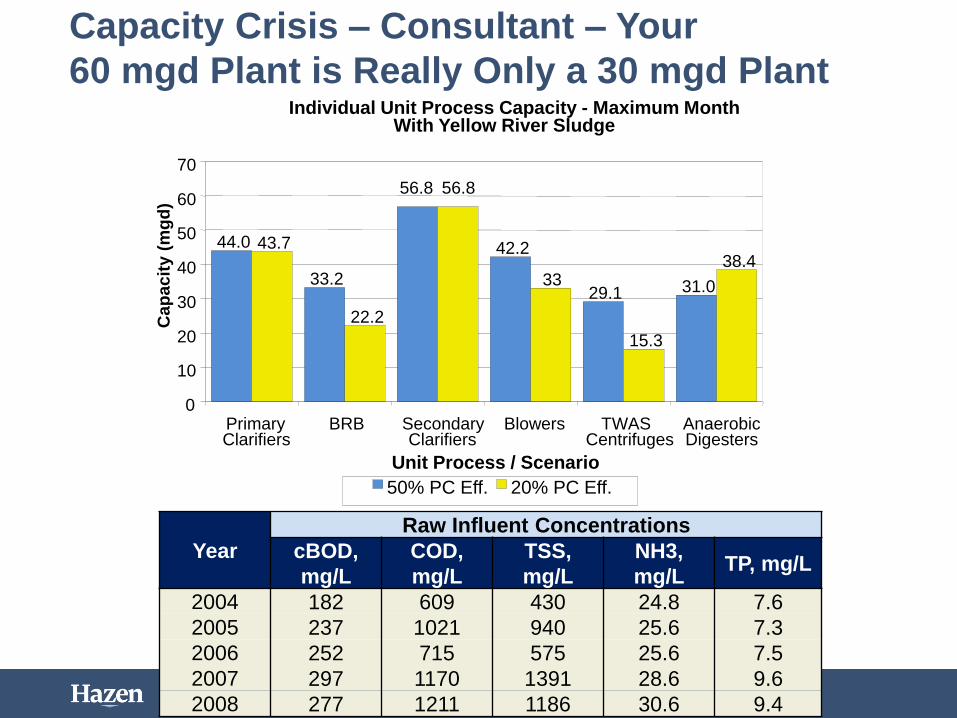
Capacity Crisis – Consultant – Your
60 mgd Plant is Really Only a 30 mgd PlantIndividual Unit Process Capacity - Maximum Month
With Yellow River Sludge
44.0
33.2
56.8
42.2
29.1 31.0
43.7
22.2
56.8
33
15.3
38.4
0
10
20
30
40
50
60
70
PrimaryClarifiers
BRB SecondaryClarifiers
Blowers TWASCentrifuges
AnaerobicDigesters
Unit Process / Scenario
Cap
acit
y (
mg
d)
50% PC Eff. 20% PC Eff.
Year
Raw Influent Concentrations
cBOD,
mg/L
COD,
mg/L
TSS,
mg/L
NH3,
mg/LTP, mg/L
2004 182 609 430 24.8 7.6
2005 237 1021 940 25.6 7.3
2006 252 715 575 25.6 7.5
2007 297 1170 1391 28.6 9.6
2008 277 1211 1186 30.6 9.4
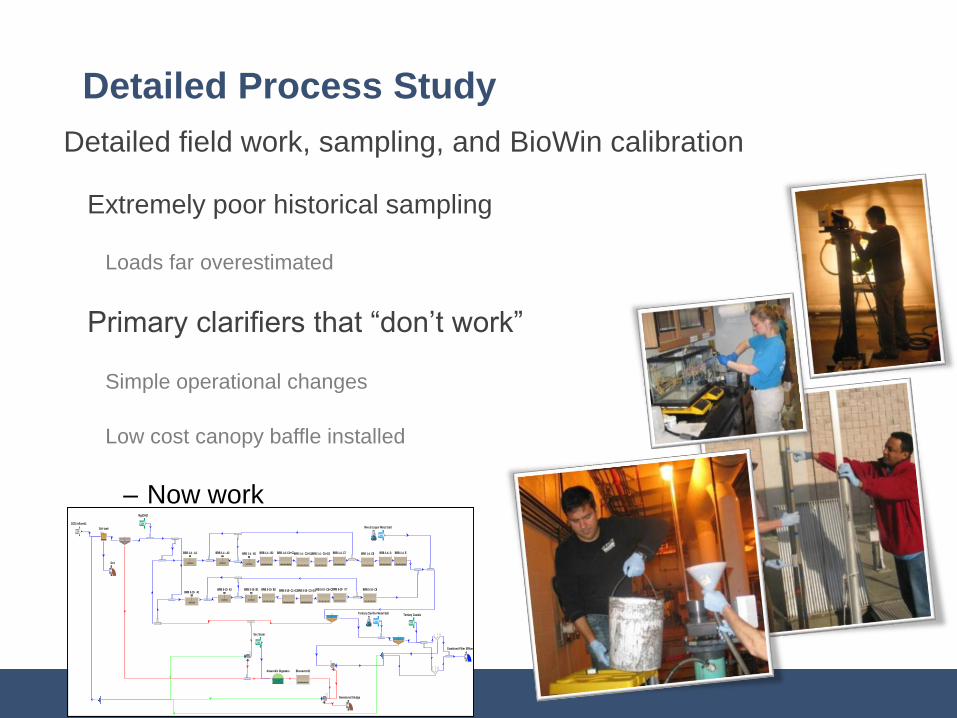
Detailed Process Study
Detailed field work, sampling, and BioWin calibration
Extremely poor historical sampling
Loads far overestimated
Primary clarifiers that “don’t work”
Simple operational changes
Low cost canopy baffle installed
– Now work
BRB 1-4 - A1 BRB 1-4 - A2 BRB 1-4 - B1 BRB 1-4 - B2 BRB 1-4 - C5+C6 BRB 1-4- C8 BRB 1-4- DBRB 1-4- C1+C2BRB 1-4 - C3+C4 BRB 1-4- C7
Grit tank
BRB 1-4- E
BRB 5-10- A1BRB 5-10- A2 BRB 5-10- B1 BRB 5-10- B2 BRB 5-10- C5+C6 BRB 5-10- C8BRB 5-10- C1+C2BRB 5-10- C3+C4 BRB 5-10- C7
Mg(OH)2
Mixed Liquor Metal Salt
Anaerobic Digesters
Dewatered Sludge
Grit
Tertiary Clarifier Metal Salt
Combined Filter Effluent - Pre O3 Infl
Tertiary Caustic
Sec Scum
Bioreactor21
COD Influent1
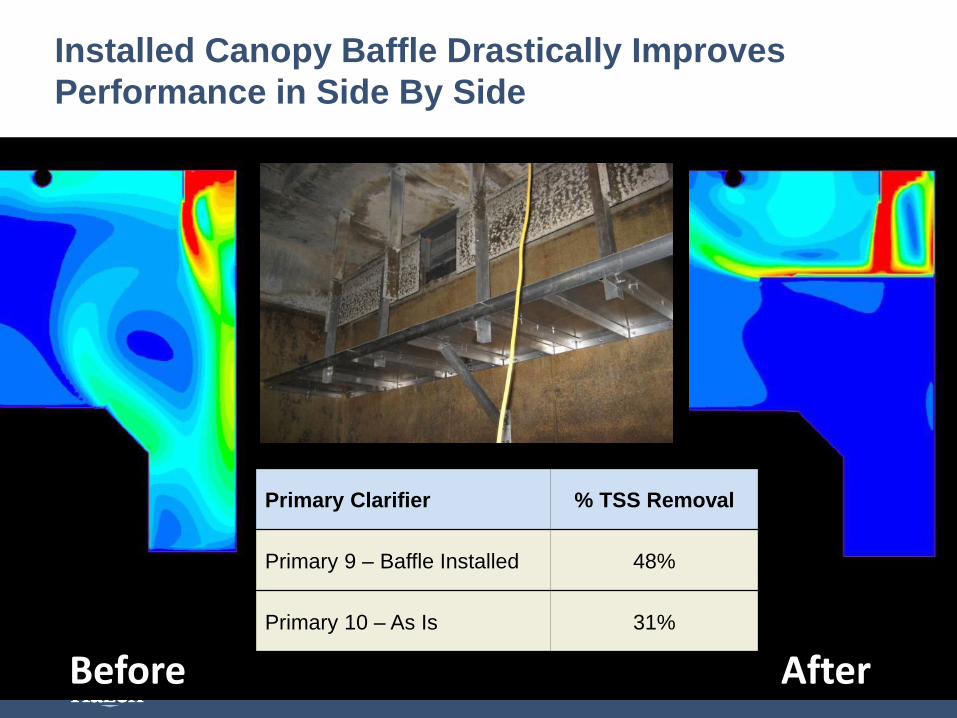
Installed Canopy Baffle Drastically Improves
Performance in Side By Side
Before After
Primary Clarifier % TSS Removal
Primary 9 – Baffle Installed 48%
Primary 10 – As Is 31%
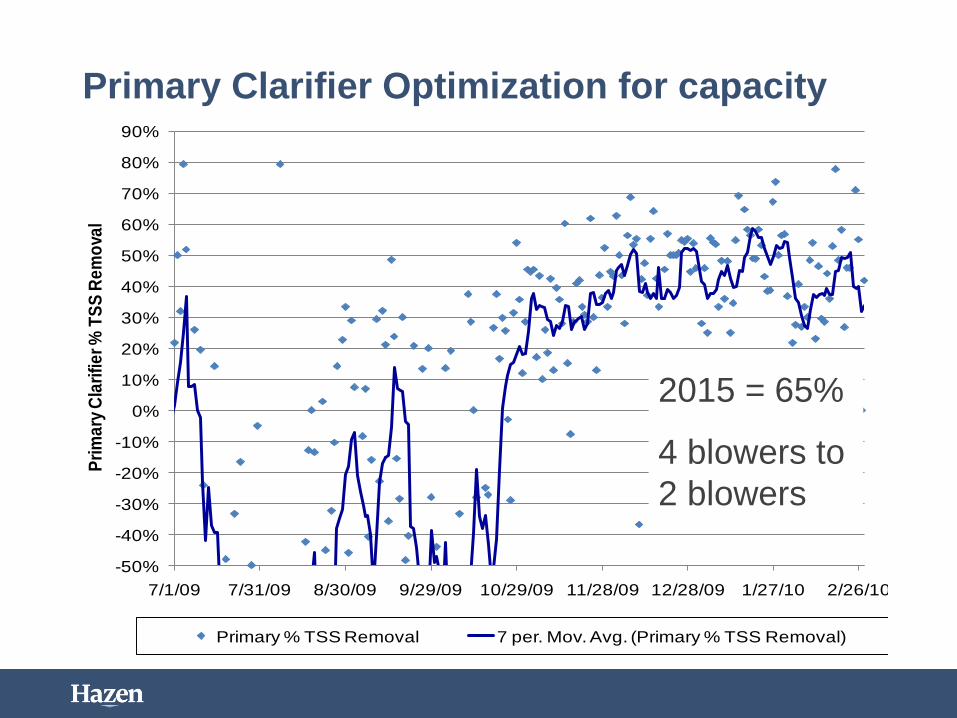
Primary Clarifier Optimization for capacity
-50%
-40%
-30%
-20%
-10%
0%
10%
20%
30%
40%
50%
60%
70%
80%
90%
7/1/09 7/31/09 8/30/09 9/29/09 10/29/09 11/28/09 12/28/09 1/27/10 2/26/10
Pri
ma
ry C
lari
fie
r %
TS
S R
em
ova
l
Primary % TSS Removal 7 per. Mov. Avg. (Primary % TSS Removal)
2015 = 65%
4 blowers to
2 blowers
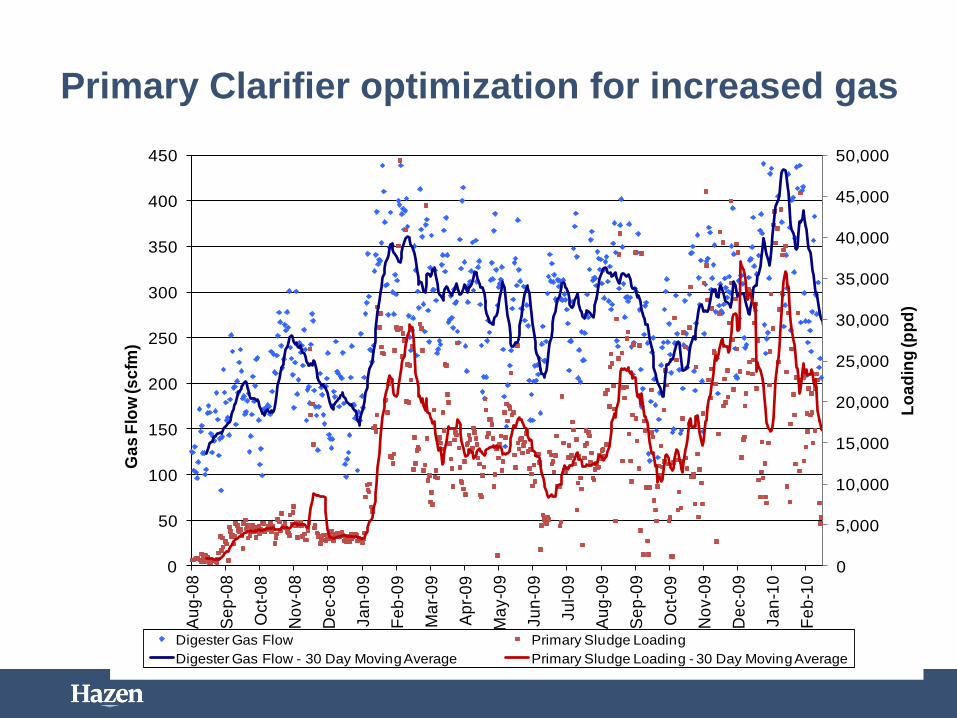
Primary Clarifier optimization for increased gas
0
5,000
10,000
15,000
20,000
25,000
30,000
35,000
40,000
45,000
50,000
0
50
100
150
200
250
300
350
400
450
Au
g-0
8
Se
p-0
8
Oct-
08
No
v-0
8
De
c-0
8
Ja
n-0
9
Fe
b-0
9
Ma
r-0
9
Ap
r-0
9
Ma
y-0
9
Ju
n-0
9
Ju
l-0
9
Au
g-0
9
Se
p-0
9
Oct-
09
No
v-0
9
De
c-0
9
Ja
n-1
0
Fe
b-1
0
Lo
ad
ing
(pp
d)
Ga
s F
low
(sc
fm)
Digester Gas Production and Primary Sludge Loading
Digester Gas Flow Primary Sludge Loading
Digester Gas Flow - 30 Day Moving Average Primary Sludge Loading - 30 Day Moving Average
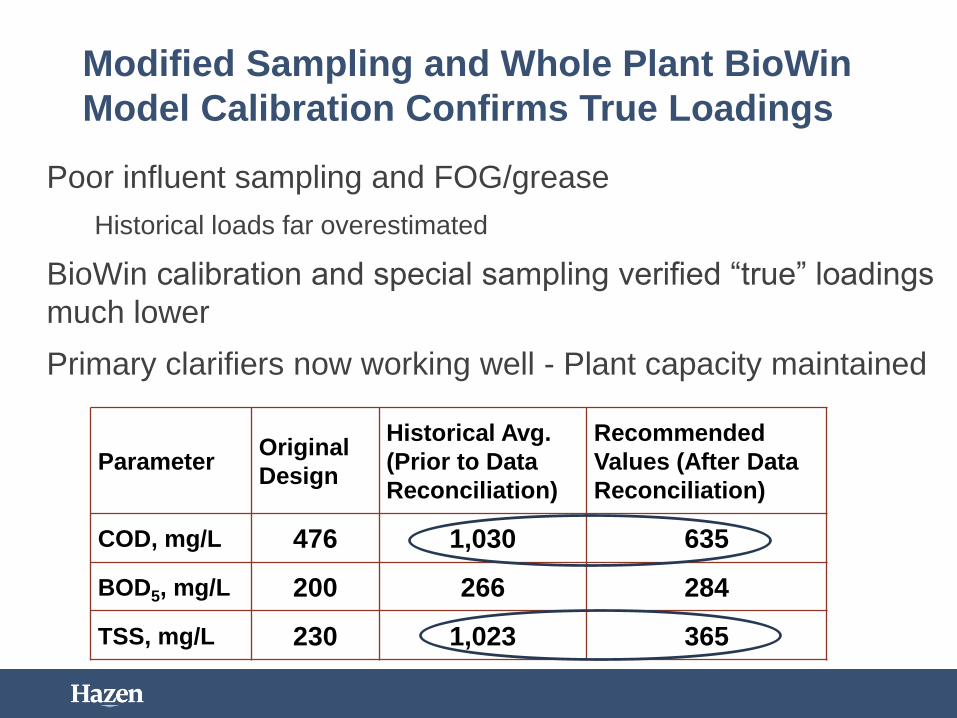
Modified Sampling and Whole Plant BioWin
Model Calibration Confirms True Loadings
Poor influent sampling and FOG/grease
Historical loads far overestimated
BioWin calibration and special sampling verified “true” loadings
much lower
Primary clarifiers now working well - Plant capacity maintained
ParameterOriginal
Design
Historical Avg.
(Prior to Data
Reconciliation)
Recommended
Values (After Data
Reconciliation)
COD, mg/L 476 1,030 635
BOD5, mg/L 200 266 284
TSS, mg/L 230 1,023 365
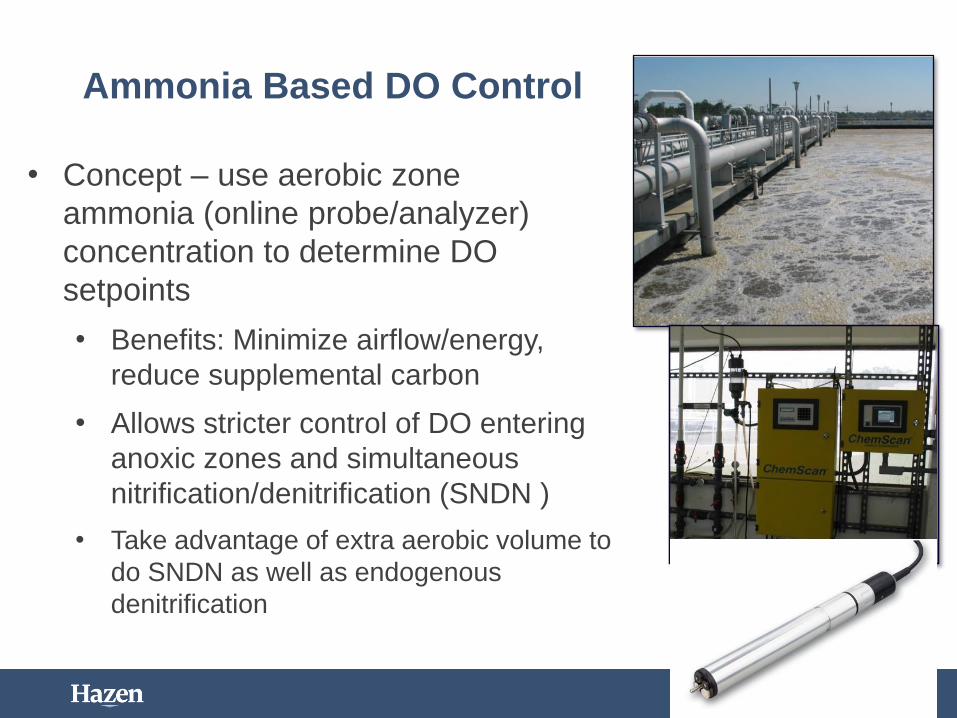
Ammonia Based DO Control
• Concept – use aerobic zone
ammonia (online probe/analyzer)
concentration to determine DO
setpoints
• Benefits: Minimize airflow/energy,
reduce supplemental carbon
• Allows stricter control of DO entering
anoxic zones and simultaneous
nitrification/denitrification (SNDN )
• Take advantage of extra aerobic volume to
do SNDN as well as endogenous
denitrification
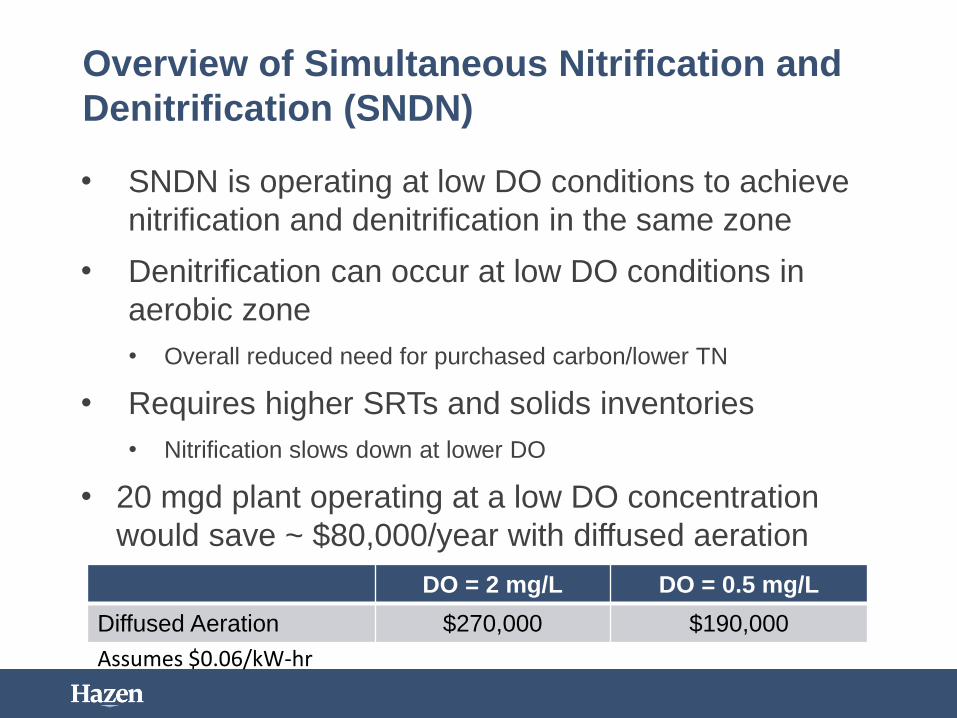
Overview of Simultaneous Nitrification and
Denitrification (SNDN)
• SNDN is operating at low DO conditions to achieve
nitrification and denitrification in the same zone
• Denitrification can occur at low DO conditions in
aerobic zone
• Overall reduced need for purchased carbon/lower TN
• Requires higher SRTs and solids inventories
• Nitrification slows down at lower DO
• 20 mgd plant operating at a low DO concentration
would save ~ $80,000/year with diffused aeration
DO = 2 mg/L DO = 0.5 mg/L
Diffused Aeration $270,000 $190,000
Assumes $0.06/kW-hr
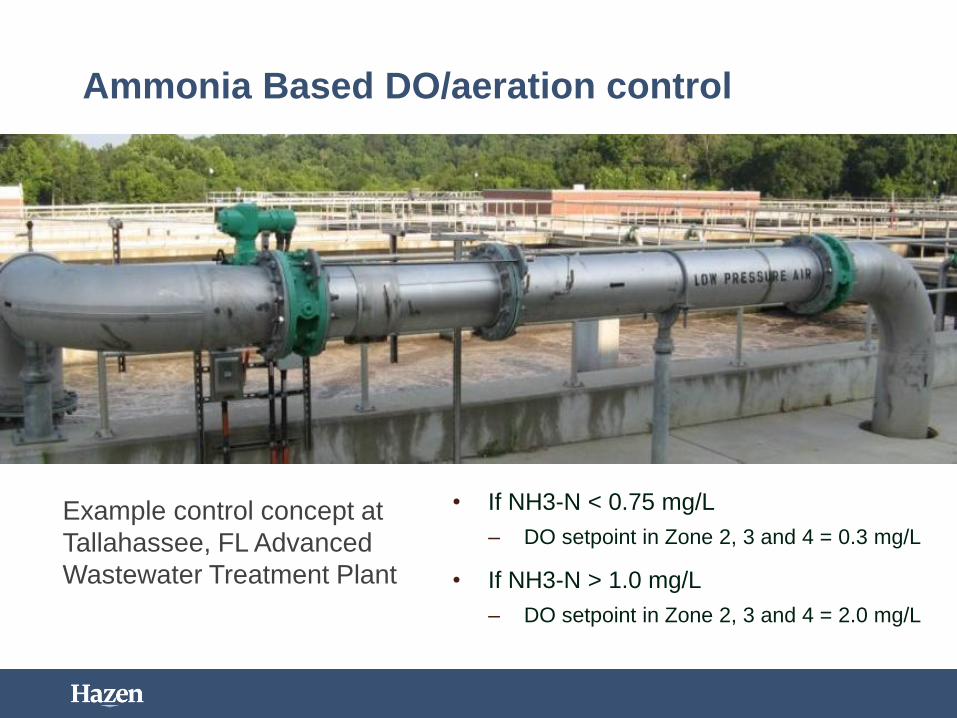
Ammonia Based DO/aeration control
Example control concept at
Tallahassee, FL Advanced
Wastewater Treatment Plant
• If NH3-N < 0.75 mg/L
– DO setpoint in Zone 2, 3 and 4 = 0.3 mg/L
• If NH3-N > 1.0 mg/L
– DO setpoint in Zone 2, 3 and 4 = 2.0 mg/L
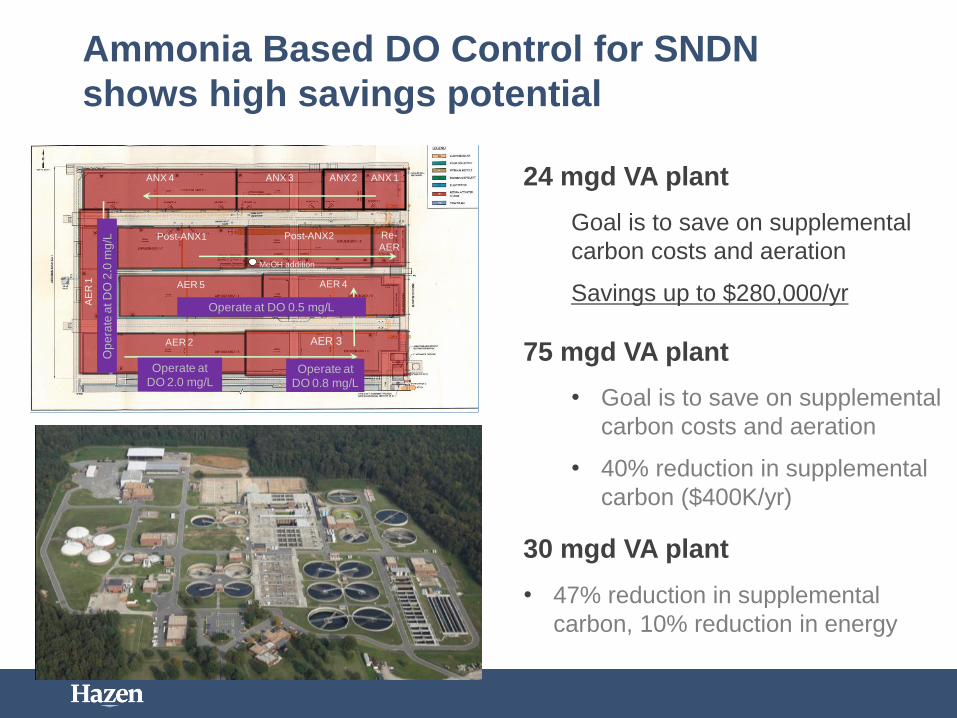
Ammonia Based DO Control for SNDN
shows high savings potential
24 mgd VA plant
Goal is to save on supplemental
carbon costs and aeration
Savings up to $280,000/yr
75 mgd VA plant
• Goal is to save on supplemental
carbon costs and aeration
• 40% reduction in supplemental
carbon ($400K/yr)
30 mgd VA plant
• 47% reduction in supplemental
carbon, 10% reduction in energy
ANX 1ANX 2ANX 3ANX 4
AE
R 1
AER 2 AER 3
AER 4
Post-ANX1 Post-ANX2 Re-
AER
MeOH addition
AER 5
Operate at DO 0.5 mg/L
Operate at
DO 2.0 mg/L
Op
era
te a
t D
O 2
.0 m
g/L
Operate at
DO 0.8 mg/L
MR396
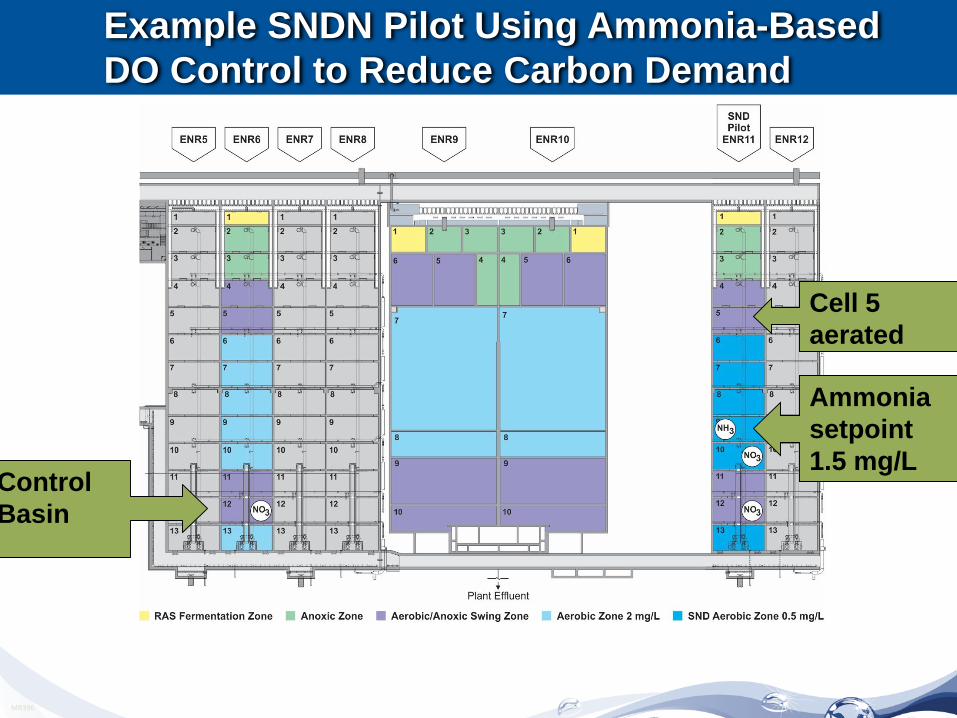
Example SNDN Pilot Using Ammonia-Based
DO Control to Reduce Carbon Demand
Control
Basin
Ammonia
setpoint
1.5 mg/L
Cell 5
aerated
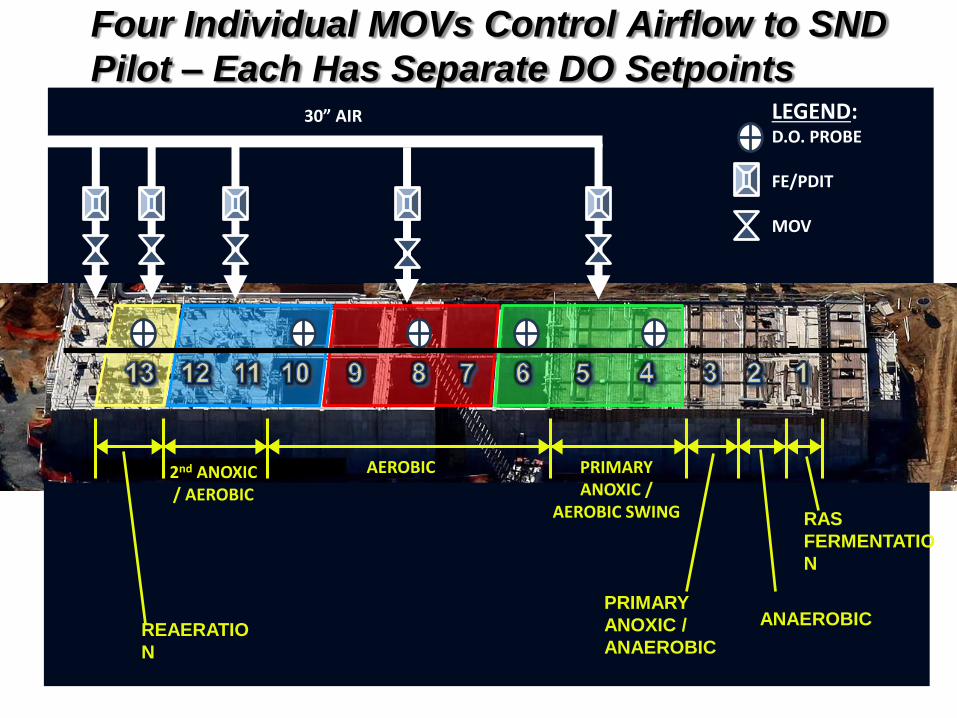
REAERATIO
N
PRIMARY
ANOXIC /
ANAEROBIC
RAS
FERMENTATIO
N
AEROBIC2nd ANOXIC / AEROBIC
PRIMARY ANOXIC /
AEROBIC SWING
ANAEROBIC
30” AIR LEGEND:D.O. PROBE
FE/PDIT
MOV
Four Individual MOVs Control Airflow to SND
Pilot – Each Has Separate DO Setpoints
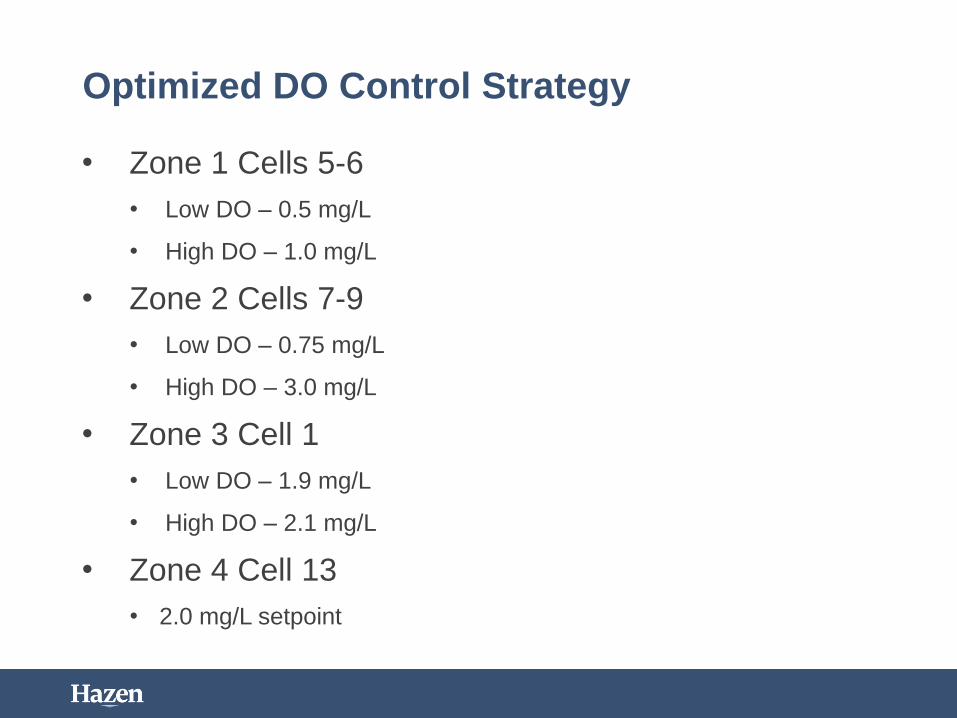
Optimized DO Control Strategy
• Zone 1 Cells 5-6
• Low DO – 0.5 mg/L
• High DO – 1.0 mg/L
• Zone 2 Cells 7-9
• Low DO – 0.75 mg/L
• High DO – 3.0 mg/L
• Zone 3 Cell 1
• Low DO – 1.9 mg/L
• High DO – 2.1 mg/L
• Zone 4 Cell 13
• 2.0 mg/L setpoint
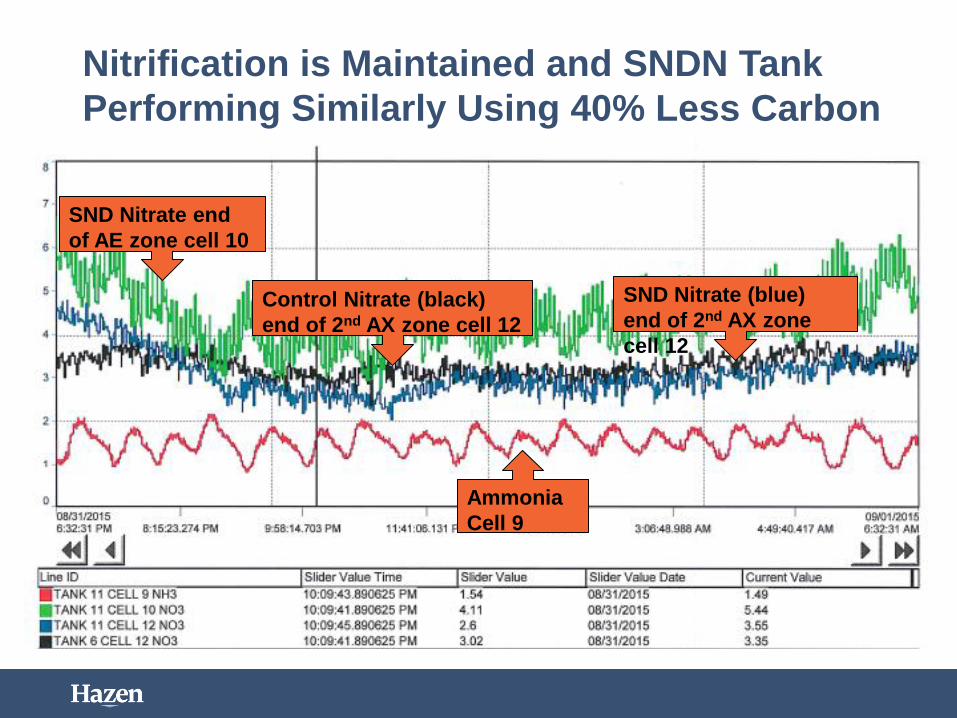
Nitrification is Maintained and SNDN Tank
Performing Similarly Using 40% Less Carbon
SND Nitrate end
of AE zone cell 10
SND Nitrate (blue)
end of 2nd AX zone
cell 12
Ammonia
Cell 9
Control Nitrate (black)
end of 2nd AX zone cell 12
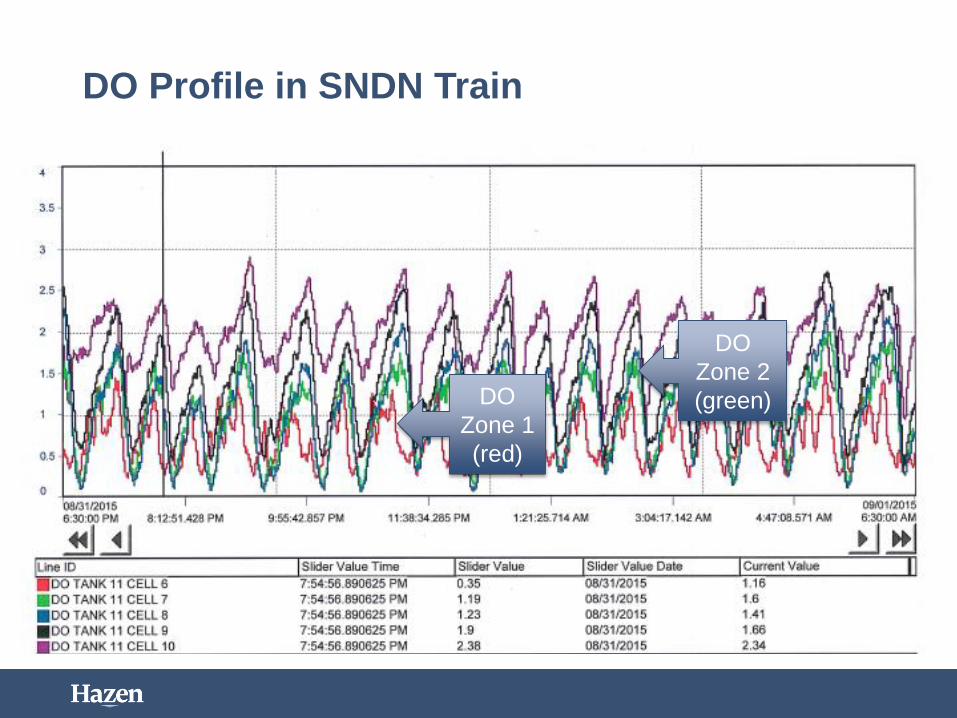
DO Profile in SNDN Train
DO
Zone 1
(red)
DO
Zone 2
(green)

Ammonia At End of Cell 9 Drops when Setpoint
is Lowered from 2.5 to 1.5 mg/L (as Expected)
0
0.5
1
1.5
2
2.5
3
3.5
4
7/25/15 0:00 7/30/15 0:00 8/4/15 0:00 8/9/15 0:00 8/14/15 0:00 8/19/15 0:00 8/24/15 0:00 8/29/15 0:00 9/3/15 0:00 9/8/15 0:00 9/13/15 0:00
Co
nce
ntr
atio
n (
mg
/L)
Time
Tank 11
Tank 11 Cell 9 Ammonia from probe (mg/L)
Setpoint
changes
Diffused aeration/mixing considerations
Diffused aeration also provides mixing of MLSS
The energy required to mix may exceed the
process oxygen demand
Results in excessive aeration, DO carryover to unaerated
zones and increased power costs
Inadequate mixing can lead to short circuiting, solids settling,
secondary P release, etc.
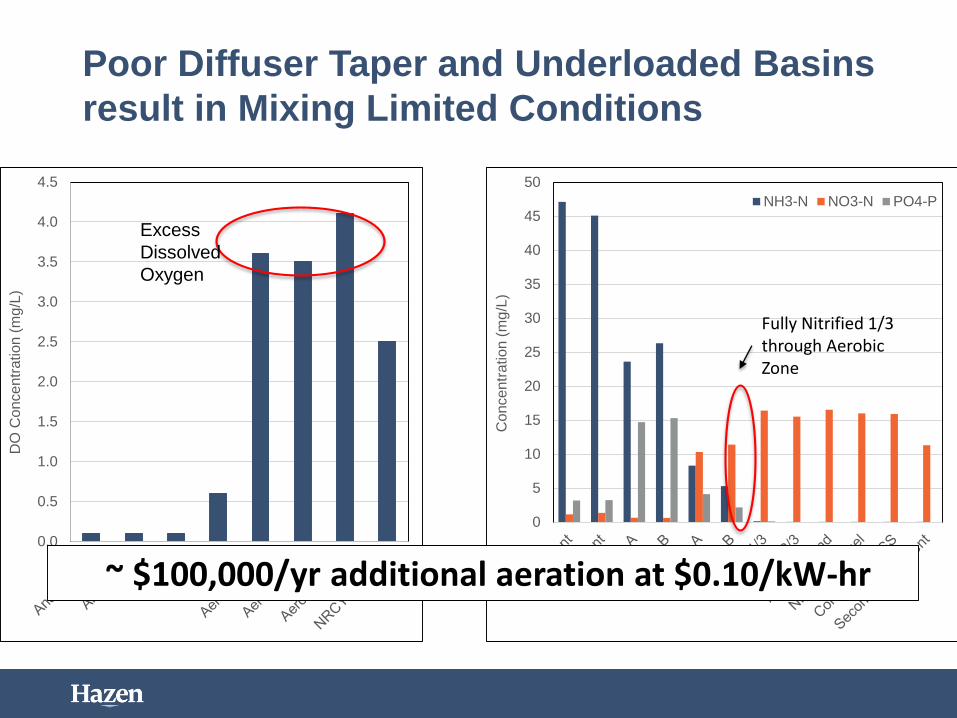
Poor Diffuser Taper and Underloaded Basins
result in Mixing Limited Conditions
0.0
0.5
1.0
1.5
2.0
2.5
3.0
3.5
4.0
4.5
DO
Co
nce
ntr
ation
(m
g/L
)
Excess
Dissolved
Oxygen
0
5
10
15
20
25
30
35
40
45
50
Co
nce
ntr
ation
(m
g/L
)
NH3-N NO3-N PO4-P
Fully Nitrified 1/3 through Aerobic Zone
~ $100,000/yr additional aeration at $0.10/kW-hr
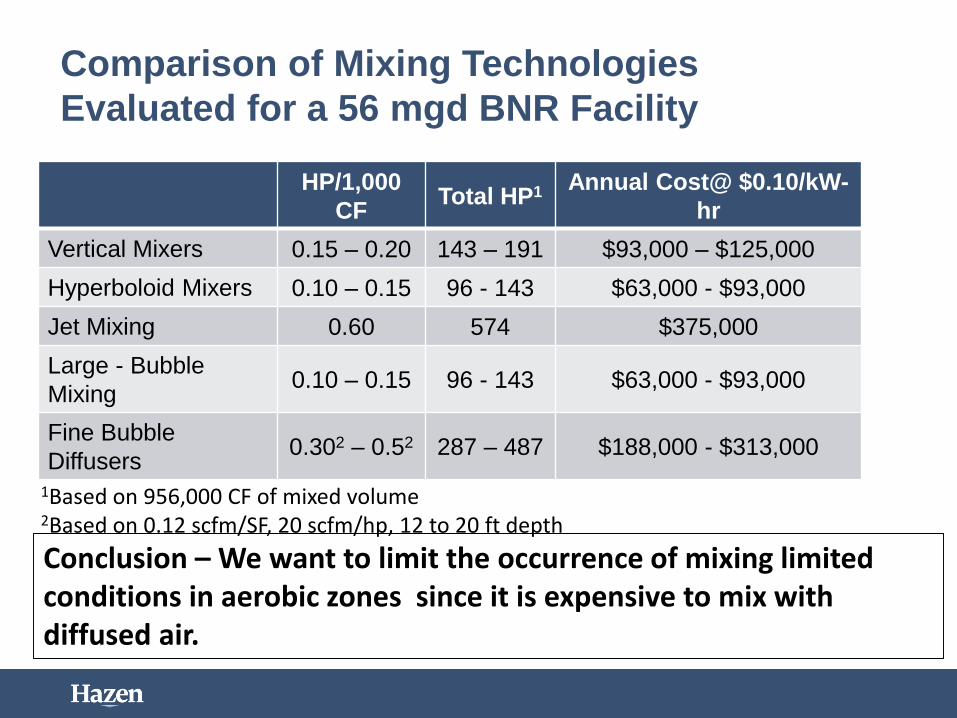
Comparison of Mixing Technologies
Evaluated for a 56 mgd BNR Facility
HP/1,000
CFTotal HP1 Annual Cost@ $0.10/kW-
hr
Vertical Mixers 0.15 – 0.20 143 – 191 $93,000 – $125,000
Hyperboloid Mixers 0.10 – 0.15 96 - 143 $63,000 - $93,000
Jet Mixing 0.60 574 $375,000
Large - Bubble
Mixing0.10 – 0.15 96 - 143 $63,000 - $93,000
Fine Bubble
Diffusers0.302 – 0.52 287 – 487 $188,000 - $313,000
1Based on 956,000 CF of mixed volume2Based on 0.12 scfm/SF, 20 scfm/hp, 12 to 20 ft depth
Conclusion – We want to limit the occurrence of mixing limited conditions in aerobic zones since it is expensive to mix with diffused air.

Case Study – 15 mgd AWRRF Recently
Converted to ENR
Needs to meet TN < 5 and TP < 0.3 mg/L
Mixed zone provided just prior to post-anoxic zone
to reduce oxygen in NRCY and post anoxic zone
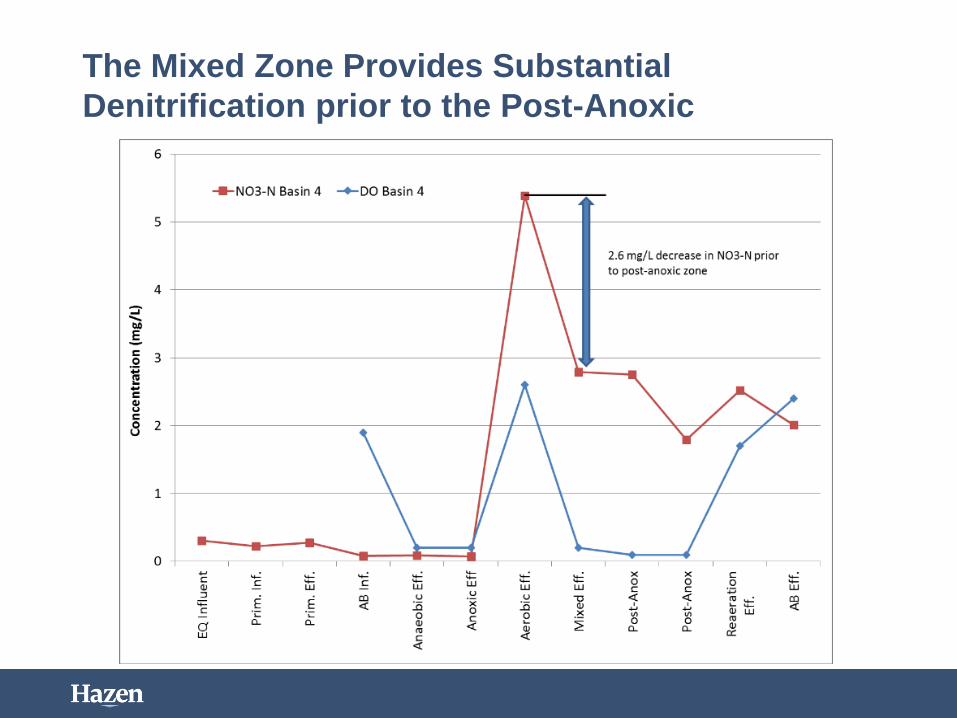
The Mixed Zone Provides Substantial
Denitrification prior to the Post-Anoxic
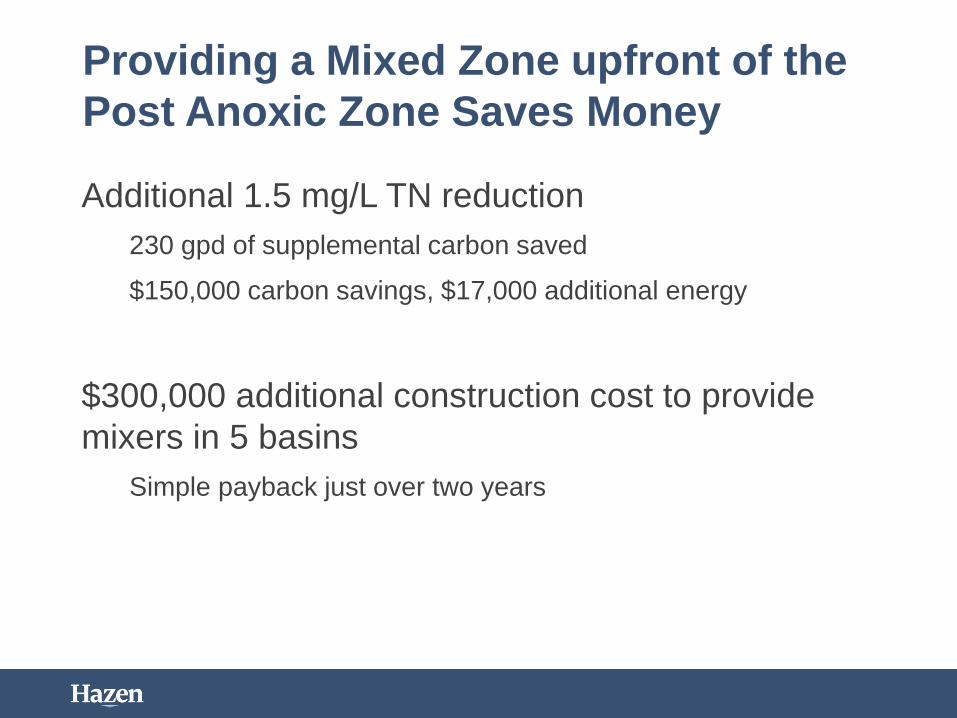
Providing a Mixed Zone upfront of the
Post Anoxic Zone Saves Money
Additional 1.5 mg/L TN reduction
230 gpd of supplemental carbon saved
$150,000 carbon savings, $17,000 additional energy
$300,000 additional construction cost to provide
mixers in 5 basins
Simple payback just over two years
Decoupling aeration and mixing for reduced
energy and effluent TN
Diffused aeration is an expensive way to mix reactors
Proper design, control & operation should limit the frequency of occurrence
The ability to decouple mixing from aeration can result in:
Decreased energy consumption
Decreased chemical usage
Decreased effluent nutrients
Decoupling aeration and mixing for reduced
energy and effluent TN
Providing separate mixing equipment in aerobic
zones (especially towards the end) can be cost-
effective
Vertical, hyperboloid and big-bubble mixers can be cost
effective and installed with diffused air
At a minimum, develop control strategies to allow
airflows to drop below minimum mixing
requirements, with occasional re-suspend cycles
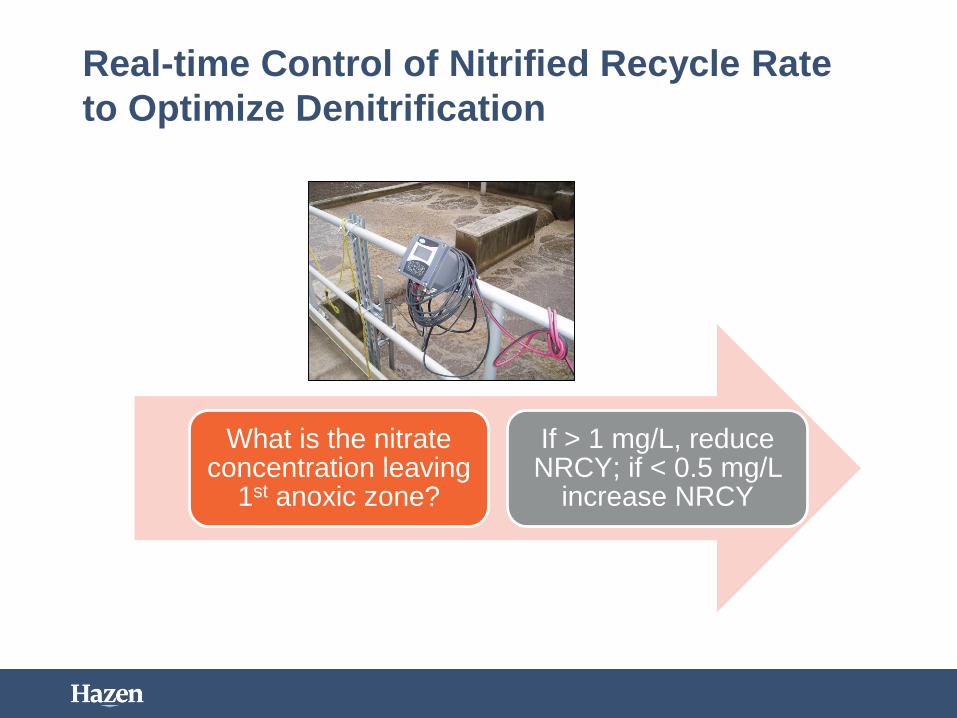
Real-time Control of Nitrified Recycle Rate
to Optimize Denitrification
What is the nitrate concentration leaving
1st anoxic zone?
If > 1 mg/L, reduce NRCY; if < 0.5 mg/L
increase NRCY
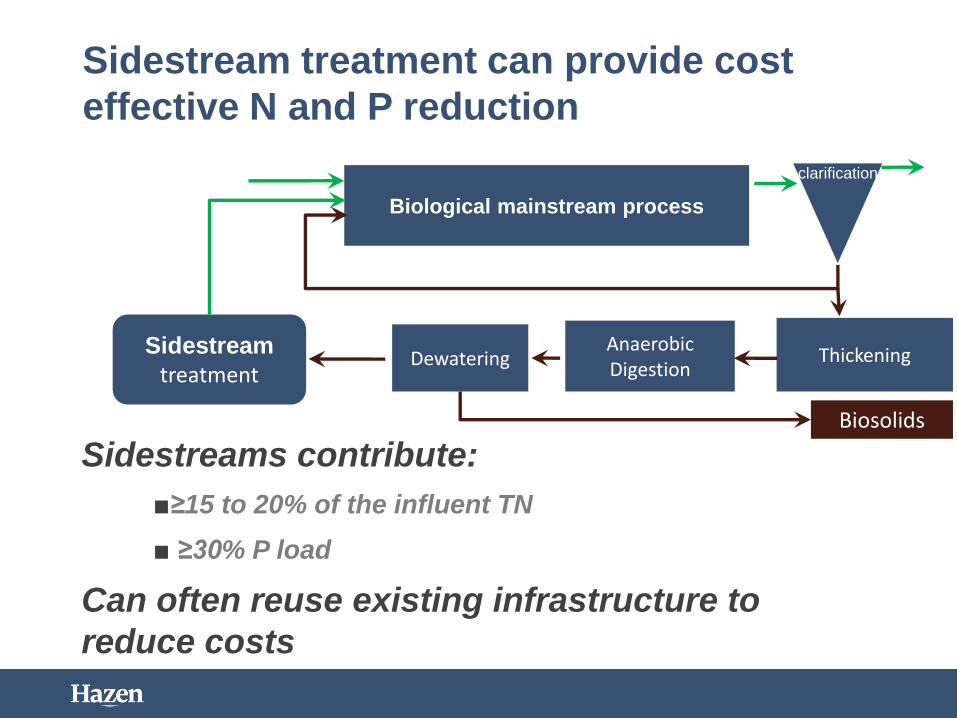
Sidestream treatment can provide cost
effective N and P reduction
Sidestreams contribute:
■≥15 to 20% of the influent TN
■ ≥30% P load
Can often reuse existing infrastructure to
reduce costs
Thickening
Biological mainstream process
Anaerobic Digestion
DewateringSidestream
treatment
clarification
Biosolids

MR396
Sidestream N treatment -
Anammox/Deammonification
41
Ammonia oxidizing bacteria(AOB)
Anammox bacteria
Oxygen: ~63% theoretical savings Carbon: ~100% theoretical savings Achieve 80-90% TIN removal Sustainable, green technology
PaquesKruger/Veolia Demon
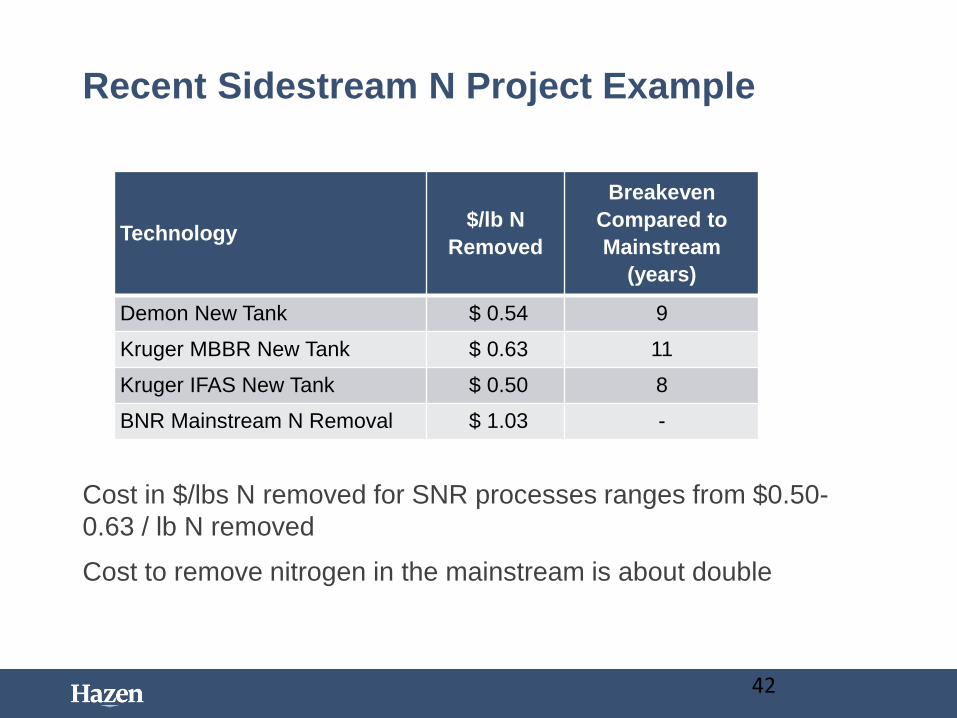
Recent Sidestream N Project Example
Cost in $/lbs N removed for SNR processes ranges from $0.50-
0.63 / lb N removed
Cost to remove nitrogen in the mainstream is about double
42
Technology$/lb N
Removed
Breakeven
Compared to
Mainstream
(years)
Demon New Tank $ 0.54 9
Kruger MBBR New Tank $ 0.63 11
Kruger IFAS New Tank $ 0.50 8
BNR Mainstream N Removal $ 1.03 -
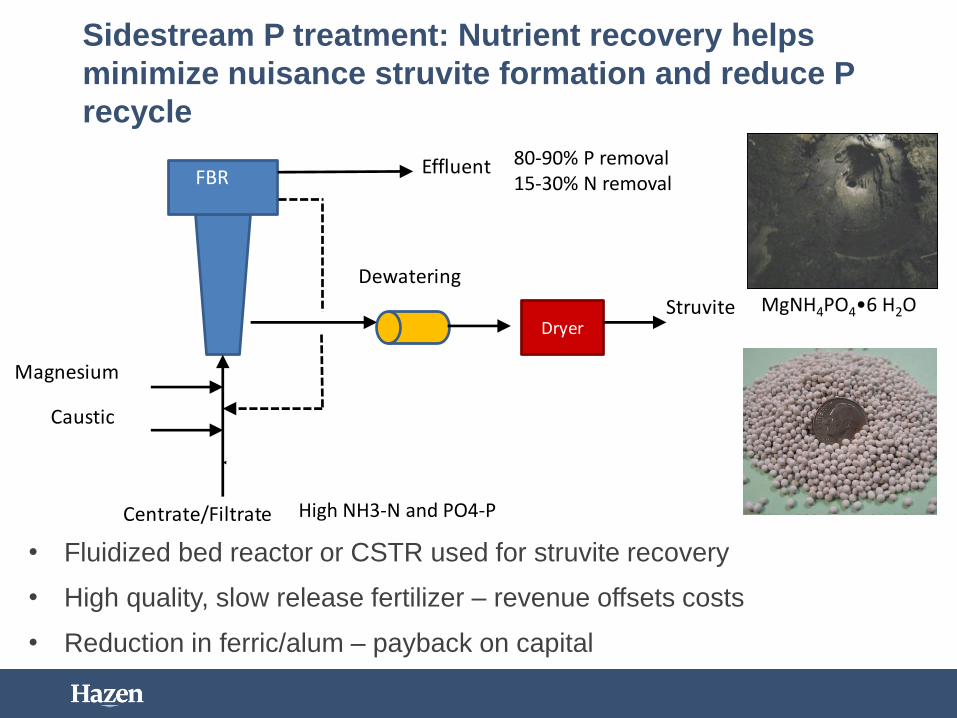
Sidestream P treatment: Nutrient recovery helps
minimize nuisance struvite formation and reduce P
recycle
• Fluidized bed reactor or CSTR used for struvite recovery
• High quality, slow release fertilizer – revenue offsets costs
• Reduction in ferric/alum – payback on capital
Magnesium
Caustic
Centrate/Filtrate
Dryer
Effluent
Struvite
Dewatering
Sand (Procorp)
FBR80-90% P removal15-30% N removal
High NH3-N and PO4-P
MgNH4PO4•6 H2O
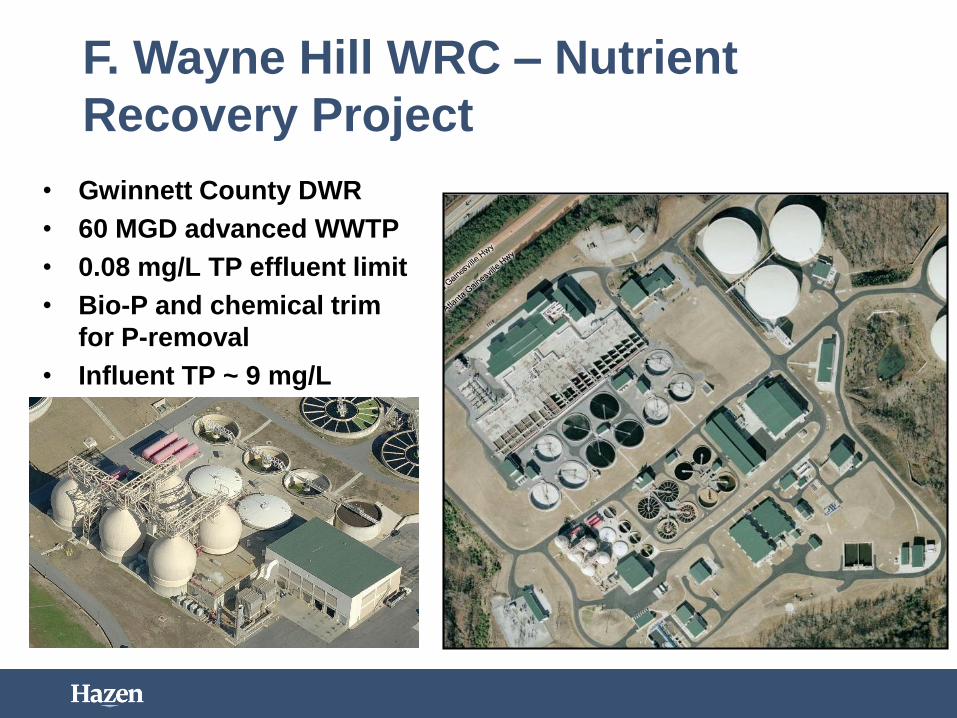
F. Wayne Hill WRC – Nutrient
Recovery Project
• Gwinnett County DWR
• 60 MGD advanced WWTP
• 0.08 mg/L TP effluent limit
• Bio-P and chemical trim
for P-removal
• Influent TP ~ 9 mg/L

Implementation of WASSTRIP™ concept at
FWH to minimize nuisance struvite production
Primary
Clarification3 Stage BNR
Secondary
Clarification
Rotary Drum
Thickening
Dewatering
Centrifuges
Ostara
Nutrient
Recovery
To Tertiary
TreatmentInfluent
WAS
Anaerobic
Digestion
RAS
P-Release Tank
Struvite
Pellets
PS
Filtrate EQ
Centrate
EQ
NaOH
MgCl2
Cake
Filtrate / Centrate
Nutrient
Recovery
Facility
Centrate
Pump
Station
Lower P and Mg content of sludge minimizes nuisance struvite formation from digester onwards
Release P and Mg from sludge
Send P, Mg rich sidestream to recovery process
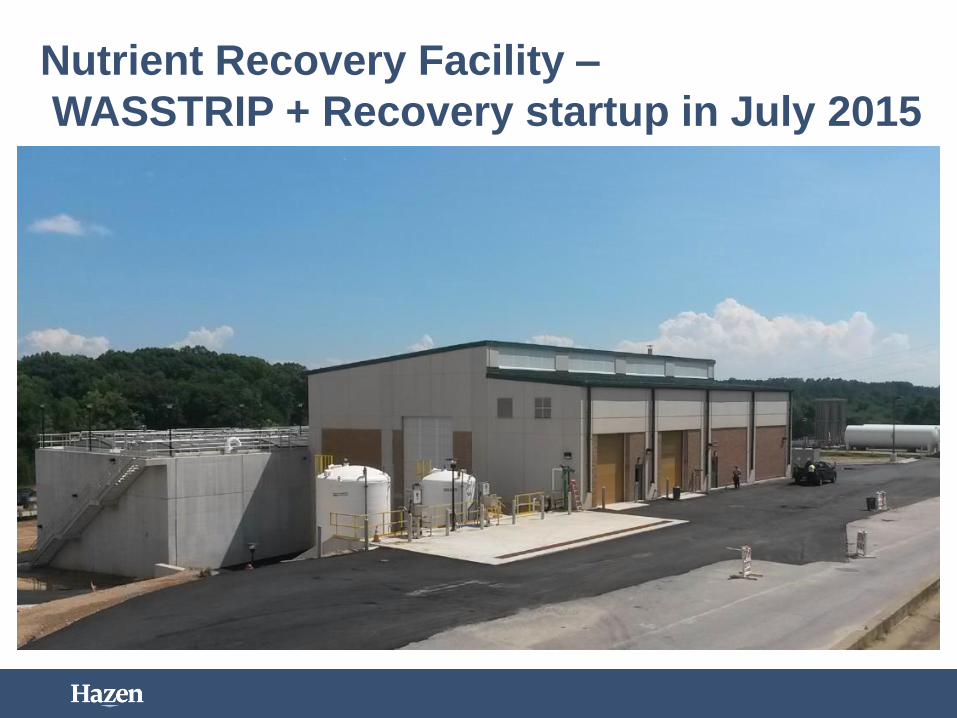
Nutrient Recovery Facility –
WASSTRIP + Recovery startup in July 2015

Observations from last 4 months
• Producing about 1 ton
per day of slow release
fertilizer product
• Reduced main plant
chemical use
• Dewatered cake
increase from 22 to 24%
• 22 wet ton decrease in
sludge mass leaving
plant
15
16
17
18
19
20
21
22
23
24
25
26
27
28
Cak
e S
olid
s (%
TS)