priority lincoln: budgeting for...
TRANSCRIPT

Priority Lincoln:
Budgeting for Outcomes
Final Report
May 29, 2008
215 Centennial Mall South, Suite 401, Lincoln, NE 68588-0228 Ph: 402-472-5678 | Fx: 402-472-5679
www.ppc.nebraska.edu

Table of Contents
Acknowledgements ........................................................................................................ 3 Background .................................................................................................................... 4
Budgeting for Outcomes Overview .............................................................................................................. 4 Budgeting for Outcomes in Lincoln, Nebraska, 2008-09 .............................................. 6
Priority Lincoln .................................................................................................................................................... 6 Public Participation Methods Utilized .......................................................................................................... 9
Scientific Telephone Survey .................................................................................................................... 10 Deliberative Discussion ........................................................................................................................... 10 Non-Random Survey ................................................................................................................................ 11 Town Hall Meetings ................................................................................................................................. 12 Focus Group .............................................................................................................................................. 13
Key Findings ................................................................................................................ 14 Highest Priorities ........................................................................................................................................... 14
Safety and Security .................................................................................................................................... 14 Economic Opportunity ............................................................................................................................ 15
Lowest Priorities ............................................................................................................................................ 16 Caveat About Lowest Priorities .............................................................................................................. 16 Accountable Government, Destination Lincoln, Effective Transportation, and Environmental Quality ............................................................................................................................. 16
Paying for City Government ........................................................................................................................ 17 Raising Taxes ............................................................................................................................................. 17
Lincolnites’ Attitudes Toward the City’s Government ............................................................................ 18 Trust, Confidence, and Fairness ............................................................................................................. 18
Lincolnites’ Knowledge About the City ..................................................................................................... 19 Misconceptions .......................................................................................................................................... 19 The Deliberation Experience is Associated with Knowledge Acquisition ...................................... 19
Conclusions .................................................................................................................. 20 Appendices Appendix Table of Contents ........................................................................................ 22
Overview ......................................................................................................................................................... 23 Appendix A: Scientific Telephone Survey ................................................................................................. 24 Appendix B: Deliberative Discussion ......................................................................................................... 56 Appendix C: Non-Random Survey ........................................................................................................... 113 Appendix D: Town Hall Meeting.............................................................................................................. 130 Appendix E: Focus Group ......................................................................................................................... 134
2

Acknowledgements The public participation activities were primarily funded from a grant provided by the Lincoln Community Foundation (www.lcf.org/). This entire effort was fueled by the largesse and vision of the Foundation, coupled with the vision of Lincoln Mayor Chris Beutler. In addition to funding from the Lincoln Community Foundation and the City of Lincoln, in-kind and other product/service donations were provided by IGA Grocers in Lincoln, Leadership Lincoln (www.leadershiplincoln.org/), Leadership Resources ((www.lrsuccess.com), Marriott Cornhusker Hotel (www.thecornhusker.com/), Qualtrics Survey Software Company of Provo, Utah (www.qualtrics.com/), and the University of Nebraska (Bureau of Sociological Research, bosr.unl.edu/; Pesticide Education Office of the Agronomy and Horticulture Department (pested.unl.edu/, and Public Policy Center, ppc.nebraska.edu). Many thanks go to Rick Carter Mark Koller and Phil Young for providing private sector input as part of the project oversight committee. We also want to thank Bill Kelly of NET-TV for moderating the April 12th Deliberative Discussion, as well as the many individuals who volunteered their efforts to assist with the event and moderate discussions: Diana Breshears, Kathy Castle, Derrick Eells, Pete Ferguson, Deane Finnegan, Gerry Finnegan, Steve Frayser, Shireen Ghorbani, Kathy Krone, Ashley Loudd, Kathy Rutledge, Leslie Schacht, Terry Uland, Vanessa Wasser, and Brent Yergensen. Additional thanks to Clyde Ogg of the University of Nebraska-Lincoln Pesticide Education Office for providing the remote voting technology used at the deliberation and town hall meetings, and Bill Luxford of 5 City TV for taping and producing part of the deliberation events for cable broadcast. Lincoln Journal Star provided a link from their website to access the online survey, for which we are most appreciative. The town hall meetings were coordinated by Leadership Lincoln; the town hall meetings were facilitated by Todd Hall, Vice President of Consumer Services for Lincoln Electric System (www.les.com/), and the small break-out group discussions at the town hall meetings were moderated by Leadership Lincoln alums. We also want to thank Boyd Ober, President of Leadership Resources (lrsuccess.com/) for conducting the focus group.
3

BACKGROUND As a centerpiece to its 2008-09 budget determination process, the City of Lincoln invited the community to provide input about how the City should prioritize budget items. Several thousand residents provided input over a period of approximately 90 days, starting in February 2008 and ending in May 2008. This Report presents the results from the City’s public participation process. BUDGETING FOR OUTCOMES OVERVIEW In Lincoln the budget process begins, as it does with most cities, with the Mayor asking each City Department head to submit a request based on the Department’s needs. Typically, departments base their funding requests for the upcoming year on their actual spending during the current budget year, adjusting the figure up or down in light of the activities that the agency heads and the Mayor want to undertake in the new budget year and in light of the city’s fiscal status (is it rising, declining, or about the same as last year?). This approach to budgeting is known as “incremental” budgeting, so called because the budget changes only incrementally from year to year.1 A number of observers have criticized this approach to governmental budget planning. 2 They argue the typical way of budgeting privileges the status quo; it is susceptible to be driven largely by political considerations; and it permits government officials to avoid making tough decisions out of fear of angering vested interests. Another criticism is that incremental budgeting allows the government to use accounting gimmicks to make it look as though the jurisdiction is in good financial shape even when it is not: In such cases the budget problem is simply put off to the future, and budget problems sometimes are compounded should economic conditions worsen. A better way of budgeting, it is argued, is strategic budgeting – budgeting that is goal-oriented, looking to the future as opposed to being mired in the past. Strategic budgeting, thus, inspires a fresh look at spending priorities each budget cycle, with specific goals identified and tactics for achieving these goals systematically developed and publicly specified. Such strategic budgeting is transparent, and it enhances governmental accountability.
1 See, e.g., William D. Berry. (1990). The confusing case of budgetary incrementalism: Too many meanings for a single concept. Journal of Politics, 52: 167-196. 2 Berry, note 1. See also David Osborne & Peter Hutchinson. (2004). The price of government: Getting the results we need in an age of permanent fiscal crisis. New York: Basic Books. As is discussed below, Osborne and Hutchinson offer an alternative to incremental budgeting, one they term “budgeting for outcomes.” For a short, easy-to-read overview of their budgeting for outcomes approach, see: Osborne & Hutchinson. (2004, October). Budgeting for outcomes: Delivering results citizens value at a price they are willing to pay. Government Finance Review, pp. 10-14. Available at http://www.gfoa.org/downloads/GFR1004.pdf.
4

“Budgeting for Outcomes” is a strategic and transparent budgeting approach that overcomes many of the problems inherent in the incremental approach.3 The outcomes-based budgeting approach starts with a determination of results desired from government for the upcoming year. The budget is then tied to proposed goals. Although this approach seems simple, in many ways it is more cumbersome than traditional budgeting approaches. It requires government officials to ascertain essential community needs, determine service and outcome priorities, and articulate goals and expected outcomes. Under an outcomes-based budgeting approach, then, priorities are systematically determined, strategies are carefully designed to meet selected goals, and measures are identified so that it can be objectively determined whether goals have been met. Unlike incremental budgeting, outcomes-based budgeting requires transparency: Funding dollars are linked to goals. Outcomes are measurable. Government is accountable. The outcome budgeting approach is relatively new. States such as Michigan have adopted it,4 as have cities such as Dallas5 and Fort Collins,6 and counties such as Polk County in Florida7 and Snohomish County in Washington.8
Budgeting for outcomes has been utilized, to great acclaim,9 in the State of Washington, which faced a serious budget crisis and economic downturn in the early part of this decade. Although Washington was not able to avoid tough decisions such as layoffs and reductions in government services, then Governor Gary Locke’s budgeting for outcomes process allowed the state to take a long-term approach rather than simply trying to rely upon “quick fixes” to deal with its deficit. 10 Washington’s
3 Osborne & Hutchinson, note 2. See also Lawrence L. Martin. (2000). Management Notes: Budgeting for Outcomes in State Human Service Agencies. Administration in Social Work, 24 (3): 71-85; Lawrence L. Martin. (2002). Budgeting for outcomes. In Aman Khan & W. Bartely Hildreth (Eds.), Budget theory in the public sector (pp. 246-260). Westport, CT: Quorum Books. 4 Michigan’s Cabinet Action Plan. (2005). Governing for results. Available at http://www.michigan.gov/documents/cap_134919_7.pdf . See also Budgeting for outcomes: The process. (2005). Available at http://www.michigan.gov/documents/cap_134919_7.pdf . 5 City of Dallas. (2006, May 3). Budgeting for outcomes: Status report. Available at http://www.dallascityhall.com/council_briefings/briefings0506/20060503_bfo.pdf. 6 City of Fort Collins. (2008). Budgeting for outcomes. Overview. Available at http://fcgov.com/bfo/. See also City of Fort Collins. (2008). Budgeting for outcomes. 2008-2009 Key results. Available at http://fcgov.com/bfo/results.php. 7 Polk County Florida Board of Commissioners. (2008). Budgeting for outcomes. Available at http://www.polk-county.net/county_offices/Budget_and_Management_svcs/outcomes.aspx. 8 Charles Taylor. (2006, December 11). Counties erase deficits by ‘budgeting for outcomes.’ NACO County News. Available at http://www.naco.org/CountyNewsTemplate.cfm?template=/ContentManagement/ContentDisplay.cfm&ContentID=21992. 9 See, e.g., The Pew Center on the States. (2008). Government performance project: Grading the States 2008. Washington. Available at http://www.pewcenteronthestates.org/uploadedFiles/PEW_ExecSumm_WA.pdf. 10 Katherine Barrett & Richard Greene (2005, February). The government performance project: Grading the States ‘05. Washington. Governing Magazine. Available at http://governing.com/gpp/2005/wa.htm.
5

outcomes-based process has been and continues to be viewed favorably by residents, government officials, and the media.11 David Osborne and Peter Hutchinson, the “gurus” of the budgeting for outcomes movement, counsel that the government’s priority setting process needs to include the public.12 Methods for including the public range from surveying to focus groups, town hall meetings to online input, and so on. The budgeting for outcomes literature, however, does not provide evidence to indicate whether one form of public input is preferred over another, or whether some combination of techniques provides useful information to policymakers. The only constant is that public input is deemed to be an integral part of the outcomes-based budgeting process. BUDGETING FOR OUTCOMES IN LINCOLN, NEBRASKA, 2008-09
PRIORITY LINCOLN Lincoln is currently facing a budget crisis, and like other cities facing fiscal problems, the City has to make tough budget decisions. In July of 2007, Mayor Chris Beutler proposed a budget of $131.7 million for fiscal year 2007-2008 and made significant cuts to address a shortfall of approximately $9 million.13 In doing so, dozens of jobs were eliminated through lay-offs, and both a hiring freeze on vacant positions and an early retirement program were imposed. Many departments were forced to cut their budgets by significant amounts as well.14 Mayor Beutler called it “the toughest budget in memory.”15 The City faces another difficult round of budget decisions this year: Given current revenues available to the the City, each Department will only receive 96.5% of the money received in the 2007-08 fiscal year. Costs to run government increase at least the amount of inflation. Thus, another shortfall exists, and without a revenue increase, program or personnel cuts will be required. On February 12, 2008, Mayor Beutler announced his intention to adopt the outcomes-based budgeting approach as he and his department heads determined their 2008-2009 budget.16 To kick-off the initiative, called “Priority Lincoln,” the City identified eight strategic priorities for 2008-09, with most of the strategies cutting
11 See notes 8, 9, & 10. 12 See Osborne & Hutchinson, note 2. 13 Deena Winter. (2007, July 8). Big changes to city budget may be in store. Lincoln Journal Star, p. A1. 14 City of Lincoln. (2007-2008). Council adopted budget: Budget summary. Available at http://www.lincoln.ne.gov/city/finance/budget/pdf/sum08.pdf . 15 Matt Olberding. (2007, July 10). Council Republicans react positively to budget plan. Lincoln Journal Star, p. B1. 16 City of Lincoln. (2008, February 12). City to seek public input on budget priorities: Process will include scientific phone survey. Available at http://www.lincoln.ne.gov/City/mayor/media/2008/021208.htm.
6

across the City’s service areas17 and departments. The Strategic Priority areas,18 ordered alphabetically and with benchmarks identified, are:
1. Accountable Government Conduct audits supervised by City Audit committee Improve maintenance frequency of city assets Maintain citizen satisfaction with access to city services Ensure adequate financial controls are in place Maintain legal protection against discrimination and harassment
2. Destination Lincoln Increase visitors Maintain number of adult recreation participants Ensure all citizens access to cultural activities such as music, art, and
community festivals Maintain Lincoln citizens’ satisfaction with quality of life Maintain level of education, appreciation, and recognition of Lincoln's
growing diversity 3. Economic Opportunity
Maintain number of jobs that pay at or above the City’s median salary rate
Increase the rate of business start-ups per year Increase percentage of college graduates who remain in Lincoln Speed the City’s development process Increase the number of primary jobs
4. Effective Transportation Build new roads each year to promote growth Repair existing roads Increase bus ridership Maintain average work commute at or below current standard Maintain existing trail lane miles
17 The City’s 12 service areas are: 1) Building Permits and Safety; 2) Health Department Services; 3) Human Services; 4) Fire and Ambulance Services; 5) Job Creation and Economic Development; 6) Libraries; 7) Maintenance and Management of Traffic Flow; 8) Management of Sewage and Storm Water; 9) Parks, Trails and Recreation; 10) Police; 11) Public Bus and Transportation Services; 12) Zoning and Growth Planning. 18 City of Lincoln. (2008, April 22). Outcomes 2008. Handout from the City, distributed at town hall meetings held in April and May in Lincoln. The City’s priority areas and the outcomes/benchmarks continued to evolve after the community input activities began in February. Thus, some of the materials used in the project and referred to in this Report – including briefing materials and surveys – have somewhat different Strategic Priority labels than those presented in the text following this footnote. We decided it is most useful to provide the latest iteration of the City’s priority areas and outcomes in this Report, even though the lack of consistent terminology or labels might be slightly confusing at times.
7

5. Environmental Quality Keep Lincoln air, water and soil clean Reduce flood risk Maintain green space per mile of urban area Increase water and wastewater infrastructure to meet growth Decrease landfill usage
6. Healthy & Productive People Decrease rate of low weight babies Maintain years of healthy, independent living for older adults Increase physical activity Prevent and reduce chronic disease Maintain the number of restaurant inspections per year Ensure adequate human services exist to meet critical needs
7. Livable Neighborhoods Ensure an adequate number of affordable homes Increase home ownership rates Maintain rate of neighborhood parks per square mile of residential
development Maintain availability of outdoor public pools Maintain current levels of access to public libraries
8. Safety & Security Maintain a low violent crime rate Clear serious crimes at a rate near our peer cities Maintain a timely ambulance response rate Decrease property damage from fire Enhance Public Health emergency response capacity
The Mayor invited the public to provide input into the priority areas and offer perspectives on the ordering of the priorities themselves.19 In addition, the public was asked to provide input into budget funding options: Should taxes be increased? Should funding be cut from lower priority areas? Should funding levels be enhanced for specific priority areas, and if so which ones and why? Residents also were asked to consider other sectors that contribute funding to the city’s services and activities, specifically the community’s philanthropic organizations and others in the private sector. Finally, residents were asked to provide input into their assessment of government: How much trust and confidence do residents of Lincoln have in their City’s government, and how fair do they perceive governmental actions such as its budgeting process? In order for the information to be used by City leaders, the Priority Lincoln community input process was initiated in February and concluded in May 2008. Initial decisions on the City’s 2008-09 budget are scheduled to be made during May. The budget is to
19 See note 16.
8

be released to the public in July. The budget goes for City Council consideration in July, with public hearings scheduled for August 11. Any modifications are negotiated between the Council and the Mayor, and on August 25 the Council is scheduled to approve the budget. Thus, the information collected in Priority Lincoln will be used by the Mayor and his department heads to inform the budget process in the months ahead. PUBLIC PARTICIPATION METHODS UTILIZED The public has had five different opportunities for input to date: a Scientific Telephone Survey (Appendix A), a Deliberative Discussion about the City budget (Appendix B), a Non-Random Survey (Appendix C), Town Hall Meetings (Appendix D), and a Focus Group (Appendix E).20 Each public input method is described further below.21 Opinions regarding budget priorities were obtained as part of each of the five public input activities, with input ranging from surveys to live remote voting technologies in the deliberative discussion and the town hall meetings. The scientific telephone survey provided the most rigorous and systematic collection of residents’ input, though each of the public participation activities provided valuable information in its own right. In addition, budget briefing materials (see Appendix B) were prepared and sent directly to those who agreed to participate in the deliberative discussion and focus group and made available for anyone who wanted to review them via the Public Policy
20 Throughout this Report, each public input method will be presented in italicized type so it is clear which public input method is being discussed. 21 As noted in the pages that follow, the public participation activities included five separate undertakings. 1) A scientific telephone survey was conducted by the University of Nebraska-Lincoln Bureau of Sociological Research based on a survey created by the Public Policy Center. 2) The Public Policy Center organized a deliberative discussion allowing residents to spend a day examining budget issues and budget trade-offs and questioning city leaders and managers about the budget. The deliberation was held at the Marriott Cornhusker Hotel’s conference facility. 3) The Public Policy Center adapted the scientific telephone survey so that it could be responded to either online or in paper form (non-random survey). The non-random survey was available from the Center’s website and the Mayor’s webpage. The paper copy of the survey was available from the City’s libraries and other city departments, and several human service agencies in the community made the survey available to their clients and others. The non-random survey was publicized via a press conference with the Mayor that was played continuously on local public access television, via media coverage (radio, television, and newspaper), and via personal invitations from the Mayor and others in City Government at meetings and public appearances. 4) Four town hall meetings were convened by Leadership Lincoln, a community leadership development and support organization. Residents were able to learn about the City’s budget from the Mayor and department officials. Budget issues were discussed in small groups, and then more discussion was held with the Mayor and department officials. Remote voting technology allowed each participant to respond to questions posed by the facilitator and see the results of everyone’s responses in real time. 5) A focus group discussion was held with residents unable to attend the deliberation. The discussion was facilitated by Boyd Ober of Leadership Resources, a leadership and strategic planning/development company.
9

Center’s website.22 The budget briefing materials were designed to educate members of the public as part of the Priority Lincoln process. The briefing document provided an overview of the City’s operations, programs, and budget; described the reason that the City is currently facing a revenue problem and provided future revenue projections; explained the budgeting for outcomes approach; presented information about the role of philanthropic contributions to city services and programs; and offered information about the City’s eight outcome areas.
1. Scientific Telephone Survey The scientific telephone survey was conducted to obtain the opinions of residents regarding the City’s budgeting priorities (see Appendix A). A random-digit-dialing procedure was used to obtain a representative cross-section of Lincoln’s residents. Six hundred five (605) residents completed the survey, which on average took respondents about 20 minutes to complete. The survey was conducted during March. Residents were mailed a postcard from the Mayor informing them they had been randomly selected to participate in the survey. A total of 1,586 contacts were made, with a 38% response rate and a confidence range of +/- 4% for results. Oversampling was used to obtain adequate minority representation.23 The greatest strength of the scientific telephone survey input is that it was based on a scientific sample, so the results from the telephone survey provide the best and most reliable insight into the views of Lincoln residents. The greatest weakness is that survey responses are a point in time assessment of what Lincolnites think. The survey does not tap into changes in attitudes and opinions that people might make once they have a chance to better understand the budgeting issues in general and the Lincoln issues in particular.24
2. Deliberative Discussion
Fifty-one (51) residents participated in a day-long, deliberative discussion about the City’s budget issues. A total of 286 individuals from the scientific telephone survey were invited to participate in the Priority Lincoln deliberation.
22 See http://ppc.nebraska.edu/program_areas/documents/PriorityLincoln-Listening.pdf. 23 Weighting was only used in data analysis that compared various demographic groups in Lincoln. All weighting is based on U.S. census figures for the City of Lincoln to compensate for underrepresentation of younger respondents, overrepresentation of older residents, slight overrepresentation of women, and minority underrepresentation. 24 The results of the public knowledge questions show that there are a number of misperceptions that exist among residents as to where Lincoln’s funding comes from and how that funding is used. Most of the misunderstandings center on the property tax. Specifically, citizens overestimate the proportion of each property tax dollar that the City receives, and they overestimate the extent to which the City relies upon the property tax to fund its operations. The results of the deliberative discussion show that there are knowledge gains once residents become engaged in discussing the City’s budget (see Appendix B).
10

Thirty-six percent (102) said they would attend; 51 (50% of those who accepted the invitation) residents showed up for the April 12th deliberative discussion.25
Participants were sent the briefing materials (see Appendix B) a week to two weeks before the event. The deliberative discussion was designed not only to gather greater in-depth information than the telephone survey, but also to educate others in the community about the budget via broadcasts of parts of the deliberative sessions on public access television. At the outset of the deliberative discussion, Mayor Beutler presented a briefing on the City’s budget to the discussion participants, including the news that Lincoln is facing a $6 million shortfall for the upcoming year. After the briefing, participants were randomly assigned to six small groups. In the initial small group discussion sessions, participants identified questions about the City’s budget, and then had an opportunity to ask those questions of the department heads in a plenary panel discussion. Following that session, the participants re-convened in their small group discussion sessions and prioritized the City’s budget outcome areas. Finally, the participants presented their list of prioritizations to the Mayor and department heads. The participating Lincolnites were paid $75 to offset any childcare, travel costs or other expenses they might have incurred in order to spend nearly eight hours that day to participate in the deliberation event. Before the discussion sessions started, participants completed a pre-event survey and then another post-event survey after the deliberation concluded (see Appendix B). The greatest strength of the deliberative discussion input is that the responses obtained post-discussion reflect what randomly selected Lincolnites think once they have had a chance to better understand budgeting issues in general and the Lincoln issues in particular.26 Thus, in many ways the participants (somewhat) emulate government officials in that they are equipped to consider
25 A 50% attendance rate is typical for public participation events of this type. 26 There was at least a 9% increase or greater in the numbers of deliberation participants’ who correctly answered knowledge questions from pre- to post-event for five of the nine knowledge questions we asked, with an over 30% increase in numbers of participants who correctly answered on three of the questions. The deliberation discussion participants at the outset of the event were indistinguishable from the non-random survey respondents (see below) in the percentages of those who correctly answered each knowledge question, though both the deliberation discussion participants and the non-random survey respondents were markedly superior to the complete random sample in terms of percentages of correct responses to the knowledge questions. This suggests that either those from the random sample who scored higher were more likely to attend the deliberation event or those who agreed to participate in the deliberations obtained accurate information about the City and its budget, from the briefing materials or other sources. In any event, by the end of the deliberation, the 51 participants were much more likely to answer questions correctly than any other group involved in the public input.
11

the competing trade-offs as they make complicated budget determinations. The greatest weakness is that the time commitment needed to participate in the deliberation may have been a barrier to some. Also, we do not know the extent to which the deliberative participants represent their fellow Lincolnites.
3. Non-Random Survey
A non-random survey (see Appendix C), open to anyone, was made available via the internet as well as in paper copy from March, 2008, to May, 2008. The survey was accessed nearly 1,700 times (online and hard copy, combined), and approximately 1,300 surveys were completed27 over the month that the survey was online or in the field.28 The survey also allowed respondents to provide narrative input to many of the questions. The open-ended questions were examined along with the quantitative questions. The strength of the non-random survey is that it was accessible for many in the Lincoln community, and the fact that over 1,000 responses were received indicates Lincolnites were eager to make sure their voices were heard by the City. People could respond at a time convenient to them, unlike with the other methods of public input. A weakness is that the survey was non-scientific and, unlike the telephone survey, the results cannot be generalized to other individuals in Lincoln. Also, it is possible some interested parties tried to influence the outcomes of the survey. Another weakness is that the complexity of the survey itself meant that some in the community found it difficult, if not impossible, to answer the survey questions. For some, taking a 20 minute survey is not a significant matter, but for others in the community, it is a barrier to providing input.
4. Town Hall Meetings A series of town hall meetings were convened to allow citizens to discuss budget issues and provide input on their budget priorities (see Appendix D). Mayor Beutler attended each meeting, provided a budget briefing, and answered questions. Also in attendance were the heads or other high officials from each of the City’s departments. Nearly 200 residents attended the town hall meetings
27 It is not known exactly how many surveys were completed since it was possible to skip questions on the survey. Furthermore, it is the case that one person could provide input multiple times, electronically or via the paper version. It is possible to ascertain how many responses were received for each question, which ranged from a high of 1,699 for the first question (because any visit to the electronic version of the survey would result in “hit” on the first question, we do not believe there were 1,699 respondents) to a low of 1,263 responses to the race/ethnicity and education questions at the end of the survey. Because the “public” survey was not intended to be scientific, the lack of precision does not matter from a results perspective. In our Report, we focus on consistencies and inconsistencies across the different public input rather than dwell on the results of any one input activity. 28 The survey was officially supposed to be off-line at midnight, May 9. However, the survey was open past that date This Report includes those data received as of May 12.
12

(some individuals attended more than one meeting), which were held on April 22nd at Lincoln Southwest High School; April 24th at Lincoln Public School’s District Offices; April 29th at North Star High School; and May 6th at Lincoln High School. Input was obtained from 128 residents29 (some residents left the town hall meeting after discussion but before providing input) on their budget priorities; whether to increase, decrease or keep spending the same; and how to fund the community’s top priority outcomes. The strength of the town hall meetings is that each provided Lincoln residents with a chance to interact with other residents and with the Mayor and City managers. It allowed interested individuals on an opportunity to make sure the Mayor and other city officials heard their concerns and ideas. The weakness of the town hall meetings is that it packed in a lot of information and activity at the end of the workday, and there was a marked drop-off in participation over the course of the town hall meeting (each of which lasted approximately two hours). Nonetheless, the town hall participants were similar in their preferences to the other public input participants.
5. Focus Group A focus group (see Appendix E) facilitated by a professional facilitator was conducted with four (4) residents. Nineteen people, drawn from the scientific telephone survey list were called asking whether they would be willing to participate in the focus group. Direct contact was made with nine people, four of whom participated in the Saturday, May 3, focus group session. The session lasted several hours, and the participants were compensated $25 to offset any childcare, travel costs or other expenses they might have incurred. The focus group allowed for an in-depth, guided discussion about the City’s budget. The same briefing materials provided to the deliberative discussion participants were given to the focus group participants, and they answered the same post-event survey as did the deliberation participants.
The strength of the focus group is that it provided a small group an opportunity to extensively explore and discuss budget issues. The weakness of the focus group is that it was attended by so few people that it is difficult to draw any specific conclusions, though not surprisingly the preferences of the focus group participants seemed consistent with the preferences of the others public input groups.
Overall, the multi-method approach used by Lincoln provided a process that was: 1) in part scientifically rigorous, ensuring some of the results obtained could be
29 One hundred twenty-eight participants participated in the electronic voting exercise at the town hall meetings. Eighty-four participants completed paper and pencil surveys administered at the events.
13

generalized to other City residents who did not participate in the public input process; 2) captured both quantitative and qualitative perceptions, providing not only easily interpretable data but also further insights into the thinking of residents of Lincoln; and 3) provided a large number of residents the opportunity to provide input. It is reasonable to estimate that we obtained input from approximately 2,000 people. In a City of approximately 240,000 that is not a lot of the community. On the other hand, it is the first time in the City’s history that so many members of the community have had the opportunity to make their opinions of the budgeting process known to the City government.
KEY FINDINGS
HIGHEST PRIORITIES: SAFETY & SECURITY AND ECONOMIC
OPPORTUNITY
Safety and Security In each of the five public input opportunities, Lincoln residents rated Safety and Security services and outcomes as their highest priorities. In the deliberative discussion and the town hall meetings, residents consistently praised the level of police, fire and ambulance services in the community. To use an education metaphor, most residents would assign Lincoln a grade of A/A+ in these areas. Residents’ support for Safety and Security even increased more after the deliberative discussion: 30% of the budget was allocated to Safety and Security after deliberation, virtually twice the amount of the next highest allocation by the Lincolnites who deliberated.30
“I always see police cars in my neighborhood. I love them, God bless them. They are my angels because I feel safe in Lincoln, I do.” - Lincoln Resident
Despite the high regard for the police, fire and emergency services, there were some disagreements about what to do with the Safety and Security area as a budgeting matter. This was most strikingly reflected in the non-random survey data: Safety and Security, as it did for all the public input methods, received the highest average ranking. In the non-random survey’s question asking residents what proportion of the budget should be allocated to each of the eight strategic priority areas, nearly 21% of the budget was assigned to the Safety and Security area, the highest by over five
30 The next highest allocation after Security and Safety for those who deliberated was Economic Opportunity, which was allocated 15.6% of the budget. These and other results are presented in Tables B.23 and B.27 in Appendix B. The fact that Safety and Security received roughly twice as much funding as the next largest area does not necessarily mean that Safety and Security is seen as twice as important as the next largest area. Rather than taking these numbers as precisely reflecting preferences, it is more useful to look at the numbers to provide rank ordering. The numbers do provide an imprecise magnitude of Lincolnites’ budget preferences, however.
14

percentage points than the next highest area (Effective Transportation).31 However, while telephone survey respondents also held Safety and Security in high regard, it was apparent that there were mixed feelings about whether to increase funding to that area or whether to simply maintain the current levels of funding; when asked whether to increase funding, decrease funding, or maintain current funding to the Safety and Security budget outcome area, 52% of respondents chose to maintian funding while 47% wanted to increase funding.32
Economic Opportunity Economic Opportunity was ranked highly; it was the second highest budget outcome priority identified in the deliberative discussion and the scientific telephone survey, and it was only slightly less highly rated than Effective Transportation by the non-random survey respondents. It also was highly rated in the town hall meetings.33 There were many Lincolnites who envisioned a greater role for private organizations in fostering economic growth for the City. When telephone survey respondents were asked the areas philanthropic entities should focus their investments, a substantial proportion said charitable organizations should focus on Economic Opportunity, suggesting that residents see distinctions between the role of public and private entities in this area.34 For example, as one online survey respondent argued, not all Lincolnites feel that the City should prioritize Economic Opportunity: “I have placed Job creation and economic development last because I do not view these as the responsibility of city government.” Another respondent, in a similar vein, wrote, “I believe the city needs to concentrate more on basic services and less on economic development.”
“Without a population that is healthy, safe, and economically growing, we will not benefit from parks, libraries, and new buildings.” - Lincoln Resident
31 These figures can be found in Table C.2 in Appendix C. 32 See Table A.12 in Appendix A. Respondents to the phone survey were generally in favor of maintaining or increasing funding and services for each of the budget outcomes. Very few respondents were in favor of decreasing funding and services for any of the budget outcome areas. 33 The results of the scientific phone survey question can be found in Table A.13; deliberative discussion results in Tables B.4 and B.23; Online Survey results in Tables C.2 and C.3; and town hall results in Table D.1. 34 See Table A.15 in Appendix A, where 23.5% of respondents said that charitable organizations should focus their efforts on Economic Opportunity.
15

LOWEST PRIORITIES: ACCOUNTABLE GOVERNMENT, DESTINATION
LINCOLN, EFFECTIVE TRANSPORTATION, AND ENVIRONMENTAL
QUALITY
Caveat About Lowest Priorities Although residents will select a lowest service or budget priority when asked to rank them, residents also indicate that choosing a priority as a lower one does not mean the area should be eliminated. Residents value the services the City offers. This can most easily be seen in the scientific telephone survey where respondents were asked to rate the importance of 12 City services. The lowest average score for a service was Public Bus and Transportation services with a score of 6.88; the highest average score was given to Fire and Ambulance services with a score of 9.09.35 The relatively small range between the highest and lowest scores shows that Lincolnites value all City services highly, as does the fact that no service received an average score below 6.36
“I would like to think that we would not have to cut these services, even though we put them at the bottom. Let’s not make them any worse. That would be my first request.” - Lincoln Resident
Similarly, several residents in the town hall meetings and the deliberative discussion mentioned the interconnectedness of the priority areas, and to them this meant that it was important to fund even the lowest priority areas. This also was reflected in the scientific telephone survey where 43% of respondents indicated that funding and services for Effective Transportation should be increased,37 yet gave it the second lowest priority among City budget outcomes.38 Similarly, scientific telephone survey respondents rated library services relatively high, even though it was one of the bottom two City service priorities among respondents when they were forced to make a decision which services should be the top and bottom priorities for the City.39
Accountable Government, Destination Lincoln, Effective Transportation, and Environmental Quality
When specifically asked which budget areas are less of a priority or which should be reduced if cuts have to be made, the above four budget outcomes were markedly more likely to be identified than were others. This means that if the City were to
35 See Table A.9 in Appendix A. 36 When services are rated on a scale from 1-10, one would expect an average score below 5 for any service that residents did not value. 37 See Table A.12 in Appendix A. 38 See Table A.13 in Appendix A. 39 Table A.9 in Appendix A shows that respondents gave libraries an average score of importance of 7.66 out of 10, placing it 7th among the 12 City services. Table A.10 shows that respondents place Libraries as their next-to-last priority (11th) when they were forced to decide on which services the City should focus.
16

follow public input literally, it would cut from these areas as opposed to the other priority areas. Unlike Safety and Security, which was seen as most important in each of the five public input methods, there is not a clear-cut distinction among the other areas in terms of importance and priority, other than the fact that Accountable Government, Destination Lincoln, Effective Transportation, and Environmental Quality are consistently seen as lower priorities. There was one other priority identified as lower priority by two of the public input methods. Economic Opportunity was pinpointed by the deliberative discussion participants and non-random survey respondents as one of the areas to be cut. Part of the reason that Economic Opportunity was selected for loss of funding, in all likelihood, is that it is a priority area Lincoln residents would like to see charitable organizations such as the Lincoln Community Foundation take an active role in fostering40 (other areas identified for support from the philanthropic sector included Healthy People and Quality of Life, according to both the scientific telephone survey and the non-random survey). PAYING FOR CITY GOVERNMENT
Raising Taxes Common wisdom is that Nebraskans are concerned about taxes. Responses on the non-random survey certainly reflected that concern.41 As one respondent wrote in an online comment on the non-random survey, “I know six families that have left [Lincoln] because of too high taxes.” The scientific telephone survey results were especially strong in rejecting raising taxes to funding new projects.42
“There is no need to raise our taxes.” - Lincoln Resident
When asked if the City should increase taxes, cut funds from other areas, or make no change in spending to fund priority services, budget outcomes and major new projects, a large proportion of the scientific phone survey respondents said that the City should take “Some Other Approach” to funding.43 Although the Some Other Approach response may not seem like a valuable response option,44 many of the
40 We discuss Economic Opportunity and the philanthropic sector above, in the text following note 33. 41 Twenty eight percent of respondents to the online survey said that taxes should be raised in order to fund a major new project. See Table C.5 in Appendix C. 42 Only 12.5% of telephone survey respondents indicated that they felt taxes should be raised in order to fund major new projects. See Table A.17a in Appendix A. 43 See Table A.11 in Appendix A. 44 Editorial. (2008, April 23). In end, budget questions can’t be ducked. Lincoln Journal Star. Available at http://ppc.unl.edu/whats_new/in_the_news/2008news/23-04-08-LJS%20editorial-In%20end.pdf.
17

respondents provided useful input when responding to the question of what the other approach should be. The responses to this question show that, while Lincolnites may hold varying opinions about taxes, they are also very willing to see the City take innovative and creative approaches, such as public/private partnerships, to fund new projects. Whereas Lincolnites are generally reluctant to pay taxes to fund new projects, they are not necessarily opposed to using their taxes to preserve governmental services and maintain priority programs. “While no one wants their taxes to increase, it is clearly time,” wrote one resident on the non-random survey. Forty percent of the deliberative discussion participants concluded by the end of their discussion that they would chose to increase their taxes in order to fund what they perceived to be priority City services.45 Approximately one-third of the deliberative discussion participants also were willing to increase taxes to fund their top budget outcome priorities at the end of the deliberation event, an increase of nearly 20% over their pre-deliberation positions.46 Similar positions were taken at the town hall meetings.47
“I would rather pay more taxes then to cut government services.” - Lincoln Resident
LINCOLNITES’ ATTITUDES TOWARD THE CITY’S GOVERNMENT
Trust, Confidence, and Fairness Lincoln residents are generally satisfied with City Government. Over half of the scientific phone survey respondents indicated that not only were they satisfied with the local government (53% indicated they “agree” or “strongly agree” with the statement), but also that officials treat residents with respect (68%), officials care about what residents think (60%), government can be trusted to make the right decisions (54%), and the City makes decisions in the best interests of the public (53%).48 The deliberative discussion participants were a slightly more cynical group than the scientific phone survey respondents who were polled prior to the deliberation;49 the
45 This is in contrast to the 23.4% who favored cutting funds from bottom service priorities to fund top service priorities. See Table B.19 in Appendix B. 46 See Tables B.25 and B.26 in Appendix B. 47 At the Town Hall meetings, 55% of respondents were in favor of increasing taxes to pay for priority budget outcomes. See Table D.3 in Appendix D. 48 With the exception of one statement, “Lincoln City government officials base their decisions on the facts, not their personal interests,” more individuals in the scientific phone survey agreed or strongly agreed to the positive statements about Lincoln City government than disagreed or strongly disagreed. See Table A.19 in Appendix A. 49 Deliberation participants were also more likely to give “Neither agree nor disagree” responses. See Table B.15 in Appendix B.
18

non-random survey respondents were similarly negative.50 After the deliberative discussion, however, participants greatly increased their positive opinions: There were increases in their perspectives on whether officials treat residents with respect (65% to 73%), officials care about what residents think (49% to 67%), government can be trusted to make the right decisions (39% to 51%), and the City makes decisions in the best interests of the public (37% to 53%).51 This finding suggests that interaction with government officials on such issues can increase trust and confidence in government. LINCOLNITES’ KNOWLEDGE ABOUT THE CITY
Misconceptions There are several misperceptions about the relationship between the property tax and City Government. Specifically, many Lincolnites overestimate the proportion that the City receives per property tax dollar and overestimate the extent to which the City relies upon property taxes to fund its operations. Most residents know the largest proportion of the budget is spent on Public Safety services. The City receives approximately 14% of each property tax dollar. To measure the extent to which residents are familiar with the tax situation in Lincoln, survey respondents were asked how much of each property tax dollar that the City receives. Only about 21% of the 605 random telephone survey respondents correctly answered the City receives less than 15% of each dollar, though 50% of the 1,300 non-random survey respondents answered the question correctly. Respondents were also asked which tax funds the largest proportion of the City’s budget. Only about 26% of the random survey respondents accurately identified the sales tax as the primary revenue source for the City (a large majority of respondents, 68%, inaccurately selected the property tax as the largest source of City funding), whereas 55% of the non-random survey respondents accurately selected the sales tax option (40% indicated property taxes).52
The Deliberation Experience is Associated with Knowledge Acquisition After deliberative discussion, participants’ knowledge of the City of Lincoln increased substantially in almost all of the areas in which they were tested. Participants were asked about the City’s largest budget category expenditure (from 69% correct in the pre-deliberation to 92% correct post-deliberation); the percentage of property tax dollars that go to the City (58% to 67%); largest source of revenue (54% to 68%); the size of the City’s annual budget (63% to 70%); the fact that the City Council makes
50 See Table C.7 in Appendix C. 51 See Table B.40 in Appendix B. 52 The results of all questions that measure citizen knowledge in each survey are presented in Tables A.18a-A.18e in Appendix A (phone survey), Tables B.31-39 in Appendix B (deliberation surveys), and Tables C.8a-C.8e in Appendix C (non-random survey).
19

the final decision on the City’s annual budget (60% to 70%); and the number of different languages and dialects spoken by Lincoln residents (18% to 52%).53
CONCLUSIONS Although Lincolnites’ highest priorities – Safety and Security – are unlikely to surprise anyone, it may come as a surprise to some that the community’s residents indicate they are willing to pay to maintain the City’s programs and activities. Lincolnites appear to care deeply about the City’s services. This is not to say that residents will not hold city officials accountable. Rather it is that as residents learn more about the City’s budget and budgeting process, most (but not all) are more interested in finding the funds to maintain city services than they are in keeping a lid on their taxes. This does not mean that residents do not want the City to become more efficient rather than raise taxes, or do not want the City to be strategic rather than raise taxes. Indeed, there is not very much support for the City to embark on new ventures using tax monies.
“I think the Mayor is taking a proactive approach to budgeting and should be commended for trying something different. Thank you for the opportunity to comment on the direction the community wants to go.” - Lincoln Resident
Finally, Lincoln residents appear to value the opportunity to provide input to the City on its budgeting process. Residents clearly embrace the budgeting for outcomes and public participation approach adopted by Mayor Beutler. It is striking how supportive and enthusiastic those Lincolnites are who participated in the deliberative discussion or the town hall meetings. It is not possible to determine whether their positive feelings are a function of the interaction with City officials or a function of the engagement activities themselves. What we do know is that we can document increases in knowledge and demonstrate a marked willingness to pay for services by those who were involved in either of the
“Thank you on behalf of all Lincoln area residents who participate, for inviting us in on the budget process for our city. This format is convenient. The questions themselves are thought-provoking and instructional. I believe this method encourages open government of the people, by the people and for the people. I appreciate the opportunity to help "make democracy work" by participating in the survey.” - Lincoln Resident
53 See Tables B.31-39 in Appendix B.
20

21
two engagement activities versus those who were involved only via answering a survey, whether the random scientific telephone survey or the non-random survey.

Appendices Table of Contents
Overview ...................................................................................................................... 23 Appendix A: Scientific Telephone Survey and Survey Instrument ............................. 24
Key Findings of Scientific Telephone Survey ...................................................................... 25 Scientific Telephone Survey ................................................................................................. 26
Methods ...................................................................................................................................................... 26 Analysis ....................................................................................................................................................... 29 Results: City Services ................................................................................................................................ 32 Results: Budget Outcomes ...................................................................................................................... 35 Results: A Role for Philanthropy ............................................................................................................ 38 Results: Major New Projects ................................................................................................................... 41 Results: Public Knowledge ...................................................................................................................... 42 Results: Public Trust and Confidence .................................................................................................... 45
Scientific Telephone Survey Instrument .................................................................................................... 46 Appendix B: Deliberative Discussion Surveys and Briefing Document ..................... 56
Key Findings of Deliberative Discussion ............................................................................ 57 Priority Lincoln Deliberative Discussion ............................................................................ 58
Introduction ............................................................................................................................................... 58 Results: Pre-Event Survey ........................................................................................................................ 60 Results: Post-Event Survey ...................................................................................................................... 66
Deliberative Discussion Survey Instruments ............................................................................................ 81 Pre-Event Survey ...................................................................................................................................... 81 Post-Event Survey ..................................................................................................................................... 87
Briefing Document: ..................................................................................................................................... 101 Appendix C: Non-Random Survey ............................................................................. 113
Key Findings of Non-Random Survey ................................................................................ 114 Introduction ............................................................................................................................................. 115 Results: Service Priorities ....................................................................................................................... 115 Results: Budget Outcomes .................................................................................................................... 116 Results: Major New Projects ................................................................................................................. 118 Results: A Role for Philanthropy .......................................................................................................... 119 Results: Public Trust and Confidence .................................................................................................. 119 Results: Public Knowledge .................................................................................................................... 120
Paper Version of Non-Random Survey ................................................................................................... 122 Appendix D: Town Hall Meetings ............................................................................. 130
Introduction ............................................................................................................................................. 131 Results ....................................................................................................................................................... 132
Appendix E: Focus Group .......................................................................................... 134 Introduction ............................................................................................................................................. 135 Results ....................................................................................................................................................... 135
22
Overview In the following sections, we provide more detailed information about the five public input techniques. We concentrate on the data we obtained from the three surveys the Center created: the scientific telephone survey, the surveys we administered as part of the deliberative discussion, and the non-random survey that was available online and in paper form. For these three public participation techniques, we discuss the methods used and the results obtained. Before each of these three sections, we offer Key Findings. We do not do this for the town hall meetings or the focus group, though we briefly report on these public participation efforts and include the outcomes as part of the “Final Report” presented in the pages preceding the Appendices.
23

APPENDIX A: SCIENTIFIC TELEPHONE SURVEY
AND SURVEY INSTRUMENT
24

Key Findings of Scientific Telephone Survey
Lincoln residents rate Fire and Ambulance services, as well as Police services, as the most important services that the City offers.
Lincolnites also feel that the City should make Fire and Ambulance services
and Police services the top priorities when it comes to funding decisions.
Lincolnites are divided over the methods the City should use to fund service priorities, budget outcome priorities, and major new projects – a relatively small number would prefer to see taxes increased.
A large proportion of residents would like to see an increase in funding and
services related to Safety and Security and Economic Development.
Safety and Security, and Economic Opportunity are the top budget priorities for Lincoln residents.
Lincoln residents would like to see charitable organizations such as the
Lincoln Community Foundation take an active role in fostering Economic Opportunity, Healthy People, and Quality of Life.
Lincoln residents are generally satisfied with the job that the City Government
is currently doing.
There are several misperceptions about the relationship between the property tax and City Government. Specifically, Lincolnites overestimate the proportion that the City receives per property tax dollar and overestimate the extent to which the City relies upon property taxes to fund its operations.
25

SCIENTIFIC TELEPHONE SURVEY 1. METHODS Introduction The purpose of the scientific telephone survey was to gather information from Lincoln residents regarding the services available in the community and their opinions about budgeting priorities. The data gathered in the survey will be used by the City of Lincoln to guide City officials during the budgeting process. A secondary goal of this survey was to recruit approximately 60 Lincoln residents to attend a community discussion on budgeting issues facing Lincoln. The Population and Sample Design The population universe for this study consisted of residents of the City of Lincoln ages 19 and older. The sample was a mixed design including random-digit-dial (RDD) sampling (n=3,386, 62.5%), an RDD oversample of neighborhoods that have a higher-than-average minority population (n=1,831, 33.8%), and a directory-listed oversample of Hispanic and Asian residents (n=201, 3.7%). Experience with projects of similar nature dictate that non-white respondents agree to participate in similar events and attend the event at lower rates than white respondents. With this in mind, the sample design was intended to help ensure that survey respondents would more accurately reflect (proportional to U.S. Census data) the ethnic and racial diversity of Lincoln. The sample was generated by Survey Sampling Inc. and was targeted at completing 600 interviews as well as recruiting approximately 60 citizens to attend the deliberative discussion. A total of 5,418 telephone numbers were included in the sample with a total of 605 respondents completing the survey. The Survey Instrument The survey instrument was developed by researchers at the University of Nebraska Public Policy Center, Lincoln City officials and representatives from the private sector. Telephone interviews were completed by interviewers at the Bureau of Sociological Research (BOSR) at the University of Nebraska-Lincoln. The questionnaire was designed to be administered over the telephone making use of a computer-assisted-telephone-interviewing system (WinCati) and was completed by respondents, on average, in about 21 minutes. Respondents who responded that they were not residents of Lincoln (n=28) were not eligible to participate in the survey. The Interviewing Process Interviewing began March 4, 2008, and 605 interviews were completed by the end of the evening on April 6, 2008. Pre-notification postcards were sent to households where an address was matched to the randomly selected telephone numbers (n=1,444, 26.7%) in order to inform the household about the study and increase participation. To ensure that each adult member of the household had an equal
26

probability of selection, the adult in the household with whom the interviewer was to speak was randomly selected from among all eligible respondents in the household. In this procedure, the interviewer asks the number of adults living in the household and, based on random selection by the computer, requests to speak with the adult who is the youngest, oldest, middle, etc. After determining the designated respondent, interviewers were instructed to ask for that person. If the designated respondent was not present in the household at that moment, a good time to find them at home was determined and a return call was made. In order to increase the response rate, multiple calls were made to numbers for which there was no answer. Additional calls were made at different times of the day and different days of the week, including the weekend, to increase the potential that a call would reach the respondent during an available time. All of the interviewing was completed by professional interviewers. All of the interviewers had previous experience in telephone interviewing; several were highly skilled with many years of interviewing experience. Two steps were involved in preparing telephone interviewers for administration of the survey to respondents. First, the study director and permanent staff met all interviewers in a group session and discussed in detail the schedule and the procedures to be used. Each interviewer was given a detailed instruction manual, which they were instructed to read through carefully and which they were required to bring with them each time they interviewed. Second, all interviewers were required to complete practice interviews. These practice interviews were carefully examined by the BOSR staff for errors, inadequate data on open-ended questions, and the like. All interviewing was done in the BOSR interviewing lab. BOSR supervisory staff was available during calling hours to supervise the interviewing and to answer questions. The proximity of interviewer workstations, as well as the use of telephone monitoring equipment, provided opportunities for careful supervision as the data was collected. The study director and others on the BOSR staff were always accessible so that questions from the interviewers could be handled immediately and, if necessary, the respondent could be called back. Further, supervisors regularly monitored interviews while they were being conducted. This helped to identify interviewing problems and difficulties. Interviews were very carefully reviewed by the BOSR staff. This was done on a daily basis so that errors could immediately be brought to the attention of the interviewers and corrected. If answers were recorded incorrectly or in an incomplete manner, the interviewer was asked to call the respondent back and correct the error. The interviewing staff is paid by the hour, not by the number of interviews completed. This method of payment is used so that we can ensure the high quality of the data collected by our staff. The progress and productivity level of each
27

interviewer, however, is monitored to detect problems in the method of interviewing. Various rates are calculated to reflect the completion rate per hour, the total number of attempts per hour, a refusal rate, etc., to monitor the progress of each interviewer compared to the entire group of interviewers. Individual attention is given if an interviewer’s rates stray from the overall mean. Data Processing The BOSR project management staff utilized the Statistical Package for the Social Sciences (SPSS) software to evaluate the data set. Frequency distributions on each of the variables in the survey were generated with missing value codes assigned. In addition, consistency checks were made due to the use of WinCati; data entry and contingency errors were minimal. Completed interviews were carefully processed and recorded by BOSR staff to ensure that each interview was accounted for and its progress along the various steps of editing, coding, merging, and uploading could be monitored. Since the data was directly entered into the computer at the time of the interview in a computer-readable form, no additional data-entry steps were needed. The open-ended data was edited and identifying information was removed.
Response Rate Of the 5,418 telephone numbers sampled, it was determined that 1,586 were likely to be households. Completed interviews (the cooperation rate) were obtained in 38.1% of these households. This rate is typical of telephone surveys of similar methodology. The following chart (Table 1) provides the outcomes of all telephone numbers selected in the sample. At the start of the survey fielding, all respondents who participated in the survey were invited to attend the budgeting discussion. Recruitment was later adjusted to randomly include a smaller proportion of non-minority respondents (one out of every three) and all minority respondents. This change was made to ensure racial/ethnic representation at the discussion closely mirrored the racial composition of the population. A total of 286 respondents were invited to attend the community discussion and about 35.7% of respondents agreed to attend the event at the time of the interview.
28

Table A.1 – Cooperation Rate (Percentage in Each Response Category)*
Response Category n % of Likely Households (N=1,586)
Completed Interview 605 38.1% Refusals 747 47.1%
No Resolution by End of Study Period 235 14.8%
Answering Machine or Answering Service 179
Busy 0
No Answer 18
Delayed Callback 38
Unable to Complete – Health or Age Reasons 20
Language Barrier 72
Not Eligible-Outside of the City of Lincoln 28
Under 19, Group Quarters, Teen or Computer Line 13
Cellular Phone 3
Business 428
FAX or Modem Sound – Multiple Attempts 238
Unassigned, Wrong Number, Etc. 3029
Total Numbers Sampled 5418 100% *Any questions regarding this report or the data collected can be directed to the Bureau of Sociological Research at the University of Nebraska-Lincoln by calling (402) 472-3672 or by sending an e-mail to [email protected].
2. Analysis
Data were analyzed by the University of Nebraska Public Policy Center. Results for the population as a whole are presented in the main body of this report. The results are presented in the following sections in table and narrative format. The total number of respondents (n) is presented in each table. DEMOGRAPHICS Table A.2
Sex n Survey Lincoln Est. * Weighted Male 281 46.4% 50.3% 50.3% Female 324 53.6% 49.7% 49.7% * Estimate taken from U.S. Census Bureau
29

30
Table A.3 Race/Ethnicity n Survey Lincoln Est.*
White 563 93.1% 88.4% Black 8 1.3% 3.9% Asian/Nat. Hawaiian/ Pacific Islander 11 1.9% 3.7%
Native American 5 .8% .7% Hispanic 15 2.5% 4.8% Other 1 .2% 1.9%
Weighted White % - 88.4% 88.4% Weighted Non-White% - 11.6% 11.6% * Estimate taken from U.S. Census Bureau Table A.4
Age n Survey Lincoln Est.* Weighted 35 or less 87 14.3% 37.7% 37.7% 36-55 260 43.3% 35.5% 35.5% 56-74 186 30.9% 19.6% 19.6% Over 75 69 11.5% 7.2% 7.2% * Estimate taken from U.S. Census Bureau Table A.5
Education n Percent Some High School 15 2.5% High School Degree 95 15.7% Some College 119 19.8% Associate’s or 2 Year Degree 79 13.1% Bachelor’s Degree 157 26.1% Some Graduate School 27 4.5% Master’s Degree 65 10.8% Doctorate or Advanced Degree 44 7.3%
Education Recoded n Percent High School or Less 110 18.3% College Degree and Some Grad. School 335 59.1% Advanced Degree 136 22.6%

Table A.6
Zip Frequency Percent
22652 1 .2% 56850 1 .2% 68000 1 .2% 68105 1 .2% 68301 1 .2% 68501 1 .2% 68502 80 13.2% 68503 25 4.1% 68504 28 4.6% 68505 30 5.0% 68506 72 11.9% 68507 27 4.5% 68508 15 2.5% 68510 49 8.1% 68512 17 2.8% 68516 105 17.4% 68520 3 .5% 68521 84 13.9% 68522 26 4.3% 68523 2 .3% 68524 12 2.0% 68525 1 .2% 68526 8 1.3% 68528 14 2.3% Total 604 100.0%
Figure A.1*
* The number in each box represents the number of respondents from each ZIP Code
City Area n Percent Core 326 53.9% Periphery 279 46.1%
Table A.7 Years Lived in
Lincoln n Percent
1-10 years 122 20.4% 11-20 years 123 20.6% 21-40 years 206 34.5% 41-60 years 120 20.1% Over 60 years 26 4.4%
31

3. RESULTS: CITY SERVICES
Importance of City Services Respondents were asked to rate the importance of 12 City services on a scale from 1-10, where “1” represents little importance and “10” represents extreme importance; the results of this task are reported in Table A.9. The results show that citizens rate Fire and Ambulance services, with an average score of 9.08, and Police services, with an average score of 8.96, substantially higher than the other 10 services. Six services received an average score between “7.5” and “8.” Three services received an average score between “7” and “7.5.” Only one service, Public Bus and Transportation services, received a score less than “7.” The results suggest that, while Lincolnites give high importance to all of the services that the City provides, there are subtle differences in the perceived importance of each service. Table A.9 “On a scale of 1-10, please rate the importance of each of these City government functions, with 1 being “not at all important” and 10 being “extremely important.” City Service Mean Score Rank n Fire and Ambulance services 9.09 1 602 Police 8.96 2 605 Management of Sewage and Storm Water 7.94 3 600 Maintenance and Management of Traffic Flow 7.79 4 603 Health Department services 7.79 5 599 Job Creation and Economic Development 7.75 6 603 Libraries 7.66 7 602 Human services 7.52 8 586 Parks, Trails and Recreation 7.14 9 604 Building Permits and Safety 7.14 10 592 Zoning and Growth Planning 7.05 11 597 Public Bus and Transportation services 6.88 12 594 Highest and Lowest Service Priorities After rating the importance of each of the 12 City services, respondents were asked to identify which of the City services are their highest two priorities and their lowest two priorities. The findings are presented in Table A.10. The results indicate that Police services and Fire and Ambulance services are the first and second priority, respectively. Parks, Trails and Recreation received the lowest priority, followed by Libraries. Interestingly, both Parks, Trails and Recreation, and Libraries scored higher than other services in terms of importance, but were ultimately given the lowest priority across the services. This suggests that, while residents may hold a particular service up as important, they may be willing to give that service a low priority when forced to make a decision between numerous City services.
32

Table A.10
“Please tell me which TWO of these you feel should be top priorities, and which TWO of these you feel should be the lowest priorities?
Highest Priority Services Rank Lowest Priority Services
Police 1 Parks, trails, and recreation
Fire and Ambulance 2 Libraries How to Fund City Service Priorities To adequately fund particular budget outcome areas, it is necessary to increase revenue or to cut services in another area. Citizens were asked to help make the determination of how the City should fund the City’s priority budget areas by making tradeoffs between various funding options. Thus, respondents were asked if the City should increase taxes, cut funds from bottom priorities, make no change in spending, or take some other approach to fund that respondent’s top budget priority. The findings are presented in Table A.11a. One-third of respondents (34%)1, said that the City should cut funds from bottom priorities to spend more on top priorities. Only 15% of respondents favored an increase in taxes, and only about 9% of respondents favored making no change in spending. A plurality of respondents (42%) said that the City should take “some other approach” to funding top budget priorities (see Table A.11b). Of those who said they would like the City to take some other approach, a large plurality (42%) said they would like the City to become more efficient with existing funds, while about 18% indicated some willingness to raise taxes. Table A.11a
“In order to fund your two service priorities, would you recommend the City:” n=574 Response Percent n Increase Taxes 15.2% 87 Cut funds from bottom priorities to spend more on top priorities
33.6% 193
Some other approach 41.8% 240 Make no change in spending 9.4% 54
1 Throughout this report, percentages reported in Tables and Figures will be rounded to the nearest percent when described in the text. For example 33.6% in Table A.11a is rounded up to 34% in the discussion of the findings.
33

Table A.11b “In order to fund your two service priorities, would you recommend the City:” Various responses of those who said “Some other approach” * Approach Efficiency/Better Use of Current Funds Increase Taxes Private Partnerships Miscellaneous Don’t Increase Taxes Fundraising/Grants Lottery/Gambling Fees Bonds
City Services: Conclusion Results indicate that Lincoln citizens rate Fire and Police as the most important of the City’s services and give these services high priority in relation to the others. Interestingly, while Parks, Trails and Recreation, and Libraries received moderately high scores in terms of importance, they were ultimately given the lowest priority. These minor contradictions show that, while Lincolnites might feel a particular service is important, citizens might not necessarily feel that the same service should be a priority for the City. About one-third of respondents (34%) appear to feel comfortable with the premise of cutting funds from the bottom priorities in order to help fund their top priorities. However, a large percentage wish the City would seek an alternate approach, simultaneously revealing a strong perception that current funds could be used in a more efficient way. Just over 15% of respondents indicated a willingness to raise taxes to pay for their service priorities. Interestingly, of those who said they would prefer that the City take “some other approach,” 17.5% also said they would be willing to have taxes raised.
34

4. RESULTS: BUDGET OUTCOMES
Outcome Based Budgeting The City of Lincoln is pursuing an outcome based budgeting approach. This approach requires that the City develop its budget based on the outcomes it hopes to achieve. Once the City has determined its budget objectives, citizen input is used to determine budget outcome priorities. Listed in alphabetical order, the eight identified budget outcomes are:
1. Economic Opportunity: This includes good jobs; healthy business climate; attract young people and visitors.
2. Effective Transportation: This includes new roads; maintain existing roads; public transportation; safe driving conditions; low traffic congestion.
3. Environmental Quality: This includes clean air, water, and soil; low flood risk; effective sewage maintenance and storm water management.
4. Equal Access and Diversity: This includes legal protection against discrimination and harassment; education, appreciation, and recognition of Lincolns growing diversity.
5. Healthy People: This includes health care for babies, children, elderly and low income residents; promoting physical fitness; disease prevention; safe restaurants.
6. Livable Neighborhoods: This includes quality and affordable housing; access to pools, parks, and Libraries.
7. Quality of Life: This includes attracting visitors; recreational and educational opportunity; access to parks, green space, and the arts.
8. Safety and Security: This includes low crime rate; low rate of injury and damage from Fire; emergency medical services.
Increase or Decrease Funding? To determine citizen preferences among the eight budget outcome areas described above, respondents were asked whether the City should increase funding and services, maintain funding and services, or decrease funding and services to achieve each of the budget outcome areas (see Table A.12). While the findings show that Lincoln residents would generally prefer to maintain the current levels of spending in each of the eight areas, there are places where citizens would like the City to increase or decrease funding and services. For example, substantial proportions of citizens would like to see the City increase investment in Economic Opportunity (50%), as well as Safety and Security (47%), Effective Transportation (43%), and Healthy People (42 %). In only two budget outcome areas did a larger proportion of citizens feel that the City should decrease funding rather than increase funding: Equal Access and Diversity (24% to decrease versus 18% to increase) and Environmental Quality (22% to decrease versus 9% to increase).
35

Table A.12 “I’m going to read a list of the desired outcomes that make up the current budget plan. They are not listed in order of importance or priority. These outcomes broadly represent the long-term goals the City of Lincoln hopes to achieve. Accordingly, the City will develop its budget to meet these goals. For each goal, please tell us if you think the City should increase funding and services, maintain current funding and services, or decrease funding and services.”
Outcome n Decrease
Funding and Services
Maintain Funding and
Services
Increase Funding and
Services Economic Opportunity 592 8.6% 41.2% 50.2%
Effective Transportation 589 4.4% 52.6% 43.0%
Environmental Quality 588 21.6% 69.7% 8.7%
Equal Access and Diversity 590 23.6% 59.0% 17.5%
Healthy People 592 6.3% 51.4% 42.4%
Livable Neighborhoods 592 8.4% 62.7% 28.9%
Quality of Life 592 13.2% 61.3% 25.5%
Safety and Security 591 1.4% 51.6% 47.0%
Highest and Lowest Budget Priorities To further gauge the preferences of citizens toward each of the budget outcomes, respondents were asked to identify the top two budget outcomes upon which the City should focus its efforts. The results are presented in Table A.13. The results show that Lincolnites feel that Safety and Security is the primary budget outcome that the City should ensure. Economic Opportunity was the second priority of Lincoln’s citizens. These findings echo the findings presented in Table A.12. Citizens were also asked to select what they felt should be the bottom priorities of the City. Citizens felt that Equal Access and Diversity and Effective Transportation should be the least prioritized areas. It is interesting that such a large percentage of residents indicated that funding and services for Effective Transportation should be increased (43%) yet it was given second lowest priority among services. Table A.13
“Please tell me which TWO of these you feel should be top priorities, and which TWO of these you feel should be the lowest priorities?
Top Budget Outcome Rank Bottom Budget Outcomes
Safety and Security 1 Equal Access and Diversity
Economic Opportunity 2 Effective Transportation
36

How to Fund Budget Outcome Priorities Respondents were asked how they want the City to fund priority budget outcome areas (see Table A.14a). Approximately one-third of respondents (34%), indicate that they would choose to see the City reallocate existing funds to pay for their budget outcome priorities. Just over 16% of respondents suggested no change in spending. Another 33% of respondents said they would like to see the City take “some other approach.” Of the respondents who chose some other approach, a large proportion (31%) indicated that they would like to see City government use existing funds more efficiently; another 15% indicated some willingness to raise taxes. The full results of the “some other approach” category are presented in Table A.14b. Table A.14a
“In order to fund your two priority goal areas, would you recommend the City:” n=581 Response Percent n Increase Taxes 16.7% 97 Cut funds from bottom priorities to spend more on top priorities
34.3% 199
Some other approach 32.9% 191 Make no change in spending 16.2% 94
Table A.14b
“In order to prioritize your two priority goal areas, would you recommend the City:” Various responses of those who said “Some other approach.”Approach Efficiency/Better Use of Current Funds Increase taxes Miscellaneous Private Business Partnerships/Donations Lottery/Gambling Charity/Volunteer Work Do Not Raise Taxes Grants Bonds Fines/Fees
Outcome Based Budgeting: Conclusion The results of questions about respondents’ budget outcome priorities show that Lincolnites prioritize Safety and Security along with Economic Opportunity. Conversely, citizens appear to value Equal Access and Diversity, Environmental Quality, and Effective Transportation less.
37

When asked how they would like to see the City fund top budget priorities, a large proportion of respondents (33%) said they would prefer that the City redistribute funds from bottom priorities to those at the top of the list. Similarly, of those who said they would prefer the City take “some other approach,” 31% said they would like to see the City spend existing funds more efficiently. A smaller number of individuals said they would be willing to raise taxes to pay for budget priorities.
5. RESULTS: A ROLE FOR PHILANTHROPY
Government is certainly not the only provider of basic services in Lincoln. In the future there may be increasing opportunities for coordination between the City and the Lincoln philanthropic community through public/private partnerships. Lincoln benefits from its numerous non-profit organizations, religious groups, and volunteers who serve the community in many needed ways. Whether it’s helping to feed or house the most vulnerable, clean and restore the natural environment, support the arts, or expand recreation, Lincoln’s charitable community plays a vibrant role in many aspects of the City’s life. Lincolnites themselves tend to be quite generous. Annually, residents of the City donate an estimated $150 million to foundations, religious entities, social welfare groups, and the arts and humanities across the country. Local businesses add to that amount. In fact, philanthropy is a significant driver of the national economy. 2006 was the highest year recorded for charitable giving, with nearly $295 billion in donations provided throughout the country.2 Local non-profit agencies and faith organizations play a significant role in strategically serving Lincoln in addition to the services provided to the City. In a survey of nonprofit organizations conducted by the Lincoln Community Foundation, one priority identified was to promote responsible community-wide philanthropy. 3 Other objectives that emerged were fostering community collaboration and being an effective convener. Tax dollars will continue to support the framework for a city, but private dollars can provide the margin of difference to determine what a city becomes. The University of Nebraska Foundation is a model for demonstrating the effectiveness of coordinated fundraising. Founded in 1936, the Foundation now directs over $100 million dollars annually to the university, a tax supported institution.
2 National Philanthropic Trust, Philanthropy statistics, available at: http://www.nptrust.org/philanthropy/philanthropy_stats.asp. 3 Personal Communication from Jessica Phillips, Assistant Director, Donor Relations and Marketing Lincoln Community Foundation.
38

As the City and the nonprofit sector work together to understand the overall priorities of the community, the coordination of these efforts may set a platform to discuss the role of philanthropy in relation to tax and City-supported efforts. A more focused and coordinated fundraising effort may result in a greater overall impact to strengthen and improve Lincoln. Charitable Organizations A number of charitable organizations exist in Lincoln that work to make the City of Lincoln a stronger community. Lincoln Community Foundation (LCF), who funded a substantial proportion of this survey, is one of those organizations. LCF was interested in asking citizens about in which areas they feel the LCF and other charitable organizations should focus their charitable funding in Lincoln. The first question asked respondents to identify outcomes that they feel charitable organizations should fund; the outcomes in this question are identical to those that were asked about the City budget (see Table A.15). The results of this question show that a plurality of citizens (24%) feel that charitable organizations should help fund Economic Opportunity for the City. A large proportion of citizens (22%) also felt that these organizations should use funding to promote Healthy People. Of the respondents, about 17% felt that charitable organizations should promote Quality of Life, and 11 % felt that Livable Neighborhoods should be a priority area. Table A.15
“To which one of the priority areas should business and community organizations like the Lincoln Community Foundation focus their charitable funding?” n=565 Outcome Percent n Economic Opportunity 23.5% 133 Healthy People 21.6% 122 Quality of Life 16.5% 94 Livable Neighborhoods 11.3% 64 Safety and Security 9.9% 56 Equal Access and Diversity 8.8% 50 Environmental Quality 4.1% 23 Effective Transportation 4.1% 23
Respondents were also asked if there are other areas that they believe business and community charitable organizations should focus their funding. The results are presented in Table A.16.
39

Table A.16 “Is there a priority area I did not mention or are there services you would like business and community charitable organizations, like the Lincoln Community Foundation, to fund?” Various responses Service Areas Business and Economic Development
Parks and Recreation
Health
Youth
Arts
Aging
Homeless
Neighborhoods
Transportation and Roads
Low Income Assistance
Diversity
Miscellaneous
Education
Safety and Security
Environment
Libraries
Disabled
Addressing Illegal Immigration
Philanthropy: Conclusion These results, taken together with responses about where the City should focus its efforts, show that Economic Opportunity is an area where the most people feel that charitable organizations should focus. The findings also show that citizens feel that the focus of the City government should be somewhat different from the focus of charitable organizations. For instance, throughout the survey citizens have felt that the City should focus its efforts on Safety and Security, while only 10% of respondents feel that charitable organizations should focus their efforts toward that area. Conversely, while Parks, Recreation and Trails received low priority as a focus for the City’s budget, Quality of Life received the third highest rating as a focus for the philanthropic community.
40

6. RESULTS: MAJOR NEW PROJECTS
With the recognition that Lincoln must invest in infrastructural and other projects that require significant amounts of resources in order for the City to grow, respondents were asked how they would like to see Lincoln raise funds for such projects (see Table A.17a). A majority of respondents (53%) indicate that they would like to see the City take “some other approach” besides increasing taxes or cutting funding from other areas of City government; a breakdown of these responses are presented in Table A.17b. Of the respondents who said they would like to see the City take “some other approach,” 21% said their choice of funding would depend on the nature of the project. An equal proportion of respondents (13%) said they would like to see the City issue bonds or rely upon donations and help from charitable organizations. Another 10% of those respondents would like to see private entities invest in major projects. Table A.17a
“If the City of Lincoln were to undertake a new, major project, how would you want it funded?” n=569 Response Percent n Increase Taxes 12.5% 71 Cut funds from other areas 16% 91 Some other approach 53.3% 303 No new project 18.3% 104
Table A.17b
“If the City of Lincoln were to undertake a new, major project, how would you want it funded?” Various responses of those who said “Some other approach.”Approach Depends on the Nature of the Project Issue Bonds Donations/Charitable Organizations Miscellaneous Private Investment Do Not Raise Taxes Raise Taxes is an Option No New Projects Efficiency/Better Use of Current Funds Other Funding Sources/Unspecified Lottery/Gambling Federal or State Money/Grants
41

Major New Projects: Conclusion The results of this question show that there are mixed feelings about how to fund a major project in Lincoln. Of those who responded to the question, over 50% felt that the City should take an alternative approach to funding a major project; the suggestions as to how to fund the project varied widely among respondents, with a plurality stating that their preference would depend upon the nature of the project. The results do show, however, that citizens are willing to entertain numerous alternatives when it comes to funding major investments.
7. RESULTS: PUBLIC KNOWLEDGE
The Mayor’s Office is interested in residents’ knowledge of the City’s budget process. Therefore, several questions were included that gauge Lincolnites’ basic knowledge about the City’s budget. These questions are important because, in order for the City to implement Outcome Based Budgeting, it is necessary for citizens to be familiar with the budgeting process as it currently exists. In Tables A.18a-A.18e, the correct answer to each question is italicized and in bold-face type. When asked on which category of services the City government spends the highest amount of its budget (see Table A.18a), nearly one-quarter of respondents chose Human services and Health Department services (25%), approximately one-third (36%) selected Public Safety services and approximately one-third (35%) selected Maintaining and Building Roads. Only 5%of respondents selected Parks, Libraries and Recreation. The pie chart in the Briefing Document (see Appendix B) of this report shows the proportion of the City’s budget that each City department receives. Table A.18a “The City government spends the highest amount of its budget on which category of services?” n=310
Response Percent n Human services and Health Department services
25.2% 78
Parks, Libraries, and Recreation
4.5% 14
Public Safety Services 35.5% 110 Maintaining and Building Roads
34.8% 108
Respondents were asked how much of each dollar collected in property taxes does the City government receive; the distribution of responses to the question are reported in Table A.18b. One-fifth of respondents (21%) chose the correct answer of less than 15%. Just over 40% believe the City receives between 15% and 24% of each dollar collected in property taxes and 28% believe the City receives between 25% and 49% of each dollar. Eleven percent (11%) of respondents believe that the City receives more than 50% of each dollar collected in property taxes. The pie chart in
42

the Briefing Document (Appendix B) shows how the property tax dollar is divided among the various local governments. Table A.18b “Of each dollar collected in property taxes in Lincoln, the City government receives approximately how much?” n=305
Response Percent n Less than 15 percent 20.7% 63 Between 15 and 24 percent 40.3% 123 Between 25 and 49 percent 27.5% 84 50 percent or more 11.5% 35 When asked what is the City’s highest source of revenue (see Table A.18c), the majority of respondents (68%) said property taxes provided the bulk of revenue for the City. About one-quarter of respondents (26 %) correctly selected sales tax, 4% of respondents said income taxes, and 2% said other sources. The results suggest that a widespread misperception exists among Lincoln’s citizens about the respective roles of sales and property taxes in Lincoln’s budget. Table A.18c “What is the highest source of revenue of the City’s budget?” n=272
Response Percent n Property Taxes 67.6% 184 Income Taxes 4.0% 11 Sales Taxes 26.1% 71 Other sources 2.2% 6 Respondents were asked approximately how large is the City of Lincoln’s annual budget. The majority of respondents were correct that the City’s budget falls between $125 million and $175 million (see Table A.18d). More than one-third of respondents (35%) believed the budget to be between $25 million and $75 million. Just over 3% believed the budget to be less than $10 million and 8.1% believed the City’s annual budget to be more than $500 million. Table A.18d “The City of Lincoln’s annual budget is approximately how much?” n=234
Response Percent n Less than $10 million 3.4% 8 Between $25 million and $75 million
35.0% 82
Between $125 million and $175 million
52.6% 123
Over $500 million 8.1 % 19 Other .9% 2
43

Respondents were asked about the level of charitable funding made available to Lincoln’s public programs and services (see Table A.18e). Only 12% correctly answered that the amount is between $125 million and $175 million. The greatest percentages of respondents answered that less than $10 million was available (40%) or between $25 million and $75 million (45%). Table A.18e “The total amount of charitable funds made available to Lincoln’s public programs and services is estimated to be at what dollar level?” n=525
Response Percent n Less than $10 million 39.8% 209 Between $25million and $75 million
45.0% 236
Between $125 million and $175 million
12.0% 63
Over $500 million 2.7% 14 Other .6% 3 Public Knowledge: Conclusion The results of the public knowledge questions show that there are a number of misperceptions that exist among citizens as to where Lincoln’s funding comes from and how that funding is used. Most of the misunderstanding centers on the property tax. Specifically, citizens overestimate the proportion of each property tax dollar that the City receives, and they overestimate the extent to which the City relies upon the property tax to fund its operations. Citizens were able to perceive, however, that the largest proportion of the budget is spent on Public Safety services.
44

8. RESULTS: PUBLIC TRUST AND CONFIDENCE
The survey included a number of questions about the levels of trust and confidence that Lincoln residents have in their City government (see Table A19). Respondents generally agreed with the statement: “I am satisfied with the Lincoln City government.” Of the respondents, 54% either agreed or strongly agreed with the statement, while only 29% disagreed or strongly disagreed. Similarly, respondents overwhelmingly agreed with the two statements: “Public officials in Lincoln City government care about what people like me think” and “Lincoln City government officials treat residents with respect.” Over 59% of respondents agreed with the first statement, and 68% of respondents agreed with the second statement. Table A.19
Statement n Strongly
agree Agree Neither
disagree nor agree
Disagree Strongly disagree
I am satisfied with the Lincoln City government. 297 2.0% 51.5% 17.5% 25.3% 3.7%
Public officials in Lincoln City government care about what people like me think.
295 5.8% 53.9% 17.6% 19.3% 3.4%
Lincoln City government officials treat residents with respect.
290 5.5% 62.4% 17.6% 12.1% 2.4%
I have great confidence in the Lincoln City government. 297 2.0% 43.1% 24.2% 26.9% 3.7%
Residents have a great say in important Lincoln City government decisions.
302 1.7% 40.4% 21.2% 30.8% 6.0%
Lincoln City government officials base their decisions on the facts, not their personal interests.
302 2.0% 35.8% 23.2% 34.8% 4.3%
Lincoln City government officials have residents’ best interests in mind when they make decisions.
303 3.0% 49.8% 16.8% 27.7% 2.6%
Lincoln City government can usually be trusted to make decisions that are right for residents as a whole.
303 2.6% 51.8% 17.8% 23.4% 4.3%
45

SCIENTIFIC TELEPHONE SURVEY INSTRUMENT
INTRODUCTION SCRIPT Q: intro1 Hello, this is __________ and I am calling from the Research Center at the University of Nebraska. We are talking to Lincoln residents on behalf of the Mayor’s office about city budgeting, funding, and the city’s economic future. We're not selling anything. Q: prenot We recently sent your household a postcard about this survey so that you would know more about us and our study. Do you recall receiving this postcard? 1 Yes 5 No 8 DK 9 REF if (ans = 1) skp intro3 Q:nolet The letter simply described why we are calling. Since you didn't receive the postcard, I'd like to tell you a little more about the study now. We're not selling anything. We are talking to Lincoln residents on behalf of the Mayor’s office about city budgeting, funding, and the city’s economic future. You may have heard about this survey on the news or in articles in the Lincoln Journal Star. Q: intro3 We're not selling anything. Your telephone number was selected at random by a computer to insure a scientific sample of people in our study. To make sure our study is scientific, can you tell me how many adults ages 19 and older are living in your household? IF (ANS = 0) SKP nonqual
46

Q: intro4 According to the computer, I need to speak with the <randomly selected adult.> 1 Respondent is on the phone 2 Person on the phone is getting Respondent 3 Respondent is not available 4 Person refuses for Respondent 5 Respondent is on line, but REFUSES Q:intro Hello, this is __________ and I am calling from the research center at the University of Nebraska. We are talking to Lincoln residents on behalf of the Mayor’s office about city budgeting, funding, and the city’s economic future. We need your help to make the study as accurate as possible. All information will be kept strictly confidential, and there are no known risks to participating in the survey. Your telephone number was generated at random. You are free to decide not to participate in this study or to withdraw at any time. Your responses will not be linked to your phone number or any identifying information. You will have the opportunity to provide your name and address to us if you wish to participate in a discussion about the budget at a later date; none of this information will be used to identify your individual responses to this survey. You may choose not to answer any questions you wish. We will report the results only in summary form, so that no individual data will be released. The interview will take about 15 to 20 minutes to complete. Can we begin now? Q:confcity First of all, do you live in the City of Lincoln? INTERVIEWER: I MEAN, DO YOU PAY YOUR TAXES TO THE CITY OF LINCOLN? 1 Yes 5 No
47

Section 1 – Satisfaction and Trust in Government First, I am going to read some statements about the Lincoln’s city government. Please keep in mind throughout the survey we are referring to only Lincoln city government’s budget, which does not include Lincoln Public School funds. For each statement, please tell me if you strongly agree, agree, neither agree or disagree, disagree or strongly disagree. [Split #’s 1,2,5,6 and #’s 3,4,7,8] 1. I am satisfied with the Lincoln City government. 2. Public officials in Lincoln City government care about what people like me think. 3. Residents have a great say in important Lincoln City government decisions. 4. Lincoln City government officials base their decisions on the facts, not their personal
interests. 5. Lincoln City government officials treat residents with respect. 6. I have great confidence in the Lincoln City government. 7. Lincoln City government officials have residents’ best interests in mind when they
make decisions. 8. Lincoln City government can usually be trusted to make decisions that are right for the
residents as a whole. Section 2 – City Service Priorities 9. [RANDOMIZE LIST FOR THIS Q AND USE THE SAME ORDER FOR THE NEXT Q] I am going to read the names of 12 city services. On a scale of 1-10, please rate the importance of each of these city government functions, with 1 being “not at all important” and 10 being “extremely important.” ______ Building permits and safety ______ Fire and ambulance services ______ Health Department services ______ Human services ______ Job creation and economic development ______ Libraries ______ Management of sewage and stormwater ______ Parks, trails, and recreation ______ Police services ______ Public bus and transportation services ______ Street maintenance and management of traffic flow ______ Zoning and growth planning
48

49
10-12. I am going to read the list of the 12 city services again; please tell me which TWO of these you feel should be top priorities, and which TWO of these you feel should be the lowest priorities? (code 1, 2, 9) ______ Building permits and safety ______ Fire and ambulance services ______ Health Department services ______ Human services ______ Job creation and economic development ______ Libraries ______ Management of sewage and stormwater ______ Parks, trails, and recreation ______ Police services ______ Public bus and transportation services ______ Street maintenance and management of traffic flow ______ Zoning and growth planning 13. You have said that [top two responses] are your two service priorities. In order to fund these areas, would you recommend the City: [randomize options 1-3]
1) Increase taxes to spend more on your priorities 2) Cut funds in your bottom priorities to spend more on your top priorities 3) Make no change in spending 4) Some other approach [specify] _________________________ 8) Don’t know/No opinion

Section 3 – Budget Outcome Priorities [RANDOMIZE LIST FOR THIS Q AND USE THE SAME ORDER FOR THE NEXT Q] Next, I’m going to read a list of the desired outcomes that make up the current budget plan. They are not listed in order of importance or priority. These outcomes broadly represent the long-term goals the City of Lincoln hopes to achieve. Accordingly, the city will develop its budget to meet these goals. For each goal, please tell us if you think the City should increase funding and services, maintain current funding and services, or decrease funding and services. 14. Safety and Security – Includes low crime rate; low rate of injury and damage from fire; emergency medical services.
1) Increase funding and services 2) Maintain current funding and services 3) Decrease funding and services 8) No opinion
15. Economic Opportunity – Includes good jobs; healthy business climate; attract young people and visitors.
1) Increase funding and services 2) Maintain current funding and services 3) Decrease funding and services 8) No opinion
16. Livable Neighborhoods – Includes quality, affordable housing; access to pools, parks, and libraries
1) Increase funding and services 2) Maintain current funding and services 3) Decrease funding and services 8) No opinion
17. Healthy People – Includes health care for babies, children, elderly and low income residents; promoting physical fitness; disease prevention; safe restaurants.
1) Increase funding and services 2) Maintain current funding and services 3) Decrease funding and services 8) No opinion
18. Effective Transportation – Includes new roads; maintain existing roads; public transportation; safe driving conditions; low traffic congestion.
1) Increase funding and services 2) Maintain current funding and services 3) Decrease funding and services 8) No opinion
50

51
19. Environmental Quality – Includes clean air, water, and soil; low flood risk; effective sewage maintenance, and storm water management.
1) Increase funding and services 2) Maintain current funding and services 3) Decrease funding and services 8) No opinion
20. Quality of Life – Attract visitors; recreational & educational opportunity; access to parks, green space, and arts.
1) Increase funding and services 2) Maintain current funding and services 3) Decrease funding and services 8) No opinion
21. Equal Access and Diversity – Includes legal protection against discrimination and harassment; education, appreciation, and recognition of Lincoln's growing diversity.
1) Increase funding and services 2) Maintain current funding and services 3) Decrease funding and services 8) No opinion
22-24. I am going to read the list of long term city budgeting goals; please tell me which TWO of these you feel are the most important, and which TWO of these is the least important. ______Safety and Security ______Economic Opportunities ______Livable Neighborhoods ______Healthy People ______Effective Transportation ______Environmental Quality ______Quality of Life ______Equal Access and Diversity 25. You have said that [top two responses] are your two priority goal areas. In order to prioritize these goals, would you recommend the City: [randomize options 1-3]
1) Increase taxes to spend more on your priorities 2) Cut funds in your bottom priorities to spend more on your top priorities 3) Make no change in spending 4) Some other approach [specify] _______________________________ 8) Don’t know/No opinion

The next two questions ask about what budget priority areas could receive funding from sources outside of Lincoln City government. For example, in most communities, including Lincoln’s, charitable contributions play an important role in funding services and activities. 26. To which one of the priority areas should business and community organizations like the Lincoln Community Foundation focus their charitable funding? ______Safety and Security ______Economic Opportunities ______Livable Neighborhoods ______Healthy People ______Effective Transportation ______Environmental Quality ______Quality of Life ______Equal Access and Diversity 27. Is there a priority area I did not mention or are there services you would like business and community charitable organizations, like the Lincoln Community Foundation, to fund? The next three questions ask about ways the City of Lincoln could grow its economy. We would like to know how you would spend money now to invest in the future economy of the city and its ability to provide services. Section 4 – Citizen Knowledge [For these questions, split #’s 28, 29 & LCF and #’s 30, 31 & LCF] 28. The city government spends the highest amount of its budget on which category of services?
1) Human services and Health Department services 2) Parks, recreation and libraries 3) Public safety services 4) Maintaining and building roads 8) Don’t know/No response
29. Of each dollar collected in property taxes in Lincoln, the city government receives approximately how much?
1) Less than 15 percent (of each dollar) 2) Between 15-24 percent (of each dollar) 3) Between 25-49 percent (of each dollar) 4) 50 percent or more (of each dollar) 8) Don’t know/No response
52

30. What is the highest source of revenue of the city’s budget? 1) Property taxes 2) Income taxes 3) Sales taxes 4) Other sources 8) Don’t know/No response
31. The City of Lincoln’s annual budget is approximately how much [5 is an unread response]?
1) Less than 10 million dollars 2) 25-75 million dollars 3) 125-175 million dollars 4) Over 500 million 5) OTHER [SPECIFY] 8) Don’t know/No response
32. The total amount of charitable funds made available to Lincoln’s public programs and services is estimated to be at what dollar level? [5 is an unread response]
1) Less than 10 million dollars 2) 25-75 million dollars 3) 125-175 million dollars 4) Over 500 million 5) OTHER [SPECIFY] 8) Don’t know/No response
Section 5 – Demographics 33. How many years have you lived in the City of Lincoln? INTERVIEWER: ENTER 0 IF RESPONDENT LIVED FOR FEWER THAN ONE YEAR
0-100) # of years 888) Refused 999) Don’t Know
34. What race, or races do you consider yourself? (can pick multiple)
1) White 2) Black or African American 3) Hispanic or Latino 3) American Indian or Alaska Native 4) Asian 5) Native Hawaiian or Other Pacific Islander 6) Other
53

35. What is the highest grade or year of school you have completed? 1) Some high school 2) High School degree 3) Some college 4) Associates certificate/2 year program 5) Bachelor’s degree 6) Some graduate school 7) Master’s degree 8) Doctorate/Advanced degree 88) Refused 99) Don’t know
36. In what year were you born?
(1880-1989) 8888) Refused
37. We want to make sure we represent people living in all areas of Lincoln.
What is your Zip Code? 38. If the City were to undertake a new, major project, how would you want it funded: [randomize options 1&2]
1) Increase taxes 2) Cut funds from other service areas 3) Some other approach [specify] _____________________________ 4) No new project 8) Don’t know/No opinion
39. Are there any other thoughts on budgeting or funding issues that you would like to share? Q:RECRUIT That was the last question. Now I have an invitation. The City of Lincoln is partnering with the Lincoln Community Foundation and the University of Nebraska Public Policy Center to sponsor an important one-day event consisting of small group discussions for a group of citizens to obtain their views on budgeting priorities. The discussion is scheduled for Saturday, April 12th, at the Cornhusker Hotel (333 South 13th Street in downtown Lincoln). Registration begins at 9:00 a.m. and the event ends at approximately 4:00 p.m. You will be paid $75 for your time, and a snack will be provided. The event is entirely non-partisan, and a wide range of views will be expressed and considered. It doesn't matter whether you know a lot about these issues. We will provide some background information but the most important thing is that we are interested in knowing what you
54

think. Past participants in dialogues of this kind have found it enjoyable and interesting. Some of the sessions will be taped for broadcast, and it has been fun for people to be on local TV. We hope that you will agree to take part in this exciting and important event. You have a chance to make your voice heard in deciding Lincoln’s future. Q:ATTEND Great! Now we need to collect some information so that we can be certain to reach you in the future. What is your first name? ASK THE PARTICIPANT TO SPELL BOTH THEIR FIRST AND LAST NAME. Q:ALNAME What is your last name? ASK THE PARTICIPANT TO SPELL BOTH THEIR FIRST AND LAST NAME. Q:ATADY What is your mailing address? Q:BPHONE What is the best phone number to reach you?
1 Current number 5 OTHER - SPECIFY
8 DONT KNOW 9 REFUSED
Q:CLOS That concludes our survey. I'd like to thank you for taking the time to help us with this important study. The results will be used for policy and program development in the state of Nebraska. Would you like a telephone number to call if you have any questions about the study? I can also provide you with contact information for the director of the Bureau of Sociological Research, Dr. Julia McQuillan, or if you want to know more about your rights as a research participant, I can give you a telephone number to contact the Institutional Review Board at the University of Nebraska. IF YES: BUREAU OF SOCIOLOGICAL RESEARCH 472-3672 UNIVERSITY OF NEBRASKA - LINCOLN IRB 472-6965
55

APPENDIX B: DELIBERATIVE DISCUSSION
SURVEYS AND BRIEFING DOCUMENT
56

Key Findings of Deliberative Discussion
Lincoln residents have relatively static opinions of the order of importance of different City services and strategic priority areas.
Safety and Security and Economic Opportunity are the budget areas in which
Deliberation Participants would like to see the City focus.
Lincoln residents’ preferences regarding how to fund City services and strategic priority areas are amenable to change.
After learning more about Lincoln’s budget process and overall financial
circumstances, residents are more willing to support an increase in taxes.
Participating in an interactive forum with City officials increases residents’ levels of trust and confidence in government.
57

PRIORITY LINCOLN DELIBERATIVE DISCUSSION
1. INTRODUCTION The Priority Lincoln: We’re Listening Community Conversation was convened on Saturday, April 12th, 2008. The format for the event was based about the Deliberative Polling model. Deliberative Polling combines random sampling with deliberative discussions as a means to provide insight about public perceptions of policy issues. Deliberative Polls were first conducted in the United States in 1996, but have since been convened in Australia, Britain, Denmark, and various other nations. In the Deliberative Polling model, a survey is conducted of a random sample of individuals about the public policy issue(s) of interest. That sample is then provided with educational materials about the issues of interest, and then invited to participate in small group deliberations about the issue and engage a panel of experts in a question-and-answer period. A follow-up survey of the sample is then conducted which measures the extent to which the deliberative process altered opinions or knowledge of the topic(s) of interest. More information about Deliberative Polling can be found at the website of the Center for Deliberative Democracy at Stanford University (http://cdd.stanford.edu/). The strengths of a Deliberative Poll are that it provides an opportunity for participants to discuss their viewpoints with others and learn more about the topic(s) of interest. A Deliberative Poll thus measures changes in attitudes towards the topic(s) of interest among a sample of individuals who have become more informed about an issue, and that sample theoretically represents a cross-section of the community of interest due to random sampling. The weaknesses of a Deliberative Poll are that it can be difficult to assess how representative participants are of the larger community from which they are drawn, and convening a Deliberation can be a costly and time consuming endeavor. Who Attended the Priority Lincoln Deliberation and What Did They Do? A total of 286 individuals were invited to participate in the Priority Lincoln Deliberation. One-hundred and two (36%) individuals accepted the invitation, and the remaining 184 (64%) individuals either declined or did not answer affirmatively. Of the 102 invitees, 51 (50%) individuals actually attended the April 12th Deliberation. All of the Deliberation invitees received an invitation to participate in
58

the event after completing the telephone survey, and were thus a sub-sample of the telephone survey respondents. The objective of the Deliberation was to provide an opportunity for those telephone survey respondents to learn more about the City’s budgeting process, and share and explore their perspectives about Lincoln’s budgeting priorities with each other and representatives from the City. Respondents were offered $75 as an incentive to participate in the Deliberation and compensate them for their time. Upon accepting the invitation to the Deliberation, the prospective participants were mailed a set of background materials a week to two weeks before the event about the City of Lincoln’s current operating budget, City services, and budget outcomes. The background document was created with consultation from the City of Lincoln. Deliberation participants were primarily white (90%), male (65%), and had a bachelor’s degree or lower (65%). See Table B.1 for demographic characteristics of the Deliberation participants. Table B.1 Race/Ethnicity White = 46 (90%) African-American = 2 (4%) American Indian/Alaskan Native = 1 (2%) Hispanic/Latino = 2 (4%) Gender Male = 33 (65%) Female = 18 (35%)
Highest Schooling Completed Some high school=2 (4%) High school degree=3 (6%) Some college=15 (30%) Associates/2 year degree=5 (10%) Bachelor’s degree=8 (16%) Some grad school=2 (4%) Master’s degree=9 (18%) Doctorate=6 (12%)
Zip Code 68502=5 (10%) 68503=2 (4%) 68504=1 (2%) 68505=4 (8%) 68506=7 (14%) 68507=3 (6%) 68508=2 (4%) 68510=5 (10%) 68512=1 (2%) 68516=11 (22%) 68520=1 (2%) 68521=5 (10%) 68522=1 (2%) 68524=2 (4%)
Upon arrival at the Deliberation, all 51 participants completed a written pre-event survey that replicated sections of the telephone survey. The pre-event survey measured changes in attitude about the City’s budget since the time the telephone survey was administered. The participants then viewed an informational presentation about the City’s budget provided by Mayor Beutler. Participants were randomly assigned to six small groups. Within small group discussion sessions, the participants identified questions about the City’s budget, and then had an opportunity to ask those questions of the department heads in a plenary panel discussion. Following that session, the participants re-convened in their small group discussion sessions and prioritized the City’s budget
59
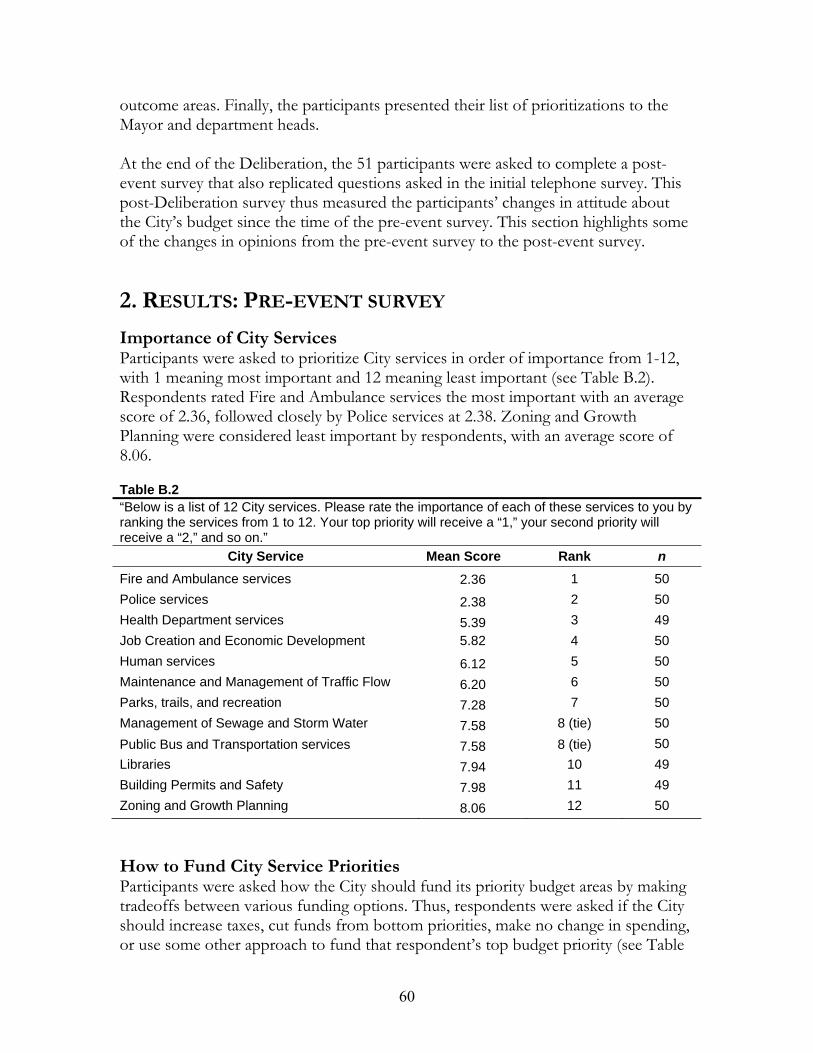
outcome areas. Finally, the participants presented their list of prioritizations to the Mayor and department heads. At the end of the Deliberation, the 51 participants were asked to complete a post-event survey that also replicated questions asked in the initial telephone survey. This post-Deliberation survey thus measured the participants’ changes in attitude about the City’s budget since the time of the pre-event survey. This section highlights some of the changes in opinions from the pre-event survey to the post-event survey. 2. RESULTS: PRE-EVENT SURVEY
Importance of City Services Participants were asked to prioritize City services in order of importance from 1-12, with 1 meaning most important and 12 meaning least important (see Table B.2). Respondents rated Fire and Ambulance services the most important with an average score of 2.36, followed closely by Police services at 2.38. Zoning and Growth Planning were considered least important by respondents, with an average score of 8.06. Table B.2 “Below is a list of 12 City services. Please rate the importance of each of these services to you by ranking the services from 1 to 12. Your top priority will receive a “1,” your second priority will receive a “2,” and so on.”
City Service Mean Score Rank n Fire and Ambulance services 2.36 1 50 Police services 2.38 2 50 Health Department services 5.39 3 49 Job Creation and Economic Development 5.82 4 50 Human services 6.12 5 50 Maintenance and Management of Traffic Flow 6.20 6 50 Parks, trails, and recreation 7.28 7 50 Management of Sewage and Storm Water 7.58 8 (tie) 50 Public Bus and Transportation services 7.58 8 (tie) 50 Libraries 7.94 10 49 Building Permits and Safety 7.98 11 49 Zoning and Growth Planning 8.06 12 50
How to Fund City Service Priorities Participants were asked how the City should fund its priority budget areas by making tradeoffs between various funding options. Thus, respondents were asked if the City should increase taxes, cut funds from bottom priorities, make no change in spending, or use some other approach to fund that respondent’s top budget priority (see Table
60

B.3). Approximately one-third of respondents (30%) said that the City should cut funds from bottom priorities to spend more on top priorities. The second largest number of participants (24%) said that the City should take “some other approach” to funding top budget priorities. Only 22% of respondents favored an increase in taxes, while only 6% of respondents favored making no change in spending. Table B.3
“In order to fund your top priority, would you recommend the City:” n=50
Response Percent n Increase Taxes 22% 11 Cut funds from bottom priorities to spend more on top priorities 30% 15
Some other approach 24% 12 Make no change in spending 6% 3 Don’t Know 18% 9
Ranking Budget Outcome Priorities Participants were asked to prioritize budget areas in order of importance from 1-8, with 1 meaning most important and 8 meaning least important (see Table B.4). Safety and Security was deemed the most important budget priority, with an average score of 2.58. Equal Access and Diversity were considered the least important budget priority, with an average score of 6. Table B.4 “Below is a list of 8 long term City budgeting goals. Please rate the importance of each of these budget goals by ranking the budget goals from 1 to 8. Your top priority will receive a “1,” your second priority will receive a “2,” and so on.”
Budget Areas Mean Score Rank n Safety and Security 2.58 1 51
Economic Opportunity 3.74 2 51
Livable Neighborhoods 4.11 3 51 Healthy People 4.29 4 51 Environmental Quality 4.37 5 51 Effective Transportation 4.55 6 51 Quality of Life 5.08 7 51 Equal Access and Diversity 6.02 8 51 How to Fund Budget Outcome Priorities Participants were asked how they want the City to fund priority budget outcome areas. Results are presented in Table B.5. Approximately one-fifth of respondents (20%) indicated that they would choose to see the City reallocate existing funds to
61

pay for their budget outcome priorities. Another 20% of respondents said they would like to see the City take some other approach. Thirty two percent of respondents did not know how to fund their top priority. Table B.5
“In order to fund your top priority, would you recommend the City:” n=50
Response Percent n Increase Taxes 16% 8 Cut funds from bottom priorities to spend more on top priorities
20% 10
Some other approach 20% 10 Make no change in spending 12% 6 Don’t Know 32% 16
Public Knowledge A series of factual questions were also asked of respondents in the pre-event survey. Results are presented in Tables B.6-B.14. Respondents were asked which City service receives the highest amount of funding (see Table B.6). The majority of respondents (69%) correctly answered that Public Safety services receives the majority of the City’s budget. Table B.6 “The City government spends the highest amount of its budget on which category of services?” n=51
Response Percent n Human services and Health Department services 11.8% 6
Parks, Libraries, and Recreation 2% 1
Public Safety Services 68.6% 35 Maintaining and Building Roads 17.6% 9
Respondents were asked how much the City received of each dollar collected in property taxes (see Table B.7). The majority of respondents (58%) correctly answered that less than 15% of each dollar collected in property taxes is allocated to the City of Lincoln.
62

Table B.7 “Of each dollar collected in property taxes in Lincoln, the City government receives approximately how much?” n=50
Response Percent n Less than 15 percent 58% 29 Between 15 and 24 percent 26% 13 Between 25 and 49 percent 6% 3 50 percent or more 10% 5 When asked what is the highest source of revenue for the City’s budget, the majority of respondents correctly answered (54%) that sales taxes were the highest source of revenue for the City’s budget (see Table B.8). Table B.8 “What is the highest source of revenue of the City’s budget?” n=50
Response Percent n Property Taxes 40.0% 20 Income Taxes 2.0% 1 Sales Taxes 54.0% 27 Other sources 4.0% 2 Respondents were asked about the approximate size of the City of Lincoln’s annual budget. The majority of respondents (63%) were correct that the City’s budget falls between $125 million and $175 million (see Table B.9). Table B.9 “The City of Lincoln’s annual budget is approximately how much?” n=48
Response Percent n Less than $10 million 2.1% 1 Between $25million and $75 million
27.1% 13
Between $125 million and $175 million 62.5% 30
Over $500 million 8.3% 4 Other 0% 0 Respondents were asked about the total amount of charitable funds made available to Lincoln’s public programs and services (see Table B.10). Only 21% of participants correctly selected between $125 million and $175 million. Most respondents incorrectly answered that less than $10 million were made available to Lincoln’s public programs and services.
63

Table B.10 “The total amount of charitable funds made available to Lincoln’s public programs and services is estimated to be at what dollar level?” n=47
Response Percent n Less than $10 million 51.1% 24 Between $25million and $75 million
27.7% 13
Between $125 million and $175 million 21.3% 10
Over $500 million 0% 0 Respondents were asked which governmental entity makes final decisions regarding the City’s annual budget (see Table B.11). A majority of respondents (60%) correctly answered that the City Council makes the final decision on the City’s annual budget. Table B.11 “Which entity makes the final decision regarding the adoption of Lincoln’s City Budget?” n=50
Response Percent n The Mayor 34% 17 City Council 60% 30 The various department heads 2% 1 The Governor 4% 2 Respondents were asked what form of budgeting is most common among localities (see Table B.12). Most respondents correctly answered that the incremental form of budgeting was the most commonly used approach to budgeting. Table B.12 “Most localities currently utilize the ________ approach to budgeting?” n=47
Response Percent n Budgeting for outcomes 25.5% 12 Incremental 53.2% 25 Provisional 14.9% 7 Price of Government 6.4% 3 When asked about the approximate amount of donations Lincoln residents provide to charities on an annual basis, only a minority of participants (23%) correctly answered that Lincolnites provide an estimated $150 million a year in donation to charity (see Table B.13).
64

Table B.13 “The amount of annual donations Lincoln residents give to charities is approximately:” n=47
Response Percent n 5 million per year 38.3% 18 50 million year 38.3% 18 150 million year 23.4% 11 Respondents were asked how many different languages and dialects were spoken among Lincoln residents (see Table B.14). Only 18% of respondents correctly answered that between 50-59 languages and dialects are spoken among Lincolnites. The majority (43%) of individuals believed between 30-39 languages and dialects are spoken in Lincoln. Table B.14 “Approximately how many different languages or dialects are currently spoken in Lincoln?” n=51
Response Percent n 30-39 43.1% 22 40-49 29.4% 15 50-59 17.6% 9 60 or more 9.8% 5 Public Trust and Confidence The pre-event survey also included a series of questions about the levels of trust and confidence that Lincoln residents have in their City government (see Table B.15). Respondents generally agreed with the statement: “I am satisfied with the Lincoln City government.” Of the respondents, 51% either agreed or strongly agreed with the statement, while only 20% disagreed or strongly disagreed. Similarly, respondents agreed or strongly agreed with the two statements: “Public officials in Lincoln City government care about what people like me think” (49%) and “Lincoln City government officials treat residents with respect” (65%).
65

Table B.15
Question n Strongly disagree Disagree
Neither disagree
nor agree
Agree Strongly agree
I am satisfied with the Lincoln City government. 51 2% 17.6% 29.4% 45.1% 5.9%
Public officials in Lincoln City government care about what people like me think.
51 5.9% 9.8% 35.3% 39.2% 9.8%
Lincoln City government officials treat residents with respect.
51 2% 5.9% 27.5% 56.9% 7.8%
I have great confidence in the Lincoln City government. 51 2% 19.6% 41.2% 29.4% 7.8%
Residents have a great say in important Lincoln City government decisions.
51 4% 38% 46% 8% 4%
Lincoln City government officials base their decisions on the facts, not their personal interests.
51 2% 35.3% 37.3% 23.5% 2%
Lincoln City government officials have residents’ best interests in mind when they make decisions.
51 3.9% 13.7% 45.1% 31.4% 5.9%
Lincoln City government can usually be trusted to make decisions that are right for residents as a whole.
51 2% 19.6% 39.2% 33.3% 5.9%
3. RESULTS: POST-EVENT SURVEY
At the conclusion of the Priority Lincoln Deliberation, the 51 participants were again asked to complete a written survey that replicated a number of questions from the initial telephone phone survey, as well as the pre-event survey administered before the Deliberation’s activities had begun. The post-event survey thus captures changes in attitude and knowledge that occurred as a result of the participants’ engagement in discussions with each other, and interaction with the Mayor and the various department heads present during the Deliberation. A number of the tables in this
66

section will highlight the change in opinions and attitudes that occurred from the pre-event survey to the post-event survey. Importance of City Services Respondents were asked to rate the importance of 12 City services on a scale from 1-10, where 1 represents little importance and 10 represents extreme importance. The results show that respondents rated Police services 8.6, and Fire and Ambulance services at 7.9. Both of these averages are substantially higher than the other ten services (see Table B.16). Table B.16 “On a scale of 1-10, please rate the importance of each of these City government functions, with 1 being “not at all important” and 10 being “extremely important.”
City Service Mean Score Rank n Police services 8.61 1 49 Fire and Ambulance services 7.93 2 49 Management of Sewage and Storm Water 6.60 3 46 Parks, Trails and Recreation 6.37 4 48 Libraries 6.31 5 48 Maintenance and Management of Traffic Flow 6.30 6 49 Zoning and Growth Planning 6.19 7 46 Job Creation and Economic Development 6.10 8 47 Health Department services 5.91 9 48 Public Bus and Transportation services 5.82 10 47 Human services 5.65 11 46 Building Permits and Safety 5.44 12 45
Ranking the Importance of City Services When asked to rank City services in order of importance from 1-12, with 1 being most important and 12 being least important, respondents indicated that Police services and Fire and Ambulance services were most important with an average score of 2.05 and 2.22, respectively (see Table B.17). These services were ranked substantially higher than the next service, Job Creation and Economic Development, which had an average ranking of 5.12.
67

Table B.17 “Below is a list of 12 City services. Please rate the importance of each of these services to you by ranking the services from 1 to 12. Your top priority will receive a “1,” your second priority will receive a “2,” and so on.”
City Service Mean Score Rank n Police services 2.06 1 50 Fire and Ambulance services 2.22 2 50 Job Creation and Economic Development 5.12 3 50 Health Department services 6.28 4 50 Maintenance and Management of Traffic Flow 6.80 5 50 Human services 7.00 6 49 Management of Sewage and Storm Water 7.06 7 50 Public Bus and Transportation services 7.32 8 49 Parks, Trails and Recreation 7.67 9 49 Libraries 7.76 10 50 Zoning and Growth Planning 8.95 11 49 Building Permits and Safety 9.08 12 48
Pre and Post Deliberation Ranking of City Services There were slight differences in how participants ranked the importance of City services before and after the Deliberation. However, in both surveys, participants valued Police services and Fire and Ambulance services over other City services by considerable margins. A comparison of results is presented in Table B.18.
68

Table B.18 “Below is a list of 12 City services. Please rate the importance of each of these services to you by ranking the services from 1 to 12. Your top priority will receive a “1,” your second priority will receive a “2,” and so on.” Pre-Deliberation Survey Post-Deliberation Survey
Rank City Service Mean Score City Service Mean Score
1 Fire and Ambulance services
2.36 Police services
2.06
2 Police services
2.38 Fire and Ambulance services
2.22
3 Health Department services
5.38 Job Creation and Economic Development
5.12
4 Job Creation and Economic Development
5.82 Health Department services
6.28
5 Human services
6.12 Maintenance and Management of Traffic Flow
6.8
6 Maintenance and Management of Traffic Flow
6.2 Human services
7
7 Parks, trails, and recreation 7.28
Management of Sewage and Storm Water
7.06
8 Management of Sewage and Storm Water
7.58 (tie) Public Bus and Transportation services
7.33
8 / 9 Public Bus and Transportation services
7.58 (tie) Parks, trails, and recreation 7.67
10 Libraries 7.94 Libraries 7.76
11 Building Permits and Safety 7.98
Zoning and Growth Planning 8.96
12 Zoning and Growth Planning 8.06
Building Permits and Safety 9.08
How to Fund City Service Priorities Participants were again asked to help make the determination of how the City should fund its priority budget outcomes by making tradeoffs between various funding options. Thus, respondents were asked if the City should increase taxes, cut funds from bottom priorities, make no change in spending, or use some other approach to fund that respondent’s top budget priority. Results are presented in Table B.19.
69

In response to this question, over 40% of respondents chose increasing taxes. An equal proportion of respondents believed that funds from bottom priorities should be cut (23%) or that “some other approach” (23%) should be taken to fund top priorities. Table B.19
“In order to fund your top priority, would you recommend the City:” n=50
Response Percent n Increase Taxes 40.4% 19 Cut funds from bottom priorities to spend more on top priorities
23.4% 11
Some other approach 23.4% 11 Make no change in spending 8.5% 4 Don’t Know 4.3% 2
Change in Preferences to Fund City Services In relation to the pre-event survey, there were substantial changes in how participants preferred to fund City services when asked the same question in the post-event survey (see Table B.20). The number of people who preferred to increase taxes to fund services following the Deliberation increased to 40% from 22%. Participants who did not know how to fund City services priorities decreased from 18% to 4% following the Deliberation. Table B.20
“In order to fund your top service priority, would you recommend the City:” n=50 (pre) n=50 (post)
Response Pre-
Deliberation Survey
Post-Deliberation
Survey Change
Increase Taxes 22% 40.4% +18% Cut funds from bottom priorities to spend more on top priorities
30% 23.4% -6.6%
Some other approach 24% 23.4% -.6% Make no change in spending 6% 8.5% +2.5% Don’t Know 18% 4.3% -13.7%
Allocation of $100 Among City Services When participants were asked how they would allocate $100 among City services, Police services received the largest proportion of dollars ($21.87), followed by Fire and Ambulance services ($18.64). The next highest dollar amount was allocated to Job Creation and Economic Development at $10.17 (see Table B.21).
70

Table B.21 “Imagine you have $100 which represents the money available for the City of Lincoln to spend on services. If you had to divide that $100 between the following 12 services, how would you divide the money? For example, if you felt that Building Permits and Safety should receive 10% of the money, you would allocate $10 to that service. Remember that you can choose to withhold funding from any service, but you must spend all of your money.”
City Service Mean $ Amount Rank n
Police services $21.88 1 48
Fire and Ambulance services $18.65 2 48 Job Creation and Economic Development $10.17 3 47 Health Department services $8.29 4 42 Maintenance and Management of Traffic Flow $7.95 5 43 Human services $7.20 6 41 Zoning and Growth Planning $7.00 7 38 Public Bus and Transportation services $6.85 8 44 Libraries $5.77 9 44 Parks, Trails and Recreation $5.74 10 42 Management of Sewage and Storm Water $5.48 11 40 Building Permits and Safety $3.89 12 39
Ranking Budget Priorities Participants were asked to prioritize budget areas in order of importance from 1-8, with 1 being most important and 8 being least important (see Table B.22). Safety and Security was deemed the most important budget priority, with an average score of 1.66. Equal Access and Diversity was considered the least important budget priority, with an average score of 7.12. Table B.22
“Below is a list of 8 long term City budgeting goals. Please rate the importance of each of these budget goals by ranking the budget goals from 1 to 8. Your top priority will receive a “1,” your second priority will receive a “2,” and so on.” Budget Areas Mean Score Rank n Safety and Security 1.66 1 50 Economic Opportunity 3.54 2 50 Livable Neighborhoods 4.12 3 49 Effective Transportation 4.33 4 49 Healthy People 4.37 5 49 Quality of Life 4.90 6 49 Environmental Quality 5.52 7 48 Equal Access and Diversity 7.12 8 49
71

Pre and Post Deliberation Ranking of Budget Areas There were slight differences in how participants ranked the importance of budget areas before and after the Deliberation. A comparison of results is presented in Table B.23. In both surveys, however, participants valued Safety and Security over other budget areas, followed by Economic Opportunity, and Livable Neighborhoods. Table B.23 “Below is a list of 12 City services. Please rate the importance of each of these services to you by ranking the services from 1 to 12. Your top priority will receive a “1,” your second priority will receive a “2,” and so on.”
Pre-Deliberation Survey Post-Deliberation Survey Rank Budget Areas Mean Score Budget Areas Mean Score
1 Safety and Security 2.59 Safety and
Security 1.66
2 Economic Opportunity 3.75 Economic
Opportunity 3.54
3 Livable Neighborhoods
4.12 Livable Neighborhoods 4.12
4 Healthy People 4.29 Effective Transportation 4.33
5 Environmental Quality 4.37 Healthy People 4.37
6 Effective Transportation 4.55 Quality of Life 4.90
7 Quality of Life 5.08 Environmental Quality 5.52
8 Equal Access and Diversity 6.02 Equal Access
and Diversity 7.12
Increase or Decrease Funding for Budget Areas To determine citizen preferences among the eight budget outcomes, respondents were asked whether the City should increase funding and services, maintain funding and services, or decrease funding and services to achieve each of the budget outcomes. The results are presented in Table B.24. While the findings show that Lincoln’s citizens would generally prefer to maintain the current levels of spending in many of the areas, there are places where citizens would like the City to either increase or decrease funding. For example, large proportions of citizens would like to see the City decrease investment in Equal Access and Diversity (56%) and increase investment in Effective Transportation (46%).
72
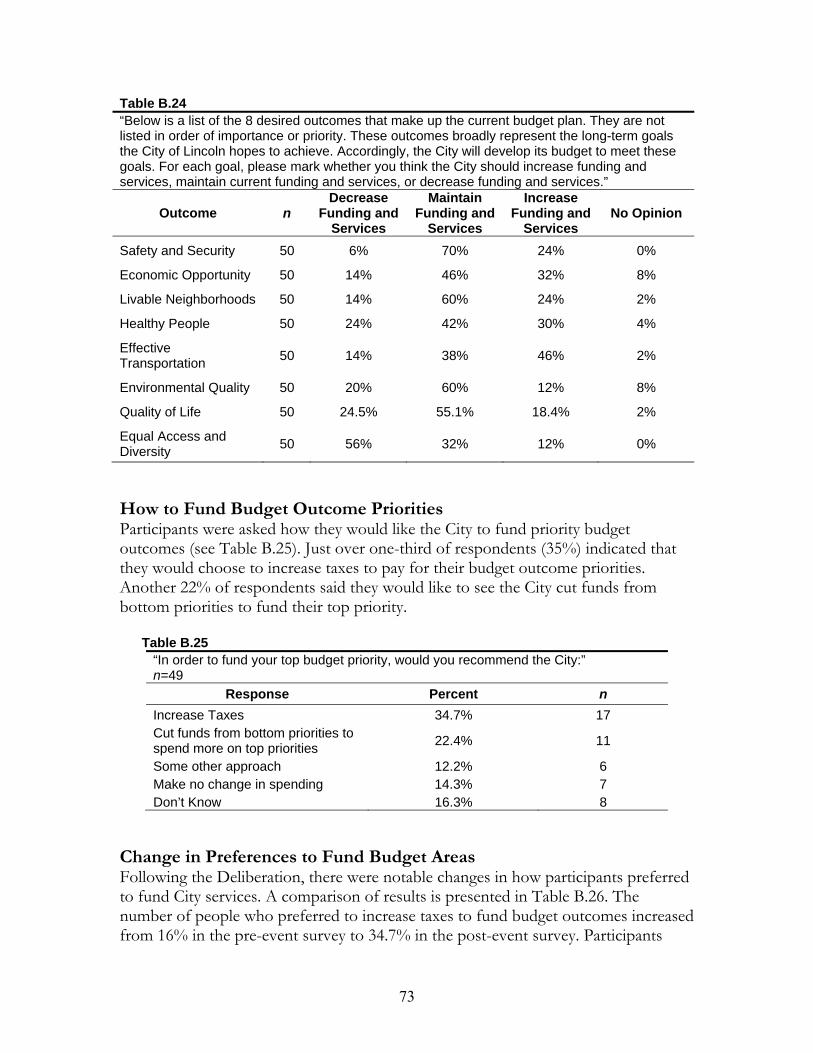
Table B.24 “Below is a list of the 8 desired outcomes that make up the current budget plan. They are not listed in order of importance or priority. These outcomes broadly represent the long-term goals the City of Lincoln hopes to achieve. Accordingly, the City will develop its budget to meet these goals. For each goal, please mark whether you think the City should increase funding and services, maintain current funding and services, or decrease funding and services.”
Outcome n Decrease
Funding and Services
Maintain Funding and
Services
Increase Funding and
Services No Opinion
Safety and Security 50 6% 70% 24% 0%
Economic Opportunity 50 14% 46% 32% 8%
Livable Neighborhoods 50 14% 60% 24% 2%
Healthy People 50 24% 42% 30% 4%
Effective Transportation 50 14% 38% 46% 2%
Environmental Quality 50 20% 60% 12% 8%
Quality of Life 50 24.5% 55.1% 18.4% 2%
Equal Access and Diversity 50 56% 32% 12% 0%
How to Fund Budget Outcome Priorities Participants were asked how they would like the City to fund priority budget outcomes (see Table B.25). Just over one-third of respondents (35%) indicated that they would choose to increase taxes to pay for their budget outcome priorities. Another 22% of respondents said they would like to see the City cut funds from bottom priorities to fund their top priority. Table B.25
“In order to fund your top budget priority, would you recommend the City:” n=49
Response Percent n Increase Taxes 34.7% 17 Cut funds from bottom priorities to spend more on top priorities 22.4% 11
Some other approach 12.2% 6 Make no change in spending 14.3% 7 Don’t Know 16.3% 8
Change in Preferences to Fund Budget Areas Following the Deliberation, there were notable changes in how participants preferred to fund City services. A comparison of results is presented in Table B.26. The number of people who preferred to increase taxes to fund budget outcomes increased from 16% in the pre-event survey to 34.7% in the post-event survey. Participants
73

who did not know how to fund City services priorities decreased substantially from 32% to 16% following the Deliberation. Table B.26
“In order to fund your top budget priority, would you recommend the City:” n=50 (pre) n=49 (post)
Response Pre-
Deliberation Survey
Post-Deliberation
Survey Change
Increase Taxes 16% 34.7% +18.7% Cut funds from bottom priorities to spend more on top priorities 20% 22.4% +2.4%
Some other approach 20% 12.2% -7.8% Make no change in spending 12% 14.3% +2.3% Don’t Know 32% 16.3% -15.7%
Allocation of $100 Among Budget Areas Participants were asked how they would allocate $100 among budget outcomes (see Table B.27). Safety and Security received the largest allocation of dollars ($30) and the next highest recipient was Economic Opportunity at $15.59. Table B.27
“Imagine you have $100 which represents the money available for the City of Lincoln to spend on its 8 budget outcome goals. If you had to divide that $100 between the following budget outcomes, how would you divide the money? For example, if you felt that Safety and Security should receive 10% of the money, you would allocate $10 to that service. Remember that you can choose to withhold funding from any service, but you must spend all of your money.”
Budget Areas Mean $ Amount Rank n
Safety and Security $30.00 1 47 Economic Opportunity $15.59 2 48 Effective Transportation $12.13 3 48 Livable Neighborhoods $11.92 4 47 Quality of Life $10.03 5 47 Healthy People $9.78 6 46 Environmental Quality $8.61 7 44 Equal Access and Diversity $6.46 8 40
Additional Funding for Budget Outcomes Respondents were asked how they would allocate an additional $20 among budget outcomes if there was an increase in the City’s funds (see Table B.28). Again, Safety and Security ($6.94) and Economic Opportunity ($6.53) were identified as the two
74

budget outcomes that would receive the most amount of additional funding if the budget were increased by 20%. Table B.28
“Here again are the 8 outcomes addressed by the budget, presented in alphabetical order. If the City were able to increase its budget by $20, how would you like to distribute the extra funds? Please indicate how much you want to spend in each area, totaling $20.”
Budget Areas Mean $ Amount Rank n
Safety and Security $6.94 1 32 Economic Opportunity $6.53 2 36 Healthy People $5.57 3 30 Effective Transportation $4.59 4 32 Livable Neighborhoods $4.39 5 31 Quality of Life $3.21 6 26 Environmental Quality $2.79 7 21 Equal Access and Diversity $2.76 8 21
Decreased Funding for Budget Outcomes Respondents were asked how they would cut $20 among budget outcomes if there were a decrease in the City’s funds (see Table B.29). Equal Access and Diversity received the largest cut in funding at an average amount of $6.72, followed by Effective Transportation at $5.70. Livable Neighborhoods was the budget outcome that respondents were least inclined to cut, with an average reduction of $3.17. Table B.29
“Here again are the 8 outcomes addressed by the budget, presented in alphabetical order. If the City had to decrease its budget by $20, how much would you reduce funding to each area? Please indicate how much you would reduce in each area, totaling $20.”
Budget Areas Mean $ Amount Rank n
Equal Access and Diversity $6.72 1 36 Effective Transportation $5.70 2 25 Economic Opportunity $4.67 3 24 Safety and Security $3.95 4 21 Quality of Life $3.86 5 29 Healthy People $3.46 6 23 Environmental Quality $3.41 7 29 Livable Neighborhoods $3.17 8 24
75

Charitable Organizations When asked what budget areas charitable organizations like the Lincoln Community Foundation should focus funding efforts (see Table B.30), 40% of respondents believed that Healthy People should receive the focus of charitable funding in Lincoln, followed by Quality of Life at 31%. Table B.30
“To which one of the priority areas should business and community organizations like the Lincoln Community Foundation focus their charitable funding?” n=45
Outcome Percent Rank n Healthy People 40% 1 18 Quality of Life 31.1% 2 14 Livable Neighborhoods 8.9% 3 4 Economic Opportunity 6.7% 4 3 Equal Access and Diversity 6.7% 5 3 Environmental Quality 4.4% 6 2 Safety and Security 2.2% 7 1 Effective Transportation 0% 8 0
Public Knowledge A series of factual questions were again asked of respondents in the post-deliberation survey. In Tables B.31-B.39 the findings of the post-deliberation survey are presented, as are the comparisons with the pre-deliberation findings. Respondents were asked which City service received the most amount of City funding (see Table B.31). The majority of respondents (92%) correctly answered that public safety services received the majority of the City’s budget in the post-deliberation, showing an increase from 69% to 92% among respondents choosing the correct answer following the Deliberation. Table B.31 “The City government spends the highest amount of its budget on which category of services?” n=51 (pre) n=51 (post)
Response Percent (pre / post) n (pre / post) Human services and Health Department services 11.8% / 6% 6 / 3
Parks, Libraries, and Recreation 2% / 0 1 / 1
Public Safety Services 68.6% / 92% 35 / 46 Maintaining and Building Roads 17.6% / 2% 9 / 1
76

When respondents were asked how much the City received of each dollar collected in property taxes, the majority of respondents (67%) correctly answered that less than 15% of each dollar collected in property taxes is allocated to the City of Lincoln (see Table B.32). There was an increase from 58% to 67% among respondents choosing the correct answer following the Deliberation. Table B.32 “Of each dollar collected in property taxes in Lincoln, the City government receives approximately how much?” n=50 (pre) n=49 (post)
Response Percent (pre / post) N (pre / post) Less than 15 percent 58% / 67.3% 29 / 33 Between 15 and 24 percent 26% / 22.4% 13 / 11 Between 25 and 49 percent 6% / 10.2% 3 / 5 50 percent or more 10% / 0 5 / 0 When asked what the highest source of revenue was of the City’s budget, a majority of respondents (54%) correctly answered that sales taxes are the largest source of revenue for the City’s budget (see Table B.33). Following the Deliberation, the proportion of correct responses increased to 68% from 54%. Table B.33 “What is the highest source of revenue of the City’s budget?” n=50 (pre) n=50 (post)
Response Percent (pre / post) n (pre / post) Property Taxes 40% / 28% 20 / 14 Income Taxes 2% / 2% 1 / 1 Sales Taxes 54% / 68% 27 / 34 Other sources 4% / 2% 2 / 1 Respondents were asked approximately how large the City of Lincoln’s annual budget is (see Table B.34). A majority of respondents (69%) were correct that the City’s budget falls between $125 million and $175 million. The number of respondents who chose the correct answer increased by nearly 7% following the Deliberation. Table B.34 “The City of Lincoln’s annual budget is approximately how much?” n=48 (pre) n=49 (post)
Response Percent (pre / post) n (pre / post) Less than $10 million 2.1% / 4.1% 1 / 2 Between $25million and $75 million
27.1% / 14.3% 13 / 7
Between $125 million and $175 million 62.5% / 69.4% 30 / 34
Over $500 million 8.3% / 12.2% 4 / 6 Other 0% / 0% 0 / 0
77

Respondents were asked about the total amount of charitable funds made available to Lincoln’s public programs and services (see Table B.35). Only 20% of participants correctly answered that charities provide between $125 million and $175 million in Lincoln. Most respondents incorrectly answered that less than $10 million were made available to Lincoln’s public programs and services. Table B.35 “The total amount of charitable funds made available to Lincoln’s public programs and services is estimated to be at what dollar level?” n=47 (pre) n=49 (post)
Response Percent (pre / post) n (pre / post) Less than $10 million 51.1% / 32.7% 24 /16 Between $25million and $75 million
27.7% / 42.9% 13 / 21
Between $125 million and $175 million 21.3% / 20.4% 10 / 10
Over $500 million 0% / 4.1% 0 / 2 When asked which governmental entity makes final decisions regarding the City’s annual budget, a majority of respondents (70%) correctly answered that the City Council makes the final decision on the City’s annual budget. There was a slight increase from 60% to 70% of respondents who chose the correct answer following the Deliberation. A comparison of results is presented in Table B.36. Table B.36 “Which entity makes the final decision regarding the adoption of Lincoln’s City Budget?” n=50 (pre) n=50 (post)
Response Percent (pre / post) n (pre / post) The Mayor 34% / 26% 17 / 13 City Council 60% / 70% 30 / 35 The various department heads 2% / 2% 1 / 1 The Governor 4% / 2% 2 / 1 Respondents were asked what the predominant form of budgeting was for local governmental entities (see Table B.37). Most respondents (55%) correctly answered that the incremental form of budgeting was the most commonly used approach to budgeting. There was an increase from 53% to 55% among respondents choosing the correct answer following the Deliberation. Table B.37 “Most localities currently utilize the ________ approach to budgeting?” n=47 (pre) n=49 (post)
Response Percent (pre / post) N (pre / post) Budgeting for outcomes 25.5% / 30.6% 12 / 15 Incremental 53.2% / 55.1% 25 / 27 Provisional 14.9% / 6.1% 7 / 3 Price of Government 6.4% / 8.2% 3 / 4
78

Respondents were asked about the approximate amount of donations Lincoln residents provide to charities on an annual basis (see Table B.38). A small proportion of participants (25%) correctly answered that Lincolnites donate an estimated $150 million a year to charity. However, there was an increase from 23% to 25% among respondents who chose the correct answer following the Deliberation. Table B.38 “The amount of annual donations Lincoln residents give to charities is approximately:” n=47(pre) n=49(post)
Response Percent (pre / post) n (pre / post) 5 million per year 38.3% / 51% 18 / 25 50 million year 38.3% / 24.5% 18 / 12 150 million year 23.4% / 24.5% 11 / 12 Respondents were asked how many different languages and dialects were spoken among Lincoln residents (see Table B.39). Only about 18% of respondents correctly answered that between 50-59 languages and dialects are spoken among Lincolnites. The majority (52%) of individuals believed between 30-39 languages and dialects are spoken in Lincoln. The proportion of respondents choosing the correct increased by about 34% from the pre-deliberation survey to the post-deliberation survey. Table B.39 “Approximately how many different languages or dialects are currently spoken in Lincoln?” n=51(pre) n=50(post)
Response Percent (pre / post) n (pre / post) 30-39 43.1% / 12% 22 / 6 40-49 29.4% / 20% 15 / 10 50-59 17.6% / 52% 9 / 26 60 or more 9.8% / 16% 5 / 8 Public Trust and Confidence The post-deliberation survey also included a series of questions about the levels of trust and confidence that Lincoln citizens have in their City government. Public trust and confidence increased following the Deliberation in every question with the exception of one (see Table B.40). For example, the amount of respondents who agreed or strongly agreed with the statement “I am satisfied with the Lincoln City government” increased from 51% to 64%, and the amount who agreed or strongly agreed with the statement “Public officials in Lincoln City government care about what people like me think” increased from 49% to 67%.
79

Table B.40
Question n
(pre/ post)
Strongly disagree
(pre / post) Disagree
(pre / post)
Neither disagree nor agree
(pre / post)
Agree (pre / post)
Strongly agree
(pre / post)
I am satisfied with the Lincoln City government. 51/ 50 2% / 2% 17.6% /
12% 29.4% /
22% 45.1% /
54% 5.9% / 10%
Public officials in Lincoln City government care about what people like me think.
51/49 5.9% / 2% 9.8% / 12.2%
35.3% / 18.4%
39.2% / 46.9%
9.8% / 20.4%
Lincoln City government officials treat residents with respect.
51/49 2% / 2% 5.9% / 4.1% 27.5% / 20.4%
56.9% / 61.2%
7.8% / 12.2%
I have great confidence in the Lincoln City government. 51/49 2% / 2% 19.6% /
14.3% 41.2% / 22.4%
29.4% / 53.1% 7.8% / 8.2%
Residents have a great say in important Lincoln City government decisions.
51/51 4% / 2% 38% / 22.4%
46% / 32.7% 8% / 34.7% 4% / 8.2%
Lincoln City government officials base their decisions on the facts, not their personal interests.
51/48 2% / 2.1% 35.3% / 52.1%
37.3% / 27.1%
23.5% / 14.6% 2% / 4.2%
Lincoln City government officials have residents’ best interests in mind when they make decisions.
51/49 3.9% / 2% 13.7% / 12.2%
45.1% / 32.7%
31.4% / 49% 5.9% / 4.1%
Lincoln City government can usually be trusted to make decisions that are right for residents as a whole.
51/49 2% / 2% 19.6% / 10.2%
39.2% / 36.7%
33.3% / 42.9% 5.9% / 8.2%
Conclusion: Deliberative Discussion The Deliberative Discussion was an opportunity for respondents to learn more about the City’s budgetary issues and interact with other survey respondents as well as City department heads. There were substantial gains in both knowledge about the City’s budget, as well as overall trust and confidence in government, following participation in the Deliberation. These outcomes suggest that residents’ attitudes about the City’s budget can be influenced by exposure to more information. However, the degree to which changes in attitudes and knowledge during the Deliberation can be attributed to participant input, the Mayor’s presentation, interaction with department heads, or other reasons, is unknown. Further research is necessary to make conclusions about the influence of individual components of the Deliberation on participant attitudes and knowledge.
80
DELIBERATIVE DISCUSSION SURVEY INSTRUMENTS
Priority Lincoln Pre-event Survey
81

Instructions: Before the day’s activities begin, please read and complete A) this survey, B) your consent form; and C) your appearance release form. Please turn those materials in to your group moderator. Thank you!
City of Lincoln Budget Deliberation Pre-Deliberation Survey
Section 1 - Public Trust and Confidence Questions Following are some statements about Lincoln’s city government. For each statement, please mark whether you strongly agree, agree, neither agree nor disagree, disagree or strongly disagree.
Statements
Stro
ngly
agr
ee
Agr
ee
Nei
ther
agr
ee
nor
disa
gree
Dis
agre
e
Stro
ngly
di
sagr
ee
1. I am satisfied with the Lincoln City government. □ □ □ □ □
2. Public officials in Lincoln City government care about what people like me think.
□ □ □ □ □
3. Residents have a great say in important Lincoln City government decisions.
□ □ □ □ □
4. Lincoln City government officials base their decisions on their personal interests, not the facts.
□ □ □ □ □
5. Lincoln City government officials treat residents with respect. □ □ □ □ □
6. I have great confidence in the Lincoln City government. □ □ □ □ □
7. Lincoln City government officials have residents’ best interests in mind when they make decisions.
□ □ □ □ □
8. Lincoln City government can usually be trusted to make decisions that are right for the residents as a whole.
□ □ □ □ □
82

Section 2 – City Service Priorities Below is a list of 12 city services. Please rate the importance of each of these services to you by ranking the services from 1 to 12. Your top priority will receive a “1,” your second priority will receive a “2,” and so on. ______ Building permits and safety ______ Fire and ambulance services ______ Health Department services ______ Human services ______ Job creation and economic development ______ Libraries ______ Management of sewage and storm water ______ Parks, trails, and recreation ______ Police services ______ Public bus and transportation services ______ Street maintenance and management of traffic flow ______ Zoning and growth planning In order to fund your top priority, would you recommend that the city: ____Increase taxes to spend more on your priority ____Cut funds in your bottom priorities to spend more on your top priorities ____Make no change in spending ____Don’t know ____Some other approach (please specify in the space below):
83

Section 3- City Goals Below is a list of 8 long term city budgeting goals. Please rate the importance of each of these budget goals by ranking the budget goals from 1 to 8. Your top priority will receive a “1,” your second priority will receive a “2,” and so on. ______Economic Opportunity – Includes good jobs; healthy business climate; attract young people and visitors. ______Effective Transportation – Includes new roads; maintain existing roads; public transportation; safe driving conditions; low traffic congestion. ______Environmental Quality – Includes clean air, water, and soil; low flood risk; effective sewage maintenance, and storm water management. ______Equal Access and Diversity – Includes legal protection against discrimination and harassment; appreciation, and recognition of Lincoln's growing diversity. ______Healthy People – Includes health care for babies, children, elderly and low income residents; promoting physical fitness; disease prevention; safe restaurants. ______Livable Neighborhoods – Includes quality, affordable housing; access to pools, parks, and libraries ______Quality of Life – Attract visitors; recreational & educational opportunity; access to parks, green space, and arts. ______Safety and Security – Includes low crime rate; low rate of injury and damage from fire; emergency medical services. In order to fund your top priority, would you recommend that the city: _____Increase taxes to spend more on your priorities _____Cut funds in your bottom priorities to spend more on your top priorities _____Make no change in spending _____Don’t know _____Some other approach (please specify in the space below) Section 4 – Citizen Knowledge The city government spends the highest amount of its budget on which category of services? _____Human services and Health Department services _____Parks, recreation and libraries _____Public safety services _____Maintaining and building roads
84

Of each dollar collected in property taxes in Lincoln, the city government receives approximately how much? _____Less than 15 percent (of each dollar) _____Between 15-24 percent (of each dollar) _____Between 25-49 percent (of each dollar) _____50 percent or more (of each dollar)
What is the highest source of revenue of the city’s budget? _____Property taxes _____Income taxes _____Sales taxes _____Other sources
The City of Lincoln’s annual budget is approximately how much? _____Less than $10 million _____$25-75 million _____$125-175 million _____Over $500 million The total amount of charitable funds made available to Lincoln’s public programs and services is estimated to be at what dollar level? _____Less than $10 million _____$25-75 million _____$125-175 million _____Over $500 million Which entity makes the final decision regarding the adoption of Lincoln’s City Budget? _____The Mayor _____The City Council _____The various department heads _____The governor Most localities currently utilize the ______ approach to budgeting? _____Budgeting for outcomes _____Incremental _____Provisional _____Price of Government The amount of annual donations Lincoln residents give to charities is approximately: _____$5 million per year _____$50 million per year _____$150 million per year _____More than $250 million per year
85
How many homicides were reported in Lincoln in 2006? ____2 ____6 ____9 ____12 or more Approximately how many different languages or dialects are currently spoken in Lincoln? _____30-39 _____40-49 _____50-59 _____60 or more Section 5 - Demographics How many years have you lived in the City of Lincoln? __________ What race, or races do you consider yourself? (choose all that apply) _____White _____Black or African American _____Hispanic or Latino _____American Indian or Alaska Native _____Asian _____Native Hawaiian or Other Pacific Islander _____Other __________________
What is the highest grade or year of school you have completed? _____Some high school _____High school degree _____Some college _____Associates certificate/2 year program _____Bachelor’s degree _____Some graduate school _____Master’s degree _____Doctorate/Advanced degree In what year were you born? ____________ We want to make sure we represent people living in all areas of Lincoln. What is your Zip Code? ____________ Thank you for taking our pre-event survey! Please turn this in to your group moderator, along with your completed consent form and appearance release form.
86
Priority Lincoln Post-event Survey
87

Mayor’s Budget Deliberation – Post Survey for April 12 Section 1 – Satisfaction and Trust in Government Below are some statements about Lincoln’s city government. For each statement, please mark whether you strongly agree, agree, neither agree nor disagree, disagree or strongly disagree.
Statements
Stro
ngly
Agr
ee
Agr
ee
Nei
ther
agr
ee
nor
disa
gree
Dis
agre
e
Stro
ngly
di
sagr
ee
1. I am satisfied with the Lincoln City government. □ □ □ □ □
2. Public officials in Lincoln City government care about what people like me think.
□ □ □ □ □
3. Residents have a great say in important Lincoln City government decisions.
□ □ □ □ □
4. Lincoln City government officials base their decisions on their personal interests, not the facts.
□ □ □ □ □
5. Lincoln City government officials treat residents with respect. □ □ □ □ □
6. I have great confidence in the Lincoln City government. □ □ □ □ □
7. Lincoln City government officials have residents’ best interests in mind when they make decisions.
□ □ □ □ □
8. Lincoln City government can usually be trusted to make decisions that are right for the residents as a whole.
□ □ □ □ □
88

89
Section 2 – City Service Priorities Below is a list of 12 city services. On a scale of 1-10, please rate the importance of each of these city government functions, with 1 being “not at all important” and 10 being “extremely important.” ______ Building permits and safety ______ Fire and ambulance services ______ Health Department services ______ Human services ______ Job creation and economic development ______ Libraries ______ Management of sewage and stormwater ______ Parks, trails, and recreation ______ Police services ______ Public bus and transportation services ______ Street maintenance and management of traffic flow ______ Zoning and growth planning Below is the same list of 12 city services. Please rate the importance of each of these services to you by ranking the services from 1 to 12. Your top priority will receive a “1,” your second priority will receive a “2,” and so on. ______ Building permits and safety ______ Fire and ambulance services ______ Health Department services ______ Human services ______ Job creation and economic development ______ Libraries ______ Management of sewage and stormwater ______ Parks, trails, and recreation ______ Police services ______ Public bus and transportation services ______ Street maintenance and management of traffic flow ______ Zoning and growth planning In order to fund your top priority, would you recommend that the city: ______ Increase taxes to spend more on your priority ______ Cut funds in your bottom priorities to spend more on your top priorities ______ Make no change in spending ______ Don’t know/No opinion ______ Some other approach (please specify in the space below)

Imagine you have $100 which represents the money available for the City of Lincoln to spend on services. If you had to divide that $100 between the following 12 services, how would you divide the money? For example, if you felt that Building Permits and Safety should receive 10% of the money, you would allocate $10 to that service. Remember that you can choose to withhold funding from any service, but you must spend all of your money. $______ Building permits and safety $______ Fire and ambulance services $______ Health Department services $______ Human services $______ Job creation and economic development $______ Libraries $______ Management of sewage and stormwater $______ Parks, trails, and recreation $______ Police services $______ Public bus and transportation services $______ Street maintenance and management of traffic flow $______ Zoning and growth planning
=$100
90

Section 3 – Budget Outcome Priorities Below is a list of the 8 desired outcomes that make up the current budget plan. They are not listed in order of importance or priority. These outcomes broadly represent the long-term goals the City of Lincoln hopes to achieve. Accordingly, the city will develop its budget to meet these goals. For each goal, please mark whether you think the City should increase funding and services, maintain current funding and services, or decrease funding and services. Economic Opportunity – Includes good jobs; healthy business climate; attract young people and visitors. ______Increase funding and services ______Maintain current funding and services ______Decrease funding and services ______No opinion Effective Transportation – Includes new roads; maintain existing roads; public transportation; safe driving conditions; low traffic congestion. ______Increase funding and services ______Maintain current funding and services ______Decrease funding and services ______No opinion Environmental Quality – Includes clean air, water, and soil; low flood risk; effective sewage maintenance, and storm water management. ______Increase funding and services ______Maintain current funding and services ______Decrease funding and services ______No opinion Equal Access and Diversity – Includes legal protection against discrimination and harassment; appreciation, and recognition of Lincoln's growing diversity. ______Increase funding and services ______Maintain current funding and services ______Decrease funding and services ______No opinion Healthy People – Includes health care for babies, children, elderly and low income residents; promoting physical fitness; disease prevention; safe restaurants. ______Increase funding and services ______Maintain current funding and services ______Decrease funding and services ______No opinion
91

Livable Neighborhoods – Includes quality, affordable housing; access to pools, parks, and libraries. ______Increase funding and services ______Maintain current funding and services ______Decrease funding and services ______No opinion Quality of Life – Attract visitors; recreational & educational opportunity; access to parks, green space, and arts. ______Increase funding and services ______Maintain current funding and services ______Decrease funding and services ______No opinion Safety and Security – Includes low crime rate; low rate of injury and damage from fire; emergency medical services. ______Increase funding and services ______Maintain current funding and services ______Decrease funding and services ______No opinion Below is the same list of 8 long term city budgeting goals. Please rate the importance of each of these budget areas to you by ranking the budget goals from 1 to 8. Your top priority will receive a “1,” your second priority will receive a “2,” and so on. ______Economic Opportunities ______Effective Transportation ______Environmental Quality ______Equal Access and Diversity ______Healthy People ______Livable Neighborhoods ______Quality of Life ______Safety and Security In order to fund your top priority, would you recommend that the city: ______Increase taxes to spend more on your priorities ______Cut funds in your bottom priority to spend more on your top priority ______Make no change in spending ______Don’t know/No opinion ______Some other approach (please specify in the space below)
92

93
Imagine you have $100 which represents the money available for the City of Lincoln to spend on its 8 budget outcome goals. If you had to divide that $100 between the following budget outcomes, how would you divide the money? For example, if you felt that Safety and Security should receive 10% of the money, you would allocate $10 to that service. Remember that you can choose to withhold funding from any service, but you must spend all of your money. $______ Economic Opportunities $______ Effective Transportation $______ Environmental Quality $______ Equal Access and Diversity $______ Healthy People $______ Livable Neighborhoods $______ Quality of Life $______ Safety and Security
=$100 Here again are the 8 outcomes addressed by the budget, presented in alphabetical order. If the City were able to increase its budget by $20, how would you like to distribute the extra funds? Please indicate how much you want to spend in each area, totaling $20. $______ Economic Opportunities $______ Effective Transportation $______ Environmental Quality $______ Equal Access and Diversity $______ Healthy People $______ Livable Neighborhoods $______ Quality of Life $______ Safety and Security
=$20 Here again are the 8 outcomes addressed by the budget, presented in alphabetical order. If the City had to decrease its budget by $20, how much would you reduce funding to each area? Please indicate how much you would reduce in each area, totaling $20. $______ Economic Opportunities $______ Effective Transportation $______ Environmental Quality $______ Equal Access and Diversity $______ Healthy People $______ Livable Neighborhoods $______ Quality of Life $______ Safety and Security
=$20

The next two questions ask about what budget priority areas could receive funding from sources outside of Lincoln City government. For example, in most communities, including Lincoln’s, charitable contributions play an important role in funding services and activities. Business and community organizations like the Lincoln Community Foundation should focus their charitable funding on which of the following priority areas? (Please choose only one) ______Economic Opportunities ______Effective Transportation ______Environmental Quality ______Equal Access and Diversity ______Healthy People ______Livable Neighborhoods ______Quality of Life ______Safety and Security Is there a priority area not mentioned above or are there services you would like business and community charitable organizations, like the Lincoln Community Foundation, to fund?
94

Section 4 – Citizen Knowledge The city government spends the highest amount of its budget on which category of services? ______Human services and Health Department services ______Parks, recreation and libraries ______Public safety services ______Maintaining and building roads Of each dollar collected in property taxes in Lincoln, the city government receives approximately how much? ______Less than 15 percent (of each dollar) ______Between 15-24 percent (of each dollar) ______Between 25-49 percent (of each dollar) ______50 percent or more (of each dollar) What is the highest source of revenue of the city’s budget? ______Property taxes ______Income taxes ______Sales taxes ______Other sources The City of Lincoln’s annual budget is approximately how much? ______Less than $10 million ______$25-75 million ______$125-175 million ______Over $500 million The total amount of charitable funds made available to Lincoln’s public programs and services is estimated to be at what dollar level? ______Less than $10 million ______$25-75 million ______$125-175 million ______Over $500 million Which entity makes the final decision regarding the adoption of Lincoln’s City Budget? ______The Mayor ______The City Council ______The various department heads ______The governor Most localities currently utilize the ______ approach to budgeting? ______Budgeting for outcomes ______Incremental ______Provisional ______Price of Government
95

The amount of annual donations Lincoln residents give to charities is approximately: ______$5 million per year ______$50 million per year ______$150 million per year ______More than $250 million per year
How many homicides were reported in Lincoln in 2006? ______2 ______6 ______9 ______12 or more Approximately how many different languages or dialects are currently spoken in Lincoln? ______30-39 ______40-49 ______50-59 ______60 or more Section 5 – Deliberative Evaluation The following questions are about your experience in the Citizen Deliberation. For each question, please mark how valuable you thought the experience was.
Statements
Not
at A
ll
Val
uabl
e
Not
Ver
y
Val
uabl
e
Nei
ther
Som
ewha
t V
alua
ble
Ver
y V
alua
ble
Please rate your overall experience in the Citizen Deliberation. □ □ □ □ □
How valuable was the briefing document in helping you clarify your positions? □ □ □ □ □
How valuable were the group discussions in helping you clarify your positions? □ □ □ □ □
How valuable was the panel in helping you clarify your positions? □ □ □ □ □
96

Please tell us how much you agree or disagree with the following statements.
Statements
Stro
ngly
agr
ee
Agr
ee
Nei
ther
agr
ee
nor
disa
gree
Dis
agre
e
Stro
ngly
di
sagr
ee
My small group moderator provided the opportunity for everyone to express his or her opinion. □ □ □ □ □
This group was effective at evaluating the quality of its ideas. □ □ □ □ □
This group developed positive interactions among members. □ □ □ □ □
One or two people tended to dominate the communication. □ □ □ □ □
Everyone in the group had about the same amount of influence or power. □ □ □ □ □
There was an obvious leader of this group. □ □ □ □ □
As a group, we practiced democratic principles. □ □ □ □ □
Leadership in this group was shared among various people. □ □ □ □ □
I was satisfied with the quality of the group process. □ □ □ □ □
I was satisfied with the quality of the group outcome. □ □ □ □ □
I was unhappy with the other group members. □ □ □ □ □
I was satisfied with the overall quality of the group effort. □ □ □ □ □
I would be willing to work with this group again. □ □ □ □ □
97

When it comes to discussing civic issues, please indicate how strongly you agree or disagree with these statements.
Statements
Stro
ngly
ag
ree
Agr
ee
Nei
ther
ag
ree
nor
disa
gree
Dis
agre
e
Stro
ngly
di
sagr
ee
Discussion should focus on ways to maintain or restore traditions from the past. □ □ □ □ □
Discussion should focus on how to accommodate changes that are happening now, in the present. □ □ □ □ □
Discussion should focus on finding new ways of doing things to replace the old. □ □ □ □ □
It is worthwhile for citizens to participate in small group discussions about public issues, even if the discussions don't lead to any action being taken by policy makers.
□ □ □ □ □
It is worthwhile to participate in small group discussions about immigration, even if the discussions don't lead to any action being taken by policy makers.
□ □ □ □ □
On a scale from 1 to 10, with 1 meaning not important at all, and 10 meaning extremely important, please indicate how important each of these values are to you when it comes to participating in group discussions about important topics. Equal opportunity – All discussion participants should have equal time to state their opinions. (Not important at all) 1 . . 2 . . 3 . . 4 . . 5 . . 6 . . 7 . . 8 . . 9 . . 10 (Extremely important) Preference to the most informed – Discussion participants who know more about the topic should have greater time to state their opinions than those who do not. (Not important at all) 1 . . 2 . . 3 . . 4 . . 5 . . 6 . . 7 . . 8 . . 9 . . 10 (Extremely important) Enfranchisement – Focus should be placed on involving and listening to discussion participants from disenfranchised backgrounds (example: women, minorities). (Not important at all) 1 . . 2 . . 3 . . 4 . . 5 . . 6 . . 7 . . 8 . . 9 . . 10 (Extremely important) Diversity of opinion – Discussions should have the widest possible range of opinions. (Not important at all) 1 . . 2 . . 3 . . 4 . . 5 . . 6 . . 7 . . 8 . . 9 . . 10 (Extremely important)
98

Consensus – The best group decision is the one all discussion participants can agree on, even if it means everyone compromises their position. (Not important at all) 1 . . 2 . . 3 . . 4 . . 5 . . 6 . . 7 . . 8 . . 9 . . 10 (Extremely important) Majority rules – The best group decision is the one the numerical majority wants. (Not important at all) 1 . . 2 . . 3 . . 4 . . 5 . . 6 . . 7 . . 8 . . 9 . . 10 (Extremely important) Most public policy issues are so complicated that a person like me can't really understand what's going on.
□ Strongly Disagree
□ Disagree
□ Neither agree nor disagree
□ Agree
□ Strongly Agree Please respond yes or no to the following questions by circling your answer in the table below.
Yes or No Yes No
Did you vote in the presidential election of 2004? Yes No Did you vote in the congressional election of 2006? Yes No In the last year did you place a political yard sign in your lawn? Yes No Prior to the last year, have you ever placed a political yard sign in your lawn? Yes No In the last year have you attended a political party meeting or event? Yes No Prior to the last year, have you ever attended a political party meeting or event? Yes No
99

Please indicate how often you have done the following activities in the last year using the scale below.
Activities
Muc
h le
ss
than
usu
al
Les
s tha
n us
ual
Abo
ut a
s m
uch
as
usua
l
Mor
e th
an
usua
l
Muc
h m
ore
than
us
ual
Paid attention to TV, radio or newspaper stories about political issues. □ □ □ □ □
Talked with family, friends or co-workers about political issues. □ □ □ □ □
Searched for information about political issues on the web or in a library. □ □ □ □ □
Initiated contact with an elected official on the state or local level (a governor, mayor or member of a city, town or school council) or someone on the staff of such an elected official.
□ □ □ □ □
Attended a meeting of any official local governmental board that deals with community problems and issues (town council, school board or the like).
□ □ □ □ □
Gone to a meeting of a voluntary civic (non-religious) group. □ □ □ □ □
Gotten together informally with or worked with others in your community or neighborhood to try to deal with some community issue or problem.
□ □ □ □ □
THANK YOU! You have completed our survey. Please be sure to turn this completed survey in along with your clicker in order to receive your $75 compensation.
100
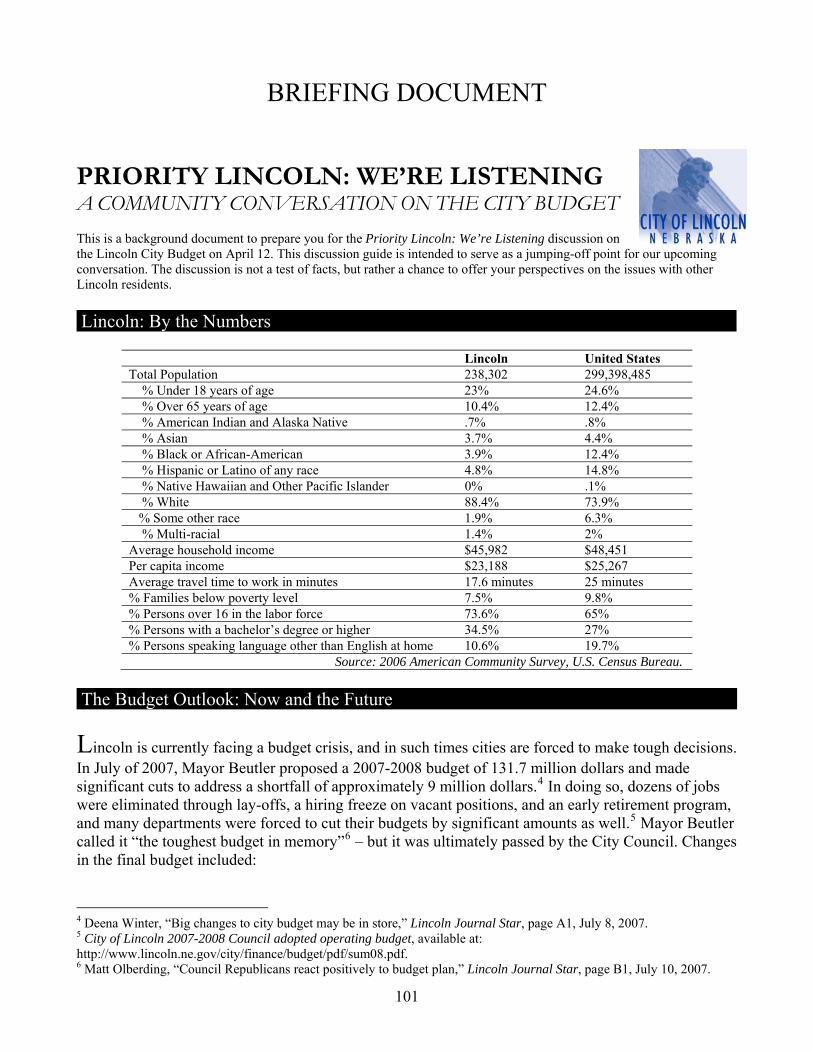
BRIEFING DOCUMENT
PRIORITY LINCOLN: WE’RE LISTENING A COMMUNITY CONVERSATION ON THE CITY BUDGET This is a background document to prepare you for the Priority Lincoln: We’re Listening discussion on the Lincoln City Budget on April 12. This discussion guide is intended to serve as a jumping-off point for our upcoming conversation. The discussion is not a test of facts, but rather a chance to offer your perspectives on the issues with other Lincoln residents.
Lincoln: By the Numbers……………………………… ………………… ….
Lincoln United States Total Population 238,302 299,398,485 % Under 18 years of age 23% 24.6% % Over 65 years of age 10.4% 12.4% % American Indian and Alaska Native .7% .8% % Asian 3.7% 4.4% % Black or African-American 3.9% 12.4% % Hispanic or Latino of any race 4.8% 14.8% % Native Hawaiian and Other Pacific Islander 0% .1% % White 88.4% 73.9% % Some other race 1.9% 6.3% % Multi-racial 1.4% 2% Average household income $45,982 $48,451 Per capita income $23,188 $25,267 Average travel time to work in minutes 17.6 minutes 25 minutes % Families below poverty level 7.5% 9.8% % Persons over 16 in the labor force 73.6% 65% % Persons with a bachelor’s degree or higher 34.5% 27% % Persons speaking language other than English at home 10.6% 19.7% Source: 2006 American Community Survey, U.S. Census Bureau.
The Budget Outlook: Now and the Future …………………… … …….
Lincoln is currently facing a budget crisis, and in such times cities are forced to make tough decisions. In July of 2007, Mayor Beutler proposed a 2007-2008 budget of 131.7 million dollars and made significant cuts to address a shortfall of approximately 9 million dollars.4 In doing so, dozens of jobs were eliminated through lay-offs, a hiring freeze on vacant positions, and an early retirement program, and many departments were forced to cut their budgets by significant amounts as well.5 Mayor Beutler called it “the toughest budget in memory”6 – but it was ultimately passed by the City Council. Changes in the final budget included:
4 Deena Winter, “Big changes to city budget may be in store,” Lincoln Journal Star, page A1, July 8, 2007. 5 City of Lincoln 2007-2008 Council adopted operating budget, available at: http://www.lincoln.ne.gov/city/finance/budget/pdf/sum08.pdf. 6 Matt Olberding, “Council Republicans react positively to budget plan,” Lincoln Journal Star, page B1, July 10, 2007.
101

• Mayor’s Department: The Council eliminated the Women’s Commission and Affirmative Action Commission.
• Area Agency on Aging: Eliminated the Calvert ActivAge Center, reduced Belmont Center hours, and eliminated special events, trips, and tour programs.
• Parks and Recreation Department: Closed 3 park restrooms, 1 pool, and 14 youth sports and recreation programs, and increased user fees for recreation and sports.
• Lincoln Public Libraries: Eliminated nearly 5 library positions, reduced hours for the Polley Music Library and increased library book fines.
• Public Works/Utilities Department: Eliminated 6 engineering positions and increased residents’ fees for water and wastewater services.
• Health Department: Reduced dental services by 530 patient visits and increased animal control and environmental health service fees.
• Fire and Rescue: Required $350,000 in discretionary budget cuts. • Police Department: Eliminated 6 positions. • Urban Development Department: Eliminated 2 positions and delayed neighborhood
improvement projects.
2007- 08 Property Tax Levy Allocation
Lancaster County14%
All Other Taxing Entities
9%City of Lincoln
14%
Lincoln Public Schools
63%
The City of Lincoln only receives 14% of every dollar collected in property taxes.
What is the cause of Lincoln’s budgetary woes? Currently, the largest source of projected City funding comes from sales taxes (42%), followed by property taxes (31%). The remaining sources of revenue come from occupation and motor vehicle taxes, and various user fees and permits.7 However, the revenue increases from sales taxes have not been as high as they were in previous years. In the 1990s, the City’s sales tax growth was very healthy. Pursuant to a request by Mayor Beutler, the State Department of Revenue examined why sales tax revenue from the 1990s had leveled off. According to their analysis, the high amount of revenue collected from sales taxes in the 1990s was explained by the expansion of retail opportunities in Lincoln during that decade, such as the North 27th Wal-Mart Supercenter, and the SouthPointe Pavilions shopping center. The Department of Revenue analysis suggested that retail growth in Lincoln may have reached a plateau – along with the growth rate of the City’s sales tax revenue. For example, motor vehicle sales taxes declined every year between 2004 and 2006. Additionally, personal income in Lincoln does not grow as fast as it does in other parts of the nation, further constraining sales tax revenue.8 With this leveling off of sales tax revenue, the City’s overall revenue intake has suffered.
What about property taxes? With the exception of voter approved bond issues, the property tax rate in Lincoln has actually decreased since 1993-94. The City receives only 14% of each property tax dollar, with the majority (63%) going to support Lincoln Public Schools.9 Some commentators have suggested that raising property taxes is a politically unfeasible move for any mayor of Lincoln. Yet
7 Mayor Chris Beutler, 2007-2008 Mayor’s recommended City of Lincoln annual operating budget, available at: http://www.lincoln.ne.gov/city/mayor/pdf/budget_07_08.pdf. 8 Deena Winter, “The falling growth rate for city’s sales tax has the Mayor asking why,” Lincoln Journal Star, page A1, January 8, 2008. 9 Mayor Chris Beutler, 2007-2008 Mayor’s recommended City of Lincoln annual operating budget, available at: http://www.lincoln.ne.gov/city/mayor/pdf/budget_07_08.pdf.
102

with sales tax revenue not keeping pace with the increasing costs for services, the City is caught in a bind.
How is the City budget currently allocated among services? Public safety services receive the most funding in the City budget, with the police department receiving the most support, followed by fire and rescue. Parks and recreation, and the public library system follow. All of the City’s service areas have been cut this year, and likely face further reductions. Yet remarkably, Lincoln continues to provide high quality services to its increasing number of residents. For example, even though Lincoln has the smallest number of police officers per capita in Nebraska, its violent crime rate remains at a level below that of other similar sized communities in the nation.10 In the face of continued growth, increasing demands on services, yet limited financial resources, how should Lincoln prioritize its budgetary goals? Budgeting for Outcomes …………………… … …….
Tax Dollars by Department
Personnel1%
City Council0%
Urban Development1%
Mayor's Department1%
Planning2%
911 Center2% Finance
2%
Aging2%
Law2%
Building and Safety1% Public Works and
Utilities4%
Health5%
Star Tran6%
Library8%Parks and Recreation
12%
Fire20%
Police31%
The majority of tax dollars collected by the city funds public safety services.
In Lincoln, as in most other cities, the budget is developed each year when the Mayor proposes a budget and the City Council approves it. Typically, the task begins each year when the Mayor asks each city government department to submit a request based on its needs. Most of the time, each department will base its funding requests on how much money it was given in the previous year, and will adjust that figure as it predicts how much money it will need in the upcoming year. This is known as “incremental” budgeting, since the budget changes incrementally from year to year.11 Once the Mayor receives all of the budget requests from each department, he or she meets with the departments
and members of the City Council.
The Mayor then uses discretion to determine how much money to allocate to each department. After the entire proposed budget is ready, it is forwarded to the City Council, which can accept or reject the proposal, or request changes it feels are necessary. Once the Mayor and City Council work out any differences, and after public hearings regarding the budget have been held, the final budget is voted upon by the City Council.
A number of observers have criticized this type of budgeting approach because it can allow the process to be driven largely by political considerations, as government officials avoid making tough decisions
10 Mayor Chris Beutler, 2007-2008 Mayor’s recommended City of Lincoln annual operating budget, available at: http://www.lincoln.ne.gov/city/mayor/pdf/budget_07_08.pdf. 11 William D. Berry, “The confusing case of budgetary incrementalism: Too many meanings for a single concept,” Journal of Politics, 52: pages 167-196, 1990.
103

out of fear of angering certain interests.12 Furthermore, with incremental budgeting municipalities can use accounting gimmicks to make it look as though the city is in fine financial shape. In such cases the budget problem is simply put off to deal with in the future, but the budget problem may be compounded if economic conditions worsen.
As a result, some observers have proposed the “Budgeting for Outcomes” approach that is not based simply upon “incremental” methods, but instead relies upon citizen input and the identification of essential community needs. Through this approach, governments rely partly upon citizen input to determine the city’s budget priorities. Once those priorities are determined, the city develops strategies to meet them, and develops measures to help determine whether they are being adequately addressed.
While the “Budgeting for Outcomes” approach is relatively new, it has been utilized with great success in the State of Washington, which faced a serious budget crisis and economic downturn about five years ago.13 Although Washington was not able to avoid tough decisions such as layoffs and reductions in government services, their budgeting for outcomes process allowed the state to take a long-term approach rather than simply trying to rely upon “quick fixes” to deal with its deficit. Evethough Washington did make drastic changes in its operating budget, its outcomes-based process was viewed favorably by residents, government officials, and members of the media because of its innovative
n
approach.
Just like the State of Washington, the City of Lincoln will be forced to make the tough decisions that come with determining a budget, even though it is using the Budgeting for Outcomes method. In this time of economic stress, the City of Lincoln, along with many other governments, will be forced to make decisions that will make some citizens unhappy. But by using this process, the Mayor hopes to provide a new direction to the City’s budget process by allowing citizens to provide input and help make decisions about the future of Lincoln.
The Bess Dodson Walt Branch Library. Credit: Nebraska Library Commission.
Lincoln: City Government 101 …………………… … ………………… . Lincoln’s City Government is comprised of thirteen departments, excluding the City Council. Each of the departments is listed below, along with a description of the work that each does: Building and Safety Department The Building and Safety Department ensures that the health, fire, and housing safety needs of the public are maintained through adherence to those requirements established by law in the construction or use of every building in the community.14 In order to meet this responsibility, the Building and
12 David Osborne & Peter Hutchinson, The price of government: Getting the results we need in an age of permanent fiscal crisis, New York: Basic Books, 2004. 13 “Government performance project: State reports,” Governing Magazine, February 2005, available at: http://www.governing.com/archive/2005/feb/gp5state.txt. 14 City of Lincoln, Building and Safety Department, Mission Statement, available at: http://www.lincoln.ne.gov/city/build/mission.htm.
104

Safety Department issues permits to individuals and businesses interested in constructing new buildings, and is involved in the inspection of buildings to make sure that each is in compliance with the City’s regulations.15 City Attorney The City Attorney’s Office provides legal advice to the Mayor, City Council, departments, committees, and commissions. The office also initiates and defends legal actions on behalf of the City, which may include appeals of City actions, labor relations, condemnations, civil rights, and contract disputes.16 The City Attorney’s Office also prosecutes misdemeanor offenses such as traffic and motor vehicle violations, general peace and moral offenses, and building code and health violations. The office also researches, drafts, and reviews contracts, ordinances, resolutions, deeds, executive orders, certificates of insurance, and various applications and permits.17 Finance Department
Government and education drive much of Lincoln’s economy. Credit: Rob Evans.
The Finance Department is primarily a service provider to the other departments within the City and County governments and to citizens. The department is responsible for the appropriation, collection, investment, and disbursement of City funds. The department also assists the Mayor in the development of the annual budget, and preparation of all City bond issues and audit reports. Divisions in the
department are: City Treasurer, Budget, Purchasing, Auditing and Accounting, City Clerk, Communications, and Information Services.18 Fire Department Lincoln Fire and Rescue service is a multi-discipline organization. The goals of the Fire and Rescue Department are to proactively facilitate community risk reduction to lives and property, to provide basic and advanced life support emergency medical services, to raise public awareness of fire prevention and public safety, to provide competent special operations, to develop and orchestrate programs in the reduction of fire losses through suppression and inspections, and to seek compliance with modern fire codes. Health Department The Lincoln-Lancaster County Health Department is responsible for assessing the health of the community and assuring that systems are in place to address health problems. Among its many goals are to decrease environmental risk factors and behaviors that adversely affect personal health and environmental quality, diminish
15 City of Lincoln, Building and Safety Department, Frequently Asked Questions, available at: http://www.lincoln.ne.gov/city/build/faq.htm. 16 City of Lincoln, City Attorney’s Office, Mission Statement, available at: http://www.lincoln.ne.gov/city/attorn/mission.htm. 17 City of Lincoln, City Attorney’s Office, Frequently Asked Questions, available at: http://www.lincoln.ne.gov/city/attorn/faq.htm. 18 City of Lincoln, Finance Department, Frequently Asked Questions, available at: http://www.lincoln.ne.gov/city/finance/faq.htm.
105

chronic disease complications by increasing access to care and early intervention, integrate substance abuse and mental health services into public health, and reduce the incidence of preventable injury, death, and disease.19 It maintains an extensive child vaccination program, environmental health program, and restaurant inspection system. Lincoln City Libraries Lincoln City Libraries provide services at 8 facilities throughout the City and at 27 bookmobile sites throughout Lincoln and Lancaster County, with 1,891,572 visits last year. Materials for informational and recreational needs are available via print, E-book, downloadable audio, DVD, CD and electronic databases. Reading and discussion programs are available for youth and adult customers. Storytimes are held for preschoolers, elementary age children, and families. Public internet computers are available at all locations as well as wireless internet access. Collections, equipment, and study space are available for English Language Learners. Resources include 796,000 books, 12,500 E-books, 56,000 audio recordings, 19,000 videocassettes, 23,000 DVDs, 1,800 magazine subscriptions, 41 electronic databases, and 570 downloadable audio books. Mayor’s Department Within the Mayor’s Department are a number of administrative entities and commissions of varied scope and areas of focus. Among them include:
The Sunken Gardens is one of Lincoln’s many parks. Credit: Joshua Wiltshire.
● The Lincoln Area Agency on Aging, which serves Lancaster and seven adjacent counties. The agency’s mission is to ensure that persons over age 60 have access to services that help them stay independent and in their homes. It serves 26% of the people who are 60 and older living in Lancaster County. It provides congregate meals at 8 sites in Lincoln and Lancaster County, home delivered meals, caregiver assistance, financial counseling, nutrition counseling, healthy living programs, transportation, social work services, case management, job placement assistance, volunteer service placement opportunities, and more. ● The Human Rights Commission, which receives, settles, and investigates complaints alleging discrimination based on race, color, religion, sex, disability, national origin, familial status, age, ancestry, marital status, and retaliation. The Commission works with public and private entities to promote understanding between races, cultures, and sexes, and eliminate inequalities and sources of inter-racial friction.
Parks and Recreation Department The mission of the Lincoln Parks and Recreation Department is to enhance the quality of life in Lincoln by providing and maintaining quality parks and green spaces, and by offering enriching
19 Lincoln/Lancaster County, Health Department, Mission, Vision, and Goals, available at http://www.lincoln.ne.gov/city/health/mission.htm.
106

recreation activities and facilities for all people in Lincoln.20 The Department is responsible for administering and maintaining all City parks and approving the planting, maintenance, and removal of City street and park trees. Responsible facilities include recreation centers, golf courses, swimming pools, play fields, an observatory, indoor rifle range, recreational trails, wildlife center, and day camps. Personnel Department The Personnel Department provides support to all City and County Departments. The Department is responsible for applicant recruitment, testing, and selection in accordance with sound merit principles. The Department coordinates employee training, conducts salary surveys, performs classification studies, and recommends compensation. The Department is also responsible for labor relations, maintaining employee records, and administering all insurance and benefit programs.21
Planning Department
A bike trail in the vicinity of Van Dorn and 20th. Credit: Michael Cornelius.
The Planning Department provides technical information and advice to elected and appointed boards and citizens on the use of land for private and public purposes, and generates maps and information about the community. The Department is responsible for developing and maintaining the Comprehensive Plan for Lincoln and Lancaster County, preparing Lincoln's Capital Improvement Program, maintaining zoning and subdivision regulations, and processing hundreds of development applications that involve those regulations each year.22
Police Department The goals of the Police Department, among others, are to ensure that all persons may pursue lawful activities without fear or impediment by maintaining order; to reduce the impact of crime, fear of crime, and public disorder on the daily lives of Lincoln residents through, patrol, crime prevention, criminal investigation, and law enforcement; and protect safe and orderly transportation through traffic direction, law enforcement, and accident investigation.23 Public Works and Utilities The purpose of the Department of Public Works/Utilities is to serve community growth, well-being, and economic success. Working together to provide quality services to the community, the Department finances, designs, constructs, operates, and maintains: municipal water, waste disposal, drainage, and transportation systems.24 The Department is also in charge of StarTran, which provides city-wide transportation to residents of Lincoln.
20 City of Lincoln, Parks & Recreation Department, Mission Statement, available at: http://www.lincoln.ne.gov/city/parks/faq.htm. 21 City of Lincoln & Lancaster County, Personnel Department, Mission Statement, available at: http://www.lincoln.ne.gov/city/person/mission.htm. 22 City of Lincoln, Planning Department, Frequently Asked Questions, available at: http://www.lincoln.ne.gov/city/plan/faq.htm. 23 City of Lincoln, Police Department, Missions and Goals, available at: http://www.lincoln.ne.gov/city/police/mission.htm. 24 City of Lincoln, Public Works and Utilities Department, Mission Statement, available at: http://www.lincoln.ne.gov/city/pworks/mission.htm.
107

Urban Development Department The primary objective of the Urban Development Department is to improve the quality of life for Lincoln’s citizens by maintaining and enhancing Lincoln’s built environment, supporting neighborhoods and business districts, and creating economic opportunity. Through its mandate for federal funding, the department strives to provide decent housing, a suitable living environment, and expanded economic opportunities for low and moderate income persons. The One Stop Career Center assisted 7,200 people who found jobs in 2007. The Parking Division is responsible for 8,585 parking spaces in garages, lots, and street parking, along with meter enforcement. Community Development is responsible for implementing the Downtown Master Plan and neighborhood redevelopment projects and plans. What Should Lincoln’s Budget Priorities Be? …………… ……… … ……. When it comes to setting priorities for Lincoln’s budget, what are the major issues at stake?
Numerous recreational and sporting opportunities exist in Lincoln. Credit: Rob Evans.
Economic Opportunities: As the state capitol and home of the University of Nebraska’s flagship campus, Lincoln’s economy centers around education and government, followed by health care. The City’s largest employer is Lincoln Public Schools, followed by the State of Nebraska, the University of Nebraska-Lincoln, BryanLGH, and Saint Elizabeth Health Systems.25 Lincoln has a well-educated workforce, with 34% of adults over 25 having a bachelor’s degree or higher, compared to a national average of 27%.26 The debate is open about growing Lincoln’s economy. Some residents favor making wide-ranging investments to maintain the City’s current businesses and attract new ones, such as revamping the City’s existing infrastructure and expanding it to encompass new growth, and revitalizing the downtown and Haymarket areas with greater recreational, retail, and housing options. Others ask how such projects would be financed, and argue that the financial costs of such wide-scale investments will increase Lincolnites’ tax burden. Effective Transportation: Lincoln’s continuing growth has increased traffic congestion throughout the City. Without a major highway running through Lincoln, and the lack of a completed beltway, interior roads shoulder nearly the entire strain of Lincoln’s cars and trucks. The Antelope Valley Project – an ongoing multi-year development project to alleviate floodplain concerns, revitalize core areas of Lincoln, and provide new research infrastructure for UNL – is designed to alleviate some of the traffic congestion affecting the City’s center. However, during rush hour it is still common for traffic to back-up on major arterials. According to traffic count data, close to 40,000 vehicles traverse O Street near the intersection with 27th each day.27 Despite these challenges, the average commute
25 Lincoln Partnership for Economic Development, 2007 Directory of Largest Employers, available at: http://www.lincolnecdev.com/Upload/pdf/largestEmpDirec.pdf. 26 Lincoln Partnership for Economic Development, Economic and demographic profile, July 2007, page 5, available at: http://www.lincolnecdev.com/Upload/pdf/Exectivebriefing.pdf. 27 City of Lincoln, Public Works Department, Traffic Operations Section, 2006 Estimated 24 hour traffic volumes, available at: http://www.lincoln.ne.gov/city/pworks/engine/trafsaf/adtv/pdf/map/city2006.pdf.
108

time for Lincoln’s workers is well under the national average. Besides concerns over traffic congestion and wear and tear on interior roads, rehabilitating old roads and expanding new ones have long-term growth implications. Sound traffic management and solid infrastructure can enhance Lincoln’s commercial potential and help draw new businesses to the City. Environmental Quality: Lancaster County is fortunate to have thousands of acres of native prairie, saline wetlands, and natural stream corridors which surround Lincoln – contributing to the City’s overall pleasant, plains-state environment. Lincoln enjoys very good environmental quality for a city its size.28 For example, air quality in Lincoln – measured by ozone levels, particulate matter, and carbon monoxide levels – are significantly lower than U.S. Environmental Protection Agency standards, and Lincoln has not experienced a violation of federal standards for a decade.29 Although many environmental standards are regulated at the federal level, the City-County Health Department plays a large role in protecting public health and the environment from risks such as contamination of ground and surface water, toxic emissions to the air, improper disposal of waste, and spills of hazardous material. Overall environmental quality and safety is critical to the well-being of Lincolnites, and makes it a pleasant city in which to live and work.
The Historical Haymarket is a hub for fine dining and antique shopping in Lincoln. Credit: Craig Kohtz.
Equal Access and Diversity: Lincoln is fast becoming a diverse community. Presently, 58 different languages and dialects are spoken in Lincoln.30 According to Census Bureau estimates, between 2000 and 2006 the numbers of racial and ethnic minorities in Lancaster County increased by 31% for
African-Americans, 26% for Asians, and 40% for Hispanics/Latinos, whereas for Whites the growth rate was 6% in that same period.31 However, complaints of discrimination have also increased. According to the City of Lincoln Commission on Human Rights – which investigates complaints of employment, housing, and public accommodations discrimination – there has been a general trend in Lincoln of increasing numbers of complaints over the past ten years. In 1997, there were 67 complaints of discrimination filed with the Human Rights Commission, and 113 filed in 2007.32 Ensuring that Lincoln is a vibrant, welcoming city for people of all backgrounds is important to its residents and business community.
Healthy People: Lincoln faces many of the same health challenges that communities across the country do. In 2005, the single leading cause of death in Lancaster County was cancer, followed by heart disease.33 Chronic diseases associated with old age and unhealthy behavior such as smoking and
28 Lincoln City – Lancaster County, Comprehensive Plan 2025, appendix page E-32, available at: http://www.lincoln.ne.gov/city/plan/complan/2025/ex_envir.pdf. 29 Personal Communication from Scott Holmes, Director, Environmental Health, Lincoln-Lancaster County Health Department. 30 Bruce Dart, Lincoln-Lancaster County Health Department. Power Point presentation. 31 Lincoln-Lancaster County Health Department, Estimated population from the American Community Survey (ACS), Lancaster County, 2006 and Change Since 2000. 32 City of Lincoln, Commission on Human Rights, 2007 Annual Report 2007, page 10, available at: http://www.lincoln.ne.gov/city/mayor/human/pdf/annual07.pdf. 33 Lincoln-Lancaster County Health Department, Leading causes of death, Lancaster County 2005.
109
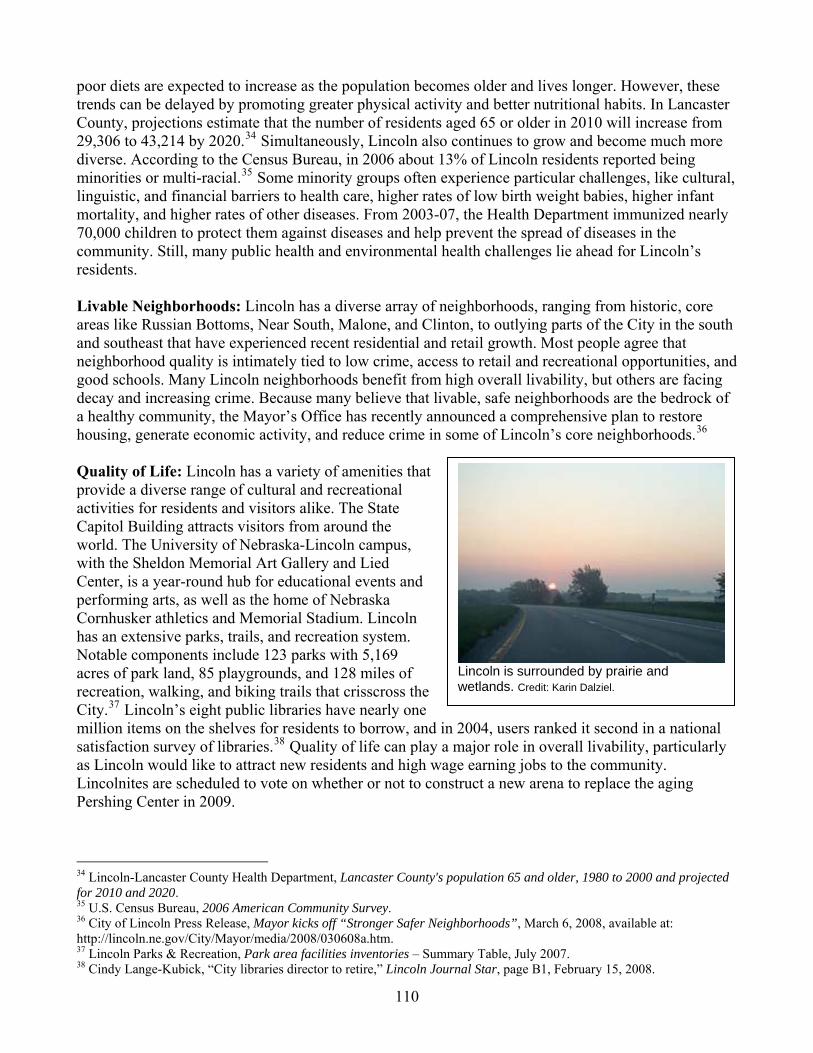
poor diets are expected to increase as the population becomes older and lives longer. However, these trends can be delayed by promoting greater physical activity and better nutritional habits. In Lancaster County, projections estimate that the number of residents aged 65 or older in 2010 will increase from 29,306 to 43,214 by 2020.34 Simultaneously, Lincoln also continues to grow and become much more diverse. According to the Census Bureau, in 2006 about 13% of Lincoln residents reported being minorities or multi-racial.35 Some minority groups often experience particular challenges, like cultural, linguistic, and financial barriers to health care, higher rates of low birth weight babies, higher infant mortality, and higher rates of other diseases. From 2003-07, the Health Department immunized nearly 70,000 children to protect them against diseases and help prevent the spread of diseases in the community. Still, many public health and environmental health challenges lie ahead for Lincoln’s residents. Livable Neighborhoods: Lincoln has a diverse array of neighborhoods, ranging from historic, core areas like Russian Bottoms, Near South, Malone, and Clinton, to outlying parts of the City in the south and southeast that have experienced recent residential and retail growth. Most people agree that neighborhood quality is intimately tied to low crime, access to retail and recreational opportunities, and good schools. Many Lincoln neighborhoods benefit from high overall livability, but others are facing decay and increasing crime. Because many believe that livable, safe neighborhoods are the bedrock of a healthy community, the Mayor’s Office has recently announced a comprehensive plan to restore housing, generate economic activity, and reduce crime in some of Lincoln’s core neighborhoods.36
Lincoln is surrounded by prairie and wetlands. Credit: Karin Dalziel.
Quality of Life: Lincoln has a variety of amenities that provide a diverse range of cultural and recreational activities for residents and visitors alike. The State Capitol Building attracts visitors from around the world. The University of Nebraska-Lincoln campus, with the Sheldon Memorial Art Gallery and Lied Center, is a year-round hub for educational events and performing arts, as well as the home of Nebraska Cornhusker athletics and Memorial Stadium. Lincoln has an extensive parks, trails, and recreation system. Notable components include 123 parks with 5,169 acres of park land, 85 playgrounds, and 128 miles of recreation, walking, and biking trails that crisscross the City.37 Lincoln’s eight public libraries have nearly one million items on the shelves for residents to borrow, and in 2004, users ranked it second in a national satisfaction survey of libraries.38 Quality of life can play a major role in overall livability, particularly as Lincoln would like to attract new residents and high wage earning jobs to the community. Lincolnites are scheduled to vote on whether or not to construct a new arena to replace the aging Pershing Center in 2009.
34 Lincoln-Lancaster County Health Department, Lancaster County's population 65 and older, 1980 to 2000 and projected for 2010 and 2020. 35 U.S. Census Bureau, 2006 American Community Survey. 36 City of Lincoln Press Release, Mayor kicks off “Stronger Safer Neighborhoods”, March 6, 2008, available at: http://lincoln.ne.gov/City/Mayor/media/2008/030608a.htm. 37 Lincoln Parks & Recreation, Park area facilities inventories – Summary Table, July 2007. 38 Cindy Lange-Kubick, “City libraries director to retire,” Lincoln Journal Star, page B1, February 15, 2008.
110

111
Safety and Security: Compared to cities the same size, Lincoln has a relatively low overall crime rate. According to FBI statistics, in 2006 there were 5 reported homicides in Lincoln, 162 robberies, and 989 aggravated assaults. For cities the same size that reported crime data to the FBI that year, the national average number of homicides was 12.4, robberies 530.8, and aggravated assaults 832.4.39 Despite continuing population growth, overall crime rates in Lincoln decreased 4% from 2005 to 2006.40 Many residents of Lincoln celebrate the “small town” feel of the City when it comes to crime and safety. Others point out that Lincoln must remain vigilant on public safety issues, particularly in core neighborhoods near the center of town. A Role for Philanthropy? … ………………… … ……. Government is certainly not the only provider of basic services in Lincoln. In the future there may be increasing opportunities for coordination between the City and the Lincoln philanthropic community through public/private partnerships. Lincoln benefits from its numerous non-profit organizations, religious groups, and volunteers who serve the community in many needed ways. Whether its helping to feed or house the most vulnerable, clean and restore the natural environment, support the arts, or expand recreation, Lincoln’s charitable community plays a vibrant role in many aspects of the City’s life. Lincolnites themselves tend to be quite generous. Annually, residents of the City donate an estimated $150 million to foundations, religious entities, social welfare groups, and the arts and humanities across the country. Local businesses add to that amount. In fact, philanthropy is a significant driver of the national economy. 2006 was the highest year recorded for charitable giving, with nearly $295 billion in donations provided throughout the country.41 Local non-profit agencies and faith organizations play a significant role in strategically serving Lincoln in addition to the services provided to the City. In a survey of nonprofit organizations conducted by the Lincoln Community Foundation, one priority identified was to promote responsible community-wide philanthropy. 42 Other objectives that emerged were fostering community collaboration and being an effective convener. Tax dollars will continue to support the framework for a city, but private dollars can provide the margin of difference to determine what a city becomes. The University of Nebraska Foundation is a model demonstrating the effectiveness of coordinated fundraising. Founded in 1936, the Foundation now directs over $100 million dollars annually to the university, a tax supported institution. As the City and the nonprofit sector work together to understand the overall priorities of the community, the coordination of these efforts may set a platform to discuss the role of philanthropy in relation to tax and City-supported efforts. A more focused and coordinated fundraising effort may result in a greater overall impact to strengthen and improve Lincoln.
39 Federal Bureau of Investigations, 2006 Crime in the United States, Table 8: Offenses known to law enforcement, available at: http://www.fbi.gov/ucr/cius2006/data/table_08.html. Four other communities with populations ranging from 239,000 to 249,000 reported crime data to the FBI that year: Chandler, AZ; Glendale, AZ; Henderson, NV; and Jersey City, NJ. 40 Lincoln Police Department, 2006 Annual Report, page 44, available at: http://www.lincoln.ne.gov/city/police/annual/06annual.pdf. 41 National Philanthropic Trust, Philanthropy statistics, available at: http://www.nptrust.org/philanthropy/philanthropy_stats.asp. 42 Personal Communication from Jessica Phillips, Assistant Director, Donor Relations and Marketing Lincoln Community Foundation.

An equal opportunity employer with a comprehensive plan for diversity.
112

APPENDIX C:
NON-RANDOM SURVEY
113

Key Findings of Non-Random Online Survey
Survey respondents place greater importance on Maintenance and Management of Traffic Flow and Effective Transportation than participants in the other public participation inputs.
Survey respondents agree with the other participants that Safety and Security
and Economic Opportunity are the highest priorities for the City.
Survey respondents are less positive in their opinions about City government and City leadership
Survey respondents are more knowledgeable about the City’s budgetary and
financial situations. However, unlike participants from the other public input techniques, survey respondents had access to information which may have assisted in searching for the correct answer to the knowledge questions.
114

1. Introduction In conjunction with the Lincoln Mayor’s Office, the Lincoln Journal Star and Leadership Lincoln, the Public Policy Center conducted a survey, accessible online and in paper copy, to supplement the other four public input techniques used in Priority Lincoln. From March, 2008, to May, 2008, the survey, hosted by Qualtrics Survey Software, was available to Lincolnites to complete. Access to the survey was made through the following websites: Mayor’s Office, Lincoln Journal Star, and Public Policy Center. Also, paper versions of the survey were made available to Lincolnites at various library branches throughout the City and from City departments. The surveys also were available to print off from the Mayor’s Office and Public Policy Center websites. Completed surveys were dropped off at any library, or mailed or dropped off at the Public Policy Center. All paper surveys that were received from the libraries were entered by Public Policy Center staff online into the Qualtrics database. An online survey is a modern method with which to measure public attitudes toward particular issues. The internet allows for wide access to surveys and large numbers of individuals are able to respond, given that he or she has internet access available. However, online surveys have a number of weaknesses. First, the fact that the survey is online limits the ability of those who have no internet availability to take the survey. Second, it is possible for individuals to take the survey multiple times, thus biasing the results. Third, it is also possible for groups within the City to coordinate efforts in an attempt to skew results one way or another. Finally, because of the nature of the survey, it is possible for those who reside outside of Lincoln to take the survey. These factors, among others, led us to describe the surveys, whether online or completed as paper versions, as “non-random” or “non-scientific.” There are numerous other methodological concerns with non-random surveys, but for the purposes of this report, the discussion will be limited to the weaknesses described above. While these weaknesses are recognized, the Public Policy Center and the Mayor’s Office decided to collect the online survey data in order to better capture the spending priorities of Lincolnites. The results of the online survey add to the knowledge base established by the phone survey, the deliberative discussion, the town hall meetings and the focus group. The online surveys also allow for even greater participation opportunities for public input into budget decisions; well over 1,000 survey responses were collected. 2. Results: Service Priorities Much like respondents in other public input areas, respondents to the non-scientific survey indicated that Police services and Fire and Ambulance services are the top two City service priorities (see Table C.1). Maintenance and Management of Traffic Flow was the third most highly rated service in the survey, marking a departure from the
115

phone survey. Job Creation and Economic development again was rated fairly highly among the survey respondents. Table C.1 “Below are 12 services the City of Lincoln provides to the community. They are not listed in order of importance or priority, rather they are in random order. Please rank your preferences for what should receive the most support in the budget, what should receive the second most support, third most and so on until you have all 12 services ranked in the order you think they should be funded.” City Service Mean Score Rank n Police 3.21 1 1749 Fire and Ambulance services 3.72 2 1749 Maintenance and Management of Traffic Flow 4.95 3 1749 Job Creation and Economic Development 5.68 4 1749 Health Department services 6.66 5 1749 Management of Sewage and Storm Water 6.99 6 1749 Human services 7.06 7 1749 Zoning and Growth Planning 7.45 8 1749 Parks, Trails and Recreation 7.58 9 1749 Public Bus and Transportation services 8.07 10 1749 Libraries 8.09 11 1749 Building Permits and Safety 8.55 12 1749 3. Results: Budget Outcomes Respondents were asked to imagine that they had $100 that represents Lincoln’s annual budget. Respondents were asked to distribute that $100 among the City’s eight budget outcomes, according to the importance that each respondent places on each budget outcome. The results show that, again, Lincolnites value Safety and Security the highest (see Table C.2). Survey respondents also broke from other respondents by placing greater value on Effective Transportation than respondents to the other inputs. Economic Opportunity was also valued highly.
116

Table C.2 “Imagine you have $100 which represents the money available for the City of Lincoln to spend on its 8 budget outcome goals. If you had to divide that $100 between the following budget outcomes, how would you divide the money? For example, if you felt that Safety and Security should receive 10% of the money, you would allocate $10 to that service. Remember that you can choose to withhold funding from any service, but you must spend all of your money.”
Outcome Mean Amount Standard Deviation n
Safety and Security $20.43 15.36 1711
Effective Transportation $14.79 11.42 1711
Economic Opportunity $12.36 11.8 1711
Environmental Quality $10.48 15.54 1711
Healthy People $10.66 8.22 1711
Livable Neighborhoods $9.85 8.61 1711
Quality of Life $9.04 9.27 1711
Equal Access and Diversity $4.48 5.44 1711 Survey participants were asked to imagine that the City had an increase of 20% available to spend on its budget items. Participants were asked how they would prefer to spend the extra $20. The results show that online survey respondents would choose to allocate the largest share of the extra money to Safety and Security (see Table C.3). Effective Transportation and Economic Opportunity also received substantial allocations among respondents. Table C.3 “Here again are the 8 outcomes addressed by the budget, presented in alphabetical order. If the City were able to increase its budget by 20% ($20), how would you like to distribute the funds? Please indicate how much you want to spend in each area, totaling $20.”
Outcome Mean Amount Standard Deviation n
Safety and Security $4.20 4.55 1498
Effective Transportation $3.72 3.70 1498
Economic Opportunity $3.18 4.35 1498
Livable Neighborhoods $2.33 3.00 1498
Healthy People $2.07 2.88 1498
Quality of Life $2.04 2.69 1498
Environmental Quality $1.84 2.23 1498
Equal Access and Diversity $.64 1.53 1498
117

When asked where they would cut funding if the City were to decrease its budget by 20%, the survey respondents indicated Equal Access and Diversity would be the budget area in which they would make the largest cut (see Table C.4). Although Economic Opportunity and Quality of Life were next on the list of cuts, the amount that would be cut from Equal Access and Diversity far outstrips the amount that would be cut from the other areas. Table C.4 “Here again are the 8 outcomes addressed by the budget, presented in alphabetical order. If the City had to decrease its budget by 20% ($20), how would you like to cut to the budget? Please indicate how much you want to decrease the budget in each area, totaling $20.”
Outcome Mean Amount Standard Deviation n
Equal Access and Diversity $5.62 5.27 1420
Economic Opportunity $2.91 4.28 1420
Quality of Life $2.77 3.50 1420
Livable Neighborhoods $2.00 2.42 1420
Healthy People $1.88 2.56 1420
Environmental Quality $1.64 2.27 1420
Effective Transportation $1.53 2.65 1420
Safety and Security $1.50 3.39 1420 4. Results: Major New Projects Respondents were asked how they would prefer the City to fund a new, major project (see Table C.5). The results indicate that equal proportions of online survey respondents would prefer to see the City increase taxes, take some other approach, or to not take on a new project. A smaller percentage would like the City to cut funds from other areas to pay for a new, major project. Table C.5
“If the City of Lincoln were to undertake a new, major project, how would you want it funded?” n=1383 Response Percent n Increase Taxes 28% 388 Cut funds from other areas 16% 217 Some other approach 28% 390 No new project 28% 388
118

5. Results: A Role for Philanthropy Survey respondents were asked to indicate which one of the eight budget outcomes they would like to see philanthropic organizations focus their efforts. The largest proportions of respondents indicated they would like to see charitable organizations and businesses focus on enhancing Quality of Life and Economic Opportunity in the City. Safety and Security, which tends to be seen as the primary responsibility of City government, was not seen by the survey respondents as the responsibility of private organizations. Table C.6
“Please choose the one area of the City's priorities you think Lincoln's businesses and charitable organizations should help with.” n=1331 Outcome Percent n Quality of Life 23% 310 Economic Opportunity 22% 294 Healthy People 19% 258 Livable Neighborhoods 15% 193 Safety and Security 9% 115 Effective Transportation 7% 90 Equal Access and Diversity 3% 39 Environmental Quality 2% 32
6. Results: Public Trust and Confidence The survey respondents were asked about the levels of trust and confidence they have in Lincoln City government (see Table C.7). The results show that, while the respondents are fairly satisfied with City government, the levels of trust and confidence appear to somewhat lower than for participants of the phone survey and the deliberative discussion who were asked identical questions. For example, with only one exception, more of the non-scientific survey respondents strongly disagreed or disagreed than strongly agreed or agreed with the positive statements about City government. The opposite was true of respondents to the other surveys, where more respondents agreed than disagreed with the positive statements about City government.
119

Table C.7 Statement
n Strongly agree Agree
Neither disagree nor agree
Disagree Strongly disagree
Lincoln City government officials treat residents with respect.
1314 5.9% 36.9% 32.1% 17.4% 7.7%
I have great confidence in the Lincoln City government. 1314 4.3% 21.4% 32.7% 28.2% 13.3%
Lincoln City government officials have residents’ best interests in mind when they make decisions.
1314 4.0% 25.7% 27.8% 30.2% 12.4%
Lincoln City government can usually be trusted to make decisions that are right for residents as a whole.
1314 3.0% 26.3% 27.2% 29.7% 13.9%
7. Results: Public Knowledge Tables C.8a – C.8e present the findings of questions that were designed to measure the levels of knowledge that the survey respondents have of the City’s budget and budget process. The results show that, with the exception of a question that asks about charitable organizations, a majority of respondents were able to answer each question correctly. Again, this is in contrast to the scientific telephone survey where respondents were generally not able to answer these questions correctly. It should be noted, however, that respondents to the non-scientific, non-random survey had access to information that the other survey respondents did not have. Table C.8a “The City government spends the highest amount of its budget on which category of services?” n=1305
Response Percent n Human services and Health Department services
19% 250
Parks, Libraries, and Recreation
2% 24
Public Safety Services 64% 841 Maintaining and Building Roads
15% 190
120

Table C.8b “Of each dollar collected in property taxes in Lincoln, the City government receives approximately how much?” n=1300
Response Percent n Less than 15 percent 50% 653 Between 15 and 24 percent 35% 452 Between 25 and 49 percent 11% 147 50 percent or more 4% 48 Table C.8c “What is the highest source of revenue of the City’s budget?” n=1305
Response Percent n Property Taxes 40% 523 Income Taxes 2% 32 Sales Taxes 55% 719 Other sources 2% 31 Table C.8d “The City of Lincoln’s annual budget is approximately how much?” n=1304
Response Percent n Less than $10 million 4% 55 Between $25 million and $75 million
28% 367
Between $125 million and $175 million
59% 770
Over $500 million 9% 112 Table C.8e “The total amount of charitable funds made available to Lincoln’s public programs and services is estimated to be how large?” n=1304
Response Percent n Less than $10 million 64% 836 Between $25million and $75 million
30% 393
Between $125 million and $175 million
5% 65
Over $500 million 1% 10
121
122
PAPER VERSION OF NON-RANDOM SURVEY
PRIORITY LINCOLN This survey is a chance to have your voice heard by the Mayor, the City Council, and other City government officials as part of Mayor Beutler's "Priority Lincoln" initiative. You have an opportunity to indicate your preferences about the City's spending in 2008. In addition, we will ask you to help us make the trade-offs the City needs to make in forming its budget. The survey begins on the next page. When you are finished with this survey, please send to or drop off at the University of Nebraska Public Policy Center, 215 Centennial Mall South, Suite 401, Lincoln, NE 68588-0228 (the Center is located west of Pershing Auditorium and south of the YWCA); e-mail the completed survey to the Center at [email protected]; or drop off the completed survey at any library in the City and it will be forwarded to the Center. If you have any questions about the Survey, contact the Public Policy Center at 472-5678 or [email protected].

1. Below is a list of 12 city services. Please rate the importance of each of these services to you by ranking the services from 1 to 12. Your top priority will receive a “1,” your second priority will receive a “2,” and so on. ______ Building permits and safety
______ Fire and ambulance services
______ Health Department services
______ Human services
______ Job creation and economic development
______ Libraries
______ Management of sewage and storm water
______ Parks, trails, and recreation
______ Police services
______ Public bus and transportation services
______ Street maintenance and management of traffic flow
______ Zoning and growth planning
If you would like, please explain the reason(s) for your ordering:
123

2. On the next page are 8 outcomes that make up the current budget plan. These 8 outcomes represent the long-term goals the City of Lincoln hopes to achieve. Accordingly, the City will use this information to guide its decisions as it develops its budget to meet these goals. Imagine you have $100 which represents the money available for the City of Lincoln to spend on its 8 budget outcome goals. If you had to divide that $100 between the following budget outcomes, how would you divide the money? For example, if you felt that Safety and Security should receive 10% of the money, you would allocate $10 to that service. Remember that you can choose to withhold funding from any service, but you must spend all of your money. $_____Economic Opportunities – Includes good jobs; healthy business climate; attract
young people and visitors.
$_____Effective Transportation – Includes new roads; maintain existing roads; public transportation; safe driving conditions; low traffic congestion.
$_____Environmental Quality – Includes clean air, water, and soil; low flood risk; effective sewage maintenance and storm water management.
$_____Equal Access and Diversity – Includes legal protection against discrimination and harassment; appreciation, and recognition of Lincoln’s growing diversity.
$_____Healthy People – Includes health care for babies, children, elderly and low income residents; promoting physical fitness; disease prevention; safe restaurants.
$_____Livable Neighborhoods – Includes quality, affordable housing; access to pools, parks, and libraries.
$_____Quality of Life – Attract visitors; recreational and educational opportunities; access to parks, green space, and arts.
$_____Safety and Security – Includes low crime rate; low rate of injury and damage from fire; emergency medical services. =$100
If you would like, please explain the reason(s) for your allocations:
124

3. Here again are the 8 outcomes addressed by the budget, presented in alphabetical order. If the City were able to increase its budget by $20, how would you like to distribute the extra funds? Please indicate how much you want to spend in each area, totaling $20. $______ Economic Opportunities
$______ Effective Transportation
$______ Environmental Quality
$______ Equal Access and Diversity
$______ Healthy People
$______ Livable Neighborhoods
$______ Quality of Life
$______ Safety and Security
=$20 If you would like, please explain the reason(s) for your increases on the next page →: Please explain the reason(s) for your increases from Question 3, below, if you like: 4. Here again are the 8 outcomes addressed by the budget, presented in alphabetical order. If the City had to decrease its budget by $20, how much would you reduce funding to each area? Please indicate how much you would reduce in each area, totaling $20. $______ Economic Opportunities
$______ Effective Transportation
$______ Environmental Quality
$______ Equal Access and Diversity
$______ Healthy People
$______ Livable Neighborhoods
$______ Quality of Life
$______ Safety and Security
=$20 If you would like, please explain the reason(s) for decreases:
125

5. If the City were to undertake a new, major project, how would you want it funded? ____Increase taxes
____Cut funding from some other service areas
____Some other approach (specify below)
____No new project
6. Charitable and business organizations contribute a lot to the activities of communities. The Lincoln Community Foundation is interested in knowing which of the City's priority areas businesses and community organizations should focus their charitable funding. Please choose the one area of the City’s priorities you think Lincoln’s businesses and charitable organizations should help with. _____Economic Opportunities
_____Effective Transportation
_____Environmental Quality
_____Equal Access and Diversity
_____Healthy People
_____Livable Neighborhoods
_____Quality of Life
_____Safety and Security
If you would like, please explain the reason(s) for your selection.
126

7. Is there a priority area not mentioned or are there other services you would like businesses and community charitable organizations, like the Lincoln Community Foundation, to fund? We would like you to tell us about your feelings toward the City's government. For each question, please indicate whether you Strongly Agree, Agree, Neither Agree nor Disagree, Disagree or Strongly Disagree.
Statements
Stro
ngly
agr
ee
Agr
ee
Nei
ther
agr
ee
nor
disa
gree
Dis
agre
e
Stro
ngly
di
sagr
ee
8. Lincoln City government officials base their decisions on their personal interests, not the facts.
□ □ □ □ □
9. Lincoln City government officials treat residents with respect. □ □ □ □ □
10. I have great confidence in the Lincoln City government. □ □ □ □ □
11. Lincoln City government officials have residents’ best interests in mind when they make decisions.
□ □ □ □ □
12. Lincoln City government can usually be trusted to make decisions that are right for the residents as a whole.
□ □ □ □ □
The following five questions ask you about City government expenditures. Please answer each question the best you can. Do not worry if you do not know an answer, just make your best guess. 13. The city government spends the highest amount of its budget on which category of services? ______Human services and Health Department services ______Parks, recreation and libraries ______Public safety services ______Maintaining and building roads
127

14. Of each dollar collected in property taxes in Lincoln, the city government receives approximately how much? ______Less than 15 percent (of each dollar) ______Between 15-24 percent (of each dollar) ______Between 25-49 percent (of each dollar) ______50 percent or more (of each dollar) 15. What is the highest source of revenue of the city’s budget? ______Property taxes ______Income taxes ______Sales taxes ______Other sources 16. The City of Lincoln’s annual budget is approximately how much? ______Less than $10 million ______$25-75 million ______$125-175 million ______Over $500 million 17. The total amount of charitable funds made available to Lincoln’s public programs and services is estimated to be at what dollar level? ______Less than $10 million ______$25-75 million ______$125-175 million ______Over $500 million In the following questions, we would like you tell us about yourself. Please answer all questions. 18. How many years have you lived in the City of Lincoln? __________ 19. What race, or races do you consider yourself? (Indicate all that apply) _____White _____Black or African American _____Hispanic or Latino _____American Indian or Alaska Native _____Asian _____Native Hawaiian or Other Pacific Islander _____Other __________________
128

20. What is the highest grade or year of school you have completed? _____Some high school _____High school degree _____Some college _____Associates certificate/2 year program _____Bachelor’s degree _____Some graduate school _____Master’s degree _____Doctorate/Advanced degree 21. In what year were you born? ____________ 22. We want to make sure we represent people living in all areas of Lincoln. What is your Zip Code + 4? (If you do not know your Zip+4, you can go to http://zip4.usps.com/zip4/ to find it.) _ _ _ _ _ -_ _ _ _ Thank you for taking the survey! For more information, you can visit the University of Nebraska Public Policy Center website where there is additional information about the City's budgeting challenges (http://ppc.nebraska.edu/program_areas/documents/LincolnBudget.htm). If you wish to provide any additional comments, you may do so on the back of this page.
129

APPENDIX D: TOWN HALL MEETINGS
130
1. Introduction Partnering with the City, Leadership Lincoln convened a series of town hall meetings for residents to learn about the budget situation, and share their opinions with other residents and officials. Nearly 200 residents attended the town hall meetings, which were held on April 22nd at Lincoln Southwest High School; April 24th at Lincoln Public School’s District Offices; April 29th at North Star High School; and May 6th at Lincoln High School. The town hall meetings were approximately two hours long, and the format was identical for each location. Each meeting opened with a short presentation by Mayor Beutler about the City’s budget, in which he outlined how the budget was currently allocated among services, funding sources, and historical information about the budget. Residents were then randomly divided into small groups of about ten participants each, and had an opportunity to discuss their views about the City’s budget with the help of a volunteer Leadership Lincoln facilitator. Each group was asked to prioritize the City’s eight strategic priority areas in order of importance. Before and after each small group discussion session, residents were asked to prioritize the priority areas on a short survey individually. Following the small group discussion session, the small groups reconvened in a large group session and reported their group priority list back to the Mayor and other City officials in attendance. After the reporting out segment, all participants were also invited to participate in a real-time, audience response voting session in which they were allowed to provide additional feedback about other budget related questions. On an anecdotal level, several participants and observers commented at the high quality of discourse at the town hall meetings:
“People were civil and listened well to others…. There wasn't any rancor or bitterness or people holding on to their own personal opinion.” “Several people did stop to say "thanks" and to say they felt "empowered" by the process.”
One recurring observation made was that many participants seemed to learn quite a bit of new information from the Mayor’s presentation about the budget, enjoyed having the Mayor himself deliver it, and were pleased to have an opportunity to interact directly with him and other City officials present. This seemed to engender a feeling that the town hall meetings were a serious effort by the City to communicate information to residents and receive feedback in turn:
131

“Some people made a point of saying how impressed they were that the Mayor took the time to do the presentation himself and stayed to answer questions.” “The Mayor’s budget presentation was very helpful to many participants. You could tell most people did not know much about the City’s budget before coming to the event.”
Three things should be noted about the data collected from the town hall meetings. First, not all town hall meeting participants stayed for the duration of their meeting, so data was not collected from every participating resident. Secondly, several participating individuals were seen at multiple town hall meetings, and thus may have had more than one opportunity to provide their feedback. Finally, the town hall meetings were promoted throughout the community, open to all members of the public, and no detailed information tracking their demographic or professional backgrounds was collected. Thus, it is unknown if town hall meeting participants were motivated to attend because of personal interest, membership in an interest group, or both. For these reasons, the data collected from the town hall meetings should not be interpreted as representing a scientifically-valid cross section of the community like that of the telephone survey and deliberative discussion. However, prioritization results from the town hall meetings shared similarities to those gathered from the other participatory methods employed. 2. Results In both the pre and post-discussion rankings, individual participants ranked Safety & Security the most important priority area, a result similar to that of the telephone survey, deliberative discussion, and non-random survey. However, Livable Neighborhoods earned the second highest position, followed by Economic Opportunity. Table D.1 Pre-discussion ranking of
Strategic Priorities Mean n Post-discussion ranking of Strategic Priorities Mean n
Safety & Security 2.07 82 Safety & Security 2.09 75 Livable Neighborhoods 3.76 84 Livable Neighborhoods 3.29 76 Economic Opportunity 3.94 82 Economic Opportunity 3.45 75 Healthy & Productive People 4.70 82 Healthy & Productive People 4.76 74 Effective Transportation 4.95 81 Environmental Quality 5.00 76 Environmental Quality 4.96 81 Effective Transportation 5.30 77 Accountable Government 5.26 81 Accountable Government 5.65 78 Destination Lincoln 6.35 82 Destination Lincoln 6.30 76 Two questions about funding strategic priority items were asked at the end of each town hall meeting. In regards to spending for top priorities, the plurality of town hall
132

meeting participants indicated that they believe spending levels should be maintained at current levels (51%), followed closely by increasing spending (42%). Table D.2 Should the city modify its spending on the community’s top priority outcomes? n=128
Response Percent n Increase current spending level 42% 54 Maintain current spending level 51% 65 Decrease current spending level 7% 9 In regards to how funding should be obtained, a plurality of town hall meeting respondents indicated that taxes should be increased (55%). This was followed by looking for other funding sources (22%), and take funding from low level priorities (15%). Table D.3 How should the city fund the community’s top priority outcomes if more money is needed? n=127
Response Percent n Increase taxes 55% 71 Take funding from low level priorities 15% 19 Look for other funding sources 22% 28 I don’t know 7% 9 Although the ranking of Strategic Priorities in the town hall meetings was similar to the outcomes resulting from the telephone survey and deliberative discussion, there were differences in terms of how to fund priorities. Town hall meeting participants seemed more willing to increase taxes to fund the City’s top strategic priority.
133

APPENDIX E: FOCUS GROUP
134

1. Introduction On Saturday, May 3, 2008, a focus group of four (4) Lincoln residents was conducted by a professional facilitator about the City’s budget issues. The purpose of the focus group was to convene a forum for residents to discuss their perceptions of the City’s budget situation in a comfortable environment without the presence of City leaders or members of the press. Nineteen people, drawn from the scientific telephone survey list, were contacted and asked to participate in the focus group. Direct contact was made with nine people, four of whom participated in the focus group. The session lasted several hours, and the participants were compensated $25 to offset any childcare, travel costs or other expenses. All participants had completed the scientific telephone survey conducted in March. They had also received the educational background materials as well as a baseline set of information about the City’s budget situation. There were no City leaders or members of the press present during the discussion. 2. Results The focus group began with a short presentation by the University of Public Policy Center highlighting the main results of the scientific telephone survey. Then, the focus group facilitator initiated a discussion touching on a number of items included in the telephone survey, as well as the participants’ general impressions about the City’s budget situation. Participants were in agreement that completing the telephone survey was a difficult task because it forced respondents to rank the importance of various city services and outcome areas over others:
“I guess it was hard to prioritize, the different things are all important.” “I know I ranked parks and trails low, and I hated myself for it. I love our parks and trails and I use them daily, but once more, through process of elimination, I had to decide whether they were more important than services.”
Contributing to the difficulty with ranking services and outcomes areas was the perception that many services and budget outcomes all impact community vitality in separate but equal ways:
“Things like parks and recreation and libraries, are towards the bottom and they’re just so important to the quality of life. We have this great quality of life, and the more people that are here the more they buy things, and then we’ll have more sales tax to spend. So I mean we can’t
135

ignore those things because then we’re cutting off our nose to despite our face.”
However, not unlike the telephone survey, non-scientific survey, or deliberative discussion, the focus group participants agreed that public safety was the most important part of the City budget. There was a general appreciation expressed for the importance of public safety as a foundation for stability in the community, as well as specific support directed towards the Lincoln Police Department:
“I think I kind of thought through it in terms of building blocks, if you don’t have the security, the rest of it doesn’t matter.” “I really think that the police, the city police, have really, really good leadership. I’ve continued to be over the years impressed with the chief and have always found him to be someone you could have a conversation with and that he won’t lie.”
The only service that was mentioned in a critical light during the focus group was public transportation:
“A real conundrum I am sure for the city is the whole StarTran thing. It is more than frustrating for me to see empty buses go down through my neighborhood, and they practically are....And they all end up on 11th and O. I know someone who would like to use the bus, but it would take forever to get where they need to go, all the way to northeast or southeast. It is very frustrating.”
Some focus group participants believed that services which affected personal health and safety were more important than quality of life areas:
“I looked at each one in terms of how it impacted human beings on a survival level. Personally, my wife and I, we contribute to library funds and that kind of thing on our own.… The city money going to the library is not as important to us or to me as the city money going to make sure that [some people] can go see a dentist. That people who are mentally ill can go and get the services that they need.... That is what I want the city to prioritize, is how to impact human beings.”
There was also a consensus that some areas were deemed to be more appropriate for the City to manage than others, which reflected in their prioritization choices. Equal access and diversity was cited as a common example:
136

“[W]hen I think about diversity in our city, I think about economic diversity, I think about the diversity of health issues, I think its multiculturalism, I think about race but I think about it in a broader way as being more than multiculturalism. But I rated it low in terms of what I know about what impacts that. I don’t think government has a place in that”
Although the focus group was able to effectively articulate broad conceptions of City spending priorities, they were unable to identify means for the City to raise revenue:
“The fuel and everybody’s utilities are increasing and so are the City’s. Just to keep going along with the minimum is going to take more money. Going along with inflation and the cost of needs. We are not going to have enough to do what we want.”
Only one participant affirmatively implied that raising taxes was a potential solution to the City’s budget situation:
“I do not think that unless we increase taxes we can even keep them the way they are.”
The focus group’s inability to identify solutions to the City’s budget problems may have been related to an overall lack of knowledge about the budget or viable solutions. Almost all of the participants noted that they did not know much about the City’s budget process:
“I was surprised how little I knew. I mean yeah. I was surprised at how little I knew. Wow, I don’t know that.”
They did agree that more efforts should be taken by the City to educate the public about the budgetary situation. One participant suggested that the City should work with utility companies to provide general information about the budget to residents:
“What if there was one sheet that says it all with the water bill. This is where we are with our budget…. What is even better is partner with Aquila and have them send it so they do not have to pay for it.”
The focus group participants were able to identify broad areas of need and set priorities for the City, but did not seem able to generate solutions. This disconnect was similar to results from the telephone and non-scientific surveys, where there were definite consensuses on priorities of services and outcomes areas, but less clear indications by residents on how to increase the City’s revenue.
137

In conclusion, the focus group allowed for an in-depth discussion among a small group of residents, and may serve as an example of what many Lincolnites think about the current budget situation without having the opportunity to interact with City leaders. However, the small size of the focus group makes it difficult to draw any specific conclusions from the discussion.
138

139
An equal opportunity employer with a comprehensive plan for diversity.