press release - missouri kids count
TRANSCRIPT


• 114B E High St • Jefferson City, Missouri 65101 • 573.636.6300 • Fax: 573.632.2499 • www.mofact.org
Press Release Family and Community Trust (FACT) Contact: Tracy Greever-Rice, Ph.D., Missouri KIDS COUNT Program Director Phone: 573.823.0092 Email: [email protected] Date: April 15, 2020 FOR IMMEDIATE RELEASE
New Data on Missouri’s Children and COVID-19 COVID-19 a Threat to Well-being
JEFFERSON CITY, MO — Currently, COVID-19 is affecting Missouri’s families in extraordinary ways. The impact of the COVID-19 pandemic will become more evident over time in all aspects of the lives of Missouri’s children. Missouri KIDS COUNT (MKC), an annual snapshot on the well-being of the state’s children first released in 1993, includes indicators tracked longitudinally and collected and analyzed prior to the COVID-19 crisis. While the newly released data on the well-being of Missouri’s children shows a generally positive trajectory, in light of the pandemic, the 2020 MKC release will serve as a baseline for tracking the fallout of the infection and the policies implemented to manage its spread. According to the Centers for Disease Control and Prevention, children and teens are among those most likely to react more strongly to stress during an infectious disease outbreak. Parents and caregivers may notice some of the following:
• Fear and worry about their health or the health of their loved ones • Changes in sleep or eating patterns • Difficulty sleeping or concentrating • Worsening of chronic health problems
In order to support the physical and mental well-being of children during the outbreak, parents and caregivers are encouraged to talk with their children often, providing reassurance and answering any questions they may have. Share suggestions for how they can deal with their emotions and concerns. Try and keep a consistent routine in place for them and avoid overstimulating them with too much news or social media. And be open to using community resources to assist if they find themselves out of work or in need of food assistance. Before the outbreak, data indicated that from an economic perspective, fewer Missouri children were living in poverty in 2018 as compared to 2014. Child homelessness, however, increased by more than 17% over that same time period. We know that kids living in underserved, higher poverty, less-resourced areas of Missouri are already at higher risk for worse outcomes. Over time, the COVID-19 pandemic will provide a stark contrast between those parts of Missouri with easy access to resources versus those without.
Board of Directors
Jennifer Tidball, Co-Chair Acting Director Dept. of Social Services
Steve Renne Co-Chair State & Nonprofit Executive (Ret)
Roseann Bentley Greene County Commission (Ret) Jack Craft Senior Council, Lathrop Gage Rob Dixon Director Dept. of Economic Development Anna S. Hui Director Dept. of Labor and Industrial Relations Sandy Karsten Director Dept. of Public Safety Ken Zellers Dept. of Revenue Brian Kinkade MO Hospital Association Lowell Kruse Senior Fellow Heartland Foundation Michael A. Middleton University of MO System (Ret) Zora Mulligan Commissioner Dept. of Higher Education Loretta Prater Dean, College of Health and Human Services (Ret.) Southeast Missouri State University Anne Precythe Director Dept. of Corrections David Russell State & Private Executive (Ret) Mark Stringer Director Dept. of Mental Health Kathryn Swan State Representative, Dist. 147 President, JCS wireless Bailus Tate Kansas City Power and Light Co. Executive (Ret) Blanche Touhill Chancellor Emeritus University of Missouri - St. Louis Margie Vandeven Commissioner Dept. of Elementary and Secondary Education Randall Williams Director Dept. of Health and Senior Services Bill Dent Executive Director

• 114B E High St • Jefferson City, Missouri 65101 • 573.636.6300 • Fax: 573.632.2499 • www.mofact.org
“Like we anticipate of the COVID-19 virus itself, we expect the impact of the pandemic will affect Missouri’s children and families in waves. Today we are focused on ensuring children are safe in their homes as well as in childcare to allow our essential workforce to serve and protect Missourians. Down the road, we anticipate the economic impact on Missouri families will be substantial for many. The primary goal of Missouri KIDS COUNT is to provide trustworthy, accurate information to support the unprecedented challenges faced by our local and state policymakers and providers.”, said Tracy Greever-Rice, FACT’s KIDS COUNT Program Director. While some indicators of physical well-being improved between 2014 and 2018, preventable hospitalizations and child deaths between the ages of 1 and 14 decreased, the indicators that worsened are concerning. These indicators include low birthweight infants and an increasing adolescent death rate, importantly attributable to an increase in suicides. The number of young people under age 20 who committed suicide doubled during this five-year period. We are concerned that this growing problem will be exacerbated by the economic impact on job and educational opportunities created by the COVID-19 crisis. In addition to the state’s current battle against COVID-19, we are also in the process of the 2020 decennial census intended to count all people living in the U.S. Our state leaders have expressed concern because around 10% of Missouri’s children live in hard to count areas. For every person not counted in the census, Missouri will lose $1,300 per person in federal funds each year. Much of the funding goes to programs that support Missouri’s kids. Information about the census in Missouri can be found at https://census.mo.gov/. The good news is there are more ways than ever for households to take part in the census, including online, by phone, or through the mail. You’re encouraged to visit my2020census.gov to respond now. FACT is Missouri’s KIDS COUNT affiliate. It is the state level, private/public organization that governs a network of 20 Community Partnerships focused on achieving better results for children and families. To read data informed stories and access specific data and information about the well-being of children in our state visit mokidscount.org. About the Annie E. Casey Foundation The Annie E. Casey Foundation creates a brighter future for the nation’s children by developing solutions to strengthen families, build paths to economic opportunity and transform struggling communities into safer and healthier places to live, work and grow. For more information, visit www.aecf.org. KIDS COUNT® is a registered trademark of the Annie E. Casey Foundation.
###

Outcome MeasuresNumber Rate Trend Rank
2014 2018 2014 2018 State Rate
County Rank
Economic Well-BeingChildren under 18 in poverty 1,078 897 23.4% 19.9% é 18.3% 40
Food insecurity for childrenb 1,010 840 20.7% 18.3% é 17.5% 46
HealthLow birthweight infantsa,c 110 107 8.3% 7.9% é 8.5% 55
Preventable hospitalizations for all causes for children under 18 (per 1,000)b,c
34 29 7.0 6.2 é 7.1 59
Child asthma ER rates (per 1,000)b
9 15 1.8 3.2 ê 7.5 49
Family & CommunityBirths to teens, ages 15-19 (per 1,000)
13 17 8.0 10.7 ê 21.6 10
Substantiated child abuse/neglect cases (per 1,000)a
20 43 4.2 9.2 ê 4.0 94
EducationHigh school graduation 232 217 93.9% 92.3% ê 91.3% 76
Achievement proficiencya,d
3rd grade English/Language Arts (MAP) 76 38.2% 48.6%
8th grade English/Language Arts (MAP)
69 34.3% 49.0%
4th grade Math (MAP) 78 35.1% 45.8%
Algebra I (End of Course exam) 77 57.5% 47.0%
Trend: é better ê worse è no change
Adair CountyCounty Seat: Kirksville
25Population: 25,325
2016
County Composite Rank
8
2020
a Outcome not included in County Composite Rank.b Data based on 2013 and 2017.c Data based on 5-year time spans, 2009-2013 and 2014-2018.d Achievement proficiency measures those that scored proficient or above on the MAP tests and Algebra I End of Course exam. Achievement data from 2014 are not shown due to differences in testing standards and assessments used in 2018; accordingly, no trend arrows or county ranks are shown.
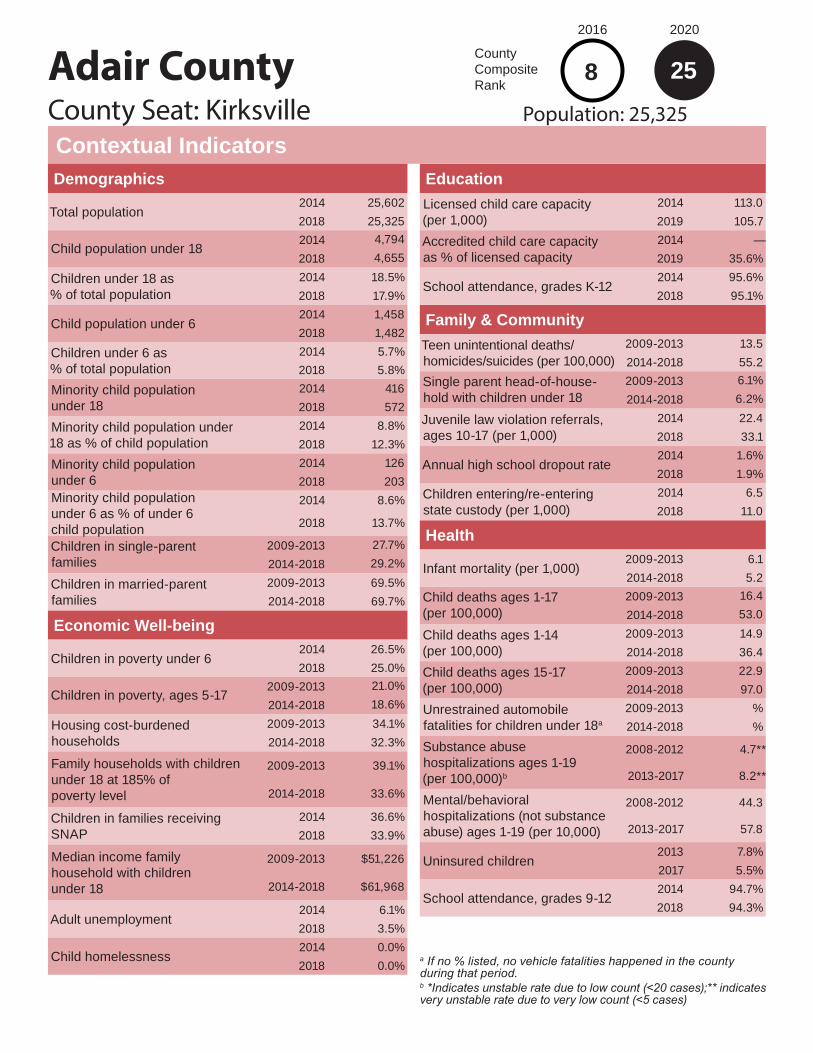
Adair County
EducationLicensed child care capacity (per 1,000)
2014 113.02019 105.7
Accredited child care capacity as % of licensed capacity
2014 —2019 35.6%
School attendance, grades K-122014 95.6%2018 95.1%
Family & CommunityTeen unintentional deaths/homicides/suicides (per 100,000)
2009-2013 13.52014-2018 55.2
Single parent head-of-house-hold with children under 18
2009-2013 6.1%2014-2018 6.2%
Juvenile law violation referrals, ages 10-17 (per 1,000)
2014 22.42018 33.1
Annual high school dropout rate2014 1.6%2018 1.9%
Children entering/re-entering state custody (per 1,000)
2014 6.52018 11.0
Health
Infant mortality (per 1,000)2009-2013 6.12014-2018 5.2
Child deaths ages 1-17 (per 100,000)
2009-2013 16.42014-2018 53.0
Child deaths ages 1-14 (per 100,000)
2009-2013 14.92014-2018 36.4
Child deaths ages 15-17 (per 100,000)
2009-2013 22.92014-2018 97.0
Unrestrained automobile fatalities for children under 18a
2009-2013 %2014-2018 %
Substance abuse hospitalizations ages 1-19 (per 100,000)b
2008-2012 4.7**
2013-2017 8.2**
Mental/behavioral hospitalizations (not substance abuse) ages 1-19 (per 10,000)
2008-2012 44.3
2013-2017 57.8
Uninsured children2013 7.8%2017 5.5%
School attendance, grades 9-122014 94.7%2018 94.3%
Contextual IndicatorsCounty Seat: Kirksville
25Population: 25,325
2016
County Composite Rank
2020
8
Demographics
Total population2014 25,6022018 25,325
Child population under 182014 4,7942018 4,655
Children under 18 as % of total population
2014 18.5%2018 17.9%
Child population under 62014 1,4582018 1,482
Children under 6 as % of total population
2014 5.7%2018 5.8%
Minority child population under 18
2014 4162018 572
Minority child population under 18 as % of child population
2014 8.8%2018 12.3%
Minority child population under 6
2014 1262018 203
Minority child population under 6 as % of under 6 child population
2014 8.6%
2018 13.7%
Children in single-parent families
2009-2013 27.7%2014-2018 29.2%
Children in married-parent families
2009-2013 69.5%2014-2018 69.7%
Economic Well-being
Children in poverty under 62014 26.5%2018 25.0%
Children in poverty, ages 5-172009-2013 21.0%2014-2018 18.6%
Housing cost-burdened households
2009-2013 34.1%2014-2018 32.3%
Family households with children under 18 at 185% of poverty level
2009-2013 39.1%
2014-2018 33.6%
Children in families receiving SNAP
2014 36.6%2018 33.9%
Median income family household with children under 18
2009-2013 $51,226
2014-2018 $61,968
Adult unemployment2014 6.1%2018 3.5%
Child homelessness2014 0.0%2018 0.0%
a If no % listed, no vehicle fatalities happened in the county during that period.b *Indicates unstable rate due to low count (<20 cases);** indicates very unstable rate due to very low count (<5 cases)

Outcome MeasuresNumber Rate Trend Rank
2014 2018 2014 2018 State Rate
County Rank
Economic Well-BeingChildren under 18 in poverty 520 453 13.3% 11.4% é 18.3% 7
Food insecurity for childrenb 640 550 15.8% 13.8% é 17.5% 4
HealthLow birthweight infantsa,c 55 67 6.0% 7.1% ê 8.5% 29
Preventable hospitalizations for all causes for children under 18 (per 1,000)b,c
26 18 6.4 4.5 é 7.1 24
Child asthma ER rates (per 1,000)b
9 11 2.2 2.7 ê 7.5 38
Family & CommunityBirths to teens, ages 15-19 (per 1,000)
15 7 27.7 14.4 é 21.6 13
Substantiated child abuse/neglect cases (per 1,000)a
9 7 2.2 1.7 é 4.0 10
EducationHigh school graduation 190 213 92.7% 93.4% é 91.3% 62
Achievement proficiencya,d
3rd grade English/Language Arts (MAP) 122 59.5% 48.6%
8th grade English/Language Arts (MAP)
109 46.6% 49.0%
4th grade Math (MAP) 123 55.4% 45.8%
Algebra I (End of Course exam) 75 32.5% 47.0%
Trend: é better ê worse è no change
Andrew CountyCounty Seat: Savannah
5Population: 17,403
2016
County Composite Rank
5
2020
a Outcome not included in County Composite Rank.b Data based on 2013 and 2017.c Data based on 5-year time spans, 2009-2013 and 2014-2018.d Achievement proficiency measures those that scored proficient or above on the MAP tests and Algebra I End of Course exam. Achievement data from 2014 are not shown due to differences in testing standards and assessments used in 2018; accordingly, no trend arrows or county ranks are shown.

Andrew County
EducationLicensed child care capacity (per 1,000)
2014 85.02019 95.9
Accredited child care capacity as % of licensed capacity
2014 —2019 0.0%
School attendance, grades K-122014 95.9%2018 94.7%
Family & CommunityTeen unintentional deaths/homicides/suicides (per 100,000)
2009-2013 17.12014-2018 127.7
Single parent head-of-house-hold with children under 18
2009-2013 7.9%2014-2018 6.4%
Juvenile law violation referrals, ages 10-17 (per 1,000)
2014 16.72018 15.4
Annual high school dropout rate2014 1.3%2018 0.8%
Children entering/re-entering state custody (per 1,000)
2014 0.52018 0.5
Health
Infant mortality (per 1,000)2009-2013 13.02014-2018 3.2
Child deaths ages 1-17 (per 100,000)
2009-2013 14.72014-2018 44.9
Child deaths ages 1-14 (per 100,000)
2009-2013 17.92014-2018 21.3
Child deaths ages 15-17 (per 100,000)
2009-2013 0.02014-2018 132.1
Unrestrained automobile fatalities for children under 18a
2009-2013 50.0%2014-2018 50%
Substance abuse hospitalizations ages 1-19 (per 100,000)b
2008-2012 12.0**
2013-2017 8.3**
Mental/behavioral hospitalizations (not substance abuse) ages 1-19 (per 10,000)
2008-2012 65.4
2013-2017 52.0
Uninsured children2013 7.9%2017 4.9%
School attendance, grades 9-122014 95.3%2018 93.1%
Contextual IndicatorsCounty Seat: Savannah
5Population: 17,403
2016
County Composite Rank
2020
5
Demographics
Total population2014 17,3792018 17,403
Child population under 182014 4,0342018 4,034
Children under 18 as % of total population
2014 22.8%2018 23.1%
Child population under 62014 1,0862018 1,239
Children under 6 as % of total population
2014 6.3%2018 7.0%
Minority child population under 18
2014 2652018 305
Minority child population under 18 as % of child population
2014 6.7%2018 7.6%
Minority child population under 6
2014 882018 103
Minority child population under 6 as % of under 6 child population
2014 8.1%
2018 8.3%
Children in single-parent families
2009-2013 22.5%2014-2018 23.9%
Children in married-parent families
2009-2013 74.0%2014-2018 73.5%
Economic Well-being
Children in poverty under 62014 30.9%2018 26.7%
Children in poverty, ages 5-172009-2013 12.3%2014-2018 10.9%
Housing cost-burdened households
2009-2013 22.2%2014-2018 20.5%
Family households with children under 18 at 185% of poverty level
2009-2013 23.8%
2014-2018 30.8%
Children in families receiving SNAP
2014 21.1%2018 15.7%
Median income family household with children under 18
2009-2013 $72,957
2014-2018 $79,096
Adult unemployment2014 5.1%2018 2.7%
Child homelessness2014 0.0%2018 0.0%
a If no % listed, no vehicle fatalities happened in the county during that period.b *Indicates unstable rate due to low count (<20 cases);** indicates very unstable rate due to very low count (<5 cases)

Outcome MeasuresNumber Rate Trend Rank
2014 2018 2014 2018 State Rate
County Rank
Economic Well-BeingChildren under 18 in poverty 182 163 17.2% 16.0% é 18.3% 24
Food insecurity for childrenb 230 170 20.0% 16.7% é 17.5% 22
HealthLow birthweight infantsa,c 17 10 5.7% 4.0% é 8.5% 1
Preventable hospitalizations for all causes for children under 18 (per 1,000)b,c
6 11 5.3 10.4 ê 7.1 106
Child asthma ER rates (per 1,000)b
6 2 5.3 1.9 é 7.5 19
Family & CommunityBirths to teens, ages 15-19 (per 1,000)
2 - 13.6 0 é 21.6 1
Substantiated child abuse/neglect cases (per 1,000)a
3 1 2.7 1.0 é 4.0 2
EducationHigh school graduation 61 46 92.4% 95.8% é 91.3% 29
Achievement proficiencya,d
3rd grade English/Language Arts (MAP) 36 63.2% 48.6%
8th grade English/Language Arts (MAP)
31 52.5% 49.0%
4th grade Math (MAP) 35 63.6% 45.8%
Algebra I (End of Course exam) 23 45.1% 47.0%
Trend: é better ê worse è no change
Atchison CountyCounty Seat: Rock Port
13Population: 5,270
2016
County Composite Rank
13
2020
a Outcome not included in County Composite Rank.b Data based on 2013 and 2017.c Data based on 5-year time spans, 2009-2013 and 2014-2018.d Achievement proficiency measures those that scored proficient or above on the MAP tests and Algebra I End of Course exam. Achievement data from 2014 are not shown due to differences in testing standards and assessments used in 2018; accordingly, no trend arrows or county ranks are shown.
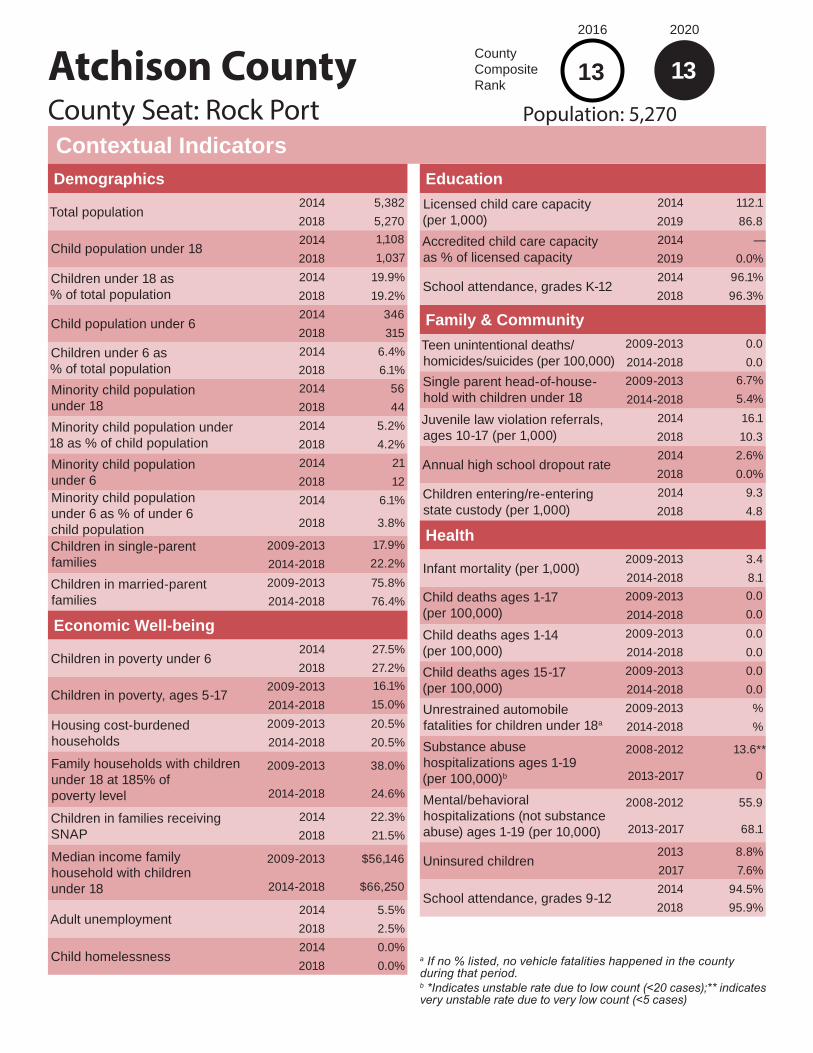
Atchison County
EducationLicensed child care capacity (per 1,000)
2014 112.12019 86.8
Accredited child care capacity as % of licensed capacity
2014 —2019 0.0%
School attendance, grades K-122014 96.1%2018 96.3%
Family & CommunityTeen unintentional deaths/homicides/suicides (per 100,000)
2009-2013 0.02014-2018 0.0
Single parent head-of-house-hold with children under 18
2009-2013 6.7%2014-2018 5.4%
Juvenile law violation referrals, ages 10-17 (per 1,000)
2014 16.12018 10.3
Annual high school dropout rate2014 2.6%2018 0.0%
Children entering/re-entering state custody (per 1,000)
2014 9.32018 4.8
Health
Infant mortality (per 1,000)2009-2013 3.42014-2018 8.1
Child deaths ages 1-17 (per 100,000)
2009-2013 0.02014-2018 0.0
Child deaths ages 1-14 (per 100,000)
2009-2013 0.02014-2018 0.0
Child deaths ages 15-17 (per 100,000)
2009-2013 0.02014-2018 0.0
Unrestrained automobile fatalities for children under 18a
2009-2013 %2014-2018 %
Substance abuse hospitalizations ages 1-19 (per 100,000)b
2008-2012 13.6**
2013-2017 0
Mental/behavioral hospitalizations (not substance abuse) ages 1-19 (per 10,000)
2008-2012 55.9
2013-2017 68.1
Uninsured children2013 8.8%2017 7.6%
School attendance, grades 9-122014 94.5%2018 95.9%
Contextual IndicatorsCounty Seat: Rock Port
13Population: 5,270
2016
County Composite Rank
2020
13
Demographics
Total population2014 5,3822018 5,270
Child population under 182014 1,1082018 1,037
Children under 18 as % of total population
2014 19.9%2018 19.2%
Child population under 62014 3462018 315
Children under 6 as % of total population
2014 6.4%2018 6.1%
Minority child population under 18
2014 562018 44
Minority child population under 18 as % of child population
2014 5.2%2018 4.2%
Minority child population under 6
2014 212018 12
Minority child population under 6 as % of under 6 child population
2014 6.1%
2018 3.8%
Children in single-parent families
2009-2013 17.9%2014-2018 22.2%
Children in married-parent families
2009-2013 75.8%2014-2018 76.4%
Economic Well-being
Children in poverty under 62014 27.5%2018 27.2%
Children in poverty, ages 5-172009-2013 16.1%2014-2018 15.0%
Housing cost-burdened households
2009-2013 20.5%2014-2018 20.5%
Family households with children under 18 at 185% of poverty level
2009-2013 38.0%
2014-2018 24.6%
Children in families receiving SNAP
2014 22.3%2018 21.5%
Median income family household with children under 18
2009-2013 $56,146
2014-2018 $66,250
Adult unemployment2014 5.5%2018 2.5%
Child homelessness2014 0.0%2018 0.0%
a If no % listed, no vehicle fatalities happened in the county during that period.b *Indicates unstable rate due to low count (<20 cases);** indicates very unstable rate due to very low count (<5 cases)

Outcome MeasuresNumber Rate Trend Rank
2014 2018 2014 2018 State Rate
County Rank
Economic Well-BeingChildren under 18 in poverty 1,600 1,430 27.5% 25.6% é 18.3% 81
Food insecurity for childrenb 1,400 1,160 22.5% 19.3% é 17.5% 66
HealthLow birthweight infantsa,c 143 150 8.2% 8.8% ê 8.5% 88
Preventable hospitalizations for all causes for children under 18 (per 1,000)b,c
33 31 5.3 5.3 è 7.1 42
Child asthma ER rates (per 1,000)b
41 37 6.6 6.3 é 7.5 97
Family & CommunityBirths to teens, ages 15-19 (per 1,000)
32 16 43.0 22 é 21.6 40
Substantiated child abuse/neglect cases (per 1,000)a
45 49 7.3 8.4 ê 4.0 92
EducationHigh school graduation 231 201 88.8% 87.0% ê 91.3% 111
Achievement proficiencya,d
3rd grade English/Language Arts (MAP) 109 42.9% 48.6%
8th grade English/Language Arts (MAP)
136 53.1% 49.0%
4th grade Math (MAP) 107 42.1% 45.8%
Algebra I (End of Course exam) 94 37.8% 47.0%
Trend: é better ê worse è no change
Audrain CountyCounty Seat: Mexico
90Population: 25,735
2016
County Composite Rank
86
2020
a Outcome not included in County Composite Rank.b Data based on 2013 and 2017.c Data based on 5-year time spans, 2009-2013 and 2014-2018.d Achievement proficiency measures those that scored proficient or above on the MAP tests and Algebra I End of Course exam. Achievement data from 2014 are not shown due to differences in testing standards and assessments used in 2018; accordingly, no trend arrows or county ranks are shown.

Audrain County
EducationLicensed child care capacity (per 1,000)
2014 61.72019 56.1
Accredited child care capacity as % of licensed capacity
2014 —2019 15.0%
School attendance, grades K-122014 95.0%2018 94.9%
Family & CommunityTeen unintentional deaths/homicides/suicides (per 100,000)
2009-2013 43.82014-2018 51.4
Single parent head-of-house-hold with children under 18
2009-2013 9.0%2014-2018 7.9%
Juvenile law violation referrals, ages 10-17 (per 1,000)
2014 22.72018 30.8
Annual high school dropout rate2014 3.9%2018 2.4%
Children entering/re-entering state custody (per 1,000)
2014 4.72018 4.6
Health
Infant mortality (per 1,000)2009-2013 4.62014-2018 7.6
Child deaths ages 1-17 (per 100,000)
2009-2013 28.92014-2018 23.4
Child deaths ages 1-14 (per 100,000)
2009-2013 15.82014-2018 17.4
Child deaths ages 15-17 (per 100,000)
2009-2013 90.02014-2018 36.6
Unrestrained automobile fatalities for children under 18a
2009-2013 66.7%2014-2018 %
Substance abuse hospitalizations ages 1-19 (per 100,000)b
2008-2012 5.1**
2013-2017 8.2**
Mental/behavioral hospitalizations (not substance abuse) ages 1-19 (per 10,000)
2008-2012 82.9
2013-2017 89.4
Uninsured children2013 8.9%2017 5.5%
School attendance, grades 9-122014 93.4%2018 94%
Contextual IndicatorsCounty Seat: Mexico
90Population: 25,735
2016
County Composite Rank
2020
86
Demographics
Total population2014 25,8872018 25,735
Child population under 182014 6,1482018 5,827
Children under 18 as % of total population
2014 23.6%2018 23.3%
Child population under 62014 1,9412018 1,932
Children under 6 as % of total population
2014 7.5%2018 7.6%
Minority child population under 18
2014 9522018 959
Minority child population under 18 as % of child population
2014 15.6%2018 16.5%
Minority child population under 6
2014 3212018 323
Minority child population under 6 as % of under 6 child population
2014 16.5%
2018 16.7%
Children in single-parent families
2009-2013 32.8%2014-2018 31.6%
Children in married-parent families
2009-2013 66.2%2014-2018 63.2%
Economic Well-being
Children in poverty under 62014 27.5%2018 21.3%
Children in poverty, ages 5-172009-2013 25.6%2014-2018 23.9%
Housing cost-burdened households
2009-2013 23.6%2014-2018 22.5%
Family households with children under 18 at 185% of poverty level
2009-2013 41.3%
2014-2018 41.6%
Children in families receiving SNAP
2014 34.1%2018 33.6%
Median income family household with children under 18
2009-2013 $51,566
2014-2018 $56,028
Adult unemployment2014 5.5%2018 3.1%
Child homelessness2014 5.4%2018 8.0%
a If no % listed, no vehicle fatalities happened in the county during that period.b *Indicates unstable rate due to low count (<20 cases);** indicates very unstable rate due to very low count (<5 cases)

Outcome MeasuresNumber Rate Trend Rank
2014 2018 2014 2018 State Rate
County Rank
Economic Well-BeingChildren under 18 in poverty 2,625 2,143 32.7% 26.9% é 18.3% 90
Food insecurity for childrenb 2,020 1,650 23.7% 20.4% é 17.5% 80
HealthLow birthweight infantsa,c 156 167 7.2% 7.9% ê 8.5% 57
Preventable hospitalizations for all causes for children under 18 (per 1,000)b,c
49 42 5.7 5.1 é 7.1 38
Child asthma ER rates (per 1,000)b
60 36 7.0 4.4 é 7.5 72
Family & CommunityBirths to teens, ages 15-19 (per 1,000)
35 35 32.8 35 ê 21.6 88
Substantiated child abuse/neglect cases (per 1,000)a
67 22 8.0 2.7 é 4.0 21
EducationHigh school graduation 406 450 92.1% 94.1% é 91.3% 53
Achievement proficiencya,d
3rd grade English/Language Arts (MAP) 186 36.8% 48.6%
8th grade English/Language Arts (MAP)
205 41.7% 49.0%
4th grade Math (MAP) 188 35.7% 45.8%
Algebra I (End of Course exam) 157 33.6% 47.0%
Trend: é better ê worse è no change
Barry CountyCounty Seat: Cassville
79Population: 35,493
2016
County Composite Rank
79
2020
a Outcome not included in County Composite Rank.b Data based on 2013 and 2017.c Data based on 5-year time spans, 2009-2013 and 2014-2018.d Achievement proficiency measures those that scored proficient or above on the MAP tests and Algebra I End of Course exam. Achievement data from 2014 are not shown due to differences in testing standards and assessments used in 2018; accordingly, no trend arrows or county ranks are shown.

Barry County
EducationLicensed child care capacity (per 1,000)
2014 40.32019 20.8
Accredited child care capacity as % of licensed capacity
2014 —2019 11.8%
School attendance, grades K-122014 94.7%2018 94.4%
Family & CommunityTeen unintentional deaths/homicides/suicides (per 100,000)
2009-2013 41.62014-2018 58.0
Single parent head-of-house-hold with children under 18
2009-2013 8.4%2014-2018 7.8%
Juvenile law violation referrals, ages 10-17 (per 1,000)
2014 23.32018 25.9
Annual high school dropout rate2014 0.7%2018 1.6%
Children entering/re-entering state custody (per 1,000)
2014 14.32018 10.9
Health
Infant mortality (per 1,000)2009-2013 8.32014-2018 4.8
Child deaths ages 1-17 (per 100,000)
2009-2013 23.42014-2018 22.4
Child deaths ages 1-14 (per 100,000)
2009-2013 17.32014-2018 13.1
Child deaths ages 15-17 (per 100,000)
2009-2013 52.12014-2018 53.7
Unrestrained automobile fatalities for children under 18a
2009-2013 100.0%2014-2018 0%
Substance abuse hospitalizations ages 1-19 (per 100,000)b
2008-2012 9.2*
2013-2017 15.6*
Mental/behavioral hospitalizations (not substance abuse) ages 1-19 (per 10,000)
2008-2012 52.6
2013-2017 62.2
Uninsured children2013 10.3%2017 8.9%
School attendance, grades 9-122014 93.9%2018 93.8%
Contextual IndicatorsCounty Seat: Cassville
79Population: 35,493
2016
County Composite Rank
2020
79
Demographics
Total population2014 35,6622018 35,493
Child population under 182014 8,3722018 8,141
Children under 18 as % of total population
2014 22.9%2018 22.7%
Child population under 62014 2,6602018 2,589
Children under 6 as % of total population
2014 7.4%2018 7.2%
Minority child population under 18
2014 1,6532018 1,916
Minority child population under 18 as % of child population
2014 20.2%2018 23.5%
Minority child population under 6
2014 6012018 718
Minority child population under 6 as % of under 6 child population
2014 22.6%
2018 27.7%
Children in single-parent families
2009-2013 28.0%2014-2018 32.8%
Children in married-parent families
2009-2013 70.4%2014-2018 66.4%
Economic Well-being
Children in poverty under 62014 37.0%2018 33.2%
Children in poverty, ages 5-172009-2013 33.0%2014-2018 25.5%
Housing cost-burdened households
2009-2013 25.5%2014-2018 27.0%
Family households with children under 18 at 185% of poverty level
2009-2013 49.7%
2014-2018 50.2%
Children in families receiving SNAP
2014 47.0%2018 39.9%
Median income family household with children under 18
2009-2013 $43,317
2014-2018 $44,750
Adult unemployment2014 6.1%2018 3.0%
Child homelessness2014 3.0%2018 4.9%
a If no % listed, no vehicle fatalities happened in the county during that period.b *Indicates unstable rate due to low count (<20 cases);** indicates very unstable rate due to very low count (<5 cases)

Outcome MeasuresNumber Rate Trend Rank
2014 2018 2014 2018 State Rate
County Rank
Economic Well-BeingChildren under 18 in poverty 827 642 28.1% 23.9% é 18.3% 71
Food insecurity for childrenb 780 610 24.5% 20.9% é 17.5% 87
HealthLow birthweight infantsa,c 55 58 7.7% 8.4% ê 8.5% 73
Preventable hospitalizations for all causes for children under 18 (per 1,000)b,c
32 19 10.0 6.7 é 7.1 66
Child asthma ER rates (per 1,000)b
9 18 2.8 6.3 ê 7.5 98
Family & CommunityBirths to teens, ages 15-19 (per 1,000)
17 13 41.3 35.7 é 21.6 91
Substantiated child abuse/neglect cases (per 1,000)a
31 7 9.9 2.5 é 4.0 16
EducationHigh school graduation 154 138 93.3% 87.3% ê 91.3% 108
Achievement proficiencya,d
3rd grade English/Language Arts (MAP) 52 41.6% 48.6%
8th grade English/Language Arts (MAP)
72 50.0% 49.0%
4th grade Math (MAP) 68 49.6% 45.8%
Algebra I (End of Course exam) 54 41.2% 47.0%
Trend: é better ê worse è no change
Barton CountyCounty Seat: Lamar
100Population: 11,850
2016
County Composite Rank
68
2020
a Outcome not included in County Composite Rank.b Data based on 2013 and 2017.c Data based on 5-year time spans, 2009-2013 and 2014-2018.d Achievement proficiency measures those that scored proficient or above on the MAP tests and Algebra I End of Course exam. Achievement data from 2014 are not shown due to differences in testing standards and assessments used in 2018; accordingly, no trend arrows or county ranks are shown.
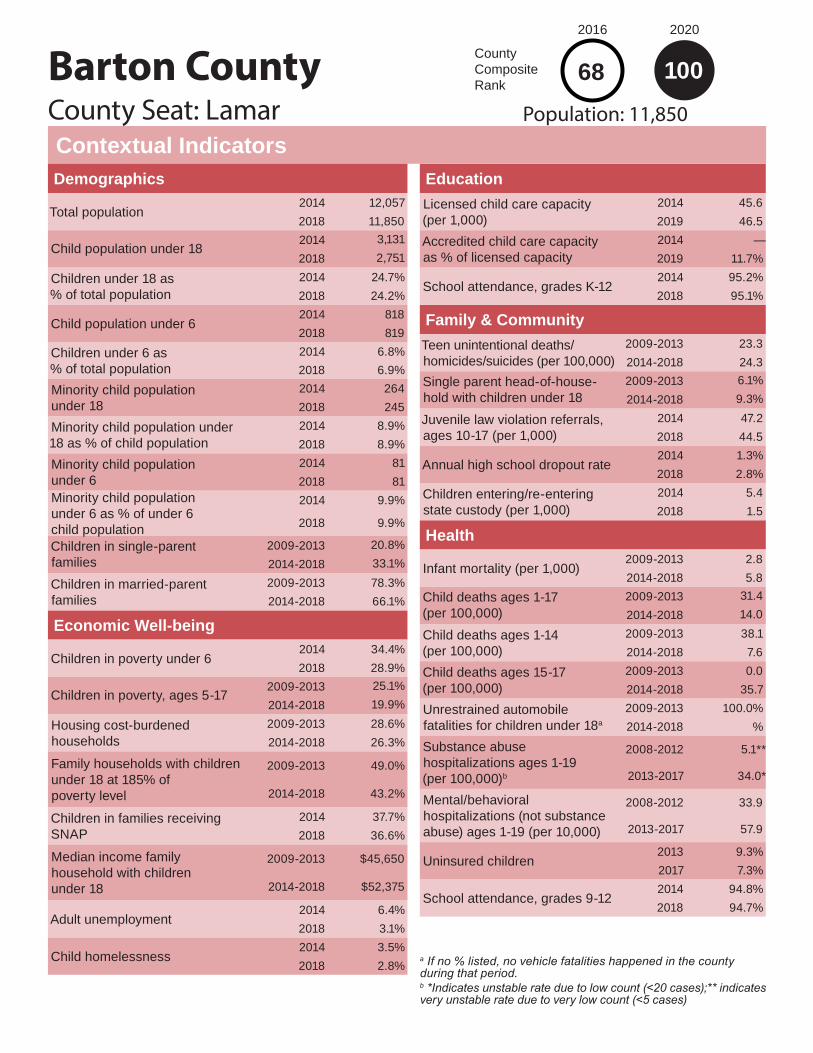
Barton County
EducationLicensed child care capacity (per 1,000)
2014 45.62019 46.5
Accredited child care capacity as % of licensed capacity
2014 —2019 11.7%
School attendance, grades K-122014 95.2%2018 95.1%
Family & CommunityTeen unintentional deaths/homicides/suicides (per 100,000)
2009-2013 23.32014-2018 24.3
Single parent head-of-house-hold with children under 18
2009-2013 6.1%2014-2018 9.3%
Juvenile law violation referrals, ages 10-17 (per 1,000)
2014 47.22018 44.5
Annual high school dropout rate2014 1.3%2018 2.8%
Children entering/re-entering state custody (per 1,000)
2014 5.42018 1.5
Health
Infant mortality (per 1,000)2009-2013 2.82014-2018 5.8
Child deaths ages 1-17 (per 100,000)
2009-2013 31.42014-2018 14.0
Child deaths ages 1-14 (per 100,000)
2009-2013 38.12014-2018 7.6
Child deaths ages 15-17 (per 100,000)
2009-2013 0.02014-2018 35.7
Unrestrained automobile fatalities for children under 18a
2009-2013 100.0%2014-2018 %
Substance abuse hospitalizations ages 1-19 (per 100,000)b
2008-2012 5.1**
2013-2017 34.0*
Mental/behavioral hospitalizations (not substance abuse) ages 1-19 (per 10,000)
2008-2012 33.9
2013-2017 57.9
Uninsured children2013 9.3%2017 7.3%
School attendance, grades 9-122014 94.8%2018 94.7%
Contextual IndicatorsCounty Seat: Lamar
100Population: 11,850
2016
County Composite Rank
2020
68
Demographics
Total population2014 12,0572018 11,850
Child population under 182014 3,1312018 2,751
Children under 18 as % of total population
2014 24.7%2018 24.2%
Child population under 62014 8182018 819
Children under 6 as % of total population
2014 6.8%2018 6.9%
Minority child population under 18
2014 2642018 245
Minority child population under 18 as % of child population
2014 8.9%2018 8.9%
Minority child population under 6
2014 812018 81
Minority child population under 6 as % of under 6 child population
2014 9.9%
2018 9.9%
Children in single-parent families
2009-2013 20.8%2014-2018 33.1%
Children in married-parent families
2009-2013 78.3%2014-2018 66.1%
Economic Well-being
Children in poverty under 62014 34.4%2018 28.9%
Children in poverty, ages 5-172009-2013 25.1%2014-2018 19.9%
Housing cost-burdened households
2009-2013 28.6%2014-2018 26.3%
Family households with children under 18 at 185% of poverty level
2009-2013 49.0%
2014-2018 43.2%
Children in families receiving SNAP
2014 37.7%2018 36.6%
Median income family household with children under 18
2009-2013 $45,650
2014-2018 $52,375
Adult unemployment2014 6.4%2018 3.1%
Child homelessness2014 3.5%2018 2.8%
a If no % listed, no vehicle fatalities happened in the county during that period.b *Indicates unstable rate due to low count (<20 cases);** indicates very unstable rate due to very low count (<5 cases)

Outcome MeasuresNumber Rate Trend Rank
2014 2018 2014 2018 State Rate
County Rank
Economic Well-BeingChildren under 18 in poverty 1,003 748 25.9% 20.3% é 18.3% 43
Food insecurity for childrenb 980 720 23.7% 18.1% é 17.5% 39
HealthLow birthweight infantsa,c 83 61 8.5% 6.6% é 8.5% 19
Preventable hospitalizations for all causes for children under 18 (per 1,000)b,c
45 26 10.9 6.7 é 7.1 67
Child asthma ER rates (per 1,000)b
36 25 8.7 6.4 é 7.5 101
Family & CommunityBirths to teens, ages 15-19 (per 1,000)
18 15 37.4 32 é 21.6 79
Substantiated child abuse/neglect cases (per 1,000)a
29 16 7.1 4.2 é 4.0 42
EducationHigh school graduation 161 184 92.5% 94.8% é 91.3% 42
Achievement proficiencya,d
3rd grade English/Language Arts (MAP) 105 51.5% 48.6%
8th grade English/Language Arts (MAP)
91 42.9% 49.0%
4th grade Math (MAP) 99 49.7% 45.8%
Algebra I (End of Course exam) 74 35.9% 47.0%
Trend: é better ê worse è no change
Bates CountyCounty Seat: Butler
67Population: 16,374
2016
County Composite Rank
93
2020
a Outcome not included in County Composite Rank.b Data based on 2013 and 2017.c Data based on 5-year time spans, 2009-2013 and 2014-2018.d Achievement proficiency measures those that scored proficient or above on the MAP tests and Algebra I End of Course exam. Achievement data from 2014 are not shown due to differences in testing standards and assessments used in 2018; accordingly, no trend arrows or county ranks are shown.

Bates County
EducationLicensed child care capacity (per 1,000)
2014 54.72019 39.9
Accredited child care capacity as % of licensed capacity
2014 —2019 13.2%
School attendance, grades K-122014 95.6%2018 95.4%
Family & CommunityTeen unintentional deaths/homicides/suicides (per 100,000)
2009-2013 17.72014-2018 0.0
Single parent head-of-house-hold with children under 18
2009-2013 7.6%2014-2018 9.3%
Juvenile law violation referrals, ages 10-17 (per 1,000)
2014 27.52018 35.6
Annual high school dropout rate2014 0.5%2018 1.0%
Children entering/re-entering state custody (per 1,000)
2014 4.22018 4.7
Health
Infant mortality (per 1,000)2009-2013 3.12014-2018 3.3
Child deaths ages 1-17 (per 100,000)
2009-2013 33.92014-2018 20.4
Child deaths ages 1-14 (per 100,000)
2009-2013 35.22014-2018 21.4
Child deaths ages 15-17 (per 100,000)
2009-2013 27.32014-2018 0.0
Unrestrained automobile fatalities for children under 18a
2009-2013 100.0%2014-2018 %
Substance abuse hospitalizations ages 1-19 (per 100,000)b
2008-2012 7.8**
2013-2017 16.5**
Mental/behavioral hospitalizations (not substance abuse) ages 1-19 (per 10,000)
2008-2012 52.5
2013-2017 52.4
Uninsured children2013 8.6%2017 6.7%
School attendance, grades 9-122014 94.8%2018 94.7%
Contextual IndicatorsCounty Seat: Butler
67Population: 16,374
2016
County Composite Rank
2020
93
Demographics
Total population2014 16,5842018 16,374
Child population under 182014 4,1052018 3,805
Children under 18 as % of total population
2014 24.1%2018 23.9%
Child population under 62014 1,1872018 1,168
Children under 6 as % of total population
2014 7.2%2018 7.2%
Minority child population under 18
2014 2772018 265
Minority child population under 18 as % of child population
2014 6.9%2018 7.0%
Minority child population under 6
2014 1192018 93
Minority child population under 6 as % of under 6 child population
2014 10.0%
2018 8.0%
Children in single-parent families
2009-2013 25.9%2014-2018 30.2%
Children in married-parent families
2009-2013 72.4%2014-2018 68.3%
Economic Well-being
Children in poverty under 62014 18.0%2018 18.8%
Children in poverty, ages 5-172009-2013 24.3%2014-2018 18.7%
Housing cost-burdened households
2009-2013 32.9%2014-2018 24.4%
Family households with children under 18 at 185% of poverty level
2009-2013 46.4%
2014-2018 41.5%
Children in families receiving SNAP
2014 33.5%2018 28.5%
Median income family household with children under 18
2009-2013 $44,635
2014-2018 $60,179
Adult unemployment2014 7.0%2018 3.8%
Child homelessness2014 0.4%2018 0.0%
a If no % listed, no vehicle fatalities happened in the county during that period.b *Indicates unstable rate due to low count (<20 cases);** indicates very unstable rate due to very low count (<5 cases)

Outcome MeasuresNumber Rate Trend Rank
2014 2018 2014 2018 State Rate
County Rank
Economic Well-BeingChildren under 18 in poverty 995 1,094 30.8% 33.7% ê 18.3% 103
Food insecurity for childrenb 880 720 25.8% 21.5% é 17.5% 92
HealthLow birthweight infantsa,c 54 68 6.9% 8.0% ê 8.5% 59
Preventable hospitalizations for all causes for children under 18 (per 1,000)b,c
27 30 7.9 9.2 ê 7.1 101
Child asthma ER rates (per 1,000)b
17 8 5.0 2.4 é 7.5 31
Family & CommunityBirths to teens, ages 15-19 (per 1,000)
16 20 35.5 44.1 ê 21.6 106
Substantiated child abuse/neglect cases (per 1,000)a
16 20 4.8 6.0 ê 4.0 70
EducationHigh school graduation 172 153 94.0% 90.0% ê 91.3% 94
Achievement proficiencya,d
3rd grade English/Language Arts (MAP) 74 46.3% 48.6%
8th grade English/Language Arts (MAP)
76 45.2% 49.0%
4th grade Math (MAP) 79 41.8% 45.8%
Algebra I (End of Course exam) 72 47.4% 47.0%
Trend: é better ê worse è no change
Benton CountyCounty Seat: Warsaw
107Population: 18,989
2016
County Composite Rank
76
2020
a Outcome not included in County Composite Rank.b Data based on 2013 and 2017.c Data based on 5-year time spans, 2009-2013 and 2014-2018.d Achievement proficiency measures those that scored proficient or above on the MAP tests and Algebra I End of Course exam. Achievement data from 2014 are not shown due to differences in testing standards and assessments used in 2018; accordingly, no trend arrows or county ranks are shown.

Benton County
EducationLicensed child care capacity (per 1,000)
2014 68.22019 90.4
Accredited child care capacity as % of licensed capacity
2014 —2019 0.0%
School attendance, grades K-122014 94.7%2018 94.6%
Family & CommunityTeen unintentional deaths/homicides/suicides (per 100,000)
2009-2013 20.32014-2018 80.5
Single parent head-of-house-hold with children under 18
2009-2013 5.0%2014-2018 4.4%
Juvenile law violation referrals, ages 10-17 (per 1,000)
2014 37.72018 43.6
Annual high school dropout rate2014 2.1%2018 1.2%
Children entering/re-entering state custody (per 1,000)
2014 4.22018 3.9
Health
Infant mortality (per 1,000)2009-2013 5.12014-2018 7.1
Child deaths ages 1-17 (per 100,000)
2009-2013 29.42014-2018 24.0
Child deaths ages 1-14 (per 100,000)
2009-2013 14.52014-2018 6.5
Child deaths ages 15-17 (per 100,000)
2009-2013 90.82014-2018 91.7
Unrestrained automobile fatalities for children under 18a
2009-2013 0.0%2014-2018 0%
Substance abuse hospitalizations ages 1-19 (per 100,000)b
2008-2012 9.6**
2013-2017 19.7**
Mental/behavioral hospitalizations (not substance abuse) ages 1-19 (per 10,000)
2008-2012 114.6
2013-2017 136.2
Uninsured children2013 11.6%2017 6.9%
School attendance, grades 9-122014 93.8%2018 94.1%
Contextual IndicatorsCounty Seat: Warsaw
107Population: 18,989
2016
County Composite Rank
2020
76
Demographics
Total population2014 18,8062018 18,989
Child population under 182014 3,3582018 3,328
Children under 18 as % of total population
2014 17.7%2018 17.5%
Child population under 62014 9092018 1,013
Children under 6 as % of total population
2014 4.8%2018 5.3%
Minority child population under 18
2014 2032018 258
Minority child population under 18 as % of child population
2014 6.1%2018 7.8%
Minority child population under 6
2014 612018 84
Minority child population under 6 as % of under 6 child population
2014 6.7%
2018 8.3%
Children in single-parent families
2009-2013 27.4%2014-2018 28.3%
Children in married-parent families
2009-2013 72.5%2014-2018 70.8%
Economic Well-being
Children in poverty under 62014 30.3%2018 22.8%
Children in poverty, ages 5-172009-2013 28.4%2014-2018 31.8%
Housing cost-burdened households
2009-2013 29.2%2014-2018 27.2%
Family households with children under 18 at 185% of poverty level
2009-2013 55.6%
2014-2018 47.8%
Children in families receiving SNAP
2014 44.9%2018 40.8%
Median income family household with children under 18
2009-2013 $40,161
2014-2018 $52,664
Adult unemployment2014 7.6%2018 4.5%
Child homelessness2014 4.3%2018 5.0%
a If no % listed, no vehicle fatalities happened in the county during that period.b *Indicates unstable rate due to low count (<20 cases);** indicates very unstable rate due to very low count (<5 cases)

Outcome MeasuresNumber Rate Trend Rank
2014 2018 2014 2018 State Rate
County Rank
Economic Well-BeingChildren under 18 in poverty 770 549 28.5% 21.9% é 18.3% 55
Food insecurity for childrenb 690 570 24.1% 20.7% é 17.5% 84
HealthLow birthweight infantsa,c 43 47 6.3% 7.2% ê 8.5% 31
Preventable hospitalizations for all causes for children under 18 (per 1,000)b,c
30 18 10.5 6.7 é 7.1 65
Child asthma ER rates (per 1,000)b
9 10 3.1 3.7 ê 7.5 60
Family & CommunityBirths to teens, ages 15-19 (per 1,000)
17 10 48.3 30.4 é 21.6 73
Substantiated child abuse/neglect cases (per 1,000)a
14 28 5.0 10.9 ê 4.0 103
EducationHigh school graduation 118 136 95.2% 95.8% é 91.3% 29
Achievement proficiencya,d
3rd grade English/Language Arts (MAP) 61 43.6% 48.6%
8th grade English/Language Arts (MAP)
70 50.7% 49.0%
4th grade Math (MAP) 58 42.3% 45.8%
Algebra I (End of Course exam) 45 36.9% 47.0%
Trend: é better ê worse è no change
Bollinger CountyCounty Seat: Marble Hill
61Population: 12,281
2016
County Composite Rank
70
2020
a Outcome not included in County Composite Rank.b Data based on 2013 and 2017.c Data based on 5-year time spans, 2009-2013 and 2014-2018.d Achievement proficiency measures those that scored proficient or above on the MAP tests and Algebra I End of Course exam. Achievement data from 2014 are not shown due to differences in testing standards and assessments used in 2018; accordingly, no trend arrows or county ranks are shown.

Bollinger County
EducationLicensed child care capacity (per 1,000)
2014 67.72019 42.7
Accredited child care capacity as % of licensed capacity
2014 —2019 0.0%
School attendance, grades K-122014 95.3%2018 94.9%
Family & CommunityTeen unintentional deaths/homicides/suicides (per 100,000)
2009-2013 49.32014-2018 51.9
Single parent head-of-house-hold with children under 18
2009-2013 6.8%2014-2018 6.2%
Juvenile law violation referrals, ages 10-17 (per 1,000)
2014 32.42018 13.0
Annual high school dropout rate2014 0.0%2018 0.5%
Children entering/re-entering state custody (per 1,000)
2014 4.02018 14.0
Health
Infant mortality (per 1,000)2009-2013 5.82014-2018 4.6
Child deaths ages 1-17 (per 100,000)
2009-2013 14.02014-2018 22.2
Child deaths ages 1-14 (per 100,000)
2009-2013 0.02014-2018 15.8
Child deaths ages 15-17 (per 100,000)
2009-2013 80.32014-2018 40.1
Unrestrained automobile fatalities for children under 18a
2009-2013 0.0%2014-2018 %
Substance abuse hospitalizations ages 1-19 (per 100,000)b
2008-2012 21.8**
2013-2017 5.9**
Mental/behavioral hospitalizations (not substance abuse) ages 1-19 (per 10,000)
2008-2012 42.5
2013-2017 40.3
Uninsured children2013 9.2%2017 7.0%
School attendance, grades 9-122014 94.7%2018 93.8%
Contextual IndicatorsCounty Seat: Marble Hill
61Population: 12,281
2016
County Composite Rank
2020
70
Demographics
Total population2014 12,3942018 12,281
Child population under 182014 2,8162018 2,578
Children under 18 as % of total population
2014 22.4%2018 22.0%
Child population under 62014 8962018 720
Children under 6 as % of total population
2014 7.2%2018 5.9%
Minority child population under 18
2014 972018 132
Minority child population under 18 as % of child population
2014 3.5%2018 5.1%
Minority child population under 6
2014 342018 48
Minority child population under 6 as % of under 6 child population
2014 3.8%
2018 6.7%
Children in single-parent families
2009-2013 23.9%2014-2018 21.1%
Children in married-parent families
2009-2013 75.8%2014-2018 78.9%
Economic Well-being
Children in poverty under 62014 34.8%2018 30.4%
Children in poverty, ages 5-172009-2013 27.3%2014-2018 19.7%
Housing cost-burdened households
2009-2013 27.8%2014-2018 20.9%
Family households with children under 18 at 185% of poverty level
2009-2013 33.9%
2014-2018 33.9%
Children in families receiving SNAP
2014 43.5%2018 41.4%
Median income family household with children under 18
2009-2013 $51,414
2014-2018 $62,344
Adult unemployment2014 6.7%2018 3.6%
Child homelessness2014 1.7%2018 2.8%
a If no % listed, no vehicle fatalities happened in the county during that period.b *Indicates unstable rate due to low count (<20 cases);** indicates very unstable rate due to very low count (<5 cases)

Outcome MeasuresNumber Rate Trend Rank
2014 2018 2014 2018 State Rate
County Rank
Economic Well-BeingChildren under 18 in poverty 6,093 4,720 17.7% 13.2% é 18.3% 11
Food insecurity for childrenb 6,360 5,400 18.4% 15.2% é 17.5% 9
HealthLow birthweight infantsa,c 798 878 7.6% 8.4% ê 8.5% 71
Preventable hospitalizations for all causes for children under 18 (per 1,000)b,c
296 296 8.6 8.2 é 7.1 88
Child asthma ER rates (per 1,000)b
196 232 5.7 6.4 ê 7.5 100
Family & CommunityBirths to teens, ages 15-19 (per 1,000)
95 73 12.6 9.5 é 21.6 8
Substantiated child abuse/neglect cases (per 1,000)a
171 134 4.9 3.7 é 4.0 35
EducationHigh school graduation 1,507 1,583 91.1% 89.9% ê 91.3% 98
Achievement proficiencya,d
3rd grade English/Language Arts (MAP) 843 47.2% 48.6%
8th grade English/Language Arts (MAP)
843 48.4% 49.0%
4th grade Math (MAP) 910 48.5% 45.8%
Algebra I (End of Course exam) 875 49.1% 47.0%
Trend: é better ê worse è no change
Boone CountyCounty Seat: Columbia
33Population: 176,515
2016
County Composite Rank
18
2020
a Outcome not included in County Composite Rank.b Data based on 2013 and 2017.c Data based on 5-year time spans, 2009-2013 and 2014-2018.d Achievement proficiency measures those that scored proficient or above on the MAP tests and Algebra I End of Course exam. Achievement data from 2014 are not shown due to differences in testing standards and assessments used in 2018; accordingly, no trend arrows or county ranks are shown.

Boone County
EducationLicensed child care capacity (per 1,000)
2014 173.42019 179.2
Accredited child care capacity as % of licensed capacity
2014 —2019 29.0%
School attendance, grades K-122014 94.9%2018 94.3%
Family & CommunityTeen unintentional deaths/homicides/suicides (per 100,000)
2009-2013 33.32014-2018 26.4
Single parent head-of-house-hold with children under 18
2009-2013 8.2%2014-2018 7.2%
Juvenile law violation referrals, ages 10-17 (per 1,000)
2014 36.92018 26.0
Annual high school dropout rate2014 1.9%2018 1.9%
Children entering/re-entering state custody (per 1,000)
2014 4.52018 4.5
Health
Infant mortality (per 1,000)2009-2013 4.12014-2018 5.8
Child deaths ages 1-17 (per 100,000)
2009-2013 19.12014-2018 21.2
Child deaths ages 1-14 (per 100,000)
2009-2013 13.12014-2018 16.2
Child deaths ages 15-17 (per 100,000)
2009-2013 52.52014-2018 31.7
Unrestrained automobile fatalities for children under 18a
2009-2013 100.0%2014-2018 66.7%
Substance abuse hospitalizations ages 1-19 (per 100,000)b
2008-2012 16.8
2013-2017 19.2
Mental/behavioral hospitalizations (not substance abuse) ages 1-19 (per 10,000)
2008-2012 59.6
2013-2017 93.6
Uninsured children2013 6.8%2017 5.1%
School attendance, grades 9-122014 93.6%2018 93.1%
Contextual IndicatorsCounty Seat: Columbia
33Population: 176,515
2016
County Composite Rank
2020
18
Demographics
Total population2014 172,7172018 176,515
Child population under 182014 34,9232018 36,565
Children under 18 as % of total population
2014 20.6%2018 20.3%
Child population under 62014 12,3382018 12,634
Children under 6 as % of total population
2014 7.1%2018 7.0%
Minority child population under 18
2014 9,6052018 10,198
Minority child population under 18 as % of child population
2014 27.1%2018 27.9%
Minority child population under 6
2014 3,3532018 3,558
Minority child population under 6 as % of under 6 child population
2014 27.2%
2018 28.2%
Children in single-parent families
2009-2013 29.7%2014-2018 28.6%
Children in married-parent families
2009-2013 69.1%2014-2018 70.5%
Economic Well-being
Children in poverty under 62014 24.3%2018 15.9%
Children in poverty, ages 5-172009-2013 16.5%2014-2018 12.1%
Housing cost-burdened households
2009-2013 35.0%2014-2018 31.9%
Family households with children under 18 at 185% of poverty level
2009-2013 30.6%
2014-2018 28.9%
Children in families receiving SNAP
2014 28.6%2018 26.5%
Median income family household with children under 18
2009-2013 $66,541
2014-2018 $70,473
Adult unemployment2014 4.1%2018 2.3%
Child homelessness2014 1.1%2018 1.3%
a If no % listed, no vehicle fatalities happened in the county during that period.b *Indicates unstable rate due to low count (<20 cases);** indicates very unstable rate due to very low count (<5 cases)

Outcome MeasuresNumber Rate Trend Rank
2014 2018 2014 2018 State Rate
County Rank
Economic Well-BeingChildren under 18 in poverty 5,316 4,325 26.8% 22.4% é 18.3% 58
Food insecurity for childrenb 4,600 3,920 22.0% 19.1% é 17.5% 57
HealthLow birthweight infantsa,c 478 488 7.7% 8.6% ê 8.5% 82
Preventable hospitalizations for all causes for children under 18 (per 1,000)b,c
232 180 11.1 8.9 é 7.1 95
Child asthma ER rates (per 1,000)b
139 111 6.6 5.5 é 7.5 90
Family & CommunityBirths to teens, ages 15-19 (per 1,000)
118 77 43.5 28.5 é 21.6 63
Substantiated child abuse/neglect cases (per 1,000)a
92 113 4.4 5.7 ê 4.0 66
EducationHigh school graduation 768 773 93.0% 83.7% ê 91.3% 114
Achievement proficiencya,d
3rd grade English/Language Arts (MAP) 495 47.9% 48.6%
8th grade English/Language Arts (MAP)
433 45.0% 49.0%
4th grade Math (MAP) 489 44.6% 45.8%
Algebra I (End of Course exam) 387 45.9% 47.0%
Trend: é better ê worse è no change
Buchanan CountyCounty Seat: St. Joseph
101Population: 89,076
2016
County Composite Rank
82
2020
a Outcome not included in County Composite Rank.b Data based on 2013 and 2017.c Data based on 5-year time spans, 2009-2013 and 2014-2018.d Achievement proficiency measures those that scored proficient or above on the MAP tests and Algebra I End of Course exam. Achievement data from 2014 are not shown due to differences in testing standards and assessments used in 2018; accordingly, no trend arrows or county ranks are shown.

Buchanan County
EducationLicensed child care capacity (per 1,000)
2014 93.72019 74.2
Accredited child care capacity as % of licensed capacity
2014 —2019 23.5%
School attendance, grades K-122014 94.0%2018 94.9%
Family & CommunityTeen unintentional deaths/homicides/suicides (per 100,000)
2009-2013 36.52014-2018 65.2
Single parent head-of-house-hold with children under 18
2009-2013 10.3%2014-2018 10.4%
Juvenile law violation referrals, ages 10-17 (per 1,000)
2014 51.52018 39.5
Annual high school dropout rate2014 0.6%2018 4.1%
Children entering/re-entering state custody (per 1,000)
2014 2.12018 3.4
Health
Infant mortality (per 1,000)2009-2013 8.92014-2018 7.4
Child deaths ages 1-17 (per 100,000)
2009-2013 17.22014-2018 21.6
Child deaths ages 1-14 (per 100,000)
2009-2013 16.02014-2018 10.0
Child deaths ages 15-17 (per 100,000)
2009-2013 22.92014-2018 72.8
Unrestrained automobile fatalities for children under 18a
2009-2013 0.0%2014-2018 100%
Substance abuse hospitalizations ages 1-19 (per 100,000)b
2008-2012 21.6
2013-2017 17.1
Mental/behavioral hospitalizations (not substance abuse) ages 1-19 (per 10,000)
2008-2012 101.8
2013-2017 109.8
Uninsured children2013 6.3%2017 4.7%
School attendance, grades 9-122014 91.7%2018 94.3%
Contextual IndicatorsCounty Seat: St. Joseph
101Population: 89,076
2016
County Composite Rank
2020
82
Demographics
Total population2014 89,4862018 89,076
Child population under 182014 20,7922018 19,933
Children under 18 as % of total population
2014 22.9%2018 22.8%
Child population under 62014 7,1212018 6,629
Children under 6 as % of total population
2014 8.0%2018 7.5%
Minority child population under 18
2014 4,2802018 4,270
Minority child population under 18 as % of child population
2014 20.9%2018 21.4%
Minority child population under 6
2014 1,6532018 1,470
Minority child population under 6 as % of under 6 child population
2014 23.2%
2018 22.2%
Children in single-parent families
2009-2013 37.8%2014-2018 39.7%
Children in married-parent families
2009-2013 60.5%2014-2018 59.2%
Economic Well-being
Children in poverty under 62014 32.5%2018 26.6%
Children in poverty, ages 5-172009-2013 25.5%2014-2018 20.5%
Housing cost-burdened households
2009-2013 30.6%2014-2018 24.7%
Family households with children under 18 at 185% of poverty level
2009-2013 40.7%
2014-2018 40.3%
Children in families receiving SNAP
2014 45.4%2018 41.2%
Median income family household with children under 18
2009-2013 $53,466
2014-2018 $54,017
Adult unemployment2014 5.6%2018 3.0%
Child homelessness2014 5.4%2018 4.2%
a If no % listed, no vehicle fatalities happened in the county during that period.b *Indicates unstable rate due to low count (<20 cases);** indicates very unstable rate due to very low count (<5 cases)

Outcome MeasuresNumber Rate Trend Rank
2014 2018 2014 2018 State Rate
County Rank
Economic Well-BeingChildren under 18 in poverty 3,177 2,932 32.2% 30.2% é 18.3% 97
Food insecurity for childrenb 2,510 2,130 25.0% 21.3% é 17.5% 91
HealthLow birthweight infantsa,c 299 277 10.5% 10.5% è 8.5% 108
Preventable hospitalizations for all causes for children under 18 (per 1,000)b,c
316 143 31.4 14.3 é 7.1 112
Child asthma ER rates (per 1,000)b
47 63 4.7 6.3 ê 7.5 96
Family & CommunityBirths to teens, ages 15-19 (per 1,000)
47 61 38.6 49.5 ê 21.6 111
Substantiated child abuse/neglect cases (per 1,000)a
108 104 10.8 10.4 é 4.0 100
EducationHigh school graduation 413 460 87.1% 93.1% é 91.3% 63
Achievement proficiencya,d
3rd grade English/Language Arts (MAP) 317 61.2% 48.6%
8th grade English/Language Arts (MAP)
215 43.2% 49.0%
4th grade Math (MAP) 231 42.8% 45.8%
Algebra I (End of Course exam) 173 29.4% 47.0%
Trend: é better ê worse è no change
Butler CountyCounty Seat: Poplar Bluff
112Population: 42,733
2016
County Composite Rank
111
2020
a Outcome not included in County Composite Rank.b Data based on 2013 and 2017.c Data based on 5-year time spans, 2009-2013 and 2014-2018.d Achievement proficiency measures those that scored proficient or above on the MAP tests and Algebra I End of Course exam. Achievement data from 2014 are not shown due to differences in testing standards and assessments used in 2018; accordingly, no trend arrows or county ranks are shown.
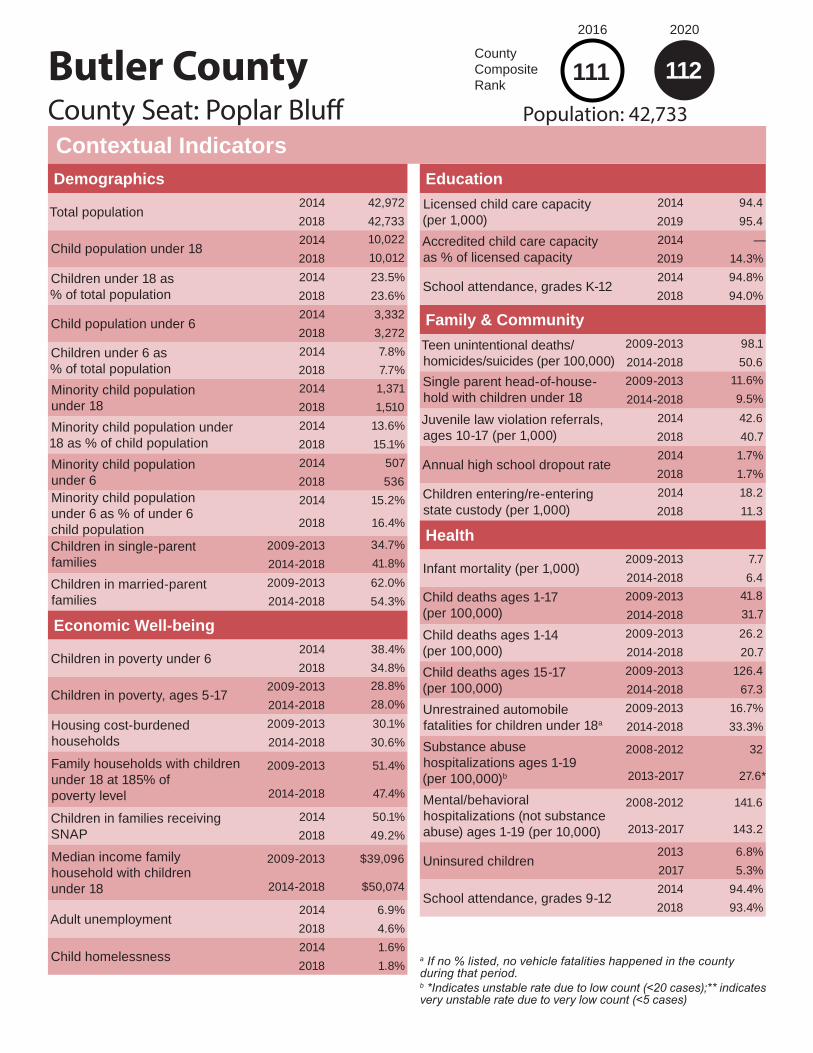
Butler County
EducationLicensed child care capacity (per 1,000)
2014 94.42019 95.4
Accredited child care capacity as % of licensed capacity
2014 —2019 14.3%
School attendance, grades K-122014 94.8%2018 94.0%
Family & CommunityTeen unintentional deaths/homicides/suicides (per 100,000)
2009-2013 98.12014-2018 50.6
Single parent head-of-house-hold with children under 18
2009-2013 11.6%2014-2018 9.5%
Juvenile law violation referrals, ages 10-17 (per 1,000)
2014 42.62018 40.7
Annual high school dropout rate2014 1.7%2018 1.7%
Children entering/re-entering state custody (per 1,000)
2014 18.22018 11.3
Health
Infant mortality (per 1,000)2009-2013 7.72014-2018 6.4
Child deaths ages 1-17 (per 100,000)
2009-2013 41.82014-2018 31.7
Child deaths ages 1-14 (per 100,000)
2009-2013 26.22014-2018 20.7
Child deaths ages 15-17 (per 100,000)
2009-2013 126.42014-2018 67.3
Unrestrained automobile fatalities for children under 18a
2009-2013 16.7%2014-2018 33.3%
Substance abuse hospitalizations ages 1-19 (per 100,000)b
2008-2012 32
2013-2017 27.6*
Mental/behavioral hospitalizations (not substance abuse) ages 1-19 (per 10,000)
2008-2012 141.6
2013-2017 143.2
Uninsured children2013 6.8%2017 5.3%
School attendance, grades 9-122014 94.4%2018 93.4%
Contextual IndicatorsCounty Seat: Poplar Bluff
112Population: 42,733
2016
County Composite Rank
2020
111
Demographics
Total population2014 42,9722018 42,733
Child population under 182014 10,0222018 10,012
Children under 18 as % of total population
2014 23.5%2018 23.6%
Child population under 62014 3,3322018 3,272
Children under 6 as % of total population
2014 7.8%2018 7.7%
Minority child population under 18
2014 1,3712018 1,510
Minority child population under 18 as % of child population
2014 13.6%2018 15.1%
Minority child population under 6
2014 5072018 536
Minority child population under 6 as % of under 6 child population
2014 15.2%
2018 16.4%
Children in single-parent families
2009-2013 34.7%2014-2018 41.8%
Children in married-parent families
2009-2013 62.0%2014-2018 54.3%
Economic Well-being
Children in poverty under 62014 38.4%2018 34.8%
Children in poverty, ages 5-172009-2013 28.8%2014-2018 28.0%
Housing cost-burdened households
2009-2013 30.1%2014-2018 30.6%
Family households with children under 18 at 185% of poverty level
2009-2013 51.4%
2014-2018 47.4%
Children in families receiving SNAP
2014 50.1%2018 49.2%
Median income family household with children under 18
2009-2013 $39,096
2014-2018 $50,074
Adult unemployment2014 6.9%2018 4.6%
Child homelessness2014 1.6%2018 1.8%
a If no % listed, no vehicle fatalities happened in the county during that period.b *Indicates unstable rate due to low count (<20 cases);** indicates very unstable rate due to very low count (<5 cases)
Outcome MeasuresNumber Rate Trend Rank
2014 2018 2014 2018 State Rate
County Rank
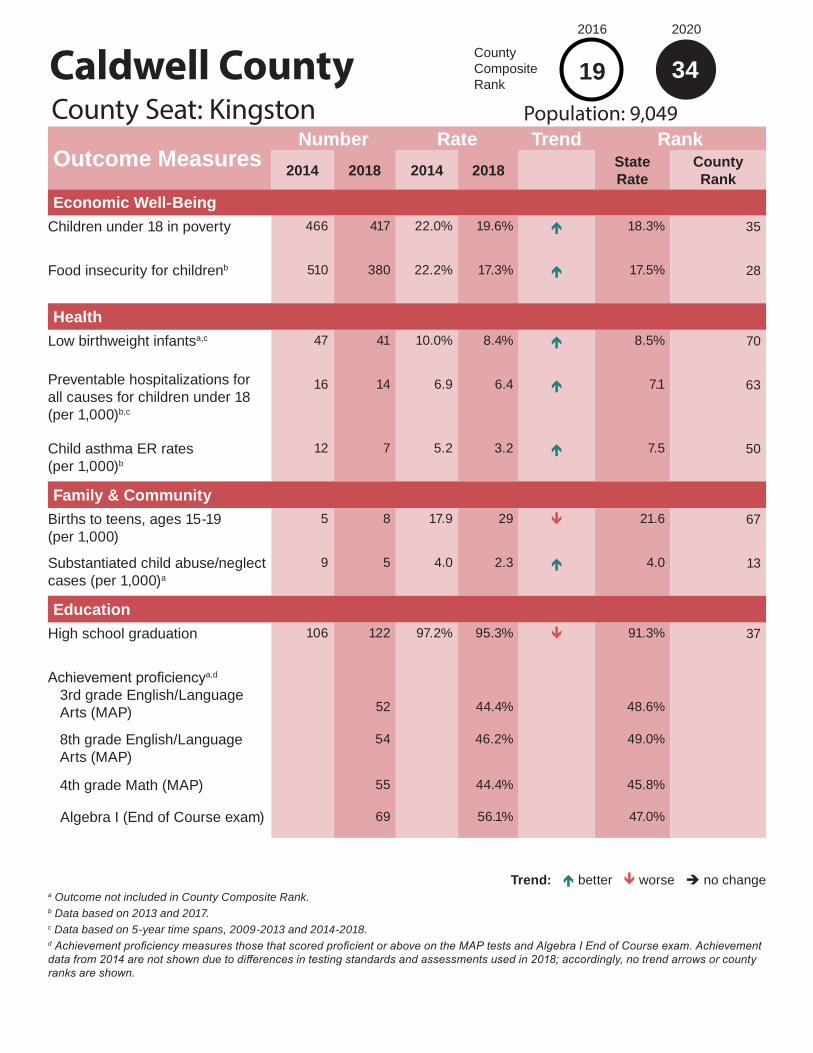
Economic Well-BeingChildren under 18 in poverty 466 417 22.0% 19.6% é 18.3% 35
Food insecurity for childrenb 510 380 22.2% 17.3% é 17.5% 28
HealthLow birthweight infantsa,c 47 41 10.0% 8.4% é 8.5% 70
Preventable hospitalizations for all causes for children under 18 (per 1,000)b,c
16 14 6.9 6.4 é 7.1 63
Child asthma ER rates (per 1,000)b
12 7 5.2 3.2 é 7.5 50
Family & CommunityBirths to teens, ages 15-19 (per 1,000)
5 8 17.9 29 ê 21.6 67
Substantiated child abuse/neglect cases (per 1,000)a
9 5 4.0 2.3 é 4.0 13
EducationHigh school graduation 106 122 97.2% 95.3% ê 91.3% 37
Achievement proficiencya,d
3rd grade English/Language Arts (MAP) 52 44.4% 48.6%
8th grade English/Language Arts (MAP)
54 46.2% 49.0%
4th grade Math (MAP) 55 44.4% 45.8%
Algebra I (End of Course exam) 69 56.1% 47.0%
Trend: é better ê worse è no change
Caldwell CountyCounty Seat: Kingston
34Population: 9,049
2016
County Composite Rank
19
2020
a Outcome not included in County Composite Rank.b Data based on 2013 and 2017.c Data based on 5-year time spans, 2009-2013 and 2014-2018.d Achievement proficiency measures those that scored proficient or above on the MAP tests and Algebra I End of Course exam. Achievement data from 2014 are not shown due to differences in testing standards and assessments used in 2018; accordingly, no trend arrows or county ranks are shown.

Caldwell County
EducationLicensed child care capacity (per 1,000)
2014 37.02019 23.1
Accredited child care capacity as % of licensed capacity
2014 —2019 40.0%
School attendance, grades K-122014 96.0%2018 95.3%
Family & CommunityTeen unintentional deaths/homicides/suicides (per 100,000)
2009-2013 30.82014-2018 32.9
Single parent head-of-house-hold with children under 18
2009-2013 7.5%2014-2018 6.9%
Juvenile law violation referrals, ages 10-17 (per 1,000)
2014 12.32018 28.7
Annual high school dropout rate2014 0.2%2018 1.0%
Children entering/re-entering state custody (per 1,000)
2014 4.62018 4.2
Health
Infant mortality (per 1,000)2009-2013 8.52014-2018 2.0
Child deaths ages 1-17 (per 100,000)
2009-2013 43.42014-2018 9.2
Child deaths ages 1-14 (per 100,000)
2009-2013 53.32014-2018 9.7
Child deaths ages 15-17 (per 100,000)
2009-2013 0.02014-2018 0.0
Unrestrained automobile fatalities for children under 18a
2009-2013 0.0%2014-2018 0%
Substance abuse hospitalizations ages 1-19 (per 100,000)b
2008-2012 0
2013-2017 7.6**
Mental/behavioral hospitalizations (not substance abuse) ages 1-19 (per 10,000)
2008-2012 58.7
2013-2017 59.7
Uninsured children2013 10.6%2017 7.5%
School attendance, grades 9-122014 95.6%2018 95.1%
Contextual IndicatorsCounty Seat: Kingston
34Population: 9,049
2016
County Composite Rank
2020
19
Demographics
Total population2014 9,0342018 9,049
Child population under 182014 2,2522018 2,165
Children under 18 as % of total population
2014 23.9%2018 24.1%
Child population under 62014 5882018 623
Children under 6 as % of total population
2014 6.5%2018 6.8%
Minority child population under 18
2014 922018 107
Minority child population under 18 as % of child population
2014 4.3%2018 4.9%
Minority child population under 6
2014 312018 27
Minority child population under 6 as % of under 6 child population
2014 5.3%
2018 4.3%
Children in single-parent families
2009-2013 30.4%2014-2018 22.4%
Children in married-parent families
2009-2013 69.5%2014-2018 75.4%
Economic Well-being
Children in poverty under 62014 21.5%2018 20.7%
Children in poverty, ages 5-172009-2013 19.8%2014-2018 17.7%
Housing cost-burdened households
2009-2013 28.5%2014-2018 22.9%
Family households with children under 18 at 185% of poverty level
2009-2013 41.2%
2014-2018 39.3%
Children in families receiving SNAP
2014 27.4%2018 27.2%
Median income family household with children under 18
2009-2013 $52,813
2014-2018 $62,250
Adult unemployment2014 5.6%2018 3.1%
Child homelessness2014 0.8%2018 1.8%
a If no % listed, no vehicle fatalities happened in the county during that period.b *Indicates unstable rate due to low count (<20 cases);** indicates very unstable rate due to very low count (<5 cases)

Outcome MeasuresNumber Rate Trend Rank
2014 2018 2014 2018 State Rate
County Rank
Economic Well-BeingChildren under 18 in poverty 1,868 1,567 20.4% 17.5% é 18.3% 30
Food insecurity for childrenb 1,960 1,660 19.9% 17.3% é 17.5% 28
HealthLow birthweight infantsa,c 236 189 9.3% 7.7% é 8.5% 49
Preventable hospitalizations for all causes for children under 18 (per 1,000)b,c
86 81 8.7 8.6 é 7.1 93
Child asthma ER rates (per 1,000)b
86 82 8.7 8.7 è 7.5 111
Family & CommunityBirths to teens, ages 15-19 (per 1,000)
36 36 21.7 22.7 ê 21.6 42
Substantiated child abuse/neglect cases (per 1,000)a
68 87 6.9 9.3 ê 4.0 95
EducationHigh school graduation 317 351 85.4% 90.2% é 91.3% 92
Achievement proficiencya,d
3rd grade English/Language Arts (MAP) 181 51.4% 48.6%
8th grade English/Language Arts (MAP)
148 39.6% 49.0%
4th grade Math (MAP) 183 45.6% 45.8%
Algebra I (End of Course exam) 163 45.2% 47.0%
Trend: é better ê worse è no change
Callaway CountyCounty Seat: Fulton
85Population: 44,840
2016
County Composite Rank
67
2020
a Outcome not included in County Composite Rank.b Data based on 2013 and 2017.c Data based on 5-year time spans, 2009-2013 and 2014-2018.d Achievement proficiency measures those that scored proficient or above on the MAP tests and Algebra I End of Course exam. Achievement data from 2014 are not shown due to differences in testing standards and assessments used in 2018; accordingly, no trend arrows or county ranks are shown.

Callaway County
EducationLicensed child care capacity (per 1,000)
2014 83.02019 95.1
Accredited child care capacity as % of licensed capacity
2014 —2019 4.0%
School attendance, grades K-122014 95.0%2018 94.4%
Family & CommunityTeen unintentional deaths/homicides/suicides (per 100,000)
2009-2013 53.62014-2018 37.0
Single parent head-of-house-hold with children under 18
2009-2013 9.0%2014-2018 9.2%
Juvenile law violation referrals, ages 10-17 (per 1,000)
2014 37.02018 32.2
Annual high school dropout rate2014 3.3%2018 1.3%
Children entering/re-entering state custody (per 1,000)
2014 9.72018 7.0
Health
Infant mortality (per 1,000)2009-2013 7.92014-2018 5.7
Child deaths ages 1-17 (per 100,000)
2009-2013 30.42014-2018 31.6
Child deaths ages 1-14 (per 100,000)
2009-2013 27.22014-2018 24.7
Child deaths ages 15-17 (per 100,000)
2009-2013 44.52014-2018 43.5
Unrestrained automobile fatalities for children under 18a
2009-2013 100.0%2014-2018 60%
Substance abuse hospitalizations ages 1-19 (per 100,000)b
2008-2012 10.7*
2013-2017 27.7*
Mental/behavioral hospitalizations (not substance abuse) ages 1-19 (per 10,000)
2008-2012 84.8
2013-2017 113.7
Uninsured children2013 6.9%2017 5.2%
School attendance, grades 9-122014 93.7%2018 93.1%
Contextual IndicatorsCounty Seat: Fulton
85Population: 44,840
2016
County Composite Rank
2020
67
Demographics
Total population2014 44,7502018 44,840
Child population under 182014 9,8232018 9,401
Children under 18 as % of total population
2014 21.5%2018 21.2%
Child population under 62014 3,0382018 2,952
Children under 6 as % of total population
2014 6.8%2018 6.6%
Minority child population under 18
2014 9822018 1,048
Minority child population under 18 as % of child population
2014 10.2%2018 11.1%
Minority child population under 6
2014 3322018 390
Minority child population under 6 as % of under 6 child population
2014 10.9%
2018 13.2%
Children in single-parent families
2009-2013 29.0%2014-2018 35.2%
Children in married-parent families
2009-2013 69.7%2014-2018 62.9%
Economic Well-being
Children in poverty under 62014 21.7%2018 19.2%
Children in poverty, ages 5-172009-2013 18.6%2014-2018 15.1%
Housing cost-burdened households
2009-2013 25.2%2014-2018 22.3%
Family households with children under 18 at 185% of poverty level
2009-2013 32.9%
2014-2018 34.7%
Children in families receiving SNAP
2014 32.0%2018 29.2%
Median income family household with children under 18
2009-2013 $56,818
2014-2018 $65,461
Adult unemployment2014 5.6%2018 2.9%
Child homelessness2014 2.1%2018 1.1%
a If no % listed, no vehicle fatalities happened in the county during that period.b *Indicates unstable rate due to low count (<20 cases);** indicates very unstable rate due to very low count (<5 cases)

Outcome MeasuresNumber Rate Trend Rank
2014 2018 2014 2018 State Rate
County Rank
Economic Well-BeingChildren under 18 in poverty 2,095 1,781 27.1% 22.9% é 18.3% 64
Food insecurity for childrenb 2,240 1,710 26.9% 20.9% é 17.5% 87
HealthLow birthweight infantsa,c 127 133 6.2% 6.6% ê 8.5% 18
Preventable hospitalizations for all causes for children under 18 (per 1,000)b,c
38 31 4.6 3.8 é 7.1 16
Child asthma ER rates (per 1,000)b
36 26 4.3 3.2 é 7.5 47
Family & CommunityBirths to teens, ages 15-19 (per 1,000)
37 19 34.5 16.9 é 21.6 21
Substantiated child abuse/neglect cases (per 1,000)a
93 55 11.2 6.8 é 4.0 78
EducationHigh school graduation 409 380 94.5% 91.3% ê 91.3% 87
Achievement proficiencya,d
3rd grade English/Language Arts (MAP) 189 51.4% 48.6%
8th grade English/Language Arts (MAP)
190 47.3% 49.0%
4th grade Math (MAP) 166 42.2% 45.8%
Algebra I (End of Course exam) 120 30.5% 47.0%
Trend: é better ê worse è no change
Camden CountyCounty Seat: Camdenton
44Population: 45,096
2016
County Composite Rank
58
2020
a Outcome not included in County Composite Rank.b Data based on 2013 and 2017.c Data based on 5-year time spans, 2009-2013 and 2014-2018.d Achievement proficiency measures those that scored proficient or above on the MAP tests and Algebra I End of Course exam. Achievement data from 2014 are not shown due to differences in testing standards and assessments used in 2018; accordingly, no trend arrows or county ranks are shown.

Camden County
EducationLicensed child care capacity (per 1,000)
2014 95.32019 90.6
Accredited child care capacity as % of licensed capacity
2014 —2019 2.7%
School attendance, grades K-122014 94.1%2018 94.1%
Family & CommunityTeen unintentional deaths/homicides/suicides (per 100,000)
2009-2013 60.12014-2018 32.7
Single parent head-of-house-hold with children under 18
2009-2013 6.7%2014-2018 4.3%
Juvenile law violation referrals, ages 10-17 (per 1,000)
2014 21.02018 17.8
Annual high school dropout rate2014 1.4%2018 1.9%
Children entering/re-entering state custody (per 1,000)
2014 5.82018 6.9
Health
Infant mortality (per 1,000)2009-2013 5.92014-2018 6.5
Child deaths ages 1-17 (per 100,000)
2009-2013 24.02014-2018 44.8
Child deaths ages 1-14 (per 100,000)
2009-2013 20.72014-2018 47.8
Child deaths ages 15-17 (per 100,000)
2009-2013 40.72014-2018 0.0
Unrestrained automobile fatalities for children under 18a
2009-2013 100.0%2014-2018 20%
Substance abuse hospitalizations ages 1-19 (per 100,000)b
2008-2012 11.5*
2013-2017 27.2*
Mental/behavioral hospitalizations (not substance abuse) ages 1-19 (per 10,000)
2008-2012 48.9
2013-2017 77.3
Uninsured children2013 10.3%2017 7.2%
School attendance, grades 9-122014 92.8%2018 92.7%
Contextual IndicatorsCounty Seat: Camdenton
44Population: 45,096
2016
County Composite Rank
2020
58
Demographics
Total population2014 44,0212018 45,096
Child population under 182014 8,2822018 8,111
Children under 18 as % of total population
2014 18.3%2018 17.8%
Child population under 62014 2,4212018 2,467
Children under 6 as % of total population
2014 5.5%2018 5.4%
Minority child population under 18
2014 7592018 840
Minority child population under 18 as % of child population
2014 9.4%2018 10.4%
Minority child population under 6
2014 2802018 274
Minority child population under 6 as % of under 6 child population
2014 11.6%
2018 11.1%
Children in single-parent families
2009-2013 36.2%2014-2018 22.8%
Children in married-parent families
2009-2013 62.6%2014-2018 74.0%
Economic Well-being
Children in poverty under 62014 28.0%2018 28.8%
Children in poverty, ages 5-172009-2013 24.6%2014-2018 21.4%
Housing cost-burdened households
2009-2013 29.3%2014-2018 27.8%
Family households with children under 18 at 185% of poverty level
2009-2013 51.4%
2014-2018 39.1%
Children in families receiving SNAP
2014 39.0%2018 34.2%
Median income family household with children under 18
2009-2013 $40,590
2014-2018 $59,819
Adult unemployment2014 8.0%2018 4.2%
Child homelessness2014 8.5%2018 15.2%
a If no % listed, no vehicle fatalities happened in the county during that period.b *Indicates unstable rate due to low count (<20 cases);** indicates very unstable rate due to very low count (<5 cases)

Outcome MeasuresNumber Rate Trend Rank
2014 2018 2014 2018 State Rate
County Rank
Economic Well-BeingChildren under 18 in poverty 3,364 2,816 20.5% 17.2% é 18.3% 28
Food insecurity for childrenb 3,490 2,910 20.9% 17.4% é 17.5% 32
HealthLow birthweight infantsa,c 397 383 8.6% 8.4% é 8.5% 75
Preventable hospitalizations for all causes for children under 18 (per 1,000)b,c
167 102 10.0 6.1 é 7.1 55
Child asthma ER rates (per 1,000)b
84 91 5.0 5.4 ê 7.5 84
Family & CommunityBirths to teens, ages 15-19 (per 1,000)
54 50 18.2 16.6 é 21.6 20
Substantiated child abuse/neglect cases (per 1,000)a
103 73 6.2 4.4 é 4.0 45
EducationHigh school graduation 655 639 91.0% 92.2% é 91.3% 78
Achievement proficiencya,d
3rd grade English/Language Arts (MAP) 407 50.6% 48.6%
8th grade English/Language Arts (MAP)
396 51.3% 49.0%
4th grade Math (MAP) 371 46.4% 45.8%
Algebra I (End of Course exam) 438 58.2% 47.0%
Trend: é better ê worse è no change
Cape Girardeau CountyCounty Seat: Jackson
37Population: 78,324
2016
County Composite Rank
36
2020
a Outcome not included in County Composite Rank.b Data based on 2013 and 2017.c Data based on 5-year time spans, 2009-2013 and 2014-2018.d Achievement proficiency measures those that scored proficient or above on the MAP tests and Algebra I End of Course exam. Achievement data from 2014 are not shown due to differences in testing standards and assessments used in 2018; accordingly, no trend arrows or county ranks are shown.

Cape Girardeau County
EducationLicensed child care capacity (per 1,000)
2014 99.22019 93.6
Accredited child care capacity as % of licensed capacity
2014 —2019 10.7%
School attendance, grades K-122014 95.5%2018 95.2%
Family & CommunityTeen unintentional deaths/homicides/suicides (per 100,000)
2009-2013 23.52014-2018 28.4
Single parent head-of-house-hold with children under 18
2009-2013 9.1%2014-2018 7.7%
Juvenile law violation referrals, ages 10-17 (per 1,000)
2014 28.72018 34.7
Annual high school dropout rate2014 2.1%2018 1.8%
Children entering/re-entering state custody (per 1,000)
2014 6.82018 8.1
Health
Infant mortality (per 1,000)2009-2013 7.82014-2018 5.7
Child deaths ages 1-17 (per 100,000)
2009-2013 25.22014-2018 25.1
Child deaths ages 1-14 (per 100,000)
2009-2013 21.62014-2018 18.4
Child deaths ages 15-17 (per 100,000)
2009-2013 37.72014-2018 44.3
Unrestrained automobile fatalities for children under 18a
2009-2013 75.0%2014-2018 100%
Substance abuse hospitalizations ages 1-19 (per 100,000)b
2008-2012 11.9*
2013-2017 19.1
Mental/behavioral hospitalizations (not substance abuse) ages 1-19 (per 10,000)
2008-2012 52.6
2013-2017 67.6
Uninsured children2013 6.1%2017 4.6%
School attendance, grades 9-122014 94.3%2018 93.8%
Contextual IndicatorsCounty Seat: Jackson
37Population: 78,324
2016
County Composite Rank
2020
36
Demographics
Total population2014 78,0432018 78,324
Child population under 182014 16,6742018 16,776
Children under 18 as % of total population
2014 21.6%2018 21.4%
Child population under 62014 5,4942018 5,459
Children under 6 as % of total population
2014 7.0%2018 6.9%
Minority child population under 18
2014 3,3142018 3,330
Minority child population under 18 as % of child population
2014 19.7%2018 19.8%
Minority child population under 6
2014 1,2532018 1,161
Minority child population under 6 as % of under 6 child population
2014 22.8%
2018 21.3%
Children in single-parent families
2009-2013 32.9%2014-2018 31.1%
Children in married-parent families
2009-2013 65.8%2014-2018 67.5%
Economic Well-being
Children in poverty under 62014 33.1%2018 19.8%
Children in poverty, ages 5-172009-2013 18.4%2014-2018 16.0%
Housing cost-burdened households
2009-2013 28.3%2014-2018 28.2%
Family households with children under 18 at 185% of poverty level
2009-2013 36.4%
2014-2018 32.0%
Children in families receiving SNAP
2014 33.9%2018 32.7%
Median income family household with children under 18
2009-2013 $57,070
2014-2018 $65,945
Adult unemployment2014 5.4%2018 2.8%
Child homelessness2014 3.5%2018 4.8%
a If no % listed, no vehicle fatalities happened in the county during that period.b *Indicates unstable rate due to low count (<20 cases);** indicates very unstable rate due to very low count (<5 cases)

Outcome MeasuresNumber Rate Trend Rank
2014 2018 2014 2018 State Rate
County Rank
Economic Well-BeingChildren under 18 in poverty 489 409 24.4% 20.8% é 18.3% 48
Food insecurity for childrenb 440 390 20.1% 19.2% é 17.5% 61
HealthLow birthweight infantsa,c 46 39 8.1% 8.4% ê 8.5% 72
Preventable hospitalizations for all causes for children under 18 (per 1,000)b,c
17 9 7.8 4.5 é 7.1 25
Child asthma ER rates (per 1,000)b
8 4 3.6 2.0 é 7.5 21
Family & CommunityBirths to teens, ages 15-19 (per 1,000)
7 7 22.9 24.5 ê 21.6 49
Substantiated child abuse/neglect cases (per 1,000)a
20 9 9.2 4.5 é 4.0 50
EducationHigh school graduation 104 100 95.4% 99.0% é 91.3% 5
Achievement proficiencya,d
3rd grade English/Language Arts (MAP) 54 66.7% 48.6%
8th grade English/Language Arts (MAP)
58 58.0% 49.0%
4th grade Math (MAP) 52 46.0% 45.8%
Algebra I (End of Course exam) 48 42.9% 47.0%
Trend: é better ê worse è no change
Carroll CountyCounty Seat: Carrollton
17Population: 8,843
2016
County Composite Rank
24
2020
a Outcome not included in County Composite Rank.b Data based on 2013 and 2017.c Data based on 5-year time spans, 2009-2013 and 2014-2018.d Achievement proficiency measures those that scored proficient or above on the MAP tests and Algebra I End of Course exam. Achievement data from 2014 are not shown due to differences in testing standards and assessments used in 2018; accordingly, no trend arrows or county ranks are shown.

Carroll County
EducationLicensed child care capacity (per 1,000)
2014 34.92019 81.4
Accredited child care capacity as % of licensed capacity
2014 —2019 0.0%
School attendance, grades K-122014 95.7%2018 95.3%
Family & CommunityTeen unintentional deaths/homicides/suicides (per 100,000)
2009-2013 125.62014-2018 114.7
Single parent head-of-house-hold with children under 18
2009-2013 8.9%2014-2018 8.1%
Juvenile law violation referrals, ages 10-17 (per 1,000)
2014 32.62018 11.7
Annual high school dropout rate2014 0.6%2018 0.2%
Children entering/re-entering state custody (per 1,000)
2014 2.42018 1.0
Health
Infant mortality (per 1,000)2009-2013 7.12014-2018 4.3
Child deaths ages 1-17 (per 100,000)
2009-2013 45.62014-2018 10.0
Child deaths ages 1-14 (per 100,000)
2009-2013 46.22014-2018 0.0
Child deaths ages 15-17 (per 100,000)
2009-2013 45.52014-2018 58.3
Unrestrained automobile fatalities for children under 18a
2009-2013 %2014-2018 %
Substance abuse hospitalizations ages 1-19 (per 100,000)b
2008-2012 22.6**
2013-2017 8.0**
Mental/behavioral hospitalizations (not substance abuse) ages 1-19 (per 10,000)
2008-2012 66.2
2013-2017 106.1
Uninsured children2013 8.8%2017 6.2%
School attendance, grades 9-122014 94.6%2018 94.5%
Contextual IndicatorsCounty Seat: Carrollton
17Population: 8,843
2016
County Composite Rank
2020
24
Demographics
Total population2014 9,0432018 8,843
Child population under 182014 2,1752018 2,015
Children under 18 as % of total population
2014 22.8%2018 22.7%
Child population under 62014 6582018 629
Children under 6 as % of total population
2014 7.3%2018 7.2%
Minority child population under 18
2014 1642018 132
Minority child population under 18 as % of child population
2014 7.9%2018 6.6%
Minority child population under 6
2014 632018 35
Minority child population under 6 as % of under 6 child population
2014 9.6%
2018 5.6%
Children in single-parent families
2009-2013 27.7%2014-2018 31.9%
Children in married-parent families
2009-2013 68.2%2014-2018 68.1%
Economic Well-being
Children in poverty under 62014 28.9%2018 25.7%
Children in poverty, ages 5-172009-2013 23.3%2014-2018 19.1%
Housing cost-burdened households
2009-2013 19.4%2014-2018 22.8%
Family households with children under 18 at 185% of poverty level
2009-2013 31.7%
2014-2018 40.0%
Children in families receiving SNAP
2014 32.5%2018 25.7%
Median income family household with children under 18
2009-2013 $65,028
2014-2018 $58,504
Adult unemployment2014 7.1%2018 3.1%
Child homelessness2014 1.0%2018 2.1%
a If no % listed, no vehicle fatalities happened in the county during that period.b *Indicates unstable rate due to low count (<20 cases);** indicates very unstable rate due to very low count (<5 cases)

Outcome MeasuresNumber Rate Trend Rank
2014 2018 2014 2018 State Rate
County Rank
Economic Well-BeingChildren under 18 in poverty 523 495 35.4% 35.3% é 18.3% 107
Food insecurity for childrenb 410 270 26.8% 17.3% é 17.5% 28
HealthLow birthweight infantsa,c 43 25 11.0% 6.4% é 8.5% 14
Preventable hospitalizations for all causes for children under 18 (per 1,000)b,c
48 21 31.4 14.4 é 7.1 113
Child asthma ER rates (per 1,000)b
7 2 4.6 1.4 é 7.5 11
Family & CommunityBirths to teens, ages 15-19 (per 1,000)
3 10 15.9 54.3 ê 21.6 113
Substantiated child abuse/neglect cases (per 1,000)a
4 15 2.6 10.6 ê 4.0 102
EducationHigh school graduation 85 80 97.7% 94.1% ê 91.3% 53
Achievement proficiencya,d
3rd grade English/Language Arts (MAP) 41 55.4% 48.6%
8th grade English/Language Arts (MAP)
41 53.9% 49.0%
4th grade Math (MAP) 49 50.5% 45.8%
Algebra I (End of Course exam) 17 15.3% 47.0%
Trend: é better ê worse è no change
Carter CountyCounty Seat: Van Buren
108Population: 6,197
2016
County Composite Rank
104
2020
a Outcome not included in County Composite Rank.b Data based on 2013 and 2017.c Data based on 5-year time spans, 2009-2013 and 2014-2018.d Achievement proficiency measures those that scored proficient or above on the MAP tests and Algebra I End of Course exam. Achievement data from 2014 are not shown due to differences in testing standards and assessments used in 2018; accordingly, no trend arrows or county ranks are shown.

Carter County
EducationLicensed child care capacity (per 1,000)
2014 81.82019 73.9
Accredited child care capacity as % of licensed capacity
2014 —2019 46.7%
School attendance, grades K-122014 95.9%2018 95.4%
Family & CommunityTeen unintentional deaths/homicides/suicides (per 100,000)
2009-2013 46.92014-2018 0.0
Single parent head-of-house-hold with children under 18
2009-2013 8.9%2014-2018 10.5%
Juvenile law violation referrals, ages 10-17 (per 1,000)
2014 15.72018 28.7
Annual high school dropout rate2014 0.0%2018 0.0%
Children entering/re-entering state custody (per 1,000)
2014 2.72018 7.7
Health
Infant mortality (per 1,000)2009-2013 17.92014-2018 2.6
Child deaths ages 1-17 (per 100,000)
2009-2013 78.62014-2018 38.9
Child deaths ages 1-14 (per 100,000)
2009-2013 97.92014-2018 44.0
Child deaths ages 15-17 (per 100,000)
2009-2013 0.02014-2018 0.0
Unrestrained automobile fatalities for children under 18a
2009-2013 %2014-2018 %
Substance abuse hospitalizations ages 1-19 (per 100,000)b
2008-2012 20.0**
2013-2017 11.0**
Mental/behavioral hospitalizations (not substance abuse) ages 1-19 (per 10,000)
2008-2012 101.9
2013-2017 92.3
Uninsured children2013 9.6%2017 6.9%
School attendance, grades 9-122014 95.7%2018 95.4%
Contextual IndicatorsCounty Seat: Van Buren
108Population: 6,197
2016
County Composite Rank
2020
104
Demographics
Total population2014 6,2582018 6,197
Child population under 182014 1,5482018 1,420
Children under 18 as % of total population
2014 24.0%2018 24.9%
Child population under 62014 4742018 477
Children under 6 as % of total population
2014 7.6%2018 7.9%
Minority child population under 18
2014 1012018 111
Minority child population under 18 as % of child population
2014 6.7%2018 7.8%
Minority child population under 6
2014 272018 33
Minority child population under 6 as % of under 6 child population
2014 5.7%
2018 6.9%
Children in single-parent families
2009-2013 25.3%2014-2018 33.4%
Children in married-parent families
2009-2013 70.9%2014-2018 65.2%
Economic Well-being
Children in poverty under 62014 38.4%2018 34.8%
Children in poverty, ages 5-172009-2013 34.9%2014-2018 35.2%
Housing cost-burdened households
2009-2013 29.6%2014-2018 28.6%
Family households with children under 18 at 185% of poverty level
2009-2013 57.3%
2014-2018 37.4%
Children in families receiving SNAP
2014 46.0%2018 46.2%
Median income family household with children under 18
2009-2013 $29,216
2014-2018 $63,929
Adult unemployment2014 8.7%2018 5.1%
Child homelessness2014 5.8%2018 10.0%
a If no % listed, no vehicle fatalities happened in the county during that period.b *Indicates unstable rate due to low count (<20 cases);** indicates very unstable rate due to very low count (<5 cases)

Outcome MeasuresNumber Rate Trend Rank
2014 2018 2014 2018 State Rate
County Rank
Economic Well-BeingChildren under 18 in poverty 3,484 2,683 14.1% 10.8% é 18.3% 6
Food insecurity for childrenb 4,860 3,840 18.6% 15.1% é 17.5% 8
HealthLow birthweight infantsa,c 421 426 6.9% 7.4% ê 8.5% 40
Preventable hospitalizations for all causes for children under 18 (per 1,000)b,c
174 180 6.7 7.1 ê 7.1 72
Child asthma ER rates (per 1,000)b
119 103 4.6 4.1 é 7.5 70
Family & CommunityBirths to teens, ages 15-19 (per 1,000)
73 51 21.8 15.2 é 21.6 15
Substantiated child abuse/neglect cases (per 1,000)a
75 43 2.9 1.7 é 4.0 9
EducationHigh school graduation 1,212 1,231 91.4% 92.3% é 91.3% 76
Achievement proficiencya,d
3rd grade English/Language Arts (MAP) 612 47.4% 48.6%
8th grade English/Language Arts (MAP)
668 50.6% 49.0%
4th grade Math (MAP) 711 52.5% 45.8%
Algebra I (End of Course exam) 616 47.6% 47.0%
Trend: é better ê worse è no change
Cass CountyCounty Seat: Harrisonville
16Population: 102,678
2016
County Composite Rank
14
2020
a Outcome not included in County Composite Rank.b Data based on 2013 and 2017.c Data based on 5-year time spans, 2009-2013 and 2014-2018.d Achievement proficiency measures those that scored proficient or above on the MAP tests and Algebra I End of Course exam. Achievement data from 2014 are not shown due to differences in testing standards and assessments used in 2018; accordingly, no trend arrows or county ranks are shown.

Cass County
EducationLicensed child care capacity (per 1,000)
2014 104.02019 110.8
Accredited child care capacity as % of licensed capacity
2014 —2019 29.7%
School attendance, grades K-122014 95.0%2018 94.5%
Family & CommunityTeen unintentional deaths/homicides/suicides (per 100,000)
2009-2013 31.72014-2018 51.4
Single parent head-of-house-hold with children under 18
2009-2013 9.7%2014-2018 8.2%
Juvenile law violation referrals, ages 10-17 (per 1,000)
2014 26.22018 23.0
Annual high school dropout rate2014 2.0%2018 1.6%
Children entering/re-entering state custody (per 1,000)
2014 3.52018 3.3
Health
Infant mortality (per 1,000)2009-2013 3.82014-2018 4.5
Child deaths ages 1-17 (per 100,000)
2009-2013 19.22014-2018 26.1
Child deaths ages 1-14 (per 100,000)
2009-2013 14.92014-2018 13.4
Child deaths ages 15-17 (per 100,000)
2009-2013 39.52014-2018 74.5
Unrestrained automobile fatalities for children under 18a
2009-2013 66.7%2014-2018 %
Substance abuse hospitalizations ages 1-19 (per 100,000)b
2008-2012 4.4*
2013-2017 18.1
Mental/behavioral hospitalizations (not substance abuse) ages 1-19 (per 10,000)
2008-2012 88.8
2013-2017 117.2
Uninsured children2013 6.6%2017 3.9%
School attendance, grades 9-122014 94.0%2018 93.6%
Contextual IndicatorsCounty Seat: Harrisonville
16Population: 102,678
2016
County Composite Rank
2020
14
Demographics
Total population2014 100,8892018 102,678
Child population under 182014 25,8432018 25,369
Children under 18 as % of total population
2014 25.1%2018 24.6%
Child population under 62014 7,4642018 7,705
Children under 6 as % of total population
2014 7.4%2018 7.3%
Minority child population under 18
2014 3,7582018 3,931
Minority child population under 18 as % of child population
2014 14.8%2018 15.5%
Minority child population under 6
2014 1,1782018 1,211
Minority child population under 6 as % of under 6 child population
2014 15.8%
2018 15.7%
Children in single-parent families
2009-2013 26.9%2014-2018 24.9%
Children in married-parent families
2009-2013 72.4%2014-2018 73.6%
Economic Well-being
Children in poverty under 62014 30.7%2018 10.5%
Children in poverty, ages 5-172009-2013 12.3%2014-2018 10.1%
Housing cost-burdened households
2009-2013 28.3%2014-2018 24.7%
Family households with children under 18 at 185% of poverty level
2009-2013 24.5%
2014-2018 25.9%
Children in families receiving SNAP
2014 25.0%2018 20.1%
Median income family household with children under 18
2009-2013 $67,434
2014-2018 $78,569
Adult unemployment2014 5.7%2018 3.1%
Child homelessness2014 2.5%2018 3.4%
a If no % listed, no vehicle fatalities happened in the county during that period.b *Indicates unstable rate due to low count (<20 cases);** indicates very unstable rate due to very low count (<5 cases)

Outcome MeasuresNumber Rate Trend Rank
2014 2018 2014 2018 State Rate
County Rank
Economic Well-BeingChildren under 18 in poverty 1,032 1,006 33.0% 30.2% é 18.3% 97
Food insecurity for childrenb 800 670 24.6% 20.2% é 17.5% 78
HealthLow birthweight infantsa,c 51 55 6.3% 5.9% é 8.5% 5
Preventable hospitalizations for all causes for children under 18 (per 1,000)b,c
20 24 6.1 7.1 ê 7.1 73
Child asthma ER rates (per 1,000)b
31 11 9.5 3.3 é 7.5 52
Family & CommunityBirths to teens, ages 15-19 (per 1,000)
26 18 61.9 45 é 21.6 107
Substantiated child abuse/neglect cases (per 1,000)a
30 7 9.3 2.1 é 4.0 12
EducationHigh school graduation 153 163 91.1% 92.1% é 91.3% 80
Achievement proficiencya,d
3rd grade English/Language Arts (MAP) 63 42.3% 48.6%
8th grade English/Language Arts (MAP)
78 42.4% 49.0%
4th grade Math (MAP) 79 50.6% 45.8%
Algebra I (End of Course exam) 67 37.2% 47.0%
Trend: é better ê worse è no change
Cedar CountyCounty Seat: Stockton
96Population: 13,938
2016
County Composite Rank
105
2020
a Outcome not included in County Composite Rank.b Data based on 2013 and 2017.c Data based on 5-year time spans, 2009-2013 and 2014-2018.d Achievement proficiency measures those that scored proficient or above on the MAP tests and Algebra I End of Course exam. Achievement data from 2014 are not shown due to differences in testing standards and assessments used in 2018; accordingly, no trend arrows or county ranks are shown.

Cedar County
EducationLicensed child care capacity (per 1,000)
2014 46.52019 45.4
Accredited child care capacity as % of licensed capacity
2014 —2019 0.0%
School attendance, grades K-122014 95.4%2018 94.7%
Family & CommunityTeen unintentional deaths/homicides/suicides (per 100,000)
2009-2013 90.52014-2018 21.8
Single parent head-of-house-hold with children under 18
2009-2013 11.3%2014-2018 9.3%
Juvenile law violation referrals, ages 10-17 (per 1,000)
2014 40.92018 27.7
Annual high school dropout rate2014 2.0%2018 2.1%
Children entering/re-entering state custody (per 1,000)
2014 3.42018 5.6
Health
Infant mortality (per 1,000)2009-2013 8.62014-2018 8.6
Child deaths ages 1-17 (per 100,000)
2009-2013 30.72014-2018 29.7
Child deaths ages 1-14 (per 100,000)
2009-2013 22.52014-2018 24.8
Child deaths ages 15-17 (per 100,000)
2009-2013 69.12014-2018 32.7
Unrestrained automobile fatalities for children under 18a
2009-2013 %2014-2018 %
Substance abuse hospitalizations ages 1-19 (per 100,000)b
2008-2012 0
2013-2017 9.8**
Mental/behavioral hospitalizations (not substance abuse) ages 1-19 (per 10,000)
2008-2012 41.9
2013-2017 52.1
Uninsured children2013 9.9%2017 7.1%
School attendance, grades 9-122014 95.2%2018 94.7%
Contextual IndicatorsCounty Seat: Stockton
96Population: 13,938
2016
County Composite Rank
2020
105
Demographics
Total population2014 13,9522018 13,938
Child population under 182014 3,2372018 3,411
Children under 18 as % of total population
2014 23.0%2018 24.2%
Child population under 62014 9222018 1,186
Children under 6 as % of total population
2014 6.6%2018 8.4%
Minority child population under 18
2014 2072018 226
Minority child population under 18 as % of child population
2014 6.5%2018 6.6%
Minority child population under 6
2014 732018 99
Minority child population under 6 as % of under 6 child population
2014 7.9%
2018 8.3%
Children in single-parent families
2009-2013 34.0%2014-2018 33.2%
Children in married-parent families
2009-2013 64.1%2014-2018 66.3%
Economic Well-being
Children in poverty under 62014 34.5%2018 28.9%
Children in poverty, ages 5-172009-2013 29.7%2014-2018 30.2%
Housing cost-burdened households
2009-2013 33.1%2014-2018 28.7%
Family households with children under 18 at 185% of poverty level
2009-2013 56.3%
2014-2018 48.9%
Children in families receiving SNAP
2014 44.9%2018 33.0%
Median income family household with children under 18
2009-2013 $42,913
2014-2018 $50,597
Adult unemployment2014 6.3%2018 3.4%
Child homelessness2014 1.3%2018 2.1%
a If no % listed, no vehicle fatalities happened in the county during that period.b *Indicates unstable rate due to low count (<20 cases);** indicates very unstable rate due to very low count (<5 cases)

Outcome MeasuresNumber Rate Trend Rank
2014 2018 2014 2018 State Rate
County Rank
Economic Well-BeingChildren under 18 in poverty 345 322 20.3% 19.3% é 18.3% 34
Food insecurity for childrenb 360 280 21.0% 16.2% é 17.5% 15
HealthLow birthweight infantsa,c 26 30 6.0% 7.0% ê 8.5% 27
Preventable hospitalizations for all causes for children under 18 (per 1,000)b,c
4 6 2.3 3.5 ê 7.1 10
Child asthma ER rates (per 1,000)b
3 4 1.7 2.3 ê 7.5 26
Family & CommunityBirths to teens, ages 15-19 (per 1,000)
8 5 38.8 24.5 é 21.6 50
Substantiated child abuse/neglect cases (per 1,000)a
2 6 1.2 3.5 ê 4.0 32
EducationHigh school graduation 74 78 92.5% 98.7% é 91.3% 7
Achievement proficiencya,d
3rd grade English/Language Arts (MAP) 31 50.0% 48.6%
8th grade English/Language Arts (MAP)
34 38.2% 49.0%
4th grade Math (MAP) 36 44.4% 45.8%
Algebra I (End of Course exam) 24 32.9% 47.0%
Trend: é better ê worse è no change
Chariton CountyCounty Seat: Keytesville
8Population: 7,546
2016
County Composite Rank
22
2020
a Outcome not included in County Composite Rank.b Data based on 2013 and 2017.c Data based on 5-year time spans, 2009-2013 and 2014-2018.d Achievement proficiency measures those that scored proficient or above on the MAP tests and Algebra I End of Course exam. Achievement data from 2014 are not shown due to differences in testing standards and assessments used in 2018; accordingly, no trend arrows or county ranks are shown.
Chariton County
EducationLicensed child care capacity (per 1,000)
2014 88.32019 106.0
Accredited child care capacity as % of licensed capacity
2014 —2019 17.8%
School attendance, grades K-122014 95.8%2018 94.9%
Family & CommunityTeen unintentional deaths/homicides/suicides (per 100,000)
2009-2013 0.02014-2018 0.0
Single parent head-of-house-hold with children under 18
2009-2013 7.1%2014-2018 4.8%
Juvenile law violation referrals, ages 10-17 (per 1,000)
2014 36.02018 3.8
Annual high school dropout rate2014 1.2%2018 0.9%
Children entering/re-entering state custody (per 1,000)
2014 2.92018 2.9
Health
Infant mortality (per 1,000)2009-2013 9.22014-2018 4.6
Child deaths ages 1-17 (per 100,000)
2009-2013 11.52014-2018 0.0
Child deaths ages 1-14 (per 100,000)
2009-2013 13.92014-2018 0.0
Child deaths ages 15-17 (per 100,000)
2009-2013 0.02014-2018 0.0
Unrestrained automobile fatalities for children under 18a
2009-2013 100.0%2014-2018 %
Substance abuse hospitalizations ages 1-19 (per 100,000)b
2008-2012 9.3**
2013-2017 0
Mental/behavioral hospitalizations (not substance abuse) ages 1-19 (per 10,000)
2008-2012 33.5
2013-2017 78.5
Uninsured children2013 10.6%2017 6.8%
School attendance, grades 9-122014 94.9%2018 93.6%
Contextual IndicatorsCounty Seat: Keytesville
8Population: 7,546
2016
County Composite Rank
2020
22
Demographics
Total population2014 7,6942018 7,546
Child population under 182014 1,7372018 1,698
Children under 18 as % of total population
2014 22.4%2018 22.9%
Child population under 62014 5782018 552
Children under 6 as % of total population
2014 7.5%2018 7.4%
Minority child population under 18
2014 1012018 111
Minority child population under 18 as % of child population
2014 5.9%2018 6.5%
Minority child population under 6
2014 372018 32
Minority child population under 6 as % of under 6 child population
2014 6.4%
2018 5.8%
Children in single-parent families
2009-2013 27.7%2014-2018 19.8%
Children in married-parent families
2009-2013 71.2%2014-2018 79.0%
Economic Well-being
Children in poverty under 62014 28.9%2018 25.7%
Children in poverty, ages 5-172009-2013 20.1%2014-2018 18.6%
Housing cost-burdened households
2009-2013 19.9%2014-2018 19.1%
Family households with children under 18 at 185% of poverty level
2009-2013 40.5%
2014-2018 30.9%
Children in families receiving SNAP
2014 29.3%2018 22.6%
Median income family household with children under 18
2009-2013 $58,333
2014-2018 $71,654
Adult unemployment2014 5.8%2018 2.8%
Child homelessness2014 0.0%2018 0.0%
a If no % listed, no vehicle fatalities happened in the county during that period.b *Indicates unstable rate due to low count (<20 cases);** indicates very unstable rate due to very low count (<5 cases)

Outcome MeasuresNumber Rate Trend Rank
2014 2018 2014 2018 State Rate
County Rank
Economic Well-BeingChildren under 18 in poverty 3,610 2,484 17.2% 11.5% é 18.3% 8
Food insecurity for childrenb 4,120 3,330 19.4% 15.4% é 17.5% 10
HealthLow birthweight infantsa,c 293 329 5.8% 6.4% ê 8.5% 12
Preventable hospitalizations for all causes for children under 18 (per 1,000)b,c
125 100 5.9 4.6 é 7.1 27
Child asthma ER rates (per 1,000)b
39 35 1.8 1.6 é 7.5 13
Family & CommunityBirths to teens, ages 15-19 (per 1,000)
51 44 18.9 16 é 21.6 17
Substantiated child abuse/neglect cases (per 1,000)a
48 59 2.3 2.7 ê 4.0 20
EducationHigh school graduation 1,017 1,001 96.2% 94.2% ê 91.3% 49
Achievement proficiencya,d
3rd grade English/Language Arts (MAP) 685 60.0% 48.6%
8th grade English/Language Arts (MAP)
615 54.5% 49.0%
4th grade Math (MAP) 661 58.2% 45.8%
Algebra I (End of Course exam) 717 64.9% 47.0%
Trend: é better ê worse è no change
Christian CountyCounty Seat: Ozark
6Population: 84,275
2016
County Composite Rank
4
2020
a Outcome not included in County Composite Rank.b Data based on 2013 and 2017.c Data based on 5-year time spans, 2009-2013 and 2014-2018.d Achievement proficiency measures those that scored proficient or above on the MAP tests and Algebra I End of Course exam. Achievement data from 2014 are not shown due to differences in testing standards and assessments used in 2018; accordingly, no trend arrows or county ranks are shown.
Christian County
EducationLicensed child care capacity (per 1,000)
2014 75.52019 71.9
Accredited child care capacity as % of licensed capacity
2014 —2019 7.6%
School attendance, grades K-122014 95.7%2018 95.3%
Family & CommunityTeen unintentional deaths/homicides/suicides (per 100,000)
2009-2013 30.52014-2018 64.3
Single parent head-of-house-hold with children under 18
2009-2013 8.5%2014-2018 8.2%
Juvenile law violation referrals, ages 10-17 (per 1,000)
2014 26.12018 27.8
Annual high school dropout rate2014 0.7%2018 0.9%
Children entering/re-entering state custody (per 1,000)
2014 3.62018 4.6
Health
Infant mortality (per 1,000)2009-2013 4.32014-2018 5.4
Child deaths ages 1-17 (per 100,000)
2009-2013 18.92014-2018 15.7
Child deaths ages 1-14 (per 100,000)
2009-2013 14.62014-2018 9.7
Child deaths ages 15-17 (per 100,000)
2009-2013 40.82014-2018 36.1
Unrestrained automobile fatalities for children under 18a
2009-2013 50.0%2014-2018 %
Substance abuse hospitalizations ages 1-19 (per 100,000)b
2008-2012 18.6
2013-2017 21.5
Mental/behavioral hospitalizations (not substance abuse) ages 1-19 (per 10,000)
2008-2012 52.6
2013-2017 71.5
Uninsured children2013 7.6%2017 4.5%
School attendance, grades 9-122014 95.7%2018 95.1%
Contextual IndicatorsCounty Seat: Ozark
6Population: 84,275
2016
County Composite Rank
2020
4
Demographics
Total population2014 82,1012018 84,275
Child population under 182014 21,2902018 21,985
Children under 18 as % of total population
2014 26.1%2018 25.8%
Child population under 62014 6,4592018 6,678
Children under 6 as % of total population
2014 7.9%2018 7.7%
Minority child population under 18
2014 1,7442018 1,774
Minority child population under 18 as % of child population
2014 8.1%2018 8.1%
Minority child population under 6
2014 5492018 578
Minority child population under 6 as % of under 6 child population
2014 8.5%
2018 8.7%
Children in single-parent families
2009-2013 22.9%2014-2018 24.3%
Children in married-parent families
2009-2013 76.4%2014-2018 74.4%
Economic Well-being
Children in poverty under 62014 23.4%2018 5.3%
Children in poverty, ages 5-172009-2013 14.9%2014-2018 10.6%
Housing cost-burdened households
2009-2013 27.6%2014-2018 25.8%
Family households with children under 18 at 185% of poverty level
2009-2013 31.4%
2014-2018 30.4%
Children in families receiving SNAP
2014 24.8%2018 20.6%
Median income family household with children under 18
2009-2013 $60,808
2014-2018 $64,715
Adult unemployment2014 4.9%2018 2.6%
Child homelessness2014 1.6%2018 1.4%
a If no % listed, no vehicle fatalities happened in the county during that period.b *Indicates unstable rate due to low count (<20 cases);** indicates very unstable rate due to very low count (<5 cases)

Outcome MeasuresNumber Rate Trend Rank
2014 2018 2014 2018 State Rate
County Rank
Economic Well-BeingChildren under 18 in poverty 367 352 23.5% 23.2% é 18.3% 66
Food insecurity for childrenb 410 330 24.5% 20.3% é 17.5% 79
HealthLow birthweight infantsa,c 20 29 5.0% 7.6% ê 8.5% 45
Preventable hospitalizations for all causes for children under 18 (per 1,000)b,c
11 2 6.5 1.3 é 7.1 1
Child asthma ER rates (per 1,000)b
- - 0.0 0.0 è 7.5 1
Family & CommunityBirths to teens, ages 15-19 (per 1,000)
4 5 20.8 27 ê 21.6 59
Substantiated child abuse/neglect cases (per 1,000)a
31 27 18.7 17.3 é 4.0 114
EducationHigh school graduation 76 64 96.2% 98.5% é 91.3% 9
Achievement proficiencya,d
3rd grade English/Language Arts (MAP) 33 41.8% 48.6%
8th grade English/Language Arts (MAP)
15 22.1% 49.0%
4th grade Math (MAP) 18 24.7% 45.8%
Algebra I (End of Course exam) 27 33.8% 47.0%
Trend: é better ê worse è no change
Clark CountyCounty Seat: Kahoka
11Population: 6,800
2016
County Composite Rank
16
2020
a Outcome not included in County Composite Rank.b Data based on 2013 and 2017.c Data based on 5-year time spans, 2009-2013 and 2014-2018.d Achievement proficiency measures those that scored proficient or above on the MAP tests and Algebra I End of Course exam. Achievement data from 2014 are not shown due to differences in testing standards and assessments used in 2018; accordingly, no trend arrows or county ranks are shown.

Clark County
EducationLicensed child care capacity (per 1,000)
2014 93.02019 81.8
Accredited child care capacity as % of licensed capacity
2014 —2019 0.0%
School attendance, grades K-122014 95.9%2018 95.2%
Family & CommunityTeen unintentional deaths/homicides/suicides (per 100,000)
2009-2013 44.92014-2018 49.8
Single parent head-of-house-hold with children under 18
2009-2013 6.6%2014-2018 8.8%
Juvenile law violation referrals, ages 10-17 (per 1,000)
2014 15.22018 1.4
Annual high school dropout rate2014 0.0%2018 0.4%
Children entering/re-entering state custody (per 1,000)
2014 17.62018 12.1
Health
Infant mortality (per 1,000)2009-2013 2.52014-2018 5.2
Child deaths ages 1-17 (per 100,000)
2009-2013 71.42014-2018 12.7
Child deaths ages 1-14 (per 100,000)
2009-2013 58.02014-2018 0.0
Child deaths ages 15-17 (per 100,000)
2009-2013 69.42014-2018 73.3
Unrestrained automobile fatalities for children under 18a
2009-2013 0.0%2014-2018 0%
Substance abuse hospitalizations ages 1-19 (per 100,000)b
2008-2012 0
2013-2017 0
Mental/behavioral hospitalizations (not substance abuse) ages 1-19 (per 10,000)
2008-2012 38.0
2013-2017 34.8
Uninsured children2013 11.1%2017 8.2%
School attendance, grades 9-122014 95.1%2018 95.3%
Contextual IndicatorsCounty Seat: Kahoka
11Population: 6,800
2016
County Composite Rank
2020
16
Demographics
Total population2014 6,9172018 6,800
Child population under 182014 1,6612018 1,565
Children under 18 as % of total population
2014 23.0%2018 23.1%
Child population under 62014 4872018 504
Children under 6 as % of total population
2014 7.1%2018 7.4%
Minority child population under 18
2014 552018 57
Minority child population under 18 as % of child population
2014 3.5%2018 3.6%
Minority child population under 6
2014 212018 21
Minority child population under 6 as % of under 6 child population
2014 4.3%
2018 4.2%
Children in single-parent families
2009-2013 24.8%2014-2018 30.0%
Children in married-parent families
2009-2013 74.9%2014-2018 69.4%
Economic Well-being
Children in poverty under 62014 26.4%2018 25.0%
Children in poverty, ages 5-172009-2013 22.1%2014-2018 22.7%
Housing cost-burdened households
2009-2013 21.3%2014-2018 18.2%
Family households with children under 18 at 185% of poverty level
2009-2013 38.8%
2014-2018 36.3%
Children in families receiving SNAP
2014 29.2%2018 29.1%
Median income family household with children under 18
2009-2013 $48,850
2014-2018 $61,429
Adult unemployment2014 6.8%2018 3.9%
Child homelessness2014 0.0%2018 0.0%
a If no % listed, no vehicle fatalities happened in the county during that period.b *Indicates unstable rate due to low count (<20 cases);** indicates very unstable rate due to very low count (<5 cases)

Outcome MeasuresNumber Rate Trend Rank
2014 2018 2014 2018 State Rate
County Rank
Economic Well-BeingChildren under 18 in poverty 6,909 5,057 12.1% 8.7% é 18.3% 3
Food insecurity for childrenb 10,420 8,480 18.1% 14.5% é 17.5% 6
HealthLow birthweight infantsa,c 1,020 1,024 6.6% 6.7% ê 8.5% 20
Preventable hospitalizations for all causes for children under 18 (per 1,000)b,c
436 418 7.6 7.1 é 7.1 71
Child asthma ER rates (per 1,000)b
381 302 6.6 5.1 é 7.5 82
Family & CommunityBirths to teens, ages 15-19 (per 1,000)
154 102 21.4 13.6 é 21.6 12
Substantiated child abuse/neglect cases (per 1,000)a
110 73 1.9 1.2 é 4.0 3
EducationHigh school graduation 2,701 2,890 93.6% 95.6% é 91.3% 32
Achievement proficiencya,d
3rd grade English/Language Arts (MAP) 1,814 58.2% 48.6%
8th grade English/Language Arts (MAP)
1,701 54.1% 49.0%
4th grade Math (MAP) 1,926 58.2% 45.8%
Algebra I (End of Course exam) 1,678 51.7% 47.0%
Trend: é better ê worse è no change
Clay CountyCounty Seat: Liberty
10Population: 239,164
2016
County Composite Rank
9
2020
a Outcome not included in County Composite Rank.b Data based on 2013 and 2017.c Data based on 5-year time spans, 2009-2013 and 2014-2018.d Achievement proficiency measures those that scored proficient or above on the MAP tests and Algebra I End of Course exam. Achievement data from 2014 are not shown due to differences in testing standards and assessments used in 2018; accordingly, no trend arrows or county ranks are shown.

Clay County
EducationLicensed child care capacity (per 1,000)
2014 89.72019 97.3
Accredited child care capacity as % of licensed capacity
2014 —2019 20.3%
School attendance, grades K-122014 94.9%2018 94.8%
Family & CommunityTeen unintentional deaths/homicides/suicides (per 100,000)
2009-2013 30.12014-2018 42.5
Single parent head-of-house-hold with children under 18
2009-2013 9.2%2014-2018 8.6%
Juvenile law violation referrals, ages 10-17 (per 1,000)
2014 20.62018 16.0
Annual high school dropout rate2014 1.2%2018 0.6%
Children entering/re-entering state custody (per 1,000)
2014 1.32018 1.0
Health
Infant mortality (per 1,000)2009-2013 5.32014-2018 5.2
Child deaths ages 1-17 (per 100,000)
2009-2013 16.32014-2018 19.5
Child deaths ages 1-14 (per 100,000)
2009-2013 14.12014-2018 12.6
Child deaths ages 15-17 (per 100,000)
2009-2013 23.52014-2018 43.2
Unrestrained automobile fatalities for children under 18a
2009-2013 0.0%2014-2018 50%
Substance abuse hospitalizations ages 1-19 (per 100,000)b
2008-2012 9.7
2013-2017 17.6
Mental/behavioral hospitalizations (not substance abuse) ages 1-19 (per 10,000)
2008-2012 80.1
2013-2017 96.6
Uninsured children2013 5.5%2017 3.7%
School attendance, grades 9-122014 93.5%2018 94.5%
Contextual IndicatorsCounty Seat: Liberty
10Population: 239,164
2016
County Composite Rank
2020
9
Demographics
Total population2014 233,6822018 239,164
Child population under 182014 57,8502018 59,326
Children under 18 as % of total population
2014 24.9%2018 24.5%
Child population under 62014 18,4432018 18,967
Children under 6 as % of total population
2014 7.9%2018 7.7%
Minority child population under 18
2014 12,9052018 14,014
Minority child population under 18 as % of child population
2014 22.2%2018 23.6%
Minority child population under 6
2014 4,0142018 4,411
Minority child population under 6 as % of under 6 child population
2014 21.8%
2018 23.3%
Children in single-parent families
2009-2013 28.3%2014-2018 27.1%
Children in married-parent families
2009-2013 70.7%2014-2018 71.5%
Economic Well-being
Children in poverty under 62014 16.0%2018 10.0%
Children in poverty, ages 5-172009-2013 10.6%2014-2018 7.9%
Housing cost-burdened households
2009-2013 27.3%2014-2018 24.5%
Family households with children under 18 at 185% of poverty level
2009-2013 26.1%
2014-2018 22.0%
Children in families receiving SNAP
2014 22.4%2018 18.7%
Median income family household with children under 18
2009-2013 $73,113
2014-2018 $84,372
Adult unemployment2014 5.4%2018 2.9%
Child homelessness2014 1.9%2018 2.5%
a If no % listed, no vehicle fatalities happened in the county during that period.b *Indicates unstable rate due to low count (<20 cases);** indicates very unstable rate due to very low count (<5 cases)

Outcome MeasuresNumber Rate Trend Rank
2014 2018 2014 2018 State Rate
County Rank
Economic Well-BeingChildren under 18 in poverty 801 608 17.0% 12.9% é 18.3% 10
Food insecurity for childrenb 1,040 810 20.5% 16.5% é 17.5% 17
HealthLow birthweight infantsa,c 75 85 6.5% 7.3% ê 8.5% 38
Preventable hospitalizations for all causes for children under 18 (per 1,000)b,c
37 24 7.3 5.0 é 7.1 34
Child asthma ER rates (per 1,000)b
22 9 4.4 1.9 é 7.5 17
Family & CommunityBirths to teens, ages 15-19 (per 1,000)
17 10 27.3 16.2 é 21.6 19
Substantiated child abuse/neglect cases (per 1,000)a
26 13 5.2 2.7 é 4.0 22
EducationHigh school graduation 231 229 93.5% 95.4% é 91.3% 35
Achievement proficiencya,d
3rd grade English/Language Arts (MAP) 112 49.6% 48.6%
8th grade English/Language Arts (MAP)
130 49.6% 49.0%
4th grade Math (MAP) 108 45.0% 45.8%
Algebra I (End of Course exam) 138 50.9% 47.0%
Trend: é better ê worse è no change
Clinton CountyCounty Seat: Plattsburg
7Population: 20,475
2016
County Composite Rank
25
2020
a Outcome not included in County Composite Rank.b Data based on 2013 and 2017.c Data based on 5-year time spans, 2009-2013 and 2014-2018.d Achievement proficiency measures those that scored proficient or above on the MAP tests and Algebra I End of Course exam. Achievement data from 2014 are not shown due to differences in testing standards and assessments used in 2018; accordingly, no trend arrows or county ranks are shown.

Clinton County
EducationLicensed child care capacity (per 1,000)
2014 50.82019 49.1
Accredited child care capacity as % of licensed capacity
2014 —2019 0.0%
School attendance, grades K-122014 95.7%2018 95.1%
Family & CommunityTeen unintentional deaths/homicides/suicides (per 100,000)
2009-2013 28.72014-2018 14.9
Single parent head-of-house-hold with children under 18
2009-2013 7.7%2014-2018 11.2%
Juvenile law violation referrals, ages 10-17 (per 1,000)
2014 23.32018 23.9
Annual high school dropout rate2014 1.5%2018 0.6%
Children entering/re-entering state custody (per 1,000)
2014 4.02018 6.0
Health
Infant mortality (per 1,000)2009-2013 9.52014-2018 4.3
Child deaths ages 1-17 (per 100,000)
2009-2013 31.72014-2018 12.4
Child deaths ages 1-14 (per 100,000)
2009-2013 28.72014-2018 8.9
Child deaths ages 15-17 (per 100,000)
2009-2013 47.52014-2018 21.8
Unrestrained automobile fatalities for children under 18a
2009-2013 %2014-2018 100%
Substance abuse hospitalizations ages 1-19 (per 100,000)b
2008-2012 9.6**
2013-2017 6.8**
Mental/behavioral hospitalizations (not substance abuse) ages 1-19 (per 10,000)
2008-2012 75.6
2013-2017 73.5
Uninsured children2013 7.9%2017 4.8%
School attendance, grades 9-122014 94.9%2018 95%
Contextual IndicatorsCounty Seat: Plattsburg
7Population: 20,475
2016
County Composite Rank
2020
25
Demographics
Total population2014 20,2992018 20,475
Child population under 182014 4,9922018 4,808
Children under 18 as % of total population
2014 23.7%2018 23.7%
Child population under 62014 1,4112018 1,489
Children under 6 as % of total population
2014 7.0%2018 7.3%
Minority child population under 18
2014 3592018 361
Minority child population under 18 as % of child population
2014 7.5%2018 7.5%
Minority child population under 6
2014 1222018 117
Minority child population under 6 as % of under 6 child population
2014 8.6%
2018 7.9%
Children in single-parent families
2009-2013 30.4%2014-2018 32.9%
Children in married-parent families
2009-2013 66.4%2014-2018 65.9%
Economic Well-being
Children in poverty under 62014 21.5%2018 20.7%
Children in poverty, ages 5-172009-2013 15.2%2014-2018 12.1%
Housing cost-burdened households
2009-2013 27.8%2014-2018 21.3%
Family households with children under 18 at 185% of poverty level
2009-2013 32.2%
2014-2018 31.7%
Children in families receiving SNAP
2014 25.9%2018 23.4%
Median income family household with children under 18
2009-2013 $61,196
2014-2018 $63,984
Adult unemployment2014 5.8%2018 3.2%
Child homelessness2014 2.0%2018 3.2%
a If no % listed, no vehicle fatalities happened in the county during that period.b *Indicates unstable rate due to low count (<20 cases);** indicates very unstable rate due to very low count (<5 cases)

Outcome MeasuresNumber Rate Trend Rank
2014 2018 2014 2018 State Rate
County Rank
Economic Well-BeingChildren under 18 in poverty 3,107 2,019 18.0% 12.0% é 18.3% 9
Food insecurity for childrenb 3,540 2,820 19.8% 16.1% é 17.5% 14
HealthLow birthweight infantsa,c 379 396 8.2% 8.7% ê 8.5% 85
Preventable hospitalizations for all causes for children under 18 (per 1,000)b,c
153 116 8.6 6.7 é 7.1 68
Child asthma ER rates (per 1,000)b
138 131 7.7 7.6 é 7.5 108
Family & CommunityBirths to teens, ages 15-19 (per 1,000)
50 43 20.7 18.2 é 21.6 26
Substantiated child abuse/neglect cases (per 1,000)a
27 28 1.5 1.6 ê 4.0 7
EducationHigh school graduation 831 708 86.7% 87.4% é 91.3% 107
Achievement proficiencya,d
3rd grade English/Language Arts (MAP) 417 47.8% 48.6%
8th grade English/Language Arts (MAP)
420 48.6% 49.0%
4th grade Math (MAP) 382 45.0% 45.8%
Algebra I (End of Course exam) 497 56.3% 47.0%
Trend: é better ê worse è no change
Cole CountyCounty Seat: Jefferson City
53Population: 76,740
2016
County Composite Rank
53
2020
a Outcome not included in County Composite Rank.b Data based on 2013 and 2017.c Data based on 5-year time spans, 2009-2013 and 2014-2018.d Achievement proficiency measures those that scored proficient or above on the MAP tests and Algebra I End of Course exam. Achievement data from 2014 are not shown due to differences in testing standards and assessments used in 2018; accordingly, no trend arrows or county ranks are shown.

Cole County
EducationLicensed child care capacity (per 1,000)
2014 163.22019 195.4
Accredited child care capacity as % of licensed capacity
2014 —2019 5.1%
School attendance, grades K-122014 94.9%2018 94.4%
Family & CommunityTeen unintentional deaths/homicides/suicides (per 100,000)
2009-2013 23.82014-2018 44.2
Single parent head-of-house-hold with children under 18
2009-2013 8.2%2014-2018 10.0%
Juvenile law violation referrals, ages 10-17 (per 1,000)
2014 36.72018 31.0
Annual high school dropout rate2014 3.0%2018 3.1%
Children entering/re-entering state custody (per 1,000)
2014 5.12018 7.6
Health
Infant mortality (per 1,000)2009-2013 8.62014-2018 5.5
Child deaths ages 1-17 (per 100,000)
2009-2013 13.42014-2018 12.7
Child deaths ages 1-14 (per 100,000)
2009-2013 13.42014-2018 7.1
Child deaths ages 15-17 (per 100,000)
2009-2013 13.52014-2018 34.5
Unrestrained automobile fatalities for children under 18a
2009-2013 66.7%2014-2018 0%
Substance abuse hospitalizations ages 1-19 (per 100,000)b
2008-2012 12.6*
2013-2017 31.7
Mental/behavioral hospitalizations (not substance abuse) ages 1-19 (per 10,000)
2008-2012 57.8
2013-2017 101.7
Uninsured children2013 6.6%2017 4.8%
School attendance, grades 9-122014 93.2%2018 92.9%
Contextual IndicatorsCounty Seat: Jefferson City
53Population: 76,740
2016
County Composite Rank
2020
53
Demographics
Total population2014 76,5572018 76,740
Child population under 182014 17,7752018 17,106
Children under 18 as % of total population
2014 23.0%2018 22.6%
Child population under 62014 5,6852018 5,544
Children under 6 as % of total population
2014 7.4%2018 7.2%
Minority child population under 18
2014 3,8112018 4,006
Minority child population under 18 as % of child population
2014 21.7%2018 23.4%
Minority child population under 6
2014 1,4092018 1,454
Minority child population under 6 as % of under 6 child population
2014 24.8%
2018 26.2%
Children in single-parent families
2009-2013 36.0%2014-2018 32.0%
Children in married-parent families
2009-2013 63.4%2014-2018 67.4%
Economic Well-being
Children in poverty under 62014 32.7%2018 6.4%
Children in poverty, ages 5-172009-2013 15.2%2014-2018 11.2%
Housing cost-burdened households
2009-2013 23.8%2014-2018 21.4%
Family households with children under 18 at 185% of poverty level
2009-2013 32.1%
2014-2018 30.5%
Children in families receiving SNAP
2014 29.2%2018 29.0%
Median income family household with children under 18
2009-2013 $60,089
2014-2018 $65,588
Adult unemployment2014 5.0%2018 2.5%
Child homelessness2014 1.9%2018 1.4%
a If no % listed, no vehicle fatalities happened in the county during that period.b *Indicates unstable rate due to low count (<20 cases);** indicates very unstable rate due to very low count (<5 cases)

Outcome MeasuresNumber Rate Trend Rank
2014 2018 2014 2018 State Rate
County Rank
Economic Well-BeingChildren under 18 in poverty 738 753 20.0% 20.7% ê 18.3% 45
Food insecurity for childrenb 920 610 23.5% 15.7% é 17.5% 12
HealthLow birthweight infantsa,c 101 74 10.2% 7.6% é 8.5% 46
Preventable hospitalizations for all causes for children under 18 (per 1,000)b,c
16 35 4.1 9.1 ê 7.1 100
Child asthma ER rates (per 1,000)b
22 21 5.6 5.5 é 7.5 89
Family & CommunityBirths to teens, ages 15-19 (per 1,000)
16 10 31.2 19.9 é 21.6 30
Substantiated child abuse/neglect cases (per 1,000)a
7 10 1.8 2.7 ê 4.0 19
EducationHigh school graduation 157 197 91.8% 98.0% é 91.3% 11
Achievement proficiencya,d
3rd grade English/Language Arts (MAP) 57 37.7% 48.6%
8th grade English/Language Arts (MAP)
70 37.4% 49.0%
4th grade Math (MAP) 47 23.6% 45.8%
Algebra I (End of Course exam) 92 42.4% 47.0%
Trend: é better ê worse è no change
Cooper CountyCounty Seat: Boonville
29Population: 17,622
2016
County Composite Rank
42
2020
a Outcome not included in County Composite Rank.b Data based on 2013 and 2017.c Data based on 5-year time spans, 2009-2013 and 2014-2018.d Achievement proficiency measures those that scored proficient or above on the MAP tests and Algebra I End of Course exam. Achievement data from 2014 are not shown due to differences in testing standards and assessments used in 2018; accordingly, no trend arrows or county ranks are shown.

Cooper County
EducationLicensed child care capacity (per 1,000)
2014 75.22019 82.7
Accredited child care capacity as % of licensed capacity
2014 —2019 12.9%
School attendance, grades K-122014 95.6%2018 94.6%
Family & CommunityTeen unintentional deaths/homicides/suicides (per 100,000)
2009-2013 35.22014-2018 38.1
Single parent head-of-house-hold with children under 18
2009-2013 8.7%2014-2018 9.0%
Juvenile law violation referrals, ages 10-17 (per 1,000)
2014 41.02018 39.4
Annual high school dropout rate2014 1.5%2018 0.4%
Children entering/re-entering state custody (per 1,000)
2014 5.72018 3.5
Health
Infant mortality (per 1,000)2009-2013 10.12014-2018 6.1
Child deaths ages 1-17 (per 100,000)
2009-2013 10.22014-2018 36.3
Child deaths ages 1-14 (per 100,000)
2009-2013 12.42014-2018 16.1
Child deaths ages 15-17 (per 100,000)
2009-2013 0.02014-2018 124.0
Unrestrained automobile fatalities for children under 18a
2009-2013 0.0%2014-2018 %
Substance abuse hospitalizations ages 1-19 (per 100,000)b
2008-2012 0
2013-2017 4.2**
Mental/behavioral hospitalizations (not substance abuse) ages 1-19 (per 10,000)
2008-2012 50.3
2013-2017 73.5
Uninsured children2013 8.2%2017 5.6%
School attendance, grades 9-122014 94.6%2018 93.9%
Contextual IndicatorsCounty Seat: Boonville
29Population: 17,622
2016
County Composite Rank
2020
42
Demographics
Total population2014 17,5852018 17,622
Child population under 182014 3,9552018 3,762
Children under 18 as % of total population
2014 21.8%2018 21.9%
Child population under 62014 1,2022018 1,122
Children under 6 as % of total population
2014 6.8%2018 6.4%
Minority child population under 18
2014 4332018 425
Minority child population under 18 as % of child population
2014 11.3%2018 11.3%
Minority child population under 6
2014 1562018 135
Minority child population under 6 as % of under 6 child population
2014 13.0%
2018 12.0%
Children in single-parent families
2009-2013 27.2%2014-2018 34.5%
Children in married-parent families
2009-2013 71.2%2014-2018 64.2%
Economic Well-being
Children in poverty under 62014 28.9%2018 25.8%
Children in poverty, ages 5-172009-2013 18.5%2014-2018 17.8%
Housing cost-burdened households
2009-2013 24.1%2014-2018 23.6%
Family households with children under 18 at 185% of poverty level
2009-2013 43.3%
2014-2018 35.3%
Children in families receiving SNAP
2014 34.2%2018 28.9%
Median income family household with children under 18
2009-2013 $52,450
2014-2018 $64,786
Adult unemployment2014 5.9%2018 3.1%
Child homelessness2014 0.9%2018 1.0%
a If no % listed, no vehicle fatalities happened in the county during that period.b *Indicates unstable rate due to low count (<20 cases);** indicates very unstable rate due to very low count (<5 cases)

Outcome MeasuresNumber Rate Trend Rank
2014 2018 2014 2018 State Rate
County Rank
Economic Well-BeingChildren under 18 in poverty 1,719 1,274 30.4% 24.1% é 18.3% 74
Food insecurity for childrenb 1,520 1,160 25.4% 20.4% é 17.5% 80
HealthLow birthweight infantsa,c 119 114 8.3% 8.3% è 8.5% 68
Preventable hospitalizations for all causes for children under 18 (per 1,000)b,c
47 32 7.9 5.8 é 7.1 51
Child asthma ER rates (per 1,000)b
35 25 5.8 4.5 é 7.5 73
Family & CommunityBirths to teens, ages 15-19 (per 1,000)
25 17 34.4 24.5 é 21.6 48
Substantiated child abuse/neglect cases (per 1,000)a
32 24 5.4 4.4 é 4.0 49
EducationHigh school graduation 223 221 92.9% 94.0% é 91.3% 57
Achievement proficiencya,d
3rd grade English/Language Arts (MAP) 134 54.7% 48.6%
8th grade English/Language Arts (MAP)
127 51.4% 49.0%
4th grade Math (MAP) 121 46.2% 45.8%
Algebra I (End of Course exam) 73 25.3% 47.0%
Trend: é better ê worse è no change
Crawford CountyCounty Seat: Steelville
64Population: 24,280
2016
County Composite Rank
84
2020
a Outcome not included in County Composite Rank.b Data based on 2013 and 2017.c Data based on 5-year time spans, 2009-2013 and 2014-2018.d Achievement proficiency measures those that scored proficient or above on the MAP tests and Algebra I End of Course exam. Achievement data from 2014 are not shown due to differences in testing standards and assessments used in 2018; accordingly, no trend arrows or county ranks are shown.

Crawford County
EducationLicensed child care capacity (per 1,000)
2014 68.72019 69.1
Accredited child care capacity as % of licensed capacity
2014 —2019 31.7%
School attendance, grades K-122014 95.0%2018 94.8%
Family & CommunityTeen unintentional deaths/homicides/suicides (per 100,000)
2009-2013 88.42014-2018 80.1
Single parent head-of-house-hold with children under 18
2009-2013 10.4%2014-2018 8.5%
Juvenile law violation referrals, ages 10-17 (per 1,000)
2014 21.52018 17.4
Annual high school dropout rate2014 2.0%2018 1.8%
Children entering/re-entering state custody (per 1,000)
2014 7.52018 10.0
Health
Infant mortality (per 1,000)2009-2013 4.22014-2018 9.5
Child deaths ages 1-17 (per 100,000)
2009-2013 36.72014-2018 17.8
Child deaths ages 1-14 (per 100,000)
2009-2013 24.22014-2018 7.6
Child deaths ages 15-17 (per 100,000)
2009-2013 97.62014-2018 58.8
Unrestrained automobile fatalities for children under 18a
2009-2013 0.0%2014-2018 100%
Substance abuse hospitalizations ages 1-19 (per 100,000)b
2008-2012 16.2*
2013-2017 49.4*
Mental/behavioral hospitalizations (not substance abuse) ages 1-19 (per 10,000)
2008-2012 82.4
2013-2017 94.4
Uninsured children2013 7.6%2017 6.3%
School attendance, grades 9-122014 94.7%2018 94.3%
Contextual IndicatorsCounty Seat: Steelville
64Population: 24,280
2016
County Composite Rank
2020
84
Demographics
Total population2014 24,6502018 24,280
Child population under 182014 5,9122018 5,426
Children under 18 as % of total population
2014 23.7%2018 23.1%
Child population under 62014 1,8392018 1,676
Children under 6 as % of total population
2014 7.5%2018 7.0%
Minority child population under 18
2014 3112018 342
Minority child population under 18 as % of child population
2014 5.3%2018 6.3%
Minority child population under 6
2014 862018 129
Minority child population under 6 as % of under 6 child population
2014 4.7%
2018 7.7%
Children in single-parent families
2009-2013 36.6%2014-2018 33.8%
Children in married-parent families
2009-2013 61.6%2014-2018 65.3%
Economic Well-being
Children in poverty under 62014 29.7%2018 27.8%
Children in poverty, ages 5-172009-2013 27.8%2014-2018 22.0%
Housing cost-burdened households
2009-2013 31.1%2014-2018 30.9%
Family households with children under 18 at 185% of poverty level
2009-2013 50.8%
2014-2018 49.3%
Children in families receiving SNAP
2014 44.0%2018 41.8%
Median income family household with children under 18
2009-2013 $39,894
2014-2018 $45,961
Adult unemployment2014 7.7%2018 3.9%
Child homelessness2014 1.4%2018 2.8%
a If no % listed, no vehicle fatalities happened in the county during that period.b *Indicates unstable rate due to low count (<20 cases);** indicates very unstable rate due to very low count (<5 cases)

Outcome MeasuresNumber Rate Trend Rank
2014 2018 2014 2018 State Rate
County Rank
Economic Well-BeingChildren under 18 in poverty 425 384 27.1% 25.2% é 18.3% 79
Food insecurity for childrenb 440 350 25.5% 22% é 17.5% 97
HealthLow birthweight infantsa,c 27 26 7.7% 7.3% é 8.5% 39
Preventable hospitalizations for all causes for children under 18 (per 1,000)b,c
5 6 2.9 3.7 ê 7.1 13
Child asthma ER rates (per 1,000)b
4 2 2.3 1.2 é 7.5 9
Family & CommunityBirths to teens, ages 15-19 (per 1,000)
5 5 22.4 24.6 ê 21.6 51
Substantiated child abuse/neglect cases (per 1,000)a
11 5 6.6 3.2 é 4.0 27
EducationHigh school graduation 88 78 91.7% 96.3% é 91.3% 24
Achievement proficiencya,d
3rd grade English/Language Arts (MAP) 39 45.3% 48.6%
8th grade English/Language Arts (MAP)
43 58.1% 49.0%
4th grade Math (MAP) 31 36.9% 45.8%
Algebra I (End of Course exam) 25 27.5% 47.0%
Trend: é better ê worse è no change
Dade CountyCounty Seat: Greenfield
36Population: 7,590
2016
County Composite Rank
39
2020
a Outcome not included in County Composite Rank.b Data based on 2013 and 2017.c Data based on 5-year time spans, 2009-2013 and 2014-2018.d Achievement proficiency measures those that scored proficient or above on the MAP tests and Algebra I End of Course exam. Achievement data from 2014 are not shown due to differences in testing standards and assessments used in 2018; accordingly, no trend arrows or county ranks are shown.

Dade County
EducationLicensed child care capacity (per 1,000)
2014 24.92019 22.5
Accredited child care capacity as % of licensed capacity
2014 —2019 0.0%
School attendance, grades K-122014 95.6%2018 94.8%
Family & CommunityTeen unintentional deaths/homicides/suicides (per 100,000)
2009-2013 38.92014-2018 119.8
Single parent head-of-house-hold with children under 18
2009-2013 8.2%2014-2018 8.1%
Juvenile law violation referrals, ages 10-17 (per 1,000)
2014 22.32018 16.9
Annual high school dropout rate2014 2.6%2018 0.6%
Children entering/re-entering state custody (per 1,000)
2014 6.22018 2.6
Health
Infant mortality (per 1,000)2009-2013 5.72014-2018 5.6
Child deaths ages 1-17 (per 100,000)
2009-2013 11.62014-2018 50.4
Child deaths ages 1-14 (per 100,000)
2009-2013 0.02014-2018 27.4
Child deaths ages 15-17 (per 100,000)
2009-2013 56.72014-2018 123.5
Unrestrained automobile fatalities for children under 18a
2009-2013 %2014-2018 %
Substance abuse hospitalizations ages 1-19 (per 100,000)b
2008-2012 28.0**
2013-2017 20.5**
Mental/behavioral hospitalizations (not substance abuse) ages 1-19 (per 10,000)
2008-2012 50.4
2013-2017 90.3
Uninsured children2013 12.2%2017 7.5%
School attendance, grades 9-122014 95.3%2018 93.9%
Contextual IndicatorsCounty Seat: Greenfield
36Population: 7,590
2016
County Composite Rank
2020
39
Demographics
Total population2014 7,6282018 7,590
Child population under 182014 1,6742018 1,558
Children under 18 as % of total population
2014 21.0%2018 20.9%
Child population under 62014 4432018 443
Children under 6 as % of total population
2014 5.8%2018 5.9%
Minority child population under 18
2014 962018 107
Minority child population under 18 as % of child population
2014 6.0%2018 6.9%
Minority child population under 6
2014 192018 29
Minority child population under 6 as % of under 6 child population
2014 4.3%
2018 6.5%
Children in single-parent families
2009-2013 30.2%2014-2018 29.8%
Children in married-parent families
2009-2013 69.5%2014-2018 66.1%
Economic Well-being
Children in poverty under 62014 34.4%2018 28.9%
Children in poverty, ages 5-172009-2013 23.7%2014-2018 23.0%
Housing cost-burdened households
2009-2013 24.4%2014-2018 24.7%
Family households with children under 18 at 185% of poverty level
2009-2013 49.7%
2014-2018 51.4%
Children in families receiving SNAP
2014 39.1%2018 31.8%
Median income family household with children under 18
2009-2013 $38,368
2014-2018 $41,618
Adult unemployment2014 5.9%2018 2.7%
Child homelessness2014 0.0%2018 0.0%
a If no % listed, no vehicle fatalities happened in the county during that period.b *Indicates unstable rate due to low count (<20 cases);** indicates very unstable rate due to very low count (<5 cases)

Outcome MeasuresNumber Rate Trend Rank
2014 2018 2014 2018 State Rate
County Rank
Economic Well-BeingChildren under 18 in poverty 1,233 993 32.8% 25.5% é 18.3% 80
Food insecurity for childrenb 1,130 760 27.7% 19.6% é 17.5% 70
HealthLow birthweight infantsa,c 66 92 6.4% 8.6% ê 8.5% 83
Preventable hospitalizations for all causes for children under 18 (per 1,000)b,c
23 33 5.7 8.3 ê 7.1 90
Child asthma ER rates (per 1,000)b
10 1 2.5 0.3 é 7.5 3
Family & CommunityBirths to teens, ages 15-19 (per 1,000)
22 14 46.5 29 é 21.6 67
Substantiated child abuse/neglect cases (per 1,000)a
37 21 9.3 5.3 é 4.0 62
EducationHigh school graduation 109 105 87.9% 96.3% é 91.3% 24
Achievement proficiencya,d
3rd grade English/Language Arts (MAP) 43 34.1% 48.6%
8th grade English/Language Arts (MAP)
59 41.0% 49.0%
4th grade Math (MAP) 59 36.4% 45.8%
Algebra I (End of Course exam) 46 37.4% 47.0%
Trend: é better ê worse è no change
Dallas CountyCounty Seat: Buffalo
47Population: 16,499
2016
County Composite Rank
101
2020
a Outcome not included in County Composite Rank.b Data based on 2013 and 2017.c Data based on 5-year time spans, 2009-2013 and 2014-2018.d Achievement proficiency measures those that scored proficient or above on the MAP tests and Algebra I End of Course exam. Achievement data from 2014 are not shown due to differences in testing standards and assessments used in 2018; accordingly, no trend arrows or county ranks are shown.

Dallas County
EducationLicensed child care capacity (per 1,000)
2014 59.62019 62.6
Accredited child care capacity as % of licensed capacity
2014 —2019 0.0%
School attendance, grades K-122014 95.0%2018 94.3%
Family & CommunityTeen unintentional deaths/homicides/suicides (per 100,000)
2009-2013 71.02014-2018 90.5
Single parent head-of-house-hold with children under 18
2009-2013 10.2%2014-2018 9.1%
Juvenile law violation referrals, ages 10-17 (per 1,000)
2014 23.12018 7.6
Annual high school dropout rate2014 2.7%2018 0.6%
Children entering/re-entering state custody (per 1,000)
2014 11.02018 4.3
Health
Infant mortality (per 1,000)2009-2013 3.92014-2018 7.5
Child deaths ages 1-17 (per 100,000)
2009-2013 49.22014-2018 55.2
Child deaths ages 1-14 (per 100,000)
2009-2013 42.02014-2018 26.3
Child deaths ages 15-17 (per 100,000)
2009-2013 83.92014-2018 184.0
Unrestrained automobile fatalities for children under 18a
2009-2013 %2014-2018 33.3%
Substance abuse hospitalizations ages 1-19 (per 100,000)b
2008-2012 11.8**
2013-2017 12.3**
Mental/behavioral hospitalizations (not substance abuse) ages 1-19 (per 10,000)
2008-2012 72.7
2013-2017 105.6
Uninsured children2013 10.4%2017 8.5%
School attendance, grades 9-122014 94.3%2018 94.2%
Contextual IndicatorsCounty Seat: Buffalo
47Population: 16,499
2016
County Composite Rank
2020
101
Demographics
Total population2014 16,3892018 16,499
Child population under 182014 3,9832018 3,959
Children under 18 as % of total population
2014 23.3%2018 24.2%
Child population under 62014 1,1582018 1,294
Children under 6 as % of total population
2014 7.1%2018 7.7%
Minority child population under 18
2014 2192018 242
Minority child population under 18 as % of child population
2014 5.7%2018 6.1%
Minority child population under 6
2014 762018 94
Minority child population under 6 as % of under 6 child population
2014 6.6%
2018 7.3%
Children in single-parent families
2009-2013 19.3%2014-2018 24.1%
Children in married-parent families
2009-2013 80.6%2014-2018 75.7%
Economic Well-being
Children in poverty under 62014 30.4%2018 22.8%
Children in poverty, ages 5-172009-2013 32.2%2014-2018 24.8%
Housing cost-burdened households
2009-2013 26.6%2014-2018 21.9%
Family households with children under 18 at 185% of poverty level
2009-2013 51.5%
2014-2018 47.1%
Children in families receiving SNAP
2014 39.1%2018 34.7%
Median income family household with children under 18
2009-2013 $40,931
2014-2018 $53,450
Adult unemployment2014 7.4%2018 3.9%
Child homelessness2014 2.8%2018 2.6%
a If no % listed, no vehicle fatalities happened in the county during that period.b *Indicates unstable rate due to low count (<20 cases);** indicates very unstable rate due to very low count (<5 cases)

Outcome MeasuresNumber Rate Trend Rank
2014 2018 2014 2018 State Rate
County Rank
Economic Well-BeingChildren under 18 in poverty 592 539 27.9% 26.0% é 18.3% 84
Food insecurity for childrenb 480 360 21.8% 16.8% é 17.5% 24
HealthLow birthweight infantsa,c 33 40 5.9% 6.5% ê 8.5% 16
Preventable hospitalizations for all causes for children under 18 (per 1,000)b,c
11 14 5.0 6.5 ê 7.1 64
Child asthma ER rates (per 1,000)b
10 10 4.6 4.6 è 7.5 77
Family & CommunityBirths to teens, ages 15-19 (per 1,000)
8 6 30.2 20.4 é 21.6 33
Substantiated child abuse/neglect cases (per 1,000)a
4 5 1.9 2.4 ê 4.0 14
EducationHigh school graduation 67 97 91.8% 94.2% é 91.3% 49
Achievement proficiencya,d
3rd grade English/Language Arts (MAP) 36 38.7% 48.6%
8th grade English/Language Arts (MAP)
34 35.8% 49.0%
4th grade Math (MAP) 36 40.4% 45.8%
Algebra I (End of Course exam) 39 41.1% 47.0%
Trend: é better ê worse è no change
Daviess CountyCounty Seat: Gallatin
43Population: 8,302
2016
County Composite Rank
50
2020
a Outcome not included in County Composite Rank.b Data based on 2013 and 2017.c Data based on 5-year time spans, 2009-2013 and 2014-2018.d Achievement proficiency measures those that scored proficient or above on the MAP tests and Algebra I End of Course exam. Achievement data from 2014 are not shown due to differences in testing standards and assessments used in 2018; accordingly, no trend arrows or county ranks are shown.

Daviess County
EducationLicensed child care capacity (per 1,000)
2014 0.02019 14.2
Accredited child care capacity as % of licensed capacity
2014 —2019 0.0%
School attendance, grades K-122014 95.9%2018 95.1%
Family & CommunityTeen unintentional deaths/homicides/suicides (per 100,000)
2009-2013 70.82014-2018 38.2
Single parent head-of-house-hold with children under 18
2009-2013 8.4%2014-2018 5.8%
Juvenile law violation referrals, ages 10-17 (per 1,000)
2014 6.72018 18.7
Annual high school dropout rate2014 0.8%2018 0.3%
Children entering/re-entering state custody (per 1,000)
2014 6.02018 1.4
Health
Infant mortality (per 1,000)2009-2013 5.32014-2018 4.9
Child deaths ages 1-17 (per 100,000)
2009-2013 45.92014-2018 65.6
Child deaths ages 1-14 (per 100,000)
2009-2013 43.72014-2018 48.9
Child deaths ages 15-17 (per 100,000)
2009-2013 52.82014-2018 105.0
Unrestrained automobile fatalities for children under 18a
2009-2013 100.0%2014-2018 %
Substance abuse hospitalizations ages 1-19 (per 100,000)b
2008-2012 0
2013-2017 0
Mental/behavioral hospitalizations (not substance abuse) ages 1-19 (per 10,000)
2008-2012 54.7
2013-2017 69.5
Uninsured children2013 14.2%2017 11.5%
School attendance, grades 9-122014 95.1%2018 94.7%
Contextual IndicatorsCounty Seat: Gallatin
43Population: 8,302
2016
County Composite Rank
2020
50
Demographics
Total population2014 8,2972018 8,302
Child population under 182014 2,1502018 2,116
Children under 18 as % of total population
2014 26.3%2018 25.7%
Child population under 62014 6442018 661
Children under 6 as % of total population
2014 7.8%2018 8.0%
Minority child population under 18
2014 872018 101
Minority child population under 18 as % of child population
2014 4.0%2018 4.8%
Minority child population under 6
2014 272018 27
Minority child population under 6 as % of under 6 child population
2014 4.2%
2018 4.1%
Children in single-parent families
2009-2013 19.6%2014-2018 21.6%
Children in married-parent families
2009-2013 80.4%2014-2018 77.2%
Economic Well-being
Children in poverty under 62014 27.5%2018 27.1%
Children in poverty, ages 5-172009-2013 25.9%2014-2018 24.4%
Housing cost-burdened households
2009-2013 26.8%2014-2018 23.2%
Family households with children under 18 at 185% of poverty level
2009-2013 41.9%
2014-2018 39.0%
Children in families receiving SNAP
2014 31.3%2018 28.9%
Median income family household with children under 18
2009-2013 $51,436
2014-2018 $61,579
Adult unemployment2014 5.8%2018 3.0%
Child homelessness2014 0.0%2018 0.0%
a If no % listed, no vehicle fatalities happened in the county during that period.b *Indicates unstable rate due to low count (<20 cases);** indicates very unstable rate due to very low count (<5 cases)

Outcome MeasuresNumber Rate Trend Rank
2014 2018 2014 2018 State Rate
County Rank
Economic Well-BeingChildren under 18 in poverty 418 292 19.9% 13.7% é 18.3% 14
Food insecurity for childrenb 430 370 19.0% 18% é 17.5% 38
HealthLow birthweight infantsa,c 37 32 6.7% 5.9% é 8.5% 7
Preventable hospitalizations for all causes for children under 18 (per 1,000)b,c
8 19 3.6 8.9 ê 7.1 94
Child asthma ER rates (per 1,000)b
18 4 8.0 1.9 é 7.5 18
Family & CommunityBirths to teens, ages 15-19 (per 1,000)
10 5 36.9 20.4 é 21.6 33
Substantiated child abuse/neglect cases (per 1,000)a
13 8 5.9 3.7 é 4.0 36
EducationHigh school graduation 69 63 95.8% 92.6% ê 91.3% 70
Achievement proficiencya,d
3rd grade English/Language Arts (MAP) 39 48.1% 48.6%
8th grade English/Language Arts (MAP)
40 54.8% 49.0%
4th grade Math (MAP) 43 46.2% 45.8%
Algebra I (End of Course exam) 39 45.3% 47.0%
Trend: é better ê worse è no change
DeKalb CountyCounty Seat: Maysville
31Population: 12,564
2016
County Composite Rank
28
2020
a Outcome not included in County Composite Rank.b Data based on 2013 and 2017.c Data based on 5-year time spans, 2009-2013 and 2014-2018.d Achievement proficiency measures those that scored proficient or above on the MAP tests and Algebra I End of Course exam. Achievement data from 2014 are not shown due to differences in testing standards and assessments used in 2018; accordingly, no trend arrows or county ranks are shown.

DeKalb County
EducationLicensed child care capacity (per 1,000)
2014 37.32019 31.8
Accredited child care capacity as % of licensed capacity
2014 —2019 0.0%
School attendance, grades K-122014 96.1%2018 95.8%
Family & CommunityTeen unintentional deaths/homicides/suicides (per 100,000)
2009-2013 31.12014-2018 73.5
Single parent head-of-house-hold with children under 18
2009-2013 7.0%2014-2018 6.1%
Juvenile law violation referrals, ages 10-17 (per 1,000)
2014 41.32018 16.3
Annual high school dropout rate2014 1.2%2018 0.7%
Children entering/re-entering state custody (per 1,000)
2014 7.02018 10.6
Health
Infant mortality (per 1,000)2009-2013 7.32014-2018 7.4
Child deaths ages 1-17 (per 100,000)
2009-2013 8.92014-2018 38.5
Child deaths ages 1-14 (per 100,000)
2009-2013 10.82014-2018 20.0
Child deaths ages 15-17 (per 100,000)
2009-2013 0.02014-2018 109.6
Unrestrained automobile fatalities for children under 18a
2009-2013 100.0%2014-2018 100%
Substance abuse hospitalizations ages 1-19 (per 100,000)b
2008-2012 0
2013-2017 8.0**
Mental/behavioral hospitalizations (not substance abuse) ages 1-19 (per 10,000)
2008-2012 35.7
2013-2017 82.3
Uninsured children2013 8.8%2017 5.8%
School attendance, grades 9-122014 95.2%2018 95.3%
Contextual IndicatorsCounty Seat: Maysville
31Population: 12,564
2016
County Composite Rank
2020
28
Demographics
Total population2014 12,6922018 12,564
Child population under 182014 2,2082018 2,173
Children under 18 as % of total population
2014 16.9%2018 16.5%
Child population under 62014 6462018 716
Children under 6 as % of total population
2014 5.1%2018 5.7%
Minority child population under 18
2014 1242018 176
Minority child population under 18 as % of child population
2014 5.8%2018 8.1%
Minority child population under 6
2014 472018 53
Minority child population under 6 as % of under 6 child population
2014 7.3%
2018 7.4%
Children in single-parent families
2009-2013 18.3%2014-2018 19.3%
Children in married-parent families
2009-2013 80.3%2014-2018 79.4%
Economic Well-being
Children in poverty under 62014 30.9%2018 26.6%
Children in poverty, ages 5-172009-2013 19.0%2014-2018 12.9%
Housing cost-burdened households
2009-2013 26.8%2014-2018 20.7%
Family households with children under 18 at 185% of poverty level
2009-2013 32.5%
2014-2018 38.0%
Children in families receiving SNAP
2014 27.5%2018 21.3%
Median income family household with children under 18
2009-2013 $56,950
2014-2018 $61,509
Adult unemployment2014 5.4%2018 3.1%
Child homelessness2014 5.8%2018 4.6%
a If no % listed, no vehicle fatalities happened in the county during that period.b *Indicates unstable rate due to low count (<20 cases);** indicates very unstable rate due to very low count (<5 cases)

Outcome MeasuresNumber Rate Trend Rank
2014 2018 2014 2018 State Rate
County Rank
Economic Well-BeingChildren under 18 in poverty 1,108 1,070 31.8% 31.6% é 18.3% 100
Food insecurity for childrenb 910 740 25.3% 20.7% é 17.5% 84
HealthLow birthweight infantsa,c 65 83 7.2% 9.1% ê 8.5% 94
Preventable hospitalizations for all causes for children under 18 (per 1,000)b,c
24 12 6.7 3.5 é 7.1 9
Child asthma ER rates (per 1,000)b
23 19 6.4 5.5 é 7.5 87
Family & CommunityBirths to teens, ages 15-19 (per 1,000)
18 13 40.4 29 é 21.6 69
Substantiated child abuse/neglect cases (per 1,000)a
15 29 4.1 8.4 ê 4.0 91
EducationHigh school graduation 129 140 95.6% 97.9% é 91.3% 12
Achievement proficiencya,d
3rd grade English/Language Arts (MAP) 61 35.5% 48.6%
8th grade English/Language Arts (MAP)
71 42.3% 49.0%
4th grade Math (MAP) 74 43.0% 45.8%
Algebra I (End of Course exam) 60 41.4% 47.0%
Trend: é better ê worse è no change
Dent CountyCounty Seat: Salem
60Population: 15,504
2016
County Composite Rank
78
2020
a Outcome not included in County Composite Rank.b Data based on 2013 and 2017.c Data based on 5-year time spans, 2009-2013 and 2014-2018.d Achievement proficiency measures those that scored proficient or above on the MAP tests and Algebra I End of Course exam. Achievement data from 2014 are not shown due to differences in testing standards and assessments used in 2018; accordingly, no trend arrows or county ranks are shown.
Dent County
EducationLicensed child care capacity (per 1,000)
2014 44.82019 79.7
Accredited child care capacity as % of licensed capacity
2014 —2019 3.6%
School attendance, grades K-122014 95.0%2018 95.4%
Family & CommunityTeen unintentional deaths/homicides/suicides (per 100,000)
2009-2013 61.52014-2018 59.1
Single parent head-of-house-hold with children under 18
2009-2013 8.4%2014-2018 7.5%
Juvenile law violation referrals, ages 10-17 (per 1,000)
2014 4.82018 25.3
Annual high school dropout rate2014 0.2%2018 0.2%
Children entering/re-entering state custody (per 1,000)
2014 7.82018 7.5
Health
Infant mortality (per 1,000)2009-2013 11.12014-2018 10.9
Child deaths ages 1-17 (per 100,000)
2009-2013 33.62014-2018 28.3
Child deaths ages 1-14 (per 100,000)
2009-2013 33.32014-2018 12.0
Child deaths ages 15-17 (per 100,000)
2009-2013 32.42014-2018 89.4
Unrestrained automobile fatalities for children under 18a
2009-2013 0.0%2014-2018 66.7%
Substance abuse hospitalizations ages 1-19 (per 100,000)b
2008-2012 4.6**
2013-2017 27.4*
Mental/behavioral hospitalizations (not substance abuse) ages 1-19 (per 10,000)
2008-2012 94.3
2013-2017 103.2
Uninsured children2013 9.6%2017 8.0%
School attendance, grades 9-122014 94.7%2018 95.3%
Contextual IndicatorsCounty Seat: Salem
60Population: 15,504
2016
County Composite Rank
2020
78
Demographics
Total population2014 15,6552018 15,504
Child population under 182014 3,6162018 3,461
Children under 18 as % of total population
2014 22.8%2018 22.8%
Child population under 62014 1,1132018 1,111
Children under 6 as % of total population
2014 7.1%2018 7.2%
Minority child population under 18
2014 2062018 273
Minority child population under 18 as % of child population
2014 5.8%2018 7.9%
Minority child population under 6
2014 862018 136
Minority child population under 6 as % of under 6 child population
2014 7.7%
2018 12.2%
Children in single-parent families
2009-2013 34.5%2014-2018 26.6%
Children in married-parent families
2009-2013 64.4%2014-2018 73.2%
Economic Well-being
Children in poverty under 62014 29.7%2018 27.8%
Children in poverty, ages 5-172009-2013 29.3%2014-2018 30.9%
Housing cost-burdened households
2009-2013 30.2%2014-2018 25.8%
Family households with children under 18 at 185% of poverty level
2009-2013 48.2%
2014-2018 42.7%
Children in families receiving SNAP
2014 45.5%2018 40.0%
Median income family household with children under 18
2009-2013 $40,189
2014-2018 $51,563
Adult unemployment2014 6.6%2018 3.3%
Child homelessness2014 2.7%2018 1.8%
a If no % listed, no vehicle fatalities happened in the county during that period.b *Indicates unstable rate due to low count (<20 cases);** indicates very unstable rate due to very low count (<5 cases)

Outcome MeasuresNumber Rate Trend Rank
2014 2018 2014 2018 State Rate
County Rank
Economic Well-BeingChildren under 18 in poverty 991 840 35.0% 29.5% é 18.3% 94
Food insecurity for childrenb 830 630 27.6% 22% é 17.5% 97
HealthLow birthweight infantsa,c 52 48 7.3% 6.1% é 8.5% 9
Preventable hospitalizations for all causes for children under 18 (per 1,000)b,c
13 9 4.3 3.1 é 7.1 7
Child asthma ER rates (per 1,000)b
3 7 1.0 2.4 ê 7.5 30
Family & CommunityBirths to teens, ages 15-19 (per 1,000)
20 7 54.5 20.5 é 21.6 35
Substantiated child abuse/neglect cases (per 1,000)a
29 19 9.8 6.5 é 4.0 73
EducationHigh school graduation 94 99 95.9% 99.0% é 91.3% 5
Achievement proficiencya,d
3rd grade English/Language Arts (MAP) 55 45.8% 48.6%
8th grade English/Language Arts (MAP)
63 54.3% 49.0%
4th grade Math (MAP) 52 43.3% 45.8%
Algebra I (End of Course exam) 55 59.8% 47.0%
Trend: é better ê worse è no change
Douglas CountyCounty Seat: Ava
27Population: 13,374
2016
County Composite Rank
77
2020
a Outcome not included in County Composite Rank.b Data based on 2013 and 2017.c Data based on 5-year time spans, 2009-2013 and 2014-2018.d Achievement proficiency measures those that scored proficient or above on the MAP tests and Algebra I End of Course exam. Achievement data from 2014 are not shown due to differences in testing standards and assessments used in 2018; accordingly, no trend arrows or county ranks are shown.

Douglas County
EducationLicensed child care capacity (per 1,000)
2014 39.92019 57.9
Accredited child care capacity as % of licensed capacity
2014 —2019 0.0%
School attendance, grades K-122014 95.0%2018 94.2%
Family & CommunityTeen unintentional deaths/homicides/suicides (per 100,000)
2009-2013 70.72014-2018 144.5
Single parent head-of-house-hold with children under 18
2009-2013 5.6%2014-2018 4.7%
Juvenile law violation referrals, ages 10-17 (per 1,000)
2014 18.02018 21.4
Annual high school dropout rate2014 0.2%2018 0.4%
Children entering/re-entering state custody (per 1,000)
2014 11.72018 7.5
Health
Infant mortality (per 1,000)2009-2013 7.02014-2018 3.8
Child deaths ages 1-17 (per 100,000)
2009-2013 46.52014-2018 35.0
Child deaths ages 1-14 (per 100,000)
2009-2013 32.52014-2018 21.8
Child deaths ages 15-17 (per 100,000)
2009-2013 110.12014-2018 83.7
Unrestrained automobile fatalities for children under 18a
2009-2013 66.7%2014-2018 %
Substance abuse hospitalizations ages 1-19 (per 100,000)b
2008-2012 0
2013-2017 5.8**
Mental/behavioral hospitalizations (not substance abuse) ages 1-19 (per 10,000)
2008-2012 32.9
2013-2017 56.8
Uninsured children2013 9.5%2017 6.9%
School attendance, grades 9-122014 94.8%2018 93.6%
Contextual IndicatorsCounty Seat: Ava
27Population: 13,374
2016
County Composite Rank
2020
77
Demographics
Total population2014 13,5462018 13,374
Child population under 182014 2,9482018 2,919
Children under 18 as % of total population
2014 21.5%2018 21.4%
Child population under 62014 9282018 911
Children under 6 as % of total population
2014 6.9%2018 6.8%
Minority child population under 18
2014 1352018 171
Minority child population under 18 as % of child population
2014 4.6%2018 5.9%
Minority child population under 6
2014 442018 64
Minority child population under 6 as % of under 6 child population
2014 4.7%
2018 7.0%
Children in single-parent families
2009-2013 28.0%2014-2018 27.6%
Children in married-parent families
2009-2013 71.0%2014-2018 72.1%
Economic Well-being
Children in poverty under 62014 34.7%2018 40.6%
Children in poverty, ages 5-172009-2013 32.7%2014-2018 27.8%
Housing cost-burdened households
2009-2013 27.7%2014-2018 27.6%
Family households with children under 18 at 185% of poverty level
2009-2013 54.6%
2014-2018 59.5%
Children in families receiving SNAP
2014 50.6%2018 41.8%
Median income family household with children under 18
2009-2013 $34,741
2014-2018 $37,380
Adult unemployment2014 7.5%2018 4.6%
Child homelessness2014 0.0%2018 0.0%
a If no % listed, no vehicle fatalities happened in the county during that period.b *Indicates unstable rate due to low count (<20 cases);** indicates very unstable rate due to very low count (<5 cases)

Outcome MeasuresNumber Rate Trend Rank
2014 2018 2014 2018 State Rate
County Rank
Economic Well-BeingChildren under 18 in poverty 3,283 2,785 41.5% 38.1% é 18.3% 112
Food insecurity for childrenb 2,200 1,980 26.9% 24.7% é 17.5% 111
HealthLow birthweight infantsa,c 261 259 11.3% 12.7% ê 8.5% 114
Preventable hospitalizations for all causes for children under 18 (per 1,000)b,c
150 113 18.4 14.5 é 7.1 114
Child asthma ER rates (per 1,000)b
70 59 8.6 7.6 é 7.5 109
Family & CommunityBirths to teens, ages 15-19 (per 1,000)
80 57 79.4 59.3 é 21.6 114
Substantiated child abuse/neglect cases (per 1,000)a
54 26 6.6 3.5 é 4.0 31
EducationHigh school graduation 365 323 91.7% 92.6% é 91.3% 70
Achievement proficiencya,d
3rd grade English/Language Arts (MAP) 168 42.6% 48.6%
8th grade English/Language Arts (MAP)
142 36.9% 49.0%
4th grade Math (MAP) 193 46.5% 45.8%
Algebra I (End of Course exam) 131 39.6% 47.0%
Trend: é better ê worse è no change
Dunklin CountyCounty Seat: Kennett
114Population: 30,428
2016
County Composite Rank
113
2020
a Outcome not included in County Composite Rank.b Data based on 2013 and 2017.c Data based on 5-year time spans, 2009-2013 and 2014-2018.d Achievement proficiency measures those that scored proficient or above on the MAP tests and Algebra I End of Course exam. Achievement data from 2014 are not shown due to differences in testing standards and assessments used in 2018; accordingly, no trend arrows or county ranks are shown.

Dunklin County
EducationLicensed child care capacity (per 1,000)
2014 91.82019 86.8
Accredited child care capacity as % of licensed capacity
2014 —2019 8.9%
School attendance, grades K-122014 94.8%2018 95.0%
Family & CommunityTeen unintentional deaths/homicides/suicides (per 100,000)
2009-2013 65.22014-2018 36.4
Single parent head-of-house-hold with children under 18
2009-2013 13.5%2014-2018 12.1%
Juvenile law violation referrals, ages 10-17 (per 1,000)
2014 45.72018 14.9
Annual high school dropout rate2014 0.9%2018 1.4%
Children entering/re-entering state custody (per 1,000)
2014 15.22018 10.6
Health
Infant mortality (per 1,000)2009-2013 9.62014-2018 7.8
Child deaths ages 1-17 (per 100,000)
2009-2013 22.02014-2018 30.5
Child deaths ages 1-14 (per 100,000)
2009-2013 20.62014-2018 21.0
Child deaths ages 15-17 (per 100,000)
2009-2013 29.52014-2018 59.8
Unrestrained automobile fatalities for children under 18a
2009-2013 25.0%2014-2018 80%
Substance abuse hospitalizations ages 1-19 (per 100,000)b
2008-2012 69.4
2013-2017 71.6
Mental/behavioral hospitalizations (not substance abuse) ages 1-19 (per 10,000)
2008-2012 183.8
2013-2017 169.2
Uninsured children2013 7.1%2017 5.3%
School attendance, grades 9-122014 93.8%2018 94.3%
Contextual IndicatorsCounty Seat: Kennett
114Population: 30,428
2016
County Composite Rank
2020
113
Demographics
Total population2014 31,3442018 30,428
Child population under 182014 8,1512018 7,526
Children under 18 as % of total population
2014 26.0%2018 25.8%
Child population under 62014 2,7282018 2,454
Children under 6 as % of total population
2014 8.7%2018 8.3%
Minority child population under 18
2014 2,3392018 2,204
Minority child population under 18 as % of child population
2014 28.7%2018 29.3%
Minority child population under 6
2014 8802018 790
Minority child population under 6 as % of under 6 child population
2014 32.3%
2018 32.2%
Children in single-parent families
2009-2013 41.8%2014-2018 42.7%
Children in married-parent families
2009-2013 56.9%2014-2018 55.5%
Economic Well-being
Children in poverty under 62014 42.1%2018 38.4%
Children in poverty, ages 5-172009-2013 40.1%2014-2018 36.7%
Housing cost-burdened households
2009-2013 31.7%2014-2018 28.3%
Family households with children under 18 at 185% of poverty level
2009-2013 58.8%
2014-2018 55.6%
Children in families receiving SNAP
2014 64.2%2018 62.1%
Median income family household with children under 18
2009-2013 $35,195
2014-2018 $39,595
Adult unemployment2014 8.7%2018 5.5%
Child homelessness2014 0.7%2018 1.0%
a If no % listed, no vehicle fatalities happened in the county during that period.b *Indicates unstable rate due to low count (<20 cases);** indicates very unstable rate due to very low count (<5 cases)

Outcome MeasuresNumber Rate Trend Rank
2014 2018 2014 2018 State Rate
County Rank
Economic Well-BeingChildren under 18 in poverty 3,808 3,074 16.2% 13.2% é 18.3% 11
Food insecurity for childrenb 5,250 3,950 21.2% 16.5% é 17.5% 17
HealthLow birthweight infantsa,c 446 493 7.0% 8.0% ê 8.5% 60
Preventable hospitalizations for all causes for children under 18 (per 1,000)b,c
174 146 7.0 6.1 é 7.1 57
Child asthma ER rates (per 1,000)b
114 97 4.6 4.0 é 7.5 68
Family & CommunityBirths to teens, ages 15-19 (per 1,000)
93 53 30.4 17.4 é 21.6 23
Substantiated child abuse/neglect cases (per 1,000)a
124 113 5.1 4.7 é 4.0 57
EducationHigh school graduation 1,134 1,003 91.1% 88.6% ê 91.3% 103
Achievement proficiencya,d
3rd grade English/Language Arts (MAP) 628 52.5% 48.6%
8th grade English/Language Arts (MAP)
633 56.1% 49.0%
4th grade Math (MAP) 571 48.5% 45.8%
Algebra I (End of Course exam) 470 41.1% 47.0%
Trend: é better ê worse è no change
Franklin CountyCounty Seat: Union
30Population: 102,781
2016
County Composite Rank
33
2020
a Outcome not included in County Composite Rank.b Data based on 2013 and 2017.c Data based on 5-year time spans, 2009-2013 and 2014-2018.d Achievement proficiency measures those that scored proficient or above on the MAP tests and Algebra I End of Course exam. Achievement data from 2014 are not shown due to differences in testing standards and assessments used in 2018; accordingly, no trend arrows or county ranks are shown.

Franklin County
EducationLicensed child care capacity (per 1,000)
2014 69.82019 62.7
Accredited child care capacity as % of licensed capacity
2014 —2019 19.8%
School attendance, grades K-122014 95.2%2018 94.9%
Family & CommunityTeen unintentional deaths/homicides/suicides (per 100,000)
2009-2013 85.22014-2018 52.5
Single parent head-of-house-hold with children under 18
2009-2013 8.9%2014-2018 8.1%
Juvenile law violation referrals, ages 10-17 (per 1,000)
2014 36.62018 28.6
Annual high school dropout rate2014 1.8%2018 1.8%
Children entering/re-entering state custody (per 1,000)
2014 4.62018 5.5
Health
Infant mortality (per 1,000)2009-2013 6.32014-2018 6.5
Child deaths ages 1-17 (per 100,000)
2009-2013 31.52014-2018 30.2
Child deaths ages 1-14 (per 100,000)
2009-2013 23.52014-2018 21.2
Child deaths ages 15-17 (per 100,000)
2009-2013 69.62014-2018 54.9
Unrestrained automobile fatalities for children under 18a
2009-2013 62.5%2014-2018 50%
Substance abuse hospitalizations ages 1-19 (per 100,000)b
2008-2012 18.2
2013-2017 39.5
Mental/behavioral hospitalizations (not substance abuse) ages 1-19 (per 10,000)
2008-2012 73.2
2013-2017 95.4
Uninsured children2013 6.6%2017 5.1%
School attendance, grades 9-122014 94.8%2018 94.2%
Contextual IndicatorsCounty Seat: Union
30Population: 102,781
2016
County Composite Rank
2020
33
Demographics
Total population2014 102,0842018 102,781
Child population under 182014 24,5332018 23,823
Children under 18 as % of total population
2014 23.6%2018 23.2%
Child population under 62014 7,5942018 7,585
Children under 6 as % of total population
2014 7.4%2018 7.3%
Minority child population under 18
2014 1,4562018 1,483
Minority child population under 18 as % of child population
2014 6.0%2018 6.2%
Minority child population under 6
2014 5622018 558
Minority child population under 6 as % of under 6 child population
2014 7.4%
2018 7.4%
Children in single-parent families
2009-2013 28.6%2014-2018 29.5%
Children in married-parent families
2009-2013 70.1%2014-2018 69.7%
Economic Well-being
Children in poverty under 62014 17.9%2018 10.3%
Children in poverty, ages 5-172009-2013 15.1%2014-2018 12.1%
Housing cost-burdened households
2009-2013 29.3%2014-2018 24.6%
Family households with children under 18 at 185% of poverty level
2009-2013 33.8%
2014-2018 29.5%
Children in families receiving SNAP
2014 28.6%2018 26.2%
Median income family household with children under 18
2009-2013 $58,828
2014-2018 $70,547
Adult unemployment2014 6.4%2018 3.1%
Child homelessness2014 3.8%2018 3.5%
a If no % listed, no vehicle fatalities happened in the county during that period.b *Indicates unstable rate due to low count (<20 cases);** indicates very unstable rate due to very low count (<5 cases)

Outcome MeasuresNumber Rate Trend Rank
2014 2018 2014 2018 State Rate
County Rank
Economic Well-BeingChildren under 18 in poverty 611 514 19.8% 17.4% é 18.3% 29
Food insecurity for childrenb 760 540 23.1% 17.3% é 17.5% 28
HealthLow birthweight infantsa,c 51 61 6.6% 7.9% ê 8.5% 56
Preventable hospitalizations for all causes for children under 18 (per 1,000)b,c
20 16 6.1 5.2 é 7.1 39
Child asthma ER rates (per 1,000)b
10 5 3.0 1.6 é 7.5 14
Family & CommunityBirths to teens, ages 15-19 (per 1,000)
10 10 22.5 24.8 ê 21.6 52
Substantiated child abuse/neglect cases (per 1,000)a
17 31 5.2 10.2 ê 4.0 98
EducationHigh school graduation 193 199 92.8% 90.0% ê 91.3% 94
Achievement proficiencya,d
3rd grade English/Language Arts (MAP) 90 47.9% 48.6%
8th grade English/Language Arts (MAP)
124 51.9% 49.0%
4th grade Math (MAP) 99 50.5% 45.8%
Algebra I (End of Course exam) 91 40.1% 47.0%
Trend: é better ê worse è no change
Gasconade CountyCounty Seat: Hermann
28Population: 14,746
2016
County Composite Rank
31
2020
a Outcome not included in County Composite Rank.b Data based on 2013 and 2017.c Data based on 5-year time spans, 2009-2013 and 2014-2018.d Achievement proficiency measures those that scored proficient or above on the MAP tests and Algebra I End of Course exam. Achievement data from 2014 are not shown due to differences in testing standards and assessments used in 2018; accordingly, no trend arrows or county ranks are shown.

Gasconade County
EducationLicensed child care capacity (per 1,000)
2014 100.32019 62.1
Accredited child care capacity as % of licensed capacity
2014 —2019 0.0%
School attendance, grades K-122014 95.8%2018 94.9%
Family & CommunityTeen unintentional deaths/homicides/suicides (per 100,000)
2009-2013 130.12014-2018 46.8
Single parent head-of-house-hold with children under 18
2009-2013 9.1%2014-2018 5.1%
Juvenile law violation referrals, ages 10-17 (per 1,000)
2014 26.52018 9.6
Annual high school dropout rate2014 1.3%2018 2.2%
Children entering/re-entering state custody (per 1,000)
2014 1.92018 3.3
Health
Infant mortality (per 1,000)2009-2013 5.22014-2018 0.0
Child deaths ages 1-17 (per 100,000)
2009-2013 48.82014-2018 25.6
Child deaths ages 1-14 (per 100,000)
2009-2013 22.62014-2018 26.9
Child deaths ages 15-17 (per 100,000)
2009-2013 161.32014-2018 0.0
Unrestrained automobile fatalities for children under 18a
2009-2013 50.0%2014-2018 0%
Substance abuse hospitalizations ages 1-19 (per 100,000)b
2008-2012 19.5**
2013-2017 31.6*
Mental/behavioral hospitalizations (not substance abuse) ages 1-19 (per 10,000)
2008-2012 92.2
2013-2017 93.3
Uninsured children2013 8.8%2017 6.5%
School attendance, grades 9-122014 95.5%2018 94.9%
Contextual IndicatorsCounty Seat: Hermann
28Population: 14,746
2016
County Composite Rank
2020
31
Demographics
Total population2014 14,8662018 14,746
Child population under 182014 3,2712018 3,029
Children under 18 as % of total population
2014 21.3%2018 21.2%
Child population under 62014 9272018 909
Children under 6 as % of total population
2014 6.2%2018 6.2%
Minority child population under 18
2014 1762018 154
Minority child population under 18 as % of child population
2014 5.6%2018 5.1%
Minority child population under 6
2014 622018 39
Minority child population under 6 as % of under 6 child population
2014 6.7%
2018 4.3%
Children in single-parent families
2009-2013 27.5%2014-2018 24.2%
Children in married-parent families
2009-2013 69.6%2014-2018 75.5%
Economic Well-being
Children in poverty under 62014 29.7%2018 27.8%
Children in poverty, ages 5-172009-2013 18.2%2014-2018 16.3%
Housing cost-burdened households
2009-2013 25.4%2014-2018 20.7%
Family households with children under 18 at 185% of poverty level
2009-2013 35.9%
2014-2018 28.7%
Children in families receiving SNAP
2014 31.5%2018 28.4%
Median income family household with children under 18
2009-2013 $56,654
2014-2018 $62,995
Adult unemployment2014 5.3%2018 2.9%
Child homelessness2014 3.3%2018 4.1%
a If no % listed, no vehicle fatalities happened in the county during that period.b *Indicates unstable rate due to low count (<20 cases);** indicates very unstable rate due to very low count (<5 cases)
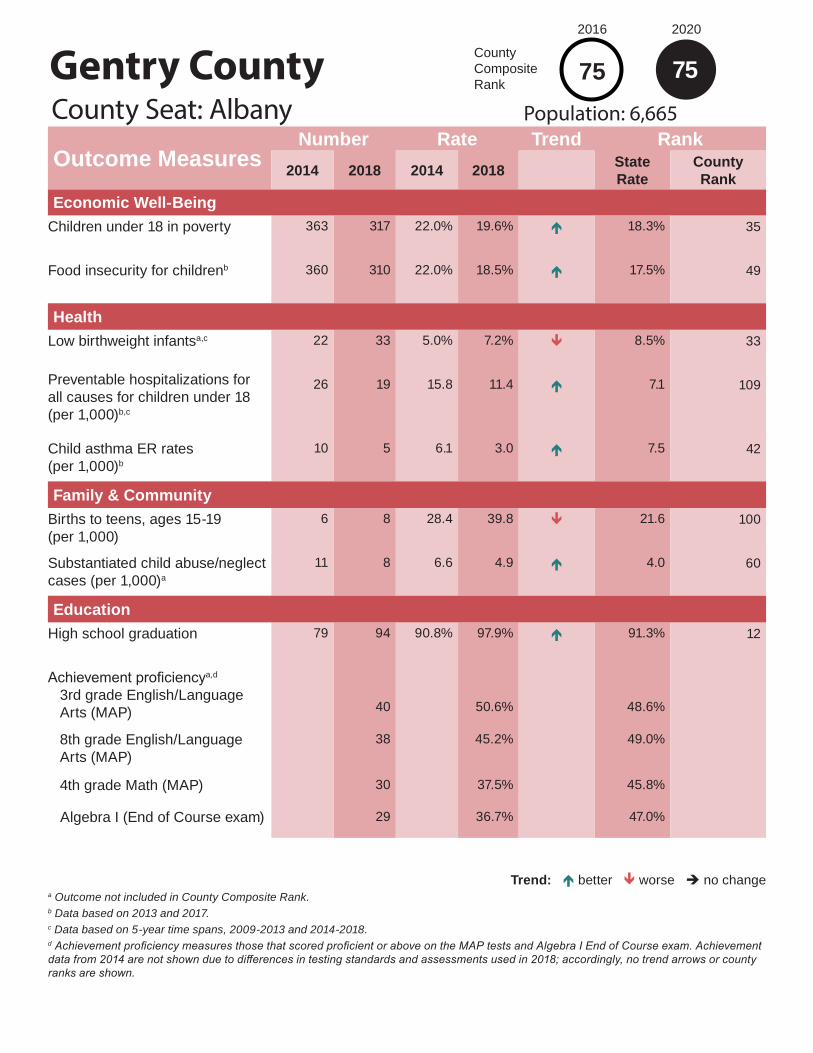
Outcome MeasuresNumber Rate Trend Rank
2014 2018 2014 2018 State Rate
County Rank
Economic Well-BeingChildren under 18 in poverty 363 317 22.0% 19.6% é 18.3% 35
Food insecurity for childrenb 360 310 22.0% 18.5% é 17.5% 49
HealthLow birthweight infantsa,c 22 33 5.0% 7.2% ê 8.5% 33
Preventable hospitalizations for all causes for children under 18 (per 1,000)b,c
26 19 15.8 11.4 é 7.1 109
Child asthma ER rates (per 1,000)b
10 5 6.1 3.0 é 7.5 42
Family & CommunityBirths to teens, ages 15-19 (per 1,000)
6 8 28.4 39.8 ê 21.6 100
Substantiated child abuse/neglect cases (per 1,000)a
11 8 6.6 4.9 é 4.0 60
EducationHigh school graduation 79 94 90.8% 97.9% é 91.3% 12
Achievement proficiencya,d
3rd grade English/Language Arts (MAP) 40 50.6% 48.6%
8th grade English/Language Arts (MAP)
38 45.2% 49.0%
4th grade Math (MAP) 30 37.5% 45.8%
Algebra I (End of Course exam) 29 36.7% 47.0%
Trend: é better ê worse è no change
Gentry CountyCounty Seat: Albany
75Population: 6,665
2016
County Composite Rank
75
2020
a Outcome not included in County Composite Rank.b Data based on 2013 and 2017.c Data based on 5-year time spans, 2009-2013 and 2014-2018.d Achievement proficiency measures those that scored proficient or above on the MAP tests and Algebra I End of Course exam. Achievement data from 2014 are not shown due to differences in testing standards and assessments used in 2018; accordingly, no trend arrows or county ranks are shown.

Gentry County
EducationLicensed child care capacity (per 1,000)
2014 123.32019 131.1
Accredited child care capacity as % of licensed capacity
2014 —2019 31.2%
School attendance, grades K-122014 95.9%2018 95.6%
Family & CommunityTeen unintentional deaths/homicides/suicides (per 100,000)
2009-2013 0.02014-2018 0.0
Single parent head-of-house-hold with children under 18
2009-2013 6.4%2014-2018 6.0%
Juvenile law violation referrals, ages 10-17 (per 1,000)
2014 12.52018 11.6
Annual high school dropout rate2014 2.5%2018 0.0%
Children entering/re-entering state custody (per 1,000)
2014 4.22018 7.3
Health
Infant mortality (per 1,000)2009-2013 0.02014-2018 8.7
Child deaths ages 1-17 (per 100,000)
2009-2013 48.62014-2018 36.7
Child deaths ages 1-14 (per 100,000)
2009-2013 58.62014-2018 37.4
Child deaths ages 15-17 (per 100,000)
2009-2013 0.02014-2018 0.0
Unrestrained automobile fatalities for children under 18a
2009-2013 100.0%2014-2018 %
Substance abuse hospitalizations ages 1-19 (per 100,000)b
2008-2012 0
2013-2017 0
Mental/behavioral hospitalizations (not substance abuse) ages 1-19 (per 10,000)
2008-2012 73.9
2013-2017 86.6
Uninsured children2013 10.5%2017 7.1%
School attendance, grades 9-122014 94.8%2018 94.5%
Contextual IndicatorsCounty Seat: Albany
75Population: 6,665
2016
County Composite Rank
2020
75
Demographics
Total population2014 6,8262018 6,665
Child population under 182014 1,6602018 1,640
Children under 18 as % of total population
2014 24.6%2018 24.5%
Child population under 62014 6032018 575
Children under 6 as % of total population
2014 8.8%2018 8.7%
Minority child population under 18
2014 702018 92
Minority child population under 18 as % of child population
2014 4.2%2018 5.6%
Minority child population under 6
2014 252018 29
Minority child population under 6 as % of under 6 child population
2014 4.1%
2018 5.0%
Children in single-parent families
2009-2013 27.7%2014-2018 19.9%
Children in married-parent families
2009-2013 69.8%2014-2018 79.9%
Economic Well-being
Children in poverty under 62014 27.5%2018 27.1%
Children in poverty, ages 5-172009-2013 22.0%2014-2018 19.5%
Housing cost-burdened households
2009-2013 23.0%2014-2018 22.2%
Family households with children under 18 at 185% of poverty level
2009-2013 42.9%
2014-2018 46.1%
Children in families receiving SNAP
2014 24.8%2018 20.7%
Median income family household with children under 18
2009-2013 $46,731
2014-2018 $52,238
Adult unemployment2014 5.6%2018 2.4%
Child homelessness2014 0.0%2018 0.0%
a If no % listed, no vehicle fatalities happened in the county during that period.b *Indicates unstable rate due to low count (<20 cases);** indicates very unstable rate due to very low count (<5 cases)

Outcome MeasuresNumber Rate Trend Rank
2014 2018 2014 2018 State Rate
County Rank
Economic Well-BeingChildren under 18 in poverty 13,951 9,804 23.9% 16.5% é 18.3% 26
Food insecurity for childrenb 13,370 10,610 22.7% 17.6% é 17.5% 34
HealthLow birthweight infantsa,c 1,319 1,305 7.5% 7.5% è 8.5% 44
Preventable hospitalizations for all causes for children under 18 (per 1,000)b,c
448 292 7.6 4.8 é 7.1 31
Child asthma ER rates (per 1,000)b
232 161 3.9 2.7 é 7.5 35
Family & CommunityBirths to teens, ages 15-19 (per 1,000)
282 208 29.5 21.6 é 21.6 38
Substantiated child abuse/neglect cases (per 1,000)a
394 253 6.7 4.2 é 4.0 41
EducationHigh school graduation 2,488 2,546 90.4% 88.7% ê 91.3% 101
Achievement proficiencya,d
3rd grade English/Language Arts (MAP) 1,539 48.9% 48.6%
8th grade English/Language Arts (MAP)
1,511 50.7% 49.0%
4th grade Math (MAP) 1,336 40.8% 45.8%
Algebra I (End of Course exam) 1,319 43.3% 47.0%
Trend: é better ê worse è no change
Greene CountyCounty Seat: Springfield
35Population: 288,429
2016
County Composite Rank
55
2020
a Outcome not included in County Composite Rank.b Data based on 2013 and 2017.c Data based on 5-year time spans, 2009-2013 and 2014-2018.d Achievement proficiency measures those that scored proficient or above on the MAP tests and Algebra I End of Course exam. Achievement data from 2014 are not shown due to differences in testing standards and assessments used in 2018; accordingly, no trend arrows or county ranks are shown.

Greene County
EducationLicensed child care capacity (per 1,000)
2014 119.92019 114.3
Accredited child care capacity as % of licensed capacity
2014 —2019 18.1%
School attendance, grades K-122014 94.9%2018 94.1%
Family & CommunityTeen unintentional deaths/homicides/suicides (per 100,000)
2009-2013 31.32014-2018 42.1
Single parent head-of-house-hold with children under 18
2009-2013 8.5%2014-2018 7.7%
Juvenile law violation referrals, ages 10-17 (per 1,000)
2014 36.72018 18.4
Annual high school dropout rate2014 1.8%2018 2.5%
Children entering/re-entering state custody (per 1,000)
2014 6.02018 5.4
Health
Infant mortality (per 1,000)2009-2013 5.72014-2018 6.3
Child deaths ages 1-17 (per 100,000)
2009-2013 24.12014-2018 19.2
Child deaths ages 1-14 (per 100,000)
2009-2013 18.72014-2018 11.0
Child deaths ages 15-17 (per 100,000)
2009-2013 53.32014-2018 52.0
Unrestrained automobile fatalities for children under 18a
2009-2013 66.7%2014-2018 100%
Substance abuse hospitalizations ages 1-19 (per 100,000)b
2008-2012 25
2013-2017 39.2
Mental/behavioral hospitalizations (not substance abuse) ages 1-19 (per 10,000)
2008-2012 96.7
2013-2017 117.9
Uninsured children2013 7.4%2017 4.8%
School attendance, grades 9-122014 93.8%2018 92.9%
Contextual IndicatorsCounty Seat: Springfield
35Population: 288,429
2016
County Composite Rank
2020
55
Demographics
Total population2014 285,8652018 288,429
Child population under 182014 59,1932018 60,957
Children under 18 as % of total population
2014 21.0%2018 21.0%
Child population under 62014 20,7932018 21,157
Children under 6 as % of total population
2014 7.3%2018 7.2%
Minority child population under 18
2014 9,1912018 9,941
Minority child population under 18 as % of child population
2014 15.3%2018 16.3%
Minority child population under 6
2014 3,3072018 3,593
Minority child population under 6 as % of under 6 child population
2014 15.9%
2018 17.0%
Children in single-parent families
2009-2013 33.3%2014-2018 30.4%
Children in married-parent families
2009-2013 64.5%2014-2018 67.8%
Economic Well-being
Children in poverty under 62014 32.5%2018 12.5%
Children in poverty, ages 5-172009-2013 21.2%2014-2018 16.7%
Housing cost-burdened households
2009-2013 34.9%2014-2018 31.6%
Family households with children under 18 at 185% of poverty level
2009-2013 44.4%
2014-2018 38.1%
Children in families receiving SNAP
2014 35.2%2018 33.0%
Median income family household with children under 18
2009-2013 $47,110
2014-2018 $57,809
Adult unemployment2014 4.8%2018 2.6%
Child homelessness2014 3.4%2018 6.8%
a If no % listed, no vehicle fatalities happened in the county during that period.b *Indicates unstable rate due to low count (<20 cases);** indicates very unstable rate due to very low count (<5 cases)

Outcome MeasuresNumber Rate Trend Rank
2014 2018 2014 2018 State Rate
County Rank
Economic Well-BeingChildren under 18 in poverty 639 597 27.4% 25.8% é 18.3% 83
Food insecurity for childrenb 550 480 22.1% 20.4% é 17.5% 80
HealthLow birthweight infantsa,c 49 66 6.7% 8.6% ê 8.5% 81
Preventable hospitalizations for all causes for children under 18 (per 1,000)b,c
18 15 7.3 6.3 é 7.1 61
Child asthma ER rates (per 1,000)b
6 11 2.4 4.6 ê 7.5 76
Family & CommunityBirths to teens, ages 15-19 (per 1,000)
17 15 48.7 44 é 21.6 105
Substantiated child abuse/neglect cases (per 1,000)a
13 25 5.3 10.5 ê 4.0 101
EducationHigh school graduation 100 89 89.3% 95.7% é 91.3% 31
Achievement proficiencya,d
3rd grade English/Language Arts (MAP) 55 51.4% 48.6%
8th grade English/Language Arts (MAP)
41 43.2% 49.0%
4th grade Math (MAP) 53 46.1% 45.8%
Algebra I (End of Course exam) 54 49.1% 47.0%
Trend: é better ê worse è no change
Grundy CountyCounty Seat: Trenton
87Population: 10,039
2016
County Composite Rank
72
2020
a Outcome not included in County Composite Rank.b Data based on 2013 and 2017.c Data based on 5-year time spans, 2009-2013 and 2014-2018.d Achievement proficiency measures those that scored proficient or above on the MAP tests and Algebra I End of Course exam. Achievement data from 2014 are not shown due to differences in testing standards and assessments used in 2018; accordingly, no trend arrows or county ranks are shown.

Grundy County
EducationLicensed child care capacity (per 1,000)
2014 60.92019 62.3
Accredited child care capacity as % of licensed capacity
2014 —2019 0.0%
School attendance, grades K-122014 95.6%2018 95.2%
Family & CommunityTeen unintentional deaths/homicides/suicides (per 100,000)
2009-2013 28.32014-2018 100.7
Single parent head-of-house-hold with children under 18
2009-2013 5.6%2014-2018 8.0%
Juvenile law violation referrals, ages 10-17 (per 1,000)
2014 13.82018 23.8
Annual high school dropout rate2014 1.6%2018 0.3%
Children entering/re-entering state custody (per 1,000)
2014 10.02018 11.4
Health
Infant mortality (per 1,000)2009-2013 8.32014-2018 14.3
Child deaths ages 1-17 (per 100,000)
2009-2013 24.42014-2018 42.9
Child deaths ages 1-14 (per 100,000)
2009-2013 19.42014-2018 42.8
Child deaths ages 15-17 (per 100,000)
2009-2013 50.92014-2018 0.0
Unrestrained automobile fatalities for children under 18a
2009-2013 %2014-2018 %
Substance abuse hospitalizations ages 1-19 (per 100,000)b
2008-2012 6.4**
2013-2017 20.0**
Mental/behavioral hospitalizations (not substance abuse) ages 1-19 (per 10,000)
2008-2012 92.2
2013-2017 80.6
Uninsured children2013 8.7%2017 8.3%
School attendance, grades 9-122014 95.0%2018 95.2%
Contextual IndicatorsCounty Seat: Trenton
87Population: 10,039
2016
County Composite Rank
2020
72
Demographics
Total population2014 10,1972018 10,039
Child population under 182014 2,4572018 2,377
Children under 18 as % of total population
2014 23.7%2018 23.2%
Child population under 62014 8452018 864
Children under 6 as % of total population
2014 8.3%2018 8.7%
Minority child population under 18
2014 1592018 186
Minority child population under 18 as % of child population
2014 6.6%2018 7.8%
Minority child population under 6
2014 562018 63
Minority child population under 6 as % of under 6 child population
2014 6.6%
2018 7.3%
Children in single-parent families
2009-2013 31.5%2014-2018 26.3%
Children in married-parent families
2009-2013 67.3%2014-2018 71.7%
Economic Well-being
Children in poverty under 62014 27.5%2018 27.2%
Children in poverty, ages 5-172009-2013 25.8%2014-2018 25.3%
Housing cost-burdened households
2009-2013 24.0%2014-2018 20.0%
Family households with children under 18 at 185% of poverty level
2009-2013 50.1%
2014-2018 39.7%
Children in families receiving SNAP
2014 31.5%2018 32.4%
Median income family household with children under 18
2009-2013 $39,306
2014-2018 $56,921
Adult unemployment2014 5.3%2018 3.6%
Child homelessness2014 2.3%2018 2.0%
a If no % listed, no vehicle fatalities happened in the county during that period.b *Indicates unstable rate due to low count (<20 cases);** indicates very unstable rate due to very low count (<5 cases)
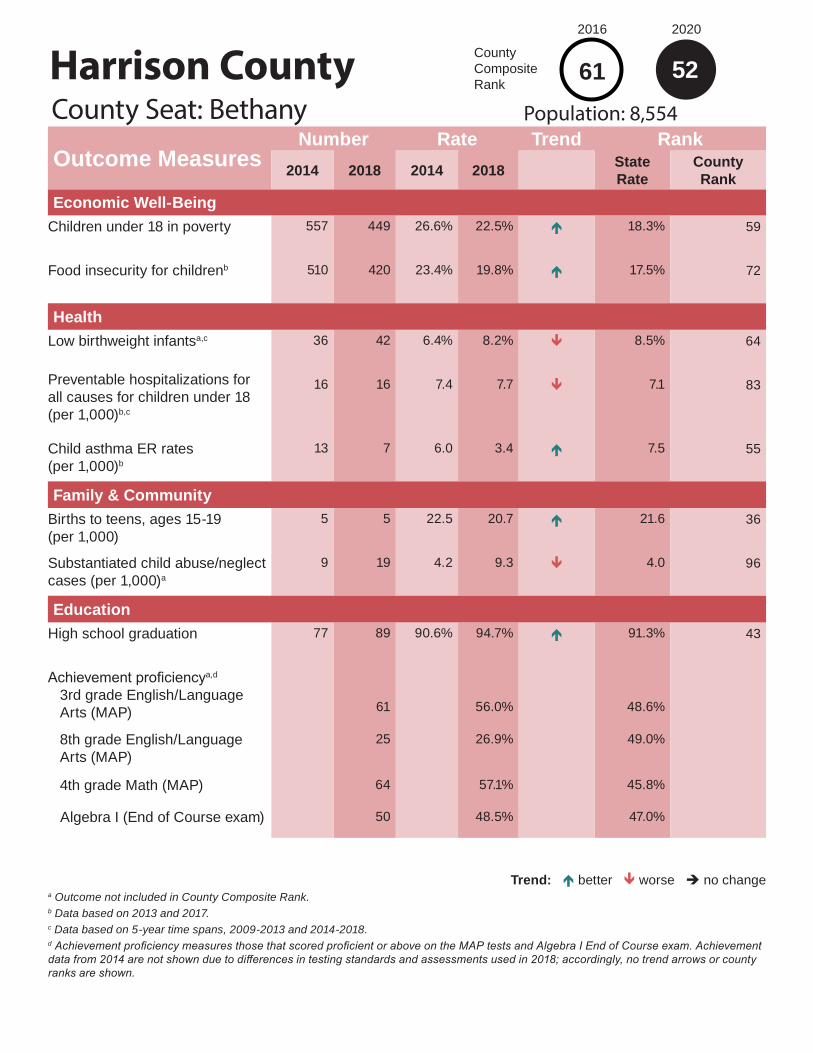
Outcome MeasuresNumber Rate Trend Rank
2014 2018 2014 2018 State Rate
County Rank
Economic Well-BeingChildren under 18 in poverty 557 449 26.6% 22.5% é 18.3% 59
Food insecurity for childrenb 510 420 23.4% 19.8% é 17.5% 72
HealthLow birthweight infantsa,c 36 42 6.4% 8.2% ê 8.5% 64
Preventable hospitalizations for all causes for children under 18 (per 1,000)b,c
16 16 7.4 7.7 ê 7.1 83
Child asthma ER rates (per 1,000)b
13 7 6.0 3.4 é 7.5 55
Family & CommunityBirths to teens, ages 15-19 (per 1,000)
5 5 22.5 20.7 é 21.6 36
Substantiated child abuse/neglect cases (per 1,000)a
9 19 4.2 9.3 ê 4.0 96
EducationHigh school graduation 77 89 90.6% 94.7% é 91.3% 43
Achievement proficiencya,d
3rd grade English/Language Arts (MAP) 61 56.0% 48.6%
8th grade English/Language Arts (MAP)
25 26.9% 49.0%
4th grade Math (MAP) 64 57.1% 45.8%
Algebra I (End of Course exam) 50 48.5% 47.0%
Trend: é better ê worse è no change
Harrison CountyCounty Seat: Bethany
52Population: 8,554
2016
County Composite Rank
61
2020
a Outcome not included in County Composite Rank.b Data based on 2013 and 2017.c Data based on 5-year time spans, 2009-2013 and 2014-2018.d Achievement proficiency measures those that scored proficient or above on the MAP tests and Algebra I End of Course exam. Achievement data from 2014 are not shown due to differences in testing standards and assessments used in 2018; accordingly, no trend arrows or county ranks are shown.

Harrison County
EducationLicensed child care capacity (per 1,000)
2014 74.82019 39.3
Accredited child care capacity as % of licensed capacity
2014 —2019 0.0%
School attendance, grades K-122014 95.3%2018 94.9%
Family & CommunityTeen unintentional deaths/homicides/suicides (per 100,000)
2009-2013 112.32014-2018 38.8
Single parent head-of-house-hold with children under 18
2009-2013 7.8%2014-2018 11.6%
Juvenile law violation referrals, ages 10-17 (per 1,000)
2014 21.92018 36.5
Annual high school dropout rate2014 0.5%2018 0.3%
Children entering/re-entering state custody (per 1,000)
2014 3.32018 10.3
Health
Infant mortality (per 1,000)2009-2013 8.82014-2018 3.9
Child deaths ages 1-17 (per 100,000)
2009-2013 27.62014-2018 9.5
Child deaths ages 1-14 (per 100,000)
2009-2013 21.62014-2018 9.9
Child deaths ages 15-17 (per 100,000)
2009-2013 60.82014-2018 0.0
Unrestrained automobile fatalities for children under 18a
2009-2013 100.0%2014-2018 %
Substance abuse hospitalizations ages 1-19 (per 100,000)b
2008-2012 0
2013-2017 15.6**
Mental/behavioral hospitalizations (not substance abuse) ages 1-19 (per 10,000)
2008-2012 62.3
2013-2017 105.3
Uninsured children2013 9.2%2017 8.2%
School attendance, grades 9-122014 95.0%2018 94.2%
Contextual IndicatorsCounty Seat: Bethany
52Population: 8,554
2016
County Composite Rank
2020
61
Demographics
Total population2014 8,6392018 8,554
Child population under 182014 2,1292018 2,034
Children under 18 as % of total population
2014 24.6%2018 24.5%
Child population under 62014 6992018 644
Children under 6 as % of total population
2014 8.1%2018 7.7%
Minority child population under 18
2014 1172018 135
Minority child population under 18 as % of child population
2014 5.5%2018 6.6%
Minority child population under 6
2014 412018 38
Minority child population under 6 as % of under 6 child population
2014 5.9%
2018 5.9%
Children in single-parent families
2009-2013 31.8%2014-2018 41.4%
Children in married-parent families
2009-2013 67.7%2014-2018 57.7%
Economic Well-being
Children in poverty under 62014 27.4%2018 27.2%
Children in poverty, ages 5-172009-2013 24.5%2014-2018 20.8%
Housing cost-burdened households
2009-2013 21.8%2014-2018 23.3%
Family households with children under 18 at 185% of poverty level
2009-2013 47.7%
2014-2018 51.1%
Children in families receiving SNAP
2014 35.4%2018 34.3%
Median income family household with children under 18
2009-2013 $44,583
2014-2018 $45,000
Adult unemployment2014 6.4%2018 3.1%
Child homelessness2014 0.0%2018 0.0%
a If no % listed, no vehicle fatalities happened in the county during that period.b *Indicates unstable rate due to low count (<20 cases);** indicates very unstable rate due to very low count (<5 cases)

Outcome MeasuresNumber Rate Trend Rank
2014 2018 2014 2018 State Rate
County Rank
Economic Well-BeingChildren under 18 in poverty 1,244 1,108 26.1% 23.9% é 18.3% 71
Food insecurity for childrenb 1,170 1,060 23.7% 21.7% é 17.5% 94
HealthLow birthweight infantsa,c 94 107 7.1% 8.7% ê 8.5% 84
Preventable hospitalizations for all causes for children under 18 (per 1,000)b,c
30 53 6.0 11.0 ê 7.1 107
Child asthma ER rates (per 1,000)b
40 27 8.1 5.6 é 7.5 92
Family & CommunityBirths to teens, ages 15-19 (per 1,000)
29 20 49.9 32.1 é 21.6 80
Substantiated child abuse/neglect cases (per 1,000)a
21 19 4.2 4.0 é 4.0 40
EducationHigh school graduation 204 192 89.5% 88.1% ê 91.3% 104
Achievement proficiencya,d
3rd grade English/Language Arts (MAP) 85 38.8% 48.6%
8th grade English/Language Arts (MAP)
70 37.0% 49.0%
4th grade Math (MAP) 58 28.6% 45.8%
Algebra I (End of Course exam) 95 40.1% 47.0%
Trend: é better ê worse è no change
Henry CountyCounty Seat: Clinton
106Population: 21,765
2016
County Composite Rank
95
2020
a Outcome not included in County Composite Rank.b Data based on 2013 and 2017.c Data based on 5-year time spans, 2009-2013 and 2014-2018.d Achievement proficiency measures those that scored proficient or above on the MAP tests and Algebra I End of Course exam. Achievement data from 2014 are not shown due to differences in testing standards and assessments used in 2018; accordingly, no trend arrows or county ranks are shown.
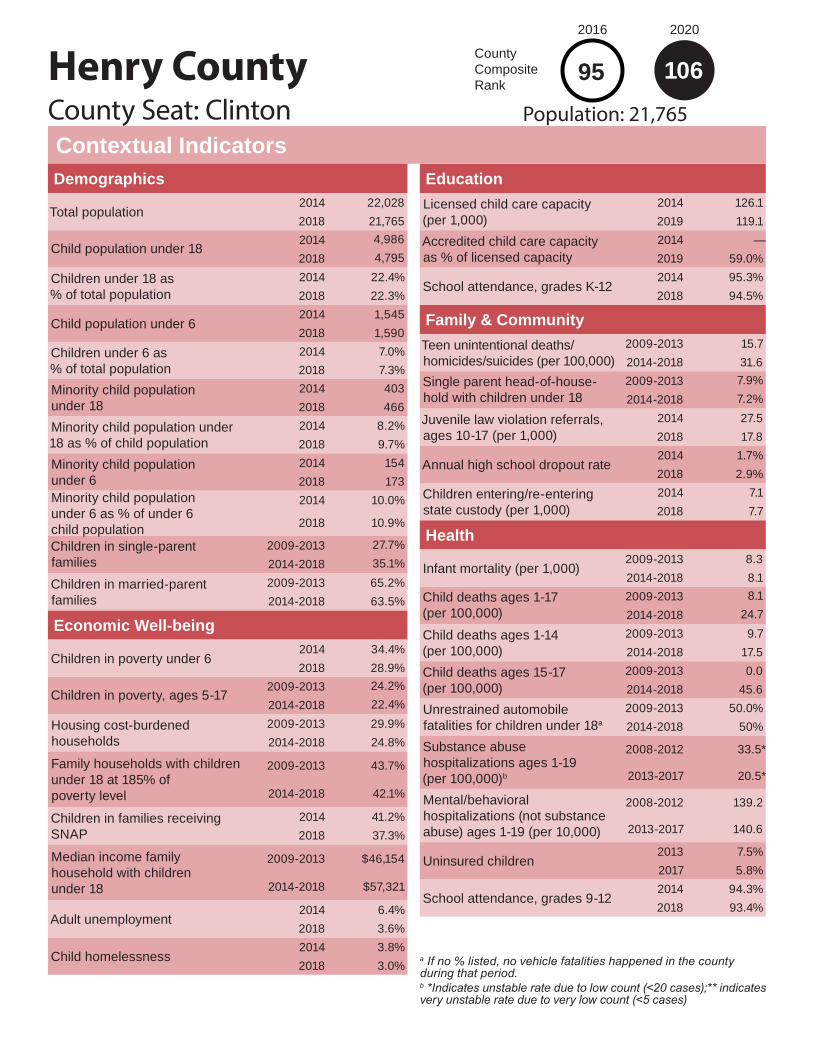
Henry County
EducationLicensed child care capacity (per 1,000)
2014 126.12019 119.1
Accredited child care capacity as % of licensed capacity
2014 —2019 59.0%
School attendance, grades K-122014 95.3%2018 94.5%
Family & CommunityTeen unintentional deaths/homicides/suicides (per 100,000)
2009-2013 15.72014-2018 31.6
Single parent head-of-house-hold with children under 18
2009-2013 7.9%2014-2018 7.2%
Juvenile law violation referrals, ages 10-17 (per 1,000)
2014 27.52018 17.8
Annual high school dropout rate2014 1.7%2018 2.9%
Children entering/re-entering state custody (per 1,000)
2014 7.12018 7.7
Health
Infant mortality (per 1,000)2009-2013 8.32014-2018 8.1
Child deaths ages 1-17 (per 100,000)
2009-2013 8.12014-2018 24.7
Child deaths ages 1-14 (per 100,000)
2009-2013 9.72014-2018 17.5
Child deaths ages 15-17 (per 100,000)
2009-2013 0.02014-2018 45.6
Unrestrained automobile fatalities for children under 18a
2009-2013 50.0%2014-2018 50%
Substance abuse hospitalizations ages 1-19 (per 100,000)b
2008-2012 33.5*
2013-2017 20.5*
Mental/behavioral hospitalizations (not substance abuse) ages 1-19 (per 10,000)
2008-2012 139.2
2013-2017 140.6
Uninsured children2013 7.5%2017 5.8%
School attendance, grades 9-122014 94.3%2018 93.4%
Contextual IndicatorsCounty Seat: Clinton
106Population: 21,765
2016
County Composite Rank
2020
95
Demographics
Total population2014 22,0282018 21,765
Child population under 182014 4,9862018 4,795
Children under 18 as % of total population
2014 22.4%2018 22.3%
Child population under 62014 1,5452018 1,590
Children under 6 as % of total population
2014 7.0%2018 7.3%
Minority child population under 18
2014 4032018 466
Minority child population under 18 as % of child population
2014 8.2%2018 9.7%
Minority child population under 6
2014 1542018 173
Minority child population under 6 as % of under 6 child population
2014 10.0%
2018 10.9%
Children in single-parent families
2009-2013 27.7%2014-2018 35.1%
Children in married-parent families
2009-2013 65.2%2014-2018 63.5%
Economic Well-being
Children in poverty under 62014 34.4%2018 28.9%
Children in poverty, ages 5-172009-2013 24.2%2014-2018 22.4%
Housing cost-burdened households
2009-2013 29.9%2014-2018 24.8%
Family households with children under 18 at 185% of poverty level
2009-2013 43.7%
2014-2018 42.1%
Children in families receiving SNAP
2014 41.2%2018 37.3%
Median income family household with children under 18
2009-2013 $46,154
2014-2018 $57,321
Adult unemployment2014 6.4%2018 3.6%
Child homelessness2014 3.8%2018 3.0%
a If no % listed, no vehicle fatalities happened in the county during that period.b *Indicates unstable rate due to low count (<20 cases);** indicates very unstable rate due to very low count (<5 cases)

Outcome MeasuresNumber Rate Trend Rank
2014 2018 2014 2018 State Rate
County Rank
Economic Well-BeingChildren under 18 in poverty 600 547 39.5% 34.5% é 18.3% 105
Food insecurity for childrenb 490 370 29.0% 23.4% é 17.5% 105
HealthLow birthweight infantsa,c 26 45 7.0% 11.8% ê 8.5% 112
Preventable hospitalizations for all causes for children under 18 (per 1,000)b,c
10 5 6.0 3.1 é 7.1 6
Child asthma ER rates (per 1,000)b
7 4 4.2 2.5 é 7.5 32
Family & CommunityBirths to teens, ages 15-19 (per 1,000)
5 7 21.6 30.6 ê 21.6 74
Substantiated child abuse/neglect cases (per 1,000)a
8 18 4.9 11.0 ê 4.0 105
EducationHigh school graduation 123 107 95.3% 98.2% é 91.3% 10
Achievement proficiencya,d
3rd grade English/Language Arts (MAP) 69 54.8% 48.6%
8th grade English/Language Arts (MAP)
77 63.6% 49.0%
4th grade Math (MAP) 60 53.1% 45.8%
Algebra I (End of Course exam) 72 59.5% 47.0%
Trend: é better ê worse è no change
Hickory CountyCounty Seat: Hermitage
68Population: 9,368
2016
County Composite Rank
85
2020
a Outcome not included in County Composite Rank.b Data based on 2013 and 2017.c Data based on 5-year time spans, 2009-2013 and 2014-2018.d Achievement proficiency measures those that scored proficient or above on the MAP tests and Algebra I End of Course exam. Achievement data from 2014 are not shown due to differences in testing standards and assessments used in 2018; accordingly, no trend arrows or county ranks are shown.

Hickory County
EducationLicensed child care capacity (per 1,000)
2014 63.52019 80.2
Accredited child care capacity as % of licensed capacity
2014 —2019 0.0%
School attendance, grades K-122014 95.5%2018 95.5%
Family & CommunityTeen unintentional deaths/homicides/suicides (per 100,000)
2009-2013 41.12014-2018 84.0
Single parent head-of-house-hold with children under 18
2009-2013 5.0%2014-2018 4.0%
Juvenile law violation referrals, ages 10-17 (per 1,000)
2014 24.82018 30.8
Annual high school dropout rate2014 0.6%2018 0.0%
Children entering/re-entering state custody (per 1,000)
2014 1.92018 2.4
Health
Infant mortality (per 1,000)2009-2013 10.82014-2018 10.5
Child deaths ages 1-17 (per 100,000)
2009-2013 23.92014-2018 25.5
Child deaths ages 1-14 (per 100,000)
2009-2013 15.02014-2018 13.8
Child deaths ages 15-17 (per 100,000)
2009-2013 59.52014-2018 67.6
Unrestrained automobile fatalities for children under 18a
2009-2013 100.0%2014-2018 100%
Substance abuse hospitalizations ages 1-19 (per 100,000)b
2008-2012 0
2013-2017 10.5**
Mental/behavioral hospitalizations (not substance abuse) ages 1-19 (per 10,000)
2008-2012 81.4
2013-2017 99.3
Uninsured children2013 11.8%2017 8.2%
School attendance, grades 9-122014 95.5%2018 95.2%
Contextual IndicatorsCounty Seat: Hermitage
68Population: 9,368
2016
County Composite Rank
2020
85
Demographics
Total population2014 9,2192018 9,368
Child population under 182014 1,6452018 1,633
Children under 18 as % of total population
2014 17.1%2018 16.8%
Child population under 62014 4502018 504
Children under 6 as % of total population
2014 4.9%2018 5.3%
Minority child population under 18
2014 912018 126
Minority child population under 18 as % of child population
2014 5.8%2018 7.7%
Minority child population under 6
2014 262018 56
Minority child population under 6 as % of under 6 child population
2014 5.8%
2018 11.1%
Children in single-parent families
2009-2013 26.6%2014-2018 28.0%
Children in married-parent families
2009-2013 72.1%2014-2018 69.7%
Economic Well-being
Children in poverty under 62014 30.4%2018 22.7%
Children in poverty, ages 5-172009-2013 36.1%2014-2018 32.3%
Housing cost-burdened households
2009-2013 33.8%2014-2018 27.3%
Family households with children under 18 at 185% of poverty level
2009-2013 59.1%
2014-2018 44.1%
Children in families receiving SNAP
2014 41.0%2018 38.0%
Median income family household with children under 18
2009-2013 $30,191
2014-2018 $51,354
Adult unemployment2014 8.3%2018 4.1%
Child homelessness2014 0.0%2018 0.0%
a If no % listed, no vehicle fatalities happened in the county during that period.b *Indicates unstable rate due to low count (<20 cases);** indicates very unstable rate due to very low count (<5 cases)

Outcome MeasuresNumber Rate Trend Rank
2014 2018 2014 2018 State Rate
County Rank
Economic Well-BeingChildren under 18 in poverty 192 178 21.6% 19.7% é 18.3% 38
Food insecurity for childrenb 180 140 19.4% 15.5% é 17.5% 11
HealthLow birthweight infantsa,c 23 10 8.5% 4.1% é 8.5% 2
Preventable hospitalizations for all causes for children under 18 (per 1,000)b,c
7 2 7.5 2.3 é 7.1 2
Child asthma ER rates (per 1,000)b
8 5 8.6 5.6 é 7.5 93
Family & CommunityBirths to teens, ages 15-19 (per 1,000)
4 - 37.4 0 é 21.6 1
Substantiated child abuse/neglect cases (per 1,000)a
2 3 2.1 3.3 ê 4.0 28
EducationHigh school graduation 41 27 89.1% 100.0% é 91.3% 1
Achievement proficiencya,d
3rd grade English/Language Arts (MAP) 23 53.5% 48.6%
8th grade English/Language Arts (MAP)
24 48.0% 49.0%
4th grade Math (MAP) 27 54.0% 45.8%
Algebra I (End of Course exam) 15 36.6% 47.0%
Trend: é better ê worse è no change
Holt CountyCounty Seat: Oregon
2Population: 4,456
2016
County Composite Rank
64
2020
a Outcome not included in County Composite Rank.b Data based on 2013 and 2017.c Data based on 5-year time spans, 2009-2013 and 2014-2018.d Achievement proficiency measures those that scored proficient or above on the MAP tests and Algebra I End of Course exam. Achievement data from 2014 are not shown due to differences in testing standards and assessments used in 2018; accordingly, no trend arrows or county ranks are shown.

Holt County
EducationLicensed child care capacity (per 1,000)
2014 44.12019 43.8
Accredited child care capacity as % of licensed capacity
2014 —2019 0.0%
School attendance, grades K-122014 95.8%2018 95.8%
Family & CommunityTeen unintentional deaths/homicides/suicides (per 100,000)
2009-2013 323.62014-2018 0.0
Single parent head-of-house-hold with children under 18
2009-2013 6.2%2014-2018 6.4%
Juvenile law violation referrals, ages 10-17 (per 1,000)
2014 26.92018 0.0
Annual high school dropout rate2014 0.7%2018 0.0%
Children entering/re-entering state custody (per 1,000)
2014 7.72018 4.4
Health
Infant mortality (per 1,000)2009-2013 7.42014-2018 0.0
Child deaths ages 1-17 (per 100,000)
2009-2013 21.42014-2018 44.0
Child deaths ages 1-14 (per 100,000)
2009-2013 0.02014-2018 22.3
Child deaths ages 15-17 (per 100,000)
2009-2013 129.92014-2018 148.1
Unrestrained automobile fatalities for children under 18a
2009-2013 %2014-2018 %
Substance abuse hospitalizations ages 1-19 (per 100,000)b
2008-2012 0
2013-2017 18.6**
Mental/behavioral hospitalizations (not substance abuse) ages 1-19 (per 10,000)
2008-2012 73.5
2013-2017 83.6
Uninsured children2013 10.7%2017 8.1%
School attendance, grades 9-122014 95.1%2018 95.6%
Contextual IndicatorsCounty Seat: Oregon
2Population: 4,456
2016
County Composite Rank
2020
64
Demographics
Total population2014 4,5162018 4,456
Child population under 182014 9342018 913
Children under 18 as % of total population
2014 20.1%2018 20.4%
Child population under 62014 2892018 278
Children under 6 as % of total population
2014 6.4%2018 6.3%
Minority child population under 18
2014 432018 50
Minority child population under 18 as % of child population
2014 4.7%2018 5.5%
Minority child population under 6
2014 132018 11
Minority child population under 6 as % of under 6 child population
2014 4.5%
2018 4.0%
Children in single-parent families
2009-2013 17.3%2014-2018 31.8%
Children in married-parent families
2009-2013 80.2%2014-2018 68.2%
Economic Well-being
Children in poverty under 62014 27.4%2018 27.1%
Children in poverty, ages 5-172009-2013 20.2%2014-2018 18.1%
Housing cost-burdened households
2009-2013 21.1%2014-2018 21.3%
Family households with children under 18 at 185% of poverty level
2009-2013 35.2%
2014-2018 40.2%
Children in families receiving SNAP
2014 28.0%2018 26.0%
Median income family household with children under 18
2009-2013 $54,063
2014-2018 $53,056
Adult unemployment2014 4.9%2018 2.4%
Child homelessness2014 0.0%2018 0.0%
a If no % listed, no vehicle fatalities happened in the county during that period.b *Indicates unstable rate due to low count (<20 cases);** indicates very unstable rate due to very low count (<5 cases)
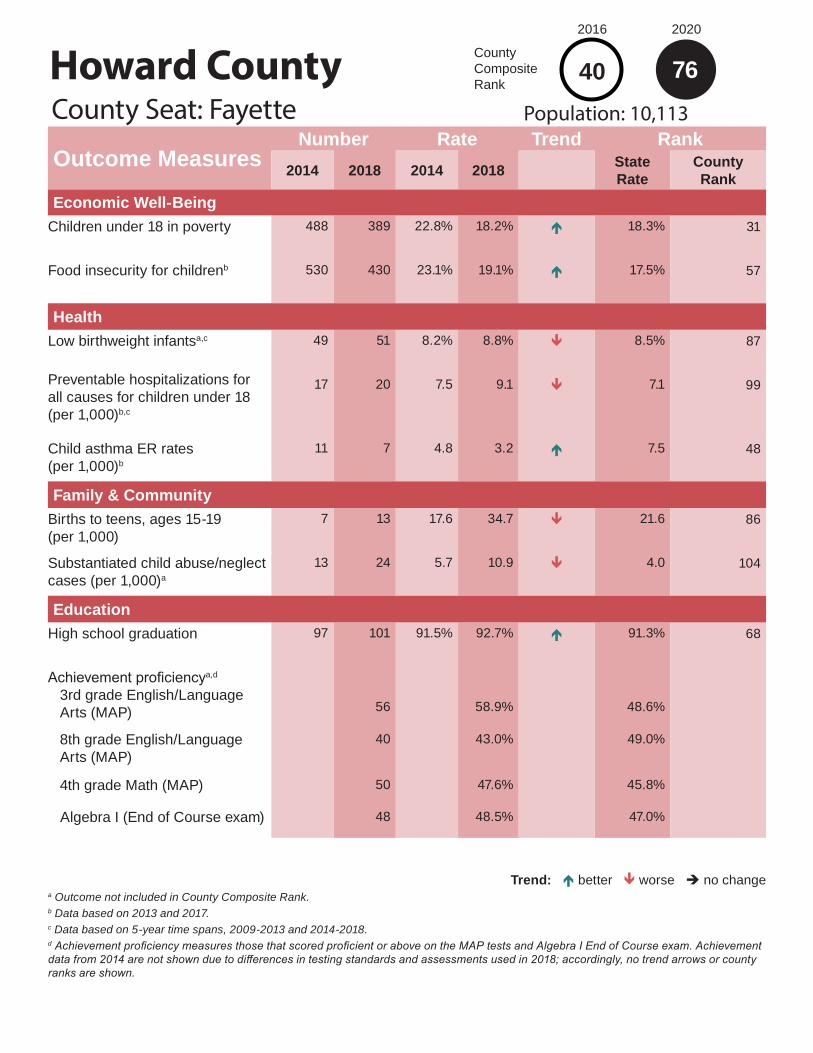
Outcome MeasuresNumber Rate Trend Rank
2014 2018 2014 2018 State Rate
County Rank
Economic Well-BeingChildren under 18 in poverty 488 389 22.8% 18.2% é 18.3% 31
Food insecurity for childrenb 530 430 23.1% 19.1% é 17.5% 57
HealthLow birthweight infantsa,c 49 51 8.2% 8.8% ê 8.5% 87
Preventable hospitalizations for all causes for children under 18 (per 1,000)b,c
17 20 7.5 9.1 ê 7.1 99
Child asthma ER rates (per 1,000)b
11 7 4.8 3.2 é 7.5 48
Family & CommunityBirths to teens, ages 15-19 (per 1,000)
7 13 17.6 34.7 ê 21.6 86
Substantiated child abuse/neglect cases (per 1,000)a
13 24 5.7 10.9 ê 4.0 104
EducationHigh school graduation 97 101 91.5% 92.7% é 91.3% 68
Achievement proficiencya,d
3rd grade English/Language Arts (MAP) 56 58.9% 48.6%
8th grade English/Language Arts (MAP)
40 43.0% 49.0%
4th grade Math (MAP) 50 47.6% 45.8%
Algebra I (End of Course exam) 48 48.5% 47.0%
Trend: é better ê worse è no change
Howard CountyCounty Seat: Fayette
76Population: 10,113
2016
County Composite Rank
40
2020
a Outcome not included in County Composite Rank.b Data based on 2013 and 2017.c Data based on 5-year time spans, 2009-2013 and 2014-2018.d Achievement proficiency measures those that scored proficient or above on the MAP tests and Algebra I End of Course exam. Achievement data from 2014 are not shown due to differences in testing standards and assessments used in 2018; accordingly, no trend arrows or county ranks are shown.
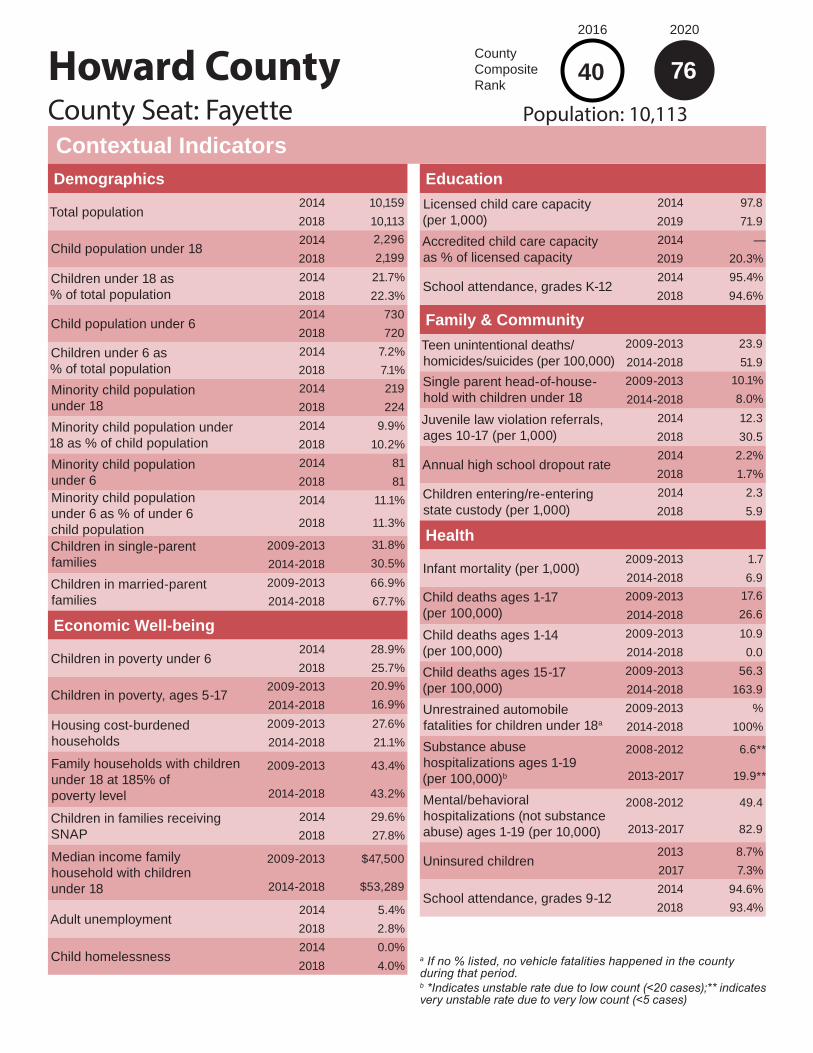
Howard County
EducationLicensed child care capacity (per 1,000)
2014 97.82019 71.9
Accredited child care capacity as % of licensed capacity
2014 —2019 20.3%
School attendance, grades K-122014 95.4%2018 94.6%
Family & CommunityTeen unintentional deaths/homicides/suicides (per 100,000)
2009-2013 23.92014-2018 51.9
Single parent head-of-house-hold with children under 18
2009-2013 10.1%2014-2018 8.0%
Juvenile law violation referrals, ages 10-17 (per 1,000)
2014 12.32018 30.5
Annual high school dropout rate2014 2.2%2018 1.7%
Children entering/re-entering state custody (per 1,000)
2014 2.32018 5.9
Health
Infant mortality (per 1,000)2009-2013 1.72014-2018 6.9
Child deaths ages 1-17 (per 100,000)
2009-2013 17.62014-2018 26.6
Child deaths ages 1-14 (per 100,000)
2009-2013 10.92014-2018 0.0
Child deaths ages 15-17 (per 100,000)
2009-2013 56.32014-2018 163.9
Unrestrained automobile fatalities for children under 18a
2009-2013 %2014-2018 100%
Substance abuse hospitalizations ages 1-19 (per 100,000)b
2008-2012 6.6**
2013-2017 19.9**
Mental/behavioral hospitalizations (not substance abuse) ages 1-19 (per 10,000)
2008-2012 49.4
2013-2017 82.9
Uninsured children2013 8.7%2017 7.3%
School attendance, grades 9-122014 94.6%2018 93.4%
Contextual IndicatorsCounty Seat: Fayette
76Population: 10,113
2016
County Composite Rank
2020
40
Demographics
Total population2014 10,1592018 10,113
Child population under 182014 2,2962018 2,199
Children under 18 as % of total population
2014 21.7%2018 22.3%
Child population under 62014 7302018 720
Children under 6 as % of total population
2014 7.2%2018 7.1%
Minority child population under 18
2014 2192018 224
Minority child population under 18 as % of child population
2014 9.9%2018 10.2%
Minority child population under 6
2014 812018 81
Minority child population under 6 as % of under 6 child population
2014 11.1%
2018 11.3%
Children in single-parent families
2009-2013 31.8%2014-2018 30.5%
Children in married-parent families
2009-2013 66.9%2014-2018 67.7%
Economic Well-being
Children in poverty under 62014 28.9%2018 25.7%
Children in poverty, ages 5-172009-2013 20.9%2014-2018 16.9%
Housing cost-burdened households
2009-2013 27.6%2014-2018 21.1%
Family households with children under 18 at 185% of poverty level
2009-2013 43.4%
2014-2018 43.2%
Children in families receiving SNAP
2014 29.6%2018 27.8%
Median income family household with children under 18
2009-2013 $47,500
2014-2018 $53,289
Adult unemployment2014 5.4%2018 2.8%
Child homelessness2014 0.0%2018 4.0%
a If no % listed, no vehicle fatalities happened in the county during that period.b *Indicates unstable rate due to low count (<20 cases);** indicates very unstable rate due to very low count (<5 cases)

Outcome MeasuresNumber Rate Trend Rank
2014 2018 2014 2018 State Rate
County Rank
Economic Well-BeingChildren under 18 in poverty 2,909 2,859 30.6% 30.6% è 18.3% 99
Food insecurity for childrenb 2,640 2,170 26.2% 22.3% é 17.5% 100
HealthLow birthweight infantsa,c 188 188 7.1% 7.4% ê 8.5% 41
Preventable hospitalizations for all causes for children under 18 (per 1,000)b,c
78 70 7.7 7.3 é 7.1 77
Child asthma ER rates (per 1,000)b
49 20 4.8 2.1 é 7.5 23
Family & CommunityBirths to teens, ages 15-19 (per 1,000)
59 42 48.5 34.2 é 21.6 85
Substantiated child abuse/neglect cases (per 1,000)a
132 122 13.2 12.8 é 4.0 107
EducationHigh school graduation 390 401 93.8% 93.9% é 91.3% 58
Achievement proficiencya,d
3rd grade English/Language Arts (MAP) 219 38.2% 48.6%
8th grade English/Language Arts (MAP)
268 52.7% 49.0%
4th grade Math (MAP) 228 41.6% 45.8%
Algebra I (End of Course exam) 242 49.3% 47.0%
Trend: é better ê worse è no change
Howell CountyCounty Seat: West Plains
92Population: 40,102
2016
County Composite Rank
94
2020
a Outcome not included in County Composite Rank.b Data based on 2013 and 2017.c Data based on 5-year time spans, 2009-2013 and 2014-2018.d Achievement proficiency measures those that scored proficient or above on the MAP tests and Algebra I End of Course exam. Achievement data from 2014 are not shown due to differences in testing standards and assessments used in 2018; accordingly, no trend arrows or county ranks are shown.

Howell County
EducationLicensed child care capacity (per 1,000)
2014 68.32019 62.9
Accredited child care capacity as % of licensed capacity
2014 —2019 20.0%
School attendance, grades K-122014 94.8%2018 94.6%
Family & CommunityTeen unintentional deaths/homicides/suicides (per 100,000)
2009-2013 53.62014-2018 81.6
Single parent head-of-house-hold with children under 18
2009-2013 9.8%2014-2018 8.0%
Juvenile law violation referrals, ages 10-17 (per 1,000)
2014 20.92018 14.6
Annual high school dropout rate2014 0.8%2018 0.8%
Children entering/re-entering state custody (per 1,000)
2014 5.32018 7.9
Health
Infant mortality (per 1,000)2009-2013 7.52014-2018 6.3
Child deaths ages 1-17 (per 100,000)
2009-2013 31.62014-2018 42.1
Child deaths ages 1-14 (per 100,000)
2009-2013 26.32014-2018 24.0
Child deaths ages 15-17 (per 100,000)
2009-2013 60.82014-2018 108.7
Unrestrained automobile fatalities for children under 18a
2009-2013 75.0%2014-2018 100%
Substance abuse hospitalizations ages 1-19 (per 100,000)b
2008-2012 27.7*
2013-2017 45.4
Mental/behavioral hospitalizations (not substance abuse) ages 1-19 (per 10,000)
2008-2012 81.5
2013-2017 94.8
Uninsured children2013 7.5%2017 5.5%
School attendance, grades 9-122014 94.1%2018 94.5%
Contextual IndicatorsCounty Seat: West Plains
92Population: 40,102
2016
County Composite Rank
2020
94
Demographics
Total population2014 40,1732018 40,102
Child population under 182014 9,9652018 9,540
Children under 18 as % of total population
2014 24.1%2018 23.7%
Child population under 62014 3,1442018 3,043
Children under 6 as % of total population
2014 7.8%2018 7.6%
Minority child population under 18
2014 5752018 673
Minority child population under 18 as % of child population
2014 5.9%2018 7.1%
Minority child population under 6
2014 1882018 292
Minority child population under 6 as % of under 6 child population
2014 6.0%
2018 9.6%
Children in single-parent families
2009-2013 32.1%2014-2018 30.4%
Children in married-parent families
2009-2013 67.8%2014-2018 68.8%
Economic Well-being
Children in poverty under 62014 34.7%2018 40.6%
Children in poverty, ages 5-172009-2013 28.7%2014-2018 28.6%
Housing cost-burdened households
2009-2013 29.3%2014-2018 26.5%
Family households with children under 18 at 185% of poverty level
2009-2013 55.7%
2014-2018 52.2%
Children in families receiving SNAP
2014 48.8%2018 45.4%
Median income family household with children under 18
2009-2013 $35,509
2014-2018 $43,544
Adult unemployment2014 7.0%2018 3.6%
Child homelessness2014 3.3%2018 3.5%
a If no % listed, no vehicle fatalities happened in the county during that period.b *Indicates unstable rate due to low count (<20 cases);** indicates very unstable rate due to very low count (<5 cases)

Outcome MeasuresNumber Rate Trend Rank
2014 2018 2014 2018 State Rate
County Rank
Economic Well-BeingChildren under 18 in poverty 715 612 32.9% 29.8% é 18.3% 96
Food insecurity for childrenb 630 500 26.7% 23.6% é 17.5% 108
HealthLow birthweight infantsa,c 37 52 6.8% 10.1% ê 8.5% 107
Preventable hospitalizations for all causes for children under 18 (per 1,000)b,c
16 8 6.8 3.7 é 7.1 14
Child asthma ER rates (per 1,000)b
13 7 5.5 3.3 é 7.5 53
Family & CommunityBirths to teens, ages 15-19 (per 1,000)
13 13 43.9 45.6 ê 21.6 108
Substantiated child abuse/neglect cases (per 1,000)a
3 14 1.3 6.6 ê 4.0 75
EducationHigh school graduation 120 116 97.6% 96.7% ê 91.3% 19
Achievement proficiencya,d
3rd grade English/Language Arts (MAP) 71 46.7% 48.6%
8th grade English/Language Arts (MAP)
81 59.1% 49.0%
4th grade Math (MAP) 89 60.5% 45.8%
Algebra I (End of Course exam) 57 37.7% 47.0%
Trend: é better ê worse è no change
Iron CountyCounty Seat: Ironton
89Population: 10,221
2016
County Composite Rank
80
2020
a Outcome not included in County Composite Rank.b Data based on 2013 and 2017.c Data based on 5-year time spans, 2009-2013 and 2014-2018.d Achievement proficiency measures those that scored proficient or above on the MAP tests and Algebra I End of Course exam. Achievement data from 2014 are not shown due to differences in testing standards and assessments used in 2018; accordingly, no trend arrows or county ranks are shown.

Iron County
EducationLicensed child care capacity (per 1,000)
2014 44.32019 37.5
Accredited child care capacity as % of licensed capacity
2014 —2019 0.0%
School attendance, grades K-122014 96.1%2018 95.4%
Family & CommunityTeen unintentional deaths/homicides/suicides (per 100,000)
2009-2013 30.22014-2018 64.1
Single parent head-of-house-hold with children under 18
2009-2013 8.7%2014-2018 8.3%
Juvenile law violation referrals, ages 10-17 (per 1,000)
2014 3.92018 1.9
Annual high school dropout rate2014 0.3%2018 1.0%
Children entering/re-entering state custody (per 1,000)
2014 9.32018 16.9
Health
Infant mortality (per 1,000)2009-2013 5.52014-2018 5.8
Child deaths ages 1-17 (per 100,000)
2009-2013 34.02014-2018 37.5
Child deaths ages 1-14 (per 100,000)
2009-2013 41.32014-2018 10.0
Child deaths ages 15-17 (per 100,000)
2009-2013 0.02014-2018 147.1
Unrestrained automobile fatalities for children under 18a
2009-2013 %2014-2018 100%
Substance abuse hospitalizations ages 1-19 (per 100,000)b
2008-2012 6.9**
2013-2017 30.5**
Mental/behavioral hospitalizations (not substance abuse) ages 1-19 (per 10,000)
2008-2012 125.3
2013-2017 125.2
Uninsured children2013 7.6%2017 5.1%
School attendance, grades 9-122014 96.1%2018 95.2%
Contextual IndicatorsCounty Seat: Ironton
89Population: 10,221
2016
County Composite Rank
2020
80
Demographics
Total population2014 10,2672018 10,221
Child population under 182014 2,2762018 2,131
Children under 18 as % of total population
2014 22.0%2018 20.9%
Child population under 62014 7242018 622
Children under 6 as % of total population
2014 7.1%2018 6.1%
Minority child population under 18
2014 1692018 145
Minority child population under 18 as % of child population
2014 7.5%2018 6.8%
Minority child population under 6
2014 522018 35
Minority child population under 6 as % of under 6 child population
2014 7.2%
2018 5.6%
Children in single-parent families
2009-2013 32.0%2014-2018 26.0%
Children in married-parent families
2009-2013 64.4%2014-2018 71.7%
Economic Well-being
Children in poverty under 62014 38.5%2018 34.8%
Children in poverty, ages 5-172009-2013 31.8%2014-2018 27.0%
Housing cost-burdened households
2009-2013 25.1%2014-2018 21.1%
Family households with children under 18 at 185% of poverty level
2009-2013 47.7%
2014-2018 53.9%
Children in families receiving SNAP
2014 49.5%2018 47.3%
Median income family household with children under 18
2009-2013 $42,596
2014-2018 $44,744
Adult unemployment2014 9.5%2018 5.4%
Child homelessness2014 0.0%2018 1.7%
a If no % listed, no vehicle fatalities happened in the county during that period.b *Indicates unstable rate due to low count (<20 cases);** indicates very unstable rate due to very low count (<5 cases)

Outcome MeasuresNumber Rate Trend Rank
2014 2018 2014 2018 State Rate
County Rank
Economic Well-BeingChildren under 18 in poverty 37,672 30,541 23.5% 19.0% é 18.3% 32
Food insecurity for childrenb 34,640 29,810 21.1% 18.1% é 17.5% 39
HealthLow birthweight infantsa,c 4,084 4,310 8.4% 9.2% ê 8.5% 96
Preventable hospitalizations for all causes for children under 18 (per 1,000)b,c
1,487 1,591 9.0 9.6 ê 7.1 104
Child asthma ER rates (per 1,000)b
2,376 2,130 14.4 12.8 é 7.5 114
Family & CommunityBirths to teens, ages 15-19 (per 1,000)
705 560 35.0 26.8 é 21.6 57
Substantiated child abuse/neglect cases (per 1,000)a
511 409 3.1 2.5 é 4.0 15
EducationHigh school graduation 5,859 6,432 83.7% 88.7% é 91.3% 101
Achievement proficiencya,d
3rd grade English/Language Arts (MAP) 3,721 43.1% 48.6%
8th grade English/Language Arts (MAP)
3,592 45.7% 49.0%
4th grade Math (MAP) 3,541 40.7% 45.8%
Algebra I (End of Course exam) 3,229 43.2% 47.0%
Trend: é better ê worse è no change
Jackson CountyCounty Seat: Independence
103Population: 692,003
2016
County Composite Rank
103
2020
a Outcome not included in County Composite Rank.b Data based on 2013 and 2017.c Data based on 5-year time spans, 2009-2013 and 2014-2018.d Achievement proficiency measures those that scored proficient or above on the MAP tests and Algebra I End of Course exam. Achievement data from 2014 are not shown due to differences in testing standards and assessments used in 2018; accordingly, no trend arrows or county ranks are shown.

Jackson County
EducationLicensed child care capacity (per 1,000)
2014 146.42019 144.2
Accredited child care capacity as % of licensed capacity
2014 —2019 14.6%
School attendance, grades K-122014 94.1%2018 93.8%
Family & CommunityTeen unintentional deaths/homicides/suicides (per 100,000)
2009-2013 66.92014-2018 72.5
Single parent head-of-house-hold with children under 18
2009-2013 11.1%2014-2018 10.8%
Juvenile law violation referrals, ages 10-17 (per 1,000)
2014 15.72018 14.5
Annual high school dropout rate2014 5.1%2018 2.6%
Children entering/re-entering state custody (per 1,000)
2014 5.92018 5.6
Health
Infant mortality (per 1,000)2009-2013 6.32014-2018 6.5
Child deaths ages 1-17 (per 100,000)
2009-2013 24.72014-2018 26.8
Child deaths ages 1-14 (per 100,000)
2009-2013 19.72014-2018 16.4
Child deaths ages 15-17 (per 100,000)
2009-2013 51.42014-2018 66.0
Unrestrained automobile fatalities for children under 18a
2009-2013 46.2%2014-2018 65.4%
Substance abuse hospitalizations ages 1-19 (per 100,000)b
2008-2012 10.7
2013-2017 14.9
Mental/behavioral hospitalizations (not substance abuse) ages 1-19 (per 10,000)
2008-2012 116.2
2013-2017 133.8
Uninsured children2013 7.1%2017 5.5%
School attendance, grades 9-122014 92.2%2018 92.6%
Contextual IndicatorsCounty Seat: Independence
103Population: 692,003
2016
County Composite Rank
2020
103
Demographics
Total population2014 683,1912018 692,003
Child population under 182014 164,3242018 164,979
Children under 18 as % of total population
2014 24.1%2018 23.8%
Child population under 62014 56,0802018 55,649
Children under 6 as % of total population
2014 8.2%2018 7.9%
Minority child population under 18
2014 76,9532018 77,638
Minority child population under 18 as % of child population
2014 46.8%2018 47.1%
Minority child population under 6
2014 26,6632018 25,964
Minority child population under 6 as % of under 6 child population
2014 47.5%
2018 46.7%
Children in single-parent families
2009-2013 42.2%2014-2018 42.1%
Children in married-parent families
2009-2013 56.4%2014-2018 56.6%
Economic Well-being
Children in poverty under 62014 28.6%2018 18.8%
Children in poverty, ages 5-172009-2013 20.8%2014-2018 17.7%
Housing cost-burdened households
2009-2013 36.4%2014-2018 31.4%
Family households with children under 18 at 185% of poverty level
2009-2013 40.4%
2014-2018 37.3%
Children in families receiving SNAP
2014 41.6%2018 38.3%
Median income family household with children under 18
2009-2013 $53,125
2014-2018 $61,082
Adult unemployment2014 7.1%2018 3.7%
Child homelessness2014 4.1%2018 4.6%
a If no % listed, no vehicle fatalities happened in the county during that period.b *Indicates unstable rate due to low count (<20 cases);** indicates very unstable rate due to very low count (<5 cases)

Outcome MeasuresNumber Rate Trend Rank
2014 2018 2014 2018 State Rate
County Rank
Economic Well-BeingChildren under 18 in poverty 7,330 6,616 25.2% 22.7% é 18.3% 63
Food insecurity for childrenb 6,730 5,430 22.5% 18.1% é 17.5% 39
HealthLow birthweight infantsa,c 582 582 6.7% 7.1% ê 8.5% 30
Preventable hospitalizations for all causes for children under 18 (per 1,000)b,c
275 226 9.2 7.5 é 7.1 81
Child asthma ER rates (per 1,000)b
186 110 6.2 3.6 é 7.5 59
Family & CommunityBirths to teens, ages 15-19 (per 1,000)
161 138 42.4 35.6 é 21.6 90
Substantiated child abuse/neglect cases (per 1,000)a
112 82 3.7 2.7 é 4.0 23
EducationHigh school graduation 1,275 1,345 88.3% 87.2% ê 91.3% 110
Achievement proficiencya,d
3rd grade English/Language Arts (MAP) 847 49.4% 48.6%
8th grade English/Language Arts (MAP)
769 48.0% 49.0%
4th grade Math (MAP) 793 45.1% 45.8%
Algebra I (End of Course exam) 619 42.6% 47.0%
Trend: é better ê worse è no change
Jasper CountyCounty Seat: Carthage
93Population: 119,238
2016
County Composite Rank
92
2020
a Outcome not included in County Composite Rank.b Data based on 2013 and 2017.c Data based on 5-year time spans, 2009-2013 and 2014-2018.d Achievement proficiency measures those that scored proficient or above on the MAP tests and Algebra I End of Course exam. Achievement data from 2014 are not shown due to differences in testing standards and assessments used in 2018; accordingly, no trend arrows or county ranks are shown.

Jasper County
EducationLicensed child care capacity (per 1,000)
2014 72.82019 74.8
Accredited child care capacity as % of licensed capacity
2014 —2019 0.0%
School attendance, grades K-122014 95.8%2018 95.3%
Family & CommunityTeen unintentional deaths/homicides/suicides (per 100,000)
2009-2013 42.92014-2018 64.8
Single parent head-of-house-hold with children under 18
2009-2013 11.8%2014-2018 9.4%
Juvenile law violation referrals, ages 10-17 (per 1,000)
2014 25.32018 40.8
Annual high school dropout rate2014 2.4%2018 2.1%
Children entering/re-entering state custody (per 1,000)
2014 10.42018 6.0
Health
Infant mortality (per 1,000)2009-2013 5.62014-2018 4.9
Child deaths ages 1-17 (per 100,000)
2009-2013 22.72014-2018 25.3
Child deaths ages 1-14 (per 100,000)
2009-2013 19.82014-2018 15.6
Child deaths ages 15-17 (per 100,000)
2009-2013 38.52014-2018 59.4
Unrestrained automobile fatalities for children under 18a
2009-2013 100.0%2014-2018 50%
Substance abuse hospitalizations ages 1-19 (per 100,000)b
2008-2012 18.5
2013-2017 28
Mental/behavioral hospitalizations (not substance abuse) ages 1-19 (per 10,000)
2008-2012 52.8
2013-2017 69.8
Uninsured children2013 7.9%2017 6.3%
School attendance, grades 9-122014 95.0%2018 94.1%
Contextual IndicatorsCounty Seat: Carthage
93Population: 119,238
2016
County Composite Rank
2020
92
Demographics
Total population2014 117,5432018 119,238
Child population under 182014 30,0082018 30,127
Children under 18 as % of total population
2014 25.5%2018 25.2%
Child population under 62014 10,0202018 9,930
Children under 6 as % of total population
2014 8.5%2018 8.2%
Minority child population under 18
2014 6,1912018 6,651
Minority child population under 18 as % of child population
2014 20.7%2018 22.1%
Minority child population under 6
2014 2,2452018 2,398
Minority child population under 6 as % of under 6 child population
2014 22.4%
2018 24.1%
Children in single-parent families
2009-2013 35.4%2014-2018 32.1%
Children in married-parent families
2009-2013 62.4%2014-2018 66.4%
Economic Well-being
Children in poverty under 62014 31.1%2018 34.0%
Children in poverty, ages 5-172009-2013 22.3%2014-2018 20.4%
Housing cost-burdened households
2009-2013 32.0%2014-2018 26.6%
Family households with children under 18 at 185% of poverty level
2009-2013 43.6%
2014-2018 41.8%
Children in families receiving SNAP
2014 40.2%2018 36.7%
Median income family household with children under 18
2009-2013 $44,206
2014-2018 $52,054
Adult unemployment2014 5.3%2018 2.7%
Child homelessness2014 2.2%2018 3.3%
a If no % listed, no vehicle fatalities happened in the county during that period.b *Indicates unstable rate due to low count (<20 cases);** indicates very unstable rate due to very low count (<5 cases)

Outcome MeasuresNumber Rate Trend Rank
2014 2018 2014 2018 State Rate
County Rank
Economic Well-BeingChildren under 18 in poverty 7,778 5,298 14.9% 10.4% é 18.3% 5
Food insecurity for childrenb 10,930 8,520 20.1% 16% é 17.5% 13
HealthLow birthweight infantsa,c 950 996 7.0% 7.8% ê 8.5% 51
Preventable hospitalizations for all causes for children under 18 (per 1,000)b,c
299 246 5.5 4.7 é 7.1 29
Child asthma ER rates (per 1,000)b
373 213 6.9 4.1 é 7.5 69
Family & CommunityBirths to teens, ages 15-19 (per 1,000)
152 131 22.6 19.6 é 21.6 29
Substantiated child abuse/neglect cases (per 1,000)a
226 143 4.2 2.8 é 4.0 24
EducationHigh school graduation 2,426 2,404 93.1% 92.5% ê 91.3% 73
Achievement proficiencya,d
3rd grade English/Language Arts (MAP) 1,523 57.0% 48.6%
8th grade English/Language Arts (MAP)
1,343 51.1% 49.0%
4th grade Math (MAP) 1,439 55.4% 45.8%
Algebra I (End of Course exam) 1,148 45.9% 47.0%
Trend: é better ê worse è no change
Jefferson CountyCounty Seat: Hillsboro
14Population: 223,302
2016
County Composite Rank
17
2020
a Outcome not included in County Composite Rank.b Data based on 2013 and 2017.c Data based on 5-year time spans, 2009-2013 and 2014-2018.d Achievement proficiency measures those that scored proficient or above on the MAP tests and Algebra I End of Course exam. Achievement data from 2014 are not shown due to differences in testing standards and assessments used in 2018; accordingly, no trend arrows or county ranks are shown.

Jefferson County
EducationLicensed child care capacity (per 1,000)
2014 71.42019 64.3
Accredited child care capacity as % of licensed capacity
2014 —2019 12.3%
School attendance, grades K-122014 95.3%2018 94.7%
Family & CommunityTeen unintentional deaths/homicides/suicides (per 100,000)
2009-2013 63.22014-2018 46.5
Single parent head-of-house-hold with children under 18
2009-2013 9.2%2014-2018 9.7%
Juvenile law violation referrals, ages 10-17 (per 1,000)
2014 34.62018 33.9
Annual high school dropout rate2014 1.3%2018 1.9%
Children entering/re-entering state custody (per 1,000)
2014 6.92018 6.7
Health
Infant mortality (per 1,000)2009-2013 5.22014-2018 5.3
Child deaths ages 1-17 (per 100,000)
2009-2013 21.02014-2018 16.7
Child deaths ages 1-14 (per 100,000)
2009-2013 12.92014-2018 11.9
Child deaths ages 15-17 (per 100,000)
2009-2013 60.22014-2018 30.8
Unrestrained automobile fatalities for children under 18a
2009-2013 0.0%2014-2018 16.7%
Substance abuse hospitalizations ages 1-19 (per 100,000)b
2008-2012 19.7
2013-2017 18.2
Mental/behavioral hospitalizations (not substance abuse) ages 1-19 (per 10,000)
2008-2012 78.6
2013-2017 83.0
Uninsured children2013 6.0%2017 4.6%
School attendance, grades 9-122014 94.2%2018 93.9%
Contextual IndicatorsCounty Seat: Hillsboro
14Population: 223,302
2016
County Composite Rank
2020
17
Demographics
Total population2014 222,7162018 223,302
Child population under 182014 54,0352018 51,958
Children under 18 as % of total population
2014 24.0%2018 23.6%
Child population under 62014 16,8312018 16,107
Children under 6 as % of total population
2014 7.6%2018 7.2%
Minority child population under 18
2014 3,4732018 3,583
Minority child population under 18 as % of child population
2014 6.5%2018 6.9%
Minority child population under 6
2014 1,1302018 1,181
Minority child population under 6 as % of under 6 child population
2014 6.7%
2018 7.3%
Children in single-parent families
2009-2013 26.6%2014-2018 29.4%
Children in married-parent families
2009-2013 72.3%2014-2018 69.5%
Economic Well-being
Children in poverty under 62014 16.4%2018 8.2%
Children in poverty, ages 5-172009-2013 13.1%2014-2018 9.4%
Housing cost-burdened households
2009-2013 27.7%2014-2018 23.7%
Family households with children under 18 at 185% of poverty level
2009-2013 28.4%
2014-2018 26.7%
Children in families receiving SNAP
2014 26.3%2018 23.2%
Median income family household with children under 18
2009-2013 $64,717
2014-2018 $73,114
Adult unemployment2014 6.3%2018 3.1%
Child homelessness2014 1.9%2018 2.5%
a If no % listed, no vehicle fatalities happened in the county during that period.b *Indicates unstable rate due to low count (<20 cases);** indicates very unstable rate due to very low count (<5 cases)

Outcome MeasuresNumber Rate Trend Rank
2014 2018 2014 2018 State Rate
County Rank
Economic Well-BeingChildren under 18 in poverty 1,951 1,557 16.9% 13.9% é 18.3% 16
Food insecurity for childrenb 2,610 1,940 21.7% 16.5% é 17.5% 17
HealthLow birthweight infantsa,c 210 245 5.8% 6.9% ê 8.5% 25
Preventable hospitalizations for all causes for children under 18 (per 1,000)b,c
124 84 10.3 7.3 é 7.1 78
Child asthma ER rates (per 1,000)b
55 52 4.6 4.5 é 7.5 74
Family & CommunityBirths to teens, ages 15-19 (per 1,000)
35 40 15.5 18 ê 21.6 25
Substantiated child abuse/neglect cases (per 1,000)a
43 30 3.6 2.6 é 4.0 17
EducationHigh school graduation 451 483 94.0% 92.5% ê 91.3% 73
Achievement proficiencya,d
3rd grade English/Language Arts (MAP) 282 51.4% 48.6%
8th grade English/Language Arts (MAP)
275 48.5% 49.0%
4th grade Math (MAP) 283 48.5% 45.8%
Algebra I (End of Course exam) 244 48.6% 47.0%
Trend: é better ê worse è no change
Johnson CountyCounty Seat: Warrensburg
24Population: 53,689
2016
County Composite Rank
26
2020
a Outcome not included in County Composite Rank.b Data based on 2013 and 2017.c Data based on 5-year time spans, 2009-2013 and 2014-2018.d Achievement proficiency measures those that scored proficient or above on the MAP tests and Algebra I End of Course exam. Achievement data from 2014 are not shown due to differences in testing standards and assessments used in 2018; accordingly, no trend arrows or county ranks are shown.

Johnson County
EducationLicensed child care capacity (per 1,000)
2014 137.82019 88.2
Accredited child care capacity as % of licensed capacity
2014 —2019 0.0%
School attendance, grades K-122014 95.3%2018 94.8%
Family & CommunityTeen unintentional deaths/homicides/suicides (per 100,000)
2009-2013 46.82014-2018 54.2
Single parent head-of-house-hold with children under 18
2009-2013 6.9%2014-2018 7.6%
Juvenile law violation referrals, ages 10-17 (per 1,000)
2014 20.42018 18.8
Annual high school dropout rate2014 1.1%2018 1.2%
Children entering/re-entering state custody (per 1,000)
2014 5.32018 6.0
Health
Infant mortality (per 1,000)2009-2013 5.82014-2018 4.5
Child deaths ages 1-17 (per 100,000)
2009-2013 18.22014-2018 27.6
Child deaths ages 1-14 (per 100,000)
2009-2013 9.92014-2018 15.6
Child deaths ages 15-17 (per 100,000)
2009-2013 63.52014-2018 73.2
Unrestrained automobile fatalities for children under 18a
2009-2013 %2014-2018 25%
Substance abuse hospitalizations ages 1-19 (per 100,000)b
2008-2012 7.3*
2013-2017 7.5*
Mental/behavioral hospitalizations (not substance abuse) ages 1-19 (per 10,000)
2008-2012 70.7
2013-2017 82.6
Uninsured children2013 7.0%2017 4.8%
School attendance, grades 9-122014 94.9%2018 94.6%
Contextual IndicatorsCounty Seat: Warrensburg
24Population: 53,689
2016
County Composite Rank
2020
26
Demographics
Total population2014 54,3622018 53,689
Child population under 182014 12,0102018 11,436
Children under 18 as % of total population
2014 21.8%2018 21.6%
Child population under 62014 4,2632018 3,963
Children under 6 as % of total population
2014 7.8%2018 7.4%
Minority child population under 18
2014 1,7322018 1,651
Minority child population under 18 as % of child population
2014 14.6%2018 14.4%
Minority child population under 6
2014 7272018 674
Minority child population under 6 as % of under 6 child population
2014 17.1%
2018 17.0%
Children in single-parent families
2009-2013 22.1%2014-2018 22.0%
Children in married-parent families
2009-2013 77.1%2014-2018 76.4%
Economic Well-being
Children in poverty under 62014 21.5%2018 20.7%
Children in poverty, ages 5-172009-2013 16.4%2014-2018 12.9%
Housing cost-burdened households
2009-2013 35.0%2014-2018 28.5%
Family households with children under 18 at 185% of poverty level
2009-2013 35.4%
2014-2018 34.3%
Children in families receiving SNAP
2014 24.1%2018 19.7%
Median income family household with children under 18
2009-2013 $53,718
2014-2018 $64,867
Adult unemployment2014 6.3%2018 3.7%
Child homelessness2014 7.1%2018 5.0%
a If no % listed, no vehicle fatalities happened in the county during that period.b *Indicates unstable rate due to low count (<20 cases);** indicates very unstable rate due to very low count (<5 cases)

Outcome MeasuresNumber Rate Trend Rank
2014 2018 2014 2018 State Rate
County Rank
Economic Well-BeingChildren under 18 in poverty 316 247 33.6% 27.5% é 18.3% 92
Food insecurity for childrenb 270 190 26.1% 19.7% é 17.5% 71
HealthLow birthweight infantsa,c 12 14 5.1% 5.4% ê 8.5% 3
Preventable hospitalizations for all causes for children under 18 (per 1,000)b,c
5 4 4.9 4.2 é 7.1 20
Child asthma ER rates (per 1,000)b
1 1 1.0 1.1 ê 7.5 7
Family & CommunityBirths to teens, ages 15-19 (per 1,000)
1 3 7.6 24.2 ê 21.6 47
Substantiated child abuse/neglect cases (per 1,000)a
8 6 8.1 6.5 é 4.0 74
EducationHigh school graduation 29 36 90.6% 90.0% ê 91.3% 94
Achievement proficiencya,d
3rd grade English/Language Arts (MAP) 16 47.1% 48.6%
8th grade English/Language Arts (MAP)
10 34.5% 49.0%
4th grade Math (MAP) 17 43.6% 45.8%
Algebra I (End of Course exam) 16 39.0% 47.0%
Trend: é better ê worse è no change
Knox CountyCounty Seat: Edina
55Population: 3,951
2016
County Composite Rank
47
2020
a Outcome not included in County Composite Rank.b Data based on 2013 and 2017.c Data based on 5-year time spans, 2009-2013 and 2014-2018.d Achievement proficiency measures those that scored proficient or above on the MAP tests and Algebra I End of Course exam. Achievement data from 2014 are not shown due to differences in testing standards and assessments used in 2018; accordingly, no trend arrows or county ranks are shown.

Knox County
EducationLicensed child care capacity (per 1,000)
2014 91.52019 96.0
Accredited child care capacity as % of licensed capacity
2014 —2019 0.0%
School attendance, grades K-122014 95.8%2018 94.7%
Family & CommunityTeen unintentional deaths/homicides/suicides (per 100,000)
2009-2013 72.42014-2018 0.0
Single parent head-of-house-hold with children under 18
2009-2013 4.3%2014-2018 9.9%
Juvenile law violation referrals, ages 10-17 (per 1,000)
2014 18.32018 20.5
Annual high school dropout rate2014 1.2%2018 2.8%
Children entering/re-entering state custody (per 1,000)
2014 8.32018 5.5
Health
Infant mortality (per 1,000)2009-2013 4.22014-2018 3.9
Child deaths ages 1-17 (per 100,000)
2009-2013 78.42014-2018 85.5
Child deaths ages 1-14 (per 100,000)
2009-2013 71.82014-2018 70.3
Child deaths ages 15-17 (per 100,000)
2009-2013 102.62014-2018 95.2
Unrestrained automobile fatalities for children under 18a
2009-2013 %2014-2018 %
Substance abuse hospitalizations ages 1-19 (per 100,000)b
2008-2012 0
2013-2017 0
Mental/behavioral hospitalizations (not substance abuse) ages 1-19 (per 10,000)
2008-2012 35.3
2013-2017 13.4
Uninsured children2013 16.4%2017 11.9%
School attendance, grades 9-122014 95.4%2018 94.5%
Contextual IndicatorsCounty Seat: Edina
55Population: 3,951
2016
County Composite Rank
2020
47
Demographics
Total population2014 4,0002018 3,951
Child population under 182014 9892018 917
Children under 18 as % of total population
2014 24.1%2018 23.7%
Child population under 62014 3272018 293
Children under 6 as % of total population
2014 8.2%2018 7.4%
Minority child population under 18
2014 402018 38
Minority child population under 18 as % of child population
2014 4.2%2018 4.1%
Minority child population under 6
2014 232018 16
Minority child population under 6 as % of under 6 child population
2014 7.0%
2018 5.5%
Children in single-parent families
2009-2013 26.6%2014-2018 38.9%
Children in married-parent families
2009-2013 72.0%2014-2018 60.0%
Economic Well-being
Children in poverty under 62014 26.5%2018 25.2%
Children in poverty, ages 5-172009-2013 33.0%2014-2018 26.4%
Housing cost-burdened households
2009-2013 27.2%2014-2018 20.8%
Family households with children under 18 at 185% of poverty level
2009-2013 48.2%
2014-2018 31.7%
Children in families receiving SNAP
2014 21.5%2018 23.1%
Median income family household with children under 18
2009-2013 $45,625
2014-2018 $54,265
Adult unemployment2014 4.5%2018 2.8%
Child homelessness2014 0.0%2018 0.0%
a If no % listed, no vehicle fatalities happened in the county during that period.b *Indicates unstable rate due to low count (<20 cases);** indicates very unstable rate due to very low count (<5 cases)

Outcome MeasuresNumber Rate Trend Rank
2014 2018 2014 2018 State Rate
County Rank
Economic Well-BeingChildren under 18 in poverty 2,214 1,898 26.1% 22.2% é 18.3% 57
Food insecurity for childrenb 2,380 1,750 27.0% 20.1% é 17.5% 77
HealthLow birthweight infantsa,c 175 203 7.7% 8.3% ê 8.5% 67
Preventable hospitalizations for all causes for children under 18 (per 1,000)b,c
60 54 6.8 6.2 é 7.1 58
Child asthma ER rates (per 1,000)b
40 31 4.5 3.5 é 7.5 58
Family & CommunityBirths to teens, ages 15-19 (per 1,000)
59 46 56.1 42.4 é 21.6 104
Substantiated child abuse/neglect cases (per 1,000)a
98 59 11.2 6.7 é 4.0 77
EducationHigh school graduation 392 402 91.6% 93.1% é 91.3% 63
Achievement proficiencya,d
3rd grade English/Language Arts (MAP) 207 48.3% 48.6%
8th grade English/Language Arts (MAP)
205 47.7% 49.0%
4th grade Math (MAP) 197 44.2% 45.8%
Algebra I (End of Course exam) 173 38.8% 47.0%
Trend: é better ê worse è no change
Laclede CountyCounty Seat: Lebanon
84Population: 35,507
2016
County Composite Rank
96
2020
a Outcome not included in County Composite Rank.b Data based on 2013 and 2017.c Data based on 5-year time spans, 2009-2013 and 2014-2018.d Achievement proficiency measures those that scored proficient or above on the MAP tests and Algebra I End of Course exam. Achievement data from 2014 are not shown due to differences in testing standards and assessments used in 2018; accordingly, no trend arrows or county ranks are shown.

Laclede County
EducationLicensed child care capacity (per 1,000)
2014 55.62019 45.7
Accredited child care capacity as % of licensed capacity
2014 —2019 0.0%
School attendance, grades K-122014 95.4%2018 94.8%
Family & CommunityTeen unintentional deaths/homicides/suicides (per 100,000)
2009-2013 86.02014-2018 27.4
Single parent head-of-house-hold with children under 18
2009-2013 9.1%2014-2018 7.6%
Juvenile law violation referrals, ages 10-17 (per 1,000)
2014 12.62018 21.9
Annual high school dropout rate2014 1.3%2018 1.4%
Children entering/re-entering state custody (per 1,000)
2014 6.32018 6.8
Health
Infant mortality (per 1,000)2009-2013 9.62014-2018 8.6
Child deaths ages 1-17 (per 100,000)
2009-2013 34.02014-2018 36.8
Child deaths ages 1-14 (per 100,000)
2009-2013 24.32014-2018 30.8
Child deaths ages 15-17 (per 100,000)
2009-2013 79.12014-2018 41.3
Unrestrained automobile fatalities for children under 18a
2009-2013 100.0%2014-2018 66.7%
Substance abuse hospitalizations ages 1-19 (per 100,000)b
2008-2012 14.7*
2013-2017 16.9*
Mental/behavioral hospitalizations (not substance abuse) ages 1-19 (per 10,000)
2008-2012 92.0
2013-2017 91.5
Uninsured children2013 7.2%2017 5.7%
School attendance, grades 9-122014 94.9%2018 94.1%
Contextual IndicatorsCounty Seat: Lebanon
84Population: 35,507
2016
County Composite Rank
2020
96
Demographics
Total population2014 35,4392018 35,507
Child population under 182014 8,7552018 8,827
Children under 18 as % of total population
2014 24.7%2018 24.5%
Child population under 62014 2,8412018 2,936
Children under 6 as % of total population
2014 8.0%2018 8.2%
Minority child population under 18
2014 6862018 682
Minority child population under 18 as % of child population
2014 7.8%2018 7.7%
Minority child population under 6
2014 2662018 248
Minority child population under 6 as % of under 6 child population
2014 9.4%
2018 8.4%
Children in single-parent families
2009-2013 36.5%2014-2018 23.9%
Children in married-parent families
2009-2013 62.4%2014-2018 74.4%
Economic Well-being
Children in poverty under 62014 30.3%2018 22.8%
Children in poverty, ages 5-172009-2013 24.3%2014-2018 20.9%
Housing cost-burdened households
2009-2013 30.1%2014-2018 24.8%
Family households with children under 18 at 185% of poverty level
2009-2013 54.9%
2014-2018 43.9%
Children in families receiving SNAP
2014 44.2%2018 37.9%
Median income family household with children under 18
2009-2013 $39,013
2014-2018 $58,033
Adult unemployment2014 8.0%2018 3.7%
Child homelessness2014 0.5%2018 2.6%
a If no % listed, no vehicle fatalities happened in the county during that period.b *Indicates unstable rate due to low count (<20 cases);** indicates very unstable rate due to very low count (<5 cases)

Outcome MeasuresNumber Rate Trend Rank
2014 2018 2014 2018 State Rate
County Rank
Economic Well-BeingChildren under 18 in poverty 1,487 1,058 20.1% 14.6% é 18.3% 18
Food insecurity for childrenb 1,520 1,360 19.0% 17.9% é 17.5% 36
HealthLow birthweight infantsa,c 123 141 6.4% 7.6% ê 8.5% 47
Preventable hospitalizations for all causes for children under 18 (per 1,000)b,c
46 68 5.7 9.1 ê 7.1 98
Child asthma ER rates (per 1,000)b
41 55 5.1 7.3 ê 7.5 107
Family & CommunityBirths to teens, ages 15-19 (per 1,000)
33 22 32.4 23.1 é 21.6 45
Substantiated child abuse/neglect cases (per 1,000)a
65 21 8.2 2.8 é 4.0 25
EducationHigh school graduation 342 392 94.5% 96.3% é 91.3% 24
Achievement proficiencya,d
3rd grade English/Language Arts (MAP) 170 45.6% 48.6%
8th grade English/Language Arts (MAP)
180 48.4% 49.0%
4th grade Math (MAP) 147 34.8% 45.8%
Algebra I (End of Course exam) 175 45.5% 47.0%
Trend: é better ê worse è no change
Lafayette CountyCounty Seat: Lexington
49Population: 32,589
2016
County Composite Rank
23
2020
a Outcome not included in County Composite Rank.b Data based on 2013 and 2017.c Data based on 5-year time spans, 2009-2013 and 2014-2018.d Achievement proficiency measures those that scored proficient or above on the MAP tests and Algebra I End of Course exam. Achievement data from 2014 are not shown due to differences in testing standards and assessments used in 2018; accordingly, no trend arrows or county ranks are shown.

Lafayette County
EducationLicensed child care capacity (per 1,000)
2014 96.52019 71.2
Accredited child care capacity as % of licensed capacity
2014 —2019 18.6%
School attendance, grades K-122014 95.5%2018 94.8%
Family & CommunityTeen unintentional deaths/homicides/suicides (per 100,000)
2009-2013 42.52014-2018 27.8
Single parent head-of-house-hold with children under 18
2009-2013 9.1%2014-2018 9.8%
Juvenile law violation referrals, ages 10-17 (per 1,000)
2014 30.52018 42.5
Annual high school dropout rate2014 0.8%2018 1.1%
Children entering/re-entering state custody (per 1,000)
2014 4.72018 1.5
Health
Infant mortality (per 1,000)2009-2013 5.22014-2018 8.7
Child deaths ages 1-17 (per 100,000)
2009-2013 15.02014-2018 29.1
Child deaths ages 1-14 (per 100,000)
2009-2013 9.22014-2018 22.7
Child deaths ages 15-17 (per 100,000)
2009-2013 39.42014-2018 41.4
Unrestrained automobile fatalities for children under 18a
2009-2013 100.0%2014-2018 75%
Substance abuse hospitalizations ages 1-19 (per 100,000)b
2008-2012 10.1*
2013-2017 15.2*
Mental/behavioral hospitalizations (not substance abuse) ages 1-19 (per 10,000)
2008-2012 99.4
2013-2017 107.5
Uninsured children2013 7.2%2017 4.9%
School attendance, grades 9-122014 95.2%2018 94.6%
Contextual IndicatorsCounty Seat: Lexington
49Population: 32,589
2016
County Composite Rank
2020
23
Demographics
Total population2014 32,6882018 32,589
Child population under 182014 7,8892018 7,471
Children under 18 as % of total population
2014 23.2%2018 23.2%
Child population under 62014 2,2672018 2,307
Children under 6 as % of total population
2014 6.9%2018 7.1%
Minority child population under 18
2014 7392018 732
Minority child population under 18 as % of child population
2014 9.7%2018 9.8%
Minority child population under 6
2014 2542018 245
Minority child population under 6 as % of under 6 child population
2014 11.2%
2018 10.6%
Children in single-parent families
2009-2013 28.0%2014-2018 36.3%
Children in married-parent families
2009-2013 69.8%2014-2018 61.2%
Economic Well-being
Children in poverty under 62014 21.4%2018 20.7%
Children in poverty, ages 5-172009-2013 19.1%2014-2018 13.5%
Housing cost-burdened households
2009-2013 23.7%2014-2018 23.0%
Family households with children under 18 at 185% of poverty level
2009-2013 30.6%
2014-2018 35.3%
Children in families receiving SNAP
2014 31.0%2018 27.3%
Median income family household with children under 18
2009-2013 $65,244
2014-2018 $64,558
Adult unemployment2014 5.9%2018 3.2%
Child homelessness2014 1.7%2018 2.2%
a If no % listed, no vehicle fatalities happened in the county during that period.b *Indicates unstable rate due to low count (<20 cases);** indicates very unstable rate due to very low count (<5 cases)

Outcome MeasuresNumber Rate Trend Rank
2014 2018 2014 2018 State Rate
County Rank
Economic Well-BeingChildren under 18 in poverty 2,566 2,213 27.2% 23.5% é 18.3% 69
Food insecurity for childrenb 2,350 1,880 23.4% 19.4% é 17.5% 67
HealthLow birthweight infantsa,c 185 189 7.5% 7.5% è 8.5% 43
Preventable hospitalizations for all causes for children under 18 (per 1,000)b,c
43 51 4.3 5.3 ê 7.1 40
Child asthma ER rates (per 1,000)b
46 30 4.6 3.1 é 7.5 44
Family & CommunityBirths to teens, ages 15-19 (per 1,000)
45 42 36.9 33.4 é 21.6 81
Substantiated child abuse/neglect cases (per 1,000)a
65 33 6.6 3.4 é 4.0 30
EducationHigh school graduation 364 391 87.9% 91.6% é 91.3% 85
Achievement proficiencya,d
3rd grade English/Language Arts (MAP) 192 42.5% 48.6%
8th grade English/Language Arts (MAP)
227 48.2% 49.0%
4th grade Math (MAP) 189 41.4% 45.8%
Algebra I (End of Course exam) 173 38.7% 47.0%
Trend: é better ê worse è no change
Lawrence CountyCounty Seat: Mount Vernon
70Population: 38,133
2016
County Composite Rank
71
2020
a Outcome not included in County Composite Rank.b Data based on 2013 and 2017.c Data based on 5-year time spans, 2009-2013 and 2014-2018.d Achievement proficiency measures those that scored proficient or above on the MAP tests and Algebra I End of Course exam. Achievement data from 2014 are not shown due to differences in testing standards and assessments used in 2018; accordingly, no trend arrows or county ranks are shown.

Lawrence County
EducationLicensed child care capacity (per 1,000)
2014 40.72019 34.0
Accredited child care capacity as % of licensed capacity
2014 —2019 0.0%
School attendance, grades K-122014 95.0%2018 95.1%
Family & CommunityTeen unintentional deaths/homicides/suicides (per 100,000)
2009-2013 52.62014-2018 22.0
Single parent head-of-house-hold with children under 18
2009-2013 11.6%2014-2018 8.6%
Juvenile law violation referrals, ages 10-17 (per 1,000)
2014 13.72018 22.3
Annual high school dropout rate2014 1.3%2018 1.7%
Children entering/re-entering state custody (per 1,000)
2014 11.82018 6.4
Health
Infant mortality (per 1,000)2009-2013 5.32014-2018 9.5
Child deaths ages 1-17 (per 100,000)
2009-2013 27.92014-2018 20.7
Child deaths ages 1-14 (per 100,000)
2009-2013 16.92014-2018 15.3
Child deaths ages 15-17 (per 100,000)
2009-2013 77.62014-2018 33.8
Unrestrained automobile fatalities for children under 18a
2009-2013 33.3%2014-2018 0%
Substance abuse hospitalizations ages 1-19 (per 100,000)b
2008-2012 9.6*
2013-2017 18.3*
Mental/behavioral hospitalizations (not substance abuse) ages 1-19 (per 10,000)
2008-2012 56.0
2013-2017 69.9
Uninsured children2013 9.4%2017 6.5%
School attendance, grades 9-122014 93.9%2018 94.6%
Contextual IndicatorsCounty Seat: Mount Vernon
70Population: 38,133
2016
County Composite Rank
2020
71
Demographics
Total population2014 38,0232018 38,133
Child population under 182014 9,9172018 9,667
Children under 18 as % of total population
2014 25.5%2018 25.4%
Child population under 62014 2,9612018 3,093
Children under 6 as % of total population
2014 7.8%2018 8.1%
Minority child population under 18
2014 1,4592018 1,589
Minority child population under 18 as % of child population
2014 15.1%2018 16.4%
Minority child population under 6
2014 4782018 513
Minority child population under 6 as % of under 6 child population
2014 16.1%
2018 16.6%
Children in single-parent families
2009-2013 24.7%2014-2018 28.9%
Children in married-parent families
2009-2013 73.4%2014-2018 70.2%
Economic Well-being
Children in poverty under 62014 34.4%2018 28.9%
Children in poverty, ages 5-172009-2013 25.3%2014-2018 22.4%
Housing cost-burdened households
2009-2013 27.4%2014-2018 25.3%
Family households with children under 18 at 185% of poverty level
2009-2013 48.5%
2014-2018 48.5%
Children in families receiving SNAP
2014 39.4%2018 35.0%
Median income family household with children under 18
2009-2013 $47,583
2014-2018 $46,059
Adult unemployment2014 5.9%2018 3.0%
Child homelessness2014 3.0%2018 3.3%
a If no % listed, no vehicle fatalities happened in the county during that period.b *Indicates unstable rate due to low count (<20 cases);** indicates very unstable rate due to very low count (<5 cases)

Outcome MeasuresNumber Rate Trend Rank
2014 2018 2014 2018 State Rate
County Rank
Economic Well-BeingChildren under 18 in poverty 518 454 23.0% 21.5% é 18.3% 50
Food insecurity for childrenb 520 410 21.9% 17.5% é 17.5% 33
HealthLow birthweight infantsa,c 34 55 6.8% 9.1% ê 8.5% 93
Preventable hospitalizations for all causes for children under 18 (per 1,000)b,c
6 6 2.5 2.7 ê 7.1 4
Child asthma ER rates (per 1,000)b
1 2 0.4 0.9 ê 7.5 6
Family & CommunityBirths to teens, ages 15-19 (per 1,000)
8 6 19.8 16.9 é 21.6 22
Substantiated child abuse/neglect cases (per 1,000)a
12 16 5.1 7.4 ê 4.0 83
EducationHigh school graduation 127 108 94.1% 95.6% é 91.3% 32
Achievement proficiencya,d
3rd grade English/Language Arts (MAP) 51 48.6% 48.6%
8th grade English/Language Arts (MAP)
46 45.1% 49.0%
4th grade Math (MAP) 45 46.9% 45.8%
Algebra I (End of Course exam) 45 45.9% 47.0%
Trend: é better ê worse è no change
Lewis CountyCounty Seat: Monticello
9Population: 10,027
2016
County Composite Rank
6
2020
a Outcome not included in County Composite Rank.b Data based on 2013 and 2017.c Data based on 5-year time spans, 2009-2013 and 2014-2018.d Achievement proficiency measures those that scored proficient or above on the MAP tests and Algebra I End of Course exam. Achievement data from 2014 are not shown due to differences in testing standards and assessments used in 2018; accordingly, no trend arrows or county ranks are shown.

Lewis County
EducationLicensed child care capacity (per 1,000)
2014 42.32019 40.5
Accredited child care capacity as % of licensed capacity
2014 —2019 0.0%
School attendance, grades K-122014 96.0%2018 94.8%
Family & CommunityTeen unintentional deaths/homicides/suicides (per 100,000)
2009-2013 25.02014-2018 44.7
Single parent head-of-house-hold with children under 18
2009-2013 5.6%2014-2018 7.4%
Juvenile law violation referrals, ages 10-17 (per 1,000)
2014 26.72018 46.5
Annual high school dropout rate2014 0.8%2018 1.2%
Children entering/re-entering state custody (per 1,000)
2014 5.22018 8.3
Health
Infant mortality (per 1,000)2009-2013 4.02014-2018 8.2
Child deaths ages 1-17 (per 100,000)
2009-2013 8.42014-2018 43.4
Child deaths ages 1-14 (per 100,000)
2009-2013 0.02014-2018 18.4
Child deaths ages 15-17 (per 100,000)
2009-2013 47.82014-2018 142.5
Unrestrained automobile fatalities for children under 18a
2009-2013 0.0%2014-2018 %
Substance abuse hospitalizations ages 1-19 (per 100,000)b
2008-2012 6.5**
2013-2017 0
Mental/behavioral hospitalizations (not substance abuse) ages 1-19 (per 10,000)
2008-2012 37.7
2013-2017 28.1
Uninsured children2013 10.0%2017 7.3%
School attendance, grades 9-122014 95.3%2018 93.9%
Contextual IndicatorsCounty Seat: Monticello
9Population: 10,027
2016
County Composite Rank
2020
6
Demographics
Total population2014 10,1382018 10,027
Child population under 182014 2,3532018 2,173
Children under 18 as % of total population
2014 22.8%2018 23.0%
Child population under 62014 7232018 669
Children under 6 as % of total population
2014 7.1%2018 6.8%
Minority child population under 18
2014 1772018 146
Minority child population under 18 as % of child population
2014 7.6%2018 6.7%
Minority child population under 6
2014 602018 50
Minority child population under 6 as % of under 6 child population
2014 8.3%
2018 7.5%
Children in single-parent families
2009-2013 24.7%2014-2018 29.4%
Children in married-parent families
2009-2013 74.5%2014-2018 69.9%
Economic Well-being
Children in poverty under 62014 26.5%2018 25.1%
Children in poverty, ages 5-172009-2013 21.1%2014-2018 20.4%
Housing cost-burdened households
2009-2013 22.8%2014-2018 20.0%
Family households with children under 18 at 185% of poverty level
2009-2013 42.9%
2014-2018 36.6%
Children in families receiving SNAP
2014 24.1%2018 26.9%
Median income family household with children under 18
2009-2013 $49,100
2014-2018 $62,000
Adult unemployment2014 5.2%2018 2.8%
Child homelessness2014 0.0%2018 0.7%
a If no % listed, no vehicle fatalities happened in the county during that period.b *Indicates unstable rate due to low count (<20 cases);** indicates very unstable rate due to very low count (<5 cases)

Outcome MeasuresNumber Rate Trend Rank
2014 2018 2014 2018 State Rate
County Rank
Economic Well-BeingChildren under 18 in poverty 2,911 2,185 20.8% 15.3% é 18.3% 21
Food insecurity for childrenb 3,210 2,430 22.0% 17% é 17.5% 26
HealthLow birthweight infantsa,c 256 304 6.9% 8.1% ê 8.5% 62
Preventable hospitalizations for all causes for children under 18 (per 1,000)b,c
101 87 6.9 6.1 é 7.1 56
Child asthma ER rates (per 1,000)b
117 105 8.0 7.3 é 7.5 106
Family & CommunityBirths to teens, ages 15-19 (per 1,000)
42 37 22.6 20.4 é 21.6 32
Substantiated child abuse/neglect cases (per 1,000)a
41 87 2.8 5.9 ê 4.0 69
EducationHigh school graduation 654 656 93.7% 94.9% é 91.3% 41
Achievement proficiencya,d
3rd grade English/Language Arts (MAP) 314 44.5% 48.6%
8th grade English/Language Arts (MAP)
324 50.0% 49.0%
4th grade Math (MAP) 323 45.6% 45.8%
Algebra I (End of Course exam) 347 47.1% 47.0%
Trend: é better ê worse è no change
Lincoln CountyCounty Seat: Troy
32Population: 55,563
2016
County Composite Rank
38
2020
a Outcome not included in County Composite Rank.b Data based on 2013 and 2017.c Data based on 5-year time spans, 2009-2013 and 2014-2018.d Achievement proficiency measures those that scored proficient or above on the MAP tests and Algebra I End of Course exam. Achievement data from 2014 are not shown due to differences in testing standards and assessments used in 2018; accordingly, no trend arrows or county ranks are shown.

Lincoln County
EducationLicensed child care capacity (per 1,000)
2014 27.72019 26.2
Accredited child care capacity as % of licensed capacity
2014 —2019 14.6%
School attendance, grades K-122014 94.9%2018 94.8%
Family & CommunityTeen unintentional deaths/homicides/suicides (per 100,000)
2009-2013 31.42014-2018 35.0
Single parent head-of-house-hold with children under 18
2009-2013 10.1%2014-2018 10.2%
Juvenile law violation referrals, ages 10-17 (per 1,000)
2014 30.12018 34.4
Annual high school dropout rate2014 0.9%2018 1.1%
Children entering/re-entering state custody (per 1,000)
2014 2.12018 4.3
Health
Infant mortality (per 1,000)2009-2013 4.92014-2018 5.6
Child deaths ages 1-17 (per 100,000)
2009-2013 22.02014-2018 18.2
Child deaths ages 1-14 (per 100,000)
2009-2013 16.62014-2018 14.9
Child deaths ages 15-17 (per 100,000)
2009-2013 39.42014-2018 22.6
Unrestrained automobile fatalities for children under 18a
2009-2013 40.0%2014-2018 60%
Substance abuse hospitalizations ages 1-19 (per 100,000)b
2008-2012 21.2*
2013-2017 21.7*
Mental/behavioral hospitalizations (not substance abuse) ages 1-19 (per 10,000)
2008-2012 103.0
2013-2017 126.0
Uninsured children2013 7.1%2017 5.8%
School attendance, grades 9-122014 94.3%2018 94.3%
Contextual IndicatorsCounty Seat: Troy
32Population: 55,563
2016
County Composite Rank
2020
38
Demographics
Total population2014 54,2492018 55,563
Child population under 182014 14,5242018 14,658
Children under 18 as % of total population
2014 26.4%2018 25.7%
Child population under 62014 4,4372018 4,761
Children under 6 as % of total population
2014 8.2%2018 8.3%
Minority child population under 18
2014 1,1662018 1,221
Minority child population under 18 as % of child population
2014 8.1%2018 8.3%
Minority child population under 6
2014 3852018 405
Minority child population under 6 as % of under 6 child population
2014 8.7%
2018 8.5%
Children in single-parent families
2009-2013 26.0%2014-2018 30.3%
Children in married-parent families
2009-2013 72.7%2014-2018 67.9%
Economic Well-being
Children in poverty under 62014 27.5%2018 21.3%
Children in poverty, ages 5-172009-2013 19.3%2014-2018 14.9%
Housing cost-burdened households
2009-2013 30.2%2014-2018 26.4%
Family households with children under 18 at 185% of poverty level
2009-2013 34.0%
2014-2018 36.5%
Children in families receiving SNAP
2014 31.0%2018 25.3%
Median income family household with children under 18
2009-2013 $57,031
2014-2018 $65,137
Adult unemployment2014 6.5%2018 3.3%
Child homelessness2014 1.2%2018 0.8%
a If no % listed, no vehicle fatalities happened in the county during that period.b *Indicates unstable rate due to low count (<20 cases);** indicates very unstable rate due to very low count (<5 cases)

Outcome MeasuresNumber Rate Trend Rank
2014 2018 2014 2018 State Rate
County Rank
Economic Well-BeingChildren under 18 in poverty 851 709 29.8% 25.7% é 18.3% 82
Food insecurity for childrenb 660 630 21.6% 21.6% è 17.5% 93
HealthLow birthweight infantsa,c 40 60 5.7% 8.5% ê 8.5% 76
Preventable hospitalizations for all causes for children under 18 (per 1,000)b,c
26 15 8.5 5.1 é 7.1 37
Child asthma ER rates (per 1,000)b
24 14 7.9 4.8 é 7.5 78
Family & CommunityBirths to teens, ages 15-19 (per 1,000)
24 5 61.9 13 é 21.6 11
Substantiated child abuse/neglect cases (per 1,000)a
16 15 5.3 5.3 ê 4.0 61
EducationHigh school graduation 177 149 95.7% 96.8% é 91.3% 18
Achievement proficiencya,d
3rd grade English/Language Arts (MAP) 99 63.5% 48.6%
8th grade English/Language Arts (MAP)
106 57.3% 49.0%
4th grade Math (MAP) 69 52.7% 45.8%
Algebra I (End of Course exam) 75 51.4% 47.0%
Trend: é better ê worse è no change
Linn CountyCounty Seat: Linneus
42Population: 12,186
2016
County Composite Rank
91
2020
a Outcome not included in County Composite Rank.b Data based on 2013 and 2017.c Data based on 5-year time spans, 2009-2013 and 2014-2018.d Achievement proficiency measures those that scored proficient or above on the MAP tests and Algebra I End of Course exam. Achievement data from 2014 are not shown due to differences in testing standards and assessments used in 2018; accordingly, no trend arrows or county ranks are shown.

Linn County
EducationLicensed child care capacity (per 1,000)
2014 54.32019 42.3
Accredited child care capacity as % of licensed capacity
2014 —2019 33.3%
School attendance, grades K-122014 96.2%2018 95.9%
Family & CommunityTeen unintentional deaths/homicides/suicides (per 100,000)
2009-2013 71.12014-2018 104.6
Single parent head-of-house-hold with children under 18
2009-2013 5.5%2014-2018 10.5%
Juvenile law violation referrals, ages 10-17 (per 1,000)
2014 18.72018 5.0
Annual high school dropout rate2014 1.1%2018 0.9%
Children entering/re-entering state custody (per 1,000)
2014 9.92018 6.4
Health
Infant mortality (per 1,000)2009-2013 4.32014-2018 7.1
Child deaths ages 1-17 (per 100,000)
2009-2013 19.72014-2018 48.0
Child deaths ages 1-14 (per 100,000)
2009-2013 8.02014-2018 29.1
Child deaths ages 15-17 (per 100,000)
2009-2013 70.12014-2018 117.2
Unrestrained automobile fatalities for children under 18a
2009-2013 %2014-2018 100%
Substance abuse hospitalizations ages 1-19 (per 100,000)b
2008-2012 10.6**
2013-2017 5.7**
Mental/behavioral hospitalizations (not substance abuse) ages 1-19 (per 10,000)
2008-2012 69.0
2013-2017 101.7
Uninsured children2013 9.6%2017 6.3%
School attendance, grades 9-122014 95.5%2018 95%
Contextual IndicatorsCounty Seat: Linneus
42Population: 12,186
2016
County Composite Rank
2020
91
Demographics
Total population2014 12,3112018 12,186
Child population under 182014 3,0372018 2,834
Children under 18 as % of total population
2014 23.9%2018 23.9%
Child population under 62014 8662018 871
Children under 6 as % of total population
2014 7.0%2018 7.2%
Minority child population under 18
2014 1732018 187
Minority child population under 18 as % of child population
2014 5.9%2018 6.6%
Minority child population under 6
2014 572018 63
Minority child population under 6 as % of under 6 child population
2014 6.6%
2018 7.2%
Children in single-parent families
2009-2013 29.8%2014-2018 36.9%
Children in married-parent families
2009-2013 68.8%2014-2018 63.1%
Economic Well-being
Children in poverty under 62014 27.4%2018 27.1%
Children in poverty, ages 5-172009-2013 26.1%2014-2018 23.3%
Housing cost-burdened households
2009-2013 24.1%2014-2018 18.1%
Family households with children under 18 at 185% of poverty level
2009-2013 38.4%
2014-2018 45.0%
Children in families receiving SNAP
2014 33.6%2018 30.7%
Median income family household with children under 18
2009-2013 $48,060
2014-2018 $49,805
Adult unemployment2014 8.0%2018 4.7%
Child homelessness2014 0.9%2018 1.4%
a If no % listed, no vehicle fatalities happened in the county during that period.b *Indicates unstable rate due to low count (<20 cases);** indicates very unstable rate due to very low count (<5 cases)

Outcome MeasuresNumber Rate Trend Rank
2014 2018 2014 2018 State Rate
County Rank
Economic Well-BeingChildren under 18 in poverty 739 640 23.8% 20.7% é 18.3% 45
Food insecurity for childrenb 760 610 23.3% 18.9% é 17.5% 53
HealthLow birthweight infantsa,c 65 62 7.9% 7.8% é 8.5% 53
Preventable hospitalizations for all causes for children under 18 (per 1,000)b,c
18 17 5.5 5.4 é 7.1 44
Child asthma ER rates (per 1,000)b
17 11 5.2 3.5 é 7.5 57
Family & CommunityBirths to teens, ages 15-19 (per 1,000)
12 13 28.6 34.8 ê 21.6 87
Substantiated child abuse/neglect cases (per 1,000)a
10 14 3.1 4.4 ê 4.0 48
EducationHigh school graduation 146 142 96.1% 95.3% ê 91.3% 37
Achievement proficiencya,d
3rd grade English/Language Arts (MAP) 60 42.9% 48.6%
8th grade English/Language Arts (MAP)
76 47.8% 49.0%
4th grade Math (MAP) 61 43.9% 45.8%
Algebra I (End of Course exam) 67 42.7% 47.0%
Trend: é better ê worse è no change
Livingston CountyCounty Seat: Chillicothe
45Population: 15,076
2016
County Composite Rank
34
2020
a Outcome not included in County Composite Rank.b Data based on 2013 and 2017.c Data based on 5-year time spans, 2009-2013 and 2014-2018.d Achievement proficiency measures those that scored proficient or above on the MAP tests and Algebra I End of Course exam. Achievement data from 2014 are not shown due to differences in testing standards and assessments used in 2018; accordingly, no trend arrows or county ranks are shown.

Livingston County
EducationLicensed child care capacity (per 1,000)
2014 67.12019 94.7
Accredited child care capacity as % of licensed capacity
2014 —2019 0.0%
School attendance, grades K-122014 95.8%2018 95.7%
Family & CommunityTeen unintentional deaths/homicides/suicides (per 100,000)
2009-2013 45.42014-2018 73.9
Single parent head-of-house-hold with children under 18
2009-2013 11.4%2014-2018 8.5%
Juvenile law violation referrals, ages 10-17 (per 1,000)
2014 38.12018 41.8
Annual high school dropout rate2014 1.1%2018 0.7%
Children entering/re-entering state custody (per 1,000)
2014 7.52018 9.2
Health
Infant mortality (per 1,000)2009-2013 7.32014-2018 7.6
Child deaths ages 1-17 (per 100,000)
2009-2013 6.22014-2018 18.4
Child deaths ages 1-14 (per 100,000)
2009-2013 7.42014-2018 12.3
Child deaths ages 15-17 (per 100,000)
2009-2013 0.02014-2018 36.4
Unrestrained automobile fatalities for children under 18a
2009-2013 %2014-2018 0%
Substance abuse hospitalizations ages 1-19 (per 100,000)b
2008-2012 24.8*
2013-2017 15.0**
Mental/behavioral hospitalizations (not substance abuse) ages 1-19 (per 10,000)
2008-2012 110.9
2013-2017 79.8
Uninsured children2013 8.1%2017 6.2%
School attendance, grades 9-122014 95.2%2018 95.6%
Contextual IndicatorsCounty Seat: Chillicothe
45Population: 15,076
2016
County Composite Rank
2020
34
Demographics
Total population2014 15,0532018 15,076
Child population under 182014 3,2042018 3,168
Children under 18 as % of total population
2014 21.4%2018 21.6%
Child population under 62014 1,0702018 1,027
Children under 6 as % of total population
2014 7.1%2018 6.8%
Minority child population under 18
2014 2892018 290
Minority child population under 18 as % of child population
2014 9.0%2018 9.2%
Minority child population under 6
2014 1572018 110
Minority child population under 6 as % of under 6 child population
2014 14.7%
2018 10.7%
Children in single-parent families
2009-2013 30.8%2014-2018 34.2%
Children in married-parent families
2009-2013 68.8%2014-2018 64.1%
Economic Well-being
Children in poverty under 62014 27.5%2018 27.2%
Children in poverty, ages 5-172009-2013 22.6%2014-2018 19.7%
Housing cost-burdened households
2009-2013 24.4%2014-2018 21.2%
Family households with children under 18 at 185% of poverty level
2009-2013 39.8%
2014-2018 38.1%
Children in families receiving SNAP
2014 28.5%2018 29.7%
Median income family household with children under 18
2009-2013 $50,550
2014-2018 $57,000
Adult unemployment2014 5.0%2018 2.5%
Child homelessness2014 0.0%2018 1.2%
a If no % listed, no vehicle fatalities happened in the county during that period.b *Indicates unstable rate due to low count (<20 cases);** indicates very unstable rate due to very low count (<5 cases)

Outcome MeasuresNumber Rate Trend Rank
2014 2018 2014 2018 State Rate
County Rank
Economic Well-BeingChildren under 18 in poverty 1,888 1,517 32.3% 26.2% é 18.3% 87
Food insecurity for childrenb 1,550 1,130 24.5% 19% é 17.5% 55
HealthLow birthweight infantsa,c 137 133 8.9% 7.8% é 8.5% 50
Preventable hospitalizations for all causes for children under 18 (per 1,000)b,c
39 37 6.2 6.3 ê 7.1 62
Child asthma ER rates (per 1,000)b
16 19 2.5 3.2 ê 7.5 51
Family & CommunityBirths to teens, ages 15-19 (per 1,000)
36 38 46.3 49 ê 21.6 110
Substantiated child abuse/neglect cases (per 1,000)a
22 12 3.6 2.0 é 4.0 11
EducationHigh school graduation 211 261 89.4% 91.9% é 91.3% 83
Achievement proficiencya,d
3rd grade English/Language Arts (MAP) 125 41.0% 48.6%
8th grade English/Language Arts (MAP)
143 51.1% 49.0%
4th grade Math (MAP) 184 65.2% 45.8%
Algebra I (End of Course exam) 133 55.0% 47.0%
Trend: é better ê worse è no change
McDonald CountyCounty Seat: Pineville
94Population: 22,827
2016
County Composite Rank
90
2020
a Outcome not included in County Composite Rank.b Data based on 2013 and 2017.c Data based on 5-year time spans, 2009-2013 and 2014-2018.d Achievement proficiency measures those that scored proficient or above on the MAP tests and Algebra I End of Course exam. Achievement data from 2014 are not shown due to differences in testing standards and assessments used in 2018; accordingly, no trend arrows or county ranks are shown.

McDonald County
EducationLicensed child care capacity (per 1,000)
2014 26.82019 31.8
Accredited child care capacity as % of licensed capacity
2014 —2019 0.0%
School attendance, grades K-122014 94.7%2018 94.6%
Family & CommunityTeen unintentional deaths/homicides/suicides (per 100,000)
2009-2013 82.82014-2018 85.1
Single parent head-of-house-hold with children under 18
2009-2013 9.6%2014-2018 10.1%
Juvenile law violation referrals, ages 10-17 (per 1,000)
2014 27.42018 52.7
Annual high school dropout rate2014 1.5%2018 1.6%
Children entering/re-entering state custody (per 1,000)
2014 12.22018 8.4
Health
Infant mortality (per 1,000)2009-2013 9.82014-2018 9.9
Child deaths ages 1-17 (per 100,000)
2009-2013 38.02014-2018 33.9
Child deaths ages 1-14 (per 100,000)
2009-2013 30.82014-2018 28.1
Child deaths ages 15-17 (per 100,000)
2009-2013 72.92014-2018 37.2
Unrestrained automobile fatalities for children under 18a
2009-2013 0.0%2014-2018 60%
Substance abuse hospitalizations ages 1-19 (per 100,000)b
2008-2012 10.1**
2013-2017 8.2**
Mental/behavioral hospitalizations (not substance abuse) ages 1-19 (per 10,000)
2008-2012 39.6
2013-2017 57.8
Uninsured children2013 11.0%2017 10.0%
School attendance, grades 9-122014 93.4%2018 93.4%
Contextual IndicatorsCounty Seat: Pineville
94Population: 22,827
2016
County Composite Rank
2020
90
Demographics
Total population2014 22,8002018 22,827
Child population under 182014 6,1602018 5,951
Children under 18 as % of total population
2014 26.4%2018 25.8%
Child population under 62014 1,8512018 2,056
Children under 6 as % of total population
2014 8.1%2018 8.9%
Minority child population under 18
2014 1,7792018 1,861
Minority child population under 18 as % of child population
2014 29.6%2018 31.3%
Minority child population under 6
2014 6502018 718
Minority child population under 6 as % of under 6 child population
2014 35.1%
2018 34.9%
Children in single-parent families
2009-2013 33.9%2014-2018 34.1%
Children in married-parent families
2009-2013 66.0%2014-2018 65.7%
Economic Well-being
Children in poverty under 62014 37.0%2018 33.2%
Children in poverty, ages 5-172009-2013 29.4%2014-2018 25.7%
Housing cost-burdened households
2009-2013 28.9%2014-2018 24.1%
Family households with children under 18 at 185% of poverty level
2009-2013 54.9%
2014-2018 55.6%
Children in families receiving SNAP
2014 46.1%2018 40.5%
Median income family household with children under 18
2009-2013 $41,240
2014-2018 $45,296
Adult unemployment2014 5.7%2018 3.0%
Child homelessness2014 4.2%2018 3.3%
a If no % listed, no vehicle fatalities happened in the county during that period.b *Indicates unstable rate due to low count (<20 cases);** indicates very unstable rate due to very low count (<5 cases)

Outcome MeasuresNumber Rate Trend Rank
2014 2018 2014 2018 State Rate
County Rank
Economic Well-BeingChildren under 18 in poverty 917 741 25.6% 21.8% é 18.3% 53
Food insecurity for childrenb 810 740 21.8% 20% é 17.5% 75
HealthLow birthweight infantsa,c 64 69 7.0% 7.8% ê 8.5% 54
Preventable hospitalizations for all causes for children under 18 (per 1,000)b,c
23 19 6.2 5.4 é 7.1 43
Child asthma ER rates (per 1,000)b
12 14 3.2 3.9 ê 7.5 67
Family & CommunityBirths to teens, ages 15-19 (per 1,000)
13 14 30.5 31.3 ê 21.6 77
Substantiated child abuse/neglect cases (per 1,000)a
13 42 3.5 12.1 ê 4.0 106
EducationHigh school graduation 160 139 91.4% 93.9% é 91.3% 58
Achievement proficiencya,d
3rd grade English/Language Arts (MAP) 85 57.8% 48.6%
8th grade English/Language Arts (MAP)
62 35.4% 49.0%
4th grade Math (MAP) 105 63.6% 45.8%
Algebra I (End of Course exam) 81 55.9% 47.0%
Trend: é better ê worse è no change
Macon CountyCounty Seat: Macon
59Population: 15,254
2016
County Composite Rank
44
2020
a Outcome not included in County Composite Rank.b Data based on 2013 and 2017.c Data based on 5-year time spans, 2009-2013 and 2014-2018.d Achievement proficiency measures those that scored proficient or above on the MAP tests and Algebra I End of Course exam. Achievement data from 2014 are not shown due to differences in testing standards and assessments used in 2018; accordingly, no trend arrows or county ranks are shown.

Macon County
EducationLicensed child care capacity (per 1,000)
2014 67.82019 67.4
Accredited child care capacity as % of licensed capacity
2014 —2019 59.8%
School attendance, grades K-122014 95.6%2018 95.4%
Family & CommunityTeen unintentional deaths/homicides/suicides (per 100,000)
2009-2013 81.02014-2018 0.0
Single parent head-of-house-hold with children under 18
2009-2013 9.0%2014-2018 9.2%
Juvenile law violation referrals, ages 10-17 (per 1,000)
2014 18.72018 29.9
Annual high school dropout rate2014 1.8%2018 0.3%
Children entering/re-entering state custody (per 1,000)
2014 5.72018 12.1
Health
Infant mortality (per 1,000)2009-2013 2.22014-2018 10.2
Child deaths ages 1-17 (per 100,000)
2009-2013 37.62014-2018 11.1
Child deaths ages 1-14 (per 100,000)
2009-2013 19.42014-2018 11.3
Child deaths ages 15-17 (per 100,000)
2009-2013 121.82014-2018 0.0
Unrestrained automobile fatalities for children under 18a
2009-2013 100.0%2014-2018 %
Substance abuse hospitalizations ages 1-19 (per 100,000)b
2008-2012 17.2**
2013-2017 13.4**
Mental/behavioral hospitalizations (not substance abuse) ages 1-19 (per 10,000)
2008-2012 53.6
2013-2017 58.2
Uninsured children2013 9.1%2017 6.3%
School attendance, grades 9-122014 94.3%2018 94.7%
Contextual IndicatorsCounty Seat: Macon
59Population: 15,254
2016
County Composite Rank
2020
44
Demographics
Total population2014 15,4792018 15,254
Child population under 182014 3,7232018 3,470
Children under 18 as % of total population
2014 23.7%2018 23.7%
Child population under 62014 1,1222018 1,045
Children under 6 as % of total population
2014 7.3%2018 6.9%
Minority child population under 18
2014 3062018 286
Minority child population under 18 as % of child population
2014 8.3%2018 8.2%
Minority child population under 6
2014 882018 77
Minority child population under 6 as % of under 6 child population
2014 7.8%
2018 7.4%
Children in single-parent families
2009-2013 23.8%2014-2018 33.3%
Children in married-parent families
2009-2013 76.1%2014-2018 66.5%
Economic Well-being
Children in poverty under 62014 26.4%2018 25.1%
Children in poverty, ages 5-172009-2013 23.7%2014-2018 20.0%
Housing cost-burdened households
2009-2013 24.6%2014-2018 22.9%
Family households with children under 18 at 185% of poverty level
2009-2013 41.4%
2014-2018 49.5%
Children in families receiving SNAP
2014 33.1%2018 26.5%
Median income family household with children under 18
2009-2013 $51,454
2014-2018 $54,571
Adult unemployment2014 6.1%2018 2.9%
Child homelessness2014 0.0%2018 0.0%
a If no % listed, no vehicle fatalities happened in the county during that period.b *Indicates unstable rate due to low count (<20 cases);** indicates very unstable rate due to very low count (<5 cases)

Outcome MeasuresNumber Rate Trend Rank
2014 2018 2014 2018 State Rate
County Rank
Economic Well-BeingChildren under 18 in poverty 830 659 30.2% 24.5% é 18.3% 75
Food insecurity for childrenb 760 530 26.0% 19.2% é 17.5% 61
HealthLow birthweight infantsa,c 52 63 7.1% 8.8% ê 8.5% 90
Preventable hospitalizations for all causes for children under 18 (per 1,000)b,c
33 10 11.3 3.5 é 7.1 12
Child asthma ER rates (per 1,000)b
33 11 11.3 3.9 é 7.5 64
Family & CommunityBirths to teens, ages 15-19 (per 1,000)
18 10 49.7 28.8 é 21.6 66
Substantiated child abuse/neglect cases (per 1,000)a
24 16 8.3 5.7 é 4.0 67
EducationHigh school graduation 137 139 89.0% 90.3% é 91.3% 91
Achievement proficiencya,d
3rd grade English/Language Arts (MAP) 87 50.9% 48.6%
8th grade English/Language Arts (MAP)
80 45.2% 49.0%
4th grade Math (MAP) 69 40.4% 45.8%
Algebra I (End of Course exam) 38 23.2% 47.0%
Trend: é better ê worse è no change
Madison CountyCounty Seat: Fredericktown
62Population: 12,205
2016
County Composite Rank
109
2020
a Outcome not included in County Composite Rank.b Data based on 2013 and 2017.c Data based on 5-year time spans, 2009-2013 and 2014-2018.d Achievement proficiency measures those that scored proficient or above on the MAP tests and Algebra I End of Course exam. Achievement data from 2014 are not shown due to differences in testing standards and assessments used in 2018; accordingly, no trend arrows or county ranks are shown.

Madison County
EducationLicensed child care capacity (per 1,000)
2014 153.22019 119.5
Accredited child care capacity as % of licensed capacity
2014 —2019 29.7%
School attendance, grades K-122014 95.1%2018 94.4%
Family & CommunityTeen unintentional deaths/homicides/suicides (per 100,000)
2009-2013 99.82014-2018 54.9
Single parent head-of-house-hold with children under 18
2009-2013 9.9%2014-2018 3.8%
Juvenile law violation referrals, ages 10-17 (per 1,000)
2014 51.42018 28.0
Annual high school dropout rate2014 0.2%2018 0.2%
Children entering/re-entering state custody (per 1,000)
2014 5.92018 8.2
Health
Infant mortality (per 1,000)2009-2013 10.92014-2018 4.2
Child deaths ages 1-17 (per 100,000)
2009-2013 34.22014-2018 43.2
Child deaths ages 1-14 (per 100,000)
2009-2013 16.52014-2018 30.5
Child deaths ages 15-17 (per 100,000)
2009-2013 111.92014-2018 80.0
Unrestrained automobile fatalities for children under 18a
2009-2013 100.0%2014-2018 100%
Substance abuse hospitalizations ages 1-19 (per 100,000)b
2008-2012 11.0**
2013-2017 29.8*
Mental/behavioral hospitalizations (not substance abuse) ages 1-19 (per 10,000)
2008-2012 105.2
2013-2017 122.6
Uninsured children2013 8.3%2017 6.1%
School attendance, grades 9-122014 94.0%2018 92.9%
Contextual IndicatorsCounty Seat: Fredericktown
62Population: 12,205
2016
County Composite Rank
2020
109
Demographics
Total population2014 12,3682018 12,205
Child population under 182014 2,9032018 2,820
Children under 18 as % of total population
2014 23.2%2018 22.7%
Child population under 62014 8882018 866
Children under 6 as % of total population
2014 7.2%2018 7.1%
Minority child population under 18
2014 1692018 193
Minority child population under 18 as % of child population
2014 5.9%2018 6.8%
Minority child population under 6
2014 462018 61
Minority child population under 6 as % of under 6 child population
2014 5.2%
2018 7.0%
Children in single-parent families
2009-2013 38.2%2014-2018 16.1%
Children in married-parent families
2009-2013 59.6%2014-2018 77.7%
Economic Well-being
Children in poverty under 62014 38.4%2018 34.8%
Children in poverty, ages 5-172009-2013 28.2%2014-2018 23.0%
Housing cost-burdened households
2009-2013 33.4%2014-2018 25.6%
Family households with children under 18 at 185% of poverty level
2009-2013 51.6%
2014-2018 46.2%
Children in families receiving SNAP
2014 47.0%2018 41.0%
Median income family household with children under 18
2009-2013 $39,129
2014-2018 $54,842
Adult unemployment2014 6.7%2018 3.6%
Child homelessness2014 0.8%2018 0.5%
a If no % listed, no vehicle fatalities happened in the county during that period.b *Indicates unstable rate due to low count (<20 cases);** indicates very unstable rate due to very low count (<5 cases)

Outcome MeasuresNumber Rate Trend Rank
2014 2018 2014 2018 State Rate
County Rank
Economic Well-BeingChildren under 18 in poverty 458 339 24.0% 19.7% é 18.3% 38
Food insecurity for childrenb 470 410 22.2% 22% é 17.5% 97
HealthLow birthweight infantsa,c 27 28 6.3% 6.7% ê 8.5% 21
Preventable hospitalizations for all causes for children under 18 (per 1,000)b,c
7 7 3.3 3.8 ê 7.1 15
Child asthma ER rates (per 1,000)b
2 3 0.9 1.6 ê 7.5 12
Family & CommunityBirths to teens, ages 15-19 (per 1,000)
4 8 14.3 30.3 ê 21.6 72
Substantiated child abuse/neglect cases (per 1,000)a
17 8 8.2 4.5 é 4.0 51
EducationHigh school graduation 97 85 91.5% 85.9% ê 91.3% 112
Achievement proficiencya,d
3rd grade English/Language Arts (MAP) 33 44.6% 48.6%
8th grade English/Language Arts (MAP)
49 52.1% 49.0%
4th grade Math (MAP) 62 64.6% 45.8%
Algebra I (End of Course exam) 42 41.2% 47.0%
Trend: é better ê worse è no change
Maries CountyCounty Seat: Vienna
78Population: 8,884
2016
County Composite Rank
15
2020
a Outcome not included in County Composite Rank.b Data based on 2013 and 2017.c Data based on 5-year time spans, 2009-2013 and 2014-2018.d Achievement proficiency measures those that scored proficient or above on the MAP tests and Algebra I End of Course exam. Achievement data from 2014 are not shown due to differences in testing standards and assessments used in 2018; accordingly, no trend arrows or county ranks are shown.

Maries County
EducationLicensed child care capacity (per 1,000)
2014 27.92019 36.5
Accredited child care capacity as % of licensed capacity
2014 —2019 23.1%
School attendance, grades K-122014 94.9%2018 95.4%
Family & CommunityTeen unintentional deaths/homicides/suicides (per 100,000)
2009-2013 101.32014-2018 30.9
Single parent head-of-house-hold with children under 18
2009-2013 8.8%2014-2018 7.7%
Juvenile law violation referrals, ages 10-17 (per 1,000)
2014 3.02018 0.0
Annual high school dropout rate2014 1.9%2018 1.6%
Children entering/re-entering state custody (per 1,000)
2014 5.62018 5.1
Health
Infant mortality (per 1,000)2009-2013 0.02014-2018 4.8
Child deaths ages 1-17 (per 100,000)
2009-2013 47.32014-2018 11.0
Child deaths ages 1-14 (per 100,000)
2009-2013 46.72014-2018 0.0
Child deaths ages 15-17 (per 100,000)
2009-2013 53.22014-2018 58.5
Unrestrained automobile fatalities for children under 18a
2009-2013 %2014-2018 100%
Substance abuse hospitalizations ages 1-19 (per 100,000)b
2008-2012 7.5**
2013-2017 33.6**
Mental/behavioral hospitalizations (not substance abuse) ages 1-19 (per 10,000)
2008-2012 42.0
2013-2017 101.6
Uninsured children2013 11.7%2017 8.7%
School attendance, grades 9-122014 95.1%2018 95.8%
Contextual IndicatorsCounty Seat: Vienna
78Population: 8,884
2016
County Composite Rank
2020
15
Demographics
Total population2014 9,0132018 8,884
Child population under 182014 2,0812018 1,780
Children under 18 as % of total population
2014 21.9%2018 20.5%
Child population under 62014 5042018 476
Children under 6 as % of total population
2014 5.6%2018 5.4%
Minority child population under 18
2014 992018 105
Minority child population under 18 as % of child population
2014 5.0%2018 5.9%
Minority child population under 6
2014 202018 31
Minority child population under 6 as % of under 6 child population
2014 4.0%
2018 6.5%
Children in single-parent families
2009-2013 27.1%2014-2018 31.0%
Children in married-parent families
2009-2013 71.4%2014-2018 68.6%
Economic Well-being
Children in poverty under 62014 29.7%2018 27.7%
Children in poverty, ages 5-172009-2013 20.9%2014-2018 18.0%
Housing cost-burdened households
2009-2013 21.6%2014-2018 23.7%
Family households with children under 18 at 185% of poverty level
2009-2013 36.2%
2014-2018 39.2%
Children in families receiving SNAP
2014 31.3%2018 24.0%
Median income family household with children under 18
2009-2013 $54,767
2014-2018 $55,185
Adult unemployment2014 6.1%2018 3.3%
Child homelessness2014 0.0%2018 0.0%
a If no % listed, no vehicle fatalities happened in the county during that period.b *Indicates unstable rate due to low count (<20 cases);** indicates very unstable rate due to very low count (<5 cases)
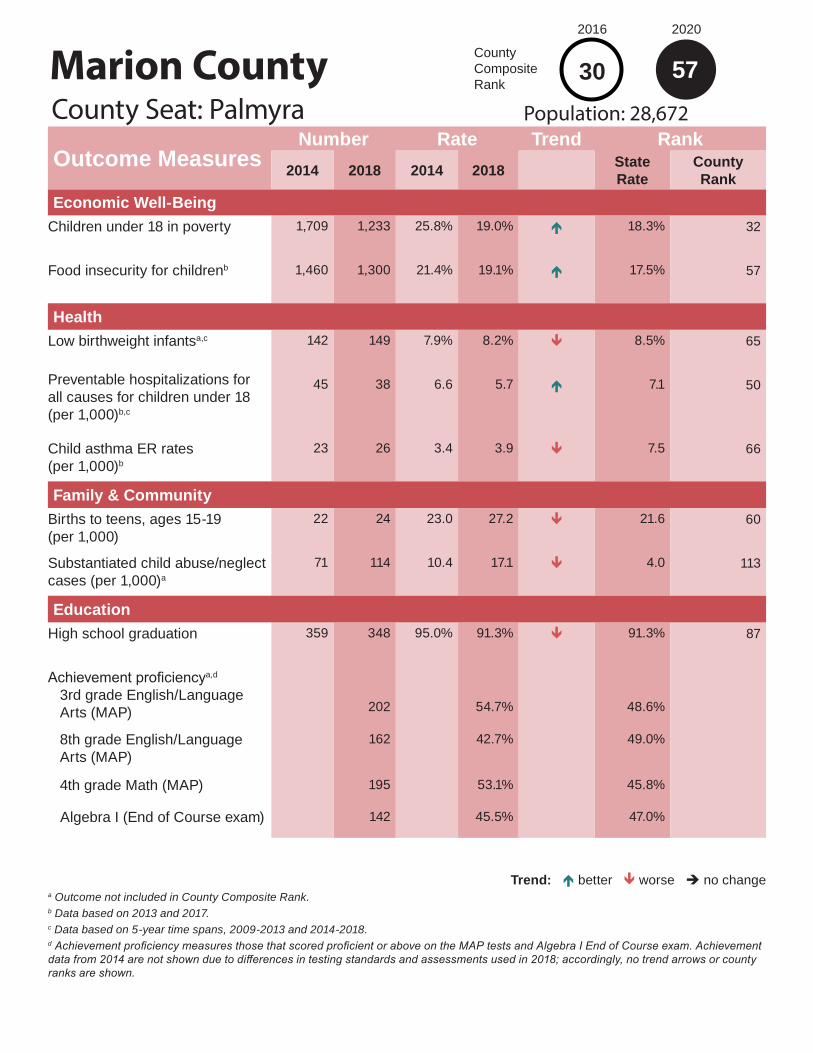
Outcome MeasuresNumber Rate Trend Rank
2014 2018 2014 2018 State Rate
County Rank
Economic Well-BeingChildren under 18 in poverty 1,709 1,233 25.8% 19.0% é 18.3% 32
Food insecurity for childrenb 1,460 1,300 21.4% 19.1% é 17.5% 57
HealthLow birthweight infantsa,c 142 149 7.9% 8.2% ê 8.5% 65
Preventable hospitalizations for all causes for children under 18 (per 1,000)b,c
45 38 6.6 5.7 é 7.1 50
Child asthma ER rates (per 1,000)b
23 26 3.4 3.9 ê 7.5 66
Family & CommunityBirths to teens, ages 15-19 (per 1,000)
22 24 23.0 27.2 ê 21.6 60
Substantiated child abuse/neglect cases (per 1,000)a
71 114 10.4 17.1 ê 4.0 113
EducationHigh school graduation 359 348 95.0% 91.3% ê 91.3% 87
Achievement proficiencya,d
3rd grade English/Language Arts (MAP) 202 54.7% 48.6%
8th grade English/Language Arts (MAP)
162 42.7% 49.0%
4th grade Math (MAP) 195 53.1% 45.8%
Algebra I (End of Course exam) 142 45.5% 47.0%
Trend: é better ê worse è no change
Marion CountyCounty Seat: Palmyra
57Population: 28,672
2016
County Composite Rank
30
2020
a Outcome not included in County Composite Rank.b Data based on 2013 and 2017.c Data based on 5-year time spans, 2009-2013 and 2014-2018.d Achievement proficiency measures those that scored proficient or above on the MAP tests and Algebra I End of Course exam. Achievement data from 2014 are not shown due to differences in testing standards and assessments used in 2018; accordingly, no trend arrows or county ranks are shown.

Marion County
EducationLicensed child care capacity (per 1,000)
2014 100.42019 96.6
Accredited child care capacity as % of licensed capacity
2014 —2019 50.2%
School attendance, grades K-122014 95.6%2018 95.2%
Family & CommunityTeen unintentional deaths/homicides/suicides (per 100,000)
2009-2013 10.82014-2018 60.3
Single parent head-of-house-hold with children under 18
2009-2013 10.4%2014-2018 10.2%
Juvenile law violation referrals, ages 10-17 (per 1,000)
2014 45.92018 29.1
Annual high school dropout rate2014 1.6%2018 1.4%
Children entering/re-entering state custody (per 1,000)
2014 6.82018 11.7
Health
Infant mortality (per 1,000)2009-2013 9.52014-2018 6.1
Child deaths ages 1-17 (per 100,000)
2009-2013 23.42014-2018 17.4
Child deaths ages 1-14 (per 100,000)
2009-2013 13.82014-2018 9.1
Child deaths ages 15-17 (per 100,000)
2009-2013 76.52014-2018 50.0
Unrestrained automobile fatalities for children under 18a
2009-2013 100.0%2014-2018 %
Substance abuse hospitalizations ages 1-19 (per 100,000)b
2008-2012 9.2**
2013-2017 7.1**
Mental/behavioral hospitalizations (not substance abuse) ages 1-19 (per 10,000)
2008-2012 86.3
2013-2017 58.1
Uninsured children2013 6.6%2017 4.4%
School attendance, grades 9-122014 94.4%2018 94.3%
Contextual IndicatorsCounty Seat: Palmyra
57Population: 28,672
2016
County Composite Rank
2020
30
Demographics
Total population2014 28,9202018 28,672
Child population under 182014 6,8112018 6,649
Children under 18 as % of total population
2014 23.5%2018 24.0%
Child population under 62014 2,1852018 2,201
Children under 6 as % of total population
2014 7.6%2018 7.7%
Minority child population under 18
2014 8772018 816
Minority child population under 18 as % of child population
2014 12.9%2018 12.3%
Minority child population under 6
2014 2952018 271
Minority child population under 6 as % of under 6 child population
2014 13.5%
2018 12.3%
Children in single-parent families
2009-2013 40.1%2014-2018 37.1%
Children in married-parent families
2009-2013 59.7%2014-2018 62.6%
Economic Well-being
Children in poverty under 62014 26.5%2018 25.0%
Children in poverty, ages 5-172009-2013 23.3%2014-2018 17.7%
Housing cost-burdened households
2009-2013 25.1%2014-2018 24.3%
Family households with children under 18 at 185% of poverty level
2009-2013 46.2%
2014-2018 44.1%
Children in families receiving SNAP
2014 39.3%2018 35.5%
Median income family household with children under 18
2009-2013 $50,280
2014-2018 $53,040
Adult unemployment2014 5.5%2018 3.1%
Child homelessness2014 2.5%2018 3.1%
a If no % listed, no vehicle fatalities happened in the county during that period.b *Indicates unstable rate due to low count (<20 cases);** indicates very unstable rate due to very low count (<5 cases)

Outcome MeasuresNumber Rate Trend Rank
2014 2018 2014 2018 State Rate
County Rank
Economic Well-BeingChildren under 18 in poverty 196 168 22.1% 19.6% é 18.3% 35
Food insecurity for childrenb 230 170 25.0% 18.1% é 17.5% 39
HealthLow birthweight infantsa,c 15 20 7.1% 8.3% ê 8.5% 69
Preventable hospitalizations for all causes for children under 18 (per 1,000)b,c
5 4 5.4 4.6 é 7.1 26
Child asthma ER rates (per 1,000)b
3 3 3.3 3.4 ê 7.5 56
Family & CommunityBirths to teens, ages 15-19 (per 1,000)
3 3 21.0 27.3 ê 21.6 61
Substantiated child abuse/neglect cases (per 1,000)a
7 - 7.7 0.0 é 4.0 1
EducationHigh school graduation 51 40 98.1% 95.2% ê 91.3% 39
Achievement proficiencya,d
3rd grade English/Language Arts (MAP) 25 53.2% 48.6%
8th grade English/Language Arts (MAP)
18 50.0% 49.0%
4th grade Math (MAP) 14 37.8% 45.8%
Algebra I (End of Course exam) 32 74.4% 47.0%
Trend: é better ê worse è no change
Mercer CountyCounty Seat: Princeton
23Population: 3,664
2016
County Composite Rank
20
2020
a Outcome not included in County Composite Rank.b Data based on 2013 and 2017.c Data based on 5-year time spans, 2009-2013 and 2014-2018.d Achievement proficiency measures those that scored proficient or above on the MAP tests and Algebra I End of Course exam. Achievement data from 2014 are not shown due to differences in testing standards and assessments used in 2018; accordingly, no trend arrows or county ranks are shown.

Mercer County
EducationLicensed child care capacity (per 1,000)
2014 82.12019 11.5
Accredited child care capacity as % of licensed capacity
2014 —2019 0.0%
School attendance, grades K-122014 95.9%2018 94.4%
Family & CommunityTeen unintentional deaths/homicides/suicides (per 100,000)
2009-2013 160.32014-2018 0.0
Single parent head-of-house-hold with children under 18
2009-2013 7.0%2014-2018 4.8%
Juvenile law violation referrals, ages 10-17 (per 1,000)
2014 36.22018 14.5
Annual high school dropout rate2014 0.0%2018 0.0%
Children entering/re-entering state custody (per 1,000)
2014 4.42018 1.2
Health
Infant mortality (per 1,000)2009-2013 9.52014-2018 12.4
Child deaths ages 1-17 (per 100,000)
2009-2013 43.42014-2018 0.0
Child deaths ages 1-14 (per 100,000)
2009-2013 0.02014-2018 0.0
Child deaths ages 15-17 (per 100,000)
2009-2013 239.52014-2018 0.0
Unrestrained automobile fatalities for children under 18a
2009-2013 100.0%2014-2018 %
Substance abuse hospitalizations ages 1-19 (per 100,000)b
2008-2012 0
2013-2017 0
Mental/behavioral hospitalizations (not substance abuse) ages 1-19 (per 10,000)
2008-2012 33.9
2013-2017 50.2
Uninsured children2013 14.5%2017 10.7%
School attendance, grades 9-122014 95.2%2018 93.6%
Contextual IndicatorsCounty Seat: Princeton
23Population: 3,664
2016
County Composite Rank
2020
20
Demographics
Total population2014 3,7192018 3,664
Child population under 182014 9102018 867
Children under 18 as % of total population
2014 24.2%2018 25.5%
Child population under 62014 2502018 278
Children under 6 as % of total population
2014 6.7%2018 7.6%
Minority child population under 18
2014 342018 62
Minority child population under 18 as % of child population
2014 3.8%2018 7.2%
Minority child population under 6
2014 42018 22
Minority child population under 6 as % of under 6 child population
2014 1.6%
2018 7.9%
Children in single-parent families
2009-2013 32.7%2014-2018 22.8%
Children in married-parent families
2009-2013 66.7%2014-2018 75.5%
Economic Well-being
Children in poverty under 62014 27.5%2018 27.0%
Children in poverty, ages 5-172009-2013 20.7%2014-2018 19.2%
Housing cost-burdened households
2009-2013 21.6%2014-2018 18.9%
Family households with children under 18 at 185% of poverty level
2009-2013 43.8%
2014-2018 31.5%
Children in families receiving SNAP
2014 24.8%2018 18.0%
Median income family household with children under 18
2009-2013 $42,414
2014-2018 $59,250
Adult unemployment2014 5.0%2018 3.1%
Child homelessness2014 0.0%2018 0.0%
a If no % listed, no vehicle fatalities happened in the county during that period.b *Indicates unstable rate due to low count (<20 cases);** indicates very unstable rate due to very low count (<5 cases)

Outcome MeasuresNumber Rate Trend Rank
2014 2018 2014 2018 State Rate
County Rank
Economic Well-BeingChildren under 18 in poverty 1,542 1,431 26.6% 24.8% é 18.3% 78
Food insecurity for childrenb 1,600 1,150 26.3% 19.4% é 17.5% 67
HealthLow birthweight infantsa,c 99 130 6.6% 8.4% ê 8.5% 74
Preventable hospitalizations for all causes for children under 18 (per 1,000)b,c
37 35 6.1 5.9 é 7.1 53
Child asthma ER rates (per 1,000)b
25 22 4.1 3.7 é 7.5 61
Family & CommunityBirths to teens, ages 15-19 (per 1,000)
34 27 45.5 36.5 é 21.6 94
Substantiated child abuse/neglect cases (per 1,000)a
36 32 6.0 5.4 é 4.0 63
EducationHigh school graduation 314 348 93.5% 94.1% é 91.3% 53
Achievement proficiencya,d
3rd grade English/Language Arts (MAP) 187 49.2% 48.6%
8th grade English/Language Arts (MAP)
181 48.5% 49.0%
4th grade Math (MAP) 195 49.1% 45.8%
Algebra I (End of Course exam) 180 42.9% 47.0%
Trend: é better ê worse è no change
Miller CountyCounty Seat: Tuscumbia
74Population: 25,049
2016
County Composite Rank
73
2020
a Outcome not included in County Composite Rank.b Data based on 2013 and 2017.c Data based on 5-year time spans, 2009-2013 and 2014-2018.d Achievement proficiency measures those that scored proficient or above on the MAP tests and Algebra I End of Course exam. Achievement data from 2014 are not shown due to differences in testing standards and assessments used in 2018; accordingly, no trend arrows or county ranks are shown.

Miller County
EducationLicensed child care capacity (per 1,000)
2014 76.82019 84.2
Accredited child care capacity as % of licensed capacity
2014 —2019 0.0%
School attendance, grades K-122014 95.1%2018 94.7%
Family & CommunityTeen unintentional deaths/homicides/suicides (per 100,000)
2009-2013 24.92014-2018 24.8
Single parent head-of-house-hold with children under 18
2009-2013 9.7%2014-2018 8.3%
Juvenile law violation referrals, ages 10-17 (per 1,000)
2014 27.52018 12.8
Annual high school dropout rate2014 0.7%2018 1.1%
Children entering/re-entering state custody (per 1,000)
2014 3.42018 2.7
Health
Infant mortality (per 1,000)2009-2013 7.32014-2018 2.6
Child deaths ages 1-17 (per 100,000)
2009-2013 19.82014-2018 16.8
Child deaths ages 1-14 (per 100,000)
2009-2013 16.02014-2018 14.1
Child deaths ages 15-17 (per 100,000)
2009-2013 38.22014-2018 18.4
Unrestrained automobile fatalities for children under 18a
2009-2013 42.9%2014-2018 0%
Substance abuse hospitalizations ages 1-19 (per 100,000)b
2008-2012 16.0*
2013-2017 22.0*
Mental/behavioral hospitalizations (not substance abuse) ages 1-19 (per 10,000)
2008-2012 70.9
2013-2017 98.4
Uninsured children2013 8.9%2017 5.7%
School attendance, grades 9-122014 94.9%2018 94.2%
Contextual IndicatorsCounty Seat: Tuscumbia
74Population: 25,049
2016
County Composite Rank
2020
73
Demographics
Total population2014 25,1412018 25,049
Child population under 182014 5,9642018 5,918
Children under 18 as % of total population
2014 23.6%2018 23.7%
Child population under 62014 1,8042018 1,916
Children under 6 as % of total population
2014 7.2%2018 7.6%
Minority child population under 18
2014 3642018 361
Minority child population under 18 as % of child population
2014 6.1%2018 6.1%
Minority child population under 6
2014 1202018 119
Minority child population under 6 as % of under 6 child population
2014 6.7%
2018 6.2%
Children in single-parent families
2009-2013 38.1%2014-2018 29.9%
Children in married-parent families
2009-2013 61.2%2014-2018 68.2%
Economic Well-being
Children in poverty under 62014 28.0%2018 28.7%
Children in poverty, ages 5-172009-2013 25.1%2014-2018 23.1%
Housing cost-burdened households
2009-2013 33.0%2014-2018 27.5%
Family households with children under 18 at 185% of poverty level
2009-2013 54.9%
2014-2018 37.8%
Children in families receiving SNAP
2014 40.2%2018 33.6%
Median income family household with children under 18
2009-2013 $39,008
2014-2018 $59,153
Adult unemployment2014 7.6%2018 3.7%
Child homelessness2014 0.3%2018 0.4%
a If no % listed, no vehicle fatalities happened in the county during that period.b *Indicates unstable rate due to low count (<20 cases);** indicates very unstable rate due to very low count (<5 cases)

Outcome MeasuresNumber Rate Trend Rank
2014 2018 2014 2018 State Rate
County Rank
Economic Well-BeingChildren under 18 in poverty 1,249 968 40.1% 35.3% é 18.3% 107
Food insecurity for childrenb 850 830 27.0% 27% è 17.5% 115
HealthLow birthweight infantsa,c 112 89 12.5% 11.9% é 8.5% 113
Preventable hospitalizations for all causes for children under 18 (per 1,000)b,c
56 23 17.9 8.0 é 7.1 85
Child asthma ER rates (per 1,000)b
16 24 5.1 8.4 ê 7.5 110
Family & CommunityBirths to teens, ages 15-19 (per 1,000)
27 13 79.6 36.3 é 21.6 93
Substantiated child abuse/neglect cases (per 1,000)a
15 29 4.7 10.3 ê 4.0 99
EducationHigh school graduation 134 117 93.7% 96.7% é 91.3% 19
Achievement proficiencya,d
3rd grade English/Language Arts (MAP) 54 35.5% 48.6%
8th grade English/Language Arts (MAP)
61 38.6% 49.0%
4th grade Math (MAP) 45 30.0% 45.8%
Algebra I (End of Course exam) 46 26.0% 47.0%
Trend: é better ê worse è no change
Mississippi CountyCounty Seat: Charleston
110Population: 13,748
2016
County Composite Rank
110
2020
a Outcome not included in County Composite Rank.b Data based on 2013 and 2017.c Data based on 5-year time spans, 2009-2013 and 2014-2018.d Achievement proficiency measures those that scored proficient or above on the MAP tests and Algebra I End of Course exam. Achievement data from 2014 are not shown due to differences in testing standards and assessments used in 2018; accordingly, no trend arrows or county ranks are shown.

Mississippi County
EducationLicensed child care capacity (per 1,000)
2014 79.02019 69.5
Accredited child care capacity as % of licensed capacity
2014 —2019 0.0%
School attendance, grades K-122014 94.4%2018 94.5%
Family & CommunityTeen unintentional deaths/homicides/suicides (per 100,000)
2009-2013 24.72014-2018 44.2
Single parent head-of-house-hold with children under 18
2009-2013 11.5%2014-2018 14.0%
Juvenile law violation referrals, ages 10-17 (per 1,000)
2014 74.22018 35.9
Annual high school dropout rate2014 0.9%2018 0.9%
Children entering/re-entering state custody (per 1,000)
2014 9.22018 11.4
Health
Infant mortality (per 1,000)2009-2013 11.22014-2018 17.4
Child deaths ages 1-17 (per 100,000)
2009-2013 12.82014-2018 19.9
Child deaths ages 1-14 (per 100,000)
2009-2013 7.52014-2018 7.0
Child deaths ages 15-17 (per 100,000)
2009-2013 42.62014-2018 84.2
Unrestrained automobile fatalities for children under 18a
2009-2013 %2014-2018 %
Substance abuse hospitalizations ages 1-19 (per 100,000)b
2008-2012 24.8*
2013-2017 10.4**
Mental/behavioral hospitalizations (not substance abuse) ages 1-19 (per 10,000)
2008-2012 70.4
2013-2017 86.4
Uninsured children2013 6.6%2017 5.3%
School attendance, grades 9-122014 92.8%2018 93.6%
Contextual IndicatorsCounty Seat: Charleston
110Population: 13,748
2016
County Composite Rank
2020
110
Demographics
Total population2014 14,2322018 13,748
Child population under 182014 3,2252018 2,804
Children under 18 as % of total population
2014 22.2%2018 21.9%
Child population under 62014 1,1022018 825
Children under 6 as % of total population
2014 7.7%2018 6.2%
Minority child population under 18
2014 9872018 837
Minority child population under 18 as % of child population
2014 31.2%2018 29.9%
Minority child population under 6
2014 3482018 257
Minority child population under 6 as % of under 6 child population
2014 31.6%
2018 31.2%
Children in single-parent families
2009-2013 43.8%2014-2018 48.4%
Children in married-parent families
2009-2013 55.6%2014-2018 50.0%
Economic Well-being
Children in poverty under 62014 42.1%2018 38.3%
Children in poverty, ages 5-172009-2013 39.5%2014-2018 32.6%
Housing cost-burdened households
2009-2013 31.5%2014-2018 31.1%
Family households with children under 18 at 185% of poverty level
2009-2013 69.4%
2014-2018 65.0%
Children in families receiving SNAP
2014 63.1%2018 59.3%
Median income family household with children under 18
2009-2013 $30,978
2014-2018 $30,956
Adult unemployment2014 7.3%2018 3.8%
Child homelessness2014 0.0%2018 0.5%
a If no % listed, no vehicle fatalities happened in the county during that period.b *Indicates unstable rate due to low count (<20 cases);** indicates very unstable rate due to very low count (<5 cases)

Outcome MeasuresNumber Rate Trend Rank
2014 2018 2014 2018 State Rate
County Rank
Economic Well-BeingChildren under 18 in poverty 786 592 20.2% 15.3% é 18.3% 21
Food insecurity for childrenb 740 660 19.0% 16.6% é 17.5% 21
HealthLow birthweight infantsa,c 66 61 6.3% 6.0% é 8.5% 8
Preventable hospitalizations for all causes for children under 18 (per 1,000)b,c
29 24 7.4 6.0 é 7.1 54
Child asthma ER rates (per 1,000)b
18 15 4.6 3.8 é 7.5 63
Family & CommunityBirths to teens, ages 15-19 (per 1,000)
14 11 28.5 21.2 é 21.6 37
Substantiated child abuse/neglect cases (per 1,000)a
24 18 6.1 4.6 é 4.0 55
EducationHigh school graduation 152 154 93.3% 91.7% ê 91.3% 84
Achievement proficiencya,d
3rd grade English/Language Arts (MAP) 87 46.8% 48.6%
8th grade English/Language Arts (MAP)
73 41.2% 49.0%
4th grade Math (MAP) 83 47.2% 45.8%
Algebra I (End of Course exam) 68 37.6% 47.0%
Trend: é better ê worse è no change
Moniteau CountyCounty Seat: California
22Population: 15,958
2016
County Composite Rank
27
2020
a Outcome not included in County Composite Rank.b Data based on 2013 and 2017.c Data based on 5-year time spans, 2009-2013 and 2014-2018.d Achievement proficiency measures those that scored proficient or above on the MAP tests and Algebra I End of Course exam. Achievement data from 2014 are not shown due to differences in testing standards and assessments used in 2018; accordingly, no trend arrows or county ranks are shown.

Moniteau County
EducationLicensed child care capacity (per 1,000)
2014 82.92019 90.0
Accredited child care capacity as % of licensed capacity
2014 —2019 5.6%
School attendance, grades K-122014 95.7%2018 95.3%
Family & CommunityTeen unintentional deaths/homicides/suicides (per 100,000)
2009-2013 118.32014-2018 71.1
Single parent head-of-house-hold with children under 18
2009-2013 9.8%2014-2018 6.6%
Juvenile law violation referrals, ages 10-17 (per 1,000)
2014 7.12018 12.8
Annual high school dropout rate2014 1.7%2018 1.0%
Children entering/re-entering state custody (per 1,000)
2014 0.82018 1.5
Health
Infant mortality (per 1,000)2009-2013 7.72014-2018 3.9
Child deaths ages 1-17 (per 100,000)
2009-2013 51.12014-2018 24.8
Child deaths ages 1-14 (per 100,000)
2009-2013 30.62014-2018 15.5
Child deaths ages 15-17 (per 100,000)
2009-2013 159.02014-2018 58.6
Unrestrained automobile fatalities for children under 18a
2009-2013 100.0%2014-2018 0%
Substance abuse hospitalizations ages 1-19 (per 100,000)b
2008-2012 12.5**
2013-2017 8.4**
Mental/behavioral hospitalizations (not substance abuse) ages 1-19 (per 10,000)
2008-2012 39.3
2013-2017 52.2
Uninsured children2013 10.5%2017 8.7%
School attendance, grades 9-122014 95.3%2018 95.2%
Contextual IndicatorsCounty Seat: California
22Population: 15,958
2016
County Composite Rank
2020
27
Demographics
Total population2014 15,8562018 15,958
Child population under 182014 3,9342018 3,933
Children under 18 as % of total population
2014 25.1%2018 25.3%
Child population under 62014 1,2422018 1,231
Children under 6 as % of total population
2014 7.8%2018 7.6%
Minority child population under 18
2014 4312018 372
Minority child population under 18 as % of child population
2014 10.8%2018 9.5%
Minority child population under 6
2014 1572018 98
Minority child population under 6 as % of under 6 child population
2014 12.6%
2018 8.0%
Children in single-parent families
2009-2013 19.9%2014-2018 19.6%
Children in married-parent families
2009-2013 79.1%2014-2018 80.1%
Economic Well-being
Children in poverty under 62014 21.7%2018 19.2%
Children in poverty, ages 5-172009-2013 19.4%2014-2018 14.3%
Housing cost-burdened households
2009-2013 21.2%2014-2018 20.1%
Family households with children under 18 at 185% of poverty level
2009-2013 29.5%
2014-2018 32.9%
Children in families receiving SNAP
2014 24.6%2018 21.1%
Median income family household with children under 18
2009-2013 $60,000
2014-2018 $65,733
Adult unemployment2014 5.9%2018 3.0%
Child homelessness2014 0.5%2018 1.6%
a If no % listed, no vehicle fatalities happened in the county during that period.b *Indicates unstable rate due to low count (<20 cases);** indicates very unstable rate due to very low count (<5 cases)

Outcome MeasuresNumber Rate Trend Rank
2014 2018 2014 2018 State Rate
County Rank
Economic Well-BeingChildren under 18 in poverty 479 418 24.9% 22.5% é 18.3% 59
Food insecurity for childrenb 480 370 23.7% 18.9% é 17.5% 53
HealthLow birthweight infantsa,c 47 31 10.1% 6.4% é 8.5% 15
Preventable hospitalizations for all causes for children under 18 (per 1,000)b,c
15 18 7.4 9.5 ê 7.1 103
Child asthma ER rates (per 1,000)b
4 12 2.0 6.4 ê 7.5 99
Family & CommunityBirths to teens, ages 15-19 (per 1,000)
9 8 35.3 31 é 21.6 76
Substantiated child abuse/neglect cases (per 1,000)a
12 14 6.0 7.4 ê 4.0 84
EducationHigh school graduation 91 116 92.9% 94.3% é 91.3% 47
Achievement proficiencya,d
3rd grade English/Language Arts (MAP) 39 40.6% 48.6%
8th grade English/Language Arts (MAP)
42 40.4% 49.0%
4th grade Math (MAP) 46 42.6% 45.8%
Algebra I (End of Course exam) 60 43.2% 47.0%
Trend: é better ê worse è no change
Monroe CountyCounty Seat: Paris
88Population: 8,654
2016
County Composite Rank
48
2020
a Outcome not included in County Composite Rank.b Data based on 2013 and 2017.c Data based on 5-year time spans, 2009-2013 and 2014-2018.d Achievement proficiency measures those that scored proficient or above on the MAP tests and Algebra I End of Course exam. Achievement data from 2014 are not shown due to differences in testing standards and assessments used in 2018; accordingly, no trend arrows or county ranks are shown.

Monroe County
EducationLicensed child care capacity (per 1,000)
2014 88.12019 87.6
Accredited child care capacity as % of licensed capacity
2014 —2019 12.0%
School attendance, grades K-122014 95.6%2018 95.2%
Family & CommunityTeen unintentional deaths/homicides/suicides (per 100,000)
2009-2013 70.22014-2018 0.0
Single parent head-of-house-hold with children under 18
2009-2013 8.0%2014-2018 8.3%
Juvenile law violation referrals, ages 10-17 (per 1,000)
2014 33.62018 22.8
Annual high school dropout rate2014 2.0%2018 1.2%
Children entering/re-entering state custody (per 1,000)
2014 6.62018 9.5
Health
Infant mortality (per 1,000)2009-2013 0.02014-2018 6.2
Child deaths ages 1-17 (per 100,000)
2009-2013 19.72014-2018 10.4
Child deaths ages 1-14 (per 100,000)
2009-2013 12.02014-2018 11.1
Child deaths ages 15-17 (per 100,000)
2009-2013 53.52014-2018 0.0
Unrestrained automobile fatalities for children under 18a
2009-2013 100.0%2014-2018 %
Substance abuse hospitalizations ages 1-19 (per 100,000)b
2008-2012 0
2013-2017 0
Mental/behavioral hospitalizations (not substance abuse) ages 1-19 (per 10,000)
2008-2012 60.8
2013-2017 67.7
Uninsured children2013 12.4%2017 8.2%
School attendance, grades 9-122014 94.9%2018 94.5%
Contextual IndicatorsCounty Seat: Paris
88Population: 8,654
2016
County Composite Rank
2020
48
Demographics
Total population2014 8,7072018 8,654
Child population under 182014 1,9952018 1,895
Children under 18 as % of total population
2014 22.5%2018 22.3%
Child population under 62014 5552018 600
Children under 6 as % of total population
2014 6.4%2018 6.9%
Minority child population under 18
2014 1542018 182
Minority child population under 18 as % of child population
2014 7.8%2018 9.6%
Minority child population under 6
2014 452018 58
Minority child population under 6 as % of under 6 child population
2014 8.1%
2018 9.7%
Children in single-parent families
2009-2013 24.8%2014-2018 36.2%
Children in married-parent families
2009-2013 74.5%2014-2018 63.3%
Economic Well-being
Children in poverty under 62014 26.4%2018 25.1%
Children in poverty, ages 5-172009-2013 22.4%2014-2018 21.5%
Housing cost-burdened households
2009-2013 22.8%2014-2018 22.2%
Family households with children under 18 at 185% of poverty level
2009-2013 37.8%
2014-2018 48.2%
Children in families receiving SNAP
2014 27.2%2018 25.6%
Median income family household with children under 18
2009-2013 $53,393
2014-2018 $47,222
Adult unemployment2014 6.6%2018 3.6%
Child homelessness2014 1.3%2018 0.0%
a If no % listed, no vehicle fatalities happened in the county during that period.b *Indicates unstable rate due to low count (<20 cases);** indicates very unstable rate due to very low count (<5 cases)

Outcome MeasuresNumber Rate Trend Rank
2014 2018 2014 2018 State Rate
County Rank
Economic Well-BeingChildren under 18 in poverty 637 524 24.5% 21.5% é 18.3% 50
Food insecurity for childrenb 670 490 23.5% 18.4% é 17.5% 47
HealthLow birthweight infantsa,c 51 44 7.1% 6.8% é 8.5% 23
Preventable hospitalizations for all causes for children under 18 (per 1,000)b,c
20 12 7.0 4.7 é 7.1 30
Child asthma ER rates (per 1,000)b
16 14 5.6 5.5 é 7.5 91
Family & CommunityBirths to teens, ages 15-19 (per 1,000)
11 5 34.8 16.1 é 21.6 18
Substantiated child abuse/neglect cases (per 1,000)a
25 8 8.9 3.2 é 4.0 26
EducationHigh school graduation 116 87 94.3% 88.8% ê 91.3% 100
Achievement proficiencya,d
3rd grade English/Language Arts (MAP) 32 32.3% 48.6%
8th grade English/Language Arts (MAP)
61 49.6% 49.0%
4th grade Math (MAP) 45 38.5% 45.8%
Algebra I (End of Course exam) 46 40.0% 47.0%
Trend: é better ê worse è no change
Montgomery CountyCounty Seat: Montgomery City
58Population: 11,545
2016
County Composite Rank
52
2020
a Outcome not included in County Composite Rank.b Data based on 2013 and 2017.c Data based on 5-year time spans, 2009-2013 and 2014-2018.d Achievement proficiency measures those that scored proficient or above on the MAP tests and Algebra I End of Course exam. Achievement data from 2014 are not shown due to differences in testing standards and assessments used in 2018; accordingly, no trend arrows or county ranks are shown.

Montgomery County
EducationLicensed child care capacity (per 1,000)
2014 52.12019 30.4
Accredited child care capacity as % of licensed capacity
2014 —2019 50.6%
School attendance, grades K-122014 95.6%2018 95.3%
Family & CommunityTeen unintentional deaths/homicides/suicides (per 100,000)
2009-2013 131.12014-2018 63.7
Single parent head-of-house-hold with children under 18
2009-2013 8.4%2014-2018 10.8%
Juvenile law violation referrals, ages 10-17 (per 1,000)
2014 33.12018 43.7
Annual high school dropout rate2014 1.3%2018 2.2%
Children entering/re-entering state custody (per 1,000)
2014 7.82018 7.1
Health
Infant mortality (per 1,000)2009-2013 7.02014-2018 1.6
Child deaths ages 1-17 (per 100,000)
2009-2013 28.22014-2018 15.2
Child deaths ages 1-14 (per 100,000)
2009-2013 25.62014-2018 15.4
Child deaths ages 15-17 (per 100,000)
2009-2013 41.92014-2018 0.0
Unrestrained automobile fatalities for children under 18a
2009-2013 50.0%2014-2018 %
Substance abuse hospitalizations ages 1-19 (per 100,000)b
2008-2012 0
2013-2017 30.8*
Mental/behavioral hospitalizations (not substance abuse) ages 1-19 (per 10,000)
2008-2012 118.1
2013-2017 148.3
Uninsured children2013 8.5%2017 6.5%
School attendance, grades 9-122014 95.5%2018 95%
Contextual IndicatorsCounty Seat: Montgomery City
58Population: 11,545
2016
County Composite Rank
2020
52
Demographics
Total population2014 11,8412018 11,545
Child population under 182014 2,8022018 2,530
Children under 18 as % of total population
2014 22.7%2018 22.7%
Child population under 62014 8322018 760
Children under 6 as % of total population
2014 7.0%2018 6.6%
Minority child population under 18
2014 1442018 159
Minority child population under 18 as % of child population
2014 5.4%2018 6.3%
Minority child population under 6
2014 402018 45
Minority child population under 6 as % of under 6 child population
2014 4.8%
2018 5.9%
Children in single-parent families
2009-2013 33.2%2014-2018 36.8%
Children in married-parent families
2009-2013 62.8%2014-2018 59.7%
Economic Well-being
Children in poverty under 62014 27.5%2018 21.3%
Children in poverty, ages 5-172009-2013 22.9%2014-2018 20.5%
Housing cost-burdened households
2009-2013 29.2%2014-2018 22.9%
Family households with children under 18 at 185% of poverty level
2009-2013 46.8%
2014-2018 47.5%
Children in families receiving SNAP
2014 37.6%2018 33.6%
Median income family household with children under 18
2009-2013 $48,621
2014-2018 $48,375
Adult unemployment2014 6.0%2018 2.9%
Child homelessness2014 0.0%2018 2.7%
a If no % listed, no vehicle fatalities happened in the county during that period.b *Indicates unstable rate due to low count (<20 cases);** indicates very unstable rate due to very low count (<5 cases)

Outcome MeasuresNumber Rate Trend Rank
2014 2018 2014 2018 State Rate
County Rank
Economic Well-BeingChildren under 18 in poverty 1,375 1,185 31.5% 26.0% é 18.3% 84
Food insecurity for childrenb 1,160 1,040 26.6% 23.5% é 17.5% 106
HealthLow birthweight infantsa,c 86 94 6.9% 6.9% è 8.5% 26
Preventable hospitalizations for all causes for children under 18 (per 1,000)b,c
22 26 5.0 5.7 ê 7.1 49
Child asthma ER rates (per 1,000)b
19 11 4.3 2.4 é 7.5 29
Family & CommunityBirths to teens, ages 15-19 (per 1,000)
17 11 32.2 18.9 é 21.6 28
Substantiated child abuse/neglect cases (per 1,000)a
65 60 14.6 12.9 é 4.0 108
EducationHigh school graduation 143 113 97.3% 100.0% é 91.3% 1
Achievement proficiencya,d
3rd grade English/Language Arts (MAP) 49 36.0% 48.6%
8th grade English/Language Arts (MAP)
51 33.8% 49.0%
4th grade Math (MAP) 57 34.3% 45.8%
Algebra I (End of Course exam) 24 21.2% 47.0%
Trend: é better ê worse è no change
Morgan CountyCounty Seat: Versailles
40Population: 20,137
2016
County Composite Rank
57
2020
a Outcome not included in County Composite Rank.b Data based on 2013 and 2017.c Data based on 5-year time spans, 2009-2013 and 2014-2018.d Achievement proficiency measures those that scored proficient or above on the MAP tests and Algebra I End of Course exam. Achievement data from 2014 are not shown due to differences in testing standards and assessments used in 2018; accordingly, no trend arrows or county ranks are shown.

Morgan County
EducationLicensed child care capacity (per 1,000)
2014 40.92019 36.9
Accredited child care capacity as % of licensed capacity
2014 —2019 0.0%
School attendance, grades K-122014 94.4%2018 93.9%
Family & CommunityTeen unintentional deaths/homicides/suicides (per 100,000)
2009-2013 65.12014-2018 16.7
Single parent head-of-house-hold with children under 18
2009-2013 7.7%2014-2018 7.0%
Juvenile law violation referrals, ages 10-17 (per 1,000)
2014 26.62018 14.2
Annual high school dropout rate2014 0.3%2018 0.0%
Children entering/re-entering state custody (per 1,000)
2014 4.02018 5.2
Health
Infant mortality (per 1,000)2009-2013 4.82014-2018 5.2
Child deaths ages 1-17 (per 100,000)
2009-2013 32.02014-2018 30.8
Child deaths ages 1-14 (per 100,000)
2009-2013 16.32014-2018 27.7
Child deaths ages 15-17 (per 100,000)
2009-2013 98.32014-2018 24.7
Unrestrained automobile fatalities for children under 18a
2009-2013 0.0%2014-2018 %
Substance abuse hospitalizations ages 1-19 (per 100,000)b
2008-2012 18.3*
2013-2017 18.6*
Mental/behavioral hospitalizations (not substance abuse) ages 1-19 (per 10,000)
2008-2012 72.6
2013-2017 83.3
Uninsured children2013 12.0%2017 12.0%
School attendance, grades 9-122014 93.4%2018 93.9%
Contextual IndicatorsCounty Seat: Versailles
40Population: 20,137
2016
County Composite Rank
2020
57
Demographics
Total population2014 20,2402018 20,137
Child population under 182014 4,4472018 4,657
Children under 18 as % of total population
2014 22.0%2018 22.6%
Child population under 62014 1,4462018 1,546
Children under 6 as % of total population
2014 7.2%2018 7.6%
Minority child population under 18
2014 2792018 322
Minority child population under 18 as % of child population
2014 6.3%2018 6.9%
Minority child population under 6
2014 952018 111
Minority child population under 6 as % of under 6 child population
2014 6.6%
2018 7.2%
Children in single-parent families
2009-2013 26.6%2014-2018 27.8%
Children in married-parent families
2009-2013 72.5%2014-2018 72.1%
Economic Well-being
Children in poverty under 62014 28.0%2018 28.8%
Children in poverty, ages 5-172009-2013 29.4%2014-2018 24.6%
Housing cost-burdened households
2009-2013 32.9%2014-2018 28.0%
Family households with children under 18 at 185% of poverty level
2009-2013 51.9%
2014-2018 59.1%
Children in families receiving SNAP
2014 40.2%2018 36.9%
Median income family household with children under 18
2009-2013 $42,250
2014-2018 $40,273
Adult unemployment2014 8.5%2018 4.3%
Child homelessness2014 3.3%2018 7.1%
a If no % listed, no vehicle fatalities happened in the county during that period.b *Indicates unstable rate due to low count (<20 cases);** indicates very unstable rate due to very low count (<5 cases)

Outcome MeasuresNumber Rate Trend Rank
2014 2018 2014 2018 State Rate
County Rank
Economic Well-BeingChildren under 18 in poverty 1,402 1,048 32.9% 26.6% é 18.3% 88
Food insecurity for childrenb 1,130 1,040 25.6% 24.6% é 17.5% 110
HealthLow birthweight infantsa,c 142 121 11.9% 10.8% é 8.5% 109
Preventable hospitalizations for all causes for children under 18 (per 1,000)b,c
67 40 15.2 9.9 é 7.1 105
Child asthma ER rates (per 1,000)b
20 22 4.5 5.4 ê 7.5 85
Family & CommunityBirths to teens, ages 15-19 (per 1,000)
35 17 60.9 34 é 21.6 84
Substantiated child abuse/neglect cases (per 1,000)a
41 30 9.4 7.5 é 4.0 85
EducationHigh school graduation 167 143 95.4% 94.1% ê 91.3% 53
Achievement proficiencya,d
3rd grade English/Language Arts (MAP) 77 41.2% 48.6%
8th grade English/Language Arts (MAP)
80 44.0% 49.0%
4th grade Math (MAP) 85 40.5% 45.8%
Algebra I (End of Course exam) 53 27.5% 47.0%
Trend: é better ê worse è no change
New Madrid CountyCounty Seat: New Madrid
104Population: 17,811
2016
County Composite Rank
102
2020
a Outcome not included in County Composite Rank.b Data based on 2013 and 2017.c Data based on 5-year time spans, 2009-2013 and 2014-2018.d Achievement proficiency measures those that scored proficient or above on the MAP tests and Algebra I End of Course exam. Achievement data from 2014 are not shown due to differences in testing standards and assessments used in 2018; accordingly, no trend arrows or county ranks are shown.

New Madrid County
EducationLicensed child care capacity (per 1,000)
2014 76.72019 72.9
Accredited child care capacity as % of licensed capacity
2014 —2019 0.0%
School attendance, grades K-122014 95.3%2018 94.9%
Family & CommunityTeen unintentional deaths/homicides/suicides (per 100,000)
2009-2013 49.52014-2018 51.1
Single parent head-of-house-hold with children under 18
2009-2013 10.8%2014-2018 13.8%
Juvenile law violation referrals, ages 10-17 (per 1,000)
2014 60.12018 37.7
Annual high school dropout rate2014 0.5%2018 0.8%
Children entering/re-entering state custody (per 1,000)
2014 5.32018 15.7
Health
Infant mortality (per 1,000)2009-2013 10.92014-2018 10.7
Child deaths ages 1-17 (per 100,000)
2009-2013 54.62014-2018 9.6
Child deaths ages 1-14 (per 100,000)
2009-2013 43.72014-2018 9.9
Child deaths ages 15-17 (per 100,000)
2009-2013 104.62014-2018 0.0
Unrestrained automobile fatalities for children under 18a
2009-2013 50.0%2014-2018 %
Substance abuse hospitalizations ages 1-19 (per 100,000)b
2008-2012 14.3**
2013-2017 39.0*
Mental/behavioral hospitalizations (not substance abuse) ages 1-19 (per 10,000)
2008-2012 117.6
2013-2017 105.6
Uninsured children2013 6.5%2017 5.8%
School attendance, grades 9-122014 94.5%2018 94.3%
Contextual IndicatorsCounty Seat: New Madrid
104Population: 17,811
2016
County Composite Rank
2020
102
Demographics
Total population2014 18,2722018 17,811
Child population under 182014 4,3692018 4,008
Children under 18 as % of total population
2014 23.8%2018 23.4%
Child population under 62014 1,3452018 1,287
Children under 6 as % of total population
2014 7.4%2018 7.4%
Minority child population under 18
2014 1,1392018 1,051
Minority child population under 18 as % of child population
2014 26.2%2018 26.2%
Minority child population under 6
2014 3832018 360
Minority child population under 6 as % of under 6 child population
2014 28.5%
2018 28.0%
Children in single-parent families
2009-2013 47.2%2014-2018 51.8%
Children in married-parent families
2009-2013 51.5%2014-2018 47.4%
Economic Well-being
Children in poverty under 62014 42.1%2018 38.4%
Children in poverty, ages 5-172009-2013 29.6%2014-2018 23.7%
Housing cost-burdened households
2009-2013 28.3%2014-2018 26.5%
Family households with children under 18 at 185% of poverty level
2009-2013 51.6%
2014-2018 60.9%
Children in families receiving SNAP
2014 52.7%2018 52.0%
Median income family household with children under 18
2009-2013 $36,901
2014-2018 $33,547
Adult unemployment2014 7.3%2018 4.8%
Child homelessness2014 1.8%2018 1.6%
a If no % listed, no vehicle fatalities happened in the county during that period.b *Indicates unstable rate due to low count (<20 cases);** indicates very unstable rate due to very low count (<5 cases)

Outcome MeasuresNumber Rate Trend Rank
2014 2018 2014 2018 State Rate
County Rank
Economic Well-BeingChildren under 18 in poverty 2,853 3,029 20.4% 22.5% ê 18.3% 59
Food insecurity for childrenb 3,180 2,310 21.6% 16.4% é 17.5% 16
HealthLow birthweight infantsa,c 246 263 6.6% 7.4% ê 8.5% 42
Preventable hospitalizations for all causes for children under 18 (per 1,000)b,c
84 74 5.7 5.3 é 7.1 41
Child asthma ER rates (per 1,000)b
58 33 3.9 2.4 é 7.5 27
Family & CommunityBirths to teens, ages 15-19 (per 1,000)
71 71 37.2 38.2 ê 21.6 99
Substantiated child abuse/neglect cases (per 1,000)a
31 17 2.1 1.2 é 4.0 4
EducationHigh school graduation 533 498 90.8% 87.5% ê 91.3% 106
Achievement proficiencya,d
3rd grade English/Language Arts (MAP) 247 41.0% 48.6%
8th grade English/Language Arts (MAP)
246 39.4% 49.0%
4th grade Math (MAP) 225 33.9% 45.8%
Algebra I (End of Course exam) 244 48.0% 47.0%
Trend: é better ê worse è no change
Newton CountyCounty Seat: Neosho
72Population: 58,202
2016
County Composite Rank
41
2020
a Outcome not included in County Composite Rank.b Data based on 2013 and 2017.c Data based on 5-year time spans, 2009-2013 and 2014-2018.d Achievement proficiency measures those that scored proficient or above on the MAP tests and Algebra I End of Course exam. Achievement data from 2014 are not shown due to differences in testing standards and assessments used in 2018; accordingly, no trend arrows or county ranks are shown.

Newton County
EducationLicensed child care capacity (per 1,000)
2014 76.62019 75.1
Accredited child care capacity as % of licensed capacity
2014 —2019 12.1%
School attendance, grades K-122014 95.1%2018 94.8%
Family & CommunityTeen unintentional deaths/homicides/suicides (per 100,000)
2009-2013 80.72014-2018 69.9
Single parent head-of-house-hold with children under 18
2009-2013 9.6%2014-2018 7.0%
Juvenile law violation referrals, ages 10-17 (per 1,000)
2014 35.32018 42.5
Annual high school dropout rate2014 2.5%2018 2.8%
Children entering/re-entering state custody (per 1,000)
2014 18.32018 7.4
Health
Infant mortality (per 1,000)2009-2013 6.52014-2018 5.9
Child deaths ages 1-17 (per 100,000)
2009-2013 21.72014-2018 28.4
Child deaths ages 1-14 (per 100,000)
2009-2013 13.22014-2018 14.9
Child deaths ages 15-17 (per 100,000)
2009-2013 61.52014-2018 78.3
Unrestrained automobile fatalities for children under 18a
2009-2013 33.3%2014-2018 85.7%
Substance abuse hospitalizations ages 1-19 (per 100,000)b
2008-2012 24.9
2013-2017 13.7*
Mental/behavioral hospitalizations (not substance abuse) ages 1-19 (per 10,000)
2008-2012 33.1
2013-2017 43.2
Uninsured children2013 10.1%2017 7.7%
School attendance, grades 9-122014 94.4%2018 94.2%
Contextual IndicatorsCounty Seat: Neosho
72Population: 58,202
2016
County Composite Rank
2020
41
Demographics
Total population2014 58,5982018 58,202
Child population under 182014 14,5992018 13,796
Children under 18 as % of total population
2014 24.5%2018 24.2%
Child population under 62014 4,4442018 4,265
Children under 6 as % of total population
2014 7.6%2018 7.3%
Minority child population under 18
2014 2,5862018 2,665
Minority child population under 18 as % of child population
2014 18.0%2018 19.3%
Minority child population under 6
2014 8782018 917
Minority child population under 6 as % of under 6 child population
2014 19.8%
2018 21.5%
Children in single-parent families
2009-2013 24.3%2014-2018 24.3%
Children in married-parent families
2009-2013 75.0%2014-2018 75.1%
Economic Well-being
Children in poverty under 62014 27.3%2018 27.2%
Children in poverty, ages 5-172009-2013 18.9%2014-2018 21.6%
Housing cost-burdened households
2009-2013 27.3%2014-2018 23.6%
Family households with children under 18 at 185% of poverty level
2009-2013 42.6%
2014-2018 42.3%
Children in families receiving SNAP
2014 34.7%2018 34.2%
Median income family household with children under 18
2009-2013 $50,324
2014-2018 $53,688
Adult unemployment2014 5.3%2018 3.0%
Child homelessness2014 7.3%2018 5.6%
a If no % listed, no vehicle fatalities happened in the county during that period.b *Indicates unstable rate due to low count (<20 cases);** indicates very unstable rate due to very low count (<5 cases)

Outcome MeasuresNumber Rate Trend Rank
2014 2018 2014 2018 State Rate
County Rank
Economic Well-BeingChildren under 18 in poverty 645 463 17.4% 13.8% é 18.3% 15
Food insecurity for childrenb 970 720 23.3% 19.2% é 17.5% 61
HealthLow birthweight infantsa,c 64 77 5.5% 7.0% ê 8.5% 28
Preventable hospitalizations for all causes for children under 18 (per 1,000)b,c
28 30 6.8 8.2 ê 7.1 89
Child asthma ER rates (per 1,000)b
19 6 4.6 1.6 é 7.5 15
Family & CommunityBirths to teens, ages 15-19 (per 1,000)
7 5 4.8 3.5 é 21.6 3
Substantiated child abuse/neglect cases (per 1,000)a
23 17 5.7 4.8 é 4.0 59
EducationHigh school graduation 204 159 95.3% 96.4% é 91.3% 22
Achievement proficiencya,d
3rd grade English/Language Arts (MAP) 95 48.0% 48.6%
8th grade English/Language Arts (MAP)
96 47.5% 49.0%
4th grade Math (MAP) 93 47.7% 45.8%
Algebra I (End of Course exam) 95 44.8% 47.0%
Trend: é better ê worse è no change
Nodaway CountyCounty Seat: Maryville
12Population: 22,547
2016
County Composite Rank
10
2020
a Outcome not included in County Composite Rank.b Data based on 2013 and 2017.c Data based on 5-year time spans, 2009-2013 and 2014-2018.d Achievement proficiency measures those that scored proficient or above on the MAP tests and Algebra I End of Course exam. Achievement data from 2014 are not shown due to differences in testing standards and assessments used in 2018; accordingly, no trend arrows or county ranks are shown.

Nodaway County
EducationLicensed child care capacity (per 1,000)
2014 128.22019 158.3
Accredited child care capacity as % of licensed capacity
2014 —2019 13.9%
School attendance, grades K-122014 96.3%2018 95.6%
Family & CommunityTeen unintentional deaths/homicides/suicides (per 100,000)
2009-2013 14.42014-2018 46.9
Single parent head-of-house-hold with children under 18
2009-2013 6.5%2014-2018 7.1%
Juvenile law violation referrals, ages 10-17 (per 1,000)
2014 13.52018 30.7
Annual high school dropout rate2014 0.8%2018 0.1%
Children entering/re-entering state custody (per 1,000)
2014 7.92018 7.9
Health
Infant mortality (per 1,000)2009-2013 4.32014-2018 4.5
Child deaths ages 1-17 (per 100,000)
2009-2013 4.82014-2018 32.5
Child deaths ages 1-14 (per 100,000)
2009-2013 0.02014-2018 16.9
Child deaths ages 15-17 (per 100,000)
2009-2013 26.52014-2018 89.0
Unrestrained automobile fatalities for children under 18a
2009-2013 100.0%2014-2018 100%
Substance abuse hospitalizations ages 1-19 (per 100,000)b
2008-2012 2.9**
2013-2017 0
Mental/behavioral hospitalizations (not substance abuse) ages 1-19 (per 10,000)
2008-2012 46.8
2013-2017 63.4
Uninsured children2013 7.8%2017 5.7%
School attendance, grades 9-122014 95.5%2018 95%
Contextual IndicatorsCounty Seat: Maryville
12Population: 22,547
2016
County Composite Rank
2020
10
Demographics
Total population2014 23,0812018 22,547
Child population under 182014 4,0542018 3,537
Children under 18 as % of total population
2014 17.0%2018 16.4%
Child population under 62014 1,2902018 1,229
Children under 6 as % of total population
2014 5.6%2018 5.5%
Minority child population under 18
2014 2402018 226
Minority child population under 18 as % of child population
2014 6.1%2018 6.4%
Minority child population under 6
2014 712018 83
Minority child population under 6 as % of under 6 child population
2014 5.5%
2018 6.8%
Children in single-parent families
2009-2013 26.3%2014-2018 32.5%
Children in married-parent families
2009-2013 69.8%2014-2018 66.4%
Economic Well-being
Children in poverty under 62014 27.5%2018 27.2%
Children in poverty, ages 5-172009-2013 15.9%2014-2018 13.7%
Housing cost-burdened households
2009-2013 33.1%2014-2018 26.8%
Family households with children under 18 at 185% of poverty level
2009-2013 38.1%
2014-2018 43.8%
Children in families receiving SNAP
2014 22.6%2018 20.0%
Median income family household with children under 18
2009-2013 $56,853
2014-2018 $49,968
Adult unemployment2014 6.5%2018 2.9%
Child homelessness2014 0.0%2018 0.0%
a If no % listed, no vehicle fatalities happened in the county during that period.b *Indicates unstable rate due to low count (<20 cases);** indicates very unstable rate due to very low count (<5 cases)

Outcome MeasuresNumber Rate Trend Rank
2014 2018 2014 2018 State Rate
County Rank
Economic Well-BeingChildren under 18 in poverty 905 874 38.2% 37.7% é 18.3% 111
Food insecurity for childrenb 670 580 27.7% 24.1% é 17.5% 109
HealthLow birthweight infantsa,c 60 61 9.7% 9.8% ê 8.5% 104
Preventable hospitalizations for all causes for children under 18 (per 1,000)b,c
19 16 7.8 6.8 é 7.1 69
Child asthma ER rates (per 1,000)b
9 3 3.7 1.3 é 7.5 10
Family & CommunityBirths to teens, ages 15-19 (per 1,000)
16 12 51.8 36.9 é 21.6 95
Substantiated child abuse/neglect cases (per 1,000)a
14 49 5.6 20.6 ê 4.0 115
EducationHigh school graduation 133 132 95.7% 96.4% é 91.3% 22
Achievement proficiencya,d
3rd grade English/Language Arts (MAP) 50 40.3% 48.6%
8th grade English/Language Arts (MAP)
63 50.0% 49.0%
4th grade Math (MAP) 56 45.2% 45.8%
Algebra I (End of Course exam) 79 51.6% 47.0%
Trend: é better ê worse è no change
Oregon CountyCounty Seat: Alton
95Population: 10,699
2016
County Composite Rank
98
2020
a Outcome not included in County Composite Rank.b Data based on 2013 and 2017.c Data based on 5-year time spans, 2009-2013 and 2014-2018.d Achievement proficiency measures those that scored proficient or above on the MAP tests and Algebra I End of Course exam. Achievement data from 2014 are not shown due to differences in testing standards and assessments used in 2018; accordingly, no trend arrows or county ranks are shown.

Oregon County
EducationLicensed child care capacity (per 1,000)
2014 53.32019 52.6
Accredited child care capacity as % of licensed capacity
2014 —2019 0.0%
School attendance, grades K-122014 95.4%2018 95.1%
Family & CommunityTeen unintentional deaths/homicides/suicides (per 100,000)
2009-2013 81.72014-2018 31.2
Single parent head-of-house-hold with children under 18
2009-2013 5.2%2014-2018 7.4%
Juvenile law violation referrals, ages 10-17 (per 1,000)
2014 7.42018 7.3
Annual high school dropout rate2014 0.2%2018 0.3%
Children entering/re-entering state custody (per 1,000)
2014 4.12018 13.0
Health
Infant mortality (per 1,000)2009-2013 16.12014-2018 6.4
Child deaths ages 1-17 (per 100,000)
2009-2013 24.72014-2018 25.3
Child deaths ages 1-14 (per 100,000)
2009-2013 10.12014-2018 26.1
Child deaths ages 15-17 (per 100,000)
2009-2013 86.62014-2018 0.0
Unrestrained automobile fatalities for children under 18a
2009-2013 100.0%2014-2018 %
Substance abuse hospitalizations ages 1-19 (per 100,000)b
2008-2012 0
2013-2017 20.4**
Mental/behavioral hospitalizations (not substance abuse) ages 1-19 (per 10,000)
2008-2012 95.4
2013-2017 85.2
Uninsured children2013 9.9%2017 7.2%
School attendance, grades 9-122014 95.0%2018 94.7%
Contextual IndicatorsCounty Seat: Alton
95Population: 10,699
2016
County Composite Rank
2020
98
Demographics
Total population2014 10,9112018 10,699
Child population under 182014 2,4832018 2,378
Children under 18 as % of total population
2014 22.3%2018 22.2%
Child population under 62014 8132018 758
Children under 6 as % of total population
2014 7.5%2018 7.2%
Minority child population under 18
2014 1652018 148
Minority child population under 18 as % of child population
2014 6.8%2018 6.2%
Minority child population under 6
2014 832018 50
Minority child population under 6 as % of under 6 child population
2014 10.2%
2018 6.6%
Children in single-parent families
2009-2013 31.0%2014-2018 33.6%
Children in married-parent families
2009-2013 68.3%2014-2018 64.9%
Economic Well-being
Children in poverty under 62014 34.7%2018 40.5%
Children in poverty, ages 5-172009-2013 35.3%2014-2018 35.1%
Housing cost-burdened households
2009-2013 31.0%2014-2018 29.6%
Family households with children under 18 at 185% of poverty level
2009-2013 61.6%
2014-2018 60.2%
Children in families receiving SNAP
2014 51.9%2018 50.3%
Median income family household with children under 18
2009-2013 $35,700
2014-2018 $41,313
Adult unemployment2014 7.4%2018 3.5%
Child homelessness2014 0.6%2018 0.8%
a If no % listed, no vehicle fatalities happened in the county during that period.b *Indicates unstable rate due to low count (<20 cases);** indicates very unstable rate due to very low count (<5 cases)

Outcome MeasuresNumber Rate Trend Rank
2014 2018 2014 2018 State Rate
County Rank
Economic Well-BeingChildren under 18 in poverty 414 316 13.0% 10.1% é 18.3% 4
Food insecurity for childrenb 570 430 16.6% 13.5% é 17.5% 2
HealthLow birthweight infantsa,c 54 59 6.9% 7.7% ê 8.5% 48
Preventable hospitalizations for all causes for children under 18 (per 1,000)b,c
18 11 5.3 3.5 é 7.1 11
Child asthma ER rates (per 1,000)b
8 7 2.3 2.2 é 7.5 24
Family & CommunityBirths to teens, ages 15-19 (per 1,000)
10 2 23.6 4.8 é 21.6 4
Substantiated child abuse/neglect cases (per 1,000)a
10 5 3.0 1.6 é 4.0 6
EducationHigh school graduation 152 126 96.2% 94.7% ê 91.3% 43
Achievement proficiencya,d
3rd grade English/Language Arts (MAP) 49 49.0% 48.6%
8th grade English/Language Arts (MAP)
65 60.2% 49.0%
4th grade Math (MAP) 49 51.0% 45.8%
Algebra I (End of Course exam) 94 57.0% 47.0%
Trend: é better ê worse è no change
Osage CountyCounty Seat: Linn
1Population: 13,619
2016
County Composite Rank
1
2020
a Outcome not included in County Composite Rank.b Data based on 2013 and 2017.c Data based on 5-year time spans, 2009-2013 and 2014-2018.d Achievement proficiency measures those that scored proficient or above on the MAP tests and Algebra I End of Course exam. Achievement data from 2014 are not shown due to differences in testing standards and assessments used in 2018; accordingly, no trend arrows or county ranks are shown.

Osage County
EducationLicensed child care capacity (per 1,000)
2014 181.22019 184.2
Accredited child care capacity as % of licensed capacity
2014 —2019 6.0%
School attendance, grades K-122014 96.0%2018 95.9%
Family & CommunityTeen unintentional deaths/homicides/suicides (per 100,000)
2009-2013 19.92014-2018 21.5
Single parent head-of-house-hold with children under 18
2009-2013 8.0%2014-2018 4.5%
Juvenile law violation referrals, ages 10-17 (per 1,000)
2014 3.92018 5.9
Annual high school dropout rate2014 0.5%2018 0.4%
Children entering/re-entering state custody (per 1,000)
2014 3.42018 1.3
Health
Infant mortality (per 1,000)2009-2013 12.92014-2018 1.3
Child deaths ages 1-17 (per 100,000)
2009-2013 11.72014-2018 31.6
Child deaths ages 1-14 (per 100,000)
2009-2013 14.42014-2018 26.6
Child deaths ages 15-17 (per 100,000)
2009-2013 0.02014-2018 36.5
Unrestrained automobile fatalities for children under 18a
2009-2013 %2014-2018 %
Substance abuse hospitalizations ages 1-19 (per 100,000)b
2008-2012 9.1**
2013-2017 15.2**
Mental/behavioral hospitalizations (not substance abuse) ages 1-19 (per 10,000)
2008-2012 35.2
2013-2017 43.7
Uninsured children2013 9.3%2017 5.6%
School attendance, grades 9-122014 96.0%2018 96.1%
Contextual IndicatorsCounty Seat: Linn
1Population: 13,619
2016
County Composite Rank
2020
1
Demographics
Total population2014 13,7032018 13,619
Child population under 182014 3,3562018 3,171
Children under 18 as % of total population
2014 23.6%2018 23.2%
Child population under 62014 9482018 987
Children under 6 as % of total population
2014 6.9%2018 7.2%
Minority child population under 18
2014 732018 99
Minority child population under 18 as % of child population
2014 2.3%2018 3.1%
Minority child population under 6
2014 292018 39
Minority child population under 6 as % of under 6 child population
2014 3.1%
2018 4.0%
Children in single-parent families
2009-2013 21.1%2014-2018 14.1%
Children in married-parent families
2009-2013 78.2%2014-2018 85.4%
Economic Well-being
Children in poverty under 62014 21.7%2018 19.2%
Children in poverty, ages 5-172009-2013 11.7%2014-2018 9.4%
Housing cost-burdened households
2009-2013 15.4%2014-2018 12.1%
Family households with children under 18 at 185% of poverty level
2009-2013 28.8%
2014-2018 22.3%
Children in families receiving SNAP
2014 16.6%2018 14.7%
Median income family household with children under 18
2009-2013 $60,779
2014-2018 $78,321
Adult unemployment2014 4.6%2018 2.4%
Child homelessness2014 0.0%2018 0.0%
a If no % listed, no vehicle fatalities happened in the county during that period.b *Indicates unstable rate due to low count (<20 cases);** indicates very unstable rate due to very low count (<5 cases)

Outcome MeasuresNumber Rate Trend Rank
2014 2018 2014 2018 State Rate
County Rank
Economic Well-BeingChildren under 18 in poverty 640 548 35.0% 33.2% é 18.3% 102
Food insecurity for childrenb 470 460 25.7% 25.2% é 17.5% 112
HealthLow birthweight infantsa,c 46 39 10.7% 9.2% é 8.5% 95
Preventable hospitalizations for all causes for children under 18 (per 1,000)b,c
15 4 8.2 2.3 é 7.1 3
Child asthma ER rates (per 1,000)b
3 1 1.6 0.6 é 7.5 4
Family & CommunityBirths to teens, ages 15-19 (per 1,000)
6 5 25.6 21.9 é 21.6 39
Substantiated child abuse/neglect cases (per 1,000)a
12 22 6.5 13.0 ê 4.0 109
EducationHigh school graduation 120 110 98.4% 96.5% ê 91.3% 21
Achievement proficiencya,d
3rd grade English/Language Arts (MAP) 57 49.6% 48.6%
8th grade English/Language Arts (MAP)
59 48.0% 49.0%
4th grade Math (MAP) 63 57.3% 45.8%
Algebra I (End of Course exam) 28 25.7% 47.0%
Trend: é better ê worse è no change
Ozark CountyCounty Seat: Gainesville
51Population: 9,236
2016
County Composite Rank
46
2020
a Outcome not included in County Composite Rank.b Data based on 2013 and 2017.c Data based on 5-year time spans, 2009-2013 and 2014-2018.d Achievement proficiency measures those that scored proficient or above on the MAP tests and Algebra I End of Course exam. Achievement data from 2014 are not shown due to differences in testing standards and assessments used in 2018; accordingly, no trend arrows or county ranks are shown.

Ozark County
EducationLicensed child care capacity (per 1,000)
2014 37.52019 46.7
Accredited child care capacity as % of licensed capacity
2014 —2019 0.0%
School attendance, grades K-122014 95.3%2018 95.8%
Family & CommunityTeen unintentional deaths/homicides/suicides (per 100,000)
2009-2013 110.72014-2018 0.0
Single parent head-of-house-hold with children under 18
2009-2013 7.2%2014-2018 5.5%
Juvenile law violation referrals, ages 10-17 (per 1,000)
2014 15.52018 10.5
Annual high school dropout rate2014 0.4%2018 0.0%
Children entering/re-entering state custody (per 1,000)
2014 5.92018 5.9
Health
Infant mortality (per 1,000)2009-2013 7.02014-2018 4.7
Child deaths ages 1-17 (per 100,000)
2009-2013 32.62014-2018 55.1
Child deaths ages 1-14 (per 100,000)
2009-2013 12.82014-2018 47.9
Child deaths ages 15-17 (per 100,000)
2009-2013 59.22014-2018 56.3
Unrestrained automobile fatalities for children under 18a
2009-2013 50.0%2014-2018 100%
Substance abuse hospitalizations ages 1-19 (per 100,000)b
2008-2012 8.7**
2013-2017 18.3**
Mental/behavioral hospitalizations (not substance abuse) ages 1-19 (per 10,000)
2008-2012 46.0
2013-2017 46.6
Uninsured children2013 12.0%2017 7.7%
School attendance, grades 9-122014 94.9%2018 95.6%
Contextual IndicatorsCounty Seat: Gainesville
51Population: 9,236
2016
County Composite Rank
2020
46
Demographics
Total population2014 9,4922018 9,236
Child population under 182014 1,8392018 1,693
Children under 18 as % of total population
2014 19.6%2018 19.7%
Child population under 62014 5372018 458
Children under 6 as % of total population
2014 5.7%2018 5.1%
Minority child population under 18
2014 872018 90
Minority child population under 18 as % of child population
2014 4.7%2018 5.3%
Minority child population under 6
2014 262018 24
Minority child population under 6 as % of under 6 child population
2014 4.8%
2018 5.2%
Children in single-parent families
2009-2013 36.8%2014-2018 27.7%
Children in married-parent families
2009-2013 61.7%2014-2018 68.4%
Economic Well-being
Children in poverty under 62014 34.8%2018 40.7%
Children in poverty, ages 5-172009-2013 31.8%2014-2018 30.2%
Housing cost-burdened households
2009-2013 25.5%2014-2018 28.3%
Family households with children under 18 at 185% of poverty level
2009-2013 55.4%
2014-2018 60.4%
Children in families receiving SNAP
2014 47.0%2018 47.1%
Median income family household with children under 18
2009-2013 $34,511
2014-2018 $34,716
Adult unemployment2014 8.7%2018 5.2%
Child homelessness2014 0.0%2018 1.7%
a If no % listed, no vehicle fatalities happened in the county during that period.b *Indicates unstable rate due to low count (<20 cases);** indicates very unstable rate due to very low count (<5 cases)
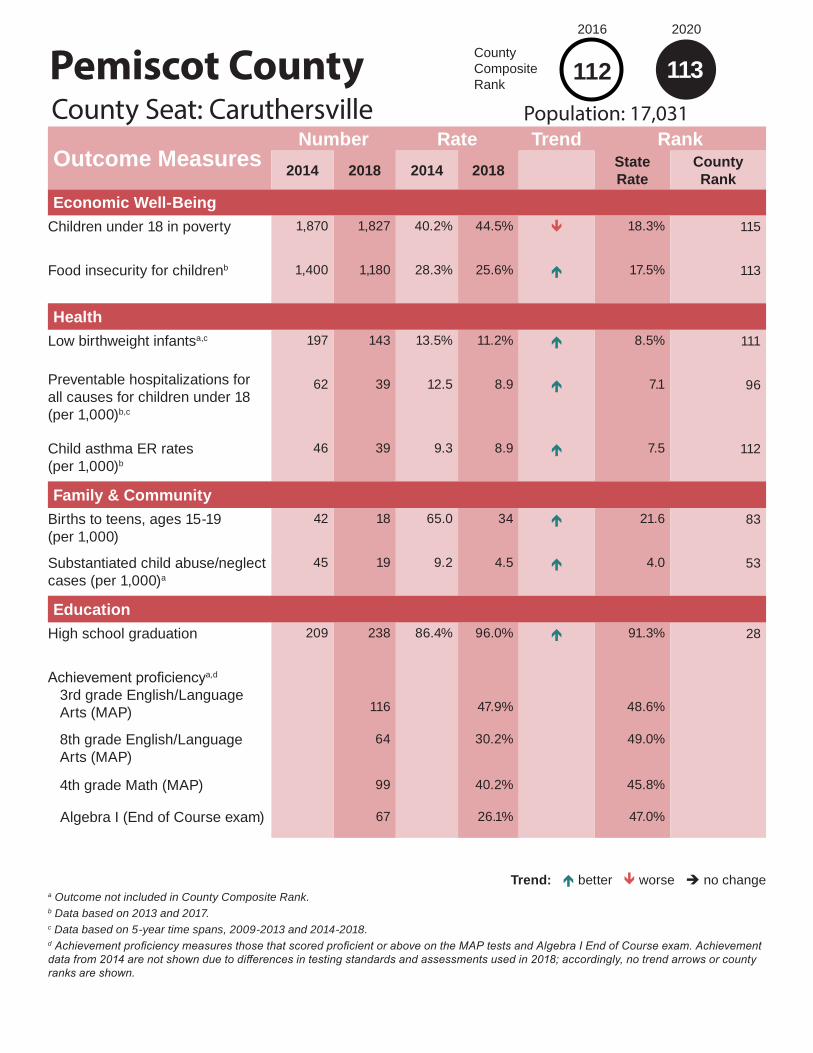
Outcome MeasuresNumber Rate Trend Rank
2014 2018 2014 2018 State Rate
County Rank
Economic Well-BeingChildren under 18 in poverty 1,870 1,827 40.2% 44.5% ê 18.3% 115
Food insecurity for childrenb 1,400 1,180 28.3% 25.6% é 17.5% 113
HealthLow birthweight infantsa,c 197 143 13.5% 11.2% é 8.5% 111
Preventable hospitalizations for all causes for children under 18 (per 1,000)b,c
62 39 12.5 8.9 é 7.1 96
Child asthma ER rates (per 1,000)b
46 39 9.3 8.9 é 7.5 112
Family & CommunityBirths to teens, ages 15-19 (per 1,000)
42 18 65.0 34 é 21.6 83
Substantiated child abuse/neglect cases (per 1,000)a
45 19 9.2 4.5 é 4.0 53
EducationHigh school graduation 209 238 86.4% 96.0% é 91.3% 28
Achievement proficiencya,d
3rd grade English/Language Arts (MAP) 116 47.9% 48.6%
8th grade English/Language Arts (MAP)
64 30.2% 49.0%
4th grade Math (MAP) 99 40.2% 45.8%
Algebra I (End of Course exam) 67 26.1% 47.0%
Trend: é better ê worse è no change
Pemiscot CountyCounty Seat: Caruthersville
113Population: 17,031
2016
County Composite Rank
112
2020
a Outcome not included in County Composite Rank.b Data based on 2013 and 2017.c Data based on 5-year time spans, 2009-2013 and 2014-2018.d Achievement proficiency measures those that scored proficient or above on the MAP tests and Algebra I End of Course exam. Achievement data from 2014 are not shown due to differences in testing standards and assessments used in 2018; accordingly, no trend arrows or county ranks are shown.

Pemiscot County
EducationLicensed child care capacity (per 1,000)
2014 97.42019 97.1
Accredited child care capacity as % of licensed capacity
2014 —2019 3.7%
School attendance, grades K-122014 94.6%2018 94.1%
Family & CommunityTeen unintentional deaths/homicides/suicides (per 100,000)
2009-2013 59.12014-2018 67.1
Single parent head-of-house-hold with children under 18
2009-2013 14.4%2014-2018 13.6%
Juvenile law violation referrals, ages 10-17 (per 1,000)
2014 12.72018 64.4
Annual high school dropout rate2014 1.5%2018 0.7%
Children entering/re-entering state custody (per 1,000)
2014 11.02018 23.2
Health
Infant mortality (per 1,000)2009-2013 13.02014-2018 15.7
Child deaths ages 1-17 (per 100,000)
2009-2013 24.22014-2018 17.9
Child deaths ages 1-14 (per 100,000)
2009-2013 14.62014-2018 14.0
Child deaths ages 15-17 (per 100,000)
2009-2013 69.02014-2018 25.4
Unrestrained automobile fatalities for children under 18a
2009-2013 100.0%2014-2018 %
Substance abuse hospitalizations ages 1-19 (per 100,000)b
2008-2012 44.5*
2013-2017 49.7*
Mental/behavioral hospitalizations (not substance abuse) ages 1-19 (per 10,000)
2008-2012 198.5
2013-2017 142.4
Uninsured children2013 5.4%2017 4.4%
School attendance, grades 9-122014 94.4%2018 93.4%
Contextual IndicatorsCounty Seat: Caruthersville
113Population: 17,031
2016
County Composite Rank
2020
112
Demographics
Total population2014 17,6502018 17,031
Child population under 182014 4,8892018 4,183
Children under 18 as % of total population
2014 26.8%2018 26.3%
Child population under 62014 1,5892018 1,437
Children under 6 as % of total population
2014 9.0%2018 8.8%
Minority child population under 18
2014 1,9502018 1,718
Minority child population under 18 as % of child population
2014 41.3%2018 41.1%
Minority child population under 6
2014 7242018 632
Minority child population under 6 as % of under 6 child population
2014 45.6%
2018 44.0%
Children in single-parent families
2009-2013 55.5%2014-2018 53.2%
Children in married-parent families
2009-2013 41.9%2014-2018 45.6%
Economic Well-being
Children in poverty under 62014 42.1%2018 38.3%
Children in poverty, ages 5-172009-2013 39.8%2014-2018 40.9%
Housing cost-burdened households
2009-2013 37.5%2014-2018 30.4%
Family households with children under 18 at 185% of poverty level
2009-2013 59.5%
2014-2018 59.1%
Children in families receiving SNAP
2014 69.6%2018 70.9%
Median income family household with children under 18
2009-2013 $28,500
2014-2018 $37,773
Adult unemployment2014 9.0%2018 5.5%
Child homelessness2014 0.8%2018 0.0%
a If no % listed, no vehicle fatalities happened in the county during that period.b *Indicates unstable rate due to low count (<20 cases);** indicates very unstable rate due to very low count (<5 cases)

Outcome MeasuresNumber Rate Trend Rank
2014 2018 2014 2018 State Rate
County Rank
Economic Well-BeingChildren under 18 in poverty 729 648 16.3% 14.9% é 18.3% 20
Food insecurity for childrenb 950 650 20.2% 14.1% é 17.5% 5
HealthLow birthweight infantsa,c 84 69 7.5% 6.3% é 8.5% 10
Preventable hospitalizations for all causes for children under 18 (per 1,000)b,c
31 20 6.6 4.4 é 7.1 23
Child asthma ER rates (per 1,000)b
17 12 3.6 2.7 é 7.5 36
Family & CommunityBirths to teens, ages 15-19 (per 1,000)
20 11 32.7 20.2 é 21.6 31
Substantiated child abuse/neglect cases (per 1,000)a
20 29 4.3 6.5 ê 4.0 72
EducationHigh school graduation 183 193 91.0% 87.3% ê 91.3% 108
Achievement proficiencya,d
3rd grade English/Language Arts (MAP) 88 51.2% 48.6%
8th grade English/Language Arts (MAP)
100 60.6% 49.0%
4th grade Math (MAP) 66 35.9% 45.8%
Algebra I (End of Course exam) 74 38.7% 47.0%
Trend: é better ê worse è no change
Perry CountyCounty Seat: Perryville
21Population: 19,146
2016
County Composite Rank
32
2020
a Outcome not included in County Composite Rank.b Data based on 2013 and 2017.c Data based on 5-year time spans, 2009-2013 and 2014-2018.d Achievement proficiency measures those that scored proficient or above on the MAP tests and Algebra I End of Course exam. Achievement data from 2014 are not shown due to differences in testing standards and assessments used in 2018; accordingly, no trend arrows or county ranks are shown.

Perry County
EducationLicensed child care capacity (per 1,000)
2014 145.72019 133.3
Accredited child care capacity as % of licensed capacity
2014 —2019 18.8%
School attendance, grades K-122014 95.0%2018 95.4%
Family & CommunityTeen unintentional deaths/homicides/suicides (per 100,000)
2009-2013 47.92014-2018 68.1
Single parent head-of-house-hold with children under 18
2009-2013 8.0%2014-2018 8.4%
Juvenile law violation referrals, ages 10-17 (per 1,000)
2014 26.62018 15.6
Annual high school dropout rate2014 3.0%2018 3.2%
Children entering/re-entering state custody (per 1,000)
2014 3.72018 6.5
Health
Infant mortality (per 1,000)2009-2013 2.72014-2018 2.7
Child deaths ages 1-17 (per 100,000)
2009-2013 12.72014-2018 4.4
Child deaths ages 1-14 (per 100,000)
2009-2013 0.02014-2018 0.0
Child deaths ages 15-17 (per 100,000)
2009-2013 74.82014-2018 25.8
Unrestrained automobile fatalities for children under 18a
2009-2013 100.0%2014-2018 50%
Substance abuse hospitalizations ages 1-19 (per 100,000)b
2008-2012 13.8**
2013-2017 14.4**
Mental/behavioral hospitalizations (not substance abuse) ages 1-19 (per 10,000)
2008-2012 57.0
2013-2017 61.2
Uninsured children2013 7.9%2017 4.4%
School attendance, grades 9-122014 93.7%2018 94.8%
Contextual IndicatorsCounty Seat: Perryville
21Population: 19,146
2016
County Composite Rank
2020
32
Demographics
Total population2014 19,2022018 19,146
Child population under 182014 4,6882018 4,470
Children under 18 as % of total population
2014 24.1%2018 24.0%
Child population under 62014 1,3902018 1,362
Children under 6 as % of total population
2014 7.2%2018 7.1%
Minority child population under 18
2014 2822018 318
Minority child population under 18 as % of child population
2014 6.1%2018 7.1%
Minority child population under 6
2014 1092018 113
Minority child population under 6 as % of under 6 child population
2014 7.8%
2018 8.3%
Children in single-parent families
2009-2013 26.8%2014-2018 25.9%
Children in married-parent families
2009-2013 71.9%2014-2018 72.2%
Economic Well-being
Children in poverty under 62014 32.7%2018 24.8%
Children in poverty, ages 5-172009-2013 14.9%2014-2018 13.3%
Housing cost-burdened households
2009-2013 24.5%2014-2018 22.9%
Family households with children under 18 at 185% of poverty level
2009-2013 35.1%
2014-2018 37.3%
Children in families receiving SNAP
2014 25.8%2018 24.3%
Median income family household with children under 18
2009-2013 $58,998
2014-2018 $65,013
Adult unemployment2014 5.4%2018 2.3%
Child homelessness2014 0.5%2018 2.3%
a If no % listed, no vehicle fatalities happened in the county during that period.b *Indicates unstable rate due to low count (<20 cases);** indicates very unstable rate due to very low count (<5 cases)

Outcome MeasuresNumber Rate Trend Rank
2014 2018 2014 2018 State Rate
County Rank
Economic Well-BeingChildren under 18 in poverty 2,700 2,365 26.4% 23.3% é 18.3% 67
Food insecurity for childrenb 2,360 1,960 22.1% 18.5% é 17.5% 49
HealthLow birthweight infantsa,c 199 196 6.8% 6.7% é 8.5% 22
Preventable hospitalizations for all causes for children under 18 (per 1,000)b,c
83 75 7.8 7.1 é 7.1 70
Child asthma ER rates (per 1,000)b
40 35 3.7 3.3 é 7.5 54
Family & CommunityBirths to teens, ages 15-19 (per 1,000)
67 52 48.7 37.8 é 21.6 96
Substantiated child abuse/neglect cases (per 1,000)a
65 39 6.1 3.7 é 4.0 37
EducationHigh school graduation 414 463 96.1% 95.5% ê 91.3% 34
Achievement proficiencya,d
3rd grade English/Language Arts (MAP) 278 52.1% 48.6%
8th grade English/Language Arts (MAP)
198 41.2% 49.0%
4th grade Math (MAP) 265 48.7% 45.8%
Algebra I (End of Course exam) 216 43.9% 47.0%
Trend: é better ê worse è no change
Pettis CountyCounty Seat: Sedalia
65Population: 42,371
2016
County Composite Rank
51
2020
a Outcome not included in County Composite Rank.b Data based on 2013 and 2017.c Data based on 5-year time spans, 2009-2013 and 2014-2018.d Achievement proficiency measures those that scored proficient or above on the MAP tests and Algebra I End of Course exam. Achievement data from 2014 are not shown due to differences in testing standards and assessments used in 2018; accordingly, no trend arrows or county ranks are shown.

Pettis County
EducationLicensed child care capacity (per 1,000)
2014 185.62019 140.9
Accredited child care capacity as % of licensed capacity
2014 —2019 3.3%
School attendance, grades K-122014 94.8%2018 94.9%
Family & CommunityTeen unintentional deaths/homicides/suicides (per 100,000)
2009-2013 28.12014-2018 64.2
Single parent head-of-house-hold with children under 18
2009-2013 7.8%2014-2018 10.5%
Juvenile law violation referrals, ages 10-17 (per 1,000)
2014 56.62018 35.6
Annual high school dropout rate2014 0.4%2018 0.5%
Children entering/re-entering state custody (per 1,000)
2014 7.02018 4.4
Health
Infant mortality (per 1,000)2009-2013 4.82014-2018 4.5
Child deaths ages 1-17 (per 100,000)
2009-2013 26.22014-2018 24.6
Child deaths ages 1-14 (per 100,000)
2009-2013 26.72014-2018 9.7
Child deaths ages 15-17 (per 100,000)
2009-2013 23.32014-2018 89.6
Unrestrained automobile fatalities for children under 18a
2009-2013 100.0%2014-2018 100%
Substance abuse hospitalizations ages 1-19 (per 100,000)b
2008-2012 11.9*
2013-2017 15.3*
Mental/behavioral hospitalizations (not substance abuse) ages 1-19 (per 10,000)
2008-2012 82.0
2013-2017 121.9
Uninsured children2013 9.0%2017 6.0%
School attendance, grades 9-122014 93.0%2018 94.2%
Contextual IndicatorsCounty Seat: Sedalia
65Population: 42,371
2016
County Composite Rank
2020
51
Demographics
Total population2014 42,2252018 42,371
Child population under 182014 10,6732018 10,466
Children under 18 as % of total population
2014 25.1%2018 24.9%
Child population under 62014 3,5052018 3,388
Children under 6 as % of total population
2014 8.3%2018 8.0%
Minority child population under 18
2014 2,2322018 2,321
Minority child population under 18 as % of child population
2014 21.1%2018 22.2%
Minority child population under 6
2014 8082018 746
Minority child population under 6 as % of under 6 child population
2014 23.1%
2018 22.0%
Children in single-parent families
2009-2013 25.3%2014-2018 32.9%
Children in married-parent families
2009-2013 74.1%2014-2018 64.9%
Economic Well-being
Children in poverty under 62014 28.9%2018 25.8%
Children in poverty, ages 5-172009-2013 24.9%2014-2018 21.1%
Housing cost-burdened households
2009-2013 32.1%2014-2018 25.2%
Family households with children under 18 at 185% of poverty level
2009-2013 51.4%
2014-2018 43.8%
Children in families receiving SNAP
2014 41.4%2018 39.4%
Median income family household with children under 18
2009-2013 $46,017
2014-2018 $50,348
Adult unemployment2014 6.1%2018 4.1%
Child homelessness2014 13.9%2018 13.3%
a If no % listed, no vehicle fatalities happened in the county during that period.b *Indicates unstable rate due to low count (<20 cases);** indicates very unstable rate due to very low count (<5 cases)

Outcome MeasuresNumber Rate Trend Rank
2014 2018 2014 2018 State Rate
County Rank
Economic Well-BeingChildren under 18 in poverty 2,377 1,952 26.1% 21.8% é 18.3% 53
Food insecurity for childrenb 2,100 1,710 21.6% 18.1% é 17.5% 39
HealthLow birthweight infantsa,c 204 203 7.5% 8.2% ê 8.5% 63
Preventable hospitalizations for all causes for children under 18 (per 1,000)b,c
91 44 9.4 4.7 é 7.1 28
Child asthma ER rates (per 1,000)b
55 39 5.7 4.2 é 7.5 71
Family & CommunityBirths to teens, ages 15-19 (per 1,000)
39 26 26.8 17.9 é 21.6 24
Substantiated child abuse/neglect cases (per 1,000)a
47 42 4.9 4.5 é 4.0 52
EducationHigh school graduation 446 430 89.6% 89.4% ê 91.3% 99
Achievement proficiencya,d
3rd grade English/Language Arts (MAP) 265 57.1% 48.6%
8th grade English/Language Arts (MAP)
272 54.9% 49.0%
4th grade Math (MAP) 264 49.8% 45.8%
Algebra I (End of Course exam) 183 35.3% 47.0%
Trend: é better ê worse è no change
Phelps CountyCounty Seat: Rolla
46Population: 44,789
2016
County Composite Rank
66
2020
a Outcome not included in County Composite Rank.b Data based on 2013 and 2017.c Data based on 5-year time spans, 2009-2013 and 2014-2018.d Achievement proficiency measures those that scored proficient or above on the MAP tests and Algebra I End of Course exam. Achievement data from 2014 are not shown due to differences in testing standards and assessments used in 2018; accordingly, no trend arrows or county ranks are shown.

Phelps County
EducationLicensed child care capacity (per 1,000)
2014 58.92019 29.0
Accredited child care capacity as % of licensed capacity
2014 —2019 0.0%
School attendance, grades K-122014 95.2%2018 95.0%
Family & CommunityTeen unintentional deaths/homicides/suicides (per 100,000)
2009-2013 41.02014-2018 36.5
Single parent head-of-house-hold with children under 18
2009-2013 9.6%2014-2018 8.8%
Juvenile law violation referrals, ages 10-17 (per 1,000)
2014 12.72018 19.0
Annual high school dropout rate2014 2.6%2018 1.9%
Children entering/re-entering state custody (per 1,000)
2014 13.32018 10.8
Health
Infant mortality (per 1,000)2009-2013 5.52014-2018 10.1
Child deaths ages 1-17 (per 100,000)
2009-2013 35.02014-2018 17.0
Child deaths ages 1-14 (per 100,000)
2009-2013 27.52014-2018 10.8
Child deaths ages 15-17 (per 100,000)
2009-2013 71.42014-2018 40.1
Unrestrained automobile fatalities for children under 18a
2009-2013 66.7%2014-2018 0%
Substance abuse hospitalizations ages 1-19 (per 100,000)b
2008-2012 33.1
2013-2017 40.3
Mental/behavioral hospitalizations (not substance abuse) ages 1-19 (per 10,000)
2008-2012 93.9
2013-2017 105.8
Uninsured children2013 8.8%2017 6.0%
School attendance, grades 9-122014 94.6%2018 94.5%
Contextual IndicatorsCounty Seat: Rolla
46Population: 44,789
2016
County Composite Rank
2020
66
Demographics
Total population2014 44,8472018 44,789
Child population under 182014 9,6512018 9,324
Children under 18 as % of total population
2014 21.2%2018 21.0%
Child population under 62014 3,1422018 2,982
Children under 6 as % of total population
2014 7.0%2018 6.7%
Minority child population under 18
2014 1,1332018 1,094
Minority child population under 18 as % of child population
2014 11.9%2018 11.7%
Minority child population under 6
2014 4442018 450
Minority child population under 6 as % of under 6 child population
2014 14.1%
2018 15.1%
Children in single-parent families
2009-2013 27.0%2014-2018 30.4%
Children in married-parent families
2009-2013 71.1%2014-2018 66.5%
Economic Well-being
Children in poverty under 62014 29.7%2018 27.8%
Children in poverty, ages 5-172009-2013 23.7%2014-2018 20.4%
Housing cost-burdened households
2009-2013 30.9%2014-2018 29.1%
Family households with children under 18 at 185% of poverty level
2009-2013 40.1%
2014-2018 41.6%
Children in families receiving SNAP
2014 37.0%2018 31.3%
Median income family household with children under 18
2009-2013 $49,385
2014-2018 $50,989
Adult unemployment2014 6.2%2018 3.1%
Child homelessness2014 1.1%2018 2.1%
a If no % listed, no vehicle fatalities happened in the county during that period.b *Indicates unstable rate due to low count (<20 cases);** indicates very unstable rate due to very low count (<5 cases)

Outcome MeasuresNumber Rate Trend Rank
2014 2018 2014 2018 State Rate
County Rank
Economic Well-BeingChildren under 18 in poverty 1,052 812 26.7% 20.5% é 18.3% 44
Food insecurity for childrenb 870 730 21.2% 17.9% é 17.5% 36
HealthLow birthweight infantsa,c 100 99 9.1% 8.9% é 8.5% 91
Preventable hospitalizations for all causes for children under 18 (per 1,000)b,c
33 30 8.1 7.3 é 7.1 80
Child asthma ER rates (per 1,000)b
20 28 4.9 6.8 ê 7.5 103
Family & CommunityBirths to teens, ages 15-19 (per 1,000)
19 11 40.2 23.1 é 21.6 46
Substantiated child abuse/neglect cases (per 1,000)a
39 27 9.6 6.6 é 4.0 76
EducationHigh school graduation 152 148 91.6% 93.7% é 91.3% 60
Achievement proficiencya,d
3rd grade English/Language Arts (MAP) 107 50.0% 48.6%
8th grade English/Language Arts (MAP)
91 47.4% 49.0%
4th grade Math (MAP) 99 59.6% 45.8%
Algebra I (End of Course exam) 72 38.7% 47.0%
Trend: é better ê worse è no change
Pike CountyCounty Seat: Bowling Green
63Population: 18,489
2016
County Composite Rank
62
2020
a Outcome not included in County Composite Rank.b Data based on 2013 and 2017.c Data based on 5-year time spans, 2009-2013 and 2014-2018.d Achievement proficiency measures those that scored proficient or above on the MAP tests and Algebra I End of Course exam. Achievement data from 2014 are not shown due to differences in testing standards and assessments used in 2018; accordingly, no trend arrows or county ranks are shown.

Pike County
EducationLicensed child care capacity (per 1,000)
2014 168.62019 162.1
Accredited child care capacity as % of licensed capacity
2014 —2019 8.5%
School attendance, grades K-122014 95.2%2018 95.0%
Family & CommunityTeen unintentional deaths/homicides/suicides (per 100,000)
2009-2013 86.72014-2018 36.2
Single parent head-of-house-hold with children under 18
2009-2013 8.9%2014-2018 9.4%
Juvenile law violation referrals, ages 10-17 (per 1,000)
2014 37.02018 34.7
Annual high school dropout rate2014 2.4%2018 1.7%
Children entering/re-entering state custody (per 1,000)
2014 8.72018 3.2
Health
Infant mortality (per 1,000)2009-2013 4.52014-2018 4.5
Child deaths ages 1-17 (per 100,000)
2009-2013 34.22014-2018 29.6
Child deaths ages 1-14 (per 100,000)
2009-2013 17.72014-2018 25.4
Child deaths ages 15-17 (per 100,000)
2009-2013 107.82014-2018 27.6
Unrestrained automobile fatalities for children under 18a
2009-2013 50.0%2014-2018 100%
Substance abuse hospitalizations ages 1-19 (per 100,000)b
2008-2012 0
2013-2017 7.9**
Mental/behavioral hospitalizations (not substance abuse) ages 1-19 (per 10,000)
2008-2012 67.4
2013-2017 70.8
Uninsured children2013 8.2%2017 6.2%
School attendance, grades 9-122014 94.8%2018 94.5%
Contextual IndicatorsCounty Seat: Bowling Green
63Population: 18,489
2016
County Composite Rank
2020
62
Demographics
Total population2014 18,5412018 18,489
Child population under 182014 4,0692018 4,072
Children under 18 as % of total population
2014 21.8%2018 21.9%
Child population under 62014 1,3332018 1,345
Children under 6 as % of total population
2014 7.2%2018 7.3%
Minority child population under 18
2014 3942018 419
Minority child population under 18 as % of child population
2014 9.8%2018 10.3%
Minority child population under 6
2014 1352018 153
Minority child population under 6 as % of under 6 child population
2014 10.1%
2018 11.4%
Children in single-parent families
2009-2013 35.2%2014-2018 30.2%
Children in married-parent families
2009-2013 64.0%2014-2018 66.5%
Economic Well-being
Children in poverty under 62014 27.5%2018 21.4%
Children in poverty, ages 5-172009-2013 25.8%2014-2018 20.8%
Housing cost-burdened households
2009-2013 25.0%2014-2018 19.3%
Family households with children under 18 at 185% of poverty level
2009-2013 45.3%
2014-2018 40.1%
Children in families receiving SNAP
2014 35.1%2018 31.2%
Median income family household with children under 18
2009-2013 $50,313
2014-2018 $53,250
Adult unemployment2014 5.7%2018 3.6%
Child homelessness2014 0.0%2018 0.0%
a If no % listed, no vehicle fatalities happened in the county during that period.b *Indicates unstable rate due to low count (<20 cases);** indicates very unstable rate due to very low count (<5 cases)

Outcome MeasuresNumber Rate Trend Rank
2014 2018 2014 2018 State Rate
County Rank
Economic Well-BeingChildren under 18 in poverty 2,089 1,780 9.4% 7.4% é 18.3% 2
Food insecurity for childrenb 3,760 3,170 17.0% 13.7% é 17.5% 3
HealthLow birthweight infantsa,c 374 378 6.6% 6.3% é 8.5% 11
Preventable hospitalizations for all causes for children under 18 (per 1,000)b,c
142 122 6.4 5.1 é 7.1 36
Child asthma ER rates (per 1,000)b
100 75 4.5 3.1 é 7.5 46
Family & CommunityBirths to teens, ages 15-19 (per 1,000)
31 32 10.3 9.9 é 21.6 9
Substantiated child abuse/neglect cases (per 1,000)a
28 65 1.3 2.7 ê 4.0 18
EducationHigh school graduation 1,079 1,153 91.8% 93.1% é 91.3% 63
Achievement proficiencya,d
3rd grade English/Language Arts (MAP) 766 59.0% 48.6%
8th grade English/Language Arts (MAP)
711 56.3% 49.0%
4th grade Math (MAP) 717 54.3% 45.8%
Algebra I (End of Course exam) 897 73.4% 47.0%
Trend: é better ê worse è no change
Platte CountyCounty Seat: Platte City
3Population: 98,824
2016
County Composite Rank
3
2020
a Outcome not included in County Composite Rank.b Data based on 2013 and 2017.c Data based on 5-year time spans, 2009-2013 and 2014-2018.d Achievement proficiency measures those that scored proficient or above on the MAP tests and Algebra I End of Course exam. Achievement data from 2014 are not shown due to differences in testing standards and assessments used in 2018; accordingly, no trend arrows or county ranks are shown.

Platte County
EducationLicensed child care capacity (per 1,000)
2014 72.42019 62.5
Accredited child care capacity as % of licensed capacity
2014 —2019 18.7%
School attendance, grades K-122014 95.5%2018 94.6%
Family & CommunityTeen unintentional deaths/homicides/suicides (per 100,000)
2009-2013 49.22014-2018 38.3
Single parent head-of-house-hold with children under 18
2009-2013 9.5%2014-2018 9.0%
Juvenile law violation referrals, ages 10-17 (per 1,000)
2014 18.82018 13.2
Annual high school dropout rate2014 1.0%2018 1.4%
Children entering/re-entering state custody (per 1,000)
2014 0.82018 1.2
Health
Infant mortality (per 1,000)2009-2013 6.42014-2018 5.2
Child deaths ages 1-17 (per 100,000)
2009-2013 14.42014-2018 16.1
Child deaths ages 1-14 (per 100,000)
2009-2013 6.62014-2018 10.7
Child deaths ages 15-17 (per 100,000)
2009-2013 50.72014-2018 33.9
Unrestrained automobile fatalities for children under 18a
2009-2013 0.0%2014-2018 0%
Substance abuse hospitalizations ages 1-19 (per 100,000)b
2008-2012 9.0*
2013-2017 7.1*
Mental/behavioral hospitalizations (not substance abuse) ages 1-19 (per 10,000)
2008-2012 59.6
2013-2017 79.5
Uninsured children2013 5.4%2017 3.5%
School attendance, grades 9-122014 94.4%2018 93.5%
Contextual IndicatorsCounty Seat: Platte City
3Population: 98,824
2016
County Composite Rank
2020
3
Demographics
Total population2014 94,7882018 98,824
Child population under 182014 22,3222018 24,501
Children under 18 as % of total population
2014 23.9%2018 23.8%
Child population under 62014 6,9832018 7,745
Children under 6 as % of total population
2014 7.4%2018 7.5%
Minority child population under 18
2014 4,8772018 5,605
Minority child population under 18 as % of child population
2014 21.6%2018 22.9%
Minority child population under 6
2014 1,6392018 1,833
Minority child population under 6 as % of under 6 child population
2014 23.5%
2018 23.7%
Children in single-parent families
2009-2013 27.8%2014-2018 27.1%
Children in married-parent families
2009-2013 71.9%2014-2018 70.9%
Economic Well-being
Children in poverty under 62014 10.9%2018 4.6%
Children in poverty, ages 5-172009-2013 8.4%2014-2018 6.6%
Housing cost-burdened households
2009-2013 29.8%2014-2018 25.6%
Family households with children under 18 at 185% of poverty level
2009-2013 23.0%
2014-2018 16.6%
Children in families receiving SNAP
2014 16.9%2018 13.7%
Median income family household with children under 18
2009-2013 $81,399
2014-2018 $93,287
Adult unemployment2014 5.1%2018 2.6%
Child homelessness2014 1.2%2018 1.4%
a If no % listed, no vehicle fatalities happened in the county during that period.b *Indicates unstable rate due to low count (<20 cases);** indicates very unstable rate due to very low count (<5 cases)

Outcome MeasuresNumber Rate Trend Rank
2014 2018 2014 2018 State Rate
County Rank
Economic Well-BeingChildren under 18 in poverty 1,933 1,673 27.6% 23.8% é 18.3% 70
Food insecurity for childrenb 2,040 1,230 27.1% 16.7% é 17.5% 22
HealthLow birthweight infantsa,c 122 124 6.4% 6.4% è 8.5% 13
Preventable hospitalizations for all causes for children under 18 (per 1,000)b,c
40 52 5.3 7.1 ê 7.1 74
Child asthma ER rates (per 1,000)b
22 19 2.9 2.6 é 7.5 34
Family & CommunityBirths to teens, ages 15-19 (per 1,000)
28 35 21.3 26.9 ê 21.6 58
Substantiated child abuse/neglect cases (per 1,000)a
50 32 6.7 4.4 é 4.0 46
EducationHigh school graduation 349 347 90.6% 92.0% é 91.3% 82
Achievement proficiencya,d
3rd grade English/Language Arts (MAP) 186 49.9% 48.6%
8th grade English/Language Arts (MAP)
135 36.4% 49.0%
4th grade Math (MAP) 176 48.0% 45.8%
Algebra I (End of Course exam) 77 31.8% 47.0%
Trend: é better ê worse è no change
Polk CountyCounty Seat: Bolivar
48Population: 31,549
2016
County Composite Rank
59
2020
a Outcome not included in County Composite Rank.b Data based on 2013 and 2017.c Data based on 5-year time spans, 2009-2013 and 2014-2018.d Achievement proficiency measures those that scored proficient or above on the MAP tests and Algebra I End of Course exam. Achievement data from 2014 are not shown due to differences in testing standards and assessments used in 2018; accordingly, no trend arrows or county ranks are shown.

Polk County
EducationLicensed child care capacity (per 1,000)
2014 68.82019 61.4
Accredited child care capacity as % of licensed capacity
2014 —2019 17.3%
School attendance, grades K-122014 95.4%2018 94.9%
Family & CommunityTeen unintentional deaths/homicides/suicides (per 100,000)
2009-2013 60.02014-2018 22.2
Single parent head-of-house-hold with children under 18
2009-2013 7.8%2014-2018 9.9%
Juvenile law violation referrals, ages 10-17 (per 1,000)
2014 46.32018 36.8
Annual high school dropout rate2014 0.9%2018 1.0%
Children entering/re-entering state custody (per 1,000)
2014 4.92018 3.0
Health
Infant mortality (per 1,000)2009-2013 6.32014-2018 6.2
Child deaths ages 1-17 (per 100,000)
2009-2013 45.22014-2018 22.0
Child deaths ages 1-14 (per 100,000)
2009-2013 32.52014-2018 17.6
Child deaths ages 15-17 (per 100,000)
2009-2013 99.22014-2018 28.6
Unrestrained automobile fatalities for children under 18a
2009-2013 33.3%2014-2018 75%
Substance abuse hospitalizations ages 1-19 (per 100,000)b
2008-2012 4.1**
2013-2017 25.0*
Mental/behavioral hospitalizations (not substance abuse) ages 1-19 (per 10,000)
2008-2012 69.8
2013-2017 90.4
Uninsured children2013 8.5%2017 6.3%
School attendance, grades 9-122014 95.4%2018 94.8%
Contextual IndicatorsCounty Seat: Bolivar
48Population: 31,549
2016
County Composite Rank
2020
59
Demographics
Total population2014 31,0542018 31,549
Child population under 182014 7,4942018 7,343
Children under 18 as % of total population
2014 23.6%2018 23.0%
Child population under 62014 2,2602018 2,338
Children under 6 as % of total population
2014 7.3%2018 7.3%
Minority child population under 18
2014 4992018 560
Minority child population under 18 as % of child population
2014 6.8%2018 7.6%
Minority child population under 6
2014 1662018 162
Minority child population under 6 as % of under 6 child population
2014 7.3%
2018 6.9%
Children in single-parent families
2009-2013 23.0%2014-2018 32.7%
Children in married-parent families
2009-2013 73.0%2014-2018 65.1%
Economic Well-being
Children in poverty under 62014 30.3%2018 22.8%
Children in poverty, ages 5-172009-2013 25.8%2014-2018 22.7%
Housing cost-burdened households
2009-2013 32.5%2014-2018 26.8%
Family households with children under 18 at 185% of poverty level
2009-2013 50.0%
2014-2018 43.5%
Children in families receiving SNAP
2014 38.6%2018 34.8%
Median income family household with children under 18
2009-2013 $42,601
2014-2018 $47,181
Adult unemployment2014 6.2%2018 3.6%
Child homelessness2014 1.3%2018 3.7%
a If no % listed, no vehicle fatalities happened in the county during that period.b *Indicates unstable rate due to low count (<20 cases);** indicates very unstable rate due to very low count (<5 cases)

Outcome MeasuresNumber Rate Trend Rank
2014 2018 2014 2018 State Rate
County Rank
Economic Well-BeingChildren under 18 in poverty 2,194 1,842 18.6% 16.6% é 18.3% 27
Food insecurity for childrenb 2,610 2,100 20.9% 17.7% é 17.5% 35
HealthLow birthweight infantsa,c 302 277 7.0% 7.3% ê 8.5% 37
Preventable hospitalizations for all causes for children under 18 (per 1,000)b,c
59 50 4.7 4.4 é 7.1 22
Child asthma ER rates (per 1,000)b
17 33 1.4 2.9 ê 7.5 41
Family & CommunityBirths to teens, ages 15-19 (per 1,000)
41 32 21.8 18.3 é 21.6 27
Substantiated child abuse/neglect cases (per 1,000)a
75 87 6.0 7.7 ê 4.0 87
EducationHigh school graduation 560 581 93.5% 93.0% ê 91.3% 66
Achievement proficiencya,d
3rd grade English/Language Arts (MAP) 303 43.8% 48.6%
8th grade English/Language Arts (MAP)
296 50.3% 49.0%
4th grade Math (MAP) 326 45.2% 45.8%
Algebra I (End of Course exam) 191 34.6% 47.0%
Trend: é better ê worse è no change
Pulaski CountyCounty Seat: Waynesville
19Population: 52,591
2016
County Composite Rank
7
2020
a Outcome not included in County Composite Rank.b Data based on 2013 and 2017.c Data based on 5-year time spans, 2009-2013 and 2014-2018.d Achievement proficiency measures those that scored proficient or above on the MAP tests and Algebra I End of Course exam. Achievement data from 2014 are not shown due to differences in testing standards and assessments used in 2018; accordingly, no trend arrows or county ranks are shown.

Pulaski County
EducationLicensed child care capacity (per 1,000)
2014 64.32019 39.2
Accredited child care capacity as % of licensed capacity
2014 —2019 14.3%
School attendance, grades K-122014 94.8%2018 94.8%
Family & CommunityTeen unintentional deaths/homicides/suicides (per 100,000)
2009-2013 32.32014-2018 24.3
Single parent head-of-house-hold with children under 18
2009-2013 11.5%2014-2018 7.9%
Juvenile law violation referrals, ages 10-17 (per 1,000)
2014 34.92018 28.4
Annual high school dropout rate2014 1.1%2018 1.3%
Children entering/re-entering state custody (per 1,000)
2014 7.72018 6.9
Health
Infant mortality (per 1,000)2009-2013 8.62014-2018 6.1
Child deaths ages 1-17 (per 100,000)
2009-2013 11.22014-2018 18.9
Child deaths ages 1-14 (per 100,000)
2009-2013 9.52014-2018 10.2
Child deaths ages 15-17 (per 100,000)
2009-2013 19.92014-2018 56.8
Unrestrained automobile fatalities for children under 18a
2009-2013 50.0%2014-2018 50%
Substance abuse hospitalizations ages 1-19 (per 100,000)b
2008-2012 6.4*
2013-2017 18.2*
Mental/behavioral hospitalizations (not substance abuse) ages 1-19 (per 10,000)
2008-2012 70.8
2013-2017 74.4
Uninsured children2013 7.4%2017 4.7%
School attendance, grades 9-122014 94.2%2018 93.7%
Contextual IndicatorsCounty Seat: Waynesville
19Population: 52,591
2016
County Composite Rank
2020
7
Demographics
Total population2014 53,4362018 52,591
Child population under 182014 12,5682018 11,371
Children under 18 as % of total population
2014 22.8%2018 22.1%
Child population under 62014 4,6152018 4,110
Children under 6 as % of total population
2014 8.6%2018 7.9%
Minority child population under 18
2014 3,9812018 3,623
Minority child population under 18 as % of child population
2014 32.6%2018 31.9%
Minority child population under 6
2014 1,5622018 1,349
Minority child population under 6 as % of under 6 child population
2014 33.8%
2018 32.8%
Children in single-parent families
2009-2013 25.4%2014-2018 25.7%
Children in married-parent families
2009-2013 73.1%2014-2018 70.3%
Economic Well-being
Children in poverty under 62014 28.0%2018 28.7%
Children in poverty, ages 5-172009-2013 18.2%2014-2018 16.6%
Housing cost-burdened households
2009-2013 27.9%2014-2018 30.0%
Family households with children under 18 at 185% of poverty level
2009-2013 41.7%
2014-2018 37.7%
Children in families receiving SNAP
2014 26.9%2018 29.3%
Median income family household with children under 18
2009-2013 $51,341
2014-2018 $58,050
Adult unemployment2014 7.3%2018 3.6%
Child homelessness2014 2.5%2018 2.4%
a If no % listed, no vehicle fatalities happened in the county during that period.b *Indicates unstable rate due to low count (<20 cases);** indicates very unstable rate due to very low count (<5 cases)

Outcome MeasuresNumber Rate Trend Rank
2014 2018 2014 2018 State Rate
County Rank
Economic Well-BeingChildren under 18 in poverty 279 233 27.7% 22.5% é 18.3% 59
Food insecurity for childrenb 240 210 21.2% 19.9% é 17.5% 74
HealthLow birthweight infantsa,c 17 26 6.4% 8.5% ê 8.5% 77
Preventable hospitalizations for all causes for children under 18 (per 1,000)b,c
14 6 12.4 5.6 é 7.1 47
Child asthma ER rates (per 1,000)b
4 3 3.5 2.8 é 7.5 39
Family & CommunityBirths to teens, ages 15-19 (per 1,000)
3 1 23.3 6.6 é 21.6 6
Substantiated child abuse/neglect cases (per 1,000)a
5 4 4.6 3.8 é 4.0 38
EducationHigh school graduation 57 51 95.0% 96.2% é 91.3% 27
Achievement proficiencya,d
3rd grade English/Language Arts (MAP) 17 47.2% 48.6%
8th grade English/Language Arts (MAP)
15 40.5% 49.0%
4th grade Math (MAP) 10 21.3% 45.8%
Algebra I (End of Course exam) 33 70.2% 47.0%
Trend: é better ê worse è no change
Putnam CountyCounty Seat: Unionville
20Population: 4,815
2016
County Composite Rank
43
2020
a Outcome not included in County Composite Rank.b Data based on 2013 and 2017.c Data based on 5-year time spans, 2009-2013 and 2014-2018.d Achievement proficiency measures those that scored proficient or above on the MAP tests and Algebra I End of Course exam. Achievement data from 2014 are not shown due to differences in testing standards and assessments used in 2018; accordingly, no trend arrows or county ranks are shown.
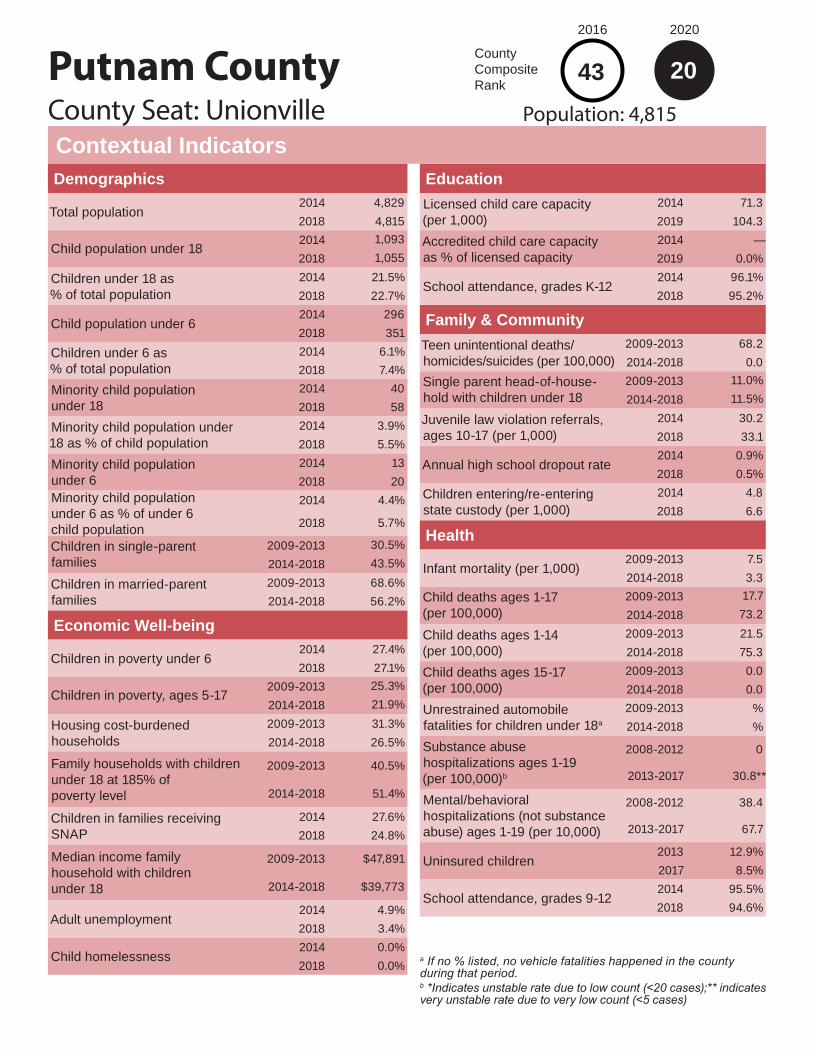
Putnam County
EducationLicensed child care capacity (per 1,000)
2014 71.32019 104.3
Accredited child care capacity as % of licensed capacity
2014 —2019 0.0%
School attendance, grades K-122014 96.1%2018 95.2%
Family & CommunityTeen unintentional deaths/homicides/suicides (per 100,000)
2009-2013 68.22014-2018 0.0
Single parent head-of-house-hold with children under 18
2009-2013 11.0%2014-2018 11.5%
Juvenile law violation referrals, ages 10-17 (per 1,000)
2014 30.22018 33.1
Annual high school dropout rate2014 0.9%2018 0.5%
Children entering/re-entering state custody (per 1,000)
2014 4.82018 6.6
Health
Infant mortality (per 1,000)2009-2013 7.52014-2018 3.3
Child deaths ages 1-17 (per 100,000)
2009-2013 17.72014-2018 73.2
Child deaths ages 1-14 (per 100,000)
2009-2013 21.52014-2018 75.3
Child deaths ages 15-17 (per 100,000)
2009-2013 0.02014-2018 0.0
Unrestrained automobile fatalities for children under 18a
2009-2013 %2014-2018 %
Substance abuse hospitalizations ages 1-19 (per 100,000)b
2008-2012 0
2013-2017 30.8**
Mental/behavioral hospitalizations (not substance abuse) ages 1-19 (per 10,000)
2008-2012 38.4
2013-2017 67.7
Uninsured children2013 12.9%2017 8.5%
School attendance, grades 9-122014 95.5%2018 94.6%
Contextual IndicatorsCounty Seat: Unionville
20Population: 4,815
2016
County Composite Rank
2020
43
Demographics
Total population2014 4,8292018 4,815
Child population under 182014 1,0932018 1,055
Children under 18 as % of total population
2014 21.5%2018 22.7%
Child population under 62014 2962018 351
Children under 6 as % of total population
2014 6.1%2018 7.4%
Minority child population under 18
2014 402018 58
Minority child population under 18 as % of child population
2014 3.9%2018 5.5%
Minority child population under 6
2014 132018 20
Minority child population under 6 as % of under 6 child population
2014 4.4%
2018 5.7%
Children in single-parent families
2009-2013 30.5%2014-2018 43.5%
Children in married-parent families
2009-2013 68.6%2014-2018 56.2%
Economic Well-being
Children in poverty under 62014 27.4%2018 27.1%
Children in poverty, ages 5-172009-2013 25.3%2014-2018 21.9%
Housing cost-burdened households
2009-2013 31.3%2014-2018 26.5%
Family households with children under 18 at 185% of poverty level
2009-2013 40.5%
2014-2018 51.4%
Children in families receiving SNAP
2014 27.6%2018 24.8%
Median income family household with children under 18
2009-2013 $47,891
2014-2018 $39,773
Adult unemployment2014 4.9%2018 3.4%
Child homelessness2014 0.0%2018 0.0%
a If no % listed, no vehicle fatalities happened in the county during that period.b *Indicates unstable rate due to low count (<20 cases);** indicates very unstable rate due to very low count (<5 cases)

Outcome MeasuresNumber Rate Trend Rank
2014 2018 2014 2018 State Rate
County Rank
Economic Well-BeingChildren under 18 in poverty 368 283 16.7% 13.3% é 18.3% 13
Food insecurity for childrenb 440 380 19.1% 17.1% é 17.5% 27
HealthLow birthweight infantsa,c 44 47 9.0% 9.5% ê 8.5% 98
Preventable hospitalizations for all causes for children under 18 (per 1,000)b,c
8 9 3.5 4.1 ê 7.1 18
Child asthma ER rates (per 1,000)b
4 6 1.8 2.7 ê 7.5 37
Family & CommunityBirths to teens, ages 15-19 (per 1,000)
8 8 30.8 30.7 é 21.6 75
Substantiated child abuse/neglect cases (per 1,000)a
12 12 5.3 5.6 ê 4.0 64
EducationHigh school graduation 48 66 80.0% 94.3% é 91.3% 47
Achievement proficiencya,d
3rd grade English/Language Arts (MAP) 28 48.3% 48.6%
8th grade English/Language Arts (MAP)
32 53.3% 49.0%
4th grade Math (MAP) 46 68.7% 45.8%
Algebra I (End of Course exam) 18 30.5% 47.0%
Trend: é better ê worse è no change
Ralls CountyCounty Seat: New London
18Population: 10,217
2016
County Composite Rank
45
2020
a Outcome not included in County Composite Rank.b Data based on 2013 and 2017.c Data based on 5-year time spans, 2009-2013 and 2014-2018.d Achievement proficiency measures those that scored proficient or above on the MAP tests and Algebra I End of Course exam. Achievement data from 2014 are not shown due to differences in testing standards and assessments used in 2018; accordingly, no trend arrows or county ranks are shown.

Ralls County
EducationLicensed child care capacity (per 1,000)
2014 26.62019 37.2
Accredited child care capacity as % of licensed capacity
2014 —2019 25.0%
School attendance, grades K-122014 95.2%2018 95.6%
Family & CommunityTeen unintentional deaths/homicides/suicides (per 100,000)
2009-2013 63.12014-2018 31.8
Single parent head-of-house-hold with children under 18
2009-2013 2.7%2014-2018 6.7%
Juvenile law violation referrals, ages 10-17 (per 1,000)
2014 23.72018 10.1
Annual high school dropout rate2014 3.9%2018 2.6%
Children entering/re-entering state custody (per 1,000)
2014 4.02018 2.8
Health
Infant mortality (per 1,000)2009-2013 14.32014-2018 2.0
Child deaths ages 1-17 (per 100,000)
2009-2013 35.12014-2018 18.4
Child deaths ages 1-14 (per 100,000)
2009-2013 10.52014-2018 19.6
Child deaths ages 15-17 (per 100,000)
2009-2013 99.82014-2018 0.0
Unrestrained automobile fatalities for children under 18a
2009-2013 100.0%2014-2018 %
Substance abuse hospitalizations ages 1-19 (per 100,000)b
2008-2012 0
2013-2017 15.0**
Mental/behavioral hospitalizations (not substance abuse) ages 1-19 (per 10,000)
2008-2012 31.8
2013-2017 32.2
Uninsured children2013 8.6%2017 6.1%
School attendance, grades 9-122014 93.7%2018 94.4%
Contextual IndicatorsCounty Seat: New London
18Population: 10,217
2016
County Composite Rank
2020
45
Demographics
Total population2014 10,2552018 10,217
Child population under 182014 2,2492018 2,153
Children under 18 as % of total population
2014 22.0%2018 21.3%
Child population under 62014 6832018 599
Children under 6 as % of total population
2014 6.6%2018 5.9%
Minority child population under 18
2014 1132018 125
Minority child population under 18 as % of child population
2014 5.0%2018 5.8%
Minority child population under 6
2014 522018 37
Minority child population under 6 as % of under 6 child population
2014 7.6%
2018 6.2%
Children in single-parent families
2009-2013 27.0%2014-2018 28.0%
Children in married-parent families
2009-2013 72.1%2014-2018 71.2%
Economic Well-being
Children in poverty under 62014 26.5%2018 25.1%
Children in poverty, ages 5-172009-2013 15.0%2014-2018 11.7%
Housing cost-burdened households
2009-2013 18.6%2014-2018 20.4%
Family households with children under 18 at 185% of poverty level
2009-2013 34.8%
2014-2018 27.7%
Children in families receiving SNAP
2014 25.1%2018 24.0%
Median income family household with children under 18
2009-2013 $52,697
2014-2018 $64,507
Adult unemployment2014 5.3%2018 2.8%
Child homelessness2014 3.1%2018 1.6%
a If no % listed, no vehicle fatalities happened in the county during that period.b *Indicates unstable rate due to low count (<20 cases);** indicates very unstable rate due to very low count (<5 cases)

Outcome MeasuresNumber Rate Trend Rank
2014 2018 2014 2018 State Rate
County Rank
Economic Well-BeingChildren under 18 in poverty 1,419 1,365 26.3% 26.1% é 18.3% 86
Food insecurity for childrenb 1,350 1,020 23.4% 18.4% é 17.5% 47
HealthLow birthweight infantsa,c 115 126 7.8% 8.7% ê 8.5% 86
Preventable hospitalizations for all causes for children under 18 (per 1,000)b,c
40 42 6.9 7.8 ê 7.1 84
Child asthma ER rates (per 1,000)b
32 39 5.5 7.3 ê 7.5 105
Family & CommunityBirths to teens, ages 15-19 (per 1,000)
23 31 29.1 41.4 ê 21.6 103
Substantiated child abuse/neglect cases (per 1,000)a
64 53 11.2 9.9 é 4.0 97
EducationHigh school graduation 283 237 91.3% 92.2% é 91.3% 78
Achievement proficiencya,d
3rd grade English/Language Arts (MAP) 142 50.5% 48.6%
8th grade English/Language Arts (MAP)
126 47.4% 49.0%
4th grade Math (MAP) 96 35.4% 45.8%
Algebra I (End of Course exam) 104 34.7% 47.0%
Trend: é better ê worse è no change
Randolph CountyCounty Seat: Huntsville
97Population: 24,945
2016
County Composite Rank
60
2020
a Outcome not included in County Composite Rank.b Data based on 2013 and 2017.c Data based on 5-year time spans, 2009-2013 and 2014-2018.d Achievement proficiency measures those that scored proficient or above on the MAP tests and Algebra I End of Course exam. Achievement data from 2014 are not shown due to differences in testing standards and assessments used in 2018; accordingly, no trend arrows or county ranks are shown.

Randolph County
EducationLicensed child care capacity (per 1,000)
2014 85.52019 79.4
Accredited child care capacity as % of licensed capacity
2014 —2019 21.1%
School attendance, grades K-122014 95.1%2018 94.4%
Family & CommunityTeen unintentional deaths/homicides/suicides (per 100,000)
2009-2013 74.02014-2018 39.1
Single parent head-of-house-hold with children under 18
2009-2013 11.9%2014-2018 8.6%
Juvenile law violation referrals, ages 10-17 (per 1,000)
2014 48.62018 23.8
Annual high school dropout rate2014 1.6%2018 1.5%
Children entering/re-entering state custody (per 1,000)
2014 14.12018 12.1
Health
Infant mortality (per 1,000)2009-2013 4.72014-2018 6.9
Child deaths ages 1-17 (per 100,000)
2009-2013 27.72014-2018 29.3
Child deaths ages 1-14 (per 100,000)
2009-2013 16.62014-2018 22.7
Child deaths ages 15-17 (per 100,000)
2009-2013 84.42014-2018 43.4
Unrestrained automobile fatalities for children under 18a
2009-2013 50.0%2014-2018 0%
Substance abuse hospitalizations ages 1-19 (per 100,000)b
2008-2012 10.9**
2013-2017 34.8*
Mental/behavioral hospitalizations (not substance abuse) ages 1-19 (per 10,000)
2008-2012 98.9
2013-2017 97.7
Uninsured children2013 7.0%2017 5.3%
School attendance, grades 9-122014 93.1%2018 93.1%
Contextual IndicatorsCounty Seat: Huntsville
97Population: 24,945
2016
County Composite Rank
2020
60
Demographics
Total population2014 25,0722018 24,945
Child population under 182014 5,7052018 5,379
Children under 18 as % of total population
2014 22.1%2018 21.9%
Child population under 62014 1,7712018 1,717
Children under 6 as % of total population
2014 7.1%2018 6.9%
Minority child population under 18
2014 6162018 646
Minority child population under 18 as % of child population
2014 11.1%2018 12.0%
Minority child population under 6
2014 2082018 215
Minority child population under 6 as % of under 6 child population
2014 11.7%
2018 12.5%
Children in single-parent families
2009-2013 38.6%2014-2018 31.9%
Children in married-parent families
2009-2013 57.5%2014-2018 67.9%
Economic Well-being
Children in poverty under 62014 28.9%2018 25.8%
Children in poverty, ages 5-172009-2013 24.8%2014-2018 24.0%
Housing cost-burdened households
2009-2013 27.5%2014-2018 25.2%
Family households with children under 18 at 185% of poverty level
2009-2013 53.6%
2014-2018 41.5%
Children in families receiving SNAP
2014 44.7%2018 39.6%
Median income family household with children under 18
2009-2013 $44,282
2014-2018 $58,276
Adult unemployment2014 6.8%2018 3.8%
Child homelessness2014 1.3%2018 1.0%
a If no % listed, no vehicle fatalities happened in the county during that period.b *Indicates unstable rate due to low count (<20 cases);** indicates very unstable rate due to very low count (<5 cases)
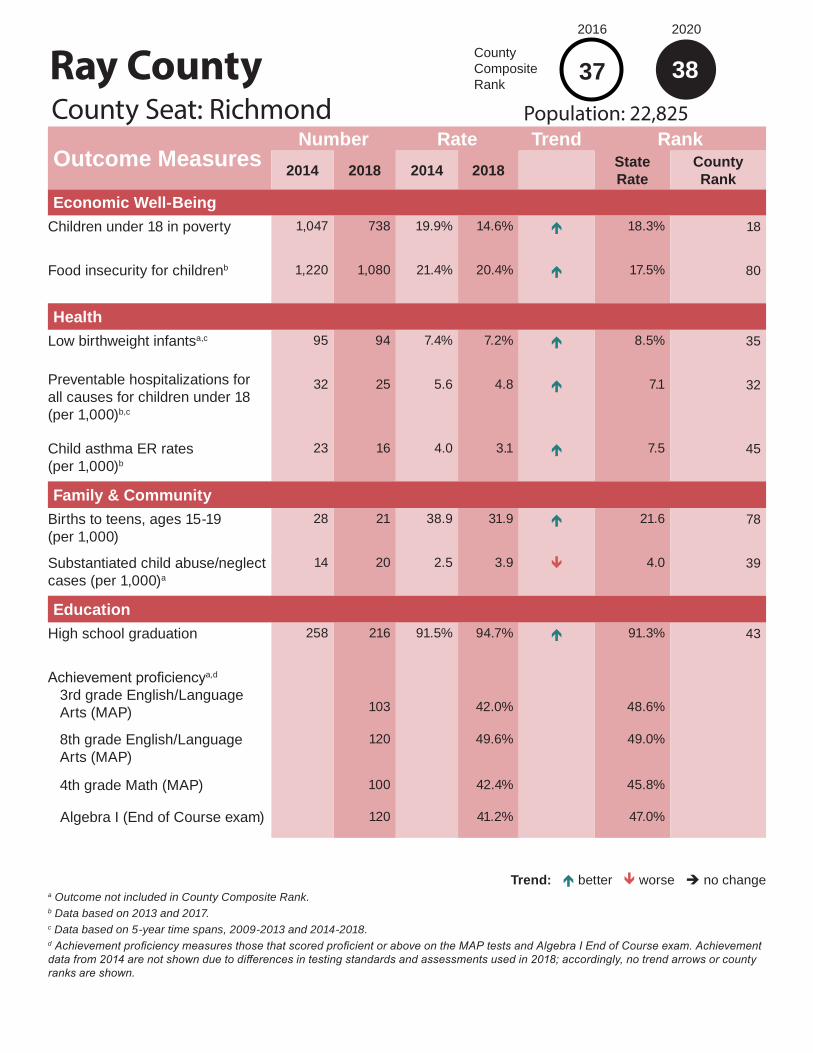
Outcome MeasuresNumber Rate Trend Rank
2014 2018 2014 2018 State Rate
County Rank
Economic Well-BeingChildren under 18 in poverty 1,047 738 19.9% 14.6% é 18.3% 18
Food insecurity for childrenb 1,220 1,080 21.4% 20.4% é 17.5% 80
HealthLow birthweight infantsa,c 95 94 7.4% 7.2% é 8.5% 35
Preventable hospitalizations for all causes for children under 18 (per 1,000)b,c
32 25 5.6 4.8 é 7.1 32
Child asthma ER rates (per 1,000)b
23 16 4.0 3.1 é 7.5 45
Family & CommunityBirths to teens, ages 15-19 (per 1,000)
28 21 38.9 31.9 é 21.6 78
Substantiated child abuse/neglect cases (per 1,000)a
14 20 2.5 3.9 ê 4.0 39
EducationHigh school graduation 258 216 91.5% 94.7% é 91.3% 43
Achievement proficiencya,d
3rd grade English/Language Arts (MAP) 103 42.0% 48.6%
8th grade English/Language Arts (MAP)
120 49.6% 49.0%
4th grade Math (MAP) 100 42.4% 45.8%
Algebra I (End of Course exam) 120 41.2% 47.0%
Trend: é better ê worse è no change
Ray CountyCounty Seat: Richmond
38Population: 22,825
2016
County Composite Rank
37
2020
a Outcome not included in County Composite Rank.b Data based on 2013 and 2017.c Data based on 5-year time spans, 2009-2013 and 2014-2018.d Achievement proficiency measures those that scored proficient or above on the MAP tests and Algebra I End of Course exam. Achievement data from 2014 are not shown due to differences in testing standards and assessments used in 2018; accordingly, no trend arrows or county ranks are shown.

Ray County
EducationLicensed child care capacity (per 1,000)
2014 16.82019 16.7
Accredited child care capacity as % of licensed capacity
2014 —2019 0.0%
School attendance, grades K-122014 95.4%2018 95.2%
Family & CommunityTeen unintentional deaths/homicides/suicides (per 100,000)
2009-2013 61.12014-2018 68.7
Single parent head-of-house-hold with children under 18
2009-2013 7.5%2014-2018 8.5%
Juvenile law violation referrals, ages 10-17 (per 1,000)
2014 48.92018 52.2
Annual high school dropout rate2014 1.6%2018 0.4%
Children entering/re-entering state custody (per 1,000)
2014 1.12018 1.2
Health
Infant mortality (per 1,000)2009-2013 8.62014-2018 5.4
Child deaths ages 1-17 (per 100,000)
2009-2013 27.92014-2018 22.9
Child deaths ages 1-14 (per 100,000)
2009-2013 17.32014-2018 16.4
Child deaths ages 15-17 (per 100,000)
2009-2013 74.42014-2018 41.5
Unrestrained automobile fatalities for children under 18a
2009-2013 %2014-2018 %
Substance abuse hospitalizations ages 1-19 (per 100,000)b
2008-2012 2.8**
2013-2017 12.4**
Mental/behavioral hospitalizations (not substance abuse) ages 1-19 (per 10,000)
2008-2012 80.5
2013-2017 91.5
Uninsured children2013 7.3%2017 5.2%
School attendance, grades 9-122014 95.0%2018 94.8%
Contextual IndicatorsCounty Seat: Richmond
38Population: 22,825
2016
County Composite Rank
2020
37
Demographics
Total population2014 22,9492018 22,825
Child population under 182014 5,6252018 5,143
Children under 18 as % of total population
2014 23.4%2018 22.9%
Child population under 62014 1,5662018 1,525
Children under 6 as % of total population
2014 6.8%2018 6.7%
Minority child population under 18
2014 4142018 394
Minority child population under 18 as % of child population
2014 7.7%2018 7.7%
Minority child population under 6
2014 1492018 123
Minority child population under 6 as % of under 6 child population
2014 9.5%
2018 8.1%
Children in single-parent families
2009-2013 27.8%2014-2018 28.2%
Children in married-parent families
2009-2013 71.7%2014-2018 71.7%
Economic Well-being
Children in poverty under 62014 21.5%2018 20.7%
Children in poverty, ages 5-172009-2013 16.7%2014-2018 12.6%
Housing cost-burdened households
2009-2013 25.8%2014-2018 22.3%
Family households with children under 18 at 185% of poverty level
2009-2013 30.4%
2014-2018 28.0%
Children in families receiving SNAP
2014 30.4%2018 26.7%
Median income family household with children under 18
2009-2013 $65,303
2014-2018 $73,691
Adult unemployment2014 6.8%2018 3.6%
Child homelessness2014 0.0%2018 0.7%
a If no % listed, no vehicle fatalities happened in the county during that period.b *Indicates unstable rate due to low count (<20 cases);** indicates very unstable rate due to very low count (<5 cases)

Outcome MeasuresNumber Rate Trend Rank
2014 2018 2014 2018 State Rate
County Rank
Economic Well-BeingChildren under 18 in poverty 432 378 33.6% 33.0% é 18.3% 101
Food insecurity for childrenb 420 250 28.4% 18.7% é 17.5% 51
HealthLow birthweight infantsa,c 27 29 8.2% 9.7% ê 8.5% 102
Preventable hospitalizations for all causes for children under 18 (per 1,000)b,c
25 4 16.9 3.2 é 7.1 8
Child asthma ER rates (per 1,000)b
4 3 2.7 2.4 é 7.5 28
Family & CommunityBirths to teens, ages 15-19 (per 1,000)
5 9 32.5 61.2 ê 21.6 115
Substantiated child abuse/neglect cases (per 1,000)a
15 10 10.4 8.2 é 4.0 90
EducationHigh school graduation 56 83 88.9% 97.6% é 91.3% 14
Achievement proficiencya,d
3rd grade English/Language Arts (MAP) 42 58.3% 48.6%
8th grade English/Language Arts (MAP)
30 35.7% 49.0%
4th grade Math (MAP) 41 61.2% 45.8%
Algebra I (End of Course exam) 34 44.7% 47.0%
Trend: é better ê worse è no change
Reynolds CountyCounty Seat: Centerville
81Population: 6,315
2016
County Composite Rank
106
2020
a Outcome not included in County Composite Rank.b Data based on 2013 and 2017.c Data based on 5-year time spans, 2009-2013 and 2014-2018.d Achievement proficiency measures those that scored proficient or above on the MAP tests and Algebra I End of Course exam. Achievement data from 2014 are not shown due to differences in testing standards and assessments used in 2018; accordingly, no trend arrows or county ranks are shown.
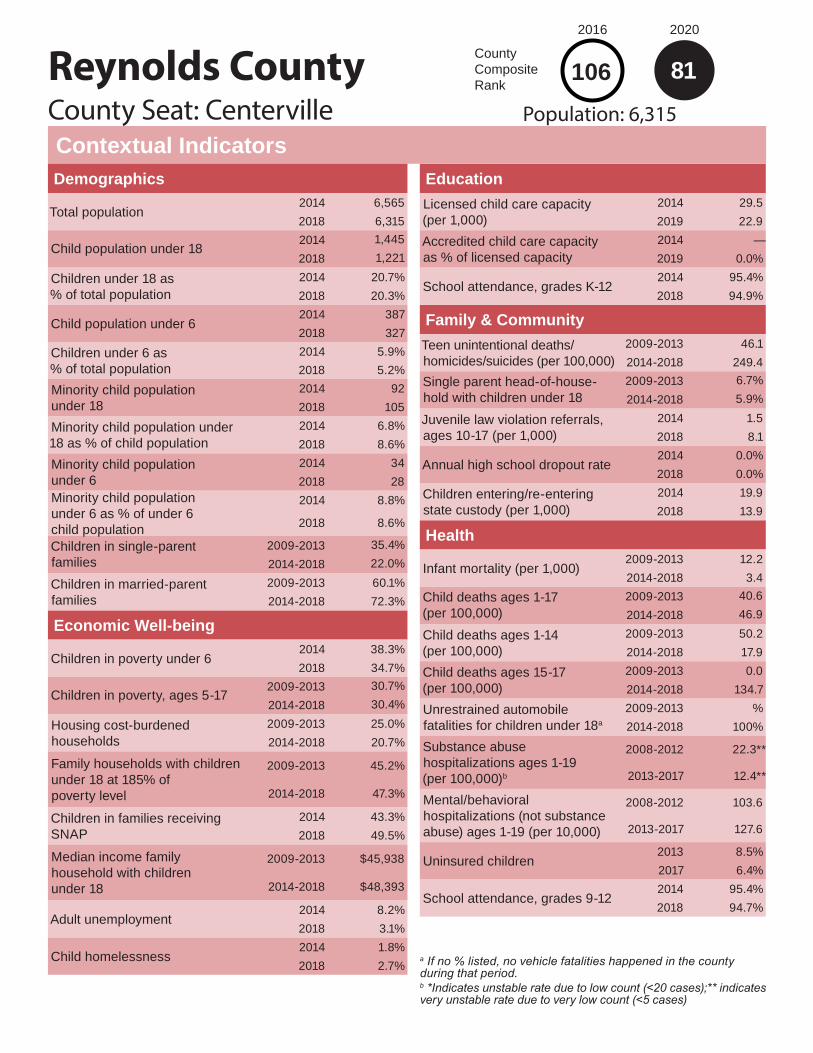
Reynolds County
EducationLicensed child care capacity (per 1,000)
2014 29.52019 22.9
Accredited child care capacity as % of licensed capacity
2014 —2019 0.0%
School attendance, grades K-122014 95.4%2018 94.9%
Family & CommunityTeen unintentional deaths/homicides/suicides (per 100,000)
2009-2013 46.12014-2018 249.4
Single parent head-of-house-hold with children under 18
2009-2013 6.7%2014-2018 5.9%
Juvenile law violation referrals, ages 10-17 (per 1,000)
2014 1.52018 8.1
Annual high school dropout rate2014 0.0%2018 0.0%
Children entering/re-entering state custody (per 1,000)
2014 19.92018 13.9
Health
Infant mortality (per 1,000)2009-2013 12.22014-2018 3.4
Child deaths ages 1-17 (per 100,000)
2009-2013 40.62014-2018 46.9
Child deaths ages 1-14 (per 100,000)
2009-2013 50.22014-2018 17.9
Child deaths ages 15-17 (per 100,000)
2009-2013 0.02014-2018 134.7
Unrestrained automobile fatalities for children under 18a
2009-2013 %2014-2018 100%
Substance abuse hospitalizations ages 1-19 (per 100,000)b
2008-2012 22.3**
2013-2017 12.4**
Mental/behavioral hospitalizations (not substance abuse) ages 1-19 (per 10,000)
2008-2012 103.6
2013-2017 127.6
Uninsured children2013 8.5%2017 6.4%
School attendance, grades 9-122014 95.4%2018 94.7%
Contextual IndicatorsCounty Seat: Centerville
81Population: 6,315
2016
County Composite Rank
2020
106
Demographics
Total population2014 6,5652018 6,315
Child population under 182014 1,4452018 1,221
Children under 18 as % of total population
2014 20.7%2018 20.3%
Child population under 62014 3872018 327
Children under 6 as % of total population
2014 5.9%2018 5.2%
Minority child population under 18
2014 922018 105
Minority child population under 18 as % of child population
2014 6.8%2018 8.6%
Minority child population under 6
2014 342018 28
Minority child population under 6 as % of under 6 child population
2014 8.8%
2018 8.6%
Children in single-parent families
2009-2013 35.4%2014-2018 22.0%
Children in married-parent families
2009-2013 60.1%2014-2018 72.3%
Economic Well-being
Children in poverty under 62014 38.3%2018 34.7%
Children in poverty, ages 5-172009-2013 30.7%2014-2018 30.4%
Housing cost-burdened households
2009-2013 25.0%2014-2018 20.7%
Family households with children under 18 at 185% of poverty level
2009-2013 45.2%
2014-2018 47.3%
Children in families receiving SNAP
2014 43.3%2018 49.5%
Median income family household with children under 18
2009-2013 $45,938
2014-2018 $48,393
Adult unemployment2014 8.2%2018 3.1%
Child homelessness2014 1.8%2018 2.7%
a If no % listed, no vehicle fatalities happened in the county during that period.b *Indicates unstable rate due to low count (<20 cases);** indicates very unstable rate due to very low count (<5 cases)

Outcome MeasuresNumber Rate Trend Rank
2014 2018 2014 2018 State Rate
County Rank
Economic Well-BeingChildren under 18 in poverty 1,127 1,009 36.9% 34.0% é 18.3% 104
Food insecurity for childrenb 940 710 28.7% 22.3% é 17.5% 100
HealthLow birthweight infantsa,c 93 81 9.9% 9.8% é 8.5% 103
Preventable hospitalizations for all causes for children under 18 (per 1,000)b,c
94 51 28.5 16.5 é 7.1 115
Child asthma ER rates (per 1,000)b
21 12 6.4 3.9 é 7.5 65
Family & CommunityBirths to teens, ages 15-19 (per 1,000)
28 13 70.0 35.2 é 21.6 89
Substantiated child abuse/neglect cases (per 1,000)a
29 11 8.8 3.6 é 4.0 33
EducationHigh school graduation 129 105 89.0% 92.1% é 91.3% 80
Achievement proficiencya,d
3rd grade English/Language Arts (MAP) 79 46.2% 48.6%
8th grade English/Language Arts (MAP)
67 41.9% 49.0%
4th grade Math (MAP) 54 30.9% 45.8%
Algebra I (End of Course exam) 46 37.7% 47.0%
Trend: é better ê worse è no change
Ripley CountyCounty Seat: Doniphan
111Population: 13,693
2016
County Composite Rank
114
2020
a Outcome not included in County Composite Rank.b Data based on 2013 and 2017.c Data based on 5-year time spans, 2009-2013 and 2014-2018.d Achievement proficiency measures those that scored proficient or above on the MAP tests and Algebra I End of Course exam. Achievement data from 2014 are not shown due to differences in testing standards and assessments used in 2018; accordingly, no trend arrows or county ranks are shown.

Ripley County
EducationLicensed child care capacity (per 1,000)
2014 42.22019 59.2
Accredited child care capacity as % of licensed capacity
2014 —2019 0.0%
School attendance, grades K-122014 95.3%2018 94.4%
Family & CommunityTeen unintentional deaths/homicides/suicides (per 100,000)
2009-2013 0.02014-2018 134.0
Single parent head-of-house-hold with children under 18
2009-2013 9.4%2014-2018 7.9%
Juvenile law violation referrals, ages 10-17 (per 1,000)
2014 44.12018 24.8
Annual high school dropout rate2014 2.3%2018 0.9%
Children entering/re-entering state custody (per 1,000)
2014 16.42018 10.4
Health
Infant mortality (per 1,000)2009-2013 8.52014-2018 3.6
Child deaths ages 1-17 (per 100,000)
2009-2013 12.12014-2018 82.9
Child deaths ages 1-14 (per 100,000)
2009-2013 14.92014-2018 58.0
Child deaths ages 15-17 (per 100,000)
2009-2013 0.02014-2018 163.3
Unrestrained automobile fatalities for children under 18a
2009-2013 100.0%2014-2018 83.3%
Substance abuse hospitalizations ages 1-19 (per 100,000)b
2008-2012 24.9*
2013-2017 51.4*
Mental/behavioral hospitalizations (not substance abuse) ages 1-19 (per 10,000)
2008-2012 123.9
2013-2017 126.9
Uninsured children2013 8.0%2017 6.1%
School attendance, grades 9-122014 93.6%2018 93.9%
Contextual IndicatorsCounty Seat: Doniphan
111Population: 13,693
2016
County Composite Rank
2020
114
Demographics
Total population2014 13,9692018 13,693
Child population under 182014 3,2922018 3,075
Children under 18 as % of total population
2014 22.7%2018 22.9%
Child population under 62014 1,1422018 988
Children under 6 as % of total population
2014 8.2%2018 7.4%
Minority child population under 18
2014 2132018 166
Minority child population under 18 as % of child population
2014 6.7%2018 5.4%
Minority child population under 6
2014 742018 69
Minority child population under 6 as % of under 6 child population
2014 6.5%
2018 7.0%
Children in single-parent families
2009-2013 34.5%2014-2018 29.8%
Children in married-parent families
2009-2013 64.6%2014-2018 67.4%
Economic Well-being
Children in poverty under 62014 38.4%2018 34.8%
Children in poverty, ages 5-172009-2013 34.7%2014-2018 32.1%
Housing cost-burdened households
2009-2013 28.5%2014-2018 25.2%
Family households with children under 18 at 185% of poverty level
2009-2013 61.6%
2014-2018 52.0%
Children in families receiving SNAP
2014 58.0%2018 55.5%
Median income family household with children under 18
2009-2013 $34,036
2014-2018 $40,720
Adult unemployment2014 8.0%2018 5.2%
Child homelessness2014 1.6%2018 5.0%
a If no % listed, no vehicle fatalities happened in the county during that period.b *Indicates unstable rate due to low count (<20 cases);** indicates very unstable rate due to very low count (<5 cases)

Outcome MeasuresNumber Rate Trend Rank
2014 2018 2014 2018 State Rate
County Rank
Economic Well-BeingChildren under 18 in poverty 8,096 6,411 8.9% 7.0% é 18.3% 1
Food insecurity for childrenb 14,580 11,900 15.8% 12.8% é 17.5% 1
HealthLow birthweight infantsa,c 1,570 1,606 6.9% 7.2% ê 8.5% 34
Preventable hospitalizations for all causes for children under 18 (per 1,000)b,c
506 464 5.5 5.0 é 7.1 35
Child asthma ER rates (per 1,000)b
664 469 7.2 5.0 é 7.5 81
Family & CommunityBirths to teens, ages 15-19 (per 1,000)
126 96 10.1 7.6 é 21.6 7
Substantiated child abuse/neglect cases (per 1,000)a
337 308 3.6 3.3 é 4.0 29
EducationHigh school graduation 4,093 4,249 92.3% 92.9% é 91.3% 67
Achievement proficiencya,d
3rd grade English/Language Arts (MAP) 2,668 61.3% 48.6%
8th grade English/Language Arts (MAP)
2,762 61.1% 49.0%
4th grade Math (MAP) 2,741 60.6% 45.8%
Algebra I (End of Course exam) 3,059 67.1% 47.0%
Trend: é better ê worse è no change
St. Charles CountyCounty Seat: St. Charles
4Population: 389,985
2016
County Composite Rank
2
2020
a Outcome not included in County Composite Rank.b Data based on 2013 and 2017.c Data based on 5-year time spans, 2009-2013 and 2014-2018.d Achievement proficiency measures those that scored proficient or above on the MAP tests and Algebra I End of Course exam. Achievement data from 2014 are not shown due to differences in testing standards and assessments used in 2018; accordingly, no trend arrows or county ranks are shown.

St. Charles County
EducationLicensed child care capacity (per 1,000)
2014 117.82019 115.9
Accredited child care capacity as % of licensed capacity
2014 —2019 18.2%
School attendance, grades K-122014 95.4%2018 95.0%
Family & CommunityTeen unintentional deaths/homicides/suicides (per 100,000)
2009-2013 27.62014-2018 30.4
Single parent head-of-house-hold with children under 18
2009-2013 7.1%2014-2018 7.3%
Juvenile law violation referrals, ages 10-17 (per 1,000)
2014 20.32018 15.3
Annual high school dropout rate2014 1.3%2018 1.3%
Children entering/re-entering state custody (per 1,000)
2014 1.52018 1.4
Health
Infant mortality (per 1,000)2009-2013 5.42014-2018 4.8
Child deaths ages 1-17 (per 100,000)
2009-2013 14.32014-2018 13.3
Child deaths ages 1-14 (per 100,000)
2009-2013 11.72014-2018 9.0
Child deaths ages 15-17 (per 100,000)
2009-2013 25.32014-2018 27.0
Unrestrained automobile fatalities for children under 18a
2009-2013 50.0%2014-2018 25%
Substance abuse hospitalizations ages 1-19 (per 100,000)b
2008-2012 14
2013-2017 21.3
Mental/behavioral hospitalizations (not substance abuse) ages 1-19 (per 10,000)
2008-2012 76.5
2013-2017 90.0
Uninsured children2013 5.0%2017 3.2%
School attendance, grades 9-122014 94.3%2018 93.9%
Contextual IndicatorsCounty Seat: St. Charles
4Population: 389,985
2016
County Composite Rank
2020
2
Demographics
Total population2014 379,4932018 389,985
Child population under 182014 92,3762018 92,666
Children under 18 as % of total population
2014 24.4%2018 23.8%
Child population under 62014 28,3702018 28,622
Children under 6 as % of total population
2014 7.5%2018 7.2%
Minority child population under 18
2014 13,9152018 14,437
Minority child population under 18 as % of child population
2014 15.0%2018 15.6%
Minority child population under 6
2014 4,6222018 4,474
Minority child population under 6 as % of under 6 child population
2014 16.3%
2018 15.6%
Children in single-parent families
2009-2013 20.6%2014-2018 22.8%
Children in married-parent families
2009-2013 78.8%2014-2018 76.5%
Economic Well-being
Children in poverty under 62014 11.9%2018 8.7%
Children in poverty, ages 5-172009-2013 7.9%2014-2018 6.3%
Housing cost-burdened households
2009-2013 27.0%2014-2018 21.3%
Family households with children under 18 at 185% of poverty level
2009-2013 17.3%
2014-2018 13.8%
Children in families receiving SNAP
2014 13.7%2018 11.8%
Median income family household with children under 18
2009-2013 $87,494
2014-2018 $102,583
Adult unemployment2014 4.8%2018 2.5%
Child homelessness2014 1.3%2018 1.2%
a If no % listed, no vehicle fatalities happened in the county during that period.b *Indicates unstable rate due to low count (<20 cases);** indicates very unstable rate due to very low count (<5 cases)

Outcome MeasuresNumber Rate Trend Rank
2014 2018 2014 2018 State Rate
County Rank
Economic Well-BeingChildren under 18 in poverty 597 546 33.8% 29.6% é 18.3% 95
Food insecurity for childrenb 470 410 24.7% 23.3% é 17.5% 103
HealthLow birthweight infantsa,c 33 36 7.3% 7.3% è 8.5% 36
Preventable hospitalizations for all causes for children under 18 (per 1,000)b,c
2 10 1.1 5.5 ê 7.1 45
Child asthma ER rates (per 1,000)b
9 2 4.7 1.1 é 7.5 8
Family & CommunityBirths to teens, ages 15-19 (per 1,000)
13 9 52.6 35.9 é 21.6 92
Substantiated child abuse/neglect cases (per 1,000)a
13 11 7.0 5.9 é 4.0 68
EducationHigh school graduation 89 101 90.8% 94.4% é 91.3% 46
Achievement proficiencya,d
3rd grade English/Language Arts (MAP) 41 36.9% 48.6%
8th grade English/Language Arts (MAP)
43 39.8% 49.0%
4th grade Math (MAP) 38 39.6% 45.8%
Algebra I (End of Course exam) 31 35.2% 47.0%
Trend: é better ê worse è no change
St. Clair CountyCounty Seat: Osceola
86Population: 9,383
2016
County Composite Rank
88
2020
a Outcome not included in County Composite Rank.b Data based on 2013 and 2017.c Data based on 5-year time spans, 2009-2013 and 2014-2018.d Achievement proficiency measures those that scored proficient or above on the MAP tests and Algebra I End of Course exam. Achievement data from 2014 are not shown due to differences in testing standards and assessments used in 2018; accordingly, no trend arrows or county ranks are shown.
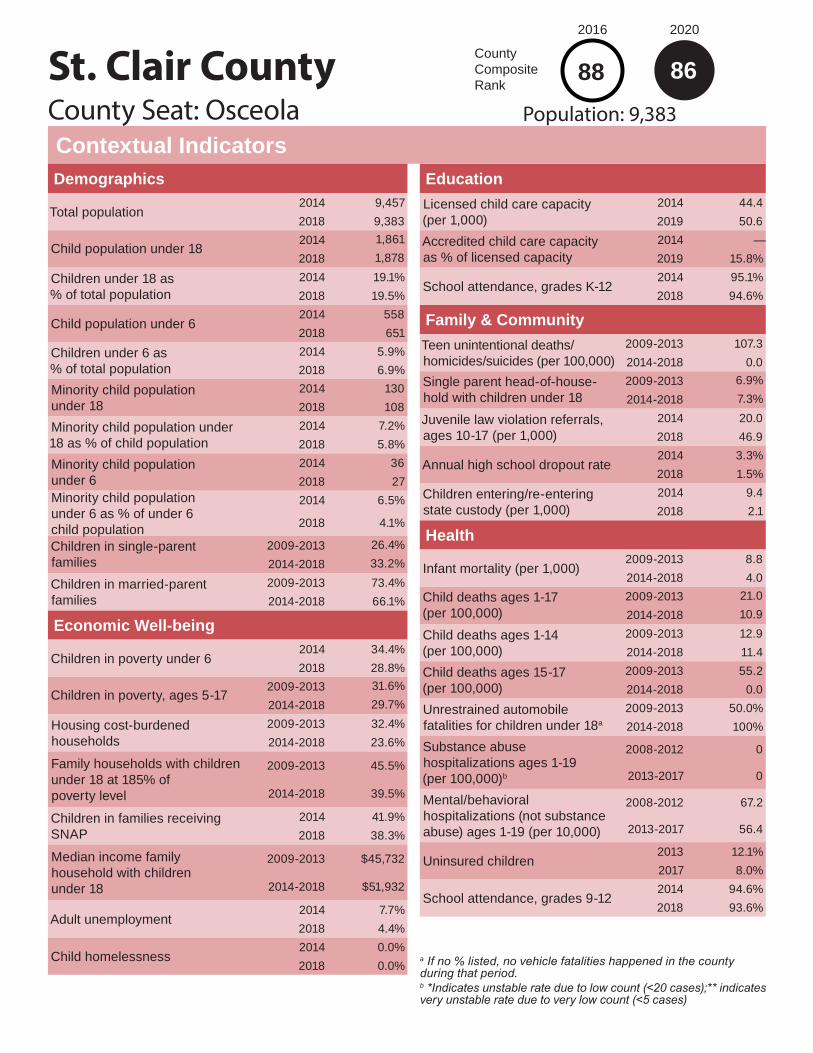
St. Clair County
EducationLicensed child care capacity (per 1,000)
2014 44.42019 50.6
Accredited child care capacity as % of licensed capacity
2014 —2019 15.8%
School attendance, grades K-122014 95.1%2018 94.6%
Family & CommunityTeen unintentional deaths/homicides/suicides (per 100,000)
2009-2013 107.32014-2018 0.0
Single parent head-of-house-hold with children under 18
2009-2013 6.9%2014-2018 7.3%
Juvenile law violation referrals, ages 10-17 (per 1,000)
2014 20.02018 46.9
Annual high school dropout rate2014 3.3%2018 1.5%
Children entering/re-entering state custody (per 1,000)
2014 9.42018 2.1
Health
Infant mortality (per 1,000)2009-2013 8.82014-2018 4.0
Child deaths ages 1-17 (per 100,000)
2009-2013 21.02014-2018 10.9
Child deaths ages 1-14 (per 100,000)
2009-2013 12.92014-2018 11.4
Child deaths ages 15-17 (per 100,000)
2009-2013 55.22014-2018 0.0
Unrestrained automobile fatalities for children under 18a
2009-2013 50.0%2014-2018 100%
Substance abuse hospitalizations ages 1-19 (per 100,000)b
2008-2012 0
2013-2017 0
Mental/behavioral hospitalizations (not substance abuse) ages 1-19 (per 10,000)
2008-2012 67.2
2013-2017 56.4
Uninsured children2013 12.1%2017 8.0%
School attendance, grades 9-122014 94.6%2018 93.6%
Contextual IndicatorsCounty Seat: Osceola
86Population: 9,383
2016
County Composite Rank
2020
88
Demographics
Total population2014 9,4572018 9,383
Child population under 182014 1,8612018 1,878
Children under 18 as % of total population
2014 19.1%2018 19.5%
Child population under 62014 5582018 651
Children under 6 as % of total population
2014 5.9%2018 6.9%
Minority child population under 18
2014 1302018 108
Minority child population under 18 as % of child population
2014 7.2%2018 5.8%
Minority child population under 6
2014 362018 27
Minority child population under 6 as % of under 6 child population
2014 6.5%
2018 4.1%
Children in single-parent families
2009-2013 26.4%2014-2018 33.2%
Children in married-parent families
2009-2013 73.4%2014-2018 66.1%
Economic Well-being
Children in poverty under 62014 34.4%2018 28.8%
Children in poverty, ages 5-172009-2013 31.6%2014-2018 29.7%
Housing cost-burdened households
2009-2013 32.4%2014-2018 23.6%
Family households with children under 18 at 185% of poverty level
2009-2013 45.5%
2014-2018 39.5%
Children in families receiving SNAP
2014 41.9%2018 38.3%
Median income family household with children under 18
2009-2013 $45,732
2014-2018 $51,932
Adult unemployment2014 7.7%2018 4.4%
Child homelessness2014 0.0%2018 0.0%
a If no % listed, no vehicle fatalities happened in the county during that period.b *Indicates unstable rate due to low count (<20 cases);** indicates very unstable rate due to very low count (<5 cases)

Outcome MeasuresNumber Rate Trend Rank
2014 2018 2014 2018 State Rate
County Rank
Economic Well-BeingChildren under 18 in poverty 718 526 18.5% 13.9% é 18.3% 16
Food insecurity for childrenb 870 790 21.1% 19.8% é 17.5% 72
HealthLow birthweight infantsa,c 51 91 5.9% 9.4% ê 8.5% 97
Preventable hospitalizations for all causes for children under 18 (per 1,000)b,c
28 12 6.8 3.1 é 7.1 5
Child asthma ER rates (per 1,000)b
12 12 2.9 3.1 ê 7.5 43
Family & CommunityBirths to teens, ages 15-19 (per 1,000)
14 14 25.3 26.6 ê 21.6 55
Substantiated child abuse/neglect cases (per 1,000)a
19 27 4.6 7.0 ê 4.0 79
EducationHigh school graduation 130 113 93.5% 85.0% ê 91.3% 113
Achievement proficiencya,d
3rd grade English/Language Arts (MAP) 79 53.7% 48.6%
8th grade English/Language Arts (MAP)
95 59.4% 49.0%
4th grade Math (MAP) 75 60.5% 45.8%
Algebra I (End of Course exam) 91 59.1% 47.0%
Trend: é better ê worse è no change
Ste. Genevieve CountyCounty Seat: Ste. Genevieve
56Population: 17,871
2016
County Composite Rank
21
2020
a Outcome not included in County Composite Rank.b Data based on 2013 and 2017.c Data based on 5-year time spans, 2009-2013 and 2014-2018.d Achievement proficiency measures those that scored proficient or above on the MAP tests and Algebra I End of Course exam. Achievement data from 2014 are not shown due to differences in testing standards and assessments used in 2018; accordingly, no trend arrows or county ranks are shown.

Ste. Genevieve County
EducationLicensed child care capacity (per 1,000)
2014 99.12019 104.9
Accredited child care capacity as % of licensed capacity
2014 —2019 9.8%
School attendance, grades K-122014 95.5%2018 95.7%
Family & CommunityTeen unintentional deaths/homicides/suicides (per 100,000)
2009-2013 51.22014-2018 69.5
Single parent head-of-house-hold with children under 18
2009-2013 7.3%2014-2018 9.6%
Juvenile law violation referrals, ages 10-17 (per 1,000)
2014 43.82018 26.1
Annual high school dropout rate2014 1.0%2018 3.2%
Children entering/re-entering state custody (per 1,000)
2014 2.22018 5.9
Health
Infant mortality (per 1,000)2009-2013 3.42014-2018 2.1
Child deaths ages 1-17 (per 100,000)
2009-2013 38.92014-2018 30.9
Child deaths ages 1-14 (per 100,000)
2009-2013 23.92014-2018 11.2
Child deaths ages 15-17 (per 100,000)
2009-2013 105.02014-2018 104.6
Unrestrained automobile fatalities for children under 18a
2009-2013 33.3%2014-2018 50%
Substance abuse hospitalizations ages 1-19 (per 100,000)b
2008-2012 15.8**
2013-2017 21.0*
Mental/behavioral hospitalizations (not substance abuse) ages 1-19 (per 10,000)
2008-2012 57.1
2013-2017 70.6
Uninsured children2013 7.9%2017 5.4%
School attendance, grades 9-122014 94.6%2018 95.1%
Contextual IndicatorsCounty Seat: Ste. Genevieve
56Population: 17,871
2016
County Composite Rank
2020
21
Demographics
Total population2014 17,9142018 17,871
Child population under 182014 4,0942018 3,880
Children under 18 as % of total population
2014 22.6%2018 21.7%
Child population under 62014 1,3172018 1,181
Children under 6 as % of total population
2014 7.3%2018 6.6%
Minority child population under 18
2014 2862018 257
Minority child population under 18 as % of child population
2014 7.1%2018 6.6%
Minority child population under 6
2014 1572018 113
Minority child population under 6 as % of under 6 child population
2014 11.9%
2018 9.6%
Children in single-parent families
2009-2013 22.6%2014-2018 36.2%
Children in married-parent families
2009-2013 76.7%2014-2018 63.3%
Economic Well-being
Children in poverty under 62014 32.7%2018 24.7%
Children in poverty, ages 5-172009-2013 16.9%2014-2018 12.8%
Housing cost-burdened households
2009-2013 31.9%2014-2018 22.5%
Family households with children under 18 at 185% of poverty level
2009-2013 31.4%
2014-2018 41.2%
Children in families receiving SNAP
2014 26.9%2018 22.5%
Median income family household with children under 18
2009-2013 $56,750
2014-2018 $59,525
Adult unemployment2014 6.6%2018 2.8%
Child homelessness2014 0.0%2018 2.9%
a If no % listed, no vehicle fatalities happened in the county during that period.b *Indicates unstable rate due to low count (<20 cases);** indicates very unstable rate due to very low count (<5 cases)

Outcome MeasuresNumber Rate Trend Rank
2014 2018 2014 2018 State Rate
County Rank
Economic Well-BeingChildren under 18 in poverty 3,612 3,366 26.3% 24.6% é 18.3% 76
Food insecurity for childrenb 3,450 2,570 24.7% 18.2% é 17.5% 45
HealthLow birthweight infantsa,c 306 307 8.0% 8.6% ê 8.5% 80
Preventable hospitalizations for all causes for children under 18 (per 1,000)b,c
95 108 6.8 7.6 ê 7.1 82
Child asthma ER rates (per 1,000)b
117 95 8.4 6.7 é 7.5 102
Family & CommunityBirths to teens, ages 15-19 (per 1,000)
67 52 39.3 27.7 é 21.6 62
Substantiated child abuse/neglect cases (per 1,000)a
102 120 7.3 8.5 ê 4.0 93
EducationHigh school graduation 696 732 93.2% 93.5% é 91.3% 61
Achievement proficiencya,d
3rd grade English/Language Arts (MAP) 401 51.2% 48.6%
8th grade English/Language Arts (MAP)
395 49.4% 49.0%
4th grade Math (MAP) 439 50.6% 45.8%
Algebra I (End of Course exam) 455 51.0% 47.0%
Trend: é better ê worse è no change
St. Francois CountyCounty Seat: Farmington
82Population: 66,342
2016
County Composite Rank
83
2020
a Outcome not included in County Composite Rank.b Data based on 2013 and 2017.c Data based on 5-year time spans, 2009-2013 and 2014-2018.d Achievement proficiency measures those that scored proficient or above on the MAP tests and Algebra I End of Course exam. Achievement data from 2014 are not shown due to differences in testing standards and assessments used in 2018; accordingly, no trend arrows or county ranks are shown.

St. Francois County
EducationLicensed child care capacity (per 1,000)
2014 119.92019 113.2
Accredited child care capacity as % of licensed capacity
2014 —2019 8.3%
School attendance, grades K-122014 94.9%2018 94.7%
Family & CommunityTeen unintentional deaths/homicides/suicides (per 100,000)
2009-2013 56.12014-2018 52.1
Single parent head-of-house-hold with children under 18
2009-2013 8.6%2014-2018 8.9%
Juvenile law violation referrals, ages 10-17 (per 1,000)
2014 55.52018 41.4
Annual high school dropout rate2014 1.7%2018 1.4%
Children entering/re-entering state custody (per 1,000)
2014 5.82018 7.3
Health
Infant mortality (per 1,000)2009-2013 6.82014-2018 6.4
Child deaths ages 1-17 (per 100,000)
2009-2013 28.72014-2018 24.2
Child deaths ages 1-14 (per 100,000)
2009-2013 25.12014-2018 12.0
Child deaths ages 15-17 (per 100,000)
2009-2013 42.92014-2018 72.3
Unrestrained automobile fatalities for children under 18a
2009-2013 100.0%2014-2018 50%
Substance abuse hospitalizations ages 1-19 (per 100,000)b
2008-2012 22.9
2013-2017 26.7
Mental/behavioral hospitalizations (not substance abuse) ages 1-19 (per 10,000)
2008-2012 102.0
2013-2017 110.9
Uninsured children2013 6.4%2017 4.3%
School attendance, grades 9-122014 94.4%2018 94.2%
Contextual IndicatorsCounty Seat: Farmington
82Population: 66,342
2016
County Composite Rank
2020
83
Demographics
Total population2014 65,9602018 66,342
Child population under 182014 13,9202018 14,102
Children under 18 as % of total population
2014 21.4%2018 21.2%
Child population under 62014 4,3622018 4,345
Children under 6 as % of total population
2014 6.6%2018 6.5%
Minority child population under 18
2014 7832018 894
Minority child population under 18 as % of child population
2014 5.5%2018 6.3%
Minority child population under 6
2014 2682018 340
Minority child population under 6 as % of under 6 child population
2014 6.1%
2018 7.8%
Children in single-parent families
2009-2013 29.5%2014-2018 31.7%
Children in married-parent families
2009-2013 67.2%2014-2018 66.9%
Economic Well-being
Children in poverty under 62014 30.2%2018 29.4%
Children in poverty, ages 5-172009-2013 23.7%2014-2018 23.3%
Housing cost-burdened households
2009-2013 30.1%2014-2018 26.6%
Family households with children under 18 at 185% of poverty level
2009-2013 45.1%
2014-2018 40.1%
Children in families receiving SNAP
2014 46.9%2018 40.4%
Median income family household with children under 18
2009-2013 $42,806
2014-2018 $56,635
Adult unemployment2014 7.5%2018 3.7%
Child homelessness2014 3.1%2018 4.7%
a If no % listed, no vehicle fatalities happened in the county during that period.b *Indicates unstable rate due to low count (<20 cases);** indicates very unstable rate due to very low count (<5 cases)

Outcome MeasuresNumber Rate Trend Rank
2014 2018 2014 2018 State Rate
County Rank
Economic Well-BeingChildren under 18 in poverty 30,191 33,839 13.7% 15.7% ê 18.3% 23
Food insecurity for childrenb 39,980 32,440 17.3% 14.6% é 17.5% 7
HealthLow birthweight infantsa,c 5,114 5,571 8.7% 9.6% ê 8.5% 101
Preventable hospitalizations for all causes for children under 18 (per 1,000)b,c
1,594 1,595 6.9 7.3 ê 7.1 76
Child asthma ER rates (per 1,000)b
3,614 2,747 15.7 12.5 é 7.5 113
Family & CommunityBirths to teens, ages 15-19 (per 1,000)
552 445 17.2 14.5 é 21.6 14
Substantiated child abuse/neglect cases (per 1,000)a
478 368 2.1 1.7 é 4.0 8
EducationHigh school graduation 9,834 9,645 89.3% 91.0% é 91.3% 89
Achievement proficiencya,d
3rd grade English/Language Arts (MAP) 5,262 50.6% 48.6%
8th grade English/Language Arts (MAP)
5,562 52.2% 49.0%
4th grade Math (MAP) 4,941 46.2% 45.8%
Algebra I (End of Course exam) 4,905 51.6% 47.0%
Trend: é better ê worse è no change
St. Louis CountyCounty Seat: Clayton
66Population: 998,684
2016
County Composite Rank
49
2020
a Outcome not included in County Composite Rank.b Data based on 2013 and 2017.c Data based on 5-year time spans, 2009-2013 and 2014-2018.d Achievement proficiency measures those that scored proficient or above on the MAP tests and Algebra I End of Course exam. Achievement data from 2014 are not shown due to differences in testing standards and assessments used in 2018; accordingly, no trend arrows or county ranks are shown.
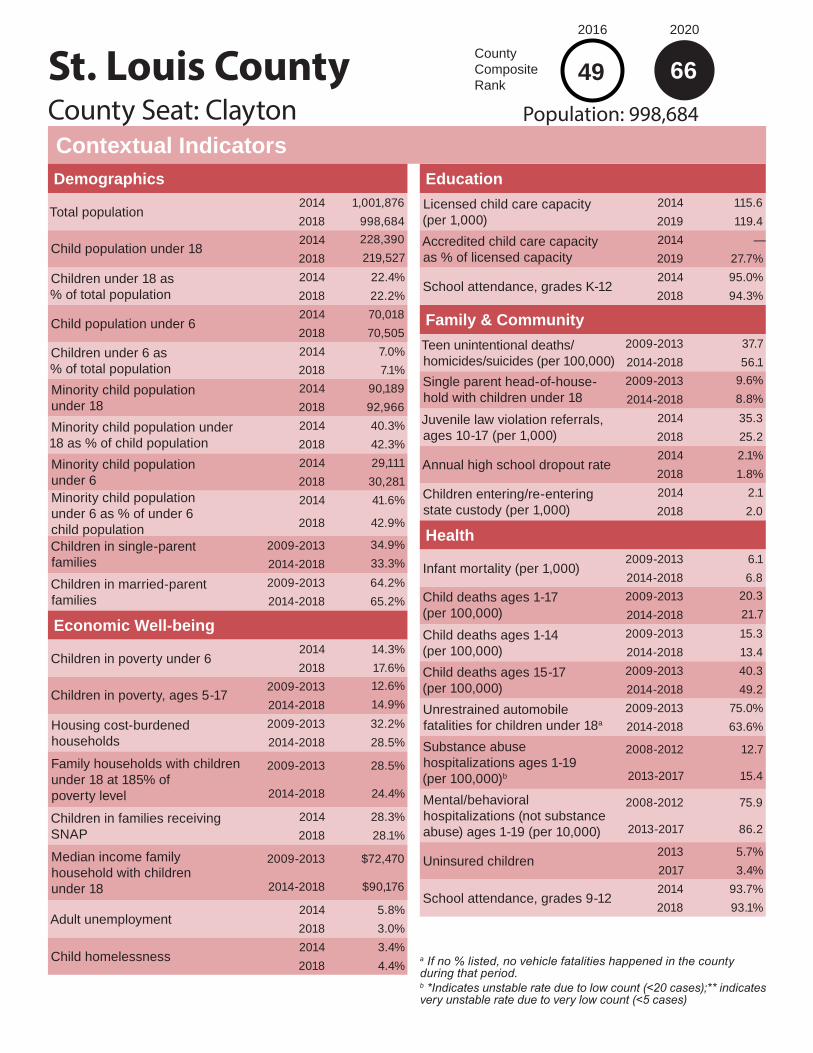
St. Louis County
EducationLicensed child care capacity (per 1,000)
2014 115.62019 119.4
Accredited child care capacity as % of licensed capacity
2014 —2019 27.7%
School attendance, grades K-122014 95.0%2018 94.3%
Family & CommunityTeen unintentional deaths/homicides/suicides (per 100,000)
2009-2013 37.72014-2018 56.1
Single parent head-of-house-hold with children under 18
2009-2013 9.6%2014-2018 8.8%
Juvenile law violation referrals, ages 10-17 (per 1,000)
2014 35.32018 25.2
Annual high school dropout rate2014 2.1%2018 1.8%
Children entering/re-entering state custody (per 1,000)
2014 2.12018 2.0
Health
Infant mortality (per 1,000)2009-2013 6.12014-2018 6.8
Child deaths ages 1-17 (per 100,000)
2009-2013 20.32014-2018 21.7
Child deaths ages 1-14 (per 100,000)
2009-2013 15.32014-2018 13.4
Child deaths ages 15-17 (per 100,000)
2009-2013 40.32014-2018 49.2
Unrestrained automobile fatalities for children under 18a
2009-2013 75.0%2014-2018 63.6%
Substance abuse hospitalizations ages 1-19 (per 100,000)b
2008-2012 12.7
2013-2017 15.4
Mental/behavioral hospitalizations (not substance abuse) ages 1-19 (per 10,000)
2008-2012 75.9
2013-2017 86.2
Uninsured children2013 5.7%2017 3.4%
School attendance, grades 9-122014 93.7%2018 93.1%
Contextual IndicatorsCounty Seat: Clayton
66Population: 998,684
2016
County Composite Rank
2020
49
Demographics
Total population2014 1,001,8762018 998,684
Child population under 182014 228,3902018 219,527
Children under 18 as % of total population
2014 22.4%2018 22.2%
Child population under 62014 70,0182018 70,505
Children under 6 as % of total population
2014 7.0%2018 7.1%
Minority child population under 18
2014 90,1892018 92,966
Minority child population under 18 as % of child population
2014 40.3%2018 42.3%
Minority child population under 6
2014 29,1112018 30,281
Minority child population under 6 as % of under 6 child population
2014 41.6%
2018 42.9%
Children in single-parent families
2009-2013 34.9%2014-2018 33.3%
Children in married-parent families
2009-2013 64.2%2014-2018 65.2%
Economic Well-being
Children in poverty under 62014 14.3%2018 17.6%
Children in poverty, ages 5-172009-2013 12.6%2014-2018 14.9%
Housing cost-burdened households
2009-2013 32.2%2014-2018 28.5%
Family households with children under 18 at 185% of poverty level
2009-2013 28.5%
2014-2018 24.4%
Children in families receiving SNAP
2014 28.3%2018 28.1%
Median income family household with children under 18
2009-2013 $72,470
2014-2018 $90,176
Adult unemployment2014 5.8%2018 3.0%
Child homelessness2014 3.4%2018 4.4%
a If no % listed, no vehicle fatalities happened in the county during that period.b *Indicates unstable rate due to low count (<20 cases);** indicates very unstable rate due to very low count (<5 cases)

Outcome MeasuresNumber Rate Trend Rank
2014 2018 2014 2018 State Rate
County Rank
Economic Well-BeingChildren under 18 in poverty 1,191 981 23.0% 20.0% é 18.3% 41
Food insecurity for childrenb 1,210 1,000 22.7% 19% é 17.5% 55
HealthLow birthweight infantsa,c 131 114 8.6% 8.8% ê 8.5% 89
Preventable hospitalizations for all causes for children under 18 (per 1,000)b,c
37 30 6.9 5.8 é 7.1 52
Child asthma ER rates (per 1,000)b
28 26 5.3 5.0 é 7.5 80
Family & CommunityBirths to teens, ages 15-19 (per 1,000)
21 23 26.7 28.8 ê 21.6 64
Substantiated child abuse/neglect cases (per 1,000)a
28 39 5.2 7.6 ê 4.0 86
EducationHigh school graduation 237 222 89.8% 88.1% ê 91.3% 104
Achievement proficiencya,d
3rd grade English/Language Arts (MAP) 96 34.2% 48.6%
8th grade English/Language Arts (MAP)
114 43.7% 49.0%
4th grade Math (MAP) 68 27.1% 45.8%
Algebra I (End of Course exam) 92 35.1% 47.0%
Trend: é better ê worse è no change
Saline CountyCounty Seat: Marshall
83Population: 23,102
2016
County Composite Rank
56
2020
a Outcome not included in County Composite Rank.b Data based on 2013 and 2017.c Data based on 5-year time spans, 2009-2013 and 2014-2018.d Achievement proficiency measures those that scored proficient or above on the MAP tests and Algebra I End of Course exam. Achievement data from 2014 are not shown due to differences in testing standards and assessments used in 2018; accordingly, no trend arrows or county ranks are shown.

Saline County
EducationLicensed child care capacity (per 1,000)
2014 80.72019 51.0
Accredited child care capacity as % of licensed capacity
2014 —2019 15.7%
School attendance, grades K-122014 95.3%2018 95.1%
Family & CommunityTeen unintentional deaths/homicides/suicides (per 100,000)
2009-2013 43.82014-2018 22.2
Single parent head-of-house-hold with children under 18
2009-2013 9.6%2014-2018 9.3%
Juvenile law violation referrals, ages 10-17 (per 1,000)
2014 36.52018 42.1
Annual high school dropout rate2014 2.3%2018 1.7%
Children entering/re-entering state custody (per 1,000)
2014 4.12018 3.9
Health
Infant mortality (per 1,000)2009-2013 7.92014-2018 7.0
Child deaths ages 1-17 (per 100,000)
2009-2013 3.82014-2018 15.1
Child deaths ages 1-14 (per 100,000)
2009-2013 4.52014-2018 7.8
Child deaths ages 15-17 (per 100,000)
2009-2013 0.02014-2018 46.8
Unrestrained automobile fatalities for children under 18a
2009-2013 %2014-2018 100%
Substance abuse hospitalizations ages 1-19 (per 100,000)b
2008-2012 8.5**
2013-2017 23.3*
Mental/behavioral hospitalizations (not substance abuse) ages 1-19 (per 10,000)
2008-2012 106.8
2013-2017 106.8
Uninsured children2013 8.0%2017 6.2%
School attendance, grades 9-122014 94.5%2018 94.5%
Contextual IndicatorsCounty Seat: Marshall
83Population: 23,102
2016
County Composite Rank
2020
56
Demographics
Total population2014 23,3472018 23,102
Child population under 182014 5,3392018 5,120
Children under 18 as % of total population
2014 23.1%2018 22.9%
Child population under 62014 1,7752018 1,573
Children under 6 as % of total population
2014 7.6%2018 6.9%
Minority child population under 18
2014 1,3832018 1,333
Minority child population under 18 as % of child population
2014 25.7%2018 26.0%
Minority child population under 6
2014 5502018 418
Minority child population under 6 as % of under 6 child population
2014 31.0%
2018 26.6%
Children in single-parent families
2009-2013 37.6%2014-2018 32.1%
Children in married-parent families
2009-2013 58.2%2014-2018 64.8%
Economic Well-being
Children in poverty under 62014 29.0%2018 25.8%
Children in poverty, ages 5-172009-2013 21.1%2014-2018 18.5%
Housing cost-burdened households
2009-2013 29.7%2014-2018 27.1%
Family households with children under 18 at 185% of poverty level
2009-2013 48.0%
2014-2018 43.7%
Children in families receiving SNAP
2014 39.3%2018 35.7%
Median income family household with children under 18
2009-2013 $40,386
2014-2018 $51,817
Adult unemployment2014 5.6%2018 3.0%
Child homelessness2014 8.4%2018 10.8%
a If no % listed, no vehicle fatalities happened in the county during that period.b *Indicates unstable rate due to low count (<20 cases);** indicates very unstable rate due to very low count (<5 cases)

Outcome MeasuresNumber Rate Trend Rank
2014 2018 2014 2018 State Rate
County Rank
Economic Well-BeingChildren under 18 in poverty 315 306 29.5% 27.3% é 18.3% 91
Food insecurity for childrenb 320 250 28.5% 20.8% é 17.5% 86
HealthLow birthweight infantsa,c 23 27 8.0% 7.8% é 8.5% 52
Preventable hospitalizations for all causes for children under 18 (per 1,000)b,c
11 5 9.8 4.3 é 7.1 21
Child asthma ER rates (per 1,000)b
2 1 1.8 0.9 é 7.5 5
Family & CommunityBirths to teens, ages 15-19 (per 1,000)
2 4 12.4 30.1 ê 21.6 71
Substantiated child abuse/neglect cases (per 1,000)a
15 5 13.4 4.3 é 4.0 44
EducationHigh school graduation 40 36 95.2% 90.0% ê 91.3% 94
Achievement proficiencya,d
3rd grade English/Language Arts (MAP) 17 54.8% 48.6%
8th grade English/Language Arts (MAP)
15 37.5% 49.0%
4th grade Math (MAP) 17 40.5% 45.8%
Algebra I (End of Course exam) 12 30.0% 47.0%
Trend: é better ê worse è no change
Schuyler CountyCounty Seat: Lancaster
71Population: 4,502
2016
County Composite Rank
54
2020
a Outcome not included in County Composite Rank.b Data based on 2013 and 2017.c Data based on 5-year time spans, 2009-2013 and 2014-2018.d Achievement proficiency measures those that scored proficient or above on the MAP tests and Algebra I End of Course exam. Achievement data from 2014 are not shown due to differences in testing standards and assessments used in 2018; accordingly, no trend arrows or county ranks are shown.

Schuyler County
EducationLicensed child care capacity (per 1,000)
2014 54.12019 51.9
Accredited child care capacity as % of licensed capacity
2014 —2019 0.0%
School attendance, grades K-122014 95.4%2018 94.7%
Family & CommunityTeen unintentional deaths/homicides/suicides (per 100,000)
2009-2013 63.52014-2018 128.6
Single parent head-of-house-hold with children under 18
2009-2013 9.0%2014-2018 7.4%
Juvenile law violation referrals, ages 10-17 (per 1,000)
2014 12.82018 20.2
Annual high school dropout rate2014 0.5%2018 2.0%
Children entering/re-entering state custody (per 1,000)
2014 9.92018 3.5
Health
Infant mortality (per 1,000)2009-2013 3.52014-2018 2.9
Child deaths ages 1-17 (per 100,000)
2009-2013 53.52014-2018 16.7
Child deaths ages 1-14 (per 100,000)
2009-2013 43.62014-2018 0.0
Child deaths ages 15-17 (per 100,000)
2009-2013 97.62014-2018 93.5
Unrestrained automobile fatalities for children under 18a
2009-2013 100.0%2014-2018 100%
Substance abuse hospitalizations ages 1-19 (per 100,000)b
2008-2012 0
2013-2017 13.7**
Mental/behavioral hospitalizations (not substance abuse) ages 1-19 (per 10,000)
2008-2012 38.8
2013-2017 27.4
Uninsured children2013 15.0%2017 10.1%
School attendance, grades 9-122014 94.0%2018 93.7%
Contextual IndicatorsCounty Seat: Lancaster
71Population: 4,502
2016
County Composite Rank
2020
54
Demographics
Total population2014 4,3702018 4,502
Child population under 182014 1,1162018 1,156
Children under 18 as % of total population
2014 25.4%2018 26.6%
Child population under 62014 3222018 425
Children under 6 as % of total population
2014 7.3%2018 9.2%
Minority child population under 18
2014 422018 49
Minority child population under 18 as % of child population
2014 3.8%2018 4.2%
Minority child population under 6
2014 142018 19
Minority child population under 6 as % of under 6 child population
2014 4.3%
2018 4.5%
Children in single-parent families
2009-2013 20.9%2014-2018 29.6%
Children in married-parent families
2009-2013 77.7%2014-2018 68.9%
Economic Well-being
Children in poverty under 62014 26.6%2018 25.1%
Children in poverty, ages 5-172009-2013 27.3%2014-2018 28.1%
Housing cost-burdened households
2009-2013 27.8%2014-2018 20.3%
Family households with children under 18 at 185% of poverty level
2009-2013 46.2%
2014-2018 41.1%
Children in families receiving SNAP
2014 28.4%2018 19.5%
Median income family household with children under 18
2009-2013 $38,429
2014-2018 $52,159
Adult unemployment2014 7.0%2018 4.1%
Child homelessness2014 0.0%2018 0.0%
a If no % listed, no vehicle fatalities happened in the county during that period.b *Indicates unstable rate due to low count (<20 cases);** indicates very unstable rate due to very low count (<5 cases)

Outcome MeasuresNumber Rate Trend Rank
2014 2018 2014 2018 State Rate
County Rank
Economic Well-BeingChildren under 18 in poverty 335 333 24.9% 23.3% é 18.3% 67
Food insecurity for childrenb 300 270 21.5% 19.2% é 17.5% 61
HealthLow birthweight infantsa,c 17 24 4.4% 5.9% ê 8.5% 4
Preventable hospitalizations for all causes for children under 18 (per 1,000)b,c
6 8 4.3 5.5 ê 7.1 46
Child asthma ER rates (per 1,000)b
4 3 2.9 2.1 é 7.5 22
Family & CommunityBirths to teens, ages 15-19 (per 1,000)
4 1 22.6 6.4 é 21.6 5
Substantiated child abuse/neglect cases (per 1,000)a
6 7 4.4 4.8 ê 4.0 58
EducationHigh school graduation 39 32 97.5% 97.0% ê 91.3% 17
Achievement proficiencya,d
3rd grade English/Language Arts (MAP) 22 50.0% 48.6%
8th grade English/Language Arts (MAP)
24 57.1% 49.0%
4th grade Math (MAP) 14 37.8% 45.8%
Algebra I (End of Course exam) 18 36.7% 47.0%
Trend: é better ê worse è no change
Scotland CountyCounty Seat: Memphis
15Population: 4,898
2016
County Composite Rank
11
2020
a Outcome not included in County Composite Rank.b Data based on 2013 and 2017.c Data based on 5-year time spans, 2009-2013 and 2014-2018.d Achievement proficiency measures those that scored proficient or above on the MAP tests and Algebra I End of Course exam. Achievement data from 2014 are not shown due to differences in testing standards and assessments used in 2018; accordingly, no trend arrows or county ranks are shown.

Scotland County
EducationLicensed child care capacity (per 1,000)
2014 66.92019 65.6
Accredited child care capacity as % of licensed capacity
2014 —2019 0.0%
School attendance, grades K-122014 95.6%2018 94.4%
Family & CommunityTeen unintentional deaths/homicides/suicides (per 100,000)
2009-2013 0.02014-2018 66.4
Single parent head-of-house-hold with children under 18
2009-2013 2.2%2014-2018 6.4%
Juvenile law violation referrals, ages 10-17 (per 1,000)
2014 0.02018 3.2
Annual high school dropout rate2014 0.5%2018 0.0%
Children entering/re-entering state custody (per 1,000)
2014 2.92018 15.0
Health
Infant mortality (per 1,000)2009-2013 2.62014-2018 2.5
Child deaths ages 1-17 (per 100,000)
2009-2013 28.92014-2018 14.4
Child deaths ages 1-14 (per 100,000)
2009-2013 34.72014-2018 14.5
Child deaths ages 15-17 (per 100,000)
2009-2013 0.02014-2018 0.0
Unrestrained automobile fatalities for children under 18a
2009-2013 %2014-2018 %
Substance abuse hospitalizations ages 1-19 (per 100,000)b
2008-2012 0
2013-2017 0
Mental/behavioral hospitalizations (not substance abuse) ages 1-19 (per 10,000)
2008-2012 30.7
2013-2017 37.3
Uninsured children2013 11.9%2017 17.5%
School attendance, grades 9-122014 94.5%2018 93.5%
Contextual IndicatorsCounty Seat: Memphis
15Population: 4,898
2016
County Composite Rank
2020
11
Demographics
Total population2014 4,8632018 4,898
Child population under 182014 1,3742018 1,463
Children under 18 as % of total population
2014 28.3%2018 28.4%
Child population under 62014 4662018 516
Children under 6 as % of total population
2014 9.6%2018 10.4%
Minority child population under 18
2014 372018 33
Minority child population under 18 as % of child population
2014 2.7%2018 2.3%
Minority child population under 6
2014 112018 7
Minority child population under 6 as % of under 6 child population
2014 2.4%
2018 1.4%
Children in single-parent families
2009-2013 23.5%2014-2018 18.6%
Children in married-parent families
2009-2013 74.3%2014-2018 81.2%
Economic Well-being
Children in poverty under 62014 26.6%2018 25.0%
Children in poverty, ages 5-172009-2013 24.2%2014-2018 23.2%
Housing cost-burdened households
2009-2013 21.1%2014-2018 31.0%
Family households with children under 18 at 185% of poverty level
2009-2013 55.5%
2014-2018 48.3%
Children in families receiving SNAP
2014 17.4%2018 12.1%
Median income family household with children under 18
2009-2013 $42,411
2014-2018 $63,281
Adult unemployment2014 4.8%2018 2.9%
Child homelessness2014 1.7%2018 0.0%
a If no % listed, no vehicle fatalities happened in the county during that period.b *Indicates unstable rate due to low count (<20 cases);** indicates very unstable rate due to very low count (<5 cases)

Outcome MeasuresNumber Rate Trend Rank
2014 2018 2014 2018 State Rate
County Rank
Economic Well-BeingChildren under 18 in poverty 2,821 2,412 31.0% 26.7% é 18.3% 89
Food insecurity for childrenb 2,230 1,960 23.2% 21.2% é 17.5% 90
HealthLow birthweight infantsa,c 241 246 8.9% 10.1% ê 8.5% 105
Preventable hospitalizations for all causes for children under 18 (per 1,000)b,c
155 103 16.1 11.2 é 7.1 108
Child asthma ER rates (per 1,000)b
77 66 8.0 7.2 é 7.5 104
Family & CommunityBirths to teens, ages 15-19 (per 1,000)
52 53 47.9 48 ê 21.6 109
Substantiated child abuse/neglect cases (per 1,000)a
48 66 5.1 7.1 ê 4.0 80
EducationHigh school graduation 463 426 96.7% 92.4% ê 91.3% 75
Achievement proficiencya,d
3rd grade English/Language Arts (MAP) 196 37.1% 48.6%
8th grade English/Language Arts (MAP)
179 35.9% 49.0%
4th grade Math (MAP) 180 35.4% 45.8%
Algebra I (End of Course exam) 210 47.5% 47.0%
Trend: é better ê worse è no change
Scott CountyCounty Seat: Benton
109Population: 38,729
2016
County Composite Rank
97
2020
a Outcome not included in County Composite Rank.b Data based on 2013 and 2017.c Data based on 5-year time spans, 2009-2013 and 2014-2018.d Achievement proficiency measures those that scored proficient or above on the MAP tests and Algebra I End of Course exam. Achievement data from 2014 are not shown due to differences in testing standards and assessments used in 2018; accordingly, no trend arrows or county ranks are shown.

Scott County
EducationLicensed child care capacity (per 1,000)
2014 117.82019 112.1
Accredited child care capacity as % of licensed capacity
2014 —2019 1.9%
School attendance, grades K-122014 95.4%2018 95.0%
Family & CommunityTeen unintentional deaths/homicides/suicides (per 100,000)
2009-2013 37.92014-2018 69.9
Single parent head-of-house-hold with children under 18
2009-2013 11.5%2014-2018 11.8%
Juvenile law violation referrals, ages 10-17 (per 1,000)
2014 48.42018 51.5
Annual high school dropout rate2014 0.5%2018 1.2%
Children entering/re-entering state custody (per 1,000)
2014 6.62018 7.8
Health
Infant mortality (per 1,000)2009-2013 7.82014-2018 8.6
Child deaths ages 1-17 (per 100,000)
2009-2013 35.32014-2018 19.5
Child deaths ages 1-14 (per 100,000)
2009-2013 32.52014-2018 11.1
Child deaths ages 15-17 (per 100,000)
2009-2013 48.52014-2018 53.4
Unrestrained automobile fatalities for children under 18a
2009-2013 100.0%2014-2018 100%
Substance abuse hospitalizations ages 1-19 (per 100,000)b
2008-2012 8.2*
2013-2017 15.7*
Mental/behavioral hospitalizations (not substance abuse) ages 1-19 (per 10,000)
2008-2012 75.5
2013-2017 77.0
Uninsured children2013 6.4%2017 4.6%
School attendance, grades 9-122014 94.1%2018 94%
Contextual IndicatorsCounty Seat: Benton
109Population: 38,729
2016
County Composite Rank
2020
97
Demographics
Total population2014 38,9032018 38,729
Child population under 182014 9,5022018 9,253
Children under 18 as % of total population
2014 23.9%2018 23.8%
Child population under 62014 3,2162018 2,965
Children under 6 as % of total population
2014 8.3%2018 7.7%
Minority child population under 18
2014 2,1062018 2,140
Minority child population under 18 as % of child population
2014 22.7%2018 23.1%
Minority child population under 6
2014 8272018 736
Minority child population under 6 as % of under 6 child population
2014 25.7%
2018 24.8%
Children in single-parent families
2009-2013 40.0%2014-2018 39.8%
Children in married-parent families
2009-2013 58.2%2014-2018 59.3%
Economic Well-being
Children in poverty under 62014 34.8%2018 30.4%
Children in poverty, ages 5-172009-2013 27.2%2014-2018 23.8%
Housing cost-burdened households
2009-2013 24.2%2014-2018 24.0%
Family households with children under 18 at 185% of poverty level
2009-2013 49.2%
2014-2018 46.6%
Children in families receiving SNAP
2014 52.7%2018 49.8%
Median income family household with children under 18
2009-2013 $43,793
2014-2018 $44,406
Adult unemployment2014 6.6%2018 3.4%
Child homelessness2014 0.6%2018 1.2%
a If no % listed, no vehicle fatalities happened in the county during that period.b *Indicates unstable rate due to low count (<20 cases);** indicates very unstable rate due to very low count (<5 cases)

Outcome MeasuresNumber Rate Trend Rank
2014 2018 2014 2018 State Rate
County Rank
Economic Well-BeingChildren under 18 in poverty 865 643 47.8% 37.4% é 18.3% 110
Food insecurity for childrenb 590 490 28.8% 26.8% é 17.5% 114
HealthLow birthweight infantsa,c 44 45 8.9% 10.1% ê 8.5% 106
Preventable hospitalizations for all causes for children under 18 (per 1,000)b,c
12 15 5.9 8.5 ê 7.1 91
Child asthma ER rates (per 1,000)b
5 4 2.4 2.3 é 7.5 25
Family & CommunityBirths to teens, ages 15-19 (per 1,000)
9 9 36.1 40.4 ê 21.6 101
Substantiated child abuse/neglect cases (per 1,000)a
27 26 13.9 14.8 ê 4.0 111
EducationHigh school graduation 53 49 94.6% 100.0% é 91.3% 1
Achievement proficiencya,d
3rd grade English/Language Arts (MAP) 28 50.0% 48.6%
8th grade English/Language Arts (MAP)
31 57.4% 49.0%
4th grade Math (MAP) 9 17.0% 45.8%
Algebra I (End of Course exam) 18 43.9% 47.0%
Trend: é better ê worse è no change
Shannon CountyCounty Seat: Eminence
102Population: 8,246
2016
County Composite Rank
99
2020
a Outcome not included in County Composite Rank.b Data based on 2013 and 2017.c Data based on 5-year time spans, 2009-2013 and 2014-2018.d Achievement proficiency measures those that scored proficient or above on the MAP tests and Algebra I End of Course exam. Achievement data from 2014 are not shown due to differences in testing standards and assessments used in 2018; accordingly, no trend arrows or county ranks are shown.

Shannon County
EducationLicensed child care capacity (per 1,000)
2014 51.32019 72.8
Accredited child care capacity as % of licensed capacity
2014 —2019 15.6%
School attendance, grades K-122014 95.7%2018 95.4%
Family & CommunityTeen unintentional deaths/homicides/suicides (per 100,000)
2009-2013 107.72014-2018 68.3
Single parent head-of-house-hold with children under 18
2009-2013 7.3%2014-2018 8.1%
Juvenile law violation referrals, ages 10-17 (per 1,000)
2014 10.62018 5.9
Annual high school dropout rate2014 0.0%2018 0.0%
Children entering/re-entering state custody (per 1,000)
2014 1.62018 11.9
Health
Infant mortality (per 1,000)2009-2013 10.12014-2018 9.0
Child deaths ages 1-17 (per 100,000)
2009-2013 19.62014-2018 11.1
Child deaths ages 1-14 (per 100,000)
2009-2013 12.72014-2018 0.0
Child deaths ages 15-17 (per 100,000)
2009-2013 52.52014-2018 64.3
Unrestrained automobile fatalities for children under 18a
2009-2013 100.0%2014-2018 %
Substance abuse hospitalizations ages 1-19 (per 100,000)b
2008-2012 25.5**
2013-2017 8.7**
Mental/behavioral hospitalizations (not substance abuse) ages 1-19 (per 10,000)
2008-2012 40.0
2013-2017 75.8
Uninsured children2013 10.9%2017 7.2%
School attendance, grades 9-122014 95.2%2018 94.8%
Contextual IndicatorsCounty Seat: Eminence
102Population: 8,246
2016
County Composite Rank
2020
99
Demographics
Total population2014 8,3292018 8,246
Child population under 182014 1,9412018 1,759
Children under 18 as % of total population
2014 22.2%2018 21.8%
Child population under 62014 5542018 516
Children under 6 as % of total population
2014 6.7%2018 6.3%
Minority child population under 18
2014 1062018 122
Minority child population under 18 as % of child population
2014 5.7%2018 6.9%
Minority child population under 6
2014 272018 48
Minority child population under 6 as % of under 6 child population
2014 4.9%
2018 9.3%
Children in single-parent families
2009-2013 26.1%2014-2018 37.4%
Children in married-parent families
2009-2013 72.8%2014-2018 60.6%
Economic Well-being
Children in poverty under 62014 34.8%2018 40.7%
Children in poverty, ages 5-172009-2013 43.5%2014-2018 35.5%
Housing cost-burdened households
2009-2013 27.4%2014-2018 25.4%
Family households with children under 18 at 185% of poverty level
2009-2013 51.7%
2014-2018 57.1%
Children in families receiving SNAP
2014 49.1%2018 50.3%
Median income family household with children under 18
2009-2013 $40,069
2014-2018 $45,844
Adult unemployment2014 9.4%2018 5.0%
Child homelessness2014 0.0%2018 0.0%
a If no % listed, no vehicle fatalities happened in the county during that period.b *Indicates unstable rate due to low count (<20 cases);** indicates very unstable rate due to very low count (<5 cases)

Outcome MeasuresNumber Rate Trend Rank
2014 2018 2014 2018 State Rate
County Rank
Economic Well-BeingChildren under 18 in poverty 324 287 24.1% 20.7% é 18.3% 45
Food insecurity for childrenb 350 290 23.1% 20% é 17.5% 75
HealthLow birthweight infantsa,c 32 31 8.8% 8.1% é 8.5% 61
Preventable hospitalizations for all causes for children under 18 (per 1,000)b,c
15 13 9.9 8.9 é 7.1 96
Child asthma ER rates (per 1,000)b
2 8 1.3 5.5 ê 7.5 88
Family & CommunityBirths to teens, ages 15-19 (per 1,000)
3 6 16.7 33.7 ê 21.6 82
Substantiated child abuse/neglect cases (per 1,000)a
19 19 12.8 13.0 ê 4.0 110
EducationHigh school graduation 76 75 95.0% 92.6% ê 91.3% 70
Achievement proficiencya,d
3rd grade English/Language Arts (MAP) 39 50.0% 48.6%
8th grade English/Language Arts (MAP)
34 47.9% 49.0%
4th grade Math (MAP) 42 50.6% 45.8%
Algebra I (End of Course exam) 38 52.1% 47.0%
Trend: é better ê worse è no change
Shelby CountyCounty Seat: Shelbyville
91Population: 6,061
2016
County Composite Rank
29
2020
a Outcome not included in County Composite Rank.b Data based on 2013 and 2017.c Data based on 5-year time spans, 2009-2013 and 2014-2018.d Achievement proficiency measures those that scored proficient or above on the MAP tests and Algebra I End of Course exam. Achievement data from 2014 are not shown due to differences in testing standards and assessments used in 2018; accordingly, no trend arrows or county ranks are shown.

Shelby County
EducationLicensed child care capacity (per 1,000)
2014 28.12019 20.6
Accredited child care capacity as % of licensed capacity
2014 —2019 0.0%
School attendance, grades K-122014 96.2%2018 95.9%
Family & CommunityTeen unintentional deaths/homicides/suicides (per 100,000)
2009-2013 142.92014-2018 158.7
Single parent head-of-house-hold with children under 18
2009-2013 7.9%2014-2018 8.4%
Juvenile law violation referrals, ages 10-17 (per 1,000)
2014 30.02018 26.5
Annual high school dropout rate2014 0.9%2018 1.0%
Children entering/re-entering state custody (per 1,000)
2014 6.32018 8.2
Health
Infant mortality (per 1,000)2009-2013 13.82014-2018 7.8
Child deaths ages 1-17 (per 100,000)
2009-2013 39.52014-2018 68.6
Child deaths ages 1-14 (per 100,000)
2009-2013 15.92014-2018 42.7
Child deaths ages 15-17 (per 100,000)
2009-2013 139.42014-2018 157.5
Unrestrained automobile fatalities for children under 18a
2009-2013 %2014-2018 100%
Substance abuse hospitalizations ages 1-19 (per 100,000)b
2008-2012 0
2013-2017 11.2**
Mental/behavioral hospitalizations (not substance abuse) ages 1-19 (per 10,000)
2008-2012 64.5
2013-2017 52.5
Uninsured children2013 11.1%2017 7.7%
School attendance, grades 9-122014 96.0%2018 95.1%
Contextual IndicatorsCounty Seat: Shelbyville
91Population: 6,061
2016
County Composite Rank
2020
29
Demographics
Total population2014 6,1082018 6,061
Child population under 182014 1,4862018 1,457
Children under 18 as % of total population
2014 23.3%2018 24.1%
Child population under 62014 4492018 448
Children under 6 as % of total population
2014 7.3%2018 7.4%
Minority child population under 18
2014 842018 122
Minority child population under 18 as % of child population
2014 5.9%2018 8.4%
Minority child population under 6
2014 252018 37
Minority child population under 6 as % of under 6 child population
2014 5.6%
2018 8.3%
Children in single-parent families
2009-2013 24.6%2014-2018 25.2%
Children in married-parent families
2009-2013 71.8%2014-2018 67.1%
Economic Well-being
Children in poverty under 62014 26.6%2018 25.1%
Children in poverty, ages 5-172009-2013 21.5%2014-2018 19.7%
Housing cost-burdened households
2009-2013 26.1%2014-2018 20.0%
Family households with children under 18 at 185% of poverty level
2009-2013 42.3%
2014-2018 44.6%
Children in families receiving SNAP
2014 30.7%2018 29.3%
Median income family household with children under 18
2009-2013 $43,142
2014-2018 $49,821
Adult unemployment2014 6.0%2018 3.0%
Child homelessness2014 0.0%2018 0.0%
a If no % listed, no vehicle fatalities happened in the county during that period.b *Indicates unstable rate due to low count (<20 cases);** indicates very unstable rate due to very low count (<5 cases)

Outcome MeasuresNumber Rate Trend Rank
2014 2018 2014 2018 State Rate
County Rank
Economic Well-BeingChildren under 18 in poverty 1,716 1,356 26.4% 21.9% é 18.3% 55
Food insecurity for childrenb 1,490 1,240 22.4% 19.2% é 17.5% 61
HealthLow birthweight infantsa,c 161 155 9.2% 9.0% é 8.5% 92
Preventable hospitalizations for all causes for children under 18 (per 1,000)b,c
87 47 13.0 7.3 é 7.1 79
Child asthma ER rates (per 1,000)b
32 24 4.8 3.7 é 7.5 62
Family & CommunityBirths to teens, ages 15-19 (per 1,000)
36 33 43.8 40.4 é 21.6 102
Substantiated child abuse/neglect cases (per 1,000)a
51 95 7.7 15.0 ê 4.0 112
EducationHigh school graduation 342 325 93.2% 94.2% é 91.3% 49
Achievement proficiencya,d
3rd grade English/Language Arts (MAP) 214 60.8% 48.6%
8th grade English/Language Arts (MAP)
164 44.3% 49.0%
4th grade Math (MAP) 177 46.8% 45.8%
Algebra I (End of Course exam) 185 48.1% 47.0%
Trend: é better ê worse è no change
Stoddard CountyCounty Seat: Bloomfield
77Population: 29,512
2016
County Composite Rank
81
2020
a Outcome not included in County Composite Rank.b Data based on 2013 and 2017.c Data based on 5-year time spans, 2009-2013 and 2014-2018.d Achievement proficiency measures those that scored proficient or above on the MAP tests and Algebra I End of Course exam. Achievement data from 2014 are not shown due to differences in testing standards and assessments used in 2018; accordingly, no trend arrows or county ranks are shown.

Stoddard County
EducationLicensed child care capacity (per 1,000)
2014 93.12019 85.8
Accredited child care capacity as % of licensed capacity
2014 —2019 9.2%
School attendance, grades K-122014 95.8%2018 95.9%
Family & CommunityTeen unintentional deaths/homicides/suicides (per 100,000)
2009-2013 41.52014-2018 31.8
Single parent head-of-house-hold with children under 18
2009-2013 8.5%2014-2018 6.7%
Juvenile law violation referrals, ages 10-17 (per 1,000)
2014 37.42018 49.9
Annual high school dropout rate2014 1.4%2018 0.5%
Children entering/re-entering state custody (per 1,000)
2014 18.72018 29.6
Health
Infant mortality (per 1,000)2009-2013 5.12014-2018 5.2
Child deaths ages 1-17 (per 100,000)
2009-2013 20.92014-2018 21.3
Child deaths ages 1-14 (per 100,000)
2009-2013 10.92014-2018 15.9
Child deaths ages 15-17 (per 100,000)
2009-2013 68.42014-2018 32.7
Unrestrained automobile fatalities for children under 18a
2009-2013 100.0%2014-2018 0%
Substance abuse hospitalizations ages 1-19 (per 100,000)b
2008-2012 19.1*
2013-2017 25.0*
Mental/behavioral hospitalizations (not substance abuse) ages 1-19 (per 10,000)
2008-2012 111.0
2013-2017 115.6
Uninsured children2013 7.6%2017 6.6%
School attendance, grades 9-122014 95.3%2018 95.8%
Contextual IndicatorsCounty Seat: Bloomfield
77Population: 29,512
2016
County Composite Rank
2020
81
Demographics
Total population2014 29,8672018 29,512
Child population under 182014 6,6352018 6,351
Children under 18 as % of total population
2014 22.3%2018 22.3%
Child population under 62014 2,0572018 2,018
Children under 6 as % of total population
2014 6.9%2018 6.9%
Minority child population under 18
2014 3982018 396
Minority child population under 18 as % of child population
2014 6.0%2018 6.2%
Minority child population under 6
2014 1672018 161
Minority child population under 6 as % of under 6 child population
2014 8.1%
2018 8.0%
Children in single-parent families
2009-2013 29.0%2014-2018 29.2%
Children in married-parent families
2009-2013 67.3%2014-2018 69.4%
Economic Well-being
Children in poverty under 62014 42.1%2018 38.4%
Children in poverty, ages 5-172009-2013 23.6%2014-2018 20.3%
Housing cost-burdened households
2009-2013 28.1%2014-2018 23.7%
Family households with children under 18 at 185% of poverty level
2009-2013 40.4%
2014-2018 42.7%
Children in families receiving SNAP
2014 41.3%2018 41.2%
Median income family household with children under 18
2009-2013 $50,785
2014-2018 $52,936
Adult unemployment2014 7.6%2018 4.4%
Child homelessness2014 0.0%2018 0.2%
a If no % listed, no vehicle fatalities happened in the county during that period.b *Indicates unstable rate due to low count (<20 cases);** indicates very unstable rate due to very low count (<5 cases)

Outcome MeasuresNumber Rate Trend Rank
2014 2018 2014 2018 State Rate
County Rank
Economic Well-BeingChildren under 18 in poverty 1,488 1,089 27.9% 21.5% é 18.3% 50
Food insecurity for childrenb 1,530 1,030 25.9% 19.1% é 17.5% 57
HealthLow birthweight infantsa,c 94 120 7.2% 9.6% ê 8.5% 100
Preventable hospitalizations for all causes for children under 18 (per 1,000)b,c
31 33 5.3 6.2 ê 7.1 60
Child asthma ER rates (per 1,000)b
11 10 1.9 1.9 è 7.5 20
Family & CommunityBirths to teens, ages 15-19 (per 1,000)
12 20 14.7 25.7 ê 21.6 53
Substantiated child abuse/neglect cases (per 1,000)a
26 40 4.5 7.7 ê 4.0 88
EducationHigh school graduation 280 277 93.6% 94.2% é 91.3% 49
Achievement proficiencya,d
3rd grade English/Language Arts (MAP) 117 44.2% 48.6%
8th grade English/Language Arts (MAP)
119 43.6% 49.0%
4th grade Math (MAP) 113 43.5% 45.8%
Algebra I (End of Course exam) 87 40.3% 47.0%
Trend: é better ê worse è no change
Stone CountyCounty Seat: Galena
41Population: 31,527
2016
County Composite Rank
35
2020
a Outcome not included in County Composite Rank.b Data based on 2013 and 2017.c Data based on 5-year time spans, 2009-2013 and 2014-2018.d Achievement proficiency measures those that scored proficient or above on the MAP tests and Algebra I End of Course exam. Achievement data from 2014 are not shown due to differences in testing standards and assessments used in 2018; accordingly, no trend arrows or county ranks are shown.

Stone County
EducationLicensed child care capacity (per 1,000)
2014 77.92019 34.6
Accredited child care capacity as % of licensed capacity
2014 —2019 0.0%
School attendance, grades K-122014 94.7%2018 94.2%
Family & CommunityTeen unintentional deaths/homicides/suicides (per 100,000)
2009-2013 44.52014-2018 58.6
Single parent head-of-house-hold with children under 18
2009-2013 5.9%2014-2018 4.0%
Juvenile law violation referrals, ages 10-17 (per 1,000)
2014 27.42018 31.1
Annual high school dropout rate2014 1.3%2018 0.8%
Children entering/re-entering state custody (per 1,000)
2014 7.32018 12.7
Health
Infant mortality (per 1,000)2009-2013 6.92014-2018 10.4
Child deaths ages 1-17 (per 100,000)
2009-2013 30.62014-2018 56.4
Child deaths ages 1-14 (per 100,000)
2009-2013 21.42014-2018 46.0
Child deaths ages 15-17 (per 100,000)
2009-2013 67.02014-2018 69.9
Unrestrained automobile fatalities for children under 18a
2009-2013 0.0%2014-2018 100%
Substance abuse hospitalizations ages 1-19 (per 100,000)b
2008-2012 2.7**
2013-2017 21.2*
Mental/behavioral hospitalizations (not substance abuse) ages 1-19 (per 10,000)
2008-2012 62.6
2013-2017 84.9
Uninsured children2013 11.6%2017 7.5%
School attendance, grades 9-122014 94.4%2018 93.8%
Contextual IndicatorsCounty Seat: Galena
41Population: 31,527
2016
County Composite Rank
2020
35
Demographics
Total population2014 31,1042018 31,527
Child population under 182014 5,7842018 5,207
Children under 18 as % of total population
2014 17.6%2018 16.9%
Child population under 62014 1,5692018 1,471
Children under 6 as % of total population
2014 5.0%2018 4.6%
Minority child population under 18
2014 3952018 424
Minority child population under 18 as % of child population
2014 7.2%2018 8.1%
Minority child population under 6
2014 1342018 131
Minority child population under 6 as % of under 6 child population
2014 8.5%
2018 8.9%
Children in single-parent families
2009-2013 31.7%2014-2018 22.9%
Children in married-parent families
2009-2013 67.8%2014-2018 76.2%
Economic Well-being
Children in poverty under 62014 37.0%2018 33.2%
Children in poverty, ages 5-172009-2013 26.4%2014-2018 20.7%
Housing cost-burdened households
2009-2013 28.5%2014-2018 25.4%
Family households with children under 18 at 185% of poverty level
2009-2013 47.8%
2014-2018 42.9%
Children in families receiving SNAP
2014 41.4%2018 35.2%
Median income family household with children under 18
2009-2013 $42,682
2014-2018 $56,429
Adult unemployment2014 9.5%2018 4.7%
Child homelessness2014 4.6%2018 4.6%
a If no % listed, no vehicle fatalities happened in the county during that period.b *Indicates unstable rate due to low count (<20 cases);** indicates very unstable rate due to very low count (<5 cases)

Outcome MeasuresNumber Rate Trend Rank
2014 2018 2014 2018 State Rate
County Rank
Economic Well-BeingChildren under 18 in poverty 360 291 25.0% 21.3% é 18.3% 49
Food insecurity for childrenb 320 240 20.7% 16.5% é 17.5% 17
HealthLow birthweight infantsa,c 37 36 8.2% 8.6% ê 8.5% 79
Preventable hospitalizations for all causes for children under 18 (per 1,000)b,c
14 12 8.9 8.5 é 7.1 92
Child asthma ER rates (per 1,000)b
8 4 5.1 2.8 é 7.5 40
Family & CommunityBirths to teens, ages 15-19 (per 1,000)
14 9 64.5 53.9 é 21.6 112
Substantiated child abuse/neglect cases (per 1,000)a
6 2 3.9 1.4 é 4.0 5
EducationHigh school graduation 83 80 94.3% 100.0% é 91.3% 1
Achievement proficiencya,d
3rd grade English/Language Arts (MAP) 27 39.1% 48.6%
8th grade English/Language Arts (MAP)
18 28.6% 49.0%
4th grade Math (MAP) 23 34.3% 45.8%
Algebra I (End of Course exam) 38 48.1% 47.0%
Trend: é better ê worse è no change
Sullivan CountyCounty Seat: Milan
54Population: 6,317
2016
County Composite Rank
69
2020
a Outcome not included in County Composite Rank.b Data based on 2013 and 2017.c Data based on 5-year time spans, 2009-2013 and 2014-2018.d Achievement proficiency measures those that scored proficient or above on the MAP tests and Algebra I End of Course exam. Achievement data from 2014 are not shown due to differences in testing standards and assessments used in 2018; accordingly, no trend arrows or county ranks are shown.

Sullivan County
EducationLicensed child care capacity (per 1,000)
2014 57.72019 50.1
Accredited child care capacity as % of licensed capacity
2014 —2019 28.6%
School attendance, grades K-122014 95.6%2018 95.3%
Family & CommunityTeen unintentional deaths/homicides/suicides (per 100,000)
2009-2013 46.62014-2018 111.7
Single parent head-of-house-hold with children under 18
2009-2013 11.8%2014-2018 7.8%
Juvenile law violation referrals, ages 10-17 (per 1,000)
2014 18.32018 9.9
Annual high school dropout rate2014 0.0%2018 0.0%
Children entering/re-entering state custody (per 1,000)
2014 14.12018 9.3
Health
Infant mortality (per 1,000)2009-2013 4.42014-2018 2.4
Child deaths ages 1-17 (per 100,000)
2009-2013 25.52014-2018 14.4
Child deaths ages 1-14 (per 100,000)
2009-2013 31.12014-2018 0.0
Child deaths ages 15-17 (per 100,000)
2009-2013 0.02014-2018 95.2
Unrestrained automobile fatalities for children under 18a
2009-2013 %2014-2018 0%
Substance abuse hospitalizations ages 1-19 (per 100,000)b
2008-2012 20.3**
2013-2017 11.4**
Mental/behavioral hospitalizations (not substance abuse) ages 1-19 (per 10,000)
2008-2012 81.1
2013-2017 77.6
Uninsured children2013 13.6%2017 9.2%
School attendance, grades 9-122014 94.4%2018 94.8%
Contextual IndicatorsCounty Seat: Milan
54Population: 6,317
2016
County Composite Rank
2020
69
Demographics
Total population2014 6,4112018 6,317
Child population under 182014 1,5302018 1,396
Children under 18 as % of total population
2014 23.3%2018 22.0%
Child population under 62014 4472018 485
Children under 6 as % of total population
2014 6.9%2018 7.8%
Minority child population under 18
2014 4562018 466
Minority child population under 18 as % of child population
2014 30.6%2018 33.4%
Minority child population under 6
2014 1602018 157
Minority child population under 6 as % of under 6 child population
2014 35.8%
2018 32.4%
Children in single-parent families
2009-2013 45.1%2014-2018 31.3%
Children in married-parent families
2009-2013 52.9%2014-2018 68.5%
Economic Well-being
Children in poverty under 62014 27.5%2018 27.1%
Children in poverty, ages 5-172009-2013 22.7%2014-2018 20.2%
Housing cost-burdened households
2009-2013 28.4%2014-2018 21.2%
Family households with children under 18 at 185% of poverty level
2009-2013 46.0%
2014-2018 45.3%
Children in families receiving SNAP
2014 37.6%2018 34.3%
Median income family household with children under 18
2009-2013 $43,063
2014-2018 $49,931
Adult unemployment2014 6.5%2018 3.1%
Child homelessness2014 2.1%2018 5.4%
a If no % listed, no vehicle fatalities happened in the county during that period.b *Indicates unstable rate due to low count (<20 cases);** indicates very unstable rate due to very low count (<5 cases)

Outcome MeasuresNumber Rate Trend Rank
2014 2018 2014 2018 State Rate
County Rank
Economic Well-BeingChildren under 18 in poverty 3,235 2,645 28.7% 23.0% é 18.3% 65
Food insecurity for childrenb 3,020 2,440 26.5% 21.1% é 17.5% 89
HealthLow birthweight infantsa,c 254 275 8.0% 8.5% ê 8.5% 78
Preventable hospitalizations for all causes for children under 18 (per 1,000)b,c
63 47 5.5 4.0 é 7.1 17
Child asthma ER rates (per 1,000)b
59 56 5.2 4.8 é 7.5 79
Family & CommunityBirths to teens, ages 15-19 (per 1,000)
60 46 34.8 25.8 é 21.6 54
Substantiated child abuse/neglect cases (per 1,000)a
67 75 5.8 6.4 ê 4.0 71
EducationHigh school graduation 519 570 92.7% 95.0% é 91.3% 40
Achievement proficiencya,d
3rd grade English/Language Arts (MAP) 301 49.5% 48.6%
8th grade English/Language Arts (MAP)
334 55.7% 49.0%
4th grade Math (MAP) 306 48.1% 45.8%
Algebra I (End of Course exam) 299 47.3% 47.0%
Trend: é better ê worse è no change
Taney CountyCounty Seat: Forsyth
50Population: 54,720
2016
County Composite Rank
74
2020
a Outcome not included in County Composite Rank.b Data based on 2013 and 2017.c Data based on 5-year time spans, 2009-2013 and 2014-2018.d Achievement proficiency measures those that scored proficient or above on the MAP tests and Algebra I End of Course exam. Achievement data from 2014 are not shown due to differences in testing standards and assessments used in 2018; accordingly, no trend arrows or county ranks are shown.

Taney County
EducationLicensed child care capacity (per 1,000)
2014 51.52019 48.6
Accredited child care capacity as % of licensed capacity
2014 —2019 40.9%
School attendance, grades K-122014 94.4%2018 94.5%
Family & CommunityTeen unintentional deaths/homicides/suicides (per 100,000)
2009-2013 34.42014-2018 67.0
Single parent head-of-house-hold with children under 18
2009-2013 6.7%2014-2018 9.6%
Juvenile law violation referrals, ages 10-17 (per 1,000)
2014 45.62018 23.6
Annual high school dropout rate2014 1.0%2018 0.7%
Children entering/re-entering state custody (per 1,000)
2014 8.02018 9.4
Health
Infant mortality (per 1,000)2009-2013 5.72014-2018 8.7
Child deaths ages 1-17 (per 100,000)
2009-2013 22.82014-2018 22.3
Child deaths ages 1-14 (per 100,000)
2009-2013 18.92014-2018 12.4
Child deaths ages 15-17 (per 100,000)
2009-2013 40.92014-2018 58.1
Unrestrained automobile fatalities for children under 18a
2009-2013 100.0%2014-2018 50%
Substance abuse hospitalizations ages 1-19 (per 100,000)b
2008-2012 13.7*
2013-2017 34.1
Mental/behavioral hospitalizations (not substance abuse) ages 1-19 (per 10,000)
2008-2012 64.5
2013-2017 83.8
Uninsured children2013 10.4%2017 6.9%
School attendance, grades 9-122014 93.4%2018 94%
Contextual IndicatorsCounty Seat: Forsyth
50Population: 54,720
2016
County Composite Rank
2020
74
Demographics
Total population2014 54,2302018 54,720
Child population under 182014 11,5362018 11,774
Children under 18 as % of total population
2014 21.2%2018 21.3%
Child population under 62014 3,7542018 3,821
Children under 6 as % of total population
2014 6.9%2018 6.8%
Minority child population under 18
2014 1,6042018 1,895
Minority child population under 18 as % of child population
2014 14.0%2018 16.1%
Minority child population under 6
2014 5782018 711
Minority child population under 6 as % of under 6 child population
2014 15.4%
2018 18.6%
Children in single-parent families
2009-2013 38.1%2014-2018 36.3%
Children in married-parent families
2009-2013 61.5%2014-2018 62.8%
Economic Well-being
Children in poverty under 62014 37.0%2018 33.2%
Children in poverty, ages 5-172009-2013 27.6%2014-2018 21.8%
Housing cost-burdened households
2009-2013 35.5%2014-2018 31.9%
Family households with children under 18 at 185% of poverty level
2009-2013 43.1%
2014-2018 51.6%
Children in families receiving SNAP
2014 43.8%2018 38.7%
Median income family household with children under 18
2009-2013 $44,575
2014-2018 $47,628
Adult unemployment2014 9.6%2018 5.2%
Child homelessness2014 11.2%2018 13.1%
a If no % listed, no vehicle fatalities happened in the county during that period.b *Indicates unstable rate due to low count (<20 cases);** indicates very unstable rate due to very low count (<5 cases)

Outcome MeasuresNumber Rate Trend Rank
2014 2018 2014 2018 State Rate
County Rank
Economic Well-BeingChildren under 18 in poverty 1,752 1,844 32.8% 34.8% ê 18.3% 106
Food insecurity for childrenb 1,430 1,390 25.2% 23.3% é 17.5% 103
HealthLow birthweight infantsa,c 109 120 7.3% 8.2% ê 8.5% 66
Preventable hospitalizations for all causes for children under 18 (per 1,000)b,c
63 40 11.2 7.2 é 7.1 75
Child asthma ER rates (per 1,000)b
21 33 3.7 6.0 ê 7.5 94
Family & CommunityBirths to teens, ages 15-19 (per 1,000)
42 21 57.0 30 é 21.6 70
Substantiated child abuse/neglect cases (per 1,000)a
60 23 10.7 4.2 é 4.0 43
EducationHigh school graduation 269 248 93.1% 91.5% ê 91.3% 86
Achievement proficiencya,d
3rd grade English/Language Arts (MAP) 121 39.8% 48.6%
8th grade English/Language Arts (MAP)
112 43.1% 49.0%
4th grade Math (MAP) 98 33.1% 45.8%
Algebra I (End of Course exam) 106 33.9% 47.0%
Trend: é better ê worse è no change
Texas CountyCounty Seat: Houston
105Population: 25,671
2016
County Composite Rank
100
2020
a Outcome not included in County Composite Rank.b Data based on 2013 and 2017.c Data based on 5-year time spans, 2009-2013 and 2014-2018.d Achievement proficiency measures those that scored proficient or above on the MAP tests and Algebra I End of Course exam. Achievement data from 2014 are not shown due to differences in testing standards and assessments used in 2018; accordingly, no trend arrows or county ranks are shown.
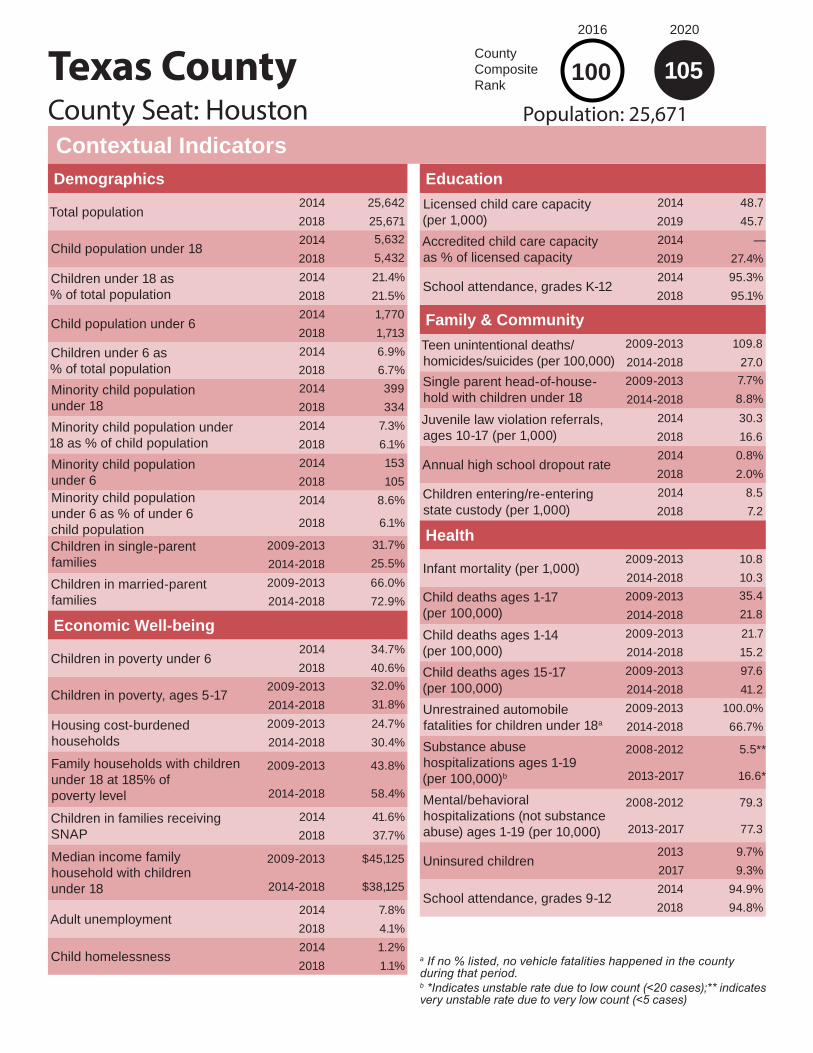
Texas County
EducationLicensed child care capacity (per 1,000)
2014 48.72019 45.7
Accredited child care capacity as % of licensed capacity
2014 —2019 27.4%
School attendance, grades K-122014 95.3%2018 95.1%
Family & CommunityTeen unintentional deaths/homicides/suicides (per 100,000)
2009-2013 109.82014-2018 27.0
Single parent head-of-house-hold with children under 18
2009-2013 7.7%2014-2018 8.8%
Juvenile law violation referrals, ages 10-17 (per 1,000)
2014 30.32018 16.6
Annual high school dropout rate2014 0.8%2018 2.0%
Children entering/re-entering state custody (per 1,000)
2014 8.52018 7.2
Health
Infant mortality (per 1,000)2009-2013 10.82014-2018 10.3
Child deaths ages 1-17 (per 100,000)
2009-2013 35.42014-2018 21.8
Child deaths ages 1-14 (per 100,000)
2009-2013 21.72014-2018 15.2
Child deaths ages 15-17 (per 100,000)
2009-2013 97.62014-2018 41.2
Unrestrained automobile fatalities for children under 18a
2009-2013 100.0%2014-2018 66.7%
Substance abuse hospitalizations ages 1-19 (per 100,000)b
2008-2012 5.5**
2013-2017 16.6*
Mental/behavioral hospitalizations (not substance abuse) ages 1-19 (per 10,000)
2008-2012 79.3
2013-2017 77.3
Uninsured children2013 9.7%2017 9.3%
School attendance, grades 9-122014 94.9%2018 94.8%
Contextual IndicatorsCounty Seat: Houston
105Population: 25,671
2016
County Composite Rank
2020
100
Demographics
Total population2014 25,6422018 25,671
Child population under 182014 5,6322018 5,432
Children under 18 as % of total population
2014 21.4%2018 21.5%
Child population under 62014 1,7702018 1,713
Children under 6 as % of total population
2014 6.9%2018 6.7%
Minority child population under 18
2014 3992018 334
Minority child population under 18 as % of child population
2014 7.3%2018 6.1%
Minority child population under 6
2014 1532018 105
Minority child population under 6 as % of under 6 child population
2014 8.6%
2018 6.1%
Children in single-parent families
2009-2013 31.7%2014-2018 25.5%
Children in married-parent families
2009-2013 66.0%2014-2018 72.9%
Economic Well-being
Children in poverty under 62014 34.7%2018 40.6%
Children in poverty, ages 5-172009-2013 32.0%2014-2018 31.8%
Housing cost-burdened households
2009-2013 24.7%2014-2018 30.4%
Family households with children under 18 at 185% of poverty level
2009-2013 43.8%
2014-2018 58.4%
Children in families receiving SNAP
2014 41.6%2018 37.7%
Median income family household with children under 18
2009-2013 $45,125
2014-2018 $38,125
Adult unemployment2014 7.8%2018 4.1%
Child homelessness2014 1.2%2018 1.1%
a If no % listed, no vehicle fatalities happened in the county during that period.b *Indicates unstable rate due to low count (<20 cases);** indicates very unstable rate due to very low count (<5 cases)

Outcome MeasuresNumber Rate Trend Rank
2014 2018 2014 2018 State Rate
County Rank
Economic Well-BeingChildren under 18 in poverty 1,316 1,109 26.8% 24.0% é 18.3% 73
Food insecurity for childrenb 1,380 930 26.1% 18.7% é 17.5% 51
HealthLow birthweight infantsa,c 86 84 6.8% 6.6% é 8.5% 17
Preventable hospitalizations for all causes for children under 18 (per 1,000)b,c
25 40 4.7 8.1 ê 7.1 86
Child asthma ER rates (per 1,000)b
30 30 5.7 6.1 ê 7.5 95
Family & CommunityBirths to teens, ages 15-19 (per 1,000)
24 19 28.7 22.9 é 21.6 43
Substantiated child abuse/neglect cases (per 1,000)a
25 22 4.8 4.5 é 4.0 54
EducationHigh school graduation 207 204 87.7% 92.7% é 91.3% 68
Achievement proficiencya,d
3rd grade English/Language Arts (MAP) 70 34.5% 48.6%
8th grade English/Language Arts (MAP)
107 43.9% 49.0%
4th grade Math (MAP) 78 32.2% 45.8%
Algebra I (End of Course exam) 28 16.2% 47.0%
Trend: é better ê worse è no change
Vernon CountyCounty Seat: Nevada
80Population: 20,691
2016
County Composite Rank
87
2020
a Outcome not included in County Composite Rank.b Data based on 2013 and 2017.c Data based on 5-year time spans, 2009-2013 and 2014-2018.d Achievement proficiency measures those that scored proficient or above on the MAP tests and Algebra I End of Course exam. Achievement data from 2014 are not shown due to differences in testing standards and assessments used in 2018; accordingly, no trend arrows or county ranks are shown.

Vernon County
EducationLicensed child care capacity (per 1,000)
2014 58.32019 65.5
Accredited child care capacity as % of licensed capacity
2014 —2019 0.0%
School attendance, grades K-122014 94.8%2018 95.2%
Family & CommunityTeen unintentional deaths/homicides/suicides (per 100,000)
2009-2013 62.72014-2018 25.6
Single parent head-of-house-hold with children under 18
2009-2013 12.0%2014-2018 8.0%
Juvenile law violation referrals, ages 10-17 (per 1,000)
2014 80.62018 60.7
Annual high school dropout rate2014 3.1%2018 1.0%
Children entering/re-entering state custody (per 1,000)
2014 4.92018 2.9
Health
Infant mortality (per 1,000)2009-2013 7.12014-2018 7.1
Child deaths ages 1-17 (per 100,000)
2009-2013 26.42014-2018 61.0
Child deaths ages 1-14 (per 100,000)
2009-2013 18.72014-2018 64.1
Child deaths ages 15-17 (per 100,000)
2009-2013 64.72014-2018 0.0
Unrestrained automobile fatalities for children under 18a
2009-2013 66.7%2014-2018 0%
Substance abuse hospitalizations ages 1-19 (per 100,000)b
2008-2012 14.9*
2013-2017 3.2**
Mental/behavioral hospitalizations (not substance abuse) ages 1-19 (per 10,000)
2008-2012 45.7
2013-2017 54.7
Uninsured children2013 9.3%2017 6.7%
School attendance, grades 9-122014 93.6%2018 94.7%
Contextual IndicatorsCounty Seat: Nevada
80Population: 20,691
2016
County Composite Rank
2020
87
Demographics
Total population2014 21,0012018 20,691
Child population under 182014 5,2502018 4,841
Children under 18 as % of total population
2014 24.3%2018 23.8%
Child population under 62014 1,5582018 1,492
Children under 6 as % of total population
2014 7.4%2018 7.3%
Minority child population under 18
2014 3752018 363
Minority child population under 18 as % of child population
2014 7.3%2018 7.5%
Minority child population under 6
2014 1322018 108
Minority child population under 6 as % of under 6 child population
2014 8.5%
2018 7.2%
Children in single-parent families
2009-2013 39.3%2014-2018 28.3%
Children in married-parent families
2009-2013 56.0%2014-2018 68.2%
Economic Well-being
Children in poverty under 62014 34.4%2018 28.9%
Children in poverty, ages 5-172009-2013 24.3%2014-2018 22.6%
Housing cost-burdened households
2009-2013 28.8%2014-2018 23.1%
Family households with children under 18 at 185% of poverty level
2009-2013 50.0%
2014-2018 42.0%
Children in families receiving SNAP
2014 37.6%2018 35.9%
Median income family household with children under 18
2009-2013 $38,176
2014-2018 $54,316
Adult unemployment2014 5.6%2018 3.1%
Child homelessness2014 3.5%2018 4.7%
a If no % listed, no vehicle fatalities happened in the county during that period.b *Indicates unstable rate due to low count (<20 cases);** indicates very unstable rate due to very low count (<5 cases)

Outcome MeasuresNumber Rate Trend Rank
2014 2018 2014 2018 State Rate
County Rank
Economic Well-BeingChildren under 18 in poverty 1,541 1,294 19.4% 16.0% é 18.3% 24
Food insecurity for childrenb 1,840 1,370 22.6% 16.9% é 17.5% 25
HealthLow birthweight infantsa,c 123 144 5.9% 6.9% ê 8.5% 24
Preventable hospitalizations for all causes for children under 18 (per 1,000)b,c
58 47 7.1 5.7 é 7.1 48
Child asthma ER rates (per 1,000)b
78 38 9.6 4.6 é 7.5 75
Family & CommunityBirths to teens, ages 15-19 (per 1,000)
26 23 27.9 22.2 é 21.6 41
Substantiated child abuse/neglect cases (per 1,000)a
57 36 7.0 4.4 é 4.0 47
EducationHigh school graduation 291 322 90.4% 90.4% è 91.3% 90
Achievement proficiencya,d
3rd grade English/Language Arts (MAP) 190 52.2% 48.6%
8th grade English/Language Arts (MAP)
180 52.9% 49.0%
4th grade Math (MAP) 174 46.4% 45.8%
Algebra I (End of Course exam) 121 34.3% 47.0%
Trend: é better ê worse è no change
Warren CountyCounty Seat: Warrenton
39Population: 33,908
2016
County Composite Rank
63
2020
a Outcome not included in County Composite Rank.b Data based on 2013 and 2017.c Data based on 5-year time spans, 2009-2013 and 2014-2018.d Achievement proficiency measures those that scored proficient or above on the MAP tests and Algebra I End of Course exam. Achievement data from 2014 are not shown due to differences in testing standards and assessments used in 2018; accordingly, no trend arrows or county ranks are shown.

Warren County
EducationLicensed child care capacity (per 1,000)
2014 49.52019 51.1
Accredited child care capacity as % of licensed capacity
2014 —2019 24.2%
School attendance, grades K-122014 94.5%2018 93.5%
Family & CommunityTeen unintentional deaths/homicides/suicides (per 100,000)
2009-2013 105.72014-2018 71.7
Single parent head-of-house-hold with children under 18
2009-2013 7.2%2014-2018 8.7%
Juvenile law violation referrals, ages 10-17 (per 1,000)
2014 15.82018 25.7
Annual high school dropout rate2014 1.0%2018 2.5%
Children entering/re-entering state custody (per 1,000)
2014 5.72018 4.4
Health
Infant mortality (per 1,000)2009-2013 5.32014-2018 5.7
Child deaths ages 1-17 (per 100,000)
2009-2013 22.22014-2018 36.9
Child deaths ages 1-14 (per 100,000)
2009-2013 14.92014-2018 27.8
Child deaths ages 15-17 (per 100,000)
2009-2013 55.22014-2018 60.7
Unrestrained automobile fatalities for children under 18a
2009-2013 100.0%2014-2018 0%
Substance abuse hospitalizations ages 1-19 (per 100,000)b
2008-2012 24.3*
2013-2017 18.5*
Mental/behavioral hospitalizations (not substance abuse) ages 1-19 (per 10,000)
2008-2012 103.2
2013-2017 154.1
Uninsured children2013 8.3%2017 5.6%
School attendance, grades 9-122014 93.5%2018 92%
Contextual IndicatorsCounty Seat: Warrenton
39Population: 33,908
2016
County Composite Rank
2020
63
Demographics
Total population2014 33,2532018 33,908
Child population under 182014 8,0992018 8,254
Children under 18 as % of total population
2014 24.4%2018 24.0%
Child population under 62014 2,5242018 2,664
Children under 6 as % of total population
2014 7.6%2018 7.7%
Minority child population under 18
2014 8742018 918
Minority child population under 18 as % of child population
2014 10.8%2018 11.1%
Minority child population under 6
2014 2932018 292
Minority child population under 6 as % of under 6 child population
2014 11.6%
2018 11.0%
Children in single-parent families
2009-2013 30.1%2014-2018 28.5%
Children in married-parent families
2009-2013 69.3%2014-2018 71.5%
Economic Well-being
Children in poverty under 62014 27.5%2018 21.4%
Children in poverty, ages 5-172009-2013 16.5%2014-2018 13.6%
Housing cost-burdened households
2009-2013 26.8%2014-2018 26.7%
Family households with children under 18 at 185% of poverty level
2009-2013 33.1%
2014-2018 37.0%
Children in families receiving SNAP
2014 34.5%2018 30.1%
Median income family household with children under 18
2009-2013 $65,179
2014-2018 $60,539
Adult unemployment2014 6.2%2018 2.8%
Child homelessness2014 6.2%2018 8.1%
a If no % listed, no vehicle fatalities happened in the county during that period.b *Indicates unstable rate due to low count (<20 cases);** indicates very unstable rate due to very low count (<5 cases)

Outcome MeasuresNumber Rate Trend Rank
2014 2018 2014 2018 State Rate
County Rank
Economic Well-BeingChildren under 18 in poverty 2,217 1,546 39.3% 27.9% é 18.3% 93
Food insecurity for childrenb 1,700 1,260 28.9% 21.9% é 17.5% 95
HealthLow birthweight infantsa,c 140 157 9.3% 10.9% ê 8.5% 110
Preventable hospitalizations for all causes for children under 18 (per 1,000)b,c
57 28 9.7 4.8 é 7.1 33
Child asthma ER rates (per 1,000)b
50 31 8.5 5.4 é 7.5 83
Family & CommunityBirths to teens, ages 15-19 (per 1,000)
29 19 40.3 26.8 é 21.6 56
Substantiated child abuse/neglect cases (per 1,000)a
40 32 6.8 5.6 é 4.0 65
EducationHigh school graduation 202 233 92.2% 97.5% é 91.3% 15
Achievement proficiencya,d
3rd grade English/Language Arts (MAP) 160 56.7% 48.6%
8th grade English/Language Arts (MAP)
174 68.8% 49.0%
4th grade Math (MAP) 113 41.4% 45.8%
Algebra I (End of Course exam) 78 29.3% 47.0%
Trend: é better ê worse è no change
Washington CountyCounty Seat: Potosi
69Population: 24,931
2016
County Composite Rank
108
2020
a Outcome not included in County Composite Rank.b Data based on 2013 and 2017.c Data based on 5-year time spans, 2009-2013 and 2014-2018.d Achievement proficiency measures those that scored proficient or above on the MAP tests and Algebra I End of Course exam. Achievement data from 2014 are not shown due to differences in testing standards and assessments used in 2018; accordingly, no trend arrows or county ranks are shown.

Washington County
EducationLicensed child care capacity (per 1,000)
2014 57.92019 65.4
Accredited child care capacity as % of licensed capacity
2014 —2019 0.0%
School attendance, grades K-122014 94.9%2018 94.5%
Family & CommunityTeen unintentional deaths/homicides/suicides (per 100,000)
2009-2013 88.12014-2018 52.6
Single parent head-of-house-hold with children under 18
2009-2013 10.6%2014-2018 8.0%
Juvenile law violation referrals, ages 10-17 (per 1,000)
2014 30.62018 30.0
Annual high school dropout rate2014 2.3%2018 0.1%
Children entering/re-entering state custody (per 1,000)
2014 7.92018 13.5
Health
Infant mortality (per 1,000)2009-2013 5.32014-2018 4.9
Child deaths ages 1-17 (per 100,000)
2009-2013 20.42014-2018 31.3
Child deaths ages 1-14 (per 100,000)
2009-2013 12.22014-2018 21.9
Child deaths ages 15-17 (per 100,000)
2009-2013 60.92014-2018 60.0
Unrestrained automobile fatalities for children under 18a
2009-2013 33.3%2014-2018 100%
Substance abuse hospitalizations ages 1-19 (per 100,000)b
2008-2012 5.4**
2013-2017 22.7*
Mental/behavioral hospitalizations (not substance abuse) ages 1-19 (per 10,000)
2008-2012 74.1
2013-2017 96.6
Uninsured children2013 7.1%2017 4.7%
School attendance, grades 9-122014 93.8%2018 93.7%
Contextual IndicatorsCounty Seat: Potosi
69Population: 24,931
2016
County Composite Rank
2020
108
Demographics
Total population2014 25,0772018 24,931
Child population under 182014 5,8982018 5,688
Children under 18 as % of total population
2014 23.1%2018 23.0%
Child population under 62014 1,7842018 1,773
Children under 6 as % of total population
2014 7.1%2018 7.1%
Minority child population under 18
2014 2732018 280
Minority child population under 18 as % of child population
2014 4.7%2018 4.9%
Minority child population under 6
2014 952018 107
Minority child population under 6 as % of under 6 child population
2014 5.3%
2018 6.0%
Children in single-parent families
2009-2013 31.4%2014-2018 29.8%
Children in married-parent families
2009-2013 66.4%2014-2018 68.4%
Economic Well-being
Children in poverty under 62014 32.7%2018 24.8%
Children in poverty, ages 5-172009-2013 35.4%2014-2018 25.2%
Housing cost-burdened households
2009-2013 23.9%2014-2018 25.1%
Family households with children under 18 at 185% of poverty level
2009-2013 56.0%
2014-2018 44.9%
Children in families receiving SNAP
2014 55.4%2018 47.3%
Median income family household with children under 18
2009-2013 $38,441
2014-2018 $49,353
Adult unemployment2014 8.5%2018 4.4%
Child homelessness2014 1.9%2018 5.7%
a If no % listed, no vehicle fatalities happened in the county during that period.b *Indicates unstable rate due to low count (<20 cases);** indicates very unstable rate due to very low count (<5 cases)

Outcome MeasuresNumber Rate Trend Rank
2014 2018 2014 2018 State Rate
County Rank
Economic Well-BeingChildren under 18 in poverty 1,112 941 40.8% 35.8% é 18.3% 109
Food insecurity for childrenb 760 630 27.3% 21.9% é 17.5% 95
HealthLow birthweight infantsa,c 70 54 9.4% 8.0% é 8.5% 58
Preventable hospitalizations for all causes for children under 18 (per 1,000)b,c
55 26 19.7 9.5 é 7.1 102
Child asthma ER rates (per 1,000)b
17 15 6.1 5.5 é 7.5 86
Family & CommunityBirths to teens, ages 15-19 (per 1,000)
10 8 29.8 22.9 é 21.6 44
Substantiated child abuse/neglect cases (per 1,000)a
16 21 5.7 7.8 ê 4.0 89
EducationHigh school graduation 103 125 93.6% 95.4% é 91.3% 35
Achievement proficiencya,d
3rd grade English/Language Arts (MAP) 43 30.9% 48.6%
8th grade English/Language Arts (MAP)
43 33.6% 49.0%
4th grade Math (MAP) 49 36.3% 45.8%
Algebra I (End of Course exam) 64 45.1% 47.0%
Trend: é better ê worse è no change
Wayne CountyCounty Seat: Greenville
98Population: 13,308
2016
County Composite Rank
107
2020
a Outcome not included in County Composite Rank.b Data based on 2013 and 2017.c Data based on 5-year time spans, 2009-2013 and 2014-2018.d Achievement proficiency measures those that scored proficient or above on the MAP tests and Algebra I End of Course exam. Achievement data from 2014 are not shown due to differences in testing standards and assessments used in 2018; accordingly, no trend arrows or county ranks are shown.

Wayne County
EducationLicensed child care capacity (per 1,000)
2014 55.42019 62.6
Accredited child care capacity as % of licensed capacity
2014 —2019 0.0%
School attendance, grades K-122014 94.8%2018 93.7%
Family & CommunityTeen unintentional deaths/homicides/suicides (per 100,000)
2009-2013 99.52014-2018 51.2
Single parent head-of-house-hold with children under 18
2009-2013 5.7%2014-2018 6.0%
Juvenile law violation referrals, ages 10-17 (per 1,000)
2014 13.02018 28.7
Annual high school dropout rate2014 1.6%2018 1.5%
Children entering/re-entering state custody (per 1,000)
2014 6.82018 9.6
Health
Infant mortality (per 1,000)2009-2013 10.72014-2018 5.9
Child deaths ages 1-17 (per 100,000)
2009-2013 21.52014-2018 28.6
Child deaths ages 1-14 (per 100,000)
2009-2013 8.82014-2018 15.3
Child deaths ages 15-17 (per 100,000)
2009-2013 71.82014-2018 76.6
Unrestrained automobile fatalities for children under 18a
2009-2013 0.0%2014-2018 %
Substance abuse hospitalizations ages 1-19 (per 100,000)b
2008-2012 11.6**
2013-2017 11.5**
Mental/behavioral hospitalizations (not substance abuse) ages 1-19 (per 10,000)
2008-2012 105.1
2013-2017 89.0
Uninsured children2013 8.7%2017 6.3%
School attendance, grades 9-122014 94.7%2018 93.4%
Contextual IndicatorsCounty Seat: Greenville
98Population: 13,308
2016
County Composite Rank
2020
107
Demographics
Total population2014 13,4522018 13,308
Child population under 182014 2,8262018 2,698
Children under 18 as % of total population
2014 20.7%2018 21.0%
Child population under 62014 9322018 869
Children under 6 as % of total population
2014 6.9%2018 6.6%
Minority child population under 18
2014 1692018 203
Minority child population under 18 as % of child population
2014 6.1%2018 7.5%
Minority child population under 6
2014 642018 65
Minority child population under 6 as % of under 6 child population
2014 6.9%
2018 7.5%
Children in single-parent families
2009-2013 35.8%2014-2018 31.5%
Children in married-parent families
2009-2013 63.2%2014-2018 64.4%
Economic Well-being
Children in poverty under 62014 38.4%2018 34.8%
Children in poverty, ages 5-172009-2013 39.9%2014-2018 32.6%
Housing cost-burdened households
2009-2013 26.9%2014-2018 21.6%
Family households with children under 18 at 185% of poverty level
2009-2013 59.9%
2014-2018 52.3%
Children in families receiving SNAP
2014 52.0%2018 49.2%
Median income family household with children under 18
2009-2013 $32,713
2014-2018 $41,753
Adult unemployment2014 7.3%2018 4.8%
Child homelessness2014 0.0%2018 0.0%
a If no % listed, no vehicle fatalities happened in the county during that period.b *Indicates unstable rate due to low count (<20 cases);** indicates very unstable rate due to very low count (<5 cases)

Outcome MeasuresNumber Rate Trend Rank
2014 2018 2014 2018 State Rate
County Rank
Economic Well-BeingChildren under 18 in poverty 2,783 2,597 28.1% 24.7% é 18.3% 77
Food insecurity for childrenb 2,450 1,990 24.5% 19.5% é 17.5% 69
HealthLow birthweight infantsa,c 152 169 5.8% 5.9% ê 8.5% 6
Preventable hospitalizations for all causes for children under 18 (per 1,000)b,c
63 44 6.3 4.2 é 7.1 19
Child asthma ER rates (per 1,000)b
23 18 2.3 1.7 é 7.5 16
Family & CommunityBirths to teens, ages 15-19 (per 1,000)
56 48 46.6 37.9 é 21.6 98
Substantiated child abuse/neglect cases (per 1,000)a
62 49 6.2 4.6 é 4.0 56
EducationHigh school graduation 277 299 93.0% 90.1% ê 91.3% 93
Achievement proficiencya,d
3rd grade English/Language Arts (MAP) 138 40.6% 48.6%
8th grade English/Language Arts (MAP)
160 49.4% 49.0%
4th grade Math (MAP) 139 38.6% 45.8%
Algebra I (End of Course exam) 179 53.0% 47.0%
Trend: é better ê worse è no change
Webster CountyCounty Seat: Marshfield
73Population: 38,082
2016
County Composite Rank
65
2020
a Outcome not included in County Composite Rank.b Data based on 2013 and 2017.c Data based on 5-year time spans, 2009-2013 and 2014-2018.d Achievement proficiency measures those that scored proficient or above on the MAP tests and Algebra I End of Course exam. Achievement data from 2014 are not shown due to differences in testing standards and assessments used in 2018; accordingly, no trend arrows or county ranks are shown.

Webster County
EducationLicensed child care capacity (per 1,000)
2014 57.52019 56.5
Accredited child care capacity as % of licensed capacity
2014 —2019 6.6%
School attendance, grades K-122014 95.3%2018 94.8%
Family & CommunityTeen unintentional deaths/homicides/suicides (per 100,000)
2009-2013 46.52014-2018 22.5
Single parent head-of-house-hold with children under 18
2009-2013 10.0%2014-2018 6.8%
Juvenile law violation referrals, ages 10-17 (per 1,000)
2014 31.42018 40.2
Annual high school dropout rate2014 1.3%2018 1.3%
Children entering/re-entering state custody (per 1,000)
2014 3.92018 4.5
Health
Infant mortality (per 1,000)2009-2013 8.02014-2018 6.3
Child deaths ages 1-17 (per 100,000)
2009-2013 33.92014-2018 17.4
Child deaths ages 1-14 (per 100,000)
2009-2013 26.62014-2018 13.9
Child deaths ages 15-17 (per 100,000)
2009-2013 68.12014-2018 22.6
Unrestrained automobile fatalities for children under 18a
2009-2013 0.0%2014-2018 66.7%
Substance abuse hospitalizations ages 1-19 (per 100,000)b
2008-2012 16.5*
2013-2017 27.0*
Mental/behavioral hospitalizations (not substance abuse) ages 1-19 (per 10,000)
2008-2012 68.6
2013-2017 71.1
Uninsured children2013 10.5%2017 7.7%
School attendance, grades 9-122014 95.0%2018 94.3%
Contextual IndicatorsCounty Seat: Marshfield
73Population: 38,082
2016
County Composite Rank
2020
65
Demographics
Total population2014 36,8882018 38,082
Child population under 182014 9,9872018 10,663
Children under 18 as % of total population
2014 27.2%2018 27.2%
Child population under 62014 3,0322018 3,493
Children under 6 as % of total population
2014 8.2%2018 8.9%
Minority child population under 18
2014 4842018 555
Minority child population under 18 as % of child population
2014 4.8%2018 5.2%
Minority child population under 6
2014 1402018 187
Minority child population under 6 as % of under 6 child population
2014 4.6%
2018 5.4%
Children in single-parent families
2009-2013 24.3%2014-2018 21.3%
Children in married-parent families
2009-2013 75.1%2014-2018 77.7%
Economic Well-being
Children in poverty under 62014 22.1%2018 17.2%
Children in poverty, ages 5-172009-2013 26.2%2014-2018 23.6%
Housing cost-burdened households
2009-2013 25.6%2014-2018 23.6%
Family households with children under 18 at 185% of poverty level
2009-2013 43.4%
2014-2018 42.4%
Children in families receiving SNAP
2014 29.9%2018 25.2%
Median income family household with children under 18
2009-2013 $48,675
2014-2018 $60,250
Adult unemployment2014 6.0%2018 3.1%
Child homelessness2014 1.1%2018 4.2%
a If no % listed, no vehicle fatalities happened in the county during that period.b *Indicates unstable rate due to low count (<20 cases);** indicates very unstable rate due to very low count (<5 cases)
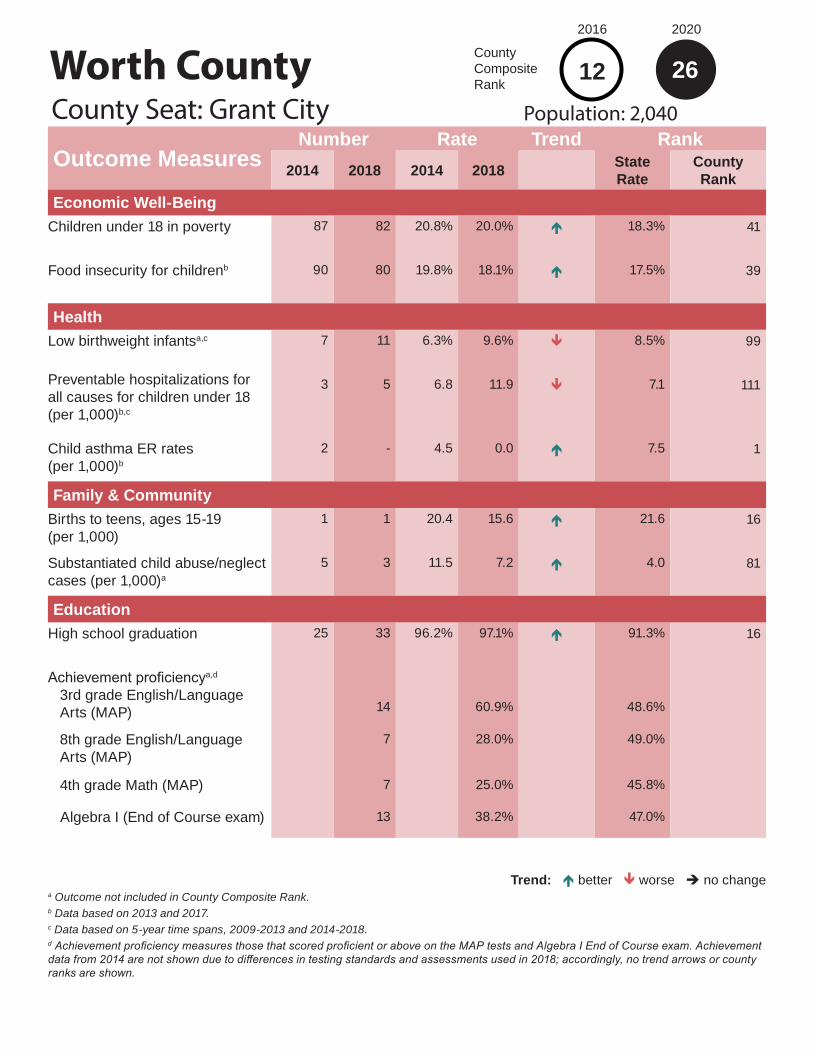
Outcome MeasuresNumber Rate Trend Rank
2014 2018 2014 2018 State Rate
County Rank
Economic Well-BeingChildren under 18 in poverty 87 82 20.8% 20.0% é 18.3% 41
Food insecurity for childrenb 90 80 19.8% 18.1% é 17.5% 39
HealthLow birthweight infantsa,c 7 11 6.3% 9.6% ê 8.5% 99
Preventable hospitalizations for all causes for children under 18 (per 1,000)b,c
3 5 6.8 11.9 ê 7.1 111
Child asthma ER rates (per 1,000)b
2 - 4.5 0.0 é 7.5 1
Family & CommunityBirths to teens, ages 15-19 (per 1,000)
1 1 20.4 15.6 é 21.6 16
Substantiated child abuse/neglect cases (per 1,000)a
5 3 11.5 7.2 é 4.0 81
EducationHigh school graduation 25 33 96.2% 97.1% é 91.3% 16
Achievement proficiencya,d
3rd grade English/Language Arts (MAP) 14 60.9% 48.6%
8th grade English/Language Arts (MAP)
7 28.0% 49.0%
4th grade Math (MAP) 7 25.0% 45.8%
Algebra I (End of Course exam) 13 38.2% 47.0%
Trend: é better ê worse è no change
Worth CountyCounty Seat: Grant City
26Population: 2,040
2016
County Composite Rank
12
2020
a Outcome not included in County Composite Rank.b Data based on 2013 and 2017.c Data based on 5-year time spans, 2009-2013 and 2014-2018.d Achievement proficiency measures those that scored proficient or above on the MAP tests and Algebra I End of Course exam. Achievement data from 2014 are not shown due to differences in testing standards and assessments used in 2018; accordingly, no trend arrows or county ranks are shown.

Worth County
EducationLicensed child care capacity (per 1,000)
2014 95.02019 48.2
Accredited child care capacity as % of licensed capacity
2014 —2019 0.0%
School attendance, grades K-122014 95.0%2018 95.4%
Family & CommunityTeen unintentional deaths/homicides/suicides (per 100,000)
2009-2013 159.52014-2018 305.3
Single parent head-of-house-hold with children under 18
2009-2013 8.9%2014-2018 6.3%
Juvenile law violation referrals, ages 10-17 (per 1,000)
2014 4.92018 47.9
Annual high school dropout rate2014 1.0%2018 0.0%
Children entering/re-entering state custody (per 1,000)
2014 14.32018 2.4
Health
Infant mortality (per 1,000)2009-2013 18.02014-2018 17.4
Child deaths ages 1-17 (per 100,000)
2009-2013 45.42014-2018 234.2
Child deaths ages 1-14 (per 100,000)
2009-2013 0.02014-2018 247.5
Child deaths ages 15-17 (per 100,000)
2009-2013 246.92014-2018 0.0
Unrestrained automobile fatalities for children under 18a
2009-2013 100.0%2014-2018 100%
Substance abuse hospitalizations ages 1-19 (per 100,000)b
2008-2012 0
2013-2017 0
Mental/behavioral hospitalizations (not substance abuse) ages 1-19 (per 10,000)
2008-2012 109.4
2013-2017 57.4
Uninsured children2013 14.2%2017 8.1%
School attendance, grades 9-122014 92.8%2018 93.9%
Contextual IndicatorsCounty Seat: Grant City
26Population: 2,040
2016
County Composite Rank
2020
12
Demographics
Total population2014 2,0732018 2,040
Child population under 182014 4332018 415
Children under 18 as % of total population
2014 20.3%2018 20.9%
Child population under 62014 1392018 130
Children under 6 as % of total population
2014 6.7%2018 6.4%
Minority child population under 18
2014 212018 26
Minority child population under 18 as % of child population
2014 5.0%2018 6.3%
Minority child population under 6
2014 52018 2
Minority child population under 6 as % of under 6 child population
2014 3.6%
2018 1.5%
Children in single-parent families
2009-2013 16.8%2014-2018 22.5%
Children in married-parent families
2009-2013 83.2%2014-2018 76.1%
Economic Well-being
Children in poverty under 62014 27.2%2018 26.9%
Children in poverty, ages 5-172009-2013 20.0%2014-2018 18.8%
Housing cost-burdened households
2009-2013 18.3%2014-2018 18.5%
Family households with children under 18 at 185% of poverty level
2009-2013 55.0%
2014-2018 46.0%
Children in families receiving SNAP
2014 26.1%2018 23.6%
Median income family household with children under 18
2009-2013 $42,000
2014-2018 $52,083
Adult unemployment2014 3.9%2018 2.8%
Child homelessness2014 0.0%2018 0.0%
a If no % listed, no vehicle fatalities happened in the county during that period.b *Indicates unstable rate due to low count (<20 cases);** indicates very unstable rate due to very low count (<5 cases)

Outcome MeasuresNumber Rate Trend Rank
2014 2018 2014 2018 State Rate
County Rank
Economic Well-BeingChildren under 18 in poverty 1,510 1,832 33.7% 39.9% ê 18.3% 114
Food insecurity for childrenb 1,350 1,070 28.4% 23.5% é 17.5% 106
HealthLow birthweight infantsa,c 88 89 7.2% 7.2% è 8.5% 32
Preventable hospitalizations for all causes for children under 18 (per 1,000)b,c
42 38 8.8 8.2 é 7.1 87
Child asthma ER rates (per 1,000)b
14 12 2.9 2.6 é 7.5 33
Family & CommunityBirths to teens, ages 15-19 (per 1,000)
25 23 44.2 37.8 é 21.6 97
Substantiated child abuse/neglect cases (per 1,000)a
93 34 19.8 7.2 é 4.0 82
EducationHigh school graduation 213 211 96.8% 98.6% é 91.3% 8
Achievement proficiencya,d
3rd grade English/Language Arts (MAP) 148 60.9% 48.6%
8th grade English/Language Arts (MAP)
126 48.3% 49.0%
4th grade Math (MAP) 102 43.2% 45.8%
Algebra I (End of Course exam) 81 39.9% 47.0%
Trend: é better ê worse è no change
Wright CountyCounty Seat: Hartville
99Population: 18,293
2016
County Composite Rank
89
2020
a Outcome not included in County Composite Rank.b Data based on 2013 and 2017.c Data based on 5-year time spans, 2009-2013 and 2014-2018.d Achievement proficiency measures those that scored proficient or above on the MAP tests and Algebra I End of Course exam. Achievement data from 2014 are not shown due to differences in testing standards and assessments used in 2018; accordingly, no trend arrows or county ranks are shown.

Wright County
EducationLicensed child care capacity (per 1,000)
2014 61.82019 76.5
Accredited child care capacity as % of licensed capacity
2014 —2019 4.2%
School attendance, grades K-122014 95.3%2018 95.4%
Family & CommunityTeen unintentional deaths/homicides/suicides (per 100,000)
2009-2013 31.92014-2018 49.3
Single parent head-of-house-hold with children under 18
2009-2013 8.7%2014-2018 10.5%
Juvenile law violation referrals, ages 10-17 (per 1,000)
2014 26.32018 25.8
Annual high school dropout rate2014 0.1%2018 0.2%
Children entering/re-entering state custody (per 1,000)
2014 19.52018 11.7
Health
Infant mortality (per 1,000)2009-2013 9.12014-2018 11.3
Child deaths ages 1-17 (per 100,000)
2009-2013 29.42014-2018 35.3
Child deaths ages 1-14 (per 100,000)
2009-2013 35.32014-2018 31.9
Child deaths ages 15-17 (per 100,000)
2009-2013 0.02014-2018 24.8
Unrestrained automobile fatalities for children under 18a
2009-2013 100.0%2014-2018 %
Substance abuse hospitalizations ages 1-19 (per 100,000)b
2008-2012 20.3*
2013-2017 21.6*
Mental/behavioral hospitalizations (not substance abuse) ages 1-19 (per 10,000)
2008-2012 79.8
2013-2017 86.7
Uninsured children2013 8.4%2017 8.0%
School attendance, grades 9-122014 94.4%2018 95.1%
Contextual IndicatorsCounty Seat: Hartville
99Population: 18,293
2016
County Composite Rank
2020
89
Demographics
Total population2014 18,2912018 18,293
Child population under 182014 4,6912018 4,703
Children under 18 as % of total population
2014 25.2%2018 24.8%
Child population under 62014 1,4192018 1,581
Children under 6 as % of total population
2014 7.8%2018 8.6%
Minority child population under 18
2014 2502018 271
Minority child population under 18 as % of child population
2014 5.4%2018 5.8%
Minority child population under 6
2014 982018 102
Minority child population under 6 as % of under 6 child population
2014 6.9%
2018 6.5%
Children in single-parent families
2009-2013 27.2%2014-2018 31.4%
Children in married-parent families
2009-2013 72.2%2014-2018 67.4%
Economic Well-being
Children in poverty under 62014 34.7%2018 40.6%
Children in poverty, ages 5-172009-2013 31.3%2014-2018 37.6%
Housing cost-burdened households
2009-2013 30.8%2014-2018 25.6%
Family households with children under 18 at 185% of poverty level
2009-2013 65.4%
2014-2018 60.6%
Children in families receiving SNAP
2014 48.5%2018 43.0%
Median income family household with children under 18
2009-2013 $30,000
2014-2018 $36,299
Adult unemployment2014 7.1%2018 4.1%
Child homelessness2014 0.9%2018 1.7%
a If no % listed, no vehicle fatalities happened in the county during that period.b *Indicates unstable rate due to low count (<20 cases);** indicates very unstable rate due to very low count (<5 cases)

Outcome MeasuresNumber Rate Trend Rank
2014 2018 2014 2018 State Rate
County Rank
Economic Well-BeingChildren under 18 in poverty 27,003 21,558 42.9% 38.4% é 18.3% 113
Food insecurity for childrenb 16,340 13,970 24.6% 22.3% é 17.5% 100
HealthLow birthweight infantsa,c 2,928 2,821 12.2% 12.9% ê 8.5% 115
Preventable hospitalizations for all causes for children under 18 (per 1,000)b,c
722 697 10.8 11.7 ê 7.1 110
Child asthma ER rates (per 1,000)b
2,028 1,491 30.5 24.9 é 7.5 115
Family & CommunityBirths to teens, ages 15-19 (per 1,000)
336 219 39.1 28.8 é 21.6 65
Substantiated child abuse/neglect cases (per 1,000)a
210 206 3.2 3.6 ê 4.0 34
EducationHigh school graduation 1,622 1,714 72.7% 80.5% é 91.3% 115
Achievement proficiencya,d
3rd grade English/Language Arts (MAP) 622 22.3% 48.6%
8th grade English/Language Arts (MAP)
505 24.5% 49.0%
4th grade Math (MAP) 580 20.6% 45.8%
Algebra I (End of Course exam) 430 25.8% 47.0%
Trend: é better ê worse è no change
St. Louis City 115Population: 311,273
2016
County Composite Rank
115
2020
a Outcome not included in County Composite Rank.b Data based on 2013 and 2017.c Data based on 5-year time spans, 2009-2013 and 2014-2018.d Achievement proficiency measures those that scored proficient or above on the MAP tests and Algebra I End of Course exam. Achievement data from 2014 are not shown due to differences in testing standards and assessments used in 2018; accordingly, no trend arrows or county ranks are shown.

St. Louis City
EducationLicensed child care capacity (per 1,000)
2014 194.72019 191.2
Accredited child care capacity as % of licensed capacity
2014 —2019 24.2%
School attendance, grades K-122014 93.7%2018 93.2%
Family & CommunityTeen unintentional deaths/homicides/suicides (per 100,000)
2009-2013 97.12014-2018 127.8
Single parent head-of-house-hold with children under 18
2009-2013 14.1%2014-2018 11.3%
Juvenile law violation referrals, ages 10-17 (per 1,000)
2014 43.22018 32.4
Annual high school dropout rate2014 10.6%2018 7.3%
Children entering/re-entering state custody (per 1,000)
2014 4.42018 4.8
Health
Infant mortality (per 1,000)2009-2013 11.62014-2018 8.1
Child deaths ages 1-17 (per 100,000)
2009-2013 30.42014-2018 38.9
Child deaths ages 1-14 (per 100,000)
2009-2013 20.22014-2018 22.7
Child deaths ages 15-17 (per 100,000)
2009-2013 86.92014-2018 108.3
Unrestrained automobile fatalities for children under 18a
2009-2013 80.0%2014-2018 92.3%
Substance abuse hospitalizations ages 1-19 (per 100,000)b
2008-2012 11.2
2013-2017 19.7
Mental/behavioral hospitalizations (not substance abuse) ages 1-19 (per 10,000)
2008-2012 64.7
2013-2017 87.6
Uninsured children2013 6.5%2017 4.8%
School attendance, grades 9-122014 92.1%2018 91.7%
Contextual Indicators
115Population: 311,273
2016
County Composite Rank
2020
115
Demographics
Total population2014 317,4192018 311,273
Child population under 182014 65,6472018 57,526
Children under 18 as % of total population
2014 20.3%2018 19.7%
Child population under 62014 25,1412018 21,998
Children under 6 as % of total population
2014 7.9%2018 7.3%
Minority child population under 18
2014 44,8562018 41,239
Minority child population under 18 as % of child population
2014 69.6%2018 71.7%
Minority child population under 6
2014 16,2432018 14,581
Minority child population under 6 as % of under 6 child population
2014 64.6%
2018 66.3%
Children in single-parent families
2009-2013 60.6%2014-2018 60.1%
Children in married-parent families
2009-2013 37.8%2014-2018 38.5%
Economic Well-being
Children in poverty under 62014 38.6%2018 39.8%
Children in poverty, ages 5-172009-2013 44.1%2014-2018 37.7%
Housing cost-burdened households
2009-2013 43.7%2014-2018 39.6%
Family households with children under 18 at 185% of poverty level
2009-2013 56.1%
2014-2018 52.2%
Children in families receiving SNAP
2014 72.7%2018 66.7%
Median income family household with children under 18
2009-2013 $31,902
2014-2018 $37,966
Adult unemployment2014 7.7%2018 3.8%
Child homelessness2014 16.0%2018 18.2%
a If no % listed, no vehicle fatalities happened in the county during that period.b *Indicates unstable rate due to low count (<20 cases);** indicates very unstable rate due to very low count (<5 cases)