presenter position enhis environment and health information system marco martuzzi andrey egorov...
TRANSCRIPT

PresenterPosition
ENHISEnvironment and Health
Information System
Marco MartuzziAndrey EgorovChristian Gapp

ENHIS development history
European environment and health process
2004 2007 2010
Indicator development projects: ECOEHIS, ENHIS-1, ENHIS-2
20112009
Launch of ENHIS
Progress assessment
Tools for monitoring
Parma commitments
2017
6th Ministerial Conference on
Environment and Health
Baseline assessment
2013
5th Ministerial Conference adopted new targets
4th Ministerial Conference stated the need to
develop ENHIS
2
New IT platform
Parma Commitment 9: “We support the development of the European Environment and Health Information System (ENHIS). We call on WHO… …to continue to assist Member States with the development of internationally comparable indicators…”

ENHIS methodology and contents
• Monitoring the European Environment and Health Process
• Country level indicators Exposure Health effect Policy action
• Graphs and maps• Standardized fact sheets in English
and Russian International comparisons Temporal trends
www.euro.who.int/enhis

euro.who.int/ENHIS
select

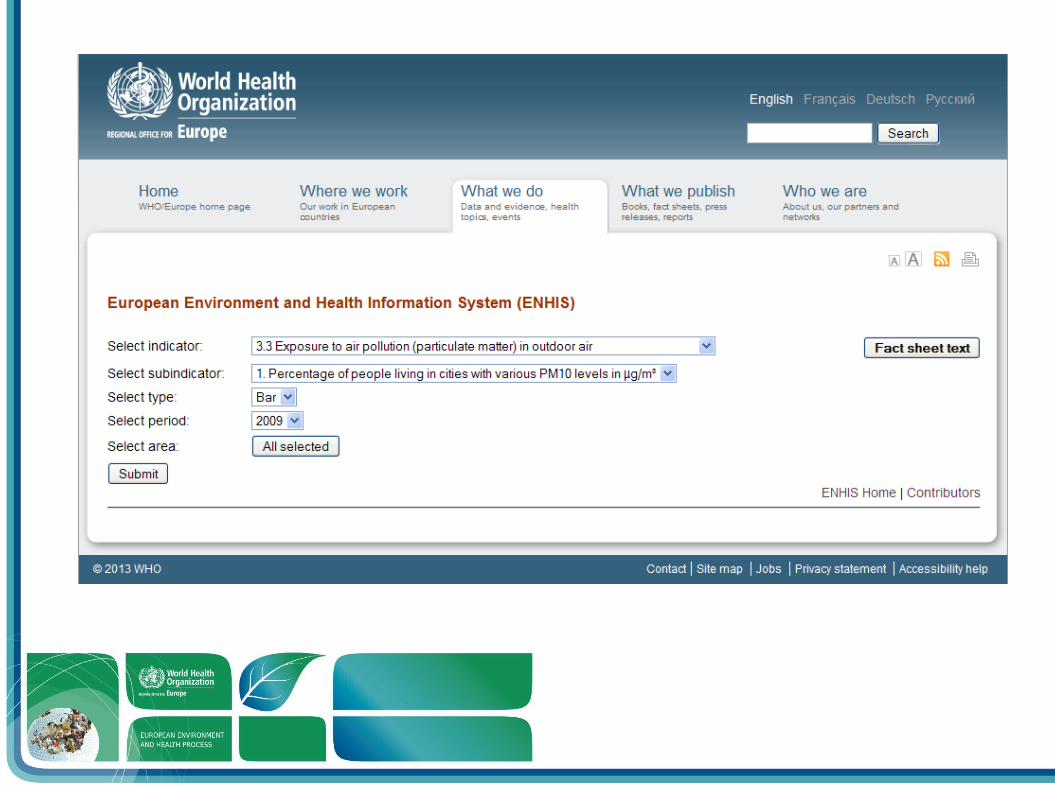

Data sources:
EEA (PM10 monitoring)
EUROSTAT (population)
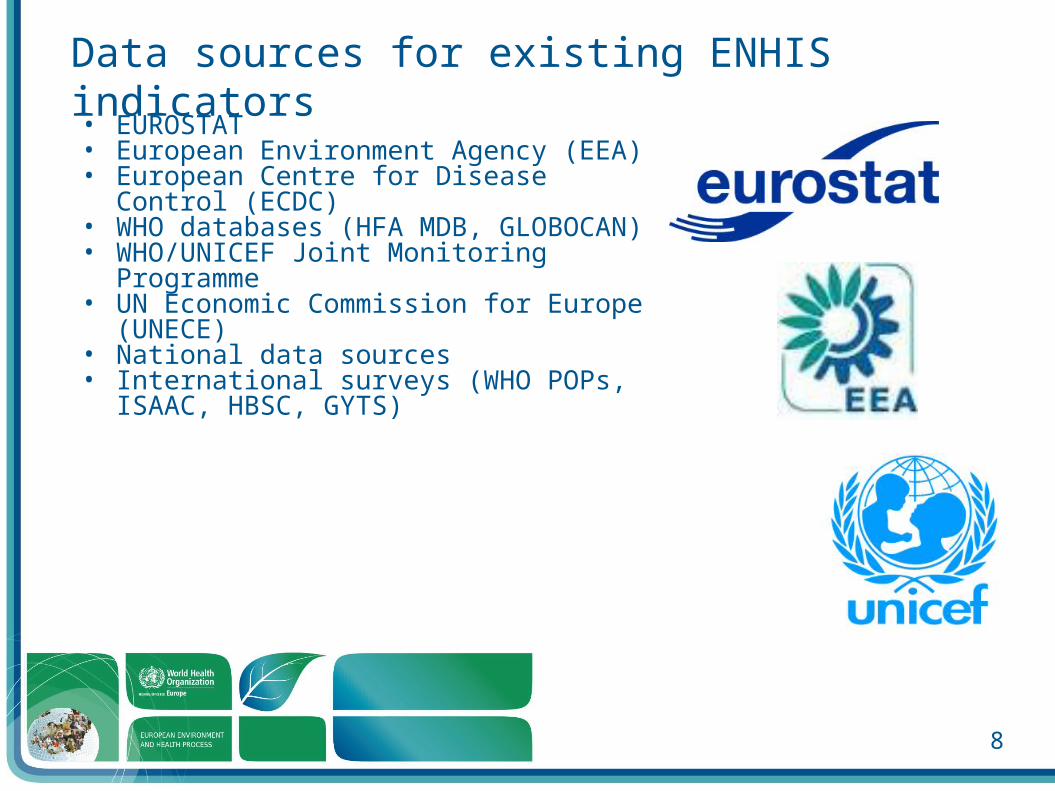
Data sources for existing ENHIS indicators• EUROSTAT• European Environment Agency (EEA)• European Centre for Disease Control (ECDC)• WHO databases (HFA MDB, GLOBOCAN)• WHO/UNICEF Joint Monitoring Programme• UN Economic Commission for Europe
(UNECE)• National data sources• International surveys (WHO POPs, ISAAC,
HBSC, GYTS)
8

New indicators for Parma monitoring• Nov. 2010 (Bonn) – proposed new
indicators
• Apr. 2011 (Bonn) – indoor air quality indicators and school survey design (funded and co-organized by Joint Research Centre)
• Sep. 2011 (Bonn) – methodologies of new indicators
• Apr 2012 (Catania, Italy) – human biomonitoring survey design and indicators
• Jun 2012 (Hague, the Netherlands) – the European Environment and Task Force approved the proposed survey
• Oct. 2012 (Bonn) – organization of data collection for new indicators
9

New indicators for Parma monitoring – RPG3
10
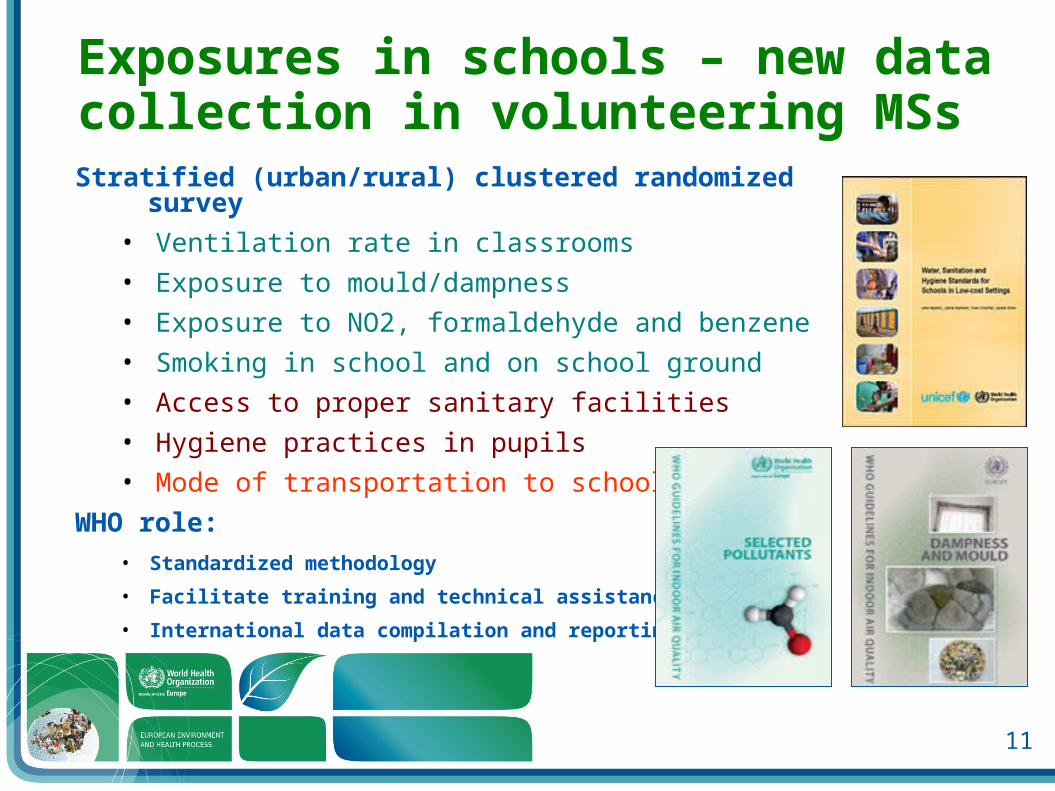
Exposures in schools – new data collection in volunteering MSsStratified (urban/rural) clustered randomized
survey• Ventilation rate in classrooms• Exposure to mould/dampness• Exposure to NO2, formaldehyde and benzene• Smoking in school and on school ground • Access to proper sanitary facilities• Hygiene practices in pupils• Mode of transportation to school
WHO role: • Standardized methodology
• Facilitate training and technical assistance
• International data compilation and reporting
11
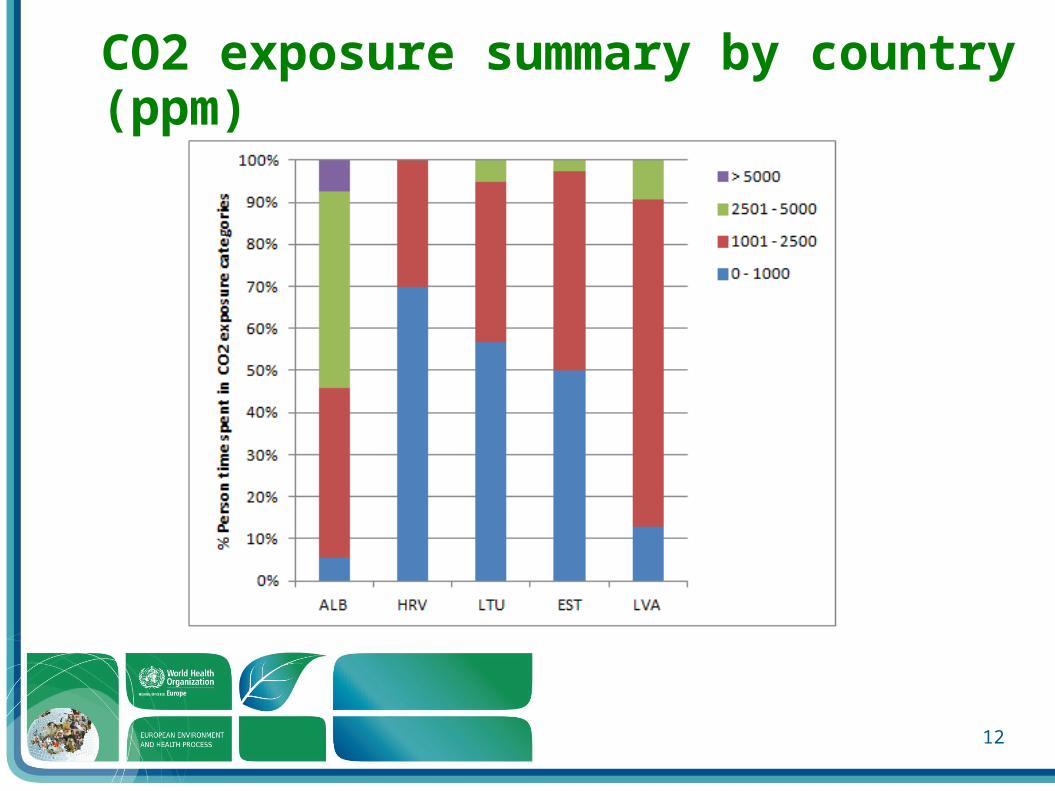
CO2 exposure summary by country (ppm)
12
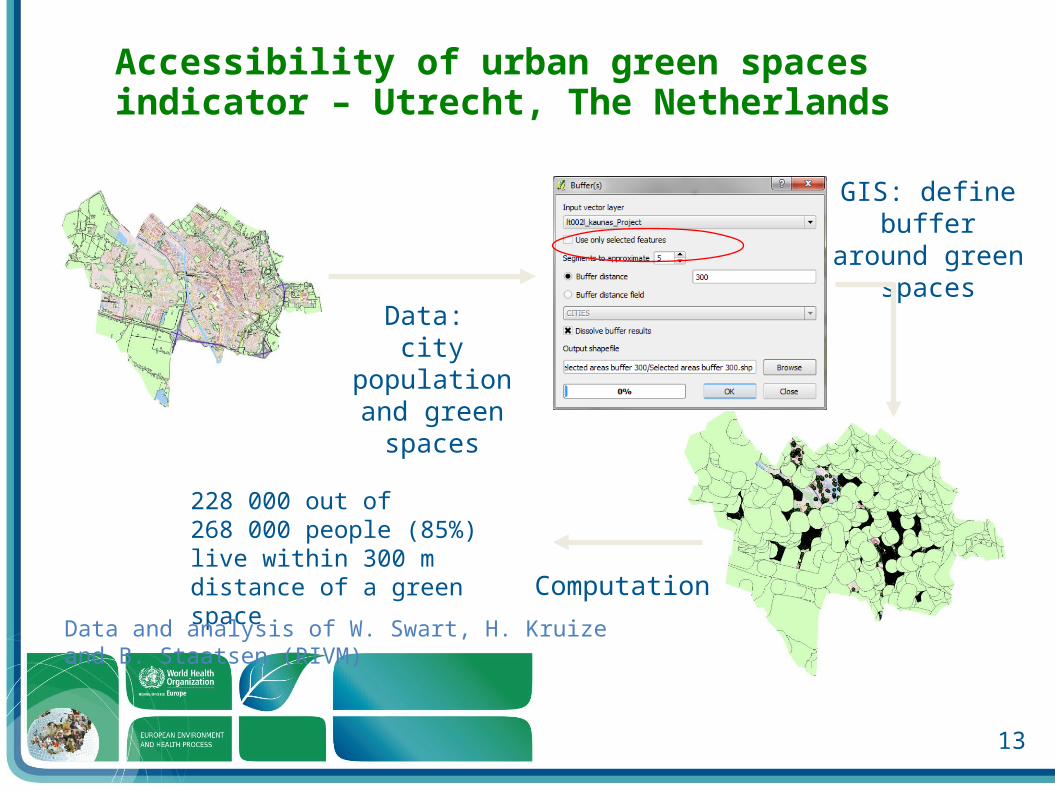
Accessibility of urban green spaces indicator – Utrecht, The Netherlands
Data: city population
and green spaces
GIS: define buffer around green spaces
Computation
228 000 out of268 000 people (85%)live within 300 m distance of a green space
Data and analysis of W. Swart, H. Kruize and B. Staatsen (RIVM)
13
Developing ENHIS – plan for next 12 months
Incorporate indicators based on unique data and standard tools:
• Publish new indicators of exposure in the school environment
• Publish new indicators of early life exposure to selected chemicals
• Finalize and publish data analysis tools, SOPs and survey protocols
• Publish new indicators based on statistical analysis of existing data (access to green spaces, exposure to pollen, etc.); publish data analysis tools.
14
Plan for next 12 months (continuation) • Provide technical support to national EHI systems (training workshop in EST in Jan 2014, etc.)
• Wrap up technical support to school surveys and publish reports and manuscripts
• Complete the HBM survey methodology and facilitate national surveys (HRV, RUS, SRB, other MSs)
• Contribute to the UNEP/WHO project on mercury
• Assess urban green space accessibility and its health effects in collaboration with other programmes
• Improve the visibility of ENHIS in the Internet, advertise the system, re-evaluate the usage data
15
Operating ENHIS• Highly demanding in manpower both with
existing data and collected ones
• Informative vs complete coverage data
• High resolution vs standardised data
• Region-wide reports and assessments developed ad-hoc (e.g., Mid-Term Review 2015)
• Increasing demand for professional packaging
16

Current discussion• Gradually decrease efforts on customer-
oriented service and invest in producing original assessments and evaluations Conduct assessments of risk, impact, burden of
disease of specific environmental factors Conduct statistical analyses of data from existing
national and international sources, identify priority for data collection, evaluate EH policies
17