presentazione di powerpoint - datalogic.com · integration office . retail: 38% of revenues* 15 *...
TRANSCRIPT

STAR Conference
Milano
25-26 March, 2014

Agenda
Group Overview
Strategy and Outlook
2013 Results
2

Group Overview

Datalogic at a glance
Global leader in Automatic Data Capture and
Industrial Automation markets
World-class producer of barcode readers, mobile
computers, sensors, vision systems and laser
marking systems with innovative solutions in retail,
manufacturing, transportation & logistics and
healthcare industries
2013 Revenues at 450.7 M Euro of which 62.6% in
the ADC Market and 30.6% in the Industrial
Automation Market
A large portfolio of nearly 1,100 patents
Founded in 1972 by Romano Volta in Bologna, Italy
and listed on the STAR Segment of the Italian Stock
Exchange since 2001
About 2,400 employees, of which 350 in R&D
Direct presence in 30 countries worldwide selling to
120 countries
+1,000 partners worldwide
4

Consistent Growth in 2001-2013
5
SALES CAGR 2001-2013 +12% EBITDA CAGR 2001-2013 +12%
NET INCOME CAGR 2001-2013 +34% Consistent history of profitable growth
Strong improvements across key indicators
reflecting investments in innovation, M&A
and better efficiency and productivity
Robust cash generation to reduce debt and
to sustain growth
* 2012 net profit impacted by the write off of Accu-Sort goodwill
112 118 132 146
206
382 404
380
312
393 426
462 451
2001 2002 2003 2004 2005 2006 2007 2008 2009 2010 2011 2012 2013
16 17 21
25
32
38
50 48
20
50
59 63
60
2001 2002 2003 2004 2005 2006 2007 2008 2009 2010 2011 2012 2013
1
5 7
11 13
4
18 18
-12
18
26
10
27
2001 2002 2003 2004 2005 2006 2007 2008 2009 2010 2011 2012 2013

Acquisition of
Multiwave
Photonics
(Portugal)
Acquisition of
IDWare Mobile
Computing &
Comm. (Italy)
Acquisition of
Escort Memory
Systems Inc.
(CA, USA)
Acquisition of
Datasensor SpA
(Italy)
Listing on the Milan
Stock Exchange
Acquisition of
Minec AB
(Sweden)
Acquisition of
Laservall SpA (Italy)
Acquisition of Informatics
Inc. (TX, USA)
Acquisition of PSC Inc.
(OR, USA)
2001 2002 2005 2004 2008 2010
Acquisition of
Evolution Robotics
Retail (CA, USA)
2011
Acquisition of
Accu-Sort Systems
Inc. (PA, USA)
Acquisition of
PPT Vision Inc.
(MN, USA)
Established in
Bologna
1972 1988 1997 2012
A history of growth through acquisitions
6
2013
7 © Copyright Datalogic 2007-2013
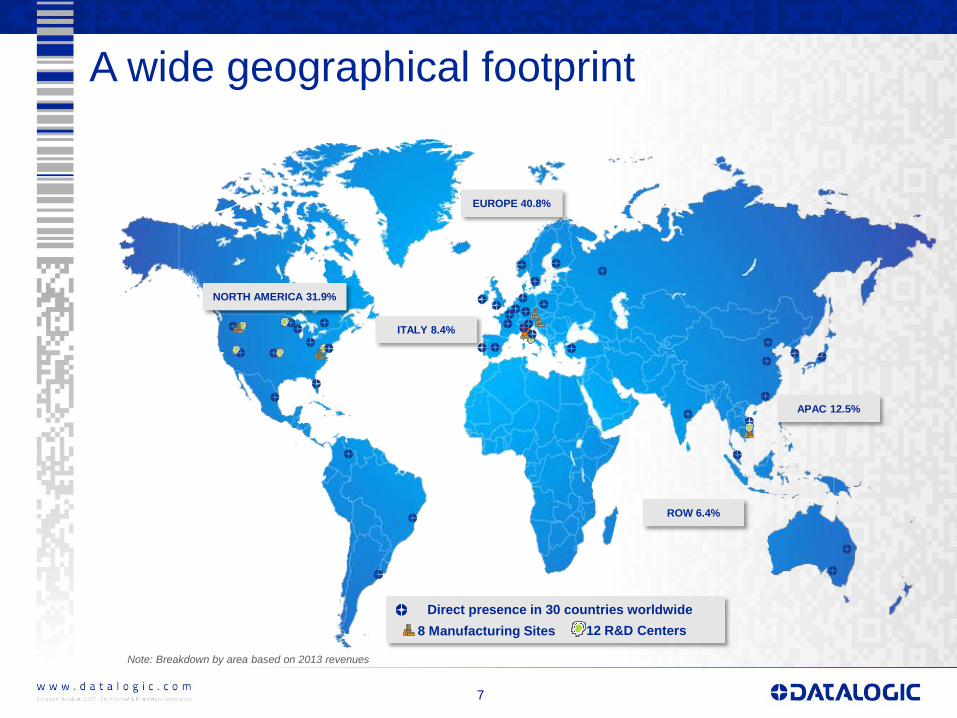
A wide geographical footprint
7
EUROPE 40.8%
ITALY 8.4%
NORTH AMERICA 31.9%
ROW 6.4%
APAC 12.5%
Note: Breakdown by area based on 2013 revenues
Direct presence in 30 countries worldwide
8 Manufacturing Sites 12 R&D Centers

Stock and Governance
8
Market Segment: STAR MTA
Reuters Code: DAL.MI
Bloomberg Code: DAL IM
Outstanding Shares: 58,446,491
Share Par-Value: 0.52 Euro each
SHAREHOLDERS’ STRUCTURE
Ticker: DAL
Price (March 21st, 2014): 9.26 Euro
Market Cap (March 21st, 2014): 541 M Euro
Specialist: Intermonte SIM
Auditing Company: Reconta Ernst & Young
DATALOGIC PRICE PERFORMANCE
5,5
6,0
6,5
7,0
7,5
8,0
8,5
9,0
9,5
10,0
5,5
6,0
6,5
7,0
7,5
8,0
8,5
9,0
9,5
10,0
feb 13mar 13apr 13mag 13giu 13lug 13ago 13set 13ott 13nov 13dic 13gen 14feb 14mar 14
Datalogic S.p.A. Ftse Italia All-Share - Index Price Level (Rebased)
67,20%
27,91%
2,44% 2,45%
Hydra S.p.A.
Free Float
JP Morgan AssetManagement
Norges Bank

Strategy and Outlook
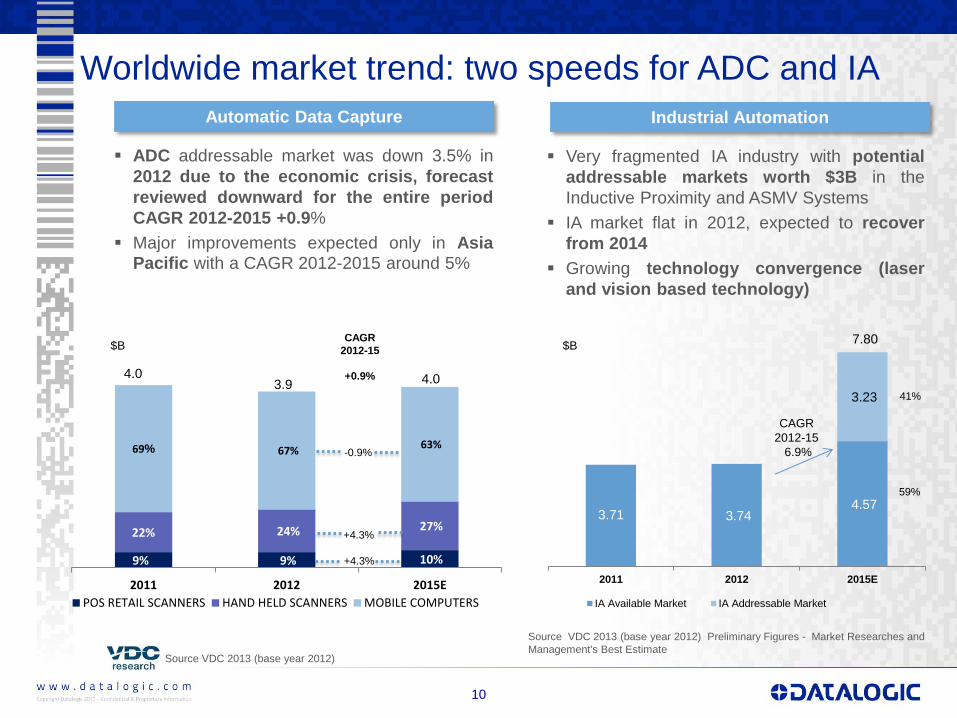
3.71 3.74 4.57
3.23
2011 2012 2015E
IA Available Market IA Addressable Market
7.80
59%
41%
9% 9% 10%
22% 24% 27%
69% 67% 63%
2011 2012 2015E
POS RETAIL SCANNERS HAND HELD SCANNERS MOBILE COMPUTERS
4.0
Worldwide market trend: two speeds for ADC and IA
10
Automatic Data Capture
ADC addressable market was down 3.5% in
2012 due to the economic crisis, forecast
reviewed downward for the entire period
CAGR 2012-2015 +0.9%
Major improvements expected only in Asia
Pacific with a CAGR 2012-2015 around 5%
Industrial Automation
Very fragmented IA industry with potential
addressable markets worth $3B in the
Inductive Proximity and ASMV Systems
IA market flat in 2012, expected to recover
from 2014
Growing technology convergence (laser
and vision based technology)
CAGR
2012-15
6.9%
$B
Source VDC 2013 (base year 2012)
$B
Source VDC 2013 (base year 2012) Preliminary Figures - Market Researches and
Management's Best Estimate
4.0 3.9
CAGR
2012-15
+0.9%
-0.9%
+4.3%
+4.3%

11
ADC positioning: competing with giants
11
Source VDC 2013 (base year 2012)
2012 ADC Available Market including POS Retail Scanners, Handheld Scanners and Mobile
Computers (Hand Held , PDA and Fork-Lift Vehicles Mounted Computer) segments
2012 Revenues in $M
20
12
Ma
rke
t S
hare
ADC Market Share
around 10%
POS Retail Scanners
#1 WW – 32.8% mkt share
Handheld Scanners
#1 in EMEA – 33.8% mkt share
#3 WW – 16.8% mkt share
Mobile Computers
#3 in EMEA – 8% mkt share
#3 WW – 4 % mkt share
• A global Leader in ADC and the only
company focus on Auto ID
• Better time to market, more efficiency
• Strong customer-focus

12 © Copyright Datalogic 2007-2013
$50 M $200 M $300 M $500 M
12%
>15%
6%
2%
4%
8%
2012 IA Available Market including Industrial Barcode Scanners, Imagers,
Photoelectric Sensors, Safety Light Curtains, Smart Cameras/Vision Sensors,
Laser Marking segments (Postal Material Handling, Dimensioner and Integrated
Solutions not included)
Source (*) VDC 2013 (base year 2012) Preliminary Figures - Market
Researches and Management's Best Estimate
2012 Revenues in $M
IA positioning: 6% market share
12
Industrial Stationary
Scanners
#1 WW – 27.5% mkt share
#1 in Americas – 31.3% mkt
share
#2 in EMEA – 29.1% mkt
share
20
12
Ma
rke
t S
hare
$100 M
• One of the few focused player • Growing technology convergence:
importance of past investments in
R&D.
13
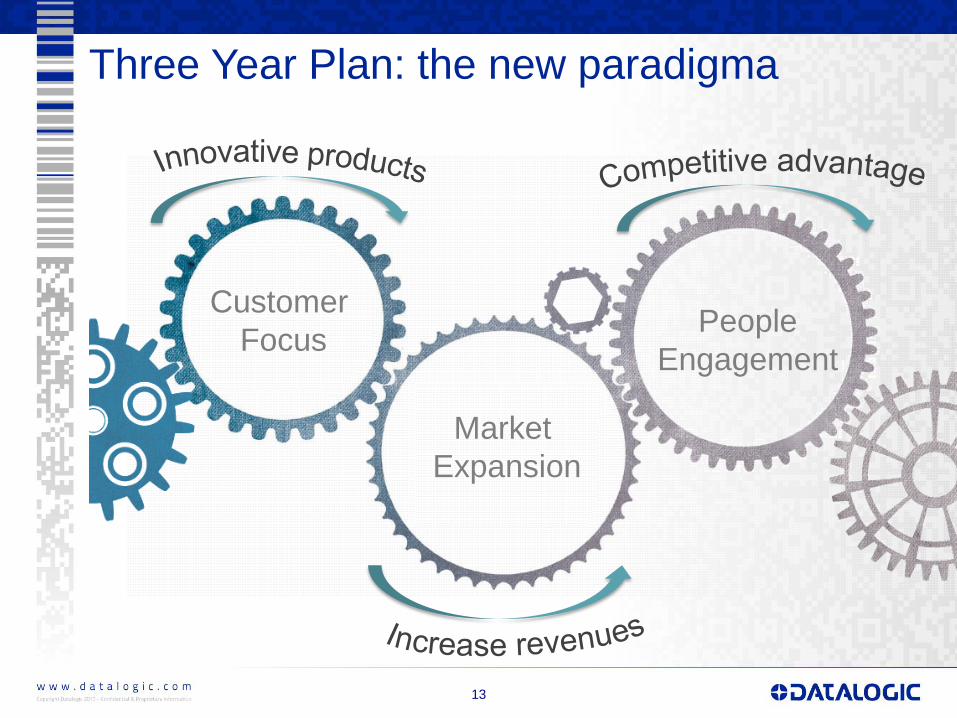
Three Year Plan: the new paradigma
Customer
Focus
Market
Expansion
People
Engagement
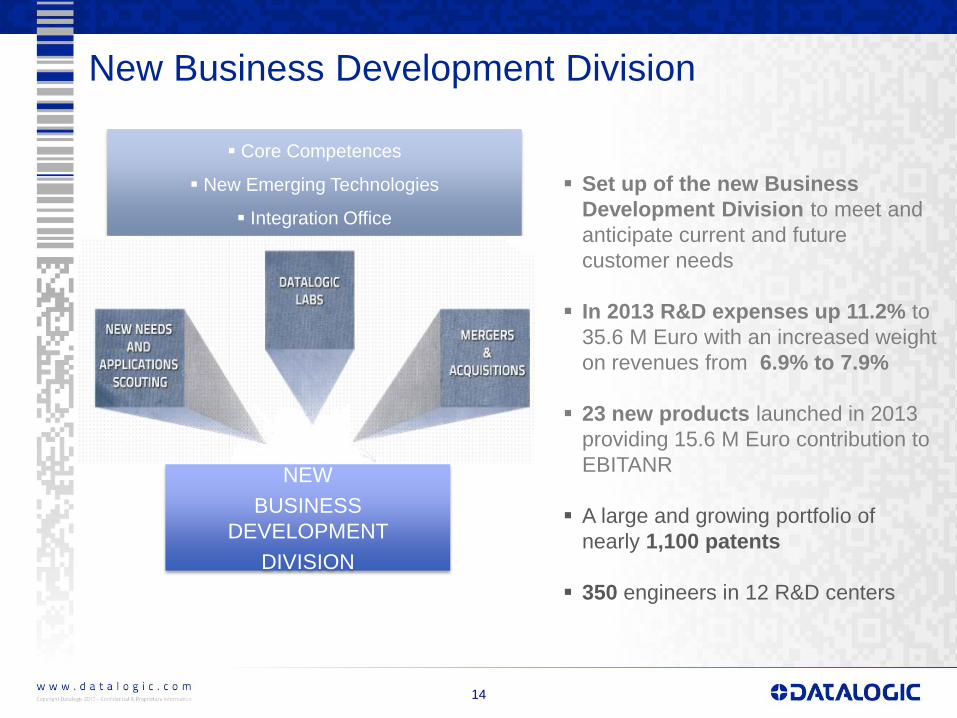
New Business Development Division
14 14 14
Set up of the new Business
Development Division to meet and
anticipate current and future
customer needs
In 2013 R&D expenses up 11.2% to
35.6 M Euro with an increased weight
on revenues from 6.9% to 7.9%
23 new products launched in 2013
providing 15.6 M Euro contribution to
EBITANR
A large and growing portfolio of
nearly 1,100 patents
350 engineers in 12 R&D centers
NEW
BUSINESS
DEVELOPMENT
DIVISION
Core Competences
New Emerging Technologies
Integration Office

Retail: 38% of revenues*
15
* Figures as of 31 December 2013
Industrial Automation
Automatic Data Capture
POS
Maintain / upgrade customer
base
Most innovative solutions
Multi-tier model
Store mngt
Increase customer penetration
New products Tailored services
Warehouse
Maximize customer
coverage
New Products
Bundle solutions
Leverage the great
market share
in POS checkout

Manufacturing: 37% of revenues*
16
* Figures as of 31 December 2013
Industrial Automation
Automatic Data Capture
Warehouse
Shop floor
Automation
Maintain / upgrade customer
base
Packaged solutions
Tailored services
Increase customer penetration
Replicate EMEA channel model
Maximize customer
coverage
Geographical expansion
Leverage the product
breadth
and distribution channel
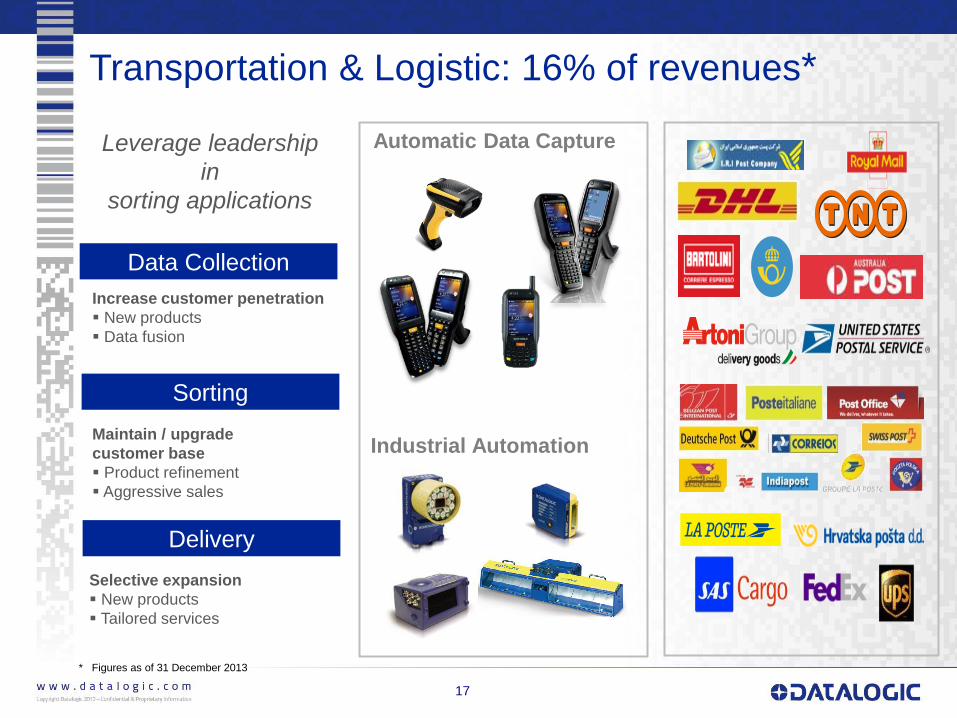
Transportation & Logistic: 16% of revenues*
17
* Figures as of 31 December 2013
Industrial Automation
Automatic Data Capture
Data Collection
Leverage leadership
in
sorting applications
Increase customer penetration
New products
Data fusion
Sorting
Maintain / upgrade
customer base
Product refinement
Aggressive sales
Delivery
Selective expansion
New products
Tailored services
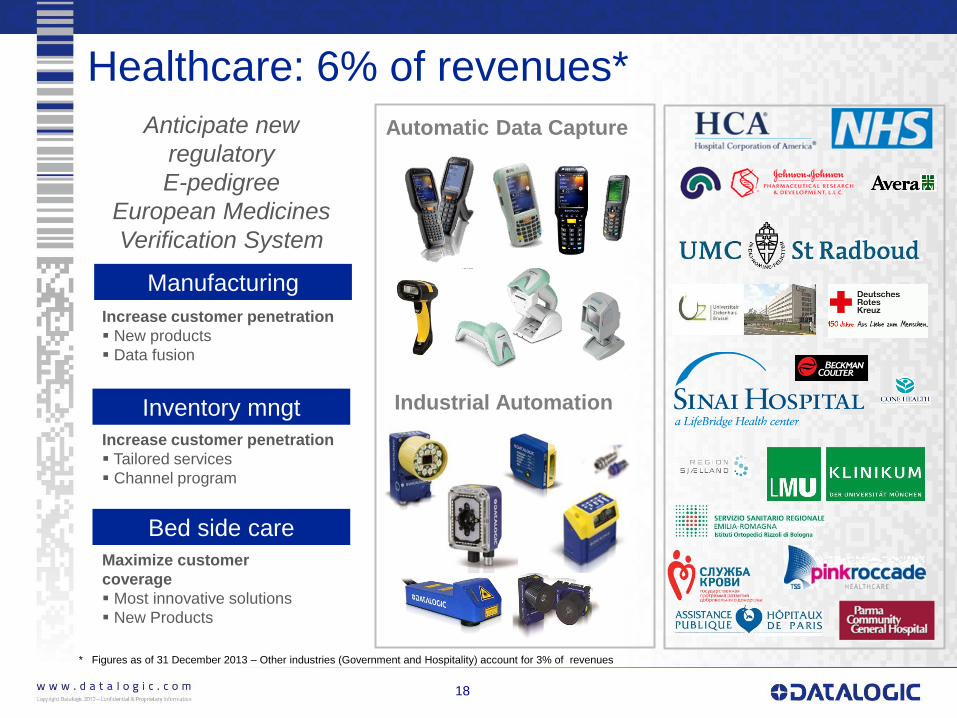
Healthcare: 6% of revenues*
18
* Figures as of 31 December 2013 – Other industries (Government and Hospitality) account for 3% of revenues
Industrial Automation
Automatic Data Capture
Manufacturing
Increase customer penetration
New products
Data fusion
Anticipate new
regulatory
E-pedigree
European Medicines
Verification System
Inventory mngt
Increase customer penetration
Tailored services
Channel program
Bed side care
Maximize customer
coverage
Most innovative solutions
New Products
Market expansion – Exploit fast growing markets
19
Increase penetration in large regions and fast
growing geographies: CAGR 2012-2015
+12%
Large potential in all key industries for
automation investments (focus on Sensors &
Vision in BRICS)
Boost growth in under served countries like
China, Korea, Turkey, Africa, India and Brazil
Strengthen sales force and establish new
local offices : new opening in Brazil with on-
site production, in Turkey and in Africa
Ad hoc products that fit with local needs and
habits
Scouting new opportunities for external growth
(not included in the plan)

Invest in people management and motivation
20
A new strengthened Human Resources
leadership to enable Datalogic business
strategy & agenda by ensuring:
the design and delivery of a high
performance organization
the selection and retention of top
talent
the development and rewarding of
people by fostering a culture of
engagement and results oriented
Datalogic Human Resources key strategic pillar:
Differentiated performance through our people!
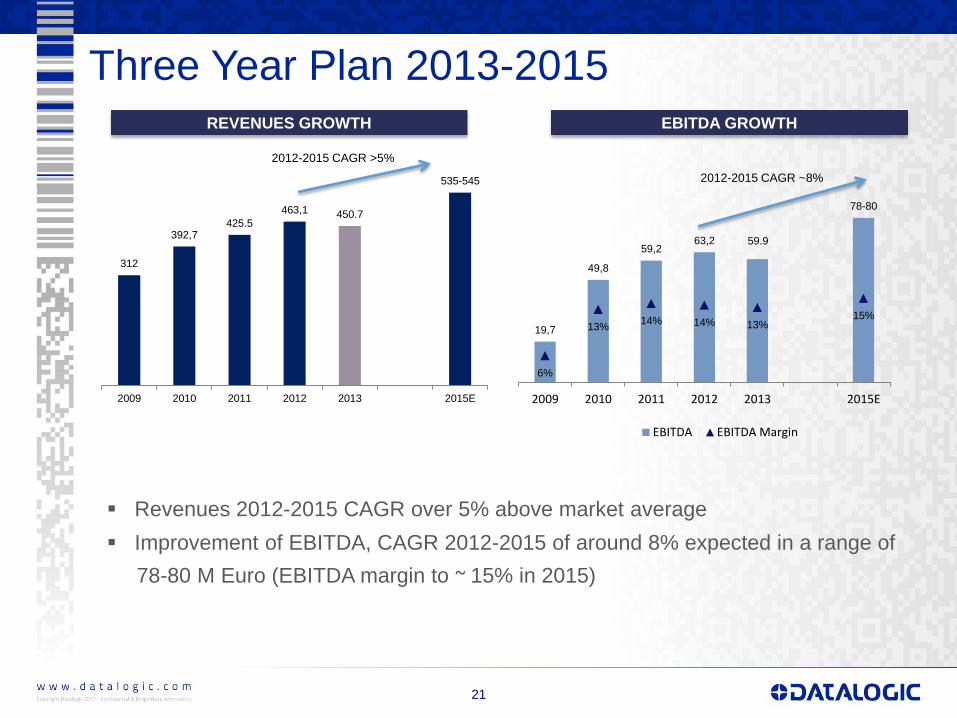
19,7
49,8
59,2 63,2 59.9
78-80
6%
13% 14% 14% 13%
15%
2009 2010 2011 2012 2013 2015E
EBITDA EBITDA Margin
312
392,7 425.5
463,1 450.7
535-545
2009 2010 2011 2012 2013 2015E
Three Year Plan 2013-2015
21
REVENUES GROWTH EBITDA GROWTH
Revenues 2012-2015 CAGR over 5% above market average
Improvement of EBITDA, CAGR 2012-2015 of around 8% expected in a range of
78-80 M Euro (EBITDA margin to ~ 15% in 2015)
2012-2015 CAGR >5%
2012-2015 CAGR ~8%

Three Year Plan 2013-2015
22
Strong cash generation: Net Debt/Equity ratio < 20% and Net Debt/EBITDA
around 0.5X
Investment in CAPEX stable at around 2% of revenues per year
2015 ROE target around 17%-18%
ROE GROWTH
* 2012 figures include impairment on Accu-Sort
** Figures gross of dividends
Net Financial Position **
(76)
(59)
(121)
56-61
(36-41)
(97)
2010 2011 2012 2013 Cash Flow 2015E
14,0%
17,7%
6,0%
15%
17%-18%%
2010 2011 2012* 2013 2015E

2013 Results

Highlights 4Q 2013
24
Revenues improved both on a quarterly (+7.1%) and on a yearly (+4.6%)
basis
Strong recovery continued in terms of revenues and marginality on a
yearly basis: EBITDA +60.2% and EBITANR +78.2% YOY
Ebitda Margin improved from 9.1% in 4Q2012 to 14.0% in 4Q2013
Improvement of Industrial Automation continues in particular in terms of
revenues thanks to the launch of new products
€000 4Q2013 3Q2013
Var
QoQ%
4Q2012
Restated
Var
YoY %
Revenues 119,964 112,004 7.1% 114,714 4.6%
Gross Operating Margin (GOM) 55,700 53,129 4.8% 50,489 10.3%
EBITDA 16,766 16,987 (1.3%) 10,465 60.2%
EBITANR 14,194 14,671 (3.3%) 7,966 78.2%
Operating Profit (EBIT) 12,883 13,225 (2.6%) (21,084) n.m.
Net profit 9,255 7,415 24.8% (18,338) n.m.
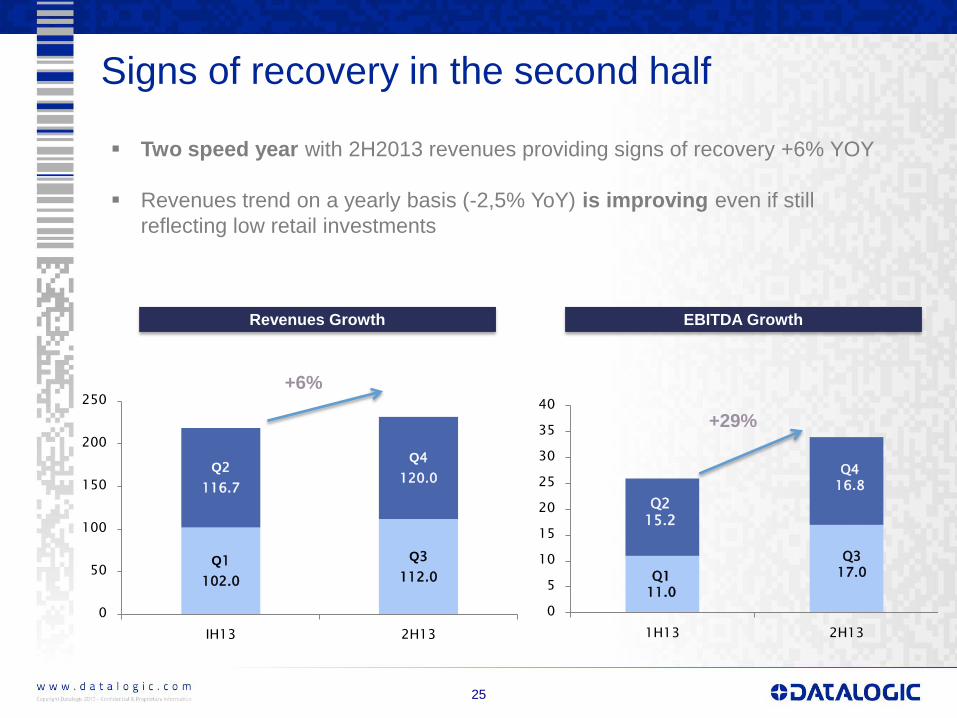
Signs of recovery in the second half
25
Two speed year with 2H2013 revenues providing signs of recovery +6% YOY
Revenues trend on a yearly basis (-2,5% YoY) is improving even if still
reflecting low retail investments
Q1
102.0
Q3
112.0
Q2
116.7
Q4
120.0
0
50
100
150
200
250
IH13 2H13
+6%
0
5
10
15
20
25
30
35
40
1H13 2H13
Q2 15.2
+29%
Q4 16.8
Q1 11.0
Q3 17.0
Revenues Growth EBITDA Growth
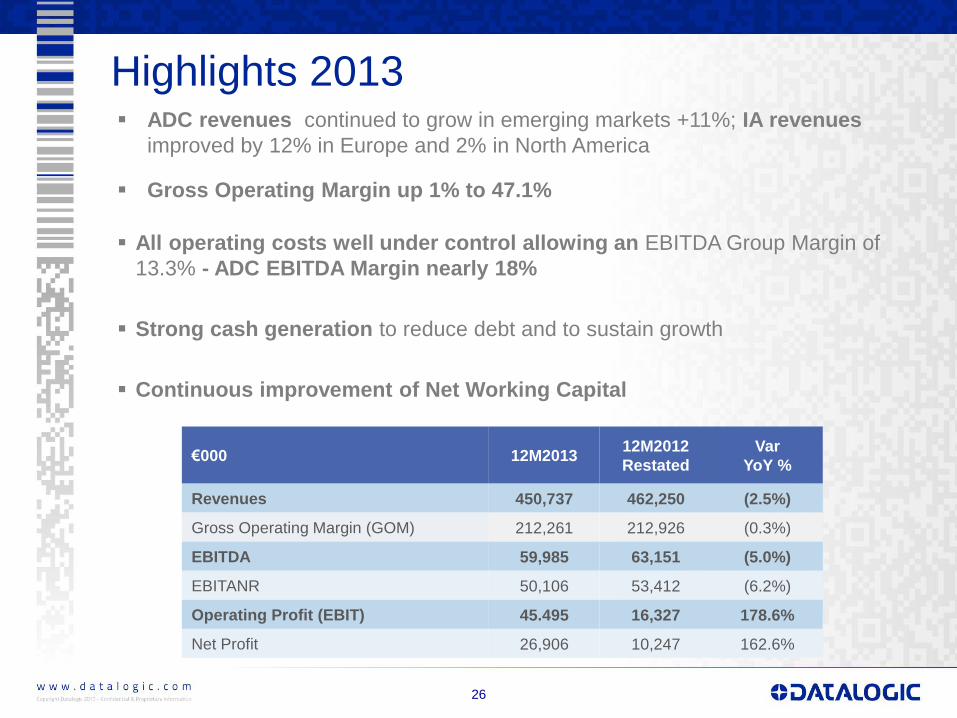
Highlights 2013
26
ADC revenues continued to grow in emerging markets +11%; IA revenues
improved by 12% in Europe and 2% in North America
Gross Operating Margin up 1% to 47.1%
All operating costs well under control allowing an EBITDA Group Margin of
13.3% - ADC EBITDA Margin nearly 18%
Strong cash generation to reduce debt and to sustain growth
Continuous improvement of Net Working Capital
€000 12M2013 12M2012
Restated
Var
YoY %
Revenues 450,737 462,250 (2.5%)
Gross Operating Margin (GOM) 212,261 212,926 (0.3%)
EBITDA 59,985 63,151 (5.0%)
EBITANR 50,106 53,412 (6.2%)
Operating Profit (EBIT) 45.495 16,327 178.6%
Net Profit 26,906 10,247 162.6%
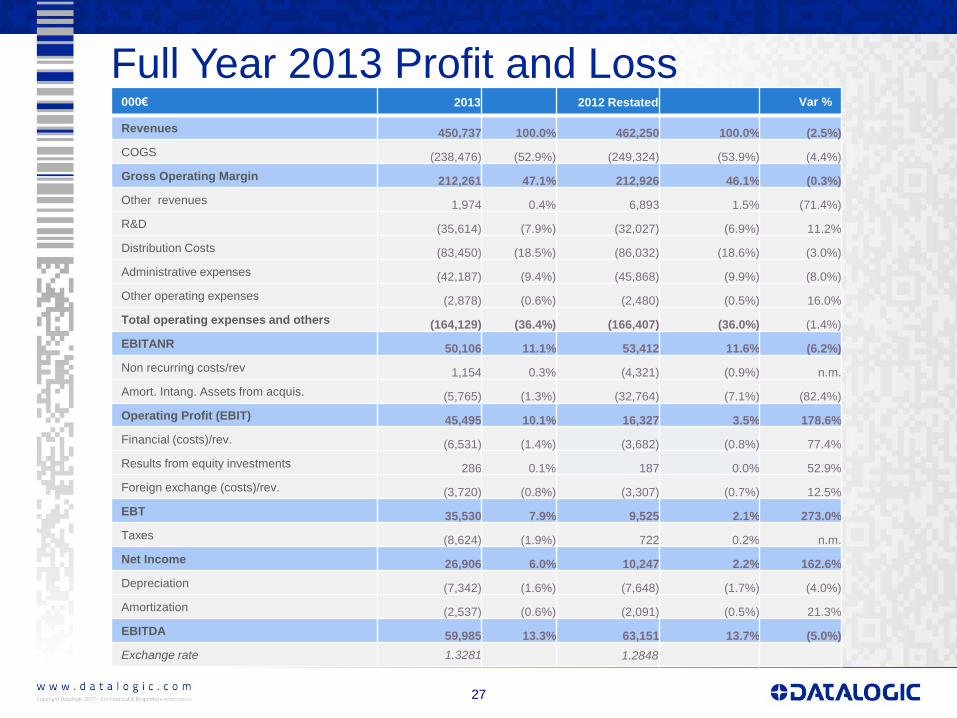
Full Year 2013 Profit and Loss
27
000€ 2013 2012 Restated
Var %
Revenues 450,737 100.0% 462,250 100.0% (2.5%)
COGS (238,476) (52.9%) (249,324) (53.9%) (4.4%)
Gross Operating Margin 212,261 47.1% 212,926 46.1% (0.3%)
Other revenues 1,974 0.4% 6,893 1.5% (71.4%)
R&D (35,614) (7.9%) (32,027) (6.9%) 11.2%
Distribution Costs (83,450) (18.5%) (86,032) (18.6%) (3.0%)
Administrative expenses (42,187) (9.4%) (45,868) (9.9%) (8.0%)
Other operating expenses (2,878) (0.6%) (2,480) (0.5%) 16.0%
Total operating expenses and others (164,129) (36.4%) (166,407) (36.0%) (1.4%)
EBITANR 50,106 11.1% 53,412 11.6% (6.2%)
Non recurring costs/rev 1,154 0.3% (4,321) (0.9%) n.m.
Amort. Intang. Assets from acquis. (5,765) (1.3%) (32,764) (7.1%) (82.4%)
Operating Profit (EBIT) 45,495 10.1% 16,327 3.5% 178.6%
Financial (costs)/rev. (6,531) (1.4%) (3,682) (0.8%) 77.4%
Results from equity investments 286 0.1% 187 0.0% 52.9%
Foreign exchange (costs)/rev. (3,720) (0.8%) (3,307) (0.7%) 12.5%
EBT 35,530 7.9% 9,525 2.1% 273.0%
Taxes (8,624) (1.9%) 722 0.2% n.m.
Net Income 26,906 6.0% 10,247 2.2% 162.6%
Depreciation (7,342) (1.6%) (7,648) (1.7%) (4.0%)
Amortization (2,537) (0.6%) (2,091) (0.5%) 21.3%
EBITDA 59,985 13.3% 63,151 13.7% (5.0%)
Exchange rate 1.3281 1.2848
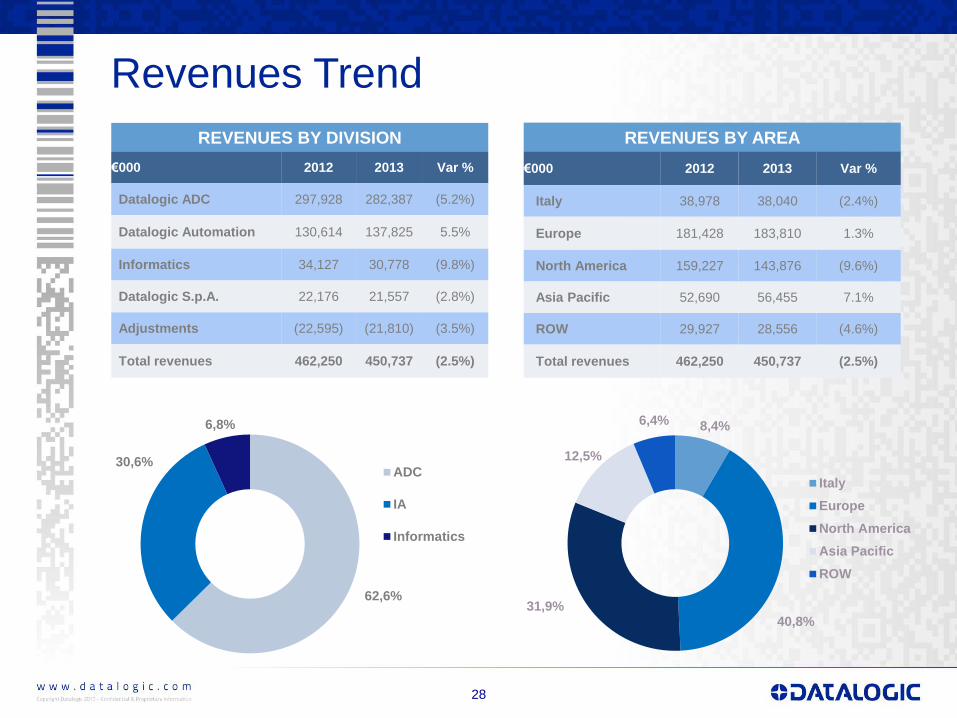
Revenues Trend
28
REVENUES BY AREA
€000 2012 2013 Var %
Italy 38,978 38,040 (2.4%)
Europe 181,428 183,810 1.3%
North America 159,227 143,876 (9.6%)
Asia Pacific 52,690 56,455 7.1%
ROW 29,927 28,556 (4.6%)
Total revenues 462,250 450,737 (2.5%)
REVENUES BY DIVISION
€000 2012 2013 Var %
Datalogic ADC 297,928 282,387 (5.2%)
Datalogic Automation 130,614 137,825 5.5%
Informatics 34,127 30,778 (9.8%)
Datalogic S.p.A. 22,176 21,557 (2.8%)
Adjustments (22,595) (21,810) (3.5%)
Total revenues 462,250 450,737 (2.5%)
62,6%
30,6%
6,8%
ADC
IA
Informatics
8,4%
40,8% 31,9%
12,5%
6,4%
Italy
Europe
North America
Asia Pacific
ROW

Segment Reporting: GOP and Ebitda
29
GROSS OPERATING MARGIN
GOP Margin 2012 2013
ADC 47.5% 49.1%
Industrial Automation 43.4% 43.7%
Informatics 43.1% 42.6%
Total Group 46.1% 47.1%
EBITDA Margin 2012 2013
ADC 15.5% 17.9%
Industrial Automation 5.7% 5.8%
Informatics 12.1% 8.3%
Total Group 13.7% 13.3%
EBITDA MARGIN
(€mln) (€mln)
46,3
7,4 4,1 5,5
63,2
50,4
8,0
2,5 -1,1
60,0
ADC IA Informatics DL SpA Total Group
2012 2013
141,5
56,7
14,7 22,2
212,9
138,7
60,2
13,1 21,6
212,3
ADC IA Informatics DL SpA Total Group
2012 2013

Segment Reporting: R&D and TWC
30
R&D COSTS TWC
(€mln) (€mln)
R&D/Revenues 2012 2013
ADC 6.2% 7.3%
Industrial Automation 9.0% 9.1%
Informatics 2.3% 2.8%
Business Development 10.1% 34.7%
Total Group 6.9% 7.9%
TWC/Annualized Revenues 2012 2013
ADC 11.6% 8.3%
Industrial Automation 10.8% 12.0%
Informatics 9.8% 7.4%
Total Group 13.1% 8.7%
34,7
14,1
3,3 6,9
60,6
23,4
16,5
2,3 0,5
39,0
ADC IA Informatics DL SpA Total Group
2012 2013
18,5
11,7
0,8 2,2
32,0
20,7
12,5
0,9
7,5
35,6
ADC IA Informatics BusinessDevelopment
Total Group
2012 2013

53,412 (12,293)
(1,032)
15,579 (445) (1,078) (870) (3,167)
Dec-12 Price Vol. Sales/Mix New Prod. Exch rate € vs $ Oper Exp Informatics Other Dec-13
EBITANR: Actual vs Last Year
31
50,106
Vol. sales/Mix -3,490
Service sales +2,458
Exch rate on sales -9,403
Exch rate on DCOGS +4,587
Exch rate on Op Exp +4,371
Other revenues - 4,920
Other variable costs -2,693
Direct Cogs +4,446
(*) Ordinary Operating Profit before non recurring costs/revenues and amortization of intangible assets from acquisition (EBITANR)
Note: The Exchange rate variance has been calculated on Sales/COGS/Operating expenses originally denominated in USD ($).
The variance was the result of the difference between December 2013 (1.3281) and December 2012 (1.2848) €/USD exchange rate.
(€/000)
- 2.7% on Revenues

Consolidated Balance Sheet
32
€000 At 31/12/2012 At 31/12/2013
Intangible fixed assets 60,262 59,058
Goodwill 151,134 145,092
Tangible fixed assets 51,621 51,328
Non Consolidated investments 3,936 5,452
Other fixed assets 46,602 39,441
Total Fixed Assets 313,555 300,371
Net trade account receivables 82,552 69,953
ST account payables (71,102) (84,712)
Inventory 49,153 53,803
Trade Working Capital 60,603 39,044
Other current receivables 25,577 26,483
Other ST payables and provision for risk & future charges (71,566) (48,838)
Net Working Capital 14,614 16,689
Other LT payables (22,513) (20,359)
Employees’ severance Indemnity (7,367) (7,049)
LT provision for risk & future charges (3,768) (7,398)
Net Invested Capital 294,521 282,254
Equity 173,403 185,247
Net Financial Position (121,118) (97,007)
Exchange rate 1.3194 1.3791

(121,118) 55,926
(17,132) 22,448
(8,525) 1,728
(9,431)
(20,903)
(97,007)
Net Debt Dec 12 Operating cashFlow
Capex Ch Trade NWC DividendPayment
Purchase of ownshares
Severance andM&A costs Cash
out
Other Net Debt Dec 13
Net Debt Analysis
33
Net Income +26,906
Deprec&Amort +15,644
Personnel & admin costs accrual +2,731
LTMIP Accrual +2,740
Tax Accrual +8,624
Other - 719
Acc. Receivable +12,084
Inventory -4,650
Acc. Payable +15,014
Tax Payment - 14,012
VAT -733
LT MIP -14,349
Other +8,191
(€/000)
Positive Cash flow Negative Cash flow
Contacts
34
IR CONTACTS
CFO and IR Manager
Marco Rondelli
E-mail [email protected]
IR Assistant
Daniela Giglioli
Tel. +39 051 3147109
Fax +39 051 3147205
E-mail [email protected]
Via Candini, 2
40012 Lippo di Calderara di Reno
Bologna – Italy
IR Consultant
Vincenza Colucci
CDR Communication Srl
Tel. +39 335 6909547
March 25-26th , 2014
STAR Conference Milan
April 23rd, 2014
Ordinary Shareholders’ Meeting
May 7th , 2014
Board of Directors to approve Q1 2014 results
www.datalogic.com
NEXT EVENTS
DATALOGIC ON LINE
Disclaimer
This document has been prepared by Datalogic S.p.A. (the "Company") for use during meetings with investors and financial
analysts and is solely for information purposes. The information set out herein has not been verified by an independent audit
company.
Neither the Company nor any of its subsidiaries, affiliates, branches, representative offices (the “Group”), as well as any of
their directors, officers, employees, advisers or agents (the “Group Representatives”) accepts any responsibility for/or makes
any representation or warranty, express or implied, as to the accuracy, timeliness or completeness of the information set out
herein or any other related information regarding the Group, whether written, oral or in visual or electronic form, transmitted or
made available.
This document may contain forward-looking statements about the Company and/or the Group based on current expectations
and opinions developed by the Company, as well as based on current plans, estimates, projections and projects of the Group.
These forward-looking statements are subject to significant risks and uncertainties (many of which are outside the control of
the Company and/or the Group) which could cause a material difference between forward-looking information and actual
future results.
The information set out in this document is provided as of the date indicated herein. Except as required by applicable laws
and regulations, the Company assumes no obligation to provide updates of any of the aforesaid forward-looking statements.
Under no circumstances shall the Group and/or any of the Group Representatives be held liable (for negligence or otherwise)
for any loss or damage howsoever arising from any use of this document or its contents or otherwise in connection with the
document or the aforesaid forward-looking statements.
This document does not constitute an offer to sell or a solicitation to buy or subscribe to Company shares and neither this
entire document or a portion of it may constitute a recommendation to effect any transaction or to conclude any legal act of
any kind whatsoever.
This document may not be reproduced or distributed, in whole or in part, by any person other than the Company.
By viewing and/or accepting a copy of this document, you agree to be bound by the foregoing limitations.
35