presentation to the financial community preliminary 2010
TRANSCRIPT

February 2011
Presentation to the Financial Community
Preliminary 2010 Consolidated Results

2
Forward-Looking Statements
By their nature, forward-looking statements are subject to risk and uncertainty since they are dependent on upon circumstances which should or are considered likely to occur in the future and are outside of the Company’s control. These include, but are not limited to: monetary exchange and interest rate fluctuations, commodity price volatility, credit and liquidity risks, HSE risks, the levels of capital expenditure in the oil and gas industry and other sectors, political instability in areas where the Group operates, actions by competitors, success of commercial transactions, risks associated with the execution of projects (including ongoing investment projects), in addition to changes in stakeholders’ expectations and other changes affecting business conditions.
Actual results could therefore differ materially from the forward-looking statements.
The Financial Reports contain in-depth analyses of some of the aforementioned risks.
Forward-looking statements are to be considered in the context of the date of their release. Saipem S.p.A. does not undertake to review, revise or correct forward-looking statements once they have been released, barring cases required by Law.
Forward-looking statements neither represent nor can be considered as estimates for legal, accounting, fiscal or investment purposes. Forward-looking statements are not intended to provide assurances and/or solicit investment.

3
Presentation Outline
FY 2010 Financial Results and Backlog Analysis
Offshore
Onshore
Offshore Drilling
2011 Guidance
Oil & Gas Industry Market Outlook
Saipem Perspectives
Beyond the Capex Plan
Saipem 2011 & Beyond

4
FY 2010 Financial Results and Backlog Analysis

5
FY 2010 Financial Results(Mln €)
All-time Records across the board Proposed dividend per share: € 0.63 (+14.5%) 5
OnshoreDrillingOffshore OffshoreOnshore
Revenues EBITDA EBIT Net Profit Adjusted
44864486
688688
52365236
1116011160
2010201020092009
732732828828
20102010200920092010201020092009 2010201020092009
750750
832832
402402
409409
18361836 % on Revenues
(18.5%)
(53.6%)
(28.1%)
(7.8%)
193193
613613
258258
370370
13191319
(13.7%)
% on Revenues
(34.4%)
(7.1%)
7878 (11.3%)
43414341
554554
48314831
1029210292
566566
810810
287287
338338
15961596 % on Revenues
(18.7%)
(50.7%)
(29.1%)
(7.0%)
161161
615615
192192
290290
11561156
(14.2%)
% on Revenues
(33.9%)
(6.0%)
5959 (10.6%)
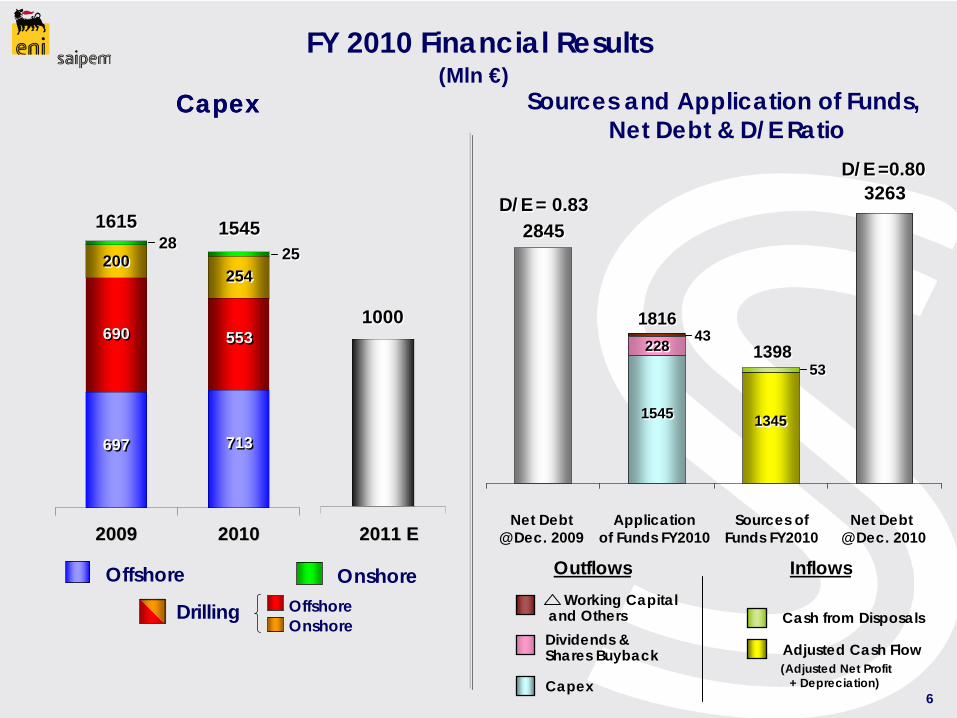
6
10001000
Capex(Mln €)
Capex
OnshoreOffshore
Drilling OffshoreOnshore
FY 2010 Financial Results
20102010 2011 E2011 E20092009
15451545
254254
713713
553553
2525
Outflows
Sources and Application of Funds,Net Debt & D/E Ratio
28452845
32633263
Net Debt @ Dec. 2010
D/E =0.80D/E =0.80
Sources of Funds FY2010
Application of Funds FY2010
Net Debt @ Dec. 2009
D/E = 0.83D/E = 0.83
Inflows
Dividends & Shares Buyback
Capex
Adjusted Cash Flow
15451545
18161816
13451345
(Adjusted Net Profit + Depreciation)
13981398
Working Capital and Others
228228
Cash from Disposals
5353
16151615
200200
697697
690690
2828
4343

7
FY 2010 Contract Acquisitions & Backlog (Mln €)
New Contract Acquisitions Backlog
OnshoreDrillingOffshore OffshoreOnshore
2010201020092009 Dec. 31, Dec. 31, ‘‘1010Dec. 31, Dec. 31, ‘‘0909
54305430
37783778
80358035
1873018730
14871487
99179917
50895089
36653665
578578585585
1293512935
46004600
77447744
265265326326
55445544
33543354
1054310543
2050520505
10641064
All-time Record Backlog (€ 20.5 Bln)7

8
7% 5%5%
64%
15% 4%
Algeria Angola Saudi Arabia Nigeria Kazakhstan Others
Backlog Analysis
Saipem Backlog € 20.5 Bln @ Dec, 31 2010
by Geo Area
by Client by Year of Execution
by Country – Local Content Focus
36%of present backlogin Countries where
Saipem has a strong Local Content Commitment
(*) Mainly-downstream, Smaller and Others
36%57%
4% 3%
Major & Supermajor National Independent Others*
27%
4%13% 5%
18%17%
16%
Middle East North Africa EuropeAmerica West Africa CISAsia Pacific
8
OnshoreOnshoreOffshoreOffshore DrillingOff.Off. On.On.
31563156 47574757704704412412
44%
29%13%
14% 2011201220132014+
2011 Backlog split by Business Unit

9
Oil & Gas Industry Market Outlook

10
0
200
400
600
800
1999
2000
2001
2002
2003
2004
2005
2006
2007
2008
2009
2010
E
2011
E
2012
E
Oil & Gas Industry Market Outlook
Oil & Gas Industry Market Outlook turning positive 10
‘E&C’ Capex
‘Exploration, appraisal & development of well’ Capex*
Oil&Gas Investments expected to return to record 2008 levels in 2012…Oil&Gas Investments expected to return to record 2008 levels in 2012…
Source: Deutsche Bank & Wood Mackenzie
Jan. 2011
Global Exploration and E&C Capex OutlookBln US$
Global E&C Capex Outlook
0
100
200
300
400
500
2008
2009
2010
E
2011
E
2012
E
Bln US$
Onshore
Offshore
-10% +4% +2% +3%
Source: Deutsche Bank & Wood Mackenzie
Jan. 2011
…with E&C Capex underpinning the recovery…with E&C Capex underpinning the recovery
(*) Excludes rig construction service Capex

11
Spending “hot themes”
0
100
200
2010E 2011E 2012E
+3% +13%Bln US$
OutlookOutlook
Saipem Perspectives- Offshore -
2011: first mild signals of a recovery expected to occur steadily in 2012
2011: first mild signals of a recovery expected to occur steadily in 2012
DW & Ultra-DW
DW & Ultra-DW
Extreme Pipelines
Extreme Pipelines
Frontier Developments
Frontier Developments
- Global Offshore E&C Spending Forecast -
- Global Offshore E&C Spending -
Saipem: resilient in tough timesSaipem: resilient in tough times
Bln US$
0
100
200
2008 2009 2010E
-7% -9%
Source: DB & Wood Mackenzie
Jan. 2011
Offshore – Resilient, Disciplined through Recession, Poised to exploit Market Recovery
New Assets already contributing to Backlog and Execution
New Assets already contributing to Backlog and Execution
Prepared for strong momentum in Deep/Ultra- deepwater Development and Extreme Pipelines Prepared for strong momentum in Deep/Ultra-
deepwater Development and Extreme Pipelines
11
CastorOneCastorOneWalker Ridge Export PipelineLocation: US GOM SoW: 220 Km Ø 24” oil pipeline
Usan Field DevelopmentLocation: NigeriaSoW: EPIC URF
FDS 2FDS 2
0
2
4
6
8
2008 2009 2010
- Saipem Offshore Backlog -Bln €
+16% +2%
Recent HistoryRecent History
Source: DB & Wood Mackenzie
Jan. 2011

12
OutlookOutlook
- Onshore -
Market expected to stabilize on peak level since 2010 recovery
Market expected to stabilize on peak level since 2010 recovery
- Global Onshore E&C Spending Forecast -
Gradual Revenue and Margin ImprovementGradual Revenue and Margin Improvement
E-P-C Model Continuous Improvement
Flexibility & Cost Effectiveness
Project-to-Project learning loops
Improve Efficiency – Reduce Risk
Saipem diversified business lines and presence in key onshore markets exploiting positive market across
Business Segments and Geographic Areas
Saipem diversified business lines and presence in key onshore markets exploiting positive market across
Business Segments and Geographic Areas
Saipem Perspectives
Recent HistoryRecent History
Backlog Quality & Quantity increased in complex marketBacklog Quality & Quantity increased in complex market
0
100
200
300
400
2008 2009 2010E
- Global Onshore E&C Spending -
0
5
10
15
2008 2009 2010
Bln US$-12% +11%
- Saipem Onshore Backlog -Bln €-13%
Bln US$
0
100
200
300
400
2010E 2011E 2012E
+2% -1%
Spending “hot themes”
Iraq
Iraq
NOCs
NOCs
LNG
LNG
Onshore – Exploiting Strong Market with Unique Industrial Model 12
+31%
Source: DB & Wood Mackenzie
Jan. 2011
Source: DB & Wood Mackenzie
Jan. 2011

13
Recent HistoryRecent History
Floaters >3000ft.Floaters >3000ft.
OutlookOutlook
Jackup*Jackup*Floaters <3000ft.Floaters <3000ft.Floaters >3000ft.Floaters >3000ft.
90
115
140
2010 2011E 2012E230
255
280
2010 2011E 2012E390
415
440
2010 2011E 2012E
Imminent Capacity availability to exploit Improving Dayrates
Benefiting from Long-Term Contracting Policy:Dayrates locked-in compare well with market trend
2011 = 100%2012 = 92%
2011 = 94%2012 = 67%
2011 = 67%2012 = 18%
Jackup*Jackup*Floaters <3000ft.Floaters <3000ft.
DayratesWorldwide
Market Forecast(Average)
DayratesWorldwide
Market Forecast(Average)
US$x1000/dd
Niche Fleet outperforms the marketNiche Fleet outperforms the market* All J-UP <400 ft, excluding Workover-only
- Offshore Drilling -Saipem Perspectives
US$x1000/ddUS$x1000/dd
6 Floaters >3000ft.
% of Saipem Capacity
Currently contracted
% of Saipem Capacity
Currently contracted
3 Floaters <3000ft. 6 Jackup*
Utilisation RateSaipem Fleet
VSWorldwide Fleet
Utilisation RateSaipem Fleet
VSWorldwide Fleet
80%
90%
100%
2008 2009 2010
70%
80%
90%
100%
2008 2009 2010Source: ODS Petrodata
Rigs under contract, marketed utilisation
Source: ODS Petrodata
80%
90%
100%
2008 2009 2010
* All J-UP <400 ft, excluding Workover-only

14
Beyond the Capex Plan

15
…maintaining Financial Discipline…maintaining Financial Discipline
12.0%14.2%
16.5%15.5%
1
1.5
2
2.5
2007 2008 2009 2010
0.5
0.75
1
2007 2008 2009 2010
6
8
10
12
2007 2008 2009 2010
- Revenues -Bln €
- Net Profit Adjusted -Bln €
+25% +1% +13%
+6% +2% +8%
Saipem 2007-2010: Growth - without stressing Balance Sheet
Capex Plan largely funded by solid cash flow generation
Net Debt @Dec, 31
2006
D/E = 0.90D/E = 0.90
Dividends Divestments
1,4171,417
3,2633,263
Net Debt @Dec, 31
2010
D/E =0.80D/E =0.80
Sources of Funds
Application of Funds
6,8486,848 5,0705,070841841
Capex Cash Flow
813813
DD&A
N.I.
Robust results based on Strong Industrial Model
Robust results based on Strong Industrial Model
Capex ~ € 8 Bln (including ’11E)
Capex ~ € 8 Bln (including ’11E)
...while funding a massive
Capex Plan…
15
Dec, 31 2006 – Dec, 31 2010: Net Debt increase < 2 Bln € Gearing still below parity
Dec, 31 2006 – Dec, 31 2010: Net Debt increase < 2 Bln € Gearing still below parity
- EBITDA -Bln €
EBITDA margin
+25%+11% +15%
Saipem recent Sound Growth…Saipem recent Sound Growth…
FPSO:Vitòria
Gimboa
Perro Negro 6 - 7 - 8
Caspian Fleet
TADTAD
In Service
To Be Delivered
CCastoro 7
LandLandRigs
Karimun YardKarimun Yard
CastorOneFDS 2
FPSO: Aquila 2
Scarabeo 9
Scarabeo 8
Saipem 12000
SS

16
Revenues: +5%
EBITDA: +10%
Capex: ~ € 1 Bln
Net Profit Adjusted: +5% (including the impact of additional ~ € 100 Mln depreciation
and increased financial charges)
2011 Guidance

17
2011 & Beyond2011 & Beyond
…Generating Resources for
Saipem 2011 & Beyond: poised for a further solid growth
• 2011 Capex Target : € 1 Bln
• From 2012 - Maintenance Capex to preserve quality: ~ € 400 Mln per year
• Enlarged Fleet, dominated by Powerful Distinctive Assets
• Sustained Cash Flow Generation further reinforced by…
New ‘Local Content’ Potential - examples: Brazil, Iraq
Potential New FPSO investment
Technology to tackle future ‘Frontiers’ - examples: Ultra-DW, Arctic
De-leveraging
• Encouraging Market Outlook
…17
Future Opportunities:

18
End of Presentation