subject: preliminary financial report june 30, 2013
TRANSCRIPT

October 17, 2013
Honorable Eric Garcetti, Mayor
Honorable Members of the Los Angeles City Council
SUBJECT: PRELIMINARY FINANCIAL REPORT – FISCAL YEAR-ENDED JUNE 30, 2013
I am submitting my Preliminary Financial Report on financial operations for the City of Los Angeles for the fiscal year-ended June 30, 2013. This
Preliminary Financial Report on financial operations for the City of Los
Angeles for fiscal year 2012-13 is the first year-end review of the City’s finances as the new fiscal year is underway. The Report provides an
informational “snapshot” of General Fund and budgeted Special Fund revenues and expenditures, reserves, and bonded indebtedness.
Also included are Guiding Principles for maintaining a healthy budget and a
recommendation to compel City departments to accelerate repayment of
Reserve Fund advances.
Later this year, the Office of the Controller will issue the City’s Comprehensive Annual Financial Report (CAFR) for fiscal year 2012-13 with
detailed views and analysis of the City’s financials. The CAFR will be prepared in conformity with Generally Accepted Accounting Principles (GAAP)
for governmental units and audited in accordance with Generally Accepted Government Auditing Standards (GAGAS) by a firm of licensed certified
public accountants.

Honorable Eric Garcetti, Mayor Honorable Members of the Los Angeles City Council October 17,2013 Page 2
My staff and I wish to express our appreciation to all City departments and offices for their help and cooperation in the preparation of this Report and in having effectuated a smooth fiscal year-end closing.
Should you have any questions, or require additional information, please contact Todd Bouey, Director of Financial Analysis and Reporting at (213) 978-7203 or todd. [email protected].
Sincerely,
RON GALPERIN Los Angeles City Controller
Attachment
cc: Gerry Miller, Chief Legislative Analyst Miguel Santana, City Administrative Officer

City of Los Angeles
Preliminary Financial Report
Fiscal Year ended June 30, 2013
www.controller.lacity.org

TABLE OF CONTENTS
Table of Contents
EXECUTIVE SUMMARY ....................................................................... i
FISCAL YEAR-END DISCUSSION ....................................................... 1
I. BUDGET OVERVIEW ...................................................................... 1
A. General Fund Revenues............................................................... 1
B. General Fund Expenditures & Appropriations .................................. 4
II. BONDED INDEBTEDNESS ............................................................... 6
III. GENERAL FUND RESERVES .......................................................... 7
A. Reserve Fund ............................................................................. 8
B. Budget Stabilization Fund .......................................................... 14
IV. IMPROVING THE CITY’S FISCAL HEALTH ..................................... 15
A. Guiding Principles ..................................................................... 15
B. Recommendation ..................................................................... 16
GLOSSARY OF KEY TERMS ............................................................. A-1
SCHEDULES ...................................................................................... B
Cash Condition – Statement of Receipts and Disbursements – All Funds B-1
Reserve Fund – Statement of Receipts and Disbursements .................. B-2
Schedule of Cash Balances by Fund Types ......................................... B-3
Statement of Receipts – Budget and Actual ....................................... B-6
Statement of Budget Appropriations, Expenditures and Encumbrances –
Budget and Actual ......................................................................... B-10
Schedule of Year-End Encumbrances – General Fund ......................... B-12
Schedule of Unencumbered Balances Reverted to the Reserve Fund .... B-13

Preliminary Financial Report Table of Contents
FY 2013 Year-End Uncommitted Balances and FY 2014 Adopted Budget
Reappropriations ........................................................................... B-14
Reserve Fund Cash Balances .......................................................... B-15
Year-End Advances from the Reserve Fund for Unfunded Expenditures and
Encumbrances .............................................................................. B-16
Revenue and Expenditure Trends .................................................... B-17
Statement of General Obligation Bonded Debt .................................. B-18
Ratio of Debt Service Requirements to General Fund Receipts ............ B-19
Computation of Legal Debt Margin .................................................. B-20

i
EXECUTIVE SUMMARY
EXECUTIVE SUMMARY
PREFACE
This Preliminary Financial Report on financial operations for the City of Los
Angeles for the fiscal year-ended June 30, 2013 provides the first year-end
review of the City’s finances as the new fiscal year is underway. The Report
provides an informational “snapshot” of General Fund and budgeted Special
Fund revenues and expenditures, reserves, and bonded indebtedness –
together with key financial schedules for the City’s financial closing of fiscal
year 2012-13 and for the fiscal year 2013-14 Adopted Budget.
This report, along with other key financial reports of the L.A. City Controller -
- including the Comprehensive Annual Financial Report (CAFR) and the
March 1 Revenue Estimate Report – is issued as part of the Controller’s City
Charter mandate to monitor and report on all matters relating to the City's
fiscal health, keep the City's official financial records, and supervise
expenditures of the City.
OVERVIEW
I. Budget Overview –
A. General Fund Revenues & Receipts
At fiscal year-end closing, actual General Fund revenues and receipts
in fiscal year 2012-13 totaled $4.67 billion, which is $116.7 million, or
2.6 percent greater than the fiscal year 2012-13 Adopted Budget. In
fiscal year 2012-13, the major revenue increases in excess of the
adopted budget were in Property Tax ($103.6 million), Documentary
Transfer Tax ($39.8 million), and Transient Occupancy Tax ($10.0
million). Although more than offset by these gains, selected
departmental receipts were lower than anticipated.

Preliminary Financial Report Executive Summary
ii
Based on the information available at the time, the Controller’s March
1, 2013 Revenue Report anticipated $4.67 billion in fiscal year 2013-
14 General Fund receipts. The fiscal year 2013-14 Adopted Budget
anticipates $4.87 billion in General Fund Revenues, representing $200
million, or 4.3 percent, growth over both fiscal year 2012-13 actual
receipts and the Controller’s March 1, 2013 Revenue Report. The fact
that actual receipts in the recently closed fiscal year somewhat
exceeded expectations is a promising sign – but should not be taken
as a given for this year.
In addition to the aforementioned General Fund receipts, the General
Fund also receives budgeted allocations from Special Funds. The
Special Fund allocation to the General Fund in the fiscal year 2013-14
Adopted Budget totals $922.7 million, a 6.0 percent increase over the
fiscal year 2012-13 Adopted Budget allocation of $869.8 million.
B. General Fund Expenditures & Appropriations –
General Fund expenditures, including allocations from other funds, in
fiscal year 2012-13 totaled nearly $5.18 billion, which is nearly $245
million, or 4.7 percent less than the fiscal year 2012-13 Adopted
Budget. However, the fiscal year 2013-14 Adopted Budget anticipates
spending $5.79 billion in General Fund appropriations. Overall, and
including Special Fund expenditures, the fiscal year 2013-14 City
Budget anticipates spending $7.69 billion, or 6.0 percent more than
the $7.25 billion Adopted Budget for fiscal year 2012-13. While various
expenditures and appropriations have been deferred in prior years –
impacting City services adversely – the City needs to be very
circumspect about growth in spending.
II. Bonded Indebtedness –
The City’s Debt Management Policy establishes guidelines of a non-
voter debt service cap as a percent of General Fund revenues of 6.0
percent and a total debt service cap as a percent of General Fund
revenues of 15.0 percent. The actual ratio of Debt Service to General
Preliminary Financial Report Executive Summary
iii
Fund Receipts was 9.42 percent in fiscal year 2010-11, 9.0 percent in
fiscal year 2011-12, and 8.55 percent in fiscal year 2012-13. Future
bond offerings would, of course, impact future bond indebtedness and
the service cap related thereto.
III. Reserves –
As of June 30, 2013, after closing the City’s General Ledger, the
recorded Reserve Fund balance was $352.3 million. This was $68.4
million more than the amount anticipated in the fiscal year 2013-14
Adopted Budget. Taking into account budgetary appropriations, and
return of advances and reappropriations, the resulting fiscal year-start
adjusted Reserve Fund balance is $326.7 million or 6.7 percent of
General Fund receipts anticipated in the fiscal year 2013-14 Adopted
Budget. This is 1.7 percent higher than the 5.0 percent set under the
Reserve Fund Policy. The Budget Stabilization Fund has also seen an
increase from an initial deposit of $500,000 to a balance of $61.5
million. The increase in the City’s reserves is a promising indicator –
but not one that should be taken as a license to spend any less
carefully. The 5.0 percent Reserve Fund Policy is a floor – and having
more is prudent.
IV. Improving the City’s Fiscal Health –
As the economy, and the City’s budget show modest signs of
improvement, challenges as well as opportunities create a path to
examine the City’s business practices and create efficiencies to
maximize the use of our limited resources. The Controller’s Guiding
Principles therefor are herein below. Note: A technical
recommendation from Council to departments for increasing the
Reserve Fund is identified on Page 16.

Preliminary Financial Report Executive Summary
iv
GUIDING PRINCIPLES
At this time, I propose ten guiding principles to maintain a healthy budget:
1. Implement a budget based on performance and measurable
results.
2. Focus on Return on Investment (ROI).
3. Reform City procurement.
4. Reduce liabilities with a comprehensive risk mitigation strategy.
5. Invest in technology.
6. Put the City’s vast assets and resources to work.
7. Improve accounting and accountability in Special Funds.
8. Explore savings in healthcare and pension costs.
9. Maximize current City revenues and collections.
10. Continue to build the City’s Reserves.
Focusing on maintaining a healthy reserve, reducing liabilities, investing
limited resources wisely, and improving service delivery without incurring
significant ongoing obligations is a recipe for financial success. The current
financial situation provides a unique opportunity for the City’s leaders and
stakeholders to work together and progress on these key strategies.
Released on the 17th of October, 2013.

1
FISCAL YEAR-END DISCUSSION
FISCAL YEAR-END DISCUSSION
I. BUDGET OVERVIEW
The Adopted Budget establishes the funding priorities of the Mayor and City
Council against anticipated revenues. The fiscal year 2012-13 Adopted
Budget of $7.25 billion (including General and Special Fund revenues)
increased by $440 million, or 6.0 percent, to $7.69 billion in the fiscal year
2013-14 Adopted Budget. This Preliminary Financial Report focuses on the
General Fund portion of the City budget, including allocations and receipts to
the General Fund and expenditures therefrom.
A. General Fund Revenues
The General Fund is the primary operating fund of the City. It is the fund
for the deposit of general receipts which are not restricted (though some
allocations from Special Funds to the General Fund are budgeted
according to specific purposes). General Fund revenues are derived from
such sources as taxes, licenses, permits, fees, fines, intergovernmental
revenues, charges for services, special assessments, interest income and
other resources. Chart I on the following page breaks out fiscal year
2012-13 actual General Fund revenues by percent.

Preliminary Financial Report Fiscal Year-End Discussion
2
The fiscal year 2012-13 actual General Fund revenues totaled $4.67
billion, which is $116.7 million or 2.6 percent greater than the fiscal year
2012-13 Adopted Budget. Based on the information provided by
departments as of January 31st, the Controller’s March 1, 2013 Revenue
Report anticipated $4.67 billion in fiscal year 2013-14 General Fund
receipts. The fiscal year 2013-14 Adopted Budget anticipates $4.87 billion
in General Fund revenues, which would be $200 million or 4.3 percent
growth over both fiscal year 2012-13 actual receipts and the Controller’s
March 1, 2013 Revenue Report. Chart II on the following page displays
General Fund adopted and actual revenues for fiscal years 2012-13 and
2013-14.
Other Income
3% Parking Users' Tax
2%
Parking Fines
3%
Documentary
Transfer Tax
3%
Transient
Occupancy Tax
4%
Power Revenue
Transfer
5% Sales Tax
7%
Business Tax
10% Utility Users Tax
13%
Licenses, Permits,
Fees
16%
Property Tax
34%
CHART I
% of FY 2012-13 Actual General Fund Revenues
Note: Excludes allocations from Special Funds

Preliminary Financial Report Fiscal Year-End Discussion
3
In fiscal year 2012-13, the major revenue increases in excess of the
adopted budget were in Property Tax ($103.6 million), Documentary
Transfer Tax ($39.8 million), and Transient Occupancy Tax ($10.0
million). Although more than offset by these gains, selected departmental
receipts were lower than anticipated. This growth had a significant impact
on the Reserve Fund balance as General Fund receipts for fiscal year
2012-13 were $116.7 million above the fiscal year 2012-13 Adopted
Budget, of which $81.0 million reverted to the Reserve Fund. It should
be noted that approximately $21 million in property tax revenue was
received earlier than expected and was anticipated in fiscal year 2013-14
receipts.
Another source of funds to the General Fund is allocations from Special
Funds. Special Funds are used to account for revenues derived from
specific taxes, fees, governmental grants, or other revenue sources that
are designated to finance particular functions and activities of the City.
On-budget and off-budget Special Funds are managed by respective City
departments. On-budget Special Fund allocations to the General Fund are
$4,300.0
$4,400.0
$4,500.0
$4,600.0
$4,700.0
$4,800.0
$4,900.0
$5,000.0
FY 12-13 Adopted FY 12-13 Actual FY 13-14 Adopted
$ M
illi
on
s
CHART II
General Fund Revenue by Fiscal Year
General Fund Revenue
Note: Excludes allocations from Special Funds

Preliminary Financial Report Fiscal Year-End Discussion
4
those discussed in this report. Off-budget funds are managed outside of
the budget process.
There are hundreds of Special Revenue Funds – with more than 50 such
Special Funds programmed in the City Budget. Therefrom, $869.8 million
was allocated to the General Fund in the fiscal year 2012-13 Adopted
Budget. The fiscal year 2013-14 Adopted Budget anticipates $922.7
million, a 6.0 percent increase over the fiscal year 2012-13 Adopted
Budget allocation of $869.8 million.
See Schedule B-6 for more information on City General Fund revenues.
B. General Fund Expenditures & Appropriations
The City tracks expenditures through both Government Activities and
budgetary account views to assist in identifying spending in terms of
priorities and cost centers.
Government Activities (as reflected in the Comprehensive Annual
Financial Report) reflect primary programmatic functions of the City
and expenditures are presented according to these major functions of
government. Chart III on the next page presents a breakdown of fiscal
year 2012-13 expenditures by Government Activity.

Preliminary Financial Report Fiscal Year-End Discussion
5
See Schedule B-17 “Expenditure Trends by Government Activity” for
further detail on expenditures by Government Activity.
Budgetary account appropriations and expenses are viewed at the line
item level and can be grouped by category for summary review and
analysis. Budgetary accounts overlap with Government Activities and
reflect the same financial information portrayed in different ways.
Table I on the following page breaks out summarized budgetary
accounts for fiscal years 2012-13 and 2013-14.
Protection of
Persons and
Property 29%
General
Government
24%
Health and
Sanitation
8%
Public Works
(Maintenance and
Improvements) 5%
Cultural and
Recreational
Services 5%
Transportation
4%
Community
Development
3%
Pension and
Retirement
System Contributions
15%
Bond Redemption
and Interest
6%
Capital Outlay
1%
CHART III
% FY 2012-13 Expenditures by Government Activity All Budgetary Funds

Preliminary Financial Report Fiscal Year-End Discussion
6
TABLE I
General Fund Expenditures and Appropriations
Including Allocations from Other Funds (In Millions)
Adopted
FY 12-13
Budget
Actual FY 12-13
Expenses
Adopted
FY 13-14
Budget
Salaries
Sworn Fire $ 461.8 $ 454.7 $ 490.5 Sworn Police 981.8 939.2 1,011.3
Civilian 1,375.1 1,326.2 1,404.8
Total Salaries 2,818.7 2,720.1 2,906.6
Medical Insurance Subsidy 381.7 376.2 396.4 Retirement Contribution
Fire and Police Pension Contribution 506.1 506.1 575.9
LACER Contribution 341.6 341.6 367.8
Total Retirement Contribution 847.7 847.7 943.7
Services, Supplies and Equipment 856.5 687.2 966.5
Lease Payment/Debt Service/TRAN Interest 223.9 214.7 268.5
Allocation to Other Funds 291.7 329.4 307.8
Total $ 5,420.2 $ 5,175.3 $ 5,789.5
*Note that departments controlling their own funds (Library and Recreation & Parks) are reflected
under Allocation to Other Funds and not included in other expenditure categories.
**Includes General Fund Appropriations and Expenditures funded by Special Fund allocations to the General Fund.
Whether viewed by Government Activity or budgetary appropriation account,
a substantial portion of the City’s General Fund expenditures goes toward
public safety activities and workforce costs.
II. BONDED INDEBTEDNESS
The City’s Debt Management Policy establishes guidelines for the structure
and management of the City’s debt obligations. These guidelines include
target and ceiling levels for certain debt ratios to be used for planning
purposes. The two most significant ratios are a non-voter debt service cap

Preliminary Financial Report Fiscal Year-End Discussion
7
as a percent of General Fund revenues of 6.0 percent and a total debt
service cap as a percent of General Fund revenues of 15.0 percent. Non-
voter debt service pertains to those obligations that do not require voter
approval, as opposed to those debts approved by the voters.
Chart IV illustrates the City’s compliance with these debt management
policies the past five years. See Schedules B-18, B-19 and B-20 for more
information on City debt.
III. GENERAL FUND RESERVES
The City has established two funds for preserving General Fund savings
above and beyond those amounts appropriated in the budget – the Reserve
Fund and the Budget Stabilization Fund. These funds are vital to the financial
health of the City.
4.17%
4.74% 4.80% 4.72% 4.51%
8.48%
9.06% 9.42% 9.00% 8.55%
0.0%
2.0%
4.0%
6.0%
8.0%
10.0%
12.0%
14.0%
16.0%
FY 08- 09 FY 09-10 FY 10-11 FY 11-12 FY 12-13
CHART IV
Ratio of Debt Service to General Fund Receipts
Non-Voter Approved Debt Cap Non-Voter Approved Debt
Total Debt Total Debt Cap

Preliminary Financial Report Fiscal Year-End Discussion
8
A. Reserve Fund
The Reserve Fund is essentially the undesignated fund balance of the
General Fund -- and is an important measure of the City’s fiscal health.
The Reserve Fund is vital to cash flow, bond ratings, and the ability to
manage unanticipated financial challenges. Failure to maintain the City’s
Reserve Fund at an adequate level not only can have negative financial
impacts (need and cost of borrowing; reduced interest earnings), but also
exposes the City to significant risk in the event of an emergency.
The City’s Reserve Fund Policy (CF 98-0459) sets a Reserve Fund cash
balance goal equal to 5.0 percent of budgeted General Fund receipts. On
March 8, 2011, voters amended Charter Section 302(b) to state,
The Reserve Fund shall include funding for unanticipated expenditures
and revenue shortfalls in the City’s General Fund. It shall include two
accounts within the fund, the Contingency Reserve Account and the
Emergency Reserve Account.
The Contingency Reserve is defined to include all monies in the
Reserve Fund over and above the amount required to be allocated to the
Emergency Reserve Account.
The Emergency Reserve is allocated at an amount that will bring the
balance in that account to not less than 2.75 percent of all General Fund
receipts anticipated for that fiscal year in the adopted budget.
Chart V on the following page displays the past six years of beginning
Reserve Fund balance compared to the 5.0 percent Reserve Fund policy.

Preliminary Financial Report Fiscal Year-End Discussion
9
As of June 30, 2013, after closing the City’s General Ledger, the recorded
Reserve Fund balance was $352.3 million. This was $68.4 million more
than the amount anticipated in the fiscal year 2013-14 Adopted Budget.
The fiscal year 2012-13 year-end Reserve Fund cash balance is not the
same as the fiscal year 2013-14 year-start cash balance because of
several technical factors required after the close of the prior fiscal year
and as further detailed in the following sections.
After the fiscal year 2012-13 accounting close, fiscal year 2013-14
budgetary appropriations, and return of advances and reappropriations,
the resulting fiscal year-start adjusted Reserve Fund balance is $326.7
million or 6.7 percent of General Fund receipts anticipated in the fiscal
year 2013-14 Adopted Budget. This is 1.7 percent higher than the 5.0
percent set under the Reserve Fund Policy. Table II on the following page
details the changes in Reserve Fund Cash Balance comparing Adopted
Budget versus actual.
3.65% 3.45% 3.92% 4.58% 5.12%
6.71%
0.0%
2.0%
4.0%
6.0%
8.0%
FY 08-09 FY 09-10 FY 10-11 FY 11-12 FY 12-13 FY 13-14
Fiscal Year
CHART V
Adjusted Beginning Reserve Fund Balance as % of General Fund
Reserve Fund Balance 5% Reserve Fund Policy

Preliminary Financial Report Fiscal Year-End Discussion
10
TABLE II
Reserve Fund Cash Balance
Adopted Budget Versus Actual (In Millions)
Adopted
FY 2014
Budget
Actual
Balance Difference
Contingency Reserve:
a. Balance Before Year-End Reversions/Borrowings $ 113.3 $ 147.4 $ 34.1 b. Reversion of Uncommitted Balances 74.7 95.6 20.9
c. Unallocated Revenue 88.8 81.0 (7.8) d. Transfer to Budget Stabilization Fund (69.0) (69.0) --
e. Advances Under CF# 12-0600-S178 -- (1.1) (1.1) f. Advances Under Charter Section 261(i) (49.0) (26.7) 22.3
Total Contingency Reserve, Year End 158.8 227.2 68.4
Emergency Reserve, Year End 125.1 125.1 --
Total Reserve Fund, Ending 6/30/13 $ 283.9 $ 352.3 $ 68.4
g. Return of Advances for Unfunded Encumbrances 18.0 7.8 (10.2) h. Reappropriations (40.7) (33.4) 7.3
Total Reserve Fund, Year Start Adjusted 7/1/13 $ 261.2 $ 326.7 $ 65.5
Emergency Reserve, Year Start Adjusted $ 133.8 $ 133.8 $ --
Contingency Reserve, Year Start Adjusted 127.4 192.9 65.5
Following are descriptions of the line item changes to the Reserve Fund
listed in Table II:
1) Reserve Fund Cash Balance (June 30, 2013)
The Reserve Fund cash balance is adjusted by the following factors to
arrive at the year-end balance:
a. Balance Before Year-End Reversions/Borrowings
This category represents the amount of cash available in the
Contingency Reserve after closing the general ledger and prior to
adjustments for year-end reversions, unallocated revenues, transfer to

Preliminary Financial Report Fiscal Year-End Discussion
11
Budget Stabilization fund and borrowings. It does not include cash in
the Emergency Reserve. The actual amount was $34.1 million more
than anticipated in the fiscal year 2013-14 Adopted Budget.
b. Reversion of Uncommitted Balances
This category refers to fiscal year 2012-13 General Fund
appropriations that reverted to the Reserve Fund at year-end because
portions of the appropriations were uncommitted (not encumbered nor
expended) at year-end. The Mayor and Council grant appropriation
authority to City departments each year. Those appropriations are
committed throughout the year in the form of encumbrances and
expenditures. The total appropriation authority minus encumbrances
and expenditures represents the uncommitted balance at year-end.
Uncommitted balances from General Fund appropriations revert to the
Reserve Fund at year-end. When the fiscal year 2013-14 budget was
adopted in June 2013, the City anticipated an uncommitted balance
reversion of $74.7 million. The year-end uncommitted balance was
$95.6 million. For a detailed breakdown of uncommitted balances and
reappropriations by department please see Schedule B-14.
The adopted budget provided that certain uncommitted balances
earmarked for specific functions be automatically reappropriated if not
expended in a given year. Of the total $95.6 million reverted to the
Reserve Fund, $33.4 million was reappropriated in the fiscal year
2013-14 Adopted Budget. However, the CIEP reappropriation amount
requires a separate Council action, so the actual reappropriation may
vary from the $16.4 million amount listed in Schedule B-14.
c. Unallocated Revenue (Excess Receipts)
Unallocated Revenue occurs when revenues exceed the total budget
appropriation. At fiscal year-end 2012-13, excess receipts of $81.0
million reverted to the Reserve Fund as unallocated revenue. The fiscal
year 2013-14 Adopted Budget anticipated $88.8 million in unallocated
revenue. Actual receipts were $7.8 million less than the budgeted
amount of unallocated revenue.

Preliminary Financial Report Fiscal Year-End Discussion
12
d. Transfer to Budget Stabilization Fund
Charter Section 302(c) provided that a Budget Stabilization Fund (BSF)
shall be established to receive money set aside during periods of
economic growth and revenue receipts exceeded projections to help
smooth out years when revenue is in decline. The fiscal year 2013-14
Adopted Budget authorized the $69 million transfer to BSF.
e. Advances Under CF 12-0600-S178
Council File 12-0600-S178 authorized the Controller to borrow from
the Reserve Fund at year-end to balance departmental budgets where
needed in order to expedite the closing of the City’s General Ledger.
This measure was taken so that the Controller could increase
appropriations within established limits without departments returning
to the Council to request the additional appropriations; a process that
would delay the closing of the City’s General Ledger. Under this
Council authority, the Controller transferred $1.1 million from the
Reserve Fund to balance departmental budgets at year-end closing.
Please note that these departments had greater total General Fund
year-end uncommitted balances than the borrowed amounts (see
Schedules B-14 and B-16).
f. Advances Under Charter Section 261(i) for Unfunded Encumbrances
and Expenditures
Under Charter Section 261(i), the Controller transfers funds from the
Reserve Fund as a loan to any fund that becomes depleted due to
tardy receipt of revenue. The fiscal year 2013-14 Adopted Budget
anticipated $49.0 million in year-end advances from the Reserve Fund.
The actual advances, in accordance with this Charter section, were
$26.7 million ($18.9 million for unfunded expenditures and $7.8
million for unfunded encumbrances, see Schedule B-16). The unfunded
expenditures generally occur due to: 1) an imbalance between the
timing of receipts in relation to expenditures, and/or; 2) billing delays.
Departments typically repay Reserve Fund advances as they are
reimbursed by their funding source, or request Mayor and Council
approval to write-off advances. The unfunded encumbered amounts

Preliminary Financial Report Fiscal Year-End Discussion
13
represent a technical adjustment at year-end, mainly for grant
contracts, and are reversed at the start of the new fiscal year.
2) Reserve Fund Cash Balance (2013-14 Year-Start)
The Reserve Fund year-end cash balance is adjusted by the following
factors to arrive at the year-start balance:
g. Return of Advances for Unfunded Encumbrances
Advances for unfunded encumbrances represent loans from the
Reserve Fund at year-end to fund encumbrances, mainly for grant
contracts, and are reversed at the start of the following fiscal year.
h. Reappropriations
Reappropriations represent the unencumbered balances of certain
funds and accounts reappropriated in accordance with the adopted
budget.
Please note that subsequent to the Reserve Fund adjustments included
in the adopted budget, the Council took actions (CF 12-0600-S179 and
13-0600-S134) that resulted in $4.6 million in additional year start
Reserve Fund adjustments. These additional reappropriations include:
$1.2 million for Council District Community Services;
$1.7 million for LINX Workers’ Compensation Claims Management
System replacement; and,
$0.5 million for third-party review of Fire resource deployment.
These actions are not reflected in the above Reserve Fund Cash
Balance table and reduced the Contingency Reserve to $188.3 million,
or $60.9 million above the fiscal year 2013-14 Adopted Budget
estimate.
While the above descriptions detail a number of direct impacts to the
Reserve Fund, it is ultimately a confluence of revenues, appropriations, and

Preliminary Financial Report Fiscal Year-End Discussion
14
expenditures as discussed within this report that set the table for the
available Reserve Fund balance.
B. Budget Stabilization Fund
As part of the fiscal year 2009-10 budget process, the Mayor and Council
established a Budget Stabilization Fund (BSF), with an initial deposit of
$500,000. The maintenance of this fund, separate and apart from the
Reserve Fund, was added to the City’s Charter in 2011. The purpose of
this fund was to set aside revenues during periods of robust economic
growth or when revenue projections are exceeded to help smooth out
years when revenue is stagnant or is in decline. The City adopted more
specific policies governing this fund in connection with the fiscal year
2013-14 Adopted Budget, and has increased the balance in the fund to a
year-start amount of $69.5 million. A subsequent transfer of $8.0 million
to the General Fund in the fiscal year 2013-14 Adopted Budget reduced
the total cash balance to $61.5 million.
TABLE III
Budget Stabilization Fund (In Millions)
FY 2012 Actual
FY 2013 Actual
FY 2014 Adopted
Cash Balance, July 1 $0.5 $0.5 $69.5
Reserve Fund -- 69.0 --
Total Receipts 0.5 69.5 69.5 Transfer to Budget -- -- 8.0
Cash Balance, June 30 $ 0.5 $ 69.5 $ 61.5
Based on the fiscal year 2013-14 Adopted Budget, the full appropriation
to the BSF under the policy would have been $115.0 million, or $53.5
million higher than the final adjusted amount.

Preliminary Financial Report Fiscal Year-End Discussion
15
IV. IMPROVING THE CITY’S FISCAL HEALTH
As the economy and the City’s budget show modest signs of improvement,
challenges as well as opportunities create a path to examine the City’s
business practices and create efficiencies to maximize the use of our limited
resources. At this time, I propose ten guiding principles to maintain a
healthy budget:
A. Guiding Principles
1. Implement a budget based on performance and measurable results.
This will ensure we maximize and prioritize our resources and
encourage innovation in City government.
2. Focus on Return on Investment (ROI). The City should examine each
of its services to make sure we are getting our money’s worth.
3. Reform City procurement. The City needs to reimagine the
procurement process not only for goods and supplies, but for
services and construction.
4. Reduce liabilities from banked overtime, lawsuits, workers’
compensation and other such costs with a comprehensive risk
reduction and mitigation strategy.
5. Invest in necessary technology replacements and improvements – to
save time and money. More data and information -- more easily
available and more transparent -- will also help the public and the
City’s own staff make better informed decisions.
6. Put the City’s vast assets and resources to work – utilizing best and
leading industry practices.
7. Improve accounting and accountability in Special Funds.

Preliminary Financial Report Fiscal Year-End Discussion
16
8. Explore savings in healthcare and pension costs by employing
economies of scale.
9. Maximize current City revenues by efficiently collecting amounts
due.
10. Continue to build the City’s Reserves. Consider additional transfers
to the Budget Stabilization Fund to achieve full compliance with the
City’s own recently adopted policies.
Focusing on maintaining a healthy reserve, reducing liabilities, investing
limited resources wisely, and improving service delivery without incurring
significant ongoing obligations is a recipe for financial success. The current
financial situation provides a unique opportunity for the City’s leaders and
stakeholders to work together and progress on these key strategies.
Following is a technical recommendation for departments to assist in
maintenance of the Reserve Fund.
B. Recommendation
In order to continue to improve the status of the Reserve Fund, it is
recommended that the Mayor and Council instruct departments to:
Accelerate repayment of Reserve Fund advances for unfunded expenditures
due to tardy receipt of revenue and/or delayed billings and to report upon
request of the City Administrative Officer and the Controller on the status of
these plans.

A-1
GLOSSARY OF KEY TERMS
GLOSSARY OF KEY TERMS
Adopted Budget is the Mayor and Council approved plan of financial
activity for a specified fiscal year indicating all planned revenues and
appropriations for the year.
Appropriation Authority is the legal authority to incur obligations and
expend up to a budgeted amount for a stated purpose. Total appropriation
authority includes the adopted budget and actions taken by Mayor and
Council during the year to amend the adopted budget.
Budget Stabilization Fund was created to prevent overspending during
prosperous years and provide resources to help maintain service levels
during years of slow revenue growth or declining revenue. Charter
Amendment P established the Budget Stabilization Fund in the City Treasury
and authorized the requirements for transfers or expenditures from the fund
as established by ordinance.
Capital Improvement Expenditure Program (CIEP) constitutes
expenditures for the acquisition, construction, expansion or rehabilitation of
the City’s physical plant (such as streets, sewers, and storm drains) and
facilities (such as fire stations, police stations, and libraries).
Comprehensive Annual Financial Report (CAFR) is published annually
by the City Controller on the City’s financial condition at the conclusion of
the fiscal year. The report is prepared to conform to Generally Accepted
Accounting Principles (GAAP) for governmental units and audited in
accordance with generally accepted auditing standards by a firm of licensed
certified public accountants.
Debt Policy is an adopted formal debt policy of the City establishing
guidelines for the structure and management of the City’s debt obligations.
These guidelines include both a target and ceiling for certain debt ratios to
be used for planning purposes.

Preliminary Financial Report Glossary of Key Terms
A-2
Department is a major administrative division of the City that indicates
overall management responsibility for an operation or group of related
operations within a functional area.
Encumbrance is an obligation or commitment to pay for a good or service.
An example of an encumbrance is ordering a car and setting aside funds to
pay for the car.
Expenditure is an actual payment. An example of an expenditure is writing
a check to pay for the car.
Fiscal Year (FY) is the time period for the City budget which begins on July
1 of a calendar year and ends on June 30 of the following year.
Fund is a fiscal entity with revenues and expenditures that are segregated
for carrying out a specific purpose or activity.
General Fund is for deposit of general receipts which are not restricted,
such as property, sales and business taxes and various fees.
Reserve Fund is the fund in which general unrestricted cash is set aside
outside the budget for unforeseen expenditures and emergencies.
Revenue is cash or credits the City receives during the fiscal year as income
to finance general or restricted operations. This includes items such as taxes,
fees from services, interest earnings, and grants.
Special Purpose Funds account for proceeds of specific revenue sources
that are legally restricted to expenditure for specified purposes.

B
SCHEDULES
SCHEDULES
(This Page is Intentionally Left Blank)

Preliminary Financial Report Schedules
B-1
Cash Balance, July 1, 2012 $ 7,733,579,823
Add - Outstanding Warrants, July 1, 2012 117,068,702
Cash in the Treasury, July 1, 2012 7,850,648,525
Add - Receipts during the year (1)
17,385,279,211
Total Available 25,235,927,736
Less - Disbursements during the Year (1)
16,683,025,886
Cash in the Treasury, June 30, 2013 8,552,901,850
Less - Outstanding Warrants, June 30, 2013 173,532,279
Cash Balance, June 30, 2013 (2)
$ 8,379,369,571
(1)
(2)
The City Charter provides that the cash in the Treasury "resides" in various Funds created
by the City Charter and legislative actions. Although the Treasury has a large cash balance
at June 30, 2013, that cash is not available to the General Fund (except for limited General
Fund balances) for general government activities of the City. The "Schedule of Cash
Balances by Fund Types" on Pages B-3 to B-5 provides additional information of the June
30 cash balances.
Cash ConditionStatement of Receipts and Disbursements - All Funds
For the Fiscal Year Ended June 30, 2013
Receipts exclude interfund operating transfers. Disbursements
include checks paid and wire transfers to depository banks by the
City Treasurer.
Excludes cash with fiscal agents, petty cash, other revolving funds,
and time deposits held for safekeeping by the City Treasurer
totalling $132,136,882.
Cash Condition – Statement of Receipts and Disbursements – All Funds

Preliminary Financial Report Schedules
B-2
Cash Balance Ending June 30, 2012 242,305,405$
Receipts:Return of Advances Under Charter Section 261(i) for:
Unfunded Expenditures 25,461,716$ Unfunded Encumbrances 19,262,989
Return of Loans from Other Funds 6,195,399 Transfer of Power Revenue Surplus 246,534,000 Transfer of Special Parking Revenue Surplus 49,086,000 Budget Allocation from General Fund 4,890,915 Early Reversion of Unencumbered Balance 13,299,482 Year-End Reversion of Unencumbered Balance 95,567,015 Unallocated Revenue 81,037,600 Miscellaneous 5,050,033 546,385,149
Total Available Cash 788,690,554
Disbursements:Transfer to General Fund of Power Revenue Surplus 246,534,000 Transfer to General Fund of Special Parking Revenue Surplus 32,577,000 Transfers to Budget Stabilization Fund 69,000,000 Transfers to Other Funds 20,669,425 Loans to Other Funds 6,444,215 Reappropriations of Prior Year Funds
for Capital Improvement Projects and Other Departmental Accounts 33,309,023
Advances Under Charter Section 261(i) for:Unfunded Expenditures 18,929,202 Unfunded Encumbrances 7,830,459
Advances for Unfunded Expenditures per CF#12-0600-S178 1,126,202 436,419,526
Cash Balance Ending June 30, 2013 352,271,028$
Note:
Reserve FundStatement of Receipts and DisbursementsFor the Fiscal Year Ended June 30, 2013
The Mayor and City Council adopted the Reserve Fund Policy (File 98-0459) on
August 4, 1998 to create two accounts in the Reserve Fund, the Contingency
Reserve and the Emergency Reserve. On March 8, 2011, Charter Amendment P
was approved prescribing the establishment and the method of accessing the
Contingency and Emergency Reserve accounts. As of June 30, 2013, the total
Contingency account is $227,132,028 and the Emergency account is
$125,139,000 for a total Reserve Fund of $352,271,028.
Reserve Fund – Statement of Receipts and Disbursements

Preliminary Financial Report Schedules
B-3
Governmental Funds:General Funds
General $304,762,071 Reserve 352,271,028Budget Stabilization 69,524,872Stores Revolving 15,524,281Other General Funds 19,404,683 761,486,935$
Special Revenue FundsRecreation and Parks 222,379,602Solid Waste Resources Revenue 198,568,988Proposition A Local Transit Assistance (PALTA) 177,093,851Transportation Grants 148,213,013MICLA Special Revenue Funds 76,852,373Measure R Local Return and Bus Operations Fund 78,441,942Solid Waste Resources Revenue Bond 2013A Acquisition 71,302,603Building and Safety Permit Enterprise 60,909,119Special Gas Tax Street Improvement 56,828,006Systematic Code Enforcement Fee Trust 40,043,698State AB 1290 35,900,264Subventions and Grants 34,227,955Citywide Recycling Trust 34,216,657Seismic Bond Reimbursement 30,883,096City of Los Angeles Affordable Housing Trust 28,828,327Telecommunication Liquidated Damage and Lost Franchise Fee 28,682,560Special Parking Revenue 28,589,883ARRA Transportaton Projects 27,874,701Municipal Sports Account 26,656,534Engineering Special Service 24,593,879Street Lighting Maintenance Assessment 22,602,738Recreation and Parks Golf 21,787,149Proposition C Anti-Gridlock Transit Improvement 18,200,042Potrero Canyon Trust 17,627,203Integrated Solid Waste Management Trust 16,575,912Coastal Transportation Corridor Trust 15,925,090U.S. Department of Justice Asset Forfeiture 15,269,604Construction Services Trust 12,077,078Disaster Assistance Trust 11,644,961Sunshine Canyon Community Amenities Trust 11,536,565Other Special Revenue Funds 389,834,412 1,984,167,805
Continued…
Schedule of Cash Balances by Fund TypesJune 30, 2013
Schedule of Cash Balances by Fund Types

Preliminary Financial Report Schedules
B-4
Debt Service FundsGeneral Obligation Bonds $170,042,420Other Debt Service Funds 5,737,337 175,779,757
Capital Projects FundsGOB Series 1989-A, 1990-B, 1992-A, 1993-A, 1994-A 1995-A, 1999-B, 2000-A, & 2001-A Library/Police/Fire/Public Works/Recreation & Parks/Zoo/Animal Shelter 21,925,583 GOB Series 2002-A Zoo/ Animal Shelter/Fire/Police 911 20,298,972GOB Series 2003-A Animal Shelter/Fire/Police 911 40,861,561GOB Series 2004-A Police 911 77,076,258 GOB Series 2005-A Storm Water/Fire 24,955,982GOB Series 2006-A Storm Water/Fire/Police 911/Animal Shelter 52,609,798GOB Series 2008-A Clean Water, and Storm Water Clean-up Projects 16,982,714GOB Series 2009-A Clean Water, and Storm Water Clean-up Projects 82,860,176GOB Series 2011-A Clean Water and Storm Water Clean-up Projects 135,299,543Recreation and Parks Grant 76,436,935Proposition K Projects and Bond Match 77,427,428Proposition K Maintenance and Administration 24,407,040Other Capital Projects Funds 27,973,758 679,115,748$
Proprietary Funds - EnterpriseAirport Revenue 710,772,498Harbor Revenue 102,291,430Power Revenue 723,569,153Water Revenue 438,596,999Passenger Facility Charge Fund - LAWA 774,045,743Passenger Facility Charge Fund - Ontario 33,096,590Airport Revenue Fund - Ontario 88,289,438Airport Insurance Trust Fund - LAWA 115,941,243China Shipping Mitigation 34,213,554Harbor Emergency 47,439,419Strategic Operating Fund 199,000,000Sewer Construction and Maintenance 102,855,652Sewer Operations and Maintenance 70,524,990Sewer Capital 10,213,667Los Angeles Convention Center 5,645,750Construction (Bond) Funds 609,239,393Bond Debt Service Funds 499,181,375Other Enterprise Funds 24,846,988 4,589,763,882
Continued…
Schedule of Cash Balances by Fund Types - (Continued)June 30, 2013

Preliminary Financial Report Schedules
B-5
Pension TrustCity Employees Retirement 901,173Fire and Police Pension 7,080,730Water and Power Employees' Retirement/Disability/Death Benefits 50,831,796Other Pension Trust Funds 514,317 59,328,016
Agency FundsBuilding and Safety Trust $ 23,005,347 General Demand 39,008,786General Payroll Reimbursement 8,081,640Department of Water and Power Payroll 5,330,284Department of Water and Power Disbursement 119,473,724Department of Water and Power Plan Benefit 1,787,992 Public Works Trust 42,768,688Parking Violation Trust 8,582,973Internal Revenue Code Section 501( c ) Employee Benefits Trust 26,835,171Other Agency Funds 28,385,102 303,259,707$
Total Cash Balance - All Fund Types (1)
8,552,901,850
Less - Outstanding Warrants:General Demands 39,008,730General Payroll and Reimbursement 7,818,410Department of Water and Power Payroll 5,330,284Department of Water and Power Disbursement 119,473,724Department of Water and Power Plan Benefit 1,787,992Fire and Police Pension Funds 113,139 173,532,279
Total Cash Balance in the Treasury, June 30, 2013 8,379,369,571$
(1)Excludes cash with fiscal agents, petty cash, other revolving funds, and time deposits held for
safekeeping by the City Treasurer totalling $132,136,882.
Schedule of Cash Balances by Fund Types - (Continued)June 30, 2013

Preliminary Financial Report Schedules
B-6
FY 2
01
3 V
ari
an
ceFY
20
13
Re
ceip
tsFY
20
13
FY 2
01
3FY
20
12
Wit
h B
ud
ge
tIn
cre
ase
Ori
gin
al
Bu
dg
et
Act
ua
l R
ece
ipts
Act
ua
l R
ece
ipts
Po
siti
ve (
Ne
ga
tive
)(D
ecr
ea
se)
Ge
ne
ral
Fun
d R
ece
ipts
:
Pr
oper
ty T
ax:
Pr
oper
ty T
ax 1
%
1,01
8,38
2,00
0$
1,10
9,28
6,55
1$
1,02
1,44
5,21
1$
90,9
04,5
51$
87
,841
,340
$
Pr
oper
ty T
ax -
Sal
es T
ax R
epla
cem
ent
120,
232,
000
116,
458,
165
100,
538,
201
(3,7
73,8
35)
15,9
19,9
64
Pr
oper
ty T
ax -
Veh
icle
Lic
ense
Fee
Rep
lace
men
t31
8,40
8,00
0
324,
643,
999
316,
856,
742
6,23
5,99
9
7,78
7,25
7
T
otal
Pro
pert
y Tax
1,45
7,02
2,00
0
1,55
0,38
8,71
5
1,43
8,84
0,15
4
93,3
66,7
15
111,
548,
561
P
rope
rty
Tax
- E
x-CRA
Tax
Inc
rem
ent
48,6
00,0
00
58,8
39,3
54
--
10,2
39,3
54
58,8
39,3
54
Util
ity U
sers
Tax
:
El
ectr
ic U
sers
Tax
313,
105,
000
320,
432,
183
303,
765,
053
7,32
7,18
3
16,6
67,1
30
Tel
epho
ne U
sers
Tax
236,
500,
000
233,
998,
314
242,
974,
285
(2,5
01,6
86)
(8,9
75,9
71)
G
as U
sers
Tax
73,0
00,0
00
66,0
17,2
86
68,2
94,9
87
(6,9
82,7
14)
(2,2
77,7
01)
T
otal
Util
ity U
sers
Tax
622,
605,
000
620,
447,
783
615,
034,
325
(2,1
57,2
17)
5,41
3,45
8
L
icen
ses,
Per
mits
, Fe
es a
nd F
ines
76
9,91
7,36
3
724,
702,
256
727,
537,
927
(45,
215,
107)
(2,8
35,6
71)
B
usin
ess
Tax
450,
026,
000
448,
832,
226
439,
802,
223
(1,1
93,7
74)
9,03
0,00
3
Sal
es T
ax33
2,93
9,00
0
338,
969,
528
323,
247,
176
6,03
0,52
8
15,7
22,3
52
Doc
umen
tary
Tra
nsfe
r Tax
107,
520,
000
147,
282,
030
103,
236,
898
39,7
62,0
30
44,0
45,1
32
Pow
er R
even
ue T
rans
fer
249,
100,
000
246,
534,
000
250,
077,
000
(2,5
66,0
00)
(3,5
43,0
00)
T
rans
ient
Occ
upan
cy T
ax15
7,80
8,00
0
167,
823,
830
151,
722,
170
10,0
15,8
30
16,1
01,6
60
Par
king
Fin
es
153,
437,
755
156,
877,
993
152,
844,
121
3,44
0,23
8
4,03
3,87
2
Par
king
Use
rs' T
ax91
,728
,000
89,4
22,8
31
86,4
49,9
01
(2,3
05,1
69)
2,97
2,93
0
Fra
nchi
se I
ncom
e47
,402
,000
42
,963
,207
44,2
08,5
81
(4,4
38,7
93)
(1,2
45,3
74)
S
tate
Mot
or V
ehic
le L
icen
se F
ees
--
2,09
9,05
8
10,5
78,1
73
2,09
9,05
8
(8,4
79,1
15)
G
rant
Rec
eipt
s8,
500,
000
7,23
1,78
5
5,26
6,96
3
(1,2
68,2
15)
1,96
4,82
2
Tob
acco
Set
tlem
ent
8,70
0,00
0
13,8
60,8
56
9,19
6,89
1
5,16
0,85
6
4,66
3,96
5
Tra
nsfe
r Fr
om T
elec
omm
unic
atio
ns D
evel
opm
ent A
ccou
nt--
--
4,91
5,05
6
--
(4,9
15,0
56)
R
esid
entia
l Dev
elop
men
t Tax
2,10
0,00
0
2,37
9,23
3
2,26
3,50
1
279,
233
115,
732
S
peci
al P
arki
ng R
even
ue T
rans
fer
32,5
77,0
00
32,5
77,0
00
--
--
32,5
77,0
00
Int
eres
t10
,510
,000
16,0
01,1
96
15,0
84,0
26
5,49
1,19
6
917,
170
T
rans
fer
from
Res
erve
Fun
d--
--
8,93
9,16
4
--
(8,9
39,1
64)
T
otal
Gen
eral
Fun
d Rec
eipt
s4,
550,
492,
118
4,66
7,23
2,88
1
4,38
9,24
4,25
0
116,
740,
763
277,
988,
631
Con
tinued…
Sta
tem
en
t o
f R
ece
ipts
- B
ud
ge
t a
nd
Act
ua
l(C
ash
Ba
sis)
All
An
nu
all
y B
ud
ge
ted
Fu
nd
sFi
sca
l Y
ea
rs E
nd
ed
Ju
ne
30
, 2
01
3 a
nd
20
12
Statement of Receipts – Budget and Actual

Preliminary Financial Report Schedules
B-7
FY 2
01
3 V
ari
an
ceFY
20
13
Re
ceip
tsFY
20
13
FY 2
01
3FY
20
12
Wit
h B
ud
ge
tIn
cre
ase
Ori
gin
al
Bu
dg
et
Act
ua
l R
ece
ipts
Act
ua
l R
ece
ipts
Po
siti
ve (
Ne
ga
tive
)(D
ecr
ea
se)
Sp
eci
al
Fun
d R
ece
ipts
:
A
ffor
dabl
e H
ousi
ng T
rust
Fun
d84
8,00
0$
32,7
58,2
81$
32
,804
,706
$
31
,910
,281
$
(4
6,42
5)$
A
rts
& C
ultu
ral F
acili
ties
& S
ervi
ces
Tru
st F
und
12,2
67,2
64
12,3
60,3
09
10,6
63,8
79
93,0
45
1,69
6,43
0
Art
s D
evel
opm
ent Fe
e Tru
st F
und
990,
000
1,74
2,20
9
5,22
0,46
6
752,
209
(3,4
78,2
57)
B
uild
ing
& S
afet
y Pe
rmit
Ente
rprise
Fun
d
108,
816,
521
124,
144,
486
107,
270,
105
15,3
27,9
65
16,8
74,3
81
Cen
tral
Rec
yclin
g an
d Tra
nsfe
r Fu
nd2,
931,
476
2,83
1,09
7
3,19
1,36
7
(100
,379
)
(360
,270
)
City
Em
ploy
ees' R
etirem
ent Fu
nd (1
)77
,618
,048
74,7
19,4
63
75,9
78,8
43
(2,8
98,5
85)
(1,2
59,3
80)
C
ity E
mpl
oyee
s Rid
esha
ring
Fun
d3,
347,
339
3,15
0,74
4
2,92
3,52
6
(196
,595
)
227,
218
C
ity E
thic
s Com
mis
sion
Fun
d1,
848,
864
1,84
8,86
4
1,86
6,47
9
--
(17,
615)
C
ity T
ax L
evy
(Deb
t Se
rvic
e)16
4,47
5,92
1
173,
423,
374
170,
419,
602
8,94
7,45
3
3,00
3,77
2
City
wid
e Rec
yclin
g Tru
st F
und
21,7
72,5
95
21,7
88,8
83
21,6
97,1
12
16,2
88
91,7
71
Cod
e En
forc
emen
t Tru
st F
und
41,5
50,0
00
42,6
73,6
15
42,1
12,3
45
1,12
3,61
5
561,
270
C
omm
unity
Dev
elop
men
t Tru
st F
und
27,3
63,3
66
29,9
30,2
84
37,1
36,3
91
2,56
6,91
8
(7,2
06,1
07)
C
omm
unity
Ser
vice
s A
dmin
istr
atio
n G
rant
2,25
9,22
4
2,30
3,75
5
2,18
0,44
4
44,5
31
123,
311
C
onve
ntio
n Cen
ter
Rev
enue
Fun
d27
,201
,620
27,1
57,8
33
27,3
14,7
02
(43,
787)
(156
,869
)
Dis
aste
r A
ssis
tanc
e Tru
st F
und
21,4
75,0
00
12,9
98,9
07
2,58
1,13
8
(8,4
76,0
93)
10,4
17,7
69
El P
uebl
o de
Los
Ang
eles
His
torica
l Mon
umen
t Fu
nd
4,83
1,96
0
4,60
2,86
5
4,59
0,91
4
(229
,095
)
11,9
51
Gre
ater
Los
Ang
eles
Vis
itors
& C
onve
ntio
n Bu
reau
Fun
d12
,139
,000
12,9
10,4
32
11,6
73,1
38
771,
432
1,23
7,29
4
HO
ME
Inve
stm
ent Pa
rtne
rshi
ps P
rogr
am F
und
6,02
8,32
2
5,58
2,01
7
4,99
5,06
2
(446
,305
)
586,
955
H
ouse
hold
Haz
ardo
us W
aste
Fun
d3,
226,
800
3,50
4,35
7
2,84
2,21
0
277,
557
662,
147
H
ousi
ng O
ppor
tuni
ties
for
Pers
ons
with
AID
S Fu
nd45
9,15
8
384,
158
314,
683
(75,
000)
69,4
75
Lan
dfill
Mai
nten
ance
Fun
d5,
240,
480
4,64
5,35
2
6,14
7,16
8
(595
,128
)
(1,5
01,8
16)
L
ocal
Pub
lic S
afet
y Fu
nd35
,500
,000
37,1
68,9
24
34,4
33,0
27
1,66
8,92
4
2,73
5,89
7
Loc
al T
rans
port
atio
n Fu
nd2,
723,
776
2,71
7,56
9
2,85
6,10
6
(6,2
07)
(138
,537
)
Mea
sure
R T
raffic
Rel
ief an
d Rai
l Exp
ansi
on F
und
66,1
89,8
42
61,9
12,6
20
38,1
85,8
62
(4,2
77,2
22)
23,7
26,7
58
Mob
ile S
ourc
e A
ir P
ollu
tion
Red
uctio
n Tru
st F
und
4,71
3,74
0
4,63
3,96
5
4,66
6,11
1
(79,
775)
(32,
146)
M
ulti-
Fam
ily B
ulky
Ite
m F
und
6,52
1,33
9
7,21
0,35
7
7,11
4,31
4
689,
018
96,0
43
Mun
icip
al H
ousi
ng F
inan
ce F
und
1,27
6,50
0
2,04
4,46
0
1,51
2,47
8
767,
960
531,
982
N
eigh
borh
ood
Empo
wer
men
t Fu
nd5,
950,
166
6,11
5,26
5
4,55
5,13
0
165,
099
1,56
0,13
5
Old
er A
mer
ican
s A
ct F
und
2,62
3,20
7
1,97
1,97
8
1,98
2,38
8
(651
,229
)
(10,
410)
P
ark
& R
ecre
atio
nal S
ites
& F
acili
ties
Fund
1,20
0,00
0
1,56
4,00
0
1,31
1,20
2
364,
000
252,
798
P
lann
ing
Cas
e Pr
oces
sing
Rev
enue
Fun
d15
,400
,000
18,4
34,3
67
16,0
04,9
46
3,03
4,36
7
2,42
9,42
1
Pro
posi
tion
A L
ocal
Tra
nsit
Ass
ista
nce
Fund
121,
437,
378
132,
716,
846
151,
939,
363
11,2
79,4
68
(19,
222,
517)
Con
tinued…
Sta
tem
en
t o
f R
ece
ipts
- B
ud
ge
t a
nd
Act
ua
l(C
ash
Ba
sis)
All
An
nu
all
y B
ud
ge
ted
Fu
nd
sFi
sca
l Y
ea
rs E
nd
ed
Ju
ne
30
, 2
01
3 a
nd
20
12

Preliminary Financial Report Schedules
B-8
FY 2
01
3 V
ari
an
ceFY
20
13
Re
ceip
tsFY
20
13
FY 2
01
3FY
20
12
Wit
h B
ud
ge
tIn
cre
ase
Ori
gin
al
Bu
dg
et
Act
ua
l R
ece
ipts
Act
ua
l R
ece
ipts
Po
siti
ve (
Ne
ga
tive
)(D
ecr
ea
se)
Sp
eci
al
Fun
d R
ece
ipts
: (C
on
tin
ue
d)
P
ropo
sitio
n C A
nti-G
ridl
ock
Tra
nsit
Im
prov
emen
t Fu
nd92
,318
,089
$
63
,900
,491
$
58
,461
,143
$
(2
8,41
7,59
8)$
5,43
9,34
8$
R
ent St
abili
zatio
n Tru
st F
und
14,4
00,0
00
14,2
91,8
86
14,2
48,6
35
(108
,114
)
43,2
51
Sew
er C
onst
ruct
ion
& M
aint
enan
ce F
und
692,
749,
362
762,
428,
597
526,
839,
196
69,6
79,2
35
235,
589,
401
S
olid
Was
te R
esou
rces
Rev
enue
Fun
d29
3,78
8,66
5
313,
434,
338
317,
836,
190
19,6
45,6
73
(4,4
01,8
52)
S
peci
al G
as T
ax S
tree
t Im
prov
emen
t Fu
nd:
Stat
e G
as T
ax -
Sec
tion
2103
45,6
00,0
00
35,6
11,0
70
54,5
53,8
97
(9,9
88,9
30)
(18,
942,
827)
Stat
e G
as T
ax -
Sec
tion
2105
18,4
30,0
00
18,0
03,4
71
18,8
25,2
74
(426
,529
)
(821
,803
)St
ate
Gas
Tax
- S
ectio
n 21
0611
,685
,000
12,5
03,3
21
11,9
86,7
85
818,
321
516,
536
Stat
e G
as T
ax -
Sec
tion
2107
26,7
90,0
00
28,5
72,9
35
27,8
19,0
54
1,78
2,93
5
753,
881
Surf
ace
Tra
nspo
rtat
ion
Prog
ram
9,00
0,00
015
,611
,815
3,93
2,54
56,
611,
815
11,6
79,2
70In
tere
st o
n G
as T
ax F
unds
250,
000
941,
362
716,
576
691,
362
224,
786
Oth
er R
ecei
pts
30,0
00
297,
029
2,52
9,58
9
267,
029
(2,2
32,5
60)
S
peci
al P
arki
ng R
even
ue F
und
35,0
77,6
27
37,7
19,4
19
66,7
69,3
38
2,64
1,79
2
(29,
049,
919)
S
peci
al P
olic
e/91
1 Sy
stem
Tax
Fun
d2,
727,
272
4,63
4,68
2
21,0
39,2
43
1,90
7,41
0
(16,
404,
561)
S
tapl
es A
rena
Spe
cial
Fun
d4,
035,
000
7,70
9,57
6
4,65
2,83
7
3,67
4,57
6
3,05
6,73
9
Sto
rmw
ater
Pol
lutio
n A
bate
men
t Fu
nd30
,242
,663
33,3
72,4
68
29,4
65,1
43
3,12
9,80
5
3,90
7,32
5
Str
eet D
amag
e Res
tora
tion
Fee
Fund
5,33
6,00
0
6,11
9,07
0
5,43
7,63
3
783,
070
681,
437
S
tree
t Li
ghtin
g M
aint
enan
ce A
sses
smen
t Fu
nd61
,614
,138
65,8
64,6
84
64,6
86,6
14
4,25
0,54
6
1,17
8,07
0
Sup
plem
enta
l Law
Enf
orce
men
t Se
rvic
es F
und
1,50
0,00
0
5,21
9,62
0
5,02
8,40
2
3,71
9,62
0
191,
218
T
elec
omm
unic
atio
ns L
iqui
date
d D
amag
es
an
d Lo
st F
ranc
hise
Fee
s Fu
nd18
,339
,000
19,0
10,9
31
13,3
36,3
54
671,
931
5,67
4,57
7
Tra
ffic
Saf
ety
Fund
11
,000
,000
8,83
5,98
4
10,2
50,5
22
(2,1
64,0
16)
(1,4
14,5
38)
W
orkf
orce
Inv
estm
ent A
ct F
und
19,2
86,9
55
15,0
30,0
34
14,8
01,2
41
(4,2
56,9
21)
228,
793
Z
oo E
nter
pris
e Tru
st F
und
15,8
45,1
01
17,0
89,0
52
19,1
39,4
95
1,24
3,95
1
(2,0
50,4
43)
Allo
catio
ns fro
m O
ther
Sou
rces
:A
RRA
- W
orkf
orce
Inv
estm
ent
--
--
105,
901
--
(105
,901
)
A
RRA
- C
omm
unity
Dev
elop
men
t Bl
ock
Gra
nt94
,087
175,
777
--
81,6
90
175,
777
ARRA
- C
OPS
Hirin
g Rec
over
y Pr
ogra
m--
--
3,00
0,00
0
--
(3,0
00,0
00)
ARRA
- E
nerg
y Ef
ficie
ncy
Con
serv
atio
n26
,345
765,
893
--
739,
548
765,
893
ARRA
- N
eigh
borh
ood
Stab
iliza
tion
1,90
1,74
2
2,61
9,36
1
2,77
1,40
5
717,
619
(152
,044
)
Bus
Benc
h A
dver
tisin
g Tru
st F
und
164,
118
164,
118
147,
836
--
16,2
82
Busi
ness
Im
prov
emen
t D
istr
ict Tru
st F
und
430,
123
490,
123
559,
393
60,0
00
(69,
270)
Con
tinued…
Sta
tem
en
t o
f R
ece
ipts
- B
ud
ge
t a
nd
Act
ua
l
(Ca
sh B
asi
s)
All
An
nu
all
y B
ud
ge
ted
Fu
nd
s
Fisc
al
Ye
ars
En
de
d J
un
e 3
0,
20
13
an
d 2
01
2

Preliminary Financial Report Schedules
B-9
FY 2
01
3 V
ari
an
ceFY
20
13
Re
ceip
tsFY
20
13
FY 2
01
3FY
20
12
Wit
h B
ud
ge
tIn
cre
ase
Ori
gin
al
Bu
dg
et
Act
ua
l R
ece
ipts
Act
ua
l R
ece
ipts
Po
siti
ve (
Ne
ga
tive
)(D
ecr
ea
se)
Sp
eci
al
Fun
d R
ece
ipts
: (C
on
tin
ue
d)
City
Attor
ney
Con
sum
er P
rote
ctio
n Fu
nd4,
000,
000
$
3,51
4,59
8$
1,86
9,00
0$
(485
,402
)$
1,64
5,59
8$
City
Pla
nnin
g Lo
ng R
ange
Pla
nnin
g Fu
nd3,
015,
009
2,33
8,32
7
1,81
5,18
2
(676
,682
)
523,
145
City
Pla
nnin
g Sy
stem
s D
evel
opm
ent Fu
nd5,
091,
460
4,57
5,35
4
3,79
3,33
2
(516
,106
)
782,
022
Coa
stal
Tra
nspo
rtat
ion
Cor
rido
r Tru
st F
und
363,
008
313,
319
431,
525
(49,
689)
(118
,206
)
Cou
ncil
Dis
tric
t 15
Rea
l Pro
pert
y Tru
st F
und
--
--
129,
500
--
(129
,500
)
Ente
rprise
Zon
e Tax
Cre
dit
368,
893
568,
596
--
199,
703
568,
596
Fede
ral E
mer
genc
y Sh
elte
r G
rant
167,
768
175,
852
59,7
12
8,08
4
116,
140
Fire
Hyd
rant
Ins
talla
tion
and
Rep
lace
men
t Fu
nd86
1,26
4
861,
264
861,
264
--
--
Forf
eite
d A
sset
s Tru
st F
und
of P
olic
e D
ept
--
6,60
5,36
0
6,56
8,45
7
6,60
5,36
0
36,9
03
Gen
eral
Ser
vice
s Tru
st35
9,78
6
397,
613
178,
981
37,8
27
218,
632
Indu
strial
Dev
elop
men
t A
utho
rity
Fun
d36
,123
15,5
02
--
(20,
621)
15,5
02
Inte
grat
ed S
olid
Was
te M
anag
emen
t Fu
nd30
0,00
0
348,
000
509,
310
48,0
00
(161
,310
)
Los
Ang
eles
Reg
iona
l Age
ncy
Tru
st F
und
91,9
62
94,3
25
83,3
39
2,36
3
10,9
86
Lope
z Can
yon
Com
mun
ity A
men
ities
Tru
st F
und
200,
000
50,0
00
200,
000
(150
,000
)
(150
,000
)
Nei
ghbo
rhoo
d St
abili
zatio
n Fu
nd58
,106
484,
096
339,
205
425,
990
144,
891
Off-S
ite S
ign
Period
ic I
nspe
ctio
n Fe
e Fu
nd43
7,22
4
278,
022
123,
463
(159
,202
)
154,
559
Perm
it Pa
rkin
g Pr
ogra
m R
even
ue F
und
1,19
3,23
1
962,
086
966,
598
(231
,145
)
(4,5
12)
Pers
hing
Squ
are
Tru
st F
und
570,
257
548,
881
574,
706
(21,
376)
(25,
825)
Prop
1B
Infr
astr
uctu
re F
und
42,4
38,7
43
42,9
81,5
70
43,5
47,4
24
542,
827
(565
,854
)
Rep
air
and
Dem
oliti
on30
0,00
0
520,
000
439,
000
220,
000
81,0
00
Sect
ion
108
Loan
Gua
rant
ee F
und
341,
670
458,
309
--
116,
639
458,
309
Stat
e A
B 12
90 C
ity F
und
25,0
00
3,30
9,24
6
2,84
9,11
4
3,28
4,24
6
460,
132
Stre
et B
anne
rs T
rust
Fun
d91
,380
498,
229
--
406,
849
498,
229
Suns
hine
Can
yon
Com
mun
ity A
men
ities
Tru
st F
und
21,0
00
49,5
66
--
28,5
66
49,5
66
Use
d O
il Col
lect
ion
Fund
550,
209
502,
609
417,
689
(47,
600)
84,9
20
Ven
tura
/Cah
ueng
a Bl
vd C
orrido
r Pl
an
812,
909
233,
651
193,
072
(579
,258
)
40,5
79
War
ner
Cen
ter
Tra
nspo
rtat
ion
Tru
st F
und
131,
054
98,0
01
102,
041
(33,
053)
(4,0
40)
Wes
t LA
Tra
nspo
rtat
ion
Impr
ovem
ent &
Miti
gatio
n12
7,78
9
96,2
03
299,
415
(31,
586)
(203
,212
)
Tot
al S
peci
al F
und
Rec
eipt
s2,
284,
842,
038
2,43
3,24
7,32
2
2,20
3,77
6,77
7
148,
405,
284
229,
470,
545
Ava
ilabl
e Ba
lanc
es41
0,78
2,49
5
436,
785,
042
404,
645,
779
26,0
02,5
47
32,1
39,2
63
To
tal
Re
ceip
ts7,
246,
116,
651
$ 7,
537,
265,
245
$ 6,
997,
666,
806
$ 29
1,14
8,59
4$
539,
598,
439
$
(1) R
etirem
ent co
ntribu
tions
fro
m H
arbo
r an
d A
irpo
rt d
epar
tmen
ts.
Sta
tem
en
t o
f R
ece
ipts
- B
ud
ge
t a
nd
Act
ua
l
(Ca
sh B
asi
s)
All
An
nu
all
y B
ud
ge
ted
Fu
nd
s
Fisc
al
Ye
ars
En
de
d J
un
e 3
0,
20
13
an
d 2
01
2

Preliminary Financial Report Schedules
B-10
FY
20
13
Va
ria
nce
FY 2
01
3
Ori
gin
al
Fin
al
Ex
pe
nd
itu
res
&E
xp
en
dit
ure
s &
Wit
h F
ina
l B
ud
ge
tE
xp
en
dit
ure
s &
B
ud
ge
tB
ud
ge
tE
ncu
mb
ran
ces
En
cum
bra
nce
sP
osi
tive
En
cum
bra
nce
sFY
20
13
FY 2
01
3FY
20
13
FY 2
01
2 (
Ne
ga
tive
)In
cre
ase
(D
ecr
ea
se)
Agi
ng
4,00
2,78
5$
4,32
8,55
0$
3,40
4,60
5$
3,
485,
770
$
92
3,94
5$
(81,
165)
$
Ani
mal
Ser
vice
s20
,170
,629
20,2
74,2
61
19,9
89,0
64
20,1
41,0
66
285,
197
(1
52,0
02)
Build
ing
& S
afet
y71
,746
,337
76,1
58,5
79
70,9
54,0
40
70,5
43,1
31
5,20
4,53
9
410,
909
City
Adm
inis
trat
ive
Offic
er13
,330
,777
14,8
00,6
09
12,9
50,7
28
12,7
91,7
68
1,84
9,88
1
158,
960
City
Attor
ney
98,5
24,6
51
109,
238,
397
108,
652,
876
102,
436,
071
58
5,52
1
6,
216,
805
City
Cle
rk25
,536
,188
25,1
64,5
92
23,5
00,6
63
11,1
01,6
29
1,66
3,92
9
12,3
99,0
34
City
Eth
ics
Com
mis
sion
2,26
9,50
1
2,
269,
501
2,03
8,17
5
1,82
3,89
0
231,
326
21
4,28
5
Com
mun
ity D
evel
opm
ent
26,1
39,0
63
28,1
14,9
49
26,2
05,6
63
28,7
18,1
31
1,90
9,28
6
(2,5
12,4
68)
Con
trol
ler
16,3
68,9
27
17,1
67,9
16
15,9
54,7
63
16,0
73,8
89
1,21
3,15
3
(119
,126
)
Cou
ncil
17,9
80,5
43
35,7
59,9
65
28,1
39,4
52
26,9
77,8
75
7,62
0,51
3
1,16
1,57
7
Cul
tura
l Affai
rs8,
065,
060
9,
040,
592
8,61
9,24
1
7,41
8,10
5
421,
351
1,
201,
136
Dis
abili
ty
2,02
3,11
6
2,
023,
116
1,58
6,40
3
1,38
5,79
0
436,
713
20
0,61
3
El
Pue
blo
De
Los
Ang
eles
H
isto
rica
l Mon
umen
t A
utho
rity
1,69
6,57
1
1,
633,
260
1,61
1,13
2
1,55
3,46
5
22,1
28
57
,667
Em
erge
ncy
Man
agem
ent
1,78
9,89
3
2,
872,
395
2,61
9,21
1
2,46
9,32
9
253,
184
14
9,88
2
Em
ploy
ee R
elat
ions
Boa
rd40
0,28
4
400,
284
329,
163
30
6,27
2
71
,121
22
,891
Fi
nanc
e36
,376
,470
36,2
25,4
62
35,7
12,7
67
42,0
58,9
29
512,
695
(6
,346
,162
)
Fi
re51
3,44
4,77
3
526,
674,
517
523,
185,
090
502,
862,
177
3,
489,
427
20,3
22,9
13
Gen
eral
Ser
vice
s21
5,22
2,75
6
296,
527,
984
263,
800,
135
279,
334,
160
32
,727
,849
(15,
534,
025)
In
form
atio
n Tec
hnol
ogy
Age
ncy
81,4
75,1
54
88,8
58,9
13
86,8
64,1
08
89,5
80,0
37
1,99
4,80
5
(2,7
15,9
29)
Lo
s A
ngel
es H
ousi
ng
50,4
77,4
74
54,0
73,9
79
48,5
76,6
67
50,2
83,8
11
5,49
7,31
2
(1,7
07,1
44)
Lo
s A
ngel
es C
onve
ntio
n Cen
ter
22,9
60,5
43
22,9
05,1
42
22,2
64,0
92
23,7
37,9
20
641,
050
(1
,473
,828
)
M
ayor
6,15
1,40
1
37
,844
,452
36,2
67,7
73
34,5
28,3
04
1,57
6,67
9
1,73
9,46
9
Nei
ghbo
rhoo
d Em
pow
erm
ent
2,29
5,92
4
2,
404,
128
2,28
6,36
9
1,68
3,50
2
117,
759
60
2,86
7
Pe
rson
nel
50,0
54,8
62
49,8
78,1
45
46,3
34,3
94
39,5
99,5
31
3,54
3,75
1
6,73
4,86
3
Plan
ning
29,0
50,3
83
29,9
38,6
53
25,9
80,5
40
22,3
50,1
89
3,95
8,11
3
3,63
0,35
1
Polic
e1,
256,
645,
232
1,26
4,52
4,34
1
1,24
9,61
3,25
3
1,23
4,39
7,28
9
14,9
11,0
88
15,2
15,9
64
Publ
ic W
orks
:Bo
ard
Offic
e13
,331
,856
16,9
45,6
46
16,2
55,9
16
19,7
81,3
70
689,
730
(3
,525
,454
)
Con
trac
t A
dmin
istr
atio
n29
,850
,334
31,7
30,4
52
27,5
23,2
92
28,1
24,6
79
4,20
7,16
0
(601
,387
)
Engi
neer
ing
71,8
00,4
23
79,9
45,6
21
68,6
01,2
00
70,2
81,9
14
11,3
44,4
21
(1,6
80,7
14)
Sa
nita
tion
221,
247,
494
222,
844,
618
199,
768,
149
199,
330,
528
23
,076
,469
437,
621
St
reet
Lig
htin
g25
,018
,468
27,2
57,0
51
24,2
21,9
14
24,9
04,8
02
3,03
5,13
7
(682
,888
)
Stre
et S
ervi
ces
166,
839,
759
181,
710,
379
163,
257,
830
167,
128,
362
18
,452
,549
(3,8
70,5
32)
Tra
nspo
rtat
ion
131,
153,
760
$
13
9,65
9,29
8$
136,
606,
320
$
134,
091,
514
$
3,
052,
978
$
2,51
4,80
6$
Zo
o17
,561
,531
17,8
03,6
19
17,4
29,7
58
17,0
26,5
16
373,
861
40
3,24
2
Tot
al -
Bud
geta
ry D
epar
tmen
ts3,
251,
002,
922
3,47
6,99
9,36
6
3,32
1,10
4,74
6
3,28
8,31
1,71
5
155,
894,
620
32
,793
,031
C
ontin
ued
Sta
tem
en
t o
f B
ud
ge
t A
pp
rop
ria
tio
ns,
Ex
pe
nd
itu
res
an
d E
ncu
mb
ran
ces
Bu
dg
et
an
d A
ctu
al
(Ca
sh B
asi
s) -
All
An
nu
all
y B
ud
ge
ted
Fu
nd
sFi
sca
l Y
ea
rs E
nd
ed
Ju
ne
30
, 2
01
3 a
nd
20
12
Statement of Budget Appropriations, Expenditures and Encumbrances – Budget and Actual

Preliminary Financial Report Schedules
B-11
FY
20
13
Va
ria
nce
FY 2
01
3
Ori
gin
al
Fin
al
Ex
pe
nd
itu
res
&E
xp
en
dit
ure
s &
Wit
h F
ina
l B
ud
ge
tE
xp
en
dit
ure
s &
B
ud
ge
tB
ud
ge
tE
ncu
mb
ran
ces
En
cum
bra
nce
sP
osi
tive
En
cum
bra
nce
sFY
20
13
FY 2
01
3FY
20
13
FY 2
01
2 (
Ne
ga
tive
)In
cre
ase
(D
ecr
ea
se)
Libr
ary
102,
307,
213
102,
307,
213
102,
307,
213
(1)
89,2
47,5
57
--
13,0
59,6
56
Rec
reat
ion
& P
arks
143,
606,
363
144,
223,
983
144,
223,
983
(1)
148,
615,
795
--
(4,3
91,8
12)
City
Em
ploy
ees' R
etirem
ent
77,6
18,0
4874
,719
,463
74,7
19,4
63
(1)
75,9
78,8
43--
(1,2
59,3
80)
Tax
and
Rev
enue
A
ntic
ipat
ion
Not
es
860,
620,
300
860,
620,
300
851,
355,
871
798,
081,
315
9,26
4,42
9
53,2
74,5
56
Bond
Red
empt
ion
and
Inte
rest
164,
475,
921
164,
475,
922
164,
475,
921
175,
062,
961
1
(1
0,58
7,04
0)
Cap
ital F
inan
ce A
dmin
istr
atio
n21
1,05
3,09
521
5,25
8,25
1
211,
219,
473
205,
562,
462
4,03
8,77
8
5,65
7,01
1
Cap
ital I
mpr
ovem
ent
E
xpen
ditu
re P
rogr
am17
4,10
6,20
116
6,15
3,11
9
95,4
72,1
95
37,2
99,0
5070
,680
,924
58,1
73,1
45
Gen
eral
City
Pur
pose
s94
,753
,670
61,7
31,1
88
56,1
07,7
04
52,6
40,8
625,
623,
484
3,46
6,84
2
Hum
an R
esou
rces
Ben
efits
592,
508,
153
580,
535,
553
575,
300,
819
546,
134,
290
5,23
4,73
4
29,1
66,5
29
Judg
men
t O
blig
atio
n Bo
nds
D
ebt Se
rvic
e 9,
030,
425
9,03
0,42
5
9,03
0,41
4
9,03
1,37
311
(9
59)
Liab
ility
Cla
ims
47,9
10,0
0056
,943
,613
56,9
41,6
48
49,0
57,4
561,
965
7,
884,
192
Prop
ositi
on A
Loc
al T
rans
it A
ssis
tanc
e Tru
st18
5,72
0,48
718
5,74
2,31
6
67,4
16,8
95
72,5
57,0
1811
8,32
5,42
1
(5
,140
,123
)
Pr
opos
ition
C A
nti-G
ridl
ock
T
rans
it Im
prov
emen
t26
,311
,952
26,5
05,1
96
11,9
26,4
99
15,5
75,0
3014
,578
,697
(3,6
48,5
31)
Sp
ecia
l Par
king
Rev
enue
47
,514
,510
48,7
04,2
52
41,2
98,5
02
38,0
85,6
367,
405,
750
3,21
2,86
6
Una
ppro
pria
ted
Bala
nce
27,4
82,0
006,
403,
648
(2)
--
--
6,40
3,64
8
--
Was
tew
ater
Spe
cial
Pur
pose
448,
973,
671
471,
926,
855
408,
482,
870
381,
272,
197
63,4
43,9
85
27,2
10,6
73
Wat
er a
nd E
lect
rici
ty36
,478
,000
38,0
50,4
72
38,0
50,4
72
35,9
78,0
00--
2,07
2,47
2
Oth
er S
peci
al P
urpo
se F
unds
744,
643,
720
797,
868,
798
494,
346,
067
467,
194,
955
303,
522,
731
27
,151
,112
Tot
al -
Non
depa
rtm
enta
l3,
995,
113,
729
4,01
1,20
0,56
73,
402,
676,
009
3,19
7,37
4,80
060
8,52
4,55
820
5,30
1,20
9
Tot
al7,
246,
116,
651
$ 7,
488,
199,
933
$ 6,
723,
780,
755
$
6,48
5,68
6,51
5$
764,
419,
178
$
238,
094,
240
$
(1)
Am
ount
dis
burs
ed b
y al
loca
tion
to the
Dep
artm
ents
con
trol
ling
thei
r ow
n fu
nds.
(2)
Tot
al fin
al a
ppro
pria
tions
was
$63
,022
,868
of w
hich
$56
,619
,220
was
tra
nsfe
rred
to
va
riou
s de
part
men
ts a
nd is
incl
uded
in D
epar
tmen
tal a
ppro
pria
tions
.
Sta
tem
en
t o
f B
ud
ge
t A
pp
rop
ria
tio
ns,
Ex
pe
nd
itu
res
an
d E
ncu
mb
ran
ces
Bu
dg
et
an
d A
ctu
al
(Ca
sh B
asi
s) -
All
An
nu
all
y B
ud
ge
ted
Fu
nd
sFi
sca
l Y
ea
rs E
nd
ed
Ju
ne
30
, 2
01
3 a
nd
20
12

Preliminary Financial Report Schedules
B-12
Fiscal Years Ended June 30, 2009 through 2013
FY 2013 FY 2012 FY 2011 FY 2010 FY 2009
Aging 179,047$ 253,884$ 156,106$ 186,077$ 336,649$
Animal Services 1,008,306 1,145,351 880,915 837,722 1,632,563
Building & Safety 2,975,012 2,713,560 2,495,675 2,157,835 5,255,705
City Administrative Officer 1,405,732 1,209,427 653,056 767,543 1,744,638
City Attorney 10,310,467 9,314,999 8,428,321 5,428,526 8,381,496
City Clerk 3,051,150 1,265,418 4,745,976 1,210,374 9,841,252
City Ethics Commission 103,804 145,029 131,327 67,981 194,090
Commission for Children, Youth and
Their Families (1)
-- -- -- -- 170,225
Commission on the Status of Women (1)
-- -- -- -- 13,463
Community Development 1,405,085 2,089,028 1,758,585 1,811,952 2,343,465
Controller 1,833,498 1,759,358 1,442,063 1,555,670 2,085,523
Council 1,750,981 1,866,189 1,252,831 1,433,387 2,173,693
Cultural Affairs 1,921,003 1,442,489 2,049,345 1,816,796 1,705,956
Disability 183,422 202,977 140,799 86,847 188,496
El Pueblo 107,082 158,782 137,339 144,603 227,199
Emergency Management 116,817 107,641 104,030 79,475 167,528
Employee Relations Board 93,590 40,193 47,080 27,553 45,301
Environmental Affairs (2)
-- -- -- 113,427 199,580
Finance (3)
2,558,257 4,510,493 1,235,016 1,029,990 2,097,555
Fire 25,706,809 20,192,219 19,824,076 19,185,220 38,294,735
General Services 26,180,452 31,911,714 31,064,004 30,605,640 43,158,897
Human Services (1) (2)
-- -- -- 53,724 76,803
Information Technology Agency 21,480,392 20,814,131 17,692,746 15,495,410 14,860,174
Los Angeles Housing 2,099,118 2,550,828 3,031,105 2,468,816 3,498,750
Los Angeles Convention Center 996,740 1,110,118 1,062,384 1,175,421 1,523,392
Mayor 10,179,527 9,334,120 7,543,239 9,498,154 7,800,400
Neighborhood Empowerment 126,385 85,490 82,402 225,747 470,079
Personnel 4,698,696 4,703,665 5,919,496 8,694,368 10,817,351
Planning 3,246,937 3,875,663 4,208,889 4,505,011 5,094,763
Police 62,515,136 59,326,515 51,561,854 46,972,719 106,973,469
PW - Board 1,662,500 2,509,500 2,368,456 1,746,711 1,971,973
PW - Contract Administration 1,218,785 1,116,461 1,003,238 937,888 2,279,846
PW - Engineering 3,634,041 3,207,809 2,915,917 2,606,942 6,424,833
PW - Sanitation 11,800,493 11,008,593 10,315,446 17,910,352 22,812,507
PW - Street Lighting 1,291,895 1,398,791 1,562,942 1,200,154 2,680,417
PW - Street Services 20,418,735 24,670,187 16,192,083 12,110,180 17,696,990
Transportation 7,184,939 9,219,635 7,129,043 6,925,909 13,330,868
Treasurer (3)
-- -- 2,495,458 3,305,937 1,432,509
Zoo 1,305,802 1,080,908 923,866 852,876 1,535,663
Capital Finance Administration 272,208 702,933 1,039,840 1,051,351 793,387
Capital Improvement Expenditure Program 4,074,272 5,063,734 9,335,162 6,075,386 11,660,532
General City Purposes 14,187,346 16,845,729 29,883,164 16,799,475 24,231,045
Human Resources Benefits 22,820,854 10,760,519 8,549,343 9,689,120 5,546,432
Liability Claims 125,000 125,000 1,901,500 125,000 91,574
Water and Electricity 17,932,384 17,344,320 26,559,300 19,381,402 18,965,936
Total Encumbrances (4)
294,162,699$ 287,183,400$ 289,823,417$ 258,354,671$ 402,827,702$
Encumbrances for Salaries 112,395,989$ 103,934,348$ 90,992,792$ 79,115,979$ 198,068,702$
Encumbrances for Other Accounts 181,766,710 183,249,052 198,830,625 179,238,692 204,759,000
Total 294,162,699$ 287,183,400$ 289,823,417$ 258,354,671$ 402,827,702$
(1) Under Council File 09-0600 the Commission for Children, Youth and Their Families, Commission on the Status of Women, and Human
Relations Commission were consolidated into the Human Service Department.(2)
Human Services and Environmental Affairs departments were eliminated under Council File Nos. 10-0706-S1 and 10-0623, respectively.(3)
Office of Finance and Office of the Treasurer were consolidated per CF11-0600-S40.(4)
Includes prior years' encumbrances not yet liquidated.
Schedule of Year-End Encumbrances - General Fund
Schedule of Year-End Encumbrances – General Fund
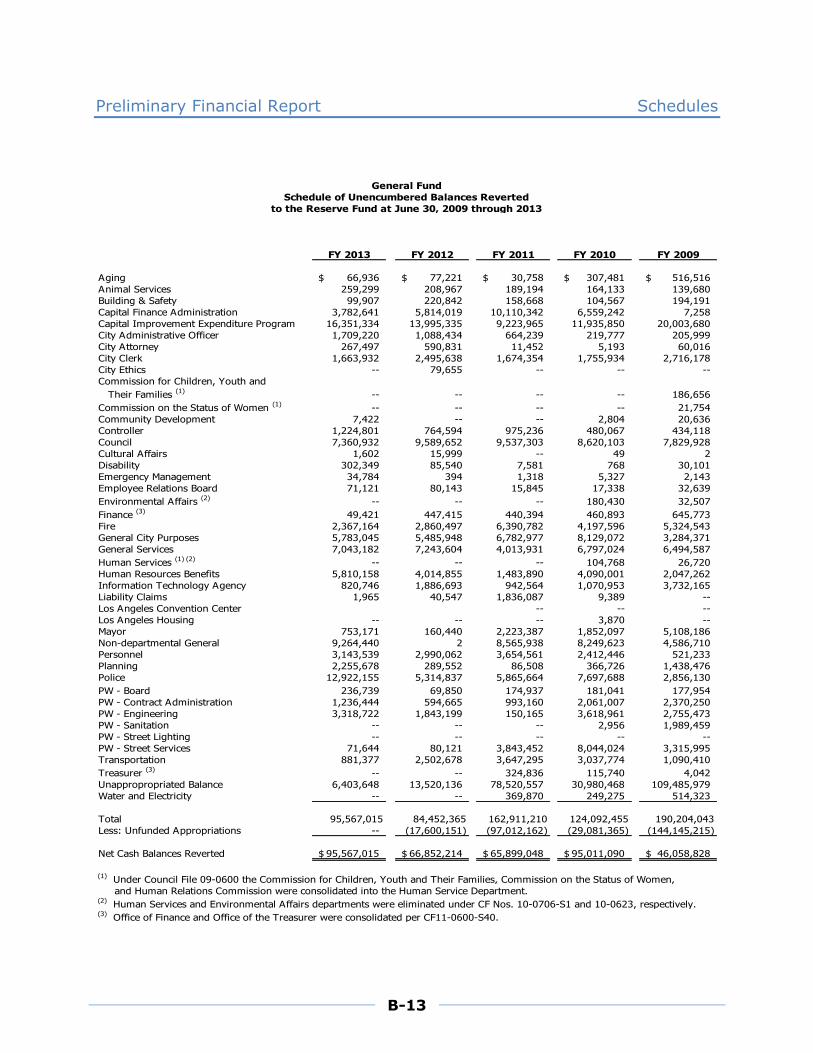
Preliminary Financial Report Schedules
B-13
FY 2013 FY 2012 FY 2011 FY 2010 FY 2009
Aging 66,936$ 77,221$ 30,758$ 307,481$ 516,516$
Animal Services 259,299 208,967 189,194 164,133 139,680
Building & Safety 99,907 220,842 158,668 104,567 194,191
Capital Finance Administration 3,782,641 5,814,019 10,110,342 6,559,242 7,258
Capital Improvement Expenditure Program 16,351,334 13,995,335 9,223,965 11,935,850 20,003,680
City Administrative Officer 1,709,220 1,088,434 664,239 219,777 205,999
City Attorney 267,497 590,831 11,452 5,193 60,016
City Clerk 1,663,932 2,495,638 1,674,354 1,755,934 2,716,178
City Ethics -- 79,655 -- -- --
Commission for Children, Youth and
Their Families (1)
-- -- -- -- 186,656
Commission on the Status of Women (1)
-- -- -- -- 21,754
Community Development 7,422 -- -- 2,804 20,636
Controller 1,224,801 764,594 975,236 480,067 434,118
Council 7,360,932 9,589,652 9,537,303 8,620,103 7,829,928
Cultural Affairs 1,602 15,999 -- 49 2
Disability 302,349 85,540 7,581 768 30,101
Emergency Management 34,784 394 1,318 5,327 2,143
Employee Relations Board 71,121 80,143 15,845 17,338 32,639
Environmental Affairs (2)
-- -- -- 180,430 32,507
Finance (3)
49,421 447,415 440,394 460,893 645,773
Fire 2,367,164 2,860,497 6,390,782 4,197,596 5,324,543
General City Purposes 5,783,045 5,485,948 6,782,977 8,129,072 3,284,371
General Services 7,043,182 7,243,604 4,013,931 6,797,024 6,494,587
Human Services (1) (2)
-- -- -- 104,768 26,720
Human Resources Benefits 5,810,158 4,014,855 1,483,890 4,090,001 2,047,262
Information Technology Agency 820,746 1,886,693 942,564 1,070,953 3,732,165
Liability Claims 1,965 40,547 1,836,087 9,389 --
Los Angeles Convention Center -- -- --
Los Angeles Housing -- -- -- 3,870 --
Mayor 753,171 160,440 2,223,387 1,852,097 5,108,186
Non-departmental General 9,264,440 2 8,565,938 8,249,623 4,586,710
Personnel 3,143,539 2,990,062 3,654,561 2,412,446 521,233
Planning 2,255,678 289,552 86,508 366,726 1,438,476
Police 12,922,155 5,314,837 5,865,664 7,697,688 2,856,130
PW - Board 236,739 69,850 174,937 181,041 177,954
PW - Contract Administration 1,236,444 594,665 993,160 2,061,007 2,370,250
PW - Engineering 3,318,722 1,843,199 150,165 3,618,961 2,755,473
PW - Sanitation -- -- -- 2,956 1,989,459
PW - Street Lighting -- -- -- -- --
PW - Street Services 71,644 80,121 3,843,452 8,044,024 3,315,995
Transportation 881,377 2,502,678 3,647,295 3,037,774 1,090,410
Treasurer (3)
-- -- 324,836 115,740 4,042
Unappropropriated Balance 6,403,648 13,520,136 78,520,557 30,980,468 109,485,979
Water and Electricity -- -- 369,870 249,275 514,323
Total 95,567,015 84,452,365 162,911,210 124,092,455 190,204,043
Less: Unfunded Appropriations -- (17,600,151) (97,012,162) (29,081,365) (144,145,215)
Net Cash Balances Reverted 95,567,015$ 66,852,214$ 65,899,048$ 95,011,090$ 46,058,828$
(1)
Under Council File 09-0600 the Commission for Children, Youth and Their Families, Commission on the Status of Women,
and Human Relations Commission were consolidated into the Human Service Department.(2)
Human Services and Environmental Affairs departments were eliminated under CF Nos. 10-0706-S1 and 10-0623, respectively.(3)
Office of Finance and Office of the Treasurer were consolidated per CF11-0600-S40.
General Fund
Schedule of Unencumbered Balances Reverted
to the Reserve Fund at June 30, 2009 through 2013
Schedule of Unencumbered Balances Reverted to the Reserve Fund
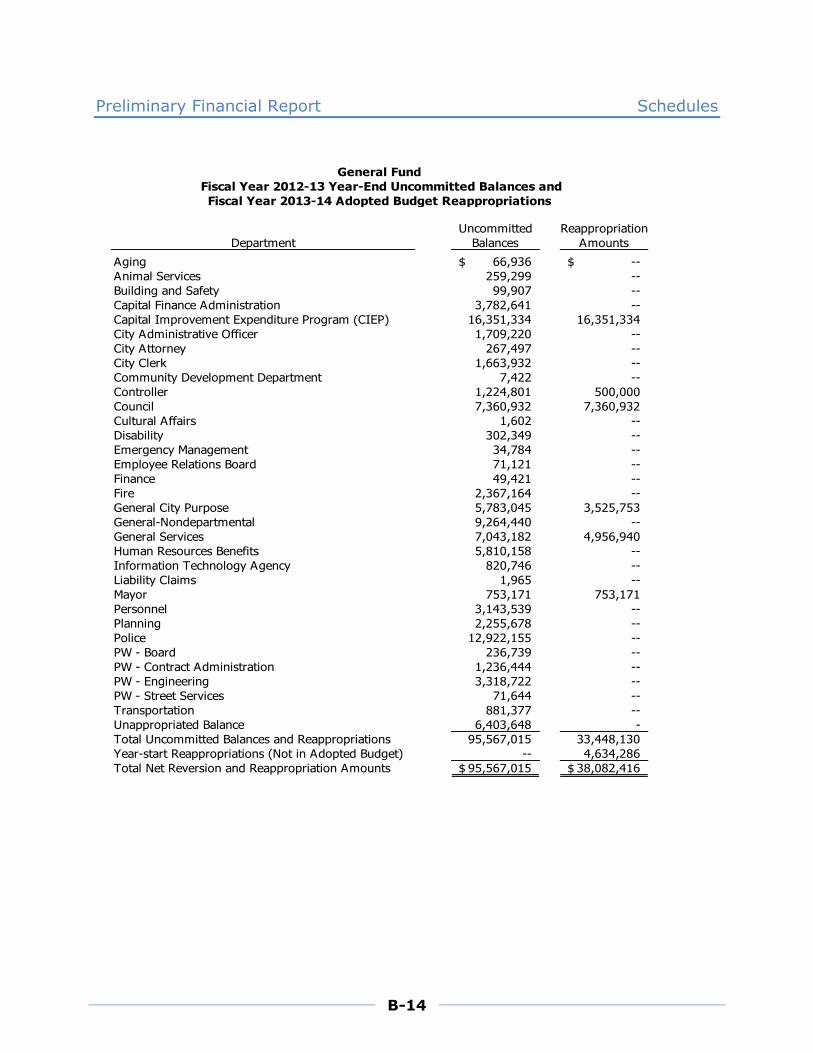
Preliminary Financial Report Schedules
B-14
Uncommitted Reappropriation
Balances Amounts
Aging 66,936$ --$
Animal Services 259,299 --
Building and Safety 99,907 --
Capital Finance Administration 3,782,641 --
Capital Improvement Expenditure Program (CIEP) 16,351,334 16,351,334
City Administrative Officer 1,709,220 --
City Attorney 267,497 --
City Clerk 1,663,932 --
Community Development Department 7,422 --
Controller 1,224,801 500,000
Council 7,360,932 7,360,932
Cultural Affairs 1,602 --
Disability 302,349 --
Emergency Management 34,784 --
Employee Relations Board 71,121 --
Finance 49,421 --
Fire 2,367,164 --
General City Purpose 5,783,045 3,525,753
General-Nondepartmental 9,264,440 --
General Services 7,043,182 4,956,940
Human Resources Benefits 5,810,158 --
Information Technology Agency 820,746 --
Liability Claims 1,965 --
Mayor 753,171 753,171
Personnel 3,143,539 --
Planning 2,255,678 --
Police 12,922,155 --
PW - Board 236,739 --
PW - Contract Administration 1,236,444 --
PW - Engineering 3,318,722 --
PW - Street Services 71,644 --
Transportation 881,377 --
Unappropriated Balance 6,403,648 -
Total Uncommitted Balances and Reappropriations 95,567,015 33,448,130
Year-start Reappropriations (Not in Adopted Budget) -- 4,634,286
Total Net Reversion and Reappropriation Amounts 95,567,015$ 38,082,416$
Fiscal Year 2012-13 Year-End Uncommitted Balances and
Fiscal Year 2013-14 Adopted Budget Reappropriations
General Fund
Department
FY 2013 Year-End Uncommitted Balances and FY 2014 Adopted Budget Reappropriations

Preliminary Financial Report Schedules
B-15
2003-04 278,010,435$
2004-05 460,036,919$
2005-06 432,399,335$
2006-07 224,192,242$
2007-08 191,564,433$
2008-09 174,251,554$
2009-10 193,512,062$
2010-11 217,740,599$
2011-12 242,305,405$
2012-13 352,271,028$
Cash Balances
Reserve Fund Cash Balances

Preliminary Financial Report Schedules
B-16
Expenditure Encumbrance Total
COUNCIL FILE #12-0600-S178 AdvancesAnimal Services 4,343$ -$ 4,343$ Emergency Management 2,507 - 2,507 Fire 1,112,887 - 1,112,887 Finance 4,566 - 4,566 Neighborhood Empowerment 1,899 - 1,899
Total Council File #12-0600-S178 Advances 1,126,202 - 1,126,202
CHARTER SECTION 261(i) Advances Aging 210,271 143,587 353,858 Building & Safety 297,235 48,836 346,071City Administrative Officer 141,307 - 141,307City Attorney 1,029,265 - 1,029,265Community Development 1,118,799 768,299 1,887,098Disability 169,268 - 169,268Emergency Management 579,272 41,054 620,326
Fire 1,288,804 - 1,288,804General Services 5,917,530 3,678,169 9,595,699Housing 1,317,274 1,454,243 2,771,517Information Technology Agency 857,594 32,222 889,816Mayor 526,686 - 526,686Personnel 28,660 11,459 40,119Planning 56,983 44,679 101,662Police 490,899 - 490,899Public Works - Board 500,655 139,202 639,857Public Works - Contract Administration 904,903 - 904,903Public Works - Engineering 1,412,348 - 1,412,348Public Works - Sanitation 1,607,642 - 1,607,642Public Works - Street Lighting 66,334 58,774 125,108Public Works - Street Services 388,416 1,409,935 1,798,351Transportation 19,057 - 19,057
Total Charter Section 261(i) Advances 18,929,202 7,830,459 26,759,661
Total 20,055,404$ 7,830,459$ 27,885,863$
Department
Year-End Advances From The Reserve Fund For Unfunded Expenditures & Encumbrances
June 30, 2013
Year-End Advances from the Reserve Fund for Unfunded Expenditures and Encumbrances

Preliminary Financial Report Schedules
B-17
Amount % Amount % Amount %
Taxes (1)
$ 3,743,684,589 53 $ 3,473,418,878 53 $ 2,639,616,611 52Licenses, Permits and Fees 848,090,731 12 850,994,338 13 544,794,942 11Intergovernmental 512,401,013 6 496,485,725 8 504,894,274 10Charges for Services 1,226,358,271 17 1,192,363,020 18 709,117,505 14Special Assessments 46,837,321 1 45,740,764 1 42,877,084 1Interest 36,692,491 1 33,169,773 -- 53,684,145 1Program Income 1,035,606 -- 441,027 -- -- --
Other (2)
406,269,181 6 241,391,338 3 224,605,589 4Transfer to General Fund 279,111,000 4 259,016,164 4 327,440,501 7
Total Revenue (2)
$ 7,100,480,203 100 $ 6,593,021,027 100 $ 5,047,030,651 100
(1) Major tax revenue sources included are Property Tax, Utility Users Tax, Sales Tax and Business Tax.
(2) Does not include available balances at July 1.
Amount % Amount % Amount %
General Government $ 1,490,585,382 24 $ 1,447,401,724 24 $ 1,186,268,283 26Protection of Persons
and Property 1,840,867,429 29 1,818,672,107 30 1,489,503,972 33Public Works (Maintenance and Improvements) 349,420,340 5 338,334,474 6 292,552,043 6Health and Sanitation 536,181,838 8 505,337,429 8 328,051,180 7Cultural and Recreational
Services 327,502,324 5 317,078,303 5 257,553,219 6Community Development 164,170,239 3 149,607,225 2 122,451,227 3Pension & Retirement
Systems Contributions 925,042,579 15 874,060,158 14 263,508,603 6Capital Outlay 68,843,656 1 21,656,547 -- 147,864,614 3Bond Redemption & Interest 384,228,970 6 414,298,834 7 282,711,150 6Transportation 247,971,275 4 260,157,417 4 203,297,399 4
Total Expenditures (1)
$ 6,334,814,032 100 $ 6,146,604,218 100 $ 4,573,761,690 100
(1) Does not include encumbrances at year-end.
FY 2004
EXPENDITURE TRENDS BY GOVERNMENT ACTIVITY(Cash Basis)
FY 2013 FY 2012 FY 2004
REVENUE TRENDS(Cash Basis)
FY 2013 FY 2012
Revenue and Expenditure Trends

Preliminary Financial Report Schedules
B-18
Outstanding OutstandingPurpose 07/01/12 Issued Matured Refunded 06/30/13
Series 1998-A - Advance refunding of a portion of Series 1989-A, 1990-B, 1991-A, 1992-A and 1995-A 44,910,000$ --$ 12,520,000$ --$ 32,390,000$
Series 2002-A - Acquisition and improvement of Animal Shelter, Zoo ,Fire/Paramedic and 911-Police-Fire-Paramedic Facilities 39,330,000 -- 13,110,000 -- 26,220,000
Series 2002-B - Advance refunding of a portion of Series 1993-A, 1999-B, 2000-A and 2001-A 42,815,000 -- 17,785,000 -- 25,030,000
Series 2003-A - Acquisition and improvement of Fire/Paramedic, Animal Shelter and 911-Police-Fire-Paramedic Facilities 23,340,000 -- 11,670,000 -- 11,670,000
Series 2003-B - Advance refunding of Series 1993-A, 1993-B and 1993-C 13,425,000 -- 6,770,000 -- 6,655,000
Series 2004-A - Acquisition and improvement of 911-Police/Fire-Paramedic Facilities 54,075,000 -- 18,025,000 -- 36,050,000
Series 2005-A - Acquisition and improvement of Fire Station and Fire/Paramedic/Emergency Rescue Helicopter Facilities & finance Water Quality Improvement projects 25,360,000 -- 6,340,000 -- 19,020,000
Series 2005-B - Advance refunding of aportion of Series 1999-B, 2000-A,and 2001-A 72,500,000 -- 110,000 -- 72,390,000
Series 2006-A - Acquisition and improvement of Fire/Paramedic,Animal Shelter, 911-Police-Fire-Paramedic Facilities and financeWater Quality Improvement projects 52,650,000 -- 3,510,000 -- 49,140,000
Series 2008-A - Acquisition andimprovement of Stormwater PollutionAbatement projects 85,850,000 -- 5,050,000 -- 80,800,000
Series 2009-A - Acquisition and
improvement of Stormwater Pollution
Abatement projects 105,900,000 -- 8,825,000 -- 97,075,000
Series 2009-B - Acquisition and
improvement of Stormwater Pollution
Abatement projects 52,950,000 -- -- -- 52,950,000
Series 2011-A - Acquisition and
improvement of Stormwater Pollution
Abatement projects 117,000,000 -- 5,850,000 -- 111,150,000
Series 2011-B - Advance refunding of
Series 1999-A and 2001-A and a
portion of Series 2002-A and
Series 2003-A 259,660,000 -- 2,765,000 -- 256,895,000
Series 2012-A - Advance refunding of a
portion of Series 2004-A and 2005-A 225,850,000 -- -- -- 225,850,000
Total 1,215,615,000$ --$ 112,330,000$ --$ 1,103,285,000$
Statement of General Obligation Bonded DebtFiscal Year Ended June 30, 2013
Statement of General Obligation Bonded Debt

Preliminary Financial Report Schedules
B-19
Note: The 6% non-voter approved debt cap can only be exceeded in two instances:
(a) There is a guaranteed new revenue stream for the debt payments and the additional debt will not cause the
debt service ratio to exceed 7.5%, or
(b) There is no guaranteed revenue stream for the debt but the 6% ratio shall only be exceeded for one fiscal year.
0.00%
1.00%
2.00%
3.00%
4.00%
5.00%
6.00%
7.00%
8.00%
9.00%
10.00%
11.00%
12.00%
13.00%
14.00%
15.00%
16.00%
2004 2005 2006 2007 2008 2009 2010 2011 2012 2013
Fiscal Years
Ratio of Debt Service Requirements to General Fund ReceiptsLast Ten Fiscal Years
Non-Voter Approved Debt Cap Non-Voter Approved Debt Total Debt Total Debt Cap
Ratio of Debt Service Requirements
Fiscal Year Debt Service Requirements to General Fund Receipts
Ended Non-Voter Voter General Fund Non-Voter Voter
June 30 Approved Approved Total Receipts (1)
Approved Approved Total
2004 141,008,595 136,739,299 277,747,894 3,585,316,653 3.93% 3.81% 7.74%
2005 159,823,544 167,281,520 327,105,064 3,912,975,296 4.08% 4.28% 8.36%
2006 152,991,584 192,483,903 345,475,487 4,136,531,029 3.70% 4.65% 8.35%
2007 146,791,654 195,720,003 342,511,657 4,386,747,690 3.35% 4.46% 7.81%
2008 170,801,748 196,742,647 367,544,395 4,383,566,846 3.90% 4.49% 8.39%
2009 185,066,947 191,308,437 376,375,384 4,435,145,176 4.17% 4.31% 8.48%
2010 210,288,273 191,756,276 402,044,549 4,435,433,454 4.74% 4.32% 9.06%
2011 206,824,552 198,867,524 405,692,076 4,304,949,490 4.80% 4.62% 9.42%
2012 207,383,076 188,246,265 395,629,341 4,396,039,813 4.72% 4.28% 9.00%
2013 210,809,036 188,706,822 399,515,858 4,676,009,369 4.51% 4.04% 8.55%
(1) General Fund receipts have been adjusted upwards to reflect bond proceeds to pay for capitalized interest.
Ratio of Debt Service Requirements to General Fund Receipts

Preliminary Financial Report Schedules
B-20
Computation of Legal Debt Margin