prepared for: department of agriculture, fisheries and ... · 13.1 i ntroduction ... the ocvo...
TRANSCRIPT
The Structure and Dynamics
of the Pig Meat Industry
Prepared for: Department of Agriculture, Fisheries and Forestry
May 2007
Authors:
1

Ross Cutler BVSc PhD Patricia Holyoake BVSc PhD Ross Cutler & Associates University of Sydney 140 The Parade Faculty of Veterinary Science Ocean Grove Vic 3226 425 Werombi Rd
Camden NSW 2570
2
TABLE OF CONTENTS 1 INTRODUCTION .................................................................................................................................5
1.1 ISSUES ..........................................................................................................................................5 1.2 TERMS OF REFERENCE.................................................................................................................5 1.2.1 STRUCTURE OF THE PIG HERD .................................................................................................5 1.2.2 DYNAMICS WITHIN THE AUSTRALIAN PIG HERD........................................................................6 1.3 OUTPUTS ......................................................................................................................................6
2 BACKGROUND.................................................................................................................................7 2.1 HISTORICAL PERSPECTIVE ...........................................................................................................7 2.2 INTERNATIONAL COMPETITIVENESS ...........................................................................................14
3 FARM STRUCTURE.......................................................................................................................17 3.1 INTEGRATION ..............................................................................................................................17 3.2 FARROW-TO-FINISH ....................................................................................................................18 3.3 WEANER PRODUCERS ................................................................................................................20 3.4 FINISHER PRODUCERS ...............................................................................................................21 3.5 MULTISITE PRODUCTION ...............................................................................................................21 3.6 CONTRACTING ARRANGEMENTS ...................................................................................................21 3.7 OUTDOOR FARMS .......................................................................................................................23
4 LOCATION OF PIG FARMS, AI CENTRES AND ABATTOIRS ..............................................24 4.1 QUEENSLAND STATISTICAL DIVISIONS, FARMS, SEED STOCK PRODUCERS, ABATTOIRS AND AI CENTRES..................................................................................................................................................25 4.2 NEW SOUTH WALES STATISTICAL DIVISION, FARMS, SEED STOCK PRODUCERS, ABATTOIRS AND AI CENTRES ....................................................................................................................................27 4.3 VICTORIA STATISTICAL DIVISION, FARMS, SEED STOCK PRODUCERS, ABATTOIRS AND AI CENTRES.................................................................................................................................................29 4.4 TASMANIA STATISTICAL DIVISION, FARMS, SEED STOCK PRODUCERS, ABATTOIRS AND AI CENTRES.................................................................................................................................................31 4.5 SOUTH AUSTRALIA STATISTICAL DIVISION, FARMS, SEED STOCK PRODUCERS, ABATTOIRS AND AI CENTRES ............................................................................................................................................32 4.6 WESTERN AUSTRALIA STATISTICAL DIVISION, FARMS, SEED STOCK PRODUCERS, ABATTOIRS AND AI CENTRES ....................................................................................................................................34 4.7 THE NORTHERN TERRITORY: STATISTICAL DIVISIONS, FARMS, SEED STOCK PRODUCERS, ABATTOIRS AND AI CENTRES..................................................................................................................36
5 ABATTOIRS ......................................................................................................................................36
6 DAY-TO-DAY OPERATIONS ON A SEMEN CENTRE ..............................................................38
7 PIG FARMS AND OTHER ANIMALS .............................................................................................40
8 BIOSECURITY AND DISEASE RISKS..........................................................................................41 8.1 DEFINITION OF A BIOSECURITY PROGRAM ....................................................................................42 8.2 EMERGENCY DISEASE HAZARDS ...................................................................................................43 8.3 KEY ELEMENTS OF A BIOSECURITY PROGRAM FOR PIG FARMS ....................................................43 8.3.1 COMPLIANCE WITH REGULATIONS PROHIBITING SWILL FEEDING ...............................................43 8.3.2 FARM ISOLATION .........................................................................................................................43 8.3.3 SEPARATION FROM OTHER ANIMALS ...........................................................................................43 8.3.4 SINGLE SOURCE SUPPLY OF BREEDING STOCK AND RECORDS OF PIG INTRODUCTIONS ..........44 8.3.5 ISOLATION FACILITY ....................................................................................................................44 8.3.6 TRANSPORT ................................................................................................................................45 8.3.7 PEOPLE MOVEMENT AND CONTROLLED ENTRY ..........................................................................45 8.3.8 EQUIPMENT USED BY VETERINARIANS AND TECHNICIANS..........................................................46 8.3.9 VEHICLES ....................................................................................................................................46
3

8.3.10 RECOGNITION OF SICK ANIMALS, DISPOSAL OF DEAD STOCK AND TRAINING PROGRAMS FOR STAFF ABOUT DISEASE CONTROL ...........................................................................................................46 8.4 THE PIG INDUSTRY BIOSECURITY CODE OF PRACTICE..................................................................46 8.5 DIAGNOSING DISEASE ...................................................................................................................46
9 MOVEMENTS OF PIGS AT AGRICULTURAL SHOWS ...........................................................47 9.1 SURVEY OF ADMINISTRATIVE PERSONNEL AT AGRICULTURAL SHOWS ........................................47 9.1.1 BIOSECURITY RISKS AT AGRICULTURAL SHOWS........................................................................50 9.2 SURVEY OF PIG EXHIBITORS AT AGRICULTURAL SHOWS ............................................................50 9.2.1 INTRODUCTION ...........................................................................................................................50 9.2.2 COMPILING A LIST OF ALL PIG EXHIBITORS ................................................................................50 9.2.3 LOCATIONS OF AGRICULTURAL SHOWS ......................................................................................50 9.2.4 QUARANTINE AND BIOSECURITY ................................................................................................52 9.2.5 PIG IDENTIFICATION ....................................................................................................................52 9.2.6 PIG MOVEMENTS POST-SHOWING...............................................................................................53 9.2.7 MOVEMENTS OF PIGS AMONG SHOWS.......................................................................................53 9.2.8 SUMMARY AND CONCLUSIONS ...................................................................................................55
10 LIVE PIG MARKETS IN AUSTRALIA .....................................................................................55 10.1 NEW SOUTH WALES ...................................................................................................................56 10.2 VICTORIA ................................................................................................................................57 10.3 QUEENSLAND .........................................................................................................................57 10.4 SOUTH AUSTRALIA .................................................................................................................58 10.5 WESTERN AUSTRALIA ............................................................................................................58 10.6 TASMANIA ...................................................................................................................................59
11 SURVEY OF PIG MOVEMENTS AT MAJOR SALEYARDS IN AUSTRALIA ..................59 11.1 INTRODUCTION ............................................................................................................................59 11.2 METHODOLOGY...........................................................................................................................59 A ‘SNAPSHOT’ SURVEY WAS UNDERTAKEN AT FOUR MAJOR SALEYARDS IN AUSTRALIA LOCATED AT DUBLIN (SOUTH AUSTRALIA), BALLARAT (VICTORIA), FORBES (NEW SOUTH WALES) AND TOOWOOMBA (QUEENSLAND) OVER A TWO-MONTH PERIOD. A ‘MINOR’ SALEYARD AT TRURO IN SOUTH AUSTRALIA WAS ALSO INCLUDED IN THE STUDY FOR COMPARISON. TABLE 21 OUTLINES THE DATES AT WHICH EACH SALEYARD WAS VISITED....................................................................................59 11.3 RESULTS .....................................................................................................................................60 11.4 SUMMARY AND CONCLUSIONS .....................................................................................................65 12.4 ACKNOWLEDGMENTS .............................................................................................................66
13 MOVEMENT DYNAMICS AMONG PIG FARMS ...................................................................66 13.1 INTRODUCTION .......................................................................................................................66 13.2 METHODOLOGY...........................................................................................................................67 13.3 RESULTS.................................................................................................................................67 13.3.1 ON-FARM BIOSECURITY ..........................................................................................................68 13.3.2 MOVEMENT DYNAMICS ...........................................................................................................68 13.3.2.1 MOVEMENTS ON TO FARMS ................................................................................................68 13.3.2.2 MOVEMENTS OFF FARMS......................................................................................................69 13.4 DISCUSSION ................................................................................................................................70 13.5 SUMMARY ...............................................................................................................................71
EXAMPLES OF SPECIFIC INDIVIDUAL FARM DYNAMICS .........................................................72
APPENDIX ONE: POSTAL SURVEY TO PORK PRODUCERS ....................................................74
REFERENCES.........................................................................................................................................76
4
1 Introduction This project was undertaken in response to terms of reference provided by the Office of the Chief Veterinary Officer (OCVO) of the Australian Department of Agriculture, Fisheries and Forestry. The need for quality information on the structure, husbandry and livestock movement patterns associated with Australia’s pig herds has been identified as an important research priority for government and industry. This information can be used in a range of applications, but is particularly important for understanding and managing potential disease incursions. This project is the last of five projects covering different livestock industries: sheep, pigs, beef cattle, dairy and poultry. The OCVO within the Australian Government — Department of Agriculture, Fisheries and Forestry (AG–DAFF) is responsible for coordinating emergency animal disease preparedness and responses. Management of incursions may be complicated by the movement of livestock throughout Australia because this movement offers the potential for rapid and widespread dissemination of disease. Successful planning for, and management of, disease incursions relies on a good understanding of ‘normal movement patterns’, rapid identification and tracing of animal movements from infected premises and prevention of further animal or animal product movements capable of spreading disease. Technologies such as disease modeling can assist in understanding the potential rate and extent of spread of diseases. Information on the movement of livestock throughout Australia is essential to the characterization of scenarios for the likely spread of a disease originating at a certain location and/or within a certain production system at different times of the year. Such scenarios are valuable in determining the effectiveness of control strategies and the allocation of resources to control an emergency disease incident. There is a range of factors that influence livestock movements — production systems, feed availability, market prices — and determining these would assist in the modeling of likely livestock movements that might occur. An example of the modeling work conducted by the OCVO has recently been published (Garner & Beckett, 2005). 1.1 Issues A preliminary study assessing the feasibility of determining cattle movements has been conducted (Cunningham et al., 2002). That study developed methods for the gathering of movement data but did not progress to collecting data. Other studies have investigated animal movements in other countries (e.g. Sanson et al., 1993, Nielen et al., 1996: Ogawa & Matsuda, 2000; Bates et al., 2001). These studies have considered both direct (live animal) and indirect (animal products, people, vehicles, etc) movements. Although this level of information is useful, given limited available resources, the focus of this project will be on direct (animal) movements. In addition to live animal movements, movement of genetic material is of particular relevance to the pig industry. This study includes information on breeding practices that entail movement of such material between farms as well. 1.2 Terms of reference The following terms of reference define the scope of this project: 1.2.1 Structure of the pig herd Identify and describe all relevant sectors/production systems within the Australian pig meat industry and detail their standard operating practices. The geographic location of each identified sector/production system should be identified (and related to the 12 survey areas used in previous studies and referred to in Section 2 [Issues] above). Identify within each sector any practices that significantly affect between-herd interactions.
5

Detail the nature of breeding systems predominant in each production system (for example, whether boars or artificial insemination are used) and their source.
Detail the typical size and age structure of herds in each sector and whether other animals are typically present on the same property. 1.2.2 Dynamics within the Australian pig herd Detail broad movement and marketing patterns of pigs within and between each production system identified under A1 above. Detail movements of animals onto and off ‘typical’ farms within each production system and region identified under A1 above. Detail frequency and source/destination of movements of reproductive material (e.g. semen) onto and off farms within the different sectors. Identify factors that impact on the nature, timing and direction of pig movements within each production system. Identify key factors (meteorological, environmental, sociological, financial etc) that affect when production units make animal purchases and sales. Identify key areas of congregation or clustering of pig as a result of movements, for example:
• assembly of animals for live export • rest stops on transport corridors, travelling stock routes • agricultural shows • others.
1.3 Outputs The major output of the project will be a report that:
• Provides a rational classification of the Australian pig meat industry which takes into account geographical, production system and marketing factors. This should include distribution maps that show where the various sectors occur in Australia.
• Describes for pig meat enterprises within these sectors, the number, type and structure
of livestock present on typical (i.e. representative) farms of each sector as well as any production practices (including breeding practices) that significantly affect between-herd mixing of animals or reproductive material.
• Identifies and discusses sources of information on pig movements.
• Describes, for each of the sectors, the frequency, timing and direction of pig movements
that occur on and off ‘typical’ farms.
• Identifies factors that may influence that affect the buying and selling of pigs.
• Identifies particular issues or areas associated with the respective sectors that may be associated with increased clustering and mixing of pig from different sources.
6

2 Background 2.1 Historical perspective The Australian pig industry, in common with other intensive animal industries worldwide, has evolved from being a sideline enterprise to dairy or grain farms to becoming a significant farming enterprise in its own right and trades pork throughout the world. In the 2004–5 financial year the Australian pig industry had a gross farm value of about $924 million (Table one). Table one: Source: Dowling 2006 PS-6008 Gross Value of Australian Farm Production
2002/03 2003/04 2004/05
$
Million $
Million $
Million LIVESTOCK SLAUGHTERINGS Cattle and calves 5,849 6,345 7,331Cattle exported live 562 314 335Sheep 446 454 397Lambs 1,182 1,318 1,258Sheep exported live 408 266 207Pigs 911 879 924Poultry 1,281 1,281 1,440Total 10,676 10,896 11,930Source: ABARE cited by the Dowling 2006
Pigs grew well on skim milk, a by-product of a dairy industry that delivered cream to butter factories, a practice that still operated in the 1970s. In areas close to butter or cheese factories, whey was delivered or piped to pig farms and this cheap feed source became an important comparative advantage for those producers. For example, in the Leitchville community of Victoria, a group of producers piped whey from the then Kraft cheese factory to their farms. At Kiewa in Victoria the Kiewa butter factory ran a skim milk line to its own nearby pig farm of several hundred sows. In common with other grain producing farms all over the world, Australian grain farmers also raised a few pigs. Again, they were a sideline industry that generated regular cash flow throughout the year. As these industries changed, so did the pig industry. Progressive deregulation of the dairy industry changed where milk was produced. Processing technologies and refrigeration reduced the availability of skim milk and the quality of whey, putting more emphasis on the efficient use of feed. Throughout the 1970s the Australian industry started to learn how to produce pigs in numbers and about the importance of volume. Those that were able to apply new technologies expanded at the expense of those with poor health status, inadequate facilities or poor feed efficiency. In 1960 there were about 50,000 producers (Figure one). The total sow population was about 211,000 sows (Figure two). Average herd size then was 4.3 sows. The number of herds declined through the 1960s along with changes to the dairying industry and other structural agricultural changes. Surplus grain production in the late 1960s to the early 1970s led to the introduction of wheat quotas so some grain farmers, following the practice common in North America, elected to market grain through pigs. This led to a brief increase in 1972 in both the number of producers (to 39,000) and the number of sows to 460,000, a number never since reached (Dowling 2006).
7

Figure one. Source: Dowling 2006
Figure two: Herd size: Australian Pig Industry 1960–2004 Source: Dowling 2006
As a consequence of an outbreak of classical swine fever in NSW in the 1960s, movement controls were placed on pigs and pork products. This regulatory and disease control action seriously compromised the capacity of the NSW based Mayfair Hams and Bacon group to maintain output. The Mayfair group made a strategic decision to establish its own units in Victoria and NSW to partly offset the effect of any future disease control restrictions. This group established Australia’s first fully intensive unit at Huntly, near Bendigo, in April 1965 and over the next five years it grew to 2,000 sows. This was the beginning of the intensive pig industry in Australia. The Mayfair group, through the leadership of Dr Dudley Smith, demonstrated the feasibility of production on units of this size and hence that of the business and system model. The Mayfair group established a similar operation at Menangle in NSW in 1971. Proof of the concept also led to the population of the Wonga pig farm in 1968 (approx 1,200 sows) developed by Dr John Holder and from there to the establishment of the then Fidelity Meat Industries farm at Corowa in 1971. Until that time, disease internationally (largely classical swine fever in the USA) had constrained farm herd size to about 500 sows but based on the success of these operations in Australia the nature of the industry changed.
8
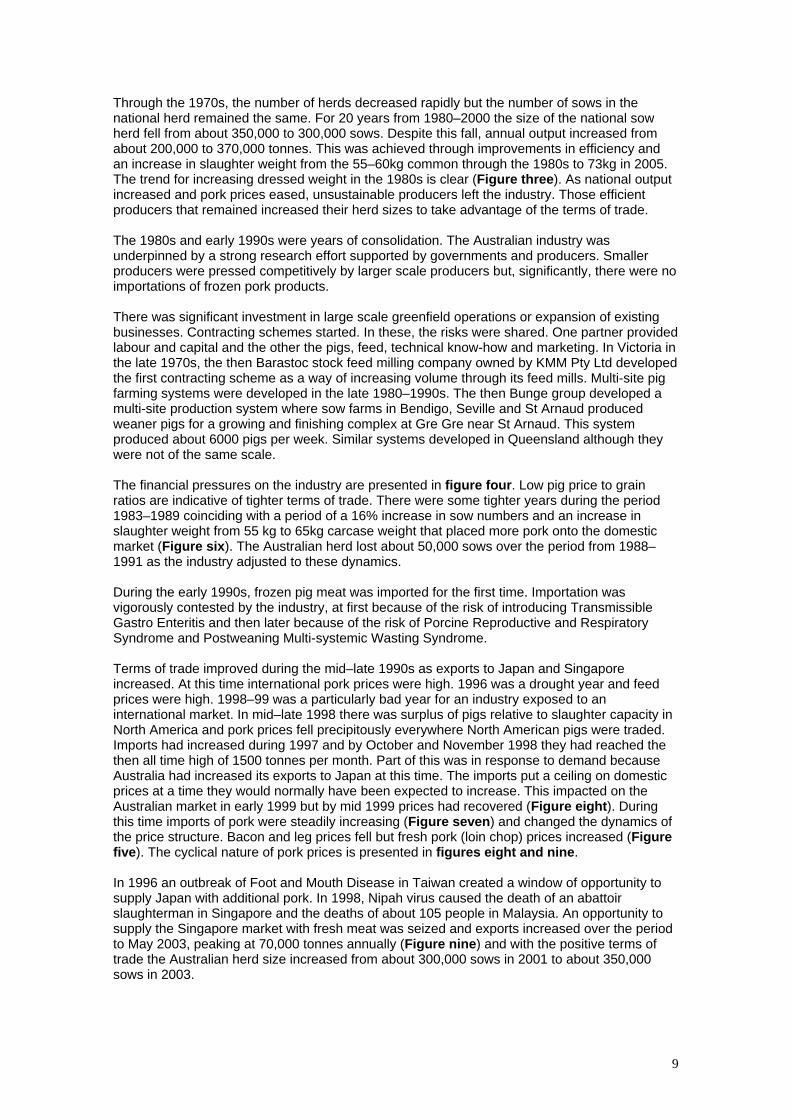
Through the 1970s, the number of herds decreased rapidly but the number of sows in the national herd remained the same. For 20 years from 1980–2000 the size of the national sow herd fell from about 350,000 to 300,000 sows. Despite this fall, annual output increased from about 200,000 to 370,000 tonnes. This was achieved through improvements in efficiency and an increase in slaughter weight from the 55–60kg common through the 1980s to 73kg in 2005. The trend for increasing dressed weight in the 1980s is clear (Figure three). As national output increased and pork prices eased, unsustainable producers left the industry. Those efficient producers that remained increased their herd sizes to take advantage of the terms of trade. The 1980s and early 1990s were years of consolidation. The Australian industry was underpinned by a strong research effort supported by governments and producers. Smaller producers were pressed competitively by larger scale producers but, significantly, there were no importations of frozen pork products. There was significant investment in large scale greenfield operations or expansion of existing businesses. Contracting schemes started. In these, the risks were shared. One partner provided labour and capital and the other the pigs, feed, technical know-how and marketing. In Victoria in the late 1970s, the then Barastoc stock feed milling company owned by KMM Pty Ltd developed the first contracting scheme as a way of increasing volume through its feed mills. Multi-site pig farming systems were developed in the late 1980–1990s. The then Bunge group developed a multi-site production system where sow farms in Bendigo, Seville and St Arnaud produced weaner pigs for a growing and finishing complex at Gre Gre near St Arnaud. This system produced about 6000 pigs per week. Similar systems developed in Queensland although they were not of the same scale. The financial pressures on the industry are presented in figure four. Low pig price to grain ratios are indicative of tighter terms of trade. There were some tighter years during the period 1983–1989 coinciding with a period of a 16% increase in sow numbers and an increase in slaughter weight from 55 kg to 65kg carcase weight that placed more pork onto the domestic market (Figure six). The Australian herd lost about 50,000 sows over the period from 1988–1991 as the industry adjusted to these dynamics. During the early 1990s, frozen pig meat was imported for the first time. Importation was vigorously contested by the industry, at first because of the risk of introducing Transmissible Gastro Enteritis and then later because of the risk of Porcine Reproductive and Respiratory Syndrome and Postweaning Multi-systemic Wasting Syndrome. Terms of trade improved during the mid–late 1990s as exports to Japan and Singapore increased. At this time international pork prices were high. 1996 was a drought year and feed prices were high. 1998–99 was a particularly bad year for an industry exposed to an international market. In mid–late 1998 there was surplus of pigs relative to slaughter capacity in North America and pork prices fell precipitously everywhere North American pigs were traded. Imports had increased during 1997 and by October and November 1998 they had reached the then all time high of 1500 tonnes per month. Part of this was in response to demand because Australia had increased its exports to Japan at this time. The imports put a ceiling on domestic prices at a time they would normally have been expected to increase. This impacted on the Australian market in early 1999 but by mid 1999 prices had recovered (Figure eight). During this time imports of pork were steadily increasing (Figure seven) and changed the dynamics of the price structure. Bacon and leg prices fell but fresh pork (loin chop) prices increased (Figure five). The cyclical nature of pork prices is presented in figures eight and nine. In 1996 an outbreak of Foot and Mouth Disease in Taiwan created a window of opportunity to supply Japan with additional pork. In 1998, Nipah virus caused the death of an abattoir slaughterman in Singapore and the deaths of about 105 people in Malaysia. An opportunity to supply the Singapore market with fresh meat was seized and exports increased over the period to May 2003, peaking at 70,000 tonnes annually (Figure nine) and with the positive terms of trade the Australian herd size increased from about 300,000 sows in 2001 to about 350,000 sows in 2003.
9

With declining terms of trade associated with dry years, high feed prices and an appreciating Australian currency value between 2001–2004 (Figure 11) exports fell, imports peaked in 2005 and the national herd size fell. Producers continue to leave the industry but whereas in the past the sow numbers were quickly made up by those remaining, in 2004 and 2005 the national herd size dropped to 318,000 sows. Figure three: Increasing slaughter weight of pigs over the period from 1980–2005 Source: Dowling 2006
50
55
60
65
70
75
80
80 81 82 83 84 85 86 87 88 89 90 91 92 93 94 95 96 97 98 99 00 01 02 03 04 05
Kgs
Average Slaughter Weight 12-Month Moving Average
Figure four: Relative profitability pig/grain price ratio. Base year 1989-90. Source: Dowling 2006
0.0
0.2
0.4
0.6
0.8
1.0
1.2
1.4
1.6
1.8
2.0
72 74 76 78 80 82 84 86 88 90 92 94 96 98 00 02 04
Pig
/Gra
in P
rice
Rat
io
Base Month = 1989/90
10
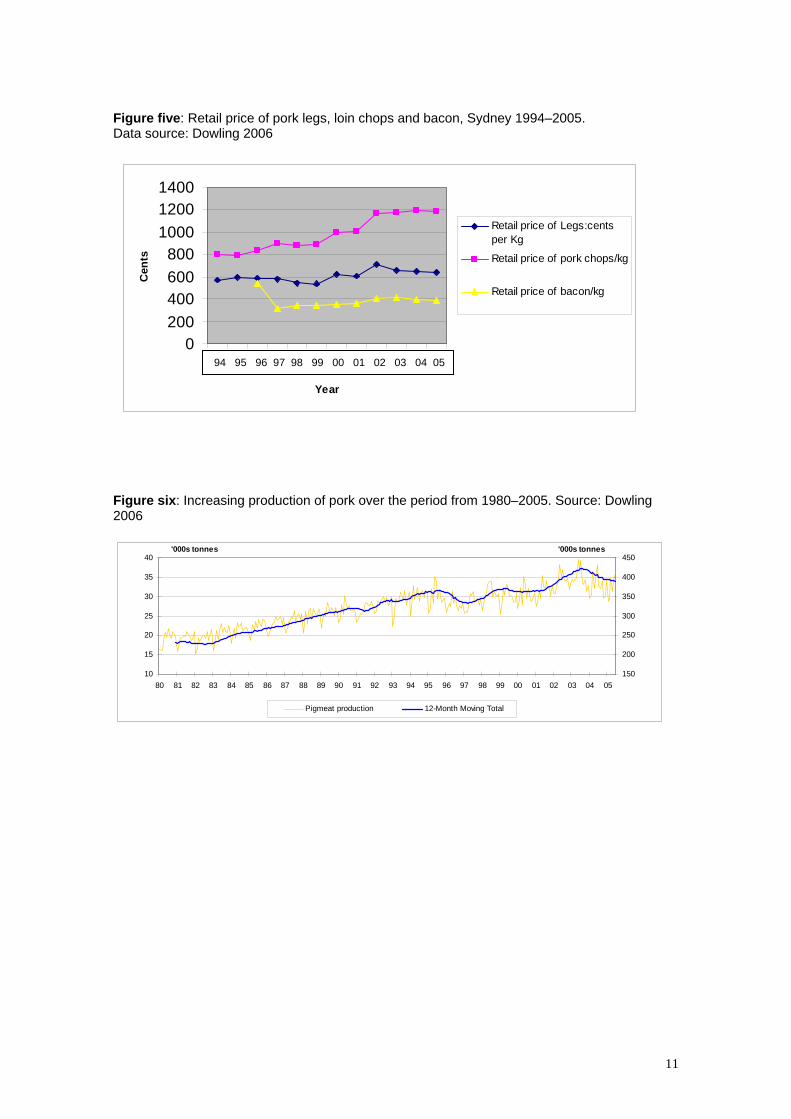
Figure five: Retail price of pork legs, loin chops and bacon, Sydney 1994–2005. Data source: Dowling 2006
0200400600800
100012001400
Cen
ts
Retail price of Legs:centsper Kg
Retail price of pork chops/kg
Retail price of bacon/kg
Figure six: In2006
10
15
20
25
30
35
40
80 81 8
'000s t
1 3 5 7 9 11 94 95 96 97 98 99 00 01 02 03 04 05
Year
creasing production of pork over the period from 1980–2005. Source: Dowling
2 83 84 85 86 87 88 89 90 91 92 93 94 95 96 97 98 99 00 01 02 03 04 05
onnes
150
200
250
300
350
400
450'000s tonnes
Pigmeat production 12-Month Moving Total
11
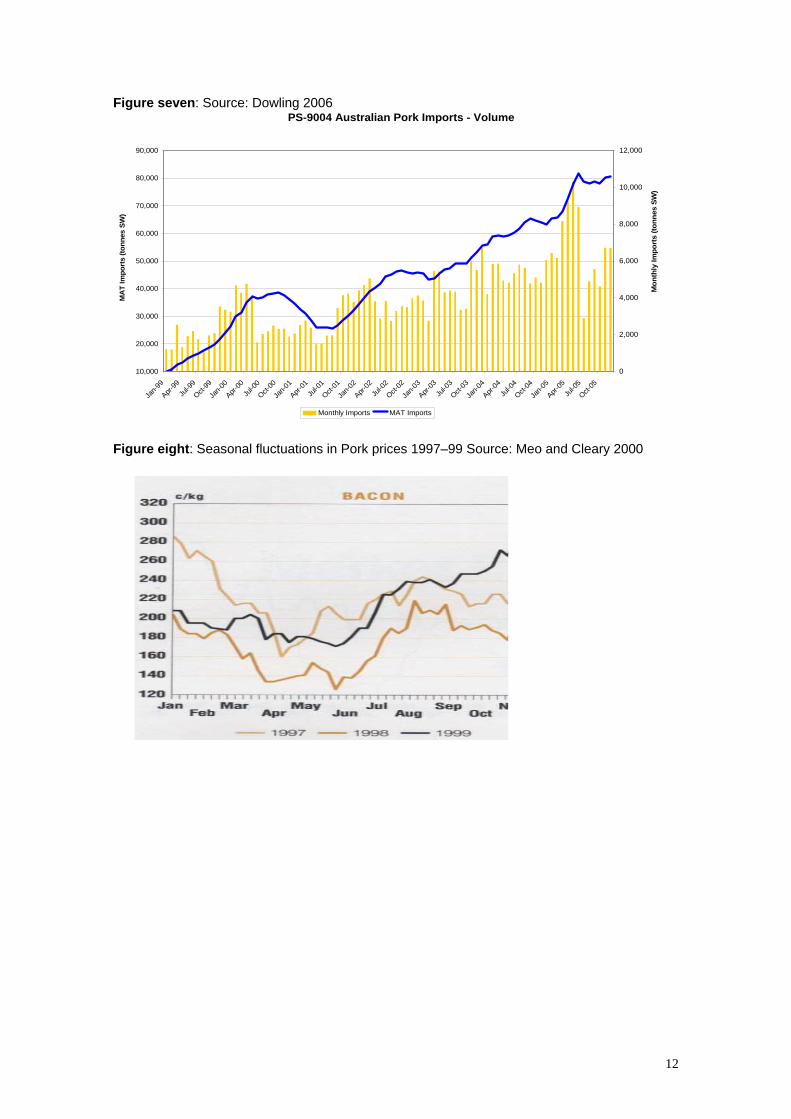
Figure seven: Source: Dowling 2006 PS-9004 Australian Pork Imports - Volume
10,000
20,000
30,000
40,000
50,000
60,000
70,000
80,000
90,000
Jan-9
9
Apr-99
Jul-9
9
Oct-99
Jan-0
0
Apr-00
Jul-0
0
Oct-00
Jan-0
1
Apr-01
Jul-0
1
Oct-01
Jan-0
2
Apr-02
Jul-0
2
Oct-02
Jan-0
3
Apr-03
Jul-0
3
Oct-03
Jan-0
4
Apr-04
Jul-0
4
Oct-04
Jan-0
5
Apr-05
Jul-0
5
Oct-05
MA
T Im
port
s (to
nnes
SW
)
0
2,000
4,000
6,000
8,000
10,000
12,000
Mon
thly
Impo
rts
(tonn
es S
W)
Monthly Imports MAT Imports
Figure eight: Seasonal fluctuations in Pork prices 1997–99 Source: Meo and Cleary 2000
12

Figure nine: Prices 2003–2005 Source: Dowling 2006
Figure 10: Australian pigmeat exports 1999–2005 Source: Dowling 2006
Figure 11: Changes in the value of the Australian dollar. Source: Baker and Barber (2004).
13
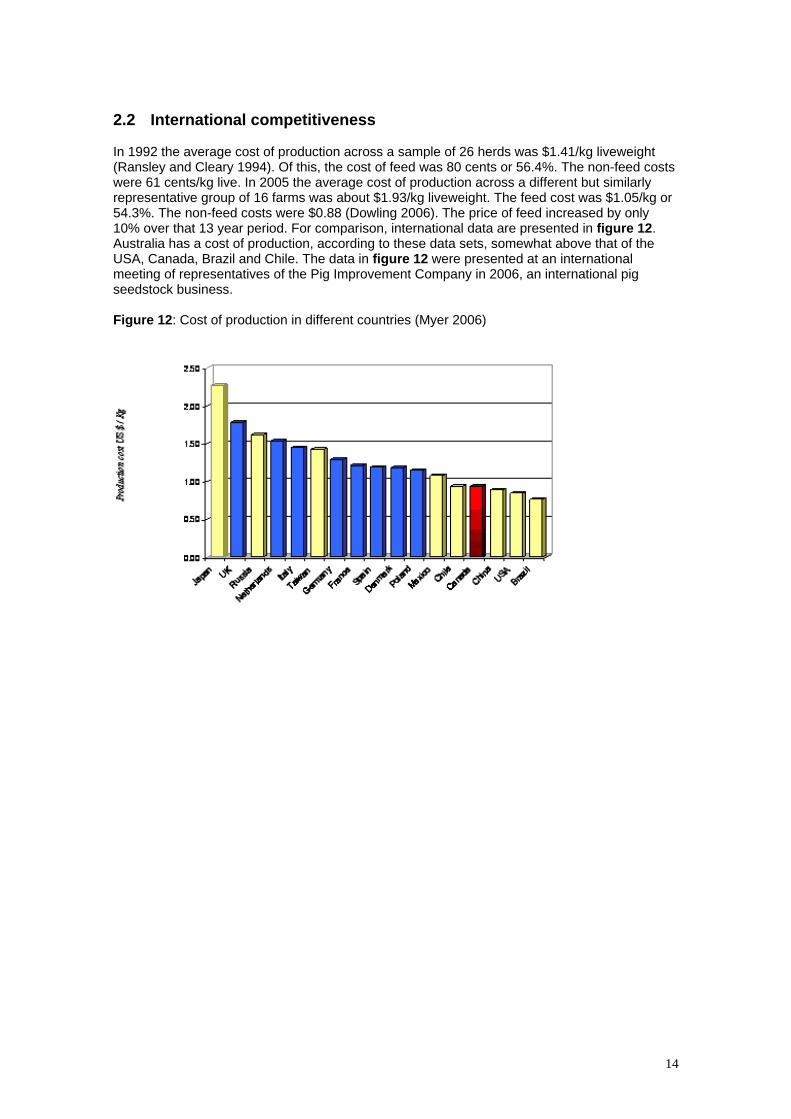
2.2 International competitiveness In 1992 the average cost of production across a sample of 26 herds was $1.41/kg liveweight (Ransley and Cleary 1994). Of this, the cost of feed was 80 cents or 56.4%. The non-feed costs were 61 cents/kg live. In 2005 the average cost of production across a different but similarly representative group of 16 farms was about $1.93/kg liveweight. The feed cost was $1.05/kg or 54.3%. The non-feed costs were $0.88 (Dowling 2006). The price of feed increased by only 10% over that 13 year period. For comparison, international data are presented in figure 12. Australia has a cost of production, according to these data sets, somewhat above that of the USA, Canada, Brazil and Chile. The data in figure 12 were presented at an international meeting of representatives of the Pig Improvement Company in 2006, an international pig seedstock business. Figure 12: Cost of production in different countries (Myer 2006)
14
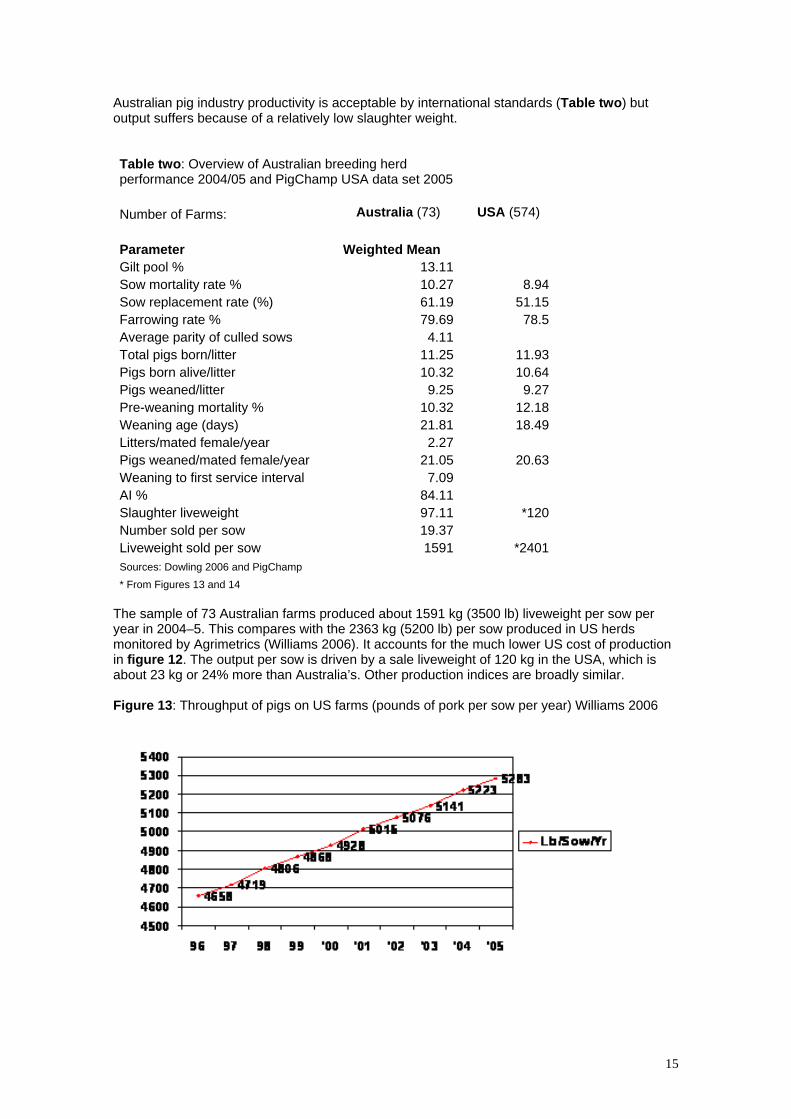
Australian pig industry productivity is acceptable by international standards (Table two) but output suffers because of a relatively low slaughter weight. Table two: Overview of Australian breeding herd performance 2004/05 and PigChamp USA data set 2005 Number of Farms: Australia (73) USA (574) Parameter Weighted Mean Gilt pool % 13.11 Sow mortality rate % 10.27 8.94Sow replacement rate (%) 61.19 51.15Farrowing rate % 79.69 78.5Average parity of culled sows 4.11Total pigs born/litter 11.25 11.93Pigs born alive/litter 10.32 10.64Pigs weaned/litter 9.25 9.27Pre-weaning mortality % 10.32 12.18Weaning age (days) 21.81 18.49Litters/mated female/year 2.27Pigs weaned/mated female/year 21.05 20.63Weaning to first service interval 7.09AI % 84.11Slaughter liveweight 97.11 *120Number sold per sow 19.37Liveweight sold per sow 1591 *2401Sources: Dowling 2006 and PigChamp * From Figures 13 and 14
The sample of 73 Australian farms produced about 1591 kg (3500 lb) liveweight per sow per year in 2004–5. This compares with the 2363 kg (5200 lb) per sow produced in US herds monitored by Agrimetrics (Williams 2006). It accounts for the much lower US cost of production in figure 12. The output per sow is driven by a sale liveweight of 120 kg in the USA, which is about 23 kg or 24% more than Australia’s. Other production indices are broadly similar. Figure 13: Throughput of pigs on US farms (pounds of pork per sow per year) Williams 2006
15

Figure 14: Average saleweight of pigs in the United States (pound [lb] liveweight) Williams 2006
As a general rule the long term price of grain is declining at about 3% per year in real terms. In 1980, the price of wheat was about $US176 and in 2005 $US181/tonne (USDA 2006). While this may be true, the periods of high feed prices associated with drought or difficult seasons provide short term uncertainty. In 2006, a drought year, the price of feed wheat immediately after harvest was $US250.00 compared to $US170/tonne the year before. In March 2007 the price of wheat was $US310/tonne. In 1992, producers earned about $US220 c/kg (hot standard carcase weight). In 2005 they earned about $US260c/kg (Figure 15). Allowing for an average rate of inflation of 2% over this period (Unicef 2006) pig prices have not kept pace with the rate of inflation. Figure 15: Farm gate price trends.
Farm gate price of bacon pigs in Victoria 1992–2005 (cents per kilogram hot standard carcase weight)
( )
0
50
100
150
200
250
300
350
1 2 3 4 5 6 7 8 9 10 11 12 13 14 92 93 94 95 96 97 98 99 00 01 02 03 04 05
(Compiled by the authors from Pigstats 1992–2001 and Dowling 2006) The pig to grain price ratio (Figure four) demonstrates fluctuations around an average ratio of about 1.0. From 1990 to 2004 there have been more years of relatively higher profitability than in the 18 years before. Australian pork prices are presented in figure 15. By comparison, USA pork prices were about $2.24 (AUD) per kg for carcase weights in excess of 105kg — roughly the same as Australia’s price for pigs sold into the Japanese market.
16
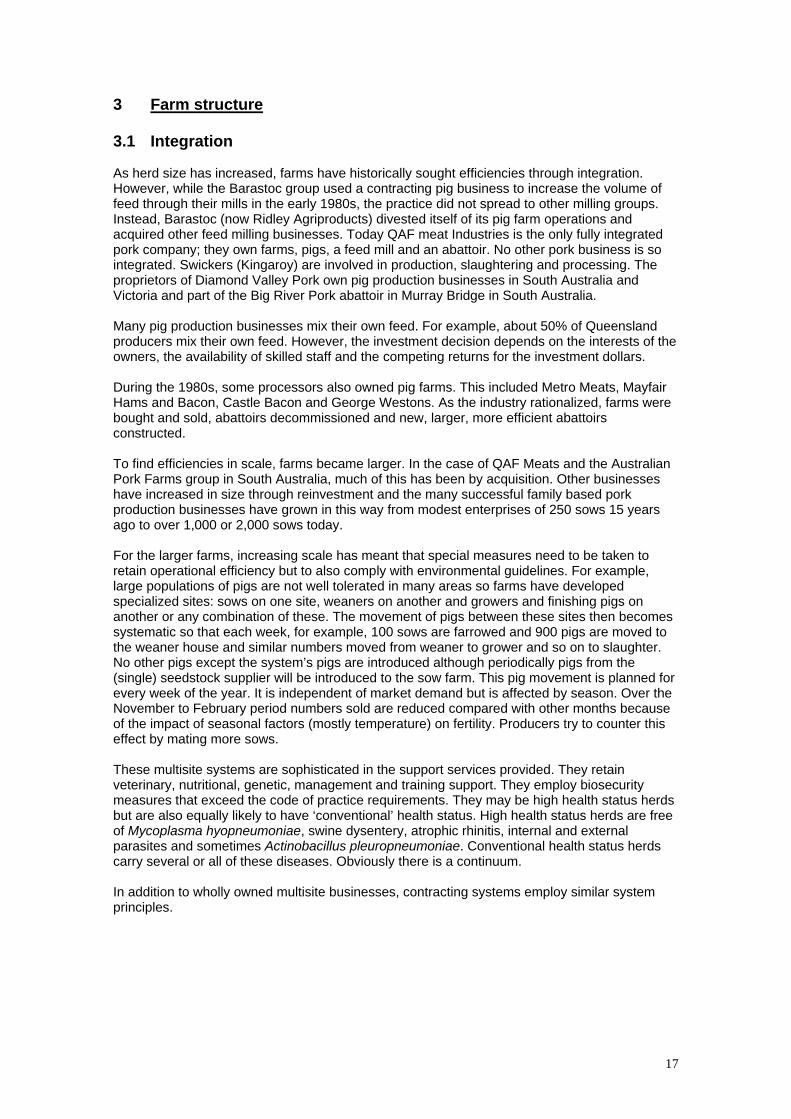
3 Farm structure 3.1 Integration As herd size has increased, farms have historically sought efficiencies through integration. However, while the Barastoc group used a contracting pig business to increase the volume of feed through their mills in the early 1980s, the practice did not spread to other milling groups. Instead, Barastoc (now Ridley Agriproducts) divested itself of its pig farm operations and acquired other feed milling businesses. Today QAF meat Industries is the only fully integrated pork company; they own farms, pigs, a feed mill and an abattoir. No other pork business is so integrated. Swickers (Kingaroy) are involved in production, slaughtering and processing. The proprietors of Diamond Valley Pork own pig production businesses in South Australia and Victoria and part of the Big River Pork abattoir in Murray Bridge in South Australia. Many pig production businesses mix their own feed. For example, about 50% of Queensland producers mix their own feed. However, the investment decision depends on the interests of the owners, the availability of skilled staff and the competing returns for the investment dollars. During the 1980s, some processors also owned pig farms. This included Metro Meats, Mayfair Hams and Bacon, Castle Bacon and George Westons. As the industry rationalized, farms were bought and sold, abattoirs decommissioned and new, larger, more efficient abattoirs constructed. To find efficiencies in scale, farms became larger. In the case of QAF Meats and the Australian Pork Farms group in South Australia, much of this has been by acquisition. Other businesses have increased in size through reinvestment and the many successful family based pork production businesses have grown in this way from modest enterprises of 250 sows 15 years ago to over 1,000 or 2,000 sows today. For the larger farms, increasing scale has meant that special measures need to be taken to retain operational efficiency but to also comply with environmental guidelines. For example, large populations of pigs are not well tolerated in many areas so farms have developed specialized sites: sows on one site, weaners on another and growers and finishing pigs on another or any combination of these. The movement of pigs between these sites then becomes systematic so that each week, for example, 100 sows are farrowed and 900 pigs are moved to the weaner house and similar numbers moved from weaner to grower and so on to slaughter. No other pigs except the system’s pigs are introduced although periodically pigs from the (single) seedstock supplier will be introduced to the sow farm. This pig movement is planned for every week of the year. It is independent of market demand but is affected by season. Over the November to February period numbers sold are reduced compared with other months because of the impact of seasonal factors (mostly temperature) on fertility. Producers try to counter this effect by mating more sows. These multisite systems are sophisticated in the support services provided. They retain veterinary, nutritional, genetic, management and training support. They employ biosecurity measures that exceed the code of practice requirements. They may be high health status herds but are also equally likely to have ‘conventional’ health status. High health status herds are free of Mycoplasma hyopneumoniae, swine dysentery, atrophic rhinitis, internal and external parasites and sometimes Actinobacillus pleuropneumoniae. Conventional health status herds carry several or all of these diseases. Obviously there is a continuum. In addition to wholly owned multisite businesses, contracting systems employ similar system principles.
17
Part of the QAF multisite system at Gre Gre Victoria
3.2 Farrow-to-finish This is the conventional structure of intensive pig farms. In this model the farm breeds, farrows, weans and grows out its own pigs for sale. As herd size has increased some businesses have been constrained by space or environmental regulation so farms have been divided into breeder units and grower units. Day-to-day operations on a farrow-to-finish farm A farm producing about 200 pigs per week requires a herd size of about 550 sows. It will farrow about 21 sows per week. To do this, it will mate about 28–30 sows every week depending on how severe the impact of seasonal infertility is on the herd. To meet this mating target, it will keep a pool of as many as 80 gilts on hand. These will be sourced about every 8–12 weeks from an external high health status multiplication herd as parent gilts. They could also be produced on-farm by a group of maternal line sows comprising about 10% of the sow herd. Their job within the herd is to supply replacement breeding stock. The maternal line sows are introduced in small numbers three to four times during the year. The genetic make up of the replacement gilts is a key element in the long term output and performance of the herd. The sows will, in most cases, be joined by AI to a terminal sire line boar but most herds still keep some boars. If the gilts are sourced externally and the herd is M hyopneumoniae free, they will likely spend about eight weeks in quarantine to reduce the risk of introducing this pathogen into the herd. If the herd is infected with M hyopneumoniae then a four week period of quarantine before entry to the main herd is the norm. About 85% of the national herd is infected with M hyopneumoniae. Over the last 40 years, the farms that have remained in the pig industry have grown and they have increased herd efficiency by increasing scale and slaughter weight. Their owners have progressively renovated growing sheds and turned them into sow housing or built new farrowing houses and turned the old ones into other housing, usually for sows. In addition they have built new farrowing houses, weaner houses and growing houses. In the last ten years they have built straw-based shelters and while they were cheap to build they were expensive in terms of the cost of bedding so that the overall cost of production was little different to conventional facilities. They were also more difficult to manage, especially when it came to sorting pigs for sale and looking after sick pigs. Many owners have taken advantage of recent profitable trading terms to restock their herds with high health status breeding stock drawn from one of three or four major suppliers that meet their health status specification. Alternatively, other producers have eliminated M hyopneumoniae using the technique of ‘Swiss depopulation’, where the growing herd is depopulated and the sow herd medicated. This has increased herd feed efficiency and herd output and also reduced the cost of medications. It has also made these producers more biosecurity conscious.
18

Profitability of these farms is driven by feed efficiency, the cost of feed, genetic improvement and health status. But before any of these elements can be exploited the pigs have to be mated each week. To mate 28–30 sows each week requires a pool of gilts — about 42–48 a week. For example, if 21 sows are weaned about seven will be culled for age or performance. That means 14–16 gilts have to be mated. To have that many on heat each week the unit needs 42–48 of the right age and weight available and cycling. Mate them too young and litter size suffers. To make sure there are enough coming through the herd needs a further three weeks supply of gilts. As a general rule a farm needs 12–15% of the sow herd as replacement breeding stock and it is this demand that fuels the movement of pigs from seedstock herd to commercial farm. Semen is delivered once or twice a week. It has a life of about five days but fertility is highest for the first three days. Some farms collect and process their own semen on site twice a week. The use of AI has significantly reduced the movement of male breeding stock from seed supply stock to commercial herds. Most herds are using AI matings for about 80–100% of their sows. Cull sows are sold weekly. Mostly they are sold direct to slaughter but significant numbers are sold through regional saleyards. Turnover rate is high on Australian farms. The average sow replacement rate for a sample of 73 farms was 61% per year (Dowling 2006). The gilt pool drives the overall herd performance. It is the limiting factor for the number of matings and hence output and profit. Gilt litter size drives long term herd litter size. Gilts are also the biggest risk to the herd’s health status because they are introduced from another farm. This can be as often as every month but on high health status farms it is about every eight weeks to allow for an extended quarantine period. Boars are introduced at the same time as gilts. In any one week the sows are weaned on Wednesday or Thursday. If they are weaned after a lactation length of about 28 days they will be on heat about 4–5 days later. If they are weaned after a lactation of about 21 days they will be on heat 5–6 days later. Hence the sows generally come into heat on Monday or Tuesday. By Thursday the farm, assuming there have been enough gilts in the system, should have met its weekly mating budget. During gestation the sows are fed a ‘dry’ sow diet. They are housed in stalls or pens or both for gestation and enter the farrowing house on the Thursday or Friday of the week before they are due to farrow. They are confined almost without exception in some sort of farrowing crate in a purpose-built farrowing house. This usually includes some form of temperature control system. With the exception of erysipelas which occurs from time to time, infectious disease in sows during gestation or in neonatal pigs at term is unusual. After farrowing, the pigs are processed. On some farms this just means docking their tails and administering iron injections but on others their teeth are clipped and ears notched as well. On most farms the pigs are treated prophylactically at 4–5 days of age for coccidiosis with toltrazuril. Common infectious diseases in the farrowing house include enterotoxigenic E coli, Glasser’s disease and Streptococcus suis. The last two usually occur more in the weaner house but they start in the younger age groups. Coccidial organisms (Isospora suis) are nearly always present but usually controlled. Pigs are commonly weaned at 3–4 weeks of age but on some farms they are weaned at two weeks. Whether they are on a single site farrow-to-finish farm or a multisite farm they are weaned into a purpose-built weaner house or straw bedded shelter. They are fed a weaner diet, usually with an antimicrobial to control proliferative enteritis. Alternatively water medication may be used to control post weaning E coli infections soon after weaning and proliferative enteritis at about 7–10 weeks of age. On sow farms a live vaccine is often added to water to control Lawsonia intracellularis. Space allowances are usually set ahead of the welfare code to optimize growth performance. Group sizes depend on the facility. They range from as many as 1000 to as few as 15–20 pigs per pen. On some farms the pen is the shed or shelter.
19

The best performance occurs in facilities that are operated on an all-in all-out basis. This is because the facilities are easily cleaned and temperature controlled to a range that suits the needs of all the pigs more than anything to do with disease spread. The most important diseases after weaning include post weaning enterotoxigenic E coli, Glasser’s disease, streptococcal septicaemia, proliferative enteritis (Lawsonia intracellularis), erysipelas, Mycoplasma hyopneumoniae, Actinobacillus pleuropneumoniae and Brachyspira hyodysenteriae. Internal and external parasites are present on many farms but rarely cause problems. By 8–10 weeks of age the pigs move to a grower facility. More space per pig is provided and the diets change again. Males and females will be usually separated at this stage if they haven’t already. Many farms of this size will operate on all-in all-out principles. In high health status herds, antimicrobial additives will have been removed but water medications for proliferative enteritis may be used. Depending on the farm practices the pigs will remain in this group until they are sold. The first heavy pigs for sale are removed at about 18 weeks of age. If the pigs are housed in straw based shelters as growers on some farms they will be moved to a larger shelter or the group split at about 16–18 weeks. At about 16 weeks of age, cull pigs recognized as having reached a sale weight will be sold. About 5% of pigs are sold at these lighter weights. Alternatively they may be kept as a group until about 18 weeks of age when the heaviest pigs are sold and the remainder moved and held in conventional concrete floored facilities in small groups until they are sold — usually over the next two-three weeks. The pigs are transported, usually early in the morning, for slaughter the same day. Where significant distances are travelled the pigs will be rested in lairage for 12 hours and killed the next day. About 50–60% of Australia’s production is grown under the umbrella of the Australian Pork Industry Quality Assurance program and the corresponding physical, chemical, biological, management, welfare and biosecurity standards. 3.3 Weaner producers Weaner farms are popular for contracting businesses. The profitability of a farm producing just weaner pigs is lower than one selling finishing pigs so it is unusual for people who own both their pigs and buildings to produce only weaner pigs. Weaner production systems lend themselves well to contracting. They require a high degree of husbandry skill and their profitability rests heavily on the herd’s reproductive performance. On specialist weaner farms, there are usually purpose-built, environmentally-controlled facilities. Properly designed, these purpose-built facilities provide the best efficiency and performance but small deficiencies easily cause problems. Some producers have solved this by providing straw-based shelters with plenty of bedding as a substitute for complex temperature control engineering. Others have provided low cost weaner hutches and created a microclimate for young pigs in buildings that once housed growing pigs. In general, the quality of a building should predict performance but this doesn’t always apply. On a specialist weaner farm, pigs will most likely be moved into all-in all-out rooms or sheds each week. On some farms, the rooms may be filled over a two week period but the shed emptied all at once. Some farms run on a batch basis and the whole site is filled at the same time. On the largest farms in Australia, pigs are moved onto the weaner site from two to three sow farms or breeder sites. It is preferable for the sow sites to have the same health status but this is not always possible. The best results are seen where the pigs from health status-compatible sow farms are
20

reared in the same weaner houses. On the largest farms, as many as 6–8,000 pigs are shipped in each week. It’s all a matter of scale. The number shipped reflects the size of the breeding herds and the number of weaner facilities engaged. They are rarely all designed together but reflect disparate expansion, the requirements for additional space, competing financial constraints, a mix of business models and a mix of production models employing, sometimes all at once, farrow-to-finish, multisite and batch production approaches. Clearly, as production scale increases, the disease risk increases through management complexity, human error, constraints on resources (such as cleaned trucks) and the proximity of farms to one another.
Weaners in an ecoshelter in Queensland. This unit operates as a separate weaner site and draws pigs from two sow farms
3.4 Finisher producers After their period in the weaner house, the pigs are moved to the grower site where they are grown out until sale. The preferred housing is based on all-in all-out systems. Straw bedded shelters lend themselves well to these systems. One shelter for 200–400 pigs works well but there are still problems with sorting the animals in these group sizes for sale. Because of the behaviours associated with housing large numbers of entire male pigs together, feed efficiency and mortality rates can be adversely affected. Finisher farm sites lend themselves well to contracting schemes. They are often situated on grain farms that have space, surplus labour and can use the effluent on crops. They resemble the design and layouts and financial arrangements of similar contracting arrangements elsewhere in the world. 3.5 Multisite production There are relatively few multisite operations in Australia. They are present in some parts of Queensland where herds are expanding and in Victoria as part of the QAF group. Their advantage lies in scale but this is also a disadvantage if the pigs have to be drawn from several breeder sites of different health status. Multisite operations have arisen because of a perceived opportunity to improve efficiency through scale, disease control and feeding practices. Unfortunately the multisite systems have not delivered against this potential. While they have solved some problems regarding land availability, environmental management or resource allocation they have not delivered on the health objectives and herds have managed to become infected with nearly all of the common diseases of pigs in Australia, with the possible exception of atrophic rhinitis, leptospirosis and mange. 3.6 Contracting arrangements In 2005 there were 472 producers in contracting arrangements (Table three). Their numbers decreased from 483 in 2004. The numbers of contractors in NSW and Victoria fell but the numbers of contractors increased from about 135 to 205 in Queensland. The precise
21

arrangements vary but, in brief, one party provides the labour and housing facilities and the other provides the feed, the pigs, technical knowledge and sells or slaughters the pigs. Some contracting schemes pay a set weekly amount while others pay bonuses dependent on feed efficiency and deaths. The size of contract farms varies. Outside of QAF, the biggest breeder sites produce about 400 weaners per week. The biggest finisher sites produce about 400 finishers a week. The biggest group involved in contracting is the QAF group in southern NSW and Victoria. QAF transports semen from their own in-house semen centre to their contract breeder herds. They transport gilts from their multiplication herds operated under contract to their contract breeder sites. There is regular movement of animals and semen across the breadth of their production enterprise. The health status of the herds varies so, to preserve the health advantage, complex biosecurity arrangements are in place. They have been generally successful in limiting disease spread. Porcine myocarditis virus did not spread outside the initially infected herds at QAF. While Mycoplasma hyopneumoniae has spread to previously-non-infected farms via aerosols, swine dysentery, A. pleuropneumoniae and internal and external parasites have not. Table Three: Pig farms and herd sizes by state 2005 2005 2005 2005 2005 2005
Contract growers 1 to 49 50 - 99
100 - 499
500 - 999 1,000 +
Total
NSW Sows 4,074 3,296 20,160 5,229 57,217 89,976 Establishments 114 325 50 103 7 13 612VIC Sows 3,433 2,817 14,412 10,378 35,261 66,301 Establishments 47 293 42 54 16 11 463QLD Sows 3,684 3,917 20,266 8,635 42,813 79,315 Establishments 205 259 52 83 11 17 627SA Sows 4,623 1,451 15,561 6,917 24,083 52,635 Establishments 63 229 22 73 11 8 406WA Sows 1,677 2,033 10,113 5,696 18,952 38,471 Establishments 25 115 30 46 9 6 231TAS Sows 342 337 1,389 2,068 Establishments 15 25 5 5 50NT Sows 3 362 362 Establishments 2 1 1 4
Australia Sows 17,836 13,852 82,262 36,855 178,326 329,131 Establishments 472 1,248 201 365 54 55 2,395
22
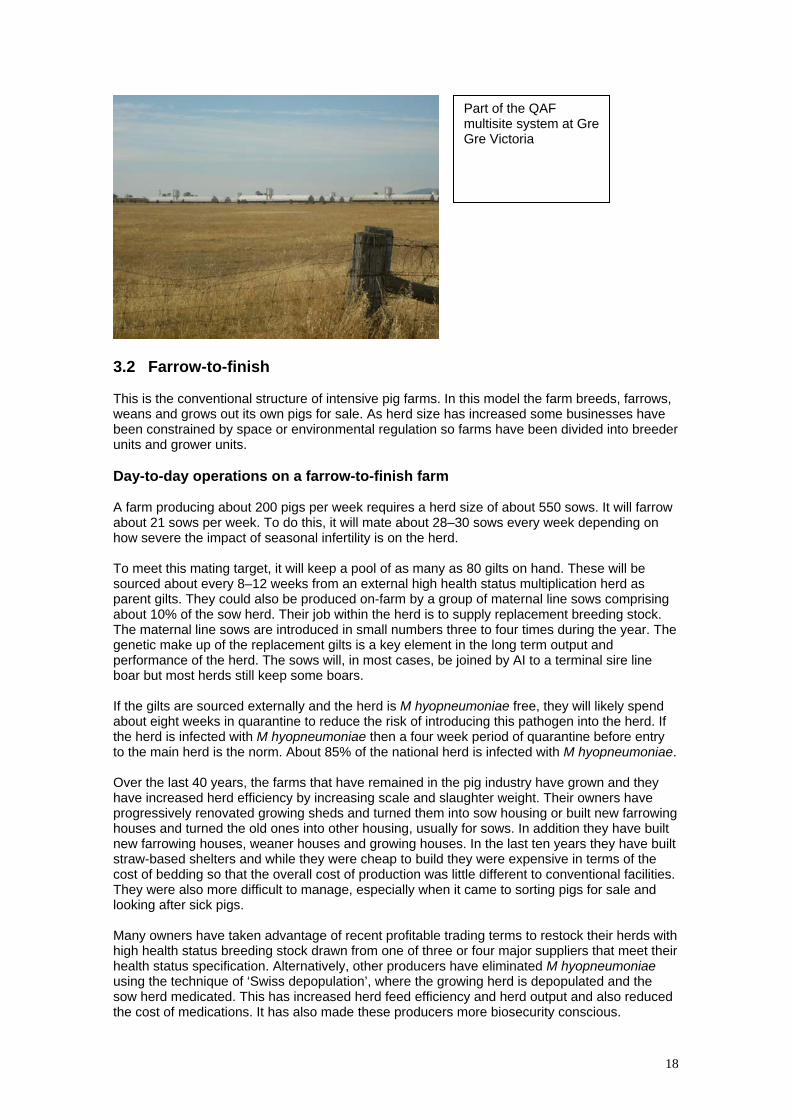
Farrow to finish unit in Qld showing perimeter fencing and the gate which is locked each evening. Feral pigs are prevalent in this area.
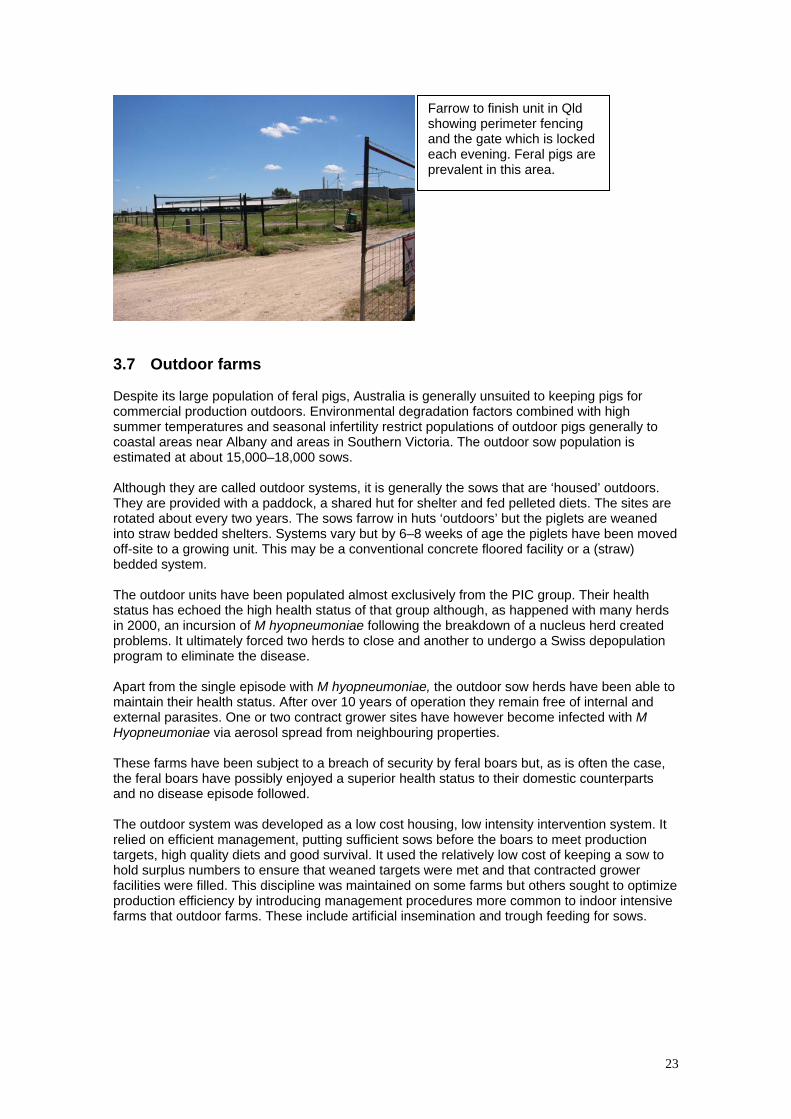
3.7 Outdoor farms Despite its large population of feral pigs, Australia is generally unsuited to keeping pigs for commercial production outdoors. Environmental degradation factors combined with high summer temperatures and seasonal infertility restrict populations of outdoor pigs generally to coastal areas near Albany and areas in Southern Victoria. The outdoor sow population is estimated at about 15,000–18,000 sows. Although they are called outdoor systems, it is generally the sows that are ‘housed’ outdoors. They are provided with a paddock, a shared hut for shelter and fed pelleted diets. The sites are rotated about every two years. The sows farrow in huts ‘outdoors’ but the piglets are weaned into straw bedded shelters. Systems vary but by 6–8 weeks of age the piglets have been moved off-site to a growing unit. This may be a conventional concrete floored facility or a (straw) bedded system. The outdoor units have been populated almost exclusively from the PIC group. Their health status has echoed the high health status of that group although, as happened with many herds in 2000, an incursion of M hyopneumoniae following the breakdown of a nucleus herd created problems. It ultimately forced two herds to close and another to undergo a Swiss depopulation program to eliminate the disease. Apart from the single episode with M hyopneumoniae, the outdoor sow herds have been able to maintain their health status. After over 10 years of operation they remain free of internal and external parasites. One or two contract grower sites have however become infected with M Hyopneumoniae via aerosol spread from neighbouring properties. These farms have been subject to a breach of security by feral boars but, as is often the case, the feral boars have possibly enjoyed a superior health status to their domestic counterparts and no disease episode followed. The outdoor system was developed as a low cost housing, low intensity intervention system. It relied on efficient management, putting sufficient sows before the boars to meet production targets, high quality diets and good survival. It used the relatively low cost of keeping a sow to hold surplus numbers to ensure that weaned targets were met and that contracted grower facilities were filled. This discipline was maintained on some farms but others sought to optimize production efficiency by introducing management procedures more common to indoor intensive farms that outdoor farms. These include artificial insemination and trough feeding for sows.
23
Outdoor sows. Bacchus Marsh, Victoria
4 Location of Pig Farms, AI Centres and Abattoirs In each state pig production is confined to a relatively few statistical divisions. These are outlined in the following figures and in the tables.
24

25
4.1 Queensland statistical divisions, farms, seed stock producers, abattoirs and
AI centres Figure 16: Queensland Statistical Divisions
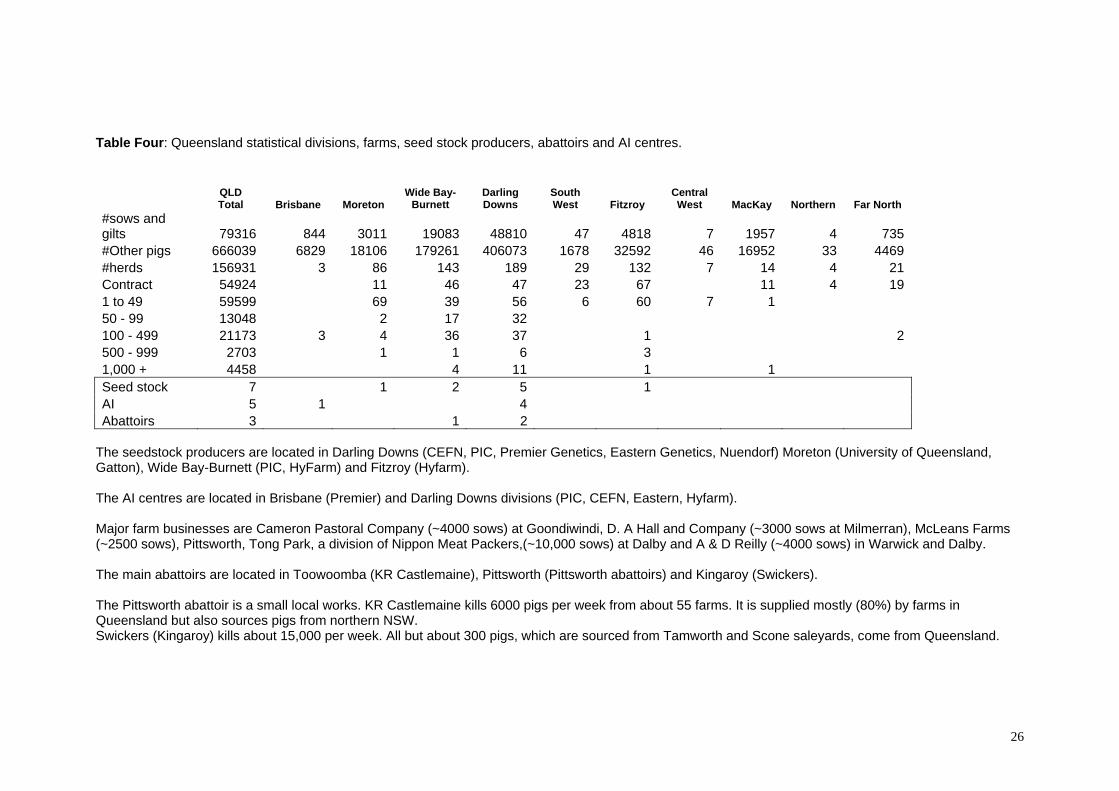
Table Four: Queensland statistical divisions, farms, seed stock producers, abattoirs and AI centres.
QLD Total Brisbane
MoretonWide Bay-
Burnett Darling Downs
South West Fitzroy
Central West MacKay Northern Far North
#sows and gilts 79316 844 3011 19083 48810 47 4818 7 1957 4 735#Other pigs
666039 6829 18106
179261 406073 1678 32592 46 16952 33 4469
#herds 156931 3 86 143 189 29 132 7 14 4 21Contract 54924 11 46 47 23 67 11 4 191 to 49 59599 69 39 56 6 60 7 1 50 - 99 13048 2 17 32 100 - 499 21173 3 4 36 37 1 2500 - 999
2703 1 1 6 3
1,000 + 4458 4 11 1 1Seed stock 7 1 2 5 1 AI 5 1 4 Abattoirs 3 1 2
The seedstock producers are located in Darling Downs (CEFN, PIC, Premier Genetics, Eastern Genetics, Nuendorf) Moreton (University of Queensland, Gatton), Wide Bay-Burnett (PIC, HyFarm) and Fitzroy (Hyfarm). The AI centres are located in Brisbane (Premier) and Darling Downs divisions (PIC, CEFN, Eastern, Hyfarm). Major farm businesses are Cameron Pastoral Company (~4000 sows) at Goondiwindi, D. A Hall and Company (~3000 sows at Milmerran), McLeans Farms (~2500 sows), Pittsworth, Tong Park, a division of Nippon Meat Packers,(~10,000 sows) at Dalby and A & D Reilly (~4000 sows) in Warwick and Dalby. The main abattoirs are located in Toowoomba (KR Castlemaine), Pittsworth (Pittsworth abattoirs) and Kingaroy (Swickers). The Pittsworth abattoir is a small local works. KR Castlemaine kills 6000 pigs per week from about 55 farms. It is supplied mostly (80%) by farms in Queensland but also sources pigs from northern NSW. Swickers (Kingaroy) kills about 15,000 per week. All but about 300 pigs, which are sourced from Tamworth and Scone saleyards, come from Queensland.
26
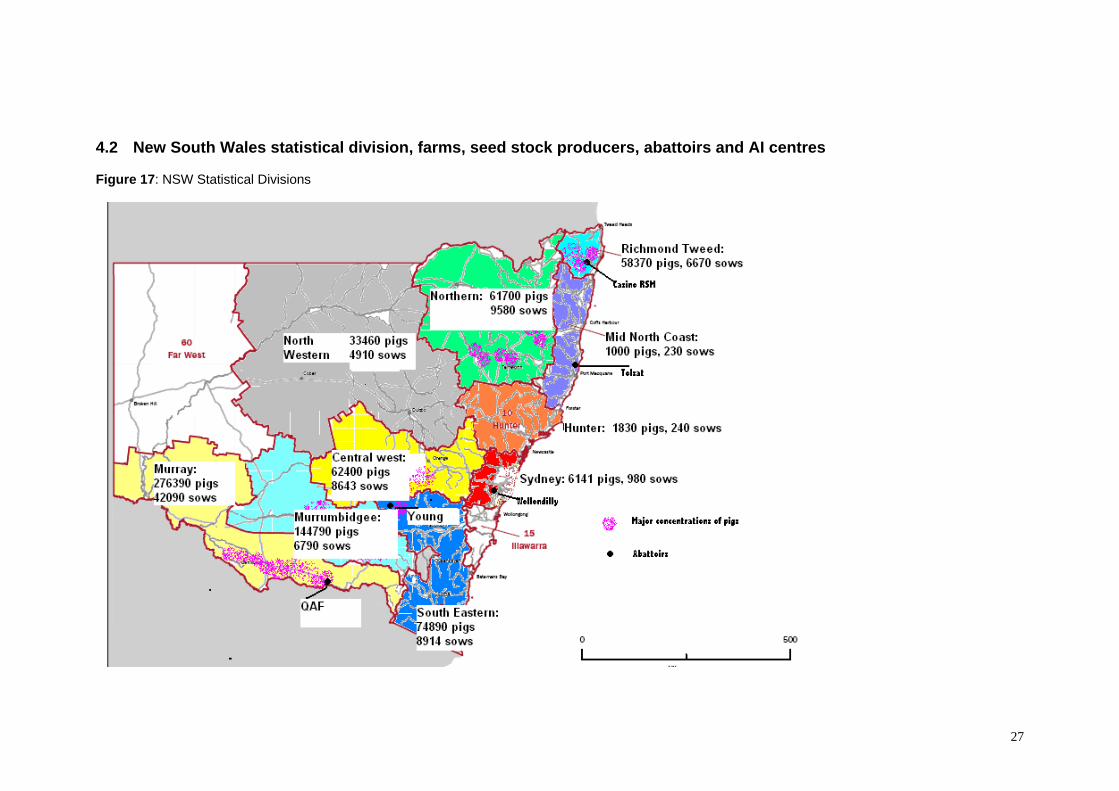
4.2 New South Wales statistical division, farms, seed stock producers, abattoirs and AI centres Figure 17: NSW Statistical Divisions
27

Table five: NSW farms, seed stock producers, abattoirs and AI centres
Abattoirs
Statistical division
NSW Total Sydney
Hunter Illawarra Richmond Mid-North Northern
North West
Central West Sth East Mrrmbgee Murray Far West
#sows and gilts 89894 979 241 838 6671 231 9584 4909 8643 8915 6790 42094 82
#Other pigs 731878 6,142
1,826
5,801
58,372
998 61,702
38,563
62,400
74,891
144,789
276,395 82
#herds 605 5 55 4
70 47 75 57 111 26
101 54Contract 115 2 1 7 43 9 17 5 26 51 to 49 325 54 2 33 39 21 74 10 60 24 8 50 – 99 51 10 4 6 7 4 20 100 - 499 104 2 1 17 18 18 22 13 10 3 500 - 999 7 1 1 2 1 1 1 1,000 + 13 1 3 3 2 1 3 Seedstock 5 1 1 1 1AI 2 1 1
6 1 2 1 1
The main seedstock producers are located near Lismore (Punjab Stud), Narrandera, (PIC), Forbes (Charles Harvey) and Corowa (QAF Meat Industries). The AI centres are located near Narrandera (PIC) and Corowa (QAF). The major producers are QAF with sites at Bungowannah (6,000 sows), Corowa (25,000 sows) and Moulamein (3000 sows), Windridge -Templemore at Young with about 4,000 sows and PIC (Grong Grong near Narrandera) with about 2,500 sows. The main abattoirs are located at Young (Burrangong Meat Processors), Booyong (Casino RSM) and Corowa (QAF). There are also smaller abattoirs at Scone (Primo) and Wollondilly. Burrangong kills about 5,000–7,000 a week. Most of the kill comes from the Windridge-Templemore farms at Young, other NSW farms and a small number come from Victoria. Casino RSM kills about 5,000 pigs a week. These animals are drawn from about 23 farms in southern Queensland (80%) and northern NSW (20%). QAF kills about 20,000 per week. The pigs are drawn from about 40 company sites in Victoria and NSW. No sows are killed in this works. QAF’s sows are killed at Diamond Valley Pork in Melbourne and Big River in Murray Bridge.
28
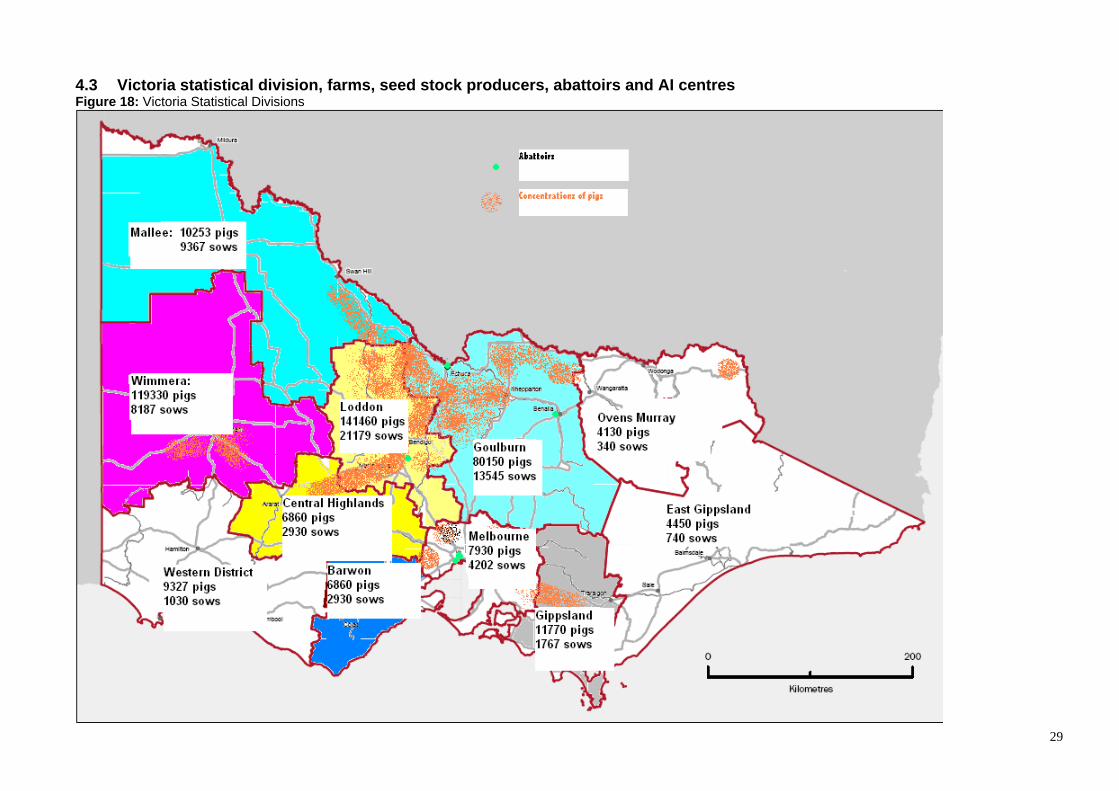
4.3 Victoria statistical division, farms, seed stock producers, abattoirs and AI centres Figure 18: Victoria Statistical Divisions
29
30
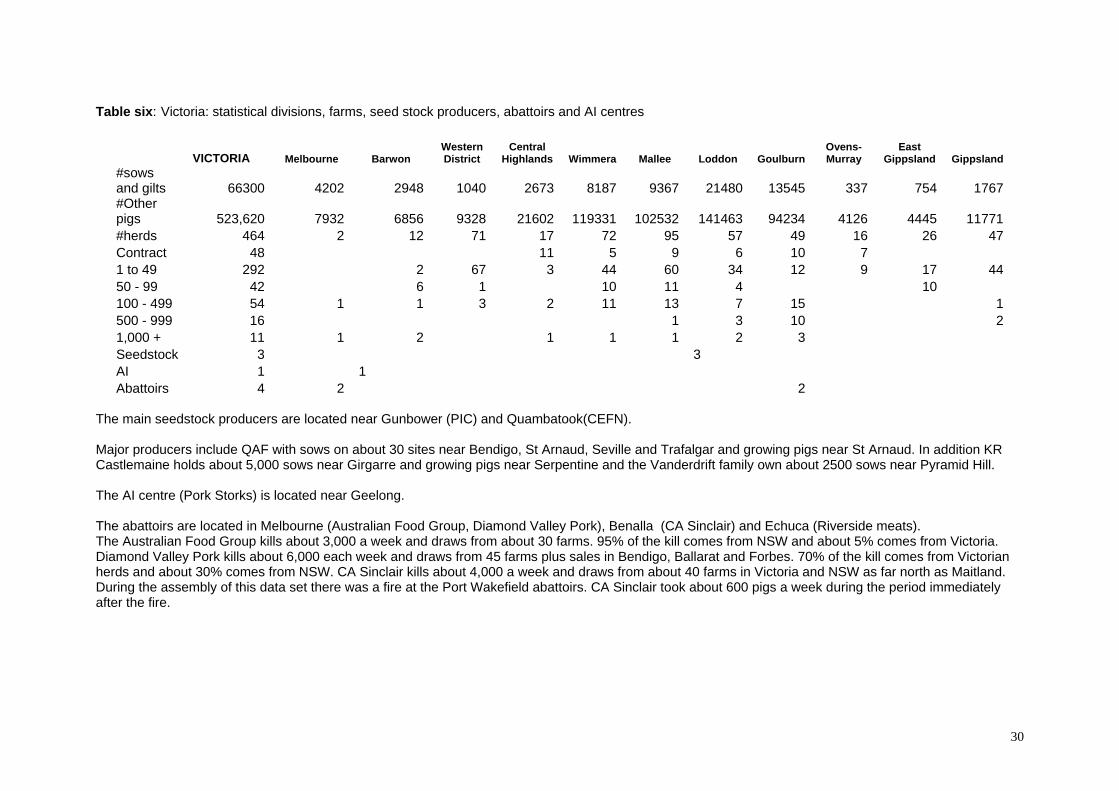
VICTORIA Melbourne Barwon
Western District
Central Highlands Wimmera Mallee Loddon Goulburn
Ovens-Murray
East Gippsland Gippsland
#sows and gilts 66300 4202 2948 1040 2673 8187 9367 21480 13545 337 754 1767 #Other pigs 523,620 7932 6856 9328 21602 119331 102532
141463 94234 4126 4445 11771
#herds 464 2 12 71
17 72 95 57 49 16 26
47 Contract 48 11 5 9 6 10 7
1 to 49 292 2 67 3 44 60 34 12 9 17 44 50 - 99 42 6 1 10 11 4 10 100 - 499 54 1 1 3 2 11 13 7 15 1 500 - 999 16 1 3 10 2 1,000 + 11 1 2 1 1 1 2
3
Seedstock
3 3AI 1 1Abattoirs 4 2 2
Table six: Victoria: statistical divisions, farms, seed stock producers, abattoirs and AI centres
The main seedstock producers are located near Gunbower (PIC) and Quambatook(CEFN). Major producers include QAF with sows on about 30 sites near Bendigo, St Arnaud, Seville and Trafalgar and growing pigs near St Arnaud. In addition KR Castlemaine holds about 5,000 sows near Girgarre and growing pigs near Serpentine and the Vanderdrift family own about 2500 sows near Pyramid Hill. The AI centre (Pork Storks) is located near Geelong. The abattoirs are located in Melbourne (Australian Food Group, Diamond Valley Pork), Benalla (CA Sinclair) and Echuca (Riverside meats). The Australian Food Group kills about 3,000 a week and draws from about 30 farms. 95% of the kill comes from NSW and about 5% comes from Victoria. Diamond Valley Pork kills about 6,000 each week and draws from 45 farms plus sales in Bendigo, Ballarat and Forbes. 70% of the kill comes from Victorian herds and about 30% comes from NSW. CA Sinclair kills about 4,000 a week and draws from about 40 farms in Victoria and NSW as far north as Maitland. During the assembly of this data set there was a fire at the Port Wakefield abattoirs. CA Sinclair took about 600 pigs a week during the period immediately after the fire.

4.4 Tasmania statistical division, farms, seed stock producers, abattoirs and AI centres
Figure 19: Tasmania Statistical Divisions
Table seven: Tasmania statistical divisions, farms, seed stock producers, abattoirs and AI centres Tasmania #sows and gilts 2137 #Other pigs 11,991 #herds 55 Contract 18 1 to 49 42 50–99 7 100–499 5 500–999 0 1,000+ 0 Seedstock 0 AI 0 Abattoirs 1 Tasmania has about 2,137 sows and 12,000 growing pigs. There are no mainstream seedstock producers and no AI centres. There is one small abattoir at Devonport and another at Cressy.
31
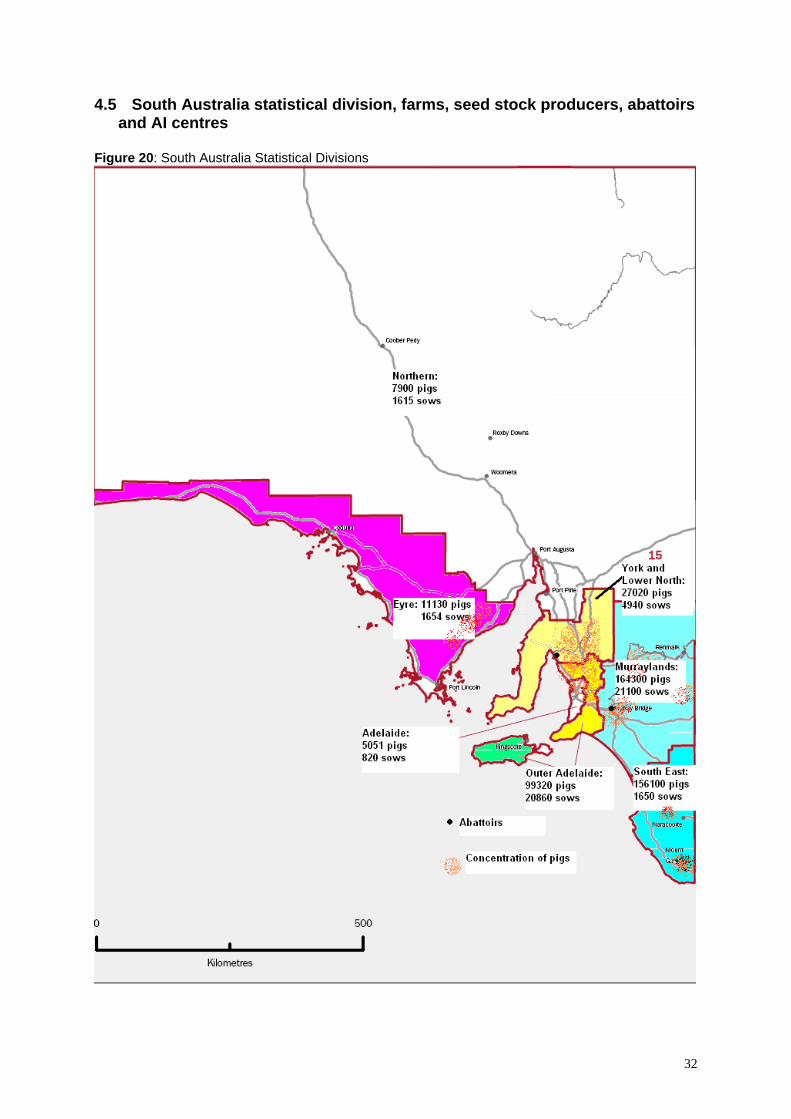
4.5 South Australia statistical division, farms, seed stock producers, abattoirs and AI centres
Figure 20: South Australia Statistical Divisions
32
33
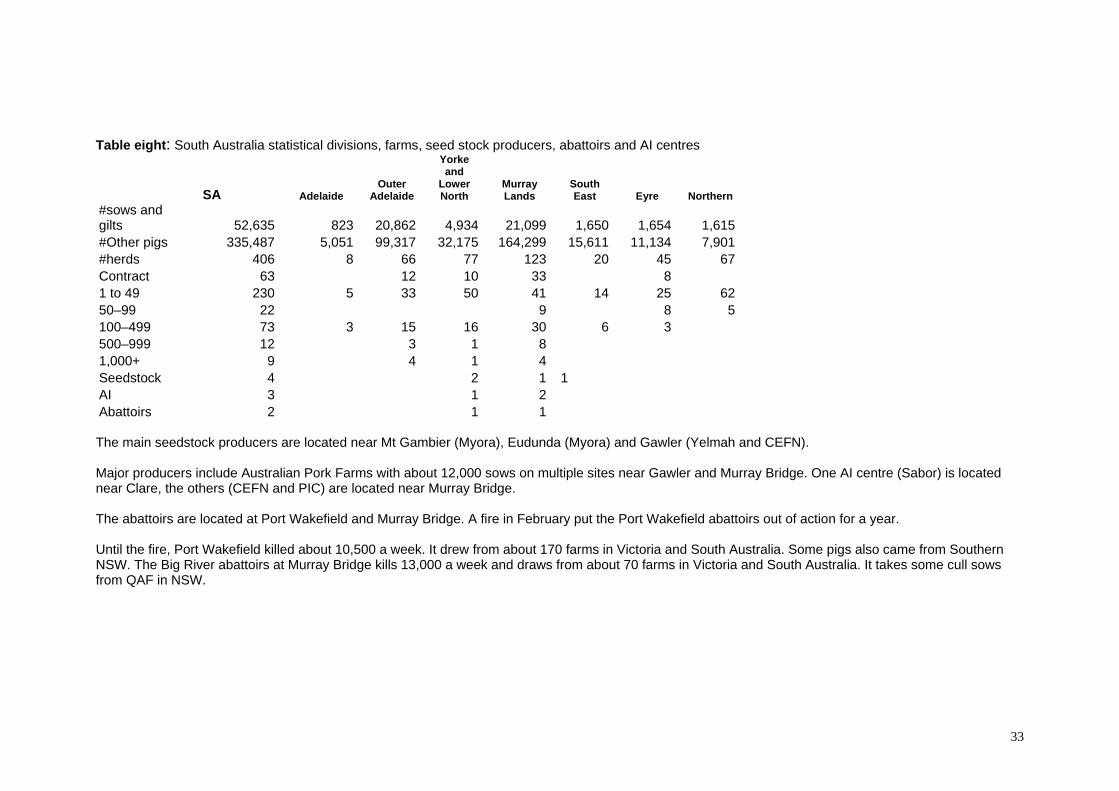
Table eight: South Australia statistical divisions, farms, seed stock producers, abattoirs and AI centres
SA Adelaide Outer
Adelaide
Yorke and
Lower North
Murray Lands
South East Eyre Northern
#sows and gilts 52,635 823 20,862 4,934 21,099 1,650 1,654 1,615#Other pigs 335,487 5,051
99,317 32,175 164,299 15,611 11,134 7,901
#herds 406 8
66 77 123 20 45 67Contract 63 12 10 33 81 to 49 230 5
33 50 41 14 25 62
50–99 22 9 8 5100–499 73 3 15 16 30 6 3500–999 12 3 1 81,000+ 9 4 1 4Seedstock
4 2 1 1
AI 3 1 2Abattoirs 2 1 1 The main seedstock producers are located near Mt Gambier (Myora), Eudunda (Myora) and Gawler (Yelmah and CEFN). Major producers include Australian Pork Farms with about 12,000 sows on multiple sites near Gawler and Murray Bridge. One AI centre (Sabor) is located near Clare, the others (CEFN and PIC) are located near Murray Bridge. The abattoirs are located at Port Wakefield and Murray Bridge. A fire in February put the Port Wakefield abattoirs out of action for a year. Until the fire, Port Wakefield killed about 10,500 a week. It drew from about 170 farms in Victoria and South Australia. Some pigs also came from Southern NSW. The Big River abattoirs at Murray Bridge kills 13,000 a week and draws from about 70 farms in Victoria and South Australia. It takes some cull sows from QAF in NSW.

4.6 Western Australia statistical division, farms, seed stock producers, abattoirs and AI centres
Figure 21: Western Australia Statistical Divisions
34
35
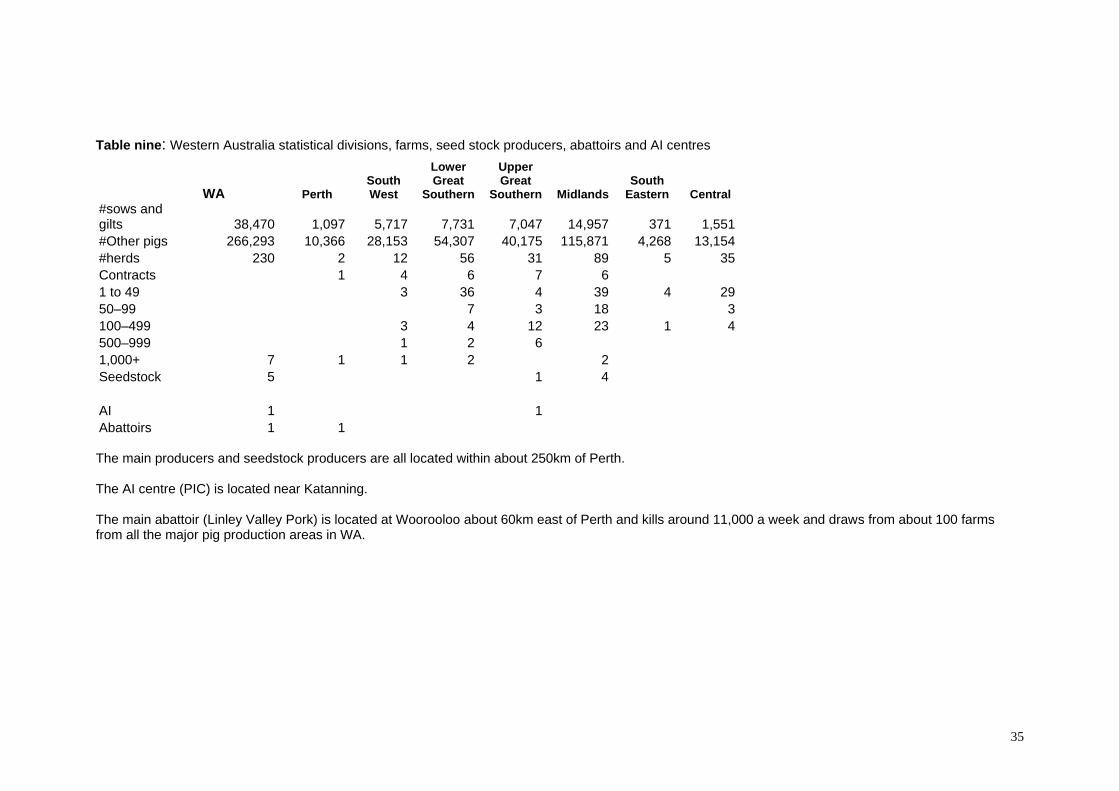
Table nine: Western Australia statistical divisions, farms, seed stock producers, abattoirs and AI centres
WA Perth South West
Lower Great
Southern
Upper Great
Southern MidlandsSouth
Eastern Central #sows and gilts 38,470 1,097 5,717 7,731 7,047 14,957 371 1,551 #Other pigs 266,293 10,366
28,153 54,307 40,175 115,871 4,268 13,154
#herds 230 2 12 56 31 89 5 35Contracts 1 4 6 7 61 to 49 3 36 4 39 4 29 50–99 7 3 18 3100–499 3 4 12 23 1 4500–999 1 2 61,000+ 7 1
1 2
2
Seedstock 5 1 4
AI 1 1Abattoirs 1 1 The main producers and seedstock producers are all located within about 250km of Perth. The AI centre (PIC) is located near Katanning. The main abattoir (Linley Valley Pork) is located at Woorooloo about 60km east of Perth and kills around 11,000 a week and draws from about 100 farms from all the major pig production areas in WA.
4.7 The Northern Territory: statistical divisions, farms, seed stock producers, abattoirs and AI centres
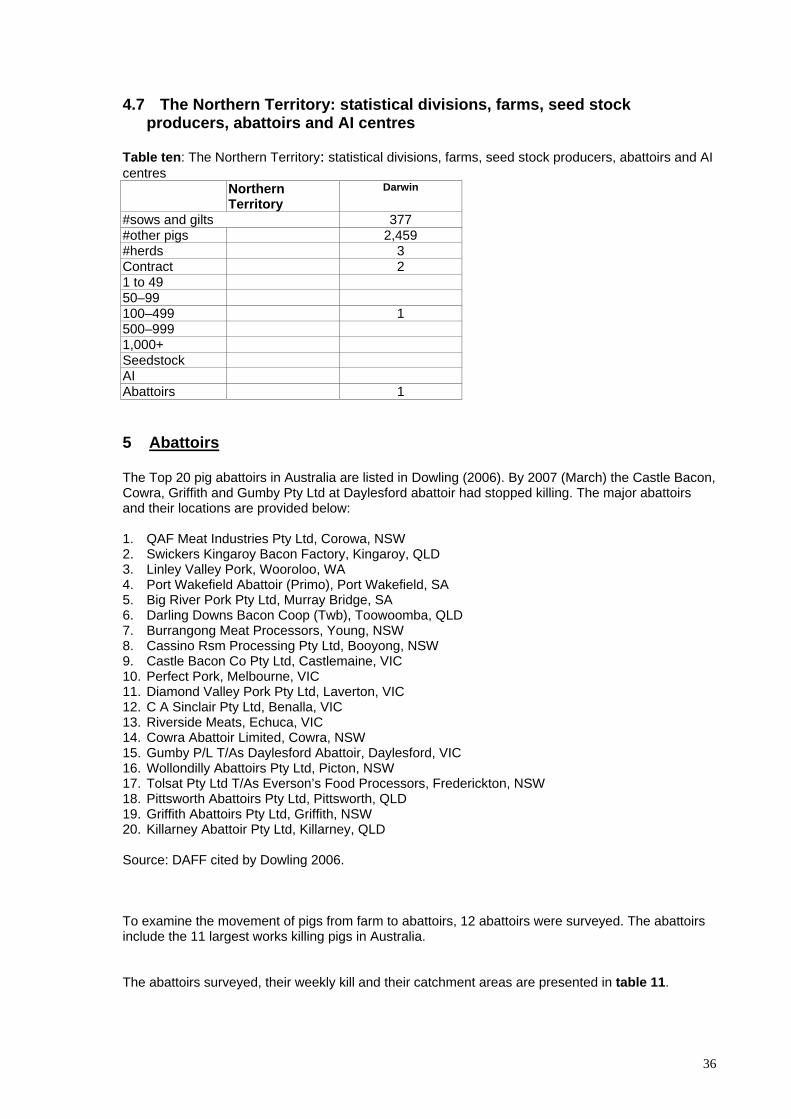
Table ten: The Northern Territory: statistical divisions, farms, seed stock producers, abattoirs and AI centres
Northern Territory
Darwin
#sows and gilts 377 #other pigs 2,459 #herds 3 Contract 2 1 to 49 50–99 100–499 1 500–999 1,000+ Seedstock AI Abattoirs 1 5 Abattoirs The Top 20 pig abattoirs in Australia are listed in Dowling (2006). By 2007 (March) the Castle Bacon, Cowra, Griffith and Gumby Pty Ltd at Daylesford abattoir had stopped killing. The major abattoirs and their locations are provided below: 1. QAF Meat Industries Pty Ltd, Corowa, NSW 2. Swickers Kingaroy Bacon Factory, Kingaroy, QLD 3. Linley Valley Pork, Wooroloo, WA 4. Port Wakefield Abattoir (Primo), Port Wakefield, SA 5. Big River Pork Pty Ltd, Murray Bridge, SA 6. Darling Downs Bacon Coop (Twb), Toowoomba, QLD 7. Burrangong Meat Processors, Young, NSW 8. Cassino Rsm Processing Pty Ltd, Booyong, NSW 9. Castle Bacon Co Pty Ltd, Castlemaine, VIC 10. Perfect Pork, Melbourne, VIC 11. Diamond Valley Pork Pty Ltd, Laverton, VIC 12. C A Sinclair Pty Ltd, Benalla, VIC 13. Riverside Meats, Echuca, VIC 14. Cowra Abattoir Limited, Cowra, NSW 15. Gumby P/L T/As Daylesford Abattoir, Daylesford, VIC 16. Wollondilly Abattoirs Pty Ltd, Picton, NSW 17. Tolsat Pty Ltd T/As Everson’s Food Processors, Frederickton, NSW 18. Pittsworth Abattoirs Pty Ltd, Pittsworth, QLD 19. Griffith Abattoirs Pty Ltd, Griffith, NSW 20. Killarney Abattoir Pty Ltd, Killarney, QLD Source: DAFF cited by Dowling 2006. To examine the movement of pigs from farm to abattoirs, 12 abattoirs were surveyed. The abattoirs include the 11 largest works killing pigs in Australia. The abattoirs surveyed, their weekly kill and their catchment areas are presented in table 11.
36

Table 11: Abattoirs and Catchments
Abattoirs Location Weekly kill Catchment Number of
farms Australian Food Group Laverton, Vic 3,000 Vic, NSW 30
C A Sinclair Benalla, Vic 4,000 Vic, NSW 30 Casino RSM Booyong, NSW 5,000 NSW, Qld 23
KR Castlemaine Toowoomba, Qld 6,000 Northern NSW, Qld 55
Diamond Valley Pork Laverton, Vic 6,000 Vic, NSW 45
Burrangong Young, NSW 7,000 NSW, Vic 20 Port Wakefield Abattoir Pork Wakefield, SA 10,500 SA, Vic, Southern
NSW 170
Linley Valley Pork Woorooloo, WA 11,000 WA 100
Big River Murray Bridge, SA 13,000 SA, Vic, NSW 70
Swickers Kingaroy Qld 15,000 Qld, Northern NSW 200
QAF meats Corowa, NSW 20,000 Victoria, Southern NSW
QAF company farms. ~40 sites
Most of the abattoirs restrict their kill to pigs from their own or neighboring states. The South Australian abattoirs draw from southern NSW as well as SA and Victoria. From time to time all the works will draw from a wider catchment. For example, during the preparation of this report, there was a fire in the Port Wakefield abattoirs. The pigs that were usually killed there were killed at Big River, CA Sinclair and Diamond Valley. The survey of the abattoirs indicated that for each of the abattoirs the farm catchment related to the pig populations of the statistical divisions. Further subdivision to post codes for farms was not fruitful.
37

6 Day-to-day operations on a semen centre Boars enter the semen centre periodically. The arrangements vary with the centre. Some centres restrict entry to breeding stock from one commercial source. Others hold boars from several sources. Introduced boars enter the station after a period of pre entry-testing and quarantine and after a period of training are routinely collected once or twice each week. The frequency of collection varies with the centre. On other centres, especially where the centre is supplying genes from one commercial source, a new batch of boars is introduced every 12–18 months. The boars are quarantined before entry to the main shed. The quarantine accommodation arrangements vary but in general direct nose to nose or single airspace contact is avoided. The new boars are trained to mount the dummy and be collected from by hand. On some centres the boars are blood tested for brucellosis and leptospirosis but there are no general rules. If the new boars are healthy and the semen collected meets the standards for the centre then the semen is dispatched to customers, even though the boars are notionally still in quarantine. The number of boars collected from and the number of days semen is collected depends on the orders for semen. Collection starts early in the morning and immediately after the boar is collected from the semen is assessed and extended. It is dispensed into individual plastic semen packs and chilled. At some centres the semen is shipped by 11:00am on the day of collection. On other sites it leaves by courier in the afternoon. By the next morning it is on site on the customer farm (in WA in 24 hours) and inseminated into sows within hours of arrival. It is possible to understand how, with this distribution efficiency, an asymptomatic boar could be excreting virus in semen in Victoria and the next day the semen (along with the virus) could be inseminated into sows in WA and Qld. A full discussion of the viruses excreted or transmitted in semen is beyond the scope of this report. A summary is presented in table 15. Table 14: Semen centres Centre Location #Farms supplied Distribution PIC NSW Grong Grong 12 All states PIC SA Murray bridge 6 SA, WA PIC Qld Toowoomba 30 NSW, Qld PIC Vic (Pork Storks) Lethbridge 31 SA,Vic, NSW PIC WA Katanning 9 WA CEFN Qld Warwick 4 NSW, Qld CEFN SA Murray bridge 81 All except Qld HYFARM QLD Toowoomba 24 WA, Vic, NSW, Qld SABOR, SA Clare Estimated 80 All states EASTERN GENETICS, Qld
Bell 60 SA, NSW, Qld
PREMIER GENETICS, Qld.
Wacol 60 Vic, NSW, Qld
38

Table 15: Potential emergency disease hazards and methods of spread Disease Spread
by direct animal contact
Spread by Aerosol
Demonstrated field spread in semen
Spread by meat products
Spread by fomites
Insect
Foot and Mouth Disease
Y Y N * Y Y N
African Swine Fever
Y N N * Y Y Y (tick)
Classical Swine Fever
Y N Y Y Y N
Transmissible Gastroenteritis
Y N N Laboratory experiments
only
Y N
Aujeszky’s Disease
Y Y N * By heads of infected
animals not other meat
N N
Japanese Encephalitis
N N N + N N Y
Porcine Reproductive and Respiratory Syndrome Virus
Y Y Short
distances
Y Laboratory experiments
only
Y N
Porcine Circovirus Associated Disease
Y N N * Not done Not done Possible
N
Swine Vesicular Disease
Y N N * Y Laboratory
experiments only
Y N
Swine influenza Y Y Short
distances
N N N N
* Virus excreted in semen but transmission not demonstrated. + Vaginal infection demonstrated following laboratory inoculation.
AI in practice on a commercial farm
39
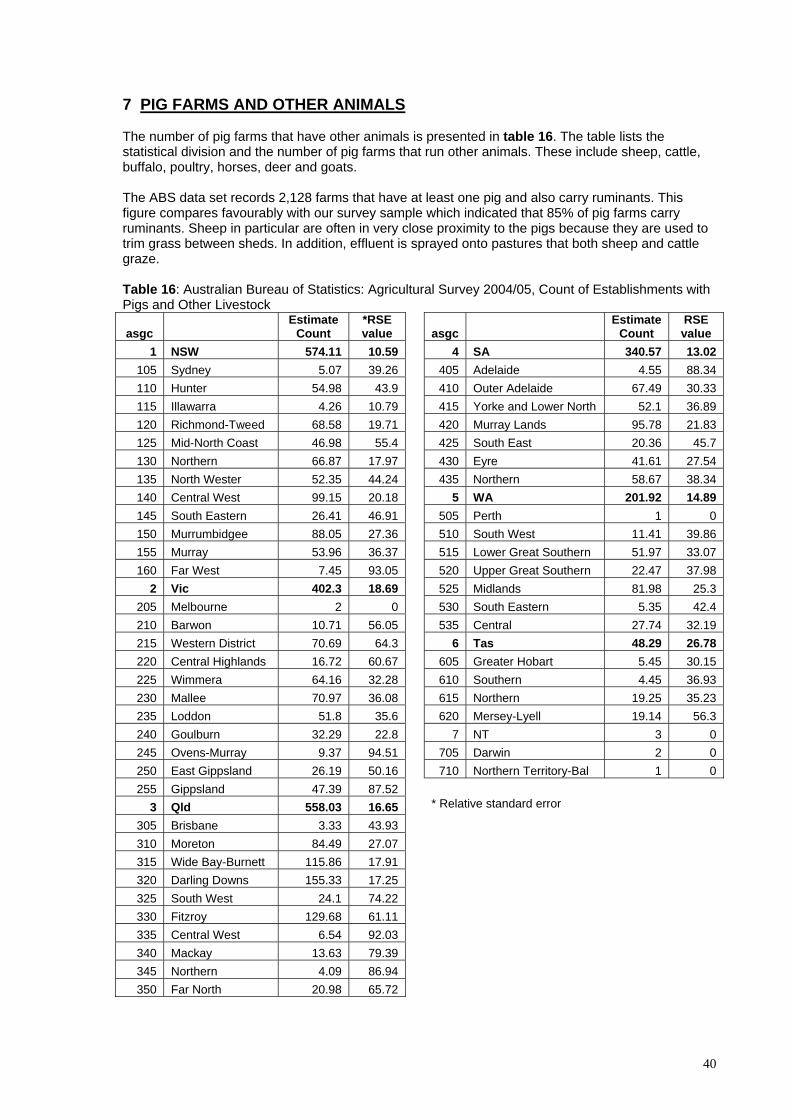
7 PIG FARMS AND OTHER ANIMALS The number of pig farms that have other animals is presented in table 16. The table lists the statistical division and the number of pig farms that run other animals. These include sheep, cattle, buffalo, poultry, horses, deer and goats. The ABS data set records 2,128 farms that have at least one pig and also carry ruminants. This figure compares favourably with our survey sample which indicated that 85% of pig farms carry ruminants. Sheep in particular are often in very close proximity to the pigs because they are used to trim grass between sheds. In addition, effluent is sprayed onto pastures that both sheep and cattle graze. Table 16: Australian Bureau of Statistics: Agricultural Survey 2004/05, Count of Establishments with Pigs and Other Livestock
asgc Estimate
Count *RSE value
asgc
Estimate Count
RSE value
1 NSW 574.11 10.59 4 SA 340.57 13.02 105 Sydney 5.07 39.26 405 Adelaide 4.55 88.34 110 Hunter 54.98 43.9 410 Outer Adelaide 67.49 30.33 115 Illawarra 4.26 10.79 415 Yorke and Lower North 52.1 36.89 120 Richmond-Tweed 68.58 19.71 420 Murray Lands 95.78 21.83 125 Mid-North Coast 46.98 55.4 425 South East 20.36 45.7 130 Northern 66.87 17.97 430 Eyre 41.61 27.54 135 North Wester 52.35 44.24 435 Northern 58.67 38.34 140 Central West 99.15 20.18 5 WA 201.92 14.89 145 South Eastern 26.41 46.91 505 Perth 1 0 150 Murrumbidgee 88.05 27.36 510 South West 11.41 39.86 155 Murray 53.96 36.37 515 Lower Great Southern 51.97 33.07 160 Far West 7.45 93.05 520 Upper Great Southern 22.47 37.98
2 Vic 402.3 18.69 525 Midlands 81.98 25.3 205 Melbourne 2 0 530 South Eastern 5.35 42.4 210 Barwon 10.71 56.05 535 Central 27.74 32.19 215 Western District 70.69 64.3 6 Tas 48.29 26.78 220 Central Highlands 16.72 60.67 605 Greater Hobart 5.45 30.15 225 Wimmera 64.16 32.28 610 Southern 4.45 36.93 230 Mallee 70.97 36.08 615 Northern 19.25 35.23 235 Loddon 51.8 35.6 620 Mersey-Lyell 19.14 56.3 240 Goulburn 32.29 22.8 7 NT 3 0 245 Ovens-Murray 9.37 94.51 705 Darwin 2 0 250 East Gippsland 26.19 50.16 710 Northern Territory-Bal 1 0 255 Gippsland 47.39 87.52
3 Qld 558.03 16.65
305 Brisbane 3.33 43.93
310 Moreton 84.49 27.07
315 Wide Bay-Burnett 115.86 17.91
* Relative standard error
320 Darling Downs 155.33 17.25
325 South West 24.1 74.22
330 Fitzroy 129.68 61.11
335 Central West 6.54 92.03
340 Mackay 13.63 79.39
345 Northern 4.09 86.94
350 Far North 20.98 65.72
40
8 Biosecurity and disease risks The Australian pig industry has remained free from the major emergency diseases of pigs for over 40 years. However, the industry remains conscious of the importance of those diseases. In addition it has an impressive disease control record that is highlighted by the eradication of Menangle virus in pigs in NSW in 1997 (Love, 2002). The major national breeding stock suppliers have herds free of internal and external parasites, atrophic rhinitis and swine dysentery. Their status with regard to Mycoplasma hyopneumoniae and Actinobacillus pleuropneumoniae is variable but PIC, CEFN, Hyfarm and Myora all have herds free of these pathogens. The highest health status herds apply high standards of biosecurity. Disease risk is reduced by industry marketing practices whereby relatively few slaughter pigs are sold through sale yards. An estimated 95% of the pigs are sold direct to slaughter, the remainder being sold through saleyards. However, each week hundreds of breeding gilts and boars are moved from seed stock producers to customer herds. Currently about 12 seed stock herds supply breeding stock to an estimated 80% of the national herd. Thousands of pigs are moved from site to site in two site or multisite pig production enterprises each week. For example, in one business about 8,000 pigs move weekly from three sow sites to a grow-out site. However, these movements are well defined and from regular point-to-point sources. They are all part of the same system. They provide examples of how much the pig industry has changed over the last ten years. Multisite production systems, contract production and outdoor systems have become part of the mainstream pig industry. For example, there are about 475 establishments engaged in contract production nationally (Table three). Pigs are produced on a farrow-to-finish basis, on two or more sites, on outdoors sites and in straw based or concrete based fully intensive systems. Most pigs are sold for slaughter between the liveweights of about 70–120 kg or about 18–26 weeks of age. The pigs may be owned by the owner of the farm for their whole life or owned by a person or company who contracts the rearing of the animal on different sites. About 50% of the breeding herd is culled each year and many of these animals are sold in regional saleyards. Sows and boars are managed on a continuous throughput basis but increasingly farrowing houses, weaners and growing pigs are managed on a batch basis. All-in all-out management systems are increasing because they offer improved performance and improved disease control. This is as much due to the opportunity to more effectively clean the sheds between groups of pigs as any effect on the disease control advantages of housing pigs of a similar age together. The use of artificial insemination is increasing and an estimated 60%–70% of matings on Australian farms are AI matings. Female breeding stock are either reared on-farm or purchased from a specialist seedstock producer. Many herds maintain their own closed herd multiplication (CHM) sows to supply replacement stock. This reduces disease risk by using replacement gilts that have been reared in the herd and have been exposed to the local pathogens. Boars are largely purchased from seed stock suppliers. Producers understand the risks of changing suppliers and tend to draw their boars from one supplier although they may change suppliers over time. Artificial insemination is emerging as a key operational strategy to improve reproductive performance, improve farm occupational safety, improve labour efficiency and reduce the risk of exposure to endemic disease. However, artificial insemination (AI) represents a potential risk to the Australian industry if an emergency disease penetrates an AI centre. In the USA, AI centres have been a source of PRRS virus infection for customers. In the Netherlands in 1998, Classical Swine Fever virus was spread by semen collected from an infected boar in an AI centre. In Western Australia in 2002, an outbreak of congenital tremors was spread by semen to about eight farms. These were closed herds sourced from the same parent herd and until the first case in 2002 had not seen this otherwise common disease. Outbreaks lasted for about 20 weeks (Nairn 2003).
41

Most farms with more than 150 sows have a veterinarian visit their herds on a regular basis — about three to four times per year. This practice is not common on smaller farms. A relatively large number of farms (1500 — more than 50% of the total number) carry only a small number of sows — less than 25 per farm. These account for only about 3.4% of the national sow herd but they present a disproportionate emergency disease risk because these producers sell through saleyards, infrequently receive a visit from a veterinarian and practice relatively poor biosecurity and management procedures. They are also unlikely to apply the standards of the Australian Pork Industry Quality (APIQ) Program. However, they are not involved in the movements of many animals and do not sell pigs to mainstream herds so this reduces the risk to the rest of the pig industry. The appearance of atrophic rhinitis in Australia in the 1980s demonstrates how a disease might be confined to a group of producers. This disease appeared in the stud pig sector of the Australian industry following the importation of pigs from Canada in about 1983. The pigs were all housed together in quarantine and introduced directly to their new farms. Over the next 12–18 months clinical signs became apparent in the studs and then spread to other herds that exhibited at shows and fairs throughout the country. It spread to customer herds but did not spread to those herds which followed good biosecurity practice, which were not directly part of the stud sector and which purchased from the more mainstream suppliers. It is the view of the authors that the disease led to the demise of the stud sector as a force in pig production. It is not a problem in the mainstream industry today. While small farms present a disproportionate emergency disease risk the larger farms can at times represent high risk. For example, Menangle virus was identified in a 3000 sow unit. The outbreak of porcine myocarditis virus in 2003 occurred in 20,000 and 5,000-sow sites. Recent outbreaks (2006) of M hyopneumnoniae in Australia have occurred in herds of 1,000 sows, 3,000 sows, 500 sows and 300 sows, indicating that common diseases can and do spread to these farms despite high levels of biosecurity awareness and implementation of biosecurity programs. M hyopneumnoniae presents a particular problem because it is a disease that spreads by aerosol as well as direct contact. Goodwin (1985) suggested it would spread three kilometres but recent events in Australia indicate that it will move six kilometres in the air (Cutler et al 2006). 8.1 Definition of a biosecurity program A biosecurity program provides procedures to limit the movement of infectious diseases of pigs from one farm to others. Infectious agents can be spread by:
- direct pig to pig contact - semen - aerosols - contamination of clothes and boots - people moving between farms - contaminated animal handling equipment - contamination of transport vehicles - contaminated feed or water - biting insects - wildlife vectors - illegal importation and disposal of contaminated meat products.
The level of infection depends on the degree of amplification of the disease agent, the immune response and interaction with the environment. In the case of foot and mouth disease (FMD) pigs are an important species because they can be infected by eating contaminated food, amplify the virus and excrete it in huge numbers before any clinical signs are evident.
42
8.2 Emergency disease hazards
The major potential disease hazards include Foot and Mouth Disease, African Swine Fever, Classical Swine Fever, Transmissible Gastroenteritis, Aujeszky’s Disease, Japanese Encephalitis, Porcine Reproductive and Respiratory Syndrome Virus, Porcine Circovirus Associated Disease (PCAD), Swine Vesicular Disease and Swine influenza. PCAD is a problematic disease. Porcine circovirus (type 2) is present in Australia but the disease syndrome described abroad in growing and finishing pigs and the disease known as PMWS in Europe appears not to be present. A full examination of each of these hazards is beyond the scope of this study but table 15 summarises the likely methods of spread should they enter the country.
8.3 Key elements of a biosecurity program for pig farms From an emergency disease perspective the most important things Australian producers can do are: • comply with regulations about swill feeding, importation of animals and importation of semen • minimize the risk of contact between domestic and feral animals, especially pigs and goats • reduce the risk of spread with appropriate controls on pig (including dead pigs), people and other
animal movements • recognize any emergency disease quickly and report it • assist regulatory animal health staff with animal movement details by keeping accurate records
of pig and transport vehicle movement. It follows then that the key elements of any biosecurity code of practice are: • compliance with regulations prohibiting swill feeding • separation of domestic pigs from other animals, especially feral pigs and other animals of risk • a record of animal and transport movements • a controlled entrance and provision of farm boots and clothing for visitors • a record of personnel visits • staff training or awareness in emergency disease recognition. For those farms using a herd veterinarian, consultation with the veterinarian should result in a biosecurity program best fitted to that farm. 8.3.1 Compliance with regulations prohibiting swill feeding A major emergency disease risk comes from illegal feeding of illegally imported meat products to pigs — either accidentally or as part of illegal swill feeding practices. Swill feeding has been illegal in Australia for many years but still occurs, albeit rarely. Compliance with regulations and reporting offenders are important elements in risk reduction. 8.3.2 Farm isolation While new farms will endeavour to establish away from other pig farms to limit the risk of spread of endemic respiratory diseases, there is little existing farms can do, especially if they are in pig dense areas. Further, even if they are located well away from other pig farms it is likely that they will be reasonably close to populations of sheep and cattle. Facility isolation is a desirable but unrealistic compulsory element of a biosecurity code. 8.3.3 Separation from other animals Pigs of any origin represent a substantial disease threat. In FMD epidemics they are a particular risk because they act as amplifying hosts and may be asymptomatic during viral excretion. Most Australian farms have ignored the feral pig or feral goat risk and there have been feral boar incursions on too many large Australian pig farms that ought to have had better controls in place. They represent a worrying emergency disease risk and a lapse of biosecurity. Feral goats present a
43
less well recognised risk. A one metre high ringlock fence with a closed gate surrounding a pig unit, to prevent direct access to pig sheds, will provide adequate security against wild pig or goat incursions. This measure is even proposed for outdoor units. However, no matter how high the fences nor how substantial, open gates render them useless in preventing contact with feral animals. A feral pig or goat is just as likely as domestic pigs to spread disease to range reared sheep and cattle. It is estimated that there are between 4–24 million feral pigs in Australia. Domestic animals in direct contact with pigs present few additional risks as far as direct disease transmission from feral animals is concerned. They do however present a risk if they travel to different farms. Sheep or goats used to graze between pig buildings could pose a threat in the event of foot and mouth disease occurring in a piggery, as they may be infected and sold through saleyards while clinical signs in pigs or sheep are not apparent. Birds have been implicated in the spread of transmissible gastroenteritis but are unimportant in an Australian pig disease transmission context. It is unreasonable and impractical to require that indoor intensive buildings, straw based shelters and outdoor pig farms are bird-proofed. However, a plentiful supply of dead carcases and spilt feed does encourage the expansion of bird populations and it is not unreasonable to expect that access to carcases and feed should be limited. Flying foxes have been demonstrated to be a source of viral infections for several species of animals including pigs. In Australia, flying foxes have been implicated in the spread of Menangle virus and in Malaysia Nipah virus spilled over from the bat population to the pig population and then to people. If flying fox access to pigs is considered excessive, bird netting and habitat reduction are the only practicable measures available. 8.3.4 Single source supply of breeding stock and records of pig introductions Producers seem curiously willing to change their breeding stock suppliers for little logical reason and contravene the most fundamental principle of disease control — single source supply of replacement breeding stock. However, from time to time it will be necessary for producers to change their breeding supplier. They can do this by following a careful process of matching health status or reducing risk using different disease prevention strategies such as the use of sentinel animals, quarantine and laboratory testing. The important issue is that the change in source of supply is carefully considered and not a random event. A record of the date of any introduction and the supplier of the pigs becomes an important element of disease management. 8.3.5 Isolation facility Most farms don’t have an isolation facility for new breeding stock. As a consequence, herds are denied any real protection against diseases which could be introduced with breeding stock. Any sort of basic quarantine facility located some distance from the main farm in addition to a simple protocol will protect a herd against disease introduced with imported breeding stock. To allow for extended periods before disease is detected in source herds, a five to eight week isolation period is recommended. Mycoplasma hyopneumoniae will, according to Goodwin (1985), spread at least three kilometres. There have been three outbreaks in Australia where distances between herds of about six kilometres have not prevented spread. For M hyopneumoniae a distance of three kilometres between isolation unit and main farm is recommended but the distance depends on the concentration of animals and the life associated excretion rates. During a 2005 outbreak of M hyopneumoniae in Victoria, any kind of quarantine facility at a distance of 600 metres from the main farm prevented the introduction of the disease on about 20 farms. Because it will hold relatively few pigs (usually less than 100), the isolation facility can be located within 100 metres of the main complex. The distance by which disease is transmitted by aerosol is proportional to the size of the herd originating the aerosol and the age of the pigs. An isolation facility is most likely to be used in high health status herds. Most others won’t comply. Where they don’t comply, the introduced stock should at least be held for a period of one month for observation. In this case, close observation becomes the principal biosecurity tool. Thus, introduced
44

stock should be inspected by a trained person. This will not prevent introduction of asymptomatic animals infected with disease but it is a good starting point. While an isolation facility may be appropriate for herds introducing breeding stock it is impractical to apply the same conditions to farms which regularly introduce growing pigs as part of multisite management practices. Yet not dissimilar risks apply. In well run operations, all-in all-out systems should ensure a degree of isolation of each batch and any introduced disease should remain contained. 8.3.6 Transport Load-out areas present a risk if a pig transport vehicle arrives onto a farm carrying pigs. The risk arises from aerosols and from the movement of pigs onto the truck then back to the farm by mistake. Risk can be reduced by providing a ‘dirty’ loading area that can be separated from ‘clean’ farm areas, with a no return policy, ‘no return’ gates and appropriate signage. While perimeter load-outs are desirable they are only practicable on small farms. To accommodate this element on very large farms pigs would have to be walked prohibitive distances to load out. Proximity to roads (about 0.5–1.0 km) and passing transports has been implicated as a possible source of spread in three instances in Australia. 8.3.7 People movement and controlled entry Most farms have some sort of control on visitors. People can carry infectious agents on contaminated boots and clothes and their skin can be contaminated but basic commonsense and personal hygiene together with a change to farm boots and clothes is sufficient to reduce to a very low level the risk of movement of disease between pig farms. Signage and locked doors and gates are measures necessary to discourage pig and feed truck drivers or unauthorised visitors from entering sheds. Clearly demarcated clean and dirty areas reinforce the biosecurity principles associated with people movement. Demarcated areas permit people to remove their off farm ‘dirty’ clothes and footwear on one side of a barrier and to put on ‘clean’ farm boots and clothing and wash their hands on the other side. The ‘familiarity breeds contempt’ concept means that staff movement may be as much a risk as visitor movement. The biosecurity program should be designed to keep piggery staff aware of the risks entailed in off-site contact with other pigs. The rules for staff entry should be similar to the rules for visitors. Staff exit is as important as entry, for example, ‘clean’ clothing should not be worn into the ‘dirty’ area, or into town to do a few jobs. Because of the consequences of disease introduction, the added security provided by a pig-free period of 12 hours or overnight and a shower-in policy for some high health status herds is not an unreasonable impost but cannot be made part of an industry-wide code. Indeed, there is no support in the scientific literature for this concept. Foot and mouth disease virus has been recovered from the nose of people working with FMD infected animals after 28 hours but not 48 hours, however, down-time rules can readily be invoked if there is an FMD emergency. Transmission of swine influenza virus to human caretakers despite the use of biosafety containment practices (coveralls, boots, goggles, gloves, hairnets and dust masks) has been recorded. Australia remains free of swine influenza despite the movement of pig production sector people all over the world. A farm policy for staff and visitors with influenza provides additional security. Foot baths have been shown to be practically useless in eliminating bacterial contamination. For these to provide any protection at all, boots must be free of organic matter and spend in excess of five minutes in the disinfectant solution. For most farms it will be enough for the farm boots to be visibly clean. Disinfectants provide little or no practical benefit beyond that.
45

A record of people movements is also useful in that it will assist with tracebacks in the event of an emergency disease outbreak. 8.3.8 Equipment used by veterinarians and technicians Farm codes and professional codes of practice must provide for mandatory disinfection of equipment (such as snares or ultrasound pregnancy detection equipment) that is moved from farm to farm. Syringes used for injection or needles used for blood collection should remain on-farm. Post mortem implements used by veterinarians for sample collection should remain off-farm or used in areas that are not in direct contact with the herd. 8.3.9 Vehicles Vehicles are only a risk if they are carrying pigs or if they have not been cleaned before they arrive on farm to collect pigs for shipment for sale or slaughter. Then the risk can be reduced by providing a loading area that can be separated from ‘clean’ farm areas with a no return policy. Vehicles other than pig transports present little risk. Rather, it is the drivers who may enter pig buildings that present the disease risk and this risk is covered by controlled entry. 8.3.10 Recognition of sick animals, disposal of dead stock and training programs for staff about disease control Rapid recognition of abnormal disease patterns is the single most important element that will lead to prompt diagnosis and management of an emergency disease. For this to occur staff need to be trained in the recognition of animal disease and the usual and unusual diseases that may occur. The next step in the awareness pathway is discussion of unusual signs with the herd’s veterinarian. Hence, a relationship with a vet is an important element in the recognition of emergency disease. Staff training, reinforcement and development should also occur in this environment. Understanding and implementation of hygiene programs necessary for good health control will follow. While hygiene programs, including dead pig disposal, are part and parcel of good production practice and reduce enteric disease, experience with endemic diseases has indicated that they do little to actually reduce the risk of introduction of disease. However, it is likely that those farms applying good hygiene practice will be amenable to implementing biosecurity codes of practice. For very small farms, a relationship with a vet is unlikely to be achieved and the best that can be expected is awareness of emergency disease issues and a broad sense that the local Department of Agriculture animal health officers should be notified of anything untoward. Disposal of dead animals via composting or burial and a fence around the burial site are required risk reduction practices. 8.4 The pig industry biosecurity code of practice In 2002 Australian pig producers, in fulfilment of their obligations under the emergency disease agreement with the Commonwealth Government, adopted a code of practice based where they agreed to: • comply with regulations prohibiting swill feeding • separate domestic pigs from other animals, especially feral pigs and other animals of risk, with a
one metre high ringlock fence and a lockable gate or grid • record people, animal and transport movements • provide a controlled entrance with hand washing facilities and farm boots and clothing for
visitors.
8.5 Diagnosing disease
Veterinary services to the pig industry are largely supplied by a small number of veterinarians providing specialized veterinary supervision. State agency laboratories in the capital cities provide diagnostic support in each state. In addition, the QDPI in Toowoomba and the Victorian DPI in
46
Bendigo provide laboratory resources. Private sector diagnostic companies are also working in pig diagnostics as are the university veterinary schools. 9 MOVEMENTS OF PIGS AT AGRICULTURAL SHOWSAgricultural shows are held in metropolitan and country areas in all states of Australia. Exhibitors bring their animals to these shows, to compete with other exhibitors in breed competitions, for educational exhibits and/or as entertainment (for example, flying/diving/racing pigs). Shows present a particular risk for disease dissemination because livestock from multiple sources are brought to a central location and commingled. Animals then leave the exhibition and are transported to many different locations. A study of pig movements at agricultural shows in 2005 has been undertaken (Cha, 2006). This study included survey data from administrative personnel at agricultural shows where pigs were exhibited and from surveys of the exhibitors themselves. This chapter highlights the key findings of this study. 9.1 Survey of Administrative Personnel at Agricultural Shows Pigs were exhibited at 46 agricultural shows in Australia in 2005. The number of shows that involved pigs varied state by state and were as follows: QLD (12), VIC (9), NSW (17), ACT (1), NT (2), SA (2), TAS (2) and WA (1). The location of agricultural shows where pigs were exhibited in 2005 is displayed in figure 26. A high number of pigs (1,196) were exhibited at agricultural shows in 2005 by a large number of exhibitors (86) (Figure 27 and Table 17). Approximately equivalent numbers of pigs were exhibited at shows in the city (536 pigs) and the country (660 pigs).
47

Figure 26: Locations of agricultural shows that exhibited pigs in 2005.
48

Figure 27: Farm locations for pig exhibitors who attended agricultural shows in 2005.
49
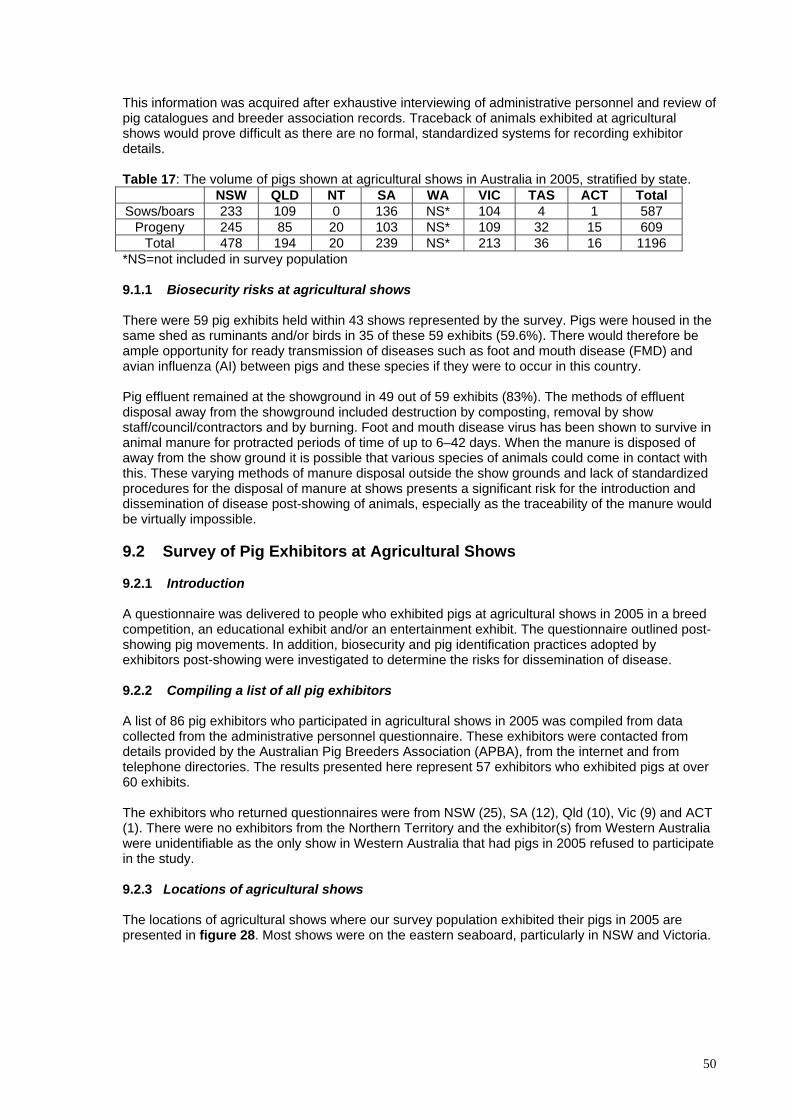
This information was acquired after exhaustive interviewing of administrative personnel and review of pig catalogues and breeder association records. Traceback of animals exhibited at agricultural shows would prove difficult as there are no formal, standardized systems for recording exhibitor details. Table 17: The volume of pigs shown at agricultural shows in Australia in 2005, stratified by state.
NSW QLD NT SA WA VIC TAS ACT Total Sows/boars 233 109 0 136 NS* 104 4 1 587
Progeny 245 85 20 103 NS* 109 32 15 609 Total 478 194 20 239 NS* 213 36 16 1196
*NS=not included in survey population 9.1.1 Biosecurity risks at agricultural shows There were 59 pig exhibits held within 43 shows represented by the survey. Pigs were housed in the same shed as ruminants and/or birds in 35 of these 59 exhibits (59.6%). There would therefore be ample opportunity for ready transmission of diseases such as foot and mouth disease (FMD) and avian influenza (AI) between pigs and these species if they were to occur in this country. Pig effluent remained at the showground in 49 out of 59 exhibits (83%). The methods of effluent disposal away from the showground included destruction by composting, removal by show staff/council/contractors and by burning. Foot and mouth disease virus has been shown to survive in animal manure for protracted periods of time of up to 6–42 days. When the manure is disposed of away from the show ground it is possible that various species of animals could come in contact with this. These varying methods of manure disposal outside the show grounds and lack of standardized procedures for the disposal of manure at shows presents a significant risk for the introduction and dissemination of disease post-showing of animals, especially as the traceability of the manure would be virtually impossible. 9.2 Survey of Pig Exhibitors at Agricultural Shows 9.2.1 Introduction A questionnaire was delivered to people who exhibited pigs at agricultural shows in 2005 in a breed competition, an educational exhibit and/or an entertainment exhibit. The questionnaire outlined post-showing pig movements. In addition, biosecurity and pig identification practices adopted by exhibitors post-showing were investigated to determine the risks for dissemination of disease. 9.2.2 Compiling a list of all pig exhibitors A list of 86 pig exhibitors who participated in agricultural shows in 2005 was compiled from data collected from the administrative personnel questionnaire. These exhibitors were contacted from details provided by the Australian Pig Breeders Association (APBA), from the internet and from telephone directories. The results presented here represent 57 exhibitors who exhibited pigs at over 60 exhibits. The exhibitors who returned questionnaires were from NSW (25), SA (12), Qld (10), Vic (9) and ACT (1). There were no exhibitors from the Northern Territory and the exhibitor(s) from Western Australia were unidentifiable as the only show in Western Australia that had pigs in 2005 refused to participate in the study. 9.2.3 Locations of agricultural shows The locations of agricultural shows where our survey population exhibited their pigs in 2005 are presented in figure 28. Most shows were on the eastern seaboard, particularly in NSW and Victoria.
50
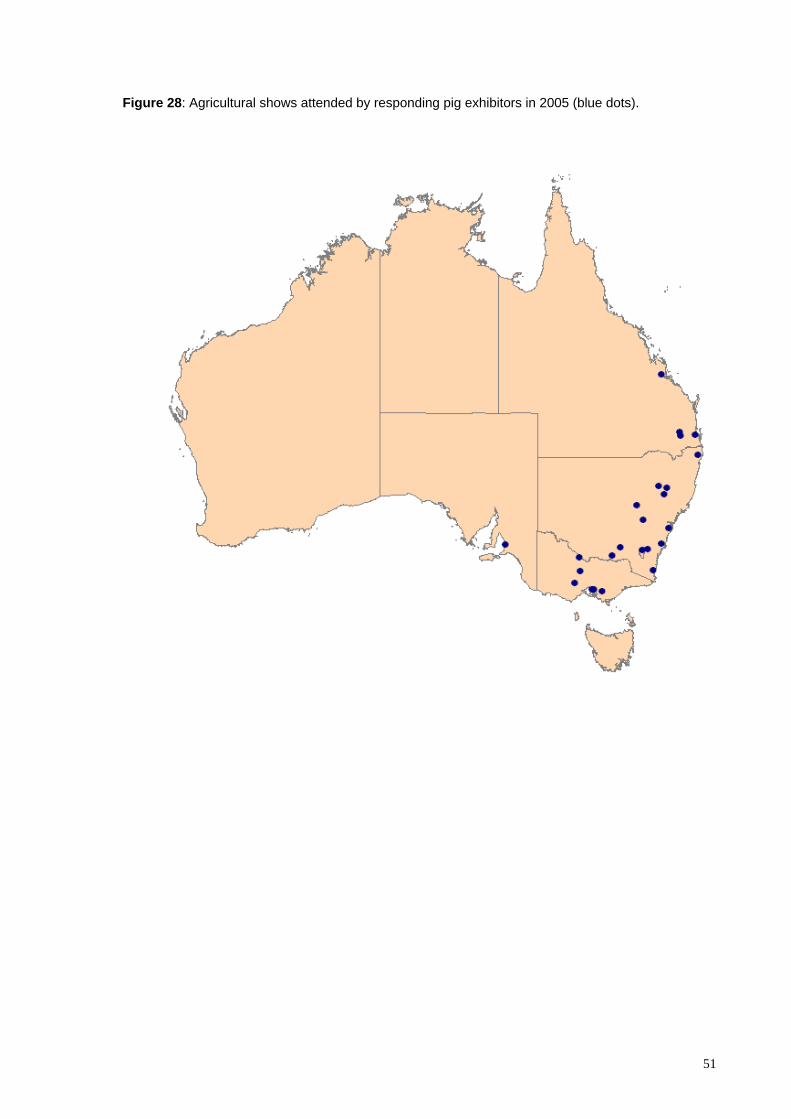
Figure 28: Agricultural shows attended by responding pig exhibitors in 2005 (blue dots).
51
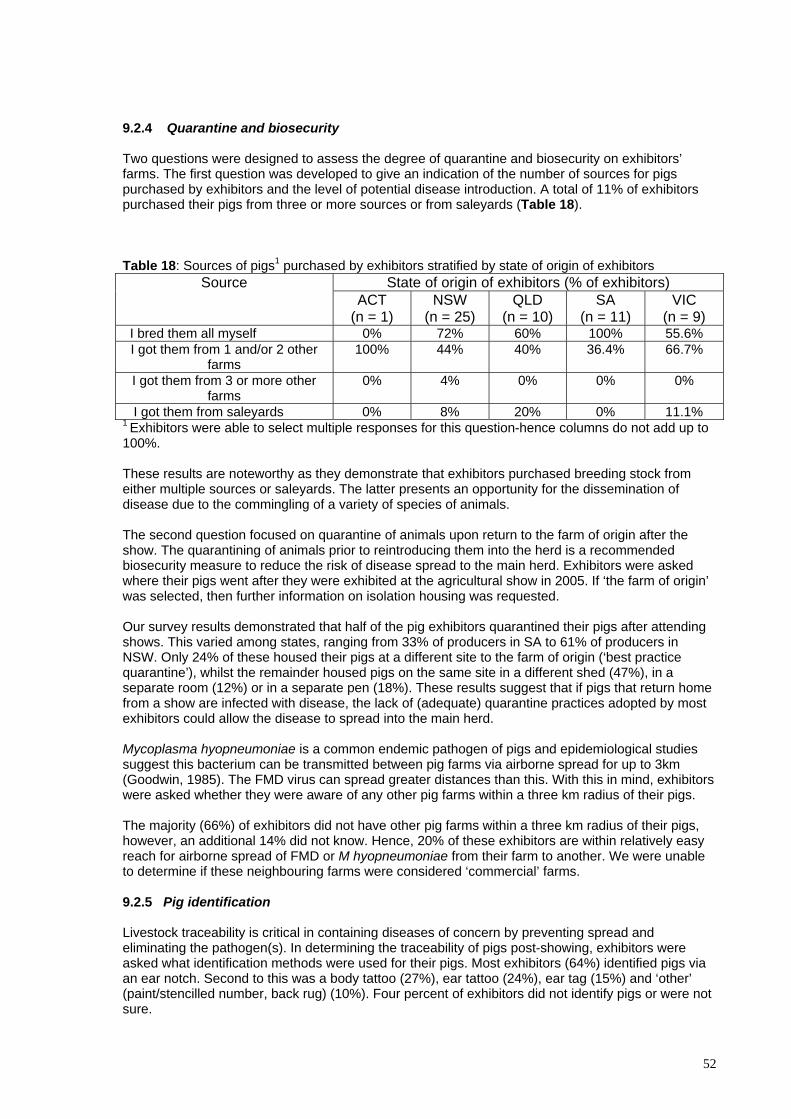
9.2.4 Quarantine and biosecurity Two questions were designed to assess the degree of quarantine and biosecurity on exhibitors’ farms. The first question was developed to give an indication of the number of sources for pigs purchased by exhibitors and the level of potential disease introduction. A total of 11% of exhibitors purchased their pigs from three or more sources or from saleyards (Table 18). Table 18: Sources of pigs1 purchased by exhibitors stratified by state of origin of exhibitors
State of origin of exhibitors (% of exhibitors) Source ACT
(n = 1) NSW
(n = 25) QLD
(n = 10) SA
(n = 11) VIC
(n = 9) I bred them all myself 0% 72% 60% 100% 55.6%
I got them from 1 and/or 2 other farms
100% 44% 40% 36.4% 66.7%
I got them from 3 or more other farms
0% 4% 0% 0% 0%
I got them from saleyards 0% 8% 20% 0% 11.1% 1 Exhibitors were able to select multiple responses for this question-hence columns do not add up to 100%. These results are noteworthy as they demonstrate that exhibitors purchased breeding stock from either multiple sources or saleyards. The latter presents an opportunity for the dissemination of disease due to the commingling of a variety of species of animals. The second question focused on quarantine of animals upon return to the farm of origin after the show. The quarantining of animals prior to reintroducing them into the herd is a recommended biosecurity measure to reduce the risk of disease spread to the main herd. Exhibitors were asked where their pigs went after they were exhibited at the agricultural show in 2005. If ‘the farm of origin’ was selected, then further information on isolation housing was requested. Our survey results demonstrated that half of the pig exhibitors quarantined their pigs after attending shows. This varied among states, ranging from 33% of producers in SA to 61% of producers in NSW. Only 24% of these housed their pigs at a different site to the farm of origin (‘best practice quarantine’), whilst the remainder housed pigs on the same site in a different shed (47%), in a separate room (12%) or in a separate pen (18%). These results suggest that if pigs that return home from a show are infected with disease, the lack of (adequate) quarantine practices adopted by most exhibitors could allow the disease to spread into the main herd. Mycoplasma hyopneumoniae is a common endemic pathogen of pigs and epidemiological studies suggest this bacterium can be transmitted between pig farms via airborne spread for up to 3km (Goodwin, 1985). The FMD virus can spread greater distances than this. With this in mind, exhibitors were asked whether they were aware of any other pig farms within a three km radius of their pigs. The majority (66%) of exhibitors did not have other pig farms within a three km radius of their pigs, however, an additional 14% did not know. Hence, 20% of these exhibitors are within relatively easy reach for airborne spread of FMD or M hyopneumoniae from their farm to another. We were unable to determine if these neighbouring farms were considered ‘commercial’ farms. 9.2.5 Pig identification Livestock traceability is critical in containing diseases of concern by preventing spread and eliminating the pathogen(s). In determining the traceability of pigs post-showing, exhibitors were asked what identification methods were used for their pigs. Most exhibitors (64%) identified pigs via an ear notch. Second to this was a body tattoo (27%), ear tattoo (24%), ear tag (15%) and ‘other’ (paint/stencilled number, back rug) (10%). Four percent of exhibitors did not identify pigs or were not sure.
52

Of these identification methodologies, only the body tattoo, ear tattoo and ear tag would provide effective traceability of animals in the event of an exotic disease outbreak. These results emphasise the need for shows to adopt a standardized method of registering pigs for accurate traceability. 9.2.6 Pig movements post-showing The questionnaire revealed that of the 55 exhibitors, a high proportion (35%) of exhibitors sent at least one pig to another farm in the same state (not the farm of origin) while an additional 15% sent at least one pig to a farm in a different state to the farm of origin. 62% of exhibitors had at least one pig return to the farm of origin and 40% had at least one pig sent for processing. The destination of pigs was calculated and stratified by state of origin of exhibitors (Table 19). Table 19: Movements of pigs post-showing, stratified by state of origin of exhibitors.
State of origin of exhibitors (% of exhibitors) ACT (n = 1)
NSW (n = 25)
QLD (n = 10)
SA (n = 11)
VIC (n = 7)
At least 1 pig returned to the farm of origin 100% 72% 20% 45.5% 87.5%
At least 1 pig went to the abattoir for processing 0% 40% 50% 45.5% 25%
At least 1 pig was sent to another farm in the same state-not farm of origin
0% 40% 30% 45.5% 12.5%
At least 1 pig was sent to another farm in a different state-not farm of origin
0% 16% 10% 27.3% 0%
At least 1 pig died 0% 0% 0% 0% 0% Other 0% 4% 0% 9.1% 12.5% 9.2.7 Movements of pigs among shows The movement of pigs was investigated by asking exhibitors if they showed their pigs at more than one agricultural show and to list those shows. Whether exhibitors travelled interstate to show their pigs was determined by comparing the state of origin of the exhibitors and the state of origin of the shows to which they were travelling. Almost 25% of exhibitors took their pigs to more than one show in 2005. This ranged from 0% (SA and ACT) to 36% (NSW). Most exhibitors (11%) attended two shows while 5% attended three shows, 2% attended four shows and 4% attended five shows. A third of exhibitors who travelled to more than one show travelled interstate. All these exhibitors were breed exhibitors. Only exhibitors from New South Wales, Queensland and Victoria travelled interstate to attend shows (28). The variety of pigs’ post-showing destinations presents a risk for the dissemination of disease across a wide geographic range if pigs were infected at a show — especially if infection were unnoticed and the movement of infected pigs were not halted.
53
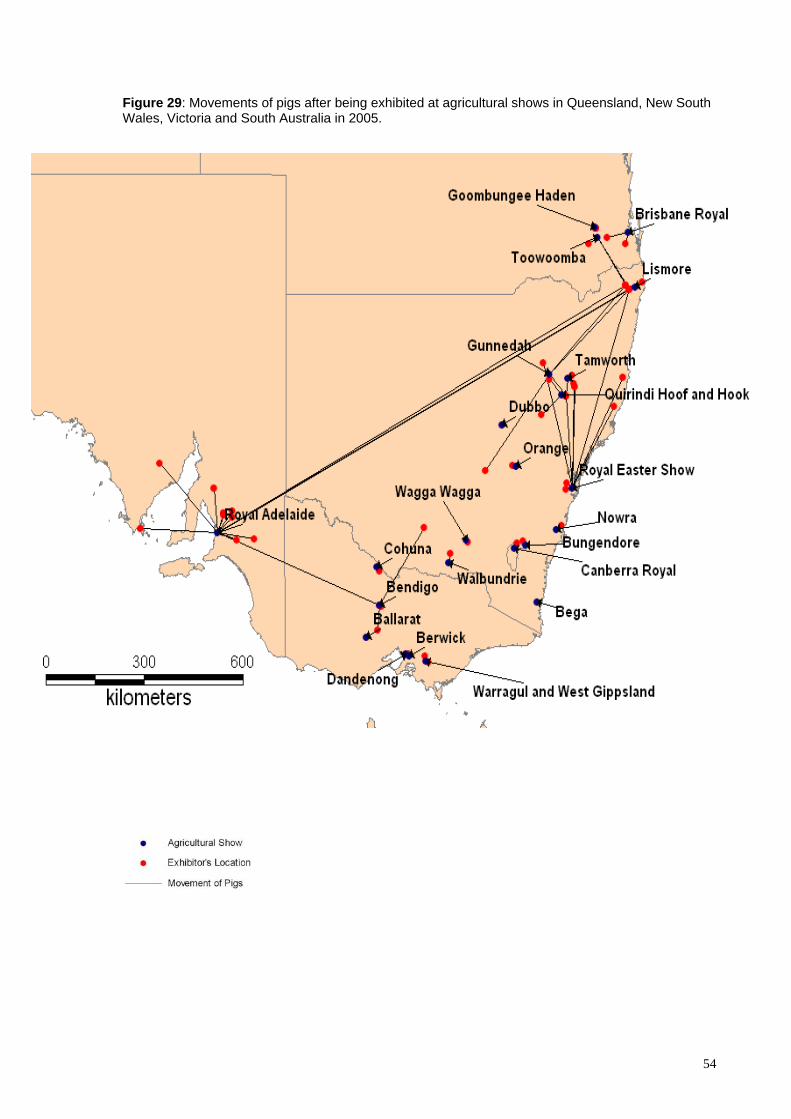
Figure 29: Movements of pigs after being exhibited at agricultural shows in Queensland, New South Wales, Victoria and South Australia in 2005.
54
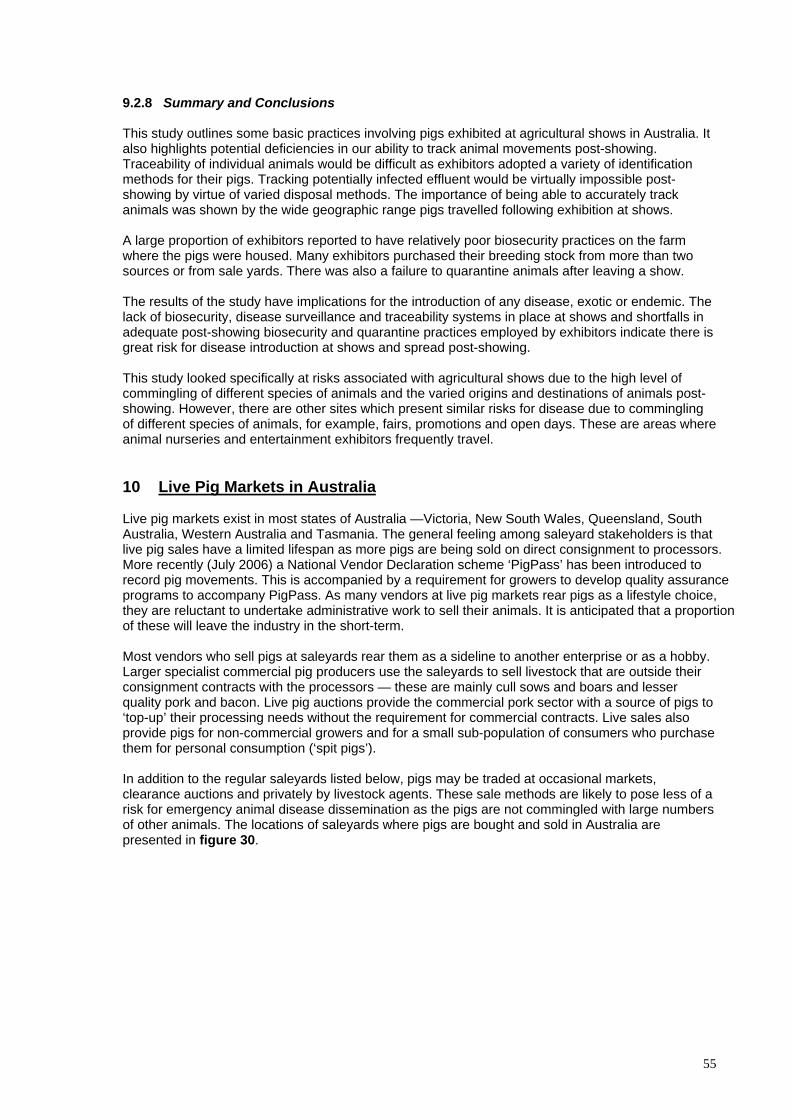
9.2.8 Summary and Conclusions This study outlines some basic practices involving pigs exhibited at agricultural shows in Australia. It also highlights potential deficiencies in our ability to track animal movements post-showing. Traceability of individual animals would be difficult as exhibitors adopted a variety of identification methods for their pigs. Tracking potentially infected effluent would be virtually impossible post-showing by virtue of varied disposal methods. The importance of being able to accurately track animals was shown by the wide geographic range pigs travelled following exhibition at shows. A large proportion of exhibitors reported to have relatively poor biosecurity practices on the farm where the pigs were housed. Many exhibitors purchased their breeding stock from more than two sources or from sale yards. There was also a failure to quarantine animals after leaving a show. The results of the study have implications for the introduction of any disease, exotic or endemic. The lack of biosecurity, disease surveillance and traceability systems in place at shows and shortfalls in adequate post-showing biosecurity and quarantine practices employed by exhibitors indicate there is great risk for disease introduction at shows and spread post-showing. This study looked specifically at risks associated with agricultural shows due to the high level of commingling of different species of animals and the varied origins and destinations of animals post-showing. However, there are other sites which present similar risks for disease due to commingling of different species of animals, for example, fairs, promotions and open days. These are areas where animal nurseries and entertainment exhibitors frequently travel. 10 Live Pig Markets in Australia Live pig markets exist in most states of Australia —Victoria, New South Wales, Queensland, South Australia, Western Australia and Tasmania. The general feeling among saleyard stakeholders is that live pig sales have a limited lifespan as more pigs are being sold on direct consignment to processors. More recently (July 2006) a National Vendor Declaration scheme ‘PigPass’ has been introduced to record pig movements. This is accompanied by a requirement for growers to develop quality assurance programs to accompany PigPass. As many vendors at live pig markets rear pigs as a lifestyle choice, they are reluctant to undertake administrative work to sell their animals. It is anticipated that a proportion of these will leave the industry in the short-term. Most vendors who sell pigs at saleyards rear them as a sideline to another enterprise or as a hobby. Larger specialist commercial pig producers use the saleyards to sell livestock that are outside their consignment contracts with the processors — these are mainly cull sows and boars and lesser quality pork and bacon. Live pig auctions provide the commercial pork sector with a source of pigs to ‘top-up’ their processing needs without the requirement for commercial contracts. Live sales also provide pigs for non-commercial growers and for a small sub-population of consumers who purchase them for personal consumption (‘spit pigs’). In addition to the regular saleyards listed below, pigs may be traded at occasional markets, clearance auctions and privately by livestock agents. These sale methods are likely to pose less of a risk for emergency animal disease dissemination as the pigs are not commingled with large numbers of other animals. The locations of saleyards where pigs are bought and sold in Australia are presented in figure 30.
55
Figure 30: Locations of saleyards in Australia (represented by a star) where pigs are bought and sold.
10.1 New South Wales There are four major pig sales in New South Wales. These are conducted at Forbes, Gunnedah, Camden and Windsor. Small sales are also held at West Wyalong and Armidale but few pigs are sold and these sales are likely to disappear in the short-term. The major market in NSW is held at Newell Highway, Forbes (2871). The market is held every fortnight on a Friday. Approximately 1,000 pigs are sold (40% suckers/weaners, 50% pork/bacon, 10% sows/boars). Vendors come from districts including Lake Cargelligo (2672), Griffith (2680), West Wyalong (2671), Condobolin (2877), Parkes (2870), and Dubbo (2830). The volume of pigs sold increases in the second half of the year towards Christmas (light pork and bacon) and early in the New Year (suckers and weaners) before Chinese New Year. This is driven mainly by price received. In drought times, the number of weaners and light porkers typically increases as growers cannot afford to feed pigs out to bacon weight. Almost all pigs are purchased by butchers/processors. There are two major wholesale purchasers for processing — Murray Brothers (Albury) and A&D Meats (Picton) that buy at the Forbes sale. These purchasers arrange for their pigs to be slaughtered at Burrangong abattoirs (Young) and/or or Wollongdilly abattoirs (Picton). The carcasses are then cut to specifications and transported to the relevant butchers/buyers for further processing. Carcasses coming out of Wollongdilly all go to butchers/buyers within NSW. Those coming out of Burrangong may move interstate and/or be exported (Burrangong is an export plant). A small proportion (approximately 5% of pigs) is sold privately to re-stocker farms as replacement breeding stock or to grow out to heavier weights. Sheep and cattle are also sold at Forbes on different days. The yards are hosed out after the pig sales. The second major sale in NSW is held at Boggabri Road, Gunnedah (2380). This sale is held on a Thursday on a fortnightly basis. Most vendors are commercial pig growers and come from as far away as Warialda (250km), Moree and Wee Waa (300–400km). Approximately 350–400 pigs are sold at each sale and this number remains fairly static throughout the year. Approximately 50% of
56
pigs presented are suckers/weaners, 40% pork or bacon and 10% backfatters (sows/boars). Of the purchasers, 95% are butchers with 5% re-stockers. All butchers are from local areas (Tamworth, Armidale, Walgett). This saleyard only holds pigs and the pens are hosed out after the sale. There are two saleyards in NSW that are located in the Sydney Basin. These are situated at Camden (2570) and Mulgrave Rd, Mulgrave (2756). The Camden sale is held every Tuesday and attracts both commercial (from Wagga Wagga and the central west NSW) and non-commercial (from the Sydney Basin) producers. Approximately 150–300 pigs are sold at each sale. 80% of these are suckers/weaners and the remainder are evenly divided between porkers, baconers and backfatters. The volumes of pigs sold remain fairly evenly spread throughout the year but this depends on pig prices and grain prices. Sheep, cattle and goats are also sold at these saleyards. The yards are hosed out after the pig sales. The Windsor sale at Mulgrave is held every Saturday. It attracts ‘backyard’ pig producers from the Sydney Basin. 90% of pigs presented are suckers/weaners with the remainder being backfatters. Volume fluctuates widely (0–100 pigs) depending on customer demand. The vast majority of buyers are private consumers who purchase ‘spit pigs’ for home consumption or to rear them to a heavier weight. The saleyards are also used to sell sheep, cattle, goats and alpacas. They are hosed out after each pig sale. 10.2 Victoria There are two regular live pig sales held in Victoria. These are located in Bendigo and Ballarat. Occasional sales are held at Geelong, Mernda, Packenham and Moe. Ballarat at LaTrobe Street, Ballarat (3350) is the major live pig sale in Victoria. Approximately 1,600 pigs are sold every Wednesday. Vendors travel as far away as Nhill (3418), Serviceton (3420), Casterton (3311), the Victorian Wimmera and the Mallee areas of South Australia. The majority of vendors are commercial growers with some hobby producers producing ‘spit pigs’. Of the pigs presented, approximately 1400 are porkers and baconers, with 100 suckers/weaners and 100 backfatters. Volumes increase just before Christmas as growers do not want to hold pigs over the Christmas period and risk them growing too heavy to sell post-Christmas. Volumes also depend on feed and water availability to grow the pigs out. The majority (80%) of purchasers are butchers, with the remaining 20% being re-stockers. Sheep and cattle are also sold at the Ballarat saleyards but on different days to the pigs. After the pig sales, any straw bedding provided is raked out and removed and the pens are hosed out. The other live sale of pigs held in Victoria on a regular basis is at Huntly (3550) in Bendigo. This sale is held on Thursday on a fortnightly basis. Most vendors are hobby producers and they originate from areas including Swan Hill (3585), Shepparton (3630) and Finley (2713). Approximately 400 pigs are sold at each sale with the majority (55%) being weaners/suckers and the rest are evenly distributed among porkers, baconers and backfatters. There is an increase in the number of pigs presented at the end of the year — particularly with drought times resulting in a shortage of feed and water. Sheep and cattle are also sold at this saleyard. The pens are hosed out after the pig sales. 10.3 Queensland Live pig sales are held on a regular basis at Toowoomba and Oakey. Sales also occur at Warwick and Gatton but only small numbers (30–40 pigs) are sold at these sales. Pig sales are held every Monday at South Street Toowoomba (4350) and attract a mixture of vendor types including commercial, semi-commercial and hobby farmers from around the local area and including Warwick and Darling Downs. Sale numbers range from 300–500 pigs presented at each sale day with about 50% being suckers/weaners and an equal proportion of porkers and baconers making up the remainder of the pigs sold. Very few backfatters (approximately 7%) are sold here. Volumes sold are fairly static with a slight rise in the lead up to Christmas as producers try to get an equivalent price for heavy pork as bacon post-Christmas. Approximately 80% of pigs are purchased by processors and/or butchers, with the remaining 20% being bought by re-stockers. Regular butchers originate from Beaudesert (4285), Killarney (4373), Esk (4312), Brisbane (4000), Lowood
57

(4311) and St George (4487). Sheep and cattle are sold on the same day as the pigs and pens are hosed out at the end of the sale. Live sales of pigs are also conducted at Cory Street, Oakey (4401) every Tuesday. Again, a mix of vendor types brings their pigs to the sale but vendors tend to favour one saleyard over another. Pig sales range from 400–600 pigs per sale with a similar distribution of age groups sold as in Toowoomba, with weaners being the majority population represented. There are few trends in volumes with the exception of an increase in the number of suckers and weaners presented in December, January and February. This is in-line with Christmas and Chinese New Year. Approximately 80% of pigs are purchased by the same butchers/wholesalers as those that frequent the Toowoomba saleyards. The remaining 20% of pigs are purchased by re-stockers. Cattle are also sold at this saleyard, with calf and pig sales occurring on the same day. Adult cattle are sold on a separate day. Pens are hosed out after the sale. 10.4 South Australia There are four locations where pigs are sold live in South Australia. The main sale is at Dublin, but there are also saleyards at Truro, Murray Bridge and Gladstone. Pigs are sold at the Dublin saleyard (Carslake Rd, Dublin 5501) every Tuesday. Approximately 1000–2000 pigs are sold at each sale with all pigs being either porkers or baconers. Only the occasional sucker or backfatter is sold here. Commercial pig producers travel from all over SA to attend this sale. Volumes are fairly steady thoughout the year, with a slight decline in numbers in June as cropping takes precedence over the selling of pigs. Almost all pigs are purchased by over 20 different butchers from both within and outside of SA. Sheep are also sold at this sale on the same day. Cattle are sold on a different day. The pens are hosed out after each sale. The saleyard at Murray Bridge (Saleyard Road, Murray Bridge 5253) takes place monthly on a Wednesday. Most vendors are local growers but pigs travel as far away as the South East of SA (Keith, Naracoorte) to be sold. At each sale, approximately 500 pigs are presented with an even mix of suckers/weaners, porkers, baconers and backfatters. Sale volumes are maintained at a fairly static level throughout the year. There are many purchasers — mainly locals — and include market gardeners and other backyard type hobby farmers. Sheep and cattle are sold on the same sale day. The pens are hosed out at the end of each sale. The third largest sale in SA takes place at Railway Terrace, Truro (5356). This sale occurs on a Wednesday on a monthly basis. Small commercial pig producers from mainly around Truro (but can travel as far away as Mildura) present about 300 pigs to this sale. The vast majority (90%) of pigs sold at the saleyard are suckers/weaners, with the remaining 10% backfatters. Volumes are fairly static throughout the year. Approximately 20% of pigs are purchased by a handful of local butchers and restaurant owners for local killing. The remaining 80% are purchased by re-stockers. These pigs are housed on straw while at the sale and this is removed at the end of each sale day. No other livestock species are sold at this sale yard. The Gladstone (5473) pig sale is held on a Monday on a monthly basis. This sale is used by small local producers to sell their pigs. Approximately 150 pigs are sold at each sale, with the vast majority (90%) being suckers/weaners and the remaining 10% being backfatters. Sale volumes are fairly consistent throughout the year. The pens are swept and/or hosed out at the end of each sale. 10.5 Western Australia There is one saleyard in Western Australia, situated in Lloyd Street, Midland (6056). This saleyard closed down temporarily in early 2006 but has since re-opened in March 2006 at the request of local producers and buyers. Pig sales are held on a Wednesday on an as-needs basis. Sales only take place if there are a minimum of 200 pigs to be sold. Average pig numbers are 380 per sale, with no specific age/type of pig represented. Vendors originate from all over WA and are a mix of commercial and hobby farmers. There has been a steady decline in pigs sold at Midland in the past 5–10 years as more pigs are sold on contract via direct consignment to processing plants. Approximately 80% of purchasers are butchers, with the remaining 20% being re-stockers. A large
58
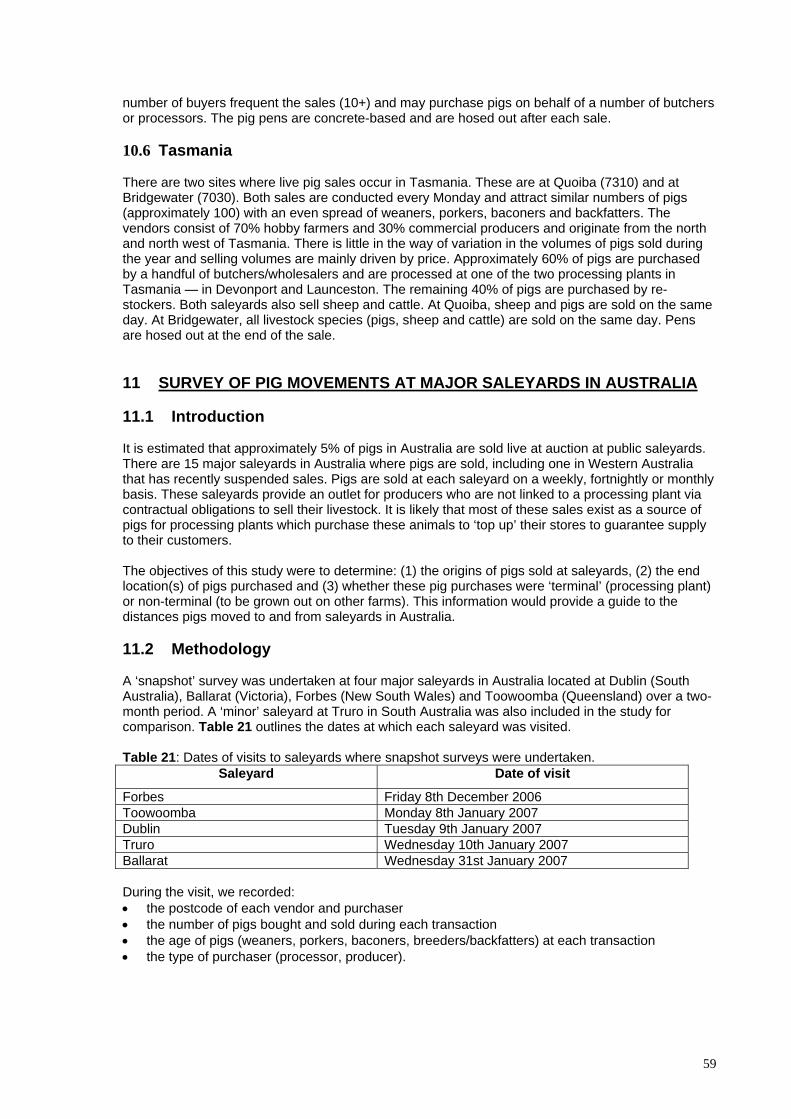
number of buyers frequent the sales (10+) and may purchase pigs on behalf of a number of butchers or processors. The pig pens are concrete-based and are hosed out after each sale. 10.6 Tasmania There are two sites where live pig sales occur in Tasmania. These are at Quoiba (7310) and at Bridgewater (7030). Both sales are conducted every Monday and attract similar numbers of pigs (approximately 100) with an even spread of weaners, porkers, baconers and backfatters. The vendors consist of 70% hobby farmers and 30% commercial producers and originate from the north and north west of Tasmania. There is little in the way of variation in the volumes of pigs sold during the year and selling volumes are mainly driven by price. Approximately 60% of pigs are purchased by a handful of butchers/wholesalers and are processed at one of the two processing plants in Tasmania — in Devonport and Launceston. The remaining 40% of pigs are purchased by re-stockers. Both saleyards also sell sheep and cattle. At Quoiba, sheep and pigs are sold on the same day. At Bridgewater, all livestock species (pigs, sheep and cattle) are sold on the same day. Pens are hosed out at the end of the sale. 11 SURVEY OF PIG MOVEMENTS AT MAJOR SALEYARDS IN AUSTRALIA 11.1 Introduction It is estimated that approximately 5% of pigs in Australia are sold live at auction at public saleyards. There are 15 major saleyards in Australia where pigs are sold, including one in Western Australia that has recently suspended sales. Pigs are sold at each saleyard on a weekly, fortnightly or monthly basis. These saleyards provide an outlet for producers who are not linked to a processing plant via contractual obligations to sell their livestock. It is likely that most of these sales exist as a source of pigs for processing plants which purchase these animals to ‘top up’ their stores to guarantee supply to their customers. The objectives of this study were to determine: (1) the origins of pigs sold at saleyards, (2) the end location(s) of pigs purchased and (3) whether these pig purchases were ‘terminal’ (processing plant) or non-terminal (to be grown out on other farms). This information would provide a guide to the distances pigs moved to and from saleyards in Australia. 11.2 Methodology A ‘snapshot’ survey was undertaken at four major saleyards in Australia located at Dublin (South Australia), Ballarat (Victoria), Forbes (New South Wales) and Toowoomba (Queensland) over a two-month period. A ‘minor’ saleyard at Truro in South Australia was also included in the study for comparison. Table 21 outlines the dates at which each saleyard was visited. Table 21: Dates of visits to saleyards where snapshot surveys were undertaken.
Saleyard Date of visit
Forbes Friday 8th December 2006 Toowoomba Monday 8th January 2007 Dublin Tuesday 9th January 2007 Truro Wednesday 10th January 2007 Ballarat Wednesday 31st January 2007 During the visit, we recorded: • the postcode of each vendor and purchaser • the number of pigs bought and sold during each transaction • the age of pigs (weaners, porkers, baconers, breeders/backfatters) at each transaction • the type of purchaser (processor, producer).
59
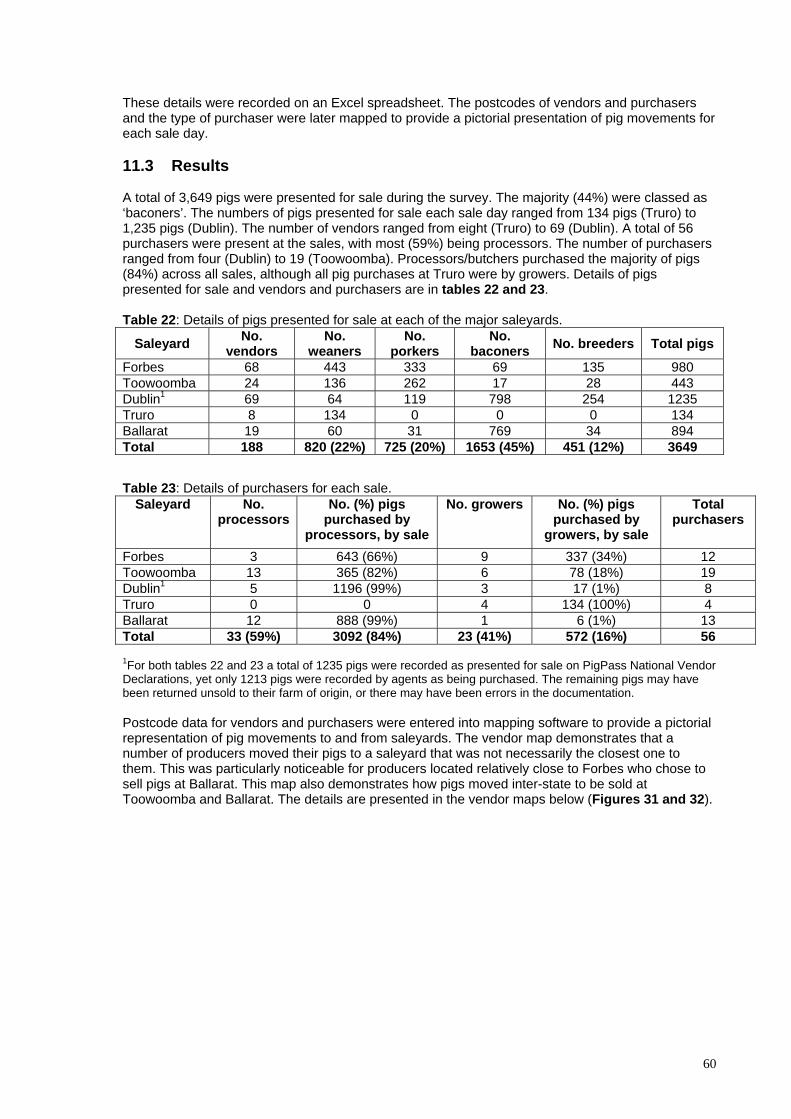
These details were recorded on an Excel spreadsheet. The postcodes of vendors and purchasers and the type of purchaser were later mapped to provide a pictorial presentation of pig movements for each sale day. 11.3 Results A total of 3,649 pigs were presented for sale during the survey. The majority (44%) were classed as ‘baconers’. The numbers of pigs presented for sale each sale day ranged from 134 pigs (Truro) to 1,235 pigs (Dublin). The number of vendors ranged from eight (Truro) to 69 (Dublin). A total of 56 purchasers were present at the sales, with most (59%) being processors. The number of purchasers ranged from four (Dublin) to 19 (Toowoomba). Processors/butchers purchased the majority of pigs (84%) across all sales, although all pig purchases at Truro were by growers. Details of pigs presented for sale and vendors and purchasers are in tables 22 and 23. Table 22: Details of pigs presented for sale at each of the major saleyards.
Saleyard No. vendors
No. weaners
No. porkers
No. baconers No. breeders Total pigs
Forbes 68 443 333 69 135 980 Toowoomba 24 136 262 17 28 443 Dublin1 69 64 119 798 254 1235 Truro 8 134 0 0 0 134 Ballarat 19 60 31 769 34 894 Total 188 820 (22%) 725 (20%) 1653 (45%) 451 (12%) 3649 Table 23: Details of purchasers for each sale.
Saleyard No. processors
No. (%) pigs purchased by
processors, by sale
No. growers No. (%) pigs purchased by
growers, by sale
Total purchasers
Forbes 3 643 (66%) 9 337 (34%) 12 Toowoomba 13 365 (82%) 6 78 (18%) 19 Dublin1 5 1196 (99%) 3 17 (1%) 8 Truro 0 0 4 134 (100%) 4 Ballarat 12 888 (99%) 1 6 (1%) 13 Total 33 (59%) 3092 (84%) 23 (41%) 572 (16%) 56
1For both tables 22 and 23 a total of 1235 pigs were recorded as presented for sale on PigPass National Vendor Declarations, yet only 1213 pigs were recorded by agents as being purchased. The remaining pigs may have been returned unsold to their farm of origin, or there may have been errors in the documentation. Postcode data for vendors and purchasers were entered into mapping software to provide a pictorial representation of pig movements to and from saleyards. The vendor map demonstrates that a number of producers moved their pigs to a saleyard that was not necessarily the closest one to them. This was particularly noticeable for producers located relatively close to Forbes who chose to sell pigs at Ballarat. This map also demonstrates how pigs moved inter-state to be sold at Toowoomba and Ballarat. The details are presented in the vendor maps below (Figures 31 and 32).
60
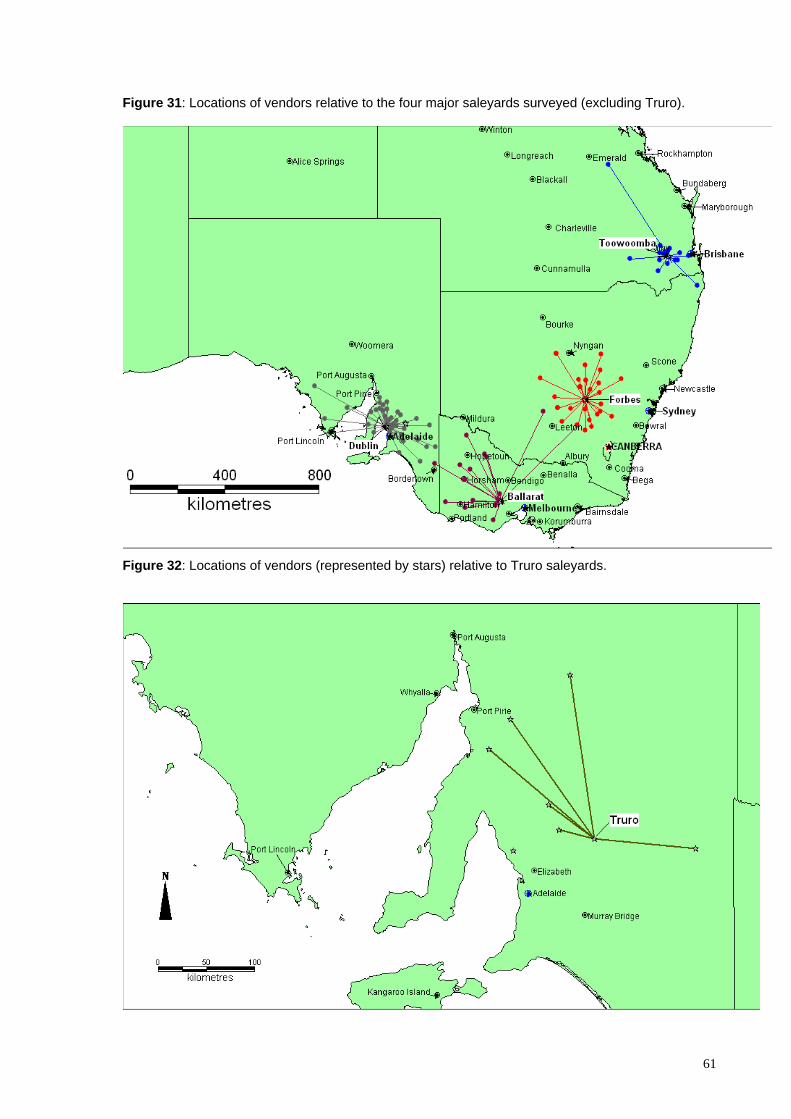
Figure 31: Locations of vendors relative to the four major saleyards surveyed (excluding Truro).
Figure 32: Locations of vendors (represented by stars) relative to Truro saleyards.
61
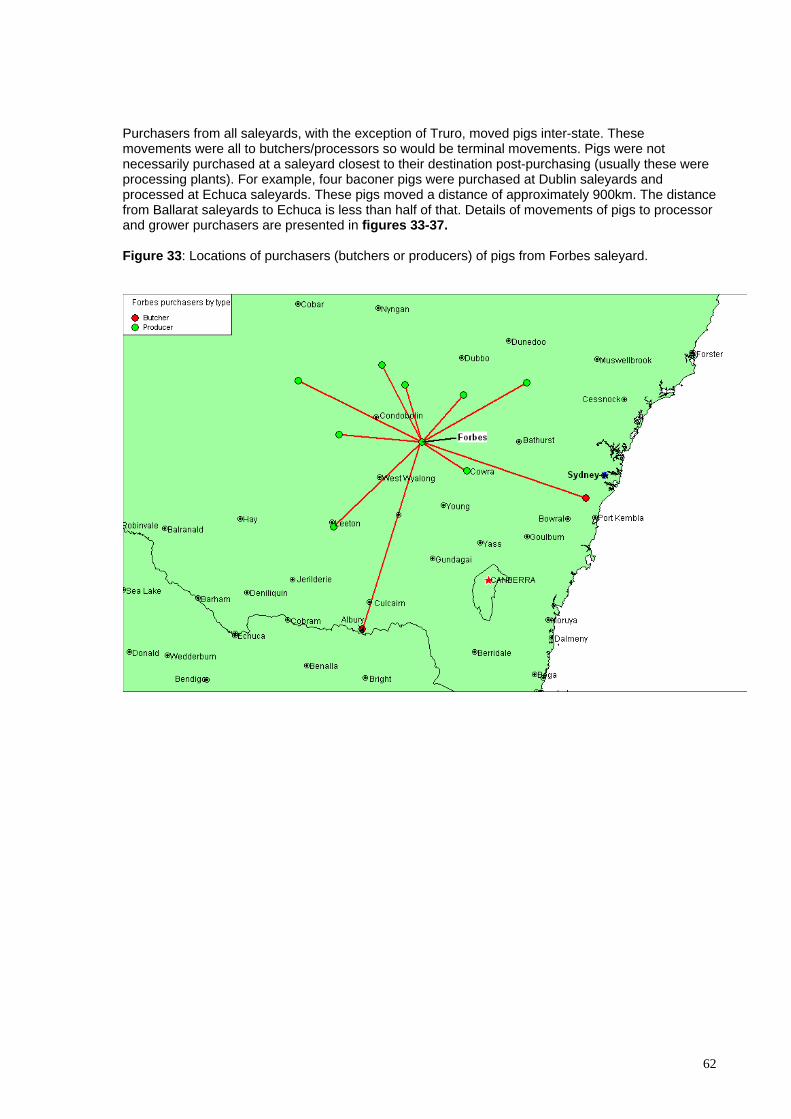
Purchasers from all saleyards, with the exception of Truro, moved pigs inter-state. These movements were all to butchers/processors so would be terminal movements. Pigs were not necessarily purchased at a saleyard closest to their destination post-purchasing (usually these were processing plants). For example, four baconer pigs were purchased at Dublin saleyards and processed at Echuca saleyards. These pigs moved a distance of approximately 900km. The distance from Ballarat saleyards to Echuca is less than half of that. Details of movements of pigs to processor and grower purchasers are presented in figures 33-37. Figure 33: Locations of purchasers (butchers or producers) of pigs from Forbes saleyard.
62

Figure 34: Locations of purchasers (butchers and/or abattoir and producers) of pigs from Toowoomba saleyards.
Figure 35: Locations of purchasers (butchers and growers) of pigs from Dublin saleyards.
63
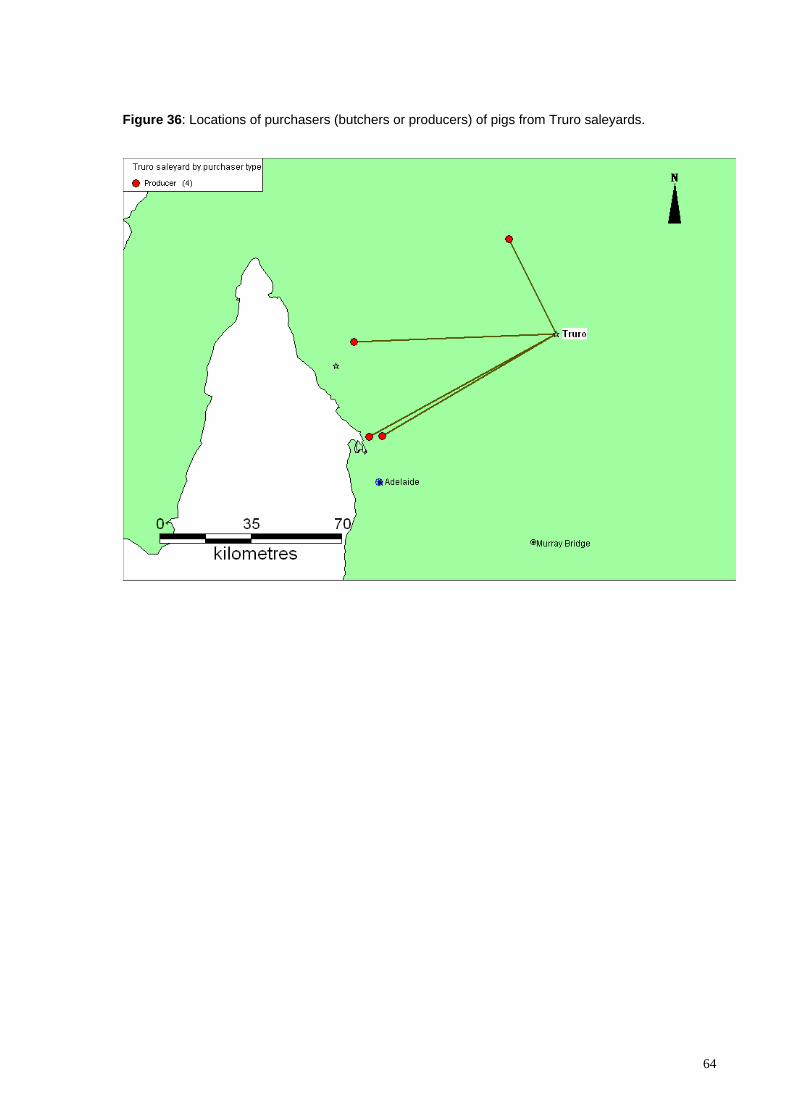
Figure 36: Locations of purchasers (butchers or producers) of pigs from Truro saleyards.
64
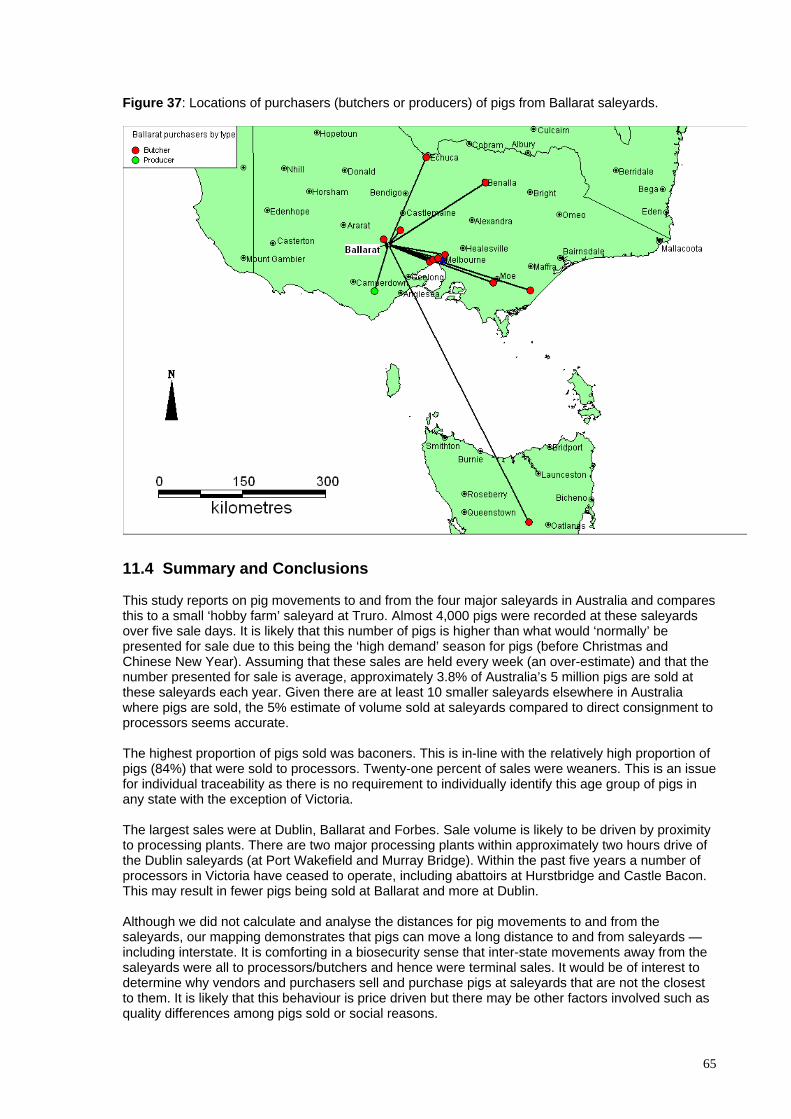
Figure 37: Locations of purchasers (butchers or producers) of pigs from Ballarat saleyards.
11.4 Summary and Conclusions This study reports on pig movements to and from the four major saleyards in Australia and compares this to a small ‘hobby farm’ saleyard at Truro. Almost 4,000 pigs were recorded at these saleyards over five sale days. It is likely that this number of pigs is higher than what would ‘normally’ be presented for sale due to this being the ‘high demand’ season for pigs (before Christmas and Chinese New Year). Assuming that these sales are held every week (an over-estimate) and that the number presented for sale is average, approximately 3.8% of Australia’s 5 million pigs are sold at these saleyards each year. Given there are at least 10 smaller saleyards elsewhere in Australia where pigs are sold, the 5% estimate of volume sold at saleyards compared to direct consignment to processors seems accurate. The highest proportion of pigs sold was baconers. This is in-line with the relatively high proportion of pigs (84%) that were sold to processors. Twenty-one percent of sales were weaners. This is an issue for individual traceability as there is no requirement to individually identify this age group of pigs in any state with the exception of Victoria. The largest sales were at Dublin, Ballarat and Forbes. Sale volume is likely to be driven by proximity to processing plants. There are two major processing plants within approximately two hours drive of the Dublin saleyards (at Port Wakefield and Murray Bridge). Within the past five years a number of processors in Victoria have ceased to operate, including abattoirs at Hurstbridge and Castle Bacon. This may result in fewer pigs being sold at Ballarat and more at Dublin. Although we did not calculate and analyse the distances for pig movements to and from the saleyards, our mapping demonstrates that pigs can move a long distance to and from saleyards — including interstate. It is comforting in a biosecurity sense that inter-state movements away from the saleyards were all to processors/butchers and hence were terminal sales. It would be of interest to determine why vendors and purchasers sell and purchase pigs at saleyards that are not the closest to them. It is likely that this behaviour is price driven but there may be other factors involved such as quality differences among pigs sold or social reasons.
65
12.4 Acknowledgments We would like to thank all the saleyard agents who assisted in data compilation for this study. We would also like to thank Dr Marta Hernandez-Jover, Ms Nicole Schembri (University of Sydney) and Mr Chris Van Dissel (PIRSA) for their assistance in gathering data from saleyards held at Toowoomba, Dublin and Truro. 13 MOVEMENT DYNAMICS AMONG PIG FARMS
13.1 Introduction Pork producers in Australia can be subdivided into three broad categories: (1) hobby or opportunistic producers, (2) private commercial enterprises often inter-twined with other commercial primary production practices and (3) large commercial enterprises that are often vertically integrated with feed mills and/or processing plants. There are examples of the three farm category types in all states of Australia, with the larger commercial enterprises sited in more regional locations close to feed supplies and/or processing plants. The majority of pork producers bring genetic material onto their farms — either in the form of replacement breeding stock and/or semen — to maintain their breeding herd inventory. This genetic material can be purchased from a commercial breeding company or from a neighbour, or may be supplied from specialist breeding herds (nucleus or multiplication herds) upstream from within the company in the case of larger commercial enterprises. In recent times, many larger producers have developed ‘multi-site’ pork production systems. This has come about with increasing herd size and with the recognition of health advantages associated with rearing pigs in age-segregated batches. These systems may include a breeding/farrowing site, weaner site, grower site and finisher site — or any combination of the above. Hence, pigs reared in these multi-site systems may move anything from one to four times during their life. The major ‘product’ for pork producers is livestock. It is estimated that approximately 95% of pigs produced move directly (via direct consignment) to processing plants. The remaining pigs are sold live via public auction, privately via livestock agents, or door-to-door among friends and relatives — usually for private celebrations. The age at which pigs are sold depends on market requirements, and this will vary between domestic and export markets and with season. The majority of pigs are sold as pork or bacon at 15 weeks of age or more. A small minority will be sold to processors and/or butchers as ‘spit pigs’ (less than 10 weeks of age) with a seasonal increase in demand for these pigs in January and February — prior to Chinese New Year. With these movements comes an increased risk of disease introduction via livestock, semen, personnel, trucks and/or associated equipment. Recommended best practice is to use one genetic supplier only with a health status similar or better than that of the home farm. There are also a plethora of biosecurity recommendations designed to minimize the risk of pathogen entry via personnel or fomites. These include “pig-free” times before visiting farms, showering in, providing clothing for visitors and recording visitor movements onto the farm. This chapter outlines a study undertaken to determine information on the following movement dynamics among pig farms: • pig and semen movements on and off farms • methods used to market pigs • variations in movement patterns on and off farms and factors that impact on this • biosecurity practices undertaken to minimize the risk of disease entry • the presence of other livestock species on the farm.
66

13.2 Methodology A two-page postal survey was forwarded to 50 pork producers in Australia, stratified by state and herd size (less than 50 sows, 50–499 sows, 500+ sows). Producers were encouraged to reply with an incentive of a chance to win a $50 gift voucher. Surveys were accompanied by: (1) a cover letter outlining the survey objectives and instructions on completing the survey, (2) a letter from DAFF authenticating the survey, and (3) a stamped self-addressed envelope. The survey was conducted in December 2006. The number of producers was selected based on a target response number of 20 and an anticipated response rate of 40%. A copy of the survey is attached (Appendix 1). No follow up procedures were undertaken after the first survey posting. 13.3 Results There were 23 responses to the survey, a response rate of 46%. Of these, 20 were able to be analysed as three producers had ceased to be involved in pig production. Analysable responses were received from producers in all states including Victoria (six responses), New South Wales (five responses, Queensland (four responses), South Australia (three responses), Tasmania (one response) and Western Australia (one response). Analysable responses were also received from producers representing all herd sizes including less than 50 sows (three producers), 50–499 sows (11 responses) and 500+ sows (four responses). A response was also received from a producer who reared pigs only for grow-out. One response was received from a producer who had just de-stocked but was able to provide all details on recent practices and pig movements. These results are presented in table 24. Table 24: Descriptive statistics for producers responding to the pig movement postal survey. Producer number State Postcode No. breeders No. weaners No. growers
38 VIC 3563 55 600 1200 39 VIC 3875 110 260 420 40 VIC 3387 200 600 5 42 VIC 3624 466 524 2130 41 VIC 3644 500 700 2400 45 VIC 3352 2480 0 13200 15 QLD 4655 5 0 0 19 QLD 4612 0 2000 4000 16 QLD 4671 100 200 200 20 QLD 4517 850 3000 0 29 SA 5333 90 140 570 31 SA 5261 250 350 1300 32 SA 5371 430 1250 1100 51 NSW 2577 20 56 72 4 NSW 2358 45 0 0 10 NSW 2342 50 70 100 8 NSW 2581 270 800 1200 11 NSW 2594 5581 16466 26003 48 WA 6326 0 0 0 35 TAS 7303 350 700 1400
The majority of producers surveyed housed their pigs indoors, either totally on concrete (six responses) or in a combination of concrete and bedded pens (seven responses). The remaining producers housed their pigs: only outdoors in paddocks (two responses); in a combination of paddocks and bedded sheds (two responses); in paddocks and non-bedded sheds (two producers); or in paddocks and bedded and non-bedded sheds (one producer).
67
13.3.1 On-farm biosecurity The majority of producers responding to the survey also reared ruminants on their pig farm (17 responses). Three of these also reared birds (chickens and/or ducks). Only three of the 20 responses had neither ruminants nor birds. A variety of biosecurity measures were undertaken by respondents to prevent the entry of disease-causing pathogens into their farms. Most (16 responses, 80%) required that visitors had a ‘pig-free’ time before visiting their farm. This was the only biosecurity measure maintained by four of these producers. The others coupled this with showering in (three responses), signing a visitor’s book (nine responses) and/or supplying clothing to visitors (10 responses). On one farm, the supply of clothing was the only biosecurity measure while on another this was coupled with signing a visitor’s book. The total number of farms that provided site-specific clothing was 12 (60%). One farm maintained a footbath as the only biosecurity measure. Only one producer replied that they had no biosecurity measures in place on their farm. The majority of producers fed pigs only either commercially-prepared pre-mixed feed (nine responses), mixed their own feed using commercial ingredients (four responses), or a combination of the two (three responses). Three producers used factory-food waste (dog biscuits, whey, yoghurt etc) in addition to the commercial diets fed, while one also supplemented pigs with milk. Most producers disposed of pig effluent on their own farm site only (17 responses, 85%), whilst three producers also disposed of effluent off-site. 13.3.2 Movement dynamics 13.3.2.1 Movements on to farms Information on the movement of livestock and/or semen on to farms was provided by 16 producers responding to the survey. Of these, livestock travelled distances ranging from 0km to 1,200km from the home farm. Five producers sourced live pigs and/or semen from states outside of their home farm state. All producers purchased these from farms and/or boar studs. None claimed to purchase pigs from saleyards. Eleven of the 16 producers (69%) purchased replacement breeding stock +/- semen. Four producers purchased semen only, while six producers purchased live replacement stock and semen. One producer purchased weaners only. The frequency of purchases ranged from weekly to yearly. Seven of the producers who purchased semen did so weekly, while two producers purchased semen on a monthly basis and one producer purchased semen every three months. Replacement breeding stock was purchased less frequently than semen, with inputs ranging from monthly (one producer), bi-monthly (three producers), every three months (three producers) and yearly (three producers). One producer did not answer this question. Live pig movements on to farms ranged from one boar every year to 90 weaners every week. Semen volume ranged from 10 doses every quarter to 150 doses each week. The pattern of live pig and/or semen movements on to farms did not alter, with the exception of three farms — two ‘as required’ and the third claimed to depend on the drop off of livestock from another multi-site operation. These results are detailed in table 25.
68
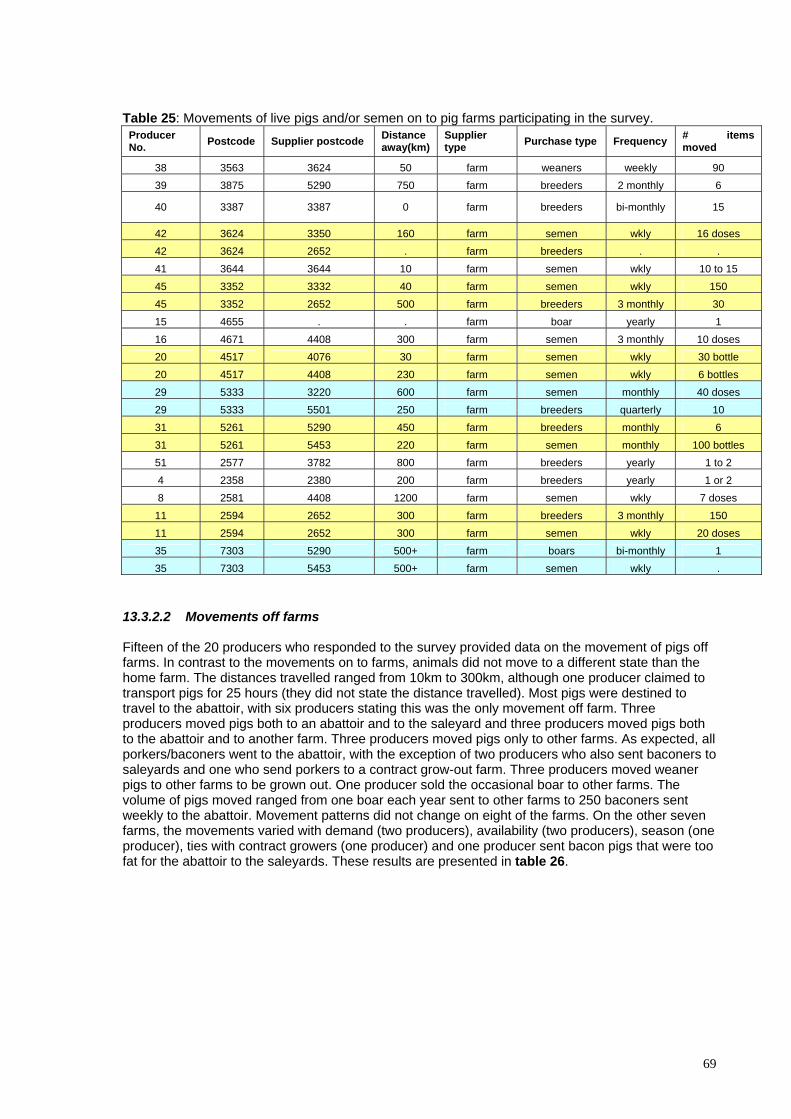
Table 25: Movements of live pigs and/or semen on to pig farms participating in the survey.
Producer No. Postcode Supplier postcode Distance
away(km) Supplier type Purchase type Frequency # items
moved
38 3563 3624 50 farm weaners weekly 90 39 3875 5290 750 farm breeders 2 monthly 6
40 3387 3387 0 farm breeders bi-monthly 15
42 3624 3350 160 farm semen wkly 16 doses 42 3624 2652 . farm breeders . . 41 3644 3644 10 farm semen wkly 10 to 15 45 3352 3332 40 farm semen wkly 150 45 3352 2652 500 farm breeders 3 monthly 30 15 4655 . . farm boar yearly 1 16 4671 4408 300 farm semen 3 monthly 10 doses 20 4517 4076 30 farm semen wkly 30 bottle 20 4517 4408 230 farm semen wkly 6 bottles 29 5333 3220 600 farm semen monthly 40 doses 29 5333 5501 250 farm breeders quarterly 10 31 5261 5290 450 farm breeders monthly 6 31 5261 5453 220 farm semen monthly 100 bottles 51 2577 3782 800 farm breeders yearly 1 to 2 4 2358 2380 200 farm breeders yearly 1 or 2 8 2581 4408 1200 farm semen wkly 7 doses
11 2594 2652 300 farm breeders 3 monthly 150 11 2594 2652 300 farm semen wkly 20 doses 35 7303 5290 500+ farm boars bi-monthly 1 35 7303 5453 500+ farm semen wkly .
13.3.2.2 Movements off farms Fifteen of the 20 producers who responded to the survey provided data on the movement of pigs off farms. In contrast to the movements on to farms, animals did not move to a different state than the home farm. The distances travelled ranged from 10km to 300km, although one producer claimed to transport pigs for 25 hours (they did not state the distance travelled). Most pigs were destined to travel to the abattoir, with six producers stating this was the only movement off farm. Three producers moved pigs both to an abattoir and to the saleyard and three producers moved pigs both to the abattoir and to another farm. Three producers moved pigs only to other farms. As expected, all porkers/baconers went to the abattoir, with the exception of two producers who also sent baconers to saleyards and one who send porkers to a contract grow-out farm. Three producers moved weaner pigs to other farms to be grown out. One producer sold the occasional boar to other farms. The volume of pigs moved ranged from one boar each year sent to other farms to 250 baconers sent weekly to the abattoir. Movement patterns did not change on eight of the farms. On the other seven farms, the movements varied with demand (two producers), availability (two producers), season (one producer), ties with contract growers (one producer) and one producer sent bacon pigs that were too fat for the abattoir to the saleyards. These results are presented in table 26.
69

Table 26: Movements of pigs off pig farms.
Producer # Postcode Purchaser postcode Distance from
farm Purchaser type Item type Sale frequency # items moved
38 3563 3624 50 farm breeders wkly 7 gilts, 1 boar 40 3387 3478 40 farm weaners fortnightly 160 40 3387 3672 300 abattoir breeders monthly 7 41 3644 3644 10 abattoir baconers wkly 140 15 4655 . 50 hobby farms weaners . . 19 4612 ? 70 abbatoir baconers wkly 250 16 4671 4621 30 abattoir baconers wkly 30 20 4517 4405 210 contractor porkers wkly 240 20 4517 4610 200 abbatoir sows/porkers wkly 12 29 5333 5550 280 abbatoir porkers 2 wkly 70 29 5333 5501 260 saleyard breeders occasionally 5 31 5261 5000 132 abattoir baconers monthly 350 31 5261 5000 132 saleyard baconers monthly 30-40 32 5371 5253 100 abattoir/saleyard baconers wkly 100 51 2577 2576 40 abattoir porkers wkly 4 to 6 4 2358 2353 100 farm weaners monthly 50
10 2342 2135 25hrs abattoir porkers wkly 10 8 2581 2794 100 abattoir baconers wkly 100
35 7303 7310 . abattoir baconers . . 35 7303 varies 10-80km farm boars yearly 1
13.4 Discussion This survey was designed to be a ‘snapshot’ of movement dynamics in a small sector of the pork production industry in Australia. The survey population was small but was stratified across states and herd sizes. It also included producers with a variety of housing systems — including ‘traditional’ (concrete based) housing, bedded housing and free-range (outdoor housing). Our results demonstrate that 85% of producers surveyed also reared ruminant species on their properties. This would allow for the ready transmission of foot and mouth disease between these two livestock types, if that disease were to occur in Australia. A smaller proportion of producers (15%) also kept poultry which may be an issue should avian influenza occur in this country. Probably the most effective biosecurity tool for preventing disease entry into pig farms is to purchase live animals from one or two suppliers of known equivalent or better health status to the home farm. The results of the movement dynamics section of this survey suggests this was the case among our survey population, with none of the producers claiming to have purchased live animals from more than one source or from saleyards. This is a positive result although we are not able to determine the relative health status of supplier’s farms. It is recommended to producers that they supply visitors with clothing before they enter the farm to prevent the mechanical transmission of disease pathogens. Our survey results demonstrated that this recommendation was implemented by 60% of producers. The most frequently quoted biosecurity measure reported in this survey was a ‘pig-free’ time for personnel before visiting the farm. There is little data on the effectiveness of this approach in preventing disease entry but it would have a positive effect on limiting the number of visitors entering farms. Only two producers had no effective biosecurity measures. This includes one producer who claimed they relied on footbaths to minimize disease entry. Eighty percent of producers participating in this survey relied solely on commercial diets to feed their pigs. Three producers supplemented these commercial diets with (non-swill) human feed by-products. This practice is likely to increase in incidence as grain prices increase with the drought.
70

These results demonstrate that there is little opportunity for the entry of exotic disease into these pig herds via swill feeding. Fifteen percent of producers disposed of effluent off-site of the home farm. This may present a hazard for the spread of disease agents to other sites, should they exist in pigs in the home farm. Our survey provided some basic information on the dynamics of pig movements on and off farms. It is clear from our survey results that producers were keen to source replacement livestock and/or semen from farms that were a reasonable distance away. This was reflected in the proportion (31%) of producers who sourced replacement breeding stock from interstate. The producer in Tasmania sourced both his live animals and semen from South Australia. These extensive movements demonstrate how widely an exotic disease would travel should it enter a pig herd unnoticed. On a positive note, the movement of live animals on to farms was relatively infrequent which might lower the risk. This is in contrast to semen movements on to farms which generally occurred on a weekly basis. Producers surveyed tended to move pigs a shorter distance from the farm to send them to abattoirs, saleyards or other farms, with a maximum distance of 300km travelled by pigs from one farm. This is likely to correlate with the increased frequency of pig movements, with most being moved off on a weekly basis. As expected, most pigs that moved off farms were destined to abattoirs. It was surprising that a total of nine producers (60%) also sold pigs at saleyards and/or other farms. This increases the risk of disease transmission should such a thing occur in the home farm. This is particularly a problem where pigs are commingled with many other pigs and possibly other livestock species at saleyards. In addition, where pigs are sold directly to other farms there is no requirement (with the exception of Western Australia) to document these movements. This would make it difficult to track animal movements. 13.5 Summary The results of this ‘snapshot’ survey highlight key factors that impact on the risk of exotic disease introduction and transmission among pig farms in Australia: • co-habitation of pigs, ruminants and poultry on farms • a proportion of producers do not have effective biosecurity procedures in place to prevent
disease entry • a small proportion of producers (15%) disposed of effluent away from the home farm • replacement breeding stock travel long distances to farms, but on an infrequent basis • semen may also travel inter-state, and is brought more frequently on to farms • most producers moved live animals off their farms to saleyards and/or to other farms.
71
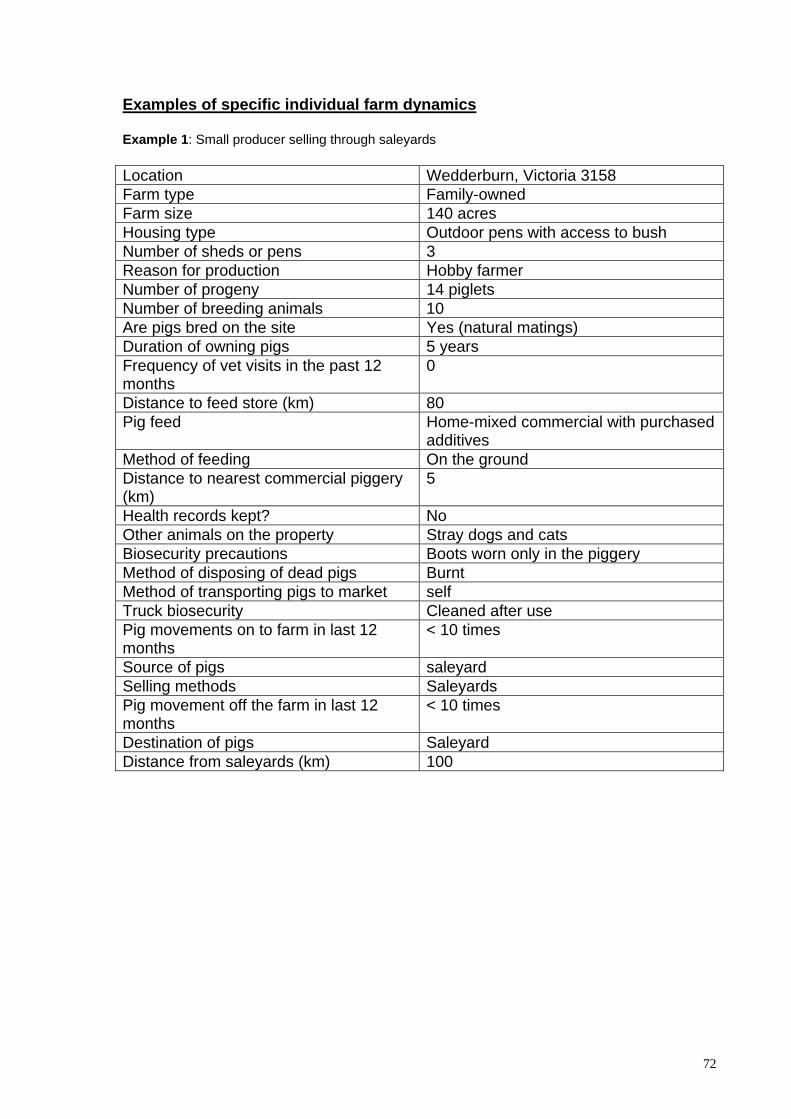
Examples of specific individual farm dynamics
Example 1: Small producer selling through saleyards Location Wedderburn, Victoria 3158 Farm type Family-owned Farm size 140 acres Housing type Outdoor pens with access to bush Number of sheds or pens 3 Reason for production Hobby farmer Number of progeny 14 piglets Number of breeding animals 10 Are pigs bred on the site Yes (natural matings) Duration of owning pigs 5 years Frequency of vet visits in the past 12 months
0
Distance to feed store (km) 80 Pig feed Home-mixed commercial with purchased
additives Method of feeding On the ground Distance to nearest commercial piggery (km)
5
Health records kept? No Other animals on the property Stray dogs and cats Biosecurity precautions Boots worn only in the piggery Method of disposing of dead pigs Burnt Method of transporting pigs to market self Truck biosecurity Cleaned after use Pig movements on to farm in last 12 months
< 10 times
Source of pigs saleyard Selling methods Saleyards Pig movement off the farm in last 12 months
< 10 times
Destination of pigs Saleyard Distance from saleyards (km) 100
72
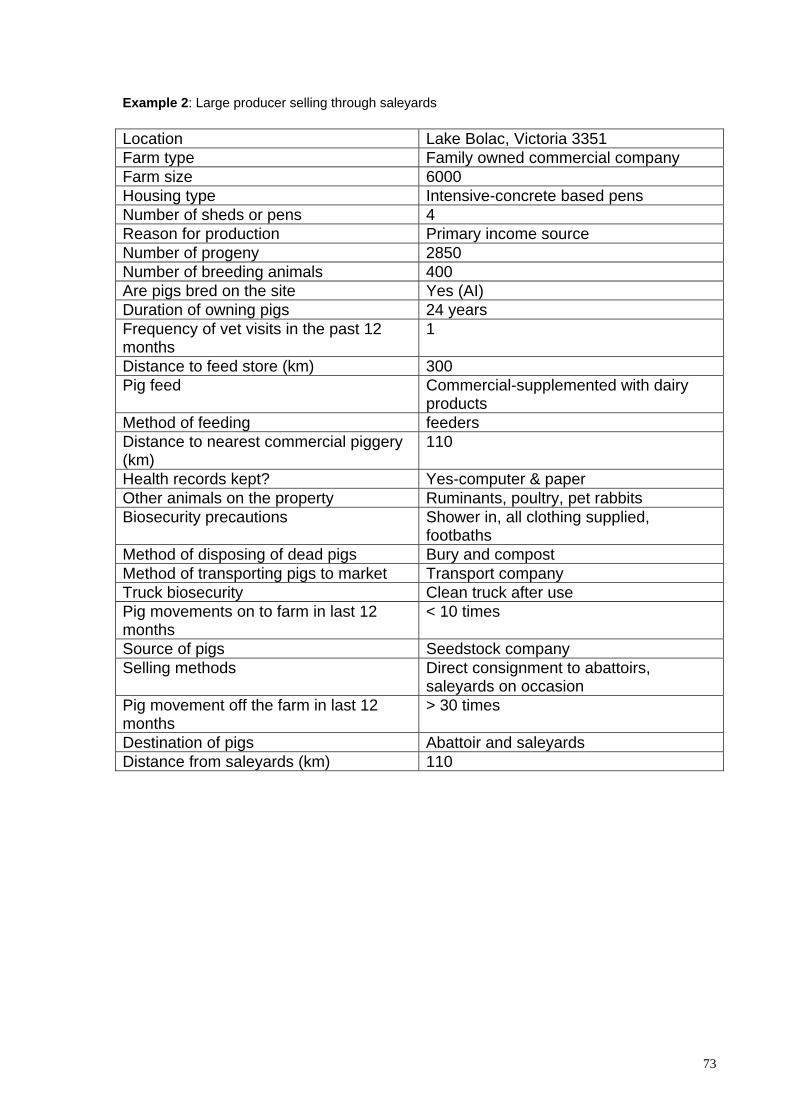
Example 2: Large producer selling through saleyards Location Lake Bolac, Victoria 3351 Farm type Family owned commercial company Farm size 6000 Housing type Intensive-concrete based pens Number of sheds or pens 4 Reason for production Primary income source Number of progeny 2850 Number of breeding animals 400 Are pigs bred on the site Yes (AI) Duration of owning pigs 24 years Frequency of vet visits in the past 12 months
1
Distance to feed store (km) 300 Pig feed Commercial-supplemented with dairy
products Method of feeding feeders Distance to nearest commercial piggery (km)
110
Health records kept? Yes-computer & paper Other animals on the property Ruminants, poultry, pet rabbits Biosecurity precautions Shower in, all clothing supplied,
footbaths Method of disposing of dead pigs Bury and compost Method of transporting pigs to market Transport company Truck biosecurity Clean truck after use Pig movements on to farm in last 12 months
< 10 times
Source of pigs Seedstock company Selling methods Direct consignment to abattoirs,
saleyards on occasion Pig movement off the farm in last 12 months
> 30 times
Destination of pigs Abattoir and saleyards Distance from saleyards (km) 110
73
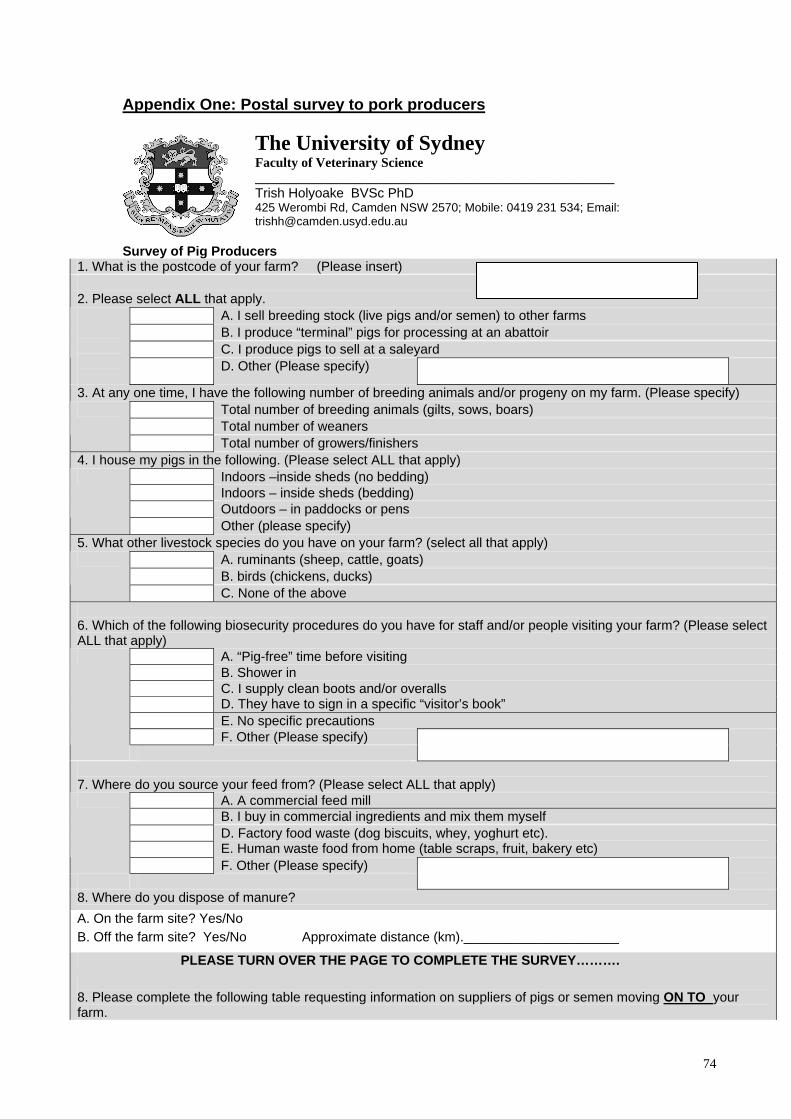
Appendix One: Postal survey to pork producers
The University of Sydney Faculty of Veterinary Science ______________________________________________________ Trish Holyoake BVSc PhD 425 Werombi Rd, Camden NSW 2570; Mobile: 0419 231 534; Email: [email protected]
Survey of Pig Producers 1. What is the postcode of your farm? (Please insert) 2. Please select ALL that apply.
A. I sell breeding stock (live pigs and/or semen) to other farms B. I produce “terminal” pigs for processing at an abattoir C. I produce pigs to sell at a saleyard
D. Other (Please specify)
3. At any one time, I have the following number of breeding animals and/or progeny on my farm. (Please specify) Total number of breeding animals (gilts, sows, boars) Total number of weaners
Total number of growers/finishers 4. I house my pigs in the following. (Please select ALL that apply)
Indoors –inside sheds (no bedding) Indoors – inside sheds (bedding) Outdoors – in paddocks or pens
Other (please specify) 5. What other livestock species do you have on your farm? (select all that apply)
A. ruminants (sheep, cattle, goats) B. birds (chickens, ducks)
C. None of the above 6. Which of the following biosecurity procedures do you have for staff and/or people visiting your farm? (Please select ALL that apply)
A. “Pig-free” time before visiting B. Shower in
C. I supply clean boots and/or overalls D. They have to sign in a specific “visitor’s book”
E. No specific precautions F. Other (Please specify)
7. Where do you source your feed from? (Please select ALL that apply)
A. A commercial feed mill B. I buy in commercial ingredients and mix them myself
D. Factory food waste (dog biscuits, whey, yoghurt etc). E. Human waste food from home (table scraps, fruit, bakery etc)
F. Other (Please specify)
8. Where do you dispose of manure? A. On the farm site? Yes/No B. Off the farm site? Yes/No Approximate distance (km)._____________________
PLEASE TURN OVER THE PAGE TO COMPLETE THE SURVEY………. 8. Please complete the following table requesting information on suppliers of pigs or semen moving ON TO your farm.
74

Supplier postcode or district name
Approx. distance (km) from your farm
Type of supplier- farm/ saleyard/ other
Purchase type breeding stock/ weaners/growers /semen
Frequency of movements- daily/weekly /monthly
Avg. number of animals or semen moved per time
Do movement patterns vary? Yes/no
If “yes” why?
9. Please complete the following table requesting information on purchasers/receivers of pigs and/or semen OFF FROM your farm.
Purchaser postcode or district name
Approx. distance (km) from your farm
Type of purchaser- abattoir/ farm/ saleyard/ other
Sale type breeding stock/ weaners/growers /semen
Frequency of movements- daily/weekly /monthly
Avg. number of animals or semen moved per time
Do movement patterns vary? Yes/no
If “yes” why?
Thank you for your time and effort in completing this questionnaire. The results of this survey are confidential and will be used as part of a report to the Department of Agriculture, Fisheries and Forestry (DAFF) on “Pig Movements in Australia”. If you would like more information on this study, please contact Dr Trish Holyoake on Ph (02) 93511617 or 0412 017 265 or via email: [email protected].
75
REFERENCES Baker, G. & Barber, G. 2004, Exchange Rates, Parliamentary library at
www.aph.gov.au/library/pubs/mesi/FEATURES/Exchange-rates.htm accessed Dec 2006. Bates, T.W., Thurmond, M.C. & Carpenter, T.E. 2001, Direct and indirect contact rates among beef,
dairy, goat, pig and swine herds in three California counties, with reference to control of potential foot-and-mouth disease transmission. Am J Vet Res 62:1121-1129.
Cha, E. 2006, A preliminary study of the risks of foot and mouth disease involving pigs at agricultural shows. BSc (Vet) Thesis, University of Sydney.
Cunningham, D.C., Fabiansson, S.U., Sykes, W. & Munro, R.K. 2002, Tracking and mapping livestock movements in Australia. Bureau of Rural Sciences, Canberra.
Cutler, R. & Dunlop, H. 2002, ‘Biosecurity’ in Eradicating Diseases of Pigs pp. 5–24. Pig Research and Development Corporation, Canberra.
Cutler, R. & Thornton, E. 2002, A Biosecurity Code of Practice for the Australian Pig Industry, Con 1761, Australian Pork Limited.
Cutler, R., Fahy, T., Moore, K., Gleeson, B., Dunlop, H. & Hill, J. 2006, Dissemination of an outbreak of Mycoplasma hyopneumoniae, Proceedings: Australian Pig Veterinarians, Melbourne, pp 91–94.
Dowling, D. 2006, Australian Pig Annual (2005 edition). Australian Pork Limited, Canberra. Garner, M.G. & Beckett, S.D. 2005, Modelling the spread of foot-and-mouth disease in Australia.
Aust Vet J 2005 Dec 83(12):758–66. Goodwin, R. 1985, Apparent infection of Enzootic-pneumonia-free pig herds: Search for possible
causes. Vet Rec 116:690–694. Love, R.J. 2002, Eradication of Menangle Virus in Eradicating Diseases of Pigs pp. 95–100. Pig
Research and Development Corporation, Canberra. Meo, H. & Cleary, G.V.C. 2000, Pig Stats 99. Australian Pig Industry Handbook. Australian Pork
Corporation, Pig R&D Corporation, Canberra. Myer, S. 2006, PIC Canada Symposium, Montreal, October 2006 Day 2. Nielen, M. et al. 1996, Quantification of contacts between Dutch farms to assess the potential risk of
foot-and-mouth disease spread. Preventative Veterinary Medicine 28:143-158. Nairn, K. 2003, There’s a whole lot of shaking going on. Congenital tremors: a WA case study. Proc
Aust Assoc Pig Vets Conf, Cairns, pp 105–107. Ogawa,T. & Matsuda, K. 2000, Potential risk of transmission of foot-and-mouth disease in
Kagoshima prefecture in Japan. Jap Agric Res Quart 34:3 (http://ss.jircas.affrc.go.jp/engpage/jarq/34-3/ogawa/ogawa.htm)
PigChamp, 2005, Benchmarking. http://www.pigchamp.com accessed April 2007. Productivity Commission 2005, Australian Pigmeat Industry, Report no. 35, Melbourne. Sanson, R.L. et al, 1993, The potential extent of transmission of foot-and-mouth disease: A study of
the movement of animals and materials in Southland, New Zealand. NZ Vet J 41:21–28. Unicef, 2006, http://www.unicef.org/infobycountry/australia_statistics.html accessed Dec 2006. USDA, 2006, Domestic and foreign wheat prices, 1980–2005 usda.mannlib.cornell.edu/data-
sets/crops/88008/table22.xls accessed Dec2006. Williams, N. 2006, PIC Canada Symposium, Montreal, October 2006 Day 1.
76