prentice hall algebra 1 - pc\|macimages.pcmac.org/sisfiles/schools/tn/bradleycounty...prentice hall...
TRANSCRIPT
Boston, Massachusetts Chandler, Arizona Glenview, Illinois Upper Saddle River, New Jersey
Prentice Hall
Algebra 1
Progress Monitoring Assessments
Copyright © Pearson Education, Inc., or its affiliates. All Rights Reserved. Printed in the United States of America. This publication is protected by copyright, and permission should be obtained from the publisher prior to any prohibited reproduction, storage in a retrieval system, or transmission in any form or by any means, electronic, mechanical, photocopying, recording, or likewise. The publisher hereby grants permission to reproduce these pages, in part or in whole, for classroom use only, the number not to exceed the number of students in each class. Notice of copyright must appear on all copies. For information regarding permissions, write to Pearson Curriculum Group Rights & Permissions, One Lake Street, Upper Saddle River, New Jersey 07458.
Pearson, Prentice Hall, and Pearson Prentice Hall are trademarks, in the U.S. and/or other countries, of Pearson Education, Inc., or its affiliates.
SAT is a registered trademark of the College Entrance Examination Board. ACT is a trademark owned by ACT, Inc. Use of the trademarks implies no relationship, sponsorship, endorsement, sale, or promotion on the part of Pearson Education, Inc., or its affiliates.
ISBN-13: 978-0-13-253155-9 ISBN-10: 0-13-253155-0
1 2 3 4 5 6 7 8 9 10 V084 14 13 12 11 10
Progress Monitoring AssessmentsCopyright © by Pearson Education, Inc., or its affiliates. All Rights Reserved.
iii
Table of Contents
To the Teacher . . . . . . . . . . . . . . . . . . . . . . . . . . . . . . . . . . . . . . . . . . . . . . . . v
Screening Test . . . . . . . . . . . . . . . . . . . . . . . . . . . . . . . . . . . . . . . . . . . . . . . . . 1
Screening Test Report . . . . . . . . . . . . . . . . . . . . . . . . . . . . . . . . . . . . . . . . . 7
Standards Progress Tests
Standards Progress Test 1, Chapters 1 and 2 . . . . . . . . . . . . . . . . . . . . . 9
Standards Progress Test 1 Report . . . . . . . . . . . . . . . . . . . . . . . . . . . . 15
Standards Progress Test 2, Chapters 3 and 4 . . . . . . . . . . . . . . . . . . . . 17
Standards Progress Test 2 Report . . . . . . . . . . . . . . . . . . . . . . . . . . . . 23
Standards Progress Test 3, Chapters 5 and 6 . . . . . . . . . . . . . . . . . . . . 25
Standards Progress Test 3 Report . . . . . . . . . . . . . . . . . . . . . . . . . . . . 31
Standards Progress Test 4, Chapters 7 and 8 . . . . . . . . . . . . . . . . . . . . 33
Standards Progress Test 4 Report . . . . . . . . . . . . . . . . . . . . . . . . . . . . 39
Standards Progress Test 5, Chapters 9–12. . . . . . . . . . . . . . . . . . . . . . . 41
Standards Progress Test 5 Report . . . . . . . . . . . . . . . . . . . . . . . . . . . . 49
Summative Assessments, Form G
Quarter 1 Test, Chapters 1–3 . . . . . . . . . . . . . . . . . . . . . . . . . . . . . . . . . . 51
Quarter 2 Test, Chapters 4–6 . . . . . . . . . . . . . . . . . . . . . . . . . . . . . . . . . . 53
Quarter 3 Test, Chapters 7–9 . . . . . . . . . . . . . . . . . . . . . . . . . . . . . . . . . . 55
Quarter 4 Test, Chapters 10–12 . . . . . . . . . . . . . . . . . . . . . . . . . . . . . . . . 57
Mid-Course Test, Chapters 1–6 . . . . . . . . . . . . . . . . . . . . . . . . . . . . . . . . 59
Final Test, Chapters 1–12 . . . . . . . . . . . . . . . . . . . . . . . . . . . . . . . . . . . . . 63
Progress Monitoring AssessmentsCopyright © by Pearson Education, Inc., or its affiliates. All Rights Reserved.
iv
Summative Assessments, Form K
Quarter 1 Test, Chapters 1–3 . . . . . . . . . . . . . . . . . . . . . . . . . . . . . . . . . . 67
Quarter 2 Test, Chapters 4–6 . . . . . . . . . . . . . . . . . . . . . . . . . . . . . . . . . . 69
Quarter 3 Test, Chapters 7–9 . . . . . . . . . . . . . . . . . . . . . . . . . . . . . . . . . . 71
Quarter 4 Test, Chapters 10–12 . . . . . . . . . . . . . . . . . . . . . . . . . . . . . . . . 73
Mid-Course Test, Chapters 1–6 . . . . . . . . . . . . . . . . . . . . . . . . . . . . . . . . 75
Final Test, Chapters 1–12 . . . . . . . . . . . . . . . . . . . . . . . . . . . . . . . . . . . . . 79
End of Course Algebra 1 Practice Test . . . . . . . . . . . . . . . . . . . . . . . . 83
Correlation Chart: End of Course Algebra 1 Practice Test
to the Tennessee State Performance Indicators . . . . . . . . . . . . . . . . . 95
SAT/ACT Preparation
Introduction . . . . . . . . . . . . . . . . . . . . . . . . . . . . . . . . . . . . . . . . . . . . . . . . . 99
Highlights . . . . . . . . . . . . . . . . . . . . . . . . . . . . . . . . . . . . . . . . . . . . . . . . . . 100
Test-Taking Tips. . . . . . . . . . . . . . . . . . . . . . . . . . . . . . . . . . . . . . . . . . . . . 108
Practice Test . . . . . . . . . . . . . . . . . . . . . . . . . . . . . . . . . . . . . . . . . . . . . . . . 115
Answers . . . . . . . . . . . . . . . . . . . . . . . . . . . . . . . . . . . . . . . . . . . . . . . . . . . . . 127
Student Answer Sheets . . . . . . . . . . . . . . . . . . . . . . . . . . . . . . . . . . . . . . 135
Progress Monitoring AssessmentsCopyright © by Pearson Education, Inc., or its affiliates. All Rights Reserved.
v
To the Teacher:During the school year, you assess how well students in your classroom are learning using various types of assessments. Prentice Hall’s Progress Monitoring Assessments provides a clear path to adequate yearly progress through systematic testing and recommendations for remediation.
Formative AssessmentsFormative Assessments help you monitor students’ understandings of key concepts and the development of important skills. The results of these assessments serve as a guide to help in the planning and adjusting of the curriculum to meet your students’ learning needs. Formative Assessments in this book are listed below.
Screening Test Before launching into the curriculum, have students complete the Screening Test. It will help you assess students’ levels of proficiency in basic computation and problem-solving skills.
Standards Progress TestsProficiency testing is at the heart of student achievement. At specified intervals throughout the school year, have students take one of the Tennessee Standards Progress Tests to assess their progress towards proficiency of the essential content of the State Performance Indicators for Algebra 1.
Summative AssessmentsSummative Assessments help you determine how proficient students are in the concepts and skills that were the recent focus of instruction. These assessments are generally administered at the end of a quarter, semester, or school year. Summative Assessments in this book are listed below.
Quarter and Mid-Course Tests These tests are designed to measure students’ mastery of content over a number of chapters. Two levels of Quarter and Mid-Course Tests are provided. The G-level tests are appropriate for students enrolled in on-grade level or advanced-level courses and the K-level tests are designed for students using the Foundations series or for students who might benefit from a lower academic reading level.
Final TestThe Final Test is a cumulative test that measures students’ mastery of content over the full school year.
Progress Monitoring AssessmentsCopyright © by Pearson Education, Inc., or its affiliates. All Rights Reserved.
vi
Standardized or State AssessmentsYour students are likely used to taking standardized or state-mandated assessments. Students take the SAT or ACT as part of the college application process. State-mandated assessments are a high school graduation requirement in many states. This book provides students with practice for these two types of tests.
SAT® and ACT® Practice TestYou can use these pages to acquaint students with topics, question formats, and practice for the SAT or the ACT. The activities and practice provided on these pages will help students be less anxious when they take these high-stakes assessments.
End of Course Practice TestAn End of Course Practice Test is also available. This practice test matches the content and format of the End of Course Algebra 1 Test and offers your students practice with both the mathematical concepts tested on the End of Course Algebra 1 Test and question types found on the test. Also provided is a test report that your students can use to self-evaluate their readiness for the actual test. Students can give themselves one (1) point for multiple-choice questions that they answer correctly. At the bottom of the page, students can find their total points.
Name Class Date
Prentice Hall Algebra 1 • Progress Monitoring AssessmentsCopyright © by Pearson Education, Inc., or its affiliates. All Rights Reserved.
1
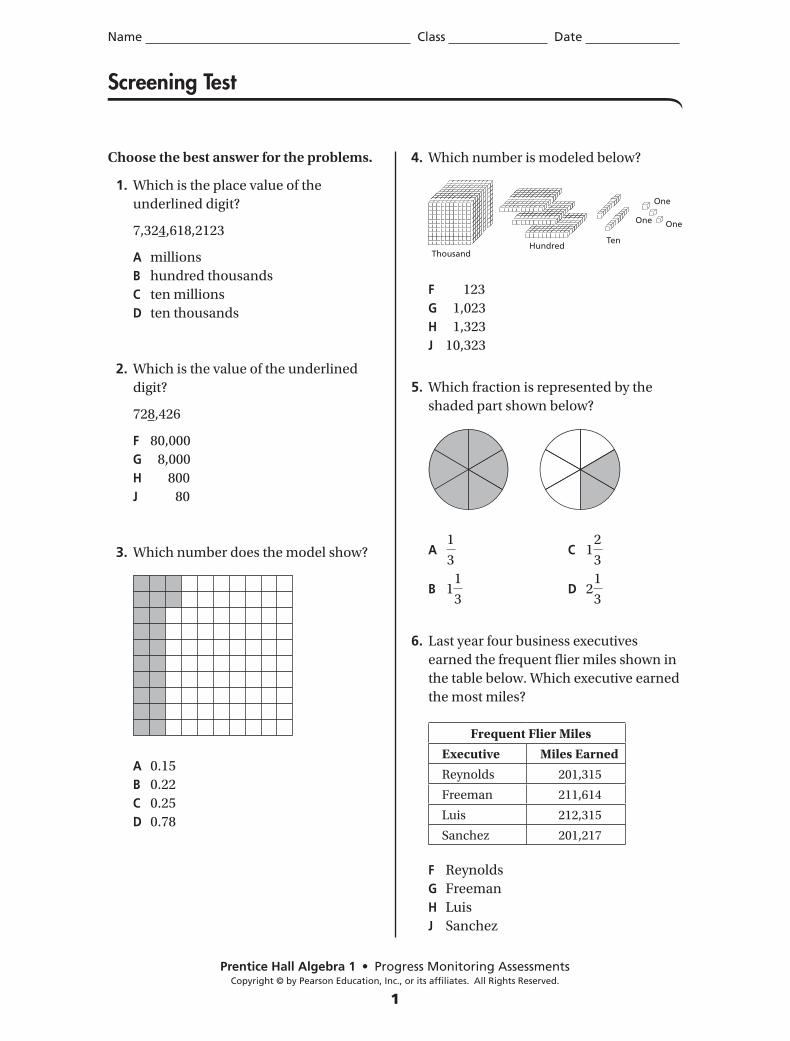
Choose the best answer for the problems.
1. Which is the place value of the
underlined digit?
7,324,618,2123
A millions
B hundred thousands
C ten millions
D ten thousands
2. Which is the value of the underlined
digit?
728,426
F 80,000
G 8,000
H 800
J 80
3. Which number does the model show?
A 0.15
B 0.22
C 0.25
D 0.78
4. Which number is modeled below?
ThousandHundred
Ten
One
One One
F 123
G 1,023
H 1,323
J 10,323
5. Which fraction is represented by the
shaded part shown below?
A 1
3 C 1
2
3
B 11
3 D 2
1
3
6. Last year four business executives
earned the frequent fl ier miles shown in
the table below. Which executive earned
the most miles?
Frequent Flier Miles
Executive Miles Earned
Reynolds 201,315
Freeman 211,614
Luis 212,315
Sanchez 201,217
F Reynolds
G Freeman
H Luis
J Sanchez
Screening Test
PHS4674_NAA1_ST.indd 1 6/27/09 1:55:20 PM
Prentice Hall Algebra 1 • Progress Monitoring AssessmentsCopyright © by Pearson Education, Inc., or its affiliates. All Rights Reserved.
2
Name Class Date
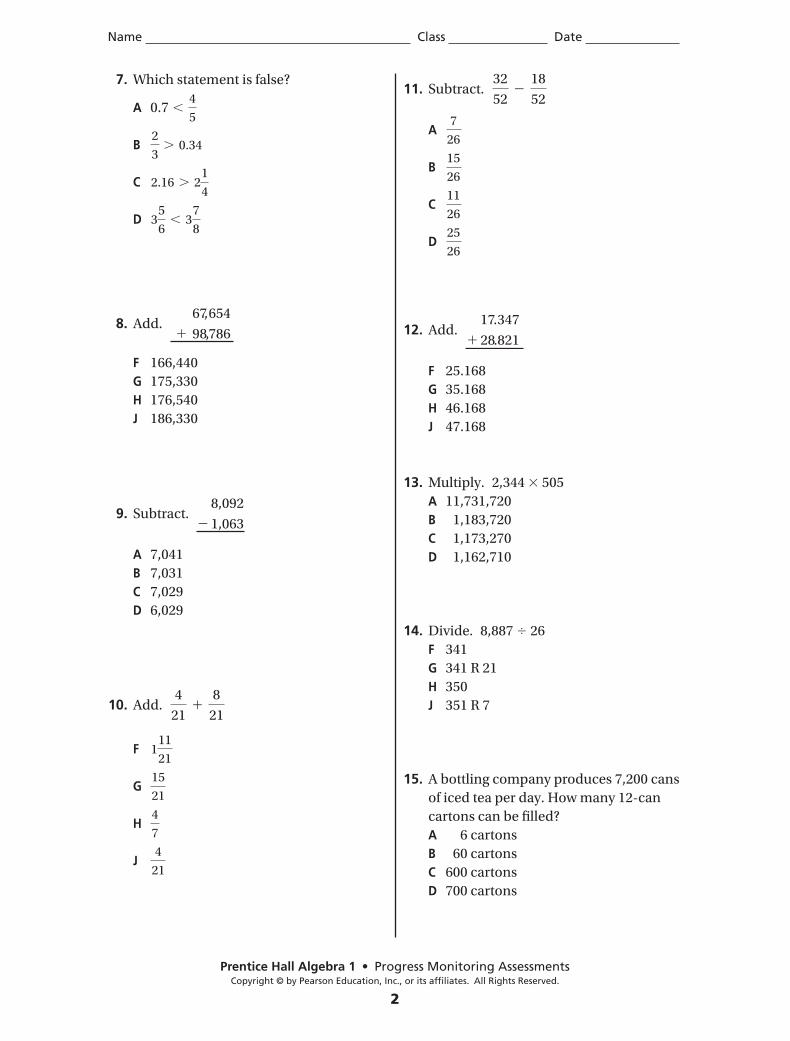
7. Which statement is false?
A 0.7 , 4
5
B 2
3. 0.34
C 2.16 . 21
4
D 35
6, 3
7
8
8. Add. 67,654
1 98,786
F 166,440
G 175,330
H 176,540
J 186,330
9. Subtract. 8,092
2 1,063
A 7,041
B 7,031
C 7,029
D 6,029
10. Add. 4
211
8
21
F 111
21
G 15
21
H 4
7
J 4
21
11. Subtract. 32
522
18
52
A 7
26
B 15
26
C 11
26
D 25
26
12. Add. 17.347
1 28.821
F 25.168
G 35.168
H 46.168
J 47.168
13. Multiply. 2,344 3 505
A 11,731,720
B 1,183,720
C 1,173,270
D 1,162,710
14. Divide. 8,887 4 26
F 341
G 341 R 21
H 350
J 351 R 7
15. A bottling company produces 7,200 cans
of iced tea per day. How many 12-can
cartons can be fi lled?
A 6 cartons
B 60 cartons
C 600 cartons
D 700 cartons
PHS4674_NAA1_ST.indd 2 6/27/09 1:55:21 PM
Prentice Hall Algebra 1 • Progress Monitoring AssessmentsCopyright © by Pearson Education, Inc., or its affiliates. All Rights Reserved.
3
Name Class Date
16. Which ratio could be used to solve the
following problem?
Ken drives his car 800 miles in 3 days.
At this rate, how far will he drive in
5 days?
F 800
55
3
x
G 800
35
5
x
H 800
85
x
5
J 800
35
x
5
17. Which number is odd?
A 37,246
B 82,342
C 764,820
D 82,341,361
18. Which set of numbers list all of the factors
of 121?
F 1, 121
G 1, 2, 60, 121
H 1, 11, 121
J 1, 3, 4, 40, 30, 121
19. Simplify. 8(7 2 4)2 1 3 ? 2 ? 5
A 78 B 102
C 510 D 750
20. Find the quotient. 4
54
2
25
F 2
125
G 8
125
H 2
J 10
21. A 1
14 mile stretch of split-rail fence is to
be constructed along one side of a farm.
If it takes one day to construct 12 mile of
fencing, how many days will it take to
complete the fencing on the farm?
A 1 day
B 2 days
C 21
2 days
D 23
4 days
22. Evaluate m 1 m2 1 2b3 for m 5 4
and b 5 0.
F 12
G 14
H 20
J 22
23. You need to measure the height of your
bean plants each week for a science
project. Which unit of measurement
would you use?
A centimeters
B meters
C kilometers
D grams
24. To measure the height of your bean
plants (from question 23) which
instrument should you use?
F compass
G stopwatch
H thermometer
J ruler
PHS4674_NAA1_ST.indd 3 6/27/09 1:55:23 PM
Prentice Hall Algebra 1 • Progress Monitoring AssessmentsCopyright © by Pearson Education, Inc., or its affiliates. All Rights Reserved.
4
Name Class Date
25. Th e formula for the perimeter of a
rectangle is P 5 2l 1 2w. Use the
formula to determine how many feet of
fencing would be needed to go around a
rectangular vegetable garden measuring
30 feet by 25 feet.
A 55 feet
B 85 feet
C 110 feet
D 750 feet
26. Th e formula for the area of a rectangle
is A 5 lw. A fi eld has a length of 260
meters and a width of 500 meters. Part
of the fi eld 50 meters by 200 meters, is
paved for a parking lot. How much of the
area remains unpaved?
F 10,000 m2
G 80,000 m2
H 120,000 m2
J 130,000 m2
27. Mr. Kingston is going to have new carpet
installed in his living room. In order to
help him estimate the cost of the carpet
what does he need to determine?
A the perimeter of the living room
B the area of the living room
C the volume of the living room
D the surface area of the room
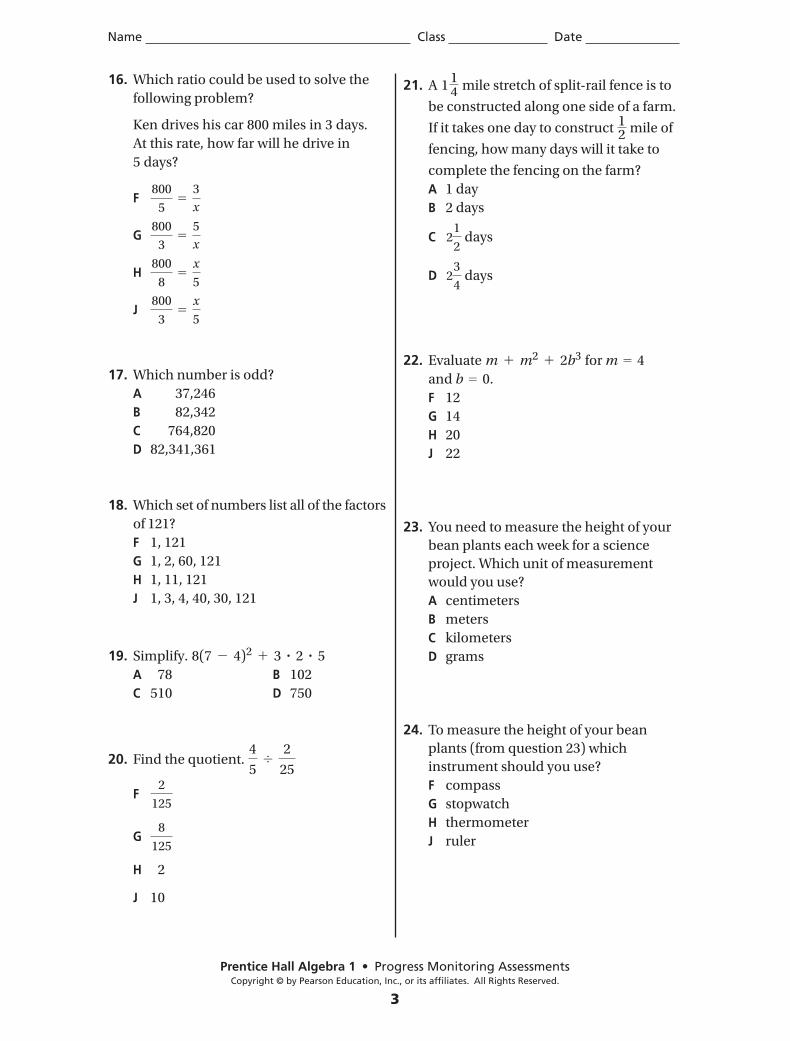
28. What is the best geometric description of
the fi gure shown?
F circle
G cylinder
H sphere
J hemisphere
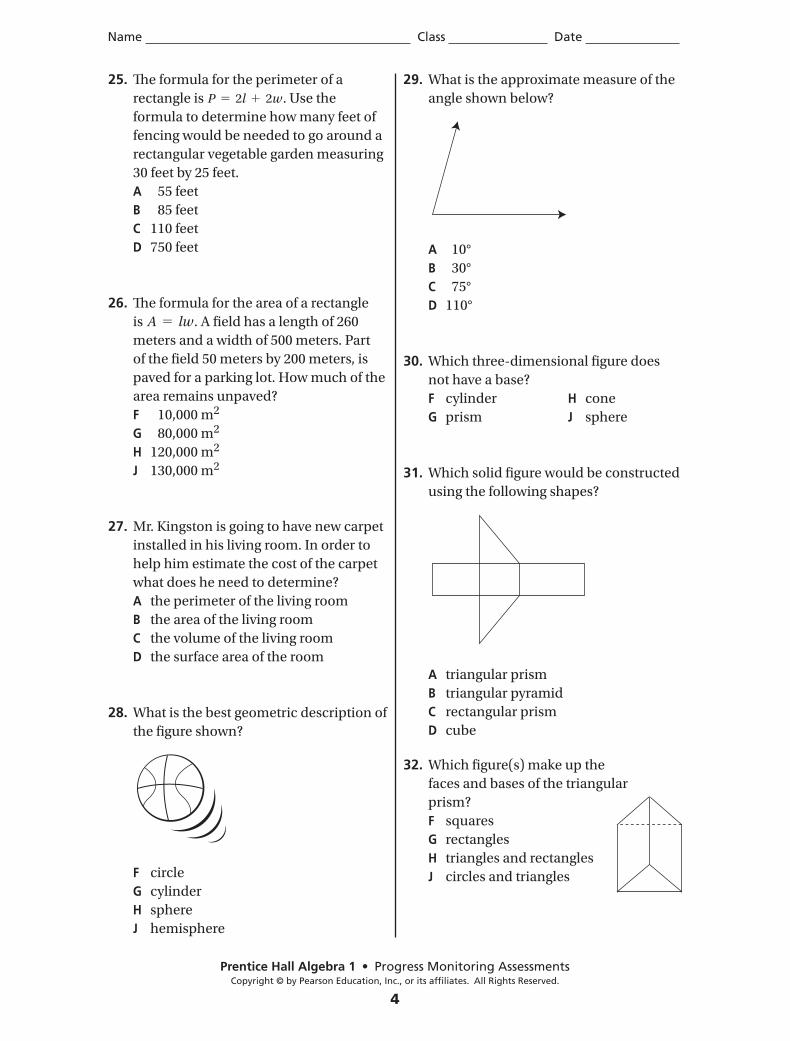
29. What is the approximate measure of the
angle shown below?
A 10°
B 30°
C 75°
D 110°
30. Which three-dimensional fi gure does
not have a base?
F cylinder H cone
G prism J sphere
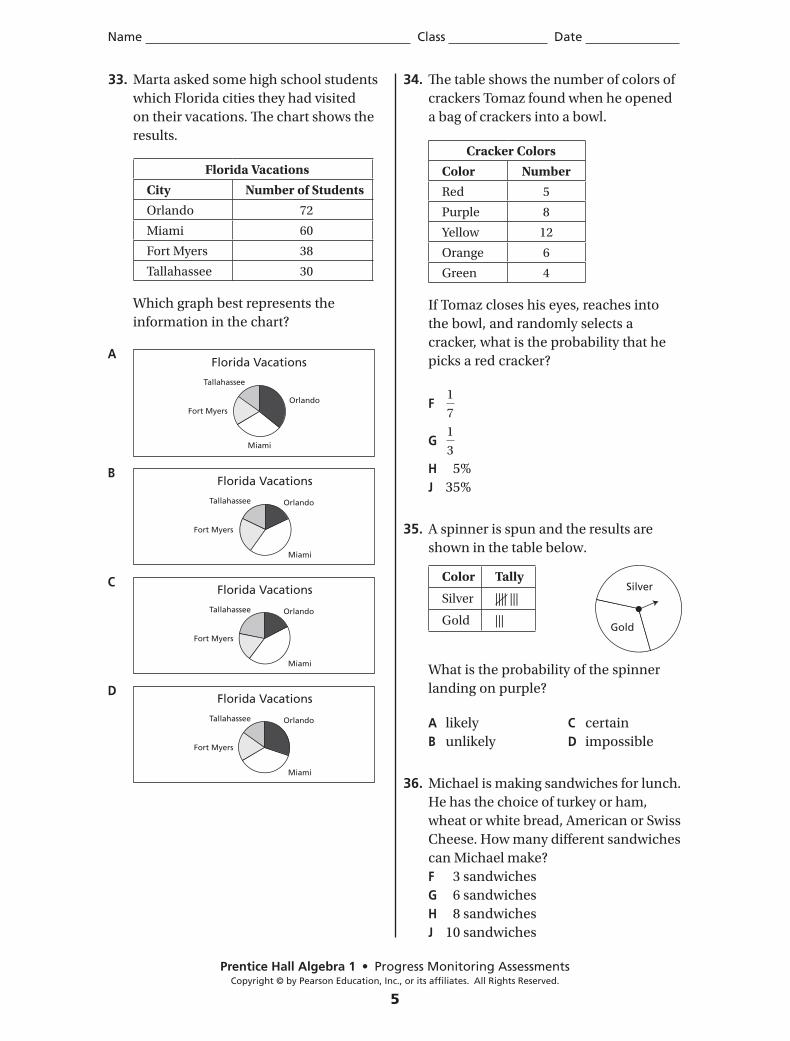
31. Which solid fi gure would be constructed
using the following shapes?
A triangular prism
B triangular pyramid
C rectangular prism
D cube
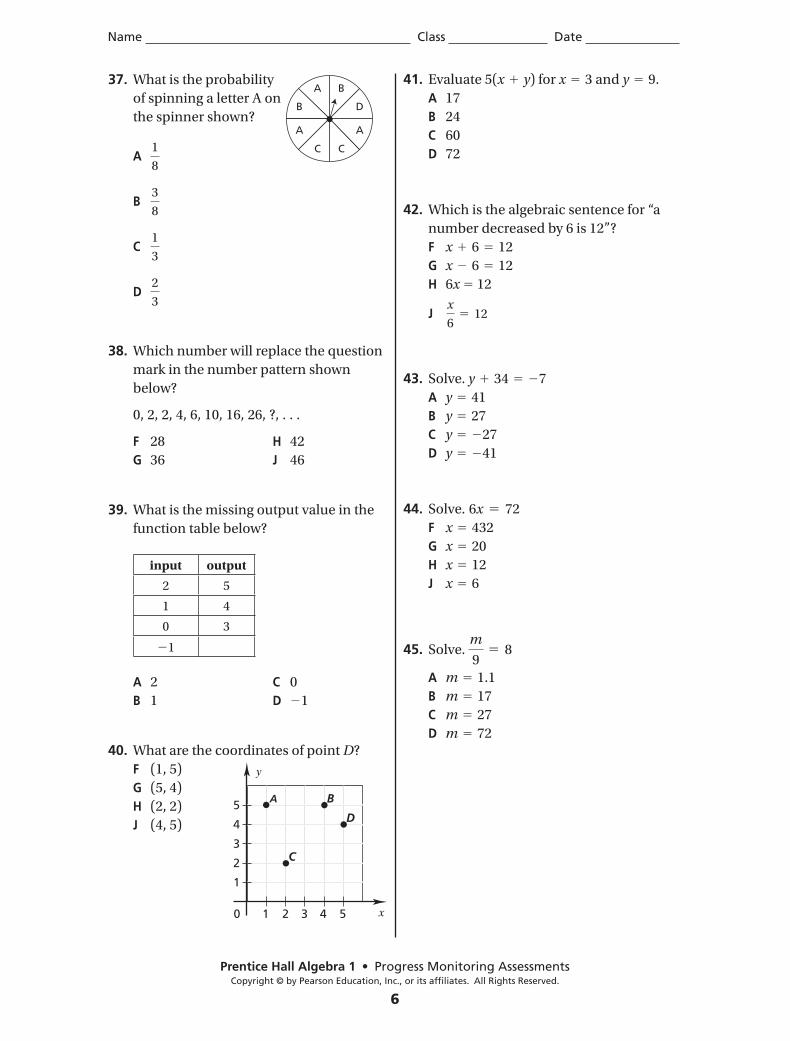
32. Which fi gure(s) make up the
faces and bases of the triangular
prism?
F squares
G rectangles
H triangles and rectangles
J circles and triangles
PHS4674_NAA1_ST.indd 4 6/27/09 1:55:25 PM
Prentice Hall Algebra 1 • Progress Monitoring AssessmentsCopyright © by Pearson Education, Inc., or its affiliates. All Rights Reserved.
5
Name Class Date
33. Marta asked some high school students
which Florida cities they had visited
on their vacations. Th e chart shows the
results.
Florida Vacations
City Number of Students
Orlando 72
Miami 60
Fort Myers 38
Tallahassee 30
Which graph best represents the
information in the chart?
A Florida Vacations
Tallahassee
Fort Myers
Miami
Orlando
B Florida Vacations
Tallahassee
Miami
Orlando
Fort Myers
C Florida Vacations
Tallahassee
Miami
Orlando
Fort Myers
D Florida Vacations
Tallahassee
Miami
Orlando
Fort Myers
34. Th e table shows the number of colors of
crackers Tomaz found when he opened
a bag of crackers into a bowl.
Cracker Colors
Color Number
Red 5
Purple 8
Yellow 12
Orange 6
Green 4
If Tomaz closes his eyes, reaches into
the bowl, and randomly selects a
cracker, what is the probability that he
picks a red cracker?
F 1
7
G 1
3
H 5%
J 35%
35. A spinner is spun and the results are
shown in the table below.
Color Tally
Silver |||| |||
Gold |||
What is the probability of the spinner
landing on purple?
A likely C certain
B unlikely D impossible
36. Michael is making sandwiches for lunch.
He has the choice of turkey or ham,
wheat or white bread, American or Swiss
Cheese. How many diff erent sandwiches
can Michael make?
F 3 sandwiches
G 6 sandwiches
H 8 sandwiches
J 10 sandwiches
Silver
Gold
PHS4674_NAA1_ST.indd 5 6/27/09 1:55:26 PM
Prentice Hall Algebra 1 • Progress Monitoring AssessmentsCopyright © by Pearson Education, Inc., or its affiliates. All Rights Reserved.
6
Name Class Date
37. What is the probability BA
C
AA
DB
C
of spinning a letter A on
the spinner shown?
A 1
8
B 3
8
C 1
3
D 2
3
38. Which number will replace the question
mark in the number pattern shown
below?
0, 2, 2, 4, 6, 10, 16, 26, ?, . . .
F 28 H 42
G 36 J 46
39. What is the missing output value in the
function table below?
input output
2 5
1 4
0 3
21
A 2 C 0
B 1 D 21
40. What are the coordinates of point D?
F (1, 5)
G (5, 4)
H (2, 2)
J (4, 5)
41. Evaluate 5(x 1 y) for x 5 3 and y 5 9.
A 17
B 24
C 60
D 72
42. Which is the algebraic sentence for “a
number decreased by 6 is 12”?
F x 1 6 5 12
G x 2 6 5 12
H 6x 5 12
J x
65 12
43. Solve. y 1 34 5 27
A y 5 41
B y 5 27
C y 5 227
D y 5 241
44. Solve. 6x 5 72
F x 5 432
G x 5 20
H x 5 12
J x 5 6
45. Solve. m
95 8
A m 5 1.1
B m 5 17
C m 5 27
D m 5 72
5
4
3
2
1
y
10 2 3 4 5 x
C
A
D
B
PHS4674_NAA1_ST.indd 6 6/27/09 1:55:26 PM
Name Class Date
Prentice Hall Algebra 1 • Progress Monitoring AssessmentsCopyright © by Pearson Education, Inc., or its affiliates. All Rights Reserved.
7
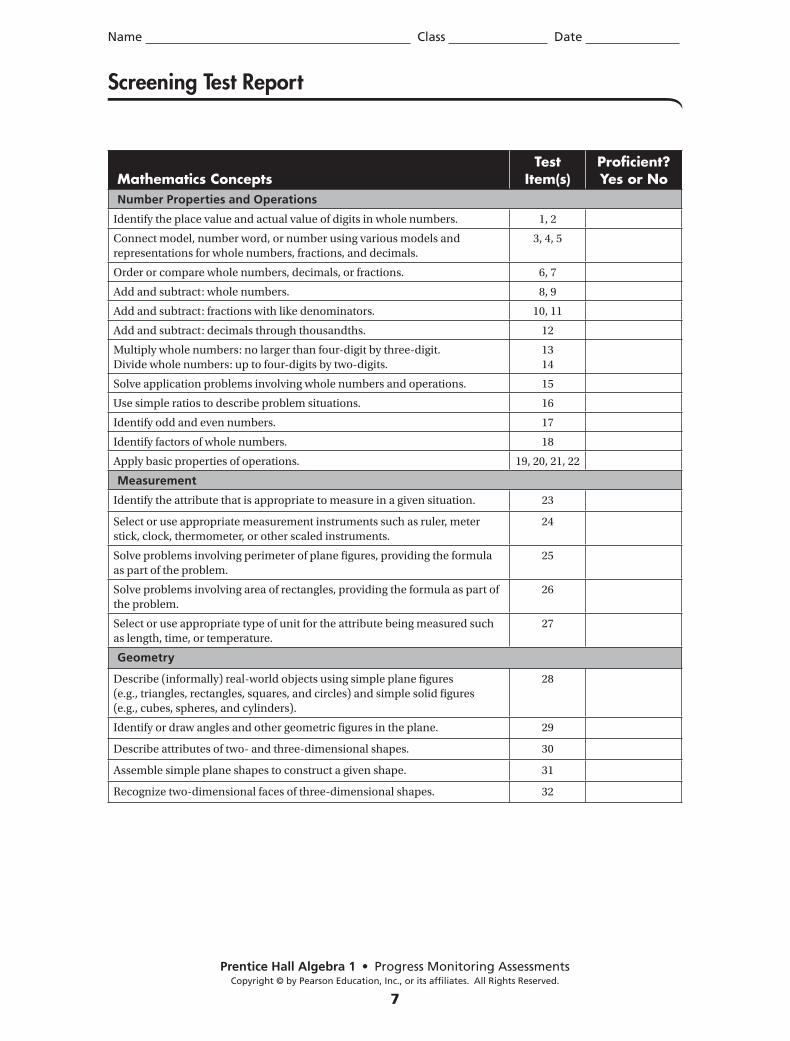
Screening Test Report
Mathematics ConceptsTest
Item(s)Profi cient? Yes or No
Number Properties and Operations
Identify the place value and actual value of digits in whole numbers. 1, 2
Connect model, number word, or number using various models and
representations for whole numbers, fractions, and decimals.
3, 4, 5
Order or compare whole numbers, decimals, or fractions. 6, 7
Add and subtract: whole numbers. 8, 9
Add and subtract: fractions with like denominators. 10, 11
Add and subtract: decimals through thousandths. 12
Multiply whole numbers: no larger than four-digit by three-digit.
Divide whole numbers: up to four-digits by two-digits.
13
14
Solve application problems involving whole numbers and operations. 15
Use simple ratios to describe problem situations. 16
Identify odd and even numbers. 17
Identify factors of whole numbers. 18
Apply basic properties of operations. 19, 20, 21, 22
Measurement
Identify the attribute that is appropriate to measure in a given situation. 23
Select or use appropriate measurement instruments such as ruler, meter
stick, clock, thermometer, or other scaled instruments.
24
Solve problems involving perimeter of plane fi gures, providing the formula
as part of the problem.
25
Solve problems involving area of rectangles, providing the formula as part of
the problem.
26
Select or use appropriate type of unit for the attribute being measured such
as length, time, or temperature.
27
Geometry
Describe (informally) real-world objects using simple plane fi gures
(e.g., triangles, rectangles, squares, and circles) and simple solid fi gures
(e.g., cubes, spheres, and cylinders).
28
Identify or draw angles and other geometric fi gures in the plane. 29
Describe attributes of two- and three-dimensional shapes. 30
Assemble simple plane shapes to construct a given shape. 31
Recognize two-dimensional faces of three-dimensional shapes. 32
PHS4674_NAA1_ST.indd 7 6/27/09 1:55:27 PM
Prentice Hall Algebra 1 • Progress Monitoring AssessmentsCopyright © by Pearson Education, Inc., or its affiliates. All Rights Reserved.
8
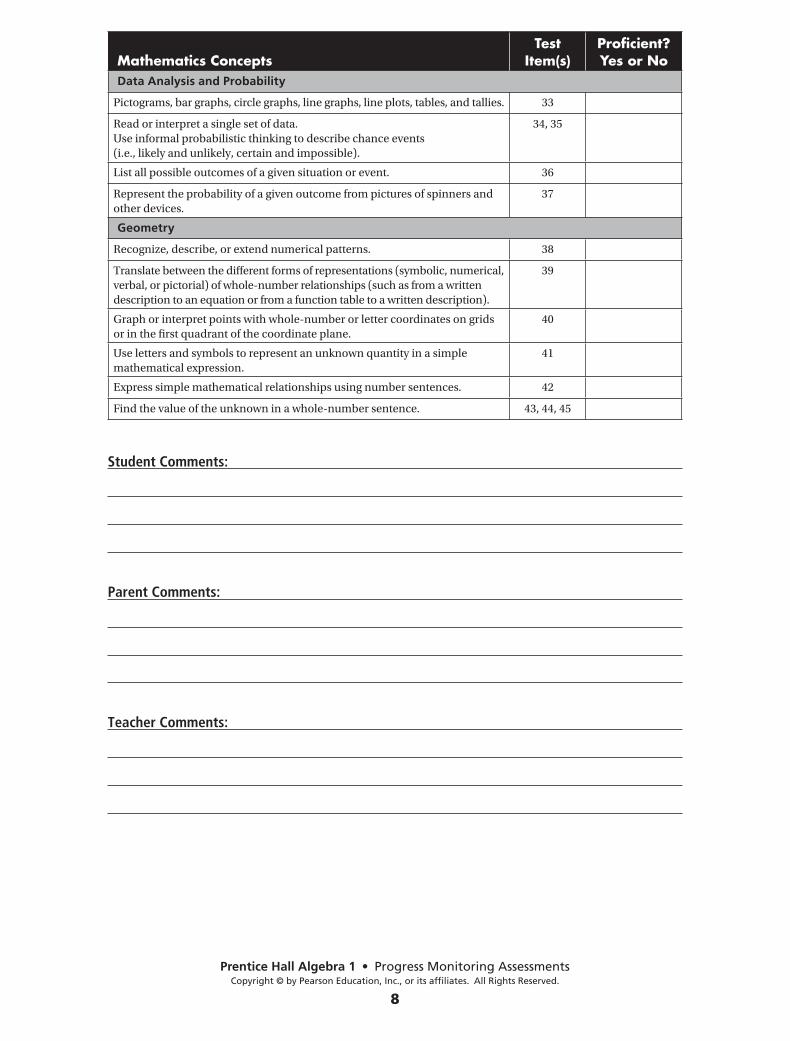
Mathematics ConceptsTest
Item(s)Profi cient? Yes or No
Data Analysis and Probability
Pictograms, bar graphs, circle graphs, line graphs, line plots, tables, and tallies. 33
Read or interpret a single set of data.
Use informal probabilistic thinking to describe chance events
(i.e., likely and unlikely, certain and impossible).
34, 35
List all possible outcomes of a given situation or event. 36
Represent the probability of a given outcome from pictures of spinners and
other devices.
37
Geometry
Recognize, describe, or extend numerical patterns. 38
Translate between the diff erent forms of representations (symbolic, numerical,
verbal, or pictorial) of whole-number relationships (such as from a written
description to an equation or from a function table to a written description).
39
Graph or interpret points with whole-number or letter coordinates on grids
or in the fi rst quadrant of the coordinate plane.
40
Use letters and symbols to represent an unknown quantity in a simple
mathematical expression.
41
Express simple mathematical relationships using number sentences. 42
Find the value of the unknown in a whole-number sentence. 43, 44, 45
Student Comments:
Parent Comments:
Teacher Comments:
PHS4674_NAA1_ST.indd 8 6/27/09 1:55:27 PM
Progress Monitoring AssessmentsCopyright © by Pearson Education, Inc., or its affiliates. All Rights Reserved.
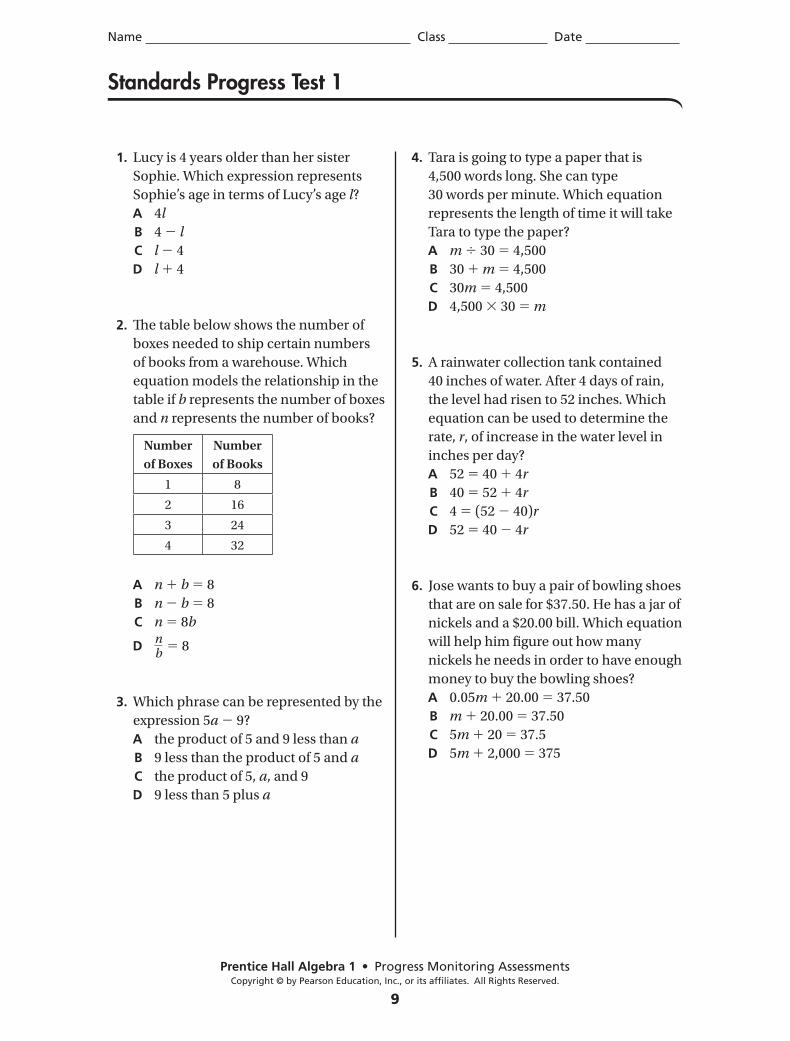
9
Name Class Date
1. Lucy is 4 years older than her sister
Sophie. Which expression represents
Sophie’s age in terms of Lucy’s age l?
A 4l
B 4 l
C l 4
D l 4
2. The table below shows the number of
boxes needed to ship certain numbers
of books from a warehouse. Which
equation models the relationship in the
table if b represents the number of boxes
and n represents the number of books?
A n b 8
B n b 8
C n 8b
D nb
8
3. Which phrase can be represented by the
expression 5a 9?
A the product of 5 and 9 less than a
B 9 less than the product of 5 and a
C the product of 5, a, and 9
D 9 less than 5 plus a
4. Tara is going to type a paper that is
4,500 words long. She can type
30 words per minute. Which equation
represents the length of time it will take
Tara to type the paper?
A m 30 4,500
B 30 m 4,500
C 30m 4,500
D 4,500 30 m
5. A rainwater collection tank contained
40 inches of water. After 4 days of rain,
the level had risen to 52 inches. Which
equation can be used to determine the
rate, r, of increase in the water level in
inches per day?
A 52 40 4r
B 40 52 4r
C 4 (52 40)r
D 52 40 4r
6. Jose wants to buy a pair of bowling shoes
that are on sale for $37.50. He has a jar of
nickels and a $20.00 bill. Which equation
will help him figure out how many
nickels he needs in order to have enough
money to buy the bowling shoes?
A 0.05m 20.00 37.50
B m 20.00 37.50
C 5m 20 37.5
D 5m 2,000 375
Number
of Boxes
Number
of Books
1 8
2 16
3 24
4 32
Standards Progress Test 1
Progress Monitoring AssessmentsCopyright © by Pearson Education, Inc., or its affiliates. All Rights Reserved.
10
Name Class Date
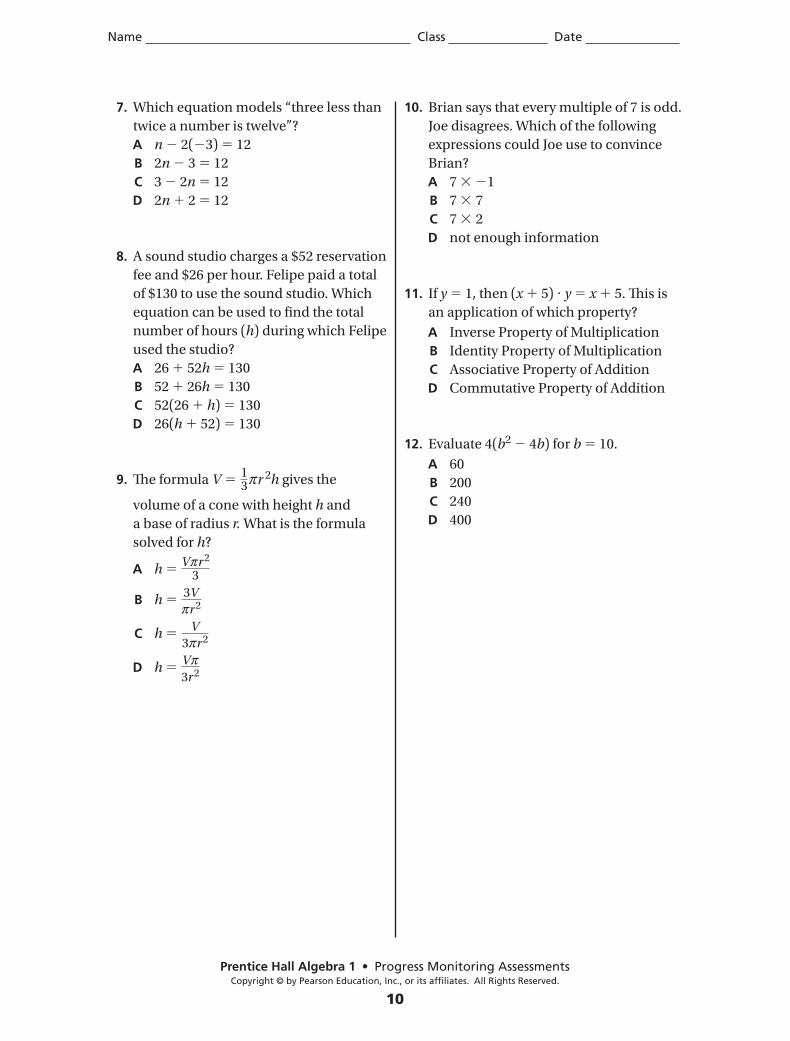
7. Which equation models “three less than
twice a number is twelve”?
A n 2( 3) 12
B 2n 3 12
C 3 2n 12
D 2n 2 12
8. A sound studio charges a $52 reservation
fee and $26 per hour. Felipe paid a total
of $130 to use the sound studio. Which
equation can be used to find the total
number of hours (h) during which Felipe
used the studio?
A 26 52h 130
B 52 26h 130
C 52(26 h) 130
D 26(h 52) 130
9. The formula V 13 r 2h gives the
volume of a cone with height h and
a base of radius r. What is the formula
solved for h?
A h V r 2
3
B h 3V
r 2
C h V
3 r 2
D h V
3r 2
10. Brian says that every multiple of 7 is odd.
Joe disagrees. Which of the following
expressions could Joe use to convince
Brian?
A 7 1
B 7 7
C 7 2
D not enough information
11. If y 1, then (x 5) y x 5. This is
an application of which property?
A Inverse Property of Multiplication
B Identity Property of Multiplication
C Associative Property of Addition
D Commutative Property of Addition
12. Evaluate 4(b2 4b) for b 10.
A 60
B 200
C 240
D 400
Progress Monitoring AssessmentsCopyright © by Pearson Education, Inc., or its affiliates. All Rights Reserved.
11
Name Class Date
13. Describe the result of multiplying two
numbers with opposite signs.
A Their product is less than 1.
B Their product is less than 0.
C Their product is greater than 0.
D Their product is greater than 1.
14. Simplify.
2(3x 4) (3x 2)
A 3x 6
B 3x 10
C 3x 6
D 3x 2
15. Simplify the algebraic expression
2x 3y 4(2x y).
A 10x 2y 4
B 6x 7y
C 6x 2y
D 6x y
16. Find the difference.
6
23 3
79
A 389
B 319
C 289
D 249
17. Simplify.
(8m 2) (5m 7) m
A 13m 5
B 14m 9
C 13m 9
D 14m 5
18. Evaluate the expression 2f 7g for
f 5 and g 3.
A 210
B 31
C 11
D 39
Progress Monitoring AssessmentsCopyright © by Pearson Education, Inc., or its affiliates. All Rights Reserved.
12
Name Class Date
19. Between which two consecutive integers
is 15.52?
A 3 and 4
B 4 and 5
C 5 and 6
D 6 and 7
20. Which of the following is false?
A 5 3
B 5 3
C 5 3
D 5 3
21. Find 41 to the nearest tenth.
A 6.4
B 6.5
C 7.4
D 7.5
22. What is the relationship between 5 and
5 on a number line?
A They are 5 units apart from each other.
B 5 is closer to zero than 5 .
C 5 is closer to zero than 5 .
D They are both the same distance
from zero.
23. Which of the following is true?
A 85 9
B 8 62
C 1625
164
D 121 144
24. Tell whether the following statement is
sometimes, always, or never true.
a a
A sometimes
B always
C never
D not enough information
Progress Monitoring AssessmentsCopyright © by Pearson Education, Inc., or its affiliates. All Rights Reserved.
13
Name Class Date
25. Use inductive reasoning to describe the
pattern.
2, 6, 18, 54
A Multiply the previous term by 2
and add 1.
B Multiply the previous term by 3.
C Add 3 to the previous term.
D Add 4 to the previous term.
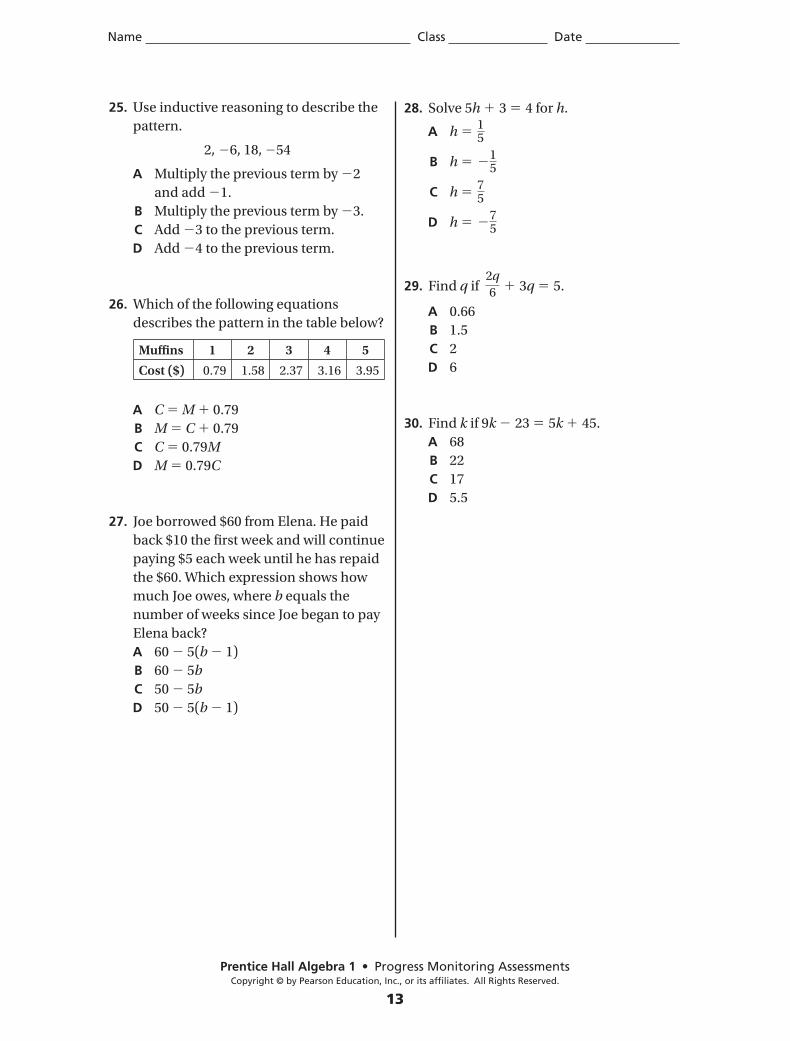
26. Which of the following equations
describes the pattern in the table below?
A C M 0.79
B M C 0.79
C C 0.79M
D M 0.79C
27. Joe borrowed $60 from Elena. He paid
back $10 the first week and will continue
paying $5 each week until he has repaid
the $60. Which expression shows how
much Joe owes, where b equals the
number of weeks since Joe began to pay
Elena back?
A 60 5(b 1)
B 60 5b
C 50 5b
D 50 5(b 1)
28. Solve 5h 3 4 for h.
A h 15
B h
15
C h 75
D h
75
29. Find q if 2q
6 3q 5.
A 0.66
B 1.5
C 2
D 6
30. Find k if 9k 23 5k 45.
A 68
B 22
C 17
D 5.5
Muffins 1 2 3 4 5
Cost ($) 0.79 1.58 2.37 3.16 3.95
Progress Monitoring AssessmentsCopyright © by Pearson Education, Inc., or its affiliates. All Rights Reserved.
14
Name Class Date
31. Solve 8a 3 21.
A 13
B 3
C 83
D 8
32. Find d if 2(d 4) 2d 8.
A 4
B 2
C 2
D 4
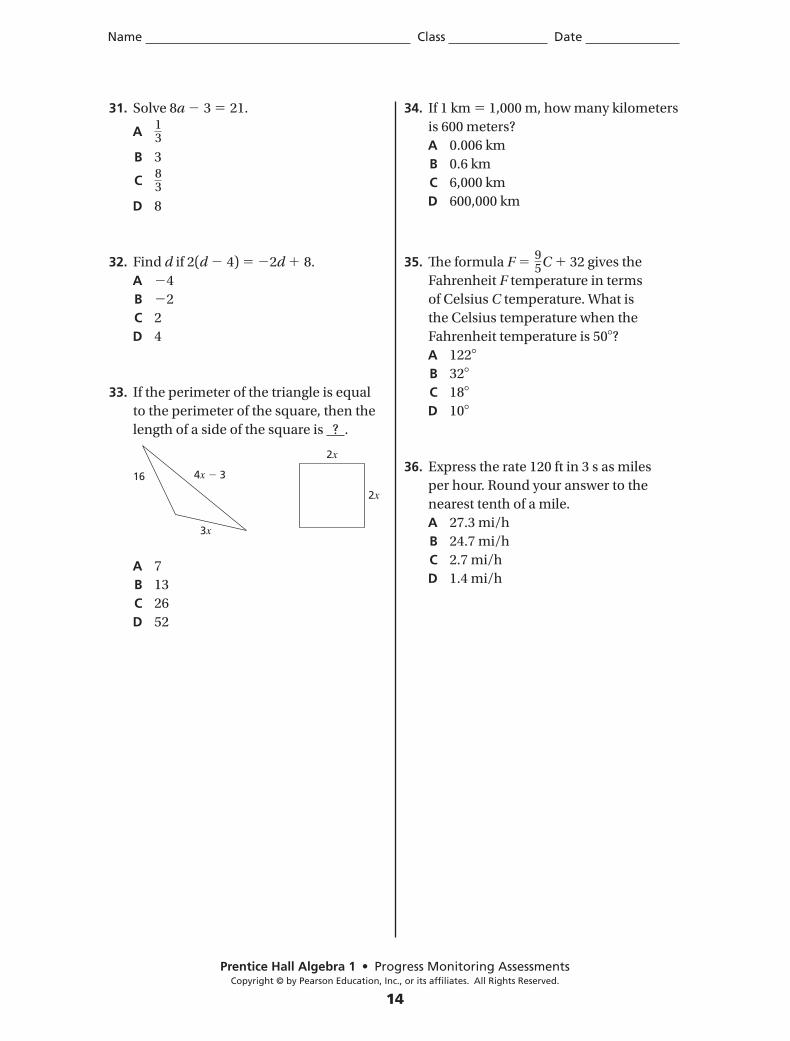
33. If the perimeter of the triangle is equal
to the perimeter of the square, then the
length of a side of the square is ? .
A 7
B 13
C 26
D 52
34. If 1 km 1,000 m, how many kilometers
is 600 meters?
A 0.006 km
B 0.6 km
C 6,000 km
D 600,000 km
35. The formula F 95C 32 gives the
Fahrenheit F temperature in terms
of Celsius C temperature. What is
the Celsius temperature when the
Fahrenheit temperature is 50 ?
A 122
B 32
C 18
D 10
36. Express the rate 120 ft in 3 s as miles
per hour. Round your answer to the
nearest tenth of a mile.
A 27.3 mi/h
B 24.7 mi/h
C 2.7 mi/h
D 1.4 mi/h
2x
4x 3
3x
2x
16
Name Class Date
Progress Monitoring AssessmentsCopyright © by Pearson Education, Inc., or its affiliates. All Rights Reserved.
15
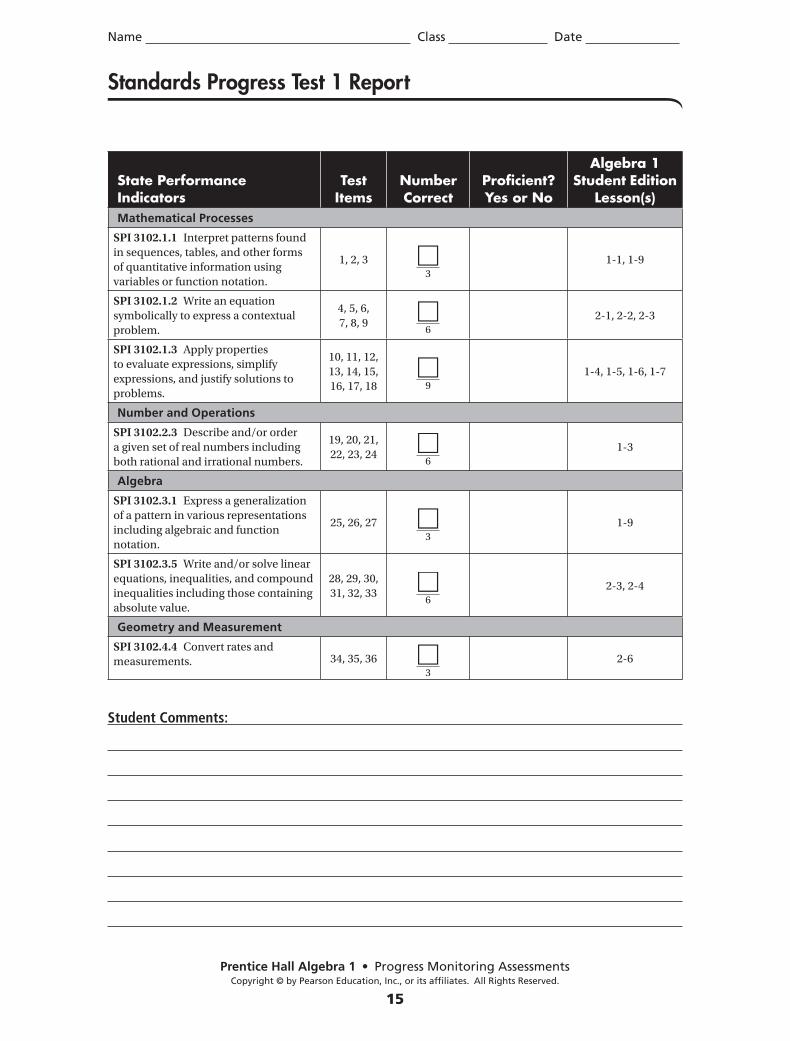
Standards Progress Test 1 Report
State Performance Indicators
Test Items
Number Correct
Proficient? Yes or No
Algebra 1 Student Edition
Lesson(s)Mathematical Processes
SPI 3102.1.1 Interpret patterns found
in sequences, tables, and other forms
of quantitative information using
variables or function notation.
1, 2, 33
1-1, 1-9
SPI 3102.1.2 Write an equation
symbolically to express a contextual
problem.
4, 5, 6,
7, 8, 96
2-1, 2-2, 2-3
SPI 3102.1.3 Apply properties
to evaluate expressions, simplify
expressions, and justify solutions to
problems.
10, 11, 12,
13, 14, 15,
16, 17, 18 9
1-4, 1-5, 1-6, 1-7
Number and Operations
SPI 3102.2.3 Describe and/or order
a given set of real numbers including
both rational and irrational numbers.
19, 20, 21,
22, 23, 246
1-3
Algebra
SPI 3102.3.1 Express a generalization
of a pattern in various representations
including algebraic and function
notation.
25, 26, 273
1-9
SPI 3102.3.5 Write and/or solve linear
equations, inequalities, and compound
inequalities including those containing
absolute value.
28, 29, 30,
31, 32, 336
2-3, 2-4
Geometry and Measurement
SPI 3102.4.4 Convert rates and
measurements. 34, 35, 363
2-6
Student Comments:
Name Class Date
Progress Monitoring AssessmentsCopyright © by Pearson Education, Inc., or its affiliates. All Rights Reserved.
16
Parent Comments:
Teacher Comments:
Progress Monitoring AssessmentsCopyright © by Pearson Education, Inc., or its affiliates. All Rights Reserved.
17
Name Class Date
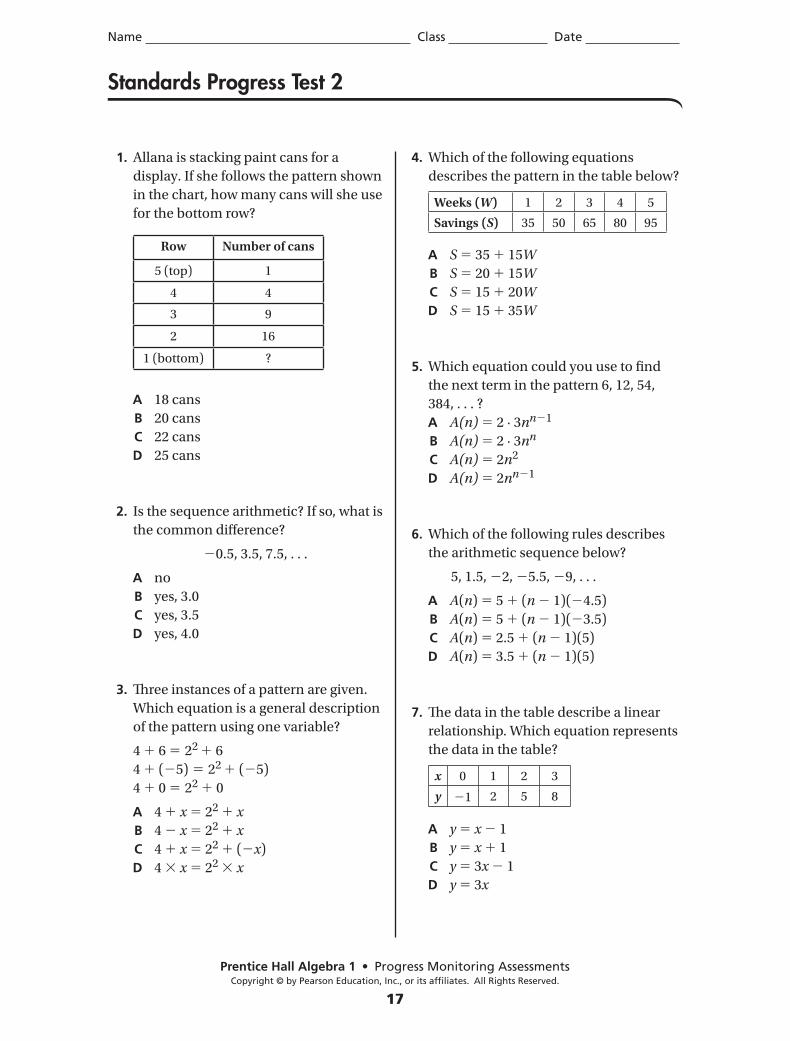
1. Allana is stacking paint cans for a
display. If she follows the pattern shown
in the chart, how many cans will she use
for the bottom row?
A 18 cans
B 20 cans
C 22 cans
D 25 cans
2. Is the sequence arithmetic? If so, what is
the common difference?
0.5, 3.5, 7.5, . . .
A no
B yes, 3.0
C yes, 3.5
D yes, 4.0
3. Three instances of a pattern are given.
Which equation is a general description
of the pattern using one variable?
4 6 22 6
4 ( 5) 22 ( 5)
4 0 22 0
A 4 x 22 x
B 4 x 22 x
C 4 x 22 ( x)
D 4 x 22 x
4. Which of the following equations
describes the pattern in the table below?
A S 35 15W
B S 20 15W
C S 15 20W
D S 15 35W
5. Which equation could you use to find
the next term in the pattern 6, 12, 54,
384, . . . ?
A A(n) 2 · 3nn 1
B A(n) 2 · 3nn
C A(n) 2n2
D A(n) 2nn 1
6. Which of the following rules describes
the arithmetic sequence below?
5, 1.5, 2, 5.5, 9, . . .
A A(n) 5 (n 1)( 4.5)
B A(n) 5 (n 1)( 3.5)
C A(n) 2.5 (n 1)(5)
D A(n) 3.5 (n 1)(5)
7. The data in the table describe a linear
relationship. Which equation represents
the data in the table?
A y x 1
B y x 1
C y 3x 1
D y 3x
Row Number of cans
5 (top) 1
4 4
3 9
2 16
1 (bottom) ?
Weeks (W ) 1 2 3 4 5
Savings (S) 35 50 65 80 95
x 0 1 2 3
y 1 2 5 8
Standards Progress Test 2
Progress Monitoring AssessmentsCopyright © by Pearson Education, Inc., or its affiliates. All Rights Reserved.
18
Name Class Date
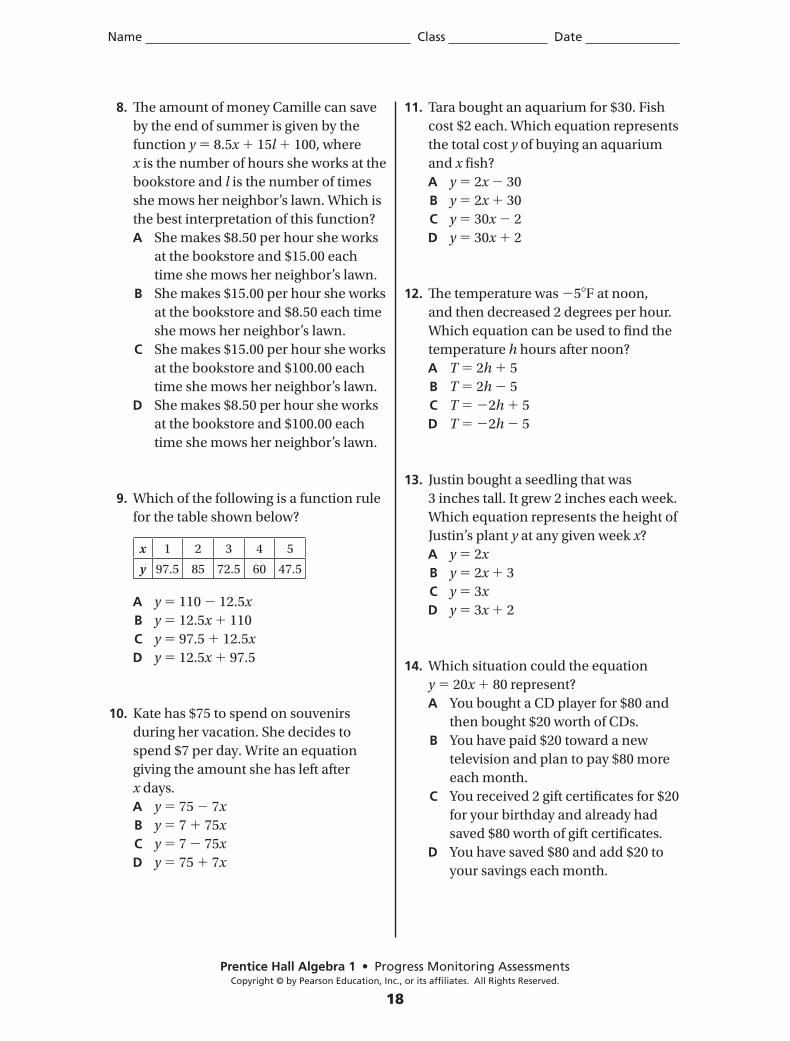
8. The amount of money Camille can save
by the end of summer is given by the
function y 8.5x 15l 100, where
x is the number of hours she works at the
bookstore and l is the number of times
she mows her neighbor’s lawn. Which is
the best interpretation of this function?
A She makes $8.50 per hour she works
at the bookstore and $15.00 each
time she mows her neighbor’s lawn.
B She makes $15.00 per hour she works
at the bookstore and $8.50 each time
she mows her neighbor’s lawn.
C She makes $15.00 per hour she works
at the bookstore and $100.00 each
time she mows her neighbor’s lawn.
D She makes $8.50 per hour she works
at the bookstore and $100.00 each
time she mows her neighbor’s lawn.
9. Which of the following is a function rule
for the table shown below?
A y 110 12.5x
B y 12.5x 110
C y 97.5 12.5x
D y 12.5x 97.5
10. Kate has $75 to spend on souvenirs
during her vacation. She decides to
spend $7 per day. Write an equation
giving the amount she has left after
x days.
A y 75 7x
B y 7 75x
C y 7 75x
D y 75 7x
11. Tara bought an aquarium for $30. Fish
cost $2 each. Which equation represents
the total cost y of buying an aquarium
and x fish?
A y 2x 30
B y 2x 30
C y 30x 2
D y 30x 2
12. The temperature was 5 F at noon,
and then decreased 2 degrees per hour.
Which equation can be used to find the
temperature h hours after noon?
A T 2h 5
B T 2h 5
C T 2h 5
D T 2h 5
13. Justin bought a seedling that was
3 inches tall. It grew 2 inches each week.
Which equation represents the height of
Justin’s plant y at any given week x?
A y 2x
B y 2x 3
C y 3x
D y 3x 2
14. Which situation could the equation
y 20x 80 represent?
A You bought a CD player for $80 and
then bought $20 worth of CDs.
B You have paid $20 toward a new
television and plan to pay $80 more
each month.
C You received 2 gift certificates for $20
for your birthday and already had
saved $80 worth of gift certificates.
D You have saved $80 and add $20 to
your savings each month.
x 1 2 3 4 5
y 97.5 85 72.5 60 47.5
Progress Monitoring AssessmentsCopyright © by Pearson Education, Inc., or its affiliates. All Rights Reserved.
19
Name Class Date
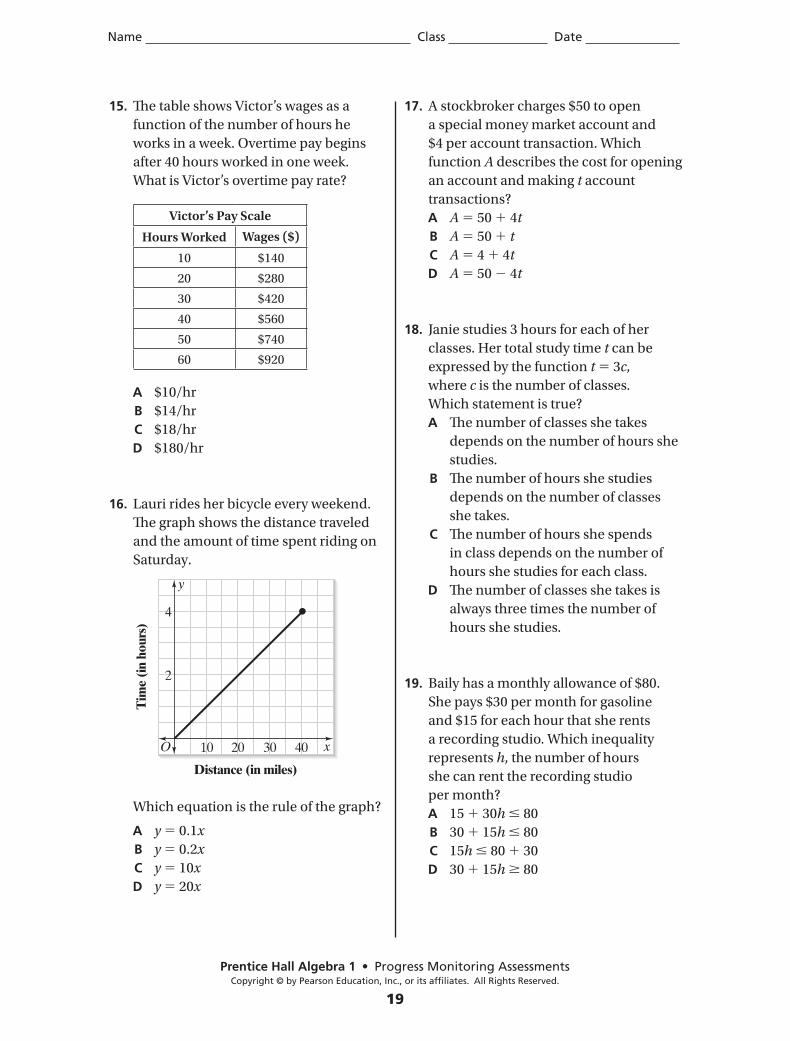
15. The table shows Victor’s wages as a
function of the number of hours he
works in a week. Overtime pay begins
after 40 hours worked in one week.
What is Victor’s overtime pay rate?
Victor’s Pay Scale
Hours Worked Wages ($)
10 $140
20 $280
30 $420
40 $560
50 $740
60 $920
A $10/hr
B $14/hr
C $18/hr
D $180/hr
16. Lauri rides her bicycle every weekend.
The graph shows the distance traveled
and the amount of time spent riding on
Saturday.
Which equation is the rule of the graph?
A y 0.1x
B y 0.2x
C y 10x
D y 20x
17. A stockbroker charges $50 to open
a special money market account and
$4 per account transaction. Which
function A describes the cost for opening
an account and making t account
transactions?
A A 50 4t
B A 50 t
C A 4 4t
D A 50 4t
18. Janie studies 3 hours for each of her
classes. Her total study time t can be
expressed by the function t 3c,
where c is the number of classes.
Which statement is true?
A The number of classes she takes
depends on the number of hours she
studies.
B The number of hours she studies
depends on the number of classes
she takes.
C The number of hours she spends
in class depends on the number of
hours she studies for each class.
D The number of classes she takes is
always three times the number of
hours she studies.
19. Baily has a monthly allowance of $80.
She pays $30 per month for gasoline
and $15 for each hour that she rents
a recording studio. Which inequality
represents h, the number of hours
she can rent the recording studio
per month?
A 15 30h 80
B 30 15h 80
C 15h 80 30
D 30 15h 80
y
O x
2
4
10 20 30 40
Tim
e (i
n ho
urs)
Distance (in miles)
Progress Monitoring AssessmentsCopyright © by Pearson Education, Inc., or its affiliates. All Rights Reserved.
20
Name Class Date
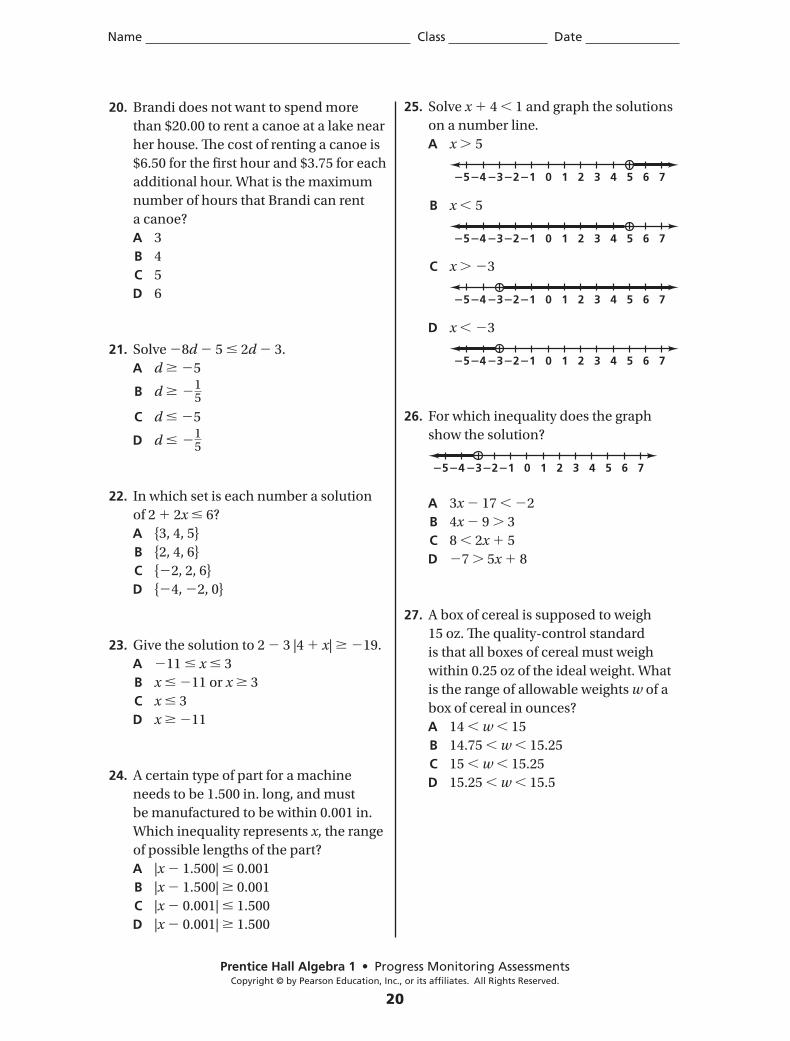
20. Brandi does not want to spend more
than $20.00 to rent a canoe at a lake near
her house. The cost of renting a canoe is
$6.50 for the first hour and $3.75 for each
additional hour. What is the maximum
number of hours that Brandi can rent
a canoe?
A 3
B 4
C 5
D 6
21. Solve 8d 5 2d 3.
A d 5
B d
15
C d 5
D d
15
22. In which set is each number a solution
of 2 2x 6?
A {3, 4, 5}
B {2, 4, 6}
C { 2, 2, 6}
D { 4, 2, 0}
23. Give the solution to 2 3 |4 x| 19.
A 11 x 3
B x 11 or x 3
C x 3
D x 11
24. A certain type of part for a machine
needs to be 1.500 in. long, and must
be manufactured to be within 0.001 in.
Which inequality represents x, the range
of possible lengths of the part?
A |x 1.500| 0.001
B |x 1.500| 0.001
C |x 0.001| 1.500
D |x 0.001| 1.500
25. Solve x 4 1 and graph the solutions
on a number line.
A x 5
B x 5
C x 3
D x 3
26. For which inequality does the graph
show the solution?
A 3x 17 2
B 4x 9 3
C 8 2x 5
D 7 5x 8
27. A box of cereal is supposed to weigh
15 oz. The quality-control standard
is that all boxes of cereal must weigh
within 0.25 oz of the ideal weight. What
is the range of allowable weights w of a
box of cereal in ounces?
A 14 w 15
B 14.75 w 15.25
C 15 w 15.25
D 15.25 w 15.5
5 4 3 2 1 0 5 6 74321
5 4 3 2 1 0 5 6 74321
5 4 3 2 1 0 5 6 74321
5 4 3 2 1 0 5 6 74321
5 4 3 2 1 0 5 6 74321
Progress Monitoring AssessmentsCopyright © by Pearson Education, Inc., or its affiliates. All Rights Reserved.
21
Name Class Date
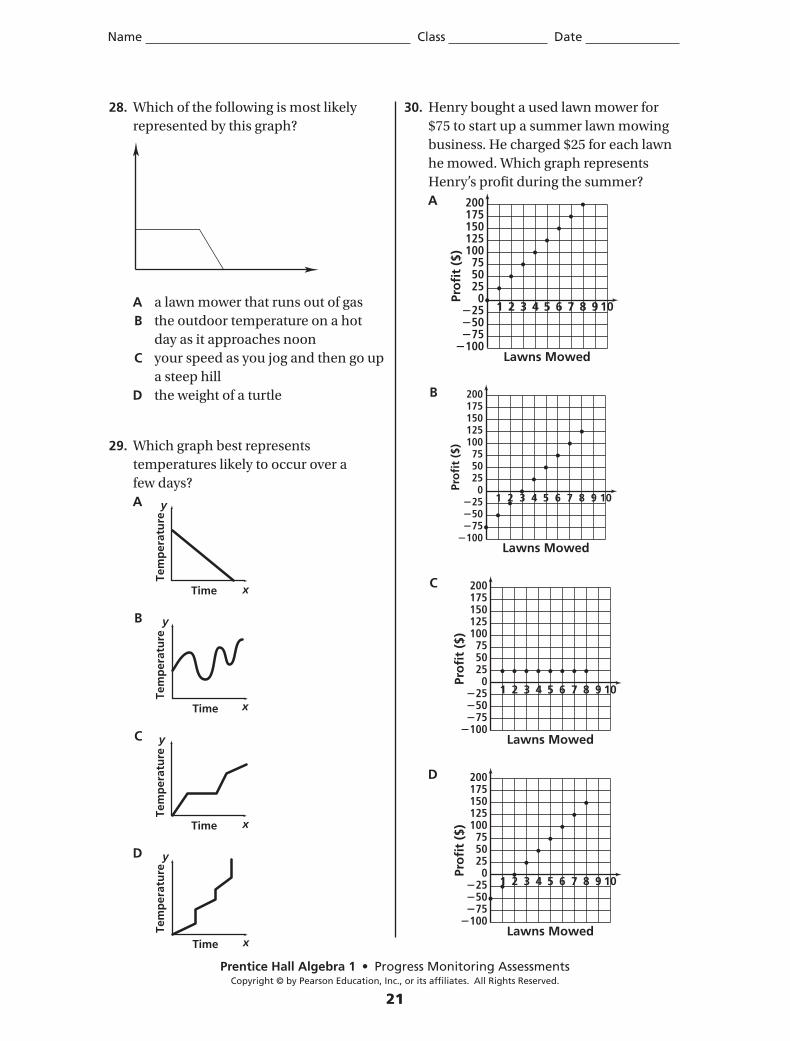
28. Which of the following is most likely
represented by this graph?
A a lawn mower that runs out of gas
B the outdoor temperature on a hot
day as it approaches noon
C your speed as you jog and then go up
a steep hill
D the weight of a turtle
29. Which graph best represents
temperatures likely to occur over a
few days?
A
B
C
D
30. Henry bought a used lawn mower for
$75 to start up a summer lawn mowing
business. He charged $25 for each lawn
he mowed. Which graph represents
Henry’s profit during the summer?
A
B
C
D
y
xTime
Tem
per
atu
re
y
xTime
Tem
per
atu
re
y
xTime
Tem
per
atu
re
y
xTime
Tem
per
atu
re
2001751501251007550250
255075
100
5
Lawns Mowed
Pro
fit
($)
61 72 83 94 10
200175150125100
755025
0255075
100
5
Lawns Mowed
Pro
fit
($)
61 72 83 94 10
200175150125100
755025
0255075
100
5
Lawns Mowed
Pro
fit
($)
61 72 83 94 10
200175150125100
755025
0255075
100
5
Lawns Mowed
Pro
fit
($)
61 72 83 94 10
Progress Monitoring AssessmentsCopyright © by Pearson Education, Inc., or its affiliates. All Rights Reserved.
22
Name Class Date
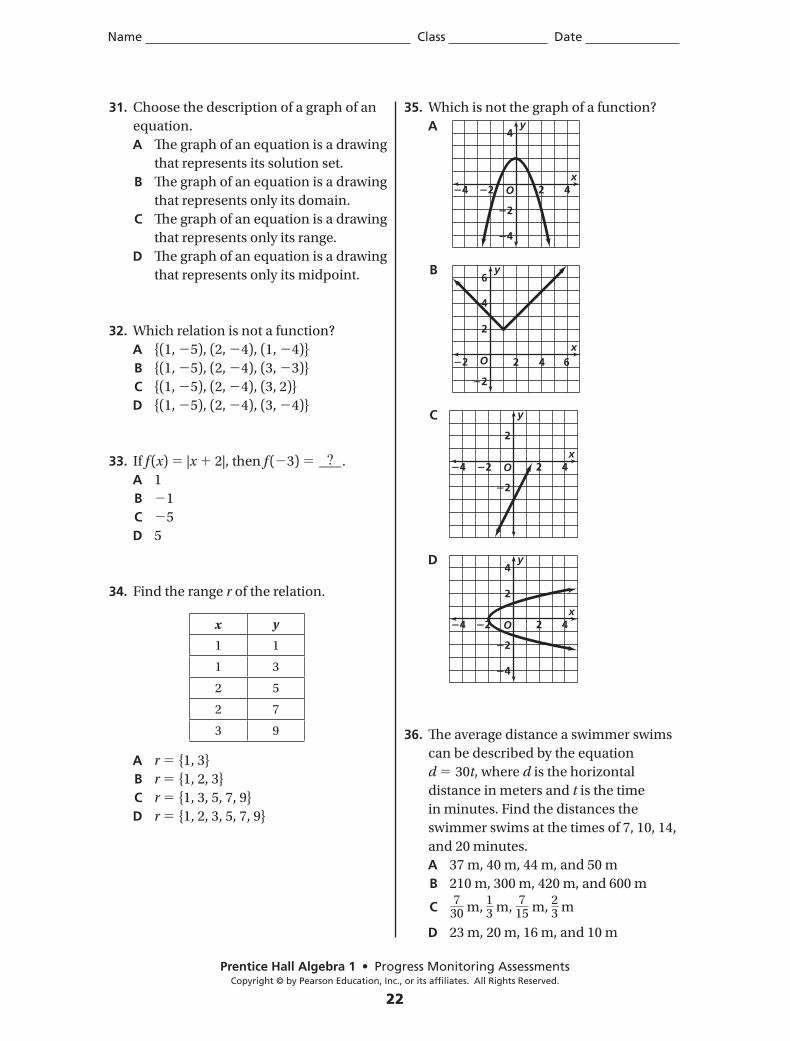
31. Choose the description of a graph of an
equation.
A The graph of an equation is a drawing
that represents its solution set.
B The graph of an equation is a drawing
that represents only its domain.
C The graph of an equation is a drawing
that represents only its range.
D The graph of an equation is a drawing
that represents only its midpoint.
32. Which relation is not a function?
A {(1, 5), (2, 4), (1, 4)}
B {(1, 5), (2, 4), (3, 3)}
C {(1, 5), (2, 4), (3, 2)}
D {(1, 5), (2, 4), (3, 4)}
33. If f (x) |x 2|, then f ( 3) .
A 1
B 1
C 5
D 5
34. Find the range r of the relation.
x y
1 1
1 3
2 5
2 7
3 9
A r {1, 3}
B r {1, 2, 3}
C r {1, 3, 5, 7, 9}
D r {1, 2, 3, 5, 7, 9}
35. Which is not the graph of a function?
A
B
C
D
36. The average distance a swimmer swims
can be described by the equation
d 30t, where d is the horizontal
distance in meters and t is the time
in minutes. Find the distances the
swimmer swims at the times of 7, 10, 14,
and 20 minutes.
A 37 m, 40 m, 44 m, and 50 m
B 210 m, 300 m, 420 m, and 600 m
C 730 m,
13 m,
715 m,
23 m
D 23 m, 20 m, 16 m, and 10 m
O
4
424 2
2
4
x
y
O
4
6
2
4 62x
y
2
2
O
2
424 2
2
x
y
O
4
2
424 2
2
4
x
y
Name Class Date
Progress Monitoring AssessmentsCopyright © by Pearson Education, Inc., or its affiliates. All Rights Reserved.
23
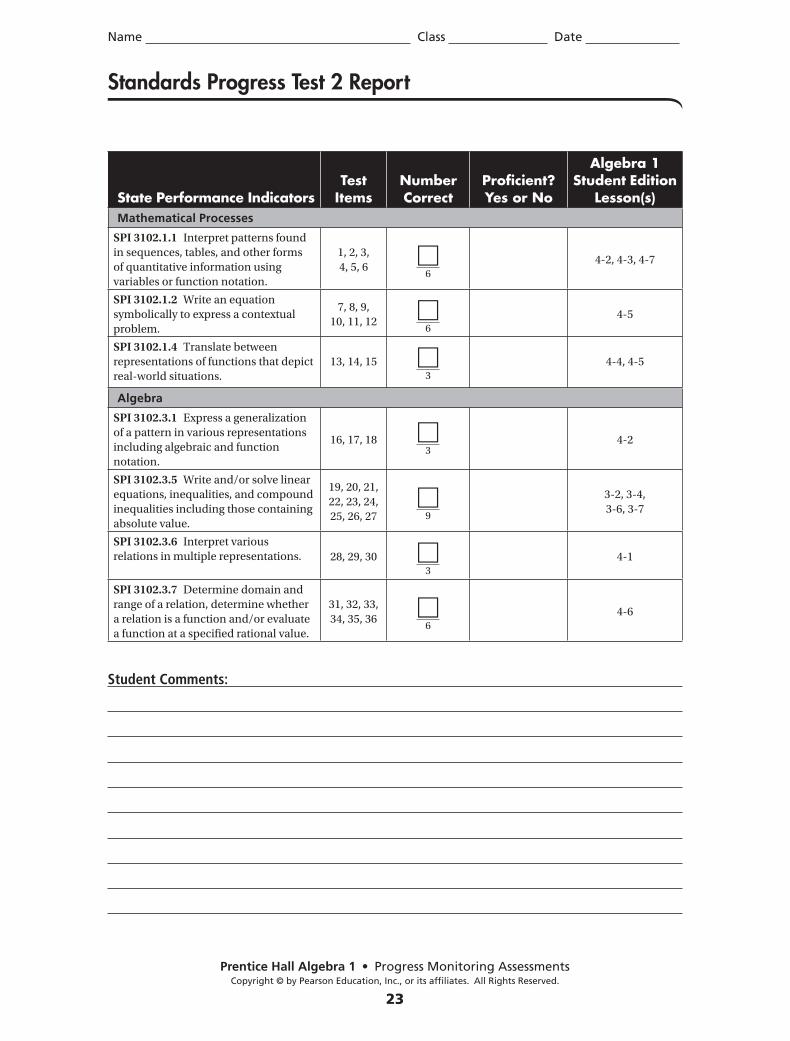
Standards Progress Test 2 Report
State Performance IndicatorsTest
ItemsNumber Correct
Proficient? Yes or No
Algebra 1 Student Edition
Lesson(s)Mathematical Processes
SPI 3102.1.1 Interpret patterns found
in sequences, tables, and other forms
of quantitative information using
variables or function notation.
1, 2, 3,
4, 5, 66
4-2, 4-3, 4-7
SPI 3102.1.2 Write an equation
symbolically to express a contextual
problem.
7, 8, 9,
10, 11, 126
4-5
SPI 3102.1.4 Translate between
representations of functions that depict
real-world situations.
13, 14, 153
4-4, 4-5
Algebra
SPI 3102.3.1 Express a generalization
of a pattern in various representations
including algebraic and function
notation.
16, 17, 183
4-2
SPI 3102.3.5 Write and/or solve linear
equations, inequalities, and compound
inequalities including those containing
absolute value.
19, 20, 21,
22, 23, 24,
25, 26, 27 9
3-2, 3-4,
3-6, 3-7
SPI 3102.3.6 Interpret various
relations in multiple representations. 28, 29, 303
4-1
SPI 3102.3.7 Determine domain and
range of a relation, determine whether
a relation is a function and/or evaluate
a function at a specified rational value.
31, 32, 33,
34, 35, 366
4-6
Student Comments:

Name Class Date
Progress Monitoring AssessmentsCopyright © by Pearson Education, Inc., or its affiliates. All Rights Reserved.
24
Parent Comments:
Teacher Comments:
Progress Monitoring AssessmentsCopyright © by Pearson Education, Inc., or its affiliates. All Rights Reserved.
25
Name Class Date
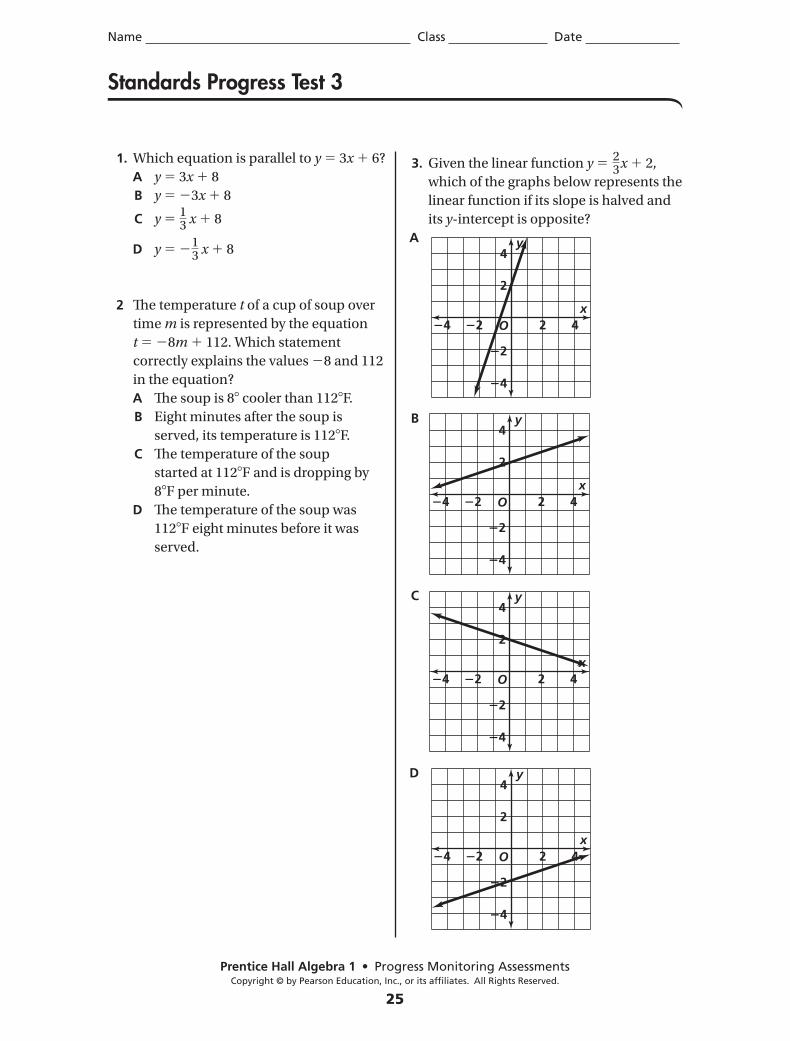
1. Which equation is parallel to y 3x 6?
A y 3x 8
B y 3x 8
C y 13 x 8
D y 13 x 8
2 The temperature t of a cup of soup over
time m is represented by the equation
t 8m 112. Which statement
correctly explains the values 8 and 112
in the equation?
A The soup is 8 cooler than 112 F.
B Eight minutes after the soup is
served, its temperature is 112 F.
C The temperature of the soup
started at 112 F and is dropping by
8 F per minute.
D The temperature of the soup was
112 F eight minutes before it was
served.
3. Given the linear function y 23x 2,
which of the graphs below represents the
linear function if its slope is halved and
its y-intercept is opposite?
A
B
C
D
O
2
4
424 2
2
4
x
y
O
2
4
424 2
2
4
x
y
O
2
4
424 2
2
4
x
y
O
2
4
424 2
2
4
x
y
Standards Progress Test 3
Progress Monitoring AssessmentsCopyright © by Pearson Education, Inc., or its affiliates. All Rights Reserved.
26
Name Class Date
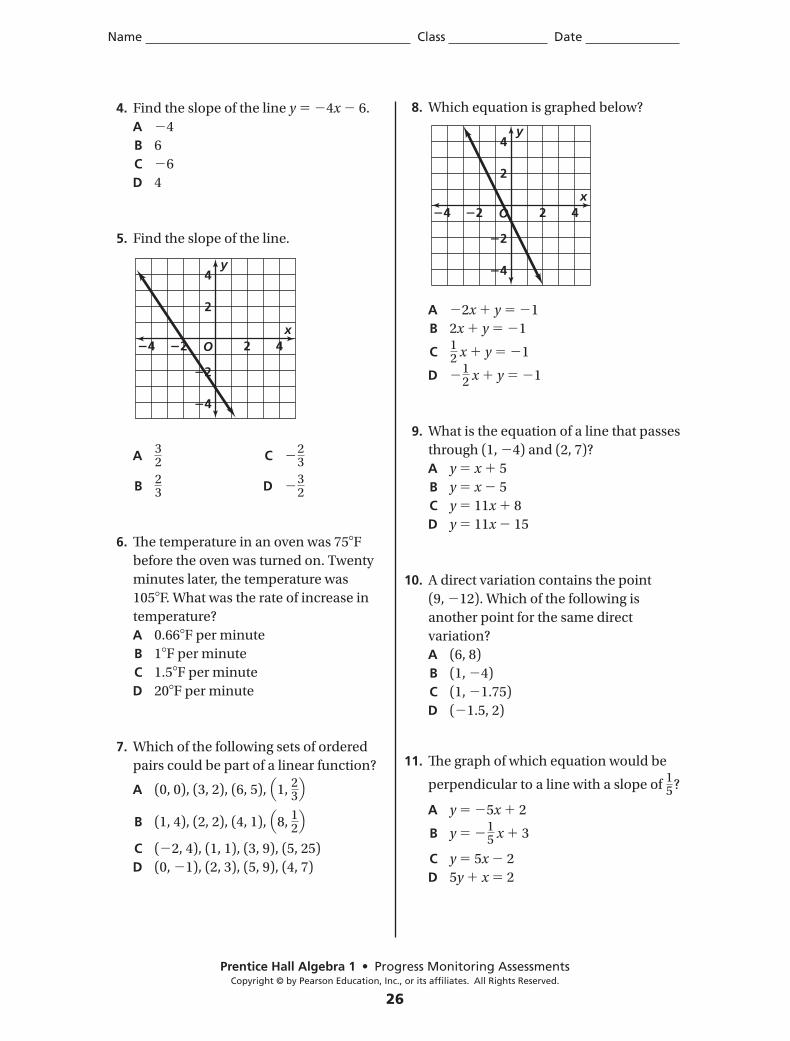
4. Find the slope of the line y 4x 6.
A 4
B 6
C 6
D 4
5. Find the slope of the line.
A 32 C
23
B 23 D
32
6. The temperature in an oven was 75 F
before the oven was turned on. Twenty
minutes later, the temperature was
105 F. What was the rate of increase in
temperature?
A 0.66 F per minute
B 1 F per minute
C 1.5 F per minute
D 20 F per minute
7. Which of the following sets of ordered
pairs could be part of a linear function?
A (0, 0), (3, 2), (6, 5), 1, 23
B (1, 4), (2, 2), (4, 1), 8, 12
C ( 2, 4), (1, 1), (3, 9), (5, 25)
D (0, 1), (2, 3), (5, 9), (4, 7)
8. Which equation is graphed below?
A 2x y 1
B 2x y 1
C 12 x y 1
D 12 x y 1
9. What is the equation of a line that passes
through (1, 4) and (2, 7)?
A y x 5
B y x 5
C y 11x 8
D y 11x 15
10. A direct variation contains the point
(9, 12). Which of the following is
another point for the same direct
variation?
A (6, 8)
B (1, 4)
C (1, 1.75)
D ( 1.5, 2)
11. The graph of which equation would be
perpendicular to a line with a slope of 15?
A y 5x 2
B y 15 x 3
C y 5x 2
D 5y x 2
O
2
4
424 2
2
4
x
y
O
2
4
424 2
2
4
x
y
Progress Monitoring AssessmentsCopyright © by Pearson Education, Inc., or its affiliates. All Rights Reserved.
27
Name Class Date
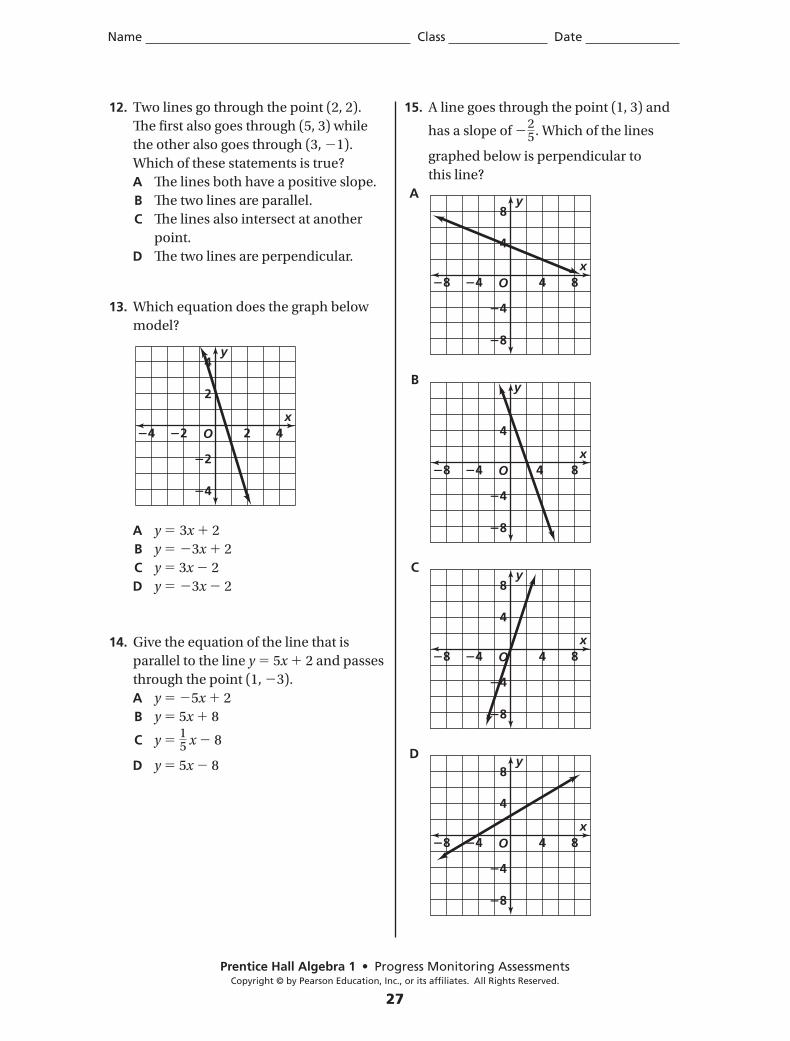
12. Two lines go through the point (2, 2).
The first also goes through (5, 3) while
the other also goes through (3, 1).
Which of these statements is true?
A The lines both have a positive slope.
B The two lines are parallel.
C The lines also intersect at another
point.
D The two lines are perpendicular.
13. Which equation does the graph below
model?
A y 3x 2
B y 3x 2
C y 3x 2
D y 3x 2
14. Give the equation of the line that is
parallel to the line y 5x 2 and passes
through the point (1, 3).
A y 5x 2
B y 5x 8
C y 15 x 8
D y 5x 8
15. A line goes through the point (1, 3) and
has a slope of 25. Which of the lines
graphed below is perpendicular to
this line?
A
B
C
D
O
2
4
424 2
2
4
x
y
O
4
8
848 4
4
8
x
y
O
4
848 4
4
8
x
y
O
4
8
848 4
4
8
x
y
O
4
8
848 4
4
8
x
y
Progress Monitoring AssessmentsCopyright © by Pearson Education, Inc., or its affiliates. All Rights Reserved.
28
Name Class Date
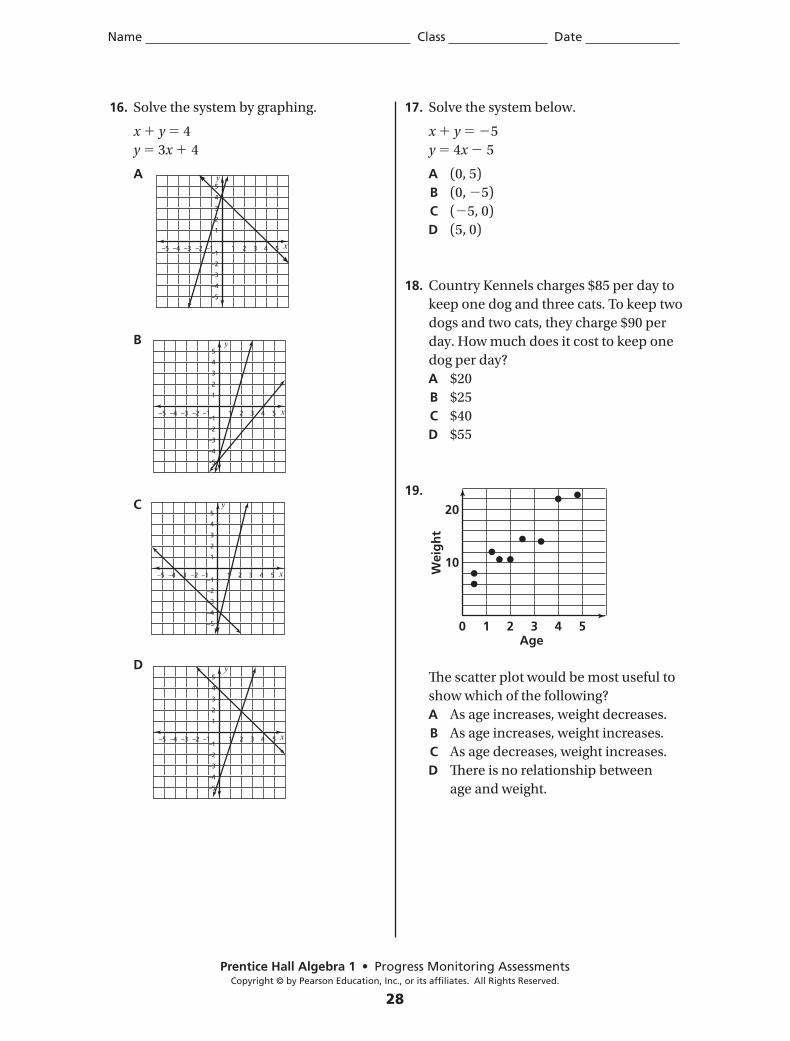
16. Solve the system by graphing.
x y 4
y 3x 4
A
B
C
D
17. Solve the system below.
x y 5
y 4x 5
A (0, 5)
B (0, 5)
C ( 5, 0)
D (5, 0)
18. Country Kennels charges $85 per day to
keep one dog and three cats. To keep two
dogs and two cats, they charge $90 per
day. How much does it cost to keep one
dog per day?
A $20
B $25
C $40
D $55
19.
The scatter plot would be most useful to
show which of the following?
A As age increases, weight decreases.
B As age increases, weight increases.
C As age decreases, weight increases.
D There is no relationship between
age and weight.
5
4
3
2
1
y
–1
–2
–3
–4
–5
–5 –4 –3 –2 –1 1 2 3 4 5 x
5
4
3
2
1
y
–1
–2
–3
–4
–5
–5 –4 –3 –2 –1 1 2 3 4 5 x
5
4
3
2
1
y
–1
–2
–3
–4
–5
–5 –4 –3 –2 –1 1 2 3 4 5 x
5
4
3
2
1
y
–1
–2
–3
–4
–5
–5 –4 –3 –2 –1 1 2 3 4 5 x
10
20
0 1 2 3 4 5Age
Wei
gh
t
Progress Monitoring AssessmentsCopyright © by Pearson Education, Inc., or its affiliates. All Rights Reserved.
29
Name Class Date
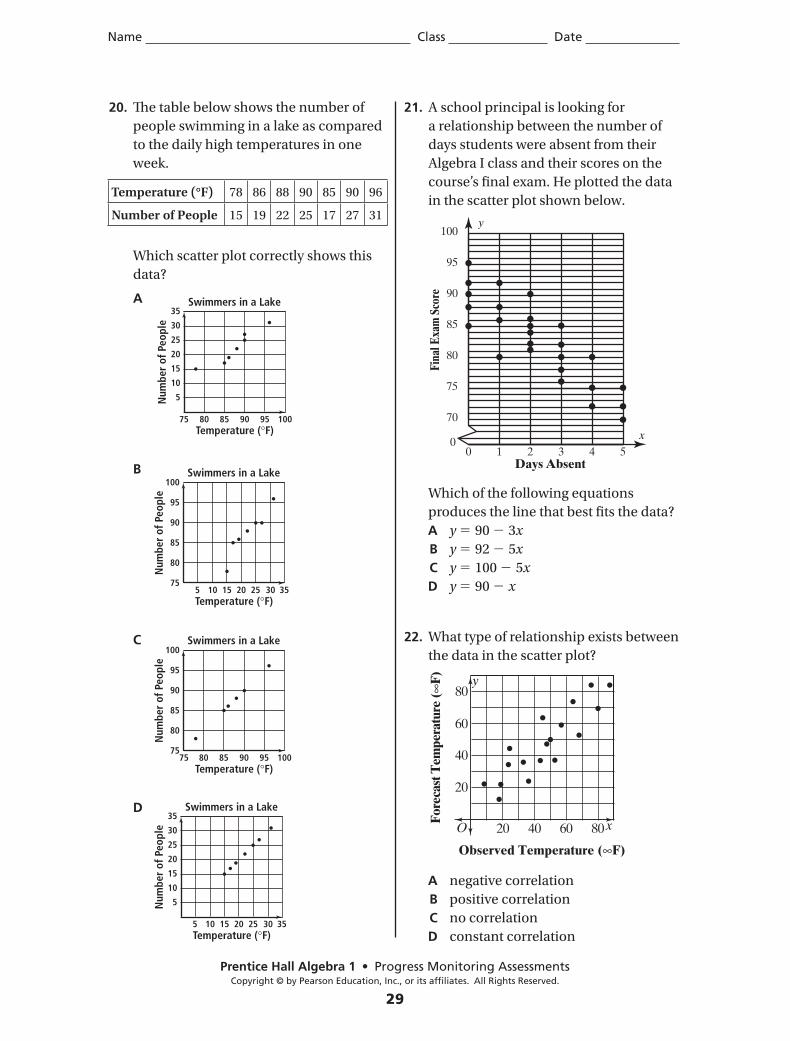
20. The table below shows the number of
people swimming in a lake as compared
to the daily high temperatures in one
week.
Which scatter plot correctly shows this
data?
A
B
C
D
21. A school principal is looking for
a relationship between the number of
days students were absent from their
Algebra I class and their scores on the
course’s final exam. He plotted the data
in the scatter plot shown below.
Which of the following equations
produces the line that best fits the data?
A y 90 3x
B y 92 5x
C y 100 5x
D y 90 x
22. What type of relationship exists between
the data in the scatter plot?
A negative correlation
B positive correlation
C no correlation
D constant correlation
Temperature (°F) 78 86 88 90 85 90 96
Number of People 15 19 22 25 17 27 31
85 958075 90 100Temperature ( F)
Swimmers in a Lake
Num
ber
of P
eopl
e
35
30
25
20
15
10
5
5 10 15 20 25 30 35Temperature ( F)
Swimmers in a Lake
Num
ber
of P
eopl
e
100
95
90
85
80
75
Temperature ( F)
Swimmers in a Lake
Num
ber
of P
eopl
e
100
95
90
85
80
7585 958075 90 100
Temperature ( F)
Swimmers in a Lake
Num
ber
of P
eopl
e
5 10 15 20 25 30 35
35
30
25
20
15
10
5
00
1 2 3 4 5
70
75
80
85
90
95
100y
x
Fina
l Exa
m S
core
Days Absent
y
O x
20
40
60
80
20 40 60 80
Fore
cast
Tem
pera
ture
(F)
Observed Temperature ( F)
Progress Monitoring AssessmentsCopyright © by Pearson Education, Inc., or its affiliates. All Rights Reserved.
30
Name Class Date
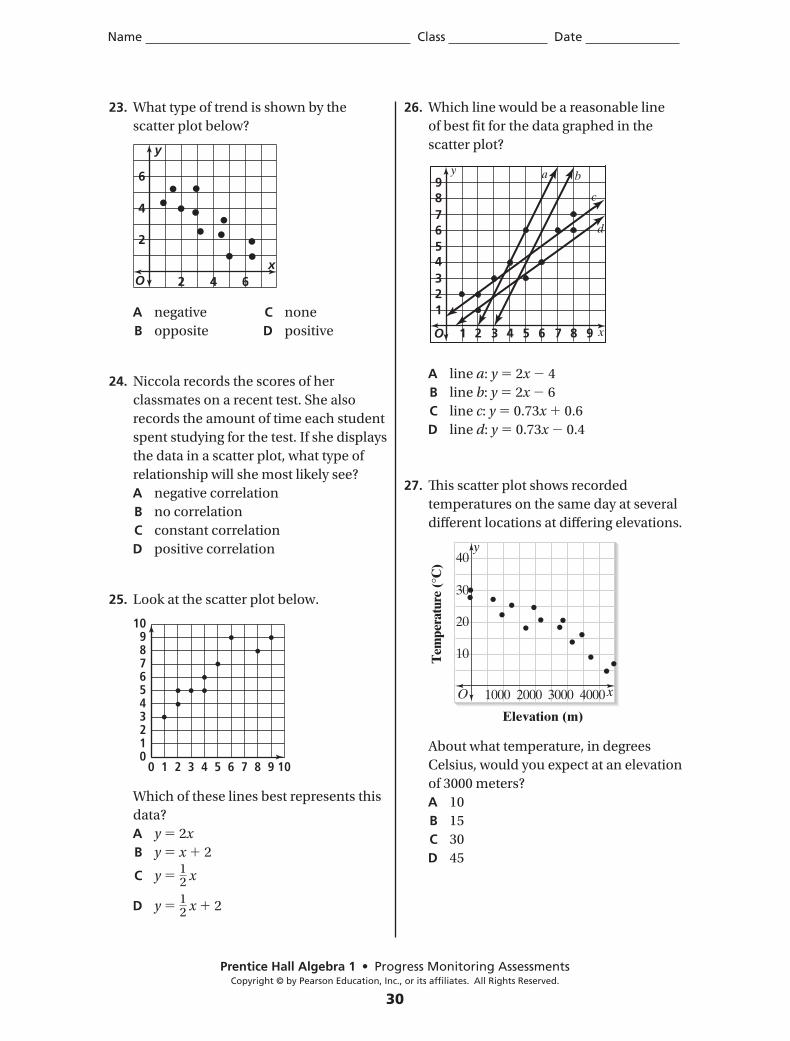
23. What type of trend is shown by the
scatter plot below?
A negative C none
B opposite D positive
24. Niccola records the scores of her
classmates on a recent test. She also
records the amount of time each student
spent studying for the test. If she displays
the data in a scatter plot, what type of
relationship will she most likely see?
A negative correlation
B no correlation
C constant correlation
D positive correlation
25. Look at the scatter plot below.
Which of these lines best represents this
data?
A y 2x
B y x 2
C y 12 x
D y 12 x 2
26. Which line would be a reasonable line
of best fit for the data graphed in the
scatter plot?
A line a: y 2x 4
B line b: y 2x 6
C line c: y 0.73x 0.6
D line d: y 0.73x 0.4
27. This scatter plot shows recorded
temperatures on the same day at several
different locations at differing elevations.
About what temperature, in degrees
Celsius, would you expect at an elevation
of 3000 meters?
A 10
B 15
C 30
D 45
O
2
4
6
4 62x
y
0 1 2 3 4 5 6 7 8 9 10
109876543210
986 75421 3 x
4
23
1
89
67
5
y a b
c
d
O
y
O x
10
20
30
40
1000 2000 3000 4000
Tem
pera
ture
(C
)
Elevation (m)
Name Class Date
Progress Monitoring AssessmentsCopyright © by Pearson Education, Inc., or its affiliates. All Rights Reserved.
31
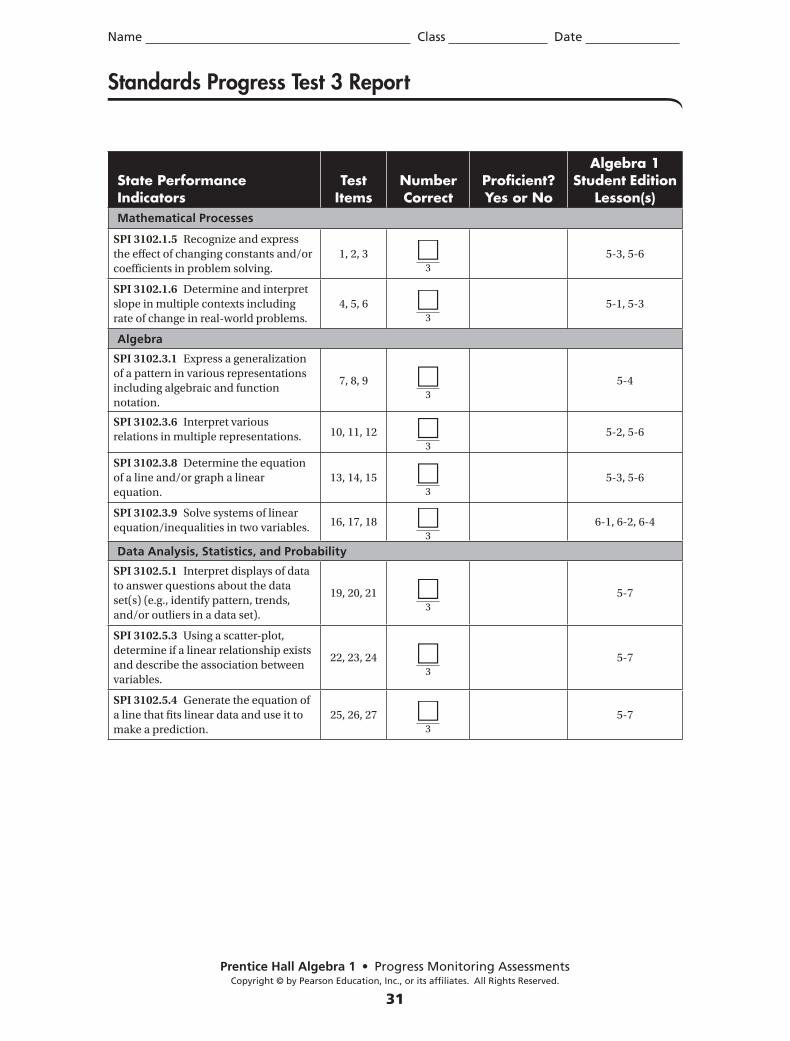
Standards Progress Test 3 Report
State Performance Indicators
Test Items
Number Correct
Proficient? Yes or No
Algebra 1 Student Edition
Lesson(s)Mathematical Processes
SPI 3102.1.5 Recognize and express
the effect of changing constants and/or
coefficients in problem solving.
1, 2, 33
5-3, 5-6
SPI 3102.1.6 Determine and interpret
slope in multiple contexts including
rate of change in real-world problems.
4, 5, 63
5-1, 5-3
Algebra
SPI 3102.3.1 Express a generalization
of a pattern in various representations
including algebraic and function
notation.
7, 8, 93
5-4
SPI 3102.3.6 Interpret various
relations in multiple representations. 10, 11, 123
5-2, 5-6
SPI 3102.3.8 Determine the equation
of a line and/or graph a linear
equation.
13, 14, 153
5-3, 5-6
SPI 3102.3.9 Solve systems of linear
equation/inequalities in two variables. 16, 17, 183
6-1, 6-2, 6-4
Data Analysis, Statistics, and Probability
SPI 3102.5.1 Interpret displays of data
to answer questions about the data
set(s) (e.g., identify pattern, trends,
and/or outliers in a data set).
19, 20, 213
5-7
SPI 3102.5.3 Using a scatter-plot,
determine if a linear relationship exists
and describe the association between
variables.
22, 23, 243
5-7
SPI 3102.5.4 Generate the equation of
a line that fits linear data and use it to
make a prediction.
25, 26, 273
5-7
Name Class Date
Progress Monitoring AssessmentsCopyright © by Pearson Education, Inc., or its affiliates. All Rights Reserved.
32
Student Comments:
Parent Comments:
Teacher Comments:
Progress Monitoring AssessmentsCopyright © by Pearson Education, Inc., or its affiliates. All Rights Reserved.
33
Name Class Date
1. Which of the following is an exponential
growth function?
A f (x) 12(4)x
B f (x) 312
x
C f (x) 3x 3
D f (x) 2x2 1
2. Which of the following equations
models exponential decay?
A y 14 300x
B y 0.005 5x
C y 300 6x
D y 450 23
x
3. Which equation best models the data in
the table?
x f (x)
114
0 1
1 4
2 16
3 64
A f (x) 4x
B f (x) 4x
C f (x) x4
D f (x) x4
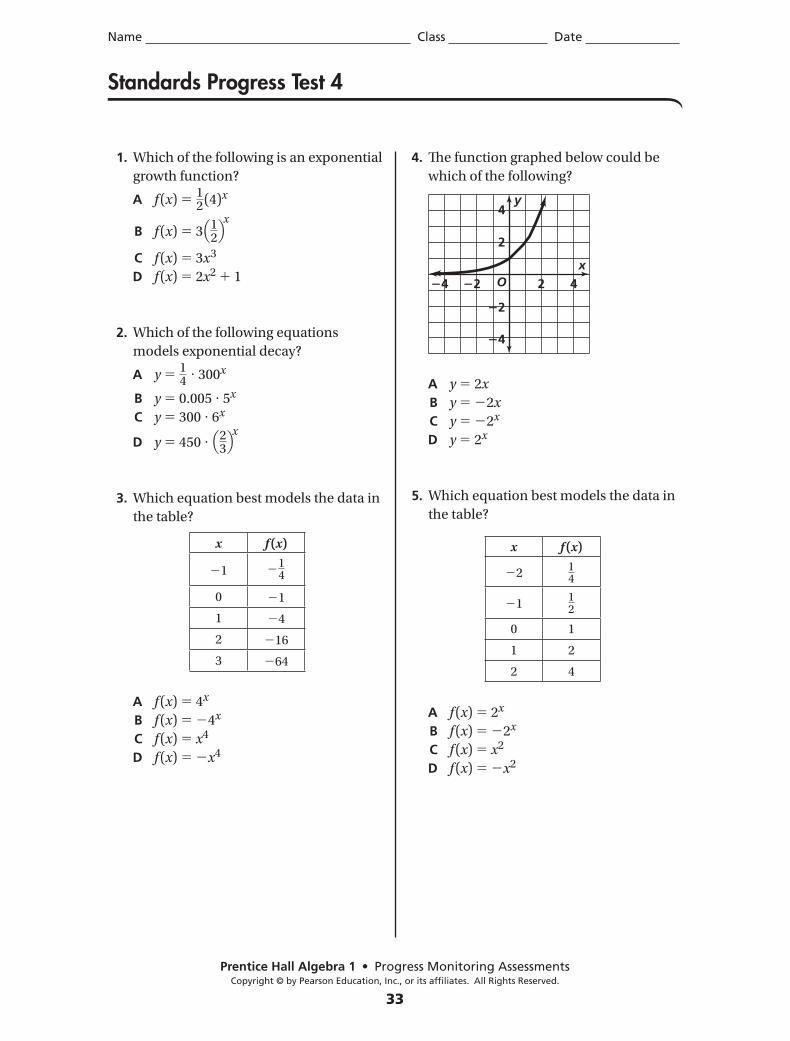
4. The function graphed below could be
which of the following?
A y 2x
B y 2x
C y 2x
D y 2x
5. Which equation best models the data in
the table?
x f (x)
214
112
0 1
1 2
2 4
A f (x) 2x
B f (x) 2x
C f (x) x2
D f (x) x2
O
4
2
2
2
4
4 42x
y
Standards Progress Test 4
Progress Monitoring AssessmentsCopyright © by Pearson Education, Inc., or its affiliates. All Rights Reserved.
34
Name Class Date
6. Suppose you invest $6200 in an account
that has an annual yield of 8.6%. Which
equation models the amount in the
account after 6 years?
A f (x) 1.086 (6200)6
B f (x) 0.086 (6200)6
C f (x) 6200 (1.086)6
D f (x) 6200 (0.086)6
7. Carrie inherited $6,300 and invested it in
an account with an annual interest rate
of 5.5%. How much greater was Carrie’s
balance after 5 years than it was after
2 years?
A $346.50
B $1,094.82
C $1,221.79
D $7,397.72
8. The population in a European city was
about 152,494 in 2002 and is decreasing
at a rate of 1% per year. The population
in an Asian city was about 175,630
in 2002 and its population is also
decreasing at a rate of 1% per year. How
many more people did the Asian city
have than the European city in 2005?
A 22,450
B 22,675
C 23,136
D 23,837
9. A bank account with a starting balance
of $800 earns 6% annual interest,
compounded monthly. How much
greater was the balance after 4 years
than after 2 years?
A $114.66
B $111.10
C $96.00
D $8.10
10. Multiply.
(2.4 106)(3 102)
A 7.2 103
B 7.2 104
C 7.2 108
D 7.2 1012
11. Simplify.
8.7 108
2.9 102
A 3 104
B 3 106
C 3 1010
D 3 1016
12. Divide.
6.2 10 4
3 106
A 2.1 10 24
B 2.1 10 10
C 2.1 10 2
D 2.1 102
Progress Monitoring AssessmentsCopyright © by Pearson Education, Inc., or its affiliates. All Rights Reserved.
35
Name Class Date
13. The equation A 300(1.06)x represents
the amount in a savings account x years
after the account is opened. How much
will be in the account after 4 years?
A $322.34
B $372.00
C $378.74
D $401.46
14. The equation V 2000 1.07x models
the expected value of a painting x years
after it was made. How much is the
painting expected to be worth after
25 years?
A $5500
B $10,854.87
C $11,000
D $18,762.39
15. The population of a small town can
be modeled using the equation
P 12,000 78
x where x is in years.
One year, the population was 9,187.
Which of the following was the
population a year later?
A 8,039
B 7,033
C 6,154
D 5,384
16. Subtract.
(4y3 2y2 2y 3) (2y3 3y2 2y)
A 2y3 y2 4y 3
B 4y3 5y2 6y 3
C 4y3 y2 2y
D 2y3 5y2 4y 3
17. A circular pond has a radius of 2x 3.
Which expression describes the area of
the pond?
A (4x 6)
B (4x 9)
C (4x2 12x 9)
D (4x2 12x 9)
18. Simplify the algebraic expression
7x(x2 2) 5(x 3).
A 7x3 19x 15
B 7x2 5x 1
C 7x3 35x2 91
D 7x2 5x 5
19. Which algebraic expression is equivalent
to x(2x2 1) 2(x2 1)?
A 2x3 2x2 2x 2
B 2x3 2x2 x 2
C 2x3 x2 2x 2
D 2x3 x2 x 2
Progress Monitoring AssessmentsCopyright © by Pearson Education, Inc., or its affiliates. All Rights Reserved.
36
Name Class Date
20. Subtract.
(x2 6x 8) ( 3x2 2x 9)
A 4x2 4x 1
B 2x2 4x 1
C 4x2 4x 17
D 4x2 8x 17
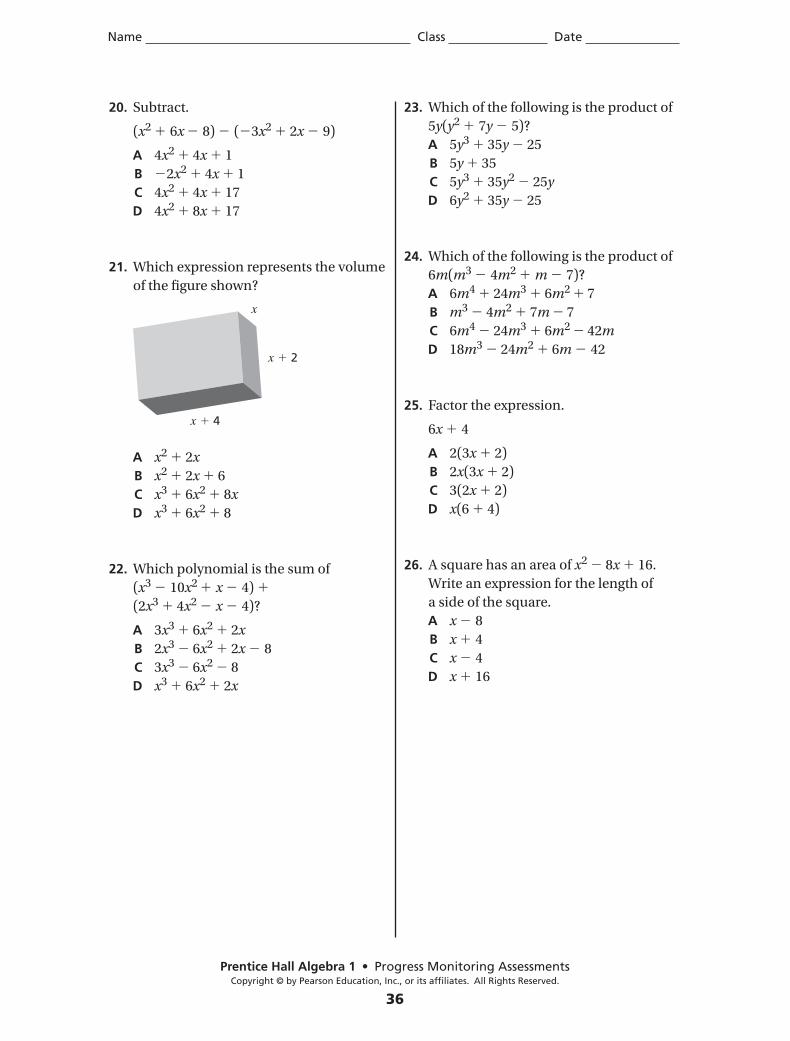
21. Which expression represents the volume
of the figure shown?
A x2 2x
B x2 2x 6
C x3 6x2 8x
D x3 6x2 8
22. Which polynomial is the sum of
(x3 10x2 x 4)
(2x3 4x2 x 4)?
A 3x3 6x2 2x
B 2x3 6x2 2x 8
C 3x3 6x2 8
D x3 6x2 2x
23. Which of the following is the product of
5y(y2 7y 5)?
A 5y3 35y 25
B 5y 35
C 5y3 35y2 25y
D 6y2 35y 25
24. Which of the following is the product of
6m(m3 4m2 m 7)?
A 6m4 24m3 6m2 7
B m3 4m2 7m 7
C 6m4 24m3 6m2 42m
D 18m3 24m2 6m 42
25. Factor the expression.
6x 4
A 2(3x 2)
B 2x(3x 2)
C 3(2x 2)
D x(6 4)
26. A square has an area of x2 8x 16.
Write an expression for the length of
a side of the square.
A x 8
B x 4
C x 4
D x 16
x 4
x 2
x
Progress Monitoring AssessmentsCopyright © by Pearson Education, Inc., or its affiliates. All Rights Reserved.
37
Name Class Date
27. A square has an area of
16x2 8x 1. Write an expression
for the length of a side of the square.
A x 1
B 2x 1
C 4x 1
D 8x 1
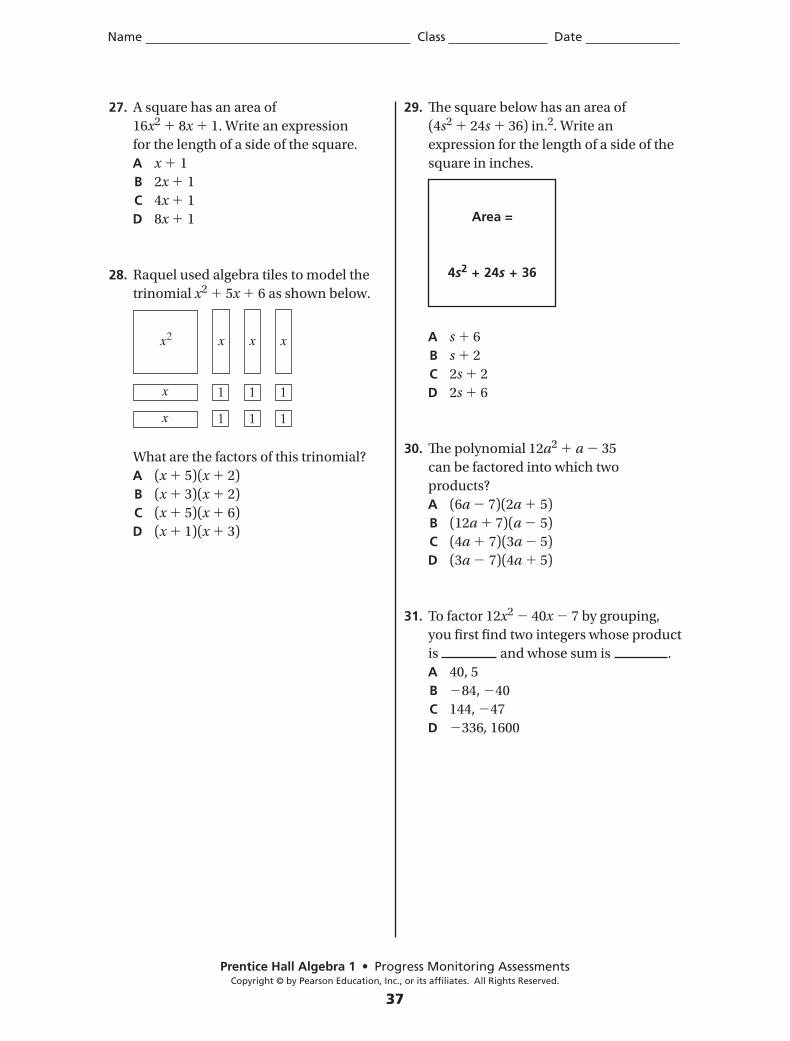
28. Raquel used algebra tiles to model the
trinomial x2 5x 6 as shown below.
What are the factors of this trinomial?
A (x 5)(x 2)
B (x 3)(x 2)
C (x 5)(x 6)
D (x 1)(x 3)
29. The square below has an area of
(4s2 24s 36) in.2. Write an
expression for the length of a side of the
square in inches.
A s 6
B s 2
C 2s 2
D 2s 6
30. The polynomial 12a2 a 35
can be factored into which two
products?
A (6a 7)(2a 5)
B (12a 7)(a 5)
C (4a 7)(3a 5)
D (3a 7)(4a 5)
31. To factor 12x2 40x 7 by grouping,
you first find two integers whose product
is and whose sum is .
A 40, 5
B 84, 40
C 144, 47
D 336, 1600
Area =
4s2 + 24s + 36
Progress Monitoring AssessmentsCopyright © by Pearson Education, Inc., or its affiliates. All Rights Reserved.
38
Name Class Date
32. Which of the following shows the
complete factorization of 6x2 216?
A 6(x 6)(x 6)
B (6x 36)(6x 36)
C 6(x 6)
D (6x 36)(x 6)
33. Find the greatest common factor of the
terms in 14a2b3 42a5b2.
A 7ab
B 7a2b2
C 14a5b3
D 14a2b2
34. x2 5x 6
A (x 2)(x 3)
B (x 2)(x 3)
C (x 1)(x 6)
D (x 1)(x 6)
35. Find the greatest common factor of the
terms in 9c3 6c2 12c.
A 3
B 3c
C 9
D 9c
36. Factor by grouping.
6x3 27x2 2x 9
A (2x 9)(3x2 1)
B 3(2x2 1)(x 3)
C 3(x 3)(2x2 1)
D (3x2 1)(2x 9)
Name Class Date
Progress Monitoring AssessmentsCopyright © by Pearson Education, Inc., or its affiliates. All Rights Reserved.
39
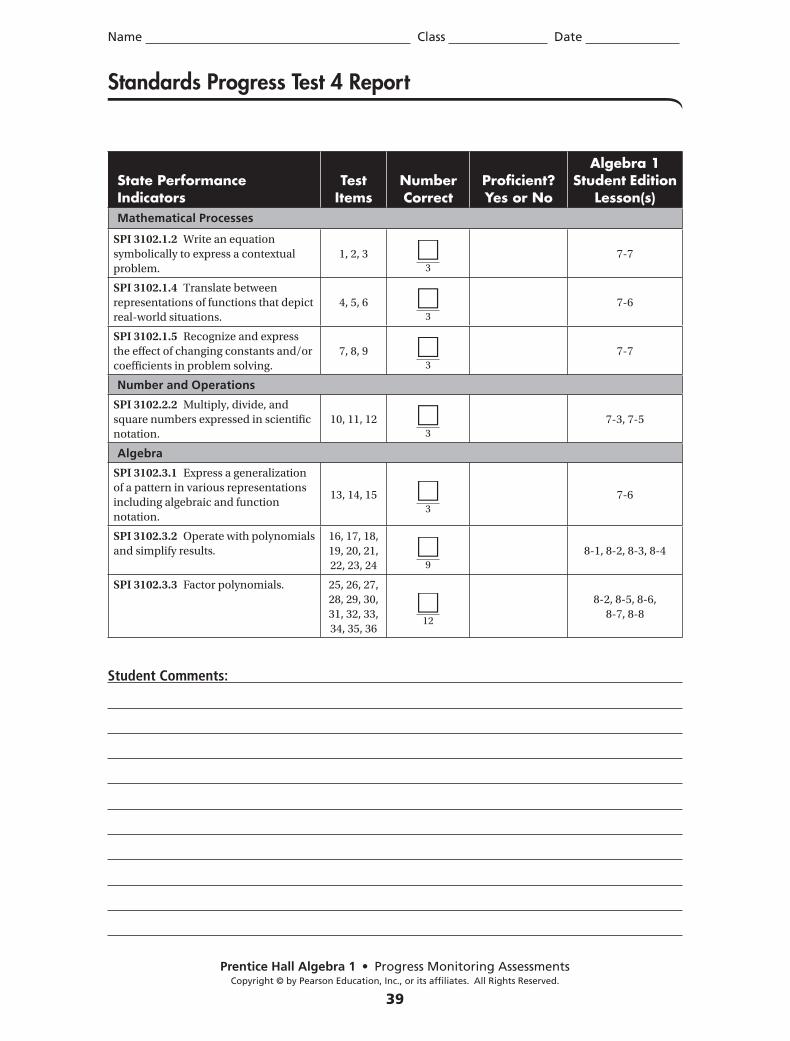
Standards Progress Test 4 Report
State Performance Indicators
Test Items
Number Correct
Proficient? Yes or No
Algebra 1 Student Edition
Lesson(s)Mathematical Processes
SPI 3102.1.2 Write an equation
symbolically to express a contextual
problem.
1, 2, 33
7-7
SPI 3102.1.4 Translate between
representations of functions that depict
real-world situations.
4, 5, 63
7-6
SPI 3102.1.5 Recognize and express
the effect of changing constants and/or
coefficients in problem solving.
7, 8, 93
7-7
Number and Operations
SPI 3102.2.2 Multiply, divide, and
square numbers expressed in scientific
notation.
10, 11, 123
7-3, 7-5
Algebra
SPI 3102.3.1 Express a generalization
of a pattern in various representations
including algebraic and function
notation.
13, 14, 153
7-6
SPI 3102.3.2 Operate with polynomials
and simplify results.
16, 17, 18,
19, 20, 21,
22, 23, 24 9
8-1, 8-2, 8-3, 8-4
SPI 3102.3.3 Factor polynomials. 25, 26, 27,
28, 29, 30,
31, 32, 33,
34, 35, 3612
8-2, 8-5, 8-6,
8-7, 8-8
Student Comments:

Name Class Date
Progress Monitoring AssessmentsCopyright © by Pearson Education, Inc., or its affiliates. All Rights Reserved.
40
Parent Comments:
Teacher Comments:
Progress Monitoring AssessmentsCopyright © by Pearson Education, Inc., or its affiliates. All Rights Reserved.
41
Name Class Date
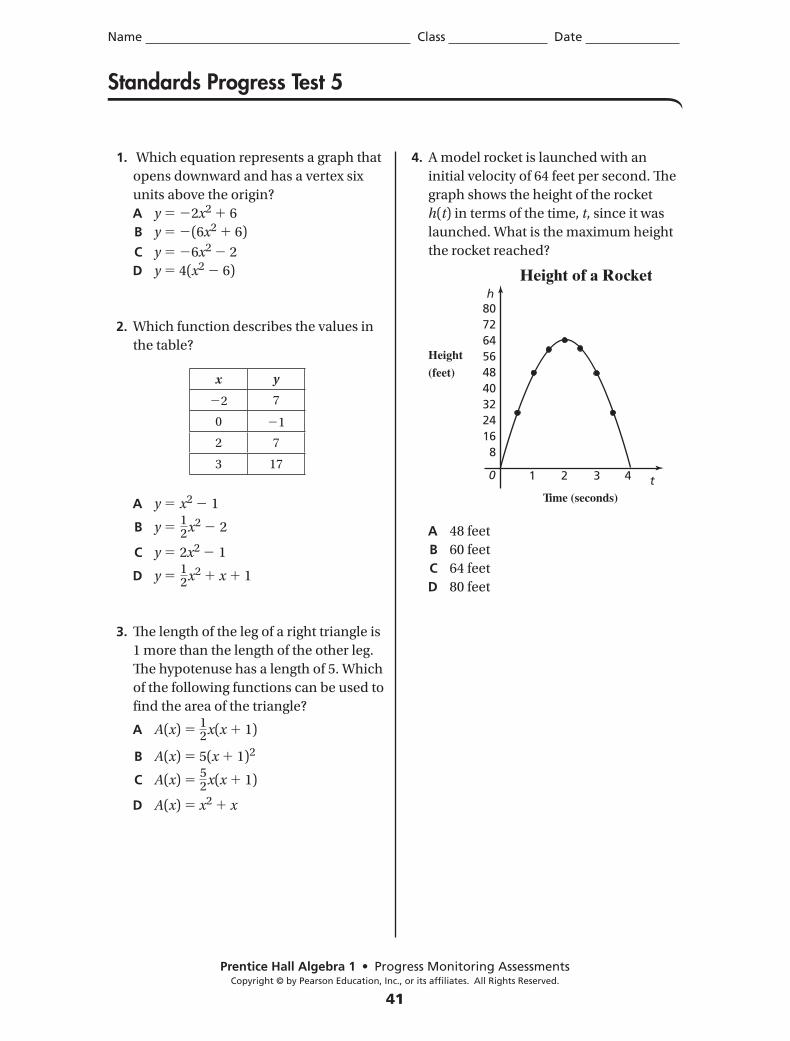
1. Which equation represents a graph that
opens downward and has a vertex six
units above the origin?
A y 2x2 6
B y (6x2 6)
C y 6x2 2
D y 4(x2 6)
2. Which function describes the values in
the table?
x y
2 7
0 1
2 7
3 17
A y x2 1
B y 12x2 2
C y 2x2 1
D y 12x2 x 1
3. The length of the leg of a right triangle is
1 more than the length of the other leg.
The hypotenuse has a length of 5. Which
of the following functions can be used to
find the area of the triangle?
A A(x) 12x(x 1)
B A(x) 5(x 1)2
C A(x) 52x(x 1)
D A(x) x2 x
4. A model rocket is launched with an
initial velocity of 64 feet per second. The
graph shows the height of the rocket
h(t) in terms of the time, t, since it was
launched. What is the maximum height
the rocket reached?
A 48 feet
B 60 feet
C 64 feet
D 80 feet
h
Time (seconds)
Height
(feet)
Height of a Rocket
t1 2 3 4
8072645648403224168
0
Standards Progress Test 5
Progress Monitoring AssessmentsCopyright © by Pearson Education, Inc., or its affiliates. All Rights Reserved.
42
Name Class Date
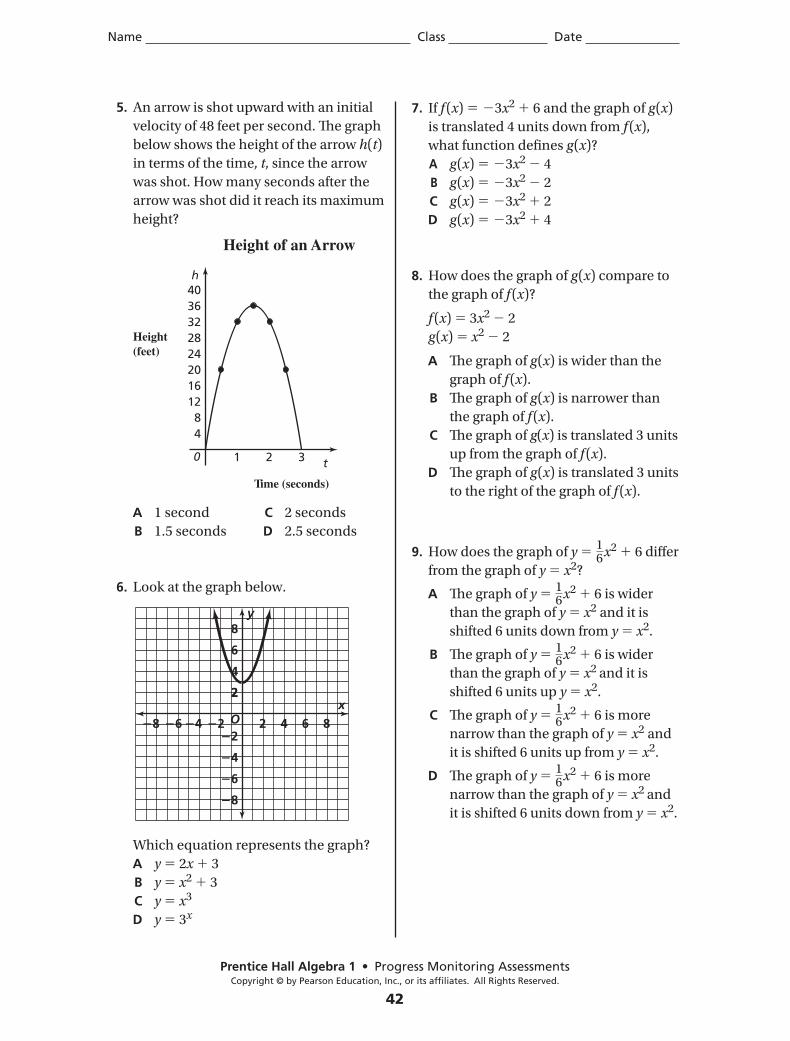
5. An arrow is shot upward with an initial
velocity of 48 feet per second. The graph
below shows the height of the arrow h(t)
in terms of the time, t, since the arrow
was shot. How many seconds after the
arrow was shot did it reach its maximum
height?
A 1 second C 2 seconds
B 1.5 seconds D 2.5 seconds
6. Look at the graph below.
Which equation represents the graph?
A y 2x 3
B y x2 3
C y x3
D y 3x
7. If f (x) 3x2 6 and the graph of g (x)
is translated 4 units down from f (x),
what function defines g (x)?
A g (x) 3x2 4
B g (x) 3x2 2
C g (x) 3x2 2
D g (x) 3x2 4
8. How does the graph of g (x) compare to
the graph of f (x)?
f (x) 3x2 2
g (x) x2 2
A The graph of g (x) is wider than the
graph of f (x).
B The graph of g (x) is narrower than
the graph of f (x).
C The graph of g(x) is translated 3 units
up from the graph of f (x).
D The graph of g (x) is translated 3 units
to the right of the graph of f (x).
9. How does the graph of y 16x2 6 differ
from the graph of y x2?
A The graph of y 16x2 6 is wider
than the graph of y x2 and it is
shifted 6 units down from y x2.
B The graph of y 16x2 6 is wider
than the graph of y x2 and it is
shifted 6 units up y x2.
C The graph of y 16x2 6 is more
narrow than the graph of y x2 and
it is shifted 6 units up from y x2.
D The graph of y 16x2 6 is more
narrow than the graph of y x2 and
it is shifted 6 units down from y x2.
h
Time (seconds)
Height(feet)
Height of an Arrow
t1 2 3
403632282420161284
0
O
8
6
4
22
22
4
6
8
468 4 6 82x
y
Progress Monitoring AssessmentsCopyright © by Pearson Education, Inc., or its affiliates. All Rights Reserved.
43
Name Class Date
10. Evaluate 2 x 3 for x 6.
A 18
B 12
C 6
D 3
11. Which of the following statements is
true?
A 2 12 3 9
B 8 25 5 32
C 6 6 3 8
D 3 4 2 9
12. Brian is helping his dad stake a tree in
their front yard. They are placing a wire
around the tree trunk at a height of 6 feet
and driving the stakes into the ground
3 feet from the base of the tree. How long
must the wire be to the nearest tenth of
a foot?
A 5.2 feet
B 6.7 feet
C 9.0 feet
D 18.0 feet
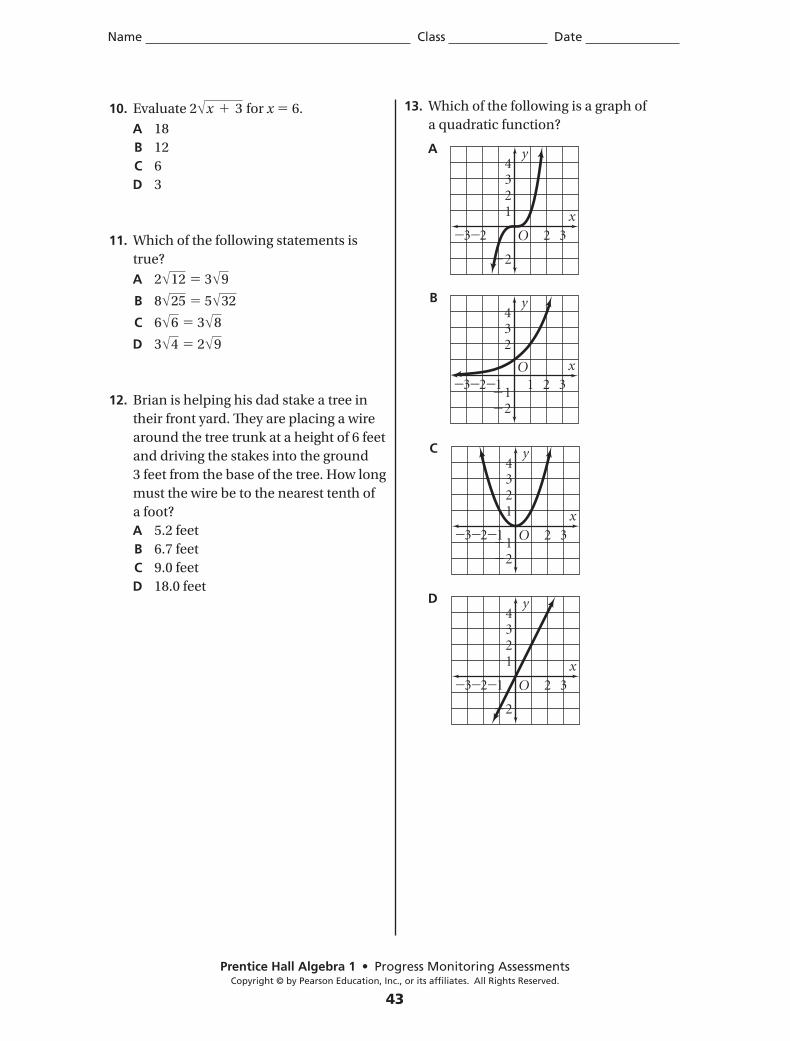
13. Which of the following is a graph of
a quadratic function?
A
B
C
D
x
y
O 2 323
21
34
2
x
y
O1 2 32 13
234
12
x
y
O 2 32 13
21
34
21
x
y
O 2 32 13
21
34
2
Progress Monitoring AssessmentsCopyright © by Pearson Education, Inc., or its affiliates. All Rights Reserved.
44
Name Class Date
14. Which of the following graphs of the
given equations would be symmetric
about the y-axis?
A y 4x C y x
12
B y 2x2 D y x 2
15. Which equation could be used to find
the balance y in a bank account after
x years? The initial deposit is $300
and the account pays 2% interest,
compounded annually.
A y 300 0.02x
B y 300 1.02x
C y 0.02 300x
D y 1.02 300x
16. (24x6 3x3 12x2) 6x
A 4x6 12x3 2x2
B 4x5 12x2 2x
C 4x5 2x2 2x
D 18x5 3x2 6x
17. Divide.
( 7x5 28x3 14x4 42x2) ( 7x2)
A x3 2x2 4x 6
B x3 2x2 4x 6
C x3 4x2 2x 6
D x3 4x2 2x 6
18. Divide.
(x3 125) (x 5)
A x2 25
B x2 5x 25
C x2 5x 25
D x2 x 120
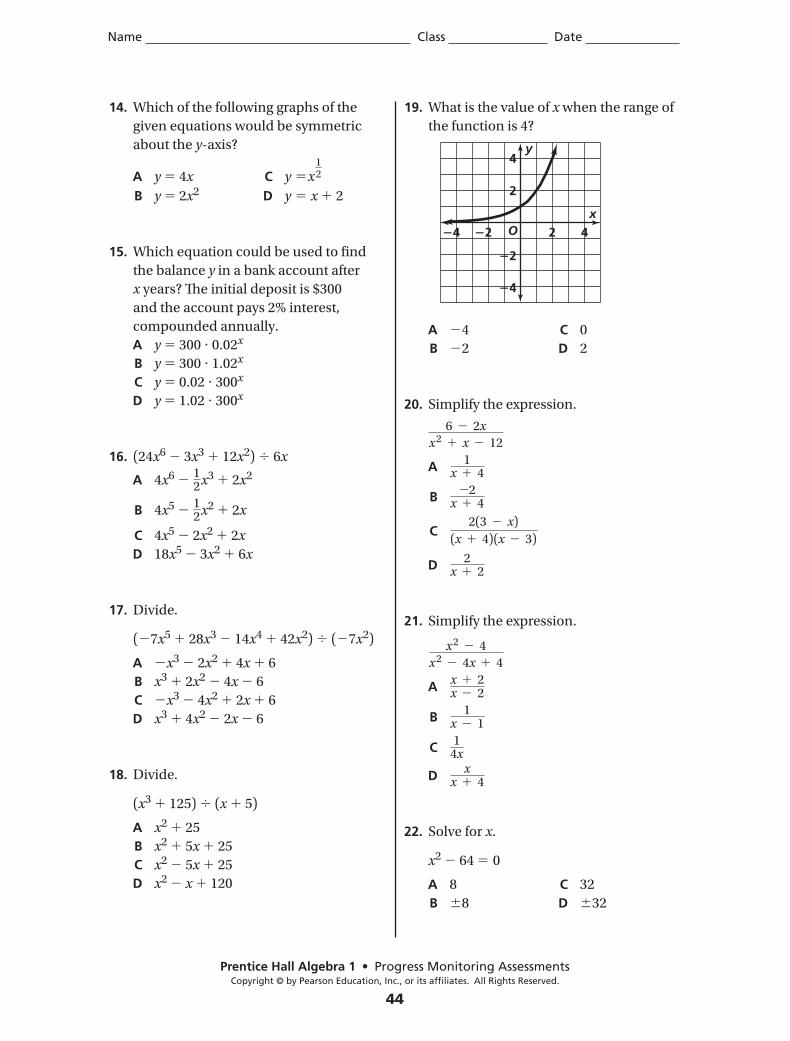
19. What is the value of x when the range of
the function is 4?
A 4 C 0
B 2 D 2
20. Simplify the expression.
6 2x
x 2 x 12
A 1x 4
B 2x 4
C 2(3 x)
(x 4)(x 3)
D 2x 2
21. Simplify the expression.
x 2 4
x 2 4x 4
A x 2x 2
B 1x 1
C 14x
D xx 4
22. Solve for x.
x2 64 0
A 8 C 32
B 8 D 32
O
4
2
2
2
4
4 42x
y
Progress Monitoring AssessmentsCopyright © by Pearson Education, Inc., or its affiliates. All Rights Reserved.
45
Name Class Date
23. Solve the equation for x.
(x 2)2 16
A 2 or 6
B 0 or 6
C 2
D 0 or 4
24. Solve 12x2 17x 6 0 for x.
A 23 and
34
B 23 and
34
C 112 and 6
D 16 and
13
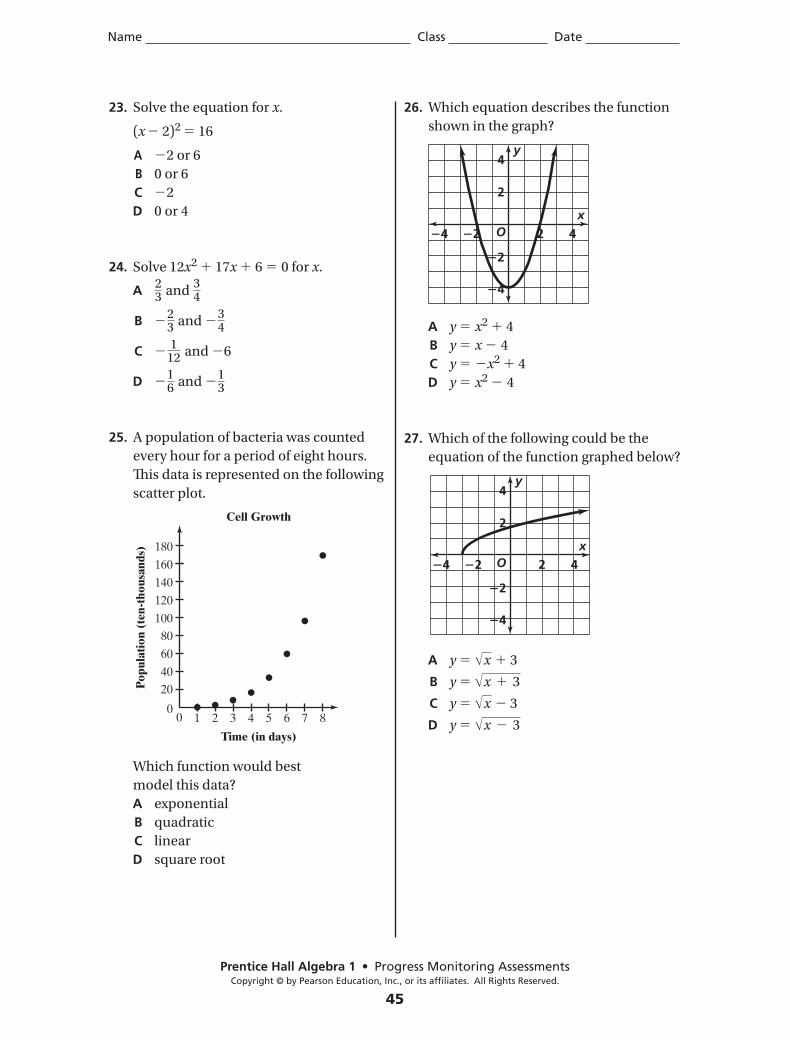
25. A population of bacteria was counted
every hour for a period of eight hours.
This data is represented on the following
scatter plot.
Which function would best
model this data?
A exponential
B quadratic
C linear
D square root
26. Which equation describes the function
shown in the graph?
A y x2 4
B y x 4
C y x2 4
D y x2 4
27. Which of the following could be the
equation of the function graphed below?
A y x 3
B y x 3
C y x 3
D y x 3
20
40
60
80
100
120
140
160
180
00 1 2 3 4 5 6 8
Time (in days)
Cell Growth
7
Pop
ulat
ion
(ten
-tho
usan
ds)
O
4
2
2
2
4
4 42x
y
O
4
2
2
2
4
4 42x
y
Name Class Date
Progress Monitoring AssessmentsCopyright © by Pearson Education, Inc., or its affiliates. All Rights Reserved.
46
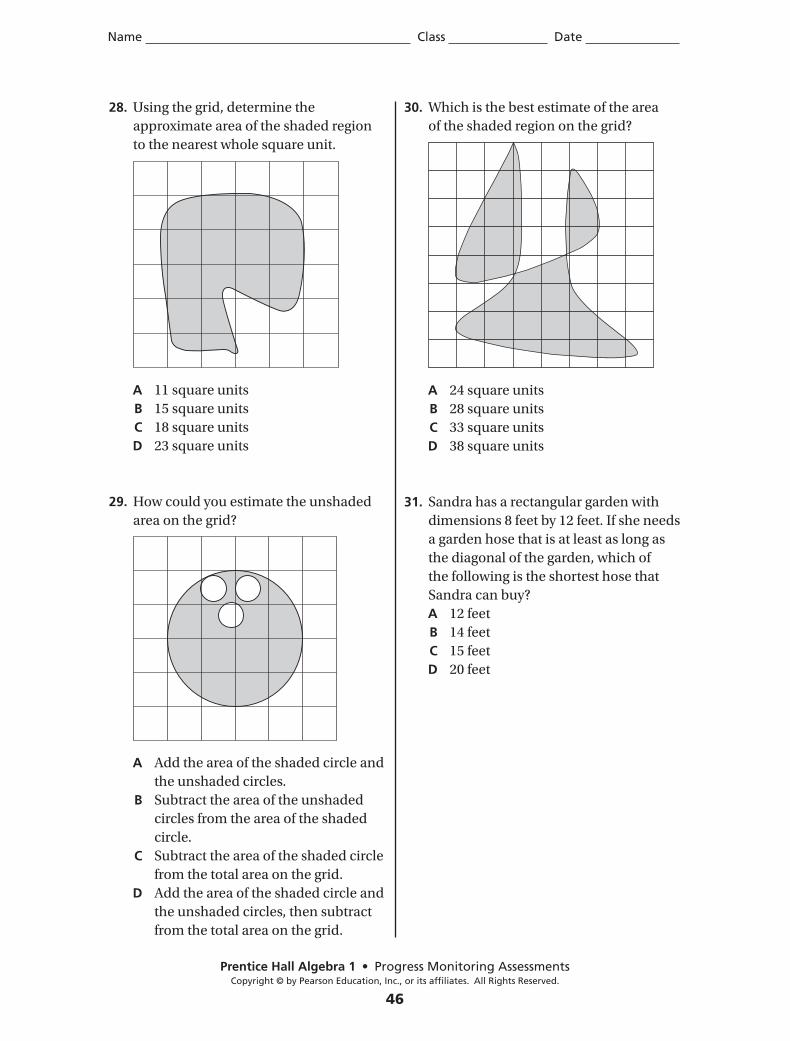
28. Using the grid, determine the
approximate area of the shaded region
to the nearest whole square unit.
A 11 square units
B 15 square units
C 18 square units
D 23 square units
29. How could you estimate the unshaded
area on the grid?
A Add the area of the shaded circle and
the unshaded circles.
B Subtract the area of the unshaded
circles from the area of the shaded
circle.
C Subtract the area of the shaded circle
from the total area on the grid.
D Add the area of the shaded circle and
the unshaded circles, then subtract
from the total area on the grid.
30. Which is the best estimate of the area
of the shaded region on the grid?
A 24 square units
B 28 square units
C 33 square units
D 38 square units
31. Sandra has a rectangular garden with
dimensions 8 feet by 12 feet. If she needs
a garden hose that is at least as long as
the diagonal of the garden, which of
the following is the shortest hose that
Sandra can buy?
A 12 feet
B 14 feet
C 15 feet
D 20 feet
Progress Monitoring AssessmentsCopyright © by Pearson Education, Inc., or its affiliates. All Rights Reserved.
47
Name Class Date
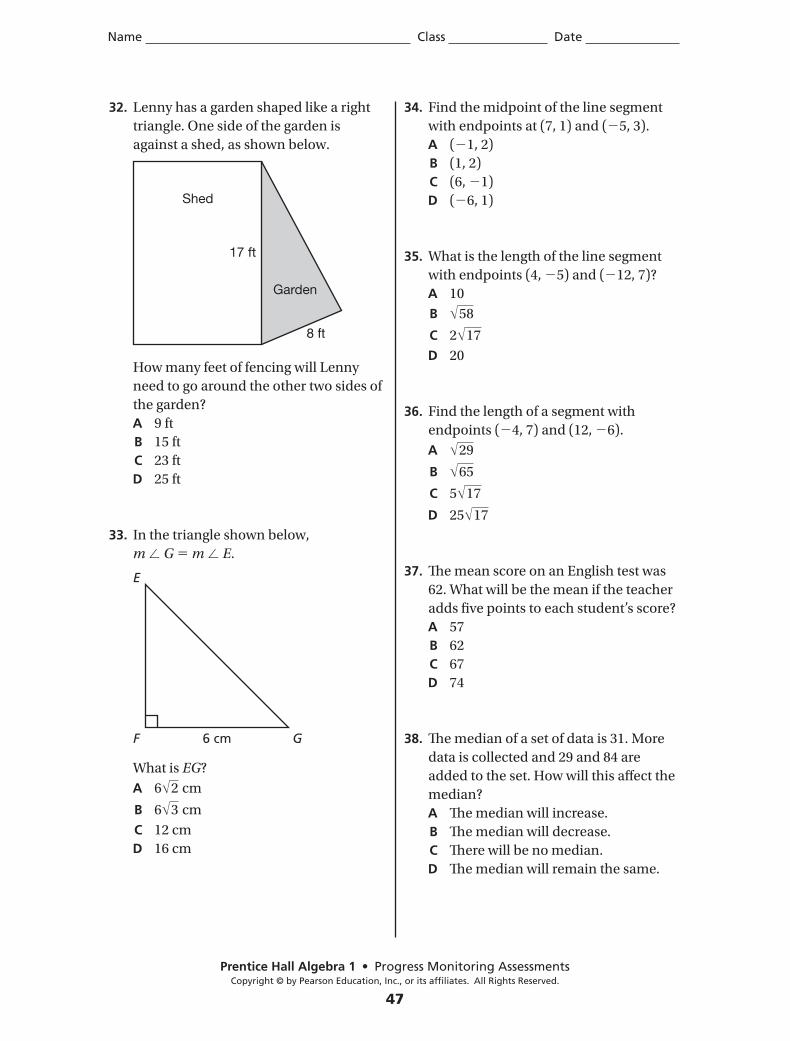
32. Lenny has a garden shaped like a right
triangle. One side of the garden is
against a shed, as shown below.
How many feet of fencing will Lenny
need to go around the other two sides of
the garden?
A 9 ft
B 15 ft
C 23 ft
D 25 ft
33. In the triangle shown below,
m G m E.
What is EG?
A 6 2 cm
B 6 3 cm
C 12 cm
D 16 cm
34. Find the midpoint of the line segment
with endpoints at (7, 1) and ( 5, 3).
A ( 1, 2)
B (1, 2)
C (6, 1)
D ( 6, 1)
35. What is the length of the line segment
with endpoints (4, 5) and ( 12, 7)?
A 10
B 58
C 2 17
D 20
36. Find the length of a segment with
endpoints ( 4, 7) and (12, 6).
A 29
B 65
C 5 17
D 25 17
37. The mean score on an English test was
62. What will be the mean if the teacher
adds five points to each student’s score?
A 57
B 62
C 67
D 74
38. The median of a set of data is 31. More
data is collected and 29 and 84 are
added to the set. How will this affect the
median?
A The median will increase.
B The median will decrease.
C There will be no median.
D The median will remain the same.
17 ft
Shed
Garden
8 ft
E
F G6 cm
Progress Monitoring AssessmentsCopyright © by Pearson Education, Inc., or its affiliates. All Rights Reserved.
48
Name Class Date
39. The median of the numbers in the list
below is 5.
3, 4, 4, 5, 5, 7, 8
An additional number, n, is added to
the list. What must be true about n if the
median of the new list is also 5?
A n 5 C n 5
B n 5 D n 5
40. A small paper bag contains ping-pong
balls. Four of the balls are orange,
12 are yellow, and 24 are white. If you
were to randomly select a ball from the
bag, what would be the probability of
choosing a yellow or orange ball?
A 40% C 7
10
B 30% D 35
41. A bag contains 6 red marbles, 7 blue
marbles, 8 green marbles, and 9 yellow
marbles. What is the probability of not
getting a red or a blue marble on one
pick?
A 1330 C
1730
B 12 D
45
42. A bag contains 12 marbles, one of which
is white. If a marble is taken from the
bag and then replaced, what is the
probability that the white marble will be
drawn twice in a row?
A 0 C 1
144
B 124 D
16
43. Cassandra has a bag of beads that she is
using to make bracelets. She has 30 red
beads, 15 blue beads, and 30 white beads.
If she chooses a bead at random, what is
the probability that the bead will be blue?
A 0.15 C 25
B 15 D 0.75
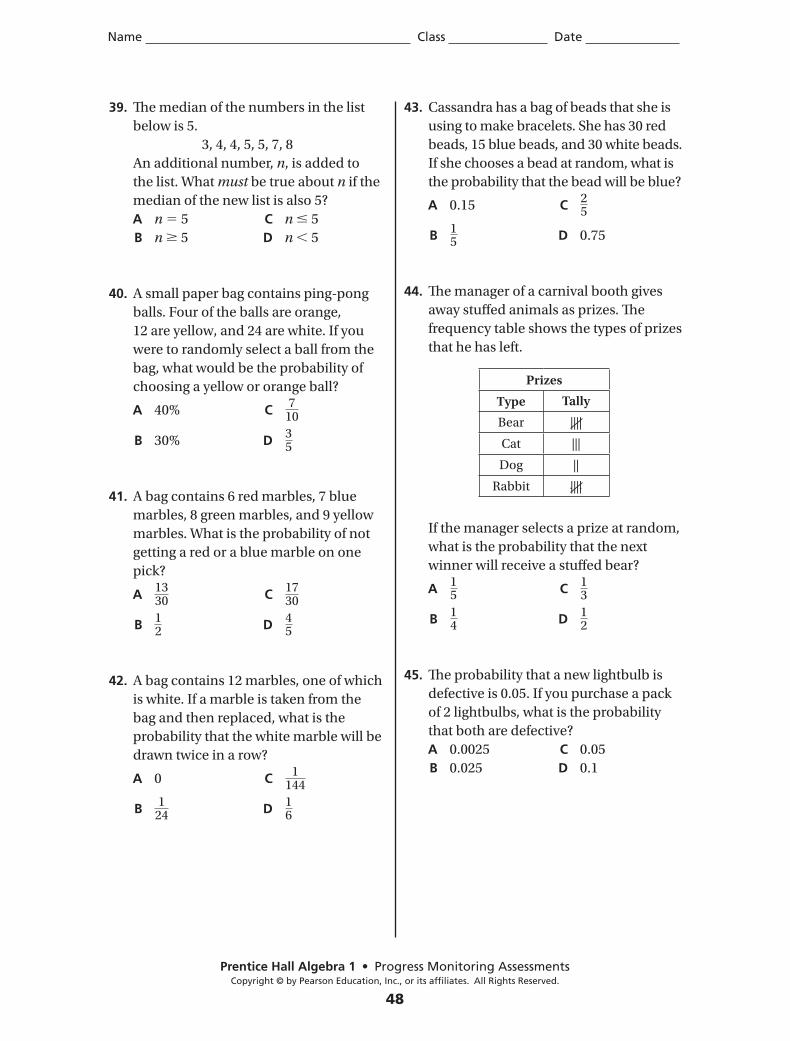
44. The manager of a carnival booth gives
away stuffed animals as prizes. The
frequency table shows the types of prizes
that he has left.
If the manager selects a prize at random,
what is the probability that the next
winner will receive a stuffed bear?
A 15 C
13
B 14 D
12
45. The probability that a new lightbulb is
defective is 0.05. If you purchase a pack
of 2 lightbulbs, what is the probability
that both are defective?
A 0.0025 C 0.05
B 0.025 D 0.1
Prizes
Type Tally
Bear ||||
Cat |||
Dog ||
Rabbit ||||
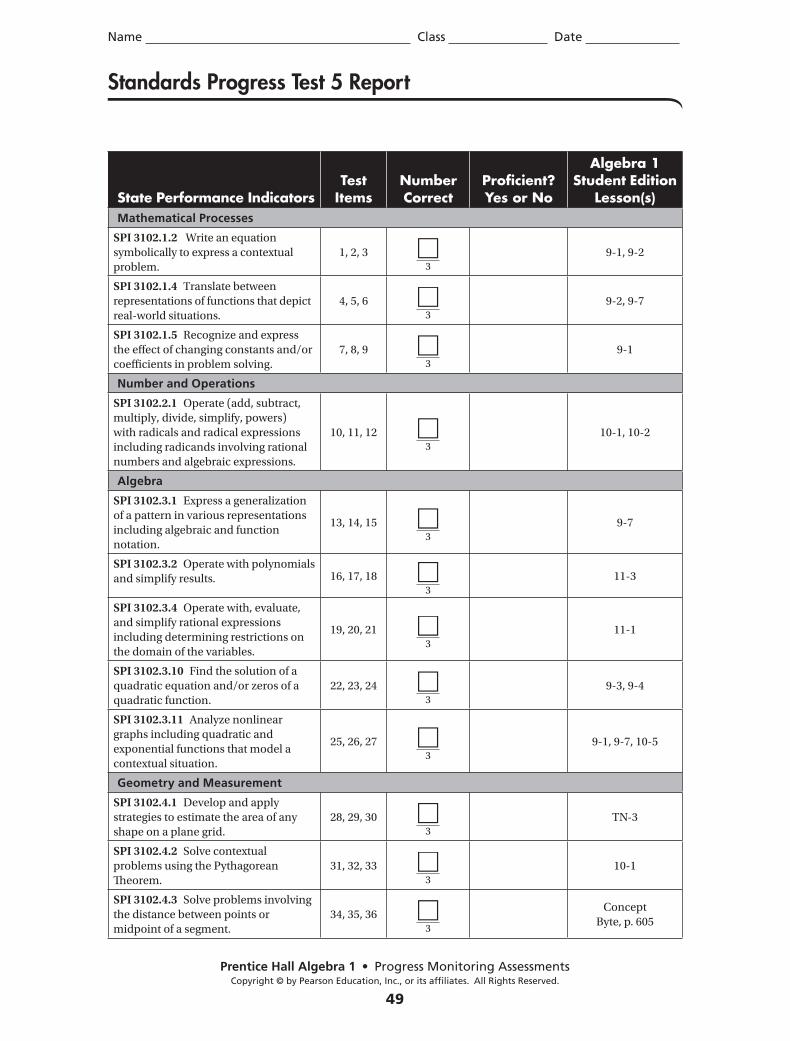
Name Class Date
Progress Monitoring AssessmentsCopyright © by Pearson Education, Inc., or its affiliates. All Rights Reserved.
49
Standards Progress Test 5 Report
State Performance IndicatorsTest
ItemsNumber Correct
Proficient? Yes or No
Algebra 1 Student Edition
Lesson(s)Mathematical Processes
SPI 3102.1.2 Write an equation
symbolically to express a contextual
problem.
1, 2, 33
9-1, 9-2
SPI 3102.1.4 Translate between
representations of functions that depict
real-world situations.
4, 5, 63
9-2, 9-7
SPI 3102.1.5 Recognize and express
the effect of changing constants and/or
coefficients in problem solving.
7, 8, 93
9-1
Number and Operations
SPI 3102.2.1 Operate (add, subtract,
multiply, divide, simplify, powers)
with radicals and radical expressions
including radicands involving rational
numbers and algebraic expressions.
10, 11, 123
10-1, 10-2
Algebra
SPI 3102.3.1 Express a generalization
of a pattern in various representations
including algebraic and function
notation.
13, 14, 153
9-7
SPI 3102.3.2 Operate with polynomials
and simplify results. 16, 17, 183
11-3
SPI 3102.3.4 Operate with, evaluate,
and simplify rational expressions
including determining restrictions on
the domain of the variables.
19, 20, 213
11-1
SPI 3102.3.10 Find the solution of a
quadratic equation and/or zeros of a
quadratic function.
22, 23, 243
9-3, 9-4
SPI 3102.3.11 Analyze nonlinear
graphs including quadratic and
exponential functions that model a
contextual situation.
25, 26, 273
9-1, 9-7, 10-5
Geometry and Measurement
SPI 3102.4.1 Develop and apply
strategies to estimate the area of any
shape on a plane grid.
28, 29, 303
TN-3
SPI 3102.4.2 Solve contextual
problems using the Pythagorean
Theorem.
31, 32, 333
10-1
SPI 3102.4.3 Solve problems involving
the distance between points or
midpoint of a segment.
34, 35, 363
Concept
Byte, p. 605
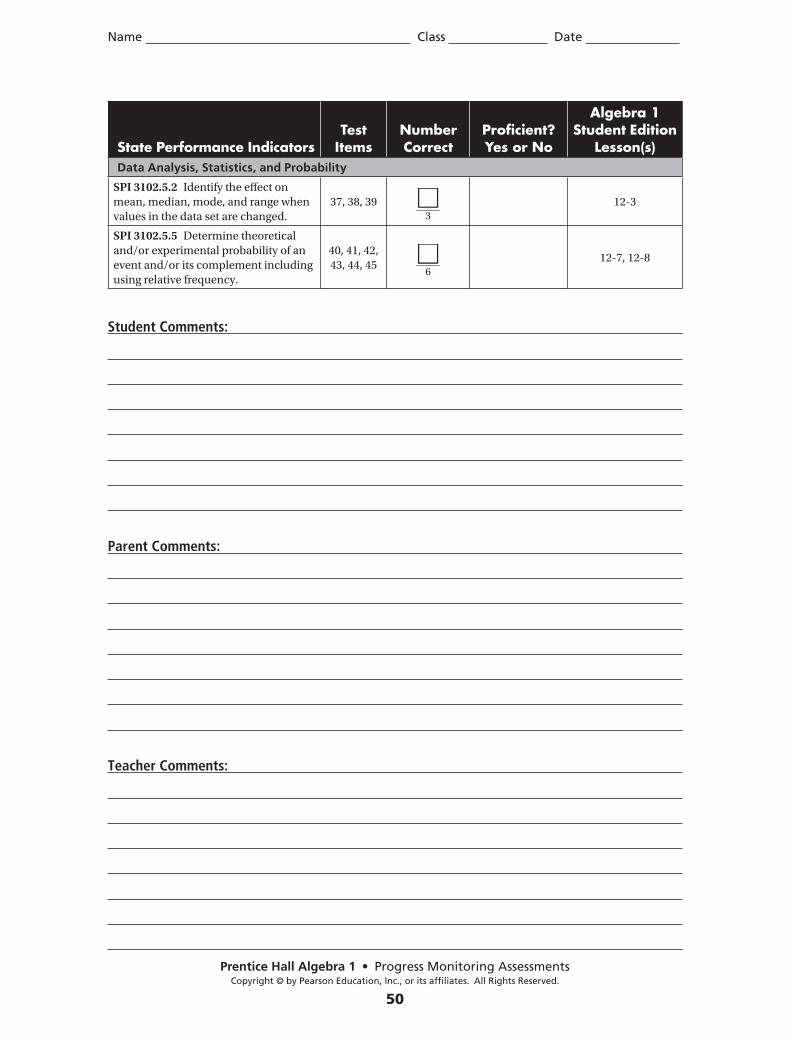
Name Class Date
Progress Monitoring AssessmentsCopyright © by Pearson Education, Inc., or its affiliates. All Rights Reserved.
50
State Performance IndicatorsTest
ItemsNumber Correct
Proficient? Yes or No
Algebra 1 Student Edition
Lesson(s)Data Analysis, Statistics, and Probability
SPI 3102.5.2 Identify the effect on
mean, median, mode, and range when
values in the data set are changed.
37, 38, 393
12-3
SPI 3102.5.5 Determine theoretical
and/or experimental probability of an
event and/or its complement including
using relative frequency.
40, 41, 42,
43, 44, 456
12-7, 12-8
Student Comments:
Parent Comments:
Teacher Comments:
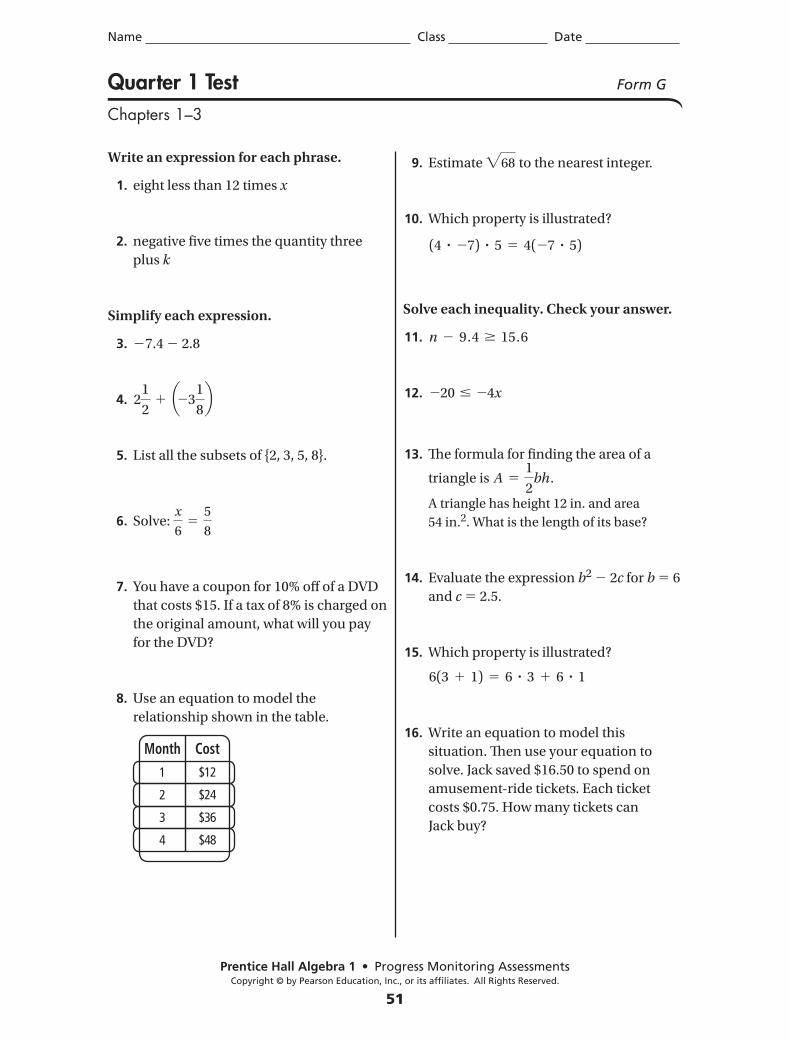
Name Class Date
Prentice Hall Algebra 1 • Progress Monitoring AssessmentsCopyright © by Pearson Education, Inc., or its affiliates. All Rights Reserved.
51
Write an expression for each phrase.
1. eight less than 12 times x
2. negative fi ve times the quantity three
plus k
Simplify each expression.
3. 27.4 2 2.8
4. 21
21 a23
1
8b
5. List all the subsets of {2, 3, 5, 8}.
6. Solve: x
65
5
8
7. You have a coupon for 10% off of a DVD
that costs $15. If a tax of 8% is charged on
the original amount, what will you pay
for the DVD?
8. Use an equation to model the
relationship shown in the table.
9. Estimate "68 to the nearest integer.
10. Which property is illustrated?
(4 ? 27) ? 5 5 4(27 ? 5)
Solve each inequality. Check your answer.
11. n 2 9.4 $ 15.6
12. 220 # 24x
13. Th e formula for fi nding the area of a
triangle is A 51
2bh.
A triangle has height 12 in. and area
54 in.2. What is the length of its base?
14. Evaluate the expression b2 2 2c for b 5 6
and c 5 2.5.
15. Which property is illustrated?
6(3 1 1) 5 6 ? 3 1 6 ? 1
16. Write an equation to model this
situation. Th en use your equation to
solve. Jack saved $16.50 to spend on
amusement-ride tickets. Each ticket
costs $0.75. How many tickets can
Jack buy?
Month Cost1
2
3
4
$12
$24
$36
$48
Quarter 1 Test Form G
Chapters 1–3
PHS4674_NAA1_QT_G.indd 51 6/27/09 2:06:10 PM
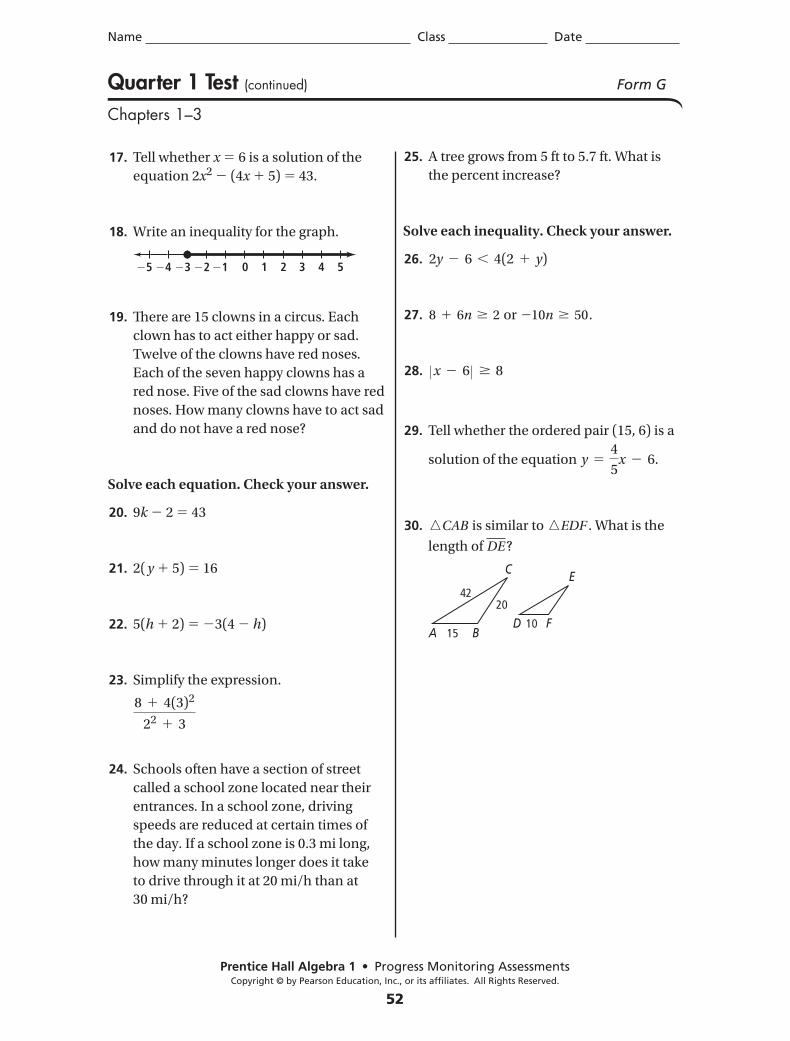
Name Class Date
Prentice Hall Algebra 1 • Progress Monitoring AssessmentsCopyright © by Pearson Education, Inc., or its affiliates. All Rights Reserved.
52
Quarter 1 Test (continued) Form G
Chapters 1–3
17. Tell whether x 5 6 is a solution of the
equation 2x2 2 (4x 1 5) 5 43.
18. Write an inequality for the graph.
19. Th ere are 15 clowns in a circus. Each
clown has to act either happy or sad.
Twelve of the clowns have red noses.
Each of the seven happy clowns has a
red nose. Five of the sad clowns have red
noses. How many clowns have to act sad
and do not have a red nose?
Solve each equation. Check your answer.
20. 9k 2 2 5 43
21. 2( y 1 5) 5 16
22. 5(h 1 2) 5 23(4 2 h)
23. Simplify the expression.
8 1 4(3)2
22 1 3
24. Schools often have a section of street
called a school zone located near their
entrances. In a school zone, driving
speeds are reduced at certain times of
the day. If a school zone is 0.3 mi long,
how many minutes longer does it take
to drive through it at 20 mi/h than at
30 mi/h?
25. A tree grows from 5 ft to 5.7 ft. What is
the percent increase?
Solve each inequality. Check your answer.
26. 2y 2 6 , 4(2 1 y)
27. 8 1 6n $ 2 or 210n $ 50.
28. Zx 2 6 Z $ 8
29. Tell whether the ordered pair (15, 6) is a
solution of the equation y 54
5x 2 6.
30. nCAB is similar to nEDF . What is the
length of DE?
24 3 4 50 1 225 22 2123
C
BAD 10
15
4220
F
E
PHS4674_NAA1_QT_G.indd 52 6/27/09 2:06:12 PM
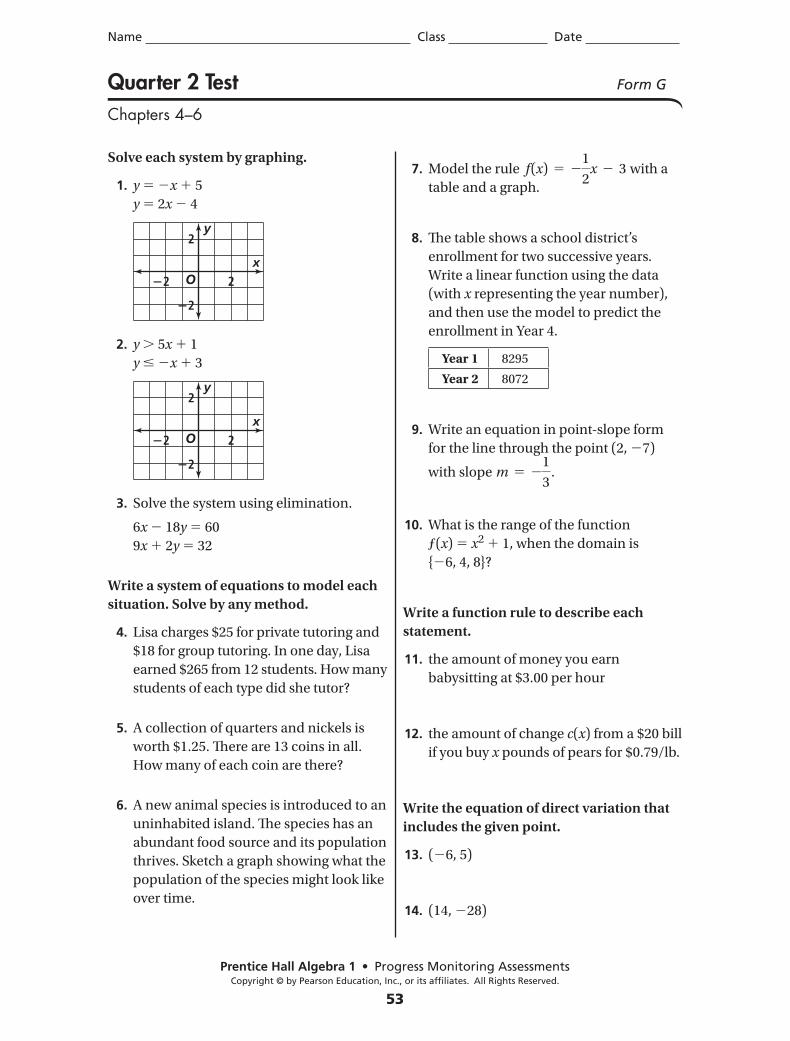
Name Class Date
Prentice Hall Algebra 1 • Progress Monitoring AssessmentsCopyright © by Pearson Education, Inc., or its affiliates. All Rights Reserved.
53
Quarter 2 Test Form G
Chapters 4–6
Solve each system by graphing.
1. y 5 2x 1 5
y 5 2x 2 4
2. y . 5x 1 1
y # 2x 1 3
3. Solve the system using elimination.
6x 2 18y 5 60
9x 1 2y 5 32
Write a system of equations to model each
situation. Solve by any method.
4. Lisa charges $25 for private tutoring and
$18 for group tutoring. In one day, Lisa
earned $265 from 12 students. How many
students of each type did she tutor?
5. A collection of quarters and nickels is
worth $1.25. Th ere are 13 coins in all.
How many of each coin are there?
6. A new animal species is introduced to an
uninhabited island. Th e species has an
abundant food source and its population
thrives. Sketch a graph showing what the
population of the species might look like
over time.
7. Model the rule f (x) 5 21
2x 2 3 with a
table and a graph.
8. Th e table shows a school district’s
enrollment for two successive years.
Write a linear function using the data
(with x representing the year number),
and then use the model to predict the
enrollment in Year 4.
Year 1 8295
Year 2 8072
9. Write an equation in point-slope form
for the line through the point (2, 27)
with slope m 5 21
3.
10. What is the range of the function
ƒ(x) 5 x2 1 1, when the domain is
{26, 4, 8}?
Write a function rule to describe each
statement.
11. the amount of money you earn
babysitting at $3.00 per hour
12. the amount of change c(x) from a $20 bill
if you buy x pounds of pears for $0.79/lb.
Write the equation of direct variation that
includes the given point.
13. (26, 5)
14. (14, 228)
O
2
�2
�2
2x
y
O
2
�2
�2
2x
y
PHS4674_NAA1_QT_G.indd 53 6/27/09 2:06:13 PM
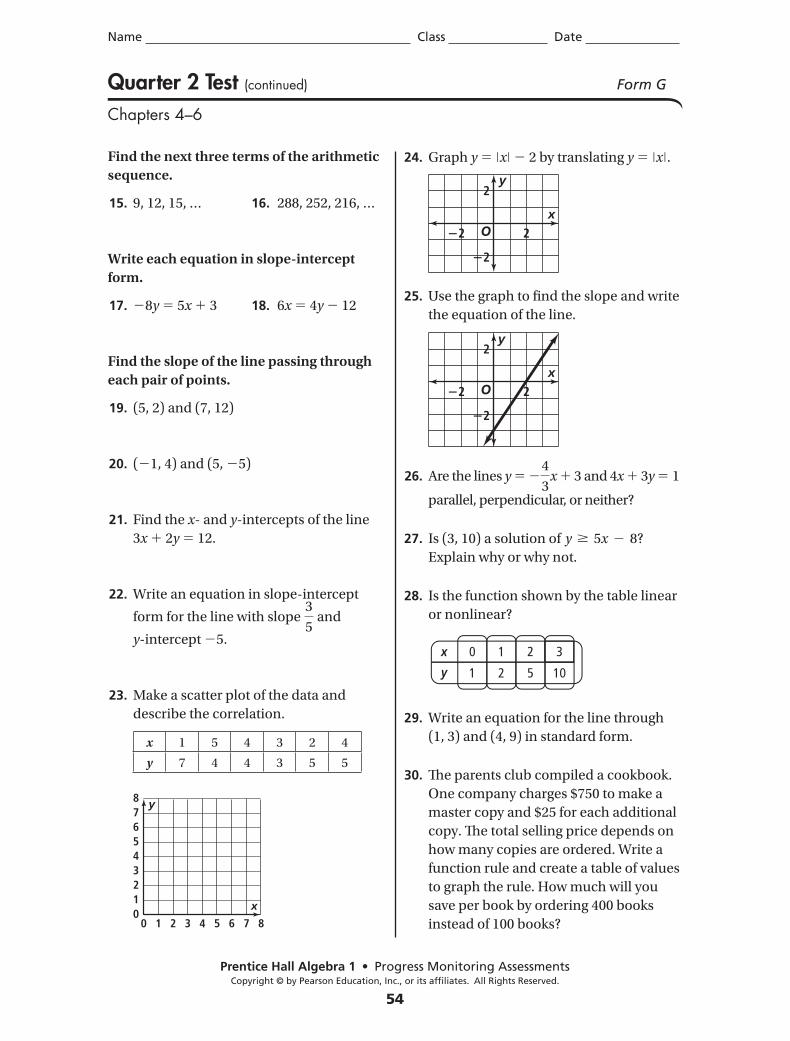
Name Class Date
Prentice Hall Algebra 1 • Progress Monitoring AssessmentsCopyright © by Pearson Education, Inc., or its affiliates. All Rights Reserved.
54
Quarter 2 Test (continued) Form G
Chapters 4–6
Find the next three terms of the arithmetic
sequence.
15. 9, 12, 15, … 16. 288, 252, 216, …
Write each equation in slope-intercept
form.
17. 28y 5 5x 1 3 18. 6x 5 4y 2 12
Find the slope of the line passing through
each pair of points.
19. (5, 2) and (7, 12)
20. (21, 4) and (5, 25)
21. Find the x- and y-intercepts of the line
3x 1 2y 5 12.
22. Write an equation in slope-intercept
form for the line with slope 3
5 and
y-intercept 25.
23. Make a scatter plot of the data and
describe the correlation.
24. Graph y 5 |x| 2 2 by translating y 5 |x|.
25. Use the graph to fi nd the slope and write
the equation of the line.
26. Are the lines y 5 24
3x 1 3 and 4x 1 3y 5 1
parallel, perpendicular, or neither?
27. Is (3, 10) a solution of y $ 5x 2 8?
Explain why or why not.
28. Is the function shown by the table linear
or nonlinear?
29. Write an equation for the line through
(1, 3) and (4, 9) in standard form.
30. Th e parents club compiled a cookbook.
One company charges $750 to make a
master copy and $25 for each additional
copy. Th e total selling price depends on
how many copies are ordered. Write a
function rule and create a table of values
to graph the rule. How much will you
save per book by ordering 400 books
instead of 100 books?
x 1 5 4 3 2 4
y 7 4 4 3 5 5
3
12
54
00 6 7 83 41 52
678 y
x
O
2
�2
�2
2x
y
O
2
�2
�2
2x
y
x 0
1
1
2
2
5
3
10y
PHS4674_NAA1_QT_G.indd 54 6/27/09 2:06:14 PM
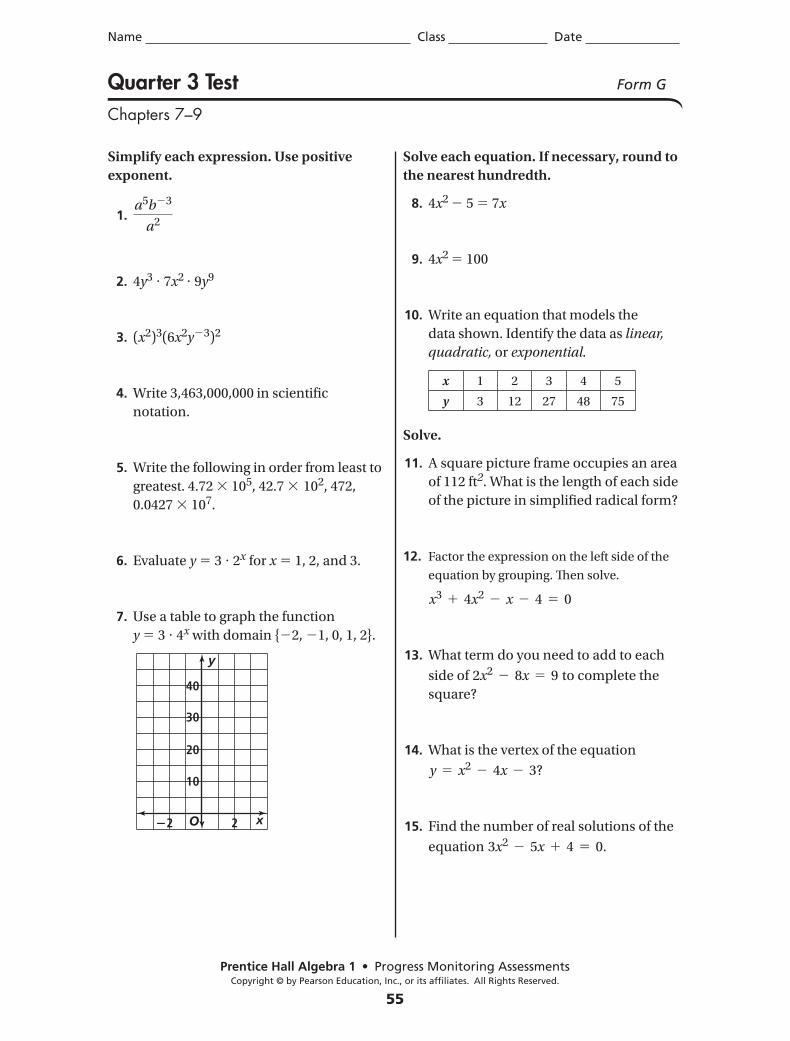
Name Class Date
Prentice Hall Algebra 1 • Progress Monitoring AssessmentsCopyright © by Pearson Education, Inc., or its affiliates. All Rights Reserved.
55
Quarter 3 Test Form G
Chapters 7–9
Simplify each expression. Use positive
exponent.
1. a5b23
a2
2. 4y3 ? 7x2 ? 9y9
3. (x2)3(6x2y23)2
4. Write 3,463,000,000 in scientifi c
notation.
5. Write the following in order from least to
greatest. 4.72 3 105, 42.7 3 102, 472,
0.0427 3 107.
6. Evaluate y 5 3 ? 2x for x 5 1, 2, and 3.
7. Use a table to graph the function
y 5 3 ? 4x with domain {22, 21, 0, 1, 2}.
O
10
20
30
40
�2 2 x
y
Solve each equation. If necessary, round to
the nearest hundredth.
8. 4x2 2 5 5 7x
9. 4x2 5 100
10. Write an equation that models the
data shown. Identify the data as linear,
quadratic, or exponential.
Solve.
11. A square picture frame occupies an area
of 112 ft2. What is the length of each side
of the picture in simplifi ed radical form?
12. Factor the expression on the left side of the
equation by grouping. Th en solve.
x3 1 4x2 2 x 2 4 5 0
13. What term do you need to add to each
side of 2x2 2 8x 5 9 to complete the
square?
14. What is the vertex of the equation
y 5 x2 2 4x 2 3?
15. Find the number of real solutions of the
equation 3x2 2 5x 1 4 5 0.
x 1 2 3 4 5
y 3 12 27 48 75
PHS4674_NAA1_QT_G.indd 55 6/27/09 2:06:15 PM
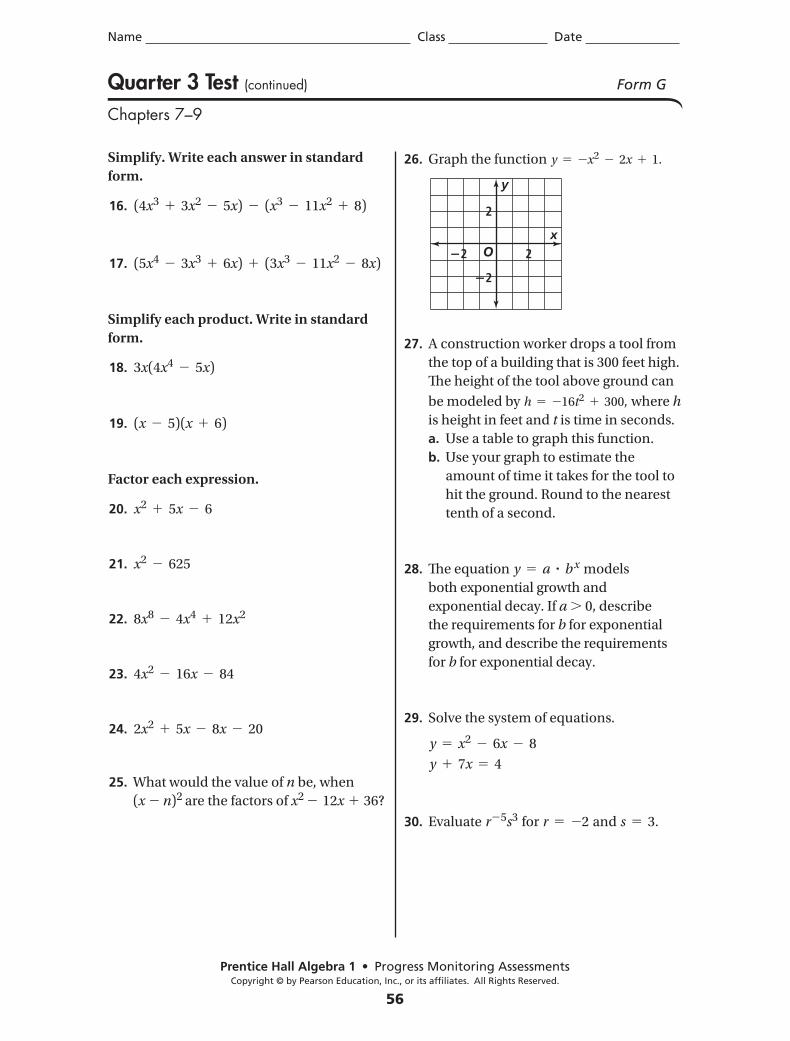
Name Class Date
Prentice Hall Algebra 1 • Progress Monitoring AssessmentsCopyright © by Pearson Education, Inc., or its affiliates. All Rights Reserved.
56
Quarter 3 Test (continued) Form G
Chapters 7–9
Simplify. Write each answer in standard
form.
16. (4x3 1 3x2 2 5x) 2 (x3 2 11x2 1 8)
17. (5x4 2 3x3 1 6x) 1 (3x3 2 11x2 2 8x)
Simplify each product. Write in standard
form.
18. 3x(4x4 2 5x)
19. (x 2 5)(x 1 6)
Factor each expression.
20. x2 1 5x 2 6
21. x2 2 625
22. 8x8 2 4x4 1 12x2
23. 4x2 2 16x 2 84
24. 2x2 1 5x 2 8x 2 20
25. What would the value of n be, when
(x 2 n)2 are the factors of x2 2 12x 1 36?
26. Graph the function y 5 2x2 2 2x 1 1.
27. A construction worker drops a tool from
the top of a building that is 300 feet high.
Th e height of the tool above ground can
be modeled by h 5 216t2 1 300, where h
is height in feet and t is time in seconds.
a. Use a table to graph this function.
b. Use your graph to estimate the
amount of time it takes for the tool to
hit the ground. Round to the nearest
tenth of a second.
28. Th e equation y 5 a ? b x models
both exponential growth and
exponential decay. If a . 0, describe
the requirements for b for exponential
growth, and describe the requirements
for b for exponential decay.
29. Solve the system of equations.
y 5 x2 2 6x 2 8
y 1 7x 5 4
30. Evaluate r25s3 for r 5 22 and s 5 3.
O
2
�2
�2
2x
y
PHS4674_NAA1_QT_G.indd 56 6/27/09 2:06:15 PM
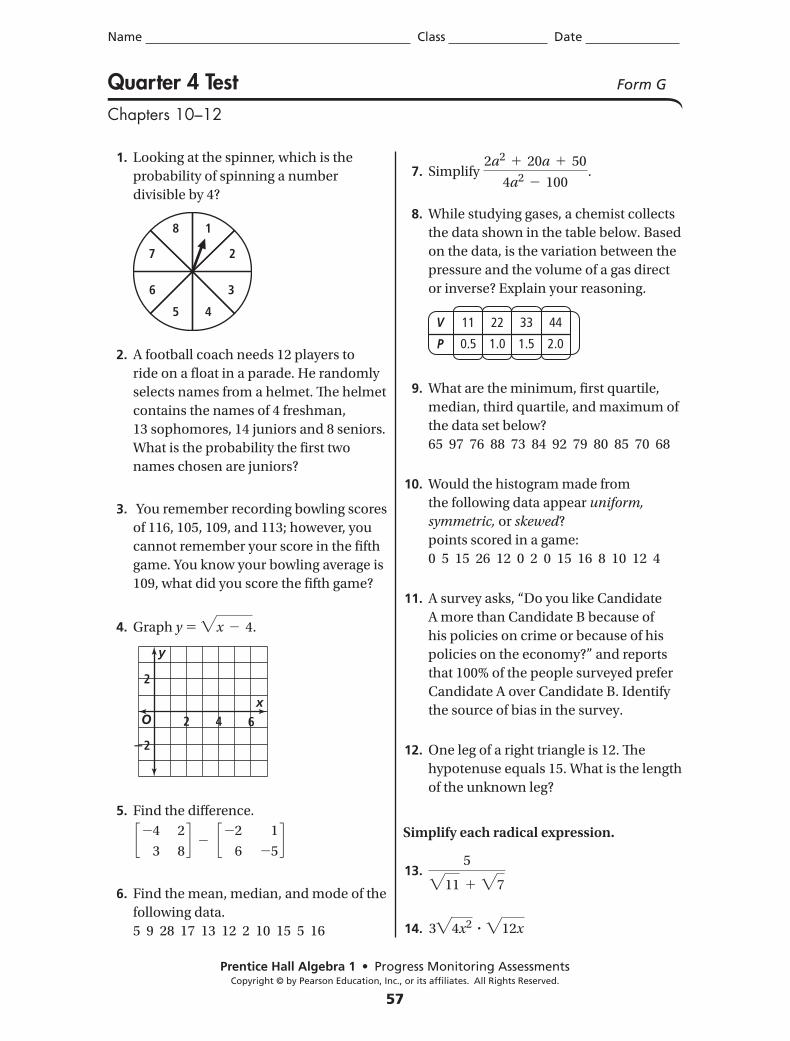
Name Class Date
Prentice Hall Algebra 1 • Progress Monitoring AssessmentsCopyright © by Pearson Education, Inc., or its affiliates. All Rights Reserved.
57
Quarter 4 Test Form G
Chapters 10–12
1. Looking at the spinner, which is the
probability of spinning a number
divisible by 4?
2. A football coach needs 12 players to
ride on a fl oat in a parade. He randomly
selects names from a helmet. Th e helmet
contains the names of 4 freshman,
13 sophomores, 14 juniors and 8 seniors.
What is the probability the fi rst two
names chosen are juniors?
3. You remember recording bowling scores
of 116, 105, 109, and 113; however, you
cannot remember your score in the fi fth
game. You know your bowling average is
109, what did you score the fi fth game?
4. Graph y 5 "x 2 4.
5. Find the diff erence.
c24
3
2
8d 2 c22
6
1
25d
6. Find the mean, median, and mode of the
following data.
5 9 28 17 13 12 2 10 15 5 16
7. Simplify 2a2 1 20a 1 50
4a2 2 100.
8. While studying gases, a chemist collects
the data shown in the table below. Based
on the data, is the variation between the
pressure and the volume of a gas direct
or inverse? Explain your reasoning.
9. What are the minimum, fi rst quartile,
median, third quartile, and maximum of
the data set below?
65 97 76 88 73 84 92 79 80 85 70 68
10. Would the histogram made from
the following data appear uniform,
symmetric, or skewed?
points scored in a game:
0 5 15 26 12 0 2 0 15 16 8 10 12 4
11. A survey asks, “Do you like Candidate
A more than Candidate B because of
his policies on crime or because of his
policies on the economy?” and reports
that 100% of the people surveyed prefer
Candidate A over Candidate B. Identify
the source of bias in the survey.
12. One leg of a right triangle is 12. Th e
hypotenuse equals 15. What is the length
of the unknown leg?
Simplify each radical expression.
13. 5"11 1 "7
14. 3"4x2 ? "12x
18
45
27
36
O
2
�2
2 4x
y
6
V 11
0.5
22
1.0
33
1.5
44
2.0P
PHS4674_NAA1_QT_G.indd 57 6/27/09 2:06:18 PM
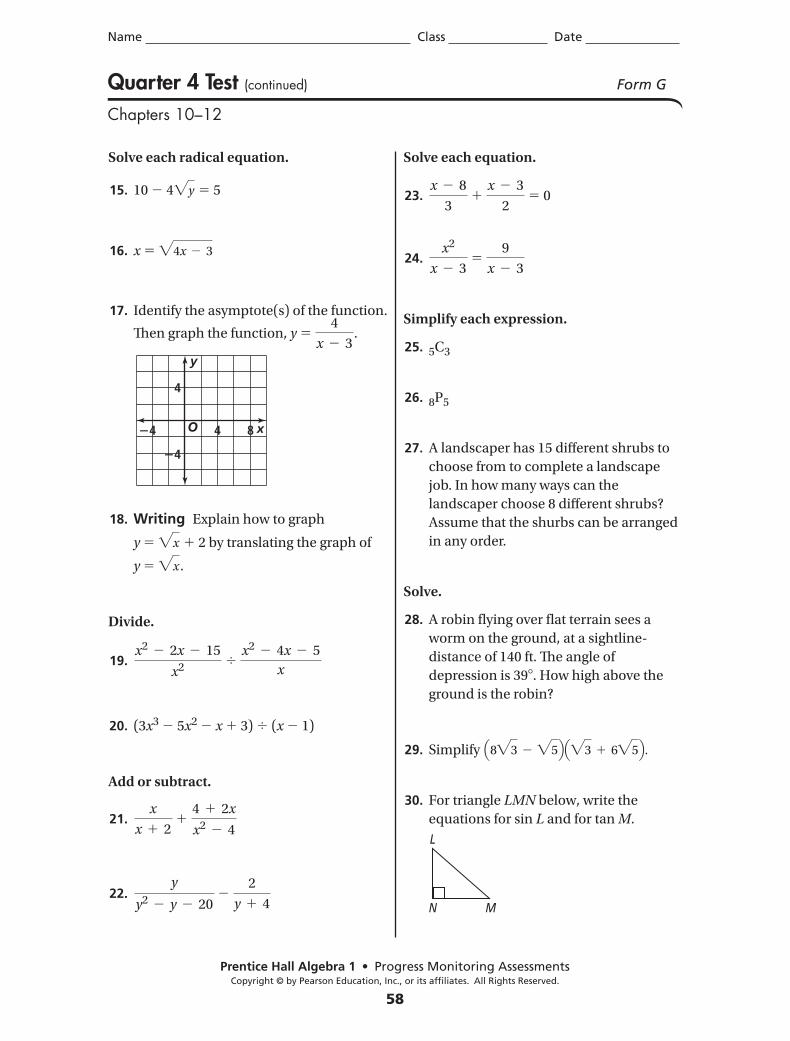
Name Class Date
Prentice Hall Algebra 1 • Progress Monitoring AssessmentsCopyright © by Pearson Education, Inc., or its affiliates. All Rights Reserved.
58
Quarter 4 Test (continued) Form G
Chapters 10–12
Solve each radical equation.
15. 10 2 4"y 5 5
16. x 5 "4x 2 3
17. Identify the asymptote(s) of the function.
Th en graph the function, y 5 4
x 2 3.
18. Writing Explain how to graph
y 5 "x 1 2 by translating the graph of
y 5 "x.
Divide.
19. x2 2 2x 2 15
x2 4 x2 2 4x 2 5
x
20. (3x3 2 5x2 2 x 1 3) 4 (x 2 1)
Add or subtract.
21. x
x 1 2 1
4 1 2x
x2 2 4
22. y
y2 2 y 2 20 2
2
y 1 4
Solve each equation.
23. x 2 8
3 1
x 2 3
2 5 0
24. x2
x 2 3 5
9
x 2 3
Simplify each expression.
25. 5C3
26. 8P5
27. A landscaper has 15 diff erent shrubs to
choose from to complete a landscape
job. In how many ways can the
landscaper choose 8 diff erent shrubs?
Assume that the shurbs can be arranged
in any order.
Solve.
28. A robin fl ying over fl at terrain sees a
worm on the ground, at a sightline-
distance of 140 ft. Th e angle of
depression is 398. How high above the
ground is the robin?
29. Simplify Q8"3 2 "5RQ"3 1 6"5R.
30. For triangle LMN below, write the
equations for sin L and for tan M.
O
4
�4
�4
4 8 x
y
L
N M
PHS4674_NAA1_QT_G.indd 58 6/27/09 2:06:19 PM
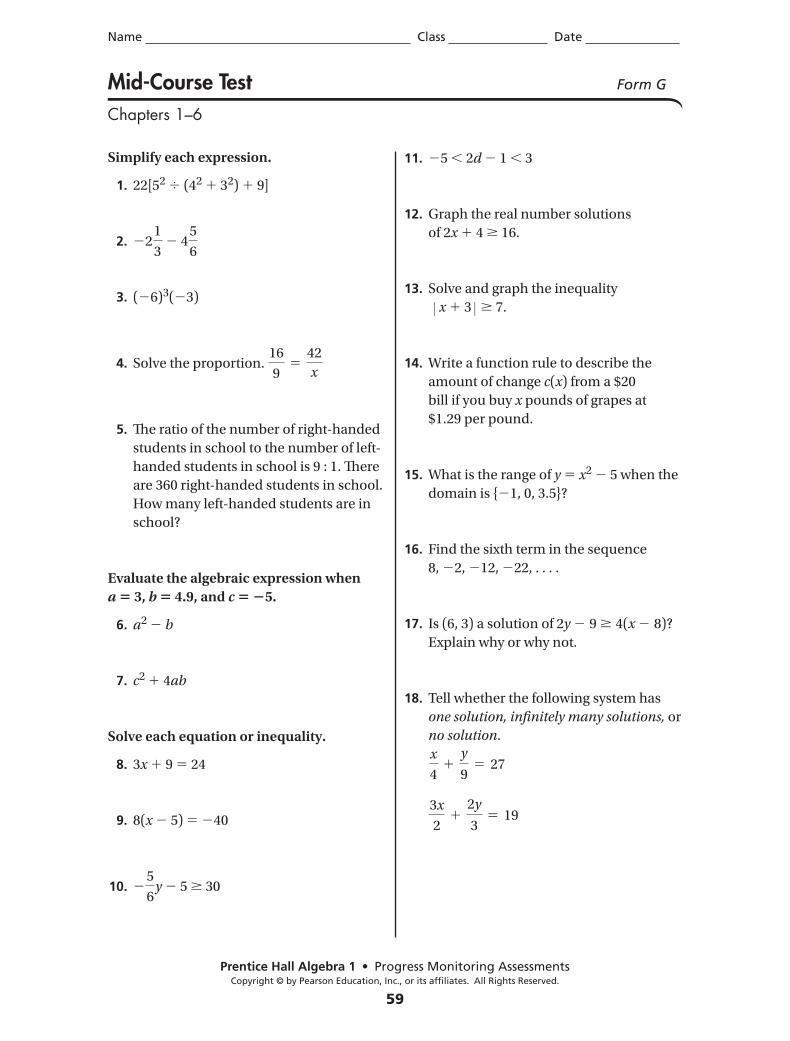
Name Class Date
Prentice Hall Algebra 1 • Progress Monitoring AssessmentsCopyright © by Pearson Education, Inc., or its affiliates. All Rights Reserved.
59
Simplify each expression.
1. 22[52 4 (42 1 32) 1 9]
2. 221
3 2 4
5
6
3. (26)3(23)
4. Solve the proportion. 16
95
42
x
5. Th e ratio of the number of right-handed
students in school to the number of left-
handed students in school is 9 : 1. Th ere
are 360 right-handed students in school.
How many left-handed students are in
school?
Evaluate the algebraic expression when
a 5 3, b 5 4.9, and c 5 25.
6. a2 2 b
7. c2 1 4ab
Solve each equation or inequality.
8. 3x 1 9 5 24
9. 8(x 2 5) 5 240
10. 25
6y 2 5 $ 30
11. 25 , 2d 2 1 , 3
12. Graph the real number solutions
of 2x 1 4 $ 16.
13. Solve and graph the inequality
Z x 1 3 Z $ 7.
14. Write a function rule to describe the
amount of change c(x) from a $20
bill if you buy x pounds of grapes at
$1.29 per pound.
15. What is the range of y 5 x2 2 5 when the
domain is {21, 0, 3.5}?
16. Find the sixth term in the sequence
8, 22, 212, 222, . . . .
17. Is (6, 3) a solution of 2y 2 9 $ 4(x 2 8)?
Explain why or why not.
18. Tell whether the following system has
one solution, infi nitely many solutions, or
no solution.
x
41
y
95 27
3x
21
2y
35 19
Mid-Course Test Form G
Chapters 1–6
PHS4674_NAA1_Test_G.indd 59 6/26/09 11:29:18 AM
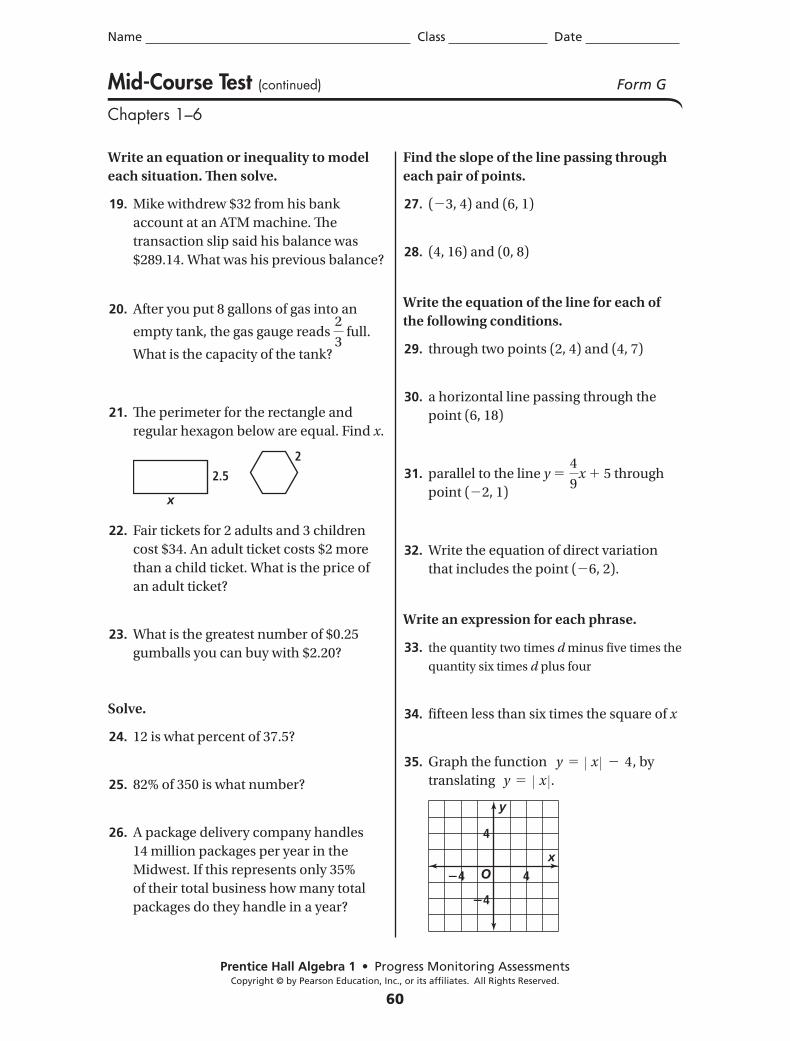
Name Class Date
Prentice Hall Algebra 1 • Progress Monitoring AssessmentsCopyright © by Pearson Education, Inc., or its affiliates. All Rights Reserved.
60
Mid-Course Test (continued) Form G
Chapters 1–6
Write an equation or inequality to model
each situation. Th en solve.
19. Mike withdrew $32 from his bank
account at an ATM machine. Th e
transaction slip said his balance was
$289.14. What was his previous balance?
20. After you put 8 gallons of gas into an
empty tank, the gas gauge reads 2
3 full.
What is the capacity of the tank?
21. Th e perimeter for the rectangle and
regular hexagon below are equal. Find x.
22. Fair tickets for 2 adults and 3 children
cost $34. An adult ticket costs $2 more
than a child ticket. What is the price of
an adult ticket?
23. What is the greatest number of $0.25
gumballs you can buy with $2.20?
Solve.
24. 12 is what percent of 37.5?
25. 82% of 350 is what number?
26. A package delivery company handles
14 million packages per year in the
Midwest. If this represents only 35%
of their total business how many total
packages do they handle in a year?
Find the slope of the line passing through
each pair of points.
27. (23, 4) and (6, 1)
28. (4, 16) and (0, 8)
Write the equation of the line for each of
the following conditions.
29. through two points (2, 4) and (4, 7)
30. a horizontal line passing through the
point (6, 18)
31. parallel to the line y 5 4
9x 1 5 through
point (22, 1)
32. Write the equation of direct variation
that includes the point (26, 2).
Write an expression for each phrase.
33. the quantity two times d minus fi ve times the
quantity six times d plus four
34. fi fteen less than six times the square of x
35. Graph the function y 5 Z x Z 2 4, by
translating y 5 Z x Z.
x
2
2.5
O
4
�4
�4
4x
y
PHS4674_NAA1_Test_G.indd 60 6/26/09 11:29:19 AM
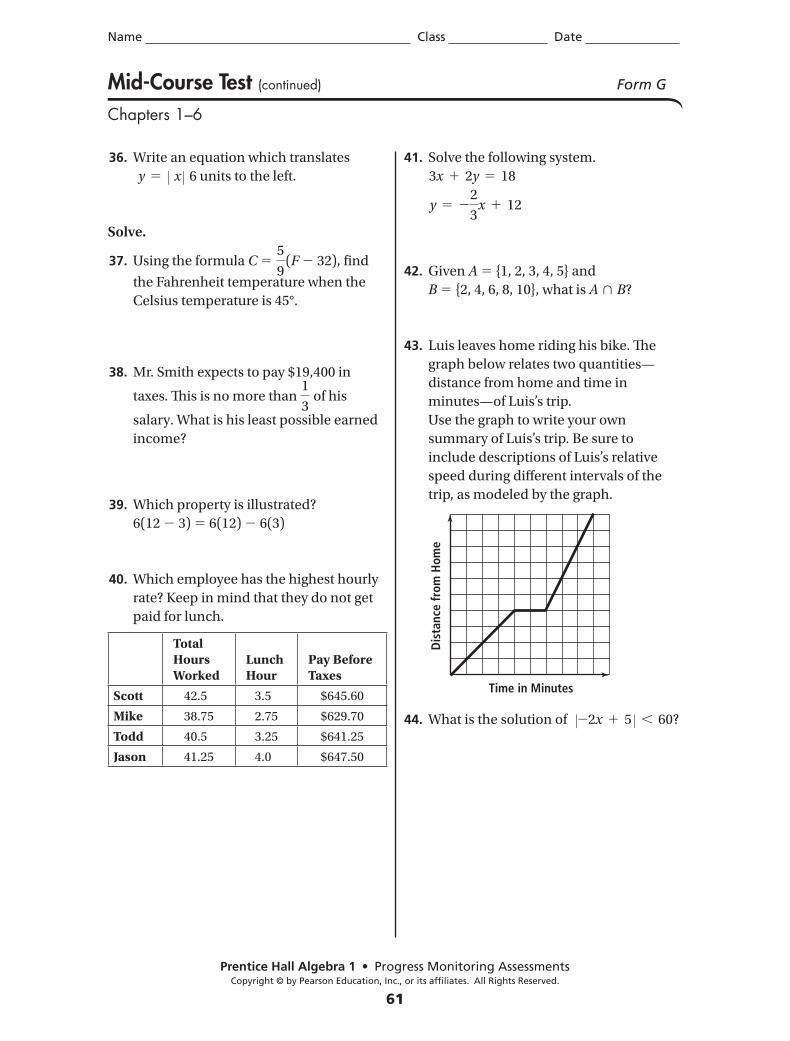
Name Class Date
Prentice Hall Algebra 1 • Progress Monitoring AssessmentsCopyright © by Pearson Education, Inc., or its affiliates. All Rights Reserved.
61
Mid-Course Test (continued) Form G
Chapters 1–6
36. Write an equation which translates
y 5 Z x Z 6 units to the left.
Solve.
37. Using the formula C 5 5
9(F 2 32), fi nd
the Fahrenheit temperature when the
Celsius temperature is 45°.
38. Mr. Smith expects to pay $19,400 in
taxes. Th is is no more than 1
3 of his
salary. What is his least possible earned
income?
39. Which property is illustrated?
6(12 2 3) 5 6(12) 2 6(3)
40. Which employee has the highest hourly
rate? Keep in mind that they do not get
paid for lunch.
TotalHoursWorked
Lunch Hour
Pay BeforeTaxes
Scott 42.5 3.5 $645.60
Mike 38.75 2.75 $629.70
Todd 40.5 3.25 $641.25
Jason 41.25 4.0 $647.50
41. Solve the following system.
3x 1 2y 5 18
y 5 22
3x 1 12
42. Given A 5 {1, 2, 3, 4, 5} and
B 5 {2, 4, 6, 8, 10}, what is A > B?
43. Luis leaves home riding his bike. Th e
graph below relates two quantities—
distance from home and time in
minutes—of Luis’s trip.
Use the graph to write your own
summary of Luis’s trip. Be sure to
include descriptions of Luis’s relative
speed during diff erent intervals of the
trip, as modeled by the graph.
44. What is the solution of Z22x 1 5 Z , 60?
Time in Minutes
Dis
tanc
e fr
om H
ome
PHS4674_NAA1_Test_G.indd 61 6/26/09 11:29:19 AM
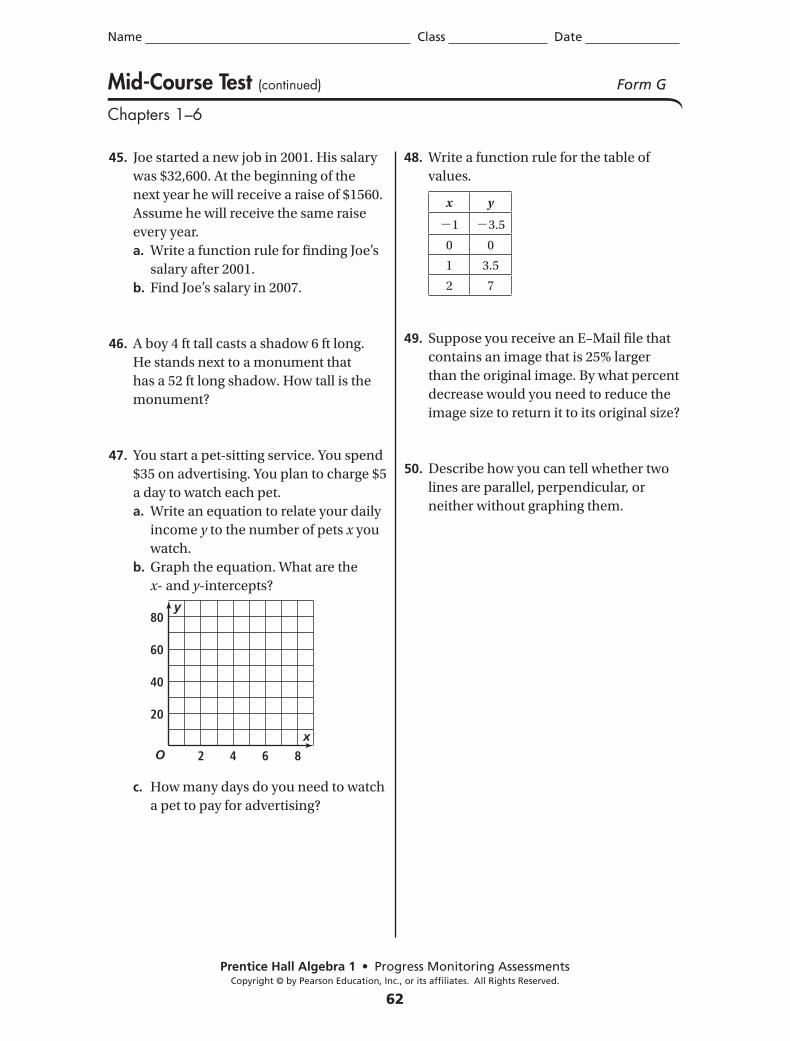
Name Class Date
Prentice Hall Algebra 1 • Progress Monitoring AssessmentsCopyright © by Pearson Education, Inc., or its affiliates. All Rights Reserved.
62
Mid-Course Test (continued) Form G
Chapters 1–6
45. Joe started a new job in 2001. His salary
was $32,600. At the beginning of the
next year he will receive a raise of $1560.
Assume he will receive the same raise
every year.
a. Write a function rule for fi nding Joe’s
salary after 2001.
b. Find Joe’s salary in 2007.
46. A boy 4 ft tall casts a shadow 6 ft long.
He stands next to a monument that
has a 52 ft long shadow. How tall is the
monument?
47. You start a pet-sitting service. You spend
$35 on advertising. You plan to charge $5
a day to watch each pet.
a. Write an equation to relate your daily
income y to the number of pets x you
watch.
b. Graph the equation. What are the
x- and y-intercepts?
c. How many days do you need to watch
a pet to pay for advertising?
48. Write a function rule for the table of
values.
49. Suppose you receive an E–Mail fi le that
contains an image that is 25% larger
than the original image. By what percent
decrease would you need to reduce the
image size to return it to its original size?
50. Describe how you can tell whether two
lines are parallel, perpendicular, or
neither without graphing them.
O 2 4 6 8
20
40
60
80
x
y
x y
21 23.5
0 0
1 3.5
2 7
PHS4674_NAA1_Test_G.indd 62 6/26/09 11:29:20 AM
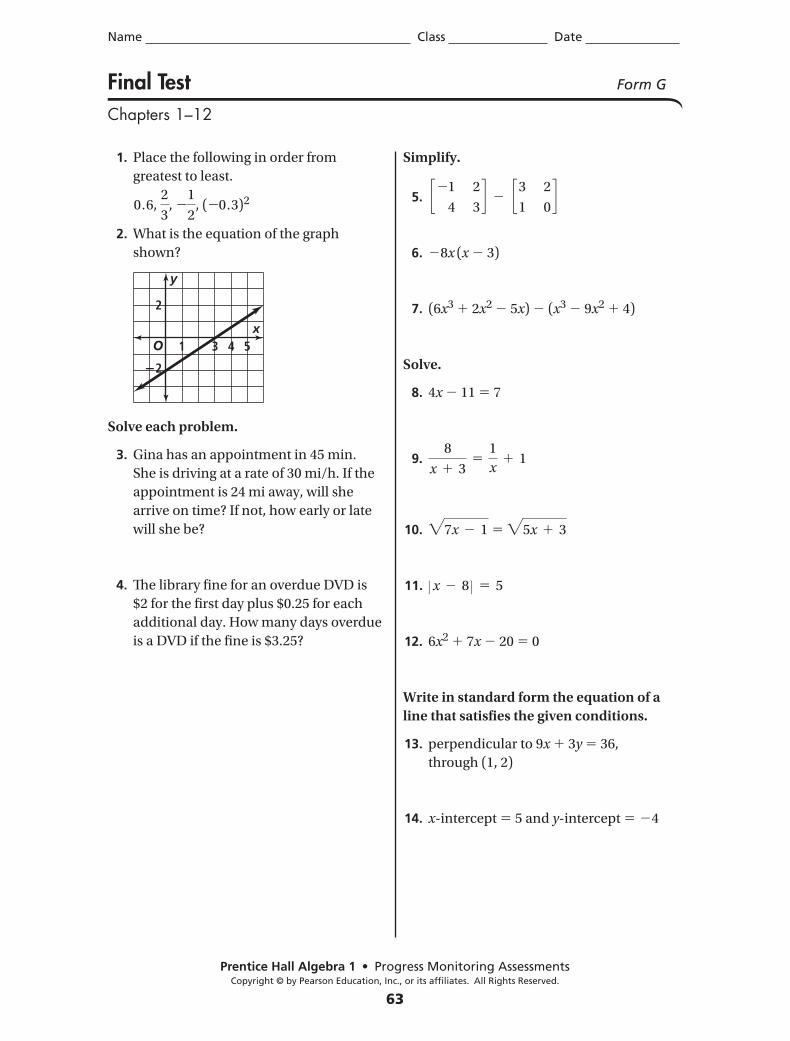
Name Class Date
Prentice Hall Algebra 1 • Progress Monitoring AssessmentsCopyright © by Pearson Education, Inc., or its affiliates. All Rights Reserved.
63
Final Test Form G
Chapters 1–12
1. Place the following in order from
greatest to least.
0.6, 2
3, 2
1
2, (20.3)2
2. What is the equation of the graph
shown?
Solve each problem.
3. Gina has an appointment in 45 min.
She is driving at a rate of 30 mi/h. If the
appointment is 24 mi away, will she
arrive on time? If not, how early or late
will she be?
4. Th e library fi ne for an overdue DVD is
$2 for the fi rst day plus $0.25 for each
additional day. How many days overdue
is a DVD if the fi ne is $3.25?
Simplify.
5. c21
4
2
3d 2 c3
1
2
0d
6. 28x (x 2 3)
7. (6x3 1 2x2 2 5x) 2 (x3 2 9x2 1 4)
Solve.
8. 4x 2 11 5 7
9. 8
x 1 35
1
x1 1
10. "7x 2 1 5 "5x 1 3
11. Z x 2 8 Z 5 5
12. 6x2 1 7x 2 20 5 0
Write in standard form the equation of a
line that satisfi es the given conditions.
13. perpendicular to 9x 1 3y 5 36,
through (1, 2)
14. x-intercept 5 5 and y-intercept 5 24
O
2
�2
1 4 53x
y
PHS4674_NAA1_Test_G.indd 63 6/26/09 11:29:20 AM
Name Class Date
Prentice Hall Algebra 1 • Progress Monitoring AssessmentsCopyright © by Pearson Education, Inc., or its affiliates. All Rights Reserved.
64
Final Test (continued) Form G
Chapters 1–12
Evaluate.
15. ƒ(3) when ƒ(x) 5 4x 2 7
16. ƒ(3) when ƒ(x) 5 2x 2 1
Factor.
17. x2 1 6x 2 27
18. 2x3 1 x2 2 14x 2 7
19. Find the number of real number
solutions of 4x2 1 16x 1 15 5 0.
20. Find the 6th term in the sequence
25, 29, 213, 217, ….
Simplify each radical expression.
21. "75 1 "3
22. "75x2 ? "3x3
Simplify each expression.
23. 52 2 (2 1 3 ? 4)
24. 7x2y21(2xy2)3
25. 4x2y5
12x3y2z23
26. What is the probability of rolling a
number divisible by 2 on a number
cube?
27. At a horse show, ribbons are given for
fi rst, second, third, and fourth places.
Th ere are 20 horses in the show. How
many diff erent arrangements of four
winning horses are possible?
28. Solve and graph the inequality.
23 # 2(x 1 9)
PHS4674_NAA1_Test_G.indd 64 6/26/09 11:29:21 AM
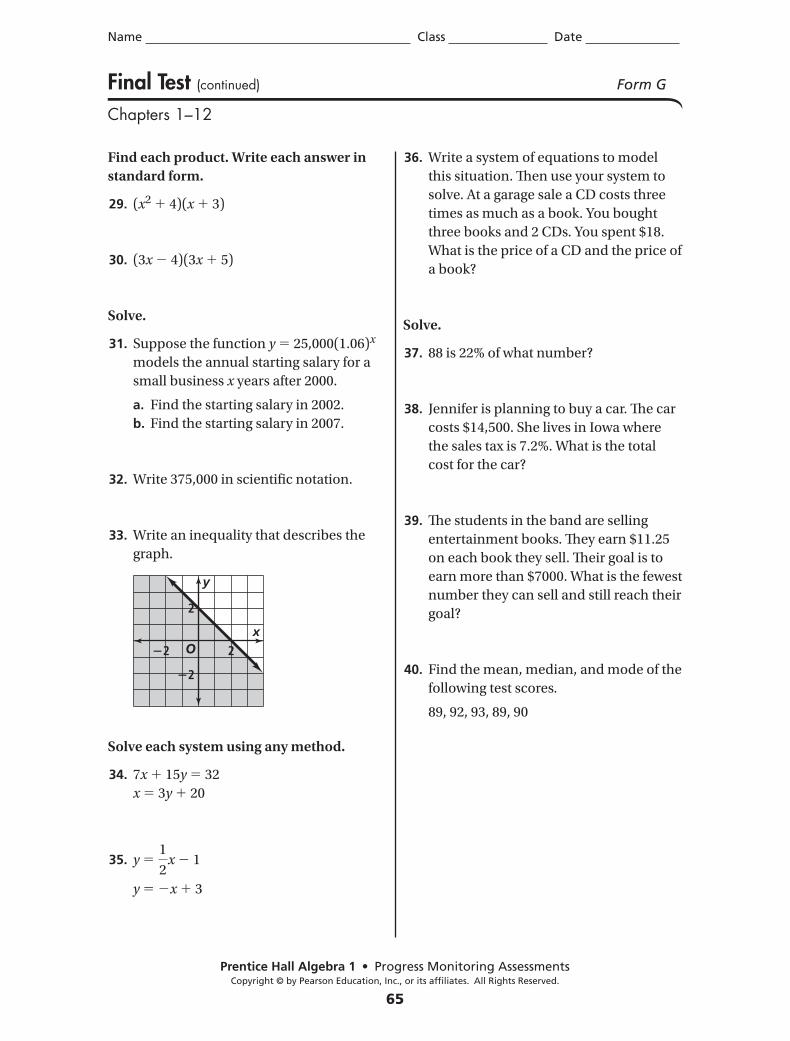
Name Class Date
Prentice Hall Algebra 1 • Progress Monitoring AssessmentsCopyright © by Pearson Education, Inc., or its affiliates. All Rights Reserved.
65
Final Test (continued) Form G
Chapters 1–12
Find each product. Write each answer in
standard form.
29. (x2 1 4)(x 1 3)
30. (3x 2 4)(3x 1 5)
Solve.
31. Suppose the function y 5 25,000(1.06)x
models the annual starting salary for a
small business x years after 2000.
a. Find the starting salary in 2002.
b. Find the starting salary in 2007.
32. Write 375,000 in scientifi c notation.
33. Write an inequality that describes the
graph.
Solve each system using any method.
34. 7x 1 15y 5 32
x 5 3y 1 20
35. y 5 1
2x 2 1
y 5 2x 1 3
36. Write a system of equations to model
this situation. Th en use your system to
solve. At a garage sale a CD costs three
times as much as a book. You bought
three books and 2 CDs. You spent $18.
What is the price of a CD and the price of
a book?
Solve.
37. 88 is 22% of what number?
38. Jennifer is planning to buy a car. Th e car
costs $14,500. She lives in Iowa where
the sales tax is 7.2%. What is the total
cost for the car?
39. Th e students in the band are selling
entertainment books. Th ey earn $11.25
on each book they sell. Th eir goal is to
earn more than $7000. What is the fewest
number they can sell and still reach their
goal?
40. Find the mean, median, and mode of the
following test scores.
89, 92, 93, 89, 90
O
2
�2
�2
2x
y
PHS4674_NAA1_Test_G.indd 65 6/26/09 11:29:22 AM
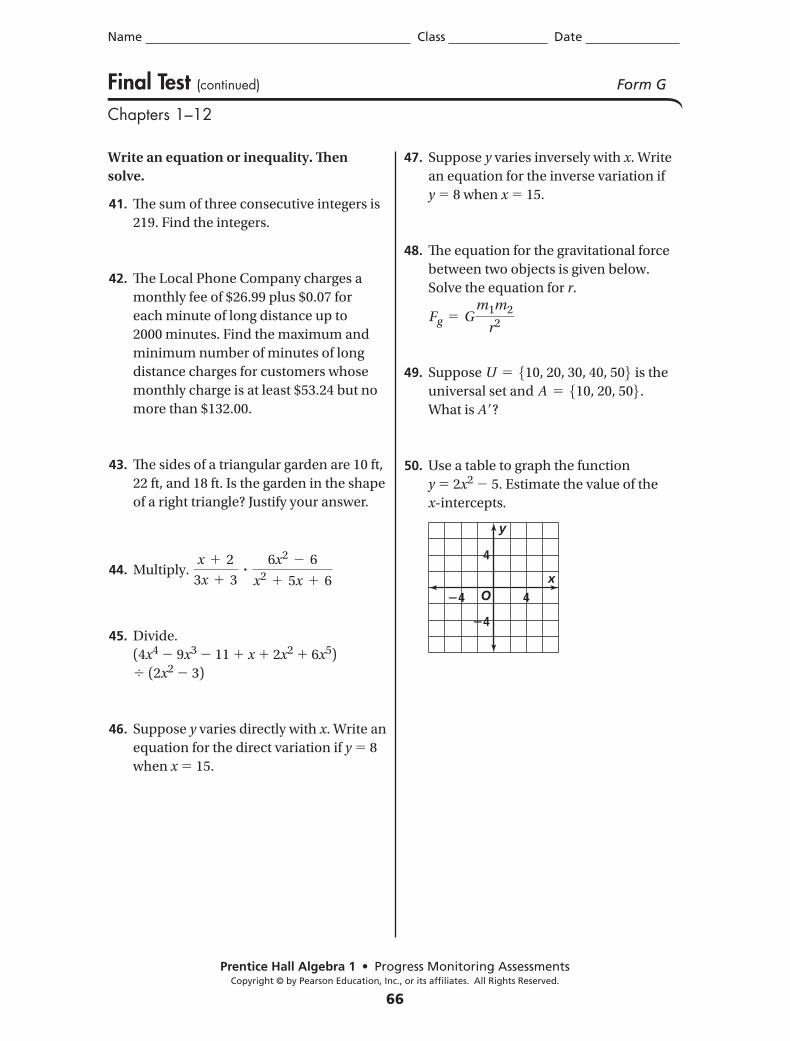
Name Class Date
Prentice Hall Algebra 1 • Progress Monitoring AssessmentsCopyright © by Pearson Education, Inc., or its affiliates. All Rights Reserved.
66
Final Test (continued) Form G
Chapters 1–12
Write an equation or inequality. Th en
solve.
41. Th e sum of three consecutive integers is
219. Find the integers.
42. Th e Local Phone Company charges a
monthly fee of $26.99 plus $0.07 for
each minute of long distance up to
2000 minutes. Find the maximum and
minimum number of minutes of long
distance charges for customers whose
monthly charge is at least $53.24 but no
more than $132.00.
43. Th e sides of a triangular garden are 10 ft,
22 ft, and 18 ft. Is the garden in the shape
of a right triangle? Justify your answer.
44. Multiply. x 1 2
3x 1 3?
6x2 2 6
x2 1 5x 1 6
45. Divide.
(4x4 2 9x3 2 11 1 x 1 2x2 1 6x5)
4 (2x2 2 3)
46. Suppose y varies directly with x. Write an
equation for the direct variation if y 5 8
when x 5 15.
47. Suppose y varies inversely with x. Write
an equation for the inverse variation if
y 5 8 when x 5 15.
48. Th e equation for the gravitational force
between two objects is given below.
Solve the equation for r.
Fg 5 G
m1m2
r2
49. Suppose U 5 510, 20, 30, 40, 506 is the
universal set and A 5 510, 20, 506 .
What is Ar?
50. Use a table to graph the function
y 5 2x2 2 5. Estimate the value of the
x-intercepts.
O
4
�4
�4
4x
y
PHS4674_NAA1_Test_G.indd 66 6/26/09 11:29:22 AM
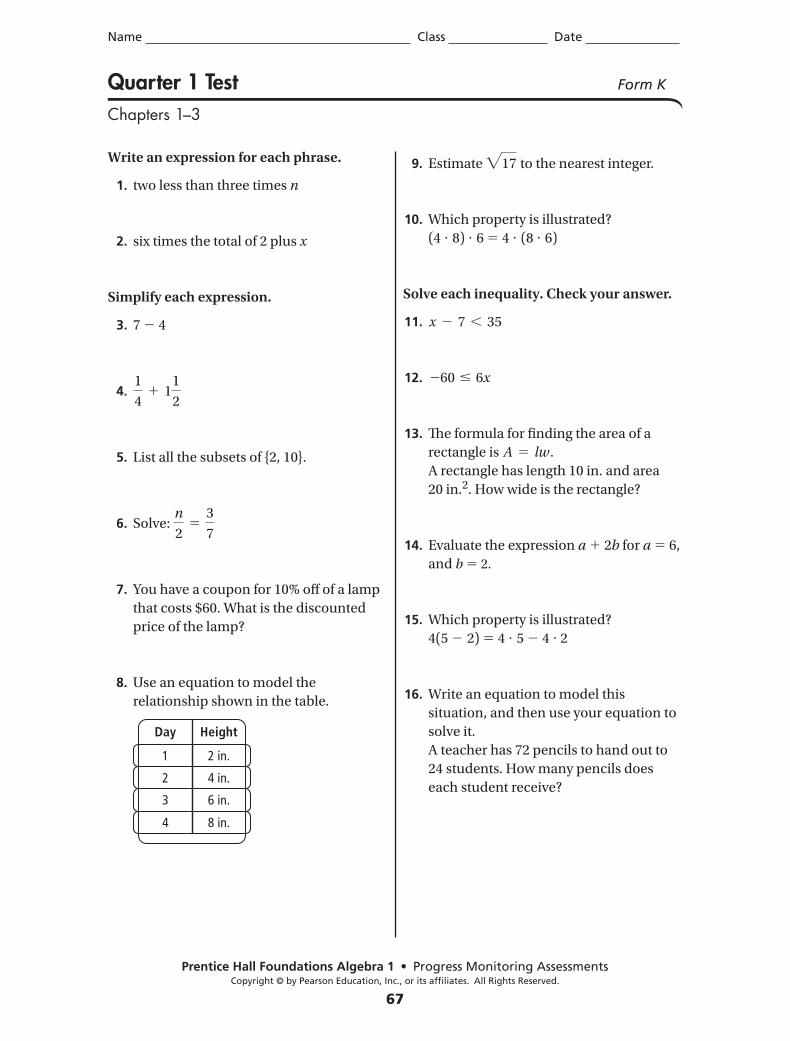
Name Class Date
Prentice Hall Foundations Algebra 1 • Progress Monitoring AssessmentsCopyright © by Pearson Education, Inc., or its affiliates. All Rights Reserved.
67
Write an expression for each phrase.
1. two less than three times n
2. six times the total of 2 plus x
Simplify each expression.
3. 7 2 4
4. 1
41 1
1
2
5. List all the subsets of {2, 10}.
6. Solve: n
25
3
7
7. You have a coupon for 10% off of a lamp
that costs $60. What is the discounted
price of the lamp?
8. Use an equation to model the
relationship shown in the table.
9. Estimate "17 to the nearest integer.
10. Which property is illustrated?
(4 ? 8) ? 6 5 4 ? (8 ? 6)
Solve each inequality. Check your answer.
11. x 2 7 , 35
12. 260 # 6x
13. Th e formula for fi nding the area of a
rectangle is A 5 lw.
A rectangle has length 10 in. and area
20 in.2. How wide is the rectangle?
14. Evaluate the expression a 1 2b for a 5 6,
and b 5 2.
15. Which property is illustrated?
4(5 2 2) 5 4 ? 5 2 4 ? 2
16. Write an equation to model this
situation, and then use your equation to
solve it.
A teacher has 72 pencils to hand out to
24 students. How many pencils does
each student receive?
Day
1
2
3
4
2 in.
4 in.
6 in.
8 in.
Height
Quarter 1 Test Form K
Chapters 1–3
PHS4674_NAA1_QT_K.indd 67 6/26/09 1:59:28 PM
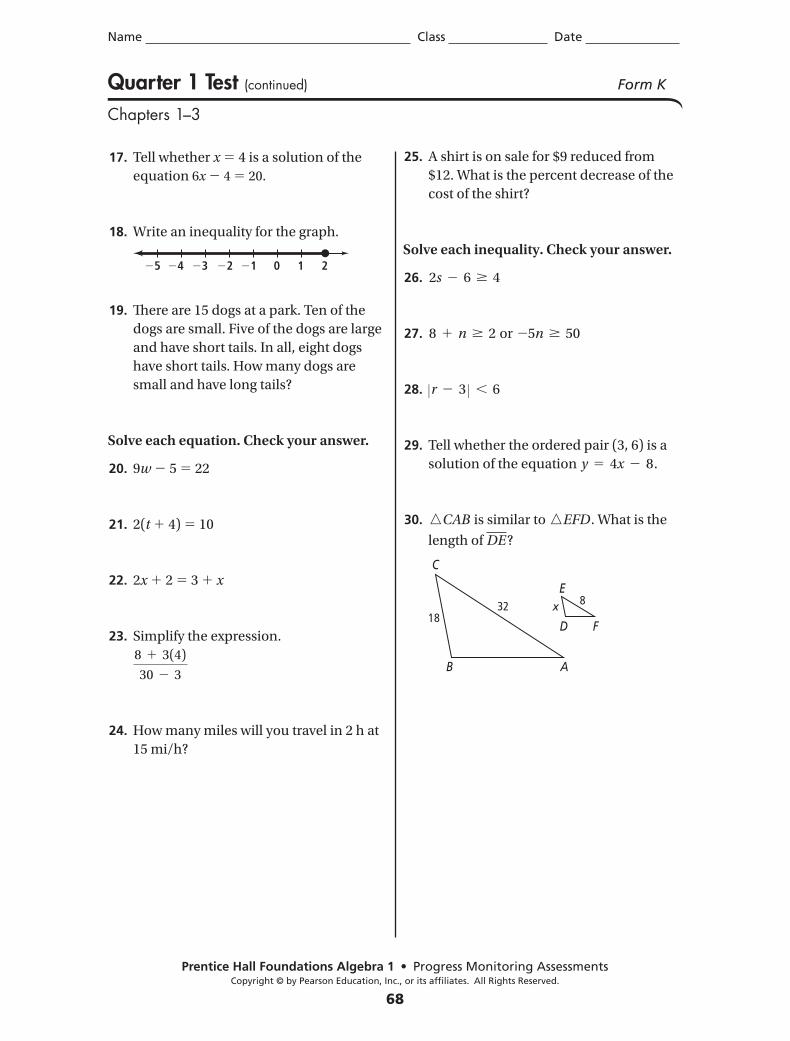
Name Class Date
Prentice Hall Foundations Algebra 1 • Progress Monitoring AssessmentsCopyright © by Pearson Education, Inc., or its affiliates. All Rights Reserved.
68
Quarter 1 Test (continued) Form K
Chapters 1–3
17. Tell whether x 5 4 is a solution of the
equation 6x 2 4 5 20.
18. Write an inequality for the graph.
19. Th ere are 15 dogs at a park. Ten of the
dogs are small. Five of the dogs are large
and have short tails. In all, eight dogs
have short tails. How many dogs are
small and have long tails?
Solve each equation. Check your answer.
20. 9w 2 5 5 22
21. 2(t 1 4) 5 10
22. 2x 1 2 5 3 1 x
23. Simplify the expression.
8 1 3(4)
30 2 3
24. How many miles will you travel in 2 h at
15 mi/h?
25. A shirt is on sale for $9 reduced from
$12. What is the percent decrease of the
cost of the shirt?
Solve each inequality. Check your answer.
26. 2s 2 6 $ 4
27. 8 1 n $ 2 or 25n $ 50
28. Zr 2 3 Z , 6
29. Tell whether the ordered pair (3, 6) is a
solution of the equation y 5 4x 2 8.
30. nCAB is similar to nEFD. What is the
length of DE?
1 2232425 22 21 0
B
C
D F
E
188x32
A
PHS4674_NAA1_QT_K.indd 68 6/26/09 1:59:29 PM
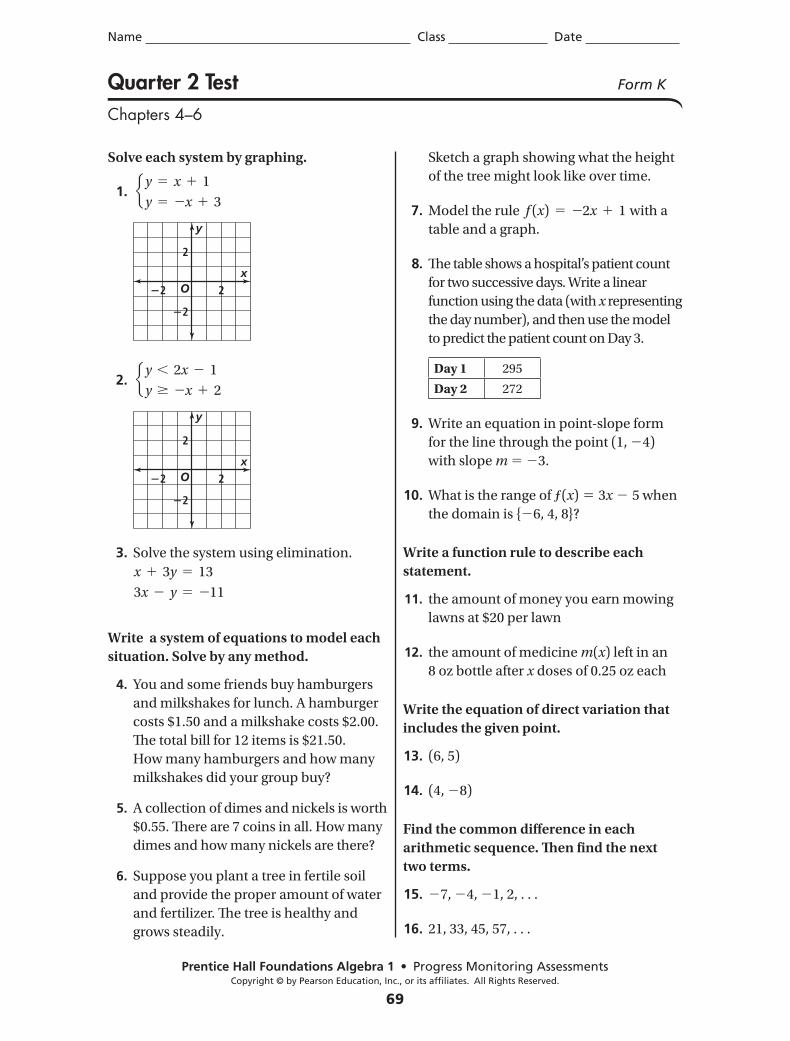
Name Class Date
Prentice Hall Foundations Algebra 1 • Progress Monitoring AssessmentsCopyright © by Pearson Education, Inc., or its affiliates. All Rights Reserved.
69
Solve each system by graphing.
1. e y 5 x 1 1
y 5 2x 1 3
2. e y , 2x 2 1
y $ 2x 1 2
3. Solve the system using elimination.
x 1 3y 5 13
3x 2 y 5 211
Write a system of equations to model each
situation. Solve by any method.
4. You and some friends buy hamburgers
and milkshakes for lunch. A hamburger
costs $1.50 and a milkshake costs $2.00.
Th e total bill for 12 items is $21.50.
How many hamburgers and how many
milkshakes did your group buy?
5. A collection of dimes and nickels is worth
$0.55. Th ere are 7 coins in all. How many
dimes and how many nickels are there?
6. Suppose you plant a tree in fertile soil
and provide the proper amount of water
and fertilizer. Th e tree is healthy and
grows steadily.
Sketch a graph showing what the height
of the tree might look like over time.
7. Model the rule f (x) 5 22x 1 1 with a
table and a graph.
8. Th e table shows a hospital’s patient count
for two successive days. Write a linear
function using the data (with x representing
the day number), and then use the model
to predict the patient count on Day 3.
Day 1 295
Day 2 272
9. Write an equation in point-slope form
for the line through the point (1, 24)
with slope m 5 23.
10. What is the range of ƒ(x) 5 3x 2 5 when
the domain is {26, 4, 8}?
Write a function rule to describe each
statement.
11. the amount of money you earn mowing
lawns at $20 per lawn
12. the amount of medicine m(x) left in an
8 oz bottle after x doses of 0.25 oz each
Write the equation of direct variation that
includes the given point.
13. (6, 5)
14. (4, 28)
Find the common diff erence in each
arithmetic sequence. Th en fi nd the next
two terms.
15. 27, 24, 21, 2, . . .
16. 21, 33, 45, 57, . . .
O
2
�2
�2
2x
y
O
2
�2
�2
2x
y
Quarter 2 Test Form K
Chapters 4–6
PHS4674_NAA1_QT_K.indd 69 6/26/09 1:59:31 PM
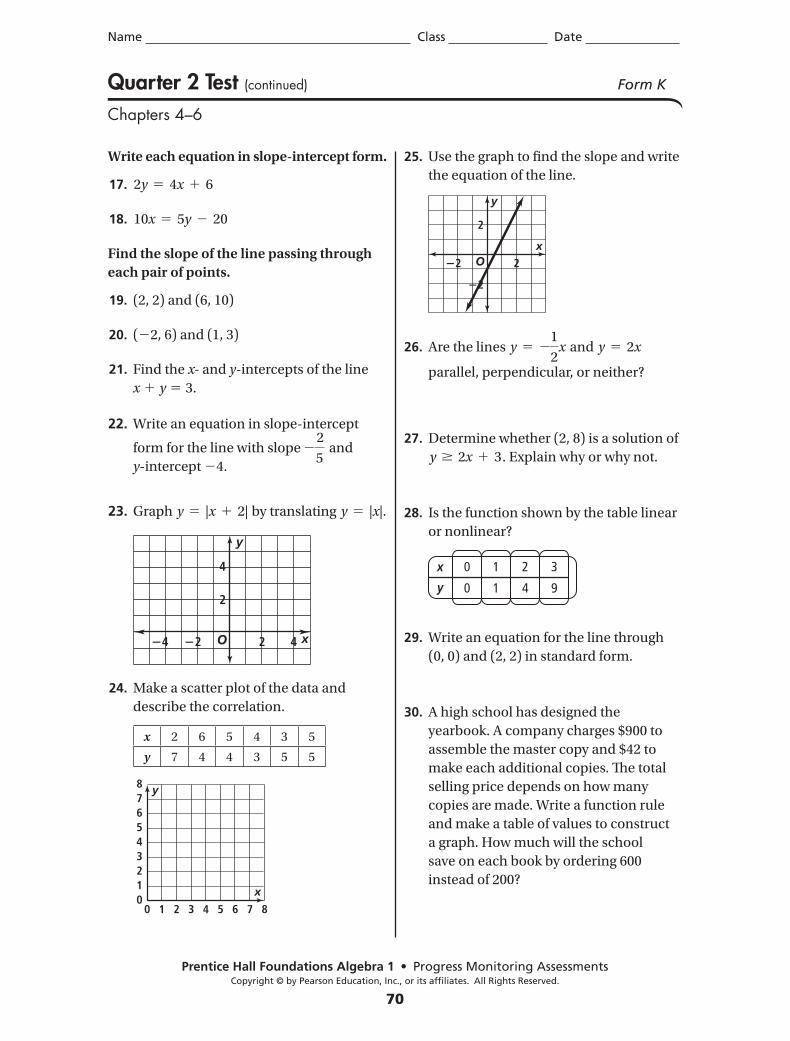
Name Class Date
Prentice Hall Foundations Algebra 1 • Progress Monitoring AssessmentsCopyright © by Pearson Education, Inc., or its affiliates. All Rights Reserved.
70
Quarter 2 Test (continued) Form K
Chapters 4–6
Write each equation in slope-intercept form.
17. 2y 5 4x 1 6
18. 10x 5 5y 2 20
Find the slope of the line passing through
each pair of points.
19. (2, 2) and (6, 10)
20. (22, 6) and (1, 3)
21. Find the x- and y-intercepts of the line
x 1 y 5 3.
22. Write an equation in slope-intercept
form for the line with slope 22
5 and
y-intercept 24.
23. Graph y 5 |x 1 2| by translating y 5 |x|.
24. Make a scatter plot of the data and
describe the correlation.
3
12
54
00 6 7 83 41 52
678 y
x
25. Use the graph to fi nd the slope and write
the equation of the line.
26. Are the lines y 5 21
2x and y 5 2x
parallel, perpendicular, or neither?
27. Determine whether (2, 8) is a solution of
y $ 2x 1 3. Explain why or why not.
28. Is the function shown by the table linear
or nonlinear?
29. Write an equation for the line through
(0, 0) and (2, 2) in standard form.
30. A high school has designed the
yearbook. A company charges $900 to
assemble the master copy and $42 to
make each additional copies. Th e total
selling price depends on how many
copies are made. Write a function rule
and make a table of values to construct
a graph. How much will the school
save on each book by ordering 600
instead of 200?
O
2
4
�2 2�4 4 x
y
x 2 6 5 4 3 5
y 7 4 4 3 5 5
O
2
�2
�2
2x
y
x 0
0
1
1
2
4
3
9y
PHS4674_NAA1_QT_K.indd 70 6/26/09 1:59:31 PM
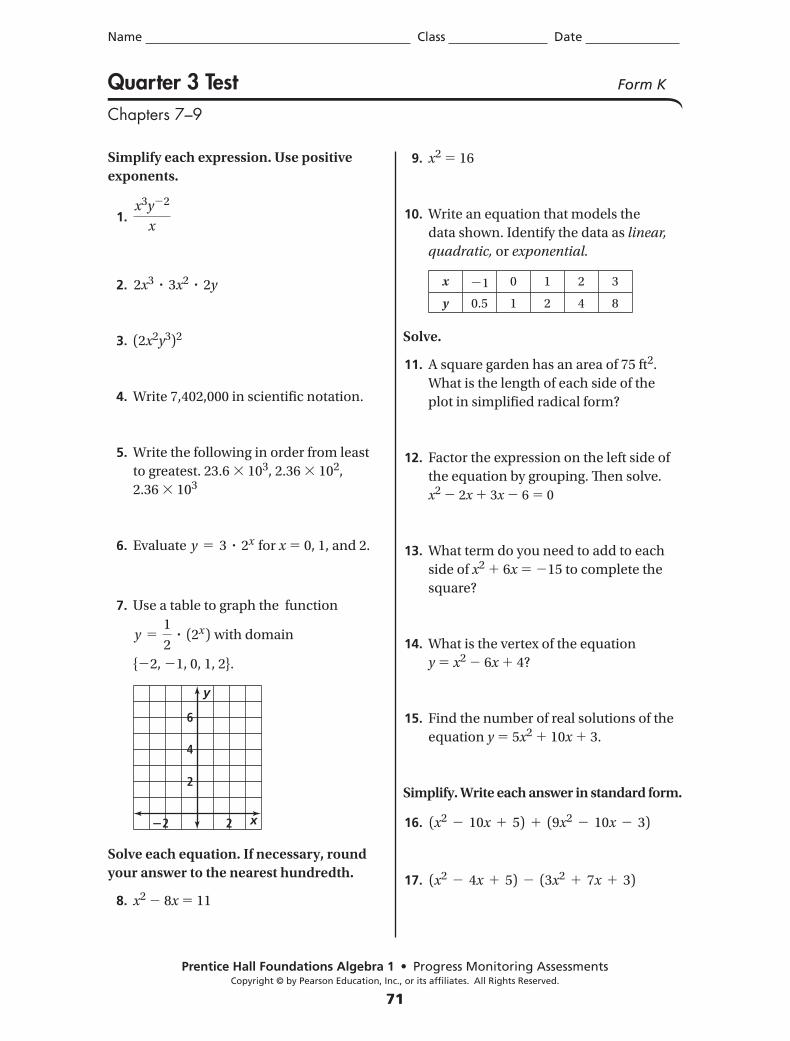
Name Class Date
Prentice Hall Foundations Algebra 1 • Progress Monitoring AssessmentsCopyright © by Pearson Education, Inc., or its affiliates. All Rights Reserved.
71
Quarter 3 Test Form K
Chapters 7–9
Simplify each expression. Use positive
exponents.
1. x3y22
x
2. 2x3 ? 3x2 ? 2y
3. (2x2y3)2
4. Write 7,402,000 in scientifi c notation.
5. Write the following in order from least
to greatest. 23.6 3 103, 2.36 3 102,
2.36 3 103
6. Evaluate y 5 3 ? 2x for x 5 0, 1, and 2.
7. Use a table to graph the function
y 51
2? (2x ) with domain
{22, 21, 0, 1, 2}.
Solve each equation. If necessary, round
your answer to the nearest hundredth.
8. x2 2 8x 5 11
9. x2 5 16
10. Write an equation that models the
data shown. Identify the data as linear,
quadratic, or exponential.
Solve.
11. A square garden has an area of 75 ft2.
What is the length of each side of the
plot in simplifi ed radical form?
12. Factor the expression on the left side of
the equation by grouping. Th en solve.
x2 2 2x 1 3x 2 6 5 0
13. What term do you need to add to each
side of x2 1 6x 5 215 to complete the
square?
14. What is the vertex of the equation
y 5 x2 2 6x 1 4?
15. Find the number of real solutions of the
equation y 5 5x2 1 10x 1 3.
Simplify. Write each answer in standard form.
16. (x2 2 10x 1 5) 1 (9x2 2 10x 2 3)
17. (x2 2 4x 1 5) 2 (3x2 1 7x 1 3)
2
4
6
�2 2 x
y
x 21 0 1 2 3
y 0.5 1 2 4 8
PHS4674_NAA1_QT_K.indd 71 6/26/09 1:59:33 PM
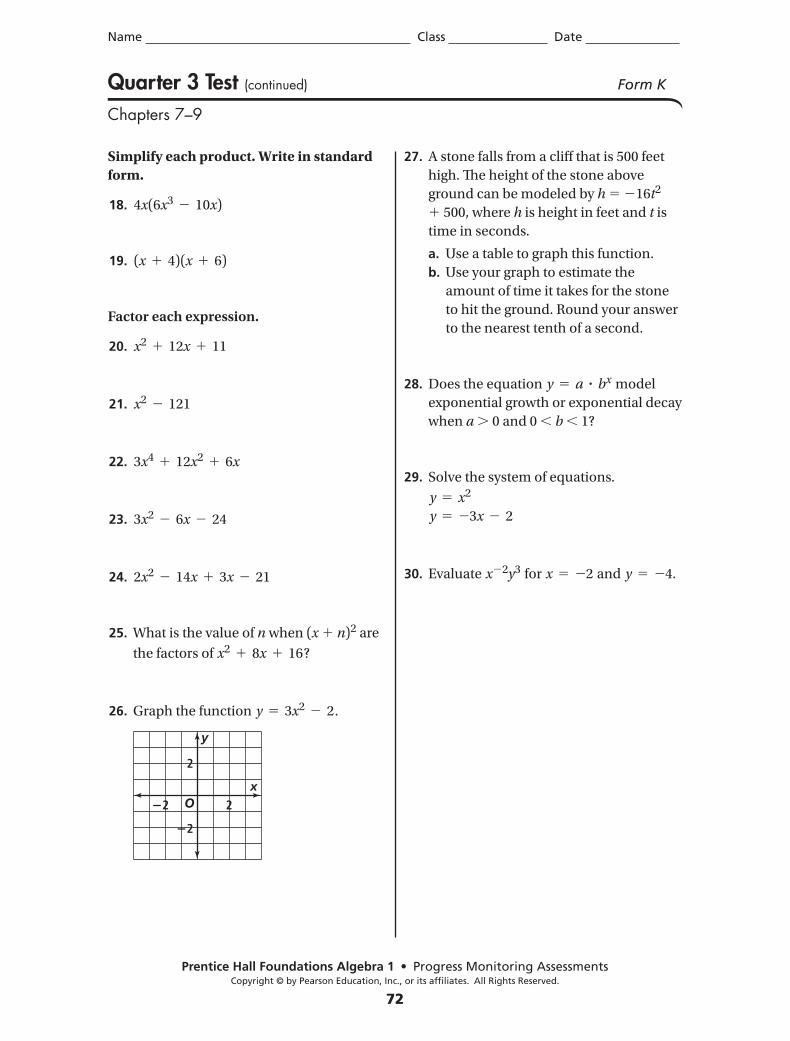
Name Class Date
Prentice Hall Foundations Algebra 1 • Progress Monitoring AssessmentsCopyright © by Pearson Education, Inc., or its affiliates. All Rights Reserved.
72
Quarter 3 Test (continued) Form K
Chapters 7–9
Simplify each product. Write in standard form.
18. 4x(6x3 2 10x)
19. (x 1 4)(x 1 6)
Factor each expression.
20. x2 1 12x 1 11
21. x2 2 121
22. 3x4 1 12x2 1 6x
23. 3x2 2 6x 2 24
24. 2x2 2 14x 1 3x 2 21
25. What is the value of n when (x 1 n)2 are
the factors of x2 1 8x 1 16?
26. Graph the function y 5 3x2 2 2.
27. A stone falls from a cliff that is 500 feet
high. Th e height of the stone above
ground can be modeled by h 5 216t2
1 500, where h is height in feet and t is
time in seconds.
a. Use a table to graph this function.
b. Use your graph to estimate the
amount of time it takes for the stone
to hit the ground. Round your answer
to the nearest tenth of a second.
28. Does the equation y 5 a ? bx model
exponential growth or exponential decay
when a . 0 and 0 , b , 1?
29. Solve the system of equations.
y 5 x2
y 5 23x 2 2
30. Evaluate x22y3 for x 5 22 and y 5 24.
O
2
�2
�2
2x
y
PHS4674_NAA1_QT_K.indd 72 6/26/09 1:59:33 PM
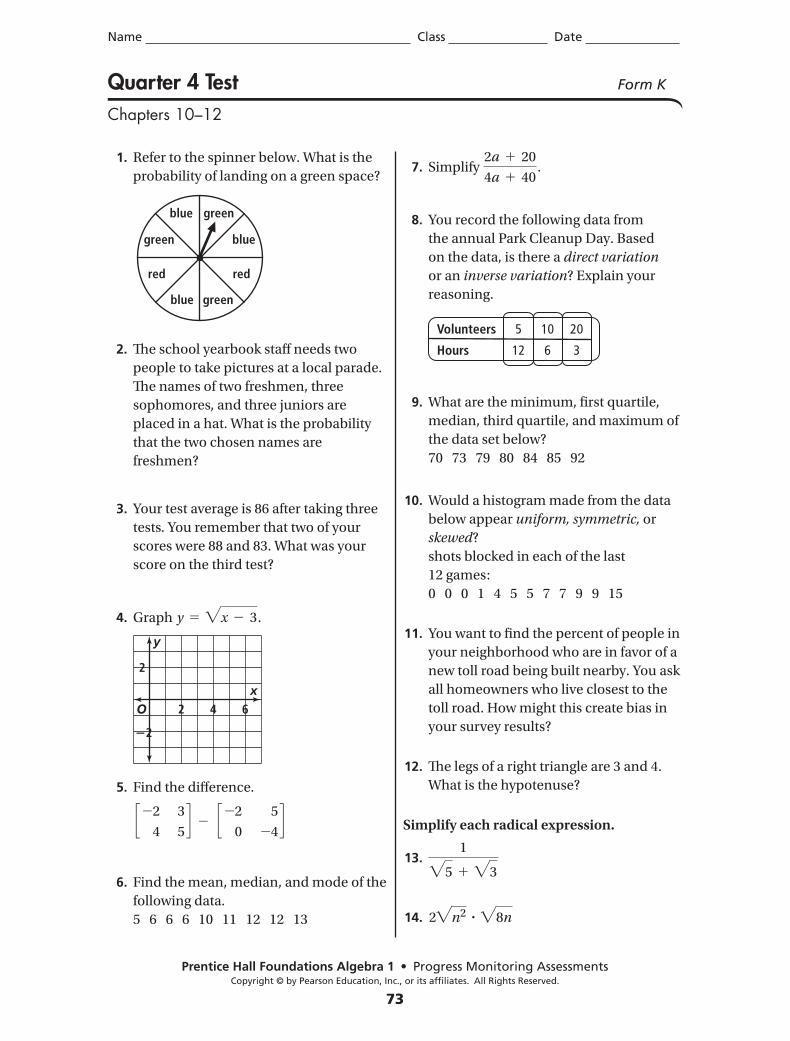
Name Class Date
Prentice Hall Foundations Algebra 1 • Progress Monitoring AssessmentsCopyright © by Pearson Education, Inc., or its affiliates. All Rights Reserved.
73
Quarter 4 Test Form K
Chapters 10–12
1. Refer to the spinner below. What is the
probability of landing on a green space?
2. Th e school yearbook staff needs two
people to take pictures at a local parade.
Th e names of two freshmen, three
sophomores, and three juniors are
placed in a hat. What is the probability
that the two chosen names are
freshmen?
3. Your test average is 86 after taking three
tests. You remember that two of your
scores were 88 and 83. What was your
score on the third test?
4. Graph y 5 "x 2 3.
5. Find the diff erence.
c22
4
3
5d 2 c22
0
5
24d
6. Find the mean, median, and mode of the
following data.
5 6 6 6 10 11 12 12 13
7. Simplify 2a 1 20
4a 1 40.
8. You record the following data from
the annual Park Cleanup Day. Based
on the data, is there a direct variation
or an inverse variation? Explain your
reasoning.
9. What are the minimum, fi rst quartile,
median, third quartile, and maximum of
the data set below?
70 73 79 80 84 85 92
10. Would a histogram made from the data
below appear uniform, symmetric, or
skewed?
shots blocked in each of the last
12 games:
0 0 0 1 4 5 5 7 7 9 9 15
11. You want to fi nd the percent of people in
your neighborhood who are in favor of a
new toll road being built nearby. You ask
all homeowners who live closest to the
toll road. How might this create bias in
your survey results?
12. Th e legs of a right triangle are 3 and 4.
What is the hypotenuse?
Simplify each radical expression.
13. 1"5 1 "3
14. 2"n2 ? "8n
green
green
greenblue
red
blue
blue
red
O
2
�2
2 4 6x
y
Volunteers
Hours
5
12
10
6
20
3
PHS4674_NAA1_QT_K.indd 73 6/26/09 1:59:35 PM
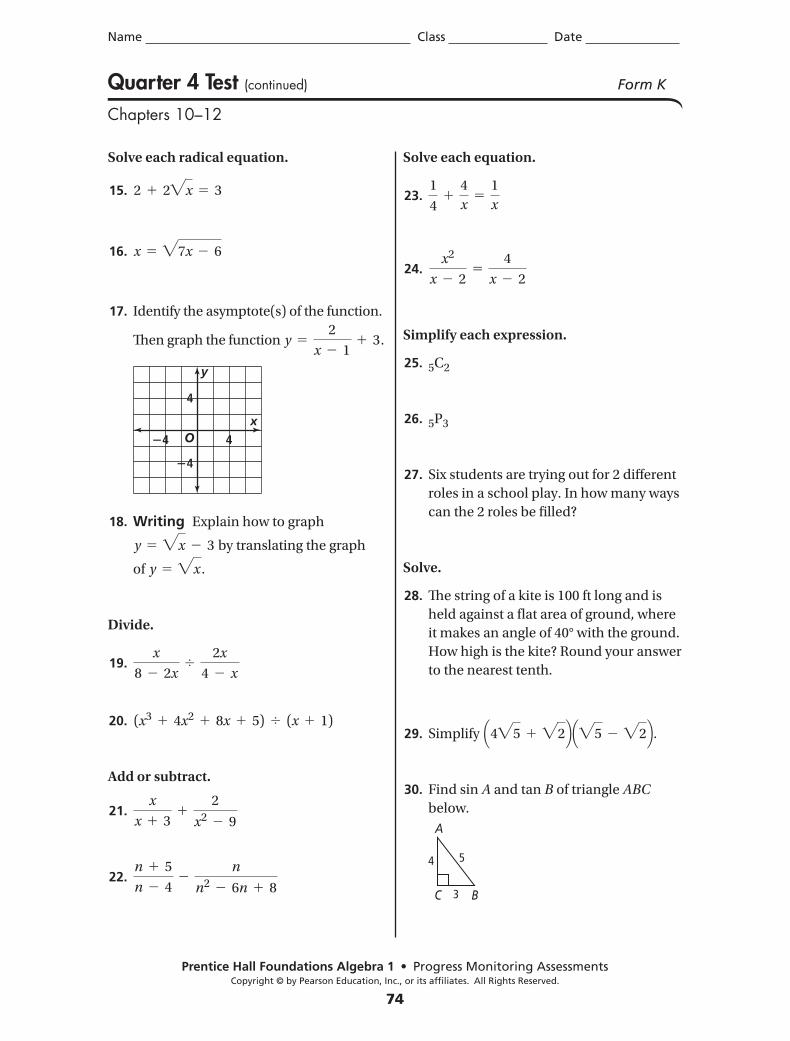
Name Class Date
Prentice Hall Foundations Algebra 1 • Progress Monitoring AssessmentsCopyright © by Pearson Education, Inc., or its affiliates. All Rights Reserved.
74
Quarter 4 Test (continued) Form K
Chapters 10–12
Solve each radical equation.
15. 2 1 2"x 5 3
16. x 5 "7x 2 6
17. Identify the asymptote(s) of the function.
Th en graph the function y 52
x 2 11 3.
18. Writing Explain how to graph
y 5 "x 2 3 by translating the graph
of y 5 "x .
Divide.
19. x
8 2 2x4
2x
4 2 x
20. (x3 1 4x2 1 8x 1 5) 4 (x 1 1)
Add or subtract.
21. x
x 1 31
2
x2 2 9
22. n 1 5
n 2 42
n
n2 2 6n 1 8
Solve each equation.
23. 1
41
4
x5
1
x
24. x2
x 2 25
4
x 2 2
Simplify each expression.
25. 5C2
26. 5P3
27. Six students are trying out for 2 diff erent
roles in a school play. In how many ways
can the 2 roles be fi lled?
Solve.
28. Th e string of a kite is 100 ft long and is
held against a fl at area of ground, where
it makes an angle of 40° with the ground.
How high is the kite? Round your answer
to the nearest tenth.
29. Simplify Q4"5 1 "2RQ"5 2 "2R. 30. Find sin A and tan B of triangle ABC
below.
O
4
�4
�4
4x
y
BC
4
3
5
A
PHS4674_NAA1_QT_K.indd 74 6/26/09 1:59:36 PM
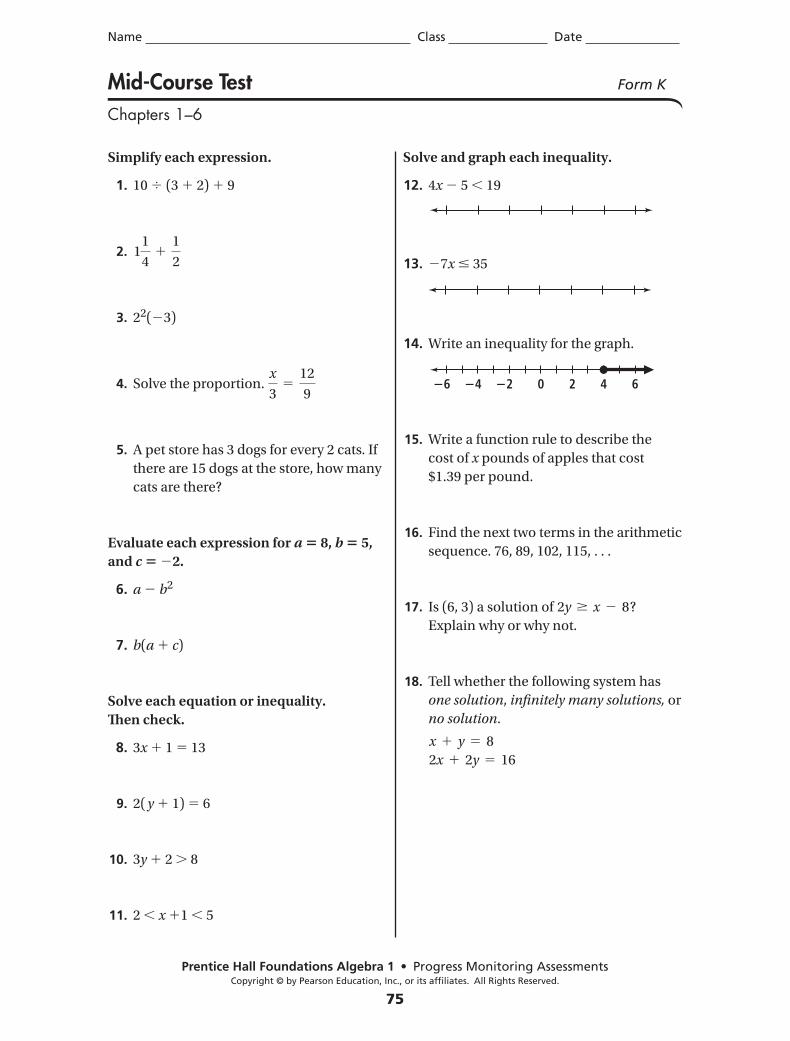
Name Class Date
Prentice Hall Foundations Algebra 1 • Progress Monitoring AssessmentsCopyright © by Pearson Education, Inc., or its affiliates. All Rights Reserved.
75
Simplify each expression.
1. 10 4 (3 1 2) 1 9
2. 11
41
1
2
3. 22(23)
4. Solve the proportion. x
35
12
9
5. A pet store has 3 dogs for every 2 cats. If
there are 15 dogs at the store, how many
cats are there?
Evaluate each expression for a 5 8, b 5 5,
and c 5 22.
6. a 2 b2
7. b(a 1 c)
Solve each equation or inequality.
Th en check.
8. 3x 1 1 5 13
9. 2( y 1 1) 5 6
10. 3y 1 2 . 8
11. 2 , x 11 , 5
Solve and graph each inequality.
12. 4x 2 5 , 19
13. 27x # 35
14. Write an inequality for the graph.
15. Write a function rule to describe the
cost of x pounds of apples that cost
$1.39 per pound.
16. Find the next two terms in the arithmetic
sequence. 76, 89, 102, 115, . . .
17. Is (6, 3) a solution of 2y $ x 2 8?
Explain why or why not.
18. Tell whether the following system has
one solution, infi nitely many solutions, or
no solution.
x 1 y 5 8
2x 1 2y 5 16
�6 �4 �2 0 642
Mid-Course Test Form K
Chapters 1–6
PHS4674_NAA1_Test_K.indd 75 6/26/09 1:57:24 PM
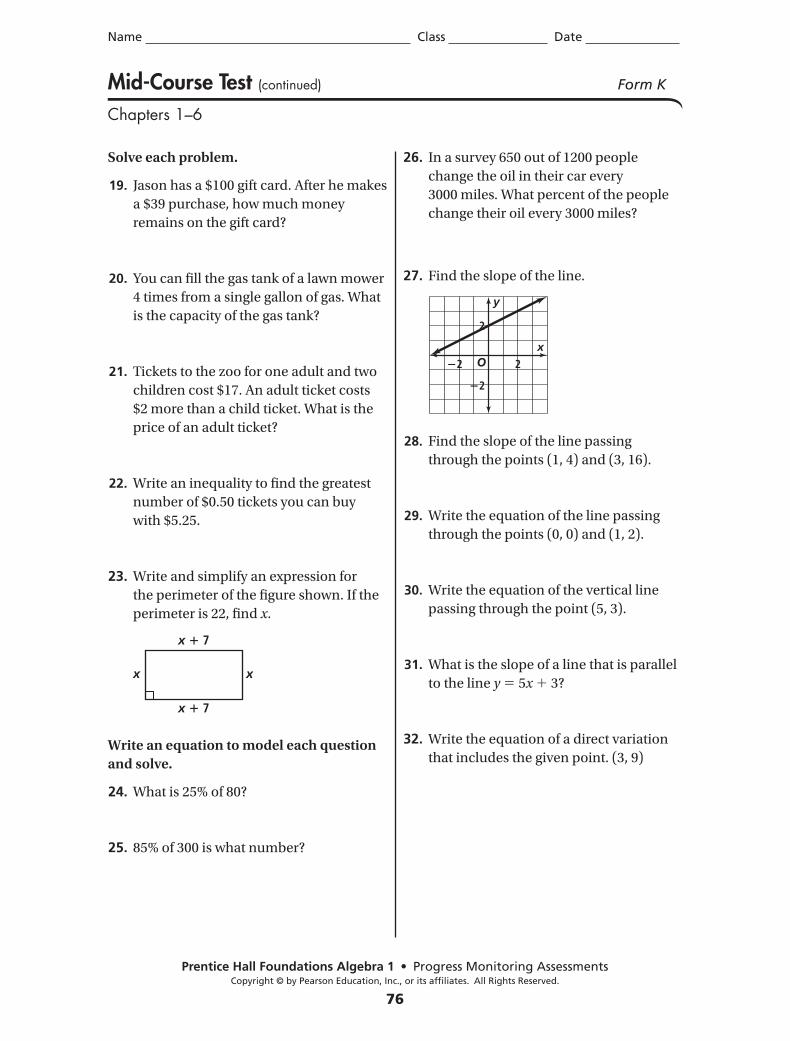
Name Class Date
Prentice Hall Foundations Algebra 1 • Progress Monitoring AssessmentsCopyright © by Pearson Education, Inc., or its affiliates. All Rights Reserved.
76
Mid-Course Test (continued) Form K
Chapters 1–6
Solve each problem.
19. Jason has a $100 gift card. After he makes
a $39 purchase, how much money
remains on the gift card?
20. You can fi ll the gas tank of a lawn mower
4 times from a single gallon of gas. What
is the capacity of the gas tank?
21. Tickets to the zoo for one adult and two
children cost $17. An adult ticket costs
$2 more than a child ticket. What is the
price of an adult ticket?
22. Write an inequality to fi nd the greatest
number of $0.50 tickets you can buy
with $5.25.
23. Write and simplify an expression for
the perimeter of the fi gure shown. If the
perimeter is 22, fi nd x.
Write an equation to model each question
and solve.
24. What is 25% of 80?
25. 85% of 300 is what number?
26. In a survey 650 out of 1200 people
change the oil in their car every
3000 miles. What percent of the people
change their oil every 3000 miles?
27. Find the slope of the line.
28. Find the slope of the line passing
through the points (1, 4) and (3, 16).
29. Write the equation of the line passing
through the points (0, 0) and (1, 2).
30. Write the equation of the vertical line
passing through the point (5, 3).
31. What is the slope of a line that is parallel
to the line y 5 5x 1 3?
32. Write the equation of a direct variation
that includes the given point. (3, 9)
x � 7
x � 7
xx
O
2
�2
�2
2x
y
PHS4674_NAA1_Test_K.indd 76 6/26/09 1:57:25 PM
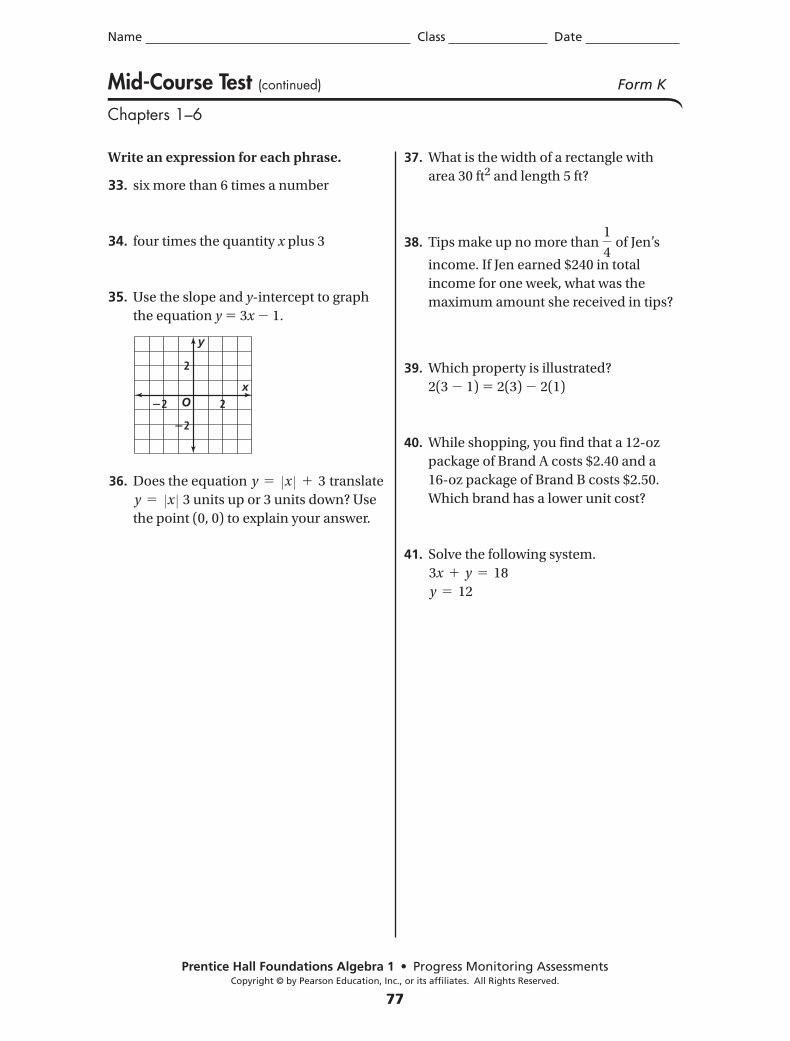
Name Class Date
Prentice Hall Foundations Algebra 1 • Progress Monitoring AssessmentsCopyright © by Pearson Education, Inc., or its affiliates. All Rights Reserved.
77
Mid-Course Test (continued) Form K
Chapters 1–6
Write an expression for each phrase.
33. six more than 6 times a number
34. four times the quantity x plus 3
35. Use the slope and y-intercept to graph
the equation y 5 3x 2 1.
36. Does the equation y 5 Zx Z 1 3 translate
y 5 Zx Z 3 units up or 3 units down? Use
the point (0, 0) to explain your answer.
37. What is the width of a rectangle with
area 30 ft2 and length 5 ft?
38. Tips make up no more than 1
4 of Jen’s
income. If Jen earned $240 in total
income for one week, what was the
maximum amount she received in tips?
39. Which property is illustrated?
2(3 2 1) 5 2(3) 2 2(1)
40. While shopping, you fi nd that a 12-oz
package of Brand A costs $2.40 and a
16-oz package of Brand B costs $2.50.
Which brand has a lower unit cost?
41. Solve the following system.
3x 1 y 5 18
y 5 12
O
2
�2
�2
2x
y
PHS4674_NAA1_Test_K.indd 77 6/26/09 1:57:26 PM
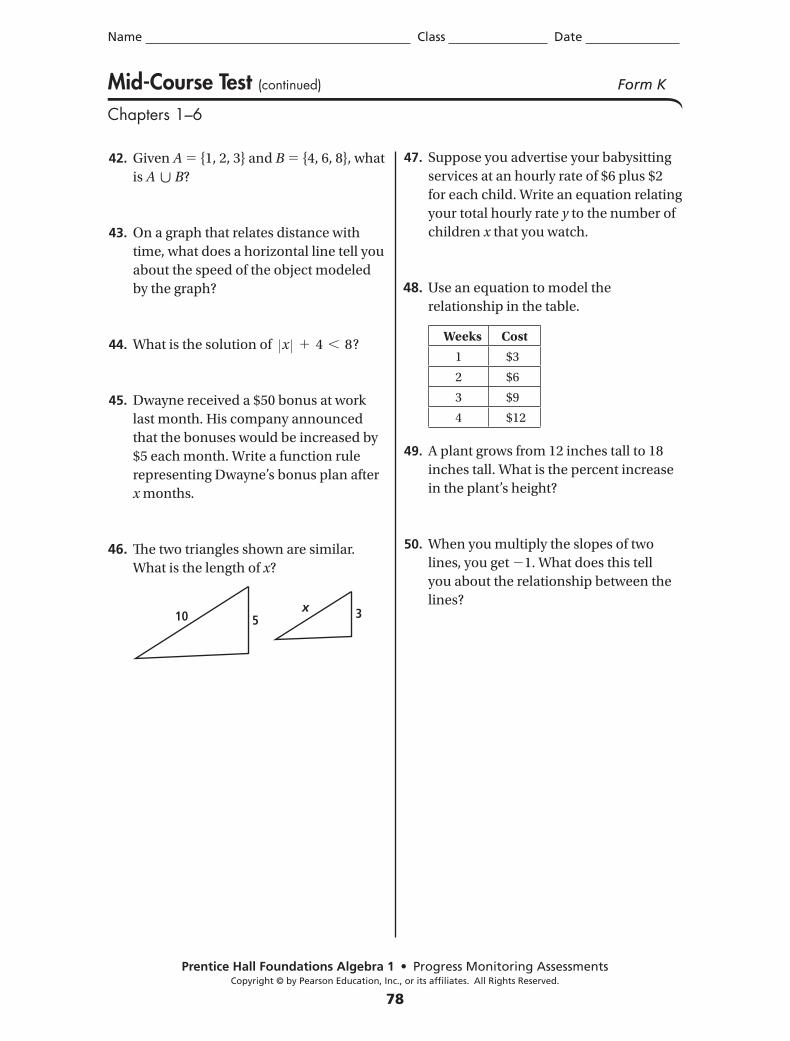
Name Class Date
Prentice Hall Foundations Algebra 1 • Progress Monitoring AssessmentsCopyright © by Pearson Education, Inc., or its affiliates. All Rights Reserved.
78
Mid-Course Test (continued) Form K
Chapters 1–6
42. Given A 5 {1, 2, 3} and B 5 {4, 6, 8}, what
is A h B?
43. On a graph that relates distance with
time, what does a horizontal line tell you
about the speed of the object modeled
by the graph?
44. What is the solution of Zx Z 1 4 , 8?
45. Dwayne received a $50 bonus at work
last month. His company announced
that the bonuses would be increased by
$5 each month. Write a function rule
representing Dwayne’s bonus plan after
x months.
46. Th e two triangles shown are similar.
What is the length of x?
47. Suppose you advertise your babysitting
services at an hourly rate of $6 plus $2
for each child. Write an equation relating
your total hourly rate y to the number of
children x that you watch.
48. Use an equation to model the
relationship in the table.
49. A plant grows from 12 inches tall to 18
inches tall. What is the percent increase
in the plant’s height?
50. When you multiply the slopes of two
lines, you get 21. What does this tell
you about the relationship between the
lines?x5 310
Weeks Cost
1 $3
2 $6
3 $9
4 $12
PHS4674_NAA1_Test_K.indd 78 6/26/09 1:57:26 PM
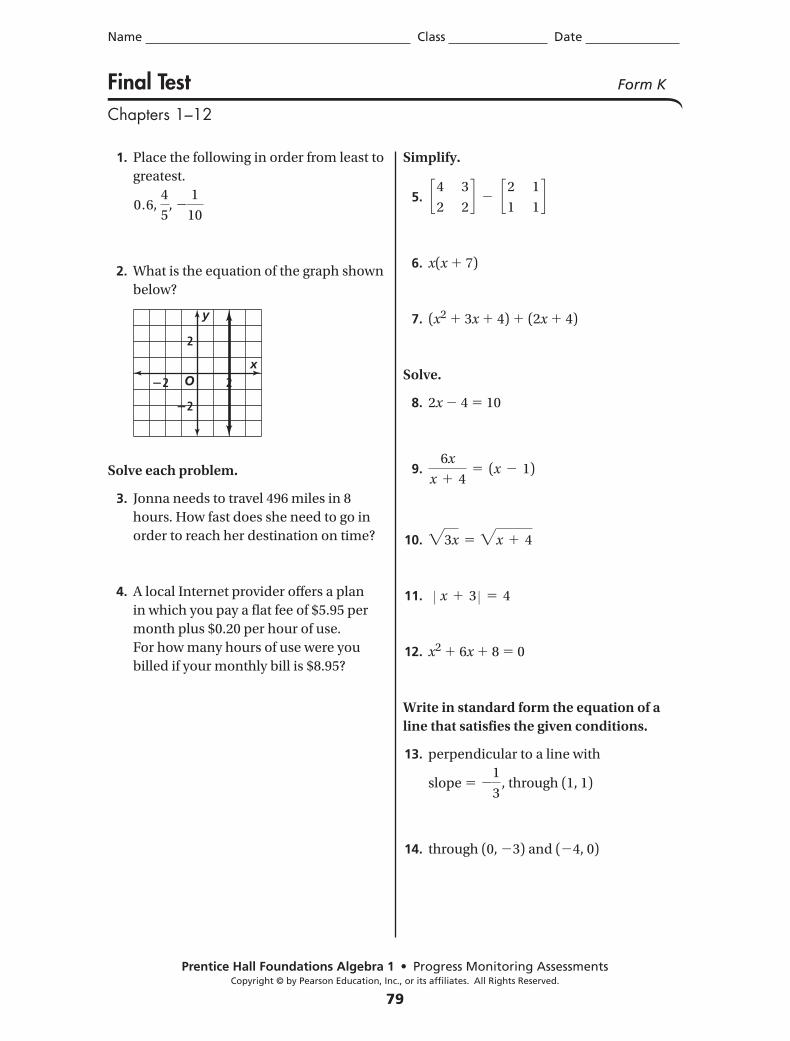
Name Class Date
Prentice Hall Foundations Algebra 1 • Progress Monitoring AssessmentsCopyright © by Pearson Education, Inc., or its affiliates. All Rights Reserved.
79
Final Test Form K
Chapters 1–12
1. Place the following in order from least to
greatest.
0.6, 4
5, 2
1
10
2. What is the equation of the graph shown
below?
Solve each problem.
3. Jonna needs to travel 496 miles in 8
hours. How fast does she need to go in
order to reach her destination on time?
4. A local Internet provider off ers a plan
in which you pay a fl at fee of $5.95 per
month plus $0.20 per hour of use.
For how many hours of use were you
billed if your monthly bill is $8.95?
Simplify.
5. c42
3
2d 2 c2
1
1
1d
6. x(x 1 7)
7. (x2 1 3x 1 4) 1 (2x 1 4)
Solve.
8. 2x 2 4 5 10
9. 6x
x 1 45 (x 2 1)
10. "3x 5 "x 1 4
11. Z x 1 3 Z 5 4
12. x2 1 6x 1 8 5 0
Write in standard form the equation of a
line that satisfi es the given conditions.
13. perpendicular to a line with
slope 5 21
3, through (1, 1)
14. through (0, 23) and (24, 0)
O
2
�2
�2
2x
y
PHS4674_NAA1_Test_K.indd 79 6/26/09 1:57:27 PM
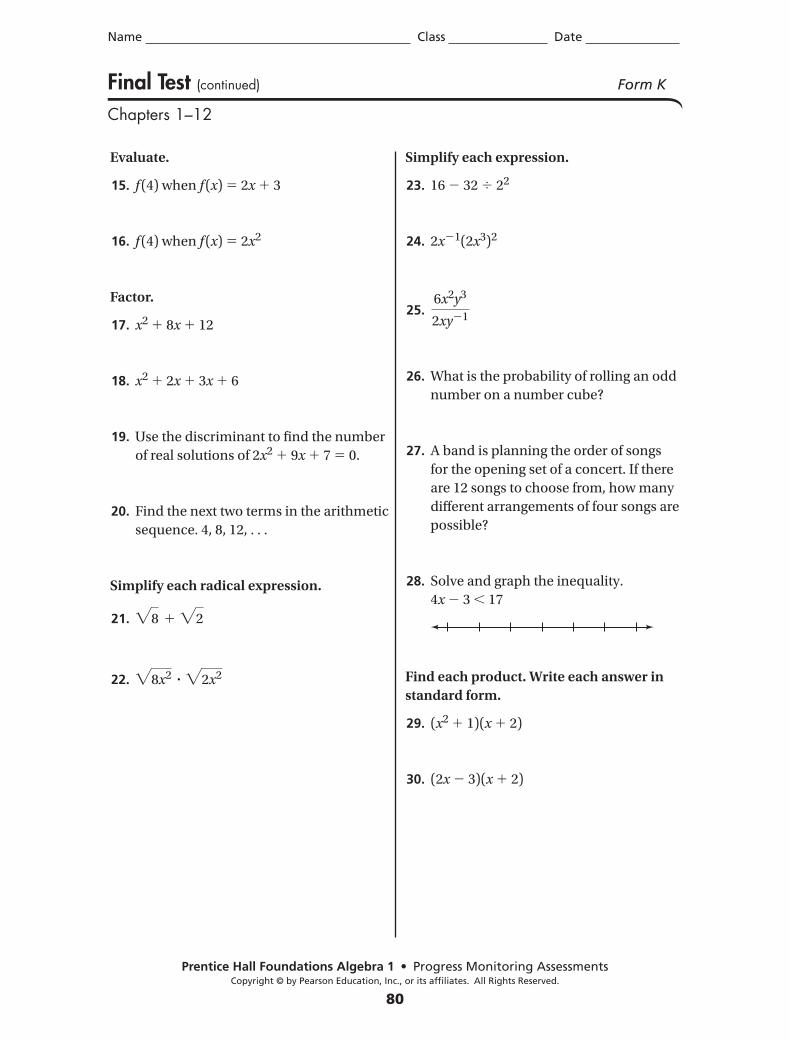
Name Class Date
Prentice Hall Foundations Algebra 1 • Progress Monitoring AssessmentsCopyright © by Pearson Education, Inc., or its affiliates. All Rights Reserved.
80
Final Test (continued) Form K
Chapters 1–12
Evaluate.
15. f (4) when f (x) 5 2x 1 3
16. f (4) when f (x) 5 2x2
Factor.
17. x2 1 8x 1 12
18. x2 1 2x 1 3x 1 6
19. Use the discriminant to fi nd the number
of real solutions of 2x2 1 9x 1 7 5 0.
20. Find the next two terms in the arithmetic
sequence. 4, 8, 12, . . .
Simplify each radical expression.
21. "8 1 "2
22. "8x2 ? "2x2
Simplify each expression.
23. 16 2 32 4 22
24. 2x21(2x3)2
25. 6x2y3
2xy21
26. What is the probability of rolling an odd
number on a number cube?
27. A band is planning the order of songs
for the opening set of a concert. If there
are 12 songs to choose from, how many
diff erent arrangements of four songs are
possible?
28. Solve and graph the inequality.
4x 2 3 , 17
Find each product. Write each answer in
standard form.
29. (x2 1 1)(x 1 2)
30. (2x 2 3)(x 1 2)
PHS4674_NAA1_Test_K.indd 80 6/26/09 1:57:27 PM
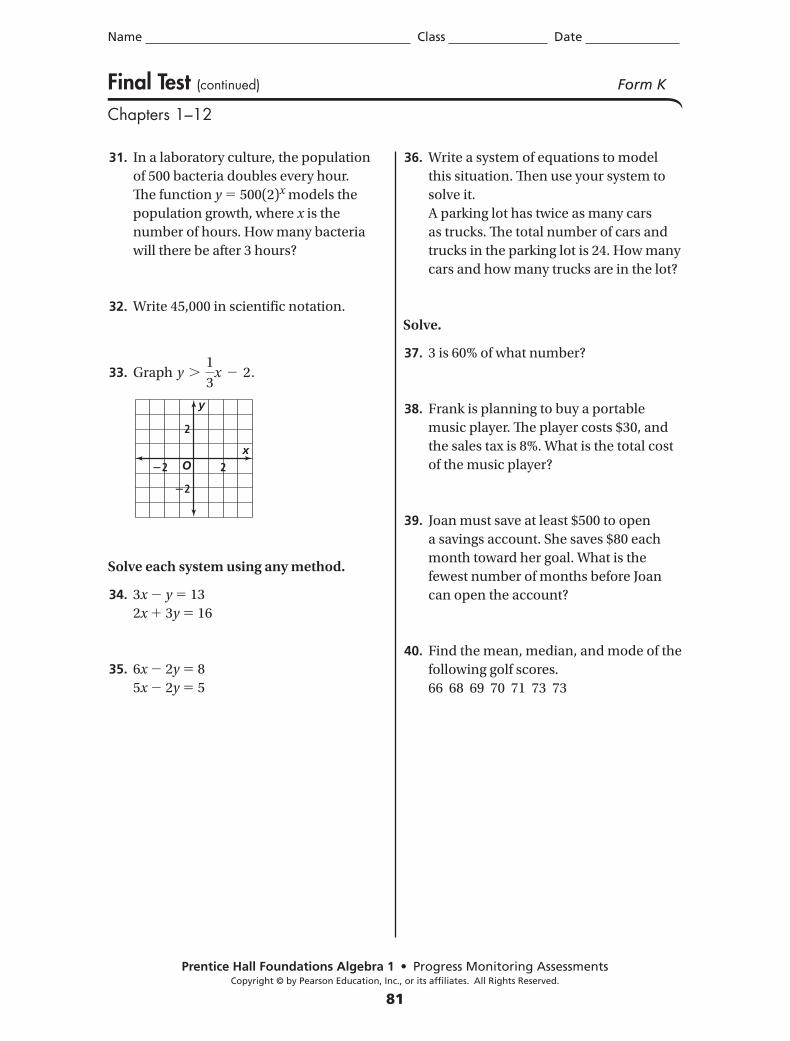
Name Class Date
Prentice Hall Foundations Algebra 1 • Progress Monitoring AssessmentsCopyright © by Pearson Education, Inc., or its affiliates. All Rights Reserved.
81
Final Test (continued) Form K
Chapters 1–12
31. In a laboratory culture, the population
of 500 bacteria doubles every hour.
Th e function y 5 500(2)x models the
population growth, where x is the
number of hours. How many bacteria
will there be after 3 hours?
32. Write 45,000 in scientifi c notation.
33. Graph y .1
3x 2 2.
Solve each system using any method.
34. 3x 2 y 5 13
2x 1 3y 5 16
35. 6x 2 2y 5 8
5x 2 2y 5 5
36. Write a system of equations to model
this situation. Th en use your system to
solve it.
A parking lot has twice as many cars
as trucks. Th e total number of cars and
trucks in the parking lot is 24. How many
cars and how many trucks are in the lot?
Solve.
37. 3 is 60% of what number?
38. Frank is planning to buy a portable
music player. Th e player costs $30, and
the sales tax is 8%. What is the total cost
of the music player?
39. Joan must save at least $500 to open
a savings account. She saves $80 each
month toward her goal. What is the
fewest number of months before Joan
can open the account?
40. Find the mean, median, and mode of the
following golf scores.
66 68 69 70 71 73 73
O
2
�2
�2
2x
y
PHS4674_NAA1_Test_K.indd 81 6/26/09 1:57:28 PM
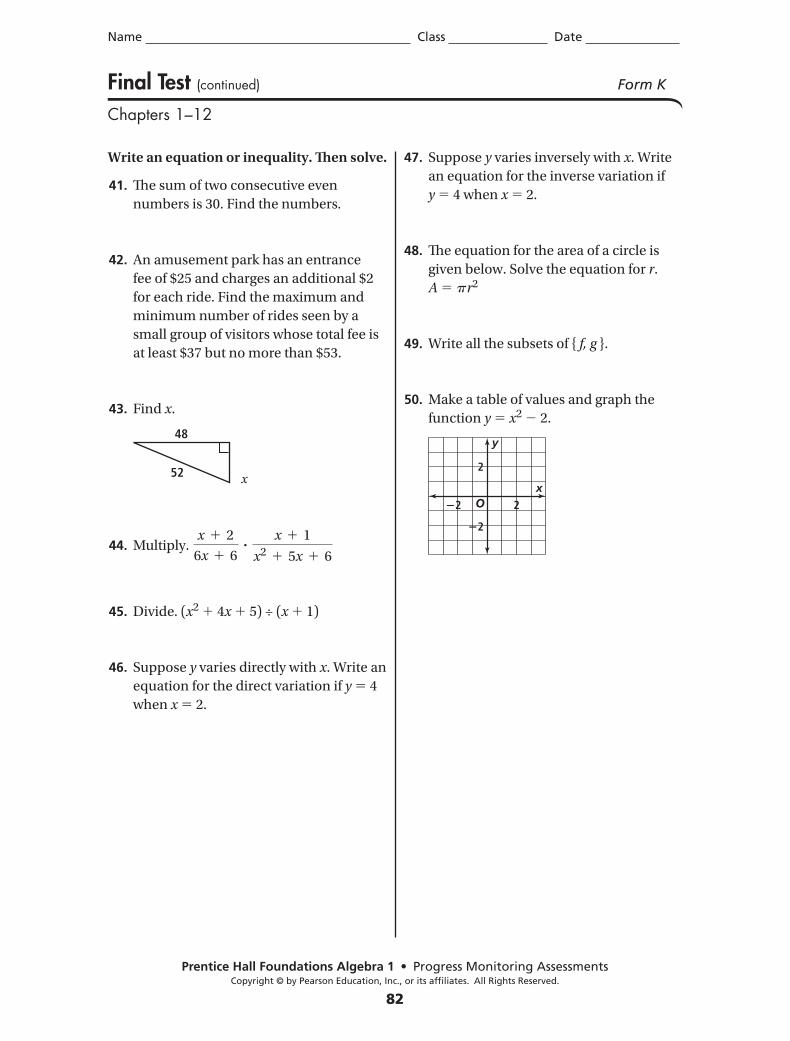
Name Class Date
Prentice Hall Foundations Algebra 1 • Progress Monitoring AssessmentsCopyright © by Pearson Education, Inc., or its affiliates. All Rights Reserved.
82
Final Test (continued) Form K
Chapters 1–12
Write an equation or inequality. Th en solve.
41. Th e sum of two consecutive even
numbers is 30. Find the numbers.
42. An amusement park has an entrance
fee of $25 and charges an additional $2
for each ride. Find the maximum and
minimum number of rides seen by a
small group of visitors whose total fee is
at least $37 but no more than $53.
43. Find x.
44. Multiply. x 1 2
6x 1 6?
x 1 1
x2 1 5x 1 6
45. Divide. (x2 1 4x 1 5) ÷ (x 1 1)
46. Suppose y varies directly with x. Write an
equation for the direct variation if y 5 4
when x 5 2.
47. Suppose y varies inversely with x. Write
an equation for the inverse variation if
y 5 4 when x 5 2.
48. Th e equation for the area of a circle is
given below. Solve the equation for r.
A 5 pr2
49. Write all the subsets of { f, g }.
50. Make a table of values and graph the
function y 5 x2 2 2.
48
52
O
2
�2
�2
2x
y
x
PHS4674_NAA1_Test_K.indd 82 6/26/09 1:57:28 PM
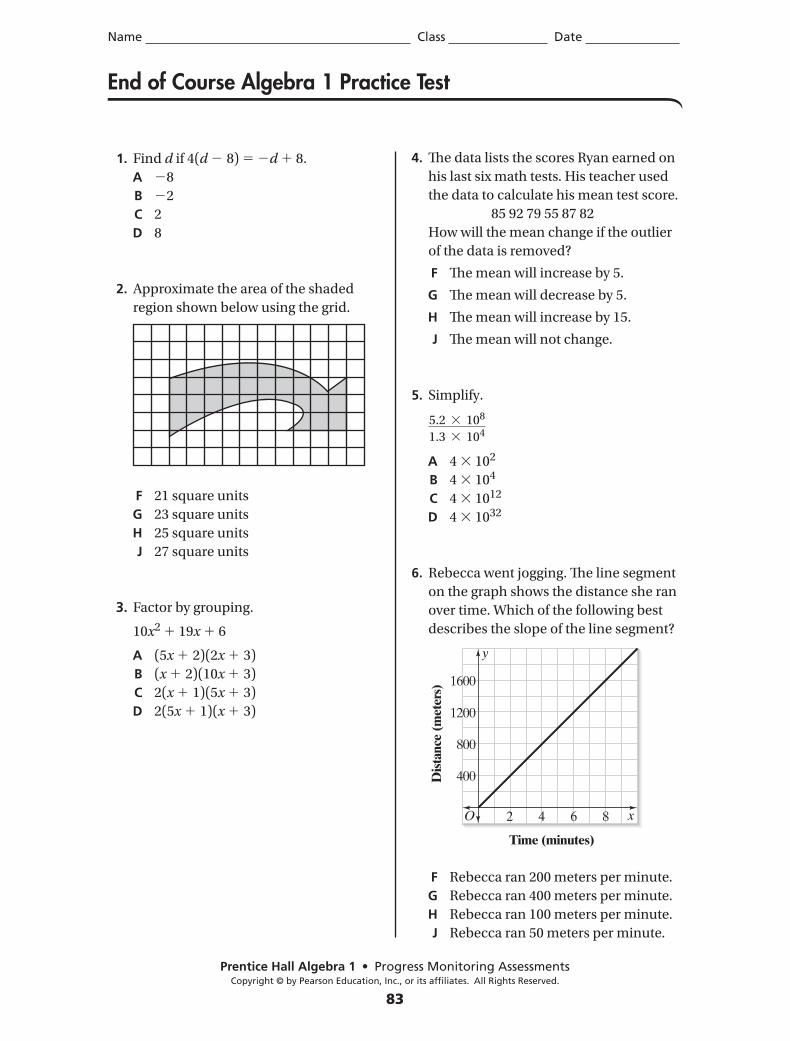
Progress Monitoring AssessmentsCopyright © by Pearson Education, Inc., or its affiliates. All Rights Reserved.
83
Name Class Date
1. Find d if 4(d 8) d 8.
A 8
B 2
C 2
D 8
2. Approximate the area of the shaded
region shown below using the grid.
F 21 square units
G 23 square units
H 25 square units
J 27 square units
3. Factor by grouping.
10x2 19x 6
A (5x 2)(2x 3)
B (x 2)(10x 3)
C 2(x 1)(5x 3)
D 2(5x 1)(x 3)
4. The data lists the scores Ryan earned on
his last six math tests. His teacher used
the data to calculate his mean test score.
85 92 79 55 87 82
How will the mean change if the outlier
of the data is removed?
F The mean will increase by 5.
G The mean will decrease by 5.
H The mean will increase by 15.
J The mean will not change.
5. Simplify.
5.2 108
1.3 104
A 4 102
B 4 104
C 4 1012
D 4 1032
6. Rebecca went jogging. The line segment
on the graph shows the distance she ran
over time. Which of the following best
describes the slope of the line segment?
F Rebecca ran 200 meters per minute.
G Rebecca ran 400 meters per minute.
H Rebecca ran 100 meters per minute.
J Rebecca ran 50 meters per minute.
y
O x
400
800
1200
1600
2 4 6 8
Dis
tanc
e (m
eter
s)
Time (minutes)
End of Course Algebra 1 Practice Test
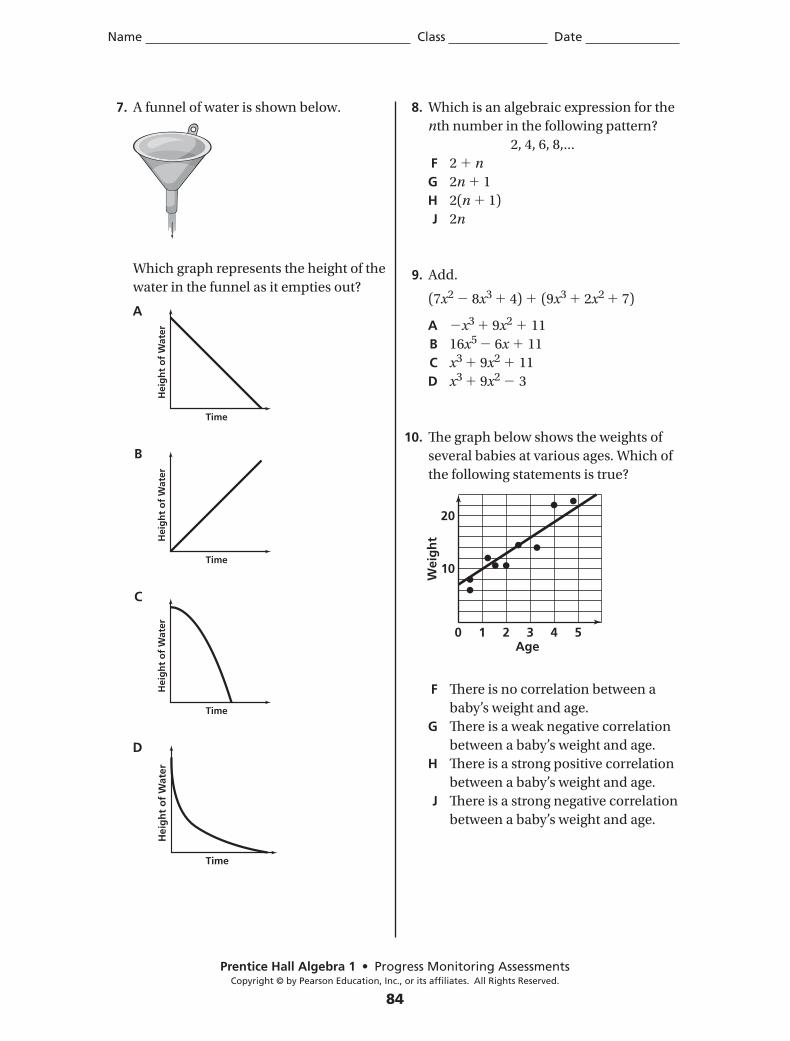
Progress Monitoring AssessmentsCopyright © by Pearson Education, Inc., or its affiliates. All Rights Reserved.
84
Name Class Date
7. A funnel of water is shown below.
Which graph represents the height of the
water in the funnel as it empties out?
A
B
C
D
8. Which is an algebraic expression for the
nth number in the following pattern?
2, 4, 6, 8,...
F 2 n
G 2n 1
H 2(n 1)
J 2n
9. Add.
(7x2 8x3 4) (9x3 2x2 7)
A x3 9x2 11
B 16x5 6x 11
C x3 9x2 11
D x3 9x2 3
10. The graph below shows the weights of
several babies at various ages. Which of
the following statements is true?
F There is no correlation between a
baby’s weight and age.
G There is a weak negative correlation
between a baby’s weight and age.
H There is a strong positive correlation
between a baby’s weight and age.
J There is a strong negative correlation
between a baby’s weight and age.
Time
Hei
gh
t o
f W
ater
Time
Hei
gh
t o
f W
ater
Time
Hei
gh
t o
f W
ater
Time
Hei
gh
t o
f W
ater
10
20
0 1 2 3 4 5Age
Wei
gh
t
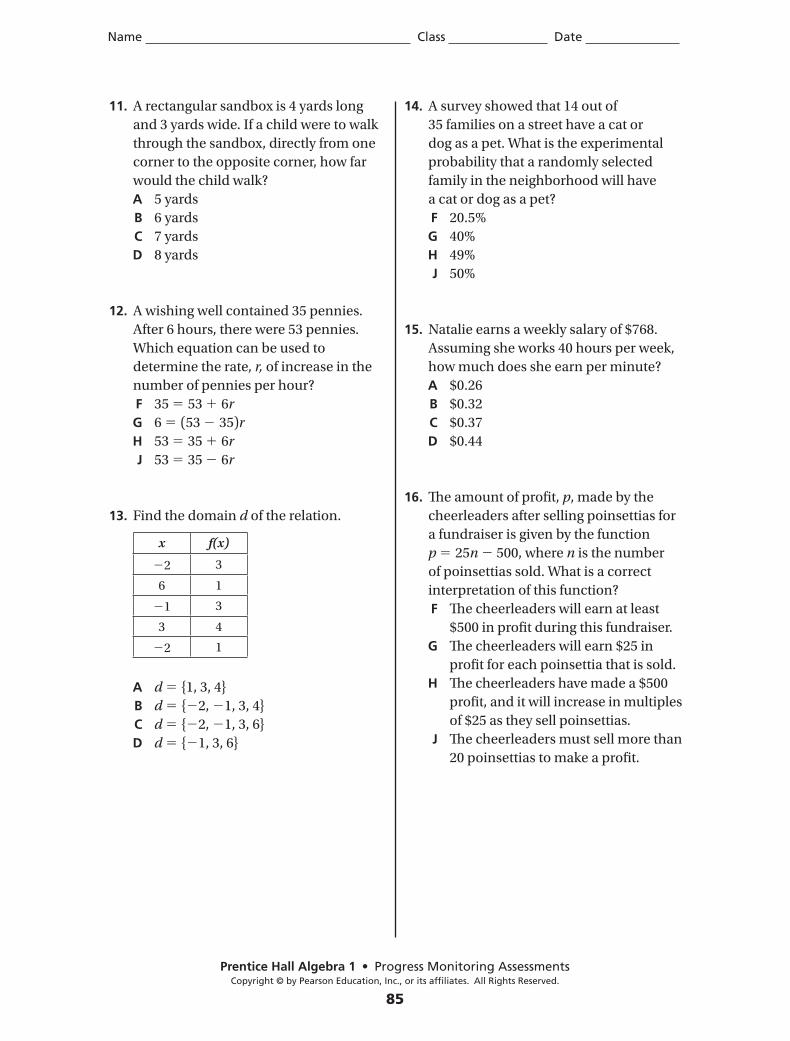
Progress Monitoring AssessmentsCopyright © by Pearson Education, Inc., or its affiliates. All Rights Reserved.
85
Name Class Date
11. A rectangular sandbox is 4 yards long
and 3 yards wide. If a child were to walk
through the sandbox, directly from one
corner to the opposite corner, how far
would the child walk?
A 5 yards
B 6 yards
C 7 yards
D 8 yards
12. A wishing well contained 35 pennies.
After 6 hours, there were 53 pennies.
Which equation can be used to
determine the rate, r, of increase in the
number of pennies per hour?
F 35 53 6r
G 6 (53 35)r
H 53 35 6r
J 53 35 6r
13. Find the domain d of the relation.
A d {1, 3, 4}
B d { 2, 1, 3, 4}
C d { 2, 1, 3, 6}
D d { 1, 3, 6}
14. A survey showed that 14 out of
35 families on a street have a cat or
dog as a pet. What is the experimental
probability that a randomly selected
family in the neighborhood will have
a cat or dog as a pet?
F 20.5%
G 40%
H 49%
J 50%
15. Natalie earns a weekly salary of $768.
Assuming she works 40 hours per week,
how much does she earn per minute?
A $0.26
B $0.32
C $0.37
D $0.44
16. The amount of profit, p, made by the
cheerleaders after selling poinsettias for
a fundraiser is given by the function
p 25n 500, where n is the number
of poinsettias sold. What is a correct
interpretation of this function?
F The cheerleaders will earn at least
$500 in profit during this fundraiser.
G The cheerleaders will earn $25 in
profit for each poinsettia that is sold.
H The cheerleaders have made a $500
profit, and it will increase in multiples
of $25 as they sell poinsettias.
J The cheerleaders must sell more than
20 poinsettias to make a profit.
x f(x)
2 3
6 1
1 3
3 4
2 1
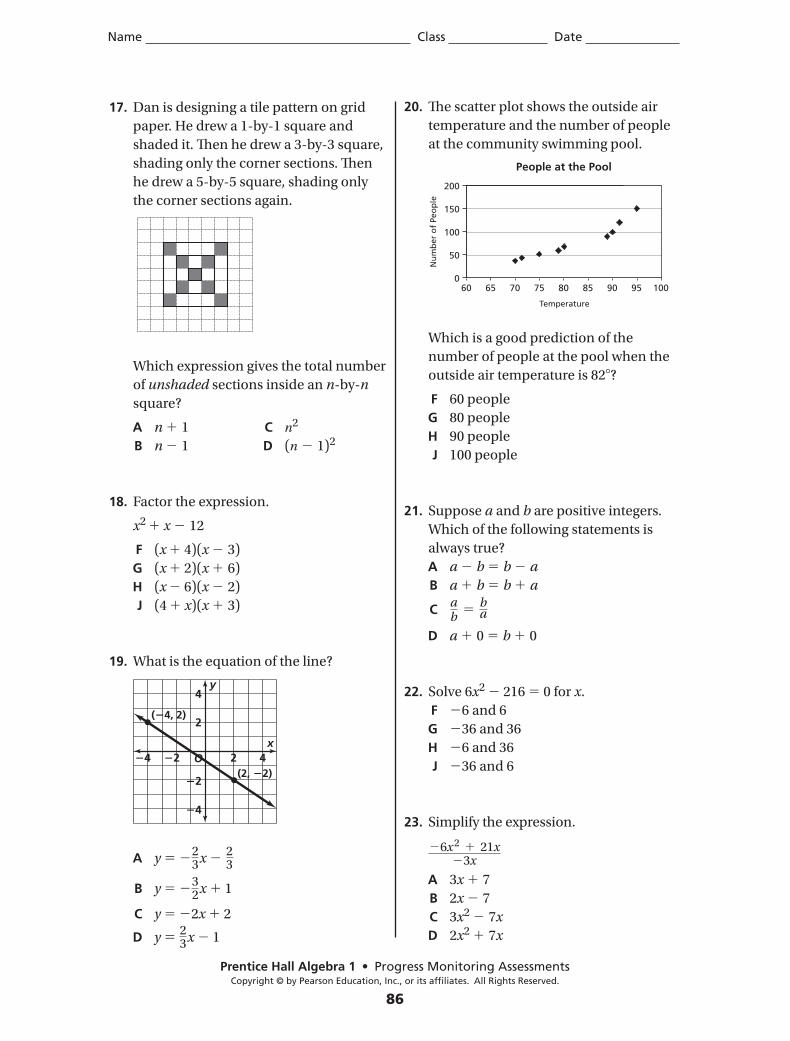
Progress Monitoring AssessmentsCopyright © by Pearson Education, Inc., or its affiliates. All Rights Reserved.
86
Name Class Date
17. Dan is designing a tile pattern on grid
paper. He drew a 1-by-1 square and
shaded it. Then he drew a 3-by-3 square,
shading only the corner sections. Then
he drew a 5-by-5 square, shading only
the corner sections again.
Which expression gives the total number
of unshaded sections inside an n-by-n
square?
A n 1 C n2
B n 1 D (n 1)2
18. Factor the expression.
x2 x 12
F (x 4)(x 3)
G (x 2)(x 6)
H (x 6)(x 2)
J (4 x)(x 3)
19. What is the equation of the line?
A y 23x
23
B y 32x 1
C y 2x 2
D y 23x 1
20. The scatter plot shows the outside air
temperature and the number of people
at the community swimming pool.
Which is a good prediction of the
number of people at the pool when the
outside air temperature is 82 ?
F 60 people
G 80 people
H 90 people
J 100 people
21. Suppose a and b are positive integers.
Which of the following statements is
always true?
A a b b a
B a b b a
C ab
ba
D a 0 b 0
22. Solve 6x2 216 0 for x.
F 6 and 6
G 36 and 36
H 6 and 36
J 36 and 6
23. Simplify the expression.
6x 2 21x 3x
A 3x 7
B 2x 7
C 3x2 7x
D 2x2 7x
O
2
4
424 2
2
4
x
y
( 4, 2)
(2, 2)
060 65 100959085807570
50
100
150
200
Temperature
People at the Pool
Nu
mb
er o
f Pe
op
le
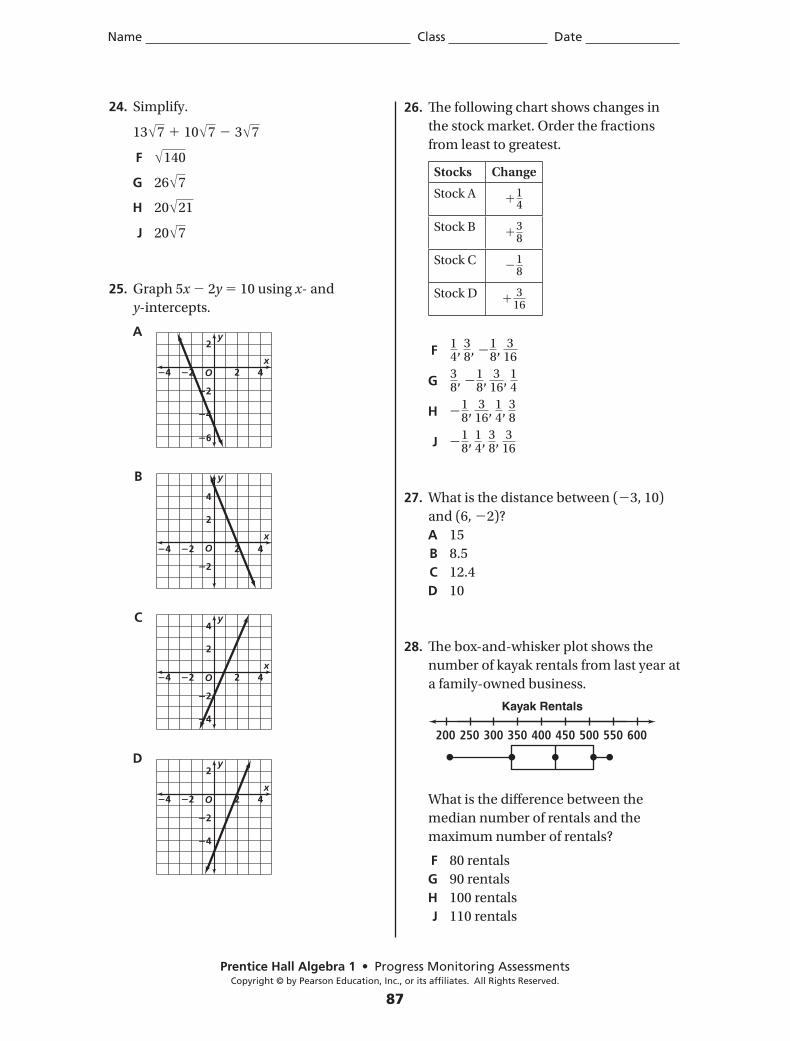
Progress Monitoring AssessmentsCopyright © by Pearson Education, Inc., or its affiliates. All Rights Reserved.
87
Name Class Date
24. Simplify.
13 7 10 7 3 7
F 140
G 26 7
H 20 21
J 20 7
25. Graph 5x 2y 10 using x- and
y-intercepts.
A
B
C
D
26. The following chart shows changes in
the stock market. Order the fractions
from least to greatest.
F 14,
38,
18,
316
G 38,
18,
316,
14
H
18,
316,
14,
38
J
18,
14,
38,
316
27. What is the distance between ( 3, 10)
and (6, 2)?
A 15
B 8.5
C 12.4
D 10
28. The box-and-whisker plot shows the
number of kayak rentals from last year at
a family-owned business.
What is the difference between the
median number of rentals and the
maximum number of rentals?
F 80 rentals
G 90 rentals
H 100 rentals
J 110 rentals
O
2
424 2
2
4
6
x
y
O
2
4
424 2
2
x
y
O
2
4
424 2
2
4
x
y
O
2
424 2
2
4
x
y
Stocks Change
Stock A 14
Stock B 38
Stock C 18
Stock D 316
200 250 300 350 400 450 550500 600
Kayak Rentals
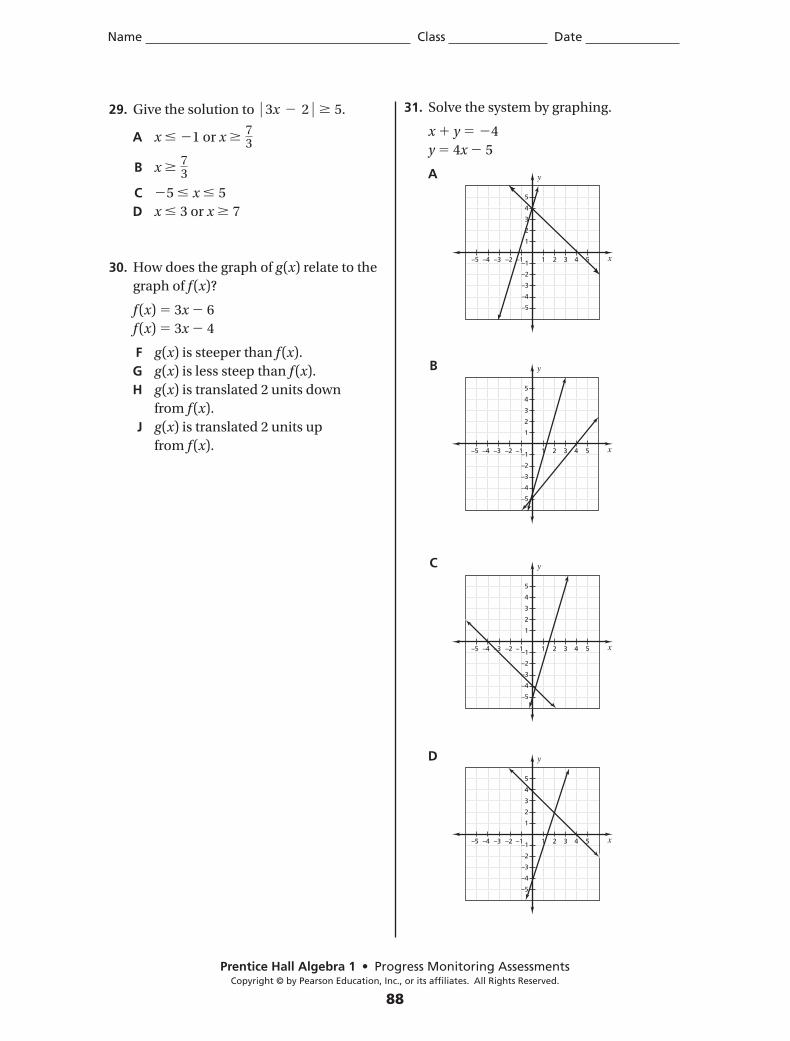
Name Class Date
Progress Monitoring AssessmentsCopyright © by Pearson Education, Inc., or its affiliates. All Rights Reserved.
88
29. Give the solution to 3x 2 5.
A x 1 or x 73
B x 73
C 5 x 5
D x 3 or x 7
30. How does the graph of g (x) relate to the
graph of f (x)?
f (x) 3x 6
f (x) 3x 4
F g (x) is steeper than f (x).
G g (x) is less steep than f (x).
H g (x) is translated 2 units down
from f (x).
J g (x) is translated 2 units up
from f (x).
31. Solve the system by graphing.
x y 4
y 4x 5
A
B
C
D
5
4
3
2
1
y
–1
–2
–3
–4
–5
–5 –4 –3 –2 –1 1 2 3 4 5 x
5
4
3
2
1
y
–1
–2
–3
–4
–5
–5 –4 –3 –2 –1 1 2 3 4 5 x
5
4
3
2
1
y
–1
–2
–3
–4
–5
–5 –4 –3 –2 –1 1 2 3 4 5 x
5
4
3
2
1
y
–1
–2
–3
–4
–5
–5 –4 –3 –2 –1 1 2 3 4 5 x
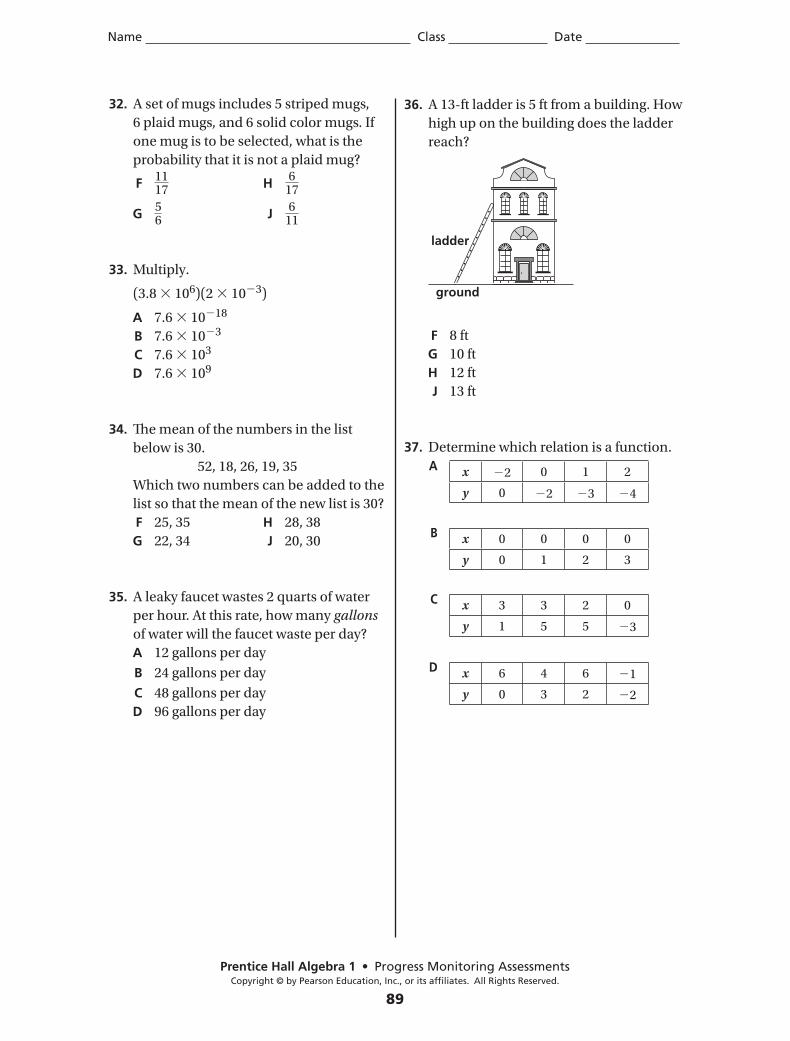
Progress Monitoring AssessmentsCopyright © by Pearson Education, Inc., or its affiliates. All Rights Reserved.
89
Name Class Date
32. A set of mugs includes 5 striped mugs,
6 plaid mugs, and 6 solid color mugs. If
one mug is to be selected, what is the
probability that it is not a plaid mug?
F 1117 H
617
G 56 J
611
33. Multiply.
(3.8 106)(2 10 3)
A 7.6 10 18
B 7.6 10 3
C 7.6 103
D 7.6 109
34. The mean of the numbers in the list
below is 30.
52, 18, 26, 19, 35
Which two numbers can be added to the
list so that the mean of the new list is 30?
F 25, 35 H 28, 38
G 22, 34 J 20, 30
35. A leaky faucet wastes 2 quarts of water
per hour. At this rate, how many gallons
of water will the faucet waste per day?
A 12 gallons per day
B 24 gallons per day
C 48 gallons per day
D 96 gallons per day
36. A 13-ft ladder is 5 ft from a building. How
high up on the building does the ladder
reach?
F 8 ft
G 10 ft
H 12 ft
J 13 ft
37. Determine which relation is a function.
A
B
C
D
ladder
ground
x 2 0 1 2
y 0 2 3 4
x 0 0 0 0
y 0 1 2 3
x 3 3 2 0
y 1 5 5 3
x 6 4 6 1
y 0 3 2 2
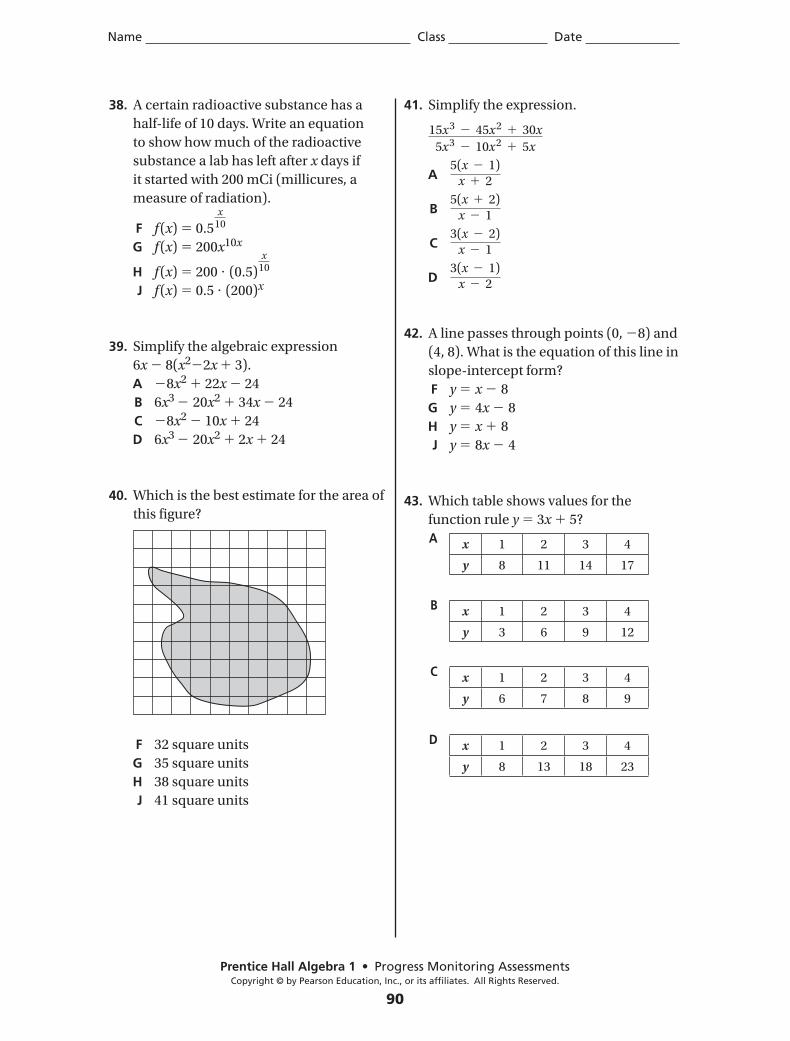
Progress Monitoring AssessmentsCopyright © by Pearson Education, Inc., or its affiliates. All Rights Reserved.
90
Name Class Date
38. A certain radioactive substance has a
half-life of 10 days. Write an equation
to show how much of the radioactive
substance a lab has left after x days if
it started with 200 mCi (millicures, a
measure of radiation).
F f (x) 0.5
x10
G f (x) 200x10x
H f (x) 200 (0.5)
x10
J f (x) 0.5 (200)x
39. Simplify the algebraic expression
6x 8(x2 2x 3).
A 8x2 22x 24
B 6x3 20x2 34x 24
C 8x2 10x 24
D 6x3 20x2 2x 24
40. Which is the best estimate for the area of
this figure?
F 32 square units
G 35 square units
H 38 square units
J 41 square units
41. Simplify the expression.
15x 3 45x 2 30x
5x 3 10x 2 5x
A 5(x 1)
x 2
B 5(x 2)
x 1
C 3(x 2)
x 1
D 3(x 1)
x 2
42. A line passes through points (0, 8) and
(4, 8). What is the equation of this line in
slope-intercept form?
F y x 8
G y 4x 8
H y x 8
J y 8x 4
43. Which table shows values for the
function rule y 3x 5?
A
B
C
D
x 1 2 3 4
y 8 11 14 17
x 1 2 3 4
y 3 6 9 12
x 1 2 3 4
y 6 7 8 9
x 1 2 3 4
y 8 13 18 23
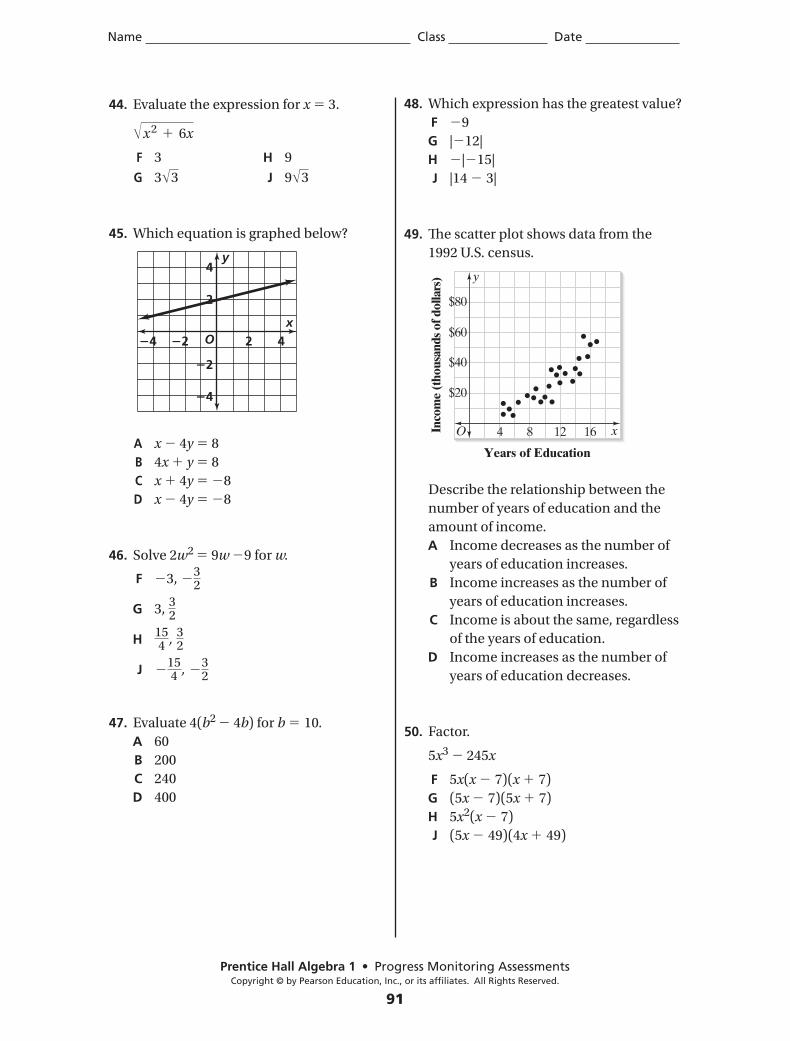
Progress Monitoring AssessmentsCopyright © by Pearson Education, Inc., or its affiliates. All Rights Reserved.
91
Name Class Date
44. Evaluate the expression for x 3.
x 2 6x
F 3 H 9
G 3 3 J 9 3
45. Which equation is graphed below?
A x 4y 8
B 4x y 8
C x 4y 8
D x 4y 8
46. Solve 2w2 9w 9 for w.
F 3,
32
G 3, 32
H 154 ,
32
J
154 ,
32
47. Evaluate 4(b2 4b) for b 10.
A 60
B 200
C 240
D 400
48. Which expression has the greatest value?
F 9
G | 12|
H | 15|
J |14 3|
49. The scatter plot shows data from the
1992 U.S. census.
Describe the relationship between the
number of years of education and the
amount of income.
A Income decreases as the number of
years of education increases.
B Income increases as the number of
years of education increases.
C Income is about the same, regardless
of the years of education.
D Income increases as the number of
years of education decreases.
50. Factor.
5x3 245x
F 5x(x 7)(x 7)
G (5x 7)(5x 7)
H 5x2(x 7)
J (5x 49)(4x 49)
O
4
2
2
2
4
4 42x
y
y
O x
$20
$40
$60
$80
4 8 12 16Inco
me
(tho
usan
ds o
f dol
lars
)Years of Education
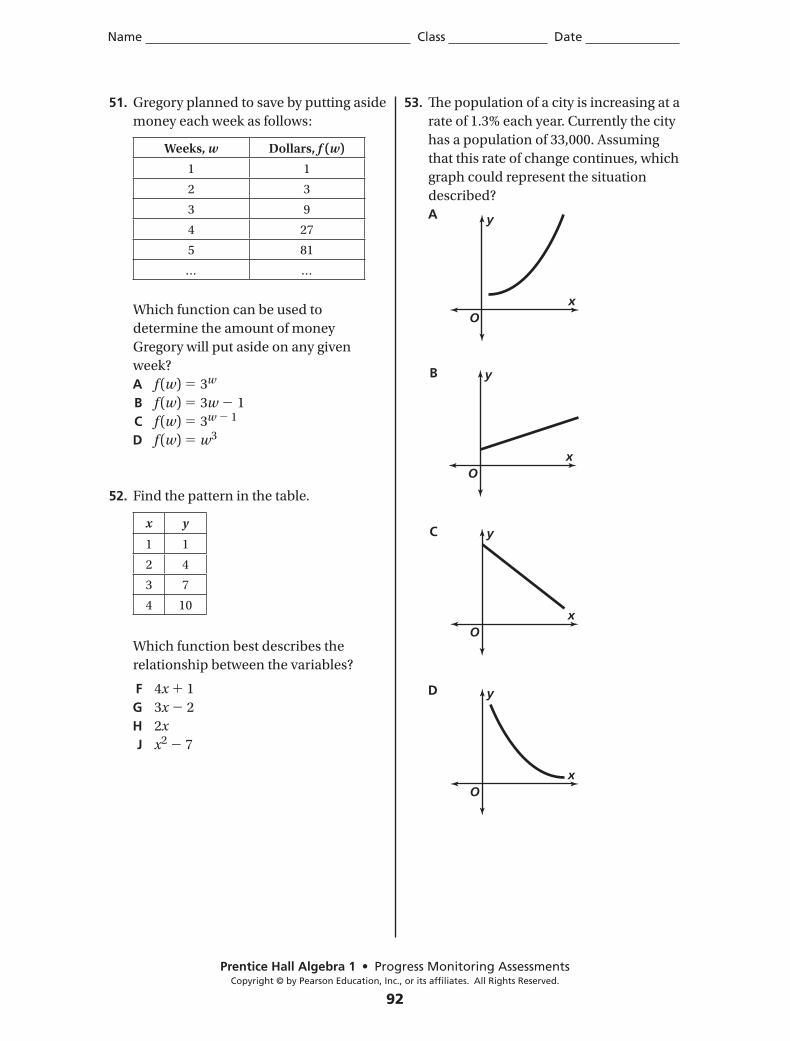
Progress Monitoring AssessmentsCopyright © by Pearson Education, Inc., or its affiliates. All Rights Reserved.
92
Name Class Date
51. Gregory planned to save by putting aside
money each week as follows:
Which function can be used to
determine the amount of money
Gregory will put aside on any given
week?
A f (w) 3w
B f (w) 3w 1
C f (w) 3w 1
D f (w) w3
52. Find the pattern in the table.
Which function best describes the
relationship between the variables?
F 4x 1
G 3x 2
H 2x
J x2 7
53. The population of a city is increasing at a
rate of 1.3% each year. Currently the city
has a population of 33,000. Assuming
that this rate of change continues, which
graph could represent the situation
described?
A
B
C
D
Weeks, w Dollars, f (w)
1 1
2 3
3 9
4 27
5 81
… …
x y
1 1
2 4
3 7
4 10
Ox
y
Ox
y
Ox
y
Ox
y
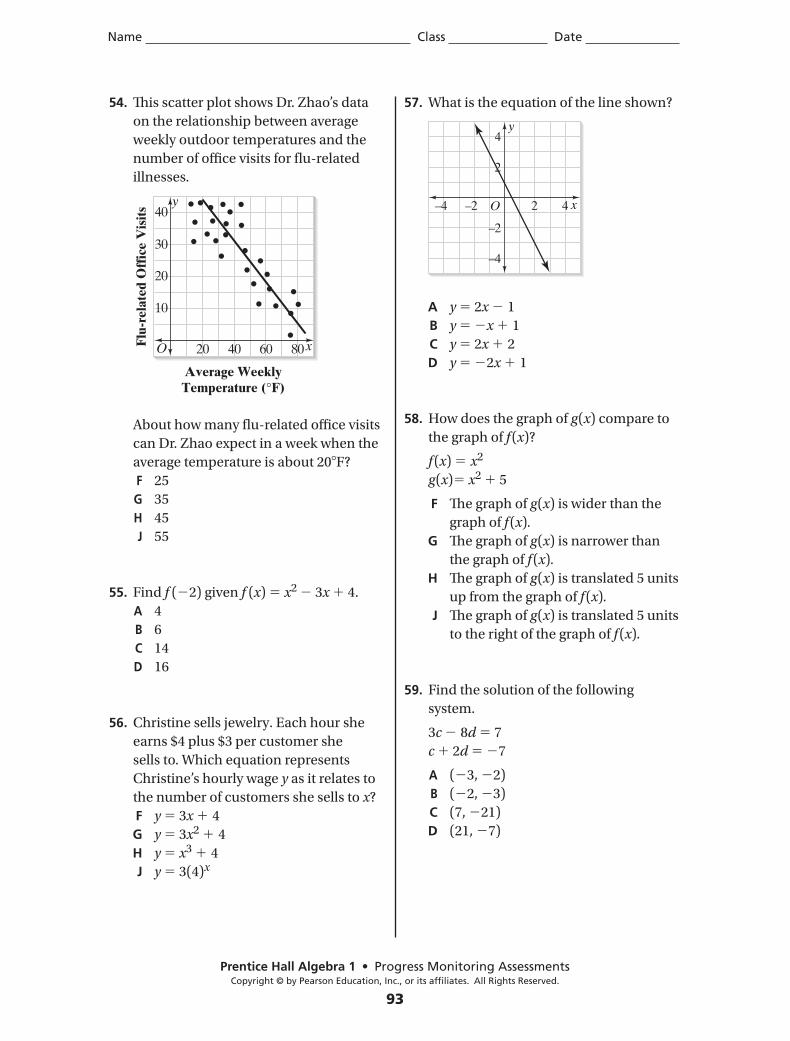
Progress Monitoring AssessmentsCopyright © by Pearson Education, Inc., or its affiliates. All Rights Reserved.
93
Name Class Date
54. This scatter plot shows Dr. Zhao’s data
on the relationship between average
weekly outdoor temperatures and the
number of office visits for flu-related
illnesses.
About how many flu-related office visits
can Dr. Zhao expect in a week when the
average temperature is about 20 F?
F 25
G 35
H 45
J 55
55. Find f ( 2) given f (x) x2 3x 4.
A 4
B 6
C 14
D 16
56. Christine sells jewelry. Each hour she
earns $4 plus $3 per customer she
sells to. Which equation represents
Christine’s hourly wage y as it relates to
the number of customers she sells to x?
F y 3x 4
G y 3x2 4
H y x3 4
J y 3(4)x
57. What is the equation of the line shown?
A y 2x 1
B y x 1
C y 2x 2
D y 2x 1
58. How does the graph of g (x) compare to
the graph of f (x)?
f (x) x2
g (x) x2 5
F The graph of g (x) is wider than the
graph of f (x).
G The graph of g (x) is narrower than
the graph of f (x).
H The graph of g (x) is translated 5 units
up from the graph of f (x).
J The graph of g (x) is translated 5 units
to the right of the graph of f (x).
59. Find the solution of the following
system.
3c 8d 7
c 2d 7
A ( 3, 2)
B ( 2, 3)
C (7, 21)
D (21, 7)
Flu
-rel
ated
Off
ice
Vis
its
Average WeeklyTemperature ( F)
y
O x
10
20
30
40
20 40 60 80
y
O x
2
4
2–2
–2
–4
–4 4
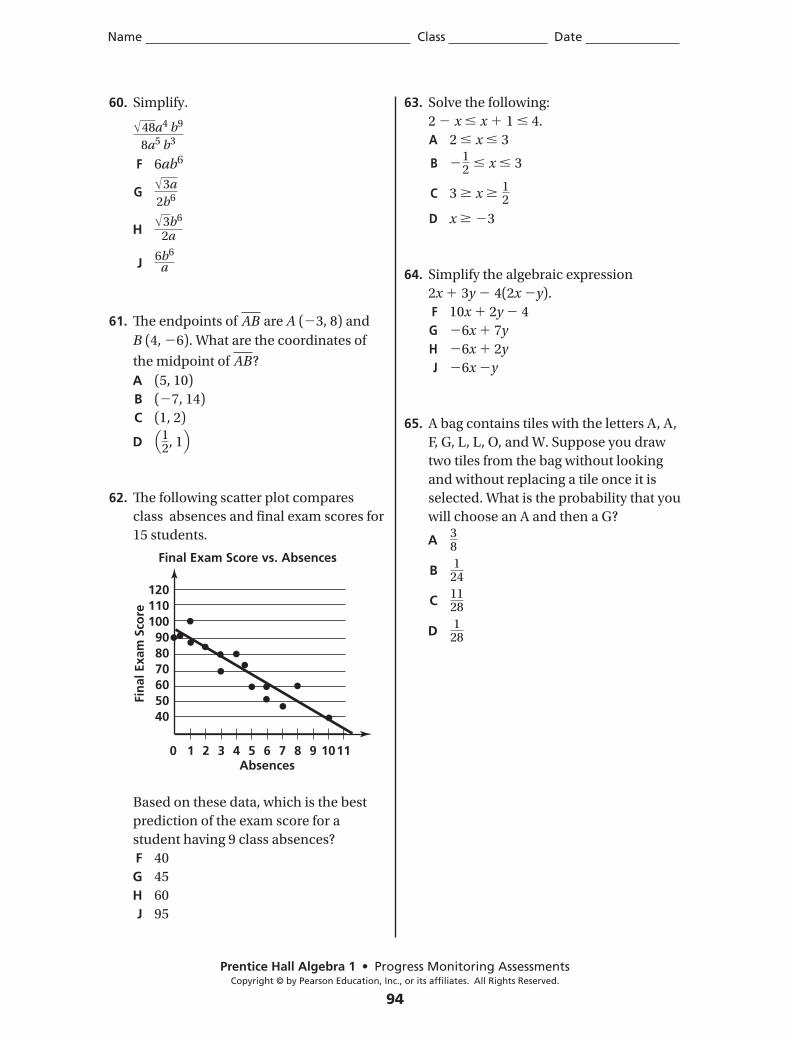
Progress Monitoring AssessmentsCopyright © by Pearson Education, Inc., or its affiliates. All Rights Reserved.
94
Name Class Date
60. Simplify.
48a4 b9
8a5 b3
F 6ab6
G 3a
2b6
H 3b6
2a
J 6b6
a
61. The endpoints of AB are A ( 3, 8) and
B (4, 6). What are the coordinates of
the midpoint of AB?
A (5, 10)
B ( 7, 14)
C (1, 2)
D 12, 1
62. The following scatter plot compares
class absences and final exam scores for
15 students.
Based on these data, which is the best
prediction of the exam score for a
student having 9 class absences?
F 40
G 45
H 60
J 95
63. Solve the following:
2 x x 1 4.
A 2 x 3
B 12 x 3
C 3 x 12
D x 3
64. Simplify the algebraic expression
2x 3y 4(2x y).
F 10x 2y 4
G 6x 7y
H 6x 2y
J 6x y
65. A bag contains tiles with the letters A, A,
F, G, L, L, O, and W. Suppose you draw
two tiles from the bag without looking
and without replacing a tile once it is
selected. What is the probability that you
will choose an A and then a G?
A 38
B 124
C 1128
D 128
5060708090
100110
40
120
0 1 2 3 4 5 6 7 8 9 1011Absences
Final Exam Score vs. Absences
Fin
al E
xam
Sco
re
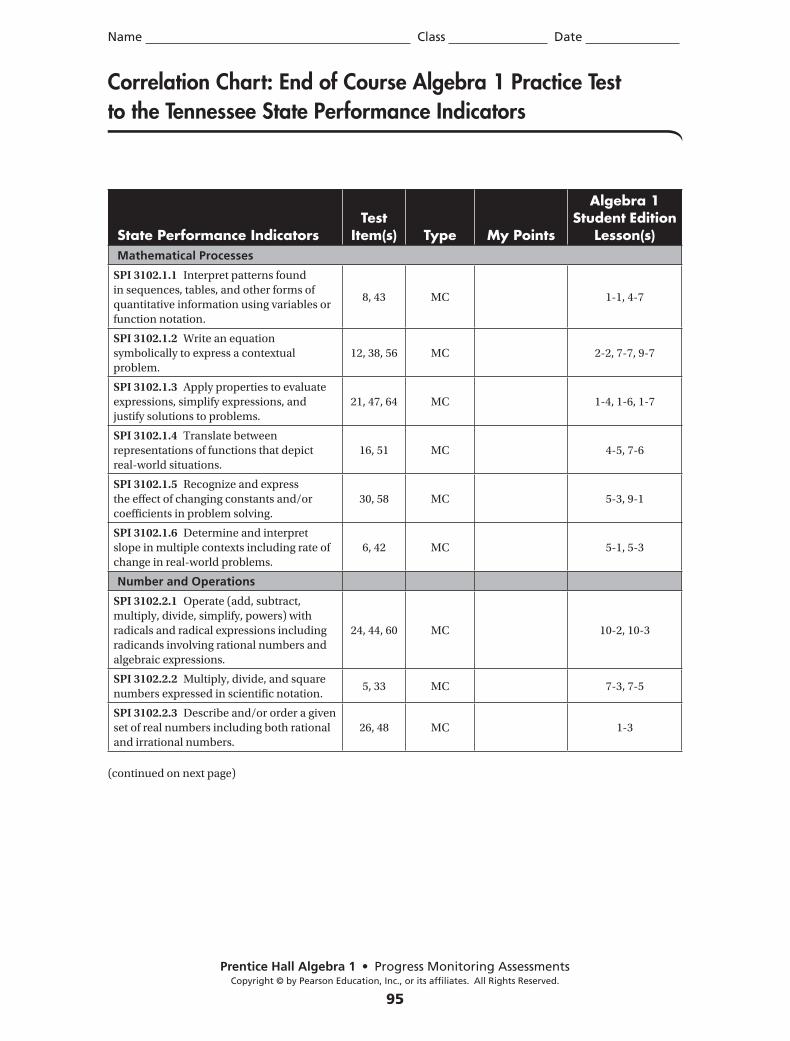
Name Class Date
Progress Monitoring AssessmentsCopyright © by Pearson Education, Inc., or its affiliates. All Rights Reserved.
95
State Performance IndicatorsTest
Item(s) Type My Points
Algebra 1 Student Edition
Lesson(s)Mathematical Processes
SPI 3102.1.1 Interpret patterns found
in sequences, tables, and other forms of
quantitative information using variables or
function notation.
8, 43 MC 1-1, 4-7
SPI 3102.1.2 Write an equation
symbolically to express a contextual
problem.
12, 38, 56 MC 2-2, 7-7, 9-7
SPI 3102.1.3 Apply properties to evaluate
expressions, simplify expressions, and
justify solutions to problems.
21, 47, 64 MC 1-4, 1-6, 1-7
SPI 3102.1.4 Translate between
representations of functions that depict
real-world situations.
16, 51 MC 4-5, 7-6
SPI 3102.1.5 Recognize and express
the effect of changing constants and/or
coefficients in problem solving.
30, 58 MC 5-3, 9-1
SPI 3102.1.6 Determine and interpret
slope in multiple contexts including rate of
change in real-world problems.
6, 42 MC 5-1, 5-3
Number and Operations
SPI 3102.2.1 Operate (add, subtract,
multiply, divide, simplify, powers) with
radicals and radical expressions including
radicands involving rational numbers and
algebraic expressions.
24, 44, 60 MC 10-2, 10-3
SPI 3102.2.2 Multiply, divide, and square
numbers expressed in scientific notation.5, 33 MC 7-3, 7-5
SPI 3102.2.3 Describe and/or order a given
set of real numbers including both rational
and irrational numbers.
26, 48 MC 1-3
(continued on next page)
Correlation Chart: End of Course Algebra 1 Practice Test to the Tennessee State Performance Indicators
Name Class Date
Progress Monitoring AssessmentsCopyright © by Pearson Education, Inc., or its affiliates. All Rights Reserved.
96
State Performance IndicatorsTest
Item(s) Type My Points
Algebra 1 Student Edition
Lesson(s)Algebra
SPI 3102.3.1 Express a generalization of a
pattern in various representations including
algebraic and function notation.
17, 52 MC 4-2, 4-3
SPI 3102.3.2 Operate with polynomials and
simplify results.9, 39 MC 8-1, 8-2
SPI 3102.3.3 Factor polynomials. 3, 18, 50 MC 8-5, 8-6, 8-7
SPI 3102.3.4 Operate with, evaluate, and
simplify rational expressions including
determining restrictions on the domain of
the variables.
23, 41 MC 11-1
SPI 3102.3.5 Write and/or solve linear
equations, inequalities, and compound
inequalities including those containing
absolute value.
1, 29, 63 MC 2-4, 3-6, 3-7
SPI 3102.3.6 Interpret various relations in
multiple representations.25, 27 MC 5-3, 5-5
SPI 3102.3.7 Determine domain and range
of a relation, determine whether a relation
is a function and/or evaluate a function at a
specified rational value.
13, 37, 55 MC 4-6
SPI 3102.3.8 Determine the equation of a
line and/or graph a linear equation.19, 45 MC 5-3, 5-5
SPI 3102.3.9 Solve systems of linear
equation/inequalities in two variables.31, 59 MC 6-1, 6-2
SPI 3102.3.10 Find the solution of a
quadratic equation and/or zeros of a
quadratic function.
22, 46 MC 9-3, 9-4
SPI 3102.3.11 Analyze nonlinear graphs
including quadratic and exponential
functions that model a contextual situation.
7, 53 MC 9-7
Geometry and Measurement
SPI 3102.4.1 Develop and apply strategies
to estimate the area of any shape on a
plane grid.
2, 40 MC TN-3
SPI 3102.4.2 Solve contextual problems
using the Pythagorean Theorem.11, 36 MC 10-1
SPI 3102.4.3 Solve problems involving the
distance between points or midpoint of a
segment.
27, 61 MC Concept Byte, p. 605
SPI 3102.4.4 Convert rates and
measurements.15, 35 MC 2-6
(continued on next page)
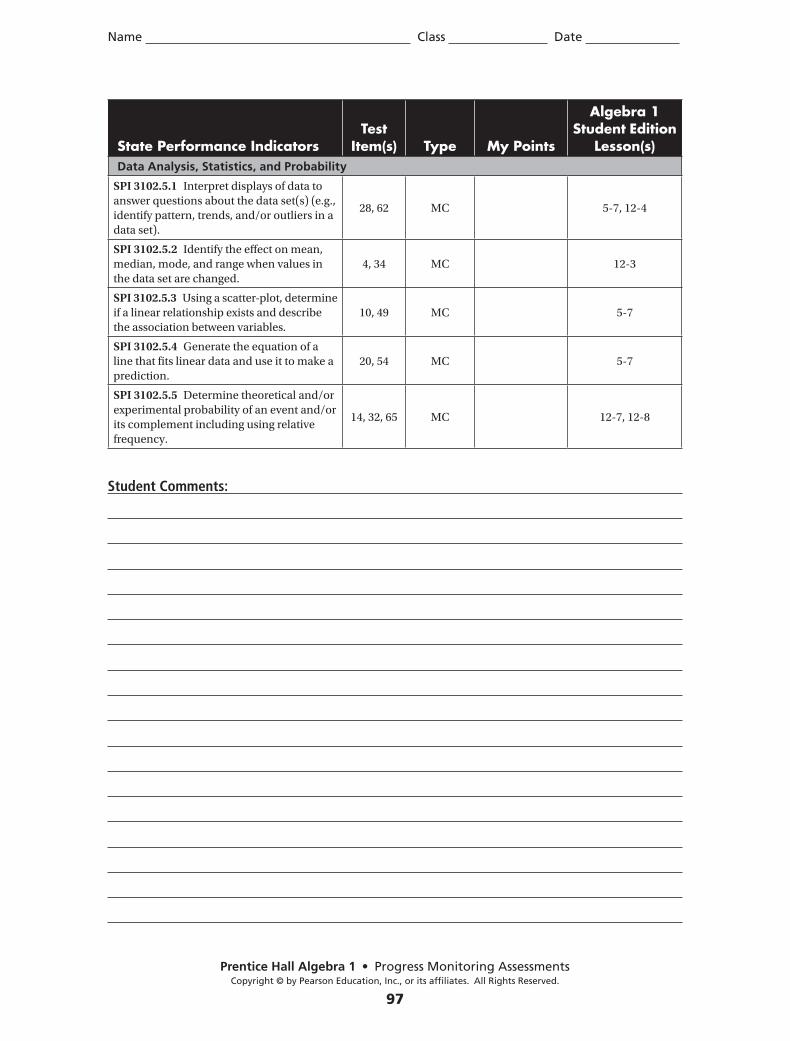
Name Class Date
Progress Monitoring AssessmentsCopyright © by Pearson Education, Inc., or its affiliates. All Rights Reserved.
97
State Performance IndicatorsTest
Item(s) Type My Points
Algebra 1 Student Edition
Lesson(s)Data Analysis, Statistics, and Probability
SPI 3102.5.1 Interpret displays of data to
answer questions about the data set(s) (e.g.,
identify pattern, trends, and/or outliers in a
data set).
28, 62 MC 5-7, 12-4
SPI 3102.5.2 Identify the effect on mean,
median, mode, and range when values in
the data set are changed.
4, 34 MC 12-3
SPI 3102.5.3 Using a scatter-plot, determine
if a linear relationship exists and describe
the association between variables.
10, 49 MC 5-7
SPI 3102.5.4 Generate the equation of a
line that fits linear data and use it to make a
prediction.
20, 54 MC 5-7
SPI 3102.5.5 Determine theoretical and/or
experimental probability of an event and/or
its complement including using relative
frequency.
14, 32, 65 MC 12-7, 12-8
Student Comments:
Name Class Date
Progress Monitoring AssessmentsCopyright © by Pearson Education, Inc., or its affiliates. All Rights Reserved.
98
Parent Comments:
Teacher Comments:
Prentice Hall Algebra 1 • Progress Monitoring AssessmentsCopyright © by Pearson Education, Inc., or its affiliates. All Rights Reserved.
99
Name Class Date
SAT/ACT: Introduction
Each year, as a key step in their advancement toward college, more than two million
high school students take the SAT Reasoning Test (SAT*)1 and the American College
Test (ACT).2 Many also take the more modest counterparts of these tests, the
Preliminary SAT Reasoning Test (PSAT/NMSQT)1 and the Preliminary American
College Test, now known as PLAN.2
Experts disagree as to how well the SAT and the ACT predict college performance.
However fair or unfair it may be, most colleges base their decisions on whether or not
to accept a student, at least to some degree, on the student’s SAT or ACT score.
(PSAT/NMSQT scores are used to qualify students for National Merit Scholarships.
Most students take the PSAT/NMSQT and PLAN, however, as practice for the SAT and
ACT.) In general, the larger the college, the more importance it places on SAT or ACT
test scores in assessing its applicants. Also, the more demanding a college’s academic
standards, the higher the test scores it expects of its applicants.
Whichever colleges you apply to, your high school transcript and activities, your
college application form and supporting materials, and often letters of
recommendation and personal interviews will have the greatest infl uence on whether
you are accepted. Still, it’s to your advantage to achieve the highest score that you can
on the SAT or ACT. Th is section was designed in three parts to help you meet that goal
on the math portions of the two tests.
Th e fi rst part will tell you what you need to know about the two tests so that you won’t
be surprised when you sit down on test day and open your booklet. Th e second part
will provide you with a host of test-taking tips. Th e third part is an SAT/ACT Practice
Test you can take to apply what you’ve learned. If you feel you need more work with
specifi c math content, you can turn to your textbook for a more comprehensive
discussion of the relevant mathematics or for extra practice.
In the weeks leading up to whichever test you plan to take, you should spend a set
amount of time each day preparing for it. Review key math topics, familiarize yourself
with the test formats, and practice the test-taking skills described in this book. Of
course, there’s no telling how much your preparations will improve your score. Given
the importance of the results, however, you have nothing to lose in preparing yourself
fully for the test, and a great deal to gain.
1 SAT is a registered trademark of, and the PSAT is a trademark owned by the College Board, which was not involved in the production of, and does not endorse, this product.
2 ACT Assessment and the PLAN are registered trademarks owned by ACT, Inc., which was not involved in the production of, and does not endorse, this product.
PHS4674_NAA1_SATACT.indd 99 6/27/09 1:59:38 PM
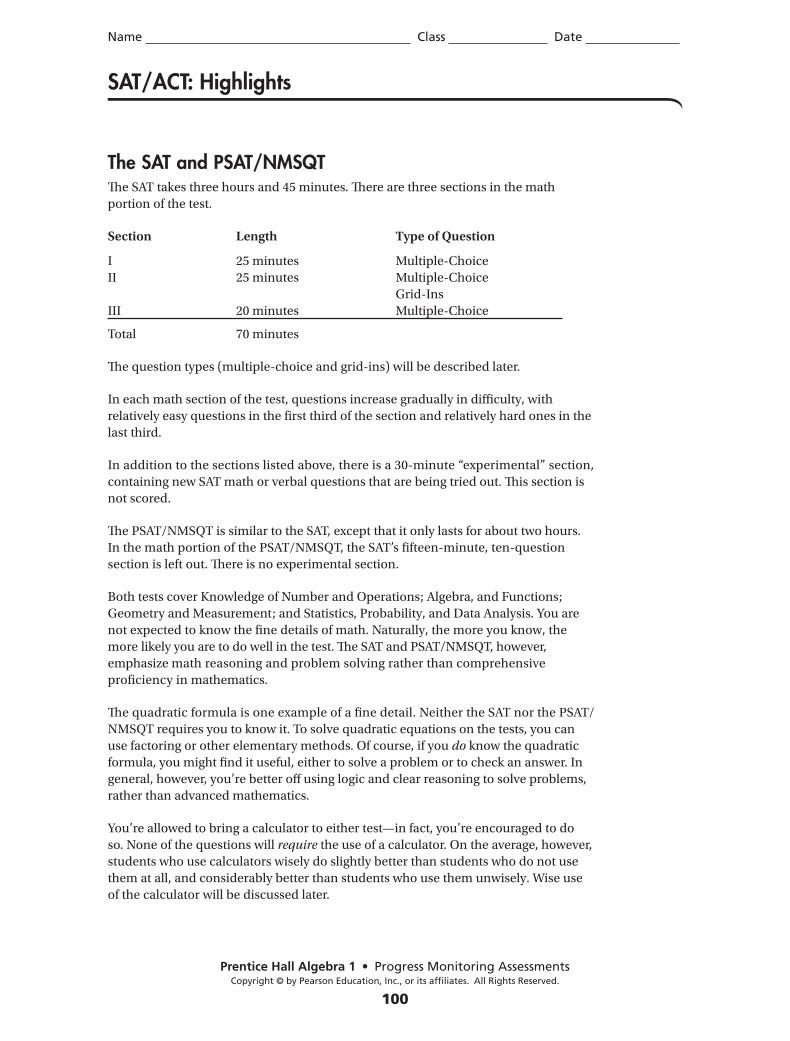
Prentice Hall Algebra 1 • Progress Monitoring AssessmentsCopyright © by Pearson Education, Inc., or its affiliates. All Rights Reserved.
100
Name Class Date
SAT/ACT: Highlights
The SAT and PSAT/NMSQTTh e SAT takes three hours and 45 minutes. Th ere are three sections in the math
portion of the test.
Section Length Type of Question
I 25 minutes Multiple-Choice
II 25 minutes Multiple-Choice
Grid-Ins
III 20 minutes Multiple-Choice
Total 70 minutes
Th e question types (multiple-choice and grid-ins) will be described later.
In each math section of the test, questions increase gradually in diffi culty, with
relatively easy questions in the fi rst third of the section and relatively hard ones in the
last third.
In addition to the sections listed above, there is a 30-minute “experimental” section,
containing new SAT math or verbal questions that are being tried out. Th is section is
not scored.
Th e PSAT/NMSQT is similar to the SAT, except that it only lasts for about two hours.
In the math portion of the PSAT/NMSQT, the SAT’s fi fteen-minute, ten-question
section is left out. Th ere is no experimental section.
Both tests cover Knowledge of Number and Operations; Algebra, and Functions;
Geometry and Measurement; and Statistics, Probability, and Data Analysis. You are
not expected to know the fi ne details of math. Naturally, the more you know, the
more likely you are to do well in the test. Th e SAT and PSAT/NMSQT, however,
emphasize math reasoning and problem solving rather than comprehensive
profi ciency in mathematics.
Th e quadratic formula is one example of a fi ne detail. Neither the SAT nor the PSAT/
NMSQT requires you to know it. To solve quadratic equations on the tests, you can
use factoring or other elementary methods. Of course, if you do know the quadratic
formula, you might fi nd it useful, either to solve a problem or to check an answer. In
general, however, you’re better off using logic and clear reasoning to solve problems,
rather than advanced mathematics.
You’re allowed to bring a calculator to either test—in fact, you’re encouraged to do
so. None of the questions will require the use of a calculator. On the average, however,
students who use calculators wisely do slightly better than students who do not use
them at all, and considerably better than students who use them unwisely. Wise use
of the calculator will be discussed later.
PHS4674_NAA1_SATACT.indd 100 6/27/09 1:59:39 PM
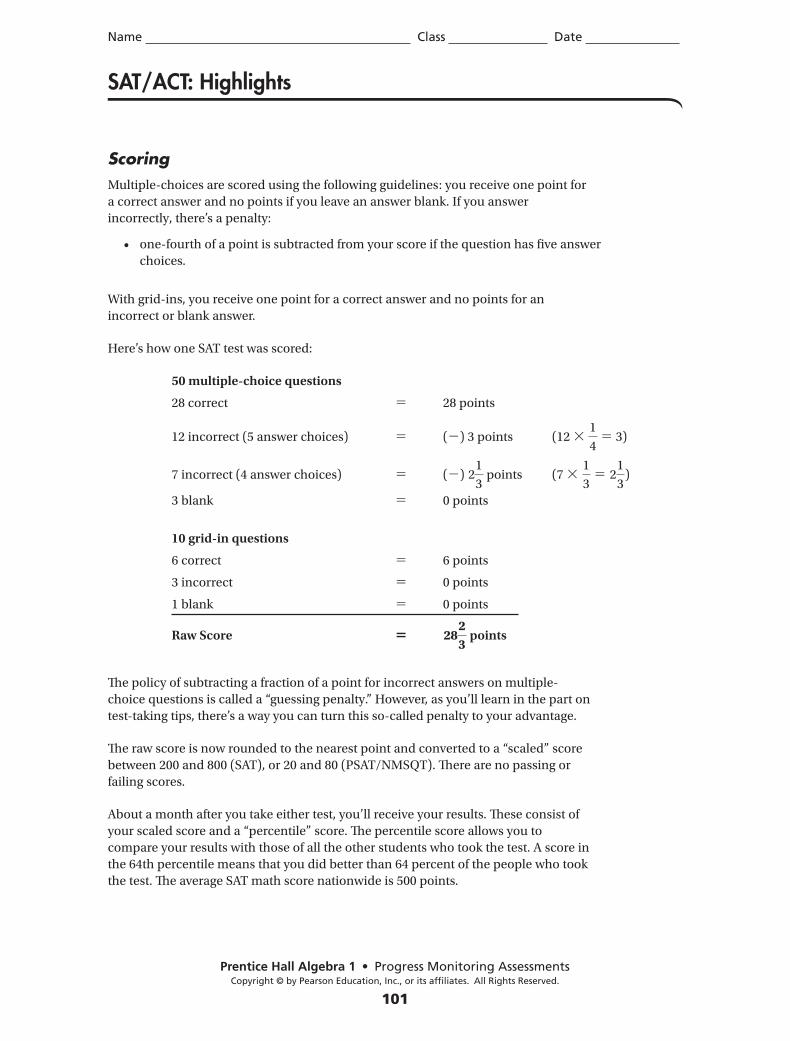
Prentice Hall Algebra 1 • Progress Monitoring AssessmentsCopyright © by Pearson Education, Inc., or its affiliates. All Rights Reserved.
101
Name Class Date
SAT/ACT: Highlights
ScoringMultiple-choices are scored using the following guidelines: you receive one point for
a correct answer and no points if you leave an answer blank. If you answer
incorrectly, there’s a penalty:
• one-fourth of a point is subtracted from your score if the question has fi ve answer
choices.
With grid-ins, you receive one point for a correct answer and no points for an
incorrect or blank answer.
Here’s how one SAT test was scored:
50 multiple-choice questions
28 correct 5 28 points
12 incorrect (5 answer choices) 5 (2) 3 points ( 12 3 1
4 5 3)
7 incorrect (4 answer choices) 5 (2) 21
3 points (7 3
1
3 5 2
1
3)
3 blank 5 0 points
10 grid-in questions
6 correct 5 6 points
3 incorrect 5 0 points
1 blank 5 0 points
Raw Score 5 2823
points
Th e policy of subtracting a fraction of a point for incorrect answers on multiple-
choice questions is called a “guessing penalty.” However, as you’ll learn in the part on
test-taking tips, there’s a way you can turn this so-called penalty to your advantage.
Th e raw score is now rounded to the nearest point and converted to a “scaled” score
between 200 and 800 (SAT), or 20 and 80 (PSAT/NMSQT). Th ere are no passing or
failing scores.
About a month after you take either test, you’ll receive your results. Th ese consist of
your scaled score and a “percentile” score. Th e percentile score allows you to
compare your results with those of all the other students who took the test. A score in
the 64th percentile means that you did better than 64 percent of the people who took
the test. Th e average SAT math score nationwide is 500 points.
PHS4674_NAA1_SATACT.indd 101 6/27/09 1:59:39 PM
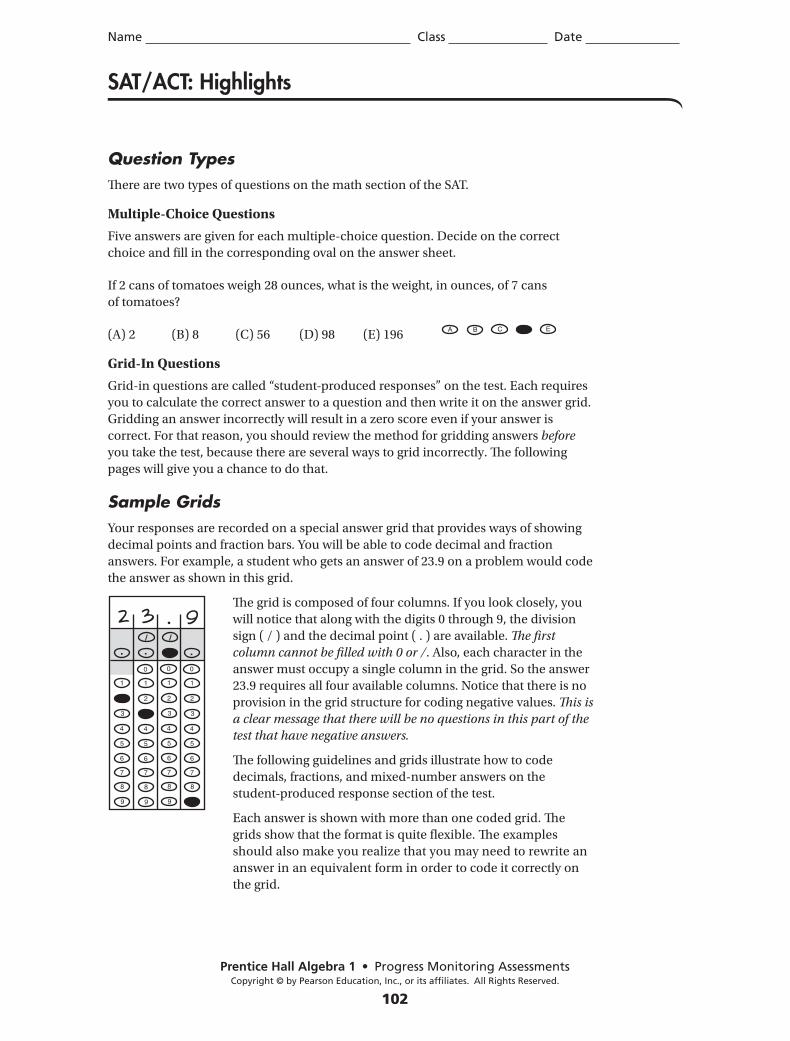
Prentice Hall Algebra 1 • Progress Monitoring AssessmentsCopyright © by Pearson Education, Inc., or its affiliates. All Rights Reserved.
102
Name Class Date
SAT/ACT: Highlights
Question TypesTh ere are two types of questions on the math section of the SAT.
Multiple-Choice Questions
Five answers are given for each multiple-choice question. Decide on the correct
choice and fi ll in the corresponding oval on the answer sheet.
If 2 cans of tomatoes weigh 28 ounces, what is the weight, in ounces, of 7 cans
of tomatoes?
(A) 2 (B) 8 (C) 56 (D) 98 (E) 196 A B C D E
Grid-In Questions
Grid-in questions are called “student-produced responses” on the test. Each requires
you to calculate the correct answer to a question and then write it on the answer grid.
Gridding an answer incorrectly will result in a zero score even if your answer is
correct. For that reason, you should review the method for gridding answers before
you take the test, because there are several ways to grid incorrectly. Th e following
pages will give you a chance to do that.
Sample GridsYour responses are recorded on a special answer grid that provides ways of showing
decimal points and fraction bars. You will be able to code decimal and fraction
answers. For example, a student who gets an answer of 23.9 on a problem would code
the answer as shown in this grid.
1
3
2
4
5
6
7
8
9
1
3
2
4
5
6
7
8
9
1
3
2
4
5
6
7
8
9
1
3
2
4
5
6
7
8
9
0 0 0
. . . ./ /
2 3 . 9Th e grid is composed of four columns. If you look closely, you
will notice that along with the digits 0 through 9, the division
sign ( / ) and the decimal point ( . ) are available. Th e fi rst
column cannot be fi lled with 0 or /. Also, each character in the
answer must occupy a single column in the grid. So the answer
23.9 requires all four available columns. Notice that there is no
provision in the grid structure for coding negative values. Th is is
a clear message that there will be no questions in this part of the
test that have negative answers.
Th e following guidelines and grids illustrate how to code
decimals, fractions, and mixed-number answers on the
student-produced response section of the test.
Each answer is shown with more than one coded grid. Th e
grids show that the format is quite fl exible. Th e examples
should also make you realize that you may need to rewrite an
answer in an equivalent form in order to code it correctly on
the grid.
PHS4674_NAA1_SATACT.indd 102 6/27/09 1:59:39 PM
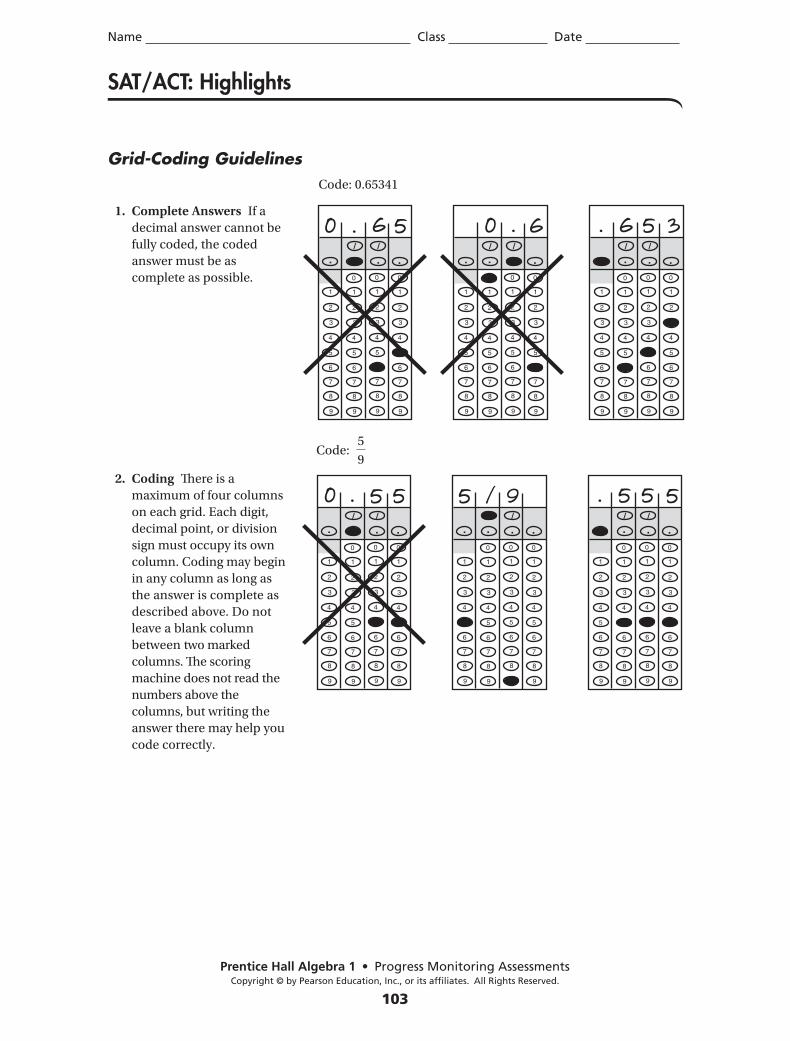
Prentice Hall Algebra 1 • Progress Monitoring AssessmentsCopyright © by Pearson Education, Inc., or its affiliates. All Rights Reserved.
103
Name Class Date
SAT/ACT: Highlights
1
3
2
4
5
6
7
8
9
1
3
2
4
5
6
7
8
9
1
3
2
4
5
6
7
8
9
1
3
2
4
5
6
7
8
9
0 0 0
. . . ./ /
1
3
2
4
5
6
7
8
9
1
3
2
4
5
6
7
8
9
1
3
2
4
5
6
7
8
9
1
3
2
4
5
6
7
8
9
0 0 0
. . . ./ /
. 6 . 60 0
1
3
2
4
5
6
7
8
9
1
3
2
4
5
6
7
8
9
1
3
2
4
5
6
7
8
9
1
3
2
4
5
6
7
8
9
0 0 0
. . . ./ /
. 36 55
Grid-Coding GuidelinesCode: 0.65341
Code: 5
9
1
3
2
4
5
6
7
8
9
1
3
2
4
5
6
7
8
9
1
3
2
4
5
6
7
8
9
1
3
2
4
5
6
7
8
9
0 0 0
. . . ./ /
. 55 5
1
3
2
4
5
6
7
8
9
1
3
2
4
5
6
7
8
9
1
3
2
4
5
6
7
8
9
1
3
2
4
5
6
7
8
9
0 0 0
. . . ./ /
. 50 5
1
3
2
4
5
6
7
8
9
1
3
2
4
5
6
7
8
9
1
3
2
4
5
6
7
8
9
1
3
2
4
5
6
7
8
9
0 0 0
. . . ./ /
95 / 2. Coding Th ere is a
maximum of four columns
on each grid. Each digit,
decimal point, or division
sign must occupy its own
column. Coding may begin
in any column as long as
the answer is complete as
described above. Do not
leave a blank column
between two marked
columns. Th e scoring
machine does not read the
numbers above the
columns, but writing the
answer there may help you
code correctly.
1. Complete Answers If a
decimal answer cannot be
fully coded, the coded
answer must be as
complete as possible.
PHS4674_NAA1_SATACT.indd 103 6/27/09 1:59:39 PM
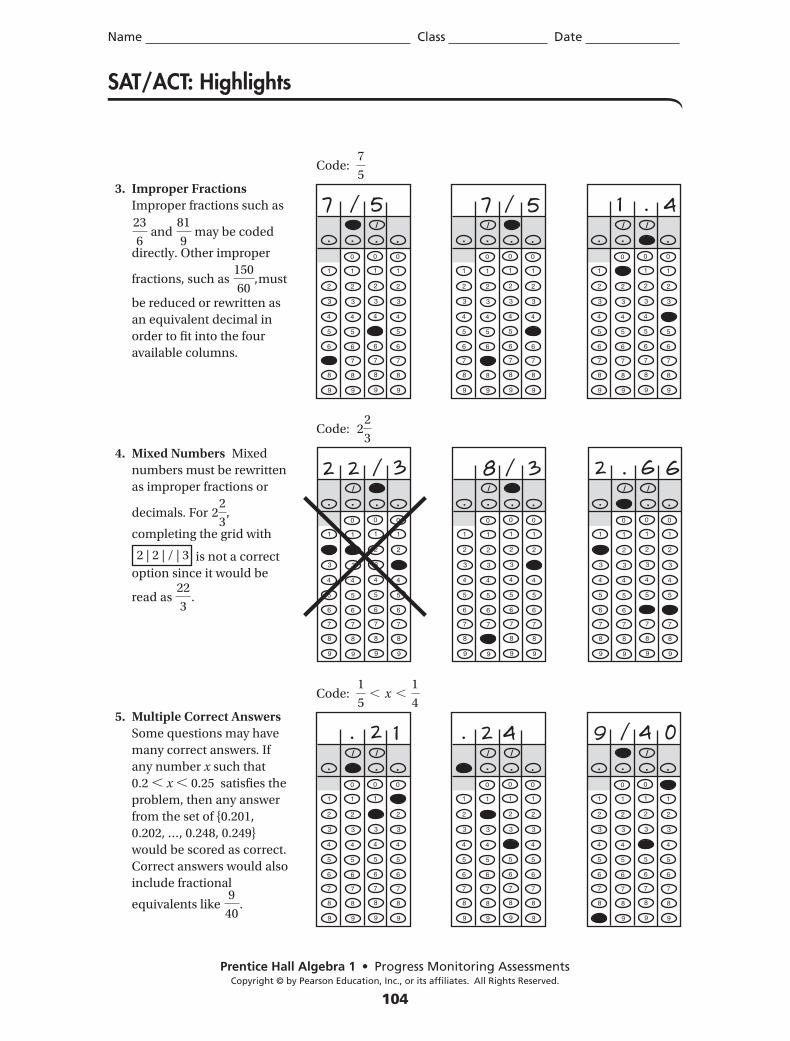
Prentice Hall Algebra 1 • Progress Monitoring AssessmentsCopyright © by Pearson Education, Inc., or its affiliates. All Rights Reserved.
104
Name Class Date
SAT/ACT: Highlights
Code: 7
5
Code: 22
3
1
3
2
4
5
6
7
8
9
1
3
2
4
5
6
7
8
9
1
3
2
4
5
6
7
8
9
1
3
2
4
5
6
7
8
9
0 0 0
. . . ./ /
1
3
2
4
5
6
7
8
9
1
3
2
4
5
6
7
8
9
1
3
2
4
5
6
7
8
9
1
3
2
4
5
6
7
8
9
0 0 0
. . . ./ /
5 57
1
3
2
4
5
6
7
8
9
1
3
2
4
5
6
7
8
9
1
3
2
4
5
6
7
8
9
1
3
2
4
5
6
7
8
9
0 0 0
. . . ./ /
. 41/ /7
1
3
2
4
5
6
7
8
9
1
3
2
4
5
6
7
8
9
1
3
2
4
5
6
7
8
9
1
3
2
4
5
6
7
8
9
0 0 0
. . . ./ /
1
3
2
4
5
6
7
8
9
1
3
2
4
5
6
7
8
9
1
3
2
4
5
6
7
8
9
1
3
2
4
5
6
7
8
9
0 0 0
. . . ./ /
3 32 2 8
1
3
2
4
5
6
7
8
9
1
3
2
4
5
6
7
8
9
1
3
2
4
5
6
7
8
9
1
3
2
4
5
6
7
8
9
0 0 0
. . . ./ /
. 62 6/ /
3. Improper Fractions
Improper fractions such as
23
6 and
81
9 may be coded
directly. Other improper
fractions, such as 150
60,must
be reduced or rewritten as
an equivalent decimal in
order to fi t into the four
available columns.
4. Mixed Numbers Mixed
numbers must be rewritten
as improper fractions or
decimals. For 22
3,
completing the grid with
2 | 2 | / | 3 is not a correct
option since it would be
read as 22
3.
Code: 1
5, x ,
1
4
1
3
2
4
5
6
7
8
9
1
3
2
4
5
6
7
8
9
1
3
2
4
5
6
7
8
9
1
3
2
4
5
6
7
8
9
0 0 0
. . . ./ /
1
3
2
4
5
6
7
8
9
1
3
2
4
5
6
7
8
9
1
3
2
4
5
6
7
8
9
1
3
2
4
5
6
7
8
9
0 0 0
. . . ./ /
2 .. 41
1
3
2
4
5
6
7
8
9
1
3
2
4
5
6
7
8
9
1
3
2
4
5
6
7
8
9
1
3
2
4
5
6
7
8
9
0 0 0
. . . ./ /
09 42 / 5. Multiple Correct Answers
Some questions may have
many correct answers. If
any number x such that
0.2 , x , 0.25 satisfi es the
problem, then any answer
from the set of {0.201,
0.202, …, 0.248, 0.249}
would be scored as correct.
Correct answers would also
include fractional
equivalents like 9
40.
PHS4674_NAA1_SATACT.indd 104 6/27/09 1:59:40 PM
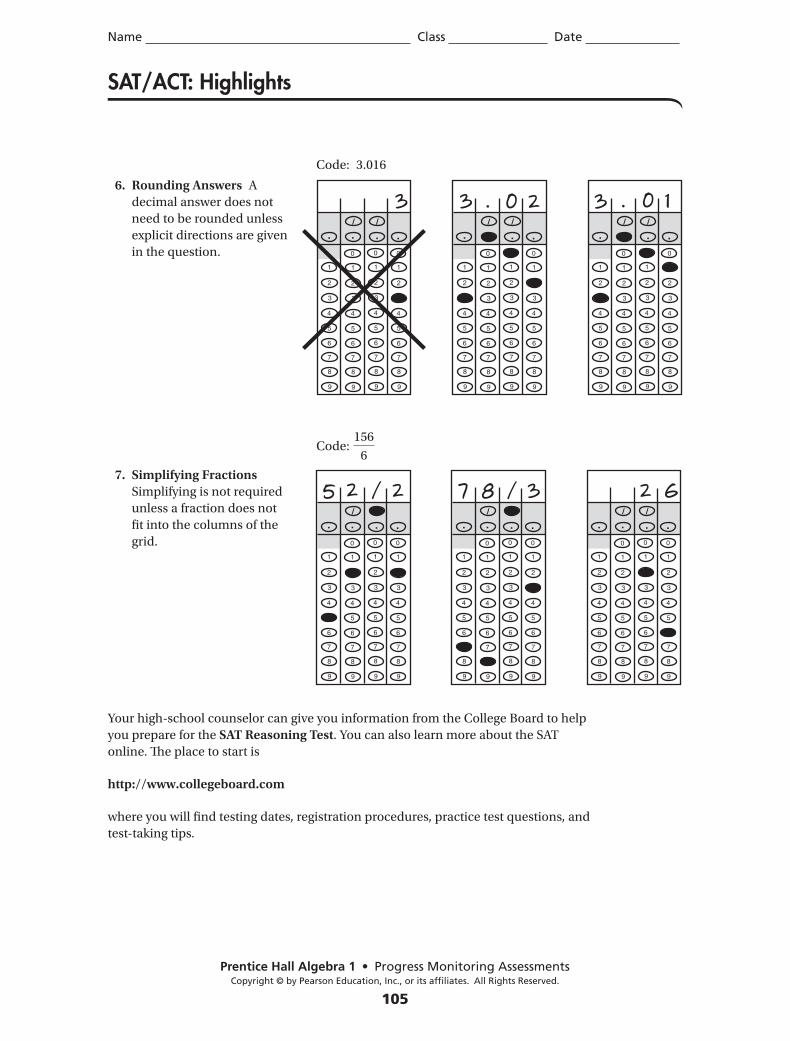
Prentice Hall Algebra 1 • Progress Monitoring AssessmentsCopyright © by Pearson Education, Inc., or its affiliates. All Rights Reserved.
105
Name Class Date
SAT/ACT: Highlights
Code: 3.016
1
3
2
4
5
6
7
8
9
1
3
2
4
5
6
7
8
9
1
3
2
4
5
6
7
8
9
1
3
2
4
5
6
7
8
9
0 0 0
. . . ./ /
. 23
1
3
2
4
5
6
7
8
9
1
3
2
4
5
6
7
8
9
1
3
2
4
5
6
7
8
9
1
3
2
4
5
6
7
8
9
0 0 0
. . . ./ /
3 0
1
3
2
4
5
6
7
8
9
1
3
2
4
5
6
7
8
9
1
3
2
4
5
6
7
8
9
1
3
2
4
5
6
7
8
9
0 0 0
. . . ./ /
03 1. 6. Rounding Answers A
decimal answer does not
need to be rounded unless
explicit directions are given
in the question.
Code: 156
6
1
3
2
4
5
6
7
8
9
1
3
2
4
5
6
7
8
9
1
3
2
4
5
6
7
8
9
1
3
2
4
5
6
7
8
9
0 0 0
. . . ./ /
1
3
2
4
5
6
7
8
9
1
3
2
4
5
6
7
8
9
1
3
2
4
5
6
7
8
9
1
3
2
4
5
6
7
8
9
0 0 0
. . . ./ /
2 35 7
1
3
2
4
5
6
7
8
9
1
3
2
4
5
6
7
8
9
1
3
2
4
5
6
7
8
9
1
3
2
4
5
6
7
8
9
0 0 0
. . . ./ /
62/ 82 / 7. Simplifying Fractions
Simplifying is not required
unless a fraction does not
fi t into the columns of the
grid.
Your high-school counselor can give you information from the College Board to help
you prepare for the SAT Reasoning Test. You can also learn more about the SAT
online. Th e place to start is
http://www.collegeboard.com
where you will fi nd testing dates, registration procedures, practice test questions, and
test-taking tips.
PHS4674_NAA1_SATACT.indd 105 6/27/09 1:59:41 PM
Prentice Hall Algebra 1 • Progress Monitoring AssessmentsCopyright © by Pearson Education, Inc., or its affiliates. All Rights Reserved.
106
Name Class Date
The ACT and PLANTh e ACT takes three and one-half hours. Th e math section of the test lasts one hour
and consists of 60 multiple-choice questions. Questions are arranged roughly in order
of diffi culty, from easiest to hardest. As with the SAT, you may use a calculator on
the ACT.
ScoringUnlike the SAT, the ACT is not scored by deducting a fraction of your incorrect
answers from your correct ones. You get one point for a correct answer and no points
for either an incorrect answer or an answer left blank. Th ere is no penalty for
guessing.
Here’s how one ACT test was scored:
60 multiple-choice questions
38 correct 5 38 points
22 incorrect 5 0 points
Raw Score 5 38 points
Th e content of ACT test questions is invariable. Th ere are always
• 24 questions on pre-algebra and elementary algebra;
• 18 questions on intermediate algebra and coordinate geometry;
• 14 questions on geometry;
• 4 questions on basic trigonometry.
Th e PLAN is a mini-ACT. Th e math section of the test lasts 40 minutes and consists of
40 multiple-choice questions, apportioned as follows:
• 14 questions on pre-algebra;
• 8 questions on elementary algebra;
• 7 questions on coordinate geometry;
• 11 questions on plane geometry.
As on the ACT, you can use a calculator when you take the PLAN.
Getting Your ResultsYou’ll receive your ACT results in four to six weeks. Your math score (and your score
in each of the other three areas of the test) will be a number from 1 to 36; 36 will be
the highest possible score. (Th e PLAN is scored from 1 to 32.) As with the SAT, you’ll
also receive a percentile ranking so that you can compare your results with those of
other students who took the test.
SAT/ACT: Highlights
PHS4674_NAA1_SATACT.indd 106 6/27/09 1:59:41 PM
Prentice Hall Algebra 1 • Progress Monitoring AssessmentsCopyright © by Pearson Education, Inc., or its affiliates. All Rights Reserved.
107
Name Class Date
SAT/ACT: Highlights
When to Take the ACTTh e ACT is given several times each year. If possible, arrange to take the test on a day
when “Test Information Release” is in eff ect. Following the test, for a small fee, you
can receive a copy of the test that you took and a photocopy of your answer sheet.
Having survived the test somehow, you may fi nd the suggestion that you revisit it
through a copy of your very own answer sheet rather humorous. Nevertheless, there
are distinct advantages to doing so. You can check to make sure the scoring machine
didn’t make any errors. More important, you can check your work to discover areas
where you were strong and other areas where you need to “bone up” on the subject
matter covered by the test. Such knowledge will be useful to you generally, and even
more so if you decide to take the test again.
If you do take the ACT several times, you’ll be allowed to decide which of your scores
should be reported to colleges.
Your high-school counselor can also give you information from the American College
Testing Program to help you prepare for the ACT Assessment. You can also learn
more about the ACT online. Th e place to start is
http://www.act.org
where you will fi nd testing dates, registration procedures, practice test questions, and
test-taking tips.
PHS4674_NAA1_SATACT.indd 107 6/27/09 1:59:41 PM
Prentice Hall Algebra 1 • Progress Monitoring AssessmentsCopyright © by Pearson Education, Inc., or its affiliates. All Rights Reserved.
108
Name Class Date
SAT/ACT: Test-Taking Tips
Preparing for the TestLong-term planning for both the SAT and the ACT should include the following:
Work hard in math class.No amount of last-minute cramming can substitute for serious study in your current
math class. Students who do well in their math classes generally do well on the math
portion of the SAT and the ACT.
Look for ways to apply math in your daily life.Problems requiring students to interpret everyday data, calculate real-world
probabilities, and otherwise apply mathematics to realistic problem situations are
becoming more and more common on the SAT and ACT. At the same time, old-style
“story problems” involving age and distance are becoming rare.
Th e best way to learn to solve real-world problems is to begin to see math as a
component of your everyday life, rather than as an irrelevant subject whose principles
you must tediously memorize. Math comes alive and begins to make sense when you see
it in newspapers and on billboards, when you hear it discussed at meetings and fi nd it in
the activities you do each day. Cultivate the practice of discovering math in your
everyday life.
Short-term planning for both the SAT and the ACT should include the following:
Begin a disciplined math-review program.Gather review materials such as SAT and ACT review books you can fi nd in the public
or school library, and offi cial publications of the SAT and ACT boards. Set aside a
specifi c amount of time each day for review. Make notes about questions that arise as
you review, so you can ask your math teacher about them the next day.
Begin your review program four to eight weeks before you plan to take the test and
continue right up to the day before the test. Th en give yourself a break. Last-minute
cramming the night before the test will probably not improve your test score, but it
will almost certainly frazzle you. Congratulate yourself for your hard work, enjoy an
evening away from your review program with your family or friends, and then get a
good night’s sleep.
Practice, practice, practice.As you review, don’t be satisfi ed with simply reading review materials and
memorizing methods or procedures for solving problems. Prepare for the test by
repeatedly practicing everything you’ll experience on test day.
• Practice solving SAT- or ACT-type problems again and again and again.
• If you’re taking the SAT, practice solving problems written in each question
format—multiple-choice and student-produced response. Spend extra time
practicing the gridding of student-produced responses, which present so many
ways to go wrong.
PHS4674_NAA1_SATACT.indd 108 6/27/09 1:59:41 PM
Prentice Hall Algebra 1 • Progress Monitoring AssessmentsCopyright © by Pearson Education, Inc., or its affiliates. All Rights Reserved.
109
Name Class Date
SAT/ACT: Test-Taking Tips
• Practice reading directions.
• Practice fi lling in answer sheets.
• Practice working under test conditions by setting an alarm clock and giving
yourself set amounts of time to answer specifi c numbers of questions. For
example, to model the multiple choice portion of the math SAT test you could
give yourself 25 minutes to answer 20 multiple-choice items. To model the
math portion of the ACT test, you could give yourself 30 minutes to answer
30 multiple-choice items.
• Practice relaxing and not becoming rattled when you can’t answer a question or
several questions in a row.
• Practice using your calculator to solve problems.
• Practice making decisions as to whether or not you will use your calculator to
solve a problem.
• Practice making decisions as to whether or not you will guess answers to
questions that stump you.
Th e more you practice at home what you’ll actually be doing at the test site, the more
the test itself will seem familiar and nonthreatening, allowing you to obtain your best
possible score.
Be ready to go on the morning of the test.Collect the following materials before test day, and put them in a place where you’ll
know where to fi nd them:
• #2 pencils
• Your ID. Th is must include your photo or a brief description of you. A description
must be written on school stationery or on a school ID form. You must sign it in
front of your principal or guidance counselor, who must also sign it.
• Your admission ticket
• Your calculator, with fresh batteries
• A watch
• A healthy snack
Be sure you’ve scoped out ahead of time exactly how to get to the test site and how
long it will take you to get there. If you rush in at the last second, you won’t be relaxed
and focused on taking the test. And if you rush in after the last second, you won’t be
allowed to take the test.
PHS4674_NAA1_SATACT.indd 109 6/27/09 1:59:41 PM
Prentice Hall Algebra 1 • Progress Monitoring AssessmentsCopyright © by Pearson Education, Inc., or its affiliates. All Rights Reserved.
110
Name Class Date
SAT/ACT: Test-Taking Tips
Taking the TestTh e following are time-honored test-taking strategies.
Manage Your Time Effi ciently.Th e questions in each section of the test are arranged roughly in order of diffi culty. As
you begin, make a quick estimate of the average amount of time you have to answer
each question. Use the estimate to guide you through the section. Allow yourself a
little less than the average amount of time for the early, easier fi rst questions so that
you’ll have extra time for the harder ones later on.
Starting with the fi rst question, move as quickly as you can through the section.
Consider each question in turn. Make a quick assessment as to whether you can solve
it rapidly. If you think you can, do so. Work at a comfortable pace, but don’t linger.
Spending too much time on a problem in the fanciful belief that you’ve almost got it
is a killer. Remember: all problems are worth the same number of points. You receive
one point for each easy question that you answer correctly and one point for each
hard one. How should you spend your time?
If you decide that you can probably solve a problem with a little more time, draw a
circle around it. After you’ve made your fi rst pass through all the questions, answering
those that seem easy, return to the questions you’ve circled. Th is second look is often
successful, so don’t get discouraged if you fi nd yourself circling lots of questions.
Continue to pace yourself during the second pass. Work your way through the
questions you think you have a chance on, but don’t be reluctant to abandon them
again and move on if they continue to tie you up. After the second pass, return to the
questions that continue to stump you if time remains.
If you’re sure that you won’t be able to solve a problem, draw an X beside it and forget
it. Th rowing in the towel on questions you can’t answer is simply good time
management and nothing to apologize for. No one is expected to answer every
question correctly and few people do.
Be careful.Beware of the following:
• Under the pressure of test-taking, it’s easy to make careless mistakes. Work through
calculations methodically, rechecking them quickly at the end. Ask yourself if
answers are reasonable. Is the price after a discount greater than the original price?
Does one of the acute angles in a right triangle measure 150°? Use estimation
whenever possible. On multiple-choice questions, an estimate may be enough to
help you decide which of the given answers is correct without actually working it out.
• On multiple-choice questions, watch out for “obvious” choices. In the fi rst part of
a section, where the questions are relatively easy, an answer that seems obvious
may be the right one. But in the last part, the obvious answer may have been put
there to deceive you. After all, if an answer is obvious, what’s the question doing
in the hard part of the test?
PHS4674_NAA1_SATACT.indd 110 6/27/09 1:59:41 PM
Prentice Hall Algebra 1 • Progress Monitoring AssessmentsCopyright © by Pearson Education, Inc., or its affiliates. All Rights Reserved.
111
Name Class Date
SAT/ACT: Test-Taking Tips
• Check and double-check to make sure that you’re writing your answers in the
correct spots, and beside the correct numbers. To guard against potential
disasters, many students write all their answers in their test booklets only,
transferring them all at once to their answer sheets in the fi nal minute or two.
• Beware of long computations. SAT and ACT problems can usually be solved with
minimal calculations. If you fi nd yourself in the midst of a multi-step nightmare,
it’s best to stop and look for a shortcut—or move on to the next question.
• If you’re told that a fi gure is not drawn to scale, believe it. Don’t assume that
lengths and angles are drawn accurately.
• Measurements may be given in diff erent units. If they are, convert and work the
problem in one unit.
Be smart.Use these ideas to simplify your work and improve your score.
• Write in your test booklet. Th ere’s no reward for a clean booklet and no penalty
for one that’s covered with pencil marks. If a question doesn’t have a drawing and
one would help, draw it. Write measurements and values on the drawing. When
you calculate an answer, write out your calculations so that you can check them
later. Th e next time, try doing them a diff erent way. Th is is a good way to check
your work and often reveals careless mistakes.
• On multiple-choice questions, draw a line through choices you know to be
wrong. Th is will simplify the job of choosing the right answer.
• Look at the answer choices before working a problem. Th is will show you the
form of the answer that is required (a fraction, for example), allowing you to work
the problem in that form from the beginning rather than having to rewrite your
answer later in a diff erent form.
• Under “Reference Information,” the SAT booklet provides a considerable amount
of information on geometrical relationships. Use it.
• Know commonly used numbers. Recognize powers of 2, 3, and 5. Know the decimal
equivalents for simple fractions with denominators of 2, 3, 4, 5, 6, 8, and 10. Know
the common Pythagorean triples 3-4-5 and 5-12-13 and recognize their multiples.
Use your calculator wisely.Every test question can be answered without a calculator, so you don’t have to bring
one. Bring one anyway. Make it one you’re familiar with and comfortable using. It can
be a scientifi c or graphing calculator, but many students fi nd that a simple four-
function model with a square-root key works best. Th at’s because the kinds of
calculations you’ll be using it for (see next page) are easier to perform on a simple
calculator than they are on a complex one. (You won’t be asked to fi nd log 453.779 or
arcsin 0.8812 on the SAT or ACT). Equally important, the keys on a simple calculator
PHS4674_NAA1_SATACT.indd 111 6/27/09 1:59:42 PM
Prentice Hall Algebra 1 • Progress Monitoring AssessmentsCopyright © by Pearson Education, Inc., or its affiliates. All Rights Reserved.
112
Name Class Date
SAT/ACT: Test-Taking Tips
are easier to hit than the keys on a scientifi c or graphing calculator, so you are less likely
to make a careless mistake.
Resist the temptation to use your calculator, or to try to use it, to solve every problem.
Most of the problems on the SAT and the ACT can be solved far more easily without a
calculator than with it. Both tests are designed to test your knowledge of mathematics
and your ability to solve problems, not to fi nd out whether you know how to punch the
keys on a calculator. So, in most cases, you’ll save time and improve your chances of
scoring points by turning to your calculator only for the specifi c purposes listed below,
or to check your work, or when you can see no other approach.
Example
Find the product: 1
23
2
33
3
43
4
53
5
63
6
73
7
83
8
9
(A) 0.1 (B) 1
9 (C) 0.11111111 (D)
1
90 (E) Not given
To solve the problem, you could use your calculator:
1 3 2 3 3 3 4 3 5 3 6 3 7 3 8
2 3 3 3 4 3 5 3 6 3 7 3 8 3 9 5
40,320
362,880 5 0.11111111 (to 8 places).
Although (C) looks right, it and your solution are rounded versions of the correct
answer. To fi nd the correct answer, you must now use your calculator again to rewrite
the fraction choices 1
9 and
1
90 as decimals. Doing so will confi rm that the correct
answer is (B) 1
9 .
Th e wise test-taker will look for a more effi cient solution before plunging into a messy
calculation like the above. Here, the product 1
23
2
33
3
43
4
53
5
63
6
73
7
83
8
9
can be quickly simplifi ed by noticing that every denominator except the last
equals the numerator of the following fraction. Th erefore, all of the fi gures can
be divided out except the fi rst numerator and the last denominator.
1
23
2
33
3
43
4
53
5
63
6
73
7
83
8
95
1
9
A calculator is useful for doing the following, any of which you might be faced with on
the test:
• fi nding percents;
• fi nding square roots;
• rewriting fractions as decimals.
A few more calculator tips:
• If you fi nd yourself performing complex calculations, you’re probably doing
something wrong. Stop and rethink your approach to the problem.
PHS4674_NAA1_SATACT.indd 112 6/27/09 1:59:42 PM
Prentice Hall Algebra 1 • Progress Monitoring AssessmentsCopyright © by Pearson Education, Inc., or its affiliates. All Rights Reserved.
113
Name Class Date
SAT/ACT: Test-Taking Tips
• When you’re solving sample problems as part of your preparation for the test,
practice making quick decisions as to whether or not you should use
your calculator.
• Practice entering numbers on your calculator correctly. When you take the test,
enter numbers deliberately and with care. Herein lies another drawback of
calculators: T hey provide no paper trail to tell you that you pressed the
wrong buttons.
• Don’t forget to CLEAR after you fi nish performing a calculation.
Stick to a sensible guessing strategy.
Guessing on the ACT Your score on the ACT is based on the number of questions you answer correctly. No
points are deducted for incorrect answers. Th erefore, you should answer every
question, even those that stump you. As you take the test, mark the questions you
can’t answer. Return to them after you’ve answered as many questions as you can and
give those that puzzle you a second try. In the fi nal seconds before you are told to
stop, fi ll in the blank spaces on your answer sheet with random guesses.
To see why this strategy makes sense, consider Bill and Phil, both of whom are
completely boggled by 20 questions on the math portion of the ACT.
• Bill left all 20 questions unanswered.
Score: 0 correct 5 0 points
0 incorrect 5 0 points
Total 5 0 points
• Phil guessed the answers to all 20. Th e probability of guessing the correct answer
from among 5 choices is one-fi fth, and, indeed, Phil guessed 20 ? 1
5 5 4 correctly.
Score: 4 correct 5 4 points
16 incorrect 5 0 points
Total 5 4 points
Phil outscored Bill by 4 points. On the ACT, guessing answers to questions that totally
stump you is likely to improve your score.
Guessing on the SATTh ere is widespread confusion about whether or not to guess answers to multiple-
choice questions on the SAT. Much of the confusion is caused by the mistaken
understanding that guessers are somehow penalized beyond the bounds of
probability by a mysterious “guessing penalty.”
In fact, there is no extra penalty for guessing on the SAT. Again, consider Bill and
Phil, now taking the SAT. Once more, they’re unable to answer 20 questions, each
with 5 answer choices.
PHS4674_NAA1_SATACT.indd 113 6/27/09 1:59:43 PM
Prentice Hall Algebra 1 • Progress Monitoring AssessmentsCopyright © by Pearson Education, Inc., or its affiliates. All Rights Reserved.
114
Name Class Date
SAT/ACT: Test-Taking Tips
• Bill left all 20 questions unanswered.
Score: 0 correct 5 0 points
0 incorrect 5 0 points
Total 5 0 points
• Phil guessed the answers to all 20 questions. As before, he guessed correctly on
exactly the number of questions that chance predicts, 20 ?1
55 4.
Score: 4 correct 5 4 points
16 incorrect 5 (2)4 points (16 31
45 4)
Total 5 0 points
Bill and Phil both earned 0 points for their eff orts. Th e conclusion is this: If you are
completely stumped by an SAT multiple-choice question—that is, if all 5 answers
appear equally likely to be correct—it makes no diff erence in the long run whether
you guess the answer or leave the space blank on your answer sheet.
Th e arguments against guessing in such situations are mostly subjective. Th e
knowledge that you’re guessing answers blindly may begin to weigh on your mind,
aff ecting your ability to do your best on the test. And, of course, you waste a tiny
amount of time fi lling in your answer sheet with random guesses. You’re likely to do
just as well leaving the spaces blank.
Improving the OddsAs you’ve seen, the odds are that guessing blindly on multiple-choice questions that
are complete stumpers won’t hurt you on either the ACT or the SAT; on the ACT, it
will probably help you.
But you’re not going to impress any college admissions offi cers with a score obtained
through blind guessing. Th at brings us to a sensible guessing strategy over which you
have some control, and one that is likely to improve your score: Eliminate fi rst and
then guess.
If you can eliminate just one of the given answers to a question as defi nitely wrong,
it’s to your advantage to guess from among the remaining choices. If you can
eliminate two answers, it’s strongly to your advantage to guess. If you can eliminate
three answers, you’re very foolish not to guess. (If you can eliminate four answers, the
one you didn’t eliminate is the answer!)
Th e reason that this kind of educated guessing makes sense is that, following
elimination, the potential gain from a correct answer chosen through blind luck
exceeds the potential deduction for an incorrect answer. Th e more answers you can
eliminate, the greater the gap between potential gain and potential loss.
Th erefore, on multiple-choice questions for which you cannot choose the correct answer,
you should follow this strategy: Eliminate as many answers as possible, and then guess.
Th is strategy makes sense on both the SAT and the ACT. (And on the ACT, don’t forget to
randomly fi ll in all blank spaces before you’re told to put down your pencil. On the SAT
there’s no need to do that, though the odds are that you’ll suff er no penalty if you do.)
PHS4674_NAA1_SATACT.indd 114 6/27/09 1:59:43 PM
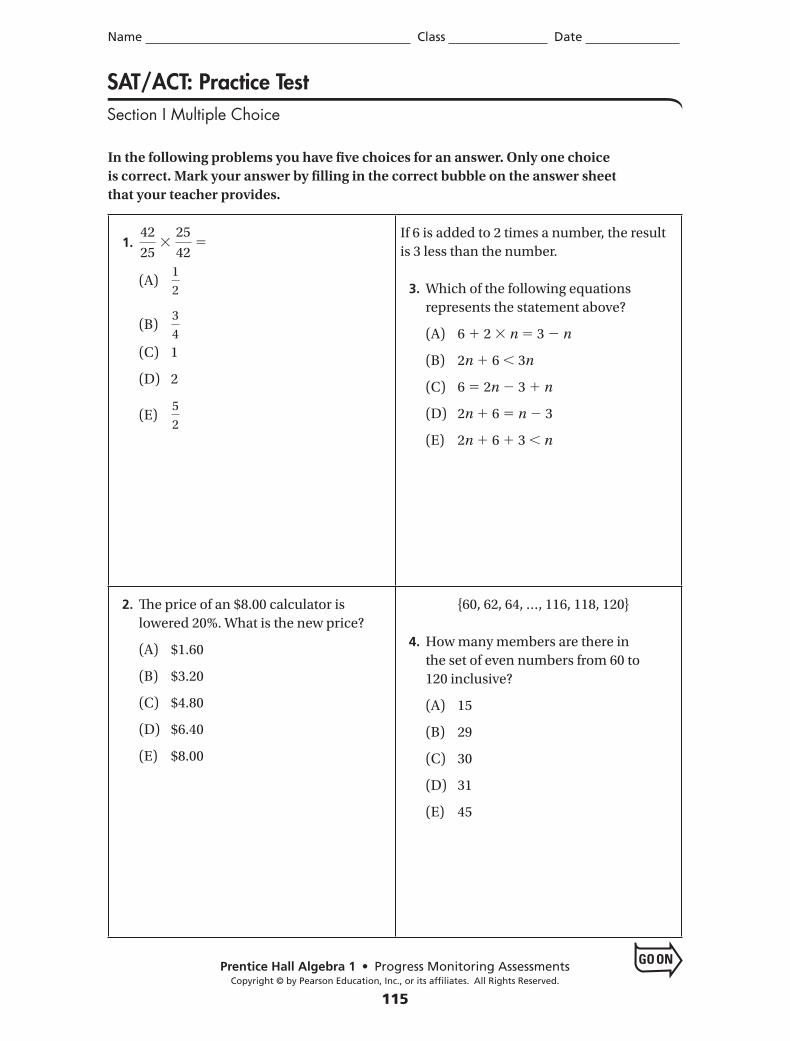
Prentice Hall Algebra 1 • Progress Monitoring AssessmentsCopyright © by Pearson Education, Inc., or its affiliates. All Rights Reserved.
115
Name Class Date
GO ON
SAT/ACT: Practice TestSection I Multiple Choice
In the following problems you have fi ve choices for an answer. Only one choice
is correct. Mark your answer by fi lling in the correct bubble on the answer sheet
that your teacher provides.
1. 42
25 3
25
42 5
(A) 1
2
(B) 3
4
(C) 1
(D) 2
(E) 5
2
If 6 is added to 2 times a number, the result
is 3 less than the number.
3. Which of the following equations
represents the statement above?
(A) 6 1 2 3 n 5 3 2 n
(B) 2n 1 6 , 3n
(C) 6 5 2n 2 3 1 n
(D) 2n 1 6 5 n 2 3
(E) 2n 1 6 1 3 , n
2. Th e price of an $8.00 calculator is
lowered 20%. What is the new price?
(A) $1.60
(B) $3.20
(C) $4.80
(D) $6.40
(E) $8.00
{60, 62, 64, …, 116, 118, 120}
4. How many members are there in
the set of even numbers from 60 to
120 inclusive?
(A) 15
(B) 29
(C) 30
(D) 31
(E) 45
PHS4674_NAA1_SATT.indd 115 6/26/09 4:30:46 PM
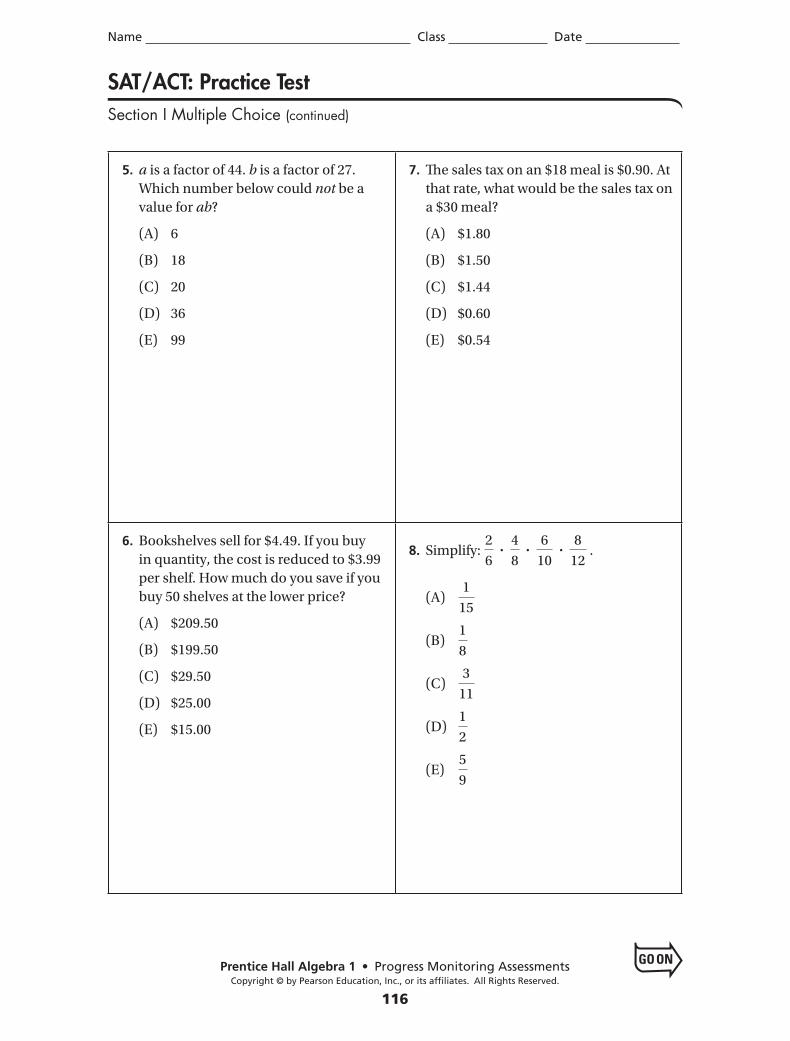
Prentice Hall Algebra 1 • Progress Monitoring AssessmentsCopyright © by Pearson Education, Inc., or its affiliates. All Rights Reserved.
116
Name Class Date
GO ON
5. a is a factor of 44. b is a factor of 27.
Which number below could not be a
value for ab?
(A) 6
(B) 18
(C) 20
(D) 36
(E) 99
7. Th e sales tax on an $18 meal is $0.90. At
that rate, what would be the sales tax on
a $30 meal?
(A) $1.80
(B) $1.50
(C) $1.44
(D) $0.60
(E) $0.54
6. Bookshelves sell for $4.49. If you buy
in quantity, the cost is reduced to $3.99
per shelf. How much do you save if you
buy 50 shelves at the lower price?
(A) $209.50
(B) $199.50
(C) $29.50
(D) $25.00
(E) $15.00
8. Simplify: 2
6?
4
8?
6
10?
8
12 .
(A) 1
15
(B) 1
8
(C) 3
11
(D) 1
2
(E) 5
9
SAT/ACT: Practice TestSection I Multiple Choice (continued)
PHS4674_NAA1_SATT.indd 116 6/26/09 4:30:48 PM
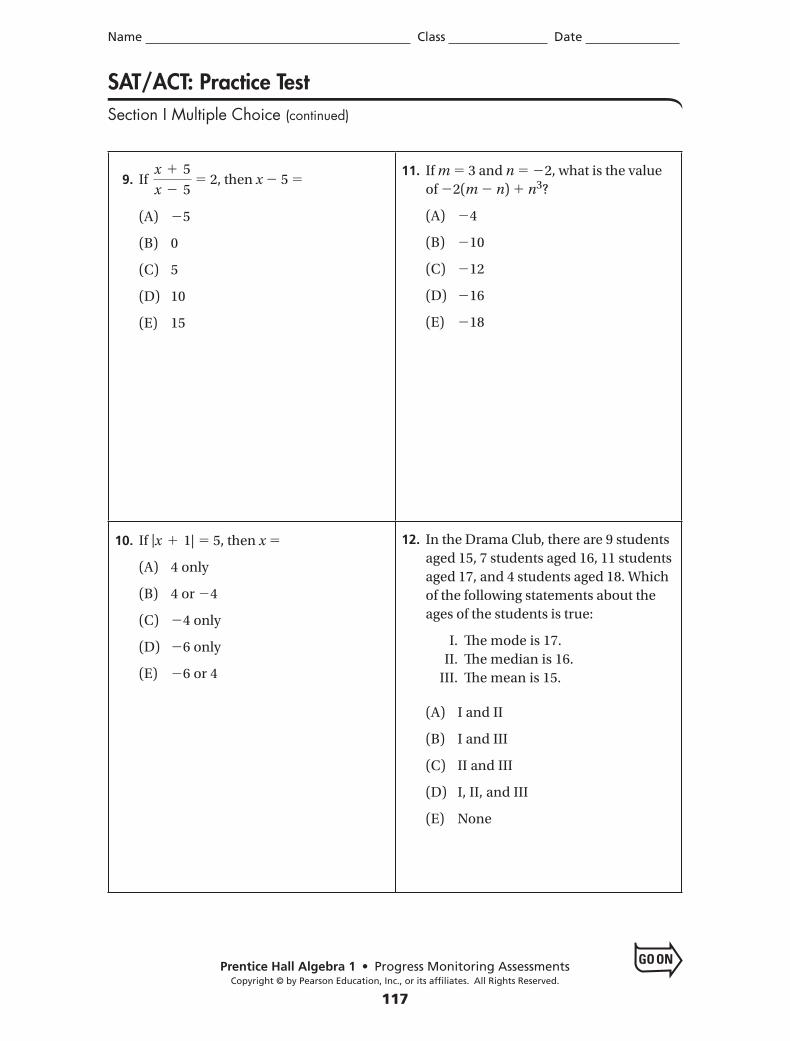
Prentice Hall Algebra 1 • Progress Monitoring AssessmentsCopyright © by Pearson Education, Inc., or its affiliates. All Rights Reserved.
117
Name Class Date
GO ON
9. If x 1 5
x 2 5 5 2, then x 2 5 5
(A) 25
(B) 0
(C) 5
(D) 10
(E) 15
11. If m 5 3 and n 5 22, what is the value
of 22(m 2 n) 1 n3?
(A) 24
(B) 210
(C) 212
(D) 216
(E) 218
10. If |x 1 1| 5 5, then x 5
(A) 4 only
(B) 4 or 24
(C) 24 only
(D) 26 only
(E) 26 or 4
12. In the Drama Club, there are 9 students
aged 15, 7 students aged 16, 11 students
aged 17, and 4 students aged 18. Which
of the following statements about the
ages of the students is true:
I. Th e mode is 17.
II. Th e median is 16.
III. Th e mean is 15.
(A) I and II
(B) I and III
(C) II and III
(D) I, II, and III
(E) None
SAT/ACT: Practice TestSection I Multiple Choice (continued)
PHS4674_NAA1_SATT.indd 117 6/26/09 4:30:49 PM
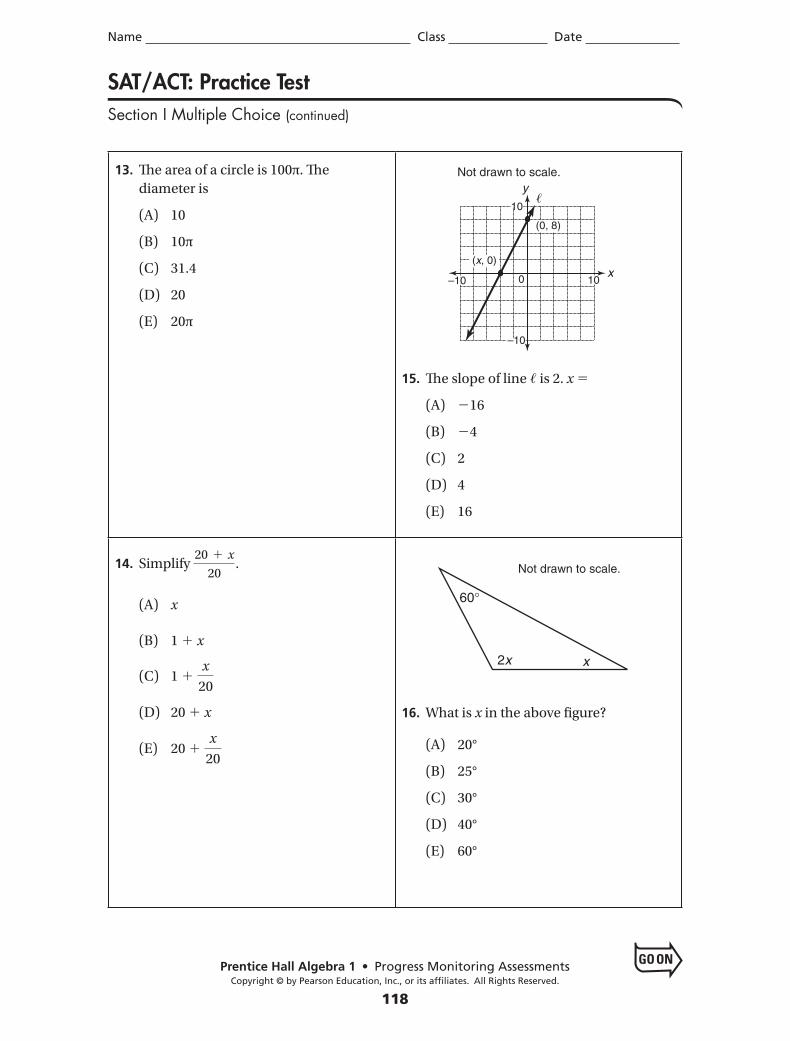
Prentice Hall Algebra 1 • Progress Monitoring AssessmentsCopyright © by Pearson Education, Inc., or its affiliates. All Rights Reserved.
118
Name Class Date
GO ON
13. Th e area of a circle is 100π. Th e
diameter is
(A) 10
(B) 10π
(C) 31.4
(D) 20
(E) 20π
15. Th e slope of line / is 2. x 5
(A) 216
(B) 24
(C) 2
(D) 4
(E) 16
14. Simplify 20 1 x
20.
(A) x
(B) 1 1 x
(C) 1 1 x
20
(D) 20 1 x
(E) 20 1 x
20
x
60°
Not drawn to scale.
2x
16. What is x in the above fi gure?
(A) 20°
(B) 25°
(C) 30°
(D) 40°
(E) 60°
y
x0 10–10
10
–10
(x, 0)
(0, 8)
/
Not drawn to scale.
SAT/ACT: Practice TestSection I Multiple Choice (continued)
PHS4674_NAA1_SATT.indd 118 6/26/09 4:30:50 PM
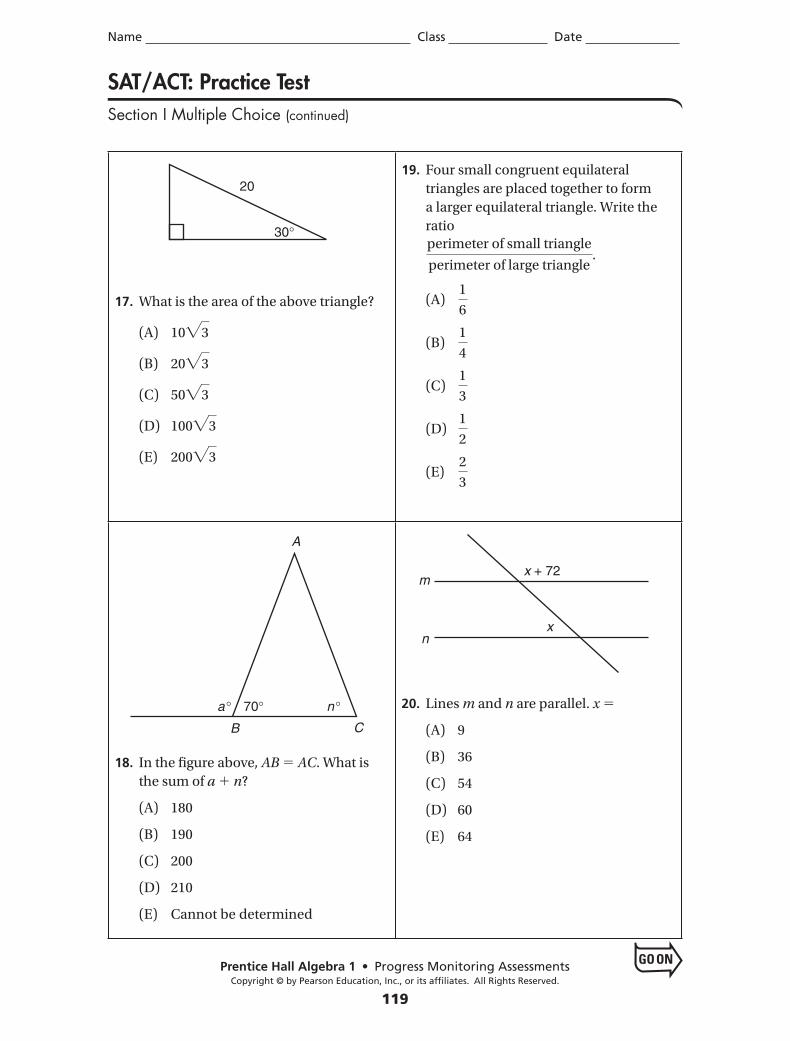
Prentice Hall Algebra 1 • Progress Monitoring AssessmentsCopyright © by Pearson Education, Inc., or its affiliates. All Rights Reserved.
119
Name Class Date
GO ON
30°
20
17. What is the area of the above triangle?
(A) 10"3
(B) 20"3
(C) 50"3
(D) 100"3
(E) 200"3
19. Four small congruent equilateral
triangles are placed together to form
a larger equilateral triangle. Write the
ratio
perimeter of small triangle
perimeter of large triangle.
(A) 1
6
(B) 1
4
(C) 1
3
(D) 1
2
(E) 2
3
70°
A
CB
n°a°
18. In the fi gure above, AB 5 AC. What is
the sum of a 1 n?
(A) 180
(B) 190
(C) 200
(D) 210
(E) Cannot be determined
m
nx
x + 72
20. Lines m and n are parallel. x 5
(A) 9
(B) 36
(C) 54
(D) 60
(E) 64
SAT/ACT: Practice TestSection I Multiple Choice (continued)
PHS4674_NAA1_SATT.indd 119 6/26/09 4:30:50 PM
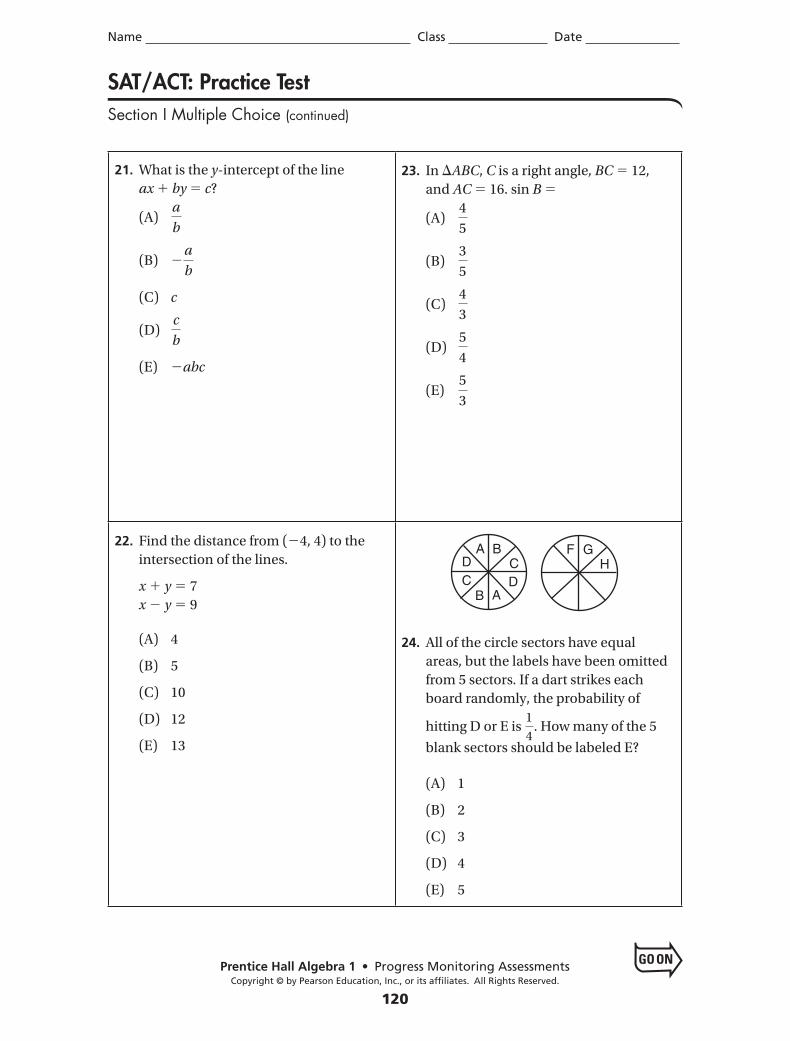
Prentice Hall Algebra 1 • Progress Monitoring AssessmentsCopyright © by Pearson Education, Inc., or its affiliates. All Rights Reserved.
120
Name Class Date
GO ON
21. What is the y-intercept of the line
ax 1 by 5 c?
(A) a
b
(B) 2a
b
(C) c
(D) c
b
(E) 2abc
23. In DABC, C is a right angle, BC 5 12,
and AC 5 16. sin B 5
(A) 4
5
(B) 3
5
(C) 4
3
(D) 5
4
(E) 5
3
22. Find the distance from ( 24, 4) to the
intersection of the lines.
x 1 y 5 7
x 2 y 5 9
(A) 4
(B) 5
(C) 10
(D) 12
(E) 13
B
A
D CC
BD
A GH
F
24. All of the circle sectors have equal
areas, but the labels have been omitted
from 5 sectors. If a dart strikes each
board randomly, the probability of
hitting D or E is 1
4. How many of the 5
blank sectors should be labeled E?
(A) 1
(B) 2
(C) 3
(D) 4
(E) 5
SAT/ACT: Practice TestSection I Multiple Choice (continued)
PHS4674_NAA1_SATT.indd 120 6/26/09 4:30:52 PM
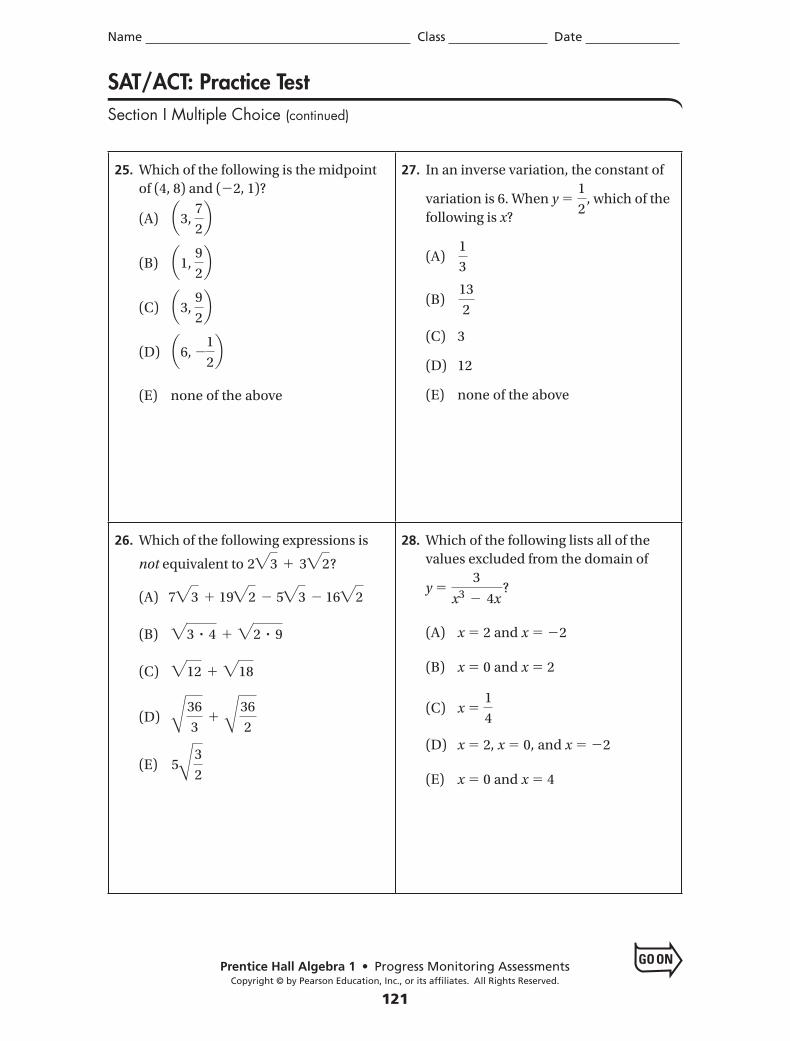
Prentice Hall Algebra 1 • Progress Monitoring AssessmentsCopyright © by Pearson Education, Inc., or its affiliates. All Rights Reserved.
121
Name Class Date
GO ON
25. Which of the following is the midpoint
of (4, 8) and (22, 1)?
(A) a3, 7
2b
(B) a1, 9
2b
(C) a3, 9
2b
(D) a6, 21
2b
(E) none of the above
27. In an inverse variation, the constant of
variation is 6. When y 5 1
2, which of the
following is x?
(A) 1
3
(B) 13
2
(C) 3
(D) 12
(E) none of the above
26. Which of the following expressions is
not equivalent to 2"3 1 3"2?
(A) 7"3 1 19"2 2 5"3 2 16"2
(B) "3 ? 4 1 "2 ? 9
(C) "12 1 "18
(D) Å36
31 Å36
2
(E) 5Å3
2
28. Which of the following lists all of the
values excluded from the domain of
y 5 3
x3 2 4x?
(A) x 5 2 and x 5 22
(B) x 5 0 and x 5 2
(C) x 5 1
4
(D) x 5 2, x 5 0, and x 5 22
(E) x 5 0 and x 5 4
SAT/ACT: Practice TestSection I Multiple Choice (continued)
PHS4674_NAA1_SATT.indd 121 6/26/09 4:30:53 PM
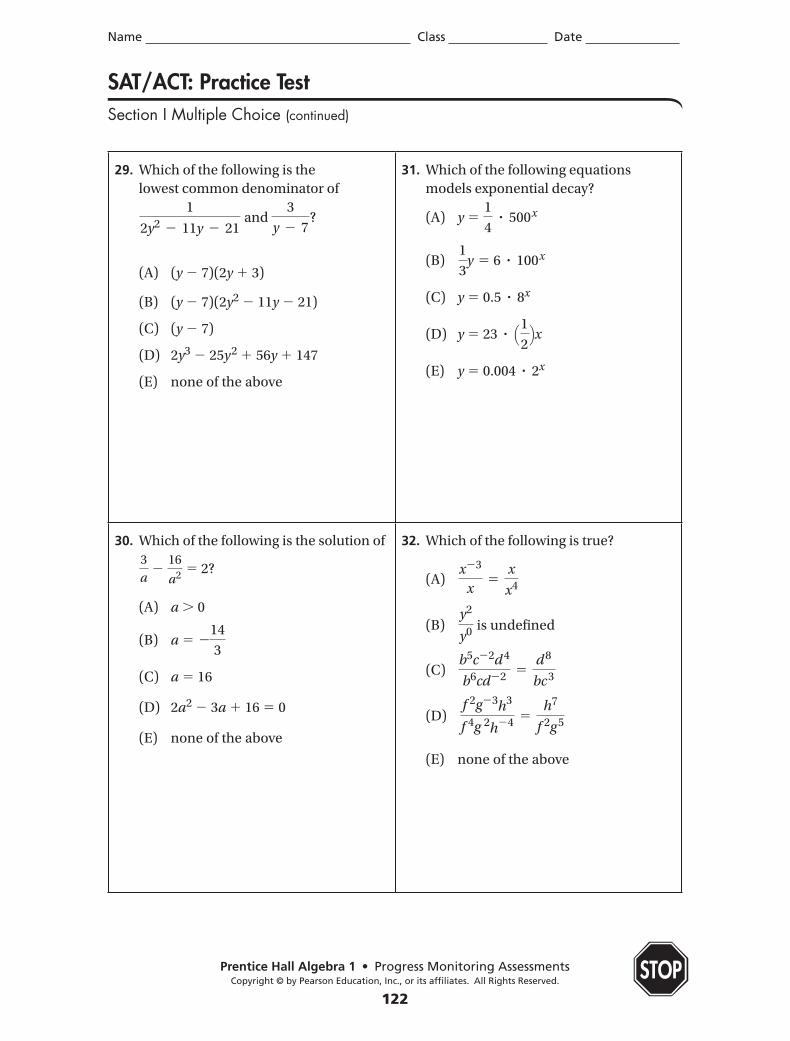
Prentice Hall Algebra 1 • Progress Monitoring AssessmentsCopyright © by Pearson Education, Inc., or its affiliates. All Rights Reserved.
122
Name Class Date
STOP
29. Which of the following is the
lowest common denominator of
1
2y2 2 11y 2 21 and
3
y 2 7?
(A) (y 2 7)(2y 1 3)
(B) (y 2 7)(2y2 2 11y 2 21)
(C) (y 2 7)
(D) 2y3 2 25y2 1 56y 1 147
(E) none of the above
31. Which of the following equations
models exponential decay?
(A) y 5 1
4? 500x
(B) 1
3y 5 6 ? 100x
(C) y 5 0.5 ? 8x
(D) y 5 23 ? Q12Rx
(E) y 5 0.004 ? 2x
30. Which of the following is the solution of
3
a 2
16
a2 5 2?
(A) a . 0
(B) a 5 214
3
(C) a 5 16
(D) 2a2 2 3a 1 16 5 0
(E) none of the above
32. Which of the following is true?
(A) x23
x5
x
x4
(B) y2
y0 is undefi ned
(C) b5c22d
4
b6cd22 5d
8
bc 3
(D) f 2g23h3
f 4g 2h24 5h7
f 2g 5
(E) none of the above
SAT/ACT: Practice TestSection I Multiple Choice (continued)
PHS4674_NAA1_SATT.indd 122 6/26/09 4:30:55 PM
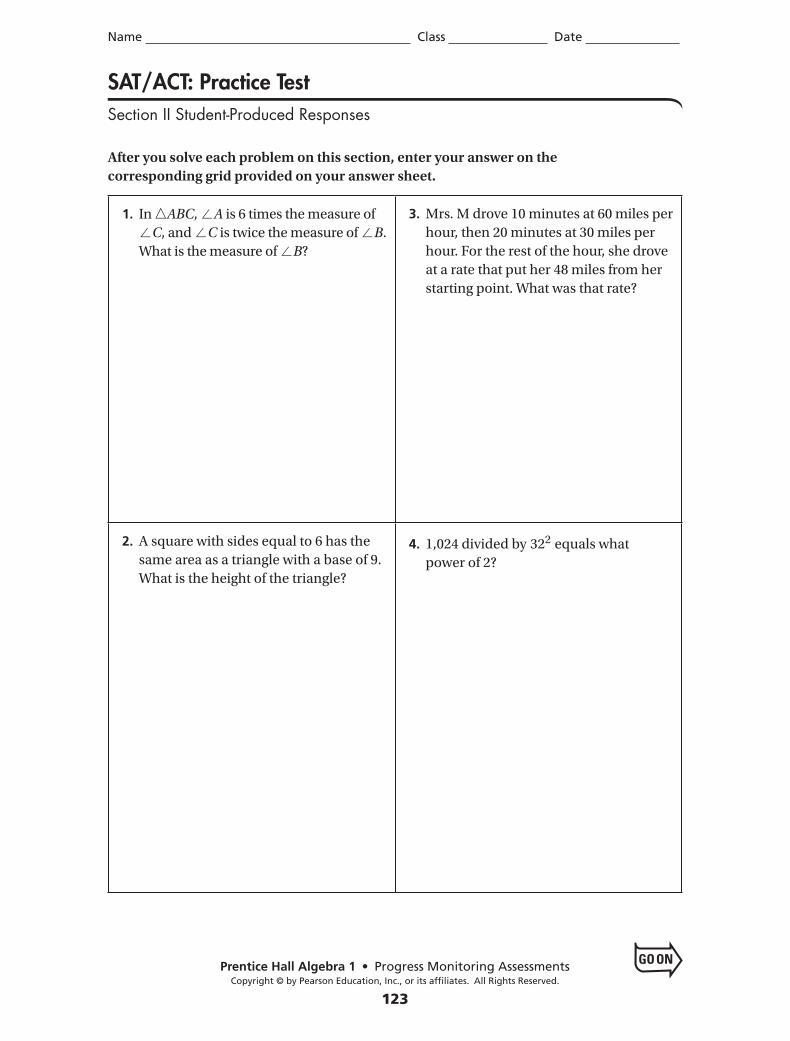
Prentice Hall Algebra 1 • Progress Monitoring AssessmentsCopyright © by Pearson Education, Inc., or its affiliates. All Rights Reserved.
123
Name Class Date
GO ON
SAT/ACT: Practice TestSection II Student-Produced Responses
After you solve each problem on this section, enter your answer on the
corresponding grid provided on your answer sheet.
1. In nABC, /A is 6 times the measure of
/C, and /C is twice the measure of /B.
What is the measure of /B?
3. Mrs. M drove 10 minutes at 60 miles per
hour, then 20 minutes at 30 miles per
hour. For the rest of the hour, she drove
at a rate that put her 48 miles from her
starting point. What was that rate?
2. A square with sides equal to 6 has the
same area as a triangle with a base of 9.
What is the height of the triangle?
4. 1,024 divided by 322 equals what
power of 2?
PHS4674_NAA1_SATT.indd 123 6/26/09 4:30:57 PM
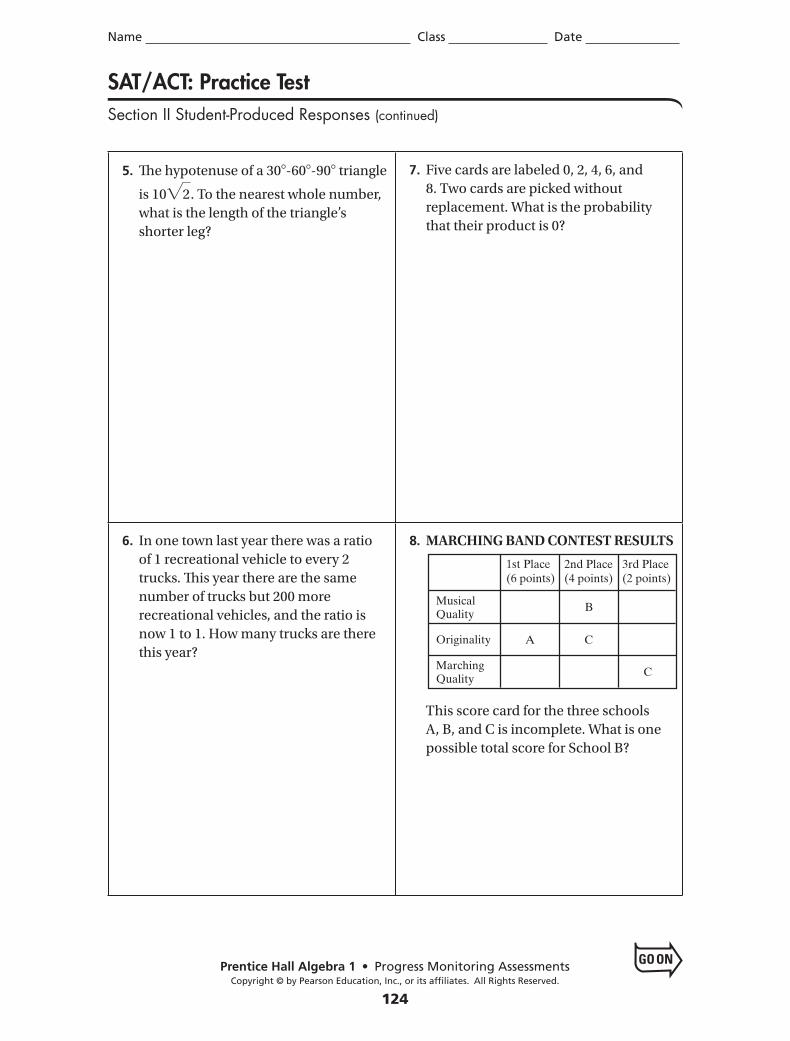
Prentice Hall Algebra 1 • Progress Monitoring AssessmentsCopyright © by Pearson Education, Inc., or its affiliates. All Rights Reserved.
124
Name Class Date
GO ON
5. Th e hypotenuse of a 308-608-908 triangle
is 10"2. To the nearest whole number,
what is the length of the triangle’s
shorter leg?
7. Five cards are labeled 0, 2, 4, 6, and
8. Two cards are picked without
replacement. What is the probability
that their product is 0?
6. In one town last year there was a ratio
of 1 recreational vehicle to every 2
trucks. Th is year there are the same
number of trucks but 200 more
recreational vehicles, and the ratio is
now 1 to 1. How many trucks are there
this year?
8. MARCHING BAND CONTEST RESULTS
This score card for the three schools
A, B, and C is incomplete. What is one
possible total score for School B?
1st Place(6 points)
2nd Place(4 points)
3rd Place(2 points)
Musical Quality
Originality
Marching Quality
A
B
C
C
SAT/ACT: Practice TestSection II Student-Produced Responses (continued)
PHS4674_NAA1_SATT.indd 124 6/26/09 4:30:58 PM
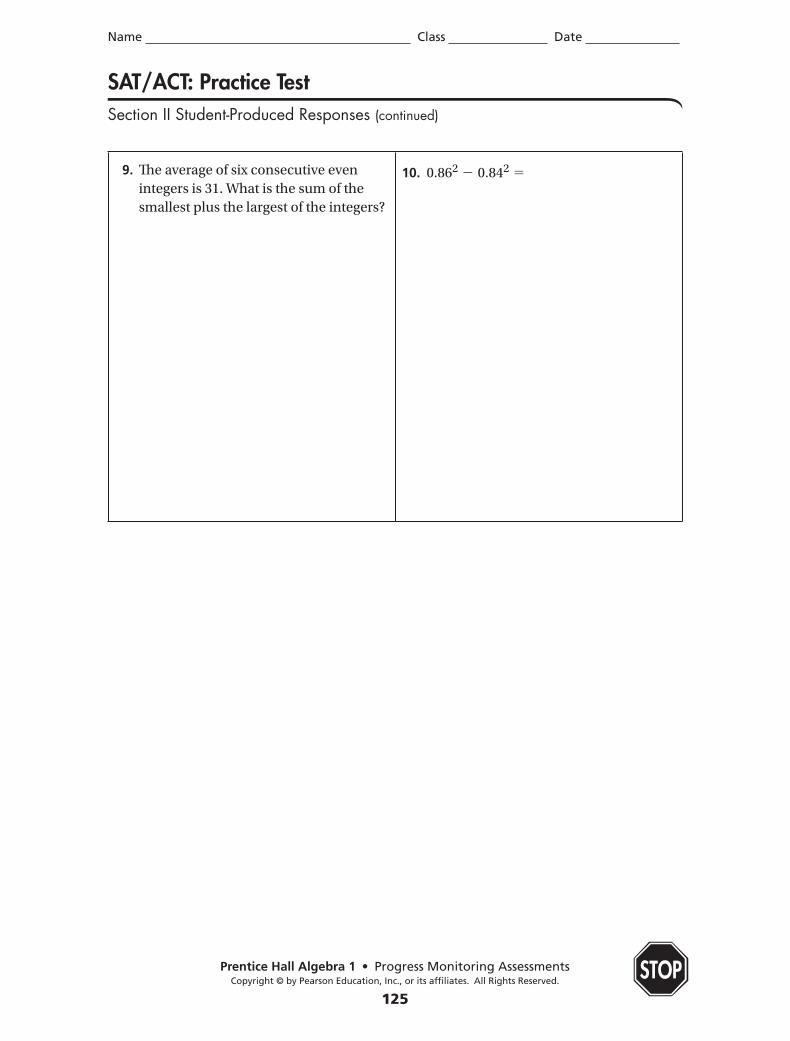
Prentice Hall Algebra 1 • Progress Monitoring AssessmentsCopyright © by Pearson Education, Inc., or its affiliates. All Rights Reserved.
125
Name Class Date
SAT/ACT: Practice TestSection II Student-Produced Responses (continued)
9. Th e average of six consecutive even
integers is 31. What is the sum of the
smallest plus the largest of the integers?
10. 0.862 2 0.842 5
STOP
PHS4674_NAA1_SATT.indd 125 6/26/09 4:30:58 PM
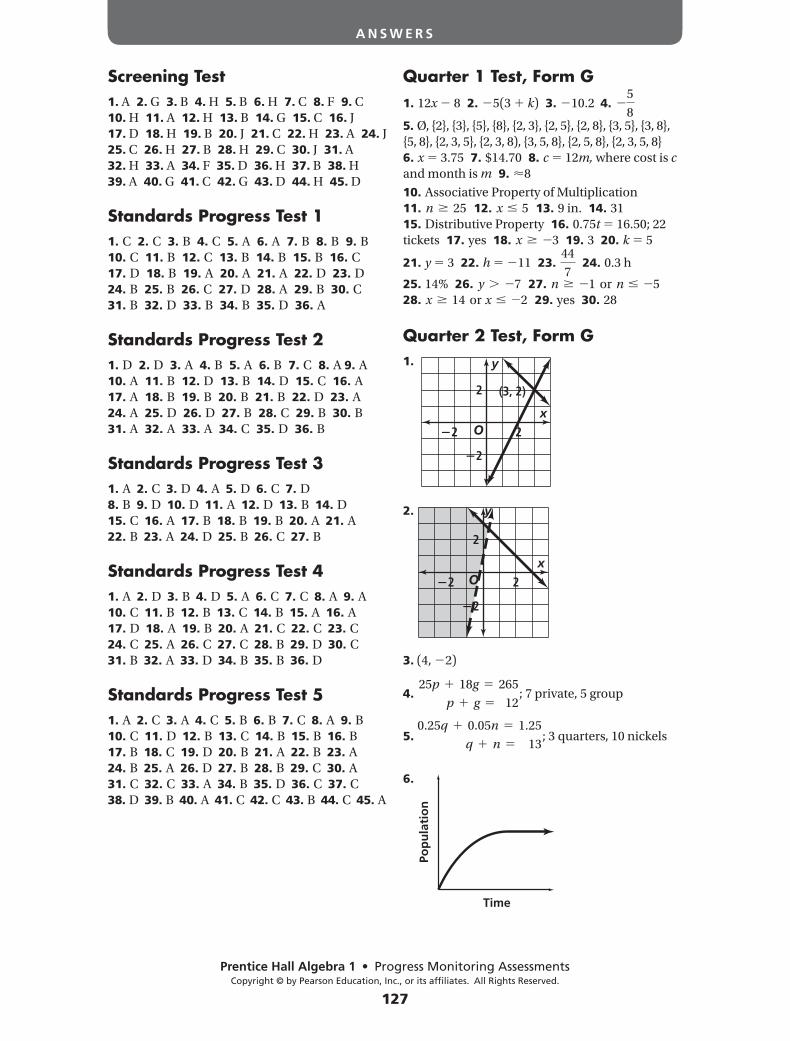
Progress Monitoring AssessmentsCopyright © by Pearson Education, Inc., or its affiliates. All Rights Reserved.
127
A N S W E R S
Screening Test1. A 2. G 3. B 4. H 5. B 6. H 7. C 8. F 9. C
10. H 11. A 12. H 13. B 14. G 15. C 16. J
17. D 18. H 19. B 20. J 21. C 22. H 23. A 24. J
25. C 26. H 27. B 28. H 29. C 30. J 31. A
32. H 33. A 34. F 35. D 36. H 37. B 38. H
39. A 40. G 41. C 42. G 43. D 44. H 45. D
Standards Progress Test 11. C 2. C 3. B 4. C 5. A 6. A 7. B 8. B 9. B 10. C 11. B 12. C 13. B 14. B 15. B 16. C 17. D 18. B 19. A 20. A 21. A 22. D 23. D 24. B 25. B 26. C 27. D 28. A 29. B 30. C 31. B 32. D 33. B 34. B 35. D 36. A
Standards Progress Test 21. D 2. D 3. A 4. B 5. A 6. B 7. C 8. A 9. A
10. A 11. B 12. D 13. B 14. D 15. C 16. A 17. A 18. B 19. B 20. B 21. B 22. D 23. A
24. A 25. D 26. D 27. B 28. C 29. B 30. B
31. A 32. A 33. A 34. C 35. D 36. B
Standards Progress Test 31. A 2. C 3. D 4. A 5. D 6. C 7. D 8. B 9. D 10. D 11. A 12. D 13. B 14. D 15. C 16. A 17. B 18. B 19. B 20. A 21. A 22. B 23. A 24. D 25. B 26. C 27. B
Standards Progress Test 41. A 2. D 3. B 4. D 5. A 6. C 7. C 8. A 9. A 10. C 11. B 12. B 13. C 14. B 15. A 16. A 17. D 18. A 19. B 20. A 21. C 22. C 23. C 24. C 25. A 26. C 27. C 28. B 29. D 30. C 31. B 32. A 33. D 34. B 35. B 36. D
Standards Progress Test 51. A 2. C 3. A 4. C 5. B 6. B 7. C 8. A 9. B 10. C 11. D 12. B 13. C 14. B 15. B 16. B 17. B 18. C 19. D 20. B 21. A 22. B 23. A 24. B 25. A 26. D 27. B 28. B 29. C 30. A 31. C 32. C 33. A 34. B 35. D 36. C 37. C 38. D 39. B 40. A 41. C 42. C 43. B 44. C 45. A
Quarter 1 Test, Form G1. 12x 8 2. 5(3 k) 3. 10.2 4.
5
8
5. Ø, {2}, {3}, {5}, {8}, {2, 3}, {2, 5}, {2, 8}, {3, 5}, {3, 8},
{5, 8}, {2, 3, 5}, {2, 3, 8), {3, 5, 8}, {2, 5, 8}, {2, 3, 5, 8} 6. x 3.75 7. $14.70 8. c 12m, where cost is c
and month is m 9. 8
10. Associative Property of Multiplication
11. n 25 12. x 5 13. 9 in. 14. 31
15. Distributive Property 16. 0.75t 16.50; 22
tickets 17. yes 18. x 3 19. 3 20. k 5
21. y 3 22. h 11 23. 44
7 24. 0.3 h
25. 14% 26. y 7 27. n 1 or n 5 28. x 14 or x 2 29. yes 30. 28
Quarter 2 Test, Form G1.
2.
3. (4, 2)
4. 25p 18g 265
p g 12; 7 private, 5 group
5. 0.25q 0.05n 1.25
q n 13; 3 quarters, 10 nickels
6.
O
2
2
2
2x
y
(3, 2)
O
2
2
2
2x
y
Time
Pop
ula
tio
n
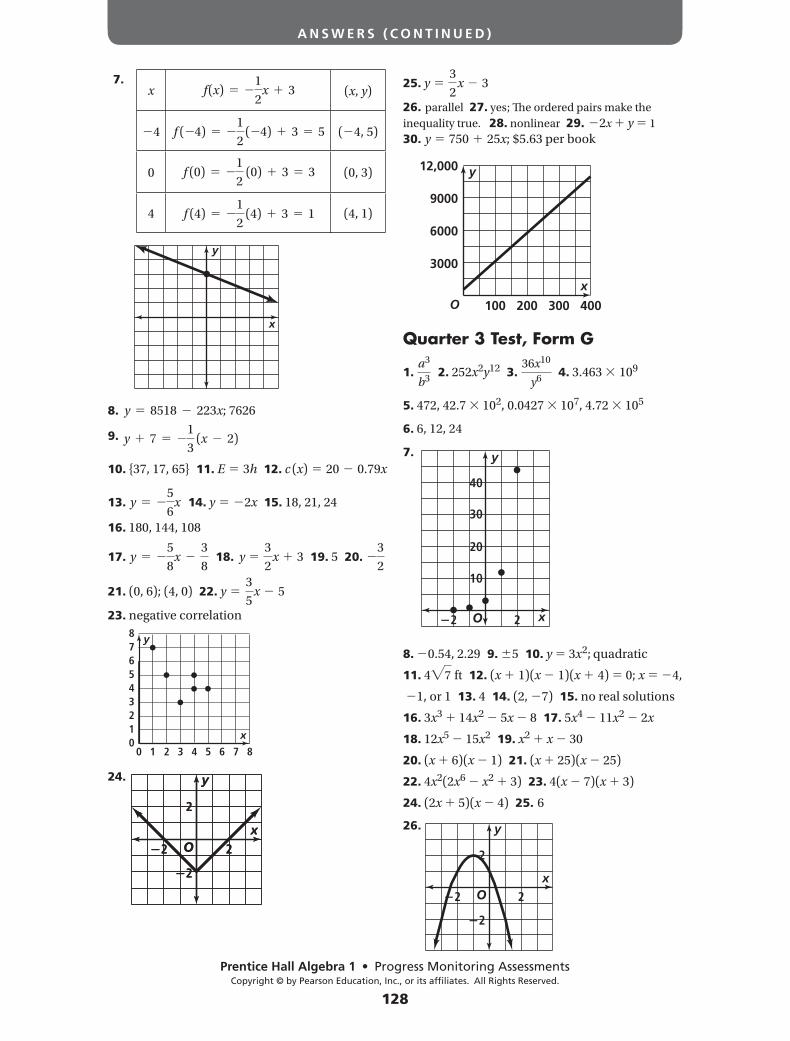
Progress Monitoring AssessmentsCopyright © by Pearson Education, Inc., or its affiliates. All Rights Reserved.
128
A N S W E R S ( C O N T I N U E D )
7.x f (x)
1
2x 3 (x, y)
4 f ( 4)1
2 ( 4) 3 5 ( 4, 5)
0 f (0)1
2 (0) 3 3 (0, 3)
4 f (4)1
2 (4) 3 1 (4, 1)
8. y 8518 223x; 7626
9. y 71
3 (x 2)
10. {37, 17, 65} 11. E 3h 12. c (x) 20 0.79x
13. y5
6x 14. y 2x 15. 18, 21, 24
16. 180, 144, 108
17. y5
8x
3
8 18. y
3
2x 3 19. 5 20.
3
2
21. (0, 6); (4, 0) 22. y 3
5x 5
23. negative correlation
24.
25. y 3
2x 3
26. parallel 27. yes; The ordered pairs make the
inequality true. 28. nonlinear 29. 2x y 1
30. y 750 25x; $5.63 per book
Quarter 3 Test, Form G
1. a3
b3 2. 252x2y12 3.
36x10
y6 4. 3.463 109
5. 472, 42.7 102, 0.0427 107, 4.72 105
6. 6, 12, 24
7.
8. 0.54, 2.29 9. 5 10. y 3x2; quadratic
11. 4 7 ft 12. (x 1)(x 1)(x 4) 0; x 4,
1, or 1 13. 4 14. (2, 7) 15. no real solutions
16. 3x3 14x2 5x 8 17. 5x4 11x2 2x
18. 12x5 15x2 19. x2 x 30
20. (x 6)(x 1) 21. (x 25)(x 25)
22. 4x2(2x6 x2 3) 23. 4(x 7)(x 3)
24. (2x 5)(x 4) 25. 6
26.
x
y
3
12
54
00 6 7 83 41 52
678 y
x
O
2
2
2
2x
y
O
2
2
2
2x
y
O 100 200 300 400
3000
6000
9000
12,000
x
y
O
10
20
30
40
2 2 x
y
O
2
2
2
2x
y
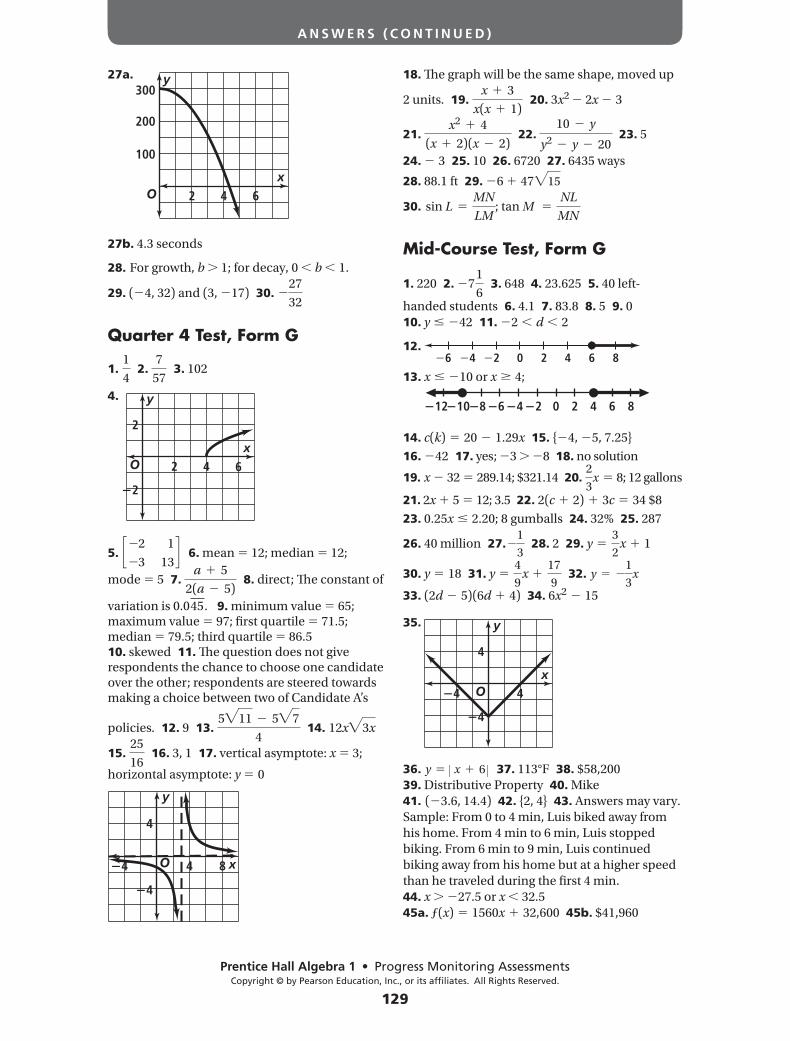
Progress Monitoring AssessmentsCopyright © by Pearson Education, Inc., or its affiliates. All Rights Reserved.
129
A N S W E R S ( C O N T I N U E D )
27a.
27b. 4.3 seconds
28. For growth, b 1; for decay, 0 b 1.
29. ( 4, 32) and (3, 17) 30. 27
32
Quarter 4 Test, Form G
1. 1
4 2.
7
57 3. 102
4.
5. 2 1
3 13 6. mean 12; median 12;
mode 5 7. a 5
2(a 5) 8. direct; The constant of
variation is 0.045. 9. minimum value 65; maximum value 97; first quartile 71.5; median 79.5; third quartile 86.5 10. skewed 11. The question does not give respondents the chance to choose one candidate over the other; respondents are steered towards making a choice between two of Candidate A’s
policies. 12. 9 13. 5 11 5 7
4 14. 12x 3x
15. 25
16 16. 3, 1 17. vertical asymptote: x 3;
horizontal asymptote: y 0
18. The graph will be the same shape, moved up
2 units. 19. x 3
x(x 1) 20. 3x2 2x 3
21. x2 4
(x 2)(x 2) 22.
10 y
y2 y 20 23. 5
24. 3 25. 10 26. 6720 27. 6435 ways
28. 88.1 ft 29. 6 47 15
30. sin LMN
LM; tan M
NL
MN
Mid-Course Test, Form G
1. 220 2. 71
6 3. 648 4. 23.625 5. 40 left-
handed students 6. 4.1 7. 83.8 8. 5 9. 0
10. y 42 11. 2 d 2
12.
13. x 10 or x 4;
14. c(k) 20 1.29x 15. { 4, 5, 7.25}
16. 42 17. yes; 3 8 18. no solution
19. x 32 289.14; $321.14 20. 2
3x 8; 12 gallons
21. 2x 5 12; 3.5 22. 2(c 2) 3c 34 $8
23. 0.25x 2.20; 8 gumballs 24. 32% 25. 287
26. 40 million 27.1
3 28. 2 29. y
3
2x 1
30. y 18 31. y 4
9x
17
9 32. y
1
3x
33. (2d 5)(6d 4) 34. 6x2 15
35.
36. y x 6 37. 113°F 38. $58,200
39. Distributive Property 40. Mike
41. ( 3.6, 14.4) 42. {2, 4} 43. Answers may vary.
Sample: From 0 to 4 min, Luis biked away from
his home. From 4 min to 6 min, Luis stopped
biking. From 6 min to 9 min, Luis continued
biking away from his home but at a higher speed
than he traveled during the first 4 min.
44. x 27.5 or x 32.5
45a. ƒ(x) 1560x 32,600 45b. $41,960
O
100
200
300
62 4x
y
O
2
2
2 4x
y
6
O
4
4
4
4 8 x
y
6 86 4 2 20 4
1012 8 6 4 2 0 8642
O
4
4
4
4x
y
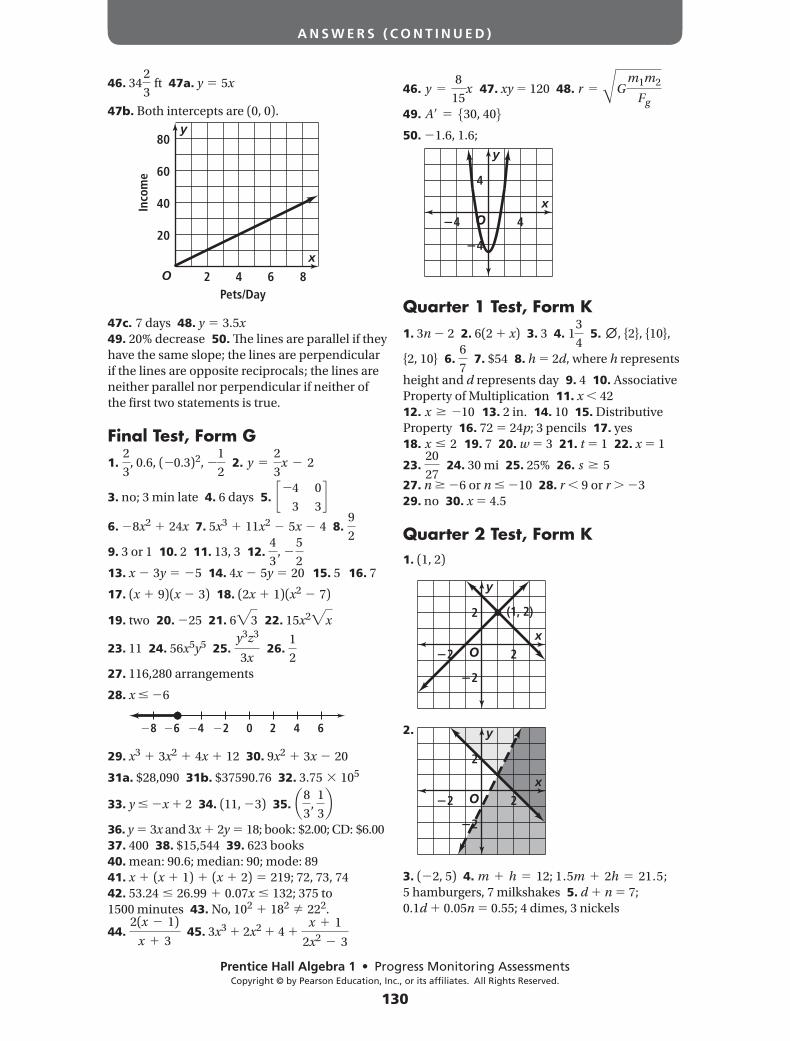
Progress Monitoring AssessmentsCopyright © by Pearson Education, Inc., or its affiliates. All Rights Reserved.
130
A N S W E R S ( C O N T I N U E D )
46. 342
3 ft 47a. y 5x
47b. Both intercepts are (0, 0).
47c. 7 days 48. y 3.5x
49. 20% decrease 50. The lines are parallel if they
have the same slope; the lines are perpendicular
if the lines are opposite reciprocals; the lines are
neither parallel nor perpendicular if neither of
the first two statements is true.
Final Test, Form G1.
2
3, 0.6, ( 0.3)2,
1
2 2. y
2
3x 2
3. no; 3 min late 4. 6 days 5. 4 0
3 3
6. 8x2 24x 7. 5x3 11x2 5x 4 8. 9
2
9. 3 or 1 10. 2 11. 13, 3 12. 4
3,
5
2
13. x 3y 5 14. 4x 5y 20 15. 5 16. 7
17. (x 9)(x 3) 18. (2x 1)(x2 7)
19. two 20. 25 21. 6 3 22. 15x2 x
23. 11 24. 56x5y5 25. y3z3
3x 26.
1
2
27. 116,280 arrangements
28. x 6
29. x3 3x2 4x 12 30. 9x2 3x 20
31a. $28,090 31b. $37590.76 32. 3.75 105
33. y x 2 34. (11, 3) 35. 8
3,
1
3
36. y 3x and 3x 2y 18; book: $2.00; CD: $6.00
37. 400 38. $15,544 39. 623 books
40. mean: 90.6; median: 90; mode: 89
41. x (x 1) (x 2) 219; 72, 73, 74
42. 53.24 26.99 0.07x 132; 375 to
1500 minutes 43. No, 102 182 222.
44. 2(x 1)
x 3 45. 3x3 2x2 4
x 1
2x2 3
46. y8
15x 47. xy 120 48. r G
m1m2
Fg49. A 30, 40
50. 1.6, 1.6;
Quarter 1 Test, Form K1. 3n 2 2. 6(2 x) 3. 3 4. 1
3
4 5. , {2}, {10},
{2, 10} 6. 6
7 7. $54 8. h 2d, where h represents
height and d represents day 9. 4 10. Associative
Property of Multiplication 11. x 42
12. x 10 13. 2 in. 14. 10 15. Distributive
Property 16. 72 24p; 3 pencils 17. yes
18. x 2 19. 7 20. w 3 21. t 1 22. x 1
23. 20
27 24. 30 mi 25. 25% 26. s 5
27. n 6 or n 10 28. r 9 or r 3
29. no 30. x 4.5
Quarter 2 Test, Form K1. (1, 2)
2.
3. ( 2, 5) 4. m h 12; 1.5m 2h 21.5;
5 hamburgers, 7 milkshakes 5. d n 7;
0.1d 0.05n 0.55; 4 dimes, 3 nickels
O 2 4 6 8
20
40
60
80
x
y
Pets/Day
Inco
me
4 6468 2 0 2
O
4
4
4
4x
y
O
2
2
2
2x
y
(1, 2)
O
2
2
2
2x
y
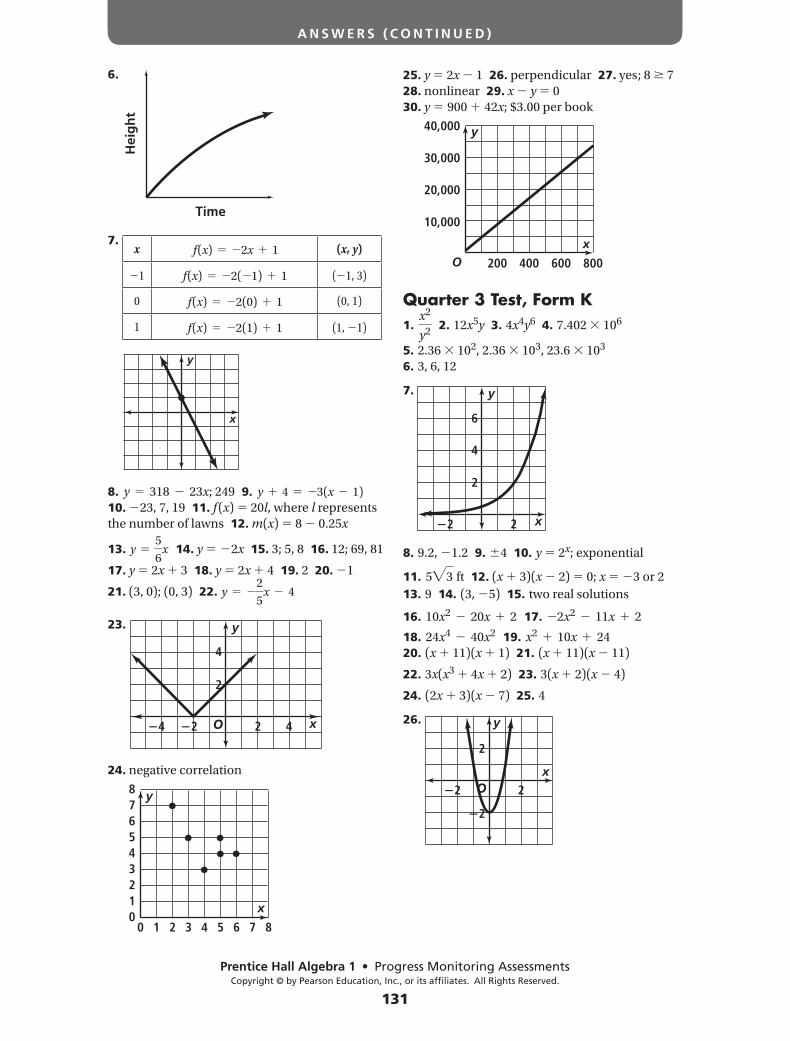
Progress Monitoring AssessmentsCopyright © by Pearson Education, Inc., or its affiliates. All Rights Reserved.
131
A N S W E R S ( C O N T I N U E D )
6.
7.
8. y 318 23x; 249 9. y 4 3(x 1)
10. 23, 7, 19 11. f (x) 20l, where l represents
the number of lawns 12. m(x) 8 0.25x
13. y5
6x 14. y 2x 15. 3; 5, 8 16. 12; 69, 81
17. y 2x 3 18. y 2x 4 19. 2 20. 1
21. (3, 0); (0, 3) 22. y2
5x 4
23.
24. negative correlation
25. y 2x 1 26. perpendicular 27. yes; 8 7
28. nonlinear 29. x y 0
30. y 900 42x; $3.00 per book
Quarter 3 Test, Form K1.
x2
y2 2. 12x5y 3. 4x4y6 4. 7.402 106
5. 2.36 102, 2.36 103, 23.6 103
6. 3, 6, 12
7.
8. 9.2, 1.2 9. 4 10. y 2x; exponential
11. 5 3 ft 12. (x 3)(x 2) 0; x 3 or 2
13. 9 14. (3, 5) 15. two real solutions
16. 10x2 20x 2 17. 2x2 11x 2
18. 24x4 40x2 19. x2 10x 24
20. (x 11)(x 1) 21. (x 11)(x 11)
22. 3x(x3 4x 2) 23. 3(x 2)(x 4)
24. (2x 3)(x 7) 25. 4
26.
Time
Hei
gh
t
x f (x) 2x 1 (x, y)
1 f (x) 2( 1) 1 ( 1, 3)
0 f (x) 2(0) 1 (0, 1)
1 f (x) 2(1) 1 (1, 1)
x
y
O
2
4
2 2 44 x
y
3
12
54
00 6 7 83 41 52
678 y
x
O 200 400 600 800
10,000
20,000
30,000
40,000
x
y
2
4
6
2 2 x
y
O
2
2
2
2x
y
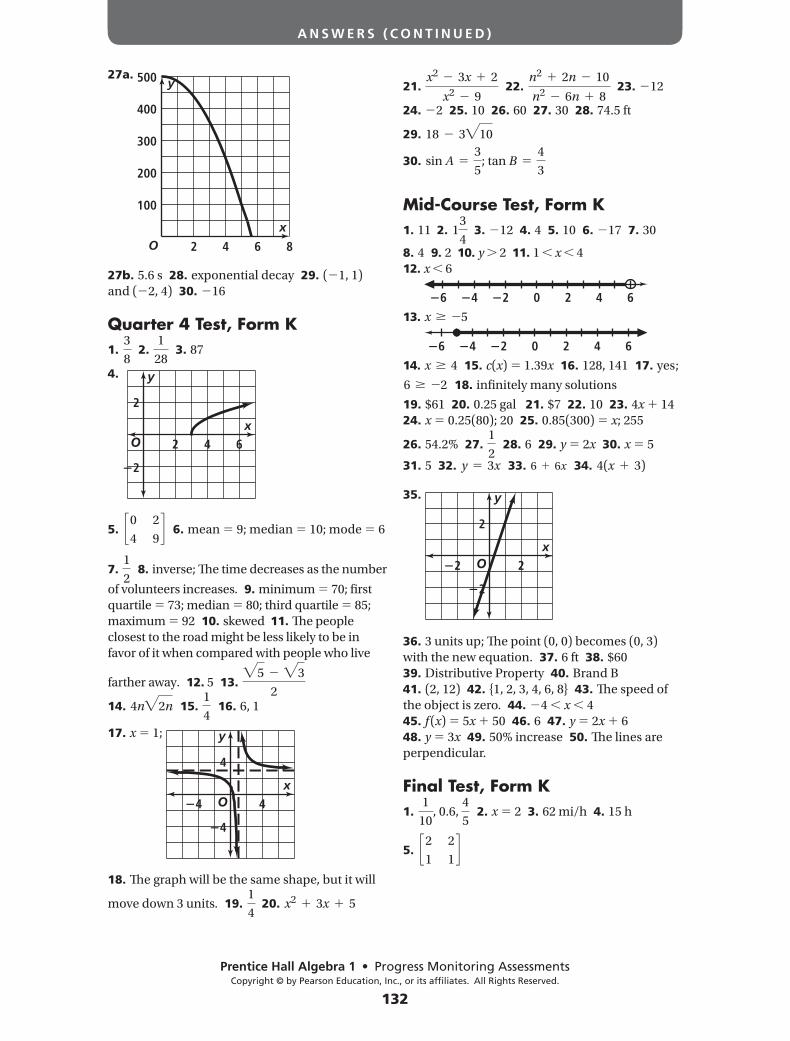
Progress Monitoring AssessmentsCopyright © by Pearson Education, Inc., or its affiliates. All Rights Reserved.
132
A N S W E R S ( C O N T I N U E D )
27a.
27b. 5.6 s 28. exponential decay 29. ( 1, 1)
and ( 2, 4) 30. 16
Quarter 4 Test, Form K1.
3
8 2.
1
28 3. 87
4.
5. 0 2
4 9 6. mean 9; median 10; mode 6
7. 1
2 8. inverse; The time decreases as the number
of volunteers increases. 9. minimum 70; first
quartile 73; median 80; third quartile 85;
maximum 92 10. skewed 11. The people
closest to the road might be less likely to be in
favor of it when compared with people who live
farther away. 12. 5 13. 5 3
2
14. 4n 2n 15. 1
4 16. 6, 1
17. x 1;
18. The graph will be the same shape, but it will
move down 3 units. 19. 1
4 20. x2 3x 5
21. x2 3x 2
x2 9 22.
n2 2n 10
n2 6n 8 23. 12
24. 2 25. 10 26. 60 27. 30 28. 74.5 ft
29. 18 3 10
30. sin A3
5; tan B
4
3
Mid-Course Test, Form K1. 11 2. 1
3
4 3. 12 4. 4 5. 10 6. 17 7. 30
8. 4 9. 2 10. y 2 11. 1 x 4
12. x 6
13. x 5
14. x 4 15. c(x) 1.39x 16. 128, 141 17. yes;
6 2 18. infinitely many solutions
19. $61 20. 0.25 gal 21. $7 22. 10 23. 4x 14
24. x 0.25(80); 20 25. 0.85(300) x; 255
26. 54.2% 27. 1
2 28. 6 29. y 2x 30. x 5
31. 5 32. y 3x 33. 6 6x 34. 4(x 3)
35.
36. 3 units up; The point (0, 0) becomes (0, 3)
with the new equation. 37. 6 ft 38. $60
39. Distributive Property 40. Brand B
41. (2, 12) 42. {1, 2, 3, 4, 6, 8} 43. The speed of
the object is zero. 44. 4 x 4
45. f (x) 5x 50 46. 6 47. y 2x 6
48. y 3x 49. 50% increase 50. The lines are
perpendicular.
Final Test, Form K1.
1
10, 0.6,
4
5 2. x 2 3. 62 mi/h 4. 15 h
5. 2 2
1 1
O 2 4 6 8
100
200
300
400
500
x
y
O
2
2
2 4 6x
y
O
4
4
4
4x
y
6 4 2 0 642
6 4 2 0 642
O
2
2
2
2x
y
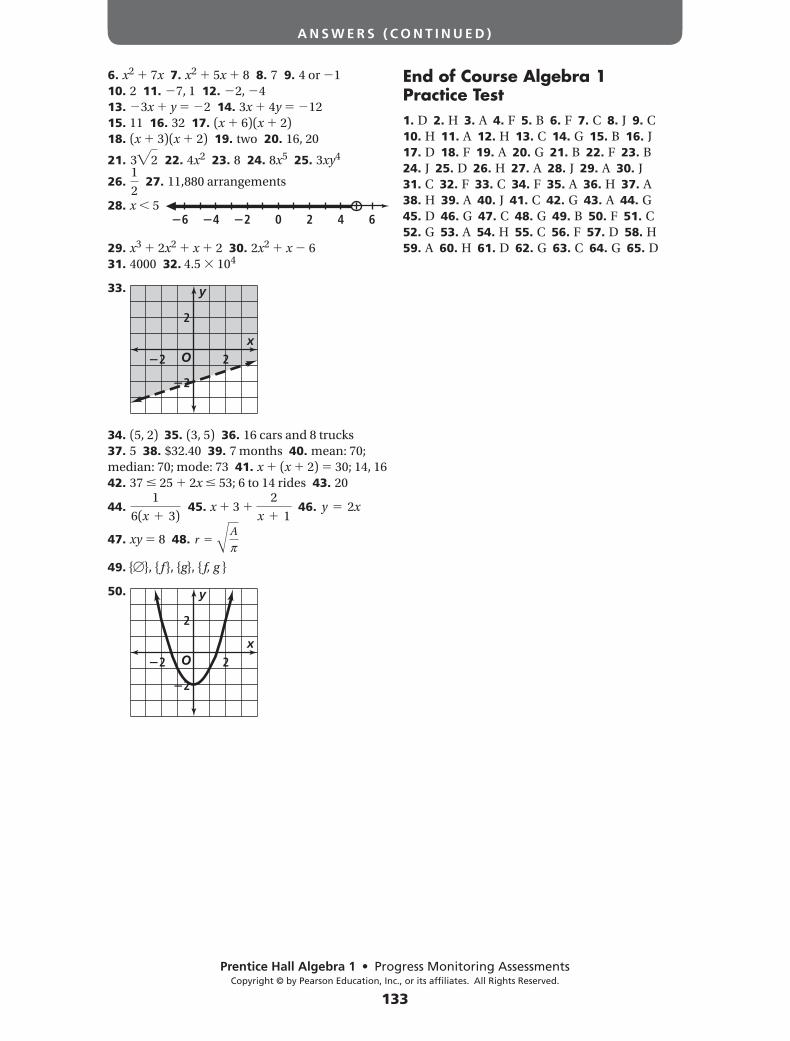
Progress Monitoring AssessmentsCopyright © by Pearson Education, Inc., or its affiliates. All Rights Reserved.
133
A N S W E R S ( C O N T I N U E D )
6. x2 7x 7. x2 5x 8 8. 7 9. 4 or 1
10. 2 11. 7, 1 12. 2, 4
13. 3x y 2 14. 3x 4y 12
15. 11 16. 32 17. (x 6)(x 2)
18. (x 3)(x 2) 19. two 20. 16, 20
21. 3 2 22. 4x2 23. 8 24. 8x5 25. 3xy4
26. 1
2 27. 11,880 arrangements
28. x 5
29. x3 2x2 x 2 30. 2x2 x 6
31. 4000 32. 4.5 104
33.
34. (5, 2) 35. (3, 5) 36. 16 cars and 8 trucks
37. 5 38. $32.40 39. 7 months 40. mean: 70;
median: 70; mode: 73 41. x (x 2) 30; 14, 16
42. 37 25 2x 53; 6 to 14 rides 43. 20
44. 1
6(x 3) 45. x 3
2
x 1 46. y 2x
47. xy 8 48. rA
49. { }, { f }, {g}, { f, g }
50.
End of Course Algebra 1 Practice Test1. D 2. H 3. A 4. F 5. B 6. F 7. C 8. J 9. C 10. H 11. A 12. H 13. C 14. G 15. B 16. J 17. D 18. F 19. A 20. G 21. B 22. F 23. B 24. J 25. D 26. H 27. A 28. J 29. A 30. J 31. C 32. F 33. C 34. F 35. A 36. H 37. A 38. H 39. A 40. J 41. C 42. G 43. A 44. G 45. D 46. G 47. C 48. G 49. B 50. F 51. C 52. G 53. A 54. H 55. C 56. F 57. D 58. H 59. A 60. H 61. D 62. G 63. C 64. G 65. D
6 4 2 0 642
O
2
2
2
2x
y
O
2
2
2
2x
y
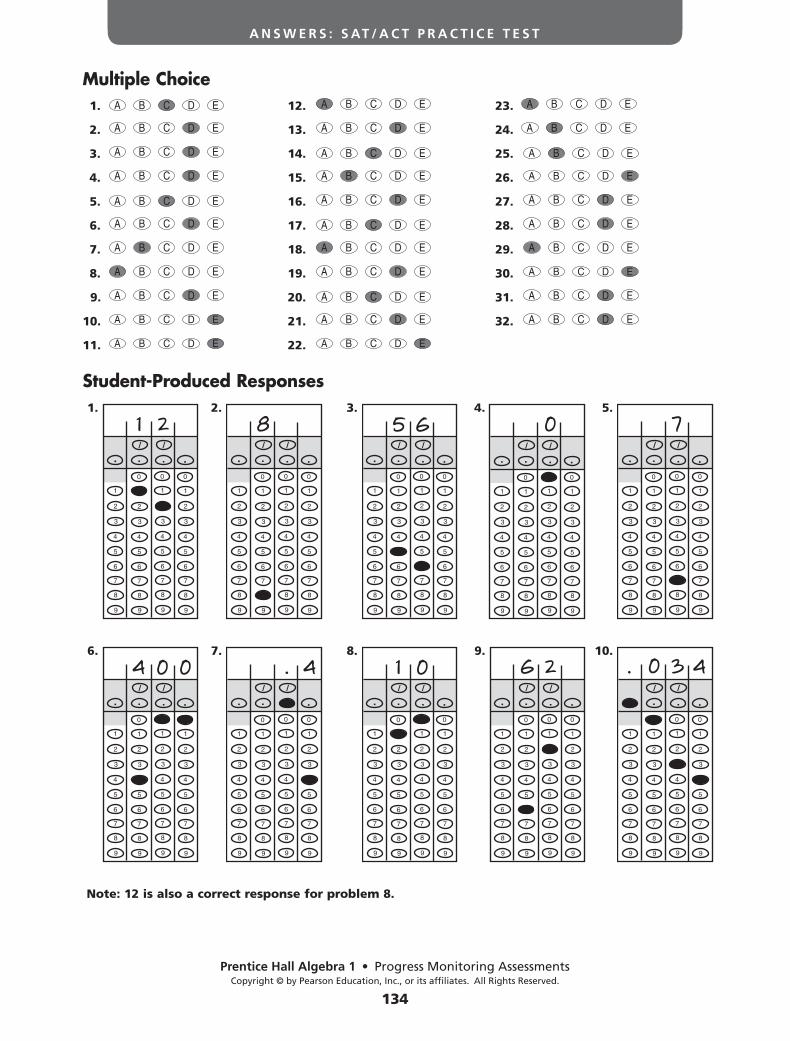
Progress Monitoring AssessmentsCopyright © by Pearson Education, Inc., or its affiliates. All Rights Reserved.
134
A N S W E R S : S AT / A C T P R A C T I C E T E S T
Multiple Choice 1. A B C D E 12. A B C D E 23. A B C D E
2. A B C D E 13. A B C D E 24. A B C D E
3. A B C D E 14. A B C D E 25. A B C D E
4. A B C D E 15. A B C D E 26. A B C D E
5. A B C D E 16. A B C D E 27. A B C D E
6. A B C D E 17. A B C D E 28. A B C D E
7. A B C D E 18. A B C D E 29. A B C D E
8. A B C D E 19. A B C D E 30. A B C D E
9. A B C D E 20. A B C D E 31. A B C D E
10. A B C D E 21. A B C D E 32. A B C D E
11. A B C D E 22. A B C D E
Student-Produced Responses 1. 2. 3. 4. 5.
6. 7. 8. 9. 10.
Note: 12 is also a correct response for problem 8.
1
3
2
4
5
6
7
8
9
1
3
2
4
5
6
7
8
9
1
3
2
4
5
6
7
8
9
1
3
2
4
5
6
7
8
9
0 0 0
. . . ./ /
1
3
2
4
5
6
7
8
9
1
3
2
4
5
6
7
8
9
1
3
2
4
5
6
7
8
9
1
3
2
4
5
6
7
8
9
0 0 0
. . . ./ /
1
3
2
4
5
6
7
8
9
1
3
2
4
5
6
7
8
9
1
3
2
4
5
6
7
8
9
1
3
2
4
5
6
7
8
9
0 0 0
. . . ./ /
1
3
2
4
5
6
7
8
9
1
3
2
4
5
6
7
8
9
1
3
2
4
5
6
7
8
9
1
3
2
4
5
6
7
8
9
0 0 0
. . . ./ /
1
3
2
4
5
6
7
8
9
1
3
2
4
5
6
7
8
9
1
3
2
4
5
6
7
8
9
1
3
2
4
5
6
7
8
9
0 0 0
. . . ./ /
1
3
2
4
5
6
7
8
9
1
3
2
4
5
6
7
8
9
1
3
2
4
5
6
7
8
9
1
3
2
4
5
6
7
8
9
0 0 0
. . . ./ /
1
3
2
4
5
6
7
8
9
1
3
2
4
5
6
7
8
9
1
3
2
4
5
6
7
8
9
1
3
2
4
5
6
7
8
9
0 0 0
. . . ./ /
1
3
2
4
5
6
7
8
9
1
3
2
4
5
6
7
8
9
1
3
2
4
5
6
7
8
9
1
3
2
4
5
6
7
8
9
0 0 0
. . . ./ /
1
3
2
4
5
6
7
8
9
1
3
2
4
5
6
7
8
9
1
3
2
4
5
6
7
8
9
1
3
2
4
5
6
7
8
9
0 0 0
. . . ./ /
1
3
2
4
5
6
7
8
9
1
3
2
4
5
6
7
8
9
1
3
2
4
5
6
7
8
9
1
3
2
4
5
6
7
8
9
0 0 0
. . . ./ /
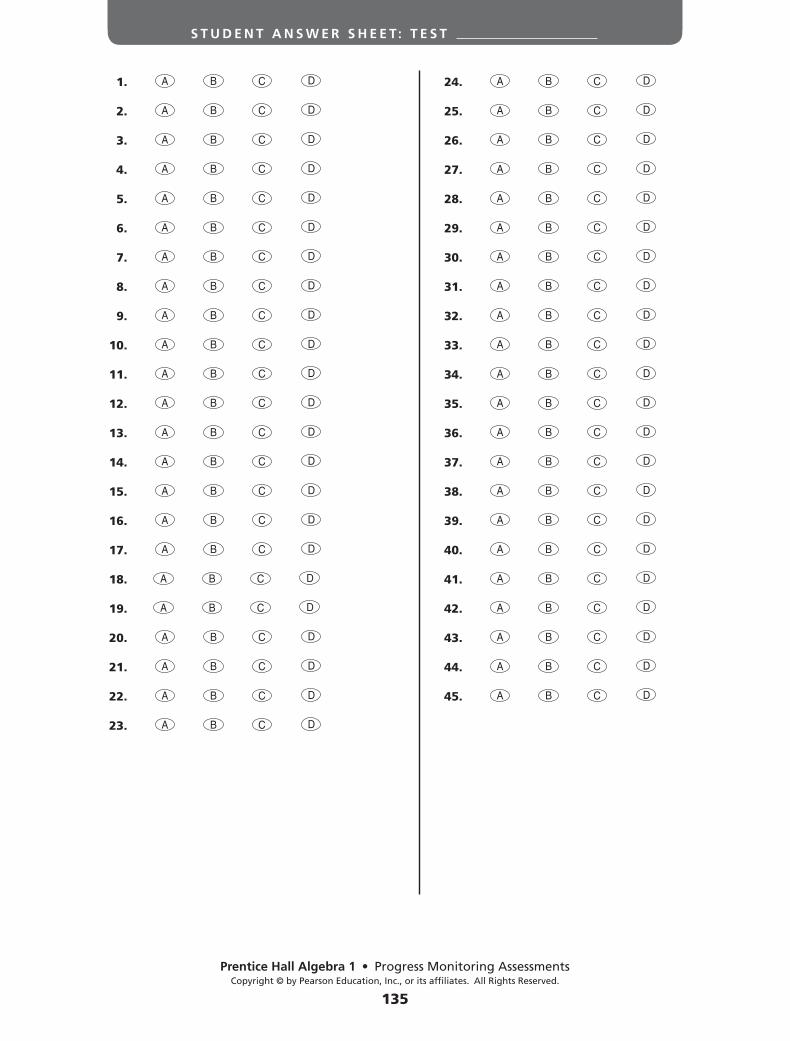
Progress Monitoring AssessmentsCopyright © by Pearson Education, Inc., or its affiliates. All Rights Reserved.
135
S T U D E N T A N S W E R S H E E T: T E S T
1. A B C D
2. A B C D
3. A B C D
4. A B C D
5. A B C D
6. A B C D
7. A B C D
8. A B C D
9. A B C D
10. A B C D
11. A B C D
12. A B C D
13. A B C D
14. A B C D
15. A B C D
16. A B C D
17. A B C D
18. A B C D
19. A B C D
20. A B C D
21. A B C D
22. A B C D
23. A B C D
24. A B C D
25. A B C D
26. A B C D
27. A B C D
28. A B C D
29. A B C D
30. A B C D
31. A B C D
32. A B C D
33. A B C D
34. A B C D
35. A B C D
36. A B C D
37. A B C D
38. A B C D
39. A B C D
40. A B C D
41. A B C D
42. A B C D
43. A B C D
44. A B C D
45. A B C D
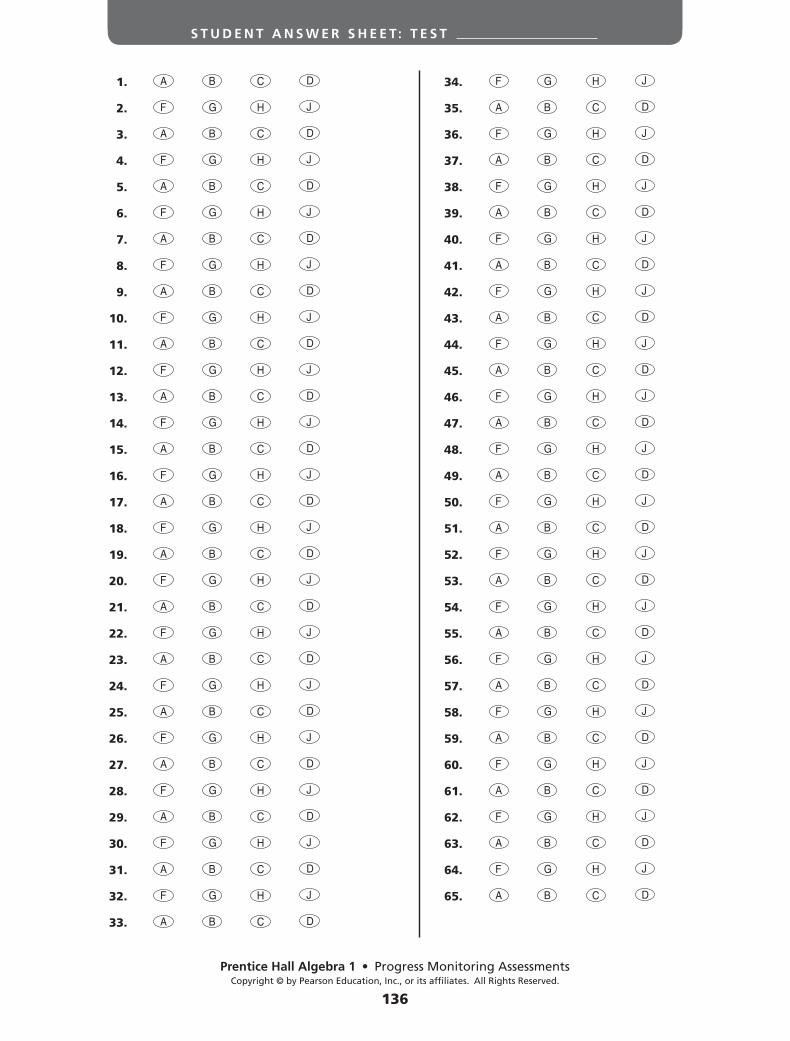
Progress Monitoring AssessmentsCopyright © by Pearson Education, Inc., or its affiliates. All Rights Reserved.
136
S T U D E N T A N S W E R S H E E T: T E S T
1. A B C D
2. F G H J
3. A B C D
4. F G H J
5. A B C D
6. F G H J
7. A B C D
8. F G H J
9. A B C D
10. F G H J
11. A B C D
12. F G H J
13. A B C D
14. F G H J
15. A B C D
16. F G H J
17. A B C D
18. F G H J
19. A B C D
20. F G H J
21. A B C D
22. F G H J
23. A B C D
24. F G H J
25. A B C D
26. F G H J
27. A B C D
28. F G H J
29. A B C D
30. F G H J
31. A B C D
32. F G H J
33. A B C D
34. F G H J
35. A B C D
36. F G H J
37. A B C D
38. F G H J
39. A B C D
40. F G H J
41. A B C D
42. F G H J
43. A B C D
44. F G H J
45. A B C D
46. F G H J
47. A B C D
48. F G H J
49. A B C D
50. F G H J
51. A B C D
52. F G H J
53. A B C D
54. F G H J
55. A B C D
56. F G H J
57. A B C D
58. F G H J
59. A B C D
60. F G H J
61. A B C D
62. F G H J
63. A B C D
64. F G H J
65. A B C D
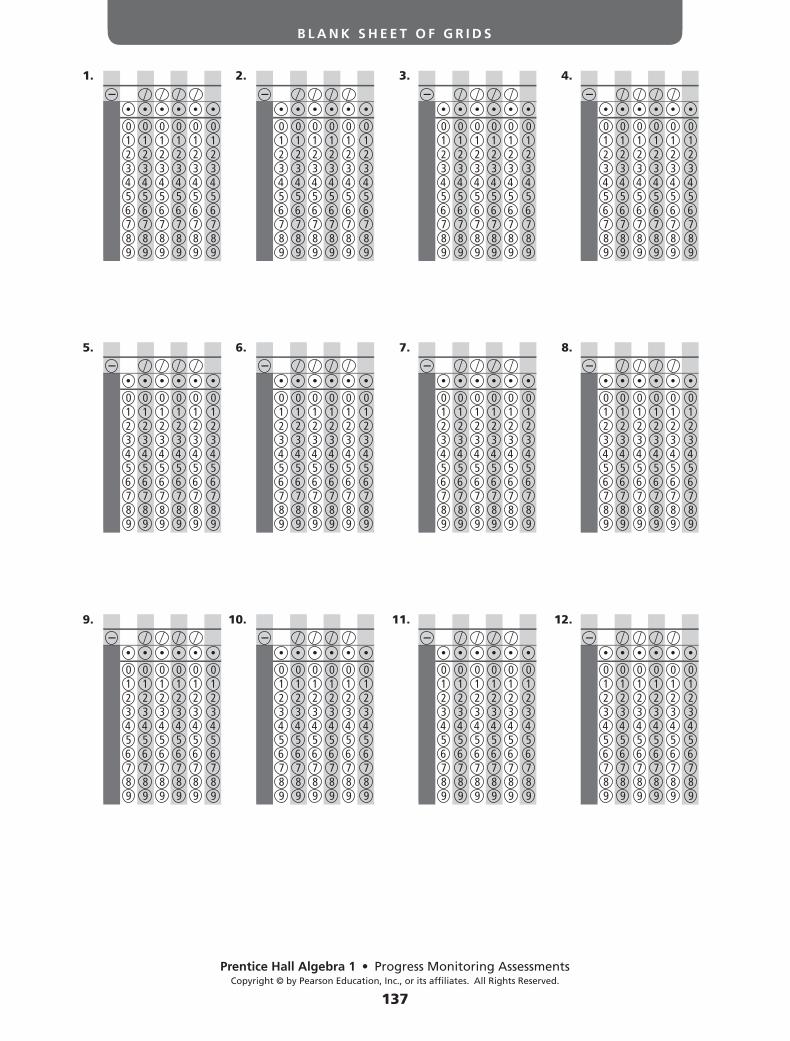
Progress Monitoring AssessmentsCopyright © by Pearson Education, Inc., or its affiliates. All Rights Reserved.
137
B L A N K S H E E T O F G R I D S
1. 2. 3. 4.
5. 6. 7. 8.
9. 10. 11. 12.
9876543210
9876543210
9876543210
9876543210
9876543210
9876543210
9876543210
9876543210
9876543210
9876543210
9876543210
9876543210
9876543210
9876543210
9876543210
9876543210
9876543210
9876543210
9876543210
9876543210
9876543210
9876543210
9876543210
9876543210
9876543210
9876543210
9876543210
9876543210
9876543210
9876543210
9876543210
9876543210
9876543210
9876543210
9876543210
9876543210
9876543210
9876543210
9876543210
9876543210
9876543210
9876543210
9876543210
9876543210
9876543210
9876543210
9876543210
9876543210
9876543210
9876543210
9876543210
9876543210
9876543210
9876543210
9876543210
9876543210
9876543210
9876543210
9876543210
9876543210
9876543210
9876543210
9876543210
9876543210
9876543210
9876543210
9876543210
9876543210
9876543210
9876543210
9876543210
9876543210
Progress Monitoring AssessmentsCopyright © by Pearson Education, Inc., or its affiliates. All Rights Reserved.
138
S T U D E N T A N S W E R S H E E T: S AT / A C T P R A C T I C E T E S T
Multiple Choice 1. A B C D E 12. A B C D E 23. A B C D E
2. A B C D E 13. A B C D E 24. A B C D E
3. A B C D E 14. A B C D E 25. A B C D E
4. A B C D E 15. A B C D E 26. A B C D E
5. A B C D E 16. A B C D E 27. A B C D E
6. A B C D E 17. A B C D E 28. A B C D E
7. A B C D E 18. A B C D E 29. A B C D E
8. A B C D E 19. A B C D E 30. A B C D E
9. A B C D E 20. A B C D E 31. A B C D E
10. A B C D E 21. A B C D E 32. A B C D E
11. A B C D E 22. A B C D E
Student-Produced Responses 1. 2. 3. 4. 5.
6. 7. 8. 9. 10.
1
3
2
4
5
6
7
8
9
1
3
2
4
5
6
7
8
9
1
3
2
4
5
6
7
8
9
1
3
2
4
5
6
7
8
9
0 0 0
. . . ./ /
1
3
2
4
5
6
7
8
9
1
3
2
4
5
6
7
8
9
1
3
2
4
5
6
7
8
9
1
3
2
4
5
6
7
8
9
0 0 0
. . . ./ /
1
3
2
4
5
6
7
8
9
1
3
2
4
5
6
7
8
9
1
3
2
4
5
6
7
8
9
1
3
2
4
5
6
7
8
9
0 0 0
. . . ./ /
1
3
2
4
5
6
7
8
9
1
3
2
4
5
6
7
8
9
1
3
2
4
5
6
7
8
9
1
3
2
4
5
6
7
8
9
0 0 0
. . . ./ /
1
3
2
4
5
6
7
8
9
1
3
2
4
5
6
7
8
9
1
3
2
4
5
6
7
8
9
1
3
2
4
5
6
7
8
9
0 0 0
. . . ./ /
1
3
2
4
5
6
7
8
9
1
3
2
4
5
6
7
8
9
1
3
2
4
5
6
7
8
9
1
3
2
4
5
6
7
8
9
0 0 0
. . . ./ /
1
3
2
4
5
6
7
8
9
1
3
2
4
5
6
7
8
9
1
3
2
4
5
6
7
8
9
1
3
2
4
5
6
7
8
9
0 0 0
. . . ./ /
1
3
2
4
5
6
7
8
9
1
3
2
4
5
6
7
8
9
1
3
2
4
5
6
7
8
9
1
3
2
4
5
6
7
8
9
0 0 0
. . . ./ /
1
3
2
4
5
6
7
8
9
1
3
2
4
5
6
7
8
9
1
3
2
4
5
6
7
8
9
1
3
2
4
5
6
7
8
9
0 0 0
. . . ./ /
1
3
2
4
5
6
7
8
9
1
3
2
4
5
6
7
8
9
1
3
2
4
5
6
7
8
9
1
3
2
4
5
6
7
8
9
0 0 0
. . . ./ /