prentice hall algebra 1 - · pdf fileprentice hall algebra 1 project report 8-31-05 gatti...
TRANSCRIPT
PRENTICE HALLALGEBRA 1
PROJECT REPORT8-31-05
Inc.GattiEvaluation
ONLINE INTERVENTION SYSTEM PILOT STUDY
Gatti Evaluation Inc.
2
1 http://www.phschool.com/2 Tse-chi Hsu PhD, Research Methods Expert [Professor (emeritus), Research Methodology, University of Pittsburgh] Marty Cohen PhD, Mathematics Curriculum & Instruction Expert [Professor, Mathematics Education, University of
Pittsburgh] Terry Goodman PhD, Mathematics Curriculum & Instruction Expert [Professor, Mathematics Education, Central Michigan State University] Gregory Schraw PhD, Curriculum & Instruction Expert [Professor, Department of Educational Psychology, University of Nevada Las Vegas] Steve Lehman PhD, Educational Technology Expert [Assistant Professor, Department of Psychology, Utah State University]
Principal Investigator
Guido G. Gatti
Gatti Evaluation Inc.
162 Fairfax Rd
Pittsburgh, PA 15221
(412) 371-9832
Fax: (412) 371-3560
Primary Stakeholder
Funded by Prentice Hall1, Pearson Education Inc.
For Information From Primary Stakeholder Please Contact:
Marcy Baughman, Director of Educational Research
(617) 671-2652
Consulting Team2
Tse-chi Hsu
Gregory Schraw
Steve Lehman
Marty Cohen
Terry Goodman
Gatti Evaluation Inc.
3
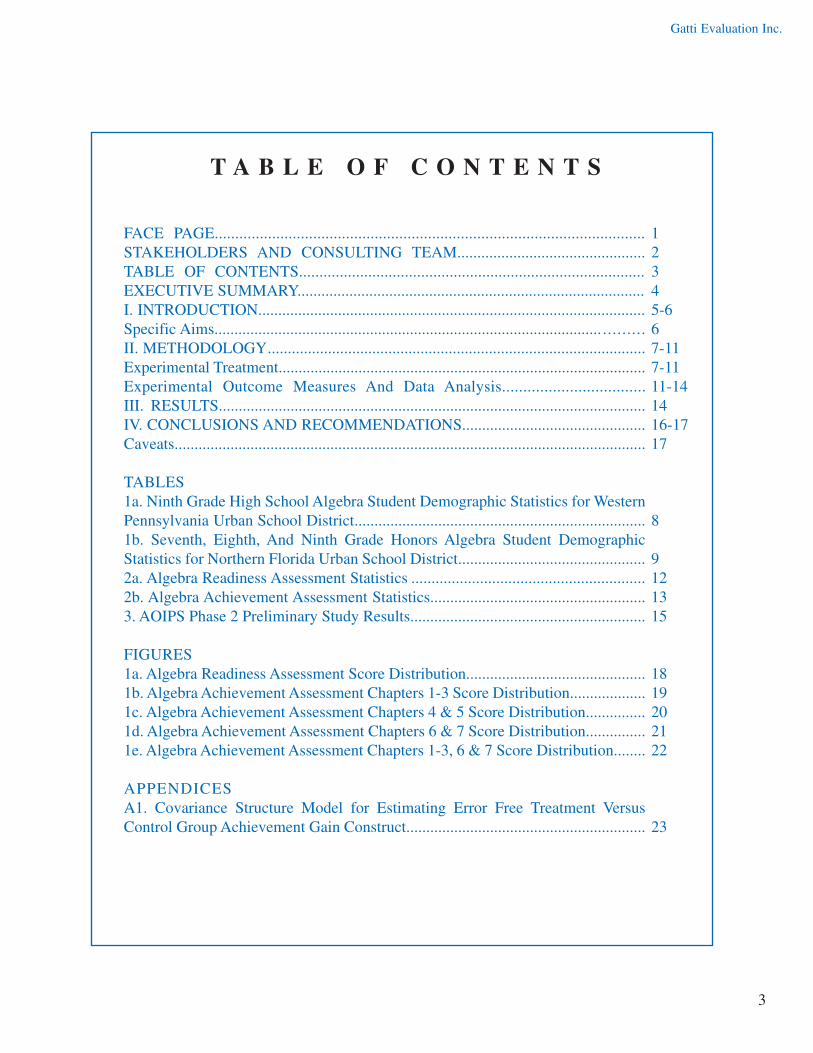
FACE PAGE.........................................................................................................STAKEHOLDERS AND CONSULTING TEAM...............................................TABLE OF CONTENTS.....................................................................................EXECUTIVE SUMMARY.......................................................................................I. INTRODUCTION.................................................................................................Specific Aims................................................................................................. .........II. METHODOLOGY..............................................................................................Experimental Treatment............................................................................................Experimental Outcome Measures And Data Analysis..................................III. RESULTS...........................................................................................................IV. CONCLUSIONS AND RECOMMENDATIONS..............................................Caveats......................................................................................................................
TABLES .....1a. Ninth Grade High School Algebra Student Demographic Statistics for WesternPennsylvania Urban School District.........................................................................1b. Seventh, Eighth, And Ninth Grade Honors Algebra Student Demographic Statistics for Northern Florida Urban School District...............................................2a. Algebra Readiness Assessment Statistics ..........................................................2b. Algebra Achievement Assessment Statistics......................................................3. AOIPS Phase 2 Preliminary Study Results...........................................................
FIGURES ....1a. Algebra Readiness Assessment Score Distribution.............................................1b. Algebra Achievement Assessment Chapters 1-3 Score Distribution...................1c. Algebra Achievement Assessment Chapters 4 & 5 Score Distribution...............1d. Algebra Achievement Assessment Chapters 6 & 7 Score Distribution...............1e. Algebra Achievement Assessment Chapters 1-3, 6 & 7 Score Distribution........
APPENDICES.... . . . . . . . . . . . . . . . . . . . . . . . . . . . . . . . . . . . . . . . . . . . . . . . . . . . . . . . . . . . . . . . . . . . . . . . . . . .A1. Covariance Structure Model for Estimating Error Free Treatment Versus Control Group Achievement Gain Construct............................................................
T A B L E O F C O N T E N T S
12345-667-117-1111-141416-1717
8
9121315
1819202122
23
Gatti Evaluation Inc.
4
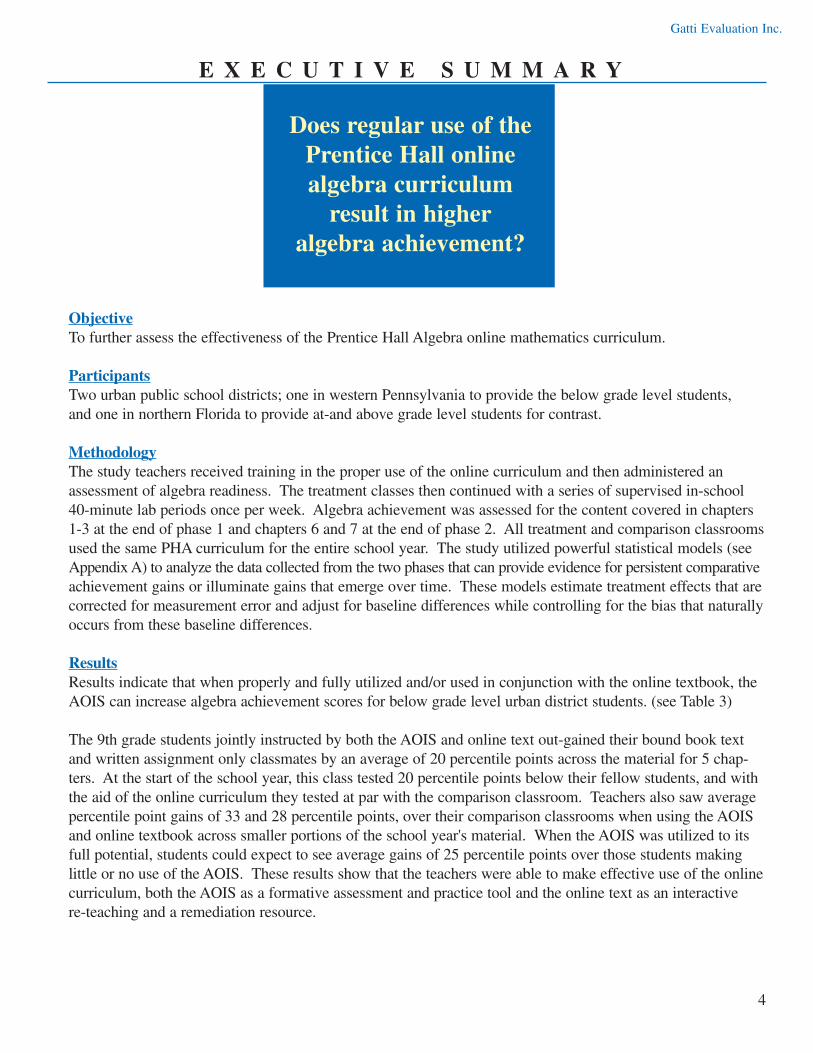
ObjectiveTo further assess the effectiveness of the Prentice Hall Algebra online mathematics curriculum.
ParticipantsTwo urban public school districts; one in western Pennsylvania to provide the below grade level students, and one in northern Florida to provide at-and above grade level students for contrast.
MethodologyThe study teachers received training in the proper use of the online curriculum and then administered anassessment of algebra readiness. The treatment classes then continued with a series of supervised in-school40-minute lab periods once per week. Algebra achievement was assessed for the content covered in chapters1-3 at the end of phase 1 and chapters 6 and 7 at the end of phase 2. All treatment and comparison classroomsused the same PHA curriculum for the entire school year. The study utilized powerful statistical models (seeAppendix A) to analyze the data collected from the two phases that can provide evidence for persistent comparativeachievement gains or illuminate gains that emerge over time. These models estimate treatment effects that arecorrected for measurement error and adjust for baseline differences while controlling for the bias that naturallyoccurs from these baseline differences.
ResultsResults indicate that when properly and fully utilized and/or used in conjunction with the online textbook, theAOIS can increase algebra achievement scores for below grade level urban district students. (see Table 3)
The 9th grade students jointly instructed by both the AOIS and online text out-gained their bound book textand written assignment only classmates by an average of 20 percentile points across the material for 5 chap-ters. At the start of the school year, this class tested 20 percentile points below their fellow students, and withthe aid of the online curriculum they tested at par with the comparison classroom. Teachers also saw averagepercentile point gains of 33 and 28 percentile points, over their comparison classrooms when using the AOISand online textbook across smaller portions of the school year's material. When the AOIS was utilized to itsfull potential, students could expect to see average gains of 25 percentile points over those students making little or no use of the AOIS. These results show that the teachers were able to make effective use of the onlinecurriculum, both the AOIS as a formative assessment and practice tool and the online text as an interactive re-teaching and a remediation resource.
E X E C U T I V E S U M M A R Y
Does regular use of thePrentice Hall online algebra curriculum
result in higheralgebra achievement?
Gatti Evaluation Inc.
5
Gatti Evaluation started evaluating Pearson Education's algebra 1 online curriculum system in classrooms from two
states in the fall of the 2004-2005 school year. The online curriculum follows the Prentice Hall Algebra 1 curriculum
(PHA) and consists of the interactive online textbook and the algebra online intervention system (AOIS3). The
AOIS is a computer-based, assessment driven, algebra intervention with assessments and a student tracking system
that may be accessed alone or used in combination with the interactive textbook. The Pearson Learning Group
division of Pearson Education is currently developing an online mathematics remediation intervention that will
also be offered with the online Prentice Hall mathematics curriculum.
I . I N T R O D U C T I O N
The Prentice Hall online curriculum is designed to help teachers make better use of assessment in
their instructional decision-making.
Research has shown that making assessment an integral part of instructional practice is associated with improved
student learning (NCTM 20004). The National Council of Teachers of Mathematics (2000) also emphasizes that
technology enhances mathematics learning and supports effective mathematics teaching. To this end the PHA
online curriculum provides feedback to students about their thinking, helps students visualize difficult-to-understand
concepts, and addresses the need for sufficient practice of important skills and ideas. Although both formative
student achievement assessment and educational technology may be skillfully combined to create an intervention
that significantly increases achievement, poorly designed products will provide no more benefit than that of a
paper text book and may even be detrimental. A poorly designed product can confuse and frustrate students and
teachers - proving to be a waste of valuable learning time. For this reason it is always necessary to pilot test these
new products for design improvements and best practice methods.
The individualized student tracking format of the online curriculum should ease the burden of regularly testing
entire classrooms by automatically providing the teacher with student progress reports on each skill assessed.
The system also provides individualized re-teaching and re-testing of non-mastered skills by suggesting further
online educational activities. Activities may also be assigned to individual students or entire classes. Interactive
online activities are offered in the form of chapter imbedded tutorials and games, along with teaching videos clips,
audio vocabulary clips, and downloadable post script worksheets. Tests and activities can be searched by both
chapter and National Assessment of Educational Progress (NAEP) or state educational objective.
3 Pearson Education (2004). Math Online Intervention: Putting Research into Practice, Grade 1 Through Algebra. Pearson Education Inc. http://www.phschool.com/atschool/4 National Council of Teaching of Mathematics (2000). Principles and Standards for School Mathematics. Reston, Va.: National Council of Teachers of Mathematics.
Gatti Evaluation Inc.
6
The AOIS assessments offer static sets of questions from the PHA textbook's chapter reviews, chapter tests, and
checkpoint quizzes online in the form of multiple choice chapter vocabulary tests, chapter diagnosing readiness
tests, chapter review tests (i.e., split up by lessons), and check point quizzes (i.e., two quizzes per chapter) with
additional re-tests for each. Benchmark tests (i.e., every two chapters) designed to be aligned to NAEP or state
educational objectives are also offered. Test, re-test, and benchmark test results are tracked individually in each
student's online profile along with those online activities accessed.
In the first and second phases of the evaluation data was collected to address the research question,
does regular use of the online algebra curriculum result in higher algebra achievement?
Phase II is a continuation of the pilot study started in the Fall of 2004 intended to further assess the effectiveness
of the Prentice Hall Algebra online mathematics curriculum5. Prentice Hall's parent company, Pearson Education,
is funding the pilot study, covering costs for developing algebra achievement assessments, site recruitment, data
collection, onsite training, and providing on-going technical support. Pearson Education also worked with the
Wisconsin Center for Educational Research (WCER) and Gatti Evaluation to improve the quality and alignment
to state standards of the grades 3 to Algebra mathematics benchmark tests6,7.
Specific AimsData was collected to further address the efficacy of the Prentice Hall online algebra curriculum, specifically in
effecting increases in achievement for students previously performing below grade level in mathematics. The
main research question was:
Do below grade level algebra students making regular use of components offered with the online algebra curriculum,
under controlled conditions over the course of several months and across diverse algebraic skills, demonstrate
higher achievement and skill mastery as evidenced by statistically and practically significantly higher achievement
test scores?
Research hypotheses will be tested empirically through a randomized controlled experiment.
TL1
Do below grade level algebra students making regular use of components offered with the online
algebra curriculum, under controlled conditions over the course of several months and across
diverse algebraic skills, demonstrate higher achievement and skill mastery as evidenced by statistically
and practically significantly higher achievement test scores?
5 Gatti, G. G. (April, 2005). Prentice Hall Algebra 1 online intervention system pilot study phase 1. Evaluation report prepared for, and submitted to, Pearson Education by Gatti Evaluation.6 Gatti, G. G. (September, 2004). Prentice Hall Mathematics benchmark item-validation study. Evaluation report prepared for, and submitted to, Pearson Education by Gatti Evaluation.7 Smithson, J (August, 2004). Summary report on alignment Analysis of Scott Foresman Mathematics test forms to Gr. 4 & Gr. 8 NAEP benchmarks & state mathematics standards in ten states. Evaluation report prepared for, and
submitted to, Pearson Education by Wisconsin Center for Educational Research.
Gatti Evaluation recruited an urban-fringe public school district in Western Pennsylvania and Northern Florida and received memorandums of understanding (MOU) from them signed by their district directors of mathematicsand school principals. The MOUs described the confidentiality concerns and the responsibilities of the schools, the principle investigator and the corporate partner. Each school was expected to contribute about 100-150 algebra1 students to the study. According to the National Center for Educational Statistics (NCES) the 2000-2001 studentpopulation of the participating Florida school is 66% White, 9% Hispanic, 24% African American, and 1% Asianwith 20% of students receiving free or reduced priced lunch. The Pennsylvania school is 90% White, 8% AfricanAmerican, 1% Asian, and 1% Hispanic with 10% of students receiving free or reduced priced lunch. The schoolsare designated urban by the NCES as they are located inside a large or mid-sized city. The PI would not characterizethese schools as large urban area inner-city schools.
In recruiting classrooms, an effort was made to maximize the diversity of gender, race and ethnicity. The publicschools included in the study are representative of the race, ethnic, and socio-economic makeup of their local areas.Students are included in the study based solely upon their enrollment in an algebra course at the schools and agree-ing to participate in the study. No students of any socio-economic level, race or ethnic background, that opted toparticipate in the study, were excluded from the study and absolutely none of the students were denied access to the online system. It is not possible to insure that students of all race and ethnic background are included in thestudy as intact classes are studied and these classes may not contain complete diversity.
All parents of students under observation were required to sign informed consent forms before students participatedin the study. The online curriculum remained available to all students regardless of their participation in the studyand student grades in no way depended on participation. Teachers, students, the school, and the district retained the right to opt out of the study at any time and were not bound to complete the remaining milestones of the study.Upon completion of the data collection any teacher, student, school, or district may opt to be omitted from anyresults presented or published.
This research involved human subjects, specifically the collection of 7th, 8th, and 9th grade student achievementtest scores and the monitoring of the completion of educational activities. This research is considered exempt from federal oversight regulations because it was conducted in an established educational setting involving normaleducational practices with minimal disruption and involves the collection of data using sanctioned educationaltests, survey procedures and public observation8.
Experimental TreatmentGatti Evaluation recruited an urban public school district in Western Pennsylvania (USDWP) as well as an urbanpublic school district in Northern Florida (USDNF). In USDWP, all 163 ninth grade high school algebra studentswere randomly assigned to one of two teachers each teaching three classes (teacher D periods 1, 2, & 3; teacher Lperiods 1, 2, & 3). USDWP uses specially designed software to schedule classes. This software randomlyassigned students to algebra classes based upon availability (i.e., classes with single session offerings get priority).The only complication with regard to random assignment was for 15 student band members. Band practice wasoffered during a single period; therefore, band members could not be assigned to TD's period 2 algebra.
Gatti Evaluation Inc.
7
I I . M E T H O D O L O G Y
8 Gatti Evaluation, the principle investigator, and the publisher understand that any unauthorized disclosure of confidential student information is unethical and illegal as provided in the federal Family Educational Rights and Privacy Act of1974 (FERPA). Gatti Evaluation has promised in writing to guard confidentiality of student data it collects as well as that data entrusted to it. Designated qualified school personnel act as honor brokers for any and all sensitive student information including achievement test scores and will release this information in accordance with the regulations set forth by their districts and states. The principle investigator has completed the Research Integrity Module (October, 2001) and the Health Insurance Portability and Accountability Act (HIPPA) Researchers Privacy Requirements Module (April, 2003) offered by the University of Pittsburgh Education and Certification Program in Research Practice Fundamentals. The principle investigator has also satisfactorily completed the National Institute of Health's Office of Human Subjects Research Protection of Human Research Subjects certification (March, 2001). Gatti Evaluation, the publisher, and the participating schools are aware of the civil rights of the subjects and personnel involved with the study and are sensitive to the needs of handicapped and learning disabled students.
27 28 28 27 27 26All Students 163
Gatti Evaluation Inc.
8
One hundred sixty three ninth grade urban fringe high school algebra students were randomly assigned
to study classrooms.
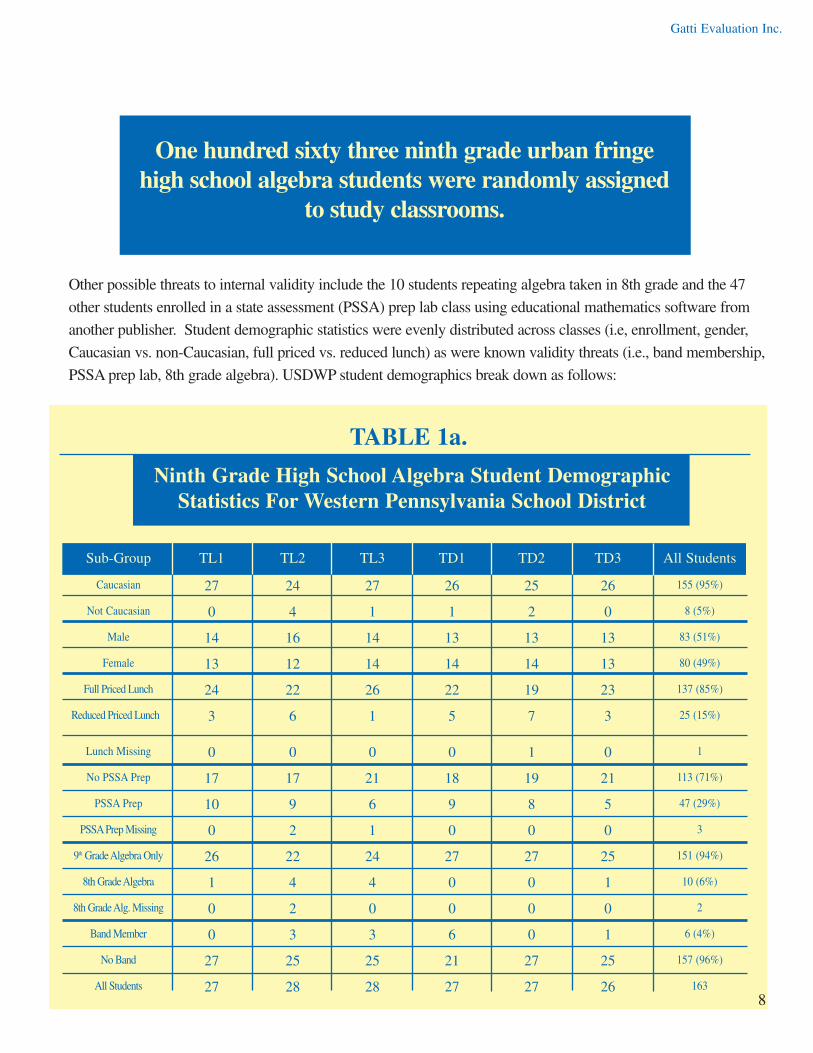
Other possible threats to internal validity include the 10 students repeating algebra taken in 8th grade and the 47
other students enrolled in a state assessment (PSSA) prep lab class using educational mathematics software from
another publisher. Student demographic statistics were evenly distributed across classes (i.e, enrollment, gender,
Caucasian vs. non-Caucasian, full priced vs. reduced lunch) as were known validity threats (i.e., band membership,
PSSA prep lab, 8th grade algebra). USDWP student demographics break down as follows:
TABLE 1a.
Ninth Grade High School Algebra Student Demographic Statistics For Western Pennsylvania School District
TL1 TL2 TL3 TD1 TD2 TD3Sub-Group All Students
27 24 27 26 25 26Caucasian 155 (95%)
0 4 1 1 2 0Not Caucasian 8 (5%)
14 16 14 13 13 13Male 83 (51%)
13 12 14 14 14 13Female 80 (49%)
24 22 26 22 19 23Full Priced Lunch 137 (85%)
3 6 1 5 7 3Reduced Priced Lunch 25 (15%)
0 0 0 0 1 0Lunch Missing 1
17 17 21 18 19 21No PSSA Prep 113 (71%)
10 9 6 9 8 5PSSA Prep 47 (29%)
0 2 1 0 0 0PSSAPrep Missing 3
26 22 24 27 27 259th Grade Algebra Only 151 (94%)
1 4 4 0 0 18th Grade Algebra 10 (6%)
0 2 0 0 0 08th Grade Alg. Missing 2
0 3 3 6 0 1Band Member 6 (4%)
27 25 25 21 27 25No Band 157 (96%)
Gatti Evaluation Inc.
9
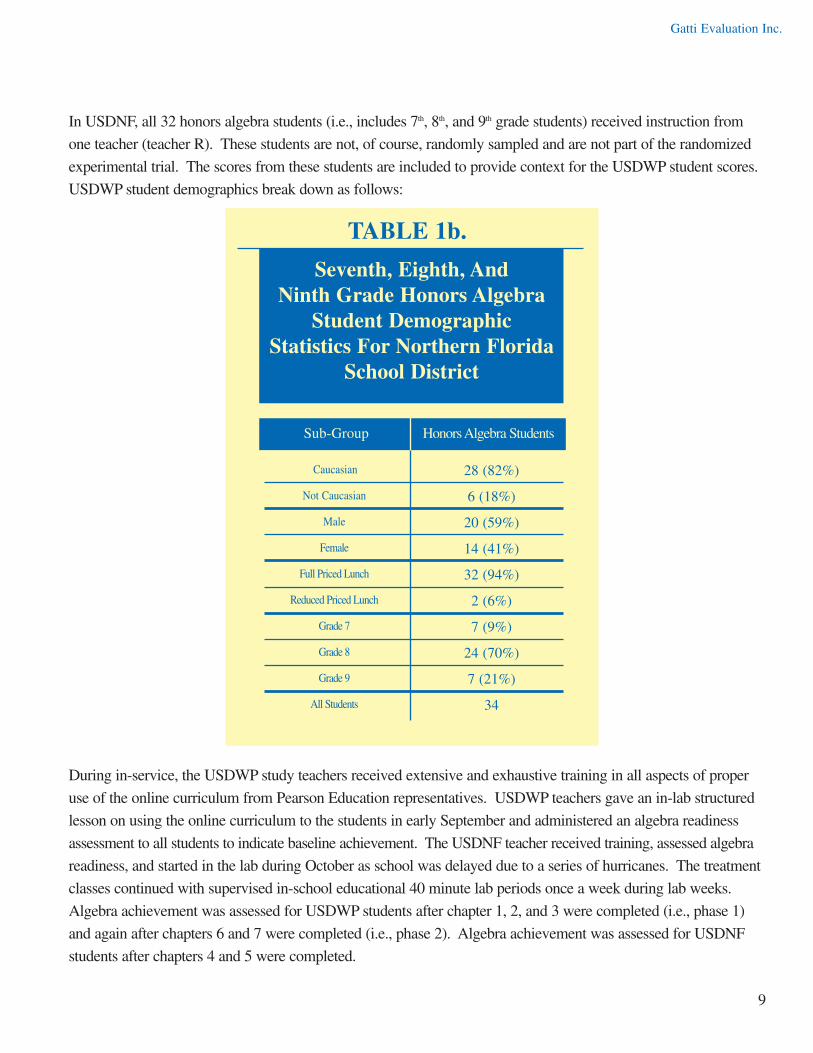
In USDNF, all 32 honors algebra students (i.e., includes 7th, 8th, and 9th grade students) received instruction from
one teacher (teacher R). These students are not, of course, randomly sampled and are not part of the randomized
experimental trial. The scores from these students are included to provide context for the USDWP student scores.
USDWP student demographics break down as follows:
TABLE 1b.
Seventh, Eighth, And Ninth Grade Honors Algebra
Student Demographic Statistics For Northern Florida
School District
Honors Algebra StudentsSub-Group
34All Students
28 (82%)Caucasian
6 (18%)Not Caucasian
20 (59%)Male
14 (41%)Female
32 (94%)Full Priced Lunch
2 (6%)Reduced Priced Lunch
7 (9%)Grade 7
24 (70%)Grade 8
7 (21%)Grade 9
During in-service, the USDWP study teachers received extensive and exhaustive training in all aspects of proper
use of the online curriculum from Pearson Education representatives. USDWP teachers gave an in-lab structured
lesson on using the online curriculum to the students in early September and administered an algebra readiness
assessment to all students to indicate baseline achievement. The USDNF teacher received training, assessed algebra
readiness, and started in the lab during October as school was delayed due to a series of hurricanes. The treatment
classes continued with supervised in-school educational 40 minute lab periods once a week during lab weeks.
Algebra achievement was assessed for USDWP students after chapter 1, 2, and 3 were completed (i.e., phase 1)
and again after chapters 6 and 7 were completed (i.e., phase 2). Algebra achievement was assessed for USDNF
students after chapters 4 and 5 were completed.
Gatti Evaluation Inc.
10
During this time all classrooms used the same Prentice Hall Algebra 1 curriculum and bound book text. Chapter 1
reviewed basic skill and included lessons on using variables, exponents, order of operations, adding/subtracting/multi-
plying/dividing real numbers, properties of real numbers, distributive property, and graphing using coordinate plane.
Chapter 2 included lessons on solving multiple step equations, including formulas, and measures of central tendency.
Chapter 3 included lessons on solving and graphing inequalities, including multi-step inequalities, and absolute
value equations. Chapter 4 included lessons on calculating ratios, proportions, percent change, and probability.
Chapter 5 covers number patterns, function rules, reading tables and graphs, relationships, and direct variation.
Chapter 6 addresses linear equations including lessons on different forms, rate of change, parallel and perpendicular
lines, scatter plots, and absolute value equations. Chapter 7 covers solving and applications of systems of equations
and inequalities.
Teacher L's (TL) periods L1 and L2 were set as the control classes for TL. Students in periods L1 and L2 were not
taken to the computer lab but rather received additional instruction from their teacher and worked individually on
paper and pencil tasks. TL's period L3 was designated as TL's treatment class. TL's period L3 students started lab
by opening the interactive online textbook to review lessons and use the imbedded activities. Selected online tests
(i.e., 5 chapter review, 2 checkpoint quizzes, 1 diagnosing readiness, 1 vocabulary) were assigned as practice only
when deemed appropriate by TL. TL scheduled 9 labs during phase 1 and 4 labs during phase 2. To maintain a
fair grading policy, TL's period L1, L2, and L3 students received up to 10 participation points, factored into final
first quarter grades, for working attentively in each lab or working on their in-class paper and pencil activities.
Periods L1, L2, and L3 also took the same paper and pencil exams to be counted for their final grades.
Teacher D's (TD) periods D2 and D3 were designated as TD's treatment classes for phase 1. During phase 1, TD
scheduled 12 labs and assigned period D2 and D3 students to complete 23 of the 28 available online chapter
review, checkpoint, vocabulary, and diagnosing readiness tests for the first three chapters. The total correct across
all the online tests and re-tests was used as a quiz grade and counted towards students' final first quarter grade.
Period D2 and D3 students were encouraged to check their answers on the initial test, look through online activities,
and try for a better score on the re-test. TD's period D1 was designated as TD's control class during phase 1 and
used the online curriculum sparingly, completing only 12 of the 28 online tests available for chapters 1-3.
During phase 2, TD scaled back usage of the system for periods D2 and D3 only assigning 9 of the 19 available
online tests over six lab periods. In phase 2, period D1 students also attended six lab sessions. However, TD
assigned period D1 activities from the online text along with online tests from the AOIS. Periods D2 and D3 were
considered the control classes for phase 2 and D1 the treatment. Teacher R also used the AOIS sparingly during
the observation period, assigning 8 of the 19 online tests available for chapters 4 and 5.
Gatti Evaluation Inc.
11
The principal investigator had unlimited online accessto monitor student progress, made regular site visits,
and was given access to teacher's grade books.
Teachers were able to monitor progress for students in the treatment classes through online reports generated by
the system as well as by walking around the lab and watching students work and answering questions. In addition
to the training, two formal site visits were made to each district. Representatives from the publisher were present
for all these meetings. The principal investigator (PI) monitored the treatment implementation over the web and
had unlimited access to the system. The PI could see which tasks were assigned and completed by students as
well as read written lab instructions given to students. The PI was also given access to teacher's grade books and
kept in continuous contact with district personnel by phone and e-mail.
Experimental Outcome Measures And Data AnalysisStudent algebra readiness was assessed using a 28 question multiple choice assessment (ART) specially
designed for the pilot study by the principal investigator and study consultants. The readiness exam was designed
to be completed in a single class period and was meant to assess students' incoming knowledge of algebraic concepts
as well as procedures and concepts covered by the first three chapters of the PHA text. USDWP student algebra
achievement was assessed prior to winter break for phase 1 by a 39 question exam (AAT123) specially aligned to
the lessons in the first three chapters of the PHA text. In May, USDWP students were assessed for phase 2 on a 15
question exam (AAT67) aligned to the lessons in chapters 6 and 7. Likewise, USDNF students were assessed in
February on a 19 question exam (AAT45) aligned to the lessons in chapters 4 and 5. Though USDWP and USDNF
students were instructed on material not covered by the study assessments, no additional achievement data was
collected on this material.
The algebra achievement tests were compiled by the PI, composed of questions written by the study consultants
that are aligned to material in lessons from the PHA text, to ensure that students could be assessed on that algebra
content actually covered in the classroom. The AATs contain constructed response items (i.e., answer choices not
provided) designed to assess both procedural as well as conceptual knowledge of algebraic concepts. Scores on
the ART are intended to inform student baseline algebra achievement which will be factored into comparisons of
AAT scores across study groups. All responses were entered into a database and checked for accuracy by inde-
pendent consultants that also carefully looked over original test forms for irregularities and instances of cheating.
Gatti Evaluation Inc.
12
The study used a randomized pre- and post-test comparison group research design.
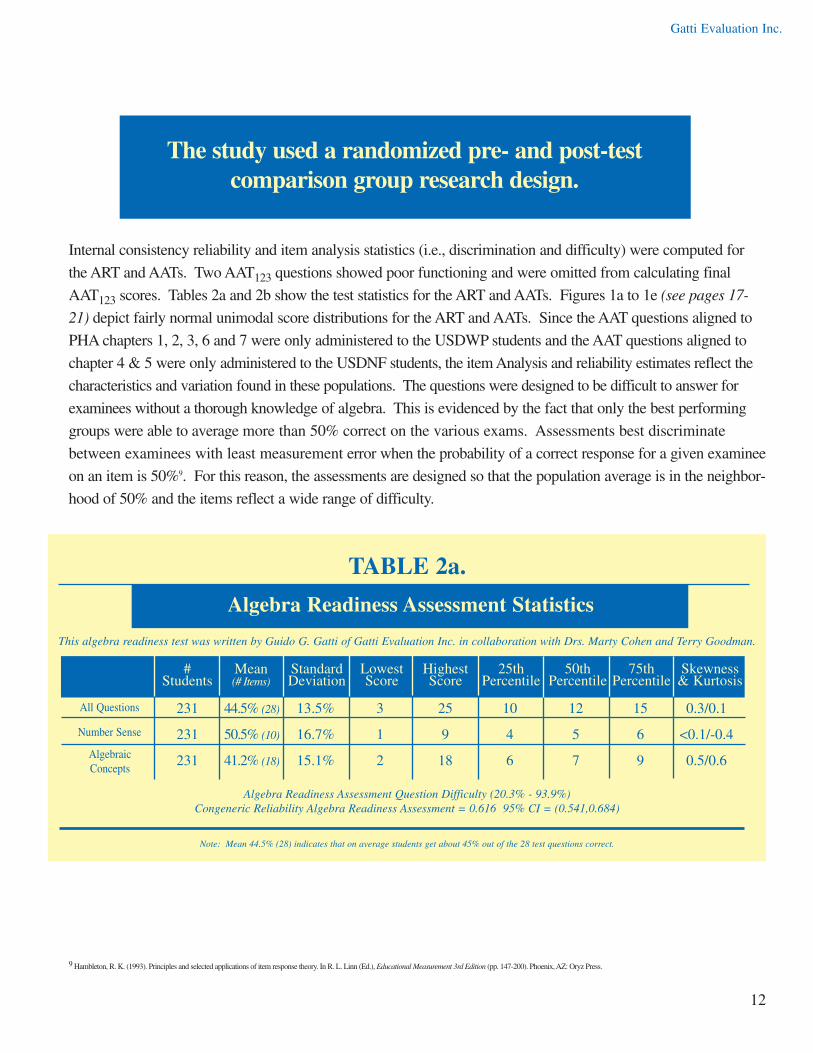
Internal consistency reliability and item analysis statistics (i.e., discrimination and difficulty) were computed for
the ART and AATs. Two AAT123 questions showed poor functioning and were omitted from calculating final
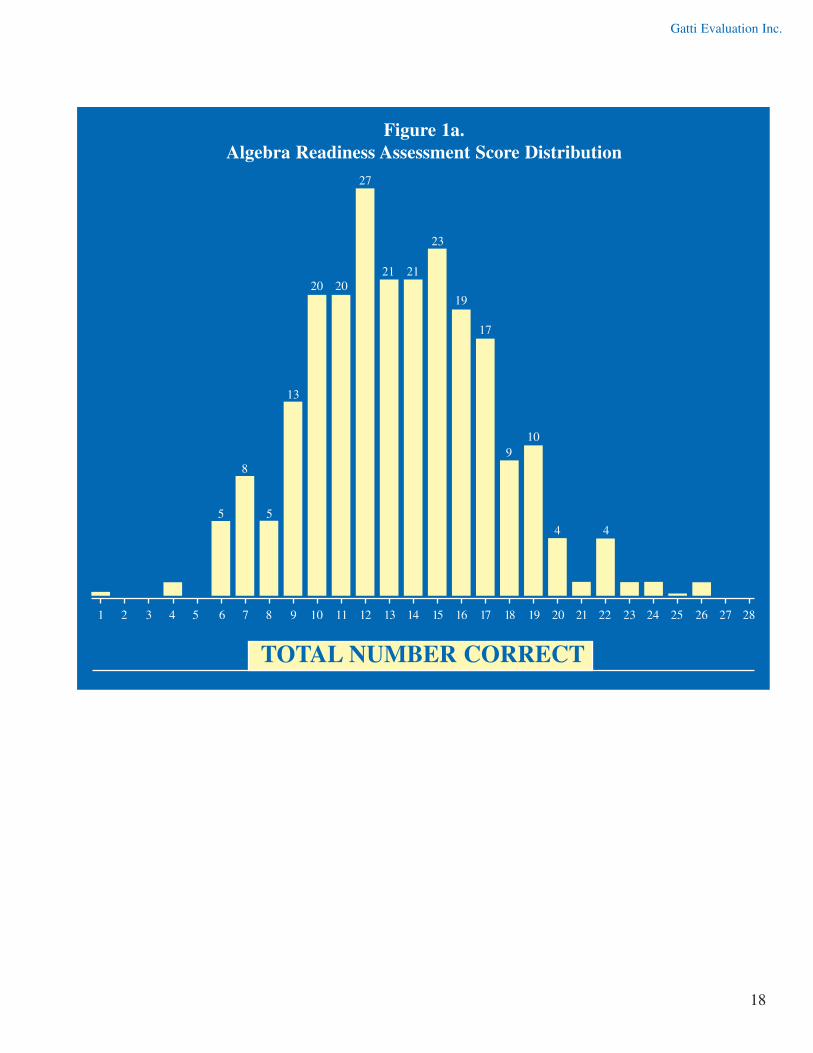
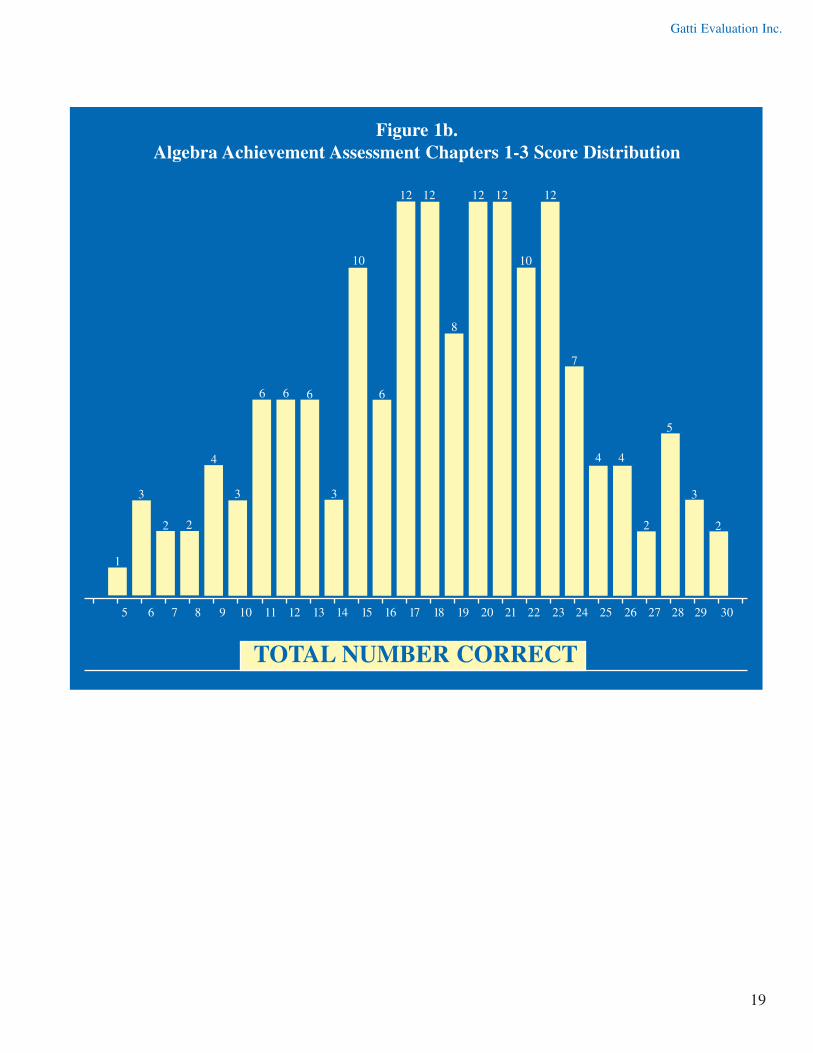
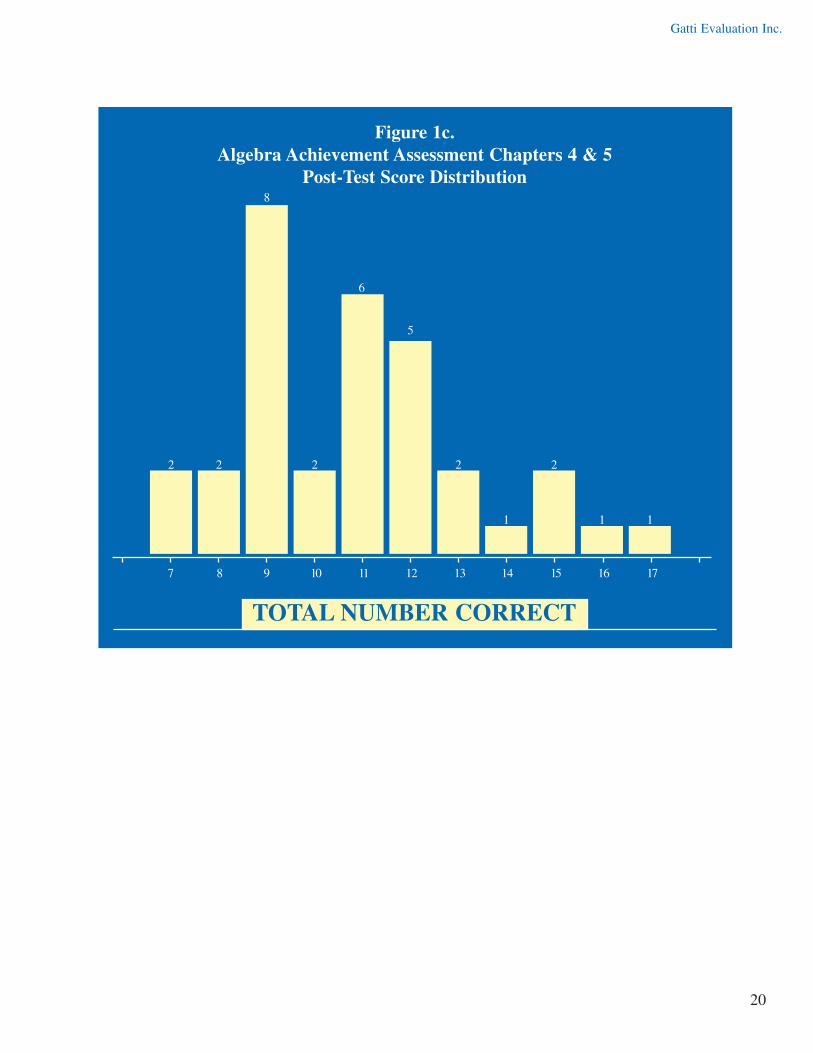
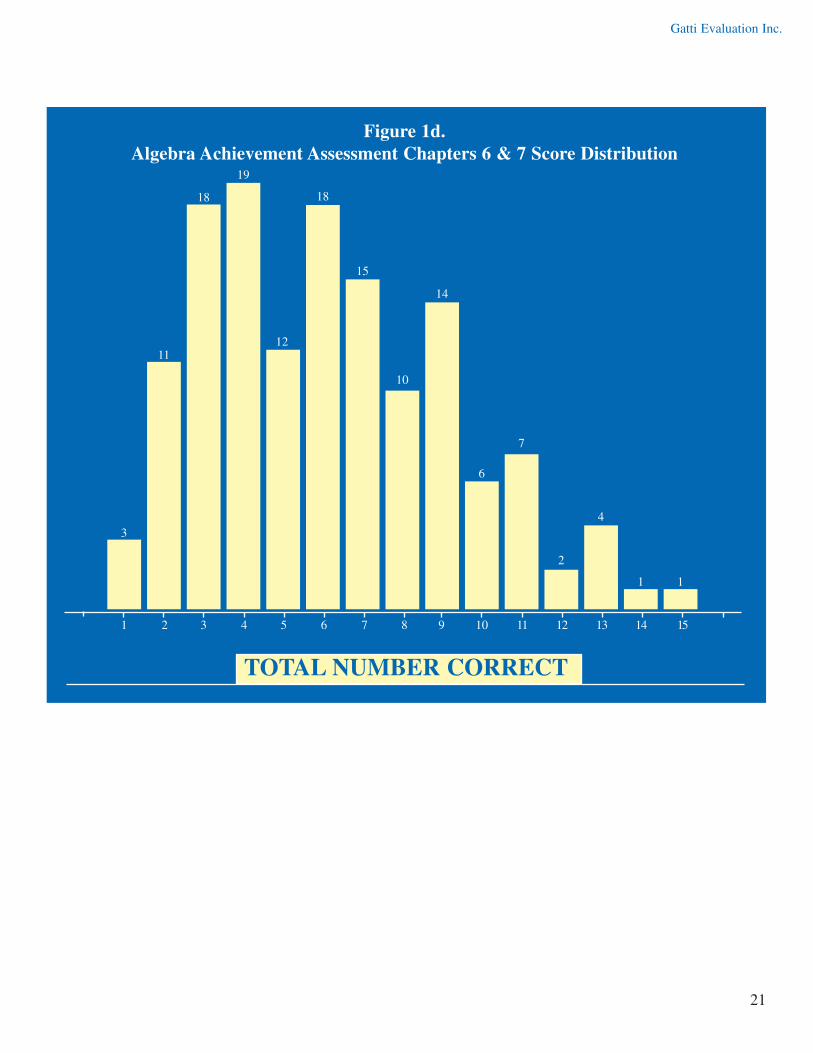
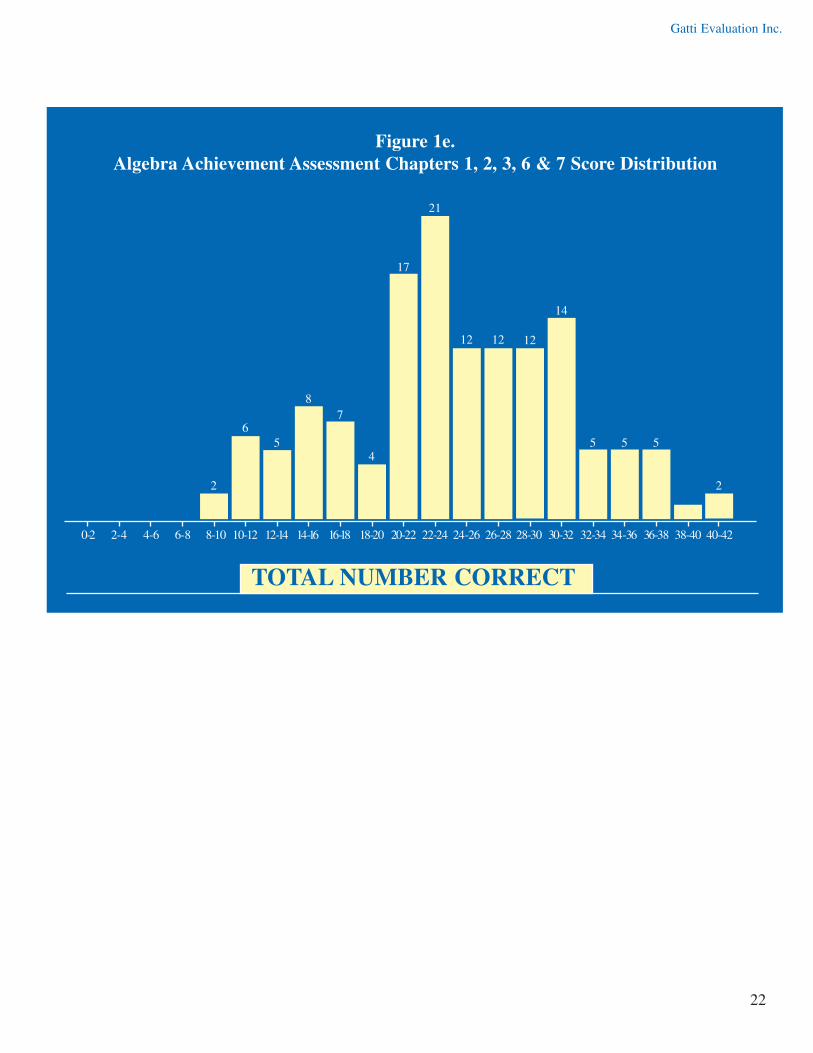
AAT123 scores. Tables 2a and 2b show the test statistics for the ART and AATs. Figures 1a to 1e (see pages 17-
21) depict fairly normal unimodal score distributions for the ART and AATs. Since the AAT questions aligned to
PHA chapters 1, 2, 3, 6 and 7 were only administered to the USDWP students and the AAT questions aligned to
chapter 4 & 5 were only administered to the USDNF students, the item Analysis and reliability estimates reflect the
characteristics and variation found in these populations. The questions were designed to be difficult to answer for
examinees without a thorough knowledge of algebra. This is evidenced by the fact that only the best performing
groups were able to average more than 50% correct on the various exams. Assessments best discriminate
between examinees with least measurement error when the probability of a correct response for a given examinee
on an item is 50%9. For this reason, the assessments are designed so that the population average is in the neighbor-
hood of 50% and the items reflect a wide range of difficulty.
TABLE 2a.
Algebra Readiness Assessment Statistics
# Students
Mean(# Items)
StandardDeviation
LowestScore
HighestScore
25thPercentile
231All Questions
231Number Sense
231Algebraic Concepts
This algebra readiness test was written by Guido G. Gatti of Gatti Evaluation Inc. in collaboration with Drs. Marty Cohen and Terry Goodman.
44.5% (28)
50.5% (10)
41.2% (18)
13.5%
16.7%
15.1%
3
1
2
25
9
18
10
4
6
12
5
7
15
6
9
0.3/0.1
<0.1/-0.4
0.5/0.6
50thPercentile
75thPercentile
Skewness& Kurtosis
Algebra Readiness Assessment Question Difficulty (20.3% - 93.9%)Congeneric Reliability Algebra Readiness Assessment = 0.616 95% CI = (0.541,0.684)
Note: Mean 44.5% (28) indicates that on average students get about 45% out of the 28 test questions correct.
9 Hambleton, R. K. (1993). Principles and selected applications of item response theory. In R. L. Linn (Ed.), Educational Measurement 3rd Edition (pp. 147-200). Phoenix, AZ: Oryz Press.
Gatti Evaluation Inc.
13
TABLE 2b.
Algebra Achievement Assessment Statistics
# Students
Mean(# Items)
StandardDeviation
LowestScore
HighestScore
25thPercentile
157AAT Chpts. 1, 2, & 3
This algebra readiness test was written by Guido G. Gatti of Gatti Evaluation Inc. in collaboration with Drs. Marty Cohen and Terry Goodman.
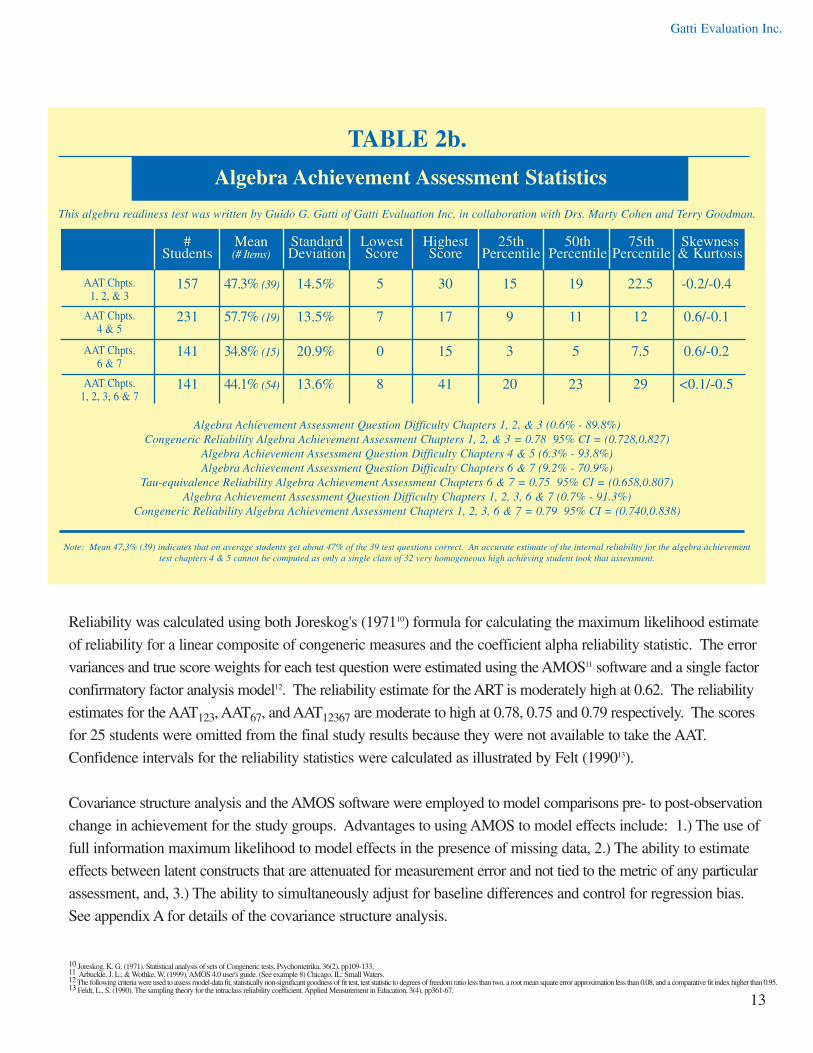
47.3% (39) 14.5% 5 30 15 19 22.5 -0.2/-0.4
50thPercentile
75thPercentile
Skewness& Kurtosis
Algebra Achievement Assessment Question Difficulty Chapters 1, 2, & 3 (0.6% - 89.8%)Congeneric Reliability Algebra Achievement Assessment Chapters 1, 2, & 3 = 0.78 95% CI = (0.728,0.827)
Algebra Achievement Assessment Question Difficulty Chapters 4 & 5 (6.3% - 93.8%)Algebra Achievement Assessment Question Difficulty Chapters 6 & 7 (9.2% - 70.9%)
Tau-equivalence Reliability Algebra Achievement Assessment Chapters 6 & 7 = 0.75 95% CI = (0.658,0.807)Algebra Achievement Assessment Question Difficulty Chapters 1, 2, 3, 6 & 7 (0.7% - 91.3%)
Congeneric Reliability Algebra Achievement Assessment Chapters 1, 2, 3, 6 & 7 = 0.79 95% CI = (0.740,0.838)
Note: Mean 47.3% (39) indicates that on average students get about 47% of the 39 test questions correct. An accurate estimate of the internal reliability for the algebra achievement test chapters 4 & 5 cannot be computed as only a single class of 32 very homogeneous high achieving student took that assessment.
231AAT Chpts. 4 & 5
57.7% (19) 13.5% 7 17 9 11 12 0.6/-0.1
141AAT Chpts. 6 & 7
34.8% (15) 20.9% 0 15 3 5 7.5 0.6/-0.2
141AAT Chpts. 1, 2, 3, 6 & 7
44.1% (54) 13.6% 8 41 20 23 29 <0.1/-0.5
Reliability was calculated using both Joreskog's (197110) formula for calculating the maximum likelihood estimate
of reliability for a linear composite of congeneric measures and the coefficient alpha reliability statistic. The error
variances and true score weights for each test question were estimated using the AMOS11 software and a single factor
confirmatory factor analysis model12. The reliability estimate for the ART is moderately high at 0.62. The reliability
estimates for the AAT123, AAT67, and AAT12367 are moderate to high at 0.78, 0.75 and 0.79 respectively. The scores
for 25 students were omitted from the final study results because they were not available to take the AAT.
Confidence intervals for the reliability statistics were calculated as illustrated by Felt (199013).
Covariance structure analysis and the AMOS software were employed to model comparisons pre- to post-observation
change in achievement for the study groups. Advantages to using AMOS to model effects include: 1.) The use of
full information maximum likelihood to model effects in the presence of missing data, 2.) The ability to estimate
effects between latent constructs that are attenuated for measurement error and not tied to the metric of any particular
assessment, and, 3.) The ability to simultaneously adjust for baseline differences and control for regression bias.
See appendix A for details of the covariance structure analysis.
10 Joreskog, K. G. (1971). Statistical analysis of sets of Congeneric tests. Psychometrika, 36(2), pp109-133.11 Arbuckle, J. L., & Wothke, W. (1999). AMOS 4.0 user's guide. (See example 8) Chicago, IL: Small Waters. 12 The following criteria were used to assess model-data fit, statistically non-significant goodness of fit test, test statistic to degrees of freedom ratio less than two, a root mean square error approximation less than 0.08, and a comparative fit index higher than 0.95. 13 Feldt, L., S. (1990). The sampling theory for the intraclass reliability coefficient. Applied Measurement in Education, 3(4), pp361-67.
Gatti Evaluation Inc.
14
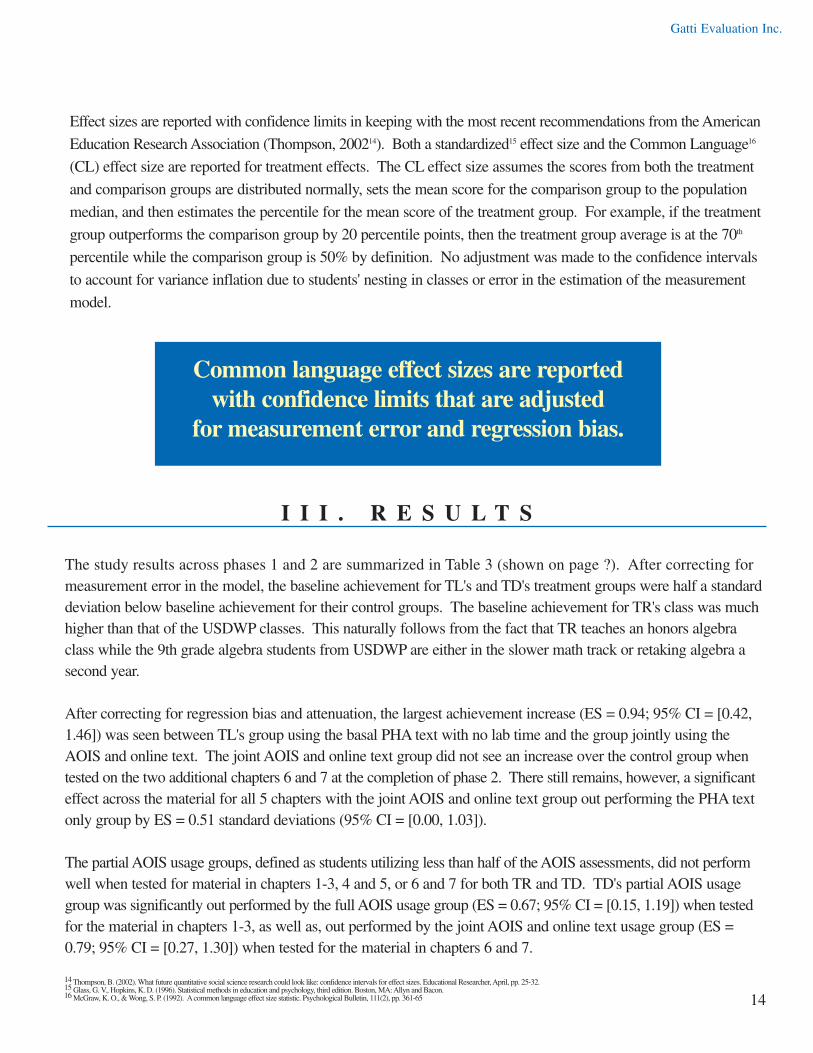
Effect sizes are reported with confidence limits in keeping with the most recent recommendations from the American
Education Research Association (Thompson, 200214). Both a standardized15 effect size and the Common Language16
(CL) effect size are reported for treatment effects. The CL effect size assumes the scores from both the treatment
and comparison groups are distributed normally, sets the mean score for the comparison group to the population
median, and then estimates the percentile for the mean score of the treatment group. For example, if the treatment
group outperforms the comparison group by 20 percentile points, then the treatment group average is at the 70th
percentile while the comparison group is 50% by definition. No adjustment was made to the confidence intervals
to account for variance inflation due to students' nesting in classes or error in the estimation of the measurement
model.
The study results across phases 1 and 2 are summarized in Table 3 (shown on page ?). After correcting formeasurement error in the model, the baseline achievement for TL's and TD's treatment groups were half a standarddeviation below baseline achievement for their control groups. The baseline achievement for TR's class was muchhigher than that of the USDWP classes. This naturally follows from the fact that TR teaches an honors algebraclass while the 9th grade algebra students from USDWP are either in the slower math track or retaking algebra asecond year.
After correcting for regression bias and attenuation, the largest achievement increase (ES = 0.94; 95% CI = [0.42,1.46]) was seen between TL's group using the basal PHA text with no lab time and the group jointly using theAOIS and online text. The joint AOIS and online text group did not see an increase over the control group whentested on the two additional chapters 6 and 7 at the completion of phase 2. There still remains, however, a significanteffect across the material for all 5 chapters with the joint AOIS and online text group out performing the PHA textonly group by ES = 0.51 standard deviations (95% CI = [0.00, 1.03]).
The partial AOIS usage groups, defined as students utilizing less than half of the AOIS assessments, did not performwell when tested for material in chapters 1-3, 4 and 5, or 6 and 7 for both TR and TD. TD's partial AOIS usagegroup was significantly out performed by the full AOIS usage group (ES = 0.67; 95% CI = [0.15, 1.19]) when testedfor the material in chapters 1-3, as well as, out performed by the joint AOIS and online text usage group (ES =0.79; 95% CI = [0.27, 1.30]) when tested for the material in chapters 6 and 7.
I I I . R E S U L T S
Common language effect sizes are reported with confidence limits that are adjusted
for measurement error and regression bias.
14 Thompson, B. (2002). What future quantitative social science research could look like: confidence intervals for effect sizes. Educational Researcher, April, pp. 25-32.15 Glass, G. V., Hopkins, K. D. (1996). Statistical methods in education and psychology, third edition. Boston, MA: Allyn and Bacon.16 McGraw, K. O., & Wong, S. P. (1992). Acommon language effect size statistic. Psychological Bulletin, 111(2), pp. 361-65

Gatti Evaluation Inc.
TABLE 3
Prentice Hall Online AlgebraStudy Results
School Year 2004-2005
Urban Fringe Public Western Pennsylvania School District
Period 1 & 2 Period 3 Treatment vs. Control
Period 1 Period 2 & 3 Treatment vs. Control
TEACHER L TEACHER D
Algebra Readiness Test (28)
Algebra Achievement Test Chapters 1, 2, & 3 (39)
AlgebraAchievement Test Chapters 6 & 7 (15)
Control Group (Basal PHA TextOnly)Raw ScoresMn = 39.04%SD = 10.68%N = 45
Control Group (No Lab Time)Raw ScoreMn = 45.23%SD = 16.31%N = 45
Control Group (No Lab Time)Raw ScoreMn = 45.80%SD = 23.40%N = 45
Treatment Group(AOIS & Online Text)Raw ScoresMn = 35.00%SD = 10.57%N = 25
Treatment Group(9 labs, 7 AOIS, 4 i-Txt)Raw ScoreMn = 49.44%SD = 12.38%N = 25
Treatment Group(4 labs, 2 AOIS, 2 i-Txt)Raw ScoreMn = 31.73%SD = 16.60%N = 25
ConstructReadinessScoresESART = -0.52†CL = 30%
Construct Gain ScoresESGain = 0.94†CL = 83%
Construct Gain ScoresESGain = -0.91†CL = 18%
Control Group(Partial AOIS Use)Raw ScoresMn = 46.14%SD = 13.18%N = 25
Control Group (9 labs, 12/28 AOIStests)Raw ScoresMn = 48.51%SD = 12.05%N = 25
Treatment Group(AOIS & OnlineText , 6 labs, 2 AOIS,4 i-Txt)Raw ScoresMn = 34.13%SD = 21.53%N = 25
Treatment Group(Full AOIS Use)Raw ScoresMn = 41.29%SD = 10.11%N = 43
Treatment Group(12 labs, 23/28 AOIS tests)Raw ScoresMn = 48.90%SD = 14.31%N = 43
Control Group (Partial AOIS Use, 6 labs, 9/19 AOIStests)Raw ScoresMn = 25.73%SD = 15.47%N = 43
ConstructReadiness ScoresESART = -0.52†CL = 30%
Construct Gain ScoresESGain = 0.67†CL = 75%
Construct Gain ScoresESGain = 0.79†CL = 78%
AlgebraAchievement Test Chapters 1, 2, 3, 6 & 7 (54)
Control Group (No Lab Time)Raw ScoreMn = 45.39%SD = 15.98%N = 45
Treatment Group(13 labs, 9 AOIS, 6 i-Txt)Raw ScoreMn = 44.52%SD = 11.31%N = 25
Construct Gain ScoresESGain = 0.51†CL = 70%
Urban Public Northern Florida School District
Algebra Readiness Test (28)
Treatment Group(Partial AOIS Use)Raw ScoresMn = 60.50%SD = 11.43%N = 32
AlgebraAchievement Test Chapters 4 & 5 (19)
Treatment Group(4 labs, 8/19 AOIStests)Raw ScoreMn = 57.74%SD = 13.32%N = 32
Period 1
TEACHER R
Note: Mn and SD refer to raw score group mean % correct and standard deviation. Parentheses (00) indicate the number of test questions. ES indicates effect size or the control vs. treatment group change on the standardized error-free latent achievement construct (i.e., ES = (Mngain-trmt-Mngain-ctrl)/SDgain = {1/sqrt[nctrl ntrmt/n(n-1)]} rgain,group). The superscript † indicates one-tailed statistical significance at a= 0.05 level for a sample sizes of 25 and 45 students per group. The 95% confidence intervals around the ES are less than + or - 0.52 (i.e., SE = 2.021(n1
-1+n2-1)1/2). CL indicates the percentile of the treatment group mean if the control group mean is set to the median. 15
Gatti Evaluation Inc.
The NCTM has pronounced both formative assessment and educational technology as two of the best ways to
increase student achievement. Formative assessment and technology may be skillfully combined to create a sup-
plemental educational technology product that significantly increases achievement. However, a poorly designed
product may have no supplemental effect over a traditional basal curriculum and may even be detrimental. A poorly
designed product can confuse and frustrate students and teachers proving to be a waste of valuable learning time.
For this reason it is necessary to pilot test these new products for design improvements and best practice methods.
The effectiveness of the Prentice Hall Algebra online mathematics curriculum, in increasing achievement, was tested
empirically through a randomized controlled experiment in two phases during the 2004-05 school year. The PI felt
it important to replicate results seen in the first phase, conducted in the first part of the school year, in a second
phase within the same classes working on different content from new chapters later in the same school year. In
utilizing powerful statistical models to analyze data collected across multiple stages of development, the study can
demonstrate evidence for persistent achievement gains attributed to the use of the online curriculum or illuminate
achievement gains that emerge over time.
I V. C O N C L U S I O N S A N D R E C O M M E N D AT I O N S
Students regularly utilizing the online curriculumgained 20 percentile points on their cohorts on the material from 5 chapters spanning
the entire school year
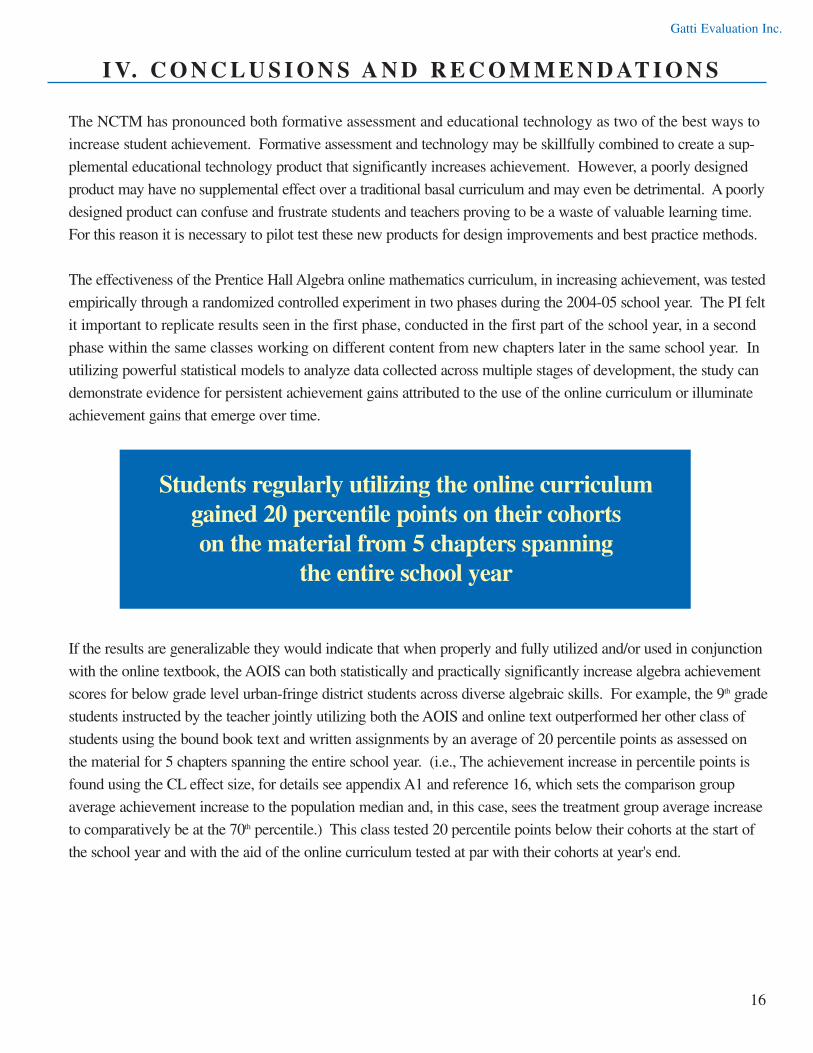
If the results are generalizable they would indicate that when properly and fully utilized and/or used in conjunction
with the online textbook, the AOIS can both statistically and practically significantly increase algebra achievement
scores for below grade level urban-fringe district students across diverse algebraic skills. For example, the 9th grade
students instructed by the teacher jointly utilizing both the AOIS and online text outperformed her other class of
students using the bound book text and written assignments by an average of 20 percentile points as assessed on
the material for 5 chapters spanning the entire school year. (i.e., The achievement increase in percentile points is
found using the CL effect size, for details see appendix A1 and reference 16, which sets the comparison group
average achievement increase to the population median and, in this case, sees the treatment group average increase
to comparatively be at the 70th percentile.) This class tested 20 percentile points below their cohorts at the start of
the school year and with the aid of the online curriculum tested at par with their cohorts at year's end.
16
Gatti Evaluation Inc.
17
Study teachers also saw average percentile point gains, over their control classrooms, of 33 and 28 points when using
the AOIS and online text book across smaller portions of the school year's material. When the AOIS was utilized
to its full potential, students could expect to see average increases in achievement of 25 percentile points over those
students making little or no use of the AOIS. These results provide evidence that the teachers were able to make
effective use of the online curriculum, both the AOIS as a formative student achievement assessment and practice
tool and the online text as an interactive re-teaching and a remediation resource.
CaveatsDespite the fact that teacher L's joint AOIS and online text group out performed the bound book text only group
when tested for the material in the first three chapters and the material in all five chapters, the treatment group did
not see an increase over the control group when tested on the material from chapters 6 and 7. This absence of an
effect for the second phase of study may be due to any of several factors such as the decrease in the number of
labs per chapter, the coverage of the specific material for chapters 6 and 7 by the teacher or the online curriculum,
or simply be a result of random fluctuation. Teacher L's bound book text only control group significantly out per-
formed all other groups in phase 2. This anomalous result is not likely due to the coverage of the material by the
online curriculum as teacher L's joint AOIS and online text group out performed teacher D's comparison group
and teacher D saw a significant gain using the AOIS and online text for this same material in phase 2.
Gatti Evaluation Inc.
18
1 2 3 4 5 6 7 8 9 10 11 12 13 14 15 16 17 18 19 20 21 22 23 24 25 26 27 28
5 5
8
13
20 20
27
21 21
23
19
17
910
4 4
TOTAL NUMBER CORRECT
Figure 1a.Algebra Readiness Assessment Score Distribution
Gatti Evaluation Inc.
19
4
6
3
6
10
12
8
12 12
10
12
4
TOTAL NUMBER CORRECT
Figure 1b.Algebra Achievement Assessment Chapters 1-3 Score Distribution
1
3
2 2
6
3
6
12
7
4
2
5
3
2
5 6 7 8 9 10 11 12 13 14 15 16 17 18 19 20 21 22 23 24 25 26 27 28 29 30
Gatti Evaluation Inc.
20
TOTAL NUMBER CORRECT
Figure 1c.Algebra Achievement Assessment Chapters 4 & 5
Post-Test Score Distribution
2 2 2 2 2
8
6
5
1 1 1
7 8 9 10 11 12 13 14 15 16 17
Gatti Evaluation Inc.
21
TOTAL NUMBER CORRECT
Figure 1d.Algebra Achievement Assessment Chapters 6 & 7 Score Distribution
1 2 3 4 5 6 7 8 9 10 11 12 13 14 15
3
11
18
19
12
18
15
10
14
6
7
2
4
1 1
Gatti Evaluation Inc.
22
TOTAL NUMBER CORRECT
Figure 1e.Algebra Achievement Assessment Chapters 1, 2, 3, 6 & 7 Score Distribution
0-2 2-4 4-6 6-8 8-10 10-12 12-14 14-16 16-18 18-20 20-22 22-24 24-26 26-28 28-30 30-32 32-34 34-36 36-38 38-40 40-42
2
65
87
4
17
21
12 12 12
14
5 5 5
2
Gatti Evaluation Inc.
23
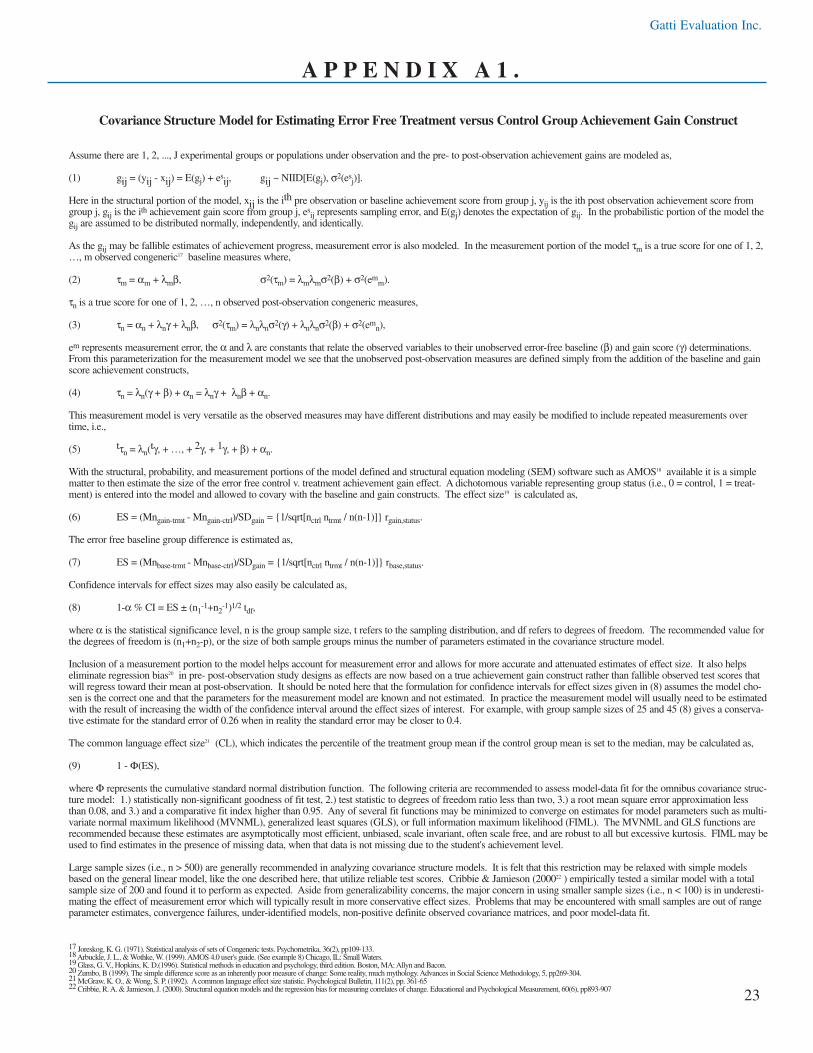
Covariance Structure Model for Estimating Error Free Treatment versus Control Group Achievement Gain Construct
Assume there are 1, 2, ..., J experimental groups or populations under observation and the pre- to post-observation achievement gains are modeled as,
(1) gij = (yij - xij) = E(gj) + esij, gij ~ NIID[E(gj), σ2(es
j)].
Here in the structural portion of the model, xij is the ith pre observation or baseline achievement score from group j, yij is the ith post observation achievement score fromgroup j, gij is the ith achievement gain score from group j, es
ij represents sampling error, and E(gj) denotes the expectation of gij. In the probabilistic portion of the model thegij are assumed to be distributed normally, independently, and identically.
As the gij may be fallible estimates of achievement progress, measurement error is also modeled. In the measurement portion of the model τm is a true score for one of 1, 2,…, m observed congeneric17 baseline measures where,
(2) τm = αm + λmβ, σ2(τm) = λmλmσ2(β) + σ2(emm).
τn is a true score for one of 1, 2, …, n observed post-observation congeneric measures,
(3) τn = αn + λnγ + λnβ, σ2(τm) = λnλnσ2(γ) + λnλnσ2(β) + σ2(emn),
em represents measurement error, the α and λ are constants that relate the observed variables to their unobserved error-free baseline (β) and gain score (γ) determinations.From this parameterization for the measurement model we see that the unobserved post-observation measures are defined simply from the addition of the baseline and gainscore achievement constructs,
(4) τn = λn(γ + β) + αn = λnγ + λnβ + αn.
This measurement model is very versatile as the observed measures may have different distributions and may easily be modified to include repeated measurements overtime, i.e.,
(5) tτn = λn(tγ, + …, + 2γ, + 1γ, + β) + αn.
With the structural, probability, and measurement portions of the model defined and structural equation modeling (SEM) software such as AMOS18 available it is a simplematter to then estimate the size of the error free control v. treatment achievement gain effect. A dichotomous variable representing group status (i.e., 0 = control, 1 = treat-ment) is entered into the model and allowed to covary with the baseline and gain constructs. The effect size19 is calculated as,
(6) ES = (Mngain-trmt - Mngain-ctrl)/SDgain = {1/sqrt[nctrl ntrmt / n(n-1)]} rgain,status.
The error free baseline group difference is estimated as,
(7) ES = (Mnbase-trmt - Mnbase-ctrl)/SDgain = {1/sqrt[nctrl ntrmt / n(n-1)]} rbase,status.
Confidence intervals for effect sizes may also easily be calculated as,
(8) 1-α % CI = ES ± (n1-1+n2
-1)1/2 tdf,
where α is the statistical significance level, n is the group sample size, t refers to the sampling distribution, and df refers to degrees of freedom. The recommended value forthe degrees of freedom is (n1+n2-p), or the size of both sample groups minus the number of parameters estimated in the covariance structure model.
Inclusion of a measurement portion to the model helps account for measurement error and allows for more accurate and attenuated estimates of effect size. It also helpseliminate regression bias20 in pre- post-observation study designs as effects are now based on a true achievement gain construct rather than fallible observed test scores thatwill regress toward their mean at post-observation. It should be noted here that the formulation for confidence intervals for effect sizes given in (8) assumes the model cho-sen is the correct one and that the parameters for the measurement model are known and not estimated. In practice the measurement model will usually need to be estimatedwith the result of increasing the width of the confidence interval around the effect sizes of interest. For example, with group sample sizes of 25 and 45 (8) gives a conserva-tive estimate for the standard error of 0.26 when in reality the standard error may be closer to 0.4.
The common language effect size21 (CL), which indicates the percentile of the treatment group mean if the control group mean is set to the median, may be calculated as,
(9) 1 - Φ(ES),
where Φ represents the cumulative standard normal distribution function. The following criteria are recommended to assess model-data fit for the omnibus covariance struc-ture model: 1.) statistically non-significant goodness of fit test, 2.) test statistic to degrees of freedom ratio less than two, 3.) a root mean square error approximation lessthan 0.08, and 3.) and a comparative fit index higher than 0.95. Any of several fit functions may be minimized to converge on estimates for model parameters such as multi-variate normal maximum likelihood (MVNML), generalized least squares (GLS), or full information maximum likelihood (FIML). The MVNML and GLS functions arerecommended because these estimates are asymptotically most efficient, unbiased, scale invariant, often scale free, and are robust to all but excessive kurtosis. FIML may beused to find estimates in the presence of missing data, when that data is not missing due to the student's achievement level.
Large sample sizes (i.e., n > 500) are generally recommended in analyzing covariance structure models. It is felt that this restriction may be relaxed with simple modelsbased on the general linear model, like the one described here, that utilize reliable test scores. Cribbie & Jamieson (200022 ) empirically tested a similar model with a totalsample size of 200 and found it to perform as expected. Aside from generalizability concerns, the major concern in using smaller sample sizes (i.e., n < 100) is in underesti-mating the effect of measurement error which will typically result in more conservative effect sizes. Problems that may be encountered with small samples are out of rangeparameter estimates, convergence failures, under-identified models, non-positive definite observed covariance matrices, and poor model-data fit.
A P P E N D I X A 1 .
17 Joreskog, K. G. (1971). Statistical analysis of sets of Congeneric tests. Psychometrika, 36(2), pp109-133. 18Arbuckle, J. L., & Wothke, W. (1999). AMOS 4.0 user's guide. (See example 8) Chicago, IL: Small Waters. 19 Glass, G. V., Hopkins, K. D.(1996). Statistical methods in education and psychology, third edition. Boston, MA: Allyn and Bacon.20 Zumbo, B (1999). The simple difference score as an inherently poor measure of change: Some reality, much mythology. Advances in Social Science Methodology, 5, pp269-304.21 McGraw, K. O., & Wong, S. P. (1992). Acommon language effect size statistic. Psychological Bulletin, 111(2), pp. 361-6522 Cribbie, R. A. & Jamieson, J. (2000). Structural equation models and the regression bias for measuring correlates of change. Educational and Psychological Measurement, 60(6), pp893-907