preliminary assessment of the effect of high
TRANSCRIPT

1
PRELIMINARY ASSESSMENT OF THE EFFECT OF HIGH ELEPHANT DENSITY ON ECOSYSTEM COMPONENTS (GRASS, TREES, AND LARGE MAMMALS) ON THE
CHOBE RIVERFRONT IN NORTHERN BOTSWANA
By
ANDREA WOLF
A THESIS PRESENTED TO THE GRADUATE SCHOOL OF THE UNIVERSITY OF FLORIDA IN PARTIAL FULFILLMENT
OF THE REQUIREMENTS FOR THE DEGREE OF MASTER OF SCIENCE
UNIVERSITY OF FLORIDA
2009
2
© 2009 Andrea Wolf

3
To my Grandmother

4
ACKNOWLEDGMENTS
I thank my parents and my brother and uncle and aunt, and all my family and friends who
supported me through this. I also thank my advisors, my fellow graduate students, and those that
worked with me in Africa to make this thesis happen. I am also very grateful for my funding
sources: Tropical Conservation and Development (TCD) at the University of Florida and the UF
Seed grant.

5
TABLE OF CONTENTS page
ACKNOWLEDGMENTS.................................................................................................................... 4
LIST OF TABLES................................................................................................................................ 7
LIST OF FIGURES .............................................................................................................................. 8
ABSTRACT .......................................................................................................................................... 9
CHAPTER
1 PLACEMENT IN GEOGRAPHY ............................................................................................. 11
Introduction ................................................................................................................................. 11 An Integrated Approach; Physical Geography, Human Geography, and Other
Disciplines................................................................................................................................ 12 Methodologies: Field Work ................................................................................................ 13 Geographic Technologies: Study Design and Data Analysis ........................................... 14 Space and Time .................................................................................................................... 16 Ecological Theory ................................................................................................................ 17
Conclusion ................................................................................................................................... 21
2 QUANTIFICATION OF CHANGE IN ECOSYSTEM COMPONETS ALONG THE CHOBE RIVERFRONT ............................................................................................................. 23
Study Area ................................................................................................................................... 24 Land Use History ........................................................................................................................ 25 Methodology................................................................................................................................ 27
Data Collection .................................................................................................................... 27 Sampling Method................................................................................................................. 27
Results .......................................................................................................................................... 29 Herbaceous Layer ................................................................................................................ 29 Woody Layer........................................................................................................................ 30
Riparian strip ................................................................................................................ 30 Pookoo Flats ................................................................................................................. 31 Mixed wood/shrubland ................................................................................................ 32 Baikiaea woodland ....................................................................................................... 32
Animal Composition and Density ...................................................................................... 33 Discussion .................................................................................................................................... 36 Conclusions ................................................................................................................................. 42
APPENDIX DESCRIPTION OF TREE AND SHRUB SPECIES .............................................. 57

6
BIBLIOGRAPHY............................................................................................................................... 58
BIOGRAPHICAL SKETCH ............................................................................................................. 62

7
LIST OF TABLES
Table page 2-1 Number of transects per site and year ................................................................................... 49
2-2 Woody species densities and percentages on Pookoo Flats. ............................................... 53
2-3 Comparison of woody species composition and densities in mixed wood/shrubland between Chobe and Bwabwata National Parks. ................................................................... 54
2-4 Comparison of woody species composition and densities in Baikiaea woodland between Chobe and Bwabwata National Parks. ................................................................... 55

8
LIST OF FIGURES
Figure page 2-1 Study site.. .............................................................................................................................. 47
2-2 Riverfront vegetation types: Floodplain, riparian strip, Pookoo Flats, sandridge, Baikiaea woodland ................................................................................................................. 47
2-3 Six vegetation types and their associated histories .............................................................. 48
2-4 Comparison of rainfall preceding the 1965 and 2007 vegetation surveys. Government of Botswana; Department of Meteorological Services ........................................................ 48
2-6 Spatial and temporal comparison of bare ground in CNP (1965, 2007) and BNP (2007) in 3 vegetation types using Riney transects .............................................................. 50
2-7 Spatial and temporal comparison of rooted grass in CNP (1965, 2007) and BNP (2007) in 3 vegetation types using Riney transects .............................................................. 51
2-8 Spatial and temporal comparison of aerial grass cover in CNP (1965, 2007) and BNP (2007) in 3 vegetation types using Riney transects .............................................................. 51
2-9 Comparison of riparian strip tree species in CNP (1965, 2007). ........................................ 52
2-10 Comparison of riparian strip tree species in Chobe (1965, 2007) and Bwabwata National Park (2007). ............................................................................................................. 53
2-11 Relative animal densities on Pookoo Flats ........................................................................... 55
2-12 Relative animal densities in mixed wood/shrubland............................................................ 56
2-13 Relative animal densities in Baikiaea woodland.................................................................. 56

9
Abstract of Thesis Presented to the Graduate School of the University of Florida in Partial Fulfillment of the
Requirements for the Degree of Master of Science
PRELIMINARY ASSESSMENT OF THE EFFECT OF HIGH ELEPHANT DENSITY ON ECOSYSTEM COMPONENTS (GRASS, TREES, AND LARGE MAMMALS) ON THE
CHOBE RIVERFRONT IN NORTHERN BOTSWANA
By
Andrea Wolf
May 2009 Chair: Brian Child Major: Geography
Elephants are well-known to affect landscapes by converting woodland into shrub or
grassland. This is obviously the case along the Chobe riverfront in Chobe National Park,
northern Botswana, where dead trees tower over the world’s largest elephant herd while tourists
watch transfixed as they move through vast stretches of shrubland on their way to the riverfront.
Two types of ecological transects developed specifically for the semi-arid savannas of
southern Africa and historical accounts were used to assess change in riverfront ecosystem
components over time and space from the herbaceous layer to the woody layer, and the large
mammal component. A temporal comparison was made between Chobe National Park in 2007
and 1965, and time was substituted for space to make a spatial comparison between Chobe
National Park 1965, 2007, and Bwabwata National Park in Namibia, a physiognomically similar
environment, with lower elephant densities.
Results demonstrate that the herbaceous layer in Chobe was already degrading by the
1960s because of past land use. The shrub layer has expanded and simplified, and is now
dominated by two species (Combretum mossambicense and Capparis tomentosa), and animal
composition and densities have changed dramatically. Selective grazers have decreased

10
significantly with the loss of the grass sward, and non-selective browsers such as elephant,
impala and kudu now dominate each site analyzed. Results show a simplification in the woody
and animal layers, and degradation in the herbaceous layer, leading to questions about
sustainability on the system, and whether this park is meeting its goals and objectives as a
National Park.

11
CHAPTER 1 PLACEMENT IN GEOGRAPHY
Introduction
Geography is often referred to as the mother of the sciences with astronomy, botany,
zoology, geology, meteorology, archaeology and anthropology among its children (Barrows,
1923). This is ironic because in today’s world, particularly in the United States, geography is
frequently marginalized as a discipline, or even considered simply a component of one of the
above mentioned fields. In spite of this, through different processes such as exploration,
discovery and cartography, geography has come to be regarded as the study of our physical
environment and humans’ response to, and impact upon the earth, and is based on the interplay
between the environment and human forces (Herbert and Matthews, 2004). This definition
assumes overlap in the humanities and social and physical sciences.
While my research is predominantly ecological in nature, it draws from a variety of
disciplines and from both human and physical geography. It remains a geographic study because
of the methodology employed to collect and analyze the data, and because of how the study fits
into several broad geographic theoretical frameworks. I discuss the methodology involved in the
data collection in the field and the use of current geographic technologies including geographic
information systems (GIS) and remote sensing. I then discuss some basic geographic concepts
such as an understanding and comparison of space, area, and region, and how geographic
technologies, specifically aerial photography, are used in my study to scale up from area to
region. I also look at change over space and time, a staple of geographic theory, and then
emphasize more contemporary trends in geographic thought including environmentalism;
particularly conservation of biological diversity. Finally, I discuss the human influence on my
study site, which is a national park, some of the objectives of national parks generally, and

12
specifically, how this anthropogenic institution influences the ecological components in my
research.
An Integrated Approach; Physical Geography, Human Geography, and Other Disciplines
Since it is an integrated study, the research can be labeled within a variety of subfields of
geography. My study presents a quantitative analysis of vegetation change over time, and
utilizes quantitative data from 1965 to determine if there has been a significant change over time,
as well as historical qualitative data to determine how and what were and are the drivers of
change. The main driver that I look at and correlate vegetation change with is elephants. Animal
behavior and population increases fall within the field of zoology, expanding the research from a
strictly ecological study. I also used a biogeographical approach by analyzing differences both
within and between sites, and then compare the differences in species composition and richness
between sites in one area to those in another physiognomically similar region. While the
quantitative portion of the study would be considered physical geography, and perhaps more
specifically, landscape ecology, the drivers must be understood within a broad context,
employing components of human and cultural geography and even those of other disciplines.
Although my work is predominantly ecological in nature, the phenomenon under analysis
has developed because of and within the context of social, political, economic, and
environmental dimensions. The results of the research must be analyzed and related back to the
relevant stakeholders within this integrated sphere. Other drivers and responses to the changes
incorporate social, environmental, and economic influences on policies. Management of the
study site (Chobe National Park) has determined current and past lands uses and has incorporated
some aspects of all the above mentioned facets of an integrated system. Some of these policies
include timber extraction and hunting regulations and livestock and agriculture policies, all of
which are influenced by the history and social and cultural norms of the local people who

13
previously lived within and now live around the national park. They are also highly linked to the
local economy, as well as the national economy of Botswana, which depends on tourism from
Chobe National Park (CNP) for a large portion of its citizen’s livelihoods. Therefore, market
forces also play a significant role in determining land use at the study site because of strong local
ties to the international tourism industry.
Methodologies: Field Work
Field work is a tradition in geography that is shared with many other disciplines,
particularly for physical geographers, but also for human and cultural geographers (Stoddart and
Adams, 2004). My field work is based on two types of vegetation transect methods developed
and practiced by ecologists in the semi-arid savannas of southern Africa. Together, they provide
the required information for a study on vegetation with an emphasis on changes over space and
time. Two methods are employed because they complement each other, and provide a
comprehensive view of the land cover. The Riney (1963) method is a rapid field technique to
assess the effects of fire and herbivory on the herbaceous layer. This method uses a point-step
technique and provides the observer with a set of syndromes meant to supply managers with an
understanding of the landscape before thresholds are crossed and there is an irreversible shift
towards degradation of the herbaceous layer in the form of reduced productivity. Tree and
animal species are also recorded as well as trend in the herbaceous and bush layer. The Walker
(1976) method is a more comprehensive and time-consuming technique which supplies
information about the herbaceous layer through an in-depth analysis of 1x1 meter plots. It also
provides information about tree and shrub composition and density, as well as animal species
density and diversity.
It is the process of carrying out this field work that a thorough understanding of the subject
can be gained, in part because it is provides a holistic view of the study area.

14
Geographic Technologies: Study Design and Data Analysis
Geographic Information Systems (GIS) and Remote Sensing technologies are perhaps the
most uniquely geographical tools employed within the discipline to analyze and display data as
well as develop and design a study before arriving in the field. These technologies “allow
Geography to address significant problems of society and the environment using explicitly
spatial data, information, evidence and knowledge” (Langley and Barnsley, 2004). They allow
users to analyze land covers from afar, and to do so over time, at least as far as the satellite
images go back in time. I used satellite images (Landsat 5, 2004) to discern distinct land covers
across the mosiaked landscape to develop a sampling frame that would place transects in each
vegetation category. This was a very effective method except in the case of fire, which is
prolific across the landscape, particularly in Namibia. Several times, a site was determined for
analysis, and an exact location within that land cover was decided upon randomly, but upon
arrival at the site, it was found to be recently burned, precluding it from analysis. Additionally
several sites has been recently burned before the image was acquired, so they showed up on the
satellite image as burned, irrespective of their true vegetation category. Obviously, there are still
constraints to the constantly evolving and improving technologies.
I make use of aerial photographs, one form of remote sensing, which provides information
about different land covers in the region, about change in land cover over time, and allows me to
perform a range of analysis on the images to better interpret the landscape. I have employed
aerial photographs to aid in the analysis of the ecological transect data (i.e., grouping vegetation
categories).
It is necessary for geographers to have a thorough understanding of the landscape, such as
that provided by extensive work in the field, to make the most effective use of geographic
technologies. The collection of ecological data is vital to my work as well as to physical

15
geography more generally because it is necessary to understand what is happening on the ground
before being able to understand and interpret satellite images or aerial photographs, which
display the land cover at significantly coarser resolutions. Although these technologies are
generally manipulated by geographers, this emphasizes the need for an integrated approach when
working with imagery.
I will expand on the current analysis in the future by scaling up from the plot level transect
data to the aerial photographs. I also plan to expand that study to the satellite imagery level by
working with other ecologists and remote sensors. This has the potential for the development of
a regional or even biome-level understanding of the landscape at various scales, and over time,
by using aerial photographs which extend back to the 1940’s for my study site, by using satellite
images which are useful for detecting change and looking at very large areas, and by using the
transect data to ground truth both applications. These technologies make valuable contributions
to a study on vegetation change over space and time because both GIS and Remote Sensing
allow for a prediction of future events based on past events in a spatially explicit way (Langley
and Barnsley, 2004).
Global positioning systems (GPS) also contributed to my research by allowing each
transect site to be recorded specifically for future repeatability and monitoring. Additionally, all
locations can be imported into GIS for analysis and display. As is commonly repeated, a picture
is worth a thousand words, and displaying the transects as GPS points on a vegetation map or
aerial photograph provides a considerable amount of information to other scientists, managers,
tourists, or community members interested in the site.
The final component of my research that makes it explicitly geographic is in my results. In
additional to quantitatively documenting change in ecosystem components by grouping transects

16
into vegetation types, I plan to produce a vegetation map showing different categories of land
covers and their extents and change over a three step time series. Although not a map in the
more tradition sense, such as those used for navigation (Vincent and Whyte, 2004), it does allow
for a visual display of the information, highlighting the spatial distribution of land covers and
their change over time. Again, this type of imagery can be exponentially more useful and
explanatory than a written analysis for a wide audience.
Space and Time
Spatial and temporal comparisons are often employed as a means to analyze various
physical and humanistic phenomenons in geography. This concept is fairly straightforward and
useful in geography because it provides ample information about different processes and their
outcomes. Richards, Bithell, and Bravo (2004) explain it simply as “underlying mechanisms
which vary across space, and cause various processes of change over time” (pg. 328). In the case
of my study, underlying mechanisms include physical changes in a dynamic ecosystem which
evolve because no natural system remains at equilibrium, and the semi-arid savanna system is
known for its lack of a climax state.
Time is relevant because both the physical and human changes happen gradually, but
specific drivers combined with time allow the landscape to change. My research looks at
different land covers within one ecosystem in a specific area. The significant changes over time
in the ecosystem components determined by analysis of the ecological transect data can be
correlated with the drivers which initiated the changes under investigation, in this case from
qualitative data from historical records and interviews from people living in the area during the
time frame in question. Analysis of different spaces within the landscape then provides
additional information about how similar inputs affect various spaces differently. For example, I

17
found that areas with different soil types exhibit different effects from similar drivers over the
same time period.
Ecological Theory
The concept of space and time leads into the ecological theory upon which this study is
based. This is because the study compares ecological transect data from 1965 with data from
2007, and also substitutes space for time by comparing the study site in Chobe National Park
with a similar ecosystem in Bwabwata National Park in Namibia. The Bwabwata site is used as
a baseline because it has not experienced the same heavy land use pressures which Chobe
National Park has experienced, and therefore a comparison with the first time series from CNP
can be made based on a continuum from BNP 2007 to CNP 1965 to CNP 2007. The data have
been grouped by vegetation category, and are analyzed between sites, with a focus on change in
three ecosystem components (the herbaceous layer, the woody layer, and animal species) in
regards to the cascade effect from the herbaceous layer to the shrub and tree layer, and on to
animal species density and diversity by vegetation category.
Although the cascade affect has largely been described from a top-down perspective, and
in relation to predators’ influence on lower tropic levels, there is evidence that large herbivores
have considerable influence on cascade effects within an ecosystem (Pringle et al., 2007). As
suggested by Hunter and Price (1992) the cascade effects seen in the Chobe riverfront ecosystem
cascade both up and down tropic levels, and are affected by the heterogeneity of the landscape.
A semi-arid savanna is somewhat continuous grass with discontinuous tree and or shrub
groupings (Belsky,1990) and include fluctuations between these components based on fire, soil
moisture and nutrient levels, and herbivory, specifically elephants. The mosaic of vegetation
types each respond to similar drivers (i.e., cattle grazing, elephants) based on their own inherent

18
qualities. Results from this study demonstrate the cascade effect in Chobe National Park to very
pronounced, although instead of simply moving up or down tropic levels, it is cyclical in nature.
Fire and cattle grazing were found to have degraded the herbaceous layer in CNP by 1965
allowing for bush encroachment along the riverfront (Child, 1968). Pringle et al. (2007) found
ungulates to have a marginally significant effect on herbaceous cover in an African savanna
(Laikiapia District, Kenya), which collaborates evidence from Chobe demonstrating that
degradation of the herbaceous layer developed because of both fire and cattle. Around the same
time in the 1960’s elephant densities increased dramatically in the park (Campbell, 1990), and
they began to exert their influence on the vegetation. They opened the woodland and converted
it to shrubland (Mosugelo et al., 2002). Ungulates have been found to exert a strong top-down
effect on tree density (Pringle et al., 2007), and many studies have correlated elephant densities
with a decrease or an opening in woodland or grassland (Cumming et al., 1997; Dublin et al.,
1990, Skarpe et al., 2004). Along the Chobe riverfront woodland was converted to shrubland,
noted particularly on Pookoo Flats and along the sandridge overlooking the Chobe River. On
alluvial soils on Pookoo Flats the area has been converted to low density stands of Combretum
mossambicense and Capparis tomentosa, while the areas which are now mixed wood or
shrubland on Kalahari sands are dominated by Combretum mossambicense and Combretum
elaeagnoides. These Combretum shrub species were referenced by Child (1968) as one of
several species in the tall bush layer in 1965 and have currently taken over both the tree and
shrub layers on the Pookoo Flats and the mixed wood/shrubland sites. Each of these sites
supports low tree and shrub densities compared with past reports of the sites, and with
comparable sites in Bwabwata National Park. The Baikiaea woodland, further from the

19
riverfront and also based on low-nutrient Kalahari sand has maintained a greater density of trees
and shrubs.
There is evidence that a large number of impala became established in the ecotonal areas
created by the conversion of woodland to shrubland by elephants in the mid-1980’s (Rutina,
2004). While elephants reduced woody cover, impala influenced composition of the woody
layer through selective browsing (Rutina, 2004). The herbaceous layer had already been
degraded, and the decrease in tree and shrub richness and abundance appears to have then
cascaded to the animal component of the ecosystem. This is clear by a significant shift in
mammal species composition and densities on Pookoo Flats and in mixed wood/shrubland, and
to a lesser extent in the Baikiaea woodland. The first two sites mentioned above currently have
very high relative densities of elephant, impala, buffalo and kudu compared to those of 1965, and
compared to similar sites in Namibia. The Baikiaea woodland also has very high elephant and
buffalo densities, and notably demonstrates a complete shift in animal composition from 1965.
While grazers such as waterbuck disappeared when the sward collapsed, other mammal species
have increased dramatically, specifically non-selective grazers such as elephant, impala, giraffe,
and kudu in response a nearly homogenous woody layer.
The cascade effect in the Chobe riverfront ecosystem begets questions of sustainability and
conservation of biodiversity, and whether Chobe National Park is achieving its goals and
objectives regarding these issues. While it is clear that there has been a substantial increase in
large mammal density, there appears to be a decrease in mammal species richness, as many
species cited in the 1965 data were not recorded in 2007. This leads to questions of
sustainability of such large densities of certain species, of whether ecological thresholds have

20
been crossed, and if they have if this will eventually lead to a decrease in the carrying capacity of
the ecosystem.
A system is resilient if it can absorb disturbance, adapt, and maintain its basic functioning
(Walker et al., 2004). Holling (1973) defines resilience in an ecological system as a measure of
the magnitude of disturbance which can be absorbed before a system centered on a locally stable
equilibrium flips to another. This can be difficult to measure because change is often
successional and not the result of a flipped system, and sometimes a threshold has been crossed
and a system has entered another state, but this is not obvious until many years or even decades
later allowing degradation to continue unfettered. It is necessary to be aware of ecosystem
resilience because a shift can often lead to degradation of an environment in the form of a
decrease in productivity upon which humans depend. This can mean different things depending
on the purpose of the ecosystem in question, but in Chobe National Park, like in many protected
areas in Africa, tourism is one of the main forms of livelihoods for communities surrounding the
park, and it is likely to remain so in the future. There is little other industry in the area, and the
semi-arid biome is prone to climatic variability (i.e., drought, floods) with low soil nutrients, and
therefore does not lend itself to large agricultural yields or high levels of income generation from
livestock. The wide variety of wildlife and low yields from other land uses influenced the
Government of Botswana to classify the area a national park in 1968 with the hopes of protecting
biodiversity, and providing income generation from tourism.
Protected areas (PAs) such as Chobe and Bwabwata National Park are defined by the
World Commission on Protected Areas as “an area dedicated to the protection and maintenance
of biological diversity, and of natural and associated cultural resources, and managed through
legal or other effective means.” (Baillie et al., 2004). As a category II National Park, CNP is an

21
area managed for ecosystem protection and recreation. This precludes resource extraction or
use within the park and forces communities to rely on tourism revenue from the area, as opposed
to any consumptive use of the site. Therefore, it is vital that the area remain a well-frequented
tourist destination, with consistent accessibility to a wide range of plant and animal species.
This returns to the question of whether CNP has already experienced a loss of biodiversity,
or if ecological thresholds have been crossed eventually leading to degradation of the landscape.
While, large mammal densities have increased since 1965, animal species richness has
decreased, and there is concern that an environmental shock could cause a crash to the system as
was the case in Tsavo National Park, Kenya. Although Tsavo seems to be recovering
ecologically (Chafota, 1998), massive die-offs of elephants and other herbivores such as giraffe
and kudu, could severely affect the tourism industry. Cumming and Brock (1997) found a
decrease in diversity of woodland birds and ants in areas where elephants had reduced woody
species richness, and the same may hold true for species which distribute seeds, leading to a
decrease in diversity and abundance of woody species, which could then cascade through to the
animal component of the ecosystem.
Because the system is so dynamic, it needs to be monitored consistently, and the different
layers and components need to be considered spatially and temporally. As protected areas in the
region expand and elephants gain access to previously inaccessible sites, it will be necessary for
communities and managers of these areas to anticipate changes associated with elephants so as to
respond appropriately, particularly around water points, which are the most impacted by high
herbivore biomass.
Conclusion
Determining resilience is very difficult in any ecological system, but particularly in semi-
arid savannas, which have high climatic variability. It is not always clear when a system has

22
crossed a threshold into another state. Even so, it is necessary to document and monitor changes
in ecological systems so that is possible to respond and adapt to these changes, whether that is
through management or shifts in usage. National Parks have been set up to maintain biodiversity
and provide recreation for people. These objectives influence economies and allow for the
maintenance of ecosystem services for future generations. Therefore, an analysis of change over
space and time contributes to an understanding of the system and its trajectory.
Although this study is inherently ecological, it incorporates many different disciplines
including zoology, biogeography, history, and economics. It maintains its geographic nature
because the tools used (i.e., GIS, satellite imagery, aerial photography) to design the study and
analyze the data and because of the basic geographic frameworks it is rooted in such as looking
at changes over space and time and scaling up from an area to a region.

23
CHAPTER 2 QUANTIFICATION OF CHANGE IN ECOSYSTEM COMPONETS ALONG THE CHOBE
RIVERFRONT
Introduction
Even to the untrained eye of a tourist in Botswana’s spectacular Chobe National Park
(CNP), the Chobe riverfront is inundated by large elephant herds, and most large trees tower as
skeletons above an underbrush of hedged shrubs and thickets. The world’s largest known
elephant herd (approximately 216,000 animals) is centered on northern Botswana, western
Zimbabwe and the Caprivi Strip of Namibia (Blanc et al., 2007). Increasing exponentially, and
doubling in under fifteen years, these elephants are of immense biological (to ecosystem health,
environmental service and biological diversity) (Cumming et al., 1997; Rutina, 2004), economic
(to tourism, safari hunting, human elephant conflict and local livelihoods) (Jackson et al., 2008)
and political (to ivory trade, culling and sustainable use practices) importance (Barnes, 1996).
Our intention was to provide repeatable measurements that were affordable financially and
in terms of time, to assess changes in the herbaceous, woody and large mammal components of
this savanna ecosystem since the colonization and domination of this environment by elephants
(Work and Owen-Smith, 1986). A temporal comparison was made by repeating and
supplementing transects conducted in the mid-1960’s using methodology developed by Riney
(1963). Substituting space for time, we identified the most physiognomically similar nearby
environment that is not yet heavily impacted by elephant (i.e., Bwabwata National Park (BNP))
west of the Kwando River in the Caprivi Strip, Namibia, and placed a comparable number of
transects there. Quantitative data regarding the woody layer were not collected in CNP in 1965,
so BNP was used as an indicator of what woody density and composition may have been in CNP
in 1965. To increase repeatability of this method, and particularly our ability to monitor changes
in woody vegetation, we complemented each Riney transect with an additional transect using

24
methodology developed by Walker (1976). To improve robustness of our conclusions, we
triangulated our results with a review of the scientific literature, diaries of hunters and explorers,
and with the knowledge of key observers including scientists, managers and local people such as
Bushmen. Our intention was to inductively identify and explore key environmental issues, as the
foundation for designing more detailed research spatially and methodologically, including the
use of remote sensing and investigations of large mammal, small mammal and invertebrate
diversity and sustainability. This study aims to quantify changes in the herbaceous layer, woody
layer and large mammal component of the Chobe riverfront ecosystem over time. It is obvious
to us, especially following the quantification outlined in this study, that the Chobe ecosystem is
much simplified in terms of plant and animal diversity. However, we still need to determine
whether this ecosystem is 1.) less productive than it was before given the high density of some
large mammals and the apparent productivity of pioneer plant species, especially the scrub layer
and 2.) how resilient this new system is in the face of increasing elephant pressures, and climate
variability and change. Models predict that climate change will impact this region more than any
other in Africa (Thornton et al., 2006).
Study Area
The Chobe riverfront (Figure 2-1) is characterized by nutrient-rich alluvial soils in areas
previously covered in floodplain and by nutrient-poor Kalahari sands elsewhere (Simpson,
1975). As illustrated by the sketch (Figure 2-2), the area is characterized by six vegetation types,
some of which have been heavily modified by, among other things, elephants and impala
(Rutina, 2004). A fringe of reed beds along the river course has almost entirely disappeared
since the 1960’s. This is followed by floodplain grassland and then a thin strip of riparian
woodland, up to 70 meters in width. Beyond this, and varying in width according to the
topography, is grassland on more fertile and alkali alluvial soils (Selous, 1881, Henry, 1966)

25
which Selous (1881) associated with scattered trees, often Acacia tortilis in 1874. The woody
cover has changed at least twice since then, with Dichrostachys cinerea thickets being associated
with cattle trekking in the 1950’s (Child, 1968) now been replaced by Capparis tomentosa, a
spiny scrambler that can take on a self-supporting tree form. Pookoo Flats is typical of this
ecotype. These bushed grasslands grade rapidly into a heavily modified mixed woodland on the
slope of the basalt-underlain sandridge, with a ‘climax’ Baikiaea plurijuga (African/Rhodesian
teak) dominated Kalahari Woodland on the deep infertile sandy soils on the top of the sandridge
(Child and von Richter 1968, Moroka, 1984). See Figure 2-3.
We selected the physiognomically similar Bwabwata National Park for comparison with
Chobe because BNP is only starting to be damaged by elephants and in places appears quite
similar to what Chobe used to look like in the 1960’s (Child, G., pers obs.). Rainfall is similar;
Chobe receives 690 mm compared to 600-700 mm in Bwabwata, as is elevation; 910-1,050 m
(Mendelsohn and Roberts, 1997) and compared to 900-1,100 m respectively. Topographically,
the Chobe study area comprises a single ‘sandridge’ atop a basalt intrusion, whereas, however,
Bwabwata is characterized by an undulating dune structure and a catenal effect, with deep sands
on the ridges and heavier and more fertile inter-dune ‘drainage’ lines.
In making our temporal comparison, we noted that the 2007 transects were done earlier in
the dry season (by two to three months) and following better rainy seasons (Figure 2-4) than the
1965 surveys. Therefore, if the status of the herbaceous level had not changed, we would expect
transect data with higher levels of rooted grass and grass cover than in 1965.
Land Use History
In 1852, Chapman shot a significant number of elephants in what is now the southeastern
corner of Chobe National Park, but as he traveled northwards into our study area he saw no more
elephants (Chapman, 1968). This was confirmed by another famous hunter and explorer, Selous,

26
who in 1874 recorded approximately 100 elephants between Kasane and Ngoma (Selous, 1881)
in our current study area. At this time the area was infested by tsetse fly, and Selous saw no
people on the mainland until he reached Linyanti; the only inhabitants of the area were living on
what is now Impalila Island (Selous, 1881). The trader Westbeach first moved cattle onto the
Chobe River at Kazungula in 1886. People began to settle what is now the Chobe Enclave, first
from Impalila Island, and from the 1920s agriculture increased significantly with an influx of
people from Gweta and Makalambabedzi southeast of the Okavango on what is now the main
road between Maun and Francistown. There were soon 30,000 cattle in what became the
“breadbasket of Botswana”, but agriculture collapsed with the floods of 1957 and approximately
half the population returned to Maun. Bushmen who were living along the Ngwezumba River,
hunting and gathering and presumably herding a few cattle, moved into the Enclave so that when
Chobe was declared a Game Reserve in 1962 and a National Park in 1968, it was devoid of
people.
The park was used for logging, with Sussman Brothers constructing a wooden trolley way
into present day Zimbabwe in the early to mid-1930s. Chobe Concessions resumed logging for
about five years from 1947, producing cross-ties for railways. Like Sussman Brothers, this
forestry venture was also unprofitable, and attempts to make the business work with cattle and
rice paddies also failed- remnants of paddies and dip tanks are still visible in the Pookoo Flats
area. From approximately 1949 to 1962, the riverfront was used as a cattle corridor from
Ngamiland to trek cattle to the Zambian Copperbelt, but the reinvasion of tsetse fly forced cattle
trekking to the east. The remnants of the invasive woody species Dichrostachys cinerea are
presumably a consequence of this period. The park was burned regularly by the Forestry

27
Department until 1967/68, but by then vegetation along the river could only support creeping
ground fires and not the intensity of fires as evidenced by fire scars on trees.
Methodology
Data Collection
Data were collected from 27 sites in BNP (Namibia) and 26 sites from CNP (Botswana).
We used the 200-yard Riney step-point method (Riney, 1963) to provide a direct comparison
with Child’s (1968) earlier work. At each site we also used Walker’s (1976) method because it
is more repeatable and the objective of our large study was to leave behind a baseline survey and
to link field methods to remote sensing. Walker developed his method from the original work
done by Riney, but designed it to be more comprehensive and repeatable, and to be adapted to
the specific purpose of his study. Thus, 25 1 m2 plots to obtain eight measures of the health of
soil surface and grass sward. A variable-width belted transect is used to assess the density and
structure of woody species, including damage to it. Both methods include comparable dung
plots, which record presence or absence of dung identified by species, and have provided
valuable data for very little extra work. Both transect methods were developed by experienced
southern African ecologists for use in the highly patchy conditions associated with semi-arid
savannas. Additionally, we classified and counted all the trees in the same one-mile long
riparian strip done by Child (1968) in 1965 to assess what changes have occurred along the
riverfront over the past 40 years.
Sampling Method
The locations of the transects were determined by a combination of methods. We replicate
the FAO vegetation survey conducted by Dr. Graham Child (FAO Wildlife Ecologist advising
the Botswana Government at the time) in 1965, when there was no GPS technology. Therefore,
Dr. Graham Child’s presence during the field work was invaluable because his memory of the

28
previous transect locations in conjunction with his field notes outlining the transect sites allowed
for a high degree of repeatability of site location. His input also allowed for standardization of
data collection techniques for the Riney transects, which contributes to greater reliability when
comparing results. The beginning and endpoints of the 2007 transects sites were recorded on a
Garmin GPSMAP 76 CSx for future replication.
Dr. Child’s 1965 vegetation assessment was based on 19 Riney transects including seven
on Pookoo Flats, nine along the sandridge overlooking the Chobe Flats (mixed wood/shrubland),
three on Kalahari woodland (Baikiaea woodland), and an enumeration of tree species along a
one mile section of riparian woodland. The 2007 (Table 1) study consists of seven sites on the
Pookoo Flats (two of which were deliberately sites in the “best” grassland for demonstration
purposes), nine sites in mixed wood/shrubland, seven sites on Baikiaea woodland, and three sites
on the Chobe River floodplain (possible because it was the dry season). A 1 mile by 70 meter
sample of the riparian strip was also replicated along the Chobe riverfront between the culvert
and Sedudu Valley.
In Bwabwata National Park sites were selected so that results could be compared with the
CNP data, but also for the purpose of establishing a baseline survey for long-term monitoring.
Satellite imagery (Landsat 5, 2004) was used to insure that all major vegetation types in the
eastern part of the park were sampled. We also identified specific sites (e.g., riparian woodland)
that were similar to those measured in Chobe in 1965, which were then assessed using both types
of transect. Overall, five vegetation categories were sampled in BNP including two riparian
strip transects, four floodplain sites, seven grassland sites, nine mixed wood/shrubland sites, and
five Baikiaea woodland sites.

29
Results
Herbaceous Layer
The most repeatable herbaceous data sets from 1965 is the 200 points we classified as having
either rooted grass (Figure 2-7) or bare ground (Figure 2-6) (i.e., Riney), as well as whether it
had a cover of perennial grass, annual grass or nothing (Figure 2-8). The Pookoo Flats area in
CNP demonstrates a significant change in the herbaceous layer in the form of an increase in bare
ground and a decrease in rooted grass between 1965 and 2007. Bare ground levels in the mixed
wood/shrubland sites in CNP, conversely, have decreased and rooted grass has increased very
slightly since 1965. However, as mentioned, inland water sources dried up early in the season
and forced animals to congregate in larger numbers along the riverfront in 1965 than when we
collected data in 2007. Comparable sites in BNP are significantly healthier than CNP 1965 and
in 2007. The Baikiaea Woodland sites in CNP also show a significant increase in bare ground
although there has not been a significant change in rooted grass. Baikiaea woodland sites in
BNP have significantly lower levels of bare ground than in CNP 2007, and higher levels of
rooted grass than in 2007.
A comparison of grass cover (i.e., % of step points with aerial grass cover) shows that
Pookoo Flats was dominated by perennial grasses (37%) in 1965 with a few annuals present
(3%). By 2007 perennial grass had declined to 1.2%, while annuals increased slightly to 2%.
Overall grass cover declined from 40% to 3%.
The sparse grass cover in mixed wood/shrubland sites was close to negligible (0.2% and 1.1%
respectively). By contrast, similar areas in the lightly stocked BNP are moderately grassed by
perennial grasses (18%), with few annuals present (3%). The CNP 1965 data show dominance
by perennials (12%) and a few annuals present (5%). In 1965, the Baikiaea woodland in CNP
30
had a reasonable grass cover dominated by perennials (12%), but perennials maintain a presence
(8%) with a similar overall grass cover to CNP in 1965.
Woody Layer
Riparian strip
There has not been a significant change in tree density (1965, n=299; 2007, n=324), or in
species richness (1965 number of tree species = 14; 2007 number of tree species = 12), but the
species composition has changed dramatically (Figure 2-9). Six of the 14 species recorded in
1965 have disappeared, including Ziziphus mucronata, Diosyrus mespliforis, Kigelia africana
(pinata), Acacia albida, Acacia galpinii and Acaica erioloba. Many of these are big, impressive
(and palatable) trees. Three species not previous present have colonized the strip, Markhamia
obtusfolia, Markamia zanzibarica: although one is (Capparis tomentosa) a vine that grows into
the tree layer and can be self-supporting. Perhaps the major change is the replacement of Acacia
nigrescens by Croton megalobotrys as the dominant species. In 1965 Acacia nigrescens, then a
relatively recent invader based on age structure of the tree population, comprised slightly more
than 50% of tree species. This and five other species comprised 88% of species recorded, by
2007 a rapidly growing invasive species, Croton megalobotrys, made up 83% of the riparian tree
species-only five C. megalobotrys were recorded in 1965. The next most prolific species in 2007
were Markhamia obtusfolia (n=11), a species not recorded in 1965, and Trichilia emetica
(n=11), a species present in 1965, and unpalatable to elephants. Additionally, 82% of species
recorded in 2007 were determined to be in the highest two classes of elephant damage possible.
Riparian trees were also recorded in the Bum Hill area of Bwabwata National Park (Figure
2-10) on the west bank of the Kwando River, the site most physiognomically similar to Chobe
identified along the river. This data is comprised of four transects (two sites), and a traverse of

31
undefined area. Although these data are not directly comparable because of differences in
collection methods, it does provide information about species composition.
Seven of 15 Namibian riparian species (dbh > 5.5”) were recorded in Chobe in 1965.
Although Acacia nigrescens dominated the area surrounding the transect sites visually, it was not
the most recorded species because a campsite had been built around and into many of these trees,
therefore precluding it as a transect site.
Lonchocarpus capassa was the most common riparian species recorded in the Namibian
transects (24). Forty L. nelsii were recorded in Chobe in 1965. These species are difficult to
distinguish, and it is possible that they have been misidentified. Ziziphus mucronata, Garcinia
livingstonei, Diospyros mespiliformis, and Acacia erioloba/giraffae were also present in CNP
1965 and BNP. Of these only two Garcinia livingstonei and one Acacia erioloba remained in
CNP in 2007. It is interesting to note the low incidence of Croton megalobotrys in both CNP
1965 and BNP, and that Markhamia obtusfolia and M. zanzibarica have a substantial presence in
CNP 2007, while neither was recorded in CNP 1965 or BNP. This would suggest that these
quick growing trees are successional species because they are functionally similar to trees
previously recorded in the area (Rutina, 2004).
Pookoo Flats
Pookoo Flats supports 152 woody plants per hectare, characterized as it is by intensively
hedged shrubs and large patches of bare ground (Figure 2-2, 2-3). In describing the woody layer
we combine trees and shrubs because the majority of trees recorded (woody species > 3 meters)
were shrub species even though they exceed 3 meters in height-thus Combretum mossambicense
and Capparis tomentosa comprise 73% of the woody layer (39% and 34% respectively). Only
seven different tree and shrub species were recorded on Pookoo Flats. See Table 2-2.

32
Mixed wood/shrubland
In the heavily utilized mixed woodland ecotype, the density of shrubs (1,373/ha) exceeded
that of trees (40/ha) thirty-four fold. By comparison, there are thirteen times as many trees in
Bwabwata (534/ha) and about 1.5 times as many shrubs (2,158/ha). As noted, Bwabwata may be
naturally more diverse than Chobe, but it also has far fewer elephants and the area burns
regularly.
In Chobe we recorded 9 species in the tree layer and 16 species in the shrub layer in CNP.
Six species were common to both categories. There were 22 tree species and 32 shrub species in
BNP. Many of these species were recorded only once or twice, indicating that rare species might
be being lost from CNP.
In Chobe, Combretum mossambicense (43%) and Combretum elaeagnoides (40%)
dominates the woody vegetation (Table 2-3). By contrast, the shrub layer in BNP is dominated
by Baphia massaiensis (29%), which was much more common in CNP in the 1960’s (Child,
1968). Terminalia sericea (29%) is the most prolific tree species in BNP, and perhaps indicative
of a perched aquifer in the ancient dune system as is often the case in Kenya (Tinley, pers com).
Baikiaea woodland
Baikiaea woodland in CNP is comprised of a tree (195/ha) and shrub (1,565/ha) layer. The
density of the shrub layer in physiognomically similar woodland in BNP is similar (1,327/ha) but
there are less trees (123/ha). The woody layer in BNP was more diverse than in CNP with 22
tree species compared to 9 in Chobe, and 32 shrub species compared to 16 in Chobe.
Baikiaea woodland sites in Chobe are dominated by Baikiaea plurijuga (29%) and
Markhamia zanzibarica, (30%), a pioneer species (Table 2-4). In BNP proportions are 53% and
18% respectively. This may reflect past logging practices in Chobe. The composition of the

33
shrub layer, however, is markedly different. In CNP Combretum elaeagnoides (42%) dominates
the shrub layer, whereas Baphia massaiensis (58%), is the dominant shrub in Namibia.
Animal Composition and Density
Analysis of dung plots in the three main vegetation types (Figures 2-11 through 2-13)
suggest that large mammal composition and densities have changed enormously over time along
the Chobe riverfront, although we caution that the absence of some species recorded in 1965 may
be exaggerated because we collected data three months earlier than in 1965, a dry year when
animals were very dependent on water from the river. The most obvious change demonstrated
across sites is that impala, which were highly restricted in 1965 (Child, 1968), are now abundant
on Pookoo Flats and in mixed wood/shrubland-where only elephant are more prolific. Elephant
are the dominant species on all sites except Pookoo Flats, and are at much higher densities than
in 1965, and roughly four times the density of BNP. Kudu have also increased markedly,
presumably reflecting a shift in ecosystem resources from grass to shrubs. Buffalo densities
remain similar to the 1960’s with their presence in Baikiaea woodland presumably linked to the
fact that they have not all come down to the river by June/July in a wetter season when the field
work was conducted.
All three vegetation types exhibit a marked decline in specialist grazing species or species
with particular niches in 2007 compared to 1965, but we also recorded some species, particularly
unspecialized browsers, that were uncommon or unrecorded then. In most cases, these changes
make sense given the habitats of the species and the changes in habitats that we described above.
On Pookoo Flats, the 2007 transects did not record four large mammals prevalent in 1965 (i.e.,
wildebeest, puku, waterbuck and bushbuck) while giraffe and impala were new. The
disappearance of the wildebeest population can be attributed to the collapse of the Makgadikgadi
population in the late 1960’s from where these animals occasionally dispersed (Child, personal

34
communication). Puku, which were once so prolific on the Flats that Selous named the area after
the species (Selous, 1881), were already thought to have decreased by the 1960’s when they
made use of the remaining perennial grasses in between the thick bush (Child, 1968), and their
subsequent disappearance may be attributed to the collapse of the grass sward (Figures 2-6
through 2-8). The degradation of the grass layer may also explain the disappearance of
waterbuck and the decline in warthog density. Although bushbuck were a commonly seen
browser on Pookoo Flats in the 1960’s, we only saw two in this area over three field seasons, and
their disappearance is probably related to competition with impala or kudu, and the loss of food
species and cover in places formerly characterized as thickets and riverine habitats.
Giraffe, by contrast, appear to have responded positively to the habitat changes we have
recorded. In two years of intense field work in 1965-1966 only five giraffe were recorded
between Kasane and Ngoma (Child, 1968), but they are now common on Pookoo Flats and in
Baikiaea woodland, where they make extensive use of Capparis tomentosa (per obs). Giraffe
are reported to disappear from the riverfront during the wet season. Kudu, too, have increased
and are now extremely common. They browse heavily on Combretum mossambicense on
Pookoo Flats, as well as C. tomentosa, which they browse at a different level than giraffe.
In the mixed wood/shrubland sites 14 species were recorded in 1965 compared to six in
2007. Eight species were no longer present (sable, bushbuck, duiker, eland, waterbuck,
wildebeest, tsessebe, baboon) and two appeared much reduced (warthog, zebra). The
explanation for the decline or disappearance of wildebeest, waterbuck, warthog and bushbuck
reductions is the same as described for Pookoo Flats. The relatively earliness of the field season
may explain some of the decline or disappearance of zebra, sable, eland, and tsessebe; however,
while we saw sable regularly, the same cannot be said for eland and tsessebe which appear to be

35
far less abundant than they used to be (Child, G., personal communication). Duiker are browsers
with small home ranges, and their local decline can be attributed to the heavy use of these
habitats by elephant and impala. The substantial increase in impala is consistent with eastward
spread of this species in Chobe and is associated with areas heavily impacted by elephants.
Buffalo maintain a strong presence, while kudu have increased with large amounts of favorable
browse in the area (Combretum mossambicense).
Similar trends are apparent in Baikiaea woodland sites. Four large mammals recorded in
the 1960’s were not recorded in 2007 (duiker, zebra, eland, sable), whereas the area has been
occupied by impala, kudu, and giraffe. This is consistent with the explanations provided. More
specialist large herbivores, especially grazers, have declined because of the large increase in
elephants and the decline in perennial grass cover and loss of woody diversity, whereas
unspecialized browsers have responded to an increase in less palatable, but abundant browse
such as Combretum elaeagnoides, Markhamia zanzibarica, Baphia massaiensis and Combretum
mossambicense.
The large increase in elephant in the Baikiaea woodland reflects the increase in the
elephant population in CNP generally-elephant passing through the Baikiaea woodland in large
numbers on their way to the Chobe River every afternoon. The increase in elephant density to
levels consistent with those in the mixed wood/shrubland on the face of the sandridge, the area
that in the 1960’s supported the highest elephant utilization levels, may also reflect both a change
in the woody composition of the Baikiaea woodland and the need for elephant to move much
further to get food. Many of the species listed above are palatable to elephant, and may
encourage their use of this area, as well as decrease in density of woody species on the sandridge
and in mixed wood/shrubland generally.

36
Because of political unrest including the South African Angolan War and much later
formal protection (1990) wildlife densities in BNP are much lower and less diverse than CNP,
even to the casual observer. Our data shows that wildlife densities in BNP are 19% of CNP’s in
1965 and 13% of what they are in 2007. Giraffe and impala, species that colonized the riverfront
in Chobe between 1965 and 2007, were not recorded in our transects in Bwabwata (although
impala were observed near roadways, which we did not sample because of road effects). In
BNP, elephants were the most numerous species, albeit at one quarter the density of CNP. We
recorded kudu in Baikiaea transects (and saw them regularly, although at a much lower
frequency than CNP), while impala were present in the riparian transects in BNP, the habitat
where they are found in the highest densities in CNP. Again, inland water pans had not fully
dried up when we did our transects, forcing animals to congregate along the Kwando River.
Discussion
Our data confirm one’s immediate impression that the Chobe riverfront has been heavily
impacted by elephants (and impala and kudu), and quantifies these change in three important
components of savanna ecosystems – the grass layer, woody vegetation and the large mammals.
Note also that preliminary work on small mammals and insects in Bwabwata (in a related
project) suggest much lower densities and diversities of these components in areas heavily used
by elephants (Mfune, personal communication). The decline in grass cover, woody species
diversity and large mammal diversity recorded in CNP between 1965 and 2007 is supported by a
comparison with Bwabwata National Park-a similar (but not identical) ecosystem (Work and
Owen-Smith, 1986) with lower levels of past anthropogenic land use and animal pressure (Rice,
1997).
The herbaceous layer along the Chobe riverfront was already overutilized and declining in
biomass in the 1960’s because of past land use (i.e., cattle grazing, logging, agriculture, fire) and
37
heavy wildlife (elephant, buffalo, hippo) pressure (Child, 1968). Our data suggests that the grass
sward is certainly no better than it was in 1965, and had we conducted our work at the end of the
dry season when previous measurements were taken, would presumably have been worse or
much worse. While some annual grasses are present on Pookoo Flats and the Baikiaea woodland
in CNP 1965, by 2007 all three vegetation categories have very little herbaceous cover (<2%),
and show signs of bush encroachment, a typical successional step after a shift from perennial to
annual species (Kelly and Walker, 1976). By comparison, similar sites in BNP have
considerably more grass, which can be explained by much lower wildlife densities (Rice, 1997),
although we also note that fire is more frequent in BNP for anthropogenic reasons (park policy
and practice) and because of higher fuel loads.
While BNP maintains perennial grass cover with less annual grass, annual grasses are
beginning to dominate the sward in Baikiaea woodland sites in BNP (Figure 2-8), possibly a
response to frequent early dry season burning (Riney, 1963). Historically, fire, especially
frequent and early dry season burns lit by the Forestry Department to “protect trees” played a
part in weakening the perennial grass layer in CNP. So did use by cattle (1950s) and wild
herbivores utilizing the river. This gives rise to a degradation sequence typical of semi-arid
savanna–heavy use and kicking up perennial grass tufts, leading to increasing bare ground and
decreasing herbaceous biomass but with a higher component of annual grasses, followed by
changes in soil water relationships that favor woody encroachment (Walker et al., 1981; Child,
B., 1986). Similarly, the decreasing vigor of the herbaceous layer opened the riverfront to bush
encroachment on Pookoo Flats, first as Dichrostachys cinerea after extensive browsing by cattle
at this site in the 1950s, and then as Capparis tomentosa-associated with the heavy utilization by
game reported in this paper.

38
Degradation in the herbaceous layer was well established by the 1960’s when elephant
densities reached levels greater than 2/Km2 (Child, 1968). At the same time, elephants began to
decimate large riverine trees (Child, 1968); Child recorded large riparian-type trees including
Acacia tortilis, Acacia nigrescens, Phyllogeiton discolor (Burchemia discolor today), Croton
megalobotrys, and a few Boscia’s on Pookoo Flats. He noted that the large trees showed
extensive elephant damage, and by 2007 these species had been replaced by Croton
megalobotrys on both Pookoo Flats and the portion of the riparian strip sampled for this study.
Child (1968) noted the dominant species in each site mentioned, but not density, which is
why we were unable to make this comparison. Several of these have presently disappeared in
the transects or are now uncommon, with one or two shrub species Child listed often now
dominating the site. For example, Child’s 1968 report describes Pookoo Flats as covered in
dense bush, specifically Dichrostachys cinerea, but also Ziziphus mucronata, and Combretum
mossambicense. In 2007 the area is dominated by Combretum mossambicense, we recorded only
one D. cinerea, Z. mucronata was not recorded in the transects, and the bush has opened up
considerably because of high elephant and other herbivore use.
Like Pookoo Flats, the mixed wood/shrubland (sandridge) sites in CNP shows a
disappearance of many tree species previously noted. Child (1968) sites Acacia
giraffae/erioloba, Acacia nigrescens, Phyllogeiton discolor (currently referred to as Berchemia
discolor), Lonchocarpus nelsii, Pterocarpus martinii and Commiphora species as the dominant
trees in the area, all of which are palatable to elephant. Of the six species listed, Acacia giraffae,
Pterocarpus martinii and Commiphora species have disappeared locally, and only Lonchocarpus
nelsii maintains any noticeable presence.

39
Species noted as part of the mixed wood/shrubland (sandridge) shrub layer in 1965 were
Combretum mossambicense, Combretum elaeagnoides, Baphia obovata, Bauhinia macrantha,
and Commiphora sp. All of these except Bauhinia and Commiphora still exist, although Baphia
is now rare. The two Combretum species are overwhelmingly dominant in the shrub layer,
accounting for 83% of shrub species. Visually, numerous dead trees also stand up over what is
now a shrubland (Figure 2-2, 2-3). Combining the tree and shrub layer, Combretum
mossambicense dominates the site.
The dominant woody species in Bwabwata National Park is Terminalia sericea, often in a
shrub form, a species that is common on deep sand in CNP but is not prevalent along the Chobe
riverfront. This indicates some ecological differences between areas, and clouds our conclusion
as to whether the substantially greater number of tree and shrub species in BNP compared to
CNP are inherent or a function of land management. However, Baphia massaiensis dominates
the shrub layer in BNP as it did in CNP in the 1960’s- which indicated some similarities between
sites.
The abundance of Baphia massaiensis at many Namibia sites including the Baikiaea
woodland and mixed wood/shrubland is noteworthy because it is considered fairly high quality
browse. Although Child (1968) cited it as a feature of the shrubland on the sandridge in the 60’s
it was very rare in CNP by 2007, and is completely absent from the Chobe Baikiaea woodland
sites. It is probable that high animal densities in Chobe have already decimated this useful
browse, and only left a few remnants in select areas. Bwabwata National Park by contrast does
not have nearly the same levels of animal densities and therefore has much more of this species
remaining.

40
Dichrostachys cinerea is often associated with cattle. As noted, it once dominated Pookoo
Flats in CNP but appeared to die naturally in the late 1960’s. It is common in the Baikiaea
woodland, in mixed wood/shrubland and even the grassland in BNP, where cattle grazed before
the park was declared in 1990. Nevertheless, more palatable species like Z. mucronata and
Baphia massaiensis are being replaced by fast-growing, softer, less palatable shrubs such as
Combretum mossambicense, Markhamia zanzibarica or a self-supporting liana such as Capparis
tomentosa.
We have already suggested that past logging may be a contributing factor to less Baikiaea
plurijuga in CNP (29%) than BNP (53%). In CNP dominance of the tree layer is shared with
Markhamia zanzibarica, an increaser species functionally similar to other tree species.
Combretum elaeagnoides dominates the shrub layer in CNP, whereas Baphia massaiensis
dominates the shrub layer in BNP and Dichrostachys cinerea is also fairly common in the shrub
layer in BNP.
Increase in elephant numbers in northern Botswana and additional attractive fauna such as
puku, lechwe, sable and roan convinced the Botswana government to protect the area for tourism
in the 1960’s. Burning and other forms of land use were curtailed by 1967/68. Elephant
numbers began to increase with continued protection from hunting, and the population in
northern Botswana was established based on immigration from Hwange National Park in
Zimbabwe (Campbell, 1990) and recruitment. The instillation of artificial boreholes within the
park after 1966 may have played a part in augmenting the population. Elephants began to open
up the scrub and woodland along the riverfront. Mosulego (2002) found a 5% increase in
shrubland and 15% increase in mixed woodland while woodland decreased by 25% within 8 Km
of the Chobe riverfront between 1962 and 1985. Elephant modified habitat is preferred by

41
impala (Rutina, 2004) and the change in vegetation categories increased ecotonal area which is
conducive to impala browsing. Impala increased significantly by the late 1980’s (Rutina, 2004),
a species which up until the 1960’s was almost absent in the area (Child, 1968). As impala
entered the riverfront area in high densities in the 1980’s there was a 15% increase in shrubland
and 11% decrease in woodland within 8 km of the Chobe riverfront between 1985 and 1998
(Mosugelo et al., 2002).
Impala curtail recruitment through extensive browsing which may provide certain species
with a comparative advantage in reaching the shrub or tree layer but reduces recruitment
generally. The changes in vegetation type near the Chobe riverfront instigated by elephant and
realized by impala have had a profound effect on the mammal species in the area. Mosugelo
(2002) found that the conversion from woodland to mixed woodland and shrubland accelerated
between 1985 and 1998; the conversion to shrubland doubled during the 23 year period between
1962 and 1985, while more than doubling during the 13 year period between 1985 and 1998.
Elephant densities were increasing at an increasing rate in the 1980’s before the rate of increase
slowed down (Rutina, 2004). This is the time when the impala population is said to have
“increased rapidly” (Rutina, 2004), which coincides with the time frame when Mosugelo found
the accelerating change in vegetation cover. Because impala browse selectively, they can alter
not only the density of the woody layer through reduced recruitment, but also its composition.
This is probably accounted for the significant impact on the woody layer leading to a major shift
in animal species as well.
The conversion from dense shrubland to open shrubland on Pookoo Flats, from woodland
to mixed woodland in the case of the Kalahari woodland sites, and mixed woodland to
shrubland on the sandridge sites demonstrate how inherent differences in location (near or far to

42
water) and composition (e.g., soil chemistry, moisture, terrain) respond differently to similar
drivers, but at the same time follow general patters such as one or two shrub species taking over
the woody layer, or a general loss of browsers and selective grazers within the animal
component of the ecosystem..
Conclusions
We have used a minimal set of transects, spatial and temporal comparisons, related
literature and oral histories to quantify changes in herbaceous and woody vegetation and large
mammal diversity in a study are on the Chobe riverfront that coincides closely with the primary
tourism area.
As can be seen from the results, the combination of Riney and Walker transects enabled us
to provide meaningful results with two months of field work. The Riney method is much
quicker, but is less quantitative and less useful for measuring changes in woody vegetation. The
Walker method is moderately time consuming but quantitative and repeatable and requires the
observer to be able to identify species rather than functional components of the ecosystem (e.g.,
annual versus perennial grass). No park would lose by having a baseline done with either
method, nevertheless, given the progress being made in simplifying ecological monitoring for
communities (Stuart-Hill et al., 2005), even simpler methods using fixed point photographs and
quicker transects (Stuart-Hill, unpublished) should be tested.
Since the 1960s, grass cover in the study area has almost certainly decreased (we did not
measure species composition), reducing the prevalence of sensitive grazing species (sable, roan,
zebra, warthog, waterbuck, puku, lechwe). The diversity of the woody vegetation has been
simplified, with large trees and palatable species being replaced by hardier shrubs and bushes,
many of which nonetheless are in the highest categories of elephant damage. Unlike grazers and
habitat specialists (e.g., bushbuck), elephants, kudu, impala and (perhaps) giraffe have thrived,

43
and buffalo have held their own, presumably relying on floodplains. Our data show that changes
were more extensive in areas of higher fertility (e.g., Pookoo Flats), but that they nevertheless
affected all components of the ecosystem (i.e., grass, woody plants and large mammals) even in
the infertile Baikiaea woodland.
This leaves the situation seen today with low herbaceous biomass, low quality shrub
monospecies stands, and extremely high densities of a few animal species along the riverfront.
However, although the diversity of the large mammals and woody vegetation has been
simplified, we cannot conclude that the overall biomass of wildlife and availability of browse
decreased (this needs more detailed research). Nevertheless, our impression is that wildlife
biomass is very high, and that browse is more plentiful than it was in the 1960s even if several of
the more palatable species have disappeared.
So what we have found is not surprising, just severe enough to raise important questions
about ecological sustainability and resilience, about whether the park is ‘successful’, and about
whether it is technically or politically possible to resolve the elephant question. Ecologically,
our recommendation is to establish a wider baseline of Walker-type transects, or a simplification
of them, because this will provide quantitative, habitat and species-level information that policy-
makers can use to make or support decisions. This monitoring also needs to be extended
spatially, and importantly into areas that have lower elephant densities and where the ecology is
still ‘intact’ such as Moremi game Reserve and Bwabwata National Park.
This study also raises important philosophical questions about the performance of
protected areas, and the responsibility for monitoring this performance. Ecologically speaking,
CNP has certainly conserved the ‘endangered’ elephant. However, there have been significant
trade-offs in terms of grass cover, key ecological zones, large trees, palatable plants, and the
44
diversity of mammals including species more threatened, if less well known, than elephants like
tsessebe. These changes are, more than likely, also an indicator of losses of other taxa, as
Cumming et al., (1997) and Mfune (ibid) found. However, a stated objective of the park was to
develop an economic sector, and in this is has been extremely successful. Yet, as with the
ecosystem, there are concerns that the lack of diversity is problematic.
Finally, is the issue of what to do with the elephants? To prevent this population of
216,000 elephant growing would require that some 13,000 animals were removed annually. On
the one hand, culling is politically sensitive. On the other, these animals already support a large
hunting and tourism industry, a multi-million dollar elephant economy that could be expanded
further, with the greatest opportunities being in leather and leather-value adding activities (not
ivory as commonly supposed). Alternatively, or additionally, is the option of working with
Angola and Zambia to develop policies that enable large areas of sparsely settled land to become
elephant economies through a combination of valorizing elephants (and associated species) and
ensuring that landholders are the primary beneficiaries – indeed, these principles lie behind
southern Africa’s successes in private and community conservation (Suich and Child, 2008).
However, to achieve this, elephants need to be given priority to key ecological zones where
humans are currently outcompeting them, such as the floodplains opposite Kasane and the river
valleys that connect up the region.
In conclusion, the management of parks is usually extremely complicated, with CNP
being no exception. Given the stated importance of parks as the cornerstone of global
conservation, it is surprising how little monitoring of their ecological, economic or social
importance takes place (e.g., Cumming, 1997). We have used relatively simple and affordable
monitoring (i.e., Riney 1963, Walker 1976) to provide quantitative data about the status of the

45
key components of savanna ecosystems. These systems could easily be integrated into the
annual workplans of park wardens.
There have been substantial changes at each of the sites along the Chobe riverfront in
Chobe National Park between 1965 and 2007 in the herbaceous, woody, and animal components.
This is further exemplified by the large disparity between Bwabwata National Park and CNP,
which demonstrate many similarities in woody species, especially between CNP 1965 and BNP,
but large differences in health of the herbaceous layer, woody species composition and densities
in 2007, and animal densities generally.
Is not clear what the simplification of the woody and mammal components of CNP will
mean, although it brings up many questions of sustainability. While CNP has experienced
significant changes over time, future work will be necessary to determine if thresholds have been
crossed, if these thresholds are irreversible, and if there has been a decline in ecosystem
resilience because of this. While some feel that elephant impact on vegetation is simply
fluctuation around an equilibrium and reversible (Lindsay, 1990), many others feel that
vegetation change by elephants crosses a threshold leading to deterioration of the landscape
(Child, 1968).
Savanna environments are currently supporting the greatest levels of population growth
of any biome on earth (Scholes and Walker, 1993), which makes the changes demonstrated all
the more relevant in terms of these environments continued provision of ecosystem services and
conservation of biodiversity. Tourism drives the economy in communities around CNP, and the
implementation of the Kavango-Zambezi Transfrontier Conservation Area (KAZA-TFCA) in
2010 would amplify this situation around the region. It is important for communities and
management institutions to be aware of the significant changes that have occurred along the

46
Chobe riverfront so that changes in other similar environments can be anticipated in the face of
similar drivers. Managers of these areas will need to make decisions regarding the instillation of
bore holes thereby attracting wildlife and tourists in the short term, and trying to maintain habitat
for future tourism, biodiversity conservation and ecosystem services in the long term. The
question of whether CNP is successful in terms of its intended purpose may be useful in
determining this.

47
Figure 2-1. Study site. A.) Southern Africa, Botswana highlighted. B.) Chobe National Park, northern Botswana. C.) Transect locations in Chobe National Park.
Figure 2-2. Riverfront vegetation types: Floodplain, riparian strip, Pookoo Flats, sandridge,
Baikiaea woodland
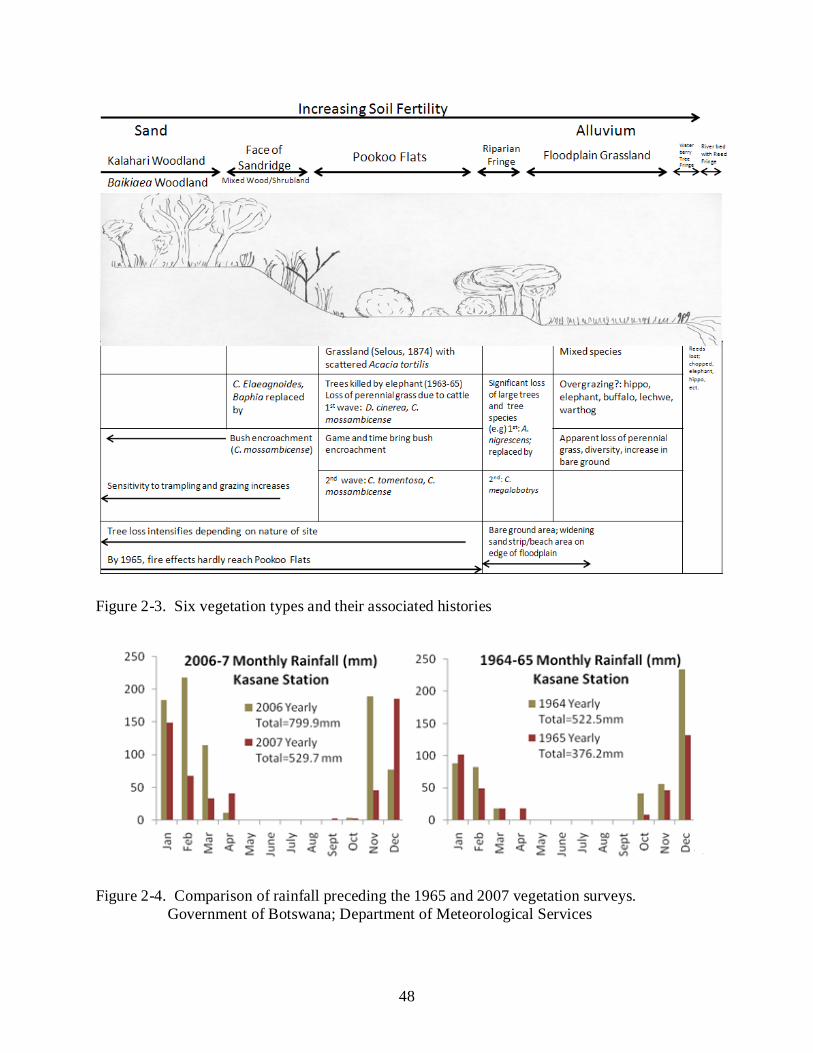
48
Figure 2-3. Six vegetation types and their associated histories
Figure 2-4. Comparison of rainfall preceding the 1965 and 2007 vegetation surveys. Government of Botswana; Department of Meteorological Services

49
Table 2-1. Number of transects per site and year Transect Numbers per Vegetation Category (n)
CNP 1965 CNP 2007 BNP 2007 Riney Walker Riney Walker Riney Walker Pookoo Flats 7 5 5 Pookoo Flats Best Grassland
2 2
Mixed Wood/Shrubland
9 9 9 9 9
Baikiaea Woodland
3 7 7 5 5
Grassland 7 7 Floodplain 3 3 4 4 Riparian Zone Enumeration report Enumeration report 2 2
Figure 2-5. History of elephants and land use in Chobe National Park
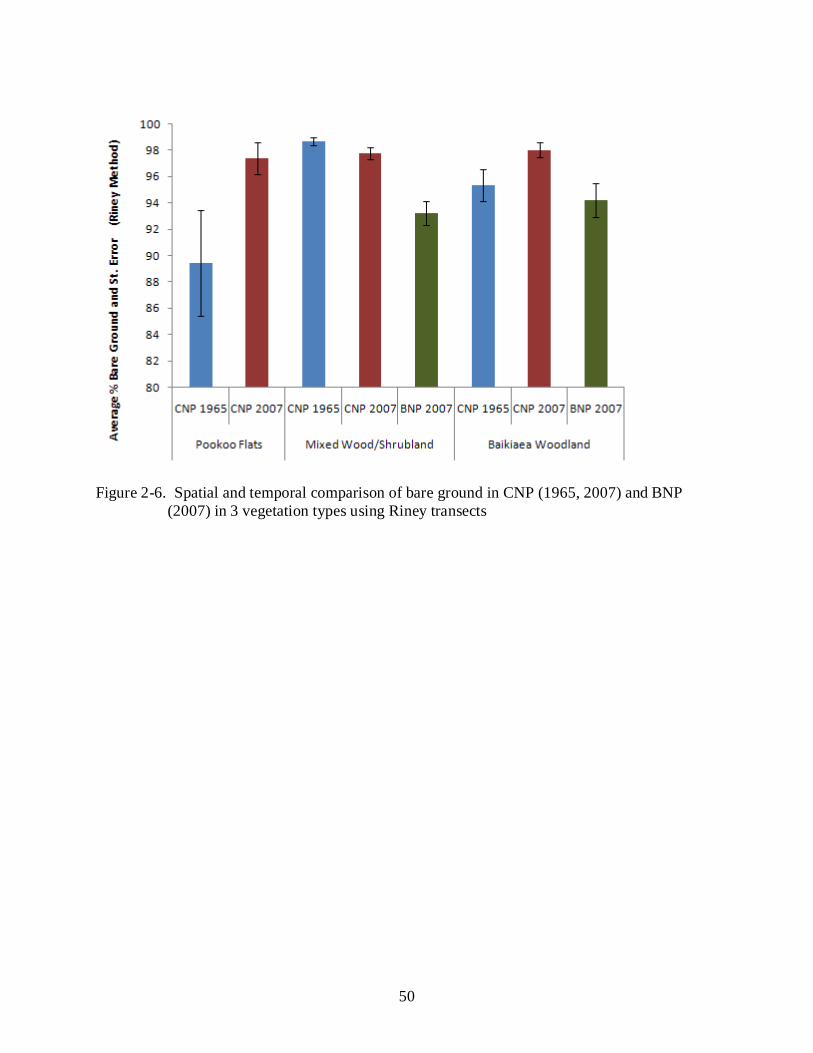
50
Figure 2-6. Spatial and temporal comparison of bare ground in CNP (1965, 2007) and BNP
(2007) in 3 vegetation types using Riney transects

51
Figure 2-7. Spatial and temporal comparison of rooted grass in CNP (1965, 2007) and BNP
(2007) in 3 vegetation types using Riney transects
Figure 2-8. Spatial and temporal comparison of aerial grass cover in CNP (1965, 2007) and BNP
(2007) in 3 vegetation types using Riney transects

52
Figure 2-9. Comparison of riparian strip tree species in CNP (1965, 2007).

53
Figure 2-10. Comparison of riparian strip tree species in Chobe (1965, 2007) and Bwabwata
National Park (2007).
Table 2-2. Woody species densities and percentages on Pookoo Flats. Pookoo Flats
Woody species density per ha-1
% of species present
Overall woody species Density per ha-1 152.1 100.0 Combretum mossambicense 59.8 39.3 Capparis tomentosa 51.4 33.8 Additional species recorded Total Species = 7
Grewia flavenscens, Croton megalobotrys, Lonchocarpus nelsii, Dichrostachys cinerea, Markhamia zanzibarica

54
Table 2-3. Comparison of woody species composition and densities in mixed wood/shrubland between Chobe and Bwabwata National Parks.
Mixed Wood/Shrubland CNP BNP Trees Shrubs Trees Shrubs Total
Density ha-1 39.7 1373.1 533.6 2157.5
Total Number of
Species
9 16 22 32
Terminalia sericea
Density ha-1 0 0 151.5 57.3 % 0 0 28.4 2.7
Combretum hereroensce
Density ha-1 0 Negligible 90.9 162.3 % 0 17.0
7.5
Baphia massaiensis
Density ha-1 0 66.2 13.2 615.8 % 0 4.8 2.5 28.5
Dichrostachys cinerea
Density ha-1 0 Negligible 44.8 343.7 % 0 8.4 15.9
Combretum mossambicense
Density ha-1 0 587.2 4.0 14.3 % 0 42.7 .7 .7
Lonchocarpus nelsii
Density ha-1 12.9 Negligible 40.8 47.7 % 32.5 7.7 2.2
Combretum elaeagnoides
Density ha-1 0 543.0 0 47.7 % 0 39.5 0 2.2

55
Table 2-4. Comparison of woody species composition and densities in Baikiaea woodland between Chobe and Bwabwata National Parks.
Baikiaea Woodland CNP BNP Trees Shrubs Trees Shrubs Total
Density ha-1 194.8 1,565.4 122.5 1326.5
Total Number of
Species
8 14 11 15
Baikiaea plurijuga
Density ha-1 55.9 14.7 65.2 53.8 % 28.7 .9 53.3 4.1
Markhamia zanzibarica
Density ha-1 59.1 143.6 22.2 34.3 % 30.3 9.2 18.1 2.6
Baphia massaiensis
Density ha-1 0 165.7 6.8 773.4 % 0 10.6 5.5 58.3
Grewia flavenscens
Density ha-1 0 3.7 0 63.6 % 0 .2 0 4.8
Combretum elaeagnoides
Density ha-1 0 644.6 0 0 % 0 41.2 0 0
Combretum mossambicense
Density ha-1 0 117.9 0 83.2
% 0 7.5 0 6.3
Figure 2-11. Relative animal densities on Pookoo Flats

56
Figure 2-12. Relative animal densities in mixed wood/shrubland
Figure 2-13. Relative animal densities in Baikiaea woodland
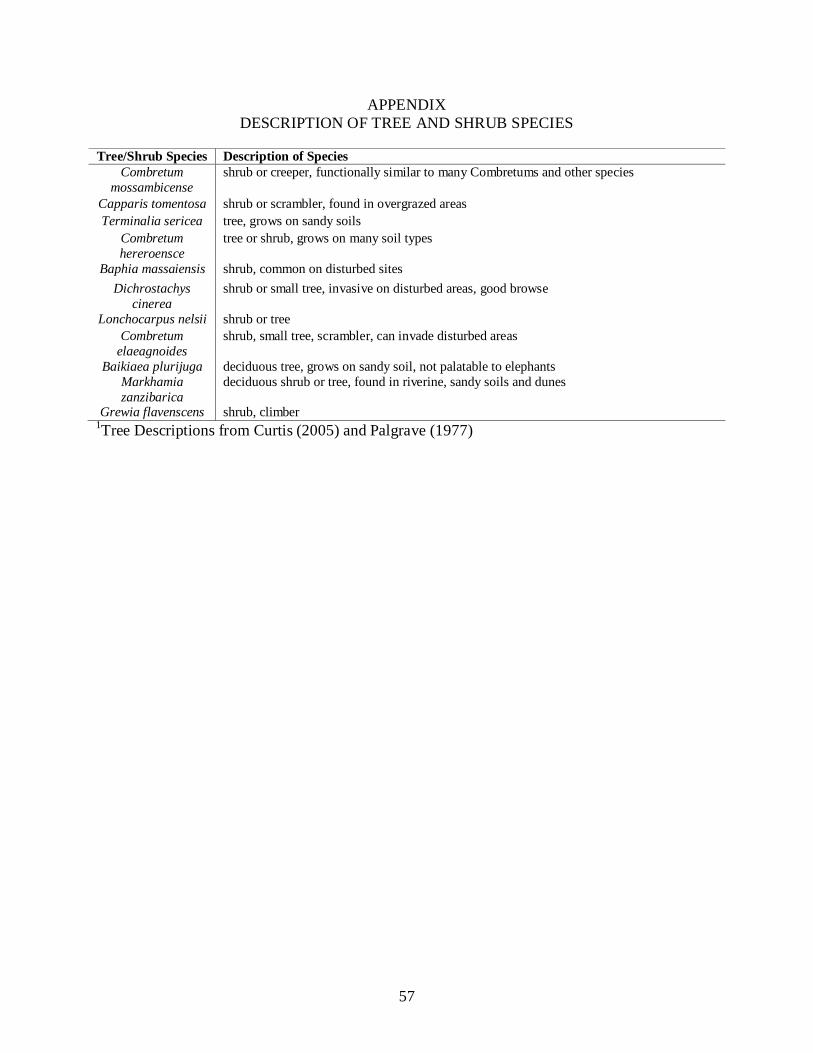
57
APPENDIX DESCRIPTION OF TREE AND SHRUB SPECIES
Tree/Shrub Species Description of Species Combretum
mossambicense shrub or creeper, functionally similar to many Combretums and other species
Capparis tomentosa shrub or scrambler, found in overgrazed areas Terminalia sericea tree, grows on sandy soils
Combretum hereroensce
tree or shrub, grows on many soil types
Baphia massaiensis shrub, common on disturbed sites Dichrostachys
cinerea shrub or small tree, invasive on disturbed areas, good browse
Lonchocarpus nelsii shrub or tree Combretum
elaeagnoides shrub, small tree, scrambler, can invade disturbed areas
Baikiaea plurijuga deciduous tree, grows on sandy soil, not palatable to elephants Markhamia zanzibarica
deciduous shrub or tree, found in riverine, sandy soils and dunes
Grewia flavenscens shrub, climber 1Tree Descriptions from Curtis (2005) and Palgrave (1977)

58
BIBLIOGRAPHY
Baillie, J.E.M., Hilton-Taylor, C. & Stuart, S. N. (2004) IUCN Red List of Threatened Species. A Global Species Assessment, IUCN. Barnes, J.I. (1996) Changes in the economic use value of elephant in Botswana: The effect of international trade prohibition. Ecol. Economics. 18, 215–230. Barrows, H. H. (1923) Geography as human ecology. Annals of the Association of the American Geographer. 13(1), 1-14. Belsky, J. A. (1990) Tree/grass ratios in East African savanna: a comparison of existing models. J. of Biogeography. 17, 483-489. Blanc, J.J., Barnes, R. F. W., Graig, G. C., Dublin, H. T., Thouless, C. R., Douglas-Hamilton, I. & Hart, J. A. (2007) African Elephant Status Report 2007: An Update from the African Elephant Database. IUCN Species Survival Commission. IUCN, Gland, Switzerland and Cambridge, UK. Campbell, A. C. (1990) History of elephants in Botswana. The Future of Botswana’s Elephants. Proceedings of a symposium organized by the Kalahari Conservation Society and Department of Wildlife and National Parks. Nov. 10, 1990. Gaborone, Botswana. Chafota, J. (1998) Effects of changes in elephant densities on the environment and other species-How much do we know? Cooperative Regional Wildlife Management in Southern Africa. Chapman, J. (1968) Travels in the Interior of South Africa 1849-1863; hunting and trading journeys from Natal to Walvis bay and visits to Lake Ngami and Victoria falls. (Edited from the original manuscripts by Tabler, E.C.1971). A. A.Balkema, Cape Town. 2 Vols: 258+244 pp. Child, G. & von Richter, W. (1968) Observations on ecology and behavior of lechwe, puku, and waterbuck along the Chobe River, Botswana. Z. Sangetierk. 34, 275-295. Child, G. (1968) Report to the Government of Botswana on an Ecological Survey of North-Eastern Botswana, FAO, #TA2563. Rome, Italy. Cumming, D. H. M., Fenton, M. B., Rautenbach, I. L., Taylor, R. D., Cumming, G. S., Cumming, M. S., Dunlop, J. M., Ford, A. G., Hovorka, M. D., Jonston , D. S., Kalcounis, M., Mahlangu, Z. & Portfors, C. V. R. (1997) Elephants, woodlands and biodiversity in southern Africa. S. Afr. J. of Science. 93, 231–236. Dublin H.T., Sinclair A. R. E., & McGlade J.(1990) Elephants and fire as causes of multiple stable states in the Serengeti-Mara woodlands. J. of Animal Eco. 49, 1147–64. Gaborone, Botswana. Henry, F.W.T. (1966) Enumeration report on the Chobe main forest block. Ministry of Agriculture, Gaborone, Botswana.

59
Holling, C. S. (1973) Resilience and stability of ecological systems. Annual Review of Ecology and Systematics. 4, 1-23. Hunter, M. D. & Price, P. W. (1992) Playing chutes and ladders: Heterogeneity and the relative roles of bottom-up and top-down forces in natural communities. Ecology. 73(3), 724-732. Jackson, T.P., Mosojane, S., Ferreira, S. & van Aarde, R. J. (2008) Solutions for elephant Loxodonta africana crop raiding in northern Botswana: moving away from symptomatic approaches. Oryx, 42, 83–91. Kelly, R. D. & Walker, B. H. (1976) The effects of different forms of land use on the ecology of a semi-arid region in south-eastern Rhodesia. J. of Eco. 64, 553-576. Langley, P. A. & Barnsley, M. J. (2004) The Potential of Geographical Information Systems and Earth Observation. In Unifying Geography: Common Heritage, Shared Future, ed. John A. Matthews and David T. Herbert, 83-93London and New York: Routledge. Lindsay, W. K. (1990) Elephant/Habitat Interactions. The Future of Botswana’s Elephants. Proceedings of a symposium organized by the Kalahari Conservation Society and Department of Wildlife and National Parks. Nov. 10, 1990. Gaborone, Botswana . Matthews, J. A. & David T. H. (2004) Unifying Geography: Common Heritage, Shared Future, ed. John A. Matthews and David T. Herbert, 83-93. London and New York: Routledge. Mendolsohn, J. & Roberts, C. (1997) An environmental profile and atlas of Caprivi. Directorate of Environmental Affairs, Namibia. Moroka, D. N. 1984. Elephants - Habitat Relationships in Northern Botswana. DWNP. Gaborone, Botswana. Mosugelo, D. K., Moe, S. R., Ringrose, S. & Christian, N. (2002) Vegetation changes during a 36-year period in northern Chobe National Park, Botswana. Afr. J. of Eco. 40, 232-240. Palgrave, K. C. (1977) Trees of Southern Africa. C. Struik Publishers. Cape Town, Johannesburg. Pringle, R. M., Young, T. P., Rubenstein, D. I. & McCauley, D. J. (2007) Herbivore-initiated interaction cascades and their modulation by productivity in an African savanna. Proceedings of the National Academy of Sciences of the United States of America. 104, 193-197. Rice, M. (1997) Community-based natural resource management project in the Caprivi Region of Namibia. Cape Town. August, 1997. Richards, K., Bithell, M., & Bravo, M. (2004) Space, Time and Science: Individuals, Emergence and Geographies of Space and Place. In Unifying Geography: Common Heritage, Shared Future, ed. John A. Matthews and David T. Herbert, 62-82. London and New York: Routledge.
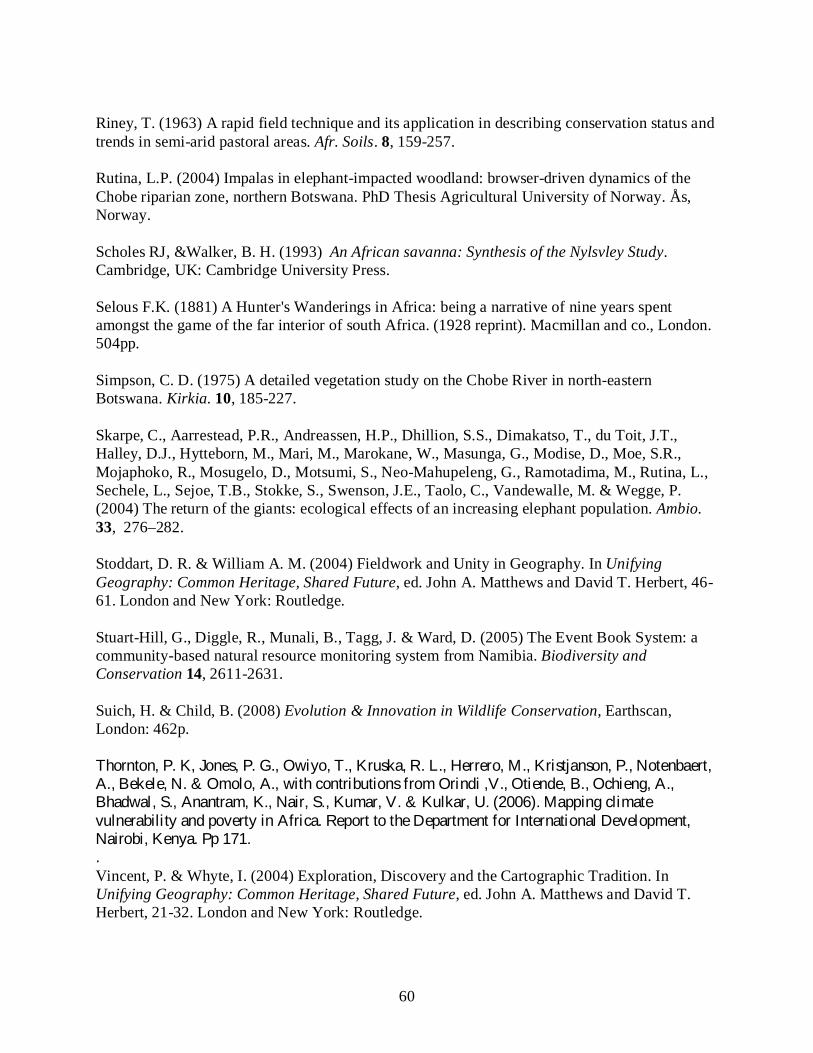
60
Riney, T. (1963) A rapid field technique and its application in describing conservation status and trends in semi-arid pastoral areas. Afr. Soils. 8, 159-257. Rutina, L.P. (2004) Impalas in elephant-impacted woodland: browser-driven dynamics of the Chobe riparian zone, northern Botswana. PhD Thesis Agricultural University of Norway. Ås, Norway. Scholes RJ, &Walker, B. H. (1993) An African savanna: Synthesis of the Nylsvley Study. Cambridge, UK: Cambridge University Press. Selous F.K. (1881) A Hunter's Wanderings in Africa: being a narrative of nine years spent amongst the game of the far interior of south Africa. (1928 reprint). Macmillan and co., London. 504pp. Simpson, C. D. (1975) A detailed vegetation study on the Chobe River in north-eastern Botswana. Kirkia. 10, 185-227. Skarpe, C., Aarrestead, P.R., Andreassen, H.P., Dhillion, S.S., Dimakatso, T., du Toit, J.T., Halley, D.J., Hytteborn, M., Mari, M., Marokane, W., Masunga, G., Modise, D., Moe, S.R., Mojaphoko, R., Mosugelo, D., Motsumi, S., Neo-Mahupeleng, G., Ramotadima, M., Rutina, L., Sechele, L., Sejoe, T.B., Stokke, S., Swenson, J.E., Taolo, C., Vandewalle, M. & Wegge, P. (2004) The return of the giants: ecological effects of an increasing elephant population. Ambio. 33, 276–282. Stoddart, D. R. & William A. M. (2004) Fieldwork and Unity in Geography. In Unifying Geography: Common Heritage, Shared Future, ed. John A. Matthews and David T. Herbert, 46-61. London and New York: Routledge. Stuart-Hill, G., Diggle, R., Munali, B., Tagg, J. & Ward, D. (2005) The Event Book System: a community-based natural resource monitoring system from Namibia. Biodiversity and Conservation 14, 2611-2631. Suich, H. & Child, B. (2008) Evolution & Innovation in Wildlife Conservation, Earthscan, London: 462p. Thornton, P. K, Jones, P. G., Owiyo, T., Kruska, R. L., Herrero, M., Kristjanson, P., Notenbaert, A., Bekele, N. & Omolo, A., with contributions from Orindi ,V., Otiende, B., Ochieng, A., Bhadwal, S., Anantram, K., Nair, S., Kumar, V. & Kulkar, U. (2006). Mapping climate vulnerabili ty and poverty in Africa. Report to the Department for International Development, Nairobi, Kenya. Pp 171. . Vincent, P. & Whyte, I. (2004) Exploration, Discovery and the Cartographic Tradition. In Unifying Geography: Common Heritage, Shared Future, ed. John A. Matthews and David T. Herbert, 21-32. London and New York: Routledge.
61
Walker, B. H. (1976) An approach to the monitoring of changes in the composition and utilization of woodland and savanna vegetation. S. Afr. J. of Wildlife Research. 6(1), 1-32. Walker, B. H., Holling, C. S., Carpenter, S. R. & Kinzig, A. S. (2004) Resilience, adaptability and transformability in social–ecological systems. Ecology and Society 9(2), 5. Walker, B. H., Ludwig, D. Holling, C. S. & Peterman, R. M. (1981) Stability of semiarid savanna grazing systems. The J. of Eco. 69, 473-498. Work, D., R. & Owen-Smith, N. (1986) Preliminary Management Recommendations for Elephant in Northern Botswana. Resource Ecology Group, Department of Botany. University of the Witwatersrand. May, 1986.
62
BIOGRAPHICAL SKETCH
The author was born in Rochester, Michigan. She received her undergraduate degree from
the University of Wisconsin-Madison in 1999. She then went on to be a Peace Corps volunteer
in Gabon, where she worked as an environmental educator. She was also a volunteer in Jamaica,
where she worked as a project coordinator for an environmental NGO.
Her interest in sustainable natural resource use and development in Africa and the
Caribbean then brought her to the University of Florida to pursue her master’s degree. She plans
to continue her education at the University of Florida to the doctorate level.