oakland preliminary resilience assessment
TRANSCRIPT

OA K L A N D
preliminaryresilienceassessmentFEBRUARY 2016

PRELIMINARY RESILIENCE ASSESSMENT - 2 - OAKL AND
About 100 Resilient Cities
Pioneered by the Rockefeller Foundation 100 Resilient Cities (100RC) is dedicated to helping cities around the world become more resilient to the physical, social and economic challenges that are a growing part of the 21st century. 100RC supports the adoption and incorpora-tion of a view of resilience that includes not just the shocks – earthquakes, fires, floods, etc. – but also the stresses that weaken the fabric of a city on a day to day or cyclical basis. By addressing both the shocks and the stresses, a city be-comes more able to respond to adverse events, and is overall better able to deliver basic functions in both good times and bad, to all populations.
The Fox Theater originally opened its doors in 1928 as an elaborate movie palace, and serves as a symbol of resilience. It shuttered in 1966 and remained closed for 40 years, surviving a fire and an earthquake, and escaping the wrecking ball before being restored to its former splendor,
reopening in 2009 as part of the renewal of the Uptown theater and arts district. Photo: Greg Linhares, City of Oakland

- 3 -
Table of Contents
1 / Overview · 4
2 / History of Resilience · 8
3 / Community Resilience Profile · 12
- Assets · 14
- Shocks · 21
- Stresses · 25
4 / Focus for Resilience · 34
5 / Community Resilience Snap Shots · 46
6 / Annex 1: Phase 1 Results · 54
Purpose of this report:
• Provide a summary of the state of resilience in Oakland today;
• Describe the work that has been done to date to understand Oakland’s key threats and opportunities to build resilience; and
• Identify emerging resilience themes and translate them into focus areas to guide the development of a Resilience Strategy for Oakland.
For Oakland, resilience is about creating a thriving and equitable city.

PRELIMINARY RESILIENCE ASSESSMENT - 4 - OAKL AND
1Overview
CITY RESILIENCE is the capacity of individuals, communities, institutions, businesses, and systems within a city to survive, adapt, and grow no matter what kinds of chronic stresses and acute shocks they experience. By develop-ing and implementing a Resilience Strategy, Oakland becomes more able to respond to adverse events and better able to deliver basic functions, especially to the poor and vulnerable.
“Shifting Topographies” public art installation at 19th Street BART Station Photo: Greg Linhares, City of Oakland

- 5 -
critical and meaningful benefits across sectors, ultimately building the resilience of the City. Most of all, resilience requires that City decision-making considers social, economic, environmental, and natural hazard risks, and when hard choices are made, prioritizes solutions that address multiple risks or provide multiple resilience benefits.
Development of a Resilience Strategy allows Oakland to (1) review and confirm the City’s existing level of resilience and (2) identify high-priority areas and initiatives for improving resilience and (3) strategically implement high impact projects in partnership with 100 Resilient Cities and other organizations and people committed to Oakland thriving. The Resilience Strategy is developed through a two-phase process. Phase 1 involves an initial assessment, culminating in the selection of high-priority focus areas where further work is needed, as documented in this report—the Preliminary Resilience Assessment. Phase 2 involves strategic planning to identify solutions to Oakland’s most critical resilience challenges. Additional analysis and diagnostic work will be conducted around each focus area, and resilience approaches and initiatives will be identified and documented in a Resilience Strategy, which will be released in 2016. As part of the 100 Resilient Cities Network, Oakland also has the opportunity to share lessons and best practices with other cities around the globe that are developing a Resilience Strategy of their own.
INTRODUCTION
Resilient cities are those in which individuals, communities, institutions, businesses, and city systems have the capacity to survive, adapt, and grow, no matter what kinds of chronic stresses and acute shocks are experienced.
Oakland was competitively selected to join 100 Resilient Cities, pioneered by the Rockefeller Foundation. 100 Resilient Cities is a global initiative in which 100 cities around the world will become more resilient to the physical, social, and economic challenges that are a growing part of the 21st century. Oakland (the City) and its neighboring cities of San Francisco and Berkeley—as well as those farther away like New Orleans, Boston, Rome, Durban, and Rio de Janeiro—are developing comprehensive strategies that seek to build not only the physical resilience of infrastructure and the environment, but also the social resilience that creates opportunities for all residents to thrive.
Resilience requires more than just disaster preparedness or even long-term planning. Resilience requires understanding the connections between stresses, such as the links between poverty and poor health, between educational disparities and high crime, and between aging infrastructure and unemployment. Resilience requires understanding how shocks, such as earthquakes and floods, impact vulnerable residents and City budgets. Resilience requires investigating how improving any of these factors has the potential to improve others. Understanding these connections is important to ensure that future interventions will have

PRELIMINARY RESILIENCE ASSESSMENT - 6 - OAKL AND
3. Living in safe and secure neighborhoods. Strengthening social stability, security, and justice are critical to reducing Oakland’s persistently high crime rates and the exposure of many residents to violence. Consequently, Resilient Oakland will iden-tify innovative approaches for reducing violent crime and building community trust and the legitimacy of law enforcement.
4. Benefiting from public infrastructure. The infra-structure residents rely on daily to work, live, and play can also be a resource for increasing Oakland’s resilience. Resilient Oakland will identify public infrastructure projects with significant impact on resilience and develop long-term strategies for how such projects should be coordinated, sequenced, and financed.
5. Recovering from adversity. Having the ability to quickly recover from major shocks and stresses is essential to keep Oakland residents in Oakland and to minimize displacement. Consequently, Resilient Oakland will identify what Oakland’s most vulnerable residents need to build their personal and commu-nity resilience.
To build resilience, Oakland will be exploring opportunities in five focus areas:
1. Prosperous residents and families. Personal resilience is often affected by financial resources and access to quality jobs and stable employment. Con-sequently, Resilient Oakland will focus on promoting the prosperity of residents and families through a more coordinated and comprehensive approach to increasing access to good jobs, building wealth, and fostering economic development.
2. Staying rooted in Oakland. Oakland’s ability to maintain and strengthen community resilience will likely be affected by the extent to which current residents have what they need to continue to call Oakland home, and new residents and businesses become part of the existing community fabric and culture. Consequently, Resilient Oakland will identify what long-term residents of Oakland (especially the most vulnerable) need to be able to stay, and what new residents need to integrate in a way that pre-serves and reinforces community character.
ResilienceInventory
FocusArea Analysis
StakeholderConsultation
ResilienceInitiative
Identification
VulnerabilityAssessment
Resilience Strategy
PreliminaryResilience
Assessment
Implementation
Phase I: Initial Assessment
Phase II: Strategic Planning

- 7 -
Provide reliable Ensures continuity
Provides & Enhances Fosters Economic E
nsures Socia
l Sta
bility
P
rom
otes
Coh
esiv
e &
comm
unication & mobility
of critical services natural & manmade assets prosperity
securit
y & justi
ce
en
gage
d co
mm
uniti
es
eec
tive
man
agem
ent
ra
nge of s
takeholders & integrated planning basic needs
livelihoods & employm
ent health services
Pro
mot
es le
ader
ship
&
E
mpowers
a broad F
osters long-term Meets
Supports
Ensures public
Infrastructure & Environment Economy & Society
Le
ader
ship & Stra
tegy Health & Wellbeing
Wat
er
Ener
gy
Foo
d
Labou
rSkills
&
Public Health
policy
training
Local business
development &
innovation
Hou
sing
Access to
healthcare
nanceAccess to
Medical
facilities &
Community
Local identityand culture
Social support
Participation
Continuity
following a
shock
CorruptionPolicing to
Law
Deterrantsto crime
Reductionand security
promote safety
enforcement
Business
continuity
City budgets
training
Local economy
linkagesEconom
ic
Inward
investment
Envi
ronm
enta
l
criti
cal
Safe
guar
ds fo
r
prov
isio
n of
Alte
rnat
ivepo
licy
infr
astr
uctu
re
serv
ices
of asse
ts
Conservatio
n
Emergency
response plans
Flood ri
sk
critical
Optimal u
se of
infrastr
ucture
man
agem
ent
Flood ri
sk
man
agem
ent
Ecos
yste
mm
anag
emen
t
transport linkRegional
Transportnetwork
infrastructureTransport
Communcation
technology
Emergency
information
Empowerment
Collaboration &
s
stakeholder
Multi-alignment
Capacity &coordination
making &
Decision
leadership
monitoring
Risk
Access to
education
awarenessRisk
Communcation
between govt.
& publicKnowledgetransfer
plansStrategies &
& m
onitoringAccess to data
Building codes
& standards
planningLanduse
ResilienceFramework
What builds resilience? Research has shown that resilient cities demonstrate seven qualities that allow them to withstand, respond to and adapt more readily to shocks and stresses.
Resilient cities are:
Reflective Using past experience to inform future decisions
Resourceful Recognizing alternative ways to use resources
Robust Well-conceived, constructed and managed systems
Redundant Spare capacity purposively created to accommodate disruption
Flexible Willingness and ability to adopt alternative strategies in response to changing circumstances
Inclusive Prioritize broad consultation to create a sense of shared ownership in decision making
Integrated bring together a range of distinct systems and institutions
PRELIMINARY RESILIENCE ASSESSMENT - 8 - OAKL AND
2History of Resilience
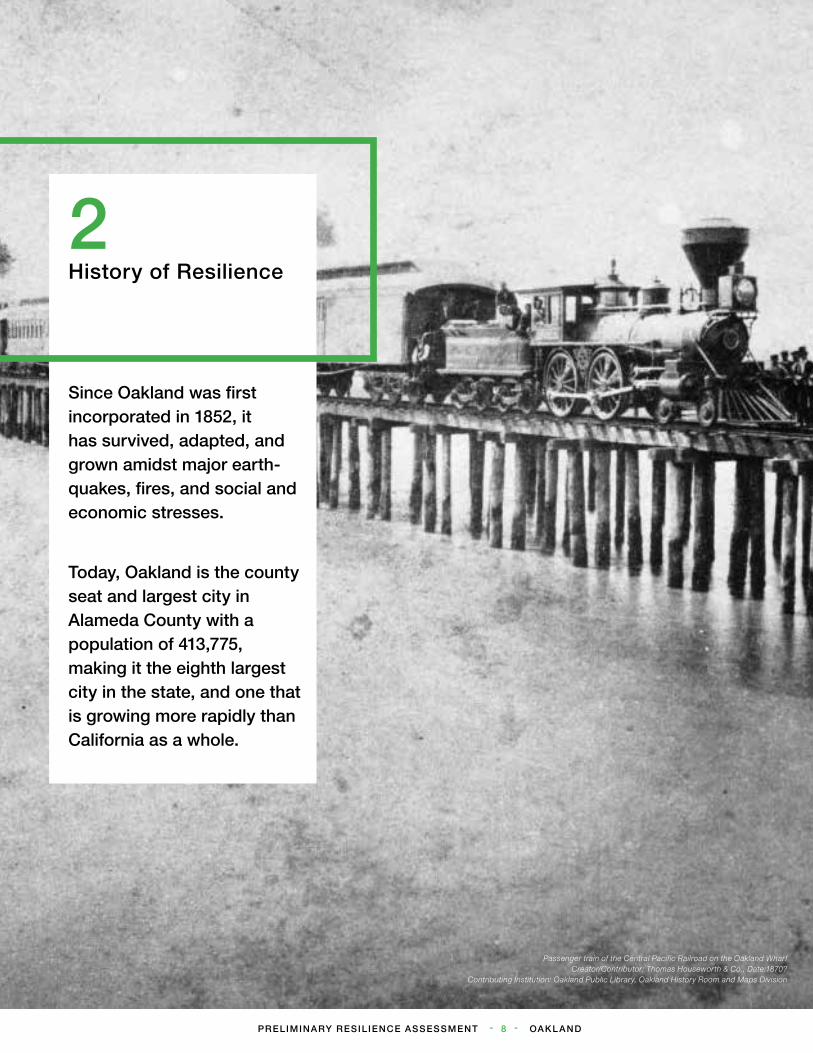
Since Oakland was first incorporated in 1852, it has survived, adapted, and grown amidst major earth-quakes, fires, and social and economic stresses.
Today, Oakland is the county seat and largest city in Alameda County with a population of 413,775, making it the eighth largest city in the state, and one that is growing more rapidly than California as a whole.
Passenger train of the Central Pacific Railroad on the Oakland Wharf Creator/Contributor: Thomas Houseworth & Co., Date:1870?
Contributing Institution: Oakland Public Library, Oakland History Room and Maps Division
- 9 -
source of economic vitality. The Port of Oakland is the fifth busiest container port in the United States, and the San Francisco Bay is among the three principal Pacific Coast gateways for U.S. containerized cargoes.
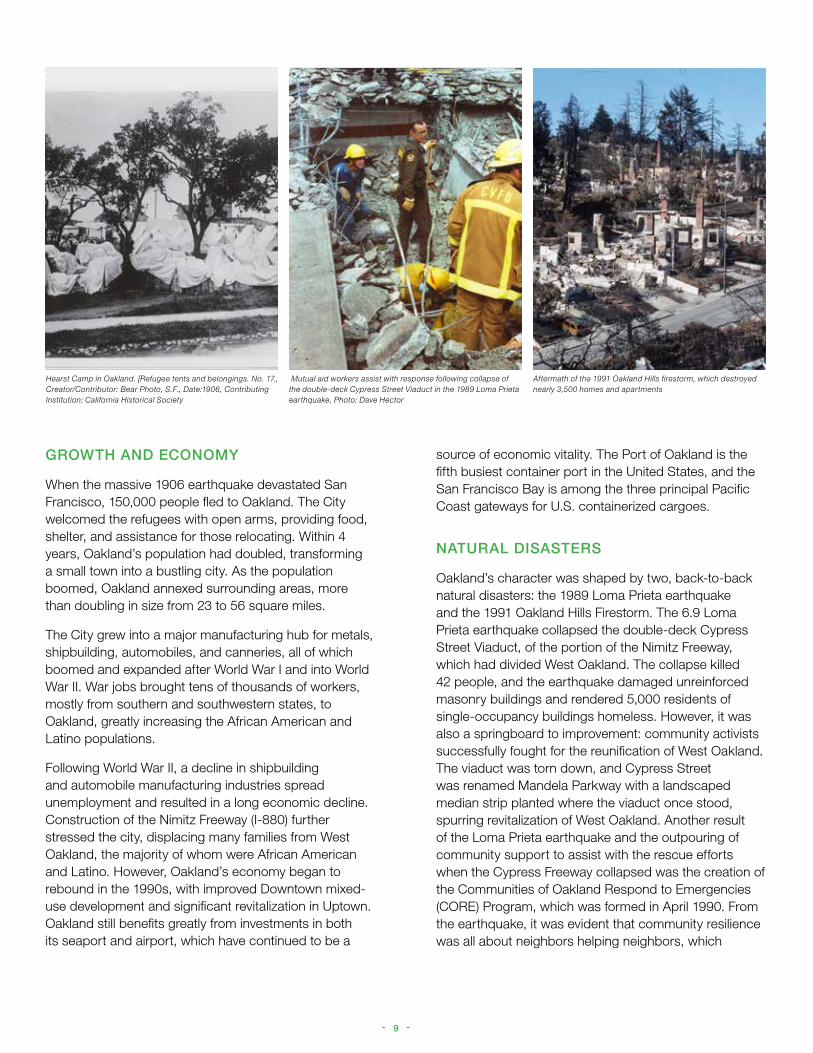
NATURAL DISASTERS
Oakland’s character was shaped by two, back-to-back natural disasters: the 1989 Loma Prieta earthquake and the 1991 Oakland Hills Firestorm. The 6.9 Loma Prieta earthquake collapsed the double-deck Cypress Street Viaduct, of the portion of the Nimitz Freeway, which had divided West Oakland. The collapse killed 42 people, and the earthquake damaged unreinforced masonry buildings and rendered 5,000 residents of single-occupancy buildings homeless. However, it was also a springboard to improvement: community activists successfully fought for the reunification of West Oakland. The viaduct was torn down, and Cypress Street was renamed Mandela Parkway with a landscaped median strip planted where the viaduct once stood, spurring revitalization of West Oakland. Another result of the Loma Prieta earthquake and the outpouring of community support to assist with the rescue efforts when the Cypress Freeway collapsed was the creation of the Communities of Oakland Respond to Emergencies (CORE) Program, which was formed in April 1990. From the earthquake, it was evident that community resilience was all about neighbors helping neighbors, which
GROWTH AND ECONOMY
When the massive 1906 earthquake devastated San Francisco, 150,000 people fled to Oakland. The City welcomed the refugees with open arms, providing food, shelter, and assistance for those relocating. Within 4 years, Oakland’s population had doubled, transforming a small town into a bustling city. As the population boomed, Oakland annexed surrounding areas, more than doubling in size from 23 to 56 square miles.
The City grew into a major manufacturing hub for metals, shipbuilding, automobiles, and canneries, all of which boomed and expanded after World War I and into World War II. War jobs brought tens of thousands of workers, mostly from southern and southwestern states, to Oakland, greatly increasing the African American and Latino populations.
Following World War II, a decline in shipbuilding and automobile manufacturing industries spread unemployment and resulted in a long economic decline. Construction of the Nimitz Freeway (I-880) further stressed the city, displacing many families from West Oakland, the majority of whom were African American and Latino. However, Oakland’s economy began to rebound in the 1990s, with improved Downtown mixed-use development and significant revitalization in Uptown. Oakland still benefits greatly from investments in both its seaport and airport, which have continued to be a
Hearst Camp in Oakland. [Refugee tents and belongings. No. 17., Creator/Contributor: Bear Photo, S.F., Date:1906, Contributing Institution: California Historical Society
Mutual aid workers assist with response following collapse of the double-deck Cypress Street Viaduct in the 1989 Loma Prieta earthquake, Photo: Dave Hector
Aftermath of the 1991 Oakland Hills firestorm, which destroyed nearly 3,500 homes and apartments

PRELIMINARY RESILIENCE ASSESSMENT - 10 - OAKL AND
years, the City has conducted an annual CORE Citywide Disaster Exercise to provide the opportunity for neighborhoods to practice the skills learned in the program.
HISTORY OF ACTIVISM
Championing the needs of the most vulnerable people is a hallmark characteristic of the Oakland community. The revolutionary socialist Black Panthers started in Oakland, and many Chicano and Asian rights movements drew followers and momentum from the City’s residents. This history of activism is evident in everyday life through the many demonstrations in front of City Hall on issues such as living wage and renters’ rights and major demonstrations against police brutality and racial profiling. This commitment to social justice and progressive views is also exemplified by the huge network of nongovernmental organizations (NGOs) that call Oakland their home. The goals of these organizations are varied, but most are committed to improving the communities in and around Oakland by empowering vulnerable citizens and directing attention (and resources) toward issues of social justice and environmental sustainability.
became the premise of the program. The program was again strengthened following the 1991 Oakland Hills Firestorm.
The 1991 Oakland Hills firestorm destroyed 2.5 square miles of mostly residential neighborhoods. Spread by gusting winds through heavily vegetated valleys, the fire destroyed 3,469 homes and apartment units, killed 25 people, and injured 150. In total, the firestorm cost $3.9 billion in present-day dollars. The economic losses combined with the injuries and loss of life made the Oakland Hills Firestorm the worst urban firestorm in State history.
The firestorm highlighted the dangers posed by wildland-urban interface fires in major cities, spurred research into improved prevention and firefighting techniques, and validated Oakland’s efforts to engage the community in responding to disasters. Oakland firefighters now carry more extensive wildland firefighting gear and fire shelters. Fire hydrants now have the industry-standard outlets throughout the city, and water cisterns and a new Oakland Hills fire station were added. Radio communications were also improved.
In 2015, CORE celebrated its 25th anniversary, when more than 2,000 people participated in free training and public education programs for individuals, neighborhood groups, and community-based organizations. The CORE program teaches self-reliance skills and helps neighborhoods establish response teams to take care of their neighborhood until professional first responders arrive. There are more than 150 CORE-organized neighborhoods throughout the City, and for the last 10
Oakland freeway underpass mural of Martin Luther King, Jr., Photo: Greg Linhares, City of Oakland

- 11 -
High-Level Vulnerability Identification
A Citywide Asset Scan included an infrastructure inventory and condition assessment and a Geographic Information System (GIS)-based exposure analysis. Exposure to an array of shocks was evaluated, including seismic, flood, and wildfire hazards. A Shocks and Stresses Analysis used the results of the Citywide Asset Scan to elucidate the complex relationships between assets, shocks, and stresses. The potential impacts of sudden shocks on long-term stresses such as poverty and violence were examined. These analyses included desktop research, in-person interviews with subject matter experts, and scenario planning workshops, guided by the 100 Resilient Cities Asset and Risk Analysis Tool.
Focus Area Selection
The Resilience Baseline identified 11 resilience challenges. Input on focus area selection was provided by the City’s Resilience Working Group, the Resilience Steering Committee, an international panel of Chief Resilience Officers, and the City’s Leadership Team.
METHODS
Oakland’s resiliency strategy began with four primary exercises designed to answer four key questions. These questions help illustrate the City’s baseline resiliency strengths and prioritize resilience needs.
Inventory of Existing Citywide Resilience Activities
Resilience-building activities within the City were inventoried. These activities included both City government actions, plans and projects, and external, public, private, and nonprofit activities. A desktop based approach was combined with stakeholder consultation and surveys and input from subject matter experts. This inventory is not intended to be comprehensive, as such activities continue to evolve throughout the City. Rather, this inventory builds a picture of the breadth and scope of those organizations contributing to Oakland’s resiliency and the good work they undertake.
Stakeholder Consultation
Well over 2,000 Oakland residents were consulted in the preparation of this Preliminary Resilience Assessment. Stakeholder input was garnered across the city using workshops, online surveys, and in-person neighborhood surveys to identify residents’ top resiliency concerns, perceptions, and actions. A Steering Committee, composed of leaders in diverse resiliency fields, was established and continues to provide invaluable insight and input into Oakland’s resiliency process.
Resilient Oakland Initiative launch, March 25, 2015

PRELIMINARY RESILIENCE ASSESSMENT - 12 - OAKL AND
3Community Resilience Profile
Oakland is one of the most ethnically diverse major cit-ies in the nation, with major representation from Hispanic and Latino, Asian, African-American and Caucasian residents speaking over 125 languages and dialects, as well as one of the country’s largest LGBT communities.
Oakland is nationally recog-nized as one of the nation’s greenest cities, with WalletHub calling Oakland the ninth-greenest city in America1. Efforts in energy efficiency and environmental aware-ness have resulted in Oakland becoming a leading city in the development of an environ-mentally and economically sustainable planning.
- 13 -
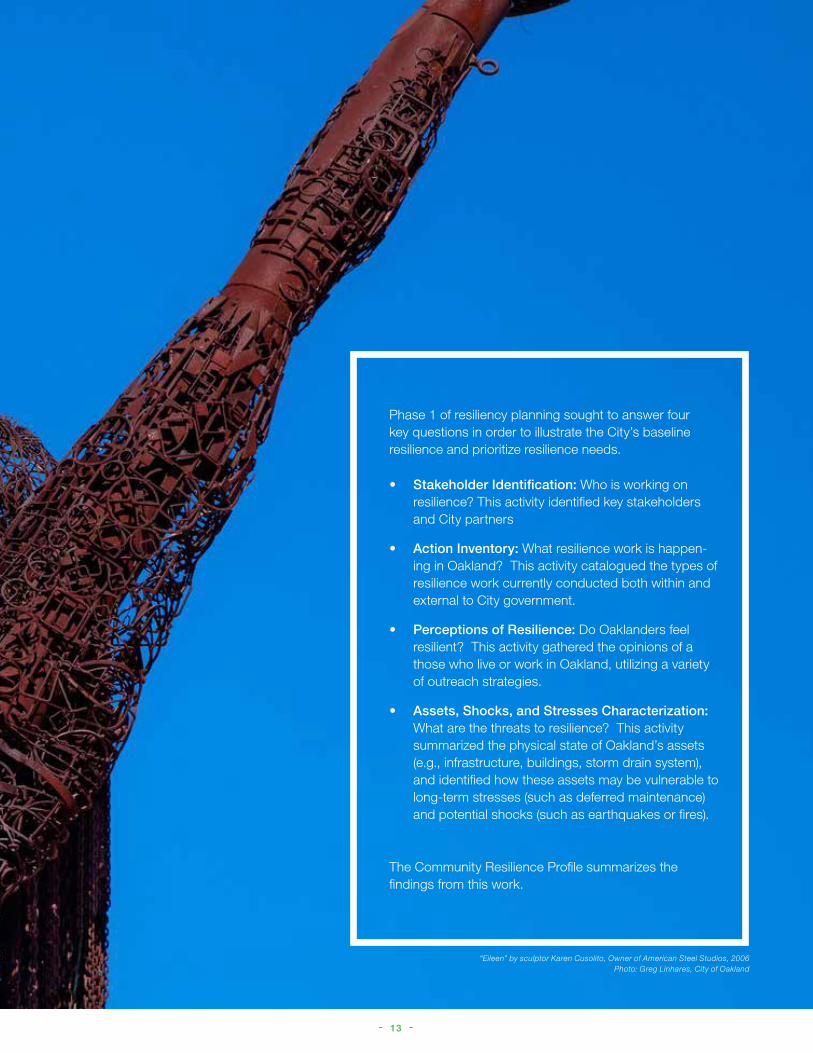
Phase 1 of resiliency planning sought to answer four key questions in order to illustrate the City’s baseline resilience and prioritize resilience needs.
• Stakeholder Identification: Who is working on resilience? This activity identified key stakeholders and City partners
• Action Inventory: What resilience work is happen-ing in Oakland? This activity catalogued the types of resilience work currently conducted both within and external to City government.
• Perceptions of Resilience: Do Oaklanders feel resilient? This activity gathered the opinions of a those who live or work in Oakland, utilizing a variety of outreach strategies.
• Assets, Shocks, and Stresses Characterization: What are the threats to resilience? This activity summarized the physical state of Oakland’s assets (e.g., infrastructure, buildings, storm drain system), and identified how these assets may be vulnerable to long-term stresses (such as deferred maintenance) and potential shocks (such as earthquakes or fires).
The Community Resilience Profile summarizes the findings from this work.
“Eileen” by sculptor Karen Cusolito, Owner of American Steel Studios, 2006 Photo: Greg Linhares, City of Oakland

PRELIMINARY RESILIENCE ASSESSMENT - 14 - OAKL AND
Oakland’s Assets People Environment Infrastructure Economy
Oakland’s People
Oakland has become known as a city of soul, where more than 100 languages are spoken, people are proud to be natives, and residents stand up for what they believe in. A steady influx of immigrants during the 20th century, along with the thousands of African American war-industry workers who relocated from the Deep South during the 1940s, have made Oakland one of the most ethnically diverse major cities in the country. Today, 27 percent of its population is foreign-born and 40 percent speak a language other than English at home. According to the 2010 census2, Oakland comprises 27 percent Black or African American, 26 percent White (not Hispanic/Latino), 25 percent Hispanic or Latino, 17 percent Asian/Pacific Islander, and 6 percent other.
Oakland’s diversity is a source of pride and identity for many of its residents, who enjoy being exposed to a variety of different cultures through music, food, dance and art. The composition of Oakland does continue changing. From 2000 to 2010, demographic changes included a 16.7 percent drop in its children and youth population, a decline of 24 percent in its African American population, a 6.2 percent increase in senior households, a 13 percent increase in the Latino population, and a 7.8 percent increase in both the White and Asian populations. Oakland’s diversity is also a source of economic vitality for many small business owners. Oakland has many cultural festivals celebrating this diversity, including Art + Soul, the Black Cowboys
Situated in the rapidly growing San Francisco Bay Area, Oakland is the county seat and largest city in Alameda County with a population of 413,775, making it the eighth largest city in California. Oakland represents 12% of the population of the San Francisco--Oakland Urban Area. Oakland is growing more rapidly than California as a whole; between 2010 and 2014, Oakland’s population grew 5.9%, while the state’s population grew 4.2%. Oakland is framed by 19 miles of San Francisco Bay coastline to the west and rolling hills to the east. It has a large footprint of 56 square miles. In between are more than 75 vibrant neighborhoods and commercial corridors, more than 100 parks totaling over 2,500 acres, and Lake Merritt, the largest saltwater lake within a U.S. city. While Oakland is blessed with significant open space, coastline and large industrial areas, it is also quite densely populated, with 7,004 people per square mile.
The City of Oakland is also one of the most ethnically diverse major cities in the nation, with major representation from Hispanic and Latino, Asian, African-American and Caucasian residents speaking over 125 languages and dialects, as well as one of the country’s largest LGBT communities.
Oakland is nationally recognized as one of the nation’s greenest cities, with WalletHub calling Oakland the ninth-greenest city in America. Efforts in energy efficiency and environmental awareness have resulted in Oakland becoming a leading city in the development of an environmentally and economically sustainable planning.
Oakland skyline looking west from hills towards San Francisco, Photo: Greg Linhares, City of Oakland

- 15 -
Oakland’s Environment
Oakland’s mild climate and geography allow residents and visitors to enjoy being outdoors year-round. They can explore a variety of parks; open space; creeks; wooded hills; and the shorelines of two lakes, the Oakland estuary, and San Francisco Bay. These diverse ecosystems—from the marshy estuary to the redwood forests—are home to a wide assortment of flora and fauna.
Oakland maintains 134 parks and public spaces. Many other parks and natural preserves along the ridgeline of the Oakland Hills are maintained by the East Bay Regional Parks District. Oakland has one of the highest percentages of parks and open space per capita in the nation. This waterfront city is haslush green hills, forests, creeks, an estuary, and two lakes.
In the center of the City is Lake Merritt and Lakeside Park. Lake Merritt, a saline lake connected through channels to San Francisco Bay, is the United States’ first official wildlife refuge, designated in 1870. Measure DD (passed in 2002) began the process of planning, funding, and implementing a variety of improvements for the lake, including water quality improvements, environmental restoration, landscaping, and the creation of new public gathering places. Lake Merritt is an important urban ecosystem of waterfowl, fish, invertebrates, and other forms of plant and microbiotic life; an essential part of Oakland’s flood control system; and a beloved recreational area.
Parade, Día de los Muertos, Chinatown Streetfest, Oakland Pride Festival, Festival of Greece, Eat Real Festival, and Lunar New Year. This local pride manifests itself in a strong network of thriving local businesses that support each other and enjoy widespread public support from Oakland citizens. The “Shop Oakland Grown” movement allows neighbors to support a thriving local economy while contributing to Oakland’s unique cultural landscape.
Although there is a strong sense of shared identity among residents of Oakland, individual well-established neighborhoods also have strong identities. Adams Point, Chinatown, Fruitvale, Jack London, Temescal, Montclair, San Antonio, West Oakland, and more—all of these neighborhoods have distinct demographics, cultures, architecturally significant buildings, land uses and economies, and community organizations dedicated to representing the interests of their residents.
Oakland’s communities are a multifaceted and powerful resource within the City. The organizational networks of community organizations and NGOs, representation of diverse stakeholder interests, a tendency toward collaboration, and a proclivity toward progressive, empowering politics are all valuable characteristics that help the city ensure that all the needs and concerns of the diverse citizens that make up Oakland’s social fabric are addressed in the process of planning for resilience.
“Off the Grid,” Friday Nights at the Oakland Museum of California Photo: Greg Linhares, City of Oakland
West Oakland Library Medicine Warrior Dance Troupe, 11/2015 Photo: Doug Oakley, volunteer
Unicyclist enjoys green space in the Oakland Hills

PRELIMINARY RESILIENCE ASSESSMENT - 16 - OAKL AND
and 20 miles of waterfront. Together with its business partners, the Port supports more than 73,000 jobs in the region and nearly 827,000 jobs across the United States. The Oakland International Airport is the fourth-largest airport in California and second-largest airport in the San Francisco Bay Area. The airport currently offers air service to 49 destinations on 13 different airline brands. The airport’s volume of air cargo ranks among the top three on the West Coast, annually moving more than 510,000 metric tons of cargo, freight, and mail.
Public Transportation
Pleasant temperatures encourage walking and biking, with Walk Score3 ranking Oakland the ninth-most-walkable U.S. city, and Better Doctor4 naming Oakland the fourth-most bike-friendly U.S. city. For local travel, the city is well served by an array of transit options. Oakland is the hub for the Bay Area Rapid Transit District (BART), the high-speed, regional rail system with 104-miles of track, including the 3.6-mile Transbay tube. With eight stations in Oakland, it is easy to jump on a train to downtown Oakland and other Bay Area cities. A trip from City Center in Oakland to downtown San Francisco takes 11 minutes. Operated by BART, the $484 million Oakland Airport Connector, which opened in 2014, took more than 1 million riders from the Coliseum BART station to Oakland International Airport in its first year of operation. Oakland is also comprehensively served by the AC Transit bus system, which connects Oakland to communities in Alameda and
Residents and workers from the nearby high-rise office buildings enjoy the pedestrian and bike paths around the lake. This foot traffic supports a variety of small, local businesses in the neighborhoods encircling Lake Merritt.
Oakland’s Infrastructure
The built infrastructure of the city consists of traditional structures, systems, and utilities interconnected to serve residents and businesses as well as to provide regional linkages to adjacent communities. These linkages include transportation, energy, water, and communications systems and the homes and businesses that rely on them.
Oakland’s Transportation
Oakland’s transportation network is one of the most varied and comprehensive in the country. Oakland’s central location within the San Francisco Bay Area means many of the region’s transportation arteries—from interstates to rail lines—flow through Oakland.
Port of Oakland’s Sea and Airport
and handles 99 percent of all containerized cargo that passes under the Golden Gate Bridge. The seaport is connected to a network of freight lines that offers the ability to move goods quickly to any market in the continental United States. The Port of Oakland oversees the Oakland seaport, Oakland International Airport,
Port of Oakland Loading Cranes at Sunset, Photo: Greg Linhares, City of Oakland

- 17 -
Contra Costa Counties. The Oakland/Alameda Ferry provides year-round service between Oakland’s Jack London Square to San Francisco’s Ferry Building and Pier 41.
Rail
For those traveling farther, Amtrak serves Oakland with multiple departures daily on three routes that link to the Pacific Northwest, Southern California, and the Central Valley at stations in Jack London Square and the Coliseum.
Oakland is also at the intersection of a large network of roadways; nine major interstate and California highways pass through Oakland.
Water and Energy
Oakland’s water and energy infrastructure are primarily operated and maintained by regional stakeholders. The East Bay Municipal Utility District (EBMUD) provides high-quality drinking water for 1.3 million customers in Alameda and Contra Costa Counties and is a partner with the City on its sewage management system. EBMUD’s award-winning wastewater treatment protects San Francisco Bay and serves 650,000 customers.
The Pacific Gas and Electric Company (PG&E) provides natural gas and electricity to nearly 16 million people in Northern and Central California. Oakland is connected by a communications system consisting of telephone, satellite, and internet networks.
Oakland’s City Property
Oakland maintains more than 300 public buildings and critical infrastructure, including more than 2,000 lane miles of streets, 38 bridges, and more than 400 miles of storm drains. Oakland’s City Hall is a historic treasure that opened in 1914 as the first high-rise government building in the nation. The building underwent seismic renovations, including installation of base isolators, following the 1989 Loma Prieta earthquake to improve the safety of the building and its occupants during future earthquakes.
Oakland’s Residential Property
Oakland has more than 170,0005 housing units, of which 41 percent are single-family homes and 19 percent are large, multifamily units in buildings of five or more units. Of Oakland households, 59 percent are renters. Oakland had a net gain of 13,113 housing units between 2000 and 2013, with most of the increase through the construction of multifamily housing. Nonetheless, nearly 12 percent of the City’s households lived in overcrowded conditions in 2010. Of those, one-third of overcrowded households are in owner-occupied units, while two-thirds are renter-occupied.
Homeownership rates are closely related to incomes. In 2011, White households had the highest median income and the highest ownership rates. However, even though Hispanic households had the second-highest median
Pergola and Necklace of Lights at Lake Merritt, Photo: Greg Linhares, City of Oakland

PRELIMINARY RESILIENCE ASSESSMENT - 18 - OAKL AND
income, their homeownership rates lagged behind those of Black/African American and Asian/Pacific Islander households.
Historically, Oakland’s residential housing stock has been less expensive than that of neighboring cities such as San Francisco and Berkeley. The housing stock ranges from elegantly restored Victorian single-family homes, bungalows, and cottages to downtown loft living, lakeside condos, and upscale hillside estates, with 42% built before World War II during times of significant population influxes (e.g., refugees following the 1906 earthquake and families attracted by war-industry jobs in the early 1940s). Consequently, a substantial portion of Oakland’s housing stock needs significant investment or it will deteriorate.
Oakland’s Commercial Property
Just as Oakland’s residential property values have increased, so too have the City’s commercial property values. In the last 3 years, Cushman & Wakefield6 notes that 22 major properties totaling 3 million square feet have been sold. Recent notable transactions include Uber’s purchase of Uptown Station for $123.5 million, the University of California’s $215.1 million purchase of 1111 Broadway, and UBS AG’s purchase of 1221 Broadway for $182 million. These prices represent between a 35.5 percent and a 394 percent increase in value over the sellers’ purchase prices. Oakland’s Central Business District and Jack London Square contain nearly 19
million square feet of office space, including 8.7 million square feet of Class A space. Also, more than 2 million square feet of office space can be found in the Hegenberger/Airport subarea.
In the retail subsector, Oakland is seeing a surge in investment. At Foothill Square, 200,000 square feet of space is nearly 100 percent leased after a major renovation/expansion of the center. The former Rockridge Shopping Center is being transformed into a 300,000-square-foot outdoor shopping and dining center with completion expected in late 2017. Infill projects are bringing much needed neighborhood-serving retail to underserved areas of Oakland.
Oakland’s healthcare sector has also seen massive investment in commercial buildings as the city’s four main hospitals have completed or are undergoing $2 billion in new construction or seismic upgrades.
Although many of Oakland’s industrial buildings are decades old, new investment has occurred over the last few years. The new 375,000-square-foot Goodman Logistics Center on Pardee Drive provides convenient access to freeways, the Oakland International Airport, and the Port of Oakland. The Oakland Global Trade & Logistics Center will transform the former Oakland Army Base into a 1.5 million-square-foot logistics center at the foot of the Bay Bridge and adjacent to the Port of Oakland.
Oakland Chinatown Crosswalk, Photo: Greg Linhares, City of Oakland

- 19 -
Finally, the Oakland–Alameda County Coliseum, jointly owned by the City of Oakland and Alameda County, is home to the World Champion Golden State Warriors, the National Football League’s Oakland Raiders, and Major League Baseball’s Oakland Athletics. The 120-acre sports and entertainment complex, adjacent to the I-880 and BART’s Coliseum/Airport station, includes the 19,000-seat Oracle Arena and O.com Coliseum with seating for up to 63,000 patrons, plus two clubs and 147 luxury suites. These facilities are served by an approximately 10,000-space parking lot.
Oakland’s Economy
Oakland’s economy is booming, with businesses discovering the convenience and ease of doing business there. More than two dozen companies have relocated—or are planning to relocate—to Oakland from neighboring cities to take advantage of lower rents, easier commutes for their workforce, and Downtown’s hip, transit-rich urban setting. Neighborhoods such as Temescal, Lake Merritt, Jack London, and Uptown have all seen a rise in foot traffic, with more residents engaging with (and spending their money in) local shops, restaurants, and clubs in their communities.
Oakland has become widely recognized for its high quality of life, vibrant dining and entertainment scenes, and diversified economy. The City has garnered international attention as a travel destination, with Lonely Planet7 ranking Oakland as the eighth-best U.S. travel
destination in 2015, Jetsetter8 ranking Oakland as the tenth-best new food city in the world in 2015, and the New York Times9 ranking Oakland as no. 5 on its list of top places to visit in the world in 2012.
As the national economy has shifted toward service industries, Oakland has been able to adapt by investing in urban redevelopment, along with expansions to its port and airport, in an effort to attract new businesses. The city is successfully attracting business in industries like manufacturing, green tech, trade, health care, construction, finance, business services, education, and leisure.
This economic diversity has helped Oakland remain an attractive and affordable home for people with a wide range of skills and potential for employment. WalletHub10 ranked Oakland as the third-best California city in which to start a career, and Popular Mechanics11 ranks Oakland the third-best start-up city in America and in the top 10 cities in the U.S. with the most tech-sector investments. The National Venture Capital Association12 noted the amount of tech investment has propelled Oakland to the ninth spot among U.S. cities. In November 2014, a voter-initiated ballot measure to raise Oakland’s minimum wage passed with an 82 percent majority, demonstrating the strong desire of residents to ensure that all workers in Oakland have the ability to support and care for themselves and their families by increasing the minimum wage and making provisions for paid sick leave.
Fruitvale Transit Village, Photo: Unity Council
Oakland Supply Company, Jack London Square Photo: Greg Linhares, City of Oakland

PRELIMINARY RESILIENCE ASSESSMENT - 20 - OAKL AND
Shocks and StressesShocks • Earthquakes & Liquefaction
• Wildfires • Coastal and urban floods
• External economic crises
• Civil unrest • • • • • • • • •
Stresses • Socioeconomic Disparities:
• Wealth disparities • Education disparities • Disparities in access to good jobs
• Health disparities • High crime rate • Insufficient affordable housing
• Chronic homelessness • Trust in government • Limited City resources • Aging infrastructure • Droughts • Sea level rise
These positive trends have meant that since 2010, when the Great Recession battered the U.S. economy, Oakland’s unemployment rate has dropped from 17 percent to 5.6 percent as of October 2015. In that same time frame, nearly 29,000 jobs have been added.13
Many of the threats to Oakland are well known. Earthquakes and wildfires have damaged the City so severely that impacts have made international news. The effects of such shocks are exacerbated by long-term social stresses, such as violent crime and financial and educational disparities. Now, climate change threatens the City, with impacts that are felt as both discrete shocks (coastal floods and increased wildfire risks) and continual or periodic stresses (rising seas and droughts). As the climate warms, droughts, extreme heat days, and large rainstorms are expected to occur more frequently and with greater intensity. Oakland’s poorer residents, the elderly, and children may be disproportionately vulnerable to these increasing threats.
When the Cypress Freeway opened in 1957, no one could have envisioned its collapse 42 years later Historic Aerial view of Cypress Freeway June 11, 1957
Photo: Carl Bigelow, Oakland Tribune

- 21 -
RESILIENCE ACTIONS
Citizens of Oakland Respond to Emergencies (CORE)
CORE is a free training program for individuals, neighborhood groups, and community-based organi-zations in Oakland. CORE teaches self-reliance skills and helps neighborhoods establish response teams to take care of the neighborhood until professional emergency personnel arrive.
Seismic Safety
The City of Oakland is developing a seismic retrofit program to make 1,400 wood-framed “soft- story” apartment buildings safer and reduce displacement for residents after an earthquake.
SHOCKS
Acute shocks are sudden, sharp events that threaten the well-being of the City. A variety of shocks are expected to occur within Oakland over time. The frequency and intensity of a particular shock can trigger additional shocks (such as a powerful earthquake triggering major infrastructure failures and wildfires), and the scale of the impacts will vary widely for an event depending on a variety of factors and conditions. The following are considered high-likelihood shocks in Oakland.
Earthquakes & Liquefaction
In Northern California, seven major fault systems are considered capable of rupturing in earthquakes of magnitude 6.7 or larger.14 Many of these earthquakes would produce strong ground shaking and damage in Oakland. The Hayward Fault, located at the base of the hills on the eastern edge of the City, has a 31 percent chance of producing such an earthquake within the next 30 years. An earthquake of this magnitude would cause significant damage in Oakland; shaking from the Hayward fault could be 3 to 10 times stronger than the shaking experienced in the 1989 Loma Prieta earthquake. Soft-story apartment buildings are particularly at risk; there are more than 17,000 apartment units in soft-story buildings in Oakland. Earthquakes also cause liquefaction, a phenomenon in which soil loses its strength, stiffness, and ability to support buildings. The United States Geological Survey has mapped the likelihood of liquefaction of soils in Oakland in the event of a major earthquake along the Hayward Fault.15 The flat-land areas of Oakland are at the highest risk, and these areas overlap with the locations of much of the critical transportation infrastructure and emergency operations facilities for the City. These areas are also home to many low-income and vulnerable residents.

PRELIMINARY RESILIENCE ASSESSMENT - 22 - OAKL AND
Coastal (Bay) and Urban Floods
The intensity and frequency of precipitation events are expected to increase.16 The combination of higher tides and larger storms with Oakland’s aging stormwater drainage systems may lead to significant increases in both coastal and urban flooding and flood damage. In December 2014, a combination of coastal and urban flooding closed roads, businesses, and schools throughout the City, impacting public safety, education, and Oakland’s economy.
The densely populated Oakland Hills are subject to both significant floods and wildfires, both of which increase the risk of landslides as a secondary shock. Although Oakland has not yet suffered from significant landslides, they are frequent in similar geographies in Southern California and have the potential to cause loss of life and extreme property loss.
RESILIENCE ACTIONS
Migrating flood risk through green infrastructure
Many opportunity sites exist in Oakland for green infrastructure like bioretention areas, rain gar-dens, green roofs, swales, per-meable pavements, tree planting and storm water detention tree wells. The City and partners like Adapt Oakland/Urban Biofilter, Urban Releaf, the San Francisco Estuary Partnership, the San Francisco Estuary Institute, the West Oakland Greening Initia-tive, and the Sierra Club, among others, are working together to identify viable projects.
Oakland residents restoring watersheds
In 2015, the City completed the Lake Merritt Sailboat House Shoreline Project; the project was funded by a $198 million voter-approved bond mea-sure to enhance water quality, wildlife habitat, and pedestrian and cycling access that have transformed Lake Merritt in recent years. Also, the Sausal Creek Restoration Project is also underway, which will daylight buried segments of the creek, create habitat and passage for native rainbow trout, and restore nearly 10,000 square feet of riparian habitat with native trees and plants. These types of creek and waterway restoration, land acquisition, and storm water protection projects improve wa-ter quality, provide flood control, protect habitat, and enhance natural landscapes.
Severe 1997-98 El Niño storms damaged homes and streets Photo: Used with permission of The Oakland Tribune Copyright ©2015. All rights reserved.

- 23 -
Wildfires
The Oakland Hills Firestorm of 1991 was the most destructive fire in state history, resulting in 25 lives lost, 150 injuries, destruction of 3,469 single-family dwellings and apartments and $3.9 billion in losses (in 2015 dollars).17 Although wildfires may occur at any time of year and in any climate, the risk of fire increases greatly with increased drought and heat. California’s future climate of frequent drought and higher heat leaves Oakland at extreme risk for wildfires.
External Economic Crises
The City of Oakland is part of the San Francisco Bay Area regional economy, which, like most local economies in the U.S., is prone to occasional recessions and contractions. The regional economy is particularly dependent on the technology and real estate sectors, which are prone to particularly dramatic boom-bust cycles. Given large income disparities and the City’s revenue structure, these economic crises have a tendency to impact the most vulnerable residents while simultaneously reducing City resources to serve those residents. The City and region are also vulnerable to shocks related to international trade, travel, tourism, logistics, and manufacturing. Analysis from the National Bureau of Economic Research18 suggests that national economic contractions recur on approximately 7-year cycles. During the prior economic recession, the City’s discretionary revenues were reduced by nearly 12 percent, and demands for City services dramatically increased.
RESILIENCE ACTIONS
Preventing fires during extreme droughts
Oakland’s Fire Department proac-tively mitigates fire risk by deploying 3,000 goats across 1,400 acres of the Oakland Hills between May and September to eat the brush that could otherwise be the flash fuel for wildfires; engages community volunteers in removing flammable brush, which in 2014 resulted in the removal of 250 cubic yards of brush like the invasive French Broom; and regularly inspects the 10,590 acre, 16.5-square-mile Wildfire Prevention Assessment District. Firefighters also educate the public on fire code require-ments and best practices for creating defensible space zones around the exterior of homes. These multi-pronged efforts make Oakland’s Fire Department among the most proactive in California and have prevented the spread of wild-fire during the most recent intense drought and during dry summer months.
Preparing for global economic downturns
Following the Great Recession, the City of Oakland developed and implemented a Rainy Day Policy. Oakland’s policy dictates that that windfall revenues from the City’s most volatile revenue stream (Real Estate Transfer Taxes) be used solely for one-time invest-ments rather than to support or expand ongoing services. Further, the policy requires that 25% of these windfall revenues be used to reduce City long-term debts and liabilities and another 25% be reserved in a special fund for times of economic hardship. Oakland’s Rainy Day Policy mirrors, in con-cept, a recently enacted policy of the State of California.
Firefighters, Councilmember Brooks, and community members join together for the dedication of a new fire danger sign in Oakland Wildfire Prevention Assessment District. Photo courtesy of Sue Piper, February 1, 2016.

PRELIMINARY RESILIENCE ASSESSMENT - 24 - OAKL AND
Civil Unrest
In the past 5 years, Oakland has experienced repeated incidents of civil unrest and public confrontations between police and citizens. In 2014–15, Oakland spent more than $5 million in officer overtime pay to address demonstrations in response to events in Ferguson and New York.
Oakland’s history as an epicenter for nationally recognized social change movements—from civil rights
to labor rights to economic justice—is a point of pride for the community. Black Lives Matter demonstrations have vocalized important issues that are part of a national conversation about racial inequity, criminal justice, and disparate treatment of people of color by the police. However, protests in Oakland have often resulted in damage to local businesses and public infrastructure, requiring the City to expend limited public funds on emergency response when protest activities have become violent.
Mural on Oakland freeway underpass, Photo: Greg Linhares, City of Oakland
Black Lives Matter rally, steps of Oakland City Hall, 2015, Photo: Victoria Salinas
- 25 -
RESILIENCE ACTIONS
Oakland Funds New Department of Race and Equity
Launched in late 2015, the City of Oakland established a new department charged with integrating the principal of “fair and just” in the delivery of city services.
Cradle-to-Career education initiative
The City and OUSD have joined forces on the Oakland Promise, an initiative to create a college- going/college-bound culture and expectation for all students in the OUSD. The district, through the Offices of Post-Secondary Education and Linked Learn-ing, is developing and improving existing academies at the high schools and partnering with businesses in the City to give its students hands-on work experi-ence through summer jobs and internships.
City of Oakland lowering barriers to start businesses
Making it easy to open businesses online is among the measures the City is taking to help start-ups thrive in Oakland.
STRESSES
In addition to acute shocks, cities also face ongoing, long-term stresses, either natural or human caused, and these challenges tend to be tightly interwoven. The following were rated Oakland’s highest-impact stresses.
Socioeconomic Disparities
Oakland is in a unique economic moment—the economy is booming and inequality is also increasing. Oakland is recovering and growing following a major nationwide economic recession, but the economic growth has been unequal across the City. Tech workers are finding Oakland an increasingly attractive place in which to live and do business, but this influx of wealth is placing stress on many existing residents and less-educated workers at a time when the manufacturing industry that was once a mainstay of the Oakland economy is shrinking. The burgeoning economy is bringing new optimism to the City while focusing new attention on issues such as inequality and displacement. Consequently, Oakland’s current story is a tale of two cities: the global Oakland, where Citywide statistics are looking better each year; and the City as seen by vulnerable residents who are black, brown, poor, young, and old.
Wealth Disparities
Oakland was recently ranked as having the seventh-highest income inequality among cities in the nation.19 Oakland also has some of the highest regional poverty levels, with 19.6 percent of residents and 30 percent of children living in households with incomes below the federal poverty level. Nearly 35 percent of children live in households that receive public assistance. The median income for African American, Latino, and Asian households in Oakland has declined since 2000. Citywide, White households have nearly double the median household income of any other racial or ethnic group.20
Educational Disparities
Educational disparities in Oakland are striking. Oakland exceeds national levels both for the number of adults with college and post-graduate degrees and for the number of adults who did not complete high school. In the past decade, Oakland’s public schools have made important gains in student achievement. Today, the Oakland Unified School District stands as California’s most improved urban school district.21 However, only a minority of Oakland’s children are meeting key educational milestones. On most metrics, the achievement gap persists when comparing African American and Latino students to White and Asian students. A majority of Oakland’s public schools struggle to serve students, particularly students of color and those from socioeconomically disadvantaged or language minority backgrounds. Although Oakland’s graduation rate has improved in recent years to 63 percent, it still lags behind the average graduation rate of 80 percent for Alameda County and California. Too many Oakland students are not gaining the skills needed for successful employment.

PRELIMINARY RESILIENCE ASSESSMENT - 26 - OAKL AND
RESILIENCE ACTIONS
New City of Oakland economic development strategy slated to encourage sustainable economic growth
Encouraging existing Oakland companies to expand and re-invest property revenues in catalytic neighborhood development proj-ects is among the priorities of the economic development plan to be released in 2016.
Procedural Justice Training Program cultivates community relationships
Developed as part of the Ceasefire Crime Reduction Strategy, the Procedural Justice Training Program teaches Oak-land Police officers the principles of giving people a voice, fair treat-ment and respect and providing a trustworthy process. In addition to building better relationships with community members, these principles promote support for an officer’s efforts to improve safety. The Oakland Police Depart-ment completed Phase one in June 2015, having conducted 50 classes and trained over 850 sworn staff. Phase two, the practical application of Procedural Justice, is currently being devel-oped with community partners. Oakland is the only city presenting the training where sworn staff and community members partner in its development and delivery.
African American and Latino students to White and Asian students. A majority of Oakland’s public schools struggle to serve students, particularly students of color and those from socioeconomically disadvantaged or language minority backgrounds. Although Oakland’s graduation rate has improved in recent years to 63 percent, it still lags behind the average graduation rate of 80 percent for Alameda County and California. Too many Oakland students are not gaining the skills needed for successful employment.
Health Disparities
Health disparities are closely tied to many additional Oakland stressors: wealth and educational disparities, limited government resources, and violent crime all contribute to increased health risks for already vulnerable populations.
• The number of seniors living in Alame-da County is expected to grow by 117 percent by 2030 to more than 94,000 residents. Ensuring these older adults have the housing, transportation, and social services they need to meet their changing needs will be a new chal-lenge for Oakland.
• More than half (55 percent) of Alam-eda County residents and a third (35 percent) of school-aged children were overweight or obese in 2014.22
• Diet-related diseases (heart disease and diabetes) are among the 10 leading causes of death in Alameda County in 2010.
• Diabetes and metabolic/nutritional disorders were among the 10 most common reasons for hospitalization of children in Alameda County between 2007 and 2011.
Disparities in Access to Good Jobs
Unemployment is decreasing Citywide, with a drop from 9 percent to 5.7 percent from 2014 to 2015. Between March 2013 and March 2014, 17,000 new jobs were added in the East Bay, with 143,000 more forecasted by 2020. However, individual Oakland census tracts still have unemployment rates above 10 percent. Among African American males between the ages 16 to 64, the unemployment rate is 14 percent. These statistics fail to capture people who are disconnected from the local economy and who have stopped searching for jobs. The Oakland economy produces a diverse range of jobs in multiple sectors, but needs stronger pathways to connect to alienated workers and encourage them to participate. These pathways include the need for a living wage, support for entrepreneurs, and career ladders for entry-level employment.
West Oakland Summer Reading Kickoff, 2014 Photo: Celia Jackson, Oakland Public Library

- 27 -
High Crime Rate
The years 2013 and 2014 had the lowest homicide numbers that Oakland has seen in more than a decade. Although more of the shootings that occurred in 2015 were fatal, 2015 marks the third consecutive year of double-digit reductions in shootings in Oakland. To put this 3-year trend into perspective, nearly 250 fewer Oakland residents were injured or killed by gun violence in 2015 than in 2012, and over 1,100 fewer people were victims of violent crime in 2015 than in 2012.
Despite progress, Oakland exceeds statewide and national trends for violent crime. Gun violence is of particular concern, with 411 reported shootings in Oakland in 2014.23 Table 1 shows crime statistics for three types of violent crime from 2010–14.24
Serious violence is most concentrated among individuals (mostly young men) 18 to 34 years old, and the highest percentage of victims and suspects are men between the ages of 18 and 24, followed by men between the ages of 25 to 34. Violence is disproportionately concentrated in specific parts of the City, particularly in East and West Oakland. According to law enforcement data, the individuals engaged in a majority of the robberies throughout the city are the same as those engaged in violent crime in East and West Oakland.25 This distribution of higher rates of violence in particular parts of the City correlates closely with the concentration of stressors that can increase the risk of violence.26 The data is based on rates of arrest, crime incidence, food stamp participation rates, youth incarceration and probation rates, rates of violent suspensions, and chronic absence among Oakland Unified School.
Crime Statistics in Oakland by Year 2010–14
Type: 2010 2011 2012 2013 2014
Murders 90 103 126 90 80
Robberies 3,200 3,326 4,173 4,838 3,349
Assaults 2,824 2,641 2,858 2,715 3,016

PRELIMINARY RESILIENCE ASSESSMENT - 28 - OAKL AND
like my neighborhoods monthly gentrification.
My peers take intelligence for granted and ignorance is a wide spreading “epidemic” more potent than any drug I’ve ever known.
I sit on A/C transit day after day observing my people.
Drowning in this concrete amusement park, a woman dusted in track marks sits beside me with arms all too familiar, from vein to sweaty creases.
She hits me too close to home.
Sophie Elkin Oakland’s 2014 Youth Poet Laureate
I can no longer sit in the back and watch my generation crumble
like the apartments in West Oakland that are being torn down.
Oakland’s 2014 Youth Poet Laureate Sophie Elkin, Courtesy of Oakland Public Library

- 29 -
RESILIENCE ACTIONS
Generating new affordable housing funds through impact fees
Oakland is completing a study that will enable a Citywide ap-proach to collecting fees and creating new development. Impact fees are a common mechanism cities use to address critical needs for transportation, infrastructure improvements, and affordable housing that can be attributed to new development.
Insufficient Affordable Housing
Oakland is currently in the midst of a housing affordability crisis. In the past decade, housing costs have outpaced income growth for the majority of Oakland residents. From November 2013 to November 2014, the home sale prices in the city rose 13.4 percent, while rents of new vacant listings in the city also rose 13.4 percent. The City’s Housing Element states that 50 percent of renter households pay more than 30 percent of their income for housing. The Urban Strategies Council’s analysis of 15 neighborhoods with different income levels shows that the vast majority of renters and owners in those neighborhoods would be unable to afford the median-priced rents or homes in their neighborhoods.
According to the City’s 2015 Rental Study of Craigslist data27, median rental prices have risen between 2 percent and 40 percent in the last year (2015 rents are between $1,475 for a studio apartment to $2,975 for a three-bedroom apartment). Housing costs are outpacing income levels of many Oakland residents. When current residents cannot afford increasing housing costs, they are priced out of the market and relocate to cities with less-expensive housing costs. Renters constitute 59 percent of Oakland households, with homeowners at 41 percent. Only 56 percent of Oakland’s rental housing stock is subject to rent stabilization requirements. Oakland’s housing patterns continue to be segregated by race, ethnicity, and income.
Chronic Homelessness
Chronic homelessness is an ongoing issue in Oakland. The January 2015 “Every One Home” Homeless count28 indicated that on any given night, there are 2,191 total homeless and 1,384 unsheltered homeless people in Oakland. Of the unsheltered, 56.5% are African American, 24% are White, 12% are Latino, and 18% are under the age of 25. Oakland

PRELIMINARY RESILIENCE ASSESSMENT - 30 - OAKL AND
provides resources for rapid re-housing, including rent subsidies, case management and services to address root causes of homelessness. However, the supply and access to affordable housing is severely limited. The City collaborates closely with housing and service providers as well as mainstream agencies in Alameda County and the Oakland the Housing Authority on issues related to chronic homelessness including winter relief shelter efforts and housing subsidy programs for interim and permanent supportive housing. In order to provide adequate shelter for all residents, both appropriate locations and funding for additional winter shelter beds for the more difficult, colder months of the year are needed.
Trust in Government
Residents at public meetings, the press, and a few public institutions have identified weak public trust and the need for enhanced ethical conduct by City staff and officials as an important issue. Complaints have focused on government transparency, including City compliance with open meeting policies or public records laws. In 2013, the Alameda County Grand Jury29 identified instances in which City Councilmembers interfered with the administrative functions of the City. In November 2014, the residents of Oakland voted to amend the City Charter in favor of increasing the Public Ethics Commission’s strength, independence, and staffing. The City Council also approved the Government Ethics Act in December 2014 to provide a clear, comprehensive, and enforceable framework of ethics rules in Oakland.
Limited City Resources
Despite prudent and conservative fiscal policies established since the last economic downturn, robust economic growth, and a steady and solid credit rating, over the long term without intervention the City’s expenditures are projected to grow faster than City revenues. The growth rate in revenues from taxes and fees is slower than the growth rate of personnel, utility, fuel, and other costs. Simultaneously, the City will require significant new investments in capital and services to maintain current infrastructure and quality of life. These trends, when coupled with limitations on the ability of local governments in California to generate new sources of revenue, create continual pressure to reduce government services or continue deferring capital investments. In times of economic downturn, these limitations can lead to dramatic reductions in government services at precisely the times those services are most needed by residents.
Aging Infrastructure
Oakland’s infrastructure systems, including roads, sewers, bridges, and pipelines, are increasingly failing and ill-prepared to meet future demands due to years of inadequate funding and deferred maintenance. A 2012 infrastructure report card issued by the American Public Works Associations30 identifies more than $95 million per year for the five year planning period in budget shortfall for maintenance, in addition to the more than $800 million in unfunded deferred maintenance across the City’s infrastructure. This report card also rated Oakland’s infrastructure “D+” due to inadequate maintenance. In addition, several key areas of infrastructure do not have dedicated funding sources to address either deferred maintenance or new needs.
RESILIENCE ACTIONS
Residents rally to adopt-a-drain
Oakland residents are volunteering to take proactive measures to prevent flooding and protect water quality by adopting nearly 1,000 drains throughout the City. Through the Adopt-a-Drain program, volunteers commit to keep-ing inlets clean and clear.

- 31 -
Droughts
California has historically experienced cyclical periods of extreme drought, the most recent of which has lasted 3 years and is ongoing, leading to significant mandatory conservation requirements. Our changing climate is expected to bring deeper, longer droughts and more days of extreme heat. During drought, Oakland experiences higher water prices, decreased cooling options during extreme heat days, loss of shade trees and plants and open space values, and higher risk of wildfires. Extreme heat disproportionately affects the health of vulnerable populations.
Sea Level Rise
As the elevation of San Francisco Bay rises in response to warming oceans and melting ice sheets, short-term, temporary coastal floods will increase in frequency and extent until permanent daily tidal inundation is reached.31 Low-lying coastal residential areas, the Port of Oakland, the former Oakland Army Base, and a variety of low-lying areas near the Coliseum, Oakland International Airport, and I-880 are most at risk. According to the Bay Conservation and Development Commission, Oakland is expected to experience 12-24 inches of sea level rise by 2050 and 3- to 5-foot rise in sea level (36 to 66 inches of sea level rise by the year 2100, which, without action, will substantially impact coastal areas.
RESILIENCE ACTIONS
Oakland schools combatting drought through water conservation.
The Oakland Unified School District is investing nearly $1.2 million for projects that reduce stormwater pollution and conserve water through a grant from the Califor-nia State Water Resources Control Board. This project, undertaken in partnership with Piedmont Unified School District and StopWaste.org, will engage students involved in the Sustainable Urban Design Academy and Science, Technology, Engineering, and Math curriculum.

PRELIMINARY RESILIENCE ASSESSMENT - 32 - OAKL AND
RESILIENCE ACTIONS
Groundbreaking sea level rise studies make adaption measures possible
Adapting to Rising Tides is a regional study led by the Bay Conservation and Develop-ment Commission that models sea level rise risk in the Bay Area. Other partners include Alameda County, Port of Oak-land, AC Transit, ABAG, BART, Bay Area Air Quality Manage-ment District, Caltrans, EB-MUD, East Bay Regional Park District, FEMA, SPUR, and the Regional Water Quality Control Board.
City Facilities Total NumberNumber at Risk from Sea Level Rise
16 inches by 2050 55 inches by 2100
Emergency Response Facilities
Fire Stations 8 2 2
Facilities serving at-risk populations
Health Care facilities 87 5 13
Homeless shelters 12 2 4
Food Banks 14 1 5
Facilities serving vulnerable, less mobile populations
Senior housing facility 45 0 3
Childcare center 146 6 16
Schools 81 3 13
Adapting to Rising Tides is a regional study addressing sea level rise risk in the Bay Area. Within Oakland, the Adapting to Rising Tides study area covers the full coast inland approximately 0.5 mile beyond the area projected to be exposed to storm event flooding with 55 inches of sea level rise. Approximately 6,000 of Oakland’s residents would be at risk from 16 inches of sea level rise, with 15,000 at risk from 55 inches of related flooding. The replacement cost of property is estimated to be $22 to $38 billion.

ASSETS, SHOCKS AND STRESSES: WHAT ARE THE THREATS TO RESILIENCE?
An assessment of the current condition of City assets and potential interactions between shocks, stresses, and assets indicated strong feedback links between all three. Both the continued decline of City infrastructure and potential shocks are expected to exacerbate existing long-term City stresses, such as public health and safety issues. Increasing City resiliency around any of the assets, shocks, or stresses would therefore be expected to provide cross-sector benefits. Potential City actions can be considered through a resilience lens to maximize these co-benefits.

PRELIMINARY RESILIENCE ASSESSMENT - 34 - OAKL AND
4Focus for Resilience
For Oakland, resilience is about having a thriving and equitable city. This means that Oakland has prosper-ous residents and families; people can stay rooted in the city they love; residents live in safe and secure neighbor-hoods; public infrastructure is a catalyst for improving people’s lives; and when disasters strike, the whole community recovers quickly.
Photo: Lech Naumovich

- 35 -
5 focus areasProsperous Residents and Families
Staying Rooted in Oakland
Living in Safe and Secure Neighborhoods
Benefiting from Public Infrastructure
Recovering Quickly from Adversity
The passion and can-do spirit of Oakland residents is a catalyst for resilience.
Clockwise from the top: (1) Brown Girl Surf volunteers kayak the Oakland Estuary for the Creek to Bay Day cleanup September 19, 2015, Photo: Lech Naumovich. (2) Beto Brancho of Courtland Creek at Thompson St., Photo: Lech Naumovich. (3) Chris Cook, volunteer coordinator of Leona Canyon Park, and a volunteer show off the strength of the weed wrench, Photo: Lech Naumovich (4) Photo: Lech Naumovich (5) Oakland Parks and Rec Foundation Annual Volunteer Workday Event, Photo: Susan Montauk. (6) Cleanup in Jingletown, Photo: Eric Saltmarsh. (7) The Three Musketeers of Courtland Creek at Thompson St., Photo: Lech Naumovich. (8) Chuck Butler of Courtland Creek Park does away with debris, Photo: Lech Naumovich.

PRELIMINARY RESILIENCE ASSESSMENT - 36 - OAKL AND
have been identified to help address the questions and challenges that have arisen around building resilience in Oakland.
These focus areas are:
1. Prosperous Residents and Families
2. Staying Rooted in Oakland
3. Living in Safe and Secure Neighborhoods
4. Benefiting from Public Infrastructure
5. Recovering Quickly from Adversity
Each of these focus areas serves as a path of inquiry for further research and as a framework for the development of resilience-building actions. This research is intended to support the exploration of approaches and initiatives that tackle multiple shocks and stresses and create cross-cutting benefits. Thus, each path of inquiry, each opportunity, each intervention must work to accomplish multiple goals and serve to achieve complementary benefits.
A consistent message has emerged from the various surveys, community engagement efforts, and workshops that underpin this Preliminary Resilience Assessment: for Oakland, resilience is about having a thriving and equitable city. This means that Oakland has prosperous residents and families; people can stay rooted in the city they love; residents live in safe and secure neighborhoods; public infrastructure is a catalyst for improving people’s lives; and when disasters strike, the whole community recovers quickly. Building Oakland’s resilience will also require Oakland’s residents to look inward to how the City’s culture can be harnessed to address new challenges. Oakland will need to coordinate regionally with other cities and institutions to tackle shared risks and seize new opportunities. New thinking will also be needed on how to leverage assets and financial tools to achieve Oakland’s goal of a thriving and equitable resilient city.
A Resilience Strategy will be developed in 2016 to unify existing initiatives and activities and identify additional actions needed to realize the City’s resilience goals. As part of this process, the questions and challenges that emerged from the Preliminary Resilience Assessment will be explored in the development of the resilience strategy. As shown in the charts below, it is difficult to prioritize among development issues in Oakland, and so the city is taking a comprehensive approach to building resilience in a way that complements the Mayor’s city-wide priorities. To provide a framework for cross-sector collaboration and problem solving during the development of the Resilience Strategy, five focus areas
Photo: Greg Linhares, City of Oakland

- 37 -
BEST thing about living in Oakland Oakland values the diversity above all other characteristics.
WORST thing about living in Oakland Nearly half of voters say crime is the worst part of living in Oakland.
What is the highest need for public services in the City?
Source: Pulse of Oakland Voter Poll October 2015, Oakland Metropolitan Chamber of Commerce

PRELIMINARY RESILIENCE ASSESSMENT - 38 - OAKL AND
RESILIENCE FOCUS AREAS
Focus Area #1
Promote the prosperity of residents and families through a more coordinated and comprehensive approach to increasing access to good jobs, building wealth, and fostering economic development.
Personal resilience is often affected by financial resources and access to quality jobs and stable employment. How and where people make money is rapidly changing due to technology, Oakland’s expanding economic sectors, and sources of public and private financing for workforce development. Oakland residents, especially those who are low income, underemployed, or find it difficult to get hired, will be more financially resilient—today and after major shocks—if there is greater access to good jobs and wealth-building opportunities. This resilience in turn will have positive impacts on people’s ability to live where they want, lead healthy lives, and improve overall personal and family well-being.
This focus area will support the Oakland Promise, a cradle to college initiative aimed at ensuring every child in Oakland graduates high school with the expectations, resources, and skills to complete college and be successful in the career of his or her choice.
Priority Questions
• How can innovative wealth building approaches for low-income commu-nity members be scaled?
• Who is disconnected from Oakland’s economy? What systemic factors lead to disengagement and how can people be connected in more targeted ways?
• How can low-income residents most effectively be supported in starting new businesses and enterprises?
Photo courtesy of Peralta Community College District
7%
86%
7% Yes
Is economic development/job creation a critical issue?
No
Unsure/Not Applicable

- 39 -
Focus Area #2
Identify what long-term residents of Oakland (especially the most vulnerable) need to be able to stay and what new residents need to be able to integrate in a way that preserves and reinforces commtunity character.
Oakland’s ability to maintain and strengthen community resilience will likely be affected by the extent to which current residents have what they need to continue to call Oakland home and new residents and businesses become part of the existing community fabric and culture. Residents will be able to stay rooted in Oakland, regardless of shocks and stresses, if housing is safer and more affordable, equity gaps are closed, neighborhoods are vibrant, and communities remain cohesive.
This focus area complements the work being undertaken by the City of Oakland, along with many local and regional organizations, through the Housing Equity Roadmap, which is aimed at alleviating the affordable housing crisis, and Mayor Schaaf’s high-level Housing Cabinet, which is providing further recommendations for tackling this challenge.
Priority Questions
• What unique aspects and characteristics of Oakland’s neighborhoods do people want to preserve for generations to come?
• How will shocks and stresses affect the availability and ability to have safe and secure housing for the most vulnerable residents of Oakland?
• What is the current level of social cohesion and community ties within neighborhoods and across neighborhoods in the city? How can social cohesion be leveraged to increase community resilience?
Golden State Warriors Championship parade and rally, June 19, 2015, Photo: Greg Linhares, City of Oakland
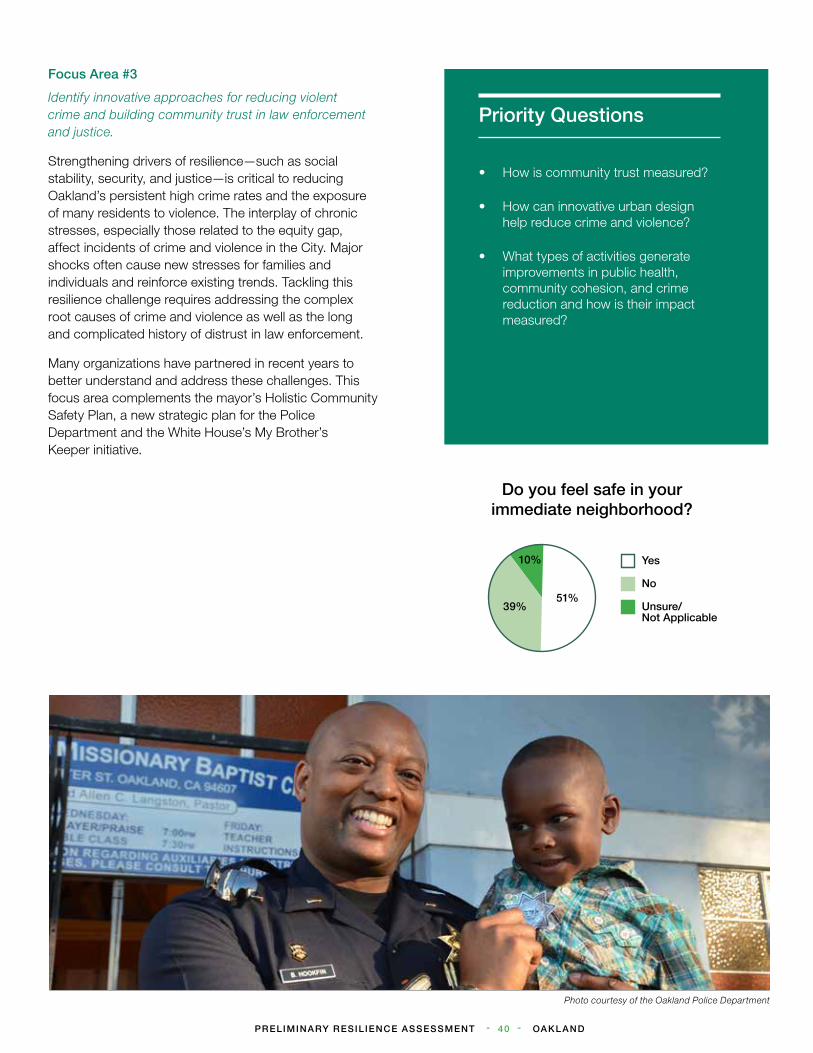
PRELIMINARY RESILIENCE ASSESSMENT - 40 - OAKL AND
Focus Area #3
Identify innovative approaches for reducing violent crime and building community trust in law enforcement and justice.
Strengthening drivers of resilience—such as social stability, security, and justice—is critical to reducing Oakland’s persistent high crime rates and the exposure of many residents to violence. The interplay of chronic stresses, especially those related to the equity gap, affect incidents of crime and violence in the City. Major shocks often cause new stresses for families and individuals and reinforce existing trends. Tackling this resilience challenge requires addressing the complex root causes of crime and violence as well as the long and complicated history of distrust in law enforcement.
Many organizations have partnered in recent years to better understand and address these challenges. This focus area complements the mayor’s Holistic Community Safety Plan, a new strategic plan for the Police Department and the White House’s My Brother’s Keeper initiative.
Priority Questions
• How is community trust measured?
• How can innovative urban design help reduce crime and violence?
• What types of activities generate improvements in public health, community cohesion, and crime reduction and how is their impact measured?
Photo courtesy of the Oakland Police Department
Yes
Do you feel safe in yourimmediate neighborhood?
No
Unsure/Not Applicable
10%
39%51%

- 41 -
Focus Area #4
Identify which public infrastructure projects will have the most impact on resilience and determine how they should be coordinated, sequenced, and financed.
The infrastructure that residents rely on daily to work, live, and play can also be a resource for increasing Oakland’s resilience. If the City of Oakland, as owners and operators of the City’s public infrastructure, together with residents, can identify the multiple benefits that can be generated by existing parks, thoroughfares, public spaces, facilities, and physical assets, then taxpayer dollars going into the built and natural environment can also help ameliorate social, economic, environmental, and hazard-related challenges.
This focus area assists with identifying new opportunities for increasing the public benefit and resilience dividend of existing and proposed infrastructure investments.
Priority Questions
• What are existing opportunities for maxi-mizing the co-benefits of infrastructure, parks, and public spaces for the most vulnerable residents?
• How should investments in infrastructure be sequenced and financed to maximize the impact on resilience?
• What improvements are needed in the coordination between adjacent jurisdictions and entities like Alameda Flood Control, Port of Oakland, PG&E, EBMUD improve their collective impact on infrastructure investments, hazard mitigation, and reduce social and economic vulnerability?
Photo: Greg Linhares, City of Oakland
35%
22%
43%
Stable
Is the condition of the publicspaces in your neighborhood:
Improving
Declining

PRELIMINARY RESILIENCE ASSESSMENT - 42 - OAKL AND
Focus Area #5
Identify what Oakland’s most vulnerable residents need to build their personal and community resilience.
The ability to quickly recover from major shocks and stresses is essential to keep Oakland residents in Oakland and remain in the city they love. By 2050, it is highly likely that sea level rise will have changed the coastline, drought will have increased fire risk, and a major earthquake will have occurred. How we prepare for, adapt to, and mitigate the potential impacts of these hazards will determine the extent to which these events lead to more frequent flooding, earthquakes that destroy buildings, and homes and fires (including those caused by earthquake damage) burning neighborhoods across the City. Addressing these challenges requires policy changes, new ordinances, infrastructure investments, and tapping into and bolstering the resilience inherent in our communities.
The City of Oakland, along with the State of California, has begun developing a disaster recovery framework to aid the long-term recovery from a major disaster. In addition, the City of Oakland is embarking on the update to its Hazard Mitigation Plan. This focus area contributes to these existing efforts and deepens the understanding of climate adaptation measures needed in Oakland.
Priority Questions
• What are the key actions needed to prepare for, mitigate, and recover from the potential impacts of natural disas-ters and climate change?
• Which services and critical assets should be prioritize for seismic safety and resilience to sea level rise and flood risk, particularly in neighbor-hoods furthest from opportunity?
• What policies, regulations, and data analysis systems can support deci-sion-making around how land use, building, and zoning can advance Oak-land’s long-term sustainability, climate resiliency, housing and job growth?
2015 CORE Citywide Exercise, Photos courtesy of Dena Gunning and Victoria Salinas
- 43 -
CROSS-CUTTING QUESTIONS
Under each focus area, the following cross-cutting issues will be explored:
Financing
How do we use existing and new finance tools and approaches to address the challenges and opportunities of the 21st Century?
Any innovative project or initiative will require new thinking around how to leverage assets and financial tools to make it sustainable.
Regional Coordination
How do we coordinate efforts regionally to address shared risks and opportunities?
The many shocks and stresses that threaten Oakland do not map neatly to political and jurisdictional boundaries. Regional coordination and planning are crucial for the implementation of resilience-building measures to ensure the mutual survival and prosperity of each jurisdiction.
Harnessing Culture
How do we use our culture to address the challenges and opportunities of the 21st Century?
Oakland’s unique culture and diversity are residents’ most cherished assets. Oakland residents often cite the City’s strong social networks as a key element of its long history of resilience. Any future comprehensive resilience-building efforts must take the City’s local culture into account to harness its creative and economic momentum to help address risk and generate opportunities.
NEXT STEPS: CRAFTING OAKLAND’S RESILIENCE STRATEGYBetween March and August 2016, Resilient Oakland will engage residents; local and international experts; and a range of organizations, companies, and institutions to explore the critical questions identified under each focus area for resilience. The information, analysis, and community input will shape Oakland’s Resilience Strategy.
For example:
• One of the primary avenues for addressing Focus Area 3, Living in Safe and Secure Neighborhoods, will be through a local and international competition for solutions that can contribute to achieving the dual goal of identifying ways for law enforcement to use data to both deter crime and enhance community trust. Through 100 Resilient Cities, Oakland will be collaborating with Citymart and local organizations to launch the challenge for innovative solutions to this intractable problem.
• The exploration of questions under Focus Area 5, Recovering Quickly from Adversity, will be instru-mental in assisting Oakland to complete the update to its Local Hazard Mitigation Plan and act on the recommendations of the City’s Energy and Climate Action Plan.
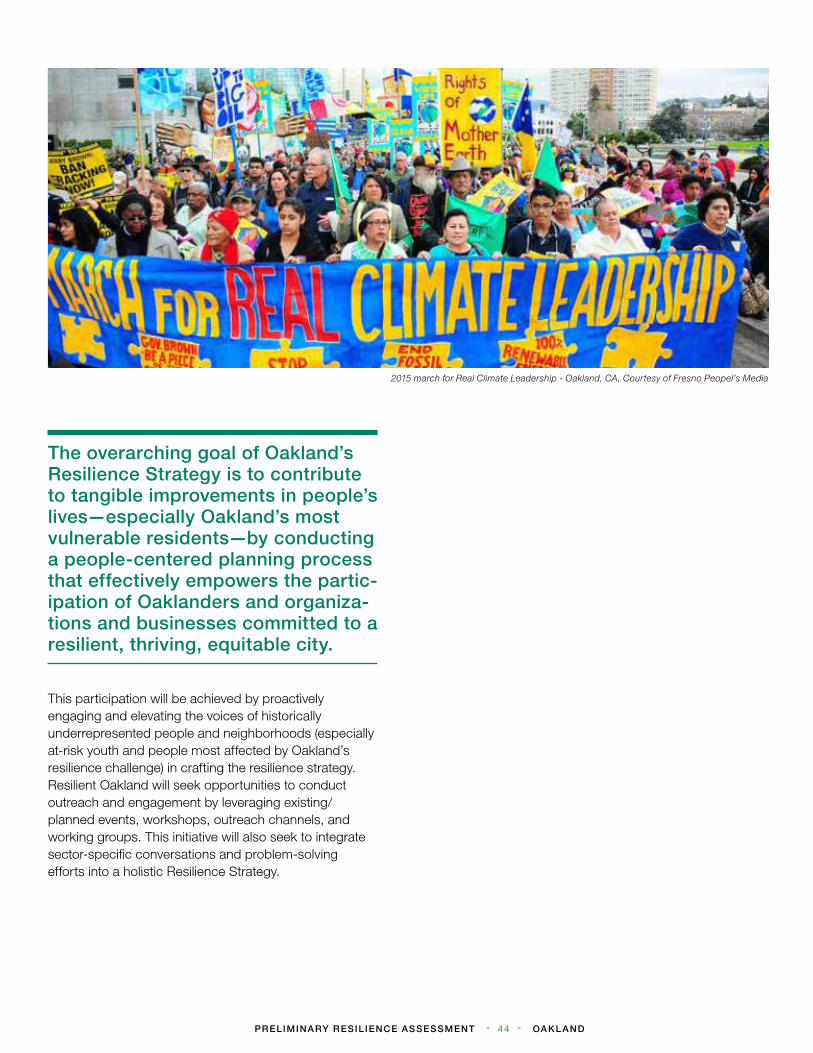
PRELIMINARY RESILIENCE ASSESSMENT - 44 - OAKL AND
The overarching goal of Oakland’s Resilience Strategy is to contribute to tangible improvements in people’s lives—especially Oakland’s most vulnerable residents—by conducting a people-centered planning process that effectively empowers the partic-ipation of Oaklanders and organiza-tions and businesses committed to a resilient, thriving, equitable city.
This participation will be achieved by proactively engaging and elevating the voices of historically underrepresented people and neighborhoods (especially at-risk youth and people most affected by Oakland’s resilience challenge) in crafting the resilience strategy. Resilient Oakland will seek opportunities to conduct outreach and engagement by leveraging existing/planned events, workshops, outreach channels, and working groups. This initiative will also seek to integrate sector-specific conversations and problem-solving efforts into a holistic Resilience Strategy.
2015 march for Real Climate Leadership - Oakland, CA, Courtesy of Fresno Peopel’s Media

Celebrating Oakland Pride: Oakland is home to one of the country’s largest LGBT communities
Photo: Greg Linhares, City of Oakland

NEIGHBORHOOD RESILIENCE SPOTLIGHT
PRELIMINARY RESILIENCE ASSESSMENT - 46 - OAKL AND
chinatownREVEALING RESILIENCE IN OAKLAND
The variety of small, unique businesses is what keeps the fabric of the community together, and they are in need of economic support at a neighbor-
hood and city scale. The area also has a critical need for housing in order to support current residents and create economic growth.
Economy
Who Lives Here?
56.4Male55.7
Median Age
Female
Chinese Garden Park
NimitzFreeway
Traffic Density72nd percentile
Asthma100th percentile
Health Concerns
Air Quality
Chinese
Korean
Asian Indian
Filipino
Japanese
Vietnamese
Other Races
Chinatown Demographics
Chinese 85.3%
Asian Population
Race
Black or African American
Hispanic / Latinx
White
Asian
Pacific Islander
Native American
Other Races
Chinatown Demographics
Asian88.8%
Owner-occupiedproperties18.7%
Households underpoverty line17.3%
Less than 11%
11% to 20%
21% to 30%
31% to 40%
Greater than 40%
0.05 0.20.10
±Miles
SF E
arth
qu
ake: Infl ux in C
hinatown Set
tled
by
Chinese imm
igrants
1850
Chi
ne
se Exclusion A
ct
1882
Photo: Greg Linhares, City of Oakland

NEIGHBORHOOD RESILIENCE SPOTLIGHT
- 47 -
Asian Pacific EnvironmentalNetwork
The Spot
Family Bridges
East Bay Asian Youth Center
Oakland Public Library(Asian Branch)
AYPAL
Oakland Chinatown Chamber of Commerce
OC
CC O
CC
C
Provide reliable Ensures continuity
Provides & Enhances Fosters Economic E
nsures Socia
l Sta
bility
P
rom
otes
Coh
esiv
e &
comm
unication & mobility
of critical services natural & manmade assets prosperity
securit
y & justi
ce
en
gage
d co
mm
uniti
es
e�ec
tive
man
agem
ent
ra
nge of s
takeholders & integrated planning basic needs
livelihoods & employm
ent health services
Pro
mot
es le
ader
ship
&
E
mpo
wer
s a broad
Fosters long-term Meets
Supports
Ensures pub
lic
Infrastructure & Environment Economy &
S
ociet
y
Le
ader
ship
& Stra
tegy
Health & Wellbeing100RC
ResilienceFramework
East Bay Asian Local Development Corporation
OC
CC
Building Resilience
Asian Health Services required to work at capacity to cater to Asian/Pacific Islander community
Public space
One of the only areas of Oakland with a sidewalk “scramble,” yet it is still unsafe for pedestrians
Community Top Priorities
Public Health
Range of stakeholders
Leadership Social stability
Cohesive community
Perceived areas for improvement
Perceived areas of strength
PedestrianSafety
SF E
arth
qu
ake: Infl ux in C
hinatown
1906
Res
iden
ts d
isplaced for freeway
1950
Fut
ure
de
velopment planned
Present
Chinatown included within Oakland
city limits
1931 1981
Language discrimination at hospital brought to Office of Civil Rights
Influx of Chinese, Vietnamese, Laosian
and Cambodian immigrants
1960

NEIGHBORHOOD RESILIENCE SPOTLIGHT
PRELIMINARY RESILIENCE ASSESSMENT - 48 - OAKL AND
Mexican
Domincan
Central American
South American
Cuban
Puerto Rican
Other Races
FRUITVALE & san antonio
REVEALING RESILIENCE IN OAKLAND
Fruitvale is located at a convergence of environmental threats, however vulnerability is often focused on language barriers, police relations, and
economic hardship. The transit-oriented Fruitvale Village was designed to combat this vulnerability, and is still working toward its potential.
Economy
Who Lives Here?
31.8Male31.3
Median Age
Female
Black or African American
Hispanic / Latinx
White
Asian
Pacific Islander
Native American
Other Races
Race
Hispanic or Latino 54.1%
Asian24.3%
Health Concerns
Other
Homocide
Influenza and Pneumonia
Stroke
Cancer
Heart disease
Leading Causes of Death
Owner-occupiedproperties30.7%
Households underpoverty line38.7%
Fruitvale Rent as a Percentage of Income
Less than 11%
11% to 20%
21% to 30%
31% to 40%
Greater than 40%
±0 Miles0.175 0.70.35
Fru
itVal
e:
many fruit orchards
1880
SF Ea
rthq
uake = population grow
th
1906
Central American 17.6%
Mexican76.7%
Hispanic or Latino Population
Courtesy of Oakland Public Library

NEIGHBORHOOD RESILIENCE SPOTLIGHT
- 49 -
Provide reliable Ensures continuity
Provides & Enhances Fosters Economic E
nsures Socia
l Sta
bility
P
rom
otes
Coh
esiv
e &
comm
unication & mobility
of critical services natural & manmade assets prosperity
securit
y & justi
ce
en
gage
d co
mm
uniti
es
e�ec
tive
man
agem
ent
ra
nge of s
takeholders & integrated planning basic needs
livelihoods & employm
ent health services
Pro
mot
es le
ader
ship
&
E
mpo
wer
s a broad
Fosters long-term Meets
Supports
Ensures pub
lic
Infrastructure & Environment Economy &
S
ociet
y
Le
ader
ship
& Stra
tegy
Health & Wellbeing100RC
ResilienceFramework
Building Resilience
Community Top Priorities
Present
Social unrest and riots due to police
brutalityNim
itz F
reeway constructed
1959
Creation ofUnity
Council
1968
Stu
den
t w
alkouts protesting w
ar
1970 1982
Montgomery Ward (employment anchor) closes its warehouse
Community predominantly Hispanic
or Latino
1955
Eastside Arts Alliance
Youth Employment Program
The Unity Council
East Bay Asian Youth Center
Oakland Public Library(César E. Chávez Branch)
Spanish Speaking Citizens Foundation
Spanish Speaking Citizens’ Foundation
Jingletown Arts & Business Community
Spanish Speaking Citizens’ Foundation
Spanish Speaking Citizens’ Foundation
Spanish Speaking Citizens’ Foundation
Oakland Public Library & ARISE
Perceived areas for improvement
ARISE School and library acts as a hub for community
Education
Fosters economic growth
Violence
2009 shooting of Oscar Grant III by a Bay Area Rapid Transit police officer
Perceived areas of strength
Range of stakeholders
Leadership Social stability
Cohesive community

NEIGHBORHOOD RESILIENCE SPOTLIGHT
PRELIMINARY RESILIENCE ASSESSMENT - 50 - OAKL AND
Black or African American
Hispanic / Latinx
White
Asian
Eastmont 1980 Demographics
Black or African American
83.2%
Hispanic or Latino
5%
Racevs. Now1980s
eastmont & castlemont
REVEALING RESILIENCE IN OAKLAND
Eastmont and Castlemont have gone through a tough history of economic decline, disinvestment, poverty, and political exclusion. This has ongoing implications for this community, specifically the large youth population, clear in the high violence
and low education rates. Future resilience work must focus on this deomographic.
Economy
Who Lives Here?
33.2Male29.7
Median Age
Female
Unemployment
Owner-occupiedproperties
27.9%
30%
Households underpoverty line26%
Health Concerns
Life expectancy for someone living in East Oakland is 10 years shorter when compared to someone living just 1.3 miles away in the Oakland Hills
Eastmont Rent as a Percentage of Income
Less than 11%
11% to 20%
21% to 30%
31% to 40%
Greater than 40%
±0 0.2 0.40.1 Miles
SF E
arth
qu
ake: Population grow
th
19061898
Che
vro
let M
otors brings wo
rkers
1916
F
HA Redlining Map
Train line from Oakland to San Leandro opened
Black or African American
Hispanic / Latinx
White
Asian
Pacific Islander
Native American
Other Races
Hispanic orLatino 46%
Black or African American45.6%
0
20
40
60
80
30+20.0-29.910.0-19.9<10A�uent Very high
poverty
83.280.2 78.0 76.4
Eastmont
Life Expectancy(Years)
Percentage of ResidentsBelow Poverty Line
Historic Picardy neighborhood in East Oakland

NEIGHBORHOOD RESILIENCE SPOTLIGHT
- 51 -
Provide reliable Ensures continuity
Provides & Enhances Fosters Economic E
nsures Socia
l Sta
bility
P
rom
otes
Coh
esiv
e &
comm
unication & mobility
of critical services natural & manmade assets prosperity
securit
y & justi
ce
en
gage
d co
mm
uniti
es
e�ec
tive
man
agem
ent
ra
nge of s
takeholders & integrated planning basic needs
livelihoods & employm
ent health services
Pro
mot
es le
ader
ship
&
E
mpo
wer
s a broad
Fosters long-term Meets
Supports
Ensures pub
lic
Infrastructure & Environment Economy &
S
ociet
y
Le
ader
ship
& Stra
tegy
Health & Wellbeing100RC
ResilienceFramework
Castlemont High School
Building Resilience
Community Top Priorities
Perceived areas for improvement
32% high school graduationrate in 2005
Education
Critical Services
Violence
86% of the youth in the areahave had contact with thecriminal justice system
Perceived areas of strength
Employment InequalitySocial stability
Public Space
Nim
itz F
reeway constructed
1959
Ed
ucat
io
n initiatives take off
Present
Chevrolet closes:Eastmont Mall built
1963 2005
Youth Uprisingopens
Castlemont Safeway
becomes vacant
1970
F
HA Redlining Map
1934 2011
Castlemontnamed by
Youth Uprising
Cra
ck cocaine epidem
ic
1982
Castlemont Community Transformation Schools
Room to Bloom
Children’s Hospital Oakland
East Oakland Youth Development Center
First 5 Alameda County
Best Babies Zone
Youth Uprising
Education
Served more than 14,000 unduplicated people since 2005
Health and Wellness
Public Safety
Civic participation
Enterprise Hubs
Black or African American
Hispanic / Latinx
White
Asian
Pacific Islander
Native American
Other Races
Black or African American45.6%

NEIGHBORHOOD RESILIENCE SPOTLIGHT
PRELIMINARY RESILIENCE ASSESSMENT - 52 - OAKL AND
Black or African American
Hispanic / Latinx
White
Asian
Pacific Islander
Native American
Other Races
golden gateREVEALING RESILIENCE IN OAKLAND
A neighborhood chartacterized by transitionis currently following that pattern by moving towards a younger, wealthier demographic. The area has the potential for economic development, however the
current state of neglect is hindering developer interest.
Owner-occupiedproperties18.7%
Households underpoverty line17.3%
Economy
Who Lives Here?
Health Concerns
Hispanic or Latino 14.6%
White39.9%
Racevs. Now
Median Age1990s vs. Now
Male47.6Female 40.5
Male35.9Female55.6
Leading Causes of Death
Cancer
Heart Disease
Stroke
Other
Heart Disease
29%Cancer 19%
Stroke 9%
Other 8%
Golden Gate Rent as a Percentage of Income
Less than 11%
11% to 20%
21% to 30%
31% to 40%
Greater than 40%
±Miles0.050 0.20.1
Klin
kner
ville established
1885
Established African
American community
RenamedGolden Gate
1888
SF Ea
rthq
ua
ke: growth in pop
ulation
1906
Black or African American
Hispanic / Latinx
White
AsianBlack or
African American34.8%
White12%
Black or African American
84%
1980s

NEIGHBORHOOD RESILIENCE SPOTLIGHT
- 53 -
Black or African American
Hispanic / Latinx
White
Asian
Pacific Islander
Native American
Other Races
Lo
ma
Prierta Earthquake
1989
Ori
gina
l Trader Vic’s opens
1934
Established African
American community
1930 1972
Trader Vic’s closes
Present
Nim
itz F
reeway constructed
1959
Rec Centeropens
Building Resilience
Many residents express strong concern about burglary and theft in the area.
Resident says house value change from $60,000 to $600,000 in 30 years
Community Top Priorities
Crime
Leadership Social stability
Perceived areas for improvement
Perceived areas of strength
Affordable Housing
Provide reliable Ensures continuity
Provides & Enhances Fosters Economic E
nsures Socia
l Sta
bility
P
rom
otes
Coh
esiv
e &
comm
unication & mobility
of critical services natural & manmade assets prosperity
securit
y & justi
ce
en
gage
d co
mm
uniti
es
e�ec
tive
man
agem
ent
ra
nge of s
takeholders & integrated planning basic needs
livelihoods & employm
ent health services
Pro
mot
es le
ader
ship
&
E
mpo
wer
s a broad
Fosters long-term Meets
Supports
Ensures pub
lic
Infrastructure & Environment Economy &
S
ociet
y
Le
ader
ship
& Stra
tegy
Health & Wellbeing100RC
ResilienceFramework
Planting Justice
People Linking Art,Community, and Ecology
Rock the Bike
Community Rejuvination Project
Oakland Public Library(Golden Gate Branch)
Rebuilding Together Oakland
Golden Gate Community Assoc. (formerly SPAGGIA)
Value increases with new housing along San Pablo Avenue
Critical ServicesPublic SpaceEmployment

Annex 1.Phase 1 Results Summary
PRELIMINARY RESILIENCE ASSESSMENT - 54 - OAKL AND
Perceptions of City Resilience from Public Workshop (150 participants)
PERCEPTIONS: DO OAKLANDERS FEEL RESILIENT?
Oakland residdents’ perceptions of resilience within the City have been gathered in multiple ways, including in-person workshops, online surveys, in-person surveys, and conversations with community representatives.
The three key messages communicated by workshop participants were that the City should:
• Empower stakeholders and promote cohesive communities
• Support local economic development
• Make City leadership more effective and connected to the community

- 55 -
STAKEHOLDERS: WHO IS WORKING ON RESILIENCE?
Oakland’s history is steeped in political, social, and environmental activism. In a recent survey, 322 organizations, agencies and businesses self-identified as contributing to three or more drivers of resilience in Oakland. From feeding the hungry and housing the homeless, to restoring green space and natural habitats, to helping vulnerable youth expand their horizons, Oakland is a community of people working for the common good.
ACTION INVENTORY: WHAT RESILIENCE WORK IS ONGOING?
The City of Oakland is supported in resilience work by hundreds of local organizations, working across all aspects of resilience, as demonstrated by survey responses.
Community Activities Contributing to Oakland’s Resilience

PRELIMINARY RESILIENCE ASSESSMENT - 56 - OAKL AND
Count of Respondents Contributing to Oakland Resilience by Driver

- 57 -
• The Oakland Firesafe Council is a grass-roots community-based organization dedi-cated to mobilizing the people of Oakland to reduce the risks of wildfire danger to people and property through outreach, programs, and projects.
• EarthMojo runs educational workshops that provide residents or businesses/em-ployees with information, and practical skills to make changes to be more sustainable, self-sufficient and resilient in their day to day lives. These workshops empower individu-als to make personal change, and move towards engaging with community resilience issues .
• Friends of the Oakland Public School Li-braries advocates for strong school libraries in every school for every child with the goal that students, teachers, parents and the broader school community will have access to a highly qualified professional teacher librarian, who can build a culture of reading in the school, teach information literacy, and maintain quality print and digital resources.
• Bike East Bay promotes healthy, sustain-able communities by making bicycling safe, fun and accessible.
• Acta Non Verba is a community program targetting community-based farming in Oakland to provide fresh and affordable produce to an underserved population, and in doing so raise seed money for college funds for participating children and teens.
Organizations conducting resilience work in Oakland focus on resilience from many angles, from housing solutions to education to environmental protection. A few examples of organizations conducting this work include:
• Allen Temple Arms Affordable Housing, working to increase affordable senior hous-ing in East Oakland.
• Abode Services, which secures permanent homes for individuals and families experi-encing homelessness, by applying the inno-vative Housing First approach to go beyond the temporary solutions that shelters and transitional housing programs offer.
• Eastside Arts Alliance, providing free neighborhood festivals, block parties, and public murals with a community resilience message.
• The Watershed Project, focusing on urban Greening strategies, storm and flood water management, and green infrastructure.
• Bay Localize, which hosts the Local Clean Energy Alliance and work toward a single vi-sion: let’s stop wasting energy, clean up our air, and put people to work.
• Oakland Heritage Alliance, advocating for the protection, preservation, and revitaliza-tion of Oakland’s architectural, historic, cul-tural and natural resources through publica-tions, education, and direct action.

PRELIMINARY RESILIENCE ASSESSMENT - 58 - OAKL AND
Steering CommitteeAna-Marie Jones, Emergency Preparedness Activist
Asian Pacific Environmental Network (APEN)Vivian Huang, Campaign and Organizing Director
Arnold Perkins, Human Rights Activist
Bay Area Rapid Transit (BART)Marla Blagg, Emergency Manager
Bay Conservation & Development CommissionLarry Goldzband, Executive DirectorLindy Lowe, Project Manager, Adapting to Rising Tides Children’s Hospital and Research Center OaklandBert Lubin, President/CEO Dayna Long, Director of Social Determinants of Health Initiatives
City of OaklandTomiquia Moss, Chief of Staff to Mayor Libby Schaaf East Bay Community FoundationJames Head, President/CEO David Pontecorvo, Interim Director, Community Investment and Partnerships
East Bay Housing OrganizationGloria Bruce, Executive Director East Bay Municipal Utility District (EBMUD)Richard Harris, Manager of Water Conservation
Heart of the Town Productions Samee Roberts, Owner Executive Director
Oakland Climate Action CoalitionCorinne VanHook, representing OCAC Steering Committee Oakland Community Organizations (OCO)Amy Fitzgerald, Executive Director
Oakland Metropolitan Chamber of CommerceBarbara Leslie, President/CEOAlex Boyd, Director of Economic Development
Oakland Unified School District
SPURLaura Tam, Sustainable Development Policy Director
The Unity CouncilChris Iglesias, CEO
Urban Economy GroupAhmad Mansur, Partner
US Department of Housing and Urban DevelopmentOphelia Basgal, Regional AdministratorJoshua Geyer, Program Analyst, Office of Economic ResilienceDwayne Marsh, Senior Advisor, Office of Economic Resilience West Oakland Environmental Indicators ProgramMs. Margaret Gordon, Co-founder/Co-Director
City of Oakland TeamVictoria Salinas, Chief Resilience Officer Karen Boyd, Communications DirectorChristine Daniel, Assistant City Administrator Tim BirchJoe DeVriesGreg ElliottAliza GalloMai-Ling GarciaMark HallDaniel HamiltonHarry HamiltonKristin HathawayBradley JohnsonHeather KleinSteve LautzeScott MeansDanielle MielerGenevieve Pastor-CohenDana Perez-St. DenisMarisa Raya Maryann SargentJamie Turbak
Resilience InternsAllan Kapoor, Semaj Blackwood, Jack Lundquist, Zoe Siegel, Chelsea Wurms
In-City team, Resilience SnapshotsB. Max Arnell, Veronica Fink, Varand Onany, Caytie Campbell-Orrock
100 Resilient CitiesRelationship ManagerCorinne LeTourneau
Strategy Partner, AECOMRebecca Verity, Claire Bonham-Carter, Kris May, Amruta Sudhalkar, Julie Guyenet, Lisa Jackson
Platform PartnerIan Mitroff, UC Berkeley Center for Catastrophic Risk Management

- 59 -
End Notes1. Wallethub, From: https://wallethub.com/edu/most-diverse-cities/12690/2. Census, from: http://www.bayareacensus.ca.gov/cities/Oakland.htm3. Walkscore, from: http://blog.walkscore.com/2013/11/2014-ranking-of-most-walkable-cities-and-neighborhoods/#.VrOey032Zes4. Better Doctor, from: https://betterdoctor.com/health/bike-friendly-cities/5. San Francisco Bay Conservation and Development Commission. 2012. Adapting to Rising Tides, Vulnerability & Risk6. Assessment Report, September 2012. From http://www.bcdc.ca.gov Accessed January 2016.7. Harvest Properties, from: http://harvestproperties.net/soaring-oakland-office-market-creates-new-gold-rush-for-landlords/8. Lonely Planet, from: http://www.lonelyplanet.com/usa/travel-tips-and-articles/best-in-the-us-20159. Jet Setter, from: http://www.jetsetter.com/feature/next-great-food-cities10. New York Times, from: http://www.nytimes.com/2012/01/08/travel/45-places-to-go-in-2012.html11. Walletub, from: https://wallethub.com/edu/best-worst-cities-to-start-a-career/3626/12. Popular Mechanics, From: http://www.popularmechanics.com/culture/g1859/the-14-best-startup-cities-in-america/?slide=313. SF Gate, from: http://blog.sfgate.com/inoakland/2014/05/06/oakland-ranked-9th-in-attracting-tech-investment-capital/14. 29,000 jobs added – Economic Development Department 15. U.S. Geological Survey, 2008. From http://earthquake.usgs.gov/regional/nca/ucerf/. Accessed January 2016. 16. California Climate Change Center. 2012. Reports on the Third Assessment from the California Climate Change Center. From, http://climatechange.ca.gov/climate_action_team/reports/
third_assessment /index.html.17. U.S. Geological Survey, 2008. From http://earthquake.usgs.gov/hazards/products/conterminous/ Accessed January 2016.18. East Bay Regional Parks District, 2011. The Oakland Hills Firestorm – 20 Years Later: Our Story. From http://www.ebparks.org/about/history/firestorm-20-years-later/The_Oakland_Hills_
Firestorm___Forward. Accessed January 2016.19. National Bureau of Economic Research, from: http://www.nber.org/cycles.html20. Alan Berube, All Cities Are Not Created Unequal (Washington, DC: Brookings Institute, 2014) The income inequality analysis was based upon the distance between households at the top 5%
by income and ones at the bottom 20%. In Oakland, households at the lowest 20% income earn $17,646 while those at the highest 5% income earn $223,965 for a ratio difference of 12.7. Incomes for both the 20% lowest and 5% highest income households declined from 2007 to 2012, which resulted in no change in the income inequality gap between those years
21. Housing Equity Roadmap, p. 8, original analysis by Urban Strategies Council http://www.policylink.org/sites/default/files/pl-report-oak-housing-070715.pdf22. Oakland Achieves - A Public Education Progress Report, from: http://www.goleadershipcenter.org/Oakland%20Achieves%20-%20A%20Public%20Education%20Progress%20Report%20
v2.pdf23. Alameda County Department of Public Health, The Health and Economic Impacts of Obesity in Alameda County, 2014, from: http://www.acgov.org/board/bos_calendar/documents/DocsA-
gendaReg_7_14_14/HEALTH%20CARE%20SERVICES/Regular%20Calendar/Alameda_County_Report_Exec_Summ_Obesity_Rpt.pdf24. Oakland Police Department25. City-Data.com 26. Urban Strategies Council and Prevention Institute (April 2015). An Analysis of Gaps and Assets to Enhance Violence Prevention Outcomes in Oakland, CA: Summary and Recommendations.27. City of Oakland’s 2015 Rental Study of Craigslist data 28. www.everyonehome.org 29. Alameda County Board of Supervisors, Grand Jury Final Report, https://www.acgov.org/grandjury/final2012-2013.pdf 30. American Public Works Association Report Card 31. AECOM, Arcadis, Geografika, and 3D Visions. 2011. Adapting to Rising Tides Transportation Vulnerability and Risk Assessment Pilot Project. Prepared for the Metropolitan Transportation
Commission, San Francisco Bay Conservation and Development Commission, Caltrans District No. 4, and the Federal Highway Administration. November 2011.
Cover image: Golden State Warriors Championship parade and rally, June 19, 2015, Photo: Greg Linhares, City of Oakland Back cover image: “Off the Grid,” Friday Nights at the Oakland Museum of California, Photo: Greg Linhares, City of Oakland
Fun Run at Lake Merritt Photo: Greg Linhares, City of Oakland

This report is printed on Process Chlorine Free (PCF) paper made from 100% recycled / 100% post-consumer waste and is Ancient Forest Friendly. Printed at a local Certified Green Business, in Alameda County, using only vegetable oil-based inks.