predictors of ventriculostomy infection in a large cohort
TRANSCRIPT
Introduction and Objective
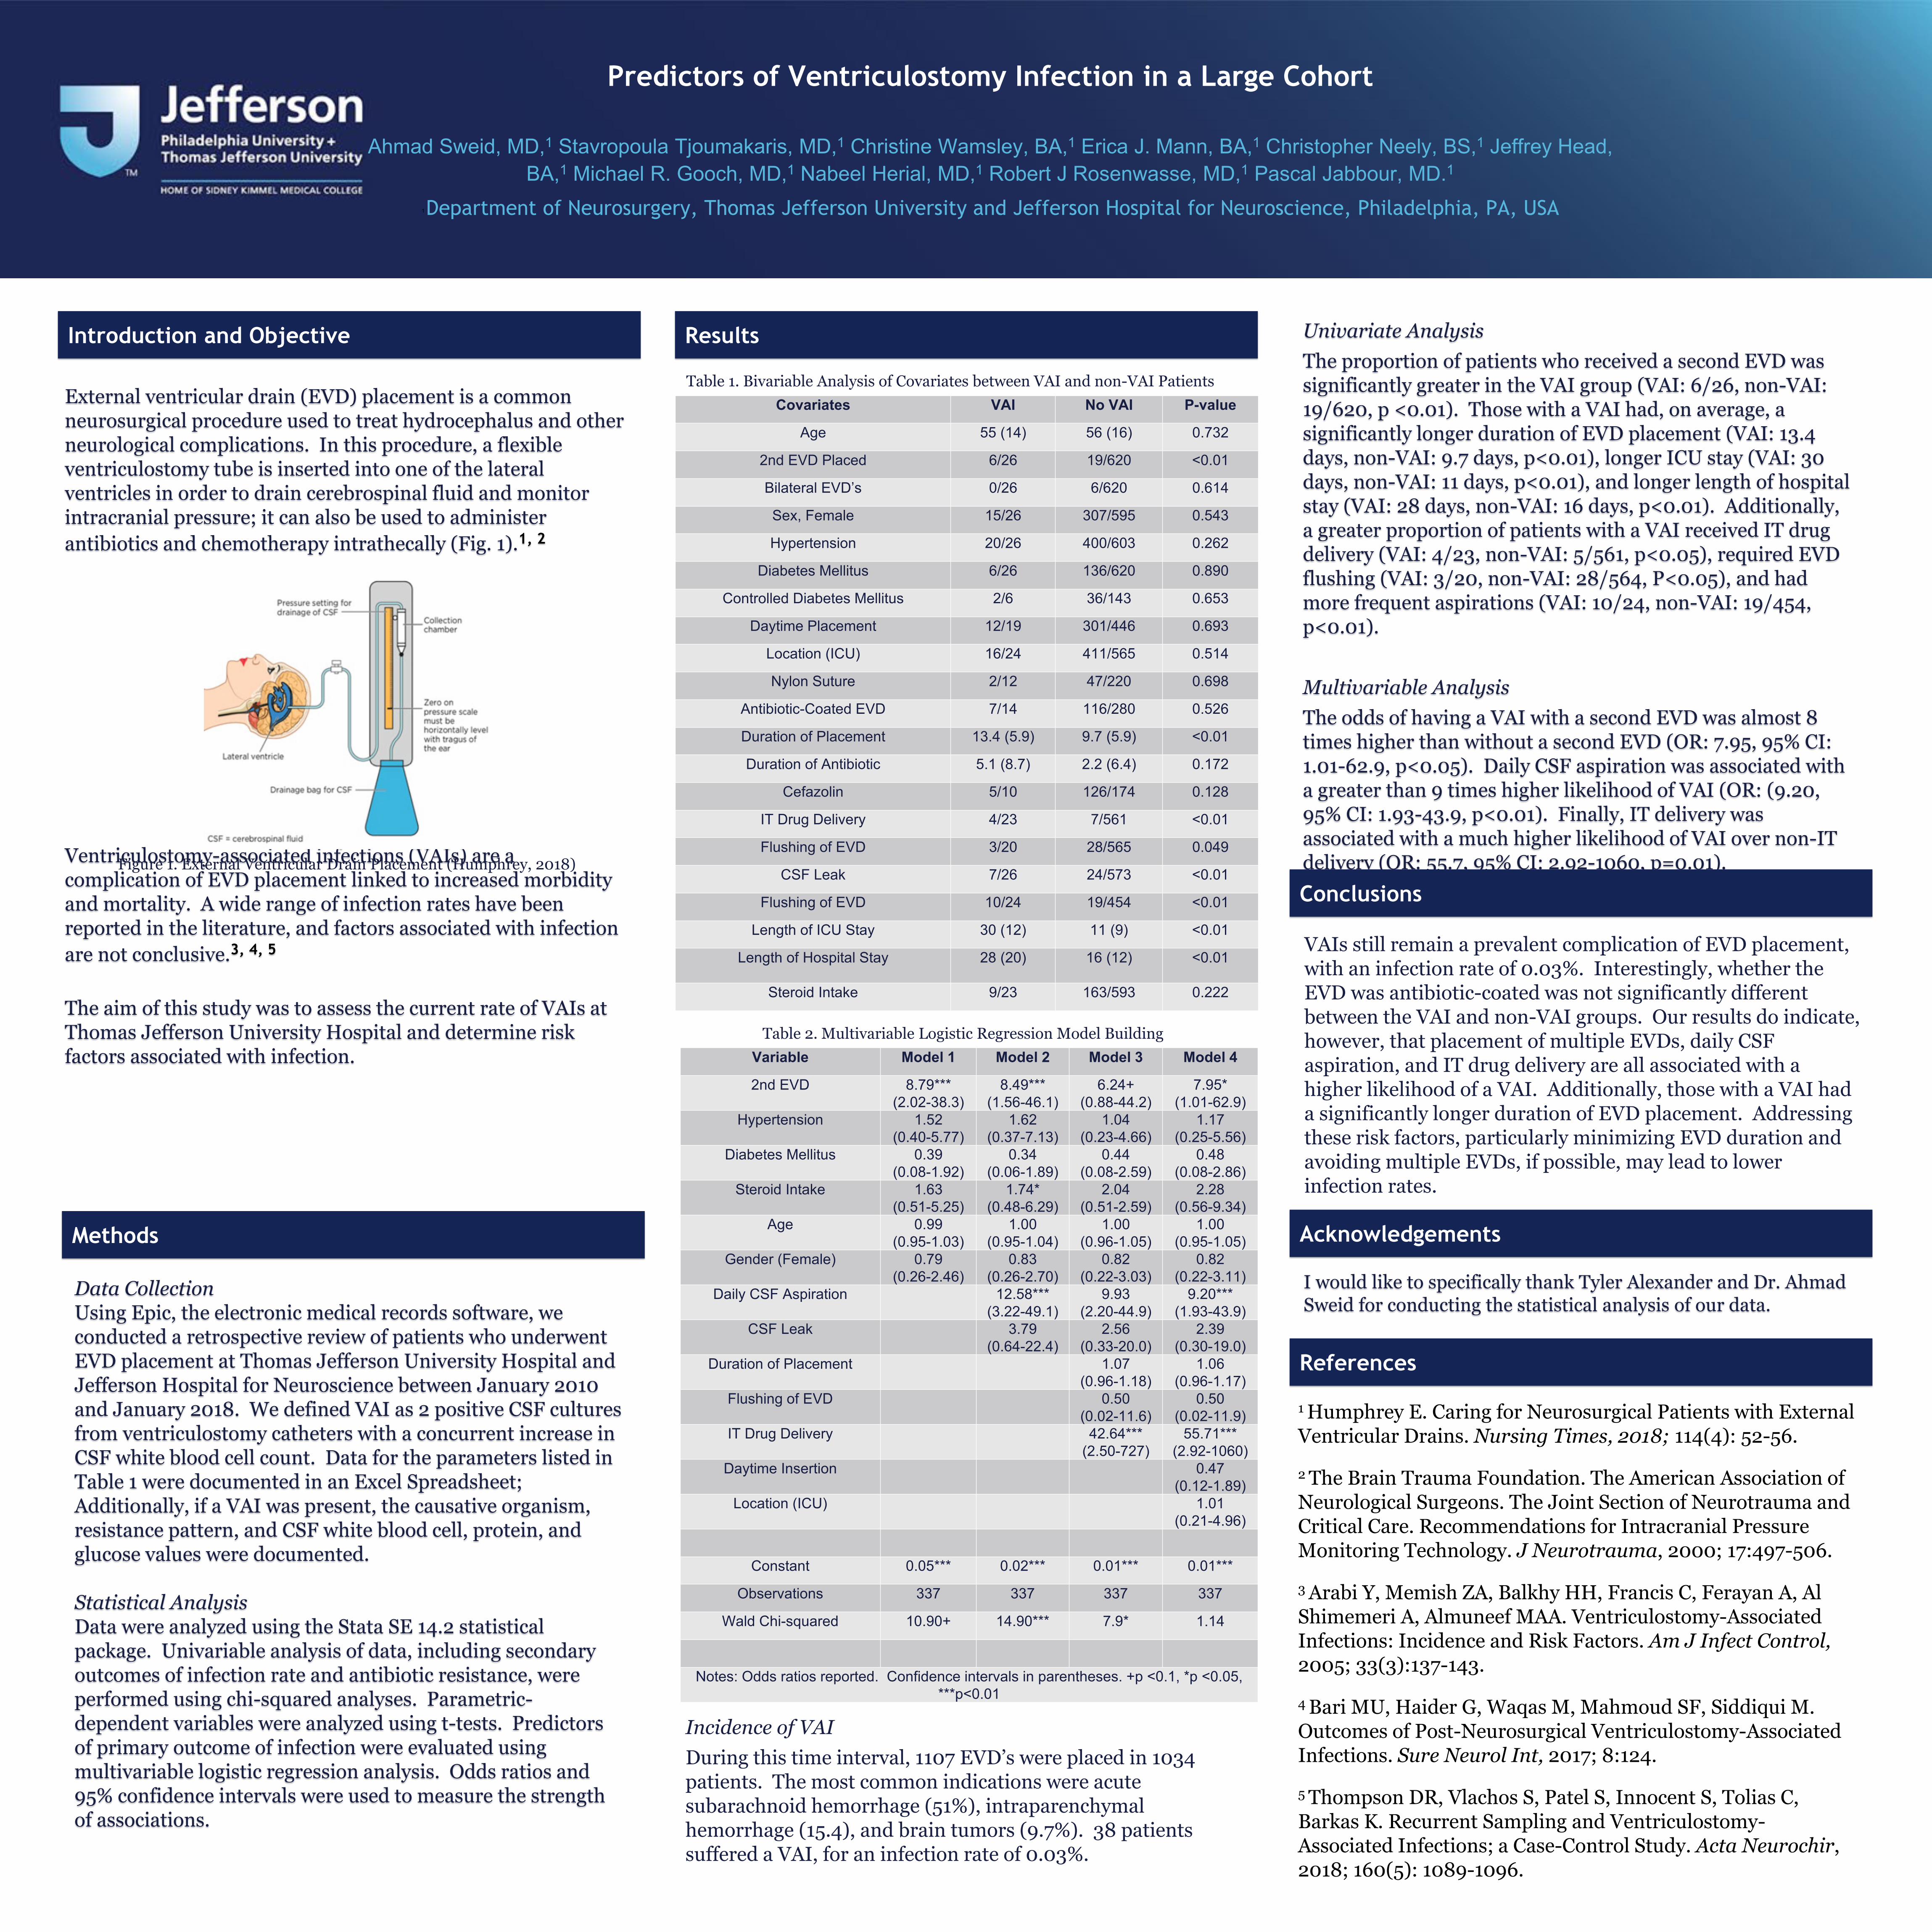
External ventricular drain (EVD) placement is a common neurosurgical procedure used to treat hydrocephalus and other neurological complications. In this procedure, a flexible ventriculostomy tube is inserted into one of the lateral ventricles in order to drain cerebrospinal fluid and monitor intracranial pressure; it can also be used to administer antibiotics and chemotherapy intrathecally (Fig. 1).1, 2
Ventriculostomy-associated infections (VAIs) are a complication of EVD placement linked to increased morbidity and mortality. A wide range of infection rates have been reported in the literature, and factors associated with infection are not conclusive.3, 4, 5
The aim of this study was to assess the current rate of VAIs at Thomas Jefferson University Hospital and determine risk factors associated with infection.
Results Univariate AnalysisThe proportion of patients who received a second EVD was significantly greater in the VAI group (VAI: 6/26, non-VAI: 19/620, p <0.01). Those with a VAI had, on average, a significantly longer duration of EVD placement (VAI: 13.4 days, non-VAI: 9.7 days, p<0.01), longer ICU stay (VAI: 30 days, non-VAI: 11 days, p<0.01), and longer length of hospital stay (VAI: 28 days, non-VAI: 16 days, p<0.01). Additionally, a greater proportion of patients with a VAI received IT drug delivery (VAI: 4/23, non-VAI: 5/561, p<0.05), required EVD flushing (VAI: 3/20, non-VAI: 28/564, P<0.05), and had more frequent aspirations (VAI: 10/24, non-VAI: 19/454, p<0.01).
Multivariable AnalysisThe odds of having a VAI with a second EVD was almost 8 times higher than without a second EVD (OR: 7.95, 95% CI: 1.01-62.9, p<0.05). Daily CSF aspiration was associated with a greater than 9 times higher likelihood of VAI (OR: (9.20, 95% CI: 1.93-43.9, p<0.01). Finally, IT delivery was associated with a much higher likelihood of VAI over non-IT delivery (OR: 55.7, 95% CI: 2.92-1060, p=0.01).
Conclusions
Acknowledgements
VAIs still remain a prevalent complication of EVD placement, with an infection rate of 0.03%. Interestingly, whether the EVD was antibiotic-coated was not significantly different between the VAI and non-VAI groups. Our results do indicate, however, that placement of multiple EVDs, daily CSF aspiration, and IT drug delivery are all associated with a higher likelihood of a VAI. Additionally, those with a VAI had a significantly longer duration of EVD placement. Addressing these risk factors, particularly minimizing EVD duration and avoiding multiple EVDs, if possible, may lead to lower infection rates.
Predictors of Ventriculostomy Infection in a Large Cohort
Ahmad Sweid, MD,1 Stavropoula Tjoumakaris, MD,1 Christine Wamsley, BA,1 Erica J. Mann, BA,1 Christopher Neely, BS,1 Jeffrey Head, BA,1 Michael R. Gooch, MD,1 Nabeel Herial, MD,1 Robert J Rosenwasse, MD,1 Pascal Jabbour, MD.1
1 Department of Neurosurgery, Thomas Jefferson University and Jefferson Hospital for Neuroscience, Philadelphia, PA, USA
References
Methods
Data CollectionUsing Epic, the electronic medical records software, we conducted a retrospective review of patients who underwent EVD placement at Thomas Jefferson University Hospital and Jefferson Hospital for Neuroscience between January 2010 and January 2018. We defined VAI as 2 positive CSF cultures from ventriculostomy catheters with a concurrent increase in CSF white blood cell count. Data for the parameters listed in Table 1 were documented in an Excel Spreadsheet; Additionally, if a VAI was present, the causative organism, resistance pattern, and CSF white blood cell, protein, and glucose values were documented.
Statistical AnalysisData were analyzed using the Stata SE 14.2 statistical package. Univariable analysis of data, including secondary outcomes of infection rate and antibiotic resistance, were performed using chi-squared analyses. Parametric-dependent variables were analyzed using t-tests. Predictors of primary outcome of infection were evaluated using multivariable logistic regression analysis. Odds ratios and 95% confidence intervals were used to measure the strength of associations.
1 Humphrey E. Caring for Neurosurgical Patients with External Ventricular Drains. Nursing Times, 2018; 114(4): 52-56.
2 The Brain Trauma Foundation. The American Association of Neurological Surgeons. The Joint Section of Neurotrauma and Critical Care. Recommendations for Intracranial Pressure Monitoring Technology. J Neurotrauma, 2000; 17:497-506.
3 Arabi Y, Memish ZA, Balkhy HH, Francis C, Ferayan A, Al Shimemeri A, Almuneef MAA. Ventriculostomy-Associated Infections: Incidence and Risk Factors. Am J Infect Control,2005; 33(3):137-143.
4 Bari MU, Haider G, Waqas M, Mahmoud SF, Siddiqui M. Outcomes of Post-Neurosurgical Ventriculostomy-Associated Infections. Sure Neurol Int, 2017; 8:124.
5 Thompson DR, Vlachos S, Patel S, Innocent S, Tolias C, Barkas K. Recurrent Sampling and Ventriculostomy-Associated Infections; a Case-Control Study. Acta Neurochir, 2018; 160(5): 1089-1096.
I would like to specifically thank Tyler Alexander and Dr. Ahmad Sweid for conducting the statistical analysis of our data.
Figure 1. External Ventricular Drain Placement (Humphrey, 2018)
Covariates VAI No VAI P-value
Age 55 (14) 56 (16) 0.732
2nd EVD Placed 6/26 19/620 <0.01
Bilateral EVD’s 0/26 6/620 0.614
Sex, Female 15/26 307/595 0.543
Hypertension 20/26 400/603 0.262
Diabetes Mellitus 6/26 136/620 0.890
Controlled Diabetes Mellitus 2/6 36/143 0.653
Daytime Placement 12/19 301/446 0.693
Location (ICU) 16/24 411/565 0.514
Nylon Suture 2/12 47/220 0.698
Antibiotic-Coated EVD 7/14 116/280 0.526
Duration of Placement 13.4 (5.9) 9.7 (5.9) <0.01
Duration of Antibiotic 5.1 (8.7) 2.2 (6.4) 0.172
Cefazolin 5/10 126/174 0.128
IT Drug Delivery 4/23 7/561 <0.01
Flushing of EVD 3/20 28/565 0.049
CSF Leak 7/26 24/573 <0.01
Flushing of EVD 10/24 19/454 <0.01
Length of ICU Stay 30 (12) 11 (9) <0.01
Length of Hospital Stay 28 (20) 16 (12) <0.01
Steroid Intake 9/23 163/593 0.222
Table 1. Bivariable Analysis of Covariates between VAI and non-VAI Patients
Variable Model 1 Model 2 Model 3 Model 4
2nd EVD 8.79***(2.02-38.3)
8.49***(1.56-46.1)
6.24+(0.88-44.2)
7.95*(1.01-62.9)
Hypertension 1.52(0.40-5.77)
1.62(0.37-7.13)
1.04(0.23-4.66)
1.17(0.25-5.56)
Diabetes Mellitus 0.39(0.08-1.92)
0.34(0.06-1.89)
0.44(0.08-2.59)
0.48(0.08-2.86)
Steroid Intake 1.63(0.51-5.25)
1.74*(0.48-6.29)
2.04(0.51-2.59)
2.28(0.56-9.34)
Age 0.99(0.95-1.03)
1.00(0.95-1.04)
1.00(0.96-1.05)
1.00(0.95-1.05)
Gender (Female) 0.79(0.26-2.46)
0.83(0.26-2.70)
0.82(0.22-3.03)
0.82(0.22-3.11)
Daily CSF Aspiration 12.58***(3.22-49.1)
9.93(2.20-44.9)
9.20***(1.93-43.9)
CSF Leak 3.79(0.64-22.4)
2.56(0.33-20.0)
2.39(0.30-19.0)
Duration of Placement 1.07(0.96-1.18)
1.06(0.96-1.17)
Flushing of EVD 0.50(0.02-11.6)
0.50(0.02-11.9)
IT Drug Delivery 42.64***(2.50-727)
55.71***(2.92-1060)
Daytime Insertion 0.47(0.12-1.89)
Location (ICU) 1.01(0.21-4.96)
Constant 0.05*** 0.02*** 0.01*** 0.01***
Observations 337 337 337 337
Wald Chi-squared 10.90+ 14.90*** 7.9* 1.14
Notes: Odds ratios reported. Confidence intervals in parentheses. +p <0.1, *p <0.05, ***p<0.01
Table 2. Multivariable Logistic Regression Model Building
Incidence of VAIDuring this time interval, 1107 EVD’s were placed in 1034 patients. The most common indications were acute subarachnoid hemorrhage (51%), intraparenchymal hemorrhage (15.4), and brain tumors (9.7%). 38 patients suffered a VAI, for an infection rate of 0.03%.