predictive system performance data analysis
TRANSCRIPT
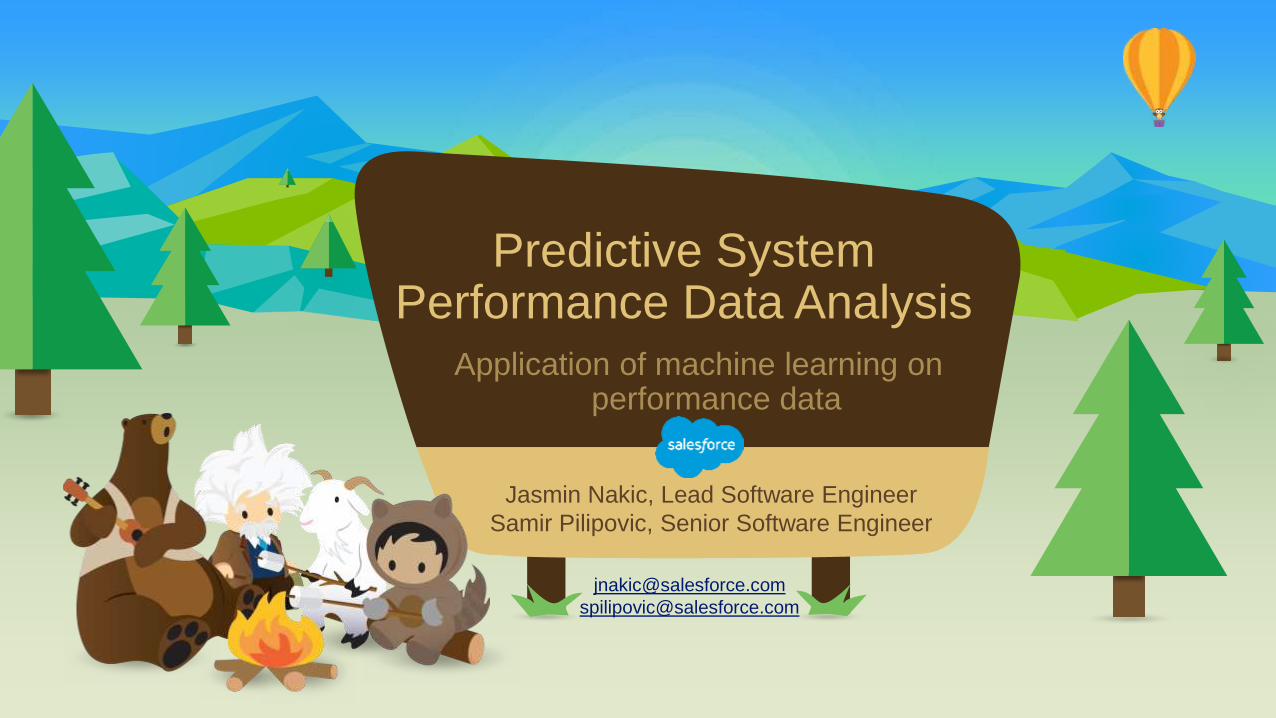
Predictive System Performance Data Analysis
Application of machine learning on performance data
Jasmin Nakic, Lead Software Engineer
Samir Pilipovic, Senior Software Engineer
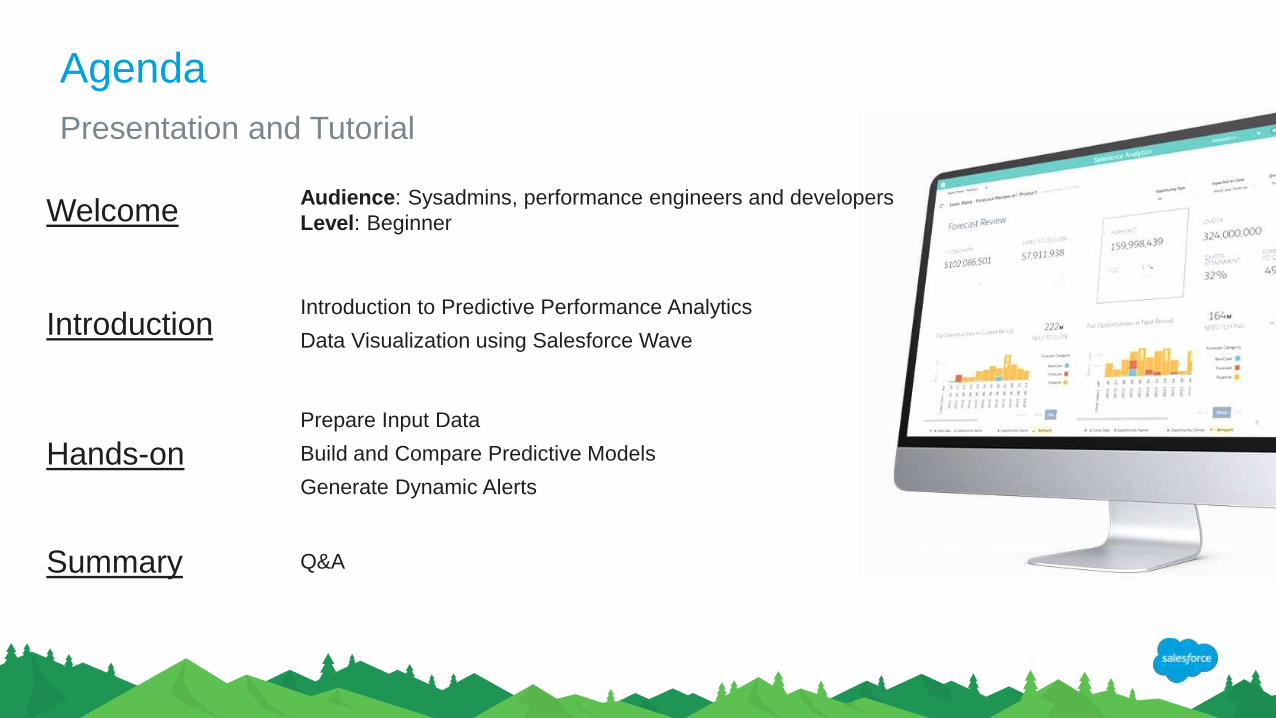
Agenda
Presentation and Tutorial
WelcomeAudience: Sysadmins, performance engineers and developers
Level: Beginner
IntroductionIntroduction to Predictive Performance Analytics
Data Visualization using Salesforce Wave
Hands-on
Prepare Input Data
Build and Compare Predictive Models
Generate Dynamic Alerts
Summary Q&A
Forward-Looking Statements
Statement under the Private Securities Litigation Reform Act of 1995:
This presentation may contain forward-looking statements that involve risks, uncertainties, and assumptions. If any such uncertainties materialize or if any
of the assumptions proves incorrect, the results of salesforce.com, inc. could differ materially from the results expressed or implied by the forward-looking
statements we make. All statements other than statements of historical fact could be deemed forward-looking, including any projections of product or
service availability, subscriber growth, earnings, revenues, or other financial items and any statements regarding strategies or plans of management for
future operations, statements of belief, any statements concerning new, planned, or upgraded services or technology developments and customer contracts
or use of our services.
The risks and uncertainties referred to above include – but are not limited to – risks associated with developing and delivering new functionality for our
service, new products and services, our new business model, our past operating losses, possible fluctuations in our operating results and rate of growth,
interruptions or delays in our Web hosting, breach of our security measures, the outcome of any litigation, risks associated with completed and any possible
mergers and acquisitions, the immature market in which we operate, our relatively limited operating history, our ability to expand, retain, and motivate our
employees and manage our growth, new releases of our service and successful customer deployment, our limited history reselling non-salesforce.com
products, and utilization and selling to larger enterprise customers. Further information on potential factors that could affect the financial results of
salesforce.com, inc. is included in our annual report on Form 10-K for the most recent fiscal year and in our quarterly report on Form 10-Q for the most
recent fiscal quarter. These documents and others containing important disclosures are available on the SEC Filings section of the Investor Information
section of our Web site.
Any unreleased services or features referenced in this or other presentations, press releases or public statements are not currently available and may not
be delivered on time or at all. Customers who purchase our services should make the purchase decisions based upon features that are currently available.
Salesforce.com, inc. assumes no obligation and does not intend to update these forward-looking statements.
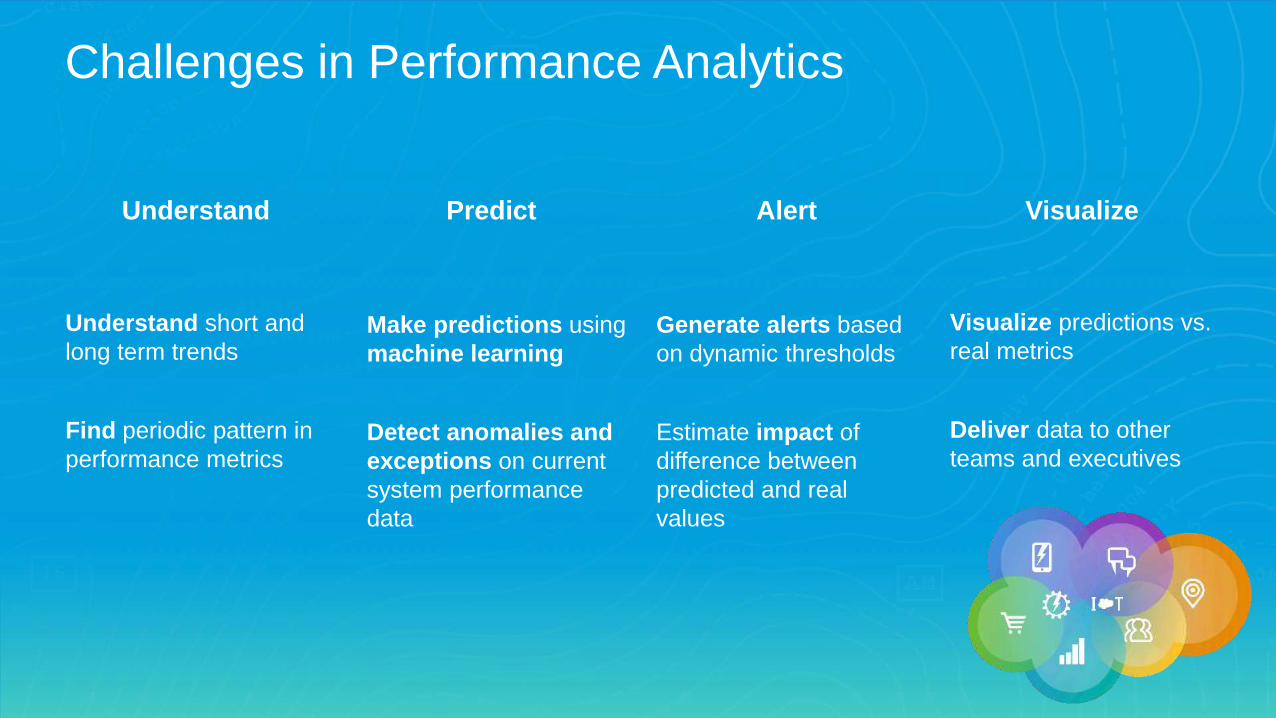
Challenges in Performance Analytics
Understand
Make predictions using
machine learning
Detect anomalies and
exceptions on current
system performance
data
Generate alerts based
on dynamic thresholds
Estimate impact of
difference between
predicted and real
values
Visualize predictions vs.
real metrics
Deliver data to other
teams and executives
Predict Alert Visualize
Understand short and
long term trends
Find periodic pattern in
performance metrics
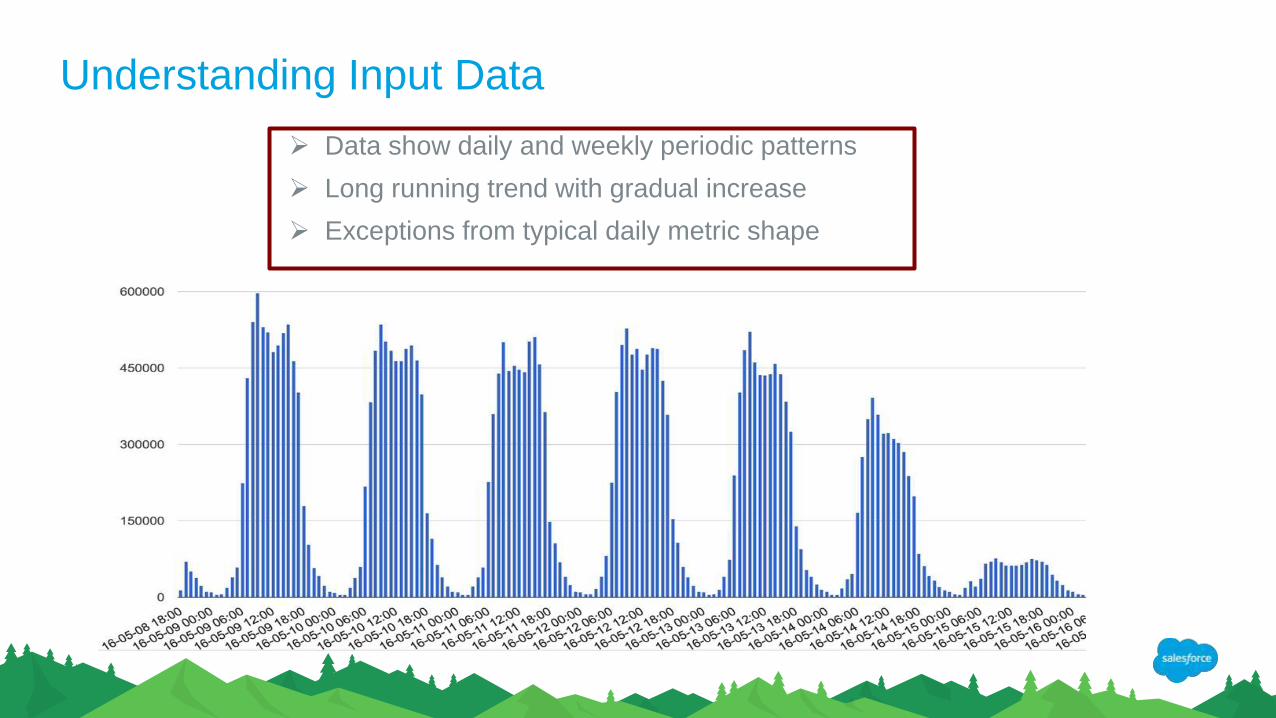
Understanding Input Data
Data show daily and weekly periodic patterns
Long running trend with gradual increase
Exceptions from typical daily metric shape
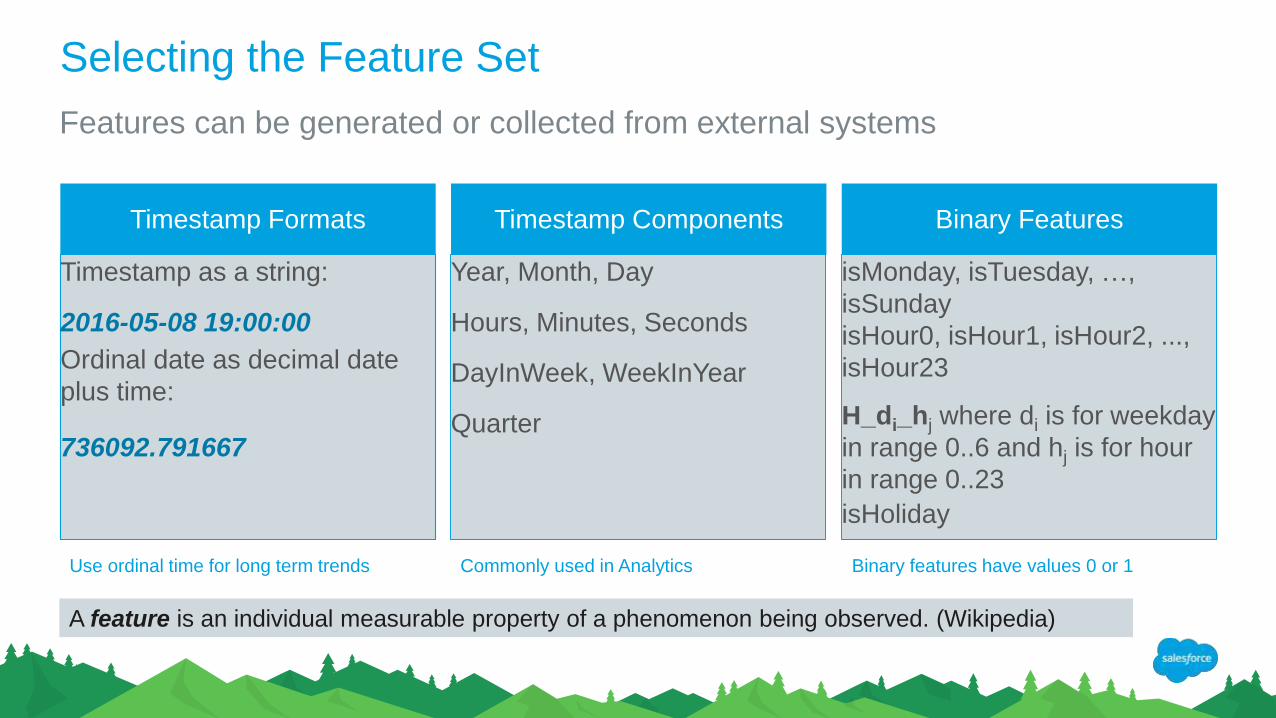
Selecting the Feature Set
Features can be generated or collected from external systems
Timestamp as a string:
2016-05-08 19:00:00
Ordinal date as decimal date
plus time:
736092.791667
Year, Month, Day
Hours, Minutes, Seconds
DayInWeek, WeekInYear
Quarter
isMonday, isTuesday, …,
isSunday
isHour0, isHour1, isHour2, ...,
isHour23
H_di_hj where di is for weekday
in range 0..6 and hj is for hour
in range 0..23
isHoliday
Timestamp Formats Timestamp Components Binary Features
Binary features have values 0 or 1Use ordinal time for long term trends Commonly used in Analytics
A feature is an individual measurable property of a phenomenon being observed. (Wikipedia)
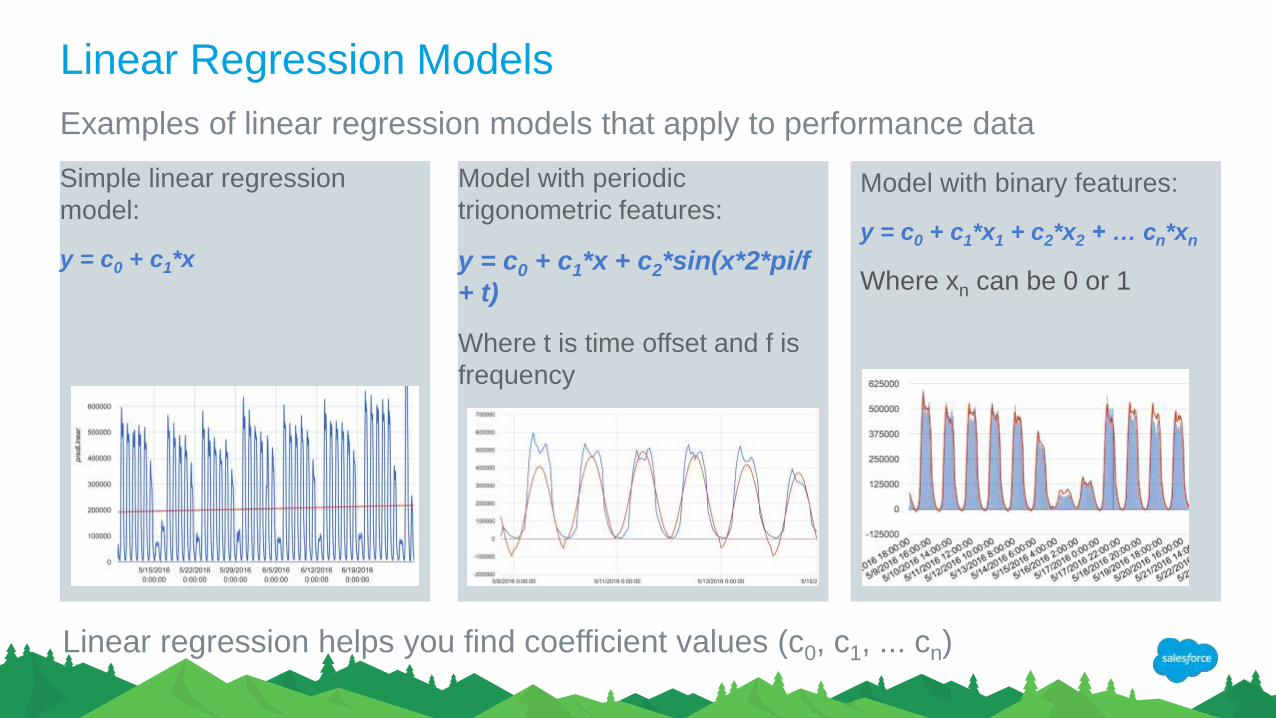
Linear Regression Models
Examples of linear regression models that apply to performance data
Simple linear regression
model:
y = c0 + c1*x
Model with periodic
trigonometric features:
y = c0 + c1*x + c2*sin(x*2*pi/f
+ t)
Where t is time offset and f is
frequency
Model with binary features:
y = c0 + c1*x1 + c2*x2 + … cn*xn
Where xn can be 0 or 1
Linear regression helps you find coefficient values (c0, c1, ... cn)
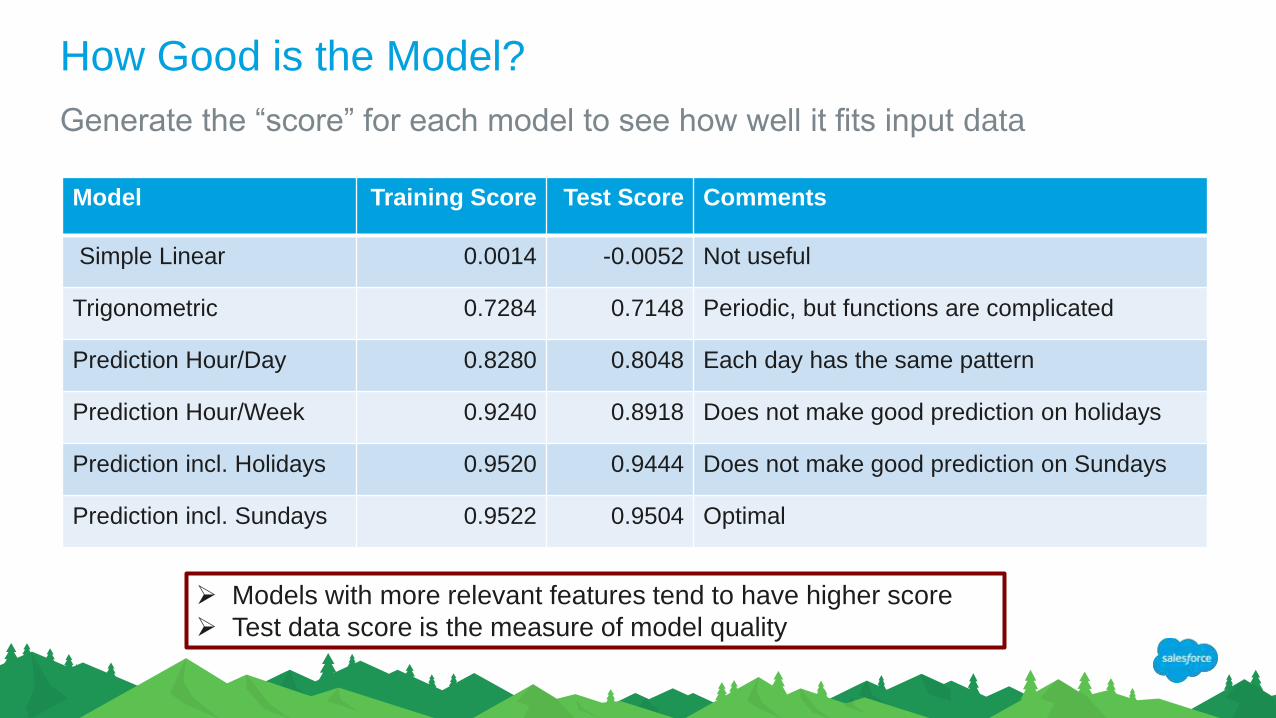
How Good is the Model?
Generate the “score” for each model to see how well it fits input data
Model Training Score Test Score Comments
Simple Linear 0.0014 -0.0052 Not useful
Trigonometric 0.7284 0.7148 Periodic, but functions are complicated
Prediction Hour/Day 0.8280 0.8048 Each day has the same pattern
Prediction Hour/Week 0.9240 0.8918 Does not make good prediction on holidays
Prediction incl. Holidays 0.9520 0.9444 Does not make good prediction on Sundays
Prediction incl. Sundays 0.9522 0.9504 Optimal
Models with more relevant features tend to have higher score
Test data score is the measure of model quality
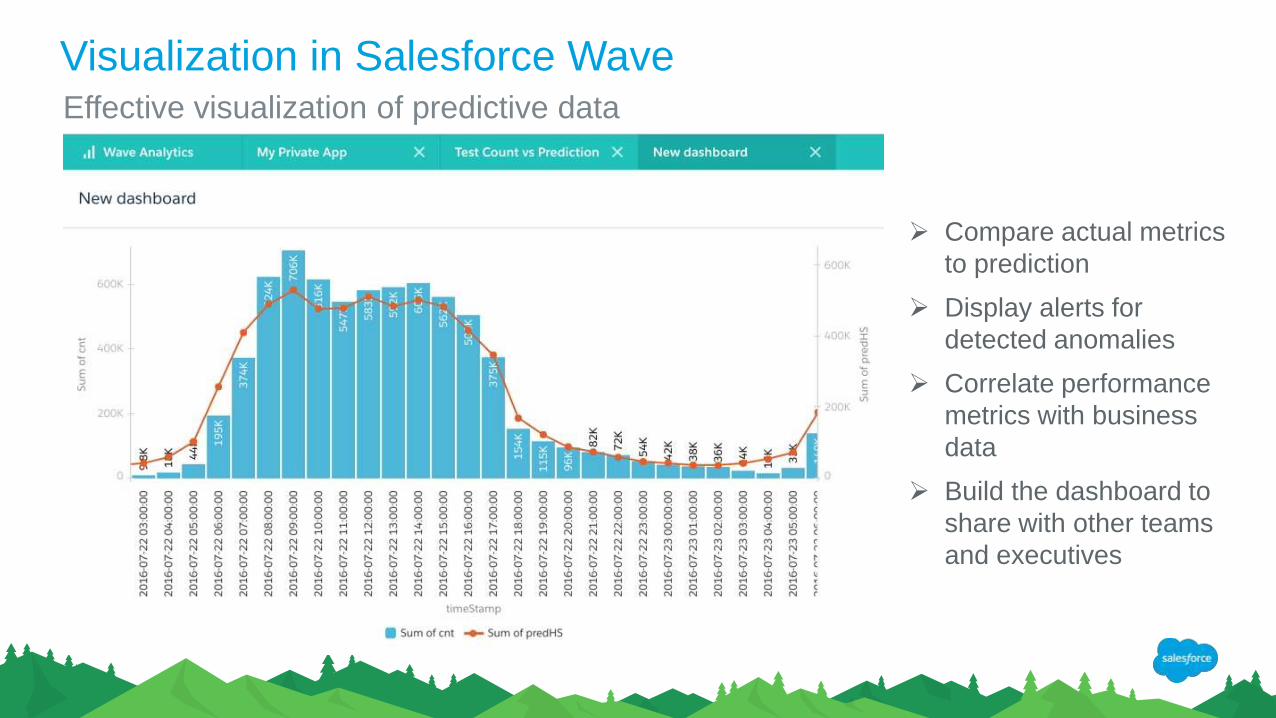
Visualization in Salesforce WaveEffective visualization of predictive data
Compare actual metrics
to prediction
Display alerts for
detected anomalies
Correlate performance
metrics with business
data
Build the dashboard to
share with other teams
and executives
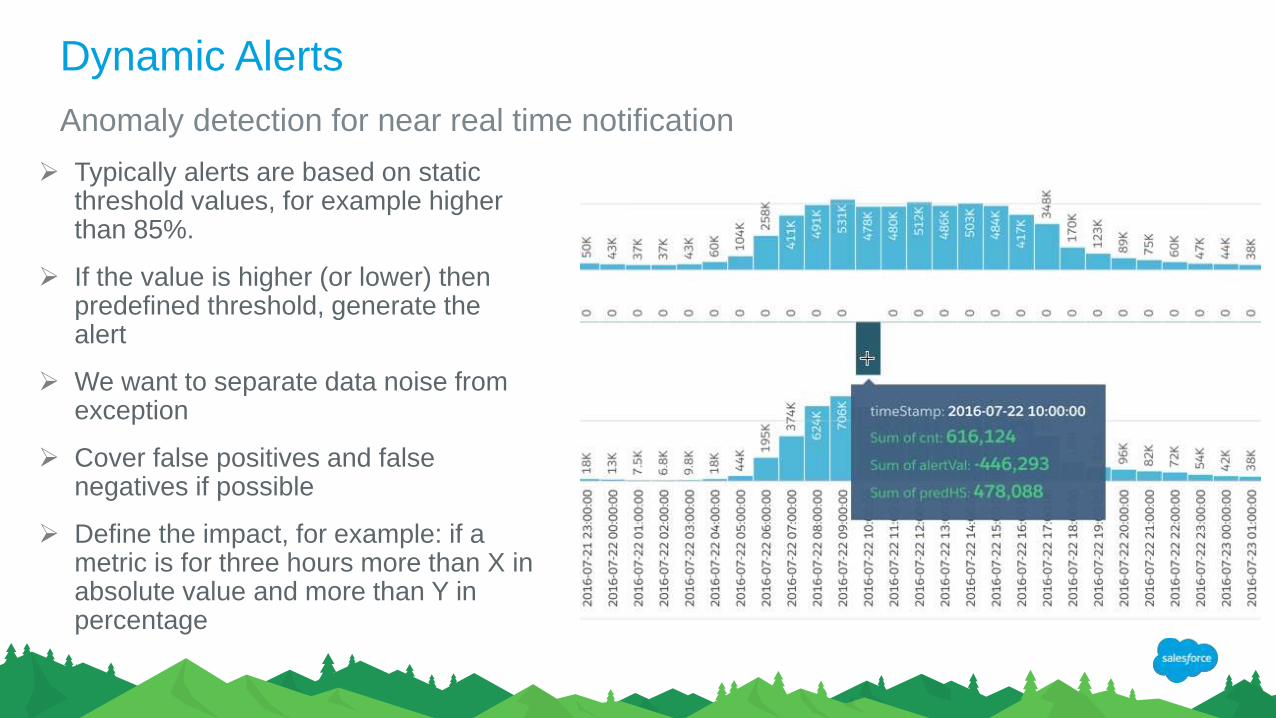
Dynamic Alerts
Anomaly detection for near real time notification
Typically alerts are based on static threshold values, for example higher than 85%.
If the value is higher (or lower) then predefined threshold, generate the alert
We want to separate data noise from exception
Cover false positives and false negatives if possible
Define the impact, for example: if a metric is for three hours more than X in absolute value and more than Y in percentage
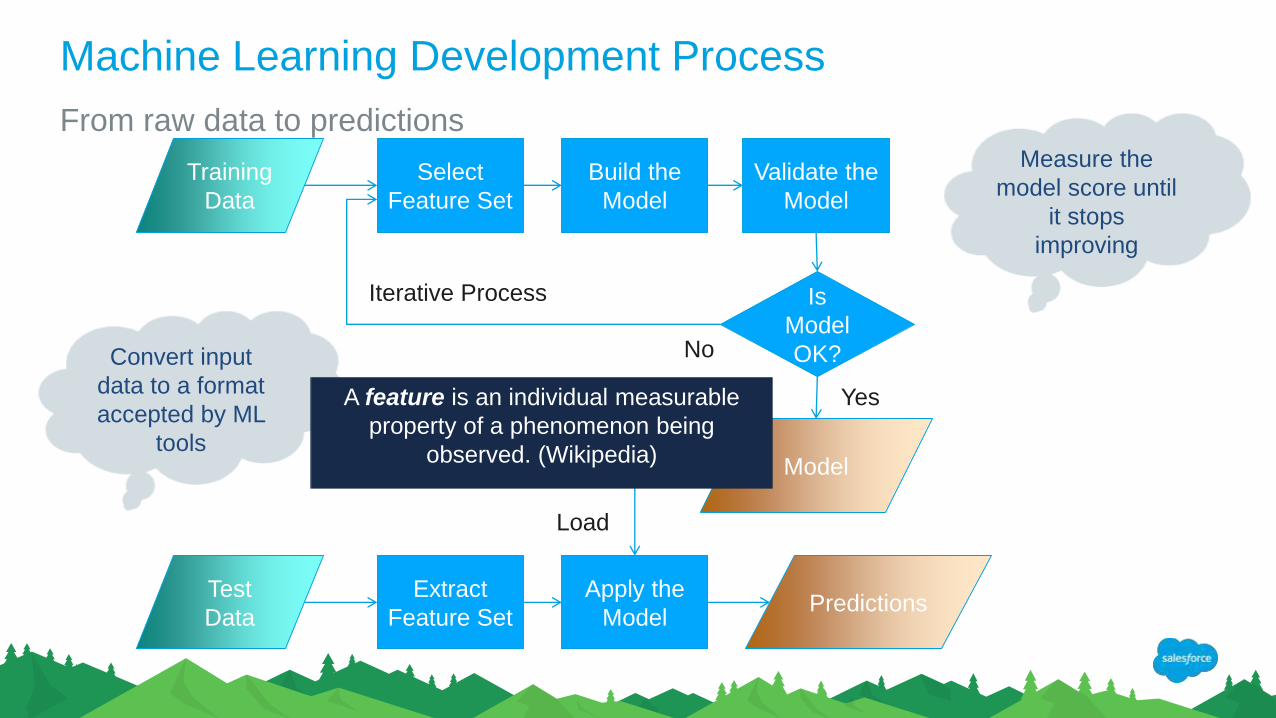
Machine Learning Development Process
From raw data to predictions
Select
Feature Set
Build the
Model
Validate the
Model
Is
Model
OK?
Model
Extract
Feature Set
Apply the
Model
Training
Data
Test
DataPredictions
Yes
No
Iterative Process
Convert input
data to a format
accepted by ML
tools
Measure the
model score until
it stops
improving
Load
A feature is an individual measurable
property of a phenomenon being
observed. (Wikipedia)
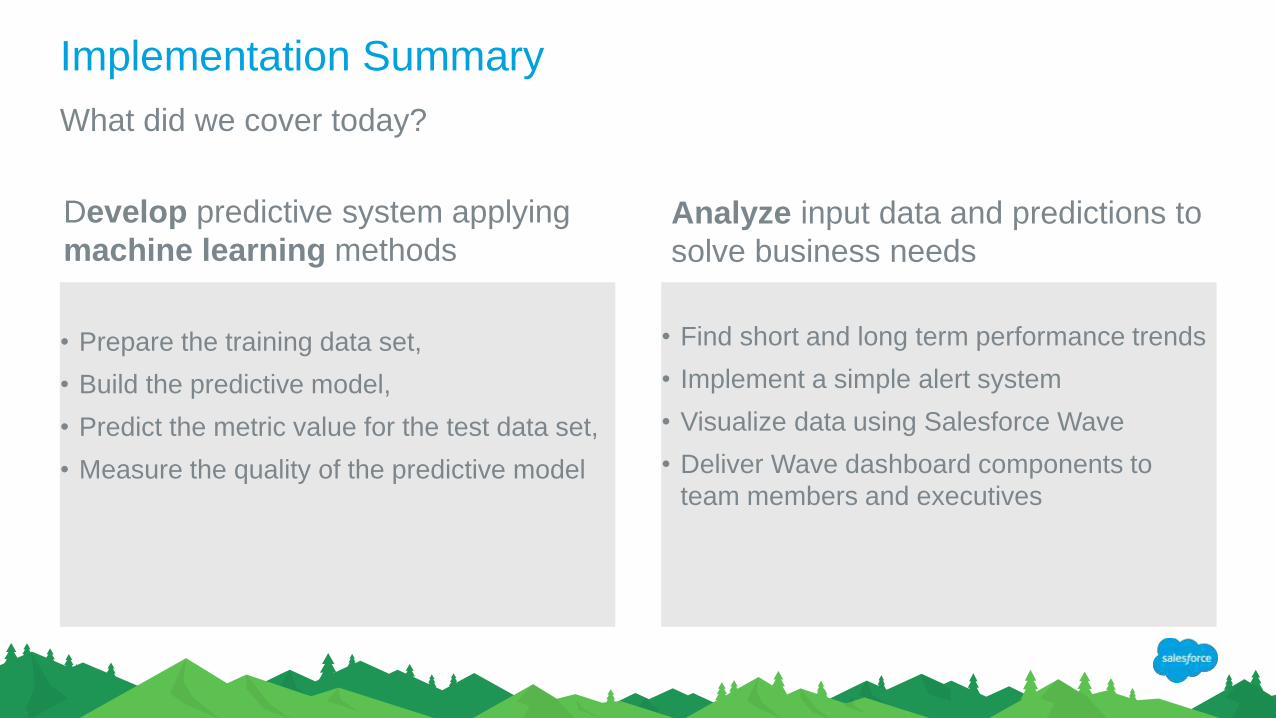
Implementation Summary
What did we cover today?
• Prepare the training data set,
• Build the predictive model,
• Predict the metric value for the test data set,
• Measure the quality of the predictive model
• Find short and long term performance trends
• Implement a simple alert system
• Visualize data using Salesforce Wave
• Deliver Wave dashboard components to
team members and executives
Develop predictive system applying
machine learning methodsAnalyze input data and predictions to
solve business needs
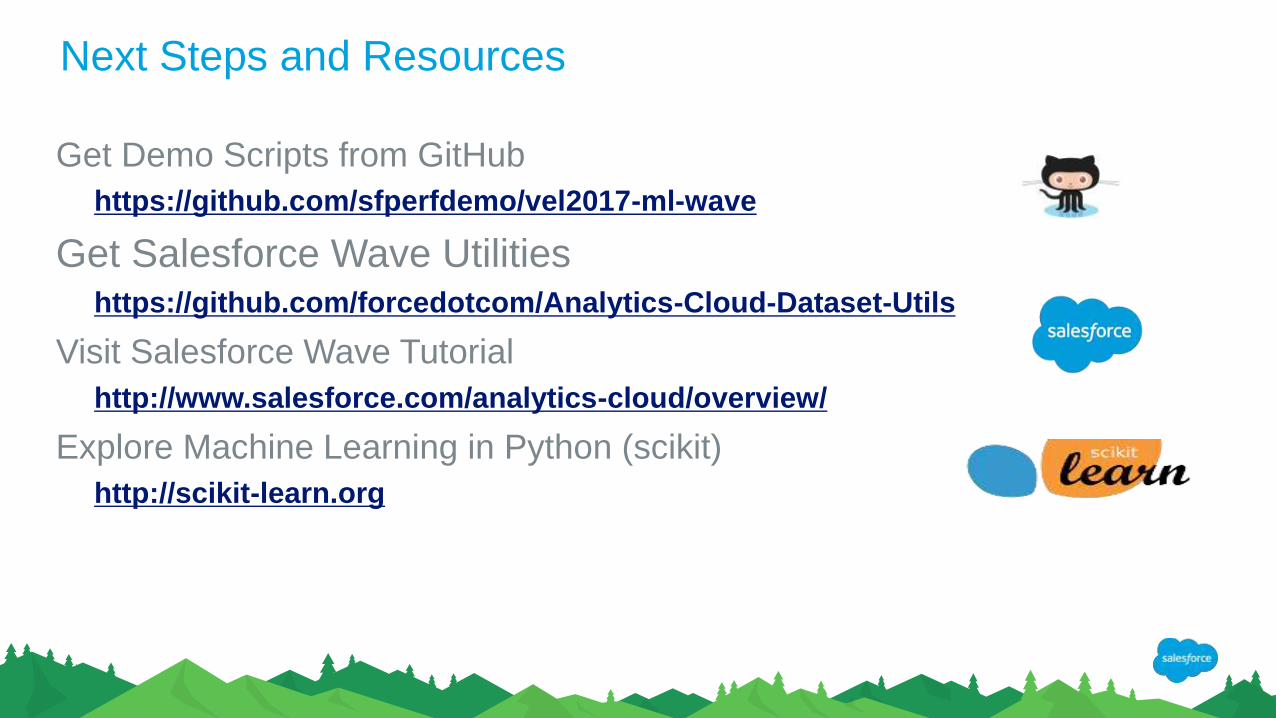
Next Steps and Resources
Get Demo Scripts from GitHub
https://github.com/sfperfdemo/vel2017-ml-wave
Get Salesforce Wave Utilitieshttps://github.com/forcedotcom/Analytics-Cloud-Dataset-Utils
Visit Salesforce Wave Tutorial
http://www.salesforce.com/analytics-cloud/overview/
Explore Machine Learning in Python (scikit)
http://scikit-learn.org

Questions and Answers
