predictive performance of physical activity on …
TRANSCRIPT

PREDICTIVE PERFORMANCE OF PHYSICAL ACTIVITY ON
MORTALITY USING UK BIOBANK AND NHANES DATASETS
by
Shiyao Xu
A dissertation submitted to The Johns Hopkins University in conformity
with the requirements for the degree of Master of Science
Baltimore, Maryland
April, 2020
c⃝ Shiyao Xu 2020
All rights reserved

Abstract
The absolute and relative mortality prediction performance of objective measures of
physical activity obtained from accelerometers is quantified in the UK Biobank and
the National Health and Nutrition Examination Survey (NHANES). Studies were
analyzed separately because of differences in objective physical activity measurements
as well as in some traditional predictors of mortality. Prediction performance was
assessed using the ten-fold cross validated C (10-f-CV) index. In NHANES using
single variable Cox regression models the most predictive variable was age followed
by total activity count (TAC) and 12 other accelerometer-derived summaries. In UK
Biobank, the top five most predictive variables are accelerometer-derived summaries
with the most predictive variable being total acceleration (TA). The most predictive
non-physical activity related variable is age. Out of the top 15 predictors, 14 were
accelerometry-derived objective measurements of physical activity. Using forward
selection and a stopping rule of an increase of less than 0.001 for the 10-f-CV resulted
in a model with 10 predictors including age, active to sedentary transition probability
(ASTP), smoking status, coronary heart failure (CHF), drinking status, gender,
mobility problem, diabetes, body mass index (BMI) and education. In UK Biobank
using a similar procedure resulted in a nine-variable model including total activity
(TA), age, relative amplitude (RA), longstanding illness/disability, cigarette smoking,
injury/illness within past 2 years, gender, cancer and high blood pressure. Another
approach was to use a two-stage forward selection where first traditional predictors
were included and then accelerometer-derived physical activity summaries were included.
Using the same inclusion stopping criterion in NHANES this resulted in a 13 variable
model which included, in this order, age, mobility problem, smoking status, CHF,
drinking status, gender, diabetes, BMI, stroke, ASTP, TLAC11 and RA. In UK
Biobank the two step forward selection procedure resulted in a 10 variable model
ii

which included age, self-reported overall health, gender, cigarette smoking, longstanding
illness/disability, injury/illness within past 2 years, high blood pressure, cancer, RA,
and two-hour summary of total log activity. The analytic results in this thesis show
that accelerometer-derived physical activity summaries: (1) outperform traditional
risk factors in terms of mortality prediction performance; and (2) improve prediction
performance in addition to traditional risk factors. Possible reasons for the differences
and similarities between the results from NHANES and UK Biobank are provided.
Primary Reader: Ciprian Crainiceanu
Secondary Reader: Vadim Zipunnikov
iii

Acknowledgements
I wish to express my sincere appreciation to my academic advisor Professor Ciprian
Crainiceanu, who has guided me through research with patience and extensive knowledge
for the field. He has motivated and encourage me to be the best researcher and to
not give up when encounter difficulties. I have learned a lot from his expertise in
wearable technology and his passion for science. Without his persistent help, this
thesis would not have achieve the goal as it has now.
I wish to acknowledge Professor Vadim Zipunnikov who is the second reader of
this thesis, for his valuable comments on this thesis, and his help during this project.
I am grateful for the chance to work with and learn from excellent researcher as him.
I would also like to thank Andrew Leroux, who have lead me through my first
research project. I have learned so much from this project and I would not have
improved as much without his help. I would like to recognize the invaluable assistance
of John Muschelli, Erjia Cui and other members of the Wearable and Implantable
Technology (WIT) group with this research project.
iv

Contents
1 Introduction 1
2 Methods 3
2.1 Data . . . . . . . . . . . . . . . . . . . . . . . . . . . . . . . . . . . . 3
2.1.1 UK Biobank . . . . . . . . . . . . . . . . . . . . . . . . . . . . 3
2.1.2 NHANES . . . . . . . . . . . . . . . . . . . . . . . . . . . . . 5
2.2 Study Population . . . . . . . . . . . . . . . . . . . . . . . . . . . . . 8
2.3 Accelerometer derived physical activity variables . . . . . . . . . . . . 8
2.3.1 UK Biobank . . . . . . . . . . . . . . . . . . . . . . . . . . . . 8
2.3.2 NHANES . . . . . . . . . . . . . . . . . . . . . . . . . . . . . 10
2.4 Statistical Analysis . . . . . . . . . . . . . . . . . . . . . . . . . . . . 11
3 Results 13
3.1 Exploratory data analysis . . . . . . . . . . . . . . . . . . . . . . . . 13
3.1.1 Minute-level raw data . . . . . . . . . . . . . . . . . . . . . . 13
3.1.2 Exploratory sub-group analyses . . . . . . . . . . . . . . . . . 16
3.1.3 Visualization of some distributions of physical activity summaries 19
3.2 Prediction Model . . . . . . . . . . . . . . . . . . . . . . . . . . . . . 22
3.2.1 Prediction models in NHANES . . . . . . . . . . . . . . . . . 25
3.2.2 Prediction models in UK Biobank . . . . . . . . . . . . . . . . 30
4 Discussion 34
S1 Appendix 39
S1.1 Dictionary . . . . . . . . . . . . . . . . . . . . . . . . . . . . . . . . . 39
v

S1.2 Visualization of physical activity summaries . . . . . . . . . . . . . . 39
vi

List of Tables
1 Comparison of covariates between entire UK Biobank population and
four subgroups of the accelerometry sub-study. . . . . . . . . . . . . . 6
2 Summary statistics for non-activity-related variables among alive and
deceased participants for UK Biobank and NHANES. . . . . . . . . . 24
3 Summary statistics for activity-related variables among alive and deceased
participants for UK Biobank and NHANES. . . . . . . . . . . . . . . 25
4 Univariate complex survey design Cox regression results comparing
activity-related and traditional mortality predictors using NHANES
2003-2006 data. Variables are ranked from the highest to lowest ten-
fold cross-validated Concordance. . . . . . . . . . . . . . . . . . . . . 27
5 Forward selection results for activity-related and traditional mortality
predictors using NHANES 2003-2006 data, with time-to-death as outcome.
Stopping rules for variable selection are ∆C≥ 0.01 and ∆C≥ 0.001 . . 29
6 Results for the two-stage forward selection of mortality risk using
NHANES 2003-2006. The first stage performed forward selection on
traditional mortality predictors. The second stage started with the
final model from the first stage and added accelerometry-derived physical
activity summaries. Variables were included as long as either ∆C≥
0.01 or ∆C≥ 0.001 . . . . . . . . . . . . . . . . . . . . . . . . . . . . 31
7 Univariate Cox regression results on activity-related and non-activity
related mortality predictors using UK Biobank data. Variables are
ranked from the highest to lowest ten-fold cross-validated Concordance. 32
8 Forward selection results on activity-related and traditional mortality
predictors using UK Biobank data, with outcome of interest as time-to-
death. Stopping rules for variable selection are ∆C≥ 0.01 and ∆C≥ 0.001 33
vii

9 Results for the two-stage forward selection of mortality risk using UK
Biobank. The first stage performed forward selection on traditional
mortality predictors. The second stage started with the final model
from the first stage and added accelerometry-derived physical activity
summaries. Variables were included as long as either ∆C≥ 0.01 or
∆C≥ 0.001 . . . . . . . . . . . . . . . . . . . . . . . . . . . . . . . . 35
S1 Description and formula to derive activity-related variables. . . . . . 39
viii

List of Figures
1 Left panels: minute-level daily activity count trajectories for one study
participant in the NHANES 2003-2005 dataset. Right panels: minute-
level daily ENMO averages for one study participant in the UK Biobank
dataset. The x-axis in each panel is time from midnight to midnight.
The y-axis is expressed in Actigraph activity counts for NHANES and
in milli-gs for UK Biobank. . . . . . . . . . . . . . . . . . . . . . . . . 14
2 Left panels: Visualization of activity data during day of the week in the
NHANES 2003-2005 dataset. Right panels: Visualization of activity
data during day of the week in the UK Biobank dataset. The x-axis in
each panel is time from midnight to midnight. The y-axis is expressed
in Actigraph activity counts for NHANES and in milli-gs for UK Biobank. 15
3 Subgroup visualization of activity data in the NHANES 2003-2005.
Left panel: Mean log activity count trajectory comparing deceased (red
solid line, N = 783) and alive (blue solid line, N = 2195) subgroups.
For illustration purposes, the mean log(1+activity count) is plotted as
five-minute window averages. Pointwise confidence intervals for each
average are shown as shaded areas with corresponding colors for each
curve. Right panel: Kaplan-Meier survival curves stratified by the
quartiles of the TLAC distribution. Plots do not account for survey
weights and sampling design. . . . . . . . . . . . . . . . . . . . . . . 16
ix

4 Subgroup visualization of activity data in the UK Biobank. Left panel:
Mean log(1+average ENMO) trajectory comparing deceased (red solid
line, N = 849) and alive (blue solid line, N = 81, 455) subgroups. For
illustration purposes, the mean log(1+average ENMO) is plotted as
five-minute window averages. Pointwise confidence intervals for each
average are shown as shaded areas with corresponding colors for each
curve. Right panel: Kaplan-Meier survival curves stratified by the
quartiles of the TLA distribution. . . . . . . . . . . . . . . . . . . . 18
5 Left panels: distributions of the total activity and total log activity
count (TAC and TLAC) in NHANES 2003-2005. Right panels: distributions
of the total acceleration and total log acceleration (TA and TLA) in the
UK Biobank. Distributions are separated by alive (blue) and deceased
(red) status. Survey weights are not accounted for. . . . . . . . . . . 20
6 Distributions of L5 (first row) and RA (second row) for the NHANES
2003-2005 and UK Biobank, respectively. Distributions are separated
by alive (blue) and deceased (red) status. Survey weights are not
accounted for. . . . . . . . . . . . . . . . . . . . . . . . . . . . . . . 21
S1 Distributions of physical activity variables in NHANES 2003-2005.
Distributions are separated by alive (blue) and deceased (red) status.
Survey weights are not accounted for. . . . . . . . . . . . . . . . . . . 40
S2 (Continued) Distributions of physical activity variables in NHANES
2003-2005. Distributions are separated by alive (blue) and deceased
(red) status. Survey weights are not accounted for. . . . . . . . . . . 41
S3 Distributions of physical activity variables in UK Biobank. Distributions
are separated by alive (blue) and deceased (red) status. . . . . . . . . 42
x

S4 (Continued) Distributions of physical activity variables in UK Biobank.
Distributions are separated by alive (blue) and deceased (red) status. 43
xi

1 Introduction
Physical activity is closely related to a person’s health status [8, 21, 26]. Increased
life expectancy is associated with an active lifestyle, whereas excessive sedentary
behavior is associated with higher risk of disease and mortality [26]. This is especially
important in older individuals whose physical activity decreases substantially with
age. There is a large body of literature indicating that age is a strong predictor
of mortality and risk of various diseases [36] and that physical activity decreases
substantially with age after age 50 [30]. Studying physical activity is particularly
important as it is considered to be a modifiable risk factor via low-cost behavioral
interventions that could be tailored to the individual. Moreover, wearable devices
could be used to track the effectiveness of interventions, though here we only focus on
the association between objective measures of physical activity and risk of mortality.
Traditionally, physical activity has been measured subjectively using questionnaires
and surveys. However, the self-reported information is highly subjective, coarse and
subject to substantial bias and measurement error due to recall, social desirability,
and differential assessment of activity intensity and duration by individuals. Thus,
using objectively measured physical activity by body-worn accelerometers provides
an exciting alternative to subjectively measured physical activity via self-report.
Indeed, accelerometers could be worn continuously and track daily activity at high
resolution (tens to hundreds of observations per second) with minimum interference
with the activities of daily living. The high resolution of the intensity and timing
of activity provides unprecedented details about the intra- and inter-day activity
profiles. Many modern accelerometers record acceleration along three orthonormal
axes in the reference system of the device. Depending on the placement of the device,
this could add substantial information about the body position. For example, an
accelerometer placed on the thigh or on the chest could provide information about
1

whether the person is laying down or standing up. An accelerometer placed on the
wrist could provide information about hand orientation.
Here we are interested in quantifying the absolute and relative mortality prediction
performance of objective measures of physical activity obtained from accelerometers
in the UK Biobank and the National Health and Nutrition Examination Survey
(NHANES). UK Biobank used wrist-worn accelerometers, while NHANES used hip-
worn accelerometers. Measures of physical activity are compared to traditional risk
factors of mortality including age, BMI and social-economic status. UK Biobank is
an ongoing health information repository with about 500,000 participants from the
United Kingdom. The data collected at the individual level is extensive and includes
socio-demographic and behavioral variables, genomics, imaging, disease status and
accelerometry data. NHANES is a nationally-representative survey in the United
States designed to assess the health and nutritional status of adults and children [10].
Analyses are conducted separately for the two datasets given the differences in the
target population, recording and encoding of variables, as well as location, placement,
and measurement resolution for the accelerometer in the two studies. Moreover, in the
UK Biobank accelerometer measurements are not taken at the same time as the other
mortality risk factors. In spite of these differences and limitations, we will conduct
a comparative assessment of the results from the two studies in terms of mortality
risk prediction. Methods for quantifying and improving mortality prediction models
by adding objective measures of physical activity to traditional risk factors are also
discussed. The data processing steps in these two datasets are provided as open
source reproducible software accompanied by vignettes.
2

2 Methods
2.1 Data
2.1.1 UK Biobank
UK Biobank is a prospective cohort study with 502,536 participants from the United
Kingdom aged between 38 and 74 years (the age when attending assessment centres).
Since 2006, the study has collected and continues to collect a wide range of health-
related measurements via touchscreen questionnaires, physical assessments and biological
sample collections [33].
The dataset includes participants’ demographic, socioeconomic, self-reported and
clinically assessed health-related information and is linked to various electronic health
records including death certificate records. This provides the opportunity to investigate
the mortality prediction performance of objectively measured physical activity using
accelerometers either as a individual summaries or relative to traditional mortality
risk factors.
The following traditional risk factors of mortality are included in our analyses:
age, race, BMI, self-reported overall health, cigarette smoking, alcohol consumption,
cardiovascular disease history (heart attack, stroke, high blood pressure), cancer
history, right hand grip strength, gait speed, illness or injury in the past 2 years
and longstanding illness or disability. This choice is based on published literature
on the mortality risk in NHANES [32] and UK Biobank [11]. It is important to
reiterate that the traditional risk factors were not recorded at the same time with the
accelerometry results in the UK Biobank. In fact, the average time between these
measurements was 5.716 years (sd = 1.070 years).
In the UK Biobank study, starting from 2012, a subset of participants were invited
to wear a wrist-worn accelerometer (Axivity AX3 wrist-worn triaxial accelerometer
3

[5]) on their dominant hand continuously for up to seven days. Email invitations were
sent to a subset of 236,486 UK Biobank study participants to join the accelerometry
study. Until 2015, UK Biobank had collected high resolution accelerometry data
from 103,698 participants. Acceleromery data for a subset of 96,536 participants
were determined to be of good quality by the UK Biobank team. High resolution tri-
axial acceleration signals were recorded and processed in non-overlapping five-second
intervals. The summary used was Euclidean norm minus one (ENMO) [15] and was
expressed in international system of measuring units (milli-gravitational units, where
gravitation is the average gravitation of the Earth g = 9.81m/s2).
To investigate the sampling effects on the marginal distribution of variables,
Table 1 provides the mean (for continuous variables) or percentage (for binary and
categorical variables) for the covariates of interest in the UK Biobank and four sub-
population of the accelerometry sub-study: (1) “Not asked” are individuals who
weren’t invited to the study; (2) “No response” are individuals who were invited
but did not respond to the invitation; (3) “Completed: bad data” are individuals
who participated in the accelerometry study but were flagged by UK Biobank as
having bad accelerometry data; and (4) “Completed: good data” are individuals who
participated in the accelerometry study and were flagged by UK Biobank as having
good accelerometry data. The “Completed: good data” is the dataset used in our
analyses, though some additional exclusions were applied; see Section 2.2 for more
details.
Table 1 shows that participants with valid physical activity data were younger
and had lower BMI, higher self-reported overall health, lower smoking and alcohol
consumption prevalence, better cardiovascular events history (heart attack, stroke,
high blood pressure), lower diabetes and cancer prevalence, higher right hand grip
strength and gait speed, lower reported illness or injury prevalence in the past two
years, lower longstanding illness or disability prevalence, and lower mortality rate.
4
We conclude that: (1) the UK Biobank data is not a random sample of the UK
population; (2) individuals who provided a valid email address are not a random sub-
sample of the UK Biobank population; (3) individuals who responded and accepted to
participate in the study are not a random sub-sample of the individuals who provided
an email address; (4) individuals who provided data are not a random sub-sample of
the individuals who accepted to participate; and (5) individuals who provided good
data are not a random sub-sample of the individuals who provided data. In fact, at
every level of selection (either by the UK Biobank or self-selection) individuals who
had access to email, were willing to answer, participate, provide data, and provide
high quality data were younger and in better health than those who did not. This
raises important questions about what population is represented by the individuals
who provided high quality data and whether results can be generalized to the UK
population. This exceeds the scope of the current thesis and we simply note that we
focus of the analysis on the population of individuals from the UK Biobank data who
fulfilled all the criteria for generating good acceleromery data.
2.1.2 NHANES
The National Health and Nutrition Examination Survey (NHANES) is a nationally
representative, cross-sectional survey in the United States that combines interviews,
various physical examinations and laboratory test results to provide accurate national
health and nutrition statistics in the United States. The surveys examine a sample
of approximately 5,000 persons each year [25].
NHANES over-samples under-represented groups including Hispanics, non-Hispanic
blacks, Asians, individuals at or below 130% of the federal poverty level, and individuals
aged 80 and over. The survey uses a complex, multistage probability sampling design
and assigns a survey weight to each sampled individual. The survey weight is the
5
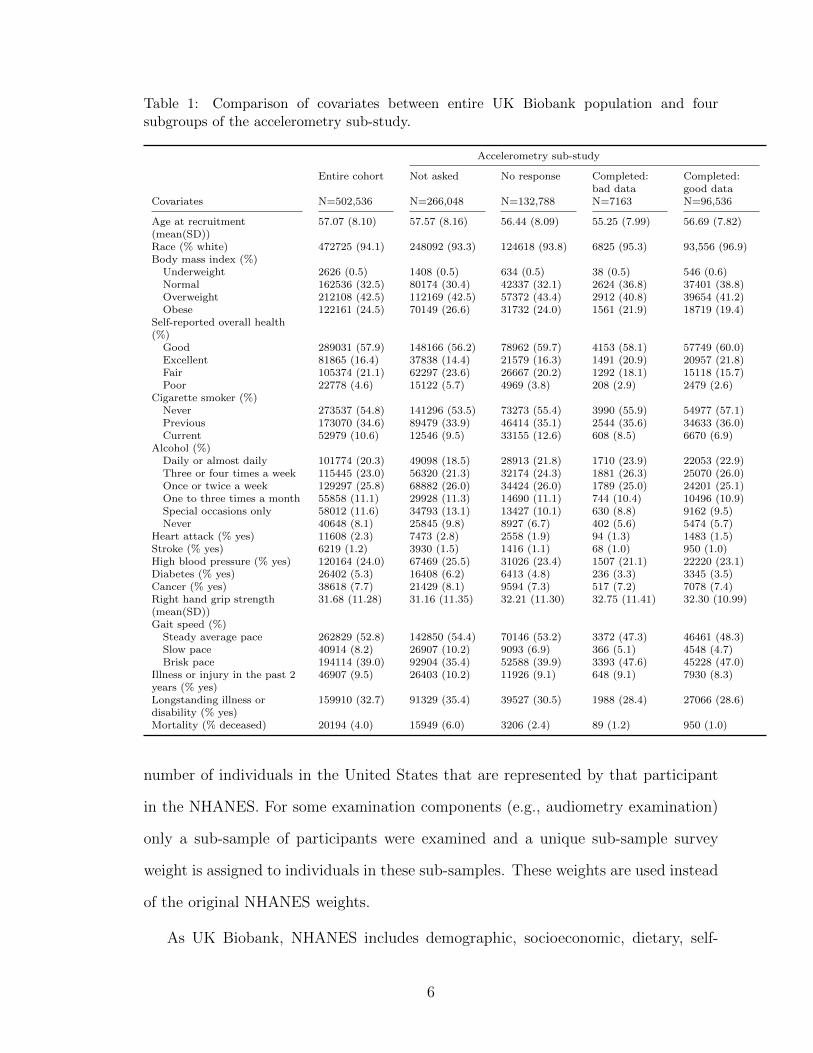
Table 1: Comparison of covariates between entire UK Biobank population and foursubgroups of the accelerometry sub-study.
Accelerometry sub-study
Entire cohort Not asked No response Completed: Completed:bad data good data
Covariates N=502,536 N=266,048 N=132,788 N=7163 N=96,536
Age at recruitment(mean(SD))
57.07 (8.10) 57.57 (8.16) 56.44 (8.09) 55.25 (7.99) 56.69 (7.82)
Race (% white) 472725 (94.1) 248092 (93.3) 124618 (93.8) 6825 (95.3) 93,556 (96.9)Body mass index (%)
Underweight 2626 (0.5) 1408 (0.5) 634 (0.5) 38 (0.5) 546 (0.6)Normal 162536 (32.5) 80174 (30.4) 42337 (32.1) 2624 (36.8) 37401 (38.8)Overweight 212108 (42.5) 112169 (42.5) 57372 (43.4) 2912 (40.8) 39654 (41.2)Obese 122161 (24.5) 70149 (26.6) 31732 (24.0) 1561 (21.9) 18719 (19.4)
Self-reported overall health(%)
Good 289031 (57.9) 148166 (56.2) 78962 (59.7) 4153 (58.1) 57749 (60.0)Excellent 81865 (16.4) 37838 (14.4) 21579 (16.3) 1491 (20.9) 20957 (21.8)Fair 105374 (21.1) 62297 (23.6) 26667 (20.2) 1292 (18.1) 15118 (15.7)Poor 22778 (4.6) 15122 (5.7) 4969 (3.8) 208 (2.9) 2479 (2.6)
Cigarette smoker (%)Never 273537 (54.8) 141296 (53.5) 73273 (55.4) 3990 (55.9) 54977 (57.1)Previous 173070 (34.6) 89479 (33.9) 46414 (35.1) 2544 (35.6) 34633 (36.0)Current 52979 (10.6) 12546 (9.5) 33155 (12.6) 608 (8.5) 6670 (6.9)
Alcohol (%)Daily or almost daily 101774 (20.3) 49098 (18.5) 28913 (21.8) 1710 (23.9) 22053 (22.9)Three or four times a week 115445 (23.0) 56320 (21.3) 32174 (24.3) 1881 (26.3) 25070 (26.0)Once or twice a week 129297 (25.8) 68882 (26.0) 34424 (26.0) 1789 (25.0) 24201 (25.1)One to three times a month 55858 (11.1) 29928 (11.3) 14690 (11.1) 744 (10.4) 10496 (10.9)Special occasions only 58012 (11.6) 34793 (13.1) 13427 (10.1) 630 (8.8) 9162 (9.5)Never 40648 (8.1) 25845 (9.8) 8927 (6.7) 402 (5.6) 5474 (5.7)
Heart attack (% yes) 11608 (2.3) 7473 (2.8) 2558 (1.9) 94 (1.3) 1483 (1.5)Stroke (% yes) 6219 (1.2) 3930 (1.5) 1416 (1.1) 68 (1.0) 950 (1.0)High blood pressure (% yes) 120164 (24.0) 67469 (25.5) 31026 (23.4) 1507 (21.1) 22220 (23.1)Diabetes (% yes) 26402 (5.3) 16408 (6.2) 6413 (4.8) 236 (3.3) 3345 (3.5)Cancer (% yes) 38618 (7.7) 21429 (8.1) 9594 (7.3) 517 (7.2) 7078 (7.4)Right hand grip strength(mean(SD))
31.68 (11.28) 31.16 (11.35) 32.21 (11.30) 32.75 (11.41) 32.30 (10.99)
Gait speed (%)Steady average pace 262829 (52.8) 142850 (54.4) 70146 (53.2) 3372 (47.3) 46461 (48.3)Slow pace 40914 (8.2) 26907 (10.2) 9093 (6.9) 366 (5.1) 4548 (4.7)Brisk pace 194114 (39.0) 92904 (35.4) 52588 (39.9) 3393 (47.6) 45228 (47.0)
Illness or injury in the past 2years (% yes)
46907 (9.5) 26403 (10.2) 11926 (9.1) 648 (9.1) 7930 (8.3)
Longstanding illness ordisability (% yes)
159910 (32.7) 91329 (35.4) 39527 (30.5) 1988 (28.4) 27066 (28.6)
Mortality (% deceased) 20194 (4.0) 15949 (6.0) 3206 (2.4) 89 (1.2) 950 (1.0)
number of individuals in the United States that are represented by that participant
in the NHANES. For some examination components (e.g., audiometry examination)
only a sub-sample of participants were examined and a unique sub-sample survey
weight is assigned to individuals in these sub-samples. These weights are used instead
of the original NHANES weights.
As UK Biobank, NHANES includes demographic, socioeconomic, dietary, self-
6

reported and clinically assessed health-related information. NHANES is also linked to
various electronic health records including death certificate records from the National
Death Index (NDI) [25]. For the purpose of our analyses we include the following
traditional mortality risk factors: age, race, BMI, education background, cigarette
smoking, alcohol consumption, cardiovascular disease history (stroke, high blood
pressure, coronary heart disease, congestive heart failure), cancer history, diabetes
history and systolic blood pressure. These mortality risk factors were chosen based
on the published literature of mortality prediction results in NHANES [32].
For the 2003-2004 and 2004-2005 wave cohorts, NHANES collected objective
measurements of physical activity via hip-worn accelerometer (ActiGraph AM-7164)
during up to seven days of normal daily activity. Individuals who participated in
the study were instructed to remove the accelerometer during sleep. Acceleration
was summarized in “activity counts”, a proprietary measure of activity intensity
accompanying the ActiGraph AM-7164 accelerometer. There is no direct comparison
between the ENMO units expressed in milli-g in the UK Biobank and the activity
counts in the NHANES.
This allows us to investigate the association between physical activity in combination
with traditional risk factors and mortality. The latest update on mortality information
in NHANES is through December 31, 2015[25].
There are important differences between the UK Biobank and the NHANES
accelerometry data including: (a) the location of the device (wrist in UK Biobank
and hip in NHANES); (b) the type of measurement summary (ENMO expressed in
milli-gs in UK Biobank and activity counts in NHANES); (c) the sampling rate of
raw data (100Hz in UK Biobank and one observation per minute in NHANES); and
(d) the wear instructions (continuous wear in UK Biobank and wear during non-sleep
periods in NHANES).
7
2.2 Study Population
For UK Biobank, we applied additional exclusion criteria to the 96,536 participants
with good quality accelerometry data. These exclusion criteria were: (1) being
younger than 50 at the time of accelerometer wear (8002 participants); (2) had
fewer than 3 days of data with at least 1, 368 minutes (95% of the entire day) of
estimated wear time (2428 participants); and (3) had missing covariate information
(3802 participants). After these exclusions the final study population included 82, 304
participants with 849 deaths and 258364.1 person years of follow-up. The follow-up
time ranges from 0.03 years to 4.67 years with the mean follow-up time of 3.14 years.
NHANES 2003-2005 collected accelerometry data on 14, 631 participants. Just
as with the UK Biobank, we applied additional exclusion criteria. These exclusion
criteria were: (1) had fewer than 3 days of data with at least 10 hours of estimated
wear time or were flagged by NHANES to have poor quality data (3, 430 participants);
(2) being younger than 50 or older than 85 at the time of accelerometer wear (7, 946
participants); (3) had missing covariate information (277 participants). After these
exclusions the final study population included 2, 978 participants with 783 deaths and
28, 869.75 person years of follow-up. The follow-up time ranges from 0.08 years to
13.08 years with the mean follow-up time of 9.69 years.
2.3 Accelerometer derived physical activity variables
2.3.1 UK Biobank
For analytic purposes, we have started with the processed five-second acceleration
ENMO summaries provided by the UK Biobank. These summaries were then averaged
at the minute-level. Based on these data we have derived 25 actigraphy-derived daily
activity summaries: total acceleration (TA), total log acceleration (TLA), two-hour
total log acceleration in non-overlapping time intervals starting at 12AM (denoted
8

TLA1 to TLA12), sedentary time (ST), light-intensity physical activity (LIPA), moderate-
to-vigorous activity (MVPA), daytime activity ratio estimate (DARE), sedentary
to active transition probability (SATP), active to sedentary transition probability
(ASTP), minute-average total log acceleration during the ten most active consecutive
hours of the day (M10), minute-average total log acceleration during the five least
active consecutive hours of the day (L5), timing of M10 (the mid-point of the M10
interval), timing of L5 (the mid-point of the L5 interval), and relative amplitude
(RA), defined as (M10-L5)/(M10+L5). Many of these measures require the definition
of thresholds for sedentary/non-sedentary and LIPA/MVPA. For the purpose of this
research we used a threshold of 30 milli-g for defining non-sedentary and 100 milli-g
for defining MVPA at the minute level. Each summary is obtained for one day and
daily summaries are then averaged over the days with good quality data.
These activity-related variables are designed to capture different aspects of an
individual’s physical activity profile and have the advantage that they are easy to
explain and derived from raw accelerometry data using open source reproducible
software. Total acceleration (TA) is a proxy for a person’s overall activity level
and is obtained by summing all minute-level ENMO values at for the entire day.
Total log acceleration (TLA) is similar to TA but minute-level TA averages are first
transformed to log(1+TA) and then added over all minutes of the day. TLA was
introduced to reduce the strong right skewness of the TA data. Similarly, the two-
hour total log acceleration is obtained by summing up the log(1+TA) total activity
in a particular two hour interval. This segments the TLA data into specific periods
of the day and can be used to investigate the time-of-day-specific effects of physical
activity measured by accelerometers. The total sedentary activity (ST) is the number
of minutes during the day when the individual was sedentary (ENMO less than 30
milli-g). Light-intensity physical activity (LIPA) is the number of minutes during
the day with an ENMO between 30 and 100 milli-g. Moderate-to-vigorous activity
9

(MVPA) is the number of minutes during the day with an ENMO between above 100
milli-g. The daytime activity ratio estimate (DARE) is the ratio of between total log
activity (TLA) between 8AM and 8PM divided by the total log activity (TLA) during
the day. M10 is the minute-average total log acceleration during the most active ten
consecutive hours of the day. L5 is the minute-average total log acceleration during
the least active five consecutive hours of the day. The combination of M10, L5, their
timing during the day and the relative amplitude, (M10-L5)/(M10+L5), are though
to be useful proxy measures of the circadian rhythm [7].
We have also included two variables designed to capture the fragmentation of an
individual’s physical activity: sedentary to active transition probability (SATP) and
active to sedentary transition probability (ASTP). The reason for including these
measures is that there is a growing literature that suggests that transition metrics
between sedentary and active periods may be associated with health outcomes [4].
2.3.2 NHANES
A similar set of accelerometry-derived daily activity summaries were derived on the
minute-level activity counts in NHANES: total activity count (TAC), total log activity
count (TLAC), two-hour total log activity count in non-overlapping time intervals
starting at 12AM (denoted TLAC1 to TLAC12), sedentary time (ST), light-intensity
physical activity (LIPA), moderate-to-vigorous activity (MVPA), daytime activity
ratio estimate (DARE), sedentary to active transition probability (SATP), active to
sedentary transition probability (ASTP), minute-average total log acceleration during
the ten most active consecutive hours of the day (M10), minute-average total log
acceleration during the five least active consecutive hours of the day (L5), timing
of M10 (the mid-point of the M10 interval), timing of L5 (the mid-point of the L5
interval), and relative amplitude (RA), defined as (M10-L5)/(M10+L5).
We should note that the calculations for physical activity (PA) variables were
10

the same between UK Biobank and NHANES, and the notations for most of the
PA variables are the same except TA/TAC, TLA/TLAC, TLA1 - TLA12/TLAC1 -
TLAC12 to denote the difference in measurement units (activity counts for NHANES,
milli-gs for UK Biobank).
There is also a difference in thresholds for defining sedentary behavior, LIPA and
MVPA between NHANES and UK Biobank. In NHANES a sedentary minute was
defined as having an activity count < 100, a LIPA minute was defined as having
an activity count ≥ 100 and < 2020, and an MVPA minute was defined as having
an activity count ≥ 2020 [32]. In UK Biobank, a sedentary minute was defined as
having an average ENMO taken over the 30 five-second intervals in a minute below
30 milli-g. This threshold was chosen based on publications on wrist-worn Axivity
acceleromter data [29, 34, 35]. Similarly, a LIPA minute was defined as having the
average ENMO over a minute ≥ 30 milli-g and < 100 milli-g [16]. An MVPA minute
was defined as having the average ENMO over a minute ≥ 100 milli-g.
A full description and exact formulae for deriving all activity-related variables are
provided in Table S1.
2.4 Statistical Analysis
The first step for comparing the mortality prediction performance of predictors was to
use univariate Cox regression models [3] with time to death as outcome. Predictors
were ranked in decreasing order of the 10-f-CV [2, 12]. The Concordance index is
calculated using the rcorr.cens function in the Hmisc [13] package in R [27]. The
10-f-CV was calculated by separately and randomly splitting the deceased and alive
individuals into ten subsets of equal size. For each fold, we combined one subset of
deceased (10% of all deceased) and one subset of alive (10% of all alive) individuals
to create the test set. The training set was obtained by combining the other nine
11

subsets of deceased (90% of all deceased) and one subset of alive (90% of all alive)
individuals. Models were fit on the training set and the Concordance was calculated
over the test data. The process was repeated ten times, each using a different test
data, which resulted in ten Concordance indexes corresponding to each training/test
data split. The 10-f-CV was then obtained by averaging the 10 Concordance indexes.
This ensure that: (1) the training and the test datasets have a sample size ratio of
9:1 (training:testing); (2) the percentage of individuals who died was the same with
the one in the original data both in the training and test data; and (3) there was no
overlap between the 10 test datasets.
For NHANES, we used the survey-weighted Cox model[6, 22] implemented in the
package svycoxph from the package survey [22, 23] in R to account for the complex
survey design. The UK Biobank has an unspecified sampling design and we were
unable to account for hidden correlations and imbalance in the population. Using the
conditional independence assumption of individuals given their observations in the
UK Biobank is a limitation of our approach.
The second step was to construct a predictive model for mortality based on
a combination of traditional risk factors and activity-related variables. This was
implemented using forward selection where at each step a new variable was included
into the prediction model. Variables were included based on which provided the
largest increase in the 10-f-CV at each step. One of the problems with using the cross
validated Concordance is that it tends to increase relatively quickly when strongly
predictive variables are added, but then it levels off and exhibits a long flat plateau.
This plateau corresponds to very small increases or decreases in the cross-validated
Concordance, which can lead to substantial instabilities in the choice of the model
if the stopping criteria is the maximum cross-validated Concordance. Instead we
used a stopping rule where the cross-validated Concordance does not improve by
more than a particular threshold. Thus, we used the following two stopping rules for
12
including new variables: (1) stop when the increase in Concordance is less than 0.01
for any additional variable; and (2) stop when the increase in Concordance is less
than 0.001 for any additional variable. The first stopping rule is more stringent and
results in more parsimonious models (models with fewer predictors). This procedure
was applied using either: (1) all variables (traditional mortality risk factors and
accelerometer-derived physical activity measures) as candidates at each step of the
forward selection procedure; or (2) traditional mortality risk factors until the stopping
criterion was met and then accelerometer-derived physical activity measures until the
stopping criteria was met again. The purpose of the second, two stage procedure
was to evaluate the added prediction performance of accelerometer-derived physical
activity measures above and beyond that of the combined prediction performance of
traditional mortality risk factors.
3 Results
3.1 Exploratory data analysis
In this section, we provide visualizations of the minute-level physical activity data
at the individual level as well as summaries within specific subgroups using both the
UK Biobank and NHANES datasets.
3.1.1 Minute-level raw data
The left panels in Figure 1 display the minute-level daily activity counts for one
randomly-chosen participant in the NHANES for seven days. Each day is shown in
one row, the x-axis in every panel is time from midnight to midnight and the y-axis is
expressed in Actigraph activity counts. Similarly, the right panels in Figure 1 display
the minute-level ENMO averages for one randomly-chosen participant in the UK
13
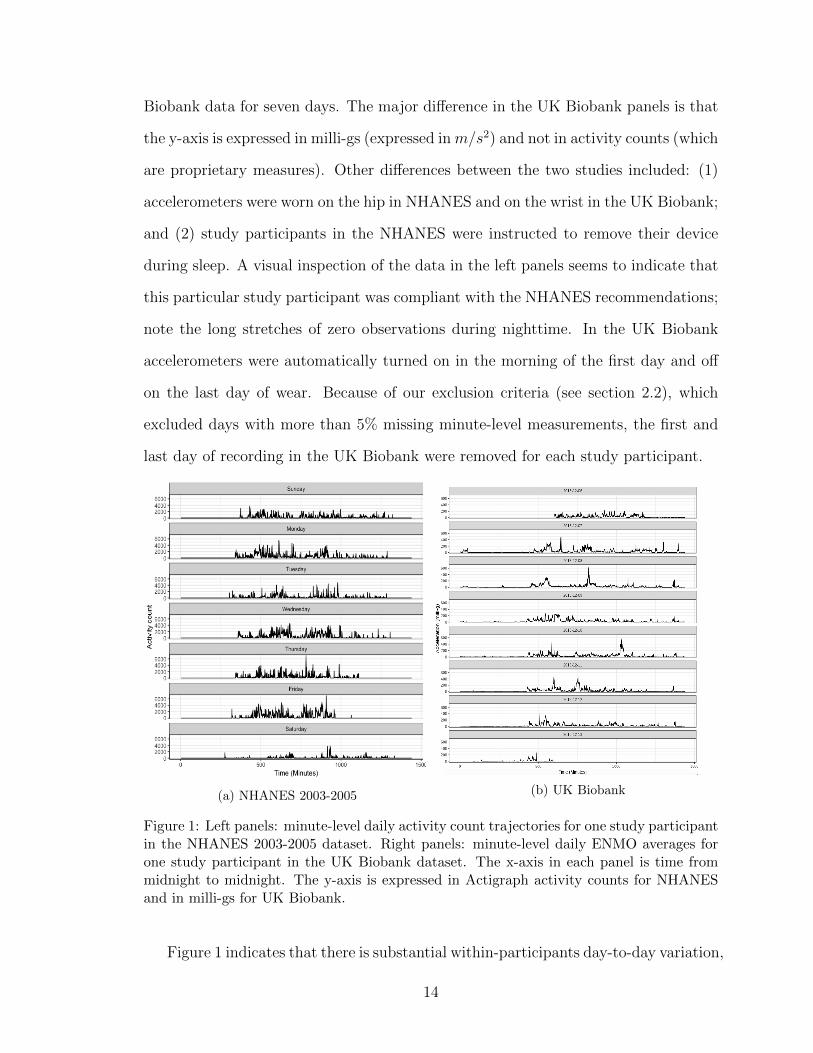
Biobank data for seven days. The major difference in the UK Biobank panels is that
the y-axis is expressed in milli-gs (expressed inm/s2) and not in activity counts (which
are proprietary measures). Other differences between the two studies included: (1)
accelerometers were worn on the hip in NHANES and on the wrist in the UK Biobank;
and (2) study participants in the NHANES were instructed to remove their device
during sleep. A visual inspection of the data in the left panels seems to indicate that
this particular study participant was compliant with the NHANES recommendations;
note the long stretches of zero observations during nighttime. In the UK Biobank
accelerometers were automatically turned on in the morning of the first day and off
on the last day of wear. Because of our exclusion criteria (see section 2.2), which
excluded days with more than 5% missing minute-level measurements, the first and
last day of recording in the UK Biobank were removed for each study participant.
(a) NHANES 2003-2005 (b) UK Biobank
Figure 1: Left panels: minute-level daily activity count trajectories for one study participantin the NHANES 2003-2005 dataset. Right panels: minute-level daily ENMO averages forone study participant in the UK Biobank dataset. The x-axis in each panel is time frommidnight to midnight. The y-axis is expressed in Actigraph activity counts for NHANESand in milli-gs for UK Biobank.
Figure 1 indicates that there is substantial within-participants day-to-day variation,
14

with larger differences between weekdays and weekends; see figure 2. Day of the week
effects are well known and have been reported before [1, 14, 20, 28]. However, these
systematic difference explain only a small proportion of the total variance in physical
activity measurements [17].
(a) NHANES 2003-2005(b) UK Biobank
Figure 2: Left panels: Visualization of activity data during day of the week in the NHANES2003-2005 dataset. Right panels: Visualization of activity data during day of the week inthe UK Biobank dataset. The x-axis in each panel is time from midnight to midnight.The y-axis is expressed in Actigraph activity counts for NHANES and in milli-gs for UKBiobank.
Current recommendations for accelerometer measurements suggest using consecutive
measurements of four to seven days to ensure accurate evaluation of an individual’s
physical activity profile [14, 31]. Seven consecutive days has become the norm for
accelerometry data collection in population health studies to account for day-to-day
and day-of-the-week effects [19, 24], balance the burden to study participants, and
account for logistic and device reliability problems associated with large studies.
Since the focus of this study is to assess the association between an individual’s
physical activity level and mortality, we calculated the day-specific summaries of
activity and then averaged these summaries across days for each participant; see
Section 2.3 and section 3.1.3.
15

3.1.2 Exploratory sub-group analyses
We now investigate and compare activity data in various subgroups. We start with
NHANES and compute the average minute-specific activity counts across days for
each participant. This resulted in a vector of length 1440 (number of minutes
in a day), where each entry represents the average of the activity counts at the
corresponding minute of the day over the available days. This vector is the participant-
specific average trajectory across days. The left panel in Figure 3 displays the average
of these average trajectories among the group of individuals who died before December
31, 2015 (red solid curve, N = 783) and the group of individuals who were alive on
December 31, 2015 (blue solid curve, N = 2195). The plot also contains pointwise
confidence intervals for each average (shaded areas with corresponding colors for each
curve).
Figure 3: Subgroup visualization of activity data in the NHANES 2003-2005. Left panel:Mean log activity count trajectory comparing deceased (red solid line, N = 783) and alive(blue solid line, N = 2195) subgroups. For illustration purposes, the mean log(1+activitycount) is plotted as five-minute window averages. Pointwise confidence intervals for eachaverage are shown as shaded areas with corresponding colors for each curve. Right panel:Kaplan-Meier survival curves stratified by the quartiles of the TLAC distribution. Plots donot account for survey weights and sampling design.
The right panel in Figure 3 displays the Kaplan-Meier estimator [18] stratified
16

by the four sub-groups defined by the quartiles of the distribution of TLAC. Results
indicate that study participants that are in the first and second quartiles of the TLAC
distribution are at much higher risk of mortality. The Kaplan-Meier curve for the first
quartile of TLAC shows a large difference from the other curves almost immediately
after the baseline measurement. This difference continues to increase. Indeed, at
7 years the estimated survival probability in the lowest quartile of TLAC is 0.703
compared to 0.8454, 0.922, and 0.923 for the second, third, and fourth quartile. The
Kaplan-Meier curve for the second quartile of TLAC is also well separated from the
other curves, though the initial separation from the other groups is not as dramatic in
the first couple of years. The curves corresponding to the third and fourth quartiles
tend to be closer, though they convey the consistent message that lower baseline
activity, at least as measured by TLAC, seems to be associated with lower survival
probability. This is just a visual inspection and does not constitute a formal statistical
test, but provides the intuition for our formal analyses; please see Sections 2.4 and
3.2.
17

(a) Population profile (b) Kaplan-Meier curve
Figure 4: Subgroup visualization of activity data in the UK Biobank. Left panel: Meanlog(1+average ENMO) trajectory comparing deceased (red solid line, N = 849) and alive(blue solid line, N = 81, 455) subgroups. For illustration purposes, the mean log(1+averageENMO) is plotted as five-minute window averages. Pointwise confidence intervals for eachaverage are shown as shaded areas with corresponding colors for each curve. Right panel:Kaplan-Meier survival curves stratified by the quartiles of the TLA distribution.
Figure 4 provides a similar visualization of the data in the UK Biobank. The
left panel displays the average minute-level ENMO averages within the deceased (red
solid curve, N = 849) and alive (blue solid curve, N = 81, 455) groups, respectively,
with the mortality data released on March 11, 2019. Pointwise confidence intervals
for each average are shown as shaded areas with corresponding colors for each curve.
The patterns are similar to the ones observed in NHANES (even though the y-axes
are not comparable). However the data from the UK Biobank seems to preserve more
of the activity data features during sleep; note the natural smoother pattern in the
UK Biobank data compared to the flat pattern in the NHANES during the night. The
right panel displays the Kaplan-Meier curves for each group defined by the quartiles
of the distribution of TLA. The shorter follow-up time and lower mortality rate result
in different Kaplan-Meier curves in the UK Biobank. Indeed, the x-axis is up to five
18

years in the UK Biobank and up to 12.5 years in the NHANES. Moreover, the y-axis
shows probabilities between 0.95 and 1 in the UK Biobank and between 0.6 and 1
in NHANES. In spite of the differences in how accelerometer data were collected,
sampling design, follow up time and population structure and characteristics, there
are many common features that can be seen in Figures 3 and 4. Indeed, the activity
averages for the deceased groups are lower than for the alive group while the Kaplan-
Meier curves for the lower quartiles of activity (measured by TLA) are lower indicating
higher risk of mortality.
3.1.3 Visualization of some distributions of physical activity summaries
As discussed in section 2.3, we derived 25 physical activity summaries of the weekly
activity profiles of each study participant in NHANES and UK Biobank. Figure 5
displays the distributions of: (1) total activity and total log activity count (TAC and
TLAC) in NHANES in the first column panels; (2) total acceleration and total log
acceleration (TA and TLA) in UK Biobank in the second column panels. Distributions
are separated by alive (blue) and deceased (red) status. As expected, the group of
study participants who did not die during follow-up has higher physical activity, as
measured by all summaries in both studies. To save space in the main body of the
thesis, similar plots are shown for all physical activity summaries in Appendix S1.2.
19

(a) Total activity counts, NHANES (b) Total acceleration, UKB
(c) Total log activity counts, NHANES (d) Total log acceleration, UKB
Figure 5: Left panels: distributions of the total activity and total log activity count (TACand TLAC) in NHANES 2003-2005. Right panels: distributions of the total accelerationand total log acceleration (TA and TLA) in the UK Biobank. Distributions are separatedby alive (blue) and deceased (red) status. Survey weights are not accounted for.
However, we are showing one more exploratory plot for L5 and relative amplitude
(RA). The left panel in the first row of Figure 6 displays the distribution of L5 in
the NHANES. Both the alive and deceased group have distributions that are highly
concentrated near zero with very long right tails. This is likely due to the fact
that the NHANES study participants were asked to take off the device during sleep.
Since L5 tends to occur during sleep, many observations will be zero or very close
to zero, giving rise to these highly concentrated distributions near zero. The left
panel in the second row displays the distribution of relative amplitude, RA=(M10-
20

L5)/(M10+L5), in the NHANES. Because L5 is so concentrated near zero, RA tends
to be highly concentrated near 1. The right panels display the distributions of L5
and RA in the UK Biobank, based on log acceleration. While L5 indicates only slight
differences between the alive and deceased groups, the relative amplitude seems to
indicate stronger differences between the groups. This may explain why RA is not a
strong predictor of mortality in NHANES but is a strong predictor in the UK Biobank;
see Section 3.2.
(a) L5, NHANES (b) L5, UKB
(c) Relative amplitude, NHANES (d) Relative amplitude, UKB
Figure 6: Distributions of L5 (first row) and RA (second row) for the NHANES 2003-2005and UK Biobank, respectively. Distributions are separated by alive (blue) and deceased(red) status. Survey weights are not accounted for.
21

3.2 Prediction Model
Table 2 displays the summary statistics for the traditional predictors of mortality
in the UK Biobank and NHANES separated by the deceased and alive groups. For
continuous variables, the mean and standard deviation (in parentheses) are reported.
For categorical variables, counts and percentages (in parentheses) within each category
are reported. Note that some variables are present in UK Biobank but not in
NHANES 2003-2005 (e.g., self-reported overall health, right hand grip strength, and
gait speed), some variables are present in NHANES 2003-2005 but not in the UK
Biobank (e.g., mobility problem). For alcohol consumption the definitions of the
categories are different because of the surveys were set up differently.
For UK Biobank for all variables, except ethnicity and illness or injury in the
past 2 years, there is a statistically significant difference between the means of the
deceased and alive group. The deceased participants were on average 3.8 years older
at accelerometer wear than the alive participants. There was a smaller proportion of
study participants with “Normal” weight in the deceased group. The proportion of
non-white participants was similar in the two groups, though both proportions are
much smaller in the UK Biobank compared to NHANES.
For all traditional predictors in NHANES, there is a statistically significant difference
between the means of the deceased and alive group. The deceased participants were
on average 9.1 years older at accelerometer wear than the alive participants. There
was a larger proportion of deceased participants with underweight BMI, though there
was not a statistically significant difference in the proportion of participants with
normal, overweight and obese BMI. The proportion of non-white was larger in the
alive group.
Table 3 displays the summary statistics for activity-related variables in the deceased
and alive groups. As mentioned in Section 2.3.2, we use the TA/TAC and TLA/TLAC
22

symbols to indicate the different PA variable names for the UK Biobank and NHANES.
Table 3 indicates that there are large differences between the two studies in terms
of distributions of TA/TLA in UK Biobank and TAC/TLAC in NHANES. This
should not be surprising as they are different summaries of acceleration obtained from
different devices placed at different locations on the body and with different study
protocols. However, there is also consistency between the two studies, as the deceased
group tends to have lower activity during day as measured by different summaries.
However, there is surprising consistency between the two studies in terms of the LIPA,
MVPA, SATP, ASTP. The differences in L5, RA, timing of M10, and timing of L5
are likely due to the NHANES protocol, which required removal of the devices during
the night; see Section 3.1.3 for more details.
Although the differences between TLA in UK Biobank and TLAC in NHANES
are relatively large, M10 derived from the two studies are highly similar in value.
To investigate this issue, we calculated the percentage of TLA/TLAC during the
ten most active consecutive hours of the day relative to the TLA/TLAC during the
entire day. For UK Biobank, the percentage of TLA during the ten most active
consecutive hours of the day versus the entire day is 58.2% for alive group and 57.2%
for deceased group. Whereas for NHNAES, the percentage of TLA during ten most
active consecutive hours of the day versus the entire day is 78.4% for alive group
and 79.0% for deceased group. So even though TLA and TLAC are on different
scales, M10 have similar values because the NHANES population have significantly
“concentrated” activity comparing to UK Biobank.
Despite these differences, we conduct separate analyses and compare the results
of various models based on the the NHANES and UK Biobank datasets, respectively.
23

Table 2: Summary statistics for non-activity-related variables among alive and deceasedparticipants for UK Biobank and NHANES.
UK Biobank NHANES
Alive Deceased Alive DeceasedVariables (mean(SD)) N=81,455 N=849 p-value N= 2195 N= 783 p-value
Age at accelerometer wear 63.66 (6.81) 67.46 (5.90) < 0.001 63.46 (8.69) 72.56 (8.90) < 0.001Race (% non-white) 2132 (2.6) 23 (2.7) 0.953 943 (43) 279 (35.6) 0.005Gender (% male) 35933 (44.1) 528 (62.2) < 0.001 1048 (47.7) 475 (60.7) < 0.001Body mass index (%) < 0.001 0.006
Underweight 446 (0.5) 4 (0.5) 14 (0.6) 15 (1.9)Normal 31353 (38.5) 238 (28.0) 545 (24.8) 215 (27.5)Overweight 33997 (41.7) 376 (44.3) 855 (39.0) 295 (37.7)Obese 15659 (19.2) 231 (27.2) 781 (35.6) 258 (33.0)
Self-reported overallhealth (%)
< 0.001
Good 49151 (60.3) 455 (53.6) — —Excellent 18112 (22.2) 118 (13.9) — —Fair 12267 (15.1) 211 (24.9) — —Poor 1925 (2.4) 65 (7.7) — —
Cigarette smoker (%) < 0.001 < 0.001Never 46239 (56.8) 364 (42.9) 1056 (48.1) 270 (34.5)Previous 29958 (36.8) 360 (42.4) 789 (35.9) 358 (45.7)Current 5258 (6.5) 125 (14.7) 350 (15.9) 155 (19.8)
Alcohol (%) < 0.001Daily or almost daily 19396 (23.8) 229 (27.0) — —Three or four times a
week21499 (26.4) 175 (20.6) — —
Once or twice a week 20048 (24.6) 206 (24.3) — —One to three times a
month8506 (10.4) 79 (9.3) — —
Special occasions only 7507 (9.2) 93 (11.0) — —Never 4499 (5.5) 67 (7.9) — —
Alcohol (%) < 0.001Moderate Drinker — — 1152 (52.5) 293 (37.4)Non-Drinker — — 867 (39.5) 399 (51.0)Heavy Drinker — — 119 (5.4) 62 (7.9)Missing alcohol — — 57 (2.6) 29 (3.7)
Heart attack (% yes) 1311 (1.6) 46 (5.4) < 0.001 — —Stroke (% yes) 786 (1.0) 19 (2.2) < 0.001 77 (3.5) 97 (12.4) < 0.001High blood pressure (%yes)
19429 (23.9) 333 (39.2) < 0.001 — —
Diabetes (% yes) 2881 (3.5) 84 (9.9) < 0.001 318 (14.5) 200 (25.5) < 0.001Cancer (% yes) 6179 (7.6) 125 (14.7) < 0.001 275 (12.5) 180 (23.0) < 0.001CHF (% yes) — — 67 (3.1) 101 (12.9) < 0.001CHD (% yes) — — 124 (5.6) 120 (15.3) < 0.001Right hand grip strength 32.14 (10.94) 32.98 (10.94) 0.026 — —Gait speed (%) < 0.001
Steady average pace 39557 (48.6) 466 (54.9) — —Slow pace 3788 (4.7) 95 (11.2) — —Brisk pace 38110 (46.8) 288 (33.9) — —
Illness or injury in thepast 2 years (% yes)
33897 (41.6) 354 (41.7) 0.990 — —
Longstanding illness ordisability (% yes)
23424 (28.8) 411 (48.4) < 0.001 — —
Mobility problem (% AnyDifficulty)
— — 545 (24.8) 395 (50.4) < 0.001
24

Table 3: Summary statistics for activity-related variables among alive and deceasedparticipants for UK Biobank and NHANES.
UK Biobank NHANES
Alive Deceased Alive DeceasedVariables(mean(SD))
N=81,455 N=849 p-value N= 2195 N= 783 p-value
TA/TAC 40449.58(11866.71)
33330.36(11879.11)
< 0.001 230772.48(111341.15)
150954.67(95137.10)
< 0.001
TLA/TLAC 3425.25(318.32)
3240.65(383.58)
< 0.001 2890.63(676.39)
2388.19(737.08)
< 0.001
TLA1/TLAC1 147.91 (37.63) 152.13 (39.44) 0.001 25.99 (64.23) 22.35 (46.77) 0.146TLA2/TLAC2 131.15 (23.83) 135.58 (25.14) < 0.001 15.92 (56.05) 15.15 (38.42) 0.720TLA3/TLAC3 136.20 (30.62) 139.16 (29.59) 0.005 41.43 (88.25) 32.42 (66.77) 0.009TLA4/TLAC4 221.49 (79.05) 208.21 (75.18) < 0.001 176.22 (155.48) 139.97 (135.14) < 0.001TLA5/TLAC5 367.53 (69.73) 345.95 (77.01) < 0.001 352.68 (153.00) 298.77 (150.03) < 0.001TLA6/TLAC6 399.46 (53.70) 377.67 (61.69) < 0.001 420.31 (125.53) 355.87 (130.06) < 0.001TLA7/TLAC7 392.97 (47.91) 368.37 (57.61) < 0.001 419.58 (110.74) 354.77 (122.10) < 0.001TLA8/TLAC8 379.35 (52.67) 350.00 (60.80) < 0.001 408.57 (112.79) 340.38 (122.75) < 0.001TLA9/TLAC9 369.25 (53.14) 334.84 (61.05) < 0.001 392.15 (108.84) 322.48 (114.98) < 0.001TLA10/TLAC10 350.03 (53.42) 321.20 (56.29) < 0.001 330.64 (116.47) 265.54 (113.97) < 0.001TLA11/TLAC11 292.56 (53.49) 275.01 (55.45) < 0.001 216.96 (124.73) 169.31 (104.40) < 0.001TLA12/TLAC12 237.36 (54.45) 232.52 (54.26) 0.010 90.16 (103.66) 71.18 (81.73) < 0.001ST 1037.79
(100.25)1094.13(118.69)
< 0.001 1090.65(101.44)
1166.36(108.00)
< 0.001
LIPA 305.59 (73.02) 278.40 (86.18) < 0.001 333.26 (95.09) 266.07 (102.78) < 0.001MVPA 96.62 (52.66) 67.46 (50.85) < 0.001 16.08 (17.97) 7.57 (12.14) < 0.001SATP 0.074 (0.02) 0.067 (0.02) < 0.001 0.09 (0.02) 0.07 (0.02) < 0.001ASTP 0.20 (0.05) 0.23 (0.09) < 0.001 0.28 (0.08) 0.35 (0.10) < 0.001DARE 0.66 (0.03) 0.65 (0.04) < 0.001 0.812 (0.093) 0.814 (0.094) 0.514M10 3.32 (0.34) 3.09 (0.42) < 0.001 3.71 (0.78) 3.10 (0.91) < 0.001L5 0.99 (0.11) 1.02 (0.14) < 0.001 0.05 (0.13) 0.06 (0.16) 0.005RA 0.54 (0.05) 0.50 (0.08) < 0.001 0.98 (0.06) 0.96 (0.09) < 0.001Timing of M10 832 (106.66) 830 (110.34) 0.634 833 (102.55) 829 (95.49) 0.297Timing of L5 234 (86.17) 239 (87.07) 0.223 156 (77.99) 158 (85.19) 0.774
TA, TLA refers to total acceleration and total log acceleration derived from the UK Biobank accelerometry data. TAC,TLAC refers to total activity count and total log activity count derived from the NHANES accelerometry data.
3.2.1 Prediction models in NHANES
Table 4 displays the univariate Cox regression results in the NHANES 2003-2005.
Variables are ranked in the decreasing order of the ten-fold cross-validated Concordance
(10f-cv-C). The most predictive variable is age with a 10f-cv-C of 0.729. The second
most predictive is TAC, an accelerometer-derived summary, with a 10f-cv-C of 0.713.
The next 12 variables are all accelerometer-derived summaries and have 10f-cv-C
from 0.693 (MVPA) to 0.633 (SATP). Self reported mobility problem has a 10f-cv-C of
0.618, while other traditional predictors have substantially smaller 10f-cv-C, including
education (0.578), drinking status (0.571), smoking (0.564), gender (0.560), diabetes
(0.550), CHF (0.546), CHD (0.542), cancer (0.542), stroke (0.540), race (0.523), and
25

BMI (0.511). These results indicate that in univariate prediction models objective
measures of physical activity derived from accelerometers substantially outperform
traditional predictors of mortality.
[32] shows the results of univariate logistic regression with outcome of interest
as 5-year mortality in the NHANES 2003-2005 for adults aged 50 years and older.
Variables are ranked based on ten-fold cross-validated AUC. The most predictive
variable is TAC with ten-fold cross-validated AUC of 0.771, and the second most
predictive variable is age with ten-fold cross-validated AUC of 0.758. The next 9
predictors are all accelerometer-derived summaries. Two similarities between results
presented in table 4 and those [32] are: (1) age and TAC are the two most predictive
variable of mortality; (2) physical activity-related variables outperform traditional
predictors of mortality. However, in our study, age is the most predictive predictor
while in [32] TAC is. While the overall message is the same, the exact order of
accelerometer-derived summaries is not identical. Possible explanations are: (1)
different models (Cox versus logistic regression) and evaluation criteria for prediction
performance (cross validated C index versus AUC); (2) different number of deaths in
the two studies (783 during the entire follow up period compared to 297 in the first
five years after the baseline visit); and (3) the large proportion of deaths after five
years, when age is likely to be a stronger predictor.
We further explored the best combinations of mortality predictors by conducting
forward selection using 10f-cv-C as the criterion for selecting and stopping the procedure
of introducing new variables. Table 5 displays the results of two forward selection
procedures for mortality prediction with two different stopping rules for introducing
additional variables. Both approaches use the all-variable-candidate approach, that
is at every step both traditional and accelerometry-derived variables are allowed to
enter the model. Predictors are listed (ranked) according to the order in which they
26
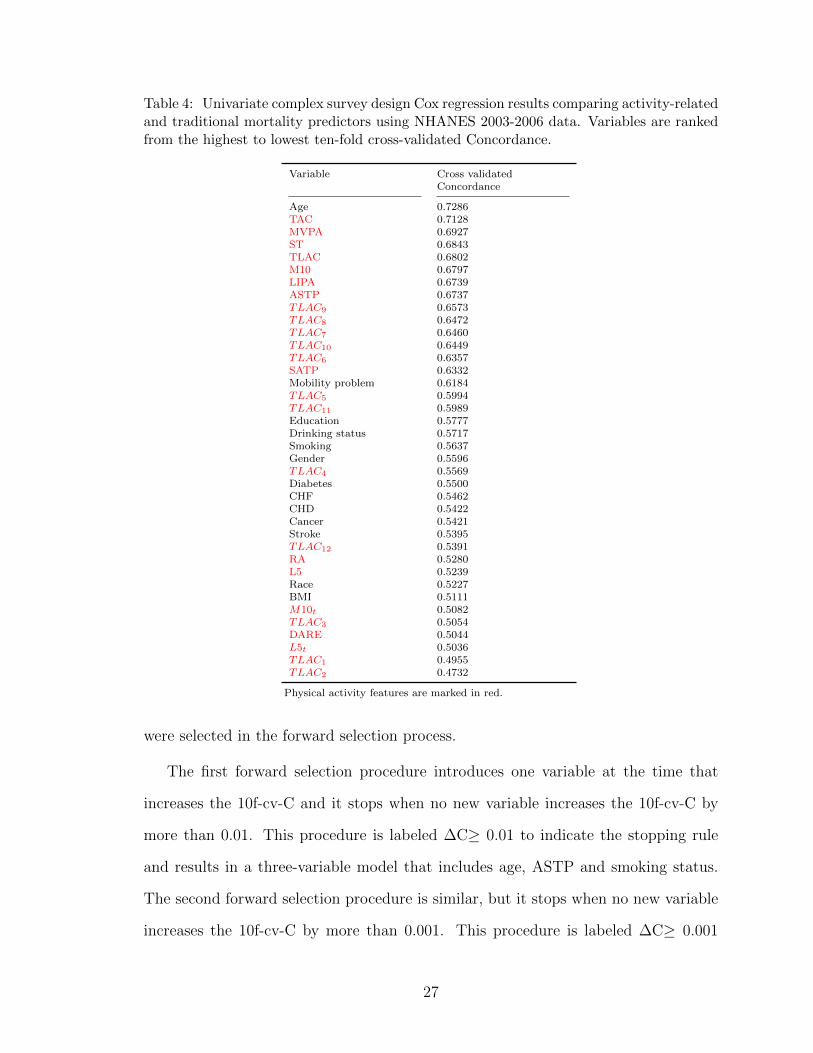
Table 4: Univariate complex survey design Cox regression results comparing activity-relatedand traditional mortality predictors using NHANES 2003-2006 data. Variables are rankedfrom the highest to lowest ten-fold cross-validated Concordance.
Variable Cross validatedConcordance
Age 0.7286TAC 0.7128MVPA 0.6927ST 0.6843TLAC 0.6802M10 0.6797LIPA 0.6739ASTP 0.6737TLAC9 0.6573TLAC8 0.6472TLAC7 0.6460TLAC10 0.6449TLAC6 0.6357SATP 0.6332Mobility problem 0.6184TLAC5 0.5994TLAC11 0.5989Education 0.5777Drinking status 0.5717Smoking 0.5637Gender 0.5596TLAC4 0.5569Diabetes 0.5500CHF 0.5462CHD 0.5422Cancer 0.5421Stroke 0.5395TLAC12 0.5391RA 0.5280L5 0.5239Race 0.5227BMI 0.5111M10t 0.5082TLAC3 0.5054DARE 0.5044L5t 0.5036TLAC1 0.4955TLAC2 0.4732
Physical activity features are marked in red.
were selected in the forward selection process.
The first forward selection procedure introduces one variable at the time that
increases the 10f-cv-C and it stops when no new variable increases the 10f-cv-C by
more than 0.01. This procedure is labeled ∆C≥ 0.01 to indicate the stopping rule
and results in a three-variable model that includes age, ASTP and smoking status.
The second forward selection procedure is similar, but it stops when no new variable
increases the 10f-cv-C by more than 0.001. This procedure is labeled ∆C≥ 0.001
27

to indicate the stopping rule and results is a ten-variable model that includes age,
ASTP, smoking status, CHF, drinking status, gender, mobility problem, diabetes,
BMI and education. When fitting the model, ASTP was standardized by dividing
it by its standard deviation. In the three-variable model, the hazard for death is
1.565 times higher for a one standard deviation increase in ASTP when controlling
for age and smoking status (95% CI: (1.427, 1.717), p < 0.000). In the ten-variable
model, the hazard for death is 1.443 times higher for one standard deviation increase
in ASTP when controlling for age, smoking status, CHF, drinking status, gender,
mobility problem, diabetes, BMI and education (95% CI: (1.331, 1.564), p < 0.000).
We have also implemented a two-stage forward selection procedure to study the
added prediction performance of accelerometry-derived physical activity summaries
to that of traditional risk factors. In the first stage of this procedure we conducted
forward selection using only traditional mortality predictors. In the second stage
we introduce accelerometry-derived physical activity summaries to the final model
including traditional risk factors. The stopping rule was the same for both stages and
the same variable inclusion rules: an increase in 10f-cv-C greater than either 0.01 or
0.001. Both rules were labeled as before, ∆C≥ 0.01 and ∆C≥ 0.001, respectively.
Table 6 displays the two stage forward selection results for the two stopping/inclusion
rules, respectively. The first model using ∆C≥ 0.01 included age, mobility problem,
and smoking as traditional risk factors and ASTP as physical activity summary. The
additional increase in 10f-cv-C for adding ASTP was 0.014, comparable to the one for
mobility problem (0.019) and smoking (0.015), after accounting for age. In the model
including all four variables there is a strong association between ASTP (standardized
by dividing by the standard deviation) and risk of mortality (hazard ratio=1.461, 95%
CI: (1.340, 1.594), p-value< 0.001). The second model using ∆C≥ 0.001 included
age, mobility problem, smoking, CHF, drinking status, gender, diabetes, BMI, and
28

Table 5: Forward selection results for activity-related and traditional mortality predictorsusing NHANES 2003-2006 data, with time-to-death as outcome. Stopping rules for variableselection are ∆C≥ 0.01 and ∆C≥ 0.001
Stopping rule: ∆C≥ 0.01
Variable Hazard ratio (95% CI) p-value CumulativeConcordancea
∆C
Age 1.095 (1.084, 1.105) 0.000*** 0.728 0.728ASTPb 1.565 (1.427, 1.717) 0.000 *** 0.758 0.030Smoking 0.770 0.012
Never 1.0 (reference)Former 1.473 (1.205, 1.801) 0.000***Current 2.640 (2.128, 3.274) 0.000***
Stopping rule: ∆C≥ 0.001
Variable Hazard ratio (95% CI) p-value CumulativeConcordancea
∆C
Age 1.088 (1.076, 1.100) 0.000*** 0.728 0.728ASTPb 1.443 (1.331, 1.564) 0.000 *** 0.758 0.030Smoking 0.770 0.012
Never 1.0 (reference)Former 1.252 (1.011, 1.552) 0.040*Current 2.019 (1.626, 2.507) 0.000***
CHF 0.777 0.007No 1.0 (reference)Yes 1.943 (1.447, 2.608) 0.000***
Drinking status 0.783 0.006Moderate drinker 1.0 (reference)Non-Drinker 1.398 (1.137, 1.719) 0.001**Heavy Drinker 1.898 (1.253, 2.877) 0.002**Missing alcohol 1.663 (0.986, 2.807) 0.057
Gender 0.788 0.005Male 1.0 (reference)Female 0.584 (0.478, 0.715) 0.000***
Mobility problem 0.792 0.004No Difficulty 1.0 (reference)Any Difficulty 1.432 (1.272, 1.612) 0.000***
Diabetes 0.794 0.002No 1.0 (reference)Yes 1.338 (1.110, 1.613) 0.002**
BMI 0.795 0.001Normal 1.0 (reference)Underweight 2.404 (1.097, 5.269) 0.028*Overweight 0.850 (0.735, 0.984) 0.030*Obese 0.968 (0.802, 1.168) 0.733
Education 0.796 0.001Less than high school 1.0 (reference)High school 0.912 (0.698, 1.192) 0.501More than high school 0.731 (0.573, 0.933) 0.012*
*p < 0.05, **p < 0.01, ***p < 0.001a 10-fold cross-validated Concordanceb ASTP is standardized by dividing by its standard deviation
stroke as traditional risk factors. It also included ASTP and TLAC11 as physical
activity summaries. The additional increase in 10f-cv-C for adding ASTP was 0.009,
larger than the increase for all variables except age, mobility problem, and smoking.
In the model including all variables there is a strong association between ASTP
29

(standardized by dividing by the standard deviation) and risk of mortality (hazard
ratio=1.383, 95% CI: (1.265, 1.512), p-value< 0.001). For the second model, TLAC11
and RA also entered model, but corresponded to an increase of 0.001 in 10f-cv-C
respectively, and their association with mortality was not statistically significant in
the joint model.
3.2.2 Prediction models in UK Biobank
Table 7 displays the univariate Cox regression results in the UK Biobank. Variables
are ranked in decreasing order of the 10f-cv-C. The top five most predictive variable
are accelerometer-derived summaries with the most predictive variable being TA with
a 10f-cv-C of 0.685. The most predictive non-physical activity related variable is
age with a 10f-cv-C of 0.669. The next 9 variable are all accelerometer-derived
summaries and have 10f-cv-C from 0.653 (TLA10) to 0.608 (TLA6). Besides age, other
traditional mortality predictors have much smaller 10f-cv-C including longstanding
illness/disability with a 10f-cv-C of 0.601, self-reported overall health (0.598), gender
(0.590), cigarette smoking (0.586), high blood pressure (0.581), usual walking speed
(0.577), BMI (0.567), alcohol (0.548), cancer (0.537), right hand grip strength (0.534),
diabetes (0.533), heart attack (0.520), stroke (0.507), illness or injury in the past
2 years (0.502) and race (0.501). Similar to NHANES 2003-2005, in univariate
prediction models objective measures of physical activity derived from accelerometers
substantially outperform traditional predictors of mortality.
Table 8 displays the first forward selection procedure with the all-variable-candidate
approach discussed above; see Section 3.2.1. The first model using ∆C≥ 0.01 included
total acceleration (TA), age and relative amplitude (RA). The second model using
∆C≥ 0.001 include total acceleration (TA), age, relative amplitude (RA), longstanding
illness/disability, cigarette smoking, injury/illness within past 2 years, gender, cancer
30

Table 6: Results for the two-stage forward selection of mortality risk using NHANES 2003-2006. The first stage performed forward selection on traditional mortality predictors. Thesecond stage started with the final model from the first stage and added accelerometry-derived physical activity summaries. Variables were included as long as either ∆C≥ 0.01or ∆C≥ 0.001
Stopping rule: ∆C≥ 0.01
Variable Hazard ratio (95% CI) p-value CumulativeConcordancea
∆C
Age 1.091 (1.080, 1.102) 0.000*** 0.729 0.729Mobility problem 0.748 0.019
No Difficulty 1.0 (reference)Any Difficulty 1.564 (1.383, 1.768) 0.000***
Smoking 0.763 0.015Never 1.0 (reference)Former 1.454 (1.192, 1.775) 0.000***Current 2.544 (2.016, 3.210) 0.000***
ASTPb 1.461 (1.340, 1.594) 0.000*** 0.777 0.014
Stopping rule: ∆C≥ 0.001
Variable Hazard ratio (95% CI) p-value CumulativeConcordancea
∆C
Age 1.089 (1.077, 1.101) 0.000*** 0.729 0.729Mobility problem 0.748 0.019
No Difficulty 1.0 (reference)Any Difficulty 1.448 (1.276, 1.644) 0.000***
Smoking 0.763 0.015Never 1.0 (reference)Former 1.246 (0.993, 1.563) 0.057Current 2.079 (1.650, 2.620) 0.000***
CHF 0.770 0.007No 1.0 (reference)Yes 1.950 (1.450, 2.623) 0.000***
Drinking status 0.777 0.007Moderate drinker 1.0 (reference)Non-Drinker 1.443 (1.176, 1.769) 0.000***Heavy Drinker 1.894 (1.251, 2.866) 0.003**Missing alcohol 1.790 (1.092, 2.935) 0.021*
Gender 0.783 0.006Male 1.0 (reference)Female 0.617 (0.499, 0.763) 0.000***
Diabetes 0.786 0.003No 1.0 (reference)Yes 1.331 (1.102, 1.607) 0.003**
BMI 0.787 0.001Normal 1.0 (reference)Underweight 2.283 (1.021, 5.103) 0.044*Overweight 0.828 (0.716, 0.957) 0.011*Obese 0.937 (0.771, 1.140) 0.517
Stroke 0.787 0.001No 1.0 (reference)Yes 1.282 (0.961, 1.709) 0.091
ASTPb 1.383 (1.265, 1.512) 0.000*** 0.796 0.009TLAC11
b 0.901 (0.802, 1.013) 0.080 0.797 0.001RAb -0.076 (0.863, 0.996) 0.037 0.798 0.001
*p < 0.05, **p < 0.01, ***p < 0.001a 10-fold cross-validated Concordanceb Active-to-sedentary transition probability (ASTP), TLAC11 and relative amplitude (RA) are standardized bydividing by the standard deviation
31

Table 7: Univariate Cox regression results on activity-related and non-activity relatedmortality predictors using UK Biobank data. Variables are ranked from the highest tolowest ten-fold cross-validated Concordance.
Variable Cross validatedConcordance
TA 0.6851MVPA 0.6811RA 0.6738M10 0.6725TLA9 0.6716Age 0.6694TLA10 0.6531TLA 0.6530ST 0.6522TLA8 0.6465TLA7 0.6373DARE 0.6238ASTP 0.6176SATP 0.6158TLA6 0.6082Longstanding illness/disability 0.6014LIPA 0.6006Self-reported overall health 0.5978TLA11 0.5959TLA5 0.5956Gender 0.5898Cigarette smoking 0.5864High blood pressure 0.5807Usual walking speed 0.5765L5 0.5724Body mass index 0.5667TLA2 0.5660TLA4 0.5510TLA3 0.5489Alcohol 0.5479TLA1 0.5471Cancer 0.5366Right hand grip strength 0.5343Diabetes 0.5329TLA12 0.5224Heart attack 0.5195L5t 0.5178Stroke 0.5072M10t 0.5072Illness or injury in the past 2 years 0.5024Race 0.5007
Physical activity features are marked in red.
and high blood pressure. When fitting the model, TA and RA were standardized
by dividing by their respective standard deviations. In the three-variable model,
the hazard for death decreased by 0.728 times for one standard deviation increase
in TA when controlling for age and RA (95% CI: (0.660, 0.804), p< 0.001). The
hazard for death is 0.674 times lower for one standard deviation increase in RA when
controlling for age and TA (95% CI: (0.632, 0.719), p< 0.001). In the nine-variable
32

model, the hazard for death is 0.758 times lower for one standard deviation increase in
TA when controlling for age, RA, longstanding illness/disability, cigarette smoking,
injury/illness within past 2 years, gender, cancer and high blood pressure (95% CI:
(0.686, 0.837), p< 0.001). The hazard for death is 0.741 times lower for one standard
deviation increase in RA when controlling for age, RA, longstanding illness/disability,
cigarette smoking, injury/illness within past 2 years, gender, cancer and high blood
pressure (95% CI: (0.693, 0.793), p< 0.001).
Table 8: Forward selection results on activity-related and traditional mortality predictorsusing UK Biobank data, with outcome of interest as time-to-death. Stopping rules forvariable selection are ∆C≥ 0.01 and ∆C≥ 0.001
Stopping rule: ∆C≥ 0.01
Variable Hazard ratio (95% CI) p-value CumulativeConcordancea
∆C
TAb 0.728 (0.660, 0.804) 0.000*** 0.685 0.685Age 1.080 (1.068, 1.093) 0.000*** 0.721 0.036RAb 0.674 (0.632, 0.719) 0.000*** 0.734 0.014
Stopping rule: ∆C≥ 0.001
Variable Hazard ratio (95% CI) p-value CumulativeConcordancea
∆C
TAb 0.758 (0.686, 0.837) 0.000*** 0.685 0.685Age 1.074 (1.061, 1.087) 0.000*** 0.721 0.036RAb 0.741 (0.693, 0.793) 0.000*** 0.734 0.014Longstandingillness/disability
0.743 0.009
No 1.0 (reference)Yes 1.532 (1.329, 1.765) 0.000***
Cigarette Smoking 0.750 0.007Never 1.0 (reference)Former 1.149 (0.991, 1.332) 0.065Current 2.380 (1.934, 2.928) 0.000***
Injury/illness within past2 years
0.754 0.004
No 1.0 (reference)Yes 0.965 (0.840, 1.109) 0.614
Gender 0.757 0.003Female 1.0 (reference)Male 1.400 (1.210, 1.620) 0.000***
Cancer 0.759 0.002No 1.0 (reference)Yes 1.633 (1.346, 1.981) 0.000***
High blood pressure 0.760 0.001No 1.0 (reference)Yes 1.228 (1.064, 1.419) 0.005**
*p < 0.05, **p < 0.01, ***p < 0.001a 10-fold cross-validated Concordanceb TA and RA are standardized by dividing by their standard deviation respectively.
Table 9 provides the two stage forward selection results for the two stopping/inclusion
33

rules, respectively. The first model using ∆C≥ 0.01 included age, self-reported overall
health, gender as traditional risk factors and RA as physical activity summary. The
additional increase in 10f-cv-C for adding RA was 0.030, comparable to the one for
self-reported overall health (0.031) and gender (0.013) after accounting for age. In
this model, there is a strong association between RA (standardized by dividing by
the standard deviation) and risk of mortality (hazard ratio=0.659, 95% CI: (0.623,
0.696), p-value< 0.001). The second model using ∆C≥ 0.001 included age, self-
reported overall health, gender, cigarette smoking, longstanding illness/disability,
injury/illness within past 2 years, high blood pressure, cancer as traditional risk
factors and RA, TLA9 as two physical activity summaries. The additional increase
in 10f-cv-C for adding RA was 0.021 and for adding TLA9 was 0.002. The added
increase in 10f-cv-C for adding RA was larger than the increase for all variables
except age and self-reported overall health. In the second model, there is a strong
association between RA (standardized by dividing by the standard deviation) and risk
of mortality (hazard ratio=0.754, 95% CI: (0.705, 0.806), p-value< 0.001). And there
is also a strong association between TLA9 and risk of mortality (hazard ratio=0.996,
95% CI: (0.994, 0.997), p-value< 0.001).
4 Discussion
In this thesis, we have investigated the absolute and relative mortality prediction
performance of objective measures of physical activity obtained from accelerometers
in the UK Biobank and the National Health and Nutrition Examination Survey
(NHANES). Despite the difference in the target population, recording and encoding
of variables (traditional risk factors and physical activity variables), accelerometer
(location, placement, measurement resolution), time of accelerometer wear relative
to baseline measurements (see section 1, section 3.2 and section 3.1.1 for detail), we
34
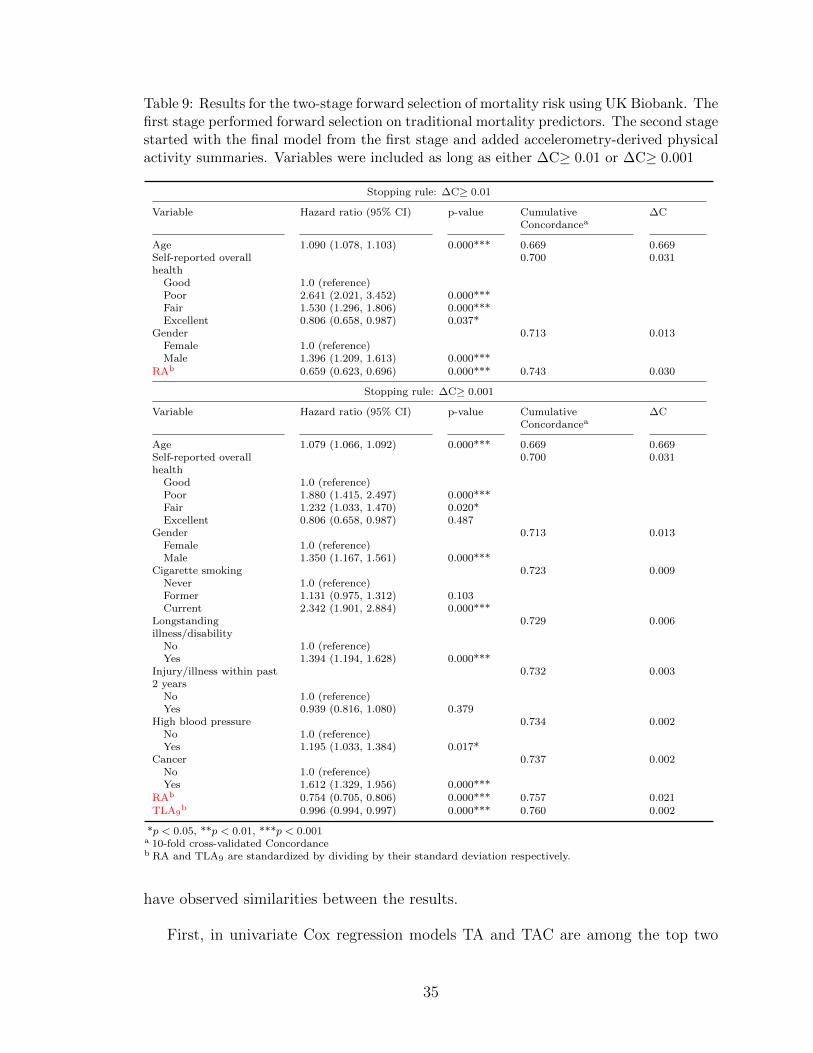
Table 9: Results for the two-stage forward selection of mortality risk using UK Biobank. Thefirst stage performed forward selection on traditional mortality predictors. The second stagestarted with the final model from the first stage and added accelerometry-derived physicalactivity summaries. Variables were included as long as either ∆C≥ 0.01 or ∆C≥ 0.001
Stopping rule: ∆C≥ 0.01
Variable Hazard ratio (95% CI) p-value CumulativeConcordancea
∆C
Age 1.090 (1.078, 1.103) 0.000*** 0.669 0.669Self-reported overallhealth
0.700 0.031
Good 1.0 (reference)Poor 2.641 (2.021, 3.452) 0.000***Fair 1.530 (1.296, 1.806) 0.000***Excellent 0.806 (0.658, 0.987) 0.037*
Gender 0.713 0.013Female 1.0 (reference)Male 1.396 (1.209, 1.613) 0.000***
RAb 0.659 (0.623, 0.696) 0.000*** 0.743 0.030
Stopping rule: ∆C≥ 0.001
Variable Hazard ratio (95% CI) p-value CumulativeConcordancea
∆C
Age 1.079 (1.066, 1.092) 0.000*** 0.669 0.669Self-reported overallhealth
0.700 0.031
Good 1.0 (reference)Poor 1.880 (1.415, 2.497) 0.000***Fair 1.232 (1.033, 1.470) 0.020*Excellent 0.806 (0.658, 0.987) 0.487
Gender 0.713 0.013Female 1.0 (reference)Male 1.350 (1.167, 1.561) 0.000***
Cigarette smoking 0.723 0.009Never 1.0 (reference)Former 1.131 (0.975, 1.312) 0.103Current 2.342 (1.901, 2.884) 0.000***
Longstandingillness/disability
0.729 0.006
No 1.0 (reference)Yes 1.394 (1.194, 1.628) 0.000***
Injury/illness within past2 years
0.732 0.003
No 1.0 (reference)Yes 0.939 (0.816, 1.080) 0.379
High blood pressure 0.734 0.002No 1.0 (reference)Yes 1.195 (1.033, 1.384) 0.017*
Cancer 0.737 0.002No 1.0 (reference)Yes 1.612 (1.329, 1.956) 0.000***
RAb 0.754 (0.705, 0.806) 0.000*** 0.757 0.021TLA9
b 0.996 (0.994, 0.997) 0.000*** 0.760 0.002
*p < 0.05, **p < 0.01, ***p < 0.001a 10-fold cross-validated Concordanceb RA and TLA9 are standardized by dividing by their standard deviation respectively.
have observed similarities between the results.
First, in univariate Cox regression models TA and TAC are among the top two
35

predictors of mortality in UK Biobank ad NHANES, respectively. The 10f-cv-C
criterion was used for quantifying model performance. Except for age, the top
predictors in both studies This is a validation that physical activity features derived
from accelerometers are among the strongest predictors of all-cause mortality.
Second, in forward selection multi-variable prediction models we used two approaches.
The first used an all-variables-candidate approach at every step of the selection
procedure. The second used a two step approach that included traditional risk factors
and then added accelerometer-derived physical activity summaries. Two criteria were
used for stopping, one when 10f-cv-C does not improve by more than 0.01 (labeled
∆C≥ 0.01) and the other one when 10f-cv-C does not improve by more than 0.001
(labeled ∆C≥ 0.001). Using the all-variable-candidate approach and the ∆C≥ 0.01
criterion in NHANES resulted in a three variable model including age, ASTP and
smoking status (10f-cv-C= 0.770. Changing the criterion to ∆C≥ 0.001 resulted in
a ten-variable model including age, ASTP, smoking status, CHF, drinking status,
gender, mobility problem, diabetes, BMI and education (10f-cv-C= 0.796). Using the
all-variable-candidate approach and the ∆C≥ 0.01 criterion in UK Biobank resulted
in a three-variable model including TA, age and RA (10f-cv-C= 0.734). Changing
the criterion to ∆C≥ 0.001 resulted in a nine-variable model including TA, age, RA,
longstanding illness/disability, cigarette smoking, injury/illness within past 2 years,
gender, cancer and high blood pressure (10f-cv-C= 0.760).
Using the two stage approach and the ∆C≥ 0.01 criterion in NHANES resulted
in four variable model including age, mobility problem, smoking status as traditional
risk factors and ASTP as physical activity summary (10f-cv-C= 0.777). Changing
the criterion to ∆C≥ 0.001 resulted in a 12-variable model including age, mobility
problem, smoking status, CHF, drinking status, gender, diabetes, BMI, stroke as
traditional risk factors and ASTP, TLAC11 and RA as physical activity summaries
(10f-cv-C= 0.798). Using the two-stage approach and the ∆C≥ 0.01 criterion in UK
36

Biobank resulted in a four-variable model including age, self-reported overall health,
and gender as traditional risk factors and RA as physical activity summary (10f-cv-
C= 0.734). Changing the criterion to ∆C≥ 0.001 resulted in a 11-variable model
including age, self-reported overall health, gender, cigarette smoking, longstanding
illness/disability, injury/illness within past 2 years, high blood pressure, cancer as
traditional risk factors and RA and TLA9 as physical activity summaries. Both for
NHANES and UK Biobank models the added increase in 10f-cv-C when including
physical activity variables after including traditional risk factors is larger than for
most traditional risk factors that were added earlier. Moreover, the effect of the
added physical activity summaries is highly significant in the joint models even after
accounting for traditional predictors of mortality. We conclude that actigraphy-
derived physical activity summaries are at least as predictive of mortality as traditional
risk factors and they often outperform them.
The models for NHANES and UK Biobank have many similarities and some
differences. For example, the objective physical activity summaries included in the
forward selecton models are not the same for NHANES and UK Biobank. A potential
reason for these differences is the fact that actigraphy measurements are different
and were collected using different protocols. Another potential reason is the different
correlations between age and physical activity variables in the two studies. In NHANES,
the highest correlation between age and PA variables is for age and TAC (−0.431).
This is likely the reason why TAC is not selected into the model when age is already
included in it. This happens despite the fact that TAC is the second most predictive
variable in single-variable models. However in UK Biobank TA outperforms age and is
selected into the forward selection model using the all-variables-candidate approach.
Thus, we need to be cautious when interpreting the specific PA variables that has
been selected in the final model. Moreover, in NHANES relative amplitude (RA) is
highly concentrated near 1, which may explain why RA is not a strong predictor in
37

NHANES but is a strong predictor in UK Biobank.
The results in this thesis provide additional evidence and strengthen existing
literature indicating that: (1) accelerometer-derived physical activity summaries outperform
traditional risk factors in terms of time to death prediction performance; and (2)
accelerometer-derived physical activity summaries improve mortality prediction performance
above and beyond traditional risk factors.
In this study, we used a Cox proportional hazards model to quantify the association
between mortality and traditional risk factors and accelerometer-derived summaries.
A similar approach was used in [9] while logistic regression and 5-year mortality was
used in [32]. There are similarities and differences between the findings in this thesis
and the results published in [32]. As described in Section 3.2.1, possible explanations
for these differences include: (1) different models (Cox versus logistic regression) and
evaluation criteria for prediction performance (cross validated C index versus AUC);
(2) different number of deaths in the two studies (783 during the entire follow up
period compared to 297 in the first five years after the baseline visit); and (3) the
large proportion of deaths after five years, when age is likely to be a stronger predictor.
This thesis complements the rich scientific literature supporting the idea that
physical activity is a modifiable predictor of mortality. Using the best available
public data (NHANES and UK Biobank) on acccelerometer-derived physical activity
summaries we have shown that: (1) objective measures of physical activity are
stronger predictors of mortality than traditional risk factors; (2) results are largely
consistent between the two studies despite the many differences in sampling and
measurement protocols; and (3) the specific predictors of mortality may vary with
the prediction time horizon (3.14 average follow up time in UK Biobank versus 9.69
average follow up time in NHANES).
38

S1 Appendix
S1.1 Dictionary
Table S1 listed the calculation for the physical activity features we have mentioned
in this study.
Table S1: Description and formula to derive activity-related variables.
Variable Description Formulaa
TAi Total acceleration 1m
∑︁mj=1
∑︁1440t=1
∑︁12j=1 Aijt
TLAi Total log acceleration 1m
∑︁mj=1
∑︁1440t=1 log(1 +
∑︁12j=1 Aijt)
TLAi x-x+2 Total log acceleration during two hour windows 1m
∑︁mj=1
∑︁60x+120t=60x+1 log(1 +
∑︁12j=1 Aijt)
STi Sedentary activity minutes 1m
∑︁mj=1
∑︁1440t=1 I(
∑︁12j=1 Aijt < 30)
LIPAi Light-intensity physical activity minutes 1m
∑︁mj=1
∑︁1440t=1 I(30 ≤
∑︁12j=1 Aijt < 100)
MVPAi Moderate-to-vigorous activity minutes 1m
∑︁mj=1
∑︁1440t=1 I(
∑︁12j=1 Aijt ≥ 100)
DAREi Dynamic activity ratio estimate. It represents 1m
∑︁mj=1
∑︁1200t=481 log(1+
∑︁12j=1 Aijt)∑︁1440
t=1 log(1+∑︁12
j=1 Aijt)
the percentage of daytime log accelerationSATPi Sedentary/sleep to active transition probability 1
SboutiASTPi Active to sedentary/sleep transition probability 1
AboutiM10i Minute average of the total log acceleration during ——
the ten most active hours of the dayL5i Minute average of the total log acceleration during ——
the five least active hours of the dayTiming ofM10i
Mid-point of the ten most active hours of the day ——
Timing of L5i Mid-point of the five least active hours of the day ——
RAi Relative amplitude between M10 and L5, M10i−L5iM10i+L5i
the relative difference between between M10 and L5
a Aijt indicate 5s acceleration at time j for subject i, day m.b TA indicate the length of active bouts. nA represent the number of active bouts.c TS indicate the length of sedentary/sleep bouts. nS represent the number of sedentary/sleep bouts.
S1.2 Visualization of physical activity summaries
Figure S1, figure S2 and figure S4 displays the distributions of accelerometry-derived
summaries within NHNAES and UK Biobank. Distributions are separated by alive
(blue) and deceased (red) status.
39

(a) TAC, NHANES(b) TLAC,NHANES
(c) L5, NHANES (d) M10, NHANES
(e) RA, NHANES(f) DARE,NHANES
(g) ST, NHANES (h) LIPA, NHANES
(i) MVPA,NHANES
(j) TLAC 12AM-2AM, NHANES
(k) TLAC 2AM-4AM, NHANES
(l) TLAC 4AM-6AM, NHANES
(m) TLAC 6AM-8AM, NHANES
(n) TLAC 8AM-10AM, NHANES
(o) TLAC 10AM-12PM, NHANES
(p) TLAC 12PM-2PM, NHANES
(q) TLAC 2PM-4PM, NHANES
(r) TLAC 4PM-6PM, NHANES
(s) TLAC 6PM-8PM, NHANES
(t) TLAC 8PM-10PM, NHANES
Figure S1: Distributions of physical activity variables in NHANES 2003-2005. Distributionsare separated by alive (blue) and deceased (red) status. Survey weights are not accountedfor.
40

(a) TLAC 10PM-12AM, NHANES
(b) ASTP,NHANES
(c) SATP,NHANES
Figure S2: (Continued) Distributions of physical activity variables in NHANES 2003-2005.Distributions are separated by alive (blue) and deceased (red) status. Survey weights arenot accounted for.
41

(a) TA, UKB (b) TLA, UKB (c) L5, UKB (d) M10, UKB
(e) RA, UKB (f) DARE, UKB (g) ST, UKB (h) LIPA, UKB
(i) MVPA, UKB(j) TLA 12AM-2AM, UKB
(k) TLA 2AM-4AM, UKB
(l) TLA 4AM-6AM,UKB
(m) TLA 6AM-8AM, UKB
(n) TLA 8AM-10AM, UKB
(o) TLA 10AM-12PM, UKB
(p) TLA 12PM-2PM, UKB
(q) TLA 2PM-4PM,UKB
(r) TLA 4PM-6PM,UKB
(s) TLA 6PM-8PM,UKB
(t) TLA 8PM-10PM, UKB
Figure S3: Distributions of physical activity variables in UK Biobank. Distributions areseparated by alive (blue) and deceased (red) status.
42

(a) TLA 10PM-12AM, UKB
(b) ASTP, UKB (c) SATP, UKB
Figure S4: (Continued) Distributions of physical activity variables in UK Biobank.Distributions are separated by alive (blue) and deceased (red) status.
43

References
[1] Daniel D. Bingham, Silvia Costa, Stacy A. Clemes, Ash C. Routen, Helen J.
Moore, and Sally E. Barber. Accelerometer data requirements for reliable
estimation of habitual physical activity and sedentary time of children during
the early years - a worked example following a stepped approach. Journal of
Sports Sciences, 2016. doi: 10.1080/02640414.2016.1149605.
[2] Marinela Capanu and Mithat Gonen. Building a nomogram for survey-weighted
cox models using r. Journal of Statistical Software, 64, 2015.
[3] D. R. Cox. Regression models and life-tables. Journal of the Royal Statistical
Society. Series B (Methodological), 34(2):187–220, 1972.
[4] J. Di, A. Leroux, J. Urbanek, and et al. Patterns of sedentary and active time
accumulation are associated with mortality in us adults: The nhanes study.
bioRxiv, 2017.
[5] A. Doherty and et al. Large scale population assessment of physical activity
using wrist worn accelerometers: The uk biobank study. PLoS One, 12(2), 2017.
doi: p.e0169649.
[6] Daniela Dunkler, Meinhard Ploner, Michael Schemper, and Georg Heinze.
Weighted cox regression using the r package coxphw. Journal of Statistical
Software, 84(2), 2018. doi: 10.18637/jss.v084.i02.
[7] Amy Ferguson, Laura M. Lyall, Rona J. Strawbridge JoeyWarda, Breda
Cullen, Nicholas Grahama, Claire L. Niedzwiedz, Keira J.A. Johnstona, Daniel
MacKaya, Stephany M. Biello, Jill P. Pell, Jonathan Cavanagh, Andrew M.
McIntosh, Aiden Doherty, Mark E.S. Bailey, DonaldM. Lyall, Cathy A.Wyse,
and Daniel J. Smith. Genome-wide association study of circadian rhythmicity in
44

71,500 uk biobank participants and polygenic association with mood instability.
EBioMedicine, 35, 2018.
[8] L. Ferrucci and D. Alley. Obesity, disability, and mortality: a puzzling link. Arch
Intern Med, 167:750–751, 2007. doi: 10.1001/archine.167.8.750.
[9] Ezra I. Fishman, Jeremy A. Steeves, Vadim Zipunnikov, Annemarie Koster,
David Berrigan, Tamara A. Harris, and Rachel Murphy. Association between
objectively measured physical activity and mortality in nhanes. Med Sci Sports
Exerc, 48(7):1303–1311, 2016. doi: 10.1249/MSS.0000000000000885.
[10] Centers for Disease Control and Prevention. About the national health
and nutrition examination survey. URL https://www.cdc.gov/nchs/nhanes/
about_nhanes.htm.
[11] A. Ganna and E. Ingelsson. 5 year mortality predictors in 498,103 uk biobank
participants: a prospective population-based study. Lancet, 386, 2015. doi:
10.1016/S0140-6736(15)60175-1.
[12] Jr Harrell, Frank E., Robert M. Cali, David B. Pryor, Kerry L. Lee, and
Robert A. Rosati. Evaluating the yield of medical tests. JAMA, 247(18):2543–
2546, 1982.
[13] Frank E Harrell Jr, with contributions from Charles Dupont, and many others.
Hmisc: Harrell Miscellaneous, 2019. URL https://CRAN.R-project.org/
package=Hmisc. R package version 4.3-0.
[14] Teresa L Hart, Ann M Swartz, Susan E Cashin, and Scott J Strath. How many
days of monitoring predict physical activity and sedentary behaviour in older
adults? International Journal of Behavioral Nutrition and Physical Activity, 8
(62), 2011.
45

[15] Vincent. T.van. Hees, Lukas. Gorzelniak, Emmanuel Carlos Dean. Leon, Martin.
Eder, Marcelo. Pias, Salman. Taherian, Ulf. Ekelund, Frida. Renstrom, Paul.W.
Franks, Alexander. Horsch, and Soren Brage. Separating movement and gravity
components in an acceleration signal and implications for the assessment of
human daily physical activity. Plos One, 8(4):e61691, 2013. doi: 10.1371/journal.
pone.0061691.
[16] M. Hildebrand, VT. VAN Hees, BH. Hansen, and U. Ekelund. Age
group comparability of raw accelerometer output from wrist- and hip-worn
monitors. Med Sci Sports Exerc, 46(9):1816–24, 2014. doi: 10.1249/MSS.
0000000000000289.
[17] Lina Jaeschke, Astrid Steinbrecher, Stephanie Jeran, Stefan Konigorski, and
Tobias Pischon. Variability and reliability study of overall physical activity
and activity intensity levels using 24h-accelerometry-assessed data. BMC Public
Health, 18:530, 2018.
[18] E. L. Kaplan and Paul Meier. Nonparametric estimation from incomplete
observations. Journal of the American Statistical Association, 53(282):457–481,
1958.
[19] Tarun R. Katapally and Nazeem Muhajarine. Towards uniform accelerometry
analysis: A standardization methodology to minimize measurement bias due to
systematic accelerometer wear-time variation. Journal of Sports Science and
Medicine, 13:379–386, 2014.
[20] Masha Kocherginsky, Megan Huisingh-Scheetz, Diane S. Lauderdale
William Dale, and Linda Waite. Measuring physical activity with hip
accelerometry among u.s. older adults: How many days are enough. PLoS ONE,
12(1):e0170082, 2017. doi: pone.0170082.
46

[21] S.G. Leveille, J.M. Guralnik, L. Ferrucci, and J.A. Langlois. Aging successfully
until death in old age: opportunities for increasing active life expectancy. Am J
Epidemiol, 149:654–664, 1999.
[22] Thomas Lumley. Analysis of complex survey samples. Journal of Statistical
Software, 9(1):1–19, 2004. R package verson 2.2.
[23] Thomas Lumley. survey: analysis of complex survey samples, 2019. R package
version 3.35-1.
[24] CHARLES E. MATTHEWS, BARBARA E. AINSWORTH, RAYMOND W.
THOMPSON, and JR. DAVID R. BASSETT. Sources of variance in daily
physical activity levels as measured by an accelerometer. Med. Sci. Sports Exerc,
34(8):1376–1381, 2002.
[25] United States Department of Health, Human Services, Centers for
Disease Control, Prevention, and National Center for Health Statistics. National
health and nutrition examination survey (nhanes), 2003-2004. Inter-university
Consortium for Political and Social Research, 2016. doi: 10.3886/ICPSR25503.
v7.
[26] R.R. Pate, M Pratt, Blair S.N., and et al. Physical activity and public health.
a recommendation from the centers for disease control and prevention and the
american college of sports medicine. JAMA, 273:402–407, 1995. doi: 10.1001/
jama.1995.03520290054029.
[27] R Core Team. R: A Language and Environment for Statistical Computing. R
Foundation for Statistical Computing, Vienna, Austria, 2019. URL https://
www.R-project.org/.
[28] Clare M. P. Roscoe, Rob S. James, and Michael J. Duncan. Accelerometer-based
47

physical activity levels differ between week and weekend days in british preschool
children. J. Funct. Morphol. Kinesiol., 4(65), 2019. doi: 0.3390/jfmk4030065.
[29] S. Sabia, VT. van Hees, MJ. Shipley, Trenell. MI, G. Hagger-Johnson, A. Elbaz,
M. Kivimaki, and A. Singh-Manoux. Association between questionnaire- and
accelerometer-assessed physical activity: the role of sociodemographic factors.
Am J Epidemiol, 179(6):781–90, 2014. doi: 10.1093/aje/kwt330.
[30] J.A. Schrack, V. Zipunnikov, J. Goldsmith, J. Bai, E.M. Simonsick,
C. Crainiceanu, and L. Ferrucci. Assessing the “physical cliff”: Detailed
quantification of age-related differences in daily patterns of physical activity.
J Gerontol A Biol Sci Med Sci, 69(8):973–979, 2014. doi: 10.1016/j.ypmed.2017.
05.030.
[31] Trost SG, McIver KL, and Pate RR. Conducting accelerometer-based activity
assessments in field-based research. Med Sci Sports Exerc, 37(11 Suppl):S531–43,
2005. doi: 10.1249/01.mss.0000185657.86065.98.
[32] Ekaterina Smirnova, Andrew Leroux, Quy Cao, Lucia Tabacu, and
Ciprian Crainiceanu Vadim Zipunnikov, and Jacek K. Urbanek. The
predictive performance of objective measures of physical activity derived from
accelerometry data for 5-year all-cause mortality in older adults: National health
and nutritional examination survey 2003–2006. Journals of Gerontology: Medical
Sciences, XX(XX):1–7, 2019. doi: 10.1093/gerona/glz193.
[33] Cathie Sudlow, John Gallacher, Naomi Allen, Valerie Bera, Paul Burton, John
Danesh, Paul Downey, Paul Elliott, Jane Green, Martin Landray, Bette Liu,
Paul Matthews, Giok Ong, Jill Pell, Alan Silman, Alan Young, Tim Sprosen,
Tim Peakman, and Rory Collins. Uk biobank: An open access resource for
48
identifying the causes of a wide range of complex diseases of middle and old age.
PLoS Med, 12(3):e1001779, 2015. doi: 10.1371/journal.pmed.1001779.
[34] Vincent van Hees. Accelerometer data processing with GGIR, 2019. URL
https://cran.r-project.org/web/packages/GGIR/vignettes/GGIR.html.
R package GGIR version 1.10-7.
[35] VT. van Hees, L. Gorzelniak, and et al. Separating movement and gravity
components in an acceleration signal and implications for the assessment of
human daily physical activity. PLoS ONE, 8(4), 2013. doi: 10.1371/journal.
pone.0061691.
[36] R.Varma. Vijay, D. Dey, A. Leroux, J. Di, J. Urbanek, L. Xiao, and
V. Zipunnikov. Re-evaluating the effect of age on physical activity over the
lifespan. Preventive Medicine, 101:102–108, 2017. doi: 10.1016/j.ypmed.2017.
05.030.
49

Biographical sketch
Shiyao Xu received the Bachelor of Science degree in Biology from Tsinghua University
in 2018, and enrolled in the ScM program in biostatistics at Johns Hopkins Bloomberg
School of Public Health in 2018. During her first year of the master program, she
joined the Wearable and Implantable Technology research group in 2019. She has
been working on the mortality prediction performance of physical activity using the
UK Biobank and NHANES dataset. Starting August 2020, she will be starting her
journey as a PhD candidate at the department of biostatistics at Johns Hopkins
Bloomberg School of Public Health.
50