precipitation variations over the iberian peninsula under climate change conditions c. rodríguez...
TRANSCRIPT

Precipitation variations over the Iberian peninsula under climate change conditions
C. Rodríguez Puebla y S. NietoDept. de Física General y de la Atmósfera
Universidad de Salamanca
28/10/2008 Seminario CLIVAR_Es , Madrid 11-13 Febrero 2009
Motivation
Why precipitation shows a trend to decrease over the Iberian peninsula?
Trenberth, et al. 2007: Observations: Surface and Atmospheric Climate Change. In: Climate Change 2007: The Physical Science Basis. Contribution of Working Group I to the Fourth Assessment Report of the Intergovernmental Panel on Climate Change Cambridge University Press, Cambridge
2

IPCC report 2007
28/10/20083

Observed precipitation time series (DJFM)
Datos de la AEMet
Kendall’Z = -2.2
Datos grid (CRU-Ensembles)
Kendall’Z = -1.2
Precipitation trend AEMet Precipitation trend Cru_Ensemble)
4
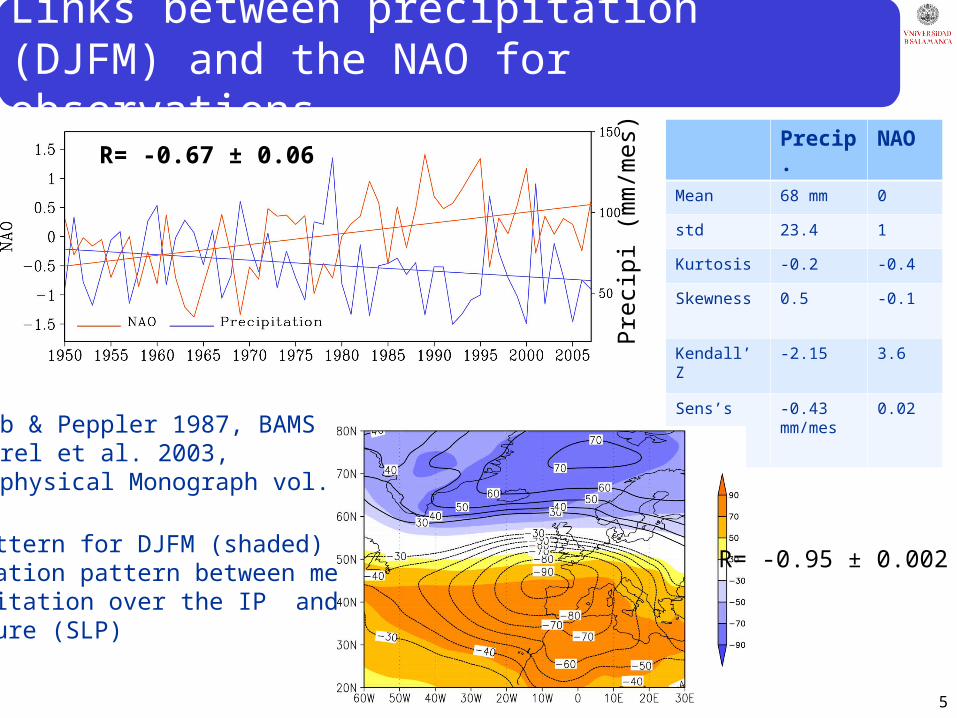
Links between precipitation (DJFM) and the NAO for observations
Prec
ipi (
mm
/mes
)
NAO pattern for DJFM (shaded)Correlation pattern between mean precipitation over the IP and sea level pressure (SLP)
R= -0.67 ± 0.06
Lamb & Peppler 1987, BAMSHurrel et al. 2003, Geophysical Monograph vol. 134
Precip. NAO
Mean 68 mm 0
std 23.4 1
Kurtosis -0.2 -0.4
Skewness 0.5 -0.1
Kendall’Z -2.15 3.6
Sens’s -0.43 mm/mes
0.02
5
R= -0.95 ± 0.002

NAO effects on precipitation (DJFM)
EOF1 of precipitation_OBS (shaded) and correlation between NAO and precipitation(contour lines)
Var=74%
R= -0.67 ±0.06
6
R= -0.92 ± 0.03
28/10/20087
What models tell us about the trend of precipitation ?
7

Data: WCRP CMIP3, PCMDIhttp://www-pcmdi.llnl.gov/
Model names Center, Country Resolution and References
BCCR-BCM2.0 Bjerknes Centre for Climate Research, NorwayT63 L31(Deque et al., 1994)
CGCM3.1 (T63) Canadian Centre for Climate Modelling and Analysis, Canada T63 L31(Flato et al., 2000)
CSIRO-Mk3.5 Commonwealth Scientific and Industrial Research Organisation, Australia T63 L18(Gordon and Coauthors, 2002)
ECHAM5/MPI-OM Max Planck Institute for Meteorology, Germany T63 L31(Roeckner and Coauthors, 2003)
ECHO-G Meteorological Institute of the University of Bonn, Meteorological Research Institute of the Korea, Germany, Korea
T30 L19
FGOALS-g1.0 National Key Laboratory of Numerical Modeling for Atmospheric Sciences and Geophysical Fluid Dynamics, China
T42 L26
GFDL-CM2.1 NOAA/Geophysical Fluid Dynamics Laboratory, USA 2.0 o X 2.5 o L24(Delworth et al., 2006)
INGV-SXG Instituto Nazionale di Geofisica e Vulcanologia, Italy T106 L19INM-CM3.0 Institute for Numerical Mathematics, Russia 4 o X 5 o L21IPSL-CM4 Institut Pierre Simon Laplace, France 2.5 o x 3.75 o L19MIROC3.2(medres) Center for Climate System Research (University of Tokyo, Japan T42 L20
MRI-CGCM2.3.2 Meteorological Research Institute, Japan T42 L30
PCM National Center for Atmospheric Research, USA T42 L26(Kiehl et al., 2004)
UKMO-HadCM3 Hadley Centre for Climate Prediction and Research/Met. Office, UK 2.5 o X 3.75 o L19(Pope et al., 2007)
UKMO_HadGEM1 Hadley Centre for Climate Prediction and Research/Met. Office, UK 1.3o X 1.9 o
(Martin et al., 2006)
8
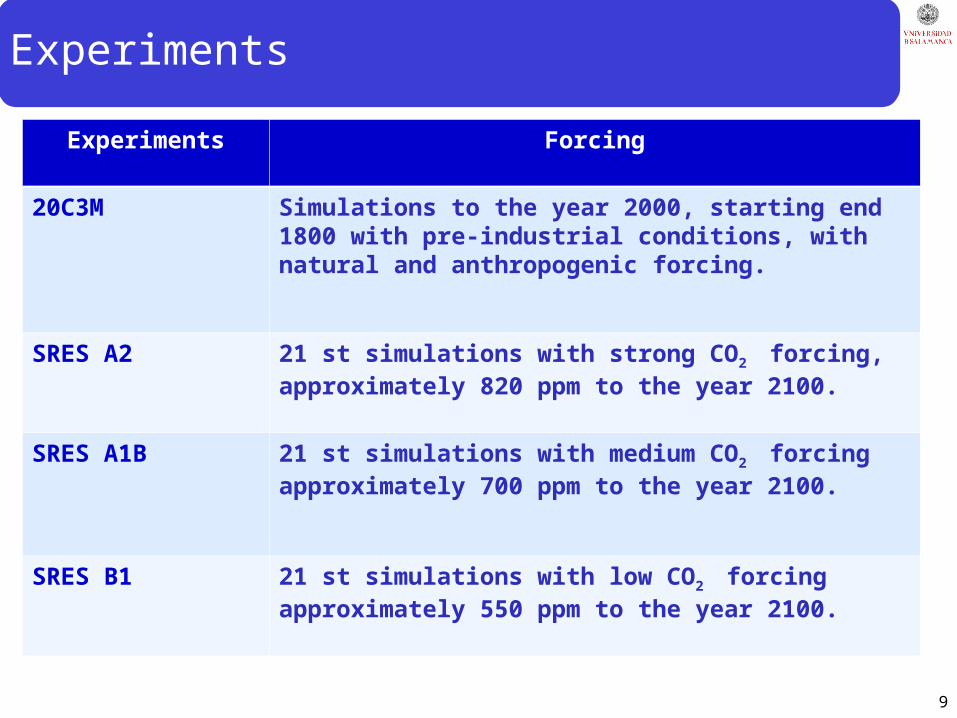
Experiments
Experiments Forcing
20C3M Simulations to the year 2000, starting end 1800 with pre-industrial conditions, with natural and anthropogenic forcing.
SRES A2 21 st simulations with strong CO2 forcing, approximately 820 ppm to the year 2100.
SRES A1B 21 st simulations with medium CO2 forcing approximately 700 ppm to the year 2100.
SRES B1 21 st simulations with low CO2 forcing approximately 550 ppm to the year 2100.
9

Mean precipitation patterns over the Iberian peninsula
10
CRU-ENSEMBLES
20C3M
SRES A2 SRES A1B

Precipitation simulations averaged over the Iberian peninsula: 20C3M and SRES A2
Multi-model precipitation averaged over the IP
11
Precipitation trend
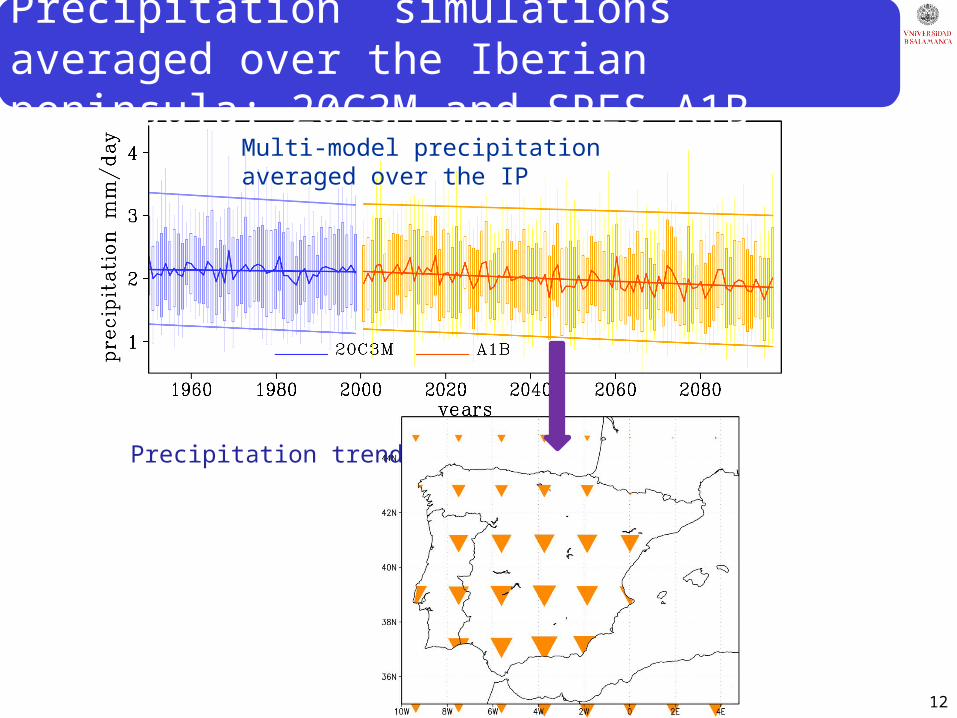
Precipitation simulations averaged over the Iberian peninsula: 20C3M and SRES A1B
Multi-model precipitation averaged over the IP
12
Precipitation trend

Precipitation simulations averaged over the Iberian peninsula: 20C3M and SRES B1
Multi-model precipitation averaged over the IP
20C3M A2 A1B B1
Kendall’Z -0.4 -4.8 -4.7 -1.2
Sen’s (mm/mes)
-0.012 -0.09 -0.08 -0.02
13
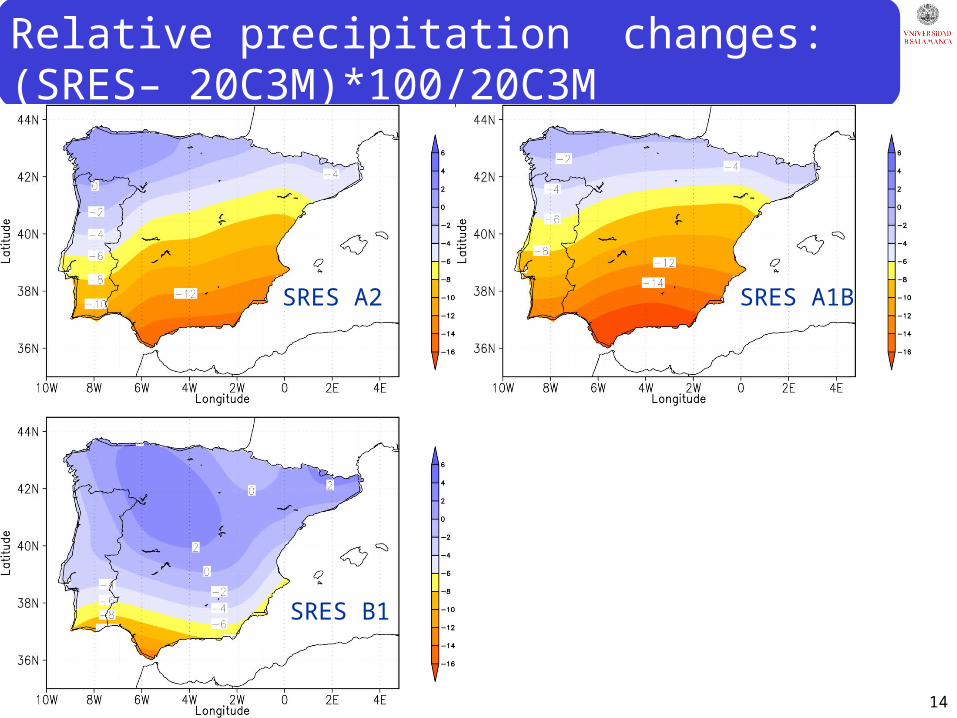
Relative precipitation changes: (SRES– 20C3M)*100/20C3M
14
SRES A2 SRES A1B
SRES B1

Mehods to obtain the NAO
1. EOF (Bretherton, 1992, Wallace 1981)
2. Selection of stations (Jones, 1997)
3. SLP averaged over areas (Stephenson 2006, Kuzmina 2005)
4. Project the SLP of model data onto the NAO pattern from reanalysis data.
1528/10/2008
Multi-model
20C3M SRESA2 SRESA1B SRESB1
R (1 and 4) 0.99 0.99 0.99 0.99

Precipitation response to NAO
28/10/200816
Model names 20C3M Correlation NAO/precipitation(IP)
SRES A2 Correlation NAO/precipitation(IP)
SRES A1B Correlation NAO/precipitation(IP)
SRES B1 Correlation NAO/precipitation(IP)
BCCR-BCM2.0 -0.67 ± 0.05 -0.68± 0.04 -0.60 ± 0.04 -0.74 ± 0.03CGCM3.1 (T63) -0.62 ± 0.04 -0.59 ± 0.04 -0.66 ± 0.03 -0.55 ± 0.04
CSIRO-Mk3.5 -0.52 ± 0.06 -0.68 ± 0.04 -0.60 ± 0.03 -0.58 ± 0.04
ECHAM5/MPI -0.62 ± 0.07 -0.78 ± 0.04 -0.70 ± 0.04 -0.77 ± 0.04
ECHO-G -0.64 ± 0.05 -0.69 ± 0.03 -0.70 ± 0.04 -0.78 ± 0.03
FGOALS-g1.0 -0.73 ± 0.03 -0.60 ± 0.02 -0.53 ± 0.03
GFDL-CM2.1 -0.80 ± 0.04 -0.77 ± 0.03 -0.76 ± 0.03 -0.69 ± 0.04
INGV-SXG -0.72 ± 0.04 -0.74 ± 0.03 -0.70 ± 0.03INM-CM3.0 -0.68 ± 0.06 -0.57 ± 0.04 -0.58 ± 0.04 -0.60 ± 0.04IPSL-CM4 -0.76 ± 0.04 -0.69 ± 0.04 -0.78 ± 0.04MIROC3.2(medres) -0.57 ± 0.05 -0.71 ± 0.03 -0.74 ± 0.03 -0.69 ± 0.03MRI-CGCM2.3.2 -0.79 ± 0.05 -0.90 ± 0.03 -0.85 ± 0.03 -0.83 ± 0.04PCM -0.65 ± 0.05 -0.71 ± 0.04 -0.75 ± 0.04
UKMO-HadCM3 -0.68 ± 0.06 -0.74 ± 0.03 -0.67 ± 0.04 -0.79 ± 0.04
UKMO_HadGEM1 -0.57 ± 0.06 -0.61 ± 0.04 -0.62 ± 0.05

Precipitation response to NAO for multi-models
28/10/200817
20C3M A2 A1B B1
R -0.64 -0.76 -0.77 -0.71
b (slope) -0.07 -0.12 -0.12 -0.11
a (cte) 2.13 2.02 1.99 2.07

28/10/200818
NAO pattern for DJFM (shaded)Correlation pattern between mean precipitation over the IP and sea level pressure (SLP)
EOF1 of precipitation_model (shaded) and Correlation between NAO and precipitation(contour lines)
Links between precipitation and NAO 20C3M
R= -0.907 ± 0.004 R= -0.89 ± 0.03

28/10/200819
NAO pattern for DJFM (shaded)Correlation pattern between mean precipitation over the IP and sea level pressure (SLP)
EOF1 of precipitation_model (shaded) and Correlation between NAO and precipitation(contour lines)
Links between precipitation and NAO SRES A2
R= -0.979 ± 0.001 R= -0.84 ± 0.04

28/10/200820
NAO pattern for DJFM (shaded)Correlation pattern between mean precipitation over the IP and sea level pressure (SLP)
EOF1 of precipitation_model (shaded) and Correlation between NAO and precipitation(contour lines)
Links between precipitation and NAO SRES A1B
R= -0.979 ± 0.001 R= -0.92 ± 0.02

Links between precipitation and NAO SRES B1
28/10/200821
NAO pattern for DJFM (shaded)Correlation pattern between mean precipitation over the IP and sea level pressure (SLP)
EOF1 of precipitation_model (shaded) and Correlation between NAO and precipitation(contour lines)
R= -0.978 ± 0.001 R= -0.91 ± 0.02

Summary and Conclusions
Observed precipitation over the Iberian peninsula shows: a trend to decrease in DJFM opposite correlation with NAO
21 st century simulations indicate a decrease in precipitation with greater significance for strong CO2 forcing.
The links between precipitation and NAO will become more significant for 21 st century simulations with strong forcing of CO2.
Therefore, the rate to decrease of Iberian precipitation will accelerate under climate change conditions.
22

Acknowledments
To the AEMet and Institute of Meteorology and Geophysics of Portugal for precipitation data.
EU-FP6 project ENSEMBLES (http://www.ensembles-eu.org) and ECA&D (http://eac.knmi.nl .) for precipitation data.
To the modelling groups for the model data CMIP3 and PCMDI that archives and distributes the data.
To the NCEP/NCAR for the reanalysis data and the CPC for SLP and teleconnection indices.
This research is supported with National and Regional projects CGL2005-06600-CO3- 01/CLI, CGL2008-04619/CLI and CyL SA123A08.
To the software developers GrADS and CDAT

Thank you very much for your attention