prairie lakes healthcare system
TRANSCRIPT
Prairie Lakes Healthcare System
Community Health Needs Assessment
Part 1: Findings
November 19, 2012

2
Table of Contents
Introduction .................................................................................................................................................. 3
Summary of Process and Methods Used .................................................................................................... 3
Healthcare System Profile ........................................................................................................................... 4
Service Area Profile ..................................................................................................................................... 9
Findings ...................................................................................................................................................... 11
Healthcare Needs and Disease Prevalence .................................................................................. 11
Mortality and Natality ..................................................................................................... 11
Cardiovascular Disease ................................................................................................... 11
Cancer ............................................................................................................................... 13
Respiratory Disease ......................................................................................................... 15
Chronic Diseases ............................................................................................................. 16
Obesity ................................................................................................................ 17
Diabetes ............................................................................................................... 18
Wound Care ........................................................................................................ 18
Congestive Heart Failure .................................................................................... 19
Orthopedic Care ............................................................................................................... 19
Behavioral Health Services ............................................................................................. 19
Palliative Care .................................................................................................................. 20
Access to Care ............................................................................................................................. 20
Specialty and Primary Care Physician Needs ................................................................ 20
Access to Primary Care ................................................................................................... 22
Barriers to Care for Low Income/Uninsured/Underinsured ..................................22
Community Identified Needs ....................................................................................................... 24
Transportation .................................................................................................................. 24
Language Barriers ............................................................................................................ 24
Patient Engagement ......................................................................................................... 24
Knowledge of Services .................................................................................................... 25
Summary of Key Findings ........................................................................................................................ 25
References .................................................................................................................................................. 27
3
Prairie Lakes Healthcare System
Community Needs Assessment
November 19, 2012
Introduction
Prairie Lakes Healthcare System completed a community health needs assessment in fiscal year
2013. The purpose of this assessment was to allow Prairie Lakes to identify the health needs of
its service area, prioritize these needs, and implement a strategy to address these needs.
As a tax-exempt hospital, Prairie Lakes is required by Section 9007 of the Patient Protection and
Affordable Care Act of 2010 (PPACA) to conduct a community health needs assessment at least once
every three years and implement a strategy to meet the needs identified through the assessment.
Hospitals must include input from persons who represent the broad interests of the community served,
including those with special knowledge or expertise in public health. This encourages tax-exempt
hospitals to partner with other providers in their service area to identify needs and opportunities for
serving their collective patient populations.
The community needs assessment for the Prairie Lakes service area, is based on the following
information:
Healthcare system profile
Service area profile
Key Findings in the areas of disease prevalence, access to care and community needs
Summary of Process and Methods Used
A comprehensive, data driven assessment was used to identify community health needs. Prairie
Lakes utilized a two step process to collect primary and secondary data. In step one, Prairie Lakes
held two focus groups with community and health leaders as well as conducted several interviews to
determine the leading health issues and priorities. In addition, Prairie Lakes partnered with
HealthStream, Inc., a community perception researcher, to conduct a community survey. Step two
consisted of a thorough review of existing internal data and data from the US Census Bureau, South
Dakota Department of Health, South Dakota Association of Healthcare Organizations, and other
sources.
The data collected in steps one and two were categorized into three areas related to disease
prevalence, access to care, and the needs of the community. These three areas were further
broken down into subcategories and the data charted and analyzed to identify and prioritize the
health needs of the community.
Step 1: Primary Data
Below are brief descriptions of primary data used for this assessment.
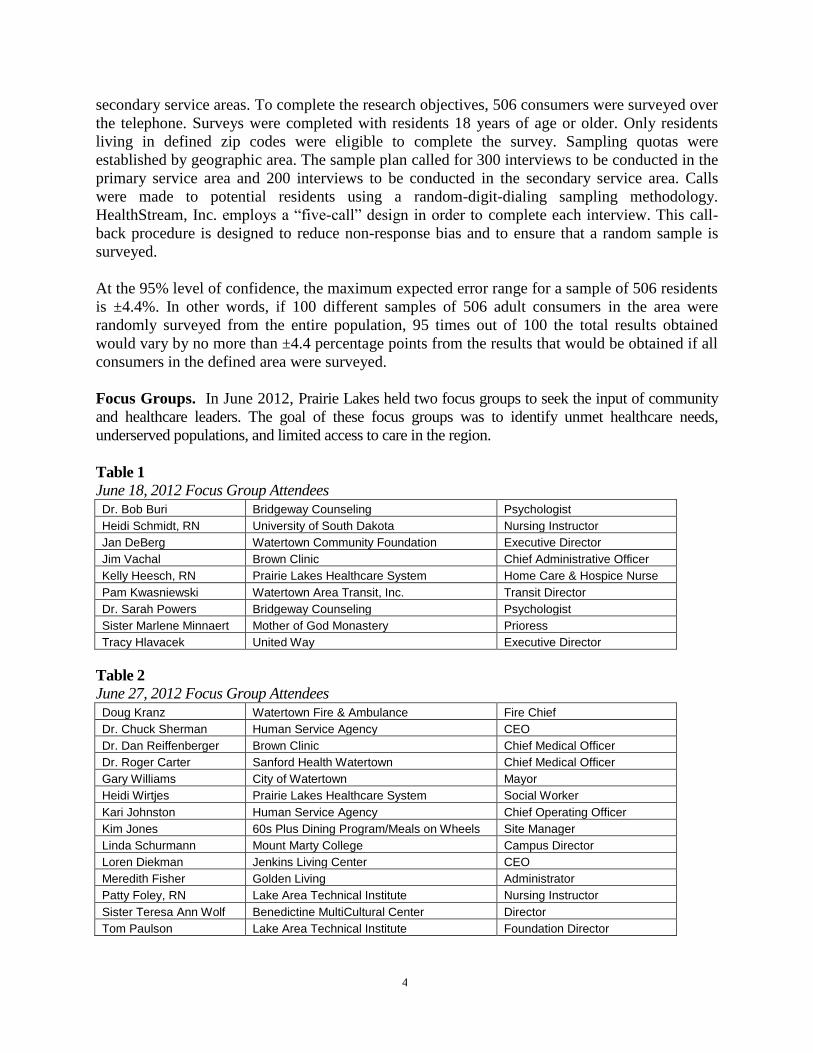
Community Survey. In July and August 2012, Prairie Lakes partnered with HealthStream, Inc.
to conduct a Community Insights Community Needs Assessment of Prairie Lakes’ primary and
4
secondary service areas. To complete the research objectives, 506 consumers were surveyed over
the telephone. Surveys were completed with residents 18 years of age or older. Only residents
living in defined zip codes were eligible to complete the survey. Sampling quotas were
established by geographic area. The sample plan called for 300 interviews to be conducted in the
primary service area and 200 interviews to be conducted in the secondary service area. Calls
were made to potential residents using a random-digit-dialing sampling methodology.
HealthStream, Inc. employs a “five-call” design in order to complete each interview. This call-
back procedure is designed to reduce non-response bias and to ensure that a random sample is
surveyed.
At the 95% level of confidence, the maximum expected error range for a sample of 506 residents
is ±4.4%. In other words, if 100 different samples of 506 adult consumers in the area were
randomly surveyed from the entire population, 95 times out of 100 the total results obtained
would vary by no more than ±4.4 percentage points from the results that would be obtained if all
consumers in the defined area were surveyed.
Focus Groups. In June 2012, Prairie Lakes held two focus groups to seek the input of community
and healthcare leaders. The goal of these focus groups was to identify unmet healthcare needs,
underserved populations, and limited access to care in the region.
Table 1
June 18, 2012 Focus Group Attendees Dr. Bob Buri Bridgeway Counseling Psychologist
Heidi Schmidt, RN University of South Dakota Nursing Instructor
Jan DeBerg Watertown Community Foundation Executive Director
Jim Vachal Brown Clinic Chief Administrative Officer
Kelly Heesch, RN Prairie Lakes Healthcare System Home Care & Hospice Nurse
Pam Kwasniewski Watertown Area Transit, Inc. Transit Director
Dr. Sarah Powers Bridgeway Counseling Psychologist
Sister Marlene Minnaert Mother of God Monastery Prioress
Tracy Hlavacek United Way Executive Director
Table 2
June 27, 2012 Focus Group Attendees Doug Kranz Watertown Fire & Ambulance Fire Chief
Dr. Chuck Sherman Human Service Agency CEO
Dr. Dan Reiffenberger Brown Clinic Chief Medical Officer
Dr. Roger Carter Sanford Health Watertown Chief Medical Officer
Gary Williams City of Watertown Mayor
Heidi Wirtjes Prairie Lakes Healthcare System Social Worker
Kari Johnston Human Service Agency Chief Operating Officer
Kim Jones 60s Plus Dining Program/Meals on Wheels Site Manager
Linda Schurmann Mount Marty College Campus Director
Loren Diekman Jenkins Living Center CEO
Meredith Fisher Golden Living Administrator
Patty Foley, RN Lake Area Technical Institute Nursing Instructor
Sister Teresa Ann Wolf Benedictine MultiCultural Center Director
Tom Paulson Lake Area Technical Institute Foundation Director

5
Interviews. To ensure all populations and interests were represented, Prairie Lakes contacted
key community and health leaders who were unable to attend either focus group for personal
interviews.
Table 3
Interviews Conducted
June 22, 2012 Troy Breitag Lake Area Technical Institute Med/Fire Rescue Department Supervisor
June 27, 2012 Rogene Severson Head Start Pre-Birth to Five, Inter-Lakes Community Action Partnership Family Service Specialist
June 27, 2012 Sara De Coteau Sisseton-Wahpeton Oyate of the Lake Traverse Reservation Health Coordinator
June 28, 2012 Lesli Jutting Watertown School District Superintendent
July 10, 2012 Jill Comes Boys & Girls Club Director of Operations
August 16, 2012 Karla Moes, RN South Dakota Department of Health Codington County Community Health Nurse
August 16, 2012 Shelly Turbak, RN Prairie Lakes Healthcare System Chief Nursing Officer
August 24, 2012 Mary Peterson, RN Prairie Lakes Healthcare System Vice President
Total Cost of Care Study. Prairie Lakes retained CliftonLarsonAllen to conduct a total cost of
care study. The study was analyzed condition specific episodic treatment group data for
employees on Prairie Lakes and the Watertown School District health insurance. The data
covered the calendar years of 2007 through 2011.
Step Two: Secondary Data
Below are brief descriptions of key secondary datasets used for this assessment.
Population Estimates and Demographics. Census data collected in 2000 and 2010 was used to
analyze population trends. South Dakota county population projections were provided by the
state demographer through the South Dakota State University Rural Life and Census Data Center.
Minnesota county population projections were obtained on the Minnesota State Demographic Center
website.
Demographic information was collected using the U.S. Census Bureau State and County
QuickFacts. This data included 2011 estimates for age, gender, and race compositions of the
service area. U.S. Census data was also used to calculate the number uninsured people living in
the service area.
Health Status Indicators. Natality and mortality information was collected utilizing the 2010
South Dakota Vital Statistics Report: A State and County Comparison of Leading Health
Indicators released by the South Dakota Department of Health. Information on cancer prevalence
was taken from the 2009 Annual Report on Cancer Incidence and Mortality among South
Dakotans released by the South Dakota Department of Health. In addition, the 2010 Behavioral
Risk Factor Surveillance System report released by South Dakota Department of Health was also
utilized to analyze behavior risk factors of people living in northeastern South Dakota compared
to the rest of the state. Other sources of health data included the Centers for Disease Control and
Prevention, Health and Human Service Agency, American Lung Association, National Institute
6
of Allergy and Infectious Diseases, National Institutes for Health, American Academy of Family
Physicians and National Alliance on Mental Illness.
Hospital Inpatient and Emergency Department Data. Inpatient market share was determined
using reports provided by the South Dakota Association of Healthcare Organizations. Internal data
sources were utilized to analyze use of the emergency department including patients seen per year and
payer information.
Physician Data. Internal data collected and tracked by Prairie Lakes was utilized to analyze the
existing medical staff, and current and future needs for primary and specialty phsycians in the
region. The age distribution of the current medical staff was compared to South Dakota and U.S.
composition information provided in the 2011 State Physician Workforce Data Book published
by the Center for Workforce Studies at the Association of American Medical Colleges.
Information Gap
The most current data available was used to prepare this document. Every effort was made to
include comprehensive data and represent all populations in the region. However, some data was
not available or included in this report. Most notably, because each state reports health status
indicator data differently, South Dakota data was used in the key findings to discuss disease
mortality rates, behavioral risk factor information, and other statistics. The decision was made
based on the percentage of patient discharges that reside in the seven South Dakota counties in
the Prairie Lakes’ service area verses the percentage that reside in the three Minnesota counties.
Healthcare System Profile
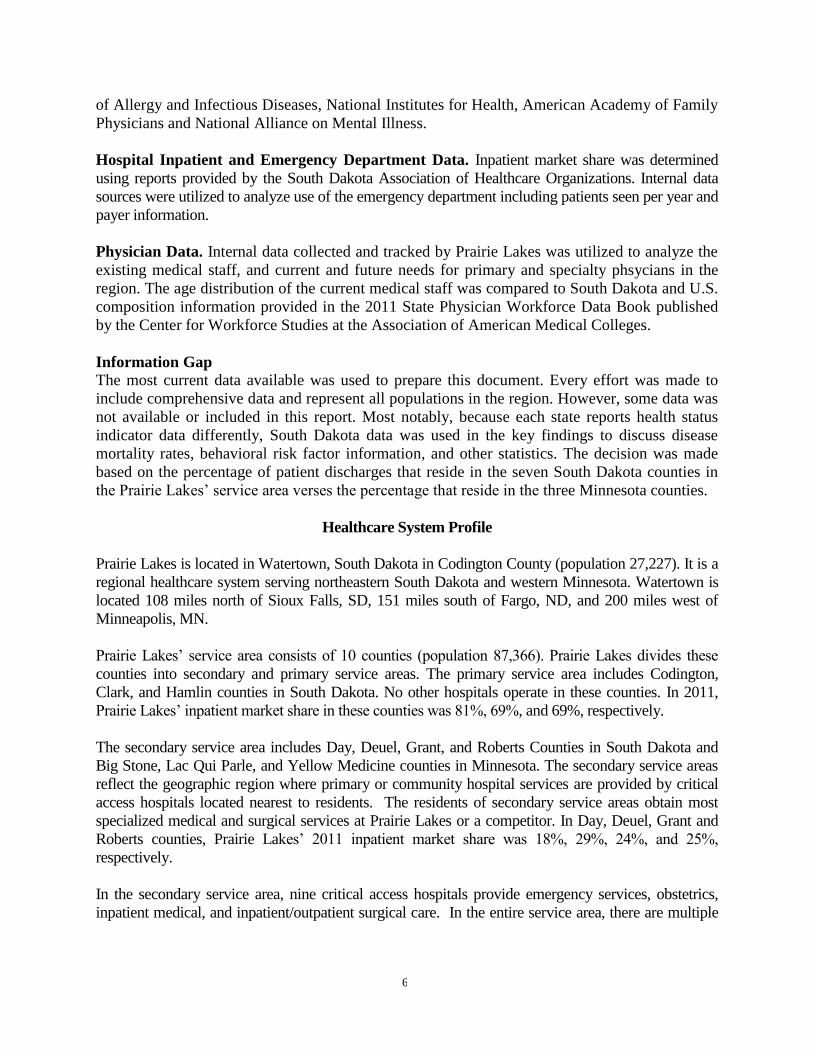
Prairie Lakes is located in Watertown, South Dakota in Codington County (population 27,227). It is a
regional healthcare system serving northeastern South Dakota and western Minnesota. Watertown is
located 108 miles north of Sioux Falls, SD, 151 miles south of Fargo, ND, and 200 miles west of
Minneapolis, MN.
Prairie Lakes’ service area consists of 10 counties (population 87,366). Prairie Lakes divides these
counties into secondary and primary service areas. The primary service area includes Codington,
Clark, and Hamlin counties in South Dakota. No other hospitals operate in these counties. In 2011,
Prairie Lakes’ inpatient market share in these counties was 81%, 69%, and 69%, respectively.
The secondary service area includes Day, Deuel, Grant, and Roberts Counties in South Dakota and
Big Stone, Lac Qui Parle, and Yellow Medicine counties in Minnesota. The secondary service areas
reflect the geographic region where primary or community hospital services are provided by critical
access hospitals located nearest to residents. The residents of secondary service areas obtain most
specialized medical and surgical services at Prairie Lakes or a competitor. In Day, Deuel, Grant and
Roberts counties, Prairie Lakes’ 2011 inpatient market share was 18%, 29%, 24%, and 25%,
respectively.
In the secondary service area, nine critical access hospitals provide emergency services, obstetrics,
inpatient medical, and inpatient/outpatient surgical care. In the entire service area, there are multiple

7
clinics that provide primary care for the communities. Specialty physicians from Sioux Falls,
Watertown, and other cities provide outreach clinic services in the secondary service area.
Table 4
Critical Access Hospitals Day County, SD Sanford Webster Medical Center, Webster, SD
Deuel County, SD Sanford Hospital Deuel County, Clear Lake, SD
Grant County, SD Avera Milbank Area Hospital, Milbank, SD
Roberts County, SD Coteau Des Prairies Hospital, Sisseton, SD
Big Stone County, MN Ortonville Area Health Services, Ortonville, MN Essentia Health Graceville, Graceville, MN
Lac Qui Parle County, MN Johnson Memorial Health Services, Dawson, MN Madison Hospital, Madison, MN
Yellow Medicine County, MN Sanford Medical Center Canby, Canby, MN
Designations
Prairie Lakes is classified as a Sole Community Hospital under the Medicare Acute Care Hospital
Prospective Payment System. Sole Community Hospitals are typically rural and located considerable
distances from other like hospitals. The Prairie Lakes Emergency Department is designated a Level IV
trauma center. This means it has met specific criteria and passed a site review to provide initial
evaluation, stabilization, diagnostic capabilities, surgery, critical care services, and transfer to a higher
level of care.
Acute Care
Prairie Lakes is licensed to operate 81 acute care hospital beds and currently operates 78 staffed
beds: labor/delivery/recovery/postpartum (10), telemetry (10), critical care (8), and general hospital
(50). Acute care hospital services also include a 24-hour staffed emergency department, 24-hour
surgery capabilities, 24-hour interventional cardiology services, and ancillary services providing
diagnostics and imaging services.
Outpatient Care
Outpatient care refers to medical care, treatment, or diagnostic services that do not require an
overnight stay in a hospital. A number of departments provide outpatient services including
laboratory, radiology, the emergency department, cardiology, and surgery. In addition, the following
departments provide all services on an outpatient basis: cancer center; specialty clinic; Mallard Pointe
Surgical Center, and the Campus Pharmacy operating as a retail pharmacy.
Specialty Services
Specialty clinics are provided by physicians employed by Prairie Lakes in the following specialties:
radiation therapy, medical oncology, hematology, cardiology, urology, and nephrology. Prairie Lakes
developed an employment model in order to recruit and retain medical and surgical specialists to a
rural service area. Other physicians in the community are in private practice, clinic organizations, or
contract groups and provide services to Prairie Lakes as members of the medical staff with clinical
privileges.
Regional access to specialty physicians occurs through patient referrals to Watertown for medical
care. In addition, Prairie Lakes provides physician services directly to communities in the region
through outreach clinics. Four Prairie Lakes’ physicians provide satellite clinics in eight communities.
8
Prairie Lakes partners with several providers to bring specialists into the community. Patients are seen
by specialists from Aberdeen, Brookings, and Sioux Falls at Prairie Lakes Mallard Pointe Surgical
Center and the Prairie Lakes Vascular Clinic. These specialties include asthma and allergy,
otolaryngology, dermatology, plastic surgery, nerve conduction/EEG, neurology, transplant,
orthopedic spine surgery, and vascular surgery.
Rehabilitation Services
Rehabilitation care includes post acute care, rehabilitation services, and dialysis. Post acute care
includes home health and hospice services. Prairie Lakes provides home health and hospice services
in seven counties in northeast South Dakota. The Rehabilitation Services Department includes
physical and occupational therapy, speech therapy and modified barium swallows (provided via a
contract), and cardiac rehabilitation. Prairie Lakes operates three outpatient dialysis units. One is
located on the hospital campus. The other units were established through community and provider
partnerships and are located in Sisseton, SD and Ortonville, MN.
Services Not Provided Due to Provider Limitations
Prairie Lakes does not provide some highly specialized services due to its relatively small size and
inability to provide adequate support, such as open heart surgery, neonatal intensive care, and burn
care. In the event patients in the service area require these services, transfer to larger medical centers
is arranged.
Services Not Provided Due to Availability of Other Options Prairie Lakes does not provide long term care (i.e. nursing home care). In addition to two
independently owned and operated long term care facilities located in Watertown, there are 10 long
term care providers in other communities in the service area. In general, bed availability and patient
placement is not an issue.
Prairie Lakes closed it mammography services in 2008 in response to service duplication by
clinics. Mammograms are provided at two primary care clinics in Watertown. These clinics
adequately meet the needs of the community.
Prairie Lakes does not provide psychiatric/mental health services. Community-based mental health
services are provided by The Human Service Agency (HSA). HSA provides services to individuals
with developmental disabilities, chemical and gambling addictions, mental illness; and coping
with a depressed mood, anxiety, marital stress, co-occurring disorders or other life stresses. HSA
offers residential detox services for medically stable individuals. Prairie Lakes does provide
financial support to HSA for detox services. Patients requiring inpatient mental health services
are transferred to providers outside the service area. In addition to HSA, several private mental
health practices exist in the community.
9
Service Area Profile
An understanding of the health of a community begins with an analysis of population trends and
demographic characteristics. Population and demographic data are used to project disease
incidence, determine present and future community needs for healthcare services, and estimate the
number of physicians needed to adequately service the region. To accomplish this, a population
profile of the service area was developed based on 2000 and 2010 US Census data and
projections of population growth through 2030.
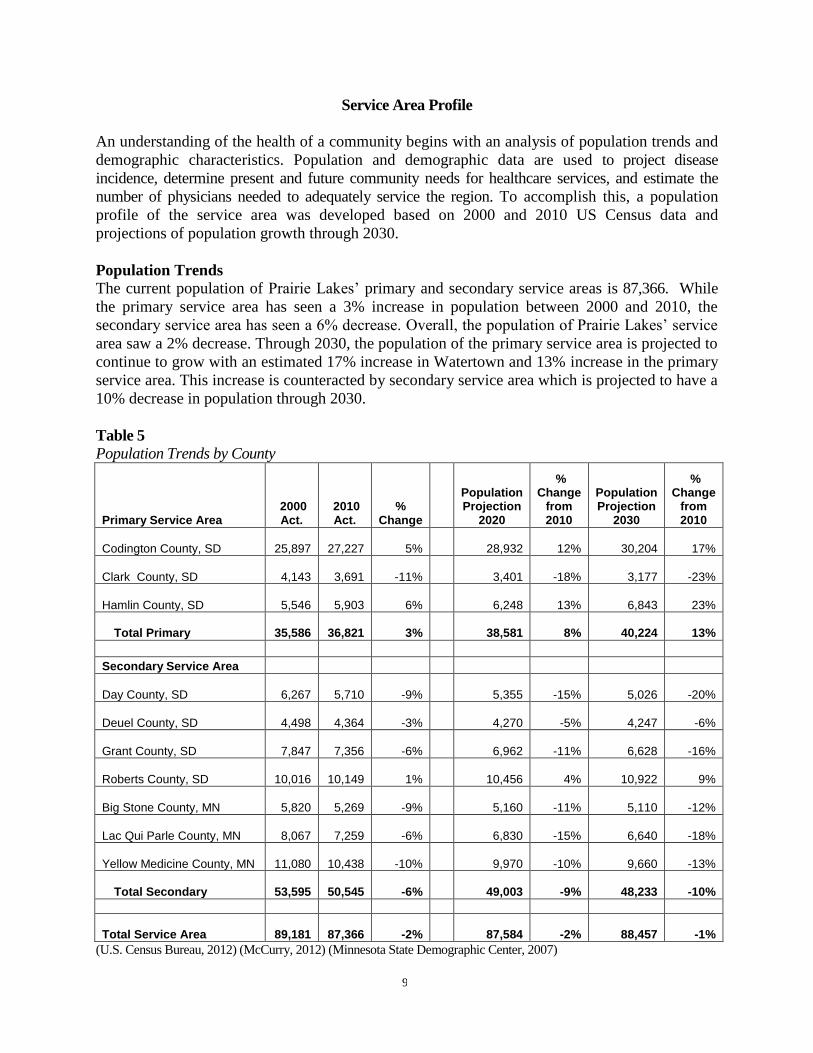
Population Trends
The current population of Prairie Lakes’ primary and secondary service areas is 87,366. While
the primary service area has seen a 3% increase in population between 2000 and 2010, the
secondary service area has seen a 6% decrease. Overall, the population of Prairie Lakes’ service
area saw a 2% decrease. Through 2030, the population of the primary service area is projected to
continue to grow with an estimated 17% increase in Watertown and 13% increase in the primary
service area. This increase is counteracted by secondary service area which is projected to have a
10% decrease in population through 2030.
Table 5
Population Trends by County
Primary Service Area 2000 Act.
2010 Act.
% Change
Population Projection
2020
% Change
from 2010
Population Projection
2030
% Change
from 2010
Codington County, SD
25,897
27,227 5% 28,932 12% 30,204 17%
Clark County, SD
4,143
3,691 -11% 3,401 -18% 3,177 -23%
Hamlin County, SD
5,546
5,903 6% 6,248 13% 6,843 23%
Total Primary
35,586
36,821 3% 38,581 8% 40,224 13%
Secondary Service Area
Day County, SD
6,267
5,710 -9%
5,355 -15%
5,026 -20%
Deuel County, SD
4,498
4,364 -3%
4,270 -5%
4,247 -6%
Grant County, SD
7,847
7,356 -6%
6,962 -11%
6,628 -16%
Roberts County, SD
10,016
10,149 1%
10,456 4%
10,922 9%
Big Stone County, MN
5,820
5,269 -9%
5,160 -11%
5,110 -12%
Lac Qui Parle County, MN
8,067
7,259 -6%
6,830 -15%
6,640 -18%
Yellow Medicine County, MN
11,080
10,438 -10%
9,970 -10%
9,660 -13%
Total Secondary
53,595
50,545 -6%
49,003 -9%
48,233 -10%
Total Service Area
89,181
87,366 -2%
87,584 -2%
88,457 -1%
(U.S. Census Bureau, 2012) (McCurry, 2012) (Minnesota State Demographic Center, 2007)

10
Demographics
Key demographics indicated by the Centers for Disease Control and Prevention (CDC) as affecting
the health of a community were reviewed. According to the CDC there are several social
determinants of health such as economic and social conditions that influence the health of people and
communities, including, education, employment, finances, health behaviors, and access to health
services (CDC, 2011).
Age. The age composition of Prairie Lakes’ service area is similar to the state of South Dakota.
However, compared to the overall population of South Dakota both the primary and secondary
service areas have a higher percentage of adults age 65 and over, which may have implications
for service delivery and demand. As the population ages, the need and demand for health care
services will likely increase due to the incidence of chronic disease conditions and the needs of an
aging population (CDC, 2003).
Race. Watertown is gradually becoming more racially and ethnically diverse, but is not diversifying
as rapidly as the average community nationwide. Minorities represented roughly 39% of all
population growth between 2000 and 2010 in Codington County, as compared to 58% and 92% of
state and national population growth, respectively (Market Street Services, 2012). As of 2010,
minorities represented 5.2% of the primary service area population and 13% of the secondary service
area population, as compared to 15.6% across the state of South Dakota. Prairie Lakes’ secondary
service area is more racially and ethnically diverse than the primary service area. In particular, 35% of
Roberts County residents identify themselves as American Indian. Some of the leading diseases and
causes of death among the American Indian population are heart disease, cancer, unintentional injuries
(accidents), diabetes, and stroke (The Office of Minority Health, 2012).
Economic and Social Indicators. In comparison to South Dakota, Prairie Lakes’ service area has a
smaller population of people speaking a language other than English at home and persons living
below the poverty level. However, in all other categories reviewed, the socioeconomic data is more
favorable for South Dakota overall compared to the Prairie Lakes’ service area. Prairie Lakes’ service
area has a a lower percentage of high school graduates, a lower percentage of people with a bachelor’s
degree or higher, a lower median household income, and a higher percentage of the people without
health insurance. All of these factors influence the health of people and the overall health of a
community.
Table 6
Demographics
Primary Secondary
Total Area
South Dakota
Population, 2011 estimate 37,048 50,374 87,422 824,082
Age
Persons under 5 years, percent, 2011 7.73% 6.37% 6.9% 7.20%
Persons under 18 years, percent, 2011 25.37% 23.52% 24.3% 24.70%
Persons 19 years to 64 years, percent, 2011 50.95% 49.58% 50.2% 53.70%
Persons 65 years and over, percent, 2011 15.94% 20.52% 18.6% 14.40%
Gender
Female persons, percent, 2011 49.83% 49.53% 49.7% 49.90%
Males persons, percent, 2011 50.17% 50.47% 50.3% 50.10%
Race

11
White persons not Hispanic, percent, 2011 94.82% 87.06% 90.4% 84.40%
Black persons, percent, 2011 0.44% 0.31% 5.9% 1.40%
American Indian and Alaska Native persons, percent, 2011 1.63% 9.02% 0.4% 8.90%
Asian persons, percent, 2011 0.43% 0.30% 0.0% 1.00%
Native Hawaiian and Other Pacific Islander persons, percent, 2011 0.00% 0.01% 1.3% 0.10%
Persons reporting two or more races, percent, 2011 1.14% 1.46% 2.1% 2.00%
Persons of Hispanic or Latino Origin, percent, 2011 1.81% 2.24% 0.4% 2.90%
Other
Language other than English spoken at home, pct age 5+, 2006-2010 3.66% 4.67% 4.2% 6.80%
High school graduates, percent of persons age 25+, 2006-2010 87.98% 87.50% 87.7% 89.30%
Bachelor's degree or higher, pct of persons age 25+, 2006-2010 20.73% 16.59% 18.3% 25.30%
Median household income 2006-2010 $43,869 $43,266 $43,447 $46,369
Persons below poverty level, percent, 2006-2010 11.90% 12.61% 12.3% 13.70%
Uninsured, Under 65, All Income Levels, 2009 14.3% 15.2% 14.8% 13.9%
(U.S. Census Bureau, 2012)
Findings
Healthcare Needs and Disease Prevalence
Natality and Mortality. Natality and mortality rates are used to calculate the dynamics of a
population. They are the key factors in determining whether a population is increasing, decreasing, or
stagnant. In 2010, both Prairie Lakes’ primary and secondary service areas experienced a significantly
higher mortality rate than the state average. Natality indicators in the service area are lower than the
state average with the exception of percentage of mothers who used tobacco while pregnant. In this
category, both the primary and secondary service areas reported a higher incidence of use than the
state average.
Display 1 Display 2
Mortality Rate (All Causes) per 100,000 Select Natality Indicators
(S.D. Department of Health, 2012) (S.D. Department of Health, 2012)
Cardiovascular Disease. Cardiovascular disease is a broad term that includes heart attack, stroke,
heart failure, hypertensive heart disease, and diseases of the arteries, veins, and circulatory system. In

12
the United States cardiovascular disease is the leading cause of death. In 2009, the South Dakota
Department of Health reported that cardiovascular disease was the leading cause of death for men and
women in all race/ethnic groups in South Dakota. According to the South Dakota Department of
Health, as the population increases and grows older, heart disease, stroke, and the economic costs
associated with treatment and rehabilitation will also increase (S.D. Department of Health, 2009).
Heart Disease. In 2010, Prairie Lakes’ service area had a significantly higher heart disease mortality
rate (all causes) than the state average. Five out of seven South Dakota counties in the service area had
heart disease mortality rates higher than the state average with Day County having a 43% percent
higher heart disease mortality rate than the state average.
Display 3 Display 4
Heart Disease (All Causes) Heart Disease (By Cause)
Mortality Rate per 100,000 Mortality Rates per 100,000
(S.D. Department of Health, 2012) (S.D. Department of Health, 2012)
Table 7
Behavioral Risk Factors, Percent of Respondents, 2010
Heart Disease Northeast
Region South
Dakota
Previously Had a Heart Attack 4.9% 4.4%
Have Angina or Coronary Heart Disease 4.4% 4.6%
(S.D. Department of Health, 2012)
Stroke. From 2006 to 2010, South Dakota was one of two states that saw a decline in stroke
prevalence, from 2.2% to 1.8% (CDC, 2012). However, the mortality rate for cerebrovascular disease
in both Prairie Lakes’ primary and secondary service areas was higher than the state average. In
addition, a higher percentage of northeastern South Dakota residents reported previously having a
stroke than the state average. Two counties, Hamlin and Day, had significantly higher rates of
cerebrovascular disease mortality rates than the state average, 64% and 60% higher, respectively.

13
Display 5 Table 8
Cerebrovascular Disease Behavioral Risk Factors,
Mortality Rate per 100,000 Percent of Respondents, 2010
(S.D. Department of Health, 2012)
To meet the needs of the region, Prairie Lakes established a cardiology program and opened a cath lab
in 2007. Services include clinic visits, consultations, congestive heart failure clinic, non-invasive
testing, stent placement, defibrillator placement, cardiac catheterization, angiography, and
interventional procedures that restore circulation. The cardiology program is staffed to provide 24/7
emergency care. In addition, Prairie Lakes offers a four-phase cardiac rehabilitation program. Based
on national physician to population ratios, the cardiology program is adequately staffed to meet the
needs of the service area. Prairie Lakes also offers two separate screenings that assess risk factors for
heart disease and stroke at a significantly reduced cost as well as community education and free blood
pressure screenings throughout the year.
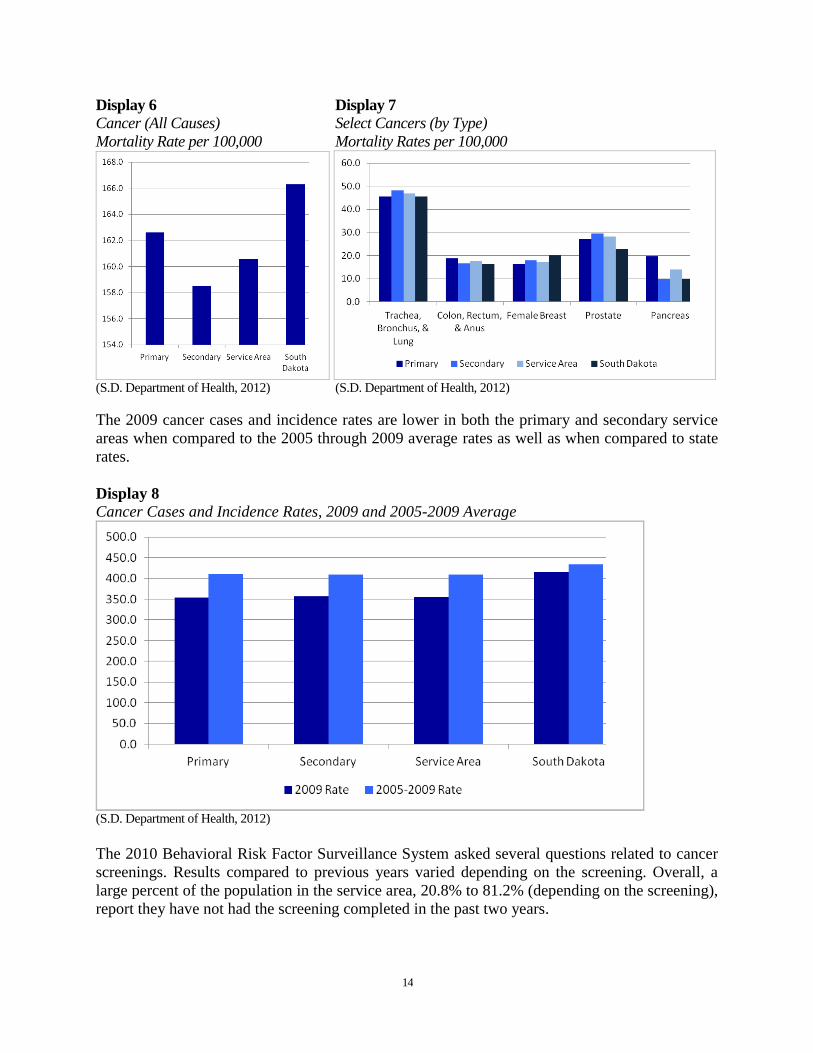
Cancer. Cancer is the second leading cause of death in South Dakota and the United States. In
South Dakota, the five most diagnosed cancer sites (prostate, female breast, lung, colorectal,
bladder) accounted for 58% of all cancer cases (S.D. Department of Health, 2012). The overall
cancer mortality rate for the Prairie Lakes’ service area is lower than the state average. A review
of mortality rates by select cancer types reveals a higher mortality rate in both the primary and
secondary service areas for all but female breast cancer when compared to the state average.
Stroke Northeast
Region South
Dakota
Previously Had a Stroke 2.5% 2.1%
(S.D. Department of Health, 2012)
14
Display 6 Display 7
Cancer (All Causes) Select Cancers (by Type)
Mortality Rate per 100,000 Mortality Rates per 100,000
(S.D. Department of Health, 2012) (S.D. Department of Health, 2012)
The 2009 cancer cases and incidence rates are lower in both the primary and secondary service
areas when compared to the 2005 through 2009 average rates as well as when compared to state
rates.
Display 8
Cancer Cases and Incidence Rates, 2009 and 2005-2009 Average
(S.D. Department of Health, 2012)
The 2010 Behavioral Risk Factor Surveillance System asked several questions related to cancer
screenings. Results compared to previous years varied depending on the screening. Overall, a
large percent of the population in the service area, 20.8% to 81.2% (depending on the screening),
report they have not had the screening completed in the past two years.

15
Table 9
Behavioral Risk Factors, Percent of Respondents, 2010
Cancer/Cancer Screenings Northeast
Region* South
Dakota Compared to Prior Years
Not Had a Mammogram (Female Respondents, Ages 40 and Older, in the Past 2 Years) 21.4% 23.4% Decreased
Not Had a Clinical Breast Exam (Female Respondents, in the Past 2 Years) 23.9% 23.9% Increased
Insufficient Cervical Cancer Screening (Female Respondents) 20.8% 19.1% Remained Steady
Not Had a PSA Test (Male Respondents, Ages 40 and Older, in the Past 2) 38.4% 40.2% Decreased
Not Had a Digital Rectal Exam (Male Respondents, Ages 40 and Older, in the Past 2) 44.6% 45.7% Remained Steady
Told They Had Prostate Cancer (Male Respondents, Ages 40 and Older) 4.7% 5.2% Increased
Not Had a Blood Stool Test Using a Home Kit (Ages 50 and Older, in the Past 2 Years) 81.2% 83.2% Remained Steady
Never Had a Sigmoidoscopy or Colonoscopy (Ages 50 and Older) 34.4% 32.9% Decreased
Ever Been Diagnosed With Cancer 9.7% 10.8% Decreased
(S.D. Department of Health, 2012)
The Prairie Lakes Cancer Center opened in 1999. The Cancer Center is staffed by doctors specializing
in radiation oncology, medical oncology, and hematology. The services offered include radiation
treatments including TomoTherapy, PET scanning, and infusion services including chemotherapy,
blood transfusions, hydration and care to patients undergoing treatment for cancer or blood disorders.
Based on national physician to population ratios, the Cancer Center is adequately staffed to meet the
needs of the service area. Pediatric cancer patients and acute leukemia patients are referred to out-of-
town specialists.
Respiratory Disease. According to the National Institutes of Health (2012), if all types of lung
disease are lumped together, it is the number three killer in the United States. The term lung disease
refers to many disorders affecting the lungs, such as asthma, chronic obstructive pulmonary disease,
infections like influenza, pneumonia and tuberculosis, lung cancer, and many other breathing
problems (National Institutes of Health, 2012). In 2011, the American Lung Association released a
report detailing at-risk groups for lung disease. In Codington County, the largest at-risk groups are
people who have cardiovascular disease.
Display 9
At-Risk Groups for Lung Diseases, Percentage of Population, Codington County
(American Lung Association, 2012)

16
The mortality rate for influenza and pneumonia in the primary service area is significantly higher than
the state average. However, the percentage of people that reported having a flu shot was higher in the
northeast region then the state rate. The mortality rate for chronic lower respiratory disease in the
secondary service area is significantly higher than the state average.
Display 10 Display 11
Influenza and Pneumonia Chronic Lower Respiratory Disease
Mortality Rate per 100,000 Mortality Rates per 100,000
(S.D. Department of Health, 2012) (S.D. Department of Health, 2012)
Table 10
Behavioral Risk Factors, Percent of Respondents, 2010
Respiratory Diseases Northeast
Region* South
Dakota
Not Had a Flu Shot (Ages 65 and Older, in the Past 12 Months) 28.1 28.8
No Flu Shot (Children, Ages 0-17) 34.8 40.7
Told They Have Asthma 6.5 7.5
(S.D. Department of Health, 2012)
Prairie Lakes does not currently offer pulmonology services. Limited pulmonology outreach services
are currently available in Watertown. Population size, disease data, physician needs assessment
(below), and focus group discussion all bring forth the need to recruit a pulmonologist to Watertown.
National physician to population ratios also dictate that the service area does need a pulmonologist.
Chronic Diseases. According to the CDC (2012), chronic diseases—such as heart disease, stroke,
cancer, diabetes, and arthritis—are among the most common, costly, and preventable of all
health problems in the US. Treatment of chronic diseases consumes a disproportionate share of
healthcare costs and is often associated with multiple hospital admissions. Four modifiable
health risk behaviors—lack of physical activity, poor nutrition, tobacco use, and excessive
alcohol consumption—are responsible for much of the illness, suffering, and early death related
to chronic diseases (Bush, 2012, p. 36).

17
A total cost of care study conducted by CliftonLarsonAllen of people insured through Prairie
Lakes and Watertown School District plans found that chronic conditions accounted for 17% of
the total cost of the nearly $21 million dollars spent on healthcare. Of this 17%, six conditions
accounted for 68% of total costs. These six conditions are: ischemic heart disease, diabetes,
hypertension, chronic sinusitis, cholelitiasis, and asthma.
A review of the 2010 Behavioral Risk Factor Surveillance System data shows that the percentage
of the population participating in the modifiable health risk behaviors in the northeast region of
South Dakota is similar to the state averages.
Table 11
Behavioral Risk Factors, Percent of Respondents, 2010
Lifestyle/Chronic Disease Causes Northeast
Region* South
Dakota
Overweight or Obese (BMI of 25.0 or above) 63.4 65.7
Class I-III Obese (BMI of 30.0 or greater) 28.2 27.7
Class II-III Obese (BMI of 35.0 or greater) 10.5 9.8
Currently Smoke Cigarettes 13.2 15.4
Use Smokeless Tobacco 5.2 5.6
Told They Have Diabetes 6.4 6.9
Activities Limited Due to Physical, Mental, or Emotional Problems 19 19.9
No Leisure Time Physical Activity 26.4 24.7
Drank Alcohol in the Past 30 Days 57.5 58.2
Engage in Binge Drinking 19.4 17.7
Engage in Heavy Drinking 3.5 4.8
Lack of Sleep in the Past 30 Days 10.1 10.1
Consumed 8 or More Sweetened Beverages in the Last 7 Days 6.9 7.3
(S.D. Department of Health, 2012)
Obesity. Many chronic diseases are linked to obesity, including heart disease, stroke, type 2 diabetes
and certain types of cancer. In the US, 35.7% of adults are obese. In South Dakota, as well as the
Prairie Lakes service area, 32.3% of the population is obese. The obesity rate in Prairie Lakes’
primary service area is slightly less at 30.9%. Focus group participants expressed a need for obesity
prevention and resources for all ages.
Display 12
Adults Who Are Obese in South Dakota, 2009 Estimates, Percentage
(CDC, 2012)

18
Diabetes. According to the CDC, 8.3% of the population has diabetes. In South Dakota, this rate is
even higher with an estimated 9.5% of adults have been diagnosed with diabetes. Both the primary
and secondary service areas also have higher rates of diabetes then the national average. In addition,
the primary service area in particular has a significantly higher mortality rate due to diabetes mellitus
compared to the secondary service area and state rate.
Display 13 Display 14
Diabetes Mellitus Adults with Diagnosed Diabetes
Mortality Rate per 100,000 2009 Estimates, Percentage
(S.D. Department of Health, 2012) (CDC, 2012)
This data, combined with medical staff input, focus group comments, and patient needs indicate a
need to raise awareness of diabetes in the service area along with the need for increased patient
education and intervention. Prairie Lakes needs to assess if the current education process for diabetics
is sufficient and identify barriers faced by these patients.
Wound Care. Chronic diseases have a large impact on wound care and would healing. Statistics
show a tremendous need for wound care treatment. Each year, approximately 6.5 million
Americans will suffer from problem wounds caused by diabetes, circulatory problems and many
other conditions–with 1.1 to 1.8 million new cases each year (Sen et al., 2009). Early diagnosis is
essential to determining the cause of non-healing wounds, to treat the underlying condition and
promote healing, prevent hospitalizations, and decrease the risk of amputation.
Dr. Greg Schultz, vascular surgeon, has identified a need for expanded wound care services in
Watertown. In his Watertown clinic, anywhere from 17% to 27% of patients have some type of
wound. (Dr. Schultz currently provides outreach services in Watertown every Thursday and
every other Tuesday.)
Prairie Lakes wound care services are general and reactive in nature. Referrals are received from
a handful of local physicians and from self-referred patients who are seeking expertise and
assistance with ostomy care. Care is provided to homebound and outpatients by one part-time
nurse who previously held Wound Ostomy Certification. Care is provided to inpatients by
nursing staff on inpatient and outpatient units and staff consults the wound nurse as needed.
19
Thus, the opportunity exists to improve outcomes for wound patients referred for vascular
interventions by evaluating them early in the disease process.
Development of wound healing services in collaboration with vascular, oncology, and
nephrology specialists will increase expertise and allow Prairie Lakes to treat patients locally and
improve outcomes for patients in the region. In addition to providing early diagnosis and
intervention for patients with vascular disease, care for oncology patients post-mastectomy,
lymph node removal, and colostomy can be provided in a consistent manner.
Congestive Heart Failure. It is common for congestive heart failure patients to be readmitted to
the hospital within 30 days of discharge. The most recent Medicare data shows that between July
2008 and June 2011, 24.7% of heart failure patients were readmitted (Rau, 2012). Prairie Lakes
sees a similar trend with congestive heart failure readmission rates. The need to address this issue
has also been brought forward by medical staff.
Studies have concluded that readmissions for heart failure could be prevented in at least 40% of cases
(Hoyt et al., 2001). Through a proactive approach Prairie Lakes could reduce heart failure
readmissions. This could include focused discharge planning with cardiac rehab staff, post discharge
follow up with patients, heart failure focused cardiac rehab education, home health referrals, and
forming a collaboration with clinics to develop a care model for chronic disease management in an
effort to strengthen transitions from the hospital to home setting or other level of care.
Orthopedic Care. According to the American Academy of Orthopaedic Surgeons, in 2006,
musculoskeletal symptoms were the number two reason for physician visits. Musculoskeletal
symptoms include pain, ache, soreness, discomfort, cramps, contractures, spasms, limitation of
movement, stiffness, weakness, swelling, lump, mass, and tumors to the musculoskeletal system
(2009). In addition, CliftonLarsonAllen found that about 20% of the total cost of care for people
insured through Prairie Lakes and Watertown School District was related to orthopedic and
rheumatology care. Many musculoskeletal conditions could be prevented by maintaining a healthy
lifestyle and having knowledge of work place and home safety practices, proper techniques for
moving and lifting items, and proper techniques for stretching muscles.
Behavioral Health Services. According to the National Alliance of Mental Illness close to
30,000 adults in South Dakota live with serious mental illness and about 9,000 children live with
serious mental health conditions (2010). In the Prairie Lakes’ service area caring for people
needing behavior health services is an ongoing need. Issues raised by medical staff, behavioral
health professionals, and focus group attendees included:
Need for better continuum of care and coordination of care for mental health patients
Better referral process from primary care and emergency department to behavioral health
professionals as well as better follow up care
Lack of infrastructure in Watertown to handle mental health patients including holding
patients waiting to be transferred to a psychiatric hospital
Resources for teens and parents who need assistance with teen behavioral issues
Prairie Lakes continues to work with the Human Service Agency and other mental health
professionals to evaluate how the community can best serve the needs of behavioral health

20
patients. Currently, Prairie Lakes provides financial assistance to subsidize a community alcohol
detox program operated by the Human Service Agency.
Palliative Care. Prairie Lakes offers hospice, palliative and home health care options. Prairie
Lakes Hospice cares for over 500 patients each year. The hospice, palliative care, and medical
staffs as well as data available on hospital admission and readmission rates, indicate a lack of
knowledge of palliative and end-of-life care. An opportunity exists to educate patients, family
members, and medical staff on palliative and end-of-life care options, services available in the
region, the importance of planning for palliative and end-of-life care, symptom management, and
the timeliness of referrals.
Access to Care
There continues to be a need for increased access to both primary and specialty care in the service
area. Prairie Lakes has identified several barriers people are currently facing when accessing care in
the service area, including: lack of specialty services, inability to pay for services, and primary care
availability.
Specialty and Primary Care Physician Needs. To determine current and future needs for physicians
in Watertown and the service area Prairie Lakes has completed a comprehensive analysis of the
medical staff and area physicians.
Medical Staff Composition. As of November 15, 2012, Prairie Lakes maintained a medical staff of
126 members, of which 58 were active staff members and 68 were courtesy staff members. Of the 58
active medical staff members, 9 of these physicians were employed by Prairie Lakes. Prairie Lakes
also maintains a contract with a third party provider for tele-radiology services. This contract covers
an additional medical staff of 32 that is not otherwise included in the medical staff count.
Table 12
Composition of the Active Medical Staff by Specialty
Specialty Number of Physicians
Board Certified
Specialty
Number of Physicians
Board Certified
Internal Medicine 3 2 Hospitalists 4 3
Family Practice 17 15 Emergency Medicine 4 4
General Surgery 4 4 Radiology 2 2
Obstetrics/Gyn 4 4 Anesthesiology 3 3
Orthopedics 3 3 Cardiology 2 2
Urology 1 1 Pathology 1 1
Ophthalmology 2 2 Pediatrics 3 3
Nephrology 1 1 Psychiatry 1 0
Oncology 3 2
Age Profile. As of November 15, 2012 the average age of the 58 members of the active medical
staff was 50 years, as compared to an average age of 49 in 2010 and 47 in 2000. Table 13
compares the age distribution of the Prairie Lakes medical staff to South Dakota and United
States physician age distributions.

21
Table 13
Medical Staff Age Distribution
Physician Age < = 40 41-59 > = 60
Prairie Lakes (2012) 19% 62% 19%
SD (2010) 17% 59% 24%
US (2010) 18% 56% 26%
(Association of American Medical Colleges, 2011)
The age distribution of Prairie Lakes’ medical staff is similar to South Dakota and the United States.
Prairie Lakes has a higher percentage of physicians between the ages of 41 and 59 compared to South
Dakota and the United States. In addition, 52% of Prairie Lakes’ medical staff members are over the
age of 50. This suggests a strong need to recruitment physicians to support succession planning.
Population-to-Physician Ratios. Nationwide standards have been set that dictate the appropriate
number of physicians needed to service a population. There are a number of factors that influence
the final population-to-physician ratio in a particular market including population demographics and
the capabilities of primary care physicians. Typically, in smaller communities primary care physicians
have an expanded scope of practice to compensate for the lack of specialty physicians. For example, a
family practice physician may provide obstetric services; an internal medicine physician may provide
basic pulmonology care; and, a general surgeon may provide colonoscopy or vascular services.
Physician to population ratios indicate a need to recruit physicians specializing in internal
medicine, pediatrics, emergency medicine, dermatology, gastroenterology, neurology,
dermatology, orthopedic surgery, ophthalmology, otolaryngology, and vascular surgery. These
ratios indicate a significant need to recruit both internal medicine physicians and pediatricians.
Currently, there are three internal medicine physicians and three pediatricians seeing patients in
primary care practices in Watertown. There are an additional five internal medicine physicians
and four pediatricians seeing patients in other communities in the region. Based on the
population of the region, 17 to 21 internal medicine physicians and 11 to 14 pediatricians are
needed to serve the population.
Community Identified Needs. A community survey conducted by HealthStream, Inc. for Prairie
Lakes revealed about two-thirds (64%) of residents in the Prairie Lakes’ service area have seen a
specialist. In the primary service area, 69% of residents have seen a specialist. Respondents indicated
the top two specialist office locations visited were in Sioux Falls and Watertown. The top two reasons
for not seeing a specialist in Watertown were that the specialist was not available in area (35%) and
the person’s primary care physician referred the patient to a specific specialist (22%). The data
collected by HealthStream, Inc. suggests the largest barrier to receiving specialty care in Watertown is
the lack of a specialist in Watertown.
The top ten specialists survey respondents or a member of their household most recently saw
were: orthopedist, cardiologist, dermatologist, obstetrician and/or gynecologist, neurologist,
urologist, oncologist, gastroenterologist, otolaryngologist, and allergist. In addition, focus group
participants identified a need for additional primary care providers especially internal medicine
physicians, physicians to provide elder care in nursing homes, endocrinologists, and
pulmonologists.

22
Access to Primary Care. Data collected by HealthStream, Inc. and focus group comments
suggest that primary care access, especially in the evenings and on weekends is a problem in the
service area. In addition, access issues were raised in regards to scheduling annual exams and
appointments with specific primary care specialties including internal medicine, pediatrics and
OB/GYN. In general, respondents to the HealthStream, Inc. survey responded positively on how
quickly they were able to schedule a routine, non-emergency appointment, 4.01 primary service
area and 4.05 secondary service area (on a 1-5 scale with 5 as excellent and 1 as poor). They also
responded positively to how quickly they were able to schedule visits when they were sick or needed
to see the doctor immediately, 3.99 primary service area and 4.02 secondary service area.
However, 14% of respondents stated “yes” when asked if they had used a hospital emergency room
or urgent care facility because they did not have a doctor or a doctor was not available. In addition, an
analysis of emergency room visits from June of the previous four years shows a significant increase in
the number of people utilizing the emergency department for non-emergent care during normal clinic
office hours.
Display 15
Appropriate ER Utilization, Emergency vs. Non-Emergency Level of Care Needed*
*Analysis includes all emergency department patients seen Monday through Friday between 800 and 1700 and
Saturday between 900-1200 when primary care clinics are open.
This data suggests:
1) People need care on weekends, evenings, and nights when primary care is not available.
2) The emergency department is being utilized due to financial or insurance limitations.
3) The emergency department is being utilized due to inadequate access to primary care.
Barriers to Care for Low Income/Uninsured/Underinsured. Research conducted by Prairie
Lakes, emergency department data, and demographics all raise access to care issues for the low
income and uninsured or underinsured populations. As noted above, 14% of HealthStream, Inc.
survey respondents said they have used a hospital emergency room or urgent care facility because
they did not have a doctor or a doctor was not available, and an analysis of emergency room visits
showed that over 50% of patients seen would be more appropriately treated in a primary care setting.
In addition, the Prairie Lakes Emergency Department saw an 11% increase in private pay and
23
Medicaid patients between fiscal year 2008 and 2011. Also of note is that 12.3% of the population in
Prairie Lakes’ service area is living below the poverty level and 14.9% of people under the age of 65
are uninsured.
Healthcare access issues and barriers to care were also identified by focus group participants and
other key informants. Several groups were particularly affected:
Low Income, Uninsured, and Underinsured Adults
o Lack of access to dental and vision care due to cost
o Inability to pay for primary care out-of-pocket
o Inability to pay for preventive care or screenings
o Postponing medical treatment until condition becomes emergent and treatment
can be sought in the ER
o Inability to receive care due to outstanding bills with private providers
o Lack of access to low-income or sliding fee clinic
Children
o Lack of insurance (do not qualify for Medicaid)
o Lack of access to dental and vision care due to the cost
o Lack of family support
o Lack of transportation to doctor appointments
Elderly
o Inability to pay for medications
o Inability to afford day-to-day expenses due to medical expenses
o Lack of transportation to appointments
o Lack of caregiver support to help meet day-to-day needs
Single Parents and Teen Parents
o Lack of resources and childbirth classes for single pregnant women and pregnant
teens
o Lack of resources for pregnancy prevention and birth control education
o Inability to receive care due to outstanding bills with private providers
o Lack of Medicaid coverage 2 months beyond pregnancy
Teens
o Lack of contact with this population
o Engaging in risky behaviors
Immigrants
o Lack of health insurance
o Inability to speak and understand English
General
o Lack of knowledge of Prairie Lakes’ financial assistance program
o Overwhelmed by increasing cost of healthcare
o Increased demand for ambulance services
o Inability to meet basic needs: no food, nowhere to live, no transportation

24
Community Identified Needs
Several needs were identified by community and health leaders through focus groups and interviews
that impact the health of individuals and the community as a whole. These needs have been grouped
into transportation, language barriers, and patient engagement.
Transportation. Several issues were discussed in regards to transportation, most of these issues
concern transportation in Watertown and for Watertown residents to out-of-town appointments.
The Watertown Area Transit provides public transportation Monday through Friday from 6:15 a.m. to
6:30 p.m. and on Saturday from 8 a.m. to 6 p.m. No service is available on Sunday. Requests for
transportation must be made one day in advance. Same day transportation is not available. Current
bus fares for a 1-way ride are $1.75 (Watertown proper) and $3.00 (outside area).
Key issues discussed include:
Lack of same day public transit services
Inappropriate use of public transit
Unable to expand current public transit services
Lack of public knowledge of public transit services and day before appointment
requirement
Inability to pay public transit fee
Inability to pay for private transportation
Lack of transportation options to out-of-town medical appointments
Lack of knowledge of specialists available in Watertown
Concern over City of Watertown Ambulance Service requiring $2,000 payment from
patients upfront for transfers to Sioux Falls
Language Barriers. As of 2010, minorities represented 5.2% of Prairie Lakes’ primary service area
population and 13% of the secondary service area population. A small percentage of the population in
the primary and secondary services areas spoke a language other than English at home, 3.66% and
4.67%, respectively. One of the largest barriers to the growing immigrant population seeking
healthcare services is the language barrier.
Focus group discussion centered on the need for certified medical interpreters to accompany patients
to medical appointments. Currently, clinics are using “whoever they can get” to help them
communicate with patients. Some physicians are using smart phone translation applications. Prairie
Lakes currently uses a telephone interpreter service. This service may not be ideal as it may add to a
patient’s anxiety level. Ambulance crews face communication barriers in the field and many times do
not have a way to communicate with a patient until they get to the hospital and can use the telephone
interpreter service.
Patient Engagement. National data, state data, focus group discussion, and interviews all point to the
need to engage patients in their own health and encourage patients to seek preventive care and
participate in health screenings.
Focus group members expressed a growing need to encourage patients to take an active role in
their own health. The scope of what the focus group would like to see is broad, including:

25
Free or affordable wellness programs for all ages
Public education on the importance of preventive care, flu shots, tobacco use, heart attack
symptoms, proper nutrition, and exercise
Low income wellness and nutrition resources
Address barriers to people seeking preventive care
Review need, costs, and knowledge of health screenings in the community
Knowledge of Services. Focus groups and interviews revealed there may be a general lack of
knowledge of both healthcare and non-healthcare services available in the community. A need to
coordinate resources and create a one-stop-shop for people seeking assistance was expressed.
Issues discussed included: lack of knowledge of what healthcare services and specialist are
available locally, people unaware of financial assistance and subsidy programs or what to do if
they do not qualify for these programs, and lack of knowledge or means to seek services.
Summary of Key Findings
Prairie Lakes conducted a comprehensive, data-driven assessment to identify community health
needs in its primary and secondary service areas. These needs were categorized into three areas:
healthcare needs and disease prevalence, access to care, and community identified needs. In
addition, Prairie Lakes analyzed population trends and demographic data, as this data is used to
project disease incidence and determine needs for physicians and healthcare services.
Population Trends and Demographic Data
Prairie Lakes’ primary service area saw a 3% increase in population from 2000 to 2010. Through
2030, the population of the primary service area is projected to continue to grow with an
estimated 17% increase in Watertown and 13% increase in the primary service area. A majority
of patients treated at Prairie Lakes do live in the primary service area, thus, the increase in
population may impact the need for healthcare services. In addition, compared to the overall
population of South Dakota, both Prairie Lakes’ primary and secondary service areas have a
higher percentage of adults ages 65 and over, which may have implications for service delivery
and demand.
Healthcare Needs and Disease Prevalence
Prairie Lakes’ service area had a significantly higher mortality rate than the state average. This
included higher mortality rates for heart disease, cerebrovascular disease, and a majority of
cancer types. In addition, compared to many state averages, Prairie Lakes’ service area has
higher mortality rates related to chronic diseases as well as chronic disease incident rates.
Overall, the healthcare needs and disease prevalence data indicates a need to address chronic
disease education, prevention, and management; develop service lines related to pulmonology
and wound care; and review utilization of existing services, including orthopedic and palliative
care.
Access to Care
There continues to be a need for increased access to both primary and specialty care in the
service area. Barriers people are currently facing when accessing care include: lack of specialty
services, inability to see primary care physicians in a timely manner or when services are needed, and

26
inability to pay for services. Data indicates a need to recruit physicians specializing in internal
medicine, pediatrics, emergency medicine, dermatology, gastroenterology, neurology,
dermatology, orthopedic surgery, ophthalmology, otolaryngology, and vascular surgery. In
addition, ways to increase access to primary care need explored in order to allow access to care
in a timely manner; decrease inappropriate use of the emergency department; and provide care to
low income, uninsured, and underinsured populations.
Community Identified Needs
Community and health leaders identified four areas that impact the health of individuals and the
community as a whole. These needs are transportation to and from appointments, language
barriers that prevent the immigration population from seeking healthcare services, people not
taking an active role in their own health, and lack of knowledge of healthcare and non-healthcare
services offered. These findings indicate a need for community and health leaders to work
together to better serve the needs of all populations.
27
References
American Academy of Orthopaedic Surgeons. (2009). Orthopaedic Fast Facts. Retrieved from
http://orthoinfo.aaos.org/topic.cfm?topic=A00130
American Lung Association. (2011). State of the Air. Retrieved from: http://www.stateoftheair.org/.
Association of American Medical Colleges. (2011.) 2011 State Physician Workforce Data Book.
Retrieved from https://www.aamc.org/download/263512/data/statedata2011.pdf
Bush, H. (2012, October). Tackling the High Cost of Chronic Disease. Hospitals and Health
Networks, 86(10), 34-40.
Centers for Disease Control and Prevention. (2012). Chronic Diseases and Health Promotion.
Retrieved from http://www.cdc.gov/chronicdisease/overview/index.htm.
Centers for Disease Control and Prevention. (2012). County Level Estimates of Obesity – U.S. Maps.
Retrieved from http://www.cdc.gov/socialdeterminants/FAQ.html.
Centers for Disease Control and Prevention. (2012). National Diabetes Surveillance System.
Retrieved from http://apps.nccd.cdc.gov/DDT_STRS2/NationalDiabetesPrevalence
Estimates.aspx?mode=OBS.
Centers for Disease Control and Prevention. (2012). Prevalence of Stroke – United States, 2006-2010.
Retrieved from http://www.cdc.gov/mmwr/preview/mmwrhtml/mm6120a5.htm
Centers for Disease Control and Prevention. (2011). Social Determinants of Health. Retrieved from
http://www.cdc.gov/socialdeterminants/FAQ.html.
Centers for Disease Control and Prevention. (2003). Trends in Aging – United States and Worldwide.
Morbidity and Mortality Weekly Report, 52(6), 101-112.
CliftonLarsonAllen. (2012). Total Cost of Care Report prepared for Prairie Lakes Healthcare System.
HealthStream, Inc.. (2012). 2012 Community Insights Community Needs Assessment prepared for
Prairie Lakes Healthcare System.
Hoyt, R.E. & Bowling, L.S. (2001, April, 15). Reducing Readmissions for Congestive Heart Failure.
American Family Physician, 63(8), 1593-1599.
Market Street Services. (2012). Vision Plan: Watertown, South Dakota.
McCurry, M. (2012). South Dakota State University Department of Sociology and Rural Studies.
County Population Projections.

28
Minnesota State Demographic Center. (2007). Population Projections 2005-2035. Retrieved from
http://www.demography.state.mn.us/documents/MinnesotaPopulationProjections20052035.pd
f
National Alliance on Mental Illness. (2010). State Advocacy 2010: State Statistics South Dakota.
Retrieved from http://www.nami.org/ContentManagement/ContentDisplay.cfm?
ContentFileID=93520
National Institutes of Health. (2012). Lung Diseases. Retrieved from
http://www.nlm.nih.gov/medlineplus/ lungdiseases.html
The Office of Minority Health. (2012). American Indian/Alaska Native Profile. Retried from
http://minorityhealth.hhs.gov/templates/browse.aspx?lvl=2&lvlid=52.
Rau, J. (2012, July 19). Hospitals’ readmission rates still too high, government says. The Washington
Post. Retried from http://www.washingtonpost.com/politics/hospitals-readmission-rates-still-
too-high-government-says/2012/07/19/gJQAZIqdwW_story.html
Sen, C. K., Gordillo, G. M., Roy, S., Kirsner, R., Lambert, L., Hunt, T. K., Gottrup, F., Gurtner,
G. C. and Longaker, M. T. (2009). Human skin wounds: A major and snowballing threat
to public health and the economy. Wound Repair and Regeneration, 17, 763–771.
South Dakota Department of Health. (2012). 2012 South Dakota Vital Statistics Report: A State and
County Comparison of Leading Health Indicators.
South Dakota Department of Health. (2012). Cancer in South Dakota, 2009. Retrieved from
http://getscreened.sd.gov/documents/2009-SD-Cancer-Report.pdf.
South Dakota Department of Health. (2009). Burden of Cardiovascular Disease in South Dakota.
Retried from http://doh.sd.gov/HDS/PDF/CVDburden.pdf.
South Dakota Department of Health. (2012). The Health Behaviors of South Dakotas 2010. Retrieved
from http://doh.sd.gov/Statistics/2010BRFSS/default.aspx.
U.S. Census Bureau. (2012). State and County QuickFacts. Retrieved from
http://quickfacts.census.gov/qfd/index.html.

29
Page Intentionally Left Blank
30
Prairie Lakes Healthcare System
Community Health Needs Assessment
Part 2: Community Benefit Implementation Plan
January 2013
31
Introduction
Prairie Lakes Healthcare System completed a community health needs assessment in fiscal year
2013. The purpose of this assessment was to allow Prairie Lakes to identify the health needs of
its service area, prioritize these needs, and implement a strategy to address these needs. This
document identifies a community benefit implementation plan to address the following:
1. The organization’s commitment to charity care and subsidizing the unpaid cost of the
Medicaid program.
2. The organization’s response to health needs identified through the completion of the FY
2013 Community Health Needs Assessment.
3. The organization’s plans for subsidizing services with negative margins to meet
community health needs.
4. The organization’s plans for supporting community building activities to serve the
broader community.
The process for identifying unmet community needs and prioritizing community benefit
spending is discussed followed by an implementation plan. The implementation plan is for FY
2013 to FY 2016. The plan will be revised as initiatives are more fully developed to address a
particular need.
Identification of Unmet Community Health Needs: Findings and Priority Setting
Community Health Needs Assessment. The complete set of findings of the PLHS Community
Health Needs Assessment is found in a document published internally in November 2013.
The organization has established processes to guide decision making regarding community
benefit spending. Processes are established to determine the following:
1. The overall amount of community benefit spending that will be targeted each fiscal year.
2. Determining priorities with respect to needs identified from the community health needs
assessment.
3. Criteria used to determine if community investments are based on the health needs of the
community, priorities, and the capabilities of the organization.
Spending Targets. The PLHS Board of Directors adopted a community benefit policy in June
2012 that established guidelines for community benefit spending and specifically what level of
resources should be spent on community benefit.
The target goal for community benefit spending recommended for PLHS is 7% of operating
expenses. This community benefit spending target includes charity care spending at 2%; a
Medicaid shortfall funding at 3%; and support for community health needs and community
building initiatives at 2%. A number of factors may cause this target to change including
financial circumstances and competing needs. The Attorney General’s Office of Massachusetts
published a guideline that recommended nonprofit hospitals with less than $200 million
operating expenses target 3% of that amount for community benefit and 3%-6% if operating

32
expenses were greater than $200 million. Annual operating expenses for PLHS FY 2013 are
projected to be $73 million. A seven percent spending level would be $5.1 million. Senator
Grassley is on record recommending a target of 5%. Management believes the PLHS target of
community benefit spending at 7% of operating expenses exceeds what few recommendations
exist at the present time.
In FY 2012, the PLHS Board of Directors established a community benefit reserve fund to build funds
for significant community benefit programs or activities. Use of these funds requires a board
resolution and alignment with the organization’s community benefit plan.
Prioritization. Charity care and subsidizing the Medicaid program are the organization’s first priorities
for community benefit “spending.” Providing care to disadvantaged persons is consistent with the
organization’s health care mission and addresses the needs of the poor and underserved in the
community. Charity care and the unpaid costs of the Medicaid program are budgeted according to
historical patterns. However, in the event the need to provide charity care or subsidized care to low
income individuals increases, the organization will respond. PLHS does not set an upper limit on
these expenditures.
In general, the nature and extent of specific community benefit initiatives supported by PLHS varies
depending on community needs and the organization’s resource capabilities at any given time. In
addition, the organization reviewed the results of the Community Health Needs Assessment and
selected the priority areas for a community benefit implementation plan. Prioritization was guided by
the following criteria:
1. The issue affected a significant number of people in the service area.
2. The level of public concern about the issue was significant.
3. The issue contributed directly or indirectly to premature death and/or significant morbidity.
4. There were inequities associated with the issue. Health inequities are differences in health
status, morbidity, and mortality rates across populations that are systemic, avoidable, unfair,
and unjust.
The community health needs assessment focused on two major areas: 1. Health concerns related to
disease morbidity and mortality, and 2. Service gaps contributing to health inequities and/or limiting
access to services.
Top Ranked Health Concerns. Based on these criteria, the top-ranked priority health concerns
identified from the Community Health Needs Assessment FY 2013 were as follows:
1. Cardiovascular Disease
There is a higher incidence of cardiovascular disease in the service area than the overall state
incidence. Heart disease is associated with premature death.
2. Respiratory Disease
There are higher mortality rates for influenza and pneumonia in the service area than the overall
state incidence. The region lacks a pulmonologist even though the population is sufficient to
support this specialty.
3. Obesity (Childhood and Adult)

33
Obesity is a major modifiable risk factor for chronic disease morbidity and mortality. Focus
groups expressed a need for community initiatives to address obesity.
4. Diabetes
The primary and secondary services areas had higher rates of diabetes than the national average.
The primary service area has a higher diabetes mortality rate than the secondary service area and
the state.
5. Mental Illness
The focus groups expressed a need for community initiatives to address care coordination,
improve referral processes, and provide services to adolescents and their families.
Three of these five health concerns will be addressed in the community benefit implementation plan
through the development of initiatives by PLHS and, if applicable, community partners: Heart
disease, respiratory disease, and diabetes.
Health Needs Not Addressed Through Hospital Initiatives. The obesity issue is currently being
addressed through community nutrition, physical activity, and weight loss initiatives. Primary care
clinics, the hospital, and the community recreation center provide a number of programs. The hospital
will evaluate opportunities to provide cash donations to support community initiatives that address
inequities associated with providing services.
Community-based mental health services are provided by The Human Service Agency. The agency
provides services to individuals with developmental disabilities; those struggling with chemical and
gambling addictions; people diagnosed with a mental illness; and to individuals coping with a
depressed mood, anxiety, marital stress, or other life stresses. The agency provides residential detox
services for medically stable individuals with financial support for this service from various entities
including Prairie Lakes Healthcare System. Patients requiring inpatient mental health services are
transferred to providers outside the service area. The hospital lacks the expertise to provide additional
mental health services and does not want to duplicate the efforts of other community providers.
However, the hospital will support efforts to work with community mental health providers to
improve care coordination and referral processes.
In addition to the top five health concerns, four other concerns were identified from the Community
Health Needs Assessment FY 2013 and will not be targeted for specific initiatives in the
implementation plan for the reasons described:
1. Cancer
2. Poor nutrition
3. Tobacco use
4. Excessive alcohol consumption
The Community Health Needs Assessment revealed a lower cancer mortality rate in the service area
than in the state. The organization has a fully developed cancer program. Cash donations are made
annually to community groups who provide assistance to cancer patients with needs. No specific
initiatives are planned but the organization will continue to provide cash donations to community
groups providing support of cancer patients.
34
The lifestyle health issues related to poor nutrition, tobacco use, and excessive alcohol consumption
are addressed through a number of community initiatives. PLHS will continue to support these
initiatives through cash donations.
Top Ranked Service Gaps. Using the prioritizing criteria previously described, the top-ranked service
gaps identified from the Community Health Needs Assessment FY 2013 were as follows:
1. Access to Primary Care and Medical Specialists
Community members surveyed as part of the community health needs assessment reported
difficulty accessing primary care in the evenings and on weekends; difficulty scheduling annual
exams; and, use of the hospital ER because they did not have a doctor or a doctor was not
available. ER utilization for non-urgent conditions is increasing. Groups that were particularly
affected included low income, uninsured, or underinsured adults.
2. Care Management: Heart Failure An opportunity to reduce inpatient heart failure readmission was identified by physicians and by
reviewing readmission rates. The community lacks a coordinated approach to care transitions
and care management for chronic disease such as heart failure. The primary reasons for
minimal care management programming are lack of physician and hospital integration and lack
of reimbursement for care coordination.
3. Wound Care There is a high demand for services but a program is not fully developed.
4. Health Literacy
Health literacy refers to the capacity of individuals to obtain, process, and understand basic
health information and services in order to make appropriate health decision. Focus groups
expressed a need for community initiatives to address health literacy.
5. Transportation Focus groups expressed a need to expand low cost public transportation options that provide
access to healthcare services.
Three of these five health service gaps will be addressed in the community benefit implementation
plan through the development of initiatives by PLHS and, if applicable, community partners: Access,
heart failure care management, and wound care.
Service Gaps Not Addressed Through Hospital Initiatives. The health literacy issue will not be
addressed at the present time through a hospital initiative. While the hospital supports improving the
health literacy of the community, there is need for additional evaluation to determine the scope of
health literacy initiatives and to assess the role of marketing and community events sponsored by the
hospital to promote health literacy.
The hospital will provide a cash donation to support transportation expansion and has no additional
plans for specific initiatives.

35
In addition to the top five service gaps, two other issues were identified from the Community Health
Needs Assessment FY 2013 and will not be targeted for specific initiatives in the implementation plan
for the reasons described:
1. Adequate health care coverage
2. Language barriers
The adequacy of health care coverage will be partly addressed through the organization’s charity care
initiative. In addition, adequacy of healthcare coverage will be addressed through access to care
initiatives. It is recognized that this will not address all needs. However, a number of community
groups that provide additional support to people with needs receive cash donations from PLHS.
The focus groups indicated the ideal means to address language barriers was to maintain a roster of
translators that could be mobilized by the healthcare provider community. The hospital’s past
experience with this approach had minimal success and the hospital instead adopted a telephone
translation service. At the present time, the organization is not planning additional initiatives to
address language barriers.