ppac cover july 2021 final 09 aug
TRANSCRIPT


PrefaceIndia is the third largest energy consumer in the world and its energy demand is poised to grow at an average rate of more than 3% till 2045 as compared to less than 1% growth rate for the world’s primary energy demand growth during the same period. India’s energy demand is expected to reach pre pandemic level during 2021-22 itself and will continue its high growth trajectory for another more than two decades.
The world is seeing greater thrust towards the green and clean energy. The Energy Policy of India is based on the premise that access to energy should be affordable and reliable as enunciated by the Hon’ble Prime Minister in his address during the inaugural event of 4th India Energy Forum CERAWEEK in October 2020. The Hon’ble Prime Minister said that like the seven horses driving the chariot of the Sun God, India’s energy map has seven key drivers:
• Accelerating our efforts to move towards a gas-based economy
• Cleaner use of fossil fuels particularly petroleum and coal
• Greater reliance on domestic fuels to drive bio-fuels
• Achieving the renewables target of 450 GW by 2030
• Increasing the contribution of electricity to de-carbonise mobility
• Moving into the emerging fuels including hydrogen
• Digital innovation across all the energy systems
All the stakeholders in the Energy Sector including the PPAC are taking appropriate steps for attaining the energy justice with smaller carbon footprints on the back of these pillars.
Petroleum Planning and Analysis Cell (PPAC), is an attached office of the Ministry of Petroleum and Natural Gas (MoP&NG), Government of India and undertakes analysis of trends of consumption, pricing, subsidy and new developments in domestic Oil and Gas energy sector. It is a nodal hub for data in the Oil & Gas sector and publishes the aggregated data on an industry basis on its website www.ppac.gov.in. The data is obtained from the Public Sector companies, Government agencies as well as the Private companies.
During 2020-21, PPAC has also been involved in various studies like All India study on sectoral demand of petrol & diesel, Energy Demand Projection Model (EDPM) for assessing consumption of all POL products during 2020-2045 with 5-year intervals, study on allocation of domestic crude to PSU refineries, recommendation of measures for continued viability of Natural Gas production from nomination fields in the context of 2014 guidelines, review of definition of Indian Basket of Crude and reassessment of Strategies for Import reduction in the Energy Sector.
Oil & Gas statistics is a crucial input for many stakeholders that include the Government,

academia, industry and research agencies. Consistent and accurate data enable both decision making and policy making.
Publication entitled ‘Ready Reckoner’ is brought out twice a year and our endeavour is to deliver accurate and timely information to all stakeholders. This July 2021 edition of PPAC’s biannual Ready Reckoner contains the latest data/information for the financial year 2020-21 and historical time series for stakeholders to access the same on a single platform. The Ready Reckoner is also published on PPAC’s website (http://ppac.gov.in) and on our mobile app - PPACE which is available on Google Play Store and Apple Store. The publication of Ready Reckoner is a concerted effort by all divisions of PPAC and I would like to place on record my sincere appreciation of the diligent efforts of the officers and staff who have contributed to bring out the current edition. Cooperation of the oil and gas industry and various organizations is sincerely acknowledged for their timely inputs.
The Ready Reckoner this year has few additional details like the average import prices of LNG and crude oil as well as a separate table on the State wise CGD sales profile segregated into CNG, PNG, commercial etc. PPAC welcomes feedback and suggestions for broadening the coverage and contents of the data being disseminated through this publication. The comments and feedback may kindly be sent to [email protected] and [email protected].
New DelhiJuly 29, 2021
Praveen M. KhanoojaDirector General
Petroleum Planning & Analysis Cell (PPAC)(Ministry of Petroleum & Natural Gas)
Praveen M. Khanooja

Vision To be the most authentic official source for data and policy analysis on the
hydrocarbon sector in the country.
Mission1. To monitor and analyze developments in the domestic oil and gas sector.2. To undertake analysis of domestic and international energy markets.3. To develop a cooperative framework for exchange of information and conduct of
studies with other countries and international organizations in the energy sector.4. To strengthen the existing data system in PPAC by adopting the latest techniques
and best practices.5. To render effective assistance and advice to the Ministry of Petroleum & Natural
Gas in the discharge of its responsibilities, particularly pricing of petroleum products and administration of subsidy schemes.
Objectives1. To monitor and analyze trends in prices of crude oil, petroleum products and
natural gas and their impact on the oil companies and consumers, and prepare appropriate technical inputs for policy making.
2. To monitor developments in the domestic market and analyze options for policy changes in pricing, transportation and distribution of petroleum products.
3. To collect, compile and disseminate data on the domestic oil and gas sector in a continuous manner and maintain the data bank.
4. To ensure quality of data in terms of prescribed parameters such as accuracy, completeness and timeliness.
5. To disseminate periodic reports on various aspects of oil and gas sector.6. To ensure effective administration of the subsidy schemes notified by the
Government.
Petroleum Planning & Analysis Cell(Ministry of Petroleum & Natural Gas, Government of India)
Vision &Mission
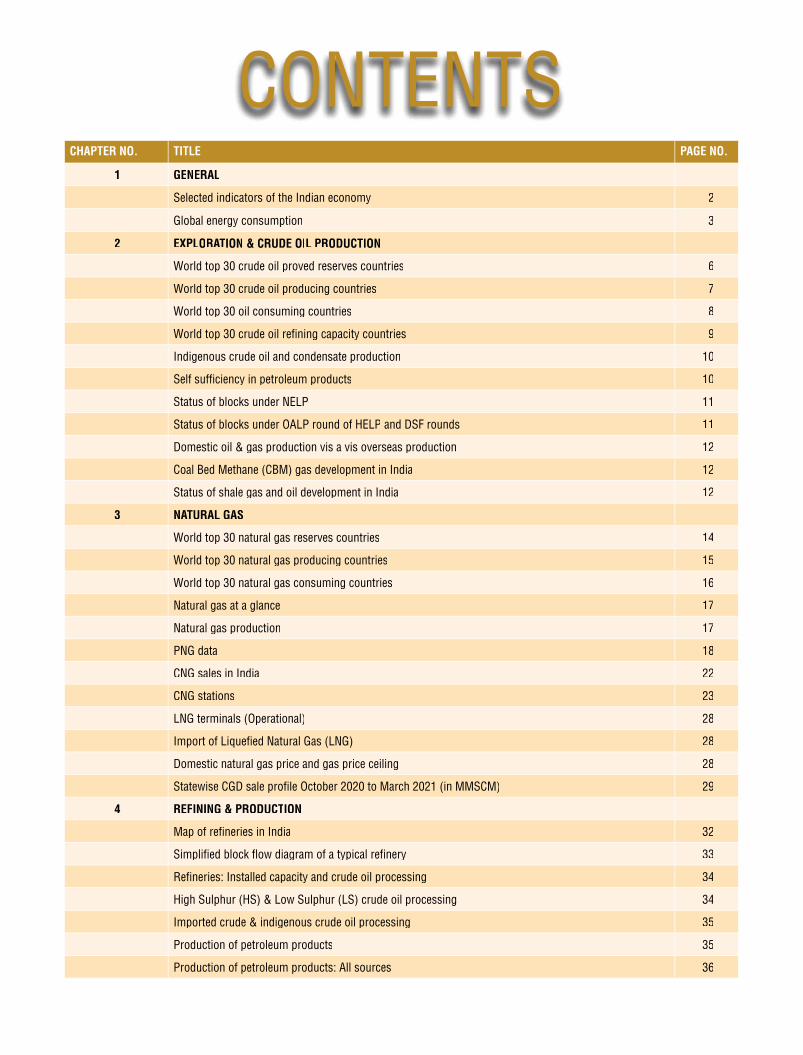
CONTENTSCHAPTER no. TiTLE PAGE no.
1 GE1 GEnERAL
Selected indicators of the Indian economy 2
Global energy consumption 3
2 EXPL2 EXPLoRATion & CRUDE oiL PRoDUCTion
World top 30 crude oil proved reserves countries 6
World top 30 crude oil producing countries 7
World top 30 oil consuming countries 8
World top 30 crude oil refining capacity countries 9
Indigenous crude oil and condensate production 10
Self sufficiency in petroleum products 10
Status of blocks under NELP 11
Status of blocks under OALP round of HELP and DSF rounds 11
Domestic oil & gas production vis a vis overseas production 12
Coal Bed Methane (CBM) gas development in India 12
Status of shale gas and oil development in India 12
3 nATURAL GAs
World top 30 natural gas reserves countries 14
World top 30 natural gas producing countries 15
World top 30 natural gas consuming countries 16
Natural gas at a glance 17
Natural gas production 17
PNG data 18
CNG sales in India 22
CNG stations 23
LNG terminals (Operational) 28
Import of Liquefied Natural Gas (LNG) 28
Domestic natural gas price and gas price ceiling 28
Statewise CGD sale profile October 2020 to March 2021 (in MMSCM) 29
4 REF4 REFininG & PRoDUCTion
Map of refineries in India 32
Simplified block flow diagram of a typical refinery 33
Refineries: Installed capacity and crude oil processing 34
High Sulphur (HS) & Low Sulphur (LS) crude oil processing 34
Imported crude & indigenous crude oil processing 35
Production of petroleum products 35
Production of petroleum products: All sources 36

Production vis a vis consumption of petroleum products 36
Gross Refining Margins (GRM) of refineries 37
GRM of North East refineries excluding excise duty benefit 38
Distillate yield of PSU refineries 38
Fuel and Loss 39
Specific energy consumption (MBN number) of PSU refineries 39
Import / export of crude oil and petroleum products 40
Exchange rates of Indian rupee (`) 41
5 MAJoR PiPELinEs in inDiA
Map of pipeline network in India 44
Natural gas pipelines 45
Existing major crude oil pipelines in India 46
Existing major POL pipelines in India 47
6 sALEs
Consumption of petroleum products 50
Chart : All India consumption of petroleum products 50
Consumption growth of petroleum products 51
End-use analysis of HSD sales & diesel consumption by sectors 51
State-wise sales of selected petroleum products 52
PDS SKO allocation 53
Oil industry retail outlets & SKO/LDO agencies 54
Chart: Category wise SKO/LDO agencies 55
Industry marketing infrastructure 55
Chart: All India number of retail ourlets in PSU & private category 56
Chart: Category wise retail outlets 56
Break-up of POL consumption data (PSU and Private) 57
Ethanol blending programme 58
Chart : POL consumption by product 59
Chart : Distribution of total domestic POL sales in India 59
7 LPG
LPG marketing at a glance 62
LPG coverage (estimated) 63
BPL households covered under PMUY scheme 64
LPG domestic customers (14.2 kg/5 kg) enrolment by PSU OMCs 65
Number of LPG distributers (New scheme) 66
8 PRiCEs AnD TAXEs
Price of crude oil & petroleum products in the international market 68
Chart: Trend in spreads of petroleum products vs Indian basket of crude oil 69
Chart: Trend in spreads of international benchmark crude oils 69
CHAPTER no. TiTLE PAGE no.

Price build-up of PDS kerosene at Mumbai 70
Price build-up of domestic LPG at Delhi 70
Price build-up of petrol at Delhi 70
Price build-up of diesel at Delhi 70
Break up of central excise duty on petrol & diesel 70
Share of taxes in Retail Selling Price of PDS kerosene at Mumbai 71
Share of taxes in Retail Selling Price of domestic LPG at Delhi 71
Weightage of crude oil, natural gas and petroleum products in Wholesale Price Index (WPI) 71
Dealers’ commission on petrol & diesel 72
Wholesale dealers’ commission on PDS kerosene 72
Distributors’ commission on domestic LPG 73
Retail Selling Price of major petroleum products in India & neighbouring countries 74
Retail Selling Price of petroleum products at State capitals/UTs 75
Retail Selling Price of PDS kerosene at major cities 75
Customs, excise duty and GST rates on petroleum products 76
Actual rate of sales tax/VAT/GST and other taxes levied by State/UT Governments on major petroleum products 77
Contribution of petroleum sector to exchequer 78
State/UT wise collection of sales tax/VAT by petroleum sector 79
State/UT wise collection of SGST/UTGST by petroleum sector 80
Profit After Tax (PAT) of oil companies 81
Financial details of oil companies 82
Total subsidy/under-recovery on petroleum products & natural gas 83
Quantity and value of Indian crude oil imports 83
9 MisCELLAnEoUs
Average international calorific values of different fuels 86
Weight to volume conversion 86
Volume conversion 86
Contents of LPG & Natural Gas 86
Natural Gas conversions 87
Major end use of petroleum products 87
List of abbreviations 88
CHAPTER no. TiTLE PAGE no.

PPAC Ready Reckoner
1
PPAC Ready Reckoner
2
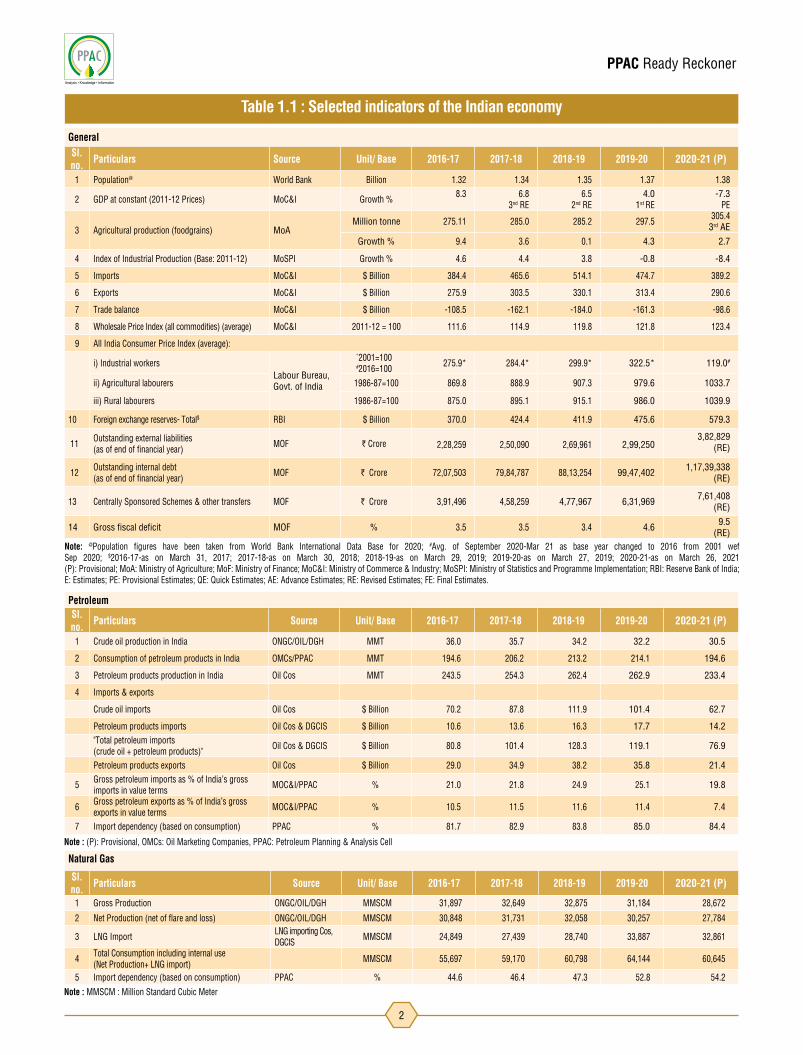
GeneralSl. no. Particulars Source Unit/ Base 2016-17 2017-18 2018-19 2019-20 2020-21 (P)
1 Population@ World Bank Billion 1.32 1.34 1.35 1.37 1.38
2 GDP at constant (2011-12 Prices) MoC&I Growth % 8.3 6.8 3nd RE
6.5 2nd RE
4.0 1st RE
-7.3 PE
3 Agricultural production (foodgrains) MoAMillion tonne 275.11 285.0 285.2 297.5 305.4
3rd AE
Growth % 9.4 3.6 0.1 4.3 2.7
4 Index of Industrial Production (Base: 2011-12) MoSPI Growth % 4.6 4.4 3.8 -0.8 -8.4
5 Imports MoC&I $ Billion 384.4 465.6 514.1 474.7 389.2
6 Exports MoC&I $ Billion 275.9 303.5 330.1 313.4 290.6
7 Trade balance MoC&I $ Billion -108.5 -162.1 -184.0 -161.3 -98.6
8 Wholesale Price Index (all commodities) (average) MoC&I 2011-12 = 100 111.6 114.9 119.8 121.8 123.4
9 All India Consumer Price Index (average):
i) Industrial workersLabour Bureau, Govt. of India
*2001=100 #2016=100 275.9* 284.4* 299.9* 322.5* 119.0#
ii) Agricultural labourers 1986-87=100 869.8 888.9 907.3 979.6 1033.7
iii) Rural labourers 1986-87=100 875.0 895.1 915.1 986.0 1039.9
10 Foreign exchange reserves- Total$ RBI $ Billion 370.0 424.4 411.9 475.6 579.3
11 Outstanding external liabilities (as of end of financial year) MOF ` Crore 2,28,259 2,50,090 2,69,961 2,99,250
3,82,829 (RE)
12 Outstanding internal debt(as of end of financial year) MOF ` Crore 72,07,503 79,84,787 88,13,254 99,47,402 1,17,39,338
(RE)
13 Centrally Sponsored Schemes & other transfers MOF ` Crore 3,91,496 4,58,259 4,77,967 6,31,969 7,61,408 (RE)
14 Gross fiscal deficit MOF % 3.5 3.5 3.4 4.6 9.5 (RE)
PetroleumSl. no. Particulars Source Unit/ Base 2016-17 2017-18 2018-19 2019-20 2020-21 (P)
1 Crude oil production in India ONGC/OIL/DGH MMT 36.0 35.7 34.2 32.2 30.5
2 Consumption of petroleum products in India OMCs/PPAC MMT 194.6 206.2 213.2 214.1 194.6
3 Petroleum products production in India Oil Cos MMT 243.5 254.3 262.4 262.9 233.4
4 Imports & exports
Crude oil imports Oil Cos $ Billion 70.2 87.8 111.9 101.4 62.7
Petroleum products imports Oil Cos & DGCIS $ Billion 10.6 13.6 16.3 17.7 14.2 "Total petroleum imports (crude oil + petroleum products)" Oil Cos & DGCIS $ Billion 80.8 101.4 128.3 119.1 76.9
Petroleum products exports Oil Cos $ Billion 29.0 34.9 38.2 35.8 21.4
5 Gross petroleum imports as % of India's gross imports in value terms MOC&I/PPAC % 21.0 21.8 24.9 25.1 19.8
6 Gross petroleum exports as % of India's gross exports in value terms MOC&I/PPAC % 10.5 11.5 11.6 11.4 7.4
7 Import dependency (based on consumption) PPAC % 81.7 82.9 83.8 85.0 84.4
Natural Gas
Sl.no. Particulars Source Unit/ Base 2016-17 2017-18 2018-19 2019-20 2020-21 (P)
1 Gross Production ONGC/OIL/DGH MMSCM 31,897 32,649 32,875 31,184 28,672
2 Net Production (net of flare and loss) ONGC/OIL/DGH MMSCM 30,848 31,731 32,058 30,257 27,784
3 LNG Import LNG importing Cos, DGCIS MMSCM 24,849 27,439 28,740 33,887 32,861
4 Total Consumption including internal use (Net Production+ LNG import) MMSCM 55,697 59,170 60,798 64,144 60,645
5 Import dependency (based on consumption) PPAC % 44.6 46.4 47.3 52.8 54.2
Table 1.1 : Selected indicators of the Indian economy
Note : MMSCM : Million Standard Cubic Meter
Note: @Population figures have been taken from World Bank International Data Base for 2020; #Avg. of September 2020-Mar 21 as base year changed to 2016 from 2001 wef Sep 2020; $2016-17-as on March 31, 2017; 2017-18-as on March 30, 2018; 2018-19-as on March 29, 2019; 2019-20-as on March 27, 2019; 2020-21-as on March 26, 2021 (P): Provisional; MoA: Ministry of Agriculture; MoF: Ministry of Finance; MoC&I: Ministry of Commerce & Industry; MoSPI: Ministry of Statistics and Programme Implementation; RBI: Reserve Bank of India; E: Estimates; PE: Provisional Estimates; QE: Quick Estimates; AE: Advance Estimates; RE: Revised Estimates; FE: Final Estimates.
Note : (P): Provisional, OMCs: Oil Marketing Companies, PPAC: Petroleum Planning & Analysis Cell

PPAC Ready Reckoner
3
Source: BP Statistical Review of World Energy, 2021. Note: For calculation of per capita consumption population figures have been taken from World Bank International Data Base for 2020. Conversion factor used for Oil as per product basket of 1 Mtoe = 0.0431 Exajoules, for all other fuels 1 Mtoe = 0.0419 Exajoules. (Approximate conversion factors from BP Statistical Review of World Energy, 2021).Since approximate conversion factors used to convert Exajoules to Mtoe, consumption of Oil may not exactly match with Table 2.2. Mtoe: Million tonnes of oil equavalent, Toe: Tonnes of oil equivalentFigures are for calendar year.
Sl.no. Country Unit Oil Natural Gas Coal Nuclear Energy Hydro Electricity Renewables Total Energy
1 China Mtoe 661.60 284.25 1965.00 77.68 280.44 186.09 3455.07
Percentage share of fuel % 19.15 8.23 56.87 2.25 8.12 5.39 100%
Per capita consumption Toe 0.47 0.20 1.40 0.06 0.20 0.13 2.46
2 USA Mtoe 755.42 715.41 219.80 176.39 61.24 146.89 2075.14
Percentage share of fuel % 36.40 34.48 10.59 8.50 2.95 7.08 100%
Per capita consumption Toe 2.29 2.17 0.67 0.54 0.19 0.45 6.30
3 India Mtoe 209.43 51.25 418.86 9.46 34.71 34.17 757.88
Percentage share of fuel % 27.63 6.76 55.27 1.25 4.58 4.51 100%
Per capita consumption Toe 0.15 0.04 0.30 0.01 0.03 0.02 0.55
4 Russian Federation Mtoe 148.31 353.73 78.20 45.80 45.07 0.90 672.00
Percentage share of fuel % 22.07 52.64 11.64 6.82 6.71 0.13 100%
Per capita consumption Toe 1.03 2.45 0.54 0.32 0.31 0.01 4.66
5 Japan Mtoe 150.76 89.78 109.26 9.12 16.45 27.04 402.41
Percentage share of fuel % 37.46 22.31 27.15 2.27 4.09 6.72 100%
Per capita consumption Toe 1.20 0.71 0.87 0.07 0.13 0.21 3.20
6 Canada Mtoe 98.91 96.85 11.83 20.69 81.60 12.80 322.67
Percentage share of fuel % 30.65 30.01 3.67 6.41 25.29 3.97 100%
Per capita consumption Toe 2.60 2.55 0.31 0.54 2.15 0.34 8.49
7 Germany Mtoe 97.71 74.42 44.04 13.66 3.95 52.67 286.45
Percentage share of fuel % 34.11 25.98 15.38 4.77 1.38 18.39 100%
Per capita consumption Toe 1.17 0.89 0.53 0.16 0.05 0.63 3.44
8 Iran Mtoe 76.87 200.43 1.78 1.34 4.49 0.21 285.12
Percentage share of fuel % 26.96 70.30 0.62 0.47 1.58 0.07 100%
Per capita consumption Toe 0.92 2.39 0.02 0.02 0.05 0.00 3.39
9 Brazil Mtoe 106.95 27.62 13.83 3.24 84.17 47.91 283.72
Percentage share of fuel % 37.69 9.73 4.87 1.14 29.67 16.89 100%
Per capita consumption Toe 0.50 0.13 0.07 0.02 0.40 0.23 1.33
10 South Korea Mtoe 113.84 48.71 72.35 33.98 0.82 8.55 278.26
Percentage share of fuel % 40.91 17.50 26.00 12.21 0.30 3.07 100%
Per capita consumption Toe 2.20 0.94 1.40 0.66 0.02 0.17 5.37
11 Saudi Arabia Mtoe 151.16 96.39 0.11 0.00 0.00 0.22 247.87
Percentage share of fuel % 60.98 38.89 0.04 - - 0.09 100%
Per capita consumption Toe 4.34 2.77 0.00 - - 0.01 7.12
12 France Mtoe 62.17 34.96 4.62 75.06 13.00 16.28 206.10
Percentage share of fuel % 30.16 16.96 2.24 36.42 6.31 7.90 100%
Per capita consumption Toe 0.92 0.52 0.07 1.11 0.19 0.24 3.06
13 Indonesia Mtoe 54.35 35.71 77.76 0.00 4.13 8.81 180.76
Percentage share of fuel % 30.07 19.75 43.02 - 2.28 4.87 100%
Per capita consumption Toe 0.20 0.13 0.28 - 0.02 0.03 0.66
14 United Kingdom Mtoe 55.39 62.33 4.62 10.67 1.37 28.69 163.07
Percentage share of fuel % 33.97 38.22 2.84 6.54 0.84 17.59 100%
Per capita consumption Toe 0.82 0.93 0.07 0.16 0.02 0.43 2.43
15 Mexico Mtoe 57.22 74.20 4.99 2.42 5.69 8.50 153.02
Percentage share of fuel % 37.39 48.49 3.26 1.58 3.72 5.55 100%
Per capita consumption Toe 0.44 0.58 0.04 0.02 0.04 0.07 1.19
Sub total Mtoe 2800.07 2246.03 3027.04 479.52 637.15 579.72 9769.54
Others Mtoe 1233.11 1040.96 589.67 93.26 274.35 177.69 3409.05
Total World Mtoe 4033.18 3287.00 3616.72 572.78 911.50 757.42 13178.60
Percentage share of fuel % 30.60 24.94 27.44 4.35 6.92 5.75 100%
Per capita consumption Toe 0.52 0.42 0.47 0.07 0.12 0.10 1.70
Table 1.2 : Global energy consumption, 2020


PPAC Ready Reckoner
6
Table 2.1 : World top 30 crude oil proved reserves countries
Sl.no. Country
At end 2020
Thousand million tonnes Thousand million barrels Reserves /Production ratio
1 Venezuela 48.0 303.8 *2 Saudi Arabia 40.9 297.5 73.63 Canada 27.1 168.1 89.44 Iran 21.7 157.8 139.85 Iraq 19.6 145.0 96.36 Russian Federation 14.8 107.8 27.67 Kuwait 14.0 101.5 103.28 United Arab Emirates 13.0 97.8 73.19 US 8.2 68.8 11.410 Libya 6.3 48.4 339.211 Nigeria 5.0 36.9 56.112 Kazakhstan 3.9 30.0 45.313 China 3.5 26.0 18.214 Qatar 2.6 25.2 38.115 Brazil 1.7 11.9 10.816 Algeria 1.5 12.2 25.017 Angola 1.1 7.8 16.118 Norway 1.0 7.9 10.819 Azerbaijan 1.0 7.0 26.720 Mexico 0.9 6.1 8.721 Oman 0.7 5.4 15.422 India 0.6 4.5 16.123 Vietnam 0.6 4.4 58.124 South Sudan 0.5 3.5 56.425 Egypt 0.4 3.1 14.026 Republic of Congo 0.4 2.9 25.727 Yemen 0.4 3.0 86.728 Malaysia 0.4 2.7 12.529 Argentina 0.3 2.5 11.330 Syria 0.3 2.5 158.8
Subtotal 240.5 1703.3Others 3.9 29.0Total World 244.4 1732.4 53.5of which: OECD 38.3 260.0 25.2 Non-OECD 206.1 1472.4 66.9 OPEC 172.0 1216.0 106.8 Non-OPEC 72.4 516.4 24.6
European Union 0.3 2.4 16.8Canadian oil sands: Total 26.2 161.4 of which: Under active development 3.1 18.9 Venezuela: Orinoco Belt 42.0 261.8
Source: BP Statistical Review of World Energy, July 2021; * More than 500 years.Notes: Total proved reserves of oil - Generally taken to be those quantities that geological and engineering information indicates with reasonable certainty can be recovered in the future from known reservoirs under existing economic and operating conditions. The data series for total proved oil reserves does not necessarily meet the definitions, guidelines and practices used for determining proved reserves at company level, for instance as published by the US Securities and Exchange Commission, nor does it necessarily represent bp’s view of proved reserves by country. Reserves-to-production (R/P) ratio - If the reserves remaining at the end of any year are divided by the production in that year, the result is the length of time that those remaining reserves would last if production were to continue at that rate. Canadian oil sands ‘under active development’ are an official estimate. Venezuelan Orinoco Belt reserves are based on the OPEC Secretariat and government announcements. Reserves and R/P ratio for Canada includes Canadian oil sands. Reserves and R/P ratio for Venezuela includes the Orinoco Belt. Saudi Arabia’s oil reserves include NGLs from 2017. Reserves include gas condensate and natural gas liquids (NGLs) as well as crude oil. Shares of total and R/P ratios are calculated using thousand million barrels figures.Figures are for calendar year.

PPAC Ready Reckoner
7
Source: BP Statistical Review of World Energy, July 2021 Notes: *Includes crude oil, shale oil, oil sands, condensates (lease condensate or gas condensates that require further refining) and NGLs (natural gas liquids - ethane, LPG and naphtha separated from the production of natural gas). Excludes liquid fuels from other sources such as biofuels and synthetic derivatives of coal and natural gas. This also excludes liquid fuel adjustment factors such as refinery processing gain. Excludes oil shales/kerogen extracted in solid form. Figures are for calendar year.
Sl.no. CountryProduction*
Million tonnes Million barrels daily
1 US 713 16.5
2 Russian Federation 524 10.7
3 Saudi Arabia 520 11.0
4 Canada 252 5.1
5 Iraq 202 4.1
6 China 195 3.9
7 United Arab Emirates 166 3.7
8 Brazil 159 3.0
9 Iran 143 3.1
10 Kuwait 130 2.7
11 Mexico 95 1.9
12 Norway 92 2.0
13 Nigeria 87 1.8
14 Kazakhstan 86 1.8
15 Qatar 76 1.8
16 Angola 65 1.3
17 Algeria 58 1.3
18 United Kingdom 48 1.0
19 Oman 46 1.0
20 Colombia 41 0.8
21 Indonesia 36 0.7
22 India 35 0.8
23 Azerbaijan 35 0.7
24 Egypt 30 0.6
25 Argentina 28 0.6
26 Venezuela 27 0.5
27 Malaysia 27 0.6
28 Ecuador 26 0.5
29 Australia 20 0.5
30 Libya 18 0.4
Sub total 3980 84.4
Others 186 3.9
Total World 4165 88.4
of which: OECD 1281 28.2
Non-OECD 2884 60.2
OPEC 1474 31.1
Non-OPEC 2691 57.3
European Union# 19 0.4
Table 2.2 : World top 30 crude oil producing countries, 2020

PPAC Ready Reckoner
8
Table 2.3 : World top 30 crude oil consuming countries, 2020
Sl. no. CountryConsumption *
Million tonnes Million barrels daily
1 US 739.7 17.2
2 China 669.2 14.2
3 India 213.1 4.7
4 Saudi Arabia 150.0 3.5
5 Japan 149.0 3.3
6 Russian Federation 146.3 3.2
7 South Korea 110.6 2.6
8 Brazil 106.8 2.3
9 Canada 98.1 2.3
10 Germany 96.2 2.0
11 Iran 75.3 1.7
12 Singapore 69.5 1.3
13 France 61.4 1.3
14 Mexico 56.1 1.3
15 United Kingdom 54.7 1.2
16 Thailand 54.0 1.3
17 Indonesia 53.2 1.2
18 Spain 51.7 1.1
19 Italy 49.3 1.1
20 Turkey 43.4 0.9
21 Taiwan 43.1 1.0
22 Australia 41.9 0.9
23 Netherlands 35.2 0.7
24 United Arab Emirates 34.7 0.8
25 Malaysia 31.1 0.7
26 Egypt 30.7 0.7
27 Iraq 30.2 0.6
28 Poland 29.4 0.6
29 Argentina 24.3 0.5
30 South Africa 23.3 0.5
Sub total 3371.8 74.7
Others 635.0 13.7
Total World 4006.7 88.5
of which: OECD 1796.8 40.3
Non-OECD 2209.9 48.2
European Union# 462.5 9.8
Source: BP Statistical Review of World Energy, July 2021 *Inland demand plus international aviation and marine bunkers and refinery fuel and loss. Consumption of biogasoline (such as ethanol) and biodiesel are excluded while derivatives of coal and natural gas are included. Notes: Differences between these world consumption figures and world production statistics are accounted for by stock changes, consumption of non-petroleum additives and substitute fuels and unavoidable disparities in the definition, measurement or conversion of oil supply and demand data.Figures are for calendar year.
PPAC Ready Reckoner
9
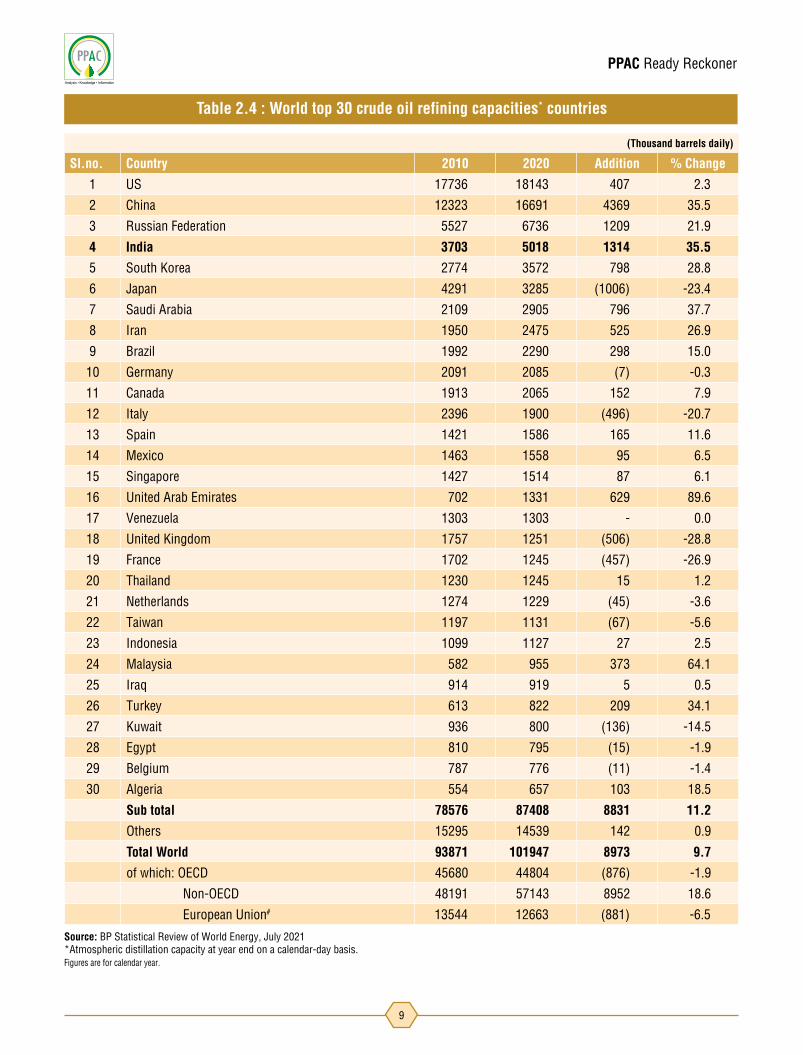
(Thousand barrels daily)
Sl.no. Country 2010 2020 Addition % Change
1 US 17736 18143 407 2.3
2 China 12323 16691 4369 35.5
3 Russian Federation 5527 6736 1209 21.9
4 India 3703 5018 1314 35.5
5 South Korea 2774 3572 798 28.8
6 Japan 4291 3285 (1006) -23.4
7 Saudi Arabia 2109 2905 796 37.7
8 Iran 1950 2475 525 26.9
9 Brazil 1992 2290 298 15.0
10 Germany 2091 2085 (7) -0.3
11 Canada 1913 2065 152 7.9
12 Italy 2396 1900 (496) -20.7
13 Spain 1421 1586 165 11.6
14 Mexico 1463 1558 95 6.5
15 Singapore 1427 1514 87 6.1
16 United Arab Emirates 702 1331 629 89.6
17 Venezuela 1303 1303 - 0.0
18 United Kingdom 1757 1251 (506) -28.8
19 France 1702 1245 (457) -26.9
20 Thailand 1230 1245 15 1.2
21 Netherlands 1274 1229 (45) -3.6
22 Taiwan 1197 1131 (67) -5.6
23 Indonesia 1099 1127 27 2.5
24 Malaysia 582 955 373 64.1
25 Iraq 914 919 5 0.5
26 Turkey 613 822 209 34.1
27 Kuwait 936 800 (136) -14.5
28 Egypt 810 795 (15) -1.9
29 Belgium 787 776 (11) -1.4
30 Algeria 554 657 103 18.5
Sub total 78576 87408 8831 11.2
Others 15295 14539 142 0.9
Total World 93871 101947 8973 9.7
of which: OECD 45680 44804 (876) -1.9
Non-OECD 48191 57143 8952 18.6
European Union# 13544 12663 (881) -6.5
Table 2.4 : World top 30 crude oil refining capacities* countries
Source: BP Statistical Review of World Energy, July 2021 *Atmospheric distillation capacity at year end on a calendar-day basis. Figures are for calendar year.
PPAC Ready Reckoner
10
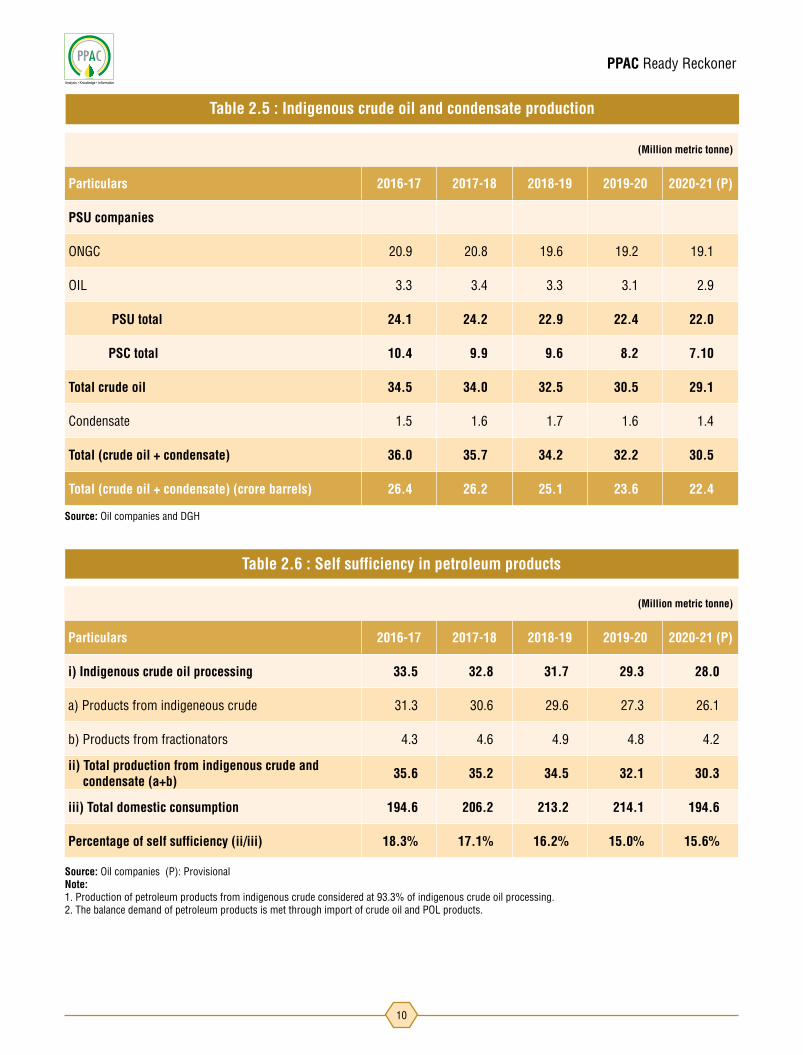
Table 2.5 : Indigenous crude oil and condensate production
Table 2.6 : Self sufficiency in petroleum products
(Million metric tonne)
Particulars 2016-17 2017-18 2018-19 2019-20 2020-21 (P)
PSU companies
ONGC 20.9 20.8 19.6 19.2 19.1
OIL 3.3 3.4 3.3 3.1 2.9
PSU total 24.1 24.2 22.9 22.4 22.0
PSC total 10.4 9.9 9.6 8.2 7.10
Total crude oil 34.5 34.0 32.5 30.5 29.1
Condensate 1.5 1.6 1.7 1.6 1.4
Total (crude oil + condensate) 36.0 35.7 34.2 32.2 30.5
Total (crude oil + condensate) (crore barrels) 26.4 26.2 25.1 23.6 22.4
(Million metric tonne)
Particulars 2016-17 2017-18 2018-19 2019-20 2020-21 (P)
i) Indigenous crude oil processing 33.5 32.8 31.7 29.3 28.0
a) Products from indigeneous crude 31.3 30.6 29.6 27.3 26.1
b) Products from fractionators 4.3 4.6 4.9 4.8 4.2
ii) Total production from indigenous crude and condensate (a+b) 35.6 35.2 34.5 32.1 30.3
iii) Total domestic consumption 194.6 206.2 213.2 214.1 194.6
Percentage of self sufficiency (ii/iii) 18.3% 17.1% 16.2% 15.0% 15.6%
Source: Oil companies and DGH
Source: Oil companies (P): ProvisionalNote: 1. Production of petroleum products from indigenous crude considered at 93.3% of indigenous crude oil processing. 2. The balance demand of petroleum products is met through import of crude oil and POL products.

PPAC Ready Reckoner
11
Round Launch year Offered
Awarded Relinquished/Proposed for Relinquishment
Operational
1999 Shallow water
Onland Total Deep water
Shallow water
Onland Total Deep water
Shallow water
Onland Total
NELP-I 1999 48 7 16 1 24 5 15 1 21 2 1 3
NELP-II 2000 25 8 8 7 23 8 8 6 22 0 1 1
NELP-III 2002 27 9 6 8 23 9 5 5 19 0 1 3 4
NELP-IV 2003 24 10 10 20 10 0 7 17 0 3 3
NELP-V 2005 20 6 2 12 20 6 1 9 16 0 1 3 4
NELP-VI 2006 55 21 6 25 52 21 4 19 44 0 2 6 8
NELP-VII 2007 57 11 7 23 41 11 4 17 32 0 3 6 9
NELP-VIII 2009 70 8 11 13 32 8 9 12 29 0 2 1 3
NELP-IX 2010 34 1 3 15 19 1 2 6 9 0 1 9 10
TOTAL 360 81 59 114 254 79 48 82 209 2 11 32 45
Table 2.7 (A) : Status of blocks under NELP (As on 01.04.2021)
Source: DGH
Round Launch year Offered
Awarded Relinquished/Proposed for Relinquishment
Operational
Deep/ Ultra Deep water
Shallow water
Onland Total Deep/ Ultra Deep water
Shallow water
Onland Total Deep/ Ultra Deep water
Shallow water
Onland Total
OALP Round-I 2018 55 1 8 46 55 0 0 0 0 1 8 46 55
OALP Round-II 2019 14 1 5 8 14 0 0 0 0 1 5 8 14
OALP Round-III 2019 23 1 3 14 18 0 0 0 0 1 3 14 18
OALP Round-IV 2019 7 7 7 0 0 0 0 7 7
OALP Round-V 2020 11 1 2 8 11 0 0 0 0 1 2 8 11
DSF Round-I 2016 46 0 7 23 30 0 4 7 11 0 3 16 19
DSF Round-II 2018 25 0 9 15 24 0 1 4 5 0 8 11 19
TOTAL 181 4 34 121 159 0 5 11 16 4 29 110 143
Table 2.7(B): Status of blocks under OALP round of HELP and DSF Rounds (As on 01.04.2021)
Source: DGHNote : NELP New Exploration Licensing Policy HELP Hydrocarbon Exploration Licensing Policy OALP Open Acreage Licensing Policy Round DSF Discovered Small and Marginal Fields Round

PPAC Ready Reckoner
12
Table 2.9 : Coal Bed Methane (CBM) Gas development in India
Prognosticated CBM resources 91.8 TCF
Established CBM resources 10.4 TCF
CBM Resources (33 Blocks) 62.8 TCF
Total available coal bearing areas (India) 32760 Sq. KM
Total available coal bearing areas with MoPNG/DGH 21659 Sq. KM
Area awarded 16613 Sq. KM
Blocks awarded 33 Nos.
Exploration initiated* 10517 Sq. KM
Production of CBM gas April-March 2021(P) 642.4 MMSCM*Area considered if any boreholes were drilled in the awarded block. Source: DGH
Policy Guidelines for Exploration & exploitation of Shale gas and oil
Shale gas and oil exploration policy was announced in October, 2013. ONGC and OIL India Ltd have been allotted 50 and 6 blocks respectively for assessment under Phase-I. ONGC identified 50 blocks in 4 basins and OIL identified 6 blocks in 2 basins in Phase-I. Under Hydrocarbon Exploration and Licensing Policy (HELP), 2016 the single licence will enable the contractor to explore conventional as well as unconventional oil and gas resources including CBM, shale gas/oil, tight gas and gas hydrates under a single license. In August 2018, the Government of India notified a Policy framework for Exploration and exploitation of Unconventional hydrocarbons in existing acreages under existing Production Sharing Contracts (PSC), Coal Bed Methane (CBM) Contracts and Nomination fields.
Oil and Natural Gas Corporation Limited (ONGC): Activities up to 2020-21
Basin Phase-I Blocks
MWP* Wells
Blocks Taken up for Drilling Actual Wells Drilled
Cambay 28 29 16 17
KG 10 13 6 8
Cauvery 9 12 1 3
Assam 3 3 2 2
Total 50 57 25 30
Oil India Limited (OIL): Activities up to 2020-21
Basin Phase-I Blocks
MWP Wells
Blocks Taken up for Drilling Actual Wells Drilled
Jaisalmer 1 2 1 1
Assam 5 6 0 3
Total 6 8 1 4
Table 2.10: Status of Shale Gas and Oil development in India ( As on 01.04.2021)
Year 2016-17 2017-18 2018-19 2019-20 2020-21 (P)
Total domestic production (MMTOE) 67.9 68.3 67.1 63.4 59.2
Overseas production (MMTOE) 17.6 22.7 24.7 24.5 21.9
Overseas production as percentage of domestic production 25.9 33.2 36.8 38.7 37.0
Table 2.8 : Domestic oil & gas production vis a vis overseas production
Source: ONGC Videsh Ltd., OIL, GAIL, BPRL, IOCL and HPCL
*MWP : Minimum Work Programme
PPAC Ready Reckoner
13

PPAC Ready Reckoner
14
(Billion cubic metres)
Sl. no. Country 2020
1 Russian Federation 37392
2 Iran 32101
3 Qatar 24665
4 Turkmenistan 13601
5 US 12619
6 China 8399
7 Venezuela 6260
8 Saudi Arabia 6019
9 United Arab Emirates 5939
10 Nigeria 5473
11 Iraq 3529
12 Azerbaijan 2504
13 Australia 2390
14 Canada 2354
15 Algeria 2279
16 Kazakhstan 2257
17 Egypt 2138
18 Kuwait 1695
19 Other Africa 1569
20 Libya 1430
21 Norway 1429
22 India 1320
23 Indonesia 1252
24 Ukraine 1091
25 Malaysia 908
26 Uzbekistan 845
27 Oman 666
27 Vietnam 646
29 Israel 589
30 Myanmar 432
Others 388
Total World 187977
of which: OECD 20280
Non-OECD 167795
European Union 442
Table 3.1 : World top 30 natural gas reserve countries
Source: BP Statistical Review of World Energy, July 2021Figures are for calendar year.
PPAC Ready Reckoner
15
(Billion cubic metres)
Sl. no. Country 2020
1 US 915
2 Russian Federation 638
3 Iran 251
4 China 194
5 Qatar 171
6 Canada 165
7 Australia 143
8 Saudi Arabia 112
9 Norway 111
10 Algeria 81
11 Malaysia 73
12 Indonesia 63
13 Turkmenistan 59
14 Egypt 58
15 United Arab Emirates 55
16 Nigeria 49
17 Uzbekistan 47
18 United Kingdom 39
19 Argentina 38
20 Oman 37
21 Thailand 33
22 Kazakhstan 32
23 Pakistan 31
24 Mexico 30
25 Trinidad & Tobago 29
26 Other Africa 29
27 Other Asia Pacific 28
28 Azerbaijan 26
29 Bangladesh 25
30 Brazil 24
Sub total 3588
Others 265
Total World 3854
of which: OECD 1478
Non-OECD 2375
European Union 48
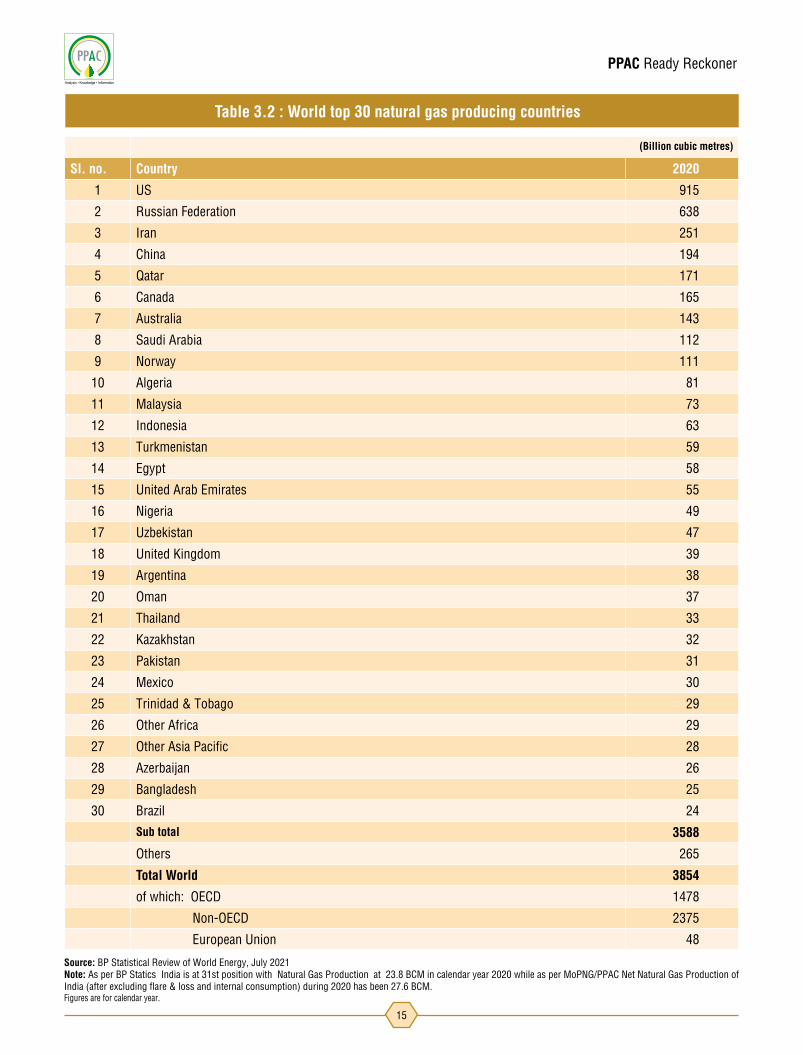
Table 3.2 : World top 30 natural gas producing countries
Source: BP Statistical Review of World Energy, July 2021Note: As per BP Statics India is at 31st position with Natural Gas Production at 23.8 BCM in calendar year 2020 while as per MoPNG/PPAC Net Natural Gas Production of India (after excluding flare & loss and internal consumption) during 2020 has been 27.6 BCM.Figures are for calendar year.

PPAC Ready Reckoner
16
(Billion cubic metres)
Sl. no. Country 2020
1 US 832
2 Russian Federation 411
3 China 331
4 Iran 233
5 Canada 113
6 Saudi Arabia 112
7 Japan 104
8 Germany 87
9 Mexico 86
10 United Kingdom 72
11 United Arab Emirates 70
12 Italy 68
13 India 60
14 Egypt 58
15 South Korea 57
16 Thailand 47
17 Turkey 46
18 Argentina 44
19 Algeria 43
20 Uzbekistan 43
21 Indonesia 42
22 Pakistan 41
23 Australia 41
24 France 41
25 Malaysia 38
26 Netherlands 37
27 Qatar 35
28 Spain 32
29 Brazil 32
30 Turkmenistan 31
Sub total 3286
Others 537
Total World 3822.8
of which: OECD 1757.7
Non-OECD 2065.1
European Union 379.9
Table 3.3 : World top 30 natural gas consuming countries
Source: BP Statistical Review of World Energy, July 2021Figures are for calendar year.

PPAC Ready Reckoner
17
(MMSCM)
2016-17 2017-18 2018-19 2019-20 2020-21 (P)
Gross production 31897 32649 32875 31184 28672Net Production (net of flare and loss) 30848 31731 32058 30257 27784LNG import 24849 27439 28740 33887 32861Total Consumption including internal use (Net Production+ LNG import) 55697 59170 60798 64144 60645
Total consumption (in BCM) 55.7 59.2 60.8 64.1 60.6
(MMSCM)
2016-17 2017-18 2018-19 2019-20 2020-21 (P)ONGCA) Gross Production 22088 23429 24677 23746 21872B) Flared 530 450 449 520 458C) Internal Use 4499 4427 4629 4697 4432D) Loss 0 0 0 0 0D) =A-B-C Net Production for Sale 17059 18553 19599 18529 16982Oil India LimitedA) Gross Production 2937 2881 2722 2668 2480B) Flared 117 114 122 155 164C) Internal Use 405 398 382 377 371D) Loss 2 5 12 13 14D) =A-B-C Net Production for Sale 2412 2365 2207 2123 1930PSC/JVs fields A) Gross Production 6872 6338 5477 4770 4321B) Flared 330 261 153 185 199C) Internal Use 952 981 1007 978 925D) Loss 70 89 81 54 53E) =A-B-C-D Net Production for Sale 5520 5007 4235 3552 3143Grand TotalA) Gross Production 31897 32649 32875 31184 28672B) Flared 977 824 724 860 822C) Internal Use 5856 5806 6017 6052 5729D) Loss 72 94 93 67 67E) =A-B-C-D Net Production for Sale 24992 25925 26041 24205 22055
Table 3.4 : Natural gas at a glance
Table 3.5 : Natural gas production
Source: Domestic Gas Producers / DGH / LNG Importing companies/DGCISNote: LNG import data in Million Metric Tonne (MMT), converted to MMSCM; 1MMT=1325 MMSCM BCM: Billion Cubic Meter; MMSCMD: Million Standard Cubic Meter per Day

PPAC Ready Reckoner
18
State/Union Territory Geographical Area/ CGD Networks Authorized CGD EntityPNG connections
Domestic Commercial Industrial
Andhra Pradesh
Kakinada Bhagyanagar Gas Limited 58087 128 2
West Godavari District Godavari Gas Private Limited 50762 12 1
East Godavari District (EAAA) Godavari Gas Private Limited 49470 5 0
Vijaywada Bhagyanagar Gas Limited 43124 53 0
Krishna District (EAAA) Megha Engineering & Infrastructure Limited 10160 90 15
Total 2,11,603 288 18
Andhra Pradesh, Karnataka & Tamil Nadu
Chittoor, Kolar and Vellore Districts AGP City Gas Private Limited 0 0 1
Total 0 0 1
AssamUpper Assam Assam Gas Company Limited 36406 1179 404
Cachar, Hailakandi & Karimganj Districts Purba Bharati Gas Private Limited 285 0 0
Total 36,691 1,179 404
Bihar Patna District GAIL (India) Limited 30336 11 0
Total 30,336 11 0
Chandigarh (UT), Haryana, Punjab & Himachal Pradesh
Chandigarh Indian-Oil Adani Gas Private Limited 111737 37 11
Total 1,11,737 37 11
Dadra & Nagar Haveli UT of Dadra & Nagar Haveli Gujarat Gas Limited 7458 54 54
Total 7,458 54 54
Daman & Diu (UT) UT of Daman Indian-Oil Adani Gas Private Limited 4817 30 29
Total 4,817 30 29
Goa North Goa District Goa Natural Gas Private Limited 5963 2 9
Total 5,963 2 9
Gujarat
Surat, Bharuch, Ankleshwar Gujarat Gas Limited 684828 9187 1010
Ahmedabad City and Daskroi Area Adani Gas Limited 420686 2858 854
Rajkot Gujarat Gas Limited 258764 1041 1424
Gandhinagar Mehsana Sabarkantha Sabarmati Gas Limited 208551 909 366
Vadodara Vadodara Gas Limited 178119 2635 7
Gandhinagar Gujarat Gas Limited 127460 541 30
Valsad Gujarat Gas Limited 110793 364 689
Navsari Gujarat Gas Limited 105580 261 52
Nadiad Gujarat Gas Limited 64646 391 20
Anand District (EAAA) Gujarat Gas Limited 37684 243 17
Bhavnagar Gujarat Gas Limited 37070 293 69
Hazira Gujarat Gas Limited 36320 132 17
Anand area including Kanjari & Vadtal Villages (in Kheda District) Charotar Gas Sahakari Mandali Limited 34867 674 142
Banaskantha District IRM Energy Private Limited 25900 107 11
Surendranagar Gujarat Gas Limited 25372 238 362
Jamnagar Gujarat Gas Limited 23206 171 108
Panchmahal District Gujarat Gas Limited 16666 94 84
Patan District Sabarmati Gas Limited 13244 25 6
Amreli District Gujarat Gas Limited 5318 30 1
Dahod District Gujarat Gas Limited 2983 10 21
Table 3.6 : PNG data as on 31.03.2021

PPAC Ready Reckoner
19
Gujarat
Kutch (West) Gujarat Gas Limited 1916 25 2
Dahej Vagra Taluka Gujarat Gas Limited 1113 13 31
Vadodara Adani Gas Limited 616 1 88
Narmada (Rajpipla) District Gujarat Gas Limited 53 0 0
Total 24,21,755 20,243 5,411
Haryana
Faridabad Adani Gas Limited 62536 203 392
Sonipat GAIL Gas Limited 25750 42 172
Gurugram Haryana City Gas Distribution Limited 22694 142 167
Panipat District Indian-Oil Adani Gas Private Limited 16939 11 25
Rewari District Indraprastha Gas Limited 10477 27 73
Kaithal District Indraprastha Gas Limited 10426 0 0
Karnal District Indraprastha Gas Limited 9769 5 9
Ambala & Kurukshetra Districts HPOIL Gas Private Limited 6575 0 0
Yamunanagar District Bharat Petroleum Corporation Limited 6150 0 0
Nuh and Palwal Distircts Adani Gas Limited 1476 4 37
Rohtak District Bharat Petroleum Corporation Limited 1424 0 0
Jhajjar District Haryana City Gas (KCE) Private Limited 24 0 0
Gurugram Indraprastha Gas Limited 15814 87 20
Total 1,90,054 521 895
Himachal Pradesh Bilaspur, Hamirpur & Una Districts Bharat Gas Resources Limited 1000 0 0
Total 1,000 0 0
Jharkhand
Ranchi District GAIL (India) Limited 18010 0 0
East Singhbhum District GAIL (India) Limited 15078 0 0
Giridih & Dhanbad Districts GAIL Gas Limited 5948 0 0
Seraikela-Kharsawan District GAIL Gas Limited 2950 0 0
Total 41,986 0 0
Karnataka
Bengaluru Rural and Urban Districts GAIL Gas Limited 196086 249 141
Tumkur District Megha Engineering & Infrastructure Limited 15724 97 35
Dharwad District Indian-Oil Adani Gas Private Limited 13387 5 0
Belgaum District Megha Engineering & Infrastructure Limited 12791 65 22
Dakshina Kannada District* GAIL Gas Limited 7848 0 0
Ramanagara District Maharashtra Natural Gas Limited 1203 0 1
Total 2,47,039 416 199
KeralaErnakulam District Indian-Oil Adani Gas Private Limited 42429 12 9
Alapuzzha, Kollam and Thiruvananthapuram Districts AGP City Gas Private Limited 0 0 3
Total 42,429 12 12
Madhya Pradesh
Indore (including Ujjain City) Aavantika Gas Limited 62873 94 236
Gwalior Aavantika Gas Limited 24277 44 8
Dewas GAIL Gas Limited 13257 28 42
Satna & Shandol Districts Bharat Gas Resources Limited 1580 0 0
Rewa District Indian Oil Corporation Limited 810 0 0
Dhar District Naveriya Gas Private Limited 615 14 0
Guna District Indian Oil Corporation Limited 506 0 0
Table 3.6 : Continued
State/Union Territory Geographical Area/ CGD Networks Authorized CGD EntityPNG connections
Domestic Commercial Industrial

PPAC Ready Reckoner
20
Madhya PradeshRaisen, Shajapur and Sehore Districts GAIL Gas Limited 44 0 0
Bhopal & Rajgarh Districts Think Gas Bhopal Private Limited 1 1 1
Total 1,03,963 181 287
Maharashtra
Mumbai & Greater Mumbai Mahanagar Gas Limited 938747 3167 15
Thane urban and adjoining Municipalities Mahanagar Gas Limited 623804 943 67
Pune City including Pimpri - Chichwad & adjoining contigeneous areas Hinjewadi, Chakan, Talegaon
Maharashtra Natural Gas Limited 358058 377 225
Raigarh District (EAAA) Mahanagar Gas Limited 40288 0 1
Kolhapur District HPOIL Gas Private Limited 3037 0 0
Pune District (EAAA) Torrent Gas Pune Limited 1488 0 4
Sindhudurg District Maharashtra Natural Gas Limited 1438 0 0
Ratnagiri District Unison Enviro Private Limited 1193 1 28
Palghar District & Thane Rural Gujarat Gas Limited 468 14 54
Sangli & Satara Districts Bharat Gas Resources Limited 455 0 0
Total 19,68,976 4,502 394
Maharashtra & Gujarat Valsad (EAAA), Dhule & Nashik Districts Maharashtra Natural Gas Limited 25023 0 0
Total 25,023 0 0
National Capital Territory of Delhi (UT) National Capital Territory of Delhi Indraprastha Gas Limited 1065662 2683 1589
Total 10,65,662 2,683 1,589
Odisha
Khordha District GAIL (India) Limited 17152 0 0
Cuttack District GAIL (India) Limited 8009 0 0
Ganjam, Nayagarh & Puri Districts GAIL Gas Limited 873 0 0
Sundargarh & Jharsuguda Districts GAIL Gas Limited 756 0 0
Total 26,790 0 0
Punjab
Rupnagar District Bharat Petroleum Corporation Limited 4950 0 0
Amritsar District Gujarat Gas Limited 3497 36 3
Fatehgarh Sahib District IRM Energy Private Limited 1432 18 48
Bhatinda District Gujarat Gas Limited 970 0 0
Ludhiana District (EAAA), Barnala & Moga Districts Think Gas Ludhiana Private Limited 110 0 0
SAS Nagar District (EAAA), Patiala & Sangrur Districts Torrent Gas Private Limited 22 0 0
Total 10,981 54 51
Rajasthan
Ajmer, Pali and Rajsamand Districts Indraprastha Gas Limited 37625 0 0
Kota Rajasthan State Gas Limited 16458 17 15
Bhiwadi (in Alwar District) Haryana City Gas Distribution (Bhiwadi) Limited 2087 0 53
Barmer, Jaisalmer & Jodhpur Districts AGP CGD India Private Limited 37 1 2
Kota District (EAAA), Baran & Chittorgarh (Only Rawatbhata Taluka) Districts Torrent Gas Private Limited 2 0 0
Total 56,209 18 70
TelanganaHyderabad Bhagyanagar Gas Limited 143248 28 45
Medak, Siddipet & Sangareddy Districts Torrent Gas Private Limited 0 0 4
Total 1,43,248 28 49
Table 3.6 : Continued
State/Union Territory Geographical Area/ CGD Networks Authorized CGD EntityPNG connections
Domestic Commercial Industrial

PPAC Ready Reckoner
21
Sources : PNGRB Note : 1. All the GAs where PNG connections/CNG Stations have been established are considered as Operational.2. Under normal conditions, operation of any particular GA commences within around one year of authorization. 3. EAAA stands for Excluding/Except Area Already Authorized | * stands for Sub-Judice
TripuraAgartala Tripura Natural Gas Company Limited 42541 491 62
West Tripura (EAAA) District Tripura Natural Gas Company Limited 6566 0 0
Total 49,107 491 62
Uttar Pradesh
Gautam Budh Nagar District Indraprastha Gas Limited 258734 607 890
Ghaziabad & Hapur Districts Indraprastha Gas Limited 244682 304 390
Kanpur Central UP Gas Limited 84044 231 81
Agra Green Gas Limited 79094 61 17
Lucknow Green Gas Limited 69870 57 11
Meerut GAIL Gas Limited 49723 44 62
Varanasi District GAIL (India) Limited 36405 30 1
Allahabad Indian-Oil Adani Gas Private Limited 36142 30 6
Bareilly Central UP Gas Limited 34532 129 23
Meerut District (EAAA), Muzaffarnagar & Shamli Districts Indraprastha Gas Limited 16525 6 0
Kanpur (EAAA) District, Fatehpur and Hamirpur Districts Indraprastha Gas Limited 14404 0 0
Moradabad Torrent Gas Moradabad Limited 9346 13 85
Saharanpur District Bharat Petroleum Corporation Limited 8902 0 0
Khurja Adani Gas Limited 7080 4 232
Mathura Sanwariya Gas Limited 4589 39 78
Amethi, Pratapgarh & Raebareli Districts Bharat Gas Resources Limited 1824 0 0
Mirzapur, Chandauli and Sonbhadra Districts GAIL Gas Limited 1308 0 0
Jhansi Central UP Gas Limited 961 0 0
Faizabad & Sultanpur Districts Green Gas Limited 841 0 0
Moradabad (EAAA) District Torrent Gas Private Limited 674 0 1
Auraiya, Kanpur Dehat & Etawah Districts Torrent Gas Private Limited 505 0 0
Allahabad District (EAAA), Bhadohi & Kaushambi Districts Indian-Oil Adani Gas Private Limited 348 0 0
Gorakhpur, Sant Kabir Nagar & Kushinagar Districts Torrent Gas Private Limited 40 0 0
Total 9,60,573 1,555 1,877
Uttar Pradesh & Rajasthan Firozabad (Taj Trapezium Zone) GAIL Gas Limited 18000 1 341
Total 18,000 1 341
UttarakhandHaridwar District Haridwar Natrural Gas Private
Limited 20946 0 0
Udham Singh Nagar District Indian-Oil Adani Gas Private Limited 10196 33 40
Dehradun District GAIL Gas Limited 7845 0 0
Total 38,987 33 40
Grand Total 78,20,387 32,339 11,803
Table 3.6 : Continued
State/Union Territory Geographical Area/ CGD Networks Authorized CGD EntityPNG connections
Domestic Commercial Industrial

PPAC Ready Reckoner
22
(Sales in TMT)#
State (s) / Union Territory Company name
No. of companies (as on
01.04.2021)2016-17 2017-18 2018-19 2019-20 2020-21
(P)
Andhra Pradesh* Bhagyanagar Gas Limited, Godavari Gas Private Limited, Megha Engineering & Infrastructure Limited 3 29 32 31 21 13
Assam Assam Gas Company Limited 1 0 0 0 0.02 0.05
Bihar GAIL (India) Limited, Think Gas Begusarai Pvt Limited 2 0 0 0 2 5Chandigarh, Haryana, Punjab & Himachal Pradesh
Indian Oil-Adani Gas Pvt. Ltd. 1 0 5 15 21 14
Dadra & Nagar Haveli** Gujarat Gas Limited 1 0 0 0 3 2
Daman and Diu Indian Oil-Adani Gas Pvt. Ltd. 1 0 1 2 2 1.37
Delhi NCT*** Indraprastha Gas Ltd . 1 804 1016 1144 1033 785
Goa Goa Natural Gas Private Limited, Indian Oil-Adani Gas Private Limited 2 0 0 0 0.03 0.15
Gujarat **
Adani Total Gas Limited, Charotar Gas Sahakari Mandali Limited, Gujarat Gas Limited, Hindustan Petroleum Corporation Limited, IRM Energy Private Limited, Sabarmati Gas Limited, Torrent Gas Private Limited, Vadodara Gas Limited
8 546 612 662 745 649
Gujarat & UT of Daman and Diu IRM Energy Private Limited 1 0 0 0 0.07 1.36
Haryana
Adani Gas Limited, GAIL Gas Limited, Haryana City Gas Distribution Limited, HPOIL Gas Private Limited, IndianOil-Adani Gas Private Limited, Indraprastha Gas Limited, Hindustan Petroleum Corporation Limited, Haryana City Gas (KCE) Private Limited, Haryana City Gas Distribution (Bhiwadi) Limited, Bharat Gas Resources Limited
10 109 144 179 197 173
Haryana & Himachal Pradesh Indian Oil-Adani Gas Private Limited 1 0 0 0 0 0.08
Haryana & Punjab Gujarat Gas Limited 1 0 0 0 0 1.4
Jharkhand GAIL (India) Limited 1 0 0 0 0.34 1.2
KarnatakaAGP City Gas Private Limited,GAIL Gas Limited, IndianOil-Adani Gas Private Limited, Maharashtra Natural Gas Limited, Megha Engineering & Infrastructure Limited, Unison Enviro Private Limited
6 0 0 0.3 1 3
Kerala AGP City Gas Private Limited, Indian Oil-Adani Gas Private Limited 1 0 0 1 6 4
Madhya PradeshAavantika Gas Limited, GAIL Gas Limited, Gujarat Gas Limited, Naveriya Gas Private Limited, Rajasthan State Gas Limited, Think Gas Bhopal Private Limited, Indian Oil Corporation Limited (Vijaypur CNG Station)
7 22 25 31 34 24
Madhya Pradesh & Rajasthan Gujarat Gas Limited 1 0 0 0 0 0.26
MaharashtraBharat Gas Resources Limited, Gujarat Gas Limited, HPOIL Gas Private Limited, Mahanagar Gas Limited, Maharashtra Natural Gas Limited, Torrent Gas Pune Limited, Unison Enviro Private Limited
7 593 630 702 738 504
Maharashtra & Gujarat Maharashtra Natural Gas Limited 1 0 0 0 0 1.4
Odisha GAIL (India) Limited, GAIL Gas Limited 2 0 0 1 3 2Puducherry (UT) & Tamil Nadu Torrent Gas Private Limited 1 0 0 0 0 0.001
PunjabBharat Gas Resources Limited, Gujarat Gas Limited, Gujarat State Petronet Limited, IRM Energy Private Limited, Think Gas Ludhiana Private Limited, Torrent Gas Private Limited
6 0 0 1 7 14
RajasthanAdani Total Gas Limited, AGP City Gas Private Limited, Dholpur CGD Private Limited, Gujarat Gas Limited, Rajasthan State Gas Limited, Torrent Gas Private Limited
6 4 5 7 9 15
Tamil Nadu AGP City Gas Private Limited 1 0 0 0 0 0.004
Telangana* Bhagyanagar Gas Limited, Torrent Gas Private Limited 2 0 0 0 13 9
Tripura Tripura Natural Gas Company Limited 1 12 13 15 16 18
Uttar Pradesh
Adani Gas Limited, Central UP Gas Limited, GAIL (India) Limited, GAIL Gas Limited, Green Gas Limited, IndianOil-Adani Gas Private Limited, Indraprastha Gas Limited, Sanwariya Gas, Torrent Gas Private Limited, Bagpat Green Energy Pvt. Ltd.
12 245 153 282 392 339
Uttar Pradesh & Uttarakhand Hindustan Petroleum Corporation Limited 1 0 0 0 0 0.359
Uttar Pradesh & Madhya Pradesh Adani Gas Limited 1 0 0 0 0.001 0.402
Uttarakhand GAIL GAs Limited, Haridwar Natural Gas Private Limited, IndianOil-Adani Gas Private Limited, 3 0 0 0.1 1 5
West Bengal Bengal Gas Company Limited, Great Eastern Energy Corporation Ltd., Indian Oil-Adani Gas Private Limited, Hindustan Petroleum Corporation Limited 4 2 2 3 2 2
Total 2365 2638 3076 3247 2589
Table 3.7: CNG sales in India
Source : CGD companies ( # Data subject to change based on inputs provided by CGD entities) Notes: From the FY 2019-20 entries for *Andhra Pradesh & Telangana are reported separately. Prior to this AP & Telangana were taken together. ** Dadra & Nagar Haveli are reported separately from Gujarat State *** Delhi contains information for Delhi NCT only. Remaining enteries of the NCR GAs are added into respective State.

PPAC Ready Reckoner
23
Table 3.8: CNG stations as on 31.03.2021(P)
State/Union Territory Geographical Area/ CGD Networks Authorized CGD Entity CNG Stations
Andhra Pradesh
Kakinada Bhagyanagar Gas Limited 12
West Godavari District Godavari Gas Private Limited 13
East Godavari District (EAAA) Godavari Gas Private Limited 15
Vijaywada Bhagyanagar Gas Limited 30
Krishna District (EAAA) Megha Engineering & Infrastructure Limited 15
Andhra Pradesh Total 85
Assam Upper Assam Assam Gas Company Limited 1
Assam Total 1
Bihar
Patna District GAIL (India) Limited 9
Begusarai District Think Gas Begusarai Private Limited 3
Aurangabad, Kaimur & Rohtas Districts Indian Oil Corporation Limited 1
Bihar Total 13Chandigarh (UT), Haryana, Punjab & Himachal Pradesh Chandigarh Indian-Oil Adani Gas Private Limited 17
Chandigarh (UT), Haryana, Punjab & Himachal Pradesh Total 17
Dadra & Nagar Haveli (UT) UT of Dadra & Nagar Haveli Gujarat Gas Limited 7
Dadra & Nagar Haveli (UT) Total 7
Daman & Diu (UT) UT of Daman Indian-Oil Adani Gas Private Limited 4
Daman & Diu (UT) Total 4
Daman and Diu & Gujarat Diu & Gir Somnath Districts IRM Energy Private Limited 9
Daman and Diu & Gujarat Total 9
GoaNorth Goa District Goa Natural Gas Private Limited 5
South Goa District Indian-Oil Adani Gas Private Limited 2
Goa Total 7
Gujarat
Surat, Bharuch, Ankleshwar Gujarat Gas Limited 108
Ahmedabad City and Daskroi Area Adani Gas Limited 70
Rajkot Gujarat Gas Limited 74
Gandhinagar Mehsana Sabarkantha Sabarmati Gas Limited 113
Vadodara Vadodara Gas Limited 20
Gandhinagar Gujarat Gas Limited 14
Valsad Gujarat Gas Limited 25
Navsari Gujarat Gas Limited 23
Nadiad Gujarat Gas Limited 32
Anand District (EAAA) Gujarat Gas Limited 29
Bhavnagar Gujarat Gas Limited 26
Hazira Gujarat Gas Limited 1Anand area including Kanjari & Vadtal Villages (in Kheda District) Charotar Gas Sahakari Mandali Limited 7
Banaskantha District IRM Energy Private Limited 30
Surendranagar Gujarat Gas Limited 18
Jamnagar Gujarat Gas Limited 19
Panchmahal District Gujarat Gas Limited 25
Patan District Sabarmati Gas Limited 22
Amreli District Gujarat Gas Limited 13
Dahod District Gujarat Gas Limited 11
Kutch (West) Gujarat Gas Limited 12
Dahej Vagra Taluka Gujarat Gas Limited 4
Vadodara Adani Gas Limited 6
Narmada (Rajpipla) District Gujarat Gas Limited 4
Ahmedabad City (Only for CNG) Hindustan Petroleum Corporation Limited 22
PPAC Ready Reckoner
24
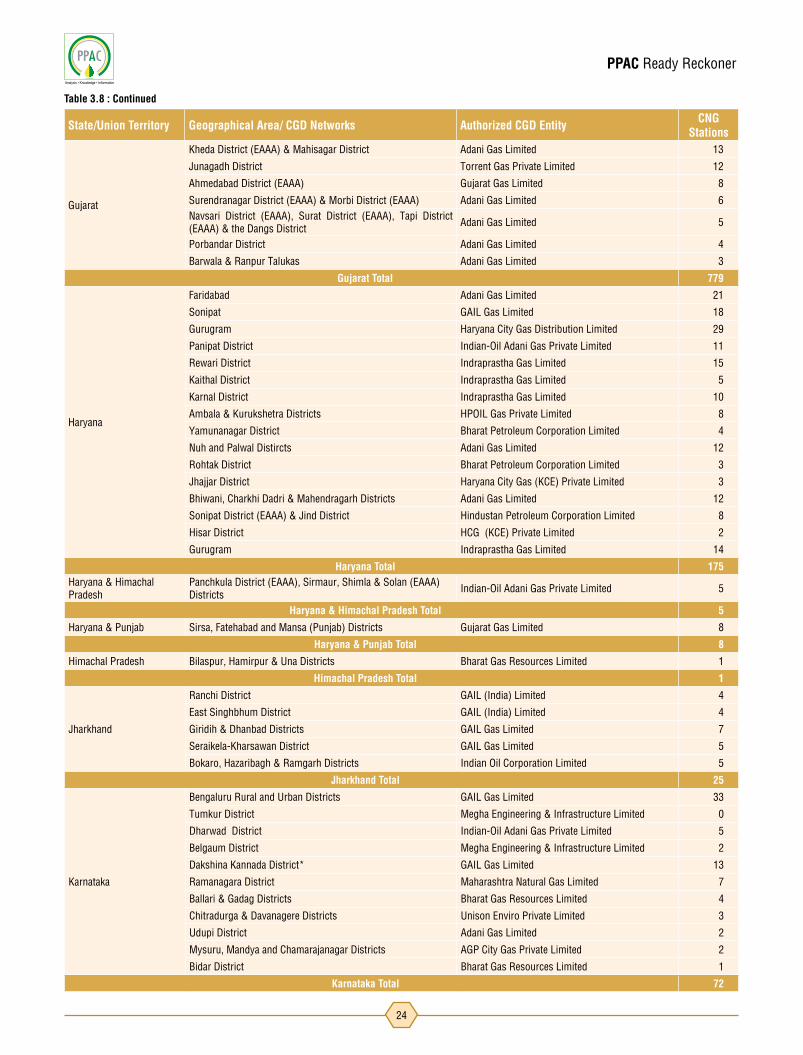
Gujarat
Kheda District (EAAA) & Mahisagar District Adani Gas Limited 13
Junagadh District Torrent Gas Private Limited 12
Ahmedabad District (EAAA) Gujarat Gas Limited 8
Surendranagar District (EAAA) & Morbi District (EAAA) Adani Gas Limited 6Navsari District (EAAA), Surat District (EAAA), Tapi District (EAAA) & the Dangs District Adani Gas Limited 5
Porbandar District Adani Gas Limited 4
Barwala & Ranpur Talukas Adani Gas Limited 3
Gujarat Total 779
Haryana
Faridabad Adani Gas Limited 21
Sonipat GAIL Gas Limited 18
Gurugram Haryana City Gas Distribution Limited 29
Panipat District Indian-Oil Adani Gas Private Limited 11
Rewari District Indraprastha Gas Limited 15
Kaithal District Indraprastha Gas Limited 5
Karnal District Indraprastha Gas Limited 10
Ambala & Kurukshetra Districts HPOIL Gas Private Limited 8
Yamunanagar District Bharat Petroleum Corporation Limited 4
Nuh and Palwal Distircts Adani Gas Limited 12
Rohtak District Bharat Petroleum Corporation Limited 3
Jhajjar District Haryana City Gas (KCE) Private Limited 3
Bhiwani, Charkhi Dadri & Mahendragarh Districts Adani Gas Limited 12
Sonipat District (EAAA) & Jind District Hindustan Petroleum Corporation Limited 8
Hisar District HCG (KCE) Private Limited 2
Gurugram Indraprastha Gas Limited 14
Haryana Total 175Haryana & Himachal Pradesh
Panchkula District (EAAA), Sirmaur, Shimla & Solan (EAAA) Districts Indian-Oil Adani Gas Private Limited 5
Haryana & Himachal Pradesh Total 5
Haryana & Punjab Sirsa, Fatehabad and Mansa (Punjab) Districts Gujarat Gas Limited 8
Haryana & Punjab Total 8
Himachal Pradesh Bilaspur, Hamirpur & Una Districts Bharat Gas Resources Limited 1
Himachal Pradesh Total 1
Jharkhand
Ranchi District GAIL (India) Limited 4
East Singhbhum District GAIL (India) Limited 4
Giridih & Dhanbad Districts GAIL Gas Limited 7
Seraikela-Kharsawan District GAIL Gas Limited 5
Bokaro, Hazaribagh & Ramgarh Districts Indian Oil Corporation Limited 5
Jharkhand Total 25
Karnataka
Bengaluru Rural and Urban Districts GAIL Gas Limited 33
Tumkur District Megha Engineering & Infrastructure Limited 0
Dharwad District Indian-Oil Adani Gas Private Limited 5
Belgaum District Megha Engineering & Infrastructure Limited 2
Dakshina Kannada District* GAIL Gas Limited 13
Ramanagara District Maharashtra Natural Gas Limited 7
Ballari & Gadag Districts Bharat Gas Resources Limited 4
Chitradurga & Davanagere Districts Unison Enviro Private Limited 3
Udupi District Adani Gas Limited 2
Mysuru, Mandya and Chamarajanagar Districts AGP City Gas Private Limited 2
Bidar District Bharat Gas Resources Limited 1
Karnataka Total 72
State/Union Territory Geographical Area/ CGD Networks Authorized CGD Entity CNG Stations
Table 3.8 : Continued

PPAC Ready Reckoner
25
Kerala
Ernakulam District Indian-Oil Adani Gas Private Limited 9
Palakkad & Thrissur Districts Indian-Oil Adani Gas Private Limited 10
Alapuzzha, Kollam and Thiruvananthapuram Districts AGP City Gas Private Limited 2
Kozhikode & Wayanad Districts Indian-Oil Adani Gas Private Limited 3
Malappuram District Indian-Oil Adani Gas Private Limited 3
Kerala Total 27
Madhya Pradesh
Indore (including Ujjain City) Aavantika Gas Limited 39
Gwalior Aavantika Gas Limited 15
Dewas GAIL Gas Limited 3
Satna & Shandol Districts Bharat Gas Resources Limited 2
Rewa District Indian Oil Corporation Limited 3
Dhar District Naveriya Gas Private Limited 2
Guna District Indian Oil Corporation Limited 1
Raisen, Shajapur and Sehore Districts GAIL Gas Limited 4
Bhopal & Rajgarh Districts Think Gas Bhopal Private Limited 16Ujjain (EAAA) District, Dewas (EAAA) District and Indore (EAAA) District Gujarat Gas Limited 6
Gwalior (EAAA) District and Sheopur District Rajasthan State Gas Limited 2
Shivpuri District Think Gas Bhopal Private Limited 1
Madhya Pradesh Total 94Madhya Pradesh and Rajasthan Jhabua, Banswara, Ratlam and Dungarpur Districts Gujarat Gas Limited 8
Madhya Pradesh and Rajasthan Total 8Madhya Pradesh and Uttar Pradesh
Jhansi (EAAA) District, Bhind, Jalaun, Lalitpur and Datia Districts Adani Gas Limited 6
Madhya Pradesh and Uttar Pradesh Total 6
Maharashtra
Mumbai & Greater Mumbai Mahanagar Gas Limited 142
Thane urban and adjoining Municipalities Mahanagar Gas Limited 112Pune City including Pimpri - Chichwad & adjoining contigeneous areas Hinjewadi, Chakan, Talegaon Maharashtra Natural Gas Limited 87
Raigarh District (EAAA) Mahanagar Gas Limited 18
Kolhapur District HPOIL Gas Private Limited 6
Pune District (EAAA) Torrent Gas Pune Limited 28
Sindhudurg District Maharashtra Natural Gas Limited 6
Ratnagiri District Unison Enviro Private Limited 15
Palghar District & Thane Rural Gujarat Gas Limited 17
Sangli & Satara Districts Bharat Gas Resources Limited 9
Ahmednagar & Aurangabad Districts Bharat Gas Resources Limited 13
Latur & Osmanabad Districts Unison Enviro Private Limited 3
Maharashtra Total 456
Maharashtra & Gujarat Valsad (EAAA), Dhule & Nashik Districts Maharashtra Natural Gas Limited 32
Maharashtra & Gujarat Total 32National Capital Territory of Delhi (UT) National Capital Territory of Delhi Indraprastha Gas Limited 436
National Capital Territory of Delhi (UT) Total 436
Odisha
Khordha District GAIL (India) Limited 10
Cuttack District GAIL (India) Limited 6
Ganjam, Nayagarh & Puri Districts GAIL Gas Limited 2
Sundargarh & Jharsuguda Districts GAIL Gas Limited 2
Balasore, Bhadrak & Mayurbhanj Districts Adani Gas Limited 4
Odisha Total 24
State/Union Territory Geographical Area/ CGD Networks Authorized CGD Entity CNG Stations
Table 3.8 : Continued

PPAC Ready Reckoner
26
Puducherry & Tamil Nadu Karaikal & Nagapattinam Districts Torrent Gas Private Limited 2
Puducherry & Tamil Nadu Total 2
Punjab
Rupnagar District Bharat Petroleum Corporation Limited 6
Amritsar District Gujarat Gas Limited 14
Fatehgarh Sahib District IRM Energy Private Limited 7
Bhatinda District Gujarat Gas Limited 5
Ludhiana District (EAAA), Barnala & Moga Districts Think Gas Ludhiana Private Limited 11
SAS Nagar District (EAAA), Patiala & Sangrur Districts Torrent Gas Private Limited 16
Hoshiarpur and Gurdaspur Districts Gujarat Gas Limited 16
Jalandhar District (EAAA), Kapurthala & SBS Nagar Districts Think Gas Ludhiana Private Limited 10
Jalandhar Jay Madhok Energy Private Limited led Consortium 3
Ludhiana Jay Madhok Energy Private Limited led Consortium 3
Ferozepur, Faridkot and Sri Muktsar Sahib Districts Gujarat Gas Limited 2
Punjab Total 93
Rajasthan
Ajmer, Pali and Rajsamand Districts Indraprastha Gas Limited 8
Kota Rajasthan State Gas Limited 7
Bhiwadi (in Alwar District) Haryana City Gas Distribution (Bhiwadi) Limited 1
Barmer, Jaisalmer & Jodhpur Districts AGP CGD India Private Limited 6Kota District (EAAA), Baran & Chittorgarh (Only Rawatbhata Taluka) Districts Torrent Gas Private Limited 11
Chittorgarh (Other than Rawatbhata Taluka) & Udaipur Districts* Adani Gas Limited 11
Jalore and Sirohi Districts Gujarat Gas Limited 6
Bhilwara & Bundi Districts Adani Gas Limited 5
Dholpur District Dholpur CGD Private Limited 4
CNG (DBS) NOC Rajasthan State Gas Limited 2
Rajasthan Total 61
Tamil Nadu
Tiruppur District Adani Gas Limited 10
Cuddalore, Nagapattinam & Tiruvarur Districts Adani Gas Limited 9
Ramanathapuram District AGP CGD India Private Limited 2
Tamil Nadu Total 21
TelanganaHyderabad Bhagyanagar Gas Limited 83
Medak, Siddipet & Sangareddy Districts Torrent Gas Private Limited 14
Telangana Total 97
Tripura
Agartala Tripura Natural Gas Company Limited 5
West Tripura (EAAA) District Tripura Natural Gas Company Limited 4
Gomati District Tripura Natural Gas Company Limited 3
Tripura Total 12
Uttar Pradesh
Gautam Budh Nagar District Indraprastha Gas Limited 51
Ghaziabad & Hapur Districts Indraprastha Gas Limited 56
Kanpur Central UP Gas Limited 36
Agra Green Gas Limited 25
Lucknow Green Gas Limited 37
Meerut GAIL Gas Limited 17
Varanasi District GAIL (India) Limited 10
Allahabad Indian-Oil Adani Gas Private Limited 6
Bareilly Central UP Gas Limited 16
Meerut District (EAAA), Muzaffarnagar & Shamli Districts Indraprastha Gas Limited 10
Kanpur (EAAA) District, Fatehpur and Hamirpur Districts Indraprastha Gas Limited 7
Moradabad Torrent Gas Moradabad Limited 6
State/Union Territory Geographical Area/ CGD Networks Authorized CGD Entity CNG Stations
Table 3.8 : Continued

PPAC Ready Reckoner
27
Sources : PNGRB & GEECL Note : 1. All the GAs where PNG connections/CNG Stations have been established are considered as Operational. 2. Under normal conditions, operation of any particular GA commences within around one year of authorization. 3. EAAA stands for Excluding/Except Area Already Authorized | * stands for Sub-Judice
Uttar Pradesh
Saharanpur District Bharat Petroleum Corporation Limited 6
Khurja Adani Gas Limited 6
Mathura Sanwariya Gas Limited 11
Amethi, Pratapgarh & Raebareli Districts Bharat Gas Resources Limited 6
Mirzapur, Chandauli and Sonbhadra Districts GAIL Gas Limited 7
Jhansi Central UP Gas Limited 5
Faizabad & Sultanpur Districts Green Gas Limited 2
Moradabad (EAAA) District Torrent Gas Private Limited 15
Auraiya, Kanpur Dehat & Etawah Districts Torrent Gas Private Limited 19
Allahabad District (EAAA), Bhadohi & Kaushambi Districts Indian-Oil Adani Gas Private Limited 9
Basti and Ambedkarnagar Districts Torrent Gas Private Limited 11
Gonda and Barabanki Districts Torrent Gas Private Limited 11
Azamgarh, Mau and Ballia Districts Torrent Gas Private Limited 9
Farrukhabad, Etah and Hardoi Districts Hindustan Petroleum Corporation Limited 8
Bareilly (EAAA) District, Pilibhit and Rampur Districts Hindustan Petroleum Corporation Limited 7
Bulandshahr District (EAAA), Aligarh & Hathras Districts Indian-Oil Adani Gas Private Limited 6
Shahjahanpur and Budaun Districts Hindustan Petroleum Corporation Limited 6
Bulandshahr (part) District Indian-Oil Adani Gas Private Limited 5
Mainpuri and Kannauj Districts Hindustan Petroleum Corporation Limited 4
Bagpat District Bagpat Green Energy Private Limited 3
Jaunpur and Ghazipur Districts Indian-Oil Adani Gas Private Limited 3
Unnao (EAAA) District Green Gas Limited 1
Gorakhpur, Sant Kabir Nagar & Kushinagar Districts Torrent Gas Private Limited 16
Uttar Pradesh Total 453
Uttar Pradesh & Rajasthan Firozabad (Taj Trapezium Zone) GAIL Gas Limited 27
Uttar Pradesh & Rajasthan Total 27Uttar Pradesh and Uttrakhand Bijnor and Nainital Districts Hindustan Petroleum Corporation Limited 6
Uttar Pradesh and Uttrakhand Total 6
UttrakhandHaridwar District Haridwar Natrural Gas Private Limited 4
Udham Singh Nagar District Indian-Oil Adani Gas Private Limited 6
Dehradun District GAIL Gas Limited 6
Uttrakhand Total 16
West Bengal
Burdwan District Indian-Oil Adani Gas Private Limited 10Kolkata Muncipal Corporation and Parts of Adjoining Districts Bengal Gas Company Limited 2
Howrah (EAAA) District and Hoogly (EAAA) District Hindustan Petroleum Corporation Limited 2
Nadia (EAAA) District and North 24 Parganas (EAAA) District Hindustan Petroleum Corporation Limited 1
CNG Stations Great Eastern Energy Corporation Limited (GEECL) 1
West Bengal Total 16
Grand Total 3,095
State/Union Territory Geographical Area/ CGD Networks Authorized CGD Entity CNG Stations
Table 3.8 : Continued
28
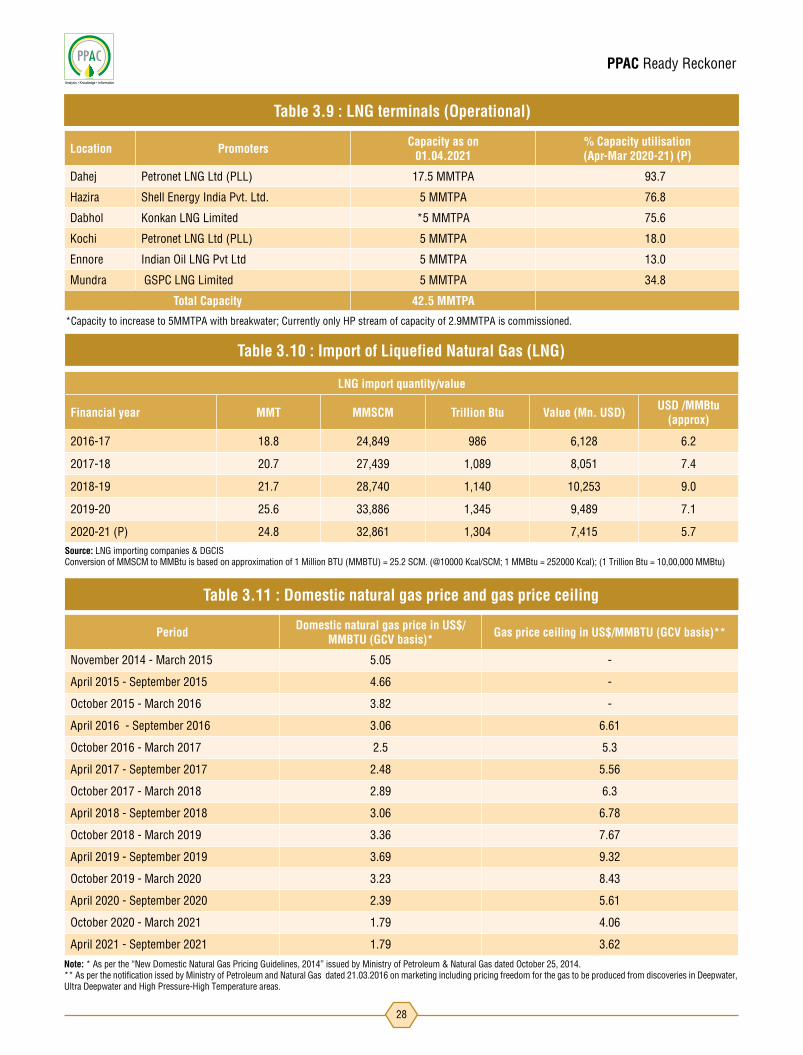
Period Domestic natural gas price in US$/MMBTU (GCV basis)* Gas price ceiling in US$/MMBTU (GCV basis)**
November 2014 - March 2015 5.05 -
April 2015 - September 2015 4.66 -
October 2015 - March 2016 3.82 -
April 2016 - September 2016 3.06 6.61
October 2016 - March 2017 2.5 5.3
April 2017 - September 2017 2.48 5.56
October 2017 - March 2018 2.89 6.3
April 2018 - September 2018 3.06 6.78
October 2018 - March 2019 3.36 7.67
April 2019 - September 2019 3.69 9.32
October 2019 - March 2020 3.23 8.43
April 2020 - September 2020 2.39 5.61
October 2020 - March 2021 1.79 4.06
April 2021 - September 2021 1.79 3.62
Table 3.11 : Domestic natural gas price and gas price ceiling
Note: * As per the “New Domestic Natural Gas Pricing Guidelines, 2014” issued by Ministry of Petroleum & Natural Gas dated October 25, 2014. ** As per the notification issed by Ministry of Petroleum and Natural Gas dated 21.03.2016 on marketing including pricing freedom for the gas to be produced from discoveries in Deepwater, Ultra Deepwater and High Pressure-High Temperature areas.
Source: LNG importing companies & DGCISConversion of MMSCM to MMBtu is based on approximation of 1 Million BTU (MMBTU) = 25.2 SCM. (@10000 Kcal/SCM; 1 MMBtu = 252000 Kcal); (1 Trillion Btu = 10,00,000 MMBtu)
LNG import quantity/value
Financial year MMT MMSCM Trillion Btu Value (Mn. USD) USD /MMBtu (approx)
2016-17 18.8 24,849 986 6,128 6.2
2017-18 20.7 27,439 1,089 8,051 7.4
2018-19 21.7 28,740 1,140 10,253 9.0
2019-20 25.6 33,886 1,345 9,489 7.1
2020-21 (P) 24.8 32,861 1,304 7,415 5.7
Table 3.10 : Import of Liquefied Natural Gas (LNG)
Location Promoters Capacity as on 01.04.2021
% Capacity utilisation (Apr-Mar 2020-21) (P)
Dahej Petronet LNG Ltd (PLL) 17.5 MMTPA 93.7
Hazira Shell Energy India Pvt. Ltd. 5 MMTPA 76.8
Dabhol Konkan LNG Limited *5 MMTPA 75.6
Kochi Petronet LNG Ltd (PLL) 5 MMTPA 18.0
Ennore Indian Oil LNG Pvt Ltd 5 MMTPA 13.0
Mundra GSPC LNG Limited 5 MMTPA 34.8
Total Capacity 42.5 MMTPA
Table 3.9 : LNG terminals (Operational)
*Capacity to increase to 5MMTPA with breakwater; Currently only HP stream of capacity of 2.9MMTPA is commissioned.
PPAC Ready Reckoner

PPAC Ready Reckoner
29
State (s) / Union Territory CNG Domestic Commercial Industrial Total
Andhra Pradesh 68874 22869 2138 29802 123683
Assam 236 126087 416953 1582608 2125885
Bihar 23937 687 58 0 24682Chandigarh, Haryana, Punjab & Himachal Pradesh 75017 4148 842 1805 81813
Dadra & Nagar Haveli 10187 1586 532 22457 34761
Daman and Diu 8308 310 355 3218 12191
Delhi 3791669 306142 98170 189391 4385371
Goa 1025 140 0 4551 5715
Gujarat 3071580 1162140 165227 10627508 15026455Gujarat & UT of Daman and Diu 7781 0 0 0 7781
Haryana 897226 50939 17252 603121 1568538
Haryana & Himachal Pradesh 614 0 0 0 614
Haryana & Punjab 9795 0 0 0 9795
Jharkhand 6849 552 0 0 7401
Karnataka 15606 20700 9174 274186 319666
Kerala 22563 531 282 12085 35461
Madhya Pradesh 124802 36205 3724 84946 249677
Madhya Pradesh & Rajasthan 1721 0 0 0 1721
Maharashtra 2638004 573509 154866 609046 3975425
Maharashtra & Gujarat 9244 0 0 0 9244
Odisha 12444 320 0 0 12763
Puducherry (UT) & Tamil Nadu 7 0 0 0 7
Punjab 76896 3820 752 56477 137945
Rajasthan 77686 1483 205 6406 85780
Tamil Nadu 28 2 0 1215 1246
Telangana 47830 28213 472 61416 137932
Tripura 77317 36919 6603 18554 139392
Uttar Pradesh 1744793 239731 44213 2290075 4318812
Uttar Pradesh & Uttarakhand 2169 0 0 0 2169Uttar Pradesh & Madhya Pradesh 2599 0 0 0 2599
Uttrakhand 28013 4028 391 28675 61107
West Bengal 10090 0 0 0 10090
Grand Total 12864911 2621058 922209 16507543 32915721
Table 3.12: Statewise CGD Sale Profile* (in SCMD )
*Inputs based on the information submitted by CGD entities. (Provisional)Categorizations of data under Commercial and Industrial sectors- as per the respective policies of individual CGD entities Sales of SCMD (SCM per day) calculated based on sales for period October 2020 to March 2021.


PPAC Ready Reckoner
32
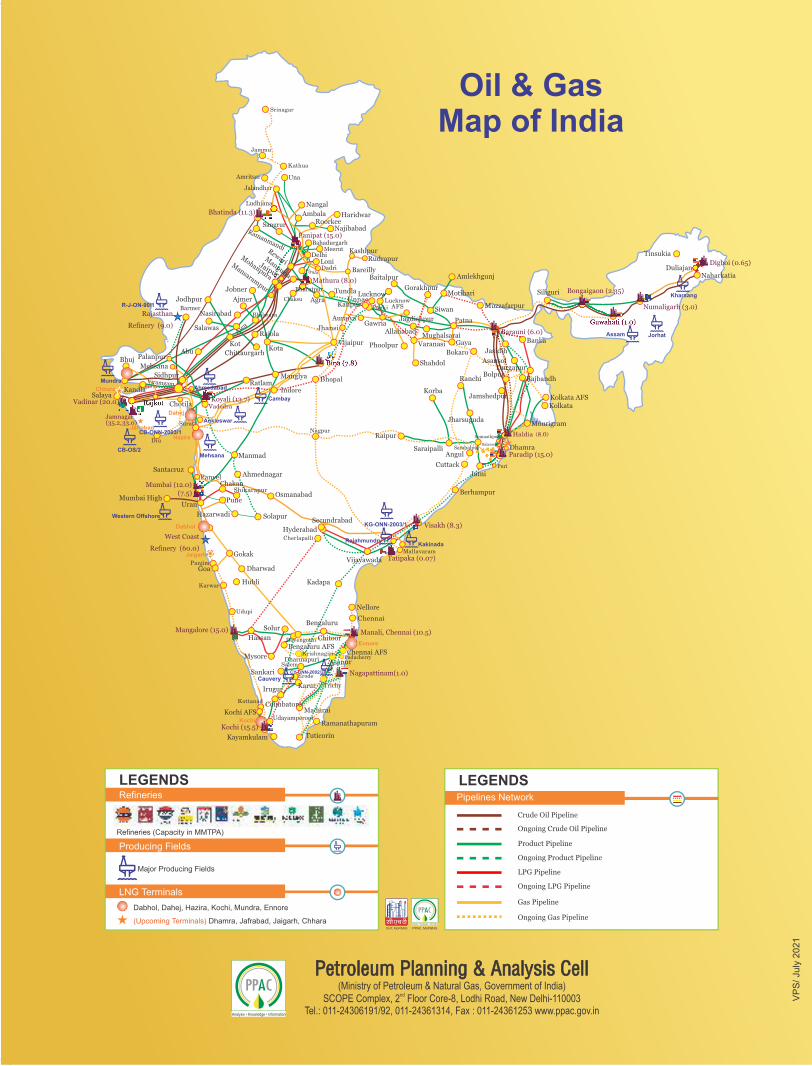
Map of Refineries in India
Capacity in MMTPA as on 01.04.2021

PPAC Ready Reckoner
33

PPAC Ready Reckoner
34
Sl. no. Refinery
Installed capacity (MMTPA) Crude Oil Processing (MMT)
01.04.2017 01.04.2018 01.04.2019 01.04.2020 01.04.2021 (P) 2016-17 2017-18 2018-19 2019-20 2020-21
(P)
1 Barauni 6.0 6.0 6.0 6.0 6.0 6.5 5.8 6.7 6.5 5.5
2 Koyali 13.7 13.7 13.7 13.7 13.7 14.0 13.8 13.5 13.1 11.6
3 Haldia 7.5 7.5 7.5 8.0 8.0 7.7 7.7 8.0 6.5 6.8
4 Mathura 8.0 8.0 8.0 8.0 8.0 9.2 9.2 9.7 8.9 8.9
5 Panipat 15.0 15.0 15.0 15.0 15.0 15.6 15.7 15.3 15.0 13.2
6 Guwahati 1.0 1.0 1.0 1.0 1.0 0.9 1.0 0.9 0.9 0.8
7 Digboi 0.65 0.65 0.65 0.65 0.65 0.5 0.7 0.7 0.7 0.6
8 Bongaigaon 2.35 2.35 2.35 2.35 2.35 2.5 2.4 2.5 2.0 2.5
9 Paradip 15.0 15.0 15.0 15.0 15.0 8.2 12.7 14.6 15.8 12.5
IOCL total 69.2 69.2 69.2 69.7 69.7 65.2 69.0 71.8 69.4 62.4
10 Mumbai 7.5 7.5 7.5 7.5 7.5 8.5 8.6 8.7 8.1 7.4
11 Visakh 8.3 8.3 8.3 8.3 8.3 9.3 9.6 9.8 9.1 9.1
12 HMEL-Bathinda 9.0 11.3 11.3 11.3 11.3 10.5 8.8 12.5 12.2 10.1
HPCL total 24.8 27.1 27.1 27.1 27.1 28.3 27.1 30.9 29.4 26.5
13 Mumbai 12.0 12.0 12.0 12.0 12.0 13.5 14.1 14.8 15.0 12.9
14 Kochi 12.4 15.5 15.5 15.5 15.5 11.8 14.1 16.1 16.5 13.3
15 BORL-Bina 6.0 6.0 7.8 7.8 7.8 6.4 6.7 5.7 7.9 6.2
BPCL total 30.4 33.5 35.3 35.3 35.3 31.7 34.9 36.5 39.4 32.4
16 Manali 10.5 10.5 10.5 10.5 10.5 9.8 10.3 10.3 10.2 8.2
17 CBR 1.0 1.0 1.0 1.0 1.0 0.5 0.5 0.4 0.0 0.0
CPCL total 11.5 11.5 11.5 11.5 11.5 10.3 10.8 10.7 10.2 8.2
18 Numaligarh 3.0 3.0 3.0 3.0 3.0 2.7 2.8 2.9 2.4 2.7
19 Tatipaka 0.07 0.07 0.07 0.07 0.07 0.09 0.08 0.07 0.09 0.08
20 MRPL-Mangalore 15.0 15.0 15.0 15.0 15.0 16.0 16.1 16.2 14.0 11.5
ONGC total 15.1 15.1 15.1 15.1 15.1 16.1 16.2 16.3 14.0 11.6
21 RIL-Jamnagar (DTA) 33.0 33.0 33.0 33.0 33.0 32.8 33.2 31.8 33.0 34.1
22 RIL-Jamnagar (SEZ) 27.0 35.2 35.2 35.2 35.2 37.4 37.3 37.4 35.9 26.8
23 NEL*-Vadinar 20.0 20.0 20.0 20.0 20.0 20.9 20.7 18.9 20.6 17.1
All India 234.0 247.6 249.4 249.9 249.9 245.4 251.9 257.2 254.4 221.8
Table 4.1 : Refineries: Installed capacity and crude oil processing
(Million metric tonne)
Sl. no. Type of crude 2016-17 2017-18 2018-19 2019-20 2020-21 (P)
1 HS crude 177.4 188.4 194.2 192.4 161.3
2 LS crude 67.9 63.6 63.0 62.0 60.5
Total crude 245.4 251.9 257.2 254.4 221.8
Share of HS crude in total crude processing 72.3% 74.8% 75.5% 75.6% 72.7%
Table 4.2 : High Sulphur (HS) & Low Sulphur (LS) crude oil processing
Source: Oil companies; *Nayara Energy Limited (formerly Essar Oil Limited)MMTPA: Million Metric Tonne Per Annum, MMT: Million Metric Tonne
Source: Oil companies
PPAC Ready Reckoner
35
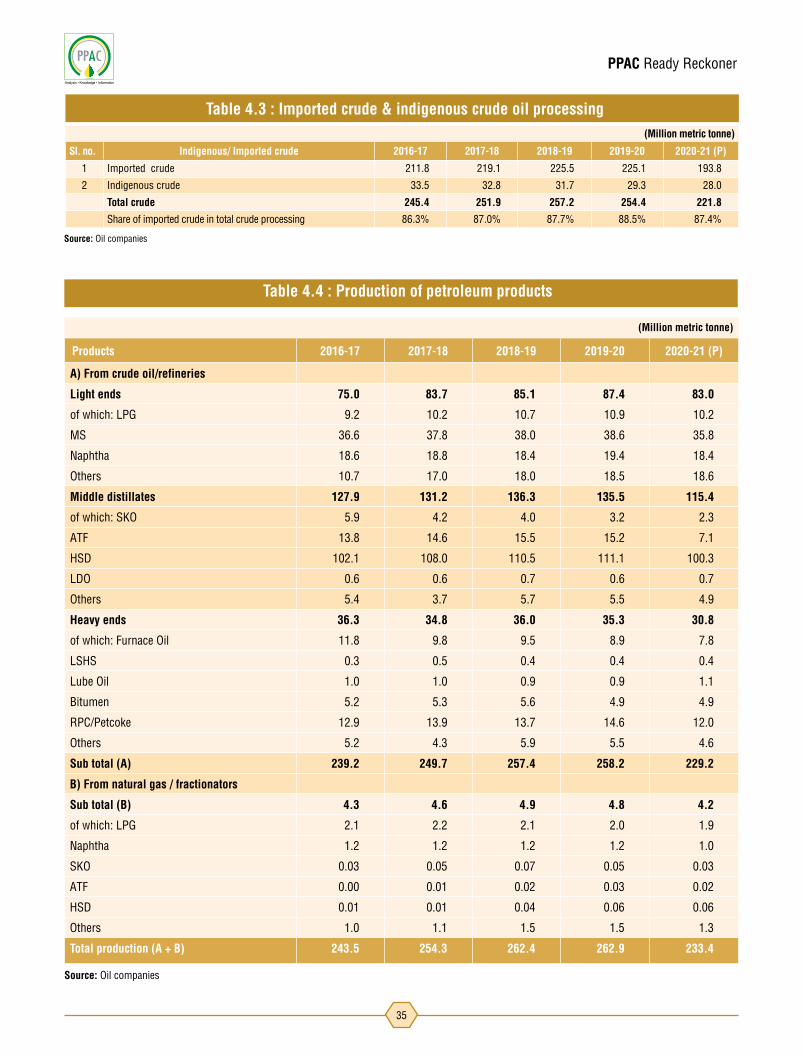
(Million metric tonne)
Sl. no. Indigenous/ Imported crude 2016-17 2017-18 2018-19 2019-20 2020-21 (P)
1 Imported crude 211.8 219.1 225.5 225.1 193.8
2 Indigenous crude 33.5 32.8 31.7 29.3 28.0
Total crude 245.4 251.9 257.2 254.4 221.8
Share of imported crude in total crude processing 86.3% 87.0% 87.7% 88.5% 87.4%
Table 4.3 : Imported crude & indigenous crude oil processing
Source: Oil companies
(Million metric tonne)
Products 2016-17 2017-18 2018-19 2019-20 2020-21 (P)
A) From crude oil/refineries
Light ends 75.0 83.7 85.1 87.4 83.0
of which: LPG 9.2 10.2 10.7 10.9 10.2
MS 36.6 37.8 38.0 38.6 35.8
Naphtha 18.6 18.8 18.4 19.4 18.4
Others 10.7 17.0 18.0 18.5 18.6
Middle distillates 127.9 131.2 136.3 135.5 115.4
of which: SKO 5.9 4.2 4.0 3.2 2.3
ATF 13.8 14.6 15.5 15.2 7.1
HSD 102.1 108.0 110.5 111.1 100.3
LDO 0.6 0.6 0.7 0.6 0.7
Others 5.4 3.7 5.7 5.5 4.9
Heavy ends 36.3 34.8 36.0 35.3 30.8
of which: Furnace Oil 11.8 9.8 9.5 8.9 7.8
LSHS 0.3 0.5 0.4 0.4 0.4
Lube Oil 1.0 1.0 0.9 0.9 1.1
Bitumen 5.2 5.3 5.6 4.9 4.9
RPC/Petcoke 12.9 13.9 13.7 14.6 12.0
Others 5.2 4.3 5.9 5.5 4.6
Sub total (A) 239.2 249.7 257.4 258.2 229.2
B) From natural gas / fractionators
Sub total (B) 4.3 4.6 4.9 4.8 4.2
of which: LPG 2.1 2.2 2.1 2.0 1.9
Naphtha 1.2 1.2 1.2 1.2 1.0
SKO 0.03 0.05 0.07 0.05 0.03
ATF 0.00 0.01 0.02 0.03 0.02
HSD 0.01 0.01 0.04 0.06 0.06
Others 1.0 1.1 1.5 1.5 1.3
Total production (A + B) 243.5 254.3 262.4 262.9 233.4
Table 4.4 : Production of petroleum products
Source: Oil companies

PPAC Ready Reckoner
36
(Million metric tonne)
Major products
2016-17 2017-18 2018-19 2019-20 2020-21 (P)Qunatity Percentage Qunatity Percentage Qunatity Percentage Qunatity Percentage Qunatity Percentage
HSD 102.1 41.9 108.1 42.5 110.6 42.1 111.2 42.3 100.4 43.0MS 36.6 15.0 37.8 14.9 38.0 14.5 38.6 14.7 35.8 15.3Naphtha 19.7 8.1 20.0 7.9 19.6 7.5 20.6 7.8 19.4 8.3FO 11.8 4.8 9.8 3.8 9.5 3.6 8.9 3.4 7.8 3.4ATF 13.8 5.7 14.7 5.8 15.5 5.9 15.2 5.8 7.1 3.0LPG 11.3 4.6 12.4 4.9 12.8 4.9 12.8 4.9 12.1 5.2SKO 6.0 2.5 4.3 1.7 4.1 1.5 3.2 1.2 2.3 1.0Bitumen 5.2 2.1 5.3 2.1 5.6 2.1 4.9 1.9 4.9 2.1LSHS 0.3 0.1 0.5 0.2 0.4 0.2 0.4 0.2 0.4 0.2Lubes 1.0 0.4 1.0 0.4 0.9 0.4 0.9 0.4 1.1 0.5LDO 0.6 0.3 0.6 0.2 0.7 0.3 0.6 0.2 0.7 0.3RPC/Petcoke 12.9 5.3 13.9 5.5 13.7 5.2 14.6 5.6 12.0 5.2Others# 22.3 9.1 26.2 10.3 31.0 11.8 31.0 11.8 29.5 12.6Total 243.5 100.0 254.3 100.0 262.4 100.0 262.9 100.0 233.4 100.0
(Million metric tonne)
Year Consumption $ Production from refineries & other sources*
Surplus (+ ) / Deficit (-)
(A) (B) (B)-(A)
1997-98 84.3 64.7 -19.6
1998-99 90.6 68.4 -22.2
1999-00 97.1 82.9 -14.2
2000-01 100.1 99.6 -0.5
2001-02 100.4 104.3 3.9
2002-03 104.1 108.7 4.5
2003-04 107.8 117.6 9.9
2004-05 111.6 123.3 11.6
2005-06 113.2 124.6 11.4
2006-07 120.7 140.6 19.9
2007-08 128.9 150.4 21.5
2008-09 133.6 157.9 24.3
2009-10 137.8 185.5 47.7
2010-11 141.0 196.2 55.2
2011-12 148.1 204.5 56.3
2012-13 157.1 218.2 61.2
2013-14 158.4 220.7 62.3
2014-15 165.5 221.1 55.6
2015-16 184.7 231.9 47.2
2016-17 194.6 243.5 48.9
2017-18 206.2 254.3 48.1
2018-19 213.2 262.4 49.1
2019-20 214.1 262.9 48.8
2020-21 (P) 194.6 233.4 38.8
Table 4.5 : Production of petroleum products : All sources
Table 4.6 : Production vis a vis consumption of petroleum products
Source: Oil companies # Others include products like Propylene, Solvents (Hexane, Benzene, Toluene, Xylene and Specialty solvents), Reformate, Mineral Turpentine Oil, Carbon Black Feed Stock, Waxes, Sulphur etc.
Note: $ includes direct imports by private parties*Fractionators and gas processing plants

PPAC Ready Reckoner
37
Company Refinery 2016-17 2017-18 2018-19 2019-20 2020-21 (P)
PSU refineries
IOCL
Barauni 6.52 6.60 3.86 (1.24) 3.98
Koyali 7.55 9.44 4.87 1.90 2.83
Haldia 6.80 6.86 5.36 (2.44) 4.10
Mathura 7.01 7.09 4.65 (1.02) 5.03
Panipat 7.95 7.74 4.66 (0.25) 3.23
Guwahati** 22.14 21.88 16.35 14.22 31.87
Digboi** 24.49 24.86 22.74 17.52 28.62
Bongaigaon** 20.15 20.62 16.94 10.49 28.89
Paradip 4.22 7.02 4.46 (1.80) 5.35
Average 7.77 8.49 5.41 0.08 5.64
BPCL
Kochi 5.16 6.44 4.27 2.17 4.36
Mumbai 5.36 7.26 4.92 2.88 3.76
Average 5.26 6.85 4.58 2.50 4.06
HPCL
Mumbai 6.95 8.35 5.79 3.63 4.10
Visakhapatnam 5.51 6.55 4.31 (1.30) 3.67
Average 6.20 7.40 5.01 1.02 3.86
CPCL Chennai 6.05 6.42 3.70 (1.18) 7.14
MRPL Mangalore 7.75 7.54 4.06 (0.23) 3.71
NRL Numaligarh** 28.56 31.92 28.11 24.55 37.23
JV refineries
BORL Bina 11.80 11.70 9.80 5.60 6.20
Private refineries
RIL Jamnagar 11.00 11.60 9.20 8.90 *
NEL@ Vadinar 9.14 8.95 6.97 5.88 *
Singapore 5.83 7.23 4.88 3.25 0.53
Table 4.7 : Gross Refining Margins (GRM) of refineries
(P) - Provisional * Not available; ** GRM of North East refineries are including excise duty benefit. For GRM excluding excise duty benefit, refer table 4.8; @Nayara Energy Limited (formerly Essar Oil Limited) As per U.S. Energy Information Administration (EIA), Gross Refining Margin is the difference between the revenue from the sale of petroleum products and the cost of the raw materials used to produce the products. Source: Indian refineries - published results/ information provided by oil companies; Singapore - Reuters.
($/bbl)

PPAC Ready Reckoner
38
(Distillate %)
Company Refinery 2016-17 2017-18 2018-19 2019-20 2020-21 (P)
IOCL
Barauni 85.3 89.0 87.9 86.9 87.1
Koyali 81.0 82.5 81 79.5 72.1
Haldia 66.7 66.9 69.9 69.0 72.2
Mathura 73.6 75.4 76.1 75.6 72.3
Panipat 84.1 84.9 82.8 84.8 80.2
Guwahati 83.5 82.7 81 83.5 82.1
Digboi 75.3 77.9 75.8 72.5 67.9
Bongaigaon 83.8 84.3 84.8 80.8 84.8
Paradip 75.3 79.4 80.8 80.7 79.2
CPCLManali 71.6 72.3 75.3 77.6 78.4
CBR 78.2 79.1 77.3 - -
HPCLMumbai 77.6 77.4 77.6 77.0 76.2
Visakh 74.0 74.5 74.5 72.1 74.4
BPCLMumbai 86.1 84.3 82.2 84.9 83.7
Kochi 85.2 83.9 82.5 84.2 83.8
NRL Numaligarh 90.5 86.7 87.1 83.0 86.4
MRPL Mangalore 77.3 76.5 76.8 76.7 78.1
PSU oil cos. average 79.3 79.7 79.6 80.0 78.6
Table 4.9 : Distillate yield of PSU refineries
Source : CHTP: Provisional
Company Refinery 2016-17 2017-18 2018-19 2019-20 2020-21 (P)
IOCL
Guwahati 1.12 3.70 0.63 (3.34) 2.13
Digboi 7.73 8.27 8.84 3.35 3.71
Bongaigaon 6.03 6.22 4.21 (1.84) 3.15
NRL Numaligarh 8.50 11.43 11.80 7.99 4.09
Table 4.8 : GRM of North East refineries excluding excise duty benefit
Source: Information provided by oil companies.
($/bbl)

PPAC Ready Reckoner
39
(MBTU/Bbl/NRGF)
Company Refinery 2016-17 2017-18 2018-19 2019-20 2020-21 (P)
IOCL
Barauni 80.7 77.7 77.9 75.9 77.5Koyali 75.2 72.4 75.3 77.4 82.0Haldia 83.0 80.8 76.6 88.3 89.7Mathura 72.2 68.3 63.9 65.8 63.5Panipat 64.9 63.2 64.1 64.5 69.3Guwahati 113.8 108.0 112.3 121.2 124.8Digboi 114.3 105.5 101.8 101.7 113.3Bongaigaon 90.2 91.7 88.6 96.8 108.3Paradip 117.8 72.8 66.8 64.1 69.0
CPCLManali 92.5 88.6 83.0 81.5 86.5CBR 117.8 123.7 118.1 - -
HPCLMumbai 85.7 84.4 82.8 84.8 97.8Visakhapatnam 78.1 77.3 77.3 84.4 81.0
BPCLMumbai 70.6 66.7 64.7 63.0 64.3Kochi 85.8 79.2 71.6 68.2 68.9
NRL Numaligarh 72.3 64.7 65.9 64.8 64.4MRPL Mangalore 79.6 76.7 74.2 75.3 81.4PSU average 81.2 75.1 72.7 72.8 76.5
Table 4.11 : Specific energy consumption of PSU refineries
(P): Provisional MBN values are as per New MBN methodology with normalisation for grid power import and BS-IV/VI production from 2015-16 onwards.Specific Energy Consumption written as SEC or MBN; MBN= MBTU/Bbl/NRGF; MBTU : Net energy & loss in Refinery (Thousand British Thermal Unit); Bbls: Barrels of crude processed; NRGF :Composite energy factor for the Refinery.
(Million metric tonne)
Sl. no. Company Refinery
2016-17 2017-18 2018-19 2019-20 2020-21 (P)Crude T'put + other inputs
Fuel & Loss Crude T'put + other inputs
Fuel & Loss Crude T'put + other inputs
Fuel & Loss Crude T'put + other inputs
Fuel & Loss Crude T'put + other inputs
Fuel & Loss
Qty % Qty % Qty % Qty % Qty %
1
IOCL
Barauni 6.6 0.6 9.2 6.0 0.5 9.2 6.9 0.6 9.0 6.7 0.6 8.8 5.7 0.557 9.82 Koyali 14.6 1.3 9.0 14.5 1.2 8.6 14.2 1.3 9.0 13.9 1.3 9.3 12.4 1.2 10.03 Haldia 7.7 0.7 8.8 7.8 0.7 8.4 8.1 0.7 8.3 6.6 0.6 9.6 6.9 0.7 10.54 Mathura 9.7 0.7 7.5 9.8 0.7 7.0 10.2 0.7 6.6 9.5 0.6 6.7 9.4 0.7 7.05 Panipat 17.2 1.5 8.4 17.3 1.4 8.1 17.3 1.4 7.9 16.7 1.4 8.3 14.9 1.4 9.26 Guwahati 1.2 0.1 9.4 1.3 0.1 10.2 1.2 0.1 9.5 1.3 0.1 9.7 1.1 0.1 10.67 Digboi 0.6 0.1 11.7 0.7 0.1 10.3 0.8 0.1 10.0 0.7 0.1 11.0 0.7 0.1 11.78 Bongaigaon 2.5 0.2 8.3 2.4 0.2 8.7 2.6 0.2 8.2 2.1 0.2 8.5 2.5 0.3 11.1
9 Paradip 8.3 1.3 15.9 12.7 1.4 10.9 14.6 1.4 9.8 15.8 1.5 9.6 12.5 1.4 11.0
IOCL Total 68.4 6.5 72.6 6.4 75.7 6.4 73.4 6.4 66.1 6.410
HPCL
Mumbai 8.5 0.6 7.2 8.6 0.6 7.2 8.8 0.6 7.0 8.1 0.4 5.1 7.5 0.6 8.011 Visakh 9.3 0.7 7.3 9.6 0.7 7.1 9.8 0.7 7.3 9.1 0.7 7.5 9.1 0.7 7.912 HMEL-Bathinda 10.6 0.7 6.3 8.9 0.6 6.2 12.6 0.7 5.8 12.3 0.7 5.7 10.1 0.6 6.0
HPCL Total 28.4 2.0 27.2 1.9 31.2 2.1 29.5 1.8 26.7 1.913
BPCL
Mumbai 13.6 0.6 4.4 14.3 0.7 4.6 14.8 0.6 4.0 15.1 0.6 4.2 13.1 0.5 4.114 Kochi 12.0 0.7 6.0 14.5 1.1 7.7 16.4 1.3 7.8 17.2 1.4 8.3 13.9 1.1 8.215 BORL-Bina 6.4 0.6 8.8 6.7 0.7 9.7 5.7 0.6 10.2 7.9 0.8 9.9 6.2 0.7 11.816 Numaligarh 3.0 0.3 9.8 3.1 0.3 10.1 3.2 0.3 9.5 2.7 0.3 10.0 3.0 0.3 9.9
BPCL Total 34.9 2.2 38.7 2.7 40.1 2.7 42.8 3.1 36.1 2.717
CPCLManali 9.8 0.9 9.3 10.4 1.0 9.7 10.3 1.1 10.3 10.3 1.0 10.0 8.5 0.9 10.7
18 CBR 0.6 0.03 4.6 0.5 0.03 5.0 0.4 0.02 5.1 0.002 0.001 52.5 0 0 0CPCL Total 10.4 0.9 10.9 1.0 10.8 1.1 10.3 1.0 8.5 0.9
19ONGC
Tatipaka 0.1 0.003 3.7 0.1 0.004 5.3 0.1 0.003 5.1 0.1 0.007 7.8 0.1 0.004 5.120 MRPL-Mangalore 16.3 1.6 10.1 16.4 1.7 10.2 16.5 1.7 10.2 14.1 1.5 10.6 11.5 1.4 11.9
ONGC Total 16.3 1.6 16.4 1.7 16.6 1.7 14.2 1.5 11.6 1.4
21RIL
Jamnagar (DTA) 35.9 2.5 6.9 36.4 2.7 7.4 37.0 2.8 7.5 40.1 3.8 9.5 40.7 4.0 9.9
22 Jamnagar (SEZ) 44.8 3.3 7.5 47.8 3.7 7.8 48.9 3.6 7.4 52.1 4.6 8.9 45.1 4.4 9.8
23 NEL** Vadinar 21.3 1.2 5.5 21.0 1.2 5.7 19.2 1.1 6.0 21.1 1.2 5.7 17.5 1.0 6.0Total 260.4 20.2 7.8 271.0 21.3 7.9 279.6 21.6 7.7 283.5 23.5 8.3 252.3 22.8 9.0
Table 4.10 : Fuel & Loss
*Nayara Energy Limited (formerly Essar Oil Limited) Source: Oil companies

PPAC Ready Reckoner
40
Table 4.12 : Import / export of crude oil and petroleum products
Import / export
Crude oil & petroleum products
2016-17 2017-18 2018-19 2019-20 2020-21 (P)Quantity Value Quantity Value Quantity Value Quantity Value Quantity Value Million tonne
US$ (Billion) Rs. (Crores) Million
tonneUS$
(Billion) Rs. (Crores) Million tonne
US$ (Billion) Rs. (Crores) Million
tonneUS$
(Billion) Rs. (Crores) Million tonne
US$ (Billion) Rs. (Crores)
IMPORT*
Crude oil 213.9 70.2 4,70,159 220.4 87.8 5,66,450 226.5 111.9 7,83,183 227.0 101.4 7,17,001 198.1 62.7 4,62,996
of which, PSU/JVs 128.3 44.0 2,94,050 133.0 54.3 3,50,612 142.9 71.9 5,04,524 141.4 64.7 4,58,073 123.5 40.1 2,95,935
Private 85.6 26.2 1,76,109 87.4 33.5 2,15,839 83.6 40.0 2,78,659 85.5 36.7 2,58,928 74.7 22.6 1,67,060
Products
LPG 11.1 4.8 32,124 11.4 5.8 37,875 13.2 7.2 49,939 14.8 7.1 50,347 16.5 7.3 53,883
Petrol 0.5 0.2 1,617 0.2 0.1 581 0.7 0.4 3,104 2.1 1.4 9,610 1.3 0.7 4,903
Naphtha 2.8 1.2 8,374 2.2 1.3 8,161 2.1 1.4 9,665 1.7 0.9 6,678 1.4 0.5 3,442
Aviation Turbine Fuel 0.3 0.2 1,109 0.3 0.2 1,159 0.3 0.2 1,392 0.1 0.04 309 0.0 0.00 0
Kerosene 0.0 0.0 0 0.0 0.0 0 0.0 0.0 0 0.0 0.0 0 0.0 0.0 0
Diesel 1.0 0.4 2,959 1.4 0.7 4,269 0.6 0.4 2,486 2.8 1.6 11,619 0.7 0.3 2,060
Lubes/LOBS 2.1 1.3 8,625 2.5 1.9 12,075 2.5 1.9 13,349 2.7 1.7 11,869 2.1 1.3 9,583
Fuel Oil 0.9 0.3 1,848 1.2 0.5 3,231 1.4 0.7 4,782 4.6 1.6 11,791 6.9 2.1 15,350
Bitumen 1.0 0.2 1,638 1.0 0.3 1,902 0.9 0.3 2,149 1.6 0.5 3,634 1.6 0.4 2,744
Petcoke 14.4 1.2 7,929 12.8 1.7 11,100 7.9 1.5 10,350 10.7 1.4 9,713 10.8 0.9 6,966
Others** 2.2 0.8 5,342 2.6 1.2 8,020 3.9 2.4 16,449 2.7 1.4 10,172 2.1 0.8 6,237
Total product import 36.3 10.6 71,566 35.5 13.6 88,374 33.3 16.3 1,13,665 43.8 17.7 1,25,742 43.5 14.2 1,05,168
of which, PSU/JVs 12.5 5.5 36,691 12.8 6.5 42,305 14.6 8.1 56,178 20.0 10.2 72,699 18.7 8.3 61,305
Private 23.7 5.2 34,875 22.7 7.1 46,069 18.8 8.3 57,487 23.8 7.5 53,042 24.8 5.9 43,864
Total import (crude oil + product) 250.2 80.8 5,41,725 255.9 101.4 6,54,824 259.8 128.3 8,96,848 270.7 119.1 8,42,743 241.6 76.9 5,68,164
EXPORT
Products
LPG 0.3 0.2 1,168 0.4 0.2 1,501 0.4 0.3 1,976 0.5 0.3 1,970 0.5 0.2 1,797
Petrol 15.4 7.9 52,920 14.0 8.5 54,580 12.9 8.6 60,419 12.7 7.7 54,512 11.6 5.0 36,530
Naphtha 8.7 3.7 24,616 9.0 4.5 29,075 7.0 4.1 28,893 8.9 4.4 31,509 6.5 2.5 18,600
Aviation Turbine Fuel 7.3 3.3 22,294 7.2 3.9 25,348 7.4 4.9 34,030 6.9 4.0 28,458 3.5 1.3 9,377
Kerosene 0.02 0.01 54 0.02 0.01 68 0.02 0.01 98 0.2 0.1 560 0.02 0.01 48
Diesel 27.30 11.9 79,857 29.7 15.4 99,454 27.8 17.6 1,23,519 31.7 17.5 1,23,919 30.6 11.1 81,550
LDO 0.2 0.1 399 0.02 0.01 37 0.1 0.05 364 0.0 0.0 0 0.0 0.0 0
Lubes/LOBS 0.01 0.02 104 0.01 0.02 118 0.01 0.02 106 0.01 0.01 96 0.01 0.01 93
Fuel Oil 2.2 0.6 3,930 2.5 0.8 5,291 2.2 0.9 6,537 1.5 0.5 3,811 1.2 0.3 2,316
Bitumen 0.04 0.01 37 0.1 0.02 119 0.02 0.01 72 0.03 0.01 89 0.01 0.003 23
Petcoke / CBFS 0.7 0.1 804 0.6 0.1 687 1.1 0.5 3,255 0.5 0.2 1,096 0.6 0.04 286
Others*** 3.3 1.3 8,710 3.4 1.4 9,110 2.1 1.2 8,429 2.9 1.1 7,998 2.3 0.9 6,428
Total product export 65.5 29.0 1,94,893 66.8 34.9 2,25,388 61.1 38.2 2,67,697 65.7 35.8 2,54,018 56.8 21.4 1,57,047
of which, PSU/JVs 12.6 5.2 35,102 15.0 7.4 48,100 13.4 8.1 56,415 14.2 7.5 53,276 10.6 4.0 29,594
Private 53.0 23.8 1,59,791 51.8 27.5 1,77,288 47.7 30.2 2,11,282 51.5 28.4 2,00,742 46.1 17.4 1,27,454
Net import 184.7 51.8 3,46,832 189.1 66.5 4,29,436 198.8 90.0 6,29,152 205.1 83.2 5,88,725 184.8 55.5 4,11,116
Net product export 29.2 18.4 1,23,327 31.4 21.3 1,37,014 27.7 21.9 1,54,031 21.9 18.2 1,28,276 13.3 7.2 51,879
Source: Oil companies & DGCIS, (P) : Provisional Note: *Import does not include LNG imports **Other imports include Paraffin Wax, Petroleum Jelly, Aviation Gas, MTBE, Reformate etc. ***Other exports include VGO, Benzene, Hexane, MTO, Sulphur etc. “Others” in exports include RIL-SEZ exports of “Others” with unspecified heavy ends.Net product export = Total product export - Total product import
• Crude oil imports decreased by 12.7% during 2020-21 as compared to 2019-20. • Imports made due to deficit in production viz. LPG and Lubes/LOBS accounted for 42.9% share of total POL products import during 2020-21 as compared to 39.9% during 2019-20. • Imports of naphtha and FO were done for commercial and technical considerations and accounted for 18.9% share of total POL products import during 2020-21 as compared to 14.3% during 2019-20.• Decrease of 13.6% was recorded in POL products export during during 2020-21 as compared to during 2019-20 mainly due to decrease in exports of all productsexcept petcoke/CBFS and LOBS/Lube
oil.

PPAC Ready Reckoner
41
Year US dollar ($)
British pound (£)
Euro (€)
Japanese yen (¥)
Indian rupee (`) / foreign currency
2002-03 48.41 74.84 48.07 0.40
2003-04 45.92 77.74 54.01 0.41
2004-05 44.95 82.95 56.55 0.42
2005-06 44.28 79.02 53.88 0.39
2006-07 45.29 85.72 58.11 0.39
2007-08 40.24 80.80 56.99 0.35
2008-09 45.91 78.45 65.14 0.46
2009-10 47.42 75.88 67.08 0.51
2010-11 45.58 70.88 60.21 0.53
2011-12 47.95 76.40 65.90 0.61
2012-13 54.45 86.02 70.06 0.66
2013-14 60.50 96.23 81.14 0.60
2014-15 61.15 98.56 77.47 0.56
2015-16 65.46 98.76 72.31 0.55
2016-17 67.09 87.71 73.61 0.62
2017-18 64.45 85.47 75.42 0.58
2018-19 69.89 91.74 80.93 0.63
2019-20 70.88 90.15 78.80 0.65
2020-21 74.20 97.06 86.67 0.70
2021-22 (upto 31.05.2021) 73.84 103.11 89.05 0.68
2021 : Month wise
January 73.11 99.73 89.05 0.71
February 72.76 100.81 88.03 0.69
March 72.79 100.88 86.72 0.67
April 74.47 103.13 89.20 0.68
May 73.27 103.09 88.92 0.67
Table 4.13 : Exchange rates of Indian rupee (`)
Source: Reserve Bank of India (RBI)/ Financial Benchmark India Private Limited (FBIL) website.Note: The rates are average for the period.


PPAC Ready Reckoner
44
Map of Pipeline Network in India
Note: Pipelines shown are indicative only.

PPAC Ready Reckoner
45
Table 5.1 : Natural Gas Pipelines in the Country - 31.03.2021
S. N. Network/Region Entity Length
(Kms)
Authrozied capacity/ Declared capacity
(mmscmd)
Pipeline size Pipeline Status
Average flow
2020-21 (mmscmd)
% Capacity
utilisation 2020-21
Average flow Oct 2020-Mar
2021 (P) (mmscmd)
% Capacity utilisation
Oct 2020-Mar 2021 (P)
1 Assam Natural Gas Pipeline NetworkAssam Gas Company
Limited (AGCL)106.7 2.428 31"/20"/16"/14" Operational 0.953538 39.27% 1.011737 41.67%
2 Cauvery Basin Network GAIL 240.3 4.330 18"/ 12"/8"/6"/4"/3"/2" Operational 1.8 42% 1.55 36%
3Hazira-Vijaipur-Jagdishpur -GREP (Gas Rehabilitation and Expansion Project)-Dahej-Vijaipur HVJ/VDPL
GAIL 4222 57.300 42"/36"/30"/18"/16"/14"/ 12"/10"/8"/6"/4"/2" Operational
68.68 62% 71.69 64%
4 Dahej-Vijaipur (DVPL)-Vijaipur-Dadri (GREP) Upgradation DVPL 2 & VDPL GAIL 1280 54.000 48"/ 16"/12" Operational
5 Dahej-Uran-Panvel-Dhabhol GAIL 815 19.900 30"/24"/18"/12"/6"/4" Operational 15.41 77% 16.8 84%
6 KG Basin Network GAIL 877.9 16.000 18"/16"/14"/12"/ 8"/6"/4"/2" Operational 4.13 26% 4.29 27%
7 Gujarat Regional Network GAIL 608.8 8.310 24"/18"/14"/12"/8"/ 6"/5"/2"/1" Operational 3.36 40% 3.67 44%
8 Agartala Regional Network GAIL 55.4 2.000 12"/10"/8" Operational 0.97 49% 1 50%
9 Mumbai Regional Network GAIL 128.7 7.034 26"/20"18"/12"/4" Operational 4.84 69% 4.84 69%
10 Dukli - Maharajganj GAIL 5.2 0.260 4" Operational 0.05 19% 0.06 23%
11 Chainsa-Jhajjar-Hissar GAIL 455 35.000 36"/18"/16"/12"/ 10"/8"-4"
Under Construction 0.94 3% 1.26 4%
12 Dadri-Bawana-Nangal GAIL 921 31.000 36"/30"/18"/10"/8" Under Construction 6.07 20% 6.74 22%
13 Kochi-Koottanad-Bangalore-Mangalore GAIL 1104 16.000 30"/24"/18"/8"/4" Operational 3.28 21% 3.96 25%
14 Dabhol-Bangalore GAIL 1414 16.000 36"/30"/24"/18"/10"/8" Under Construction 1.6 10% 1.78 11%
15 Jagdishpur-Haldia-Bokaro Dhamra-Paradip- Barauni-Guwahati GAIL 3546 23.000 36"/30"/24"/18"/12"/
8"/6"/4"Under
Construction 0.09 0% 0.18 1%
16 Srikakulam-Angul GAIL 690 6.650 24"/18"/12" Under Construction
17 Mumbai-Nagpur-Jharsuguda GAIL 1755 16.500 24"/18"/12" Under Construction
18 Hazira-Ankleshwar (HAPi) GGL 73.2 4.200 18" Operational 1.02 24.29 0.9 21.43
19 Mehsana - Bhatinda^ GIGL 1579 45.940 36"/24"/18"/12" Under Construction 2.72 5.9% 3.10 6.7%
20 Bhatinda - Gurdaspur^ GIGL 346 33.930 24"/18"/16"/12"/8"/6" Under Construction 0.01 0.03% 0.01 0.0%
21 Mallavaram - Bhopal - Bhilwara - Vijaipur$ GITL 2042 78.250 42"/36"/30"/24"/18"/12" Under
Construction 0.24 0.31% 0.41 0.5%
22 High Pressure Gujarat Gas Grid GSPL 2207 31.000 36"/30"/24"/20"/18"/ 12"/8"/6"/4" Operational
36.55 85% 36.6 85.1%23 Low Pressure Gujarat Gas Grid GSPL 57.6 12.000 36"/30"/24"/12" Operational
24 Dadri-Panipat IOCL 132 20.000 30" Operational 5.47 58% 5.94 62%
25 Ennore-Tuticorin IOCL 1421 84.700 28"/24"/16"/12"/10" Under Construction 2.11 17% 2.39 20%
26 Uran-Trombay ONGC 24 6.000 20" Operational 2.86 48% 3.05 51%
27 Kakinada-Hyderabad-Uran-Ahmedabad (East West Pipeline) PIL 1460 85.000 30"/28"/24"/20"/8" Operational 11.99 14.11% 11.92 14.02%
28 Shahdol-Phulpur RGPL 304 3.500 16" Operational 0.818 23.38 0.790 22.58
29
North East Gas Grid connecting the eight North Eastern states of Assam, Arunachal Pradesh, Meghalaya, Tripura, Mizoram, Nagaland, Manipur & Sikkim.
Indradhanush Gas Grid Limited
1656 4.750 24"/18"/16"/12"/8" Under Construction NIL NIL NIL NIL
30 Kakinada – Vishakhapatnam – Srikakulam APGDC 391 90.000 24"/18" Under
Construction NIL NIL NIL NIL
Total 27871
Note: *Information Not Available Source: Pipeline entities ^ Please note that gas is flowing through (i) Palanpur-Pali-Barmer pipeline section (341kms) and (ii) Jallandhar- Amritsar pipeline section (101kms) commissioned in Nov’ 2018 $ Please note that the gas is flowing through 365 km x 18” pipeline Kunchanapally in Andhra Pradesh to RFCL, Ramagundam in Telanagana State which was commissioned on 14.10.2019.
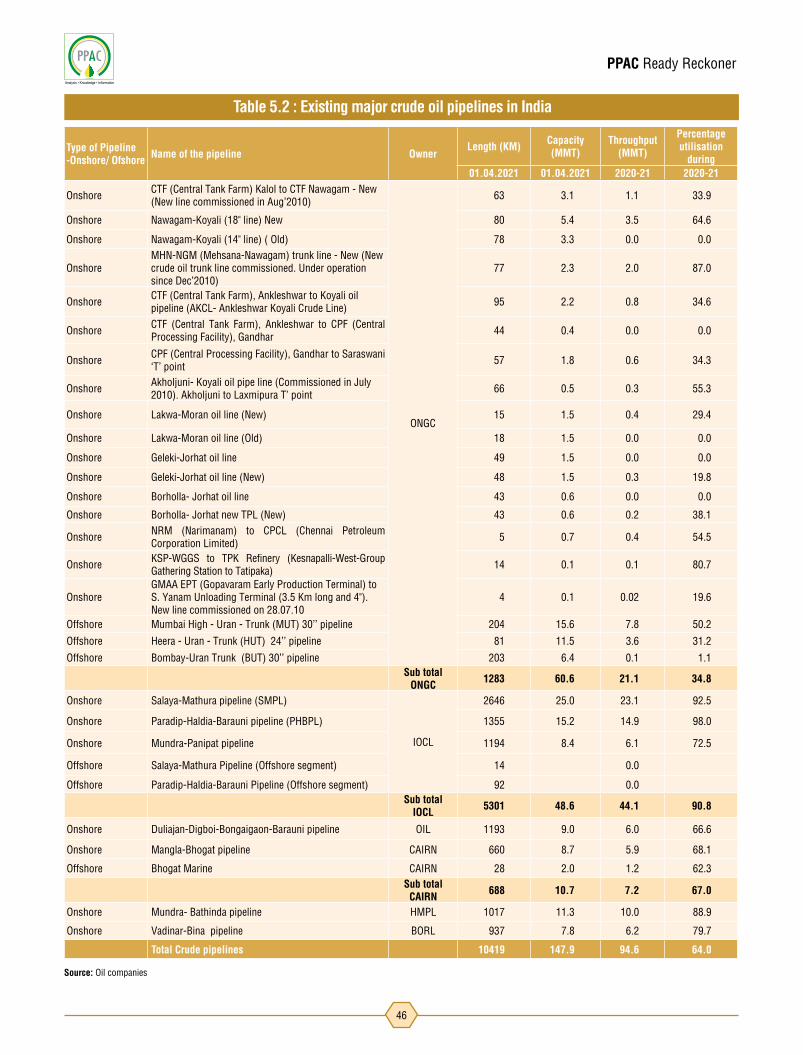
PPAC Ready Reckoner
46
Type of Pipeline -Onshore/ Ofshore Name of the pipeline Owner
Length (KM) Capacity (MMT)
Throughput (MMT)
Percentage utilisation
during01.04.2021 01.04.2021 2020-21 2020-21
Onshore CTF (Central Tank Farm) Kalol to CTF Nawagam - New (New line commissioned in Aug'2010)
ONGC
63 3.1 1.1 33.9
Onshore Nawagam-Koyali (18" line) New 80 5.4 3.5 64.6
Onshore Nawagam-Koyali (14" line) ( Old) 78 3.3 0.0 0.0
OnshoreMHN-NGM (Mehsana-Nawagam) trunk line - New (New crude oil trunk line commissioned. Under operation since Dec'2010)
77 2.3 2.0 87.0
Onshore CTF (Central Tank Farm), Ankleshwar to Koyali oil pipeline (AKCL- Ankleshwar Koyali Crude Line) 95 2.2 0.8 34.6
Onshore CTF (Central Tank Farm), Ankleshwar to CPF (Central Processing Facility), Gandhar 44 0.4 0.0 0.0
Onshore CPF (Central Processing Facility), Gandhar to Saraswani ‘T’ point 57 1.8 0.6 34.3
Onshore Akholjuni- Koyali oil pipe line (Commissioned in July 2010). Akholjuni to Laxmipura T' point 66 0.5 0.3 55.3
Onshore Lakwa-Moran oil line (New) 15 1.5 0.4 29.4
Onshore Lakwa-Moran oil line (Old) 18 1.5 0.0 0.0
Onshore Geleki-Jorhat oil line 49 1.5 0.0 0.0
Onshore Geleki-Jorhat oil line (New) 48 1.5 0.3 19.8
Onshore Borholla- Jorhat oil line 43 0.6 0.0 0.0
Onshore Borholla- Jorhat new TPL (New) 43 0.6 0.2 38.1
Onshore NRM (Narimanam) to CPCL (Chennai Petroleum Corporation Limited) 5 0.7 0.4 54.5
Onshore KSP-WGGS to TPK Refinery (Kesnapalli-West-Group Gathering Station to Tatipaka) 14 0.1 0.1 80.7
OnshoreGMAA EPT (Gopavaram Early Production Terminal) to S. Yanam Unloading Terminal (3.5 Km long and 4"). New line commissioned on 28.07.10
4 0.1 0.02 19.6
Offshore Mumbai High - Uran - Trunk (MUT) 30’’ pipeline 204 15.6 7.8 50.2
Offshore Heera - Uran - Trunk (HUT) 24’’ pipeline 81 11.5 3.6 31.2
Offshore Bombay-Uran Trunk (BUT) 30’’ pipeline 203 6.4 0.1 1.1Sub total
ONGC 1283 60.6 21.1 34.8
Onshore Salaya-Mathura pipeline (SMPL)
IOCL
2646 25.0 23.1 92.5
Onshore Paradip-Haldia-Barauni pipeline (PHBPL) 1355 15.2 14.9 98.0
Onshore Mundra-Panipat pipeline 1194 8.4 6.1 72.5
Offshore Salaya-Mathura Pipeline (Offshore segment) 14 0.0
Offshore Paradip-Haldia-Barauni Pipeline (Offshore segment) 92 0.0Sub total
IOCL 5301 48.6 44.1 90.8
Onshore Duliajan-Digboi-Bongaigaon-Barauni pipeline OIL 1193 9.0 6.0 66.6
Onshore Mangla-Bhogat pipeline CAIRN 660 8.7 5.9 68.1
Offshore Bhogat Marine CAIRN 28 2.0 1.2 62.3Sub total
CAIRN 688 10.7 7.2 67.0
Onshore Mundra- Bathinda pipeline HMPL 1017 11.3 10.0 88.9
Onshore Vadinar-Bina pipeline BORL 937 7.8 6.2 79.7
Total Crude pipelines 10419 147.9 94.6 64.0
Table 5.2 : Existing major crude oil pipelines in India
Source: Oil companies

PPAC Ready Reckoner
47
Type of Pipeline Name of the pipeline Owner
Length (KM) Capacity (MMT)
Throughput (MMT)
Percentage utilisation during
01.04.2021 01.04.2021 2020-21 2020-21
Petroleum Products Pipelines
Onshore Barauni - Kanpur pipeline
IOCL
1227 3.5 3.0 84.5
Onshore Guwahati -Siliguri pipeline 435 1.4 1.7 119.9
Onshore Haldia-Barauni pipeline 526 1.3 1.5 117.9
Onshore Haldia-Mourigram-Rajbandh pipeline 277 1.4 1.5 113.5
Onshore Koyali-Ahmedabad pipeline 79 1.1 0.5 41.1
Onshore Koyali-Sanganer pipeline (Incl. JPNPL) 1644 5.0 4.0 80.8
Onshore Koyali-Ratlam pipeline 265 2.0 0.8 39.0
Onshore Koyali-Dahej pipeline 197 2.6 0.6 24.4
Onshore Mathura-Tundla pipeline 561.2
0.435.9
Onshore Mathura-Bharatpur pipeline 21 0.2
Onshore Mathura-Delhi pipeline 147 3.7 1.8 47.5
Onshore Panipat-Amabala-Jalandhar (Including Kurukshetra-Roorkee-Najibabad branch line) 495 3.5 2.6 74.2
Onshore Panipat-Delhi (Including Sonepat-Meerut branch line) pipeline 189
3.0 0.8 25.4Onshore Panipat Bijwasan ATF pipeline 111
Onshore Panipat-Bathinda pipeline 219 1.5 1.3 86.4
Onshore Panipat-Rewari pipeline 155 2.1 1.5 69.8
Onshore Chennai-Trichy-Madurai pipeline 683 2.3 2.5 107.0
Onshore Chennai - Meenambakkam ATF pipeline 95 0.2 0.1 65.6
Onshore Chennai-Bengaluru pipeline 290 2.5 1.8 71.8
Onshore Devangonthi - Devanhalli pipeline 36 0.7 0.3 45.8
Onshore Paradip Raipur Ranchi pipeline(PRRPL) 1073 5.0 3.5 69.3
Onshore Kolkata ATF pipeline 27 0.2 0.1 27.5
Sub total IOCL 8247 44.0 30.2 68.6
Onshore Mumbai-Manmad-Bijwasan pipeline (MMBPL)
BPCL
1389 6.0 6.8 113.0
Onshore Bina-Kota pipeline (BKPL) 259 4.4 3.4 76.4
Onshore ATF P/L Mumbai Refinery (MR)-Santacruz 15 1.4 0.3 19.5
Onshore ATF P/L Kochi Refinery (KR)-Kochi Airport 34 0.6 0.2 28.0
Onshore Kota - Jobner branch pipeline(1) 211 1.7
Onshore Mumbai Refinery- Wadilube Pipeline 12 1.3 0.3 22.6
Onshore Cochin-Coimbatore-Karur (CCK) pipeline (2) 293 3.3 3.3 99.7
Sub total BPCL 2213 18.7 14.2 75.7
Onshore Mumbai-Pune-Solapur pipeline
HPCL
508 4.3 3.1 72.9
Onshore Vizag-Vijaywada-Secunderabad pipeline 572 7.7 4.6 59.2
Onshore Mundra-Delhi pipeline (1) 1054 6.9 6.8 98.4
Onshore Ramanmandi-Bahadurgarh pipeline (2) 243 7.1 4.9 69.4
Table 5.3 : Existing major POL pipelines in India

PPAC Ready Reckoner
48
Source: Oil CompaniesNote: IOCL (1) PHDPL - Durgapur to Banka commissioned on 3.7.2020 (Length = 193.629 Km) BPCL (1) Kota-Jobner pipeline is a branch pipeline of Mumbai-Manmad-Bijwasan pipeline with annual capacity of 1.7 MMTPA.Throughput of this pipeline is included in MMBPL & BKPL
pipelines. (2) Petronet CCK was merged with BPCL w.e.f 1st June 2018 HPCL (1) Thruput of Mundra-Delhi pipeline ncludes thruputs of branchlines viz. Awa Salawas Pipeline,Rewari Kanpur pipeline,Palanpur-Vadodara Pipeline and reverse pumping (1.66 MMT)
from Bahadurgarh to Rewari. (2) Thruput of Ramanmandi Bahadurgarh pipeline is including thruput of branchlines viz. Bahadurgarh-TikriKalan Pipeline & Rewari-Kanpur pipeline. (3) Lube Oil pipeline and ATF pipeline from Mumbai Refinery to Mazgaon Terminal and Mumbai Airport are speciality product pipelines. (4) Thruput of UCSPL includes both HPCL & BPCL volumes. (5) ATF Pipeline has been derated from 1.10 MMT to 0.5 MMTPetronet MHB(1) Petronet MHB JV- ONGC & HPCL 26% each, Petronet- 12%, Public- 36%.
Onshore Ramanmandi-Bathinda pipeline
HPCL
30 2.1 1.0 49.0
Onshore Awa-Salawas pipeline 93
Onshore Bahadurgarh-Tikrikalan pipeline 14
Onshore Rewari- Kanpur Pipeline 443
Onshore ATF pipeline from Mumbai Refinery to Mumbai Airport(5) 20 0.5 0.2 35.7
Onshore Black Oil Pipeline (BOPL) 22 1.5 0.3 22.4
Onshore Lube Oil Pipeline : Trombay to Wadibundar (3) 17 1.0 0.4 42.7
Onshore Palanpur-Vadodara Pipeline 235
Sub total HPCL 3250 31.1 18.2 58.5
Onshore Mangalore-Hassan-Bengaluru (MHB) pipeline (1) Petronet MHB 363 5.6 2.1 38.2
Onshore Numaligarh-Siliguri pipeline OIL 654 1.7 1.7 98.8
Total Petroleum product pipelines (w/o LPG pipelines ) 14727 101.1 66.4 65.6
LPG Pipelines
Onshore Panipat-Jalandhar pipelineIOCL
280 0.7 0.6 84.0
Onshore Paradip Haldia Durgapur pipeline (1) 873 1.3 1.1 89.1
Sub total IOCL 1153 2.0 1.7 87.3
Onshore/ offshore Mumbai-Uran pipeline BPCL 28 0.8 0.7 85.1
Onshore Jamnagar-Loni pipelineGAIL
1414 2.5 2.8 112.7
Onshore Vizag-Secunderabad pipeline 618 1.3 1.3 98.3
Sub total GAIL 2032 3.8 4.1 107.7
Onshore Mangalore-Hassan-Mysore-Bangalore LPGHPCL
356 1.9 1.1 55.5
Onshore Uran-Chakan-Shikrapur LPG Pipeline (4) 169 1.0 0.9 88.4
Sub total HPCL 525 2.9 2.0 66.7
Total LPG pipelines 3738 9.5 8.5 89.0
Total POL pipelines 18465 110.7 74.9 67.7
Type of Pipeline Name of the pipeline Owner
Length (KM) Capacity (MMT)
Throughput (MMT)
Percentage utilisation during
01.04.2021 01.04.2021 2020-21 2020-21

PPAC Ready Reckoner
49
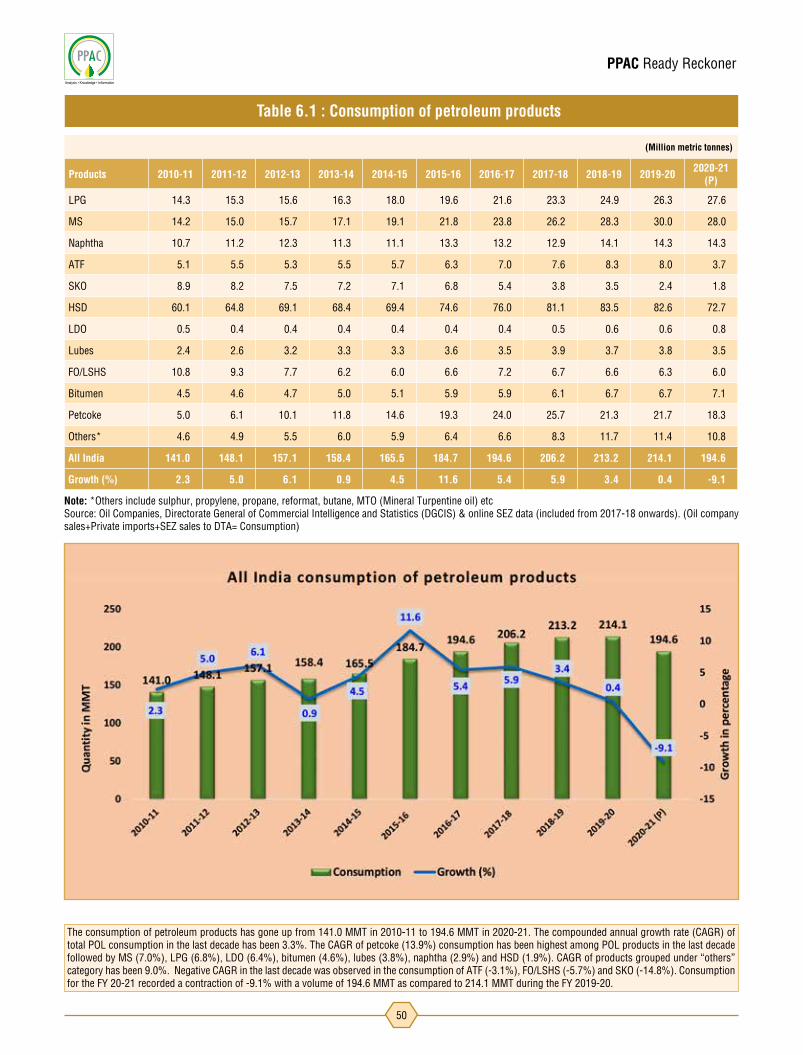
50
(Million metric tonnes)
Products 2010-11 2011-12 2012-13 2013-14 2014-15 2015-16 2016-17 2017-18 2018-19 2019-20 2020-21 (P)
LPG 14.3 15.3 15.6 16.3 18.0 19.6 21.6 23.3 24.9 26.3 27.6
MS 14.2 15.0 15.7 17.1 19.1 21.8 23.8 26.2 28.3 30.0 28.0
Naphtha 10.7 11.2 12.3 11.3 11.1 13.3 13.2 12.9 14.1 14.3 14.3
ATF 5.1 5.5 5.3 5.5 5.7 6.3 7.0 7.6 8.3 8.0 3.7
SKO 8.9 8.2 7.5 7.2 7.1 6.8 5.4 3.8 3.5 2.4 1.8
HSD 60.1 64.8 69.1 68.4 69.4 74.6 76.0 81.1 83.5 82.6 72.7
LDO 0.5 0.4 0.4 0.4 0.4 0.4 0.4 0.5 0.6 0.6 0.8
Lubes 2.4 2.6 3.2 3.3 3.3 3.6 3.5 3.9 3.7 3.8 3.5
FO/LSHS 10.8 9.3 7.7 6.2 6.0 6.6 7.2 6.7 6.6 6.3 6.0
Bitumen 4.5 4.6 4.7 5.0 5.1 5.9 5.9 6.1 6.7 6.7 7.1
Petcoke 5.0 6.1 10.1 11.8 14.6 19.3 24.0 25.7 21.3 21.7 18.3
Others* 4.6 4.9 5.5 6.0 5.9 6.4 6.6 8.3 11.7 11.4 10.8
All India 141.0 148.1 157.1 158.4 165.5 184.7 194.6 206.2 213.2 214.1 194.6
Growth (%) 2.3 5.0 6.1 0.9 4.5 11.6 5.4 5.9 3.4 0.4 -9.1
Table 6.1 : Consumption of petroleum products
Note: *Others include sulphur, propylene, propane, reformat, butane, MTO (Mineral Turpentine oil) etc Source: Oil Companies, Directorate General of Commercial Intelligence and Statistics (DGCIS) & online SEZ data (included from 2017-18 onwards). (Oil company sales+Private imports+SEZ sales to DTA= Consumption)
The consumption of petroleum products has gone up from 141.0 MMT in 2010-11 to 194.6 MMT in 2020-21. The compounded annual growth rate (CAGR) of total POL consumption in the last decade has been 3.3%. The CAGR of petcoke (13.9%) consumption has been highest among POL products in the last decade followed by MS (7.0%), LPG (6.8%), LDO (6.4%), bitumen (4.6%), lubes (3.8%), naphtha (2.9%) and HSD (1.9%). CAGR of products grouped under “others” category has been 9.0%. Negative CAGR in the last decade was observed in the consumption of ATF (-3.1%), FO/LSHS (-5.7%) and SKO (-14.8%). Consumption for the FY 20-21 recorded a contraction of -9.1% with a volume of 194.6 MMT as compared to 214.1 MMT during the FY 2019-20.
PPAC Ready Reckoner

PPAC Ready Reckoner
51
(Growth in percentage)
Products 2010-11 2011-12 2012-13 2013-14 2014-15 2015-16 2016-17 2017-18 2018-19 2019-20 2020-21 (P)
LPG 9.1 6.8 2.0 4.4 10.5 9.0 10.1 8.0 6.7 5.7 4.8
MS 10.7 5.6 5.0 8.8 11.4 14.5 8.8 10.1 8.1 6.0 -6.8
Naphtha 5.3 5.1 9.5 -8.0 -2.0 19.8 -0.2 -2.7 9.6 1.0 -0.1
ATF 9.8 9.0 -4.8 4.4 4.0 9.4 11.8 9.1 8.7 -3.6 -53.7
SKO -4.0 -7.8 -8.8 -4.5 -1.1 -3.7 -20.9 -28.8 -10.0 -30.7 -25.1
HSD 6.8 7.8 6.7 -1.0 1.5 7.5 1.8 6.6 3.0 -1.1 -12.0
LDO -0.4 -8.9 -4.0 -3.1 -5.4 11.5 10.3 16.7 14.2 5.0 34.6
Lubes -4.3 8.4 21.4 3.4 0.1 7.9 -2.8 11.9 -5.6 4.5 -7.7
FO/LSHS -7.2 -13.7 -17.7 -18.6 -4.4 11.3 7.8 -6.0 -2.3 -4.0 -4.9
Bitumen -8.0 2.2 0.8 7.1 1.3 17.1 0.0 2.5 10.2 0.2 5.9
Petcoke -24.4 23.2 65.1 16.0 23.8 32.6 24.2 7.1 -16.8 1.7 -15.7
Others -15.4 7.8 11.9 8.1 -1.4 8.2 3.8 26.5 40.6 -3.1 -4.7
All India 2.3 5.0 6.1 0.9 4.5 11.6 5.4 5.9 3.4 0.4 -9.1
Table 6.2 : Consumption growth of petroleum products
Sl. no. End-use sectors % of total
sales *
(I) (II) (III)
1 Transport, of which 70.00
a Commercial vehicles 8.94
b Private vehicles 13.15
c 3 - Wheelers 6.39
d Truck 28.25
e Buses/STU 9.55
f Railways 3.24
g Others (Shipping & Aviation) 0.48
2 Agriculture 13.00
3 Industrial application 4.96
4 Power generation 4.06
5 Mobile towers 1.54
6 Others (Including private imports) 6.45
Total 100.0
End-use analysis of HSD sales (as of 2012-13)
* Figures include consumption through retail & direct imports. End use sector wise break up as per PPAC survey and direct sales as reported by oil companies for the year 2012-13.

PPAC Ready Reckoner
52
*Total (all product) sales includes other petroleum products such as naphtha, FO, ATF, lubricants, bitumen, etc.
State wise highest/lowest per capita
Source: Oil companiesNote:1-Per capita sales figures are based on provisional sales figures for the period April 2020 - March 20212-Population figures have been taken from Census of India, 2011 and then extrapolated for 01.04.2020 based on past decadal growth.3- SKO includes both PDS & non PDS sales
Highest Lowest
(Figures in thousand metric tonnes)
State/UTLPG MS SKO HSD Total (All products)*
Sales Per capita sales (Kg) Sales Per capita
sales (Kg) Sales Per capita sales (Kg) Sales Per capita
sales (Kg) Total sales Per capita sales (Kg)
Chandigarh 46.5 38.1 91.4 74.9 0.1 0.1 126.6 103.7 312.0 255.7
Delhi 733.0 36.6 668.8 33.4 0.1 0.006 499.2 24.9 2911.2 145.4
Haryana 868.5 29.0 1011.5 33.8 1.5 0.1 4434.4 148.1 9852.8 329.2
Himachal Pradesh 179.5 23.4 233.1 30.4 8.7 1.1 609.8 79.5 1527.8 199.2
Jammu and Kashmir 210.0 14.1 273.1 18.4 79.0 5.3 576.0 38.7 1300.8 87.4
Ladakh 6.5 18.3 12.5 35.3 47.3 134.2 56.1 159.1 140.6 398.9
Punjab 991.5 31.7 888.2 28.4 1.2 0.04 2741.4 87.7 5963.6 190.9
Rajasthan 1412.7 17.3 1549.4 18.9 2.5 0.03 4336.7 53.0 9201.3 112.5
Uttar Pradesh 3819.4 16.2 3210.0 13.6 23.8 0.1 9384.7 39.7 18091.7 76.5
Uttarakhand 304.5 25.8 293.0 24.8 4.1 0.3 657.1 55.6 1533.5 129.9
SUB TOTAL NORTH 8572.1 19.7 8231.0 18.9 168.4 0.4 23422.1 53.8 50835.5 116.8
Andaman & Nicobar Islands 12.1 29.9 13.8 34.3 0.1 0.2 132.4 327.9 171.5 424.7
Bihar 1643.0 12.8 848.9 6.6 165.4 1.3 2136.5 16.7 5518.1 43.1
Jharkhand 424.6 10.7 512.5 12.9 64.8 1.6 1741.5 43.9 3138.8 79.1
Odisha 692.0 14.6 782.4 16.5 148.1 3.1 2534.5 53.6 5927.5 125.3
West Bengal 1983.9 19.3 997.4 9.7 544.5 5.3 3007.9 29.3 8489.0 82.6
SUB TOTAL EAST 4755.6 14.9 3155.1 9.9 922.9 2.9 9552.9 30.0 23244.8 73.0
Arunachal Pradesh 23.0 13.4 49.5 28.9 10.5 6.2 171.4 100.2 270.5 158.1
Assam 505.7 14.0 431.9 12.0 120.3 3.3 902.8 25.0 2727.4 75.7
Manipur 48.6 14.5 62.1 18.6 9.1 2.7 109.0 32.6 236.7 70.9
Meghalaya 27.4 7.4 81.3 21.9 14.0 3.8 281.0 75.6 409.2 110.0
Mizoram 29.0 21.8 26.0 19.5 2.5 1.9 68.9 51.7 130.4 98.0
Nagaland 24.8 12.6 31.9 16.2 6.7 3.4 88.9 45.2 162.5 82.6
Sikkim 16.2 23.7 15.8 23.1 10.2 14.9 60.4 88.5 108.1 158.5
Tripura 60.0 14.4 53.7 12.9 19.5 4.7 88.7 21.3 229.8 55.1
SUB TOTAL NORTH EAST 734.6 13.9 752.1 14.2 192.8 3.6 1771.0 33.4 4274.7 80.7
Chhattisgarh 344.2 11.2 604.3 19.6 43.8 1.4 1607.7 52.2 3420.7 111.1
Dadra & Nagar Haveli and Daman & Diu 30.5 34.6 29.9 34.0 0.02 0.02 161.7 183.7 541.6 615.2
Goa 65.3 41.7 145.1 92.6 0.3 0.2 233.4 148.9 555.6 354.5
Gujarat 1185.4 16.7 1860.2 26.2 68.2 1.0 5089.8 71.7 21994.4 309.6
Madhya Pradesh 1137.0 13.2 1461.1 17.0 145.9 1.7 3368.9 39.2 7298.1 84.8
Maharashtra 3088.9 24.0 3014.4 23.4 23.8 0.2 8031.2 62.4 17858.2 138.8
SUB TOTAL WEST 5851.4 18.3 7115.1 22.3 282.0 0.9 18492.8 58.0 51668.6 162.0
Andhra Pradesh 1293.0 23.8 1321.9 24.4 0.7 0.01 3405.3 62.8 7266.1 133.9
Karnataka 1840.7 26.4 2123.9 30.4 41.4 0.6 5574.5 79.9 11121.2 159.4
Kerala 1071.6 30.7 1371.1 39.3 53.1 1.5 1922.6 55.1 5462.0 156.5
Lakshadweep 0.8 12.0 0.0 0.0 0.7 11.0 16.0 234.5 17.7 259.8
Puducherry 47.2 30.1 108.4 69.2 0.0 0.0 211.0 134.7 412.9 263.6
Tamil Nadu 2281.4 27.7 2573.3 31.2 130.4 1.6 4997.9 60.7 12166.5 147.7
Telangana 1027.4 26.5 1199.5 30.9 2.7 0.1 3253.3 83.9 6222.8 160.5
SUB TOTAL SOUTH 7562.1 26.8 8698.1 30.9 229.1 0.8 19380.5 68.8 42669.1 151.5
All India 27475.7 19.5 27951.4 19.9 1795.1 1.3 72619.3 51.6 172692.7 122.7
Table 6.3 : State-wise sales of selected petroleum products : April - March 2021 (P)

PPAC Ready Reckoner
53
(Figures in thousand kilo litres)
State/UT 2016-17 2017-18 2018-19 2019-20 2020-21 (P)Allocn Sales Allocn Sales Allocn Sales Allocn Sales Allocn Sales
Chandigarh 0.0 0.0 0.0 0.0 0.0 0.0 0.0 0.0 0.0 0.0Delhi 0.0 0.0 0.0 0.0 0.0 0.0 0.0 0.0 0.0 0.0Haryana 66.3 35.9 0.0 0.0 0.0 0.0 0.0 0.0 0.0 0.0Himachal Pradesh 18.1 17.9 14.5 14.4 14.5 14.3 11.4 10.8 9.8 6.8Jammu & Kashmir 73.1 67.9 58.5 57.6 58.5 53.9 45.0 40.9 45.0 36.5Ladakh 3.5 1.0 3.5 3.5Punjab 74.3 62.3 0.0 0.0 0.0 0.0 0.0 0.0 0.0 0.0Rajasthan 371.4 355.8 260.0 110.5 138.0 69.3 40.0 16.2 14.2 0.9Uttar Pradesh 1168.2 1167.6 911.2 901.3 887.9 873.5 517.9 449.5 181.7 26.5Uttarakhand 31.7 31.2 25.3 13.3 25.3 10.0 8.0 0.5 2.2 0.4SUB TOTAL NORTH 1803.1 1738.5 1269.5 1097.0 1124.2 1021.0 625.8 518.8 256.4 74.6Andaman & Nicobar Islands 5.2 4.9 4.1 4.0 4.1 3.8 1.9 1.5 0.0 0.0Bihar 710.7 705.3 495.4 490.3 332.6 329.6 263.0 243.9 212.7 212.4Jharkhand 219.7 219.0 186.8 176.3 186.8 150.3 135.2 107.2 90.0 83.2Odisha 292.3 283.0 248.4 244.3 248.4 247.7 210.6 208.3 194.3 190.3West Bengal 788.9 788.3 704.0 653.6 704.0 699.3 704.0 692.7 704.0 696.5SUB TOTAL EAST 2016.8 2000.4 1638.8 1568.5 1476.0 1430.7 1314.8 1253.5 1201.1 1182.4Arunachal Pradesh 9.3 9.1 7.9 7.7 7.9 7.2 6.4 5.2 4.8 3.7Assam 289.2 287.8 245.9 245.0 245.9 242.6 181.9 176.9 155.6 153.1Manipur 21.1 15.2 17.9 18.2 17.9 17.7 13.3 12.7 11.1 11.3Meghalaya 22.9 22.7 19.4 19.4 19.4 19.3 19.3 18.9 18.9 17.9Mizoram 6.0 6.0 4.8 4.8 4.8 4.8 3.6 3.6 3.2 3.2Nagaland 15.1 9.0 12.2 9.5 10.3 9.8 9.3 8.9 8.6 8.4Sikkim 4.3 4.3 3.5 3.4 3.5 3.4 2.6 2.5 2.3 2.1Tripura 34.6 34.5 29.4 29.4 29.4 29.3 26.4 26.2 25.2 25.1SUB TOTAL NORTH EAST 402.4 388.7 340.9 337.4 339.0 334.0 262.7 254.9 229.5 224.8Chhattisgarh 135.4 121.7 115.1 92.7 115.1 91.5 82.4 69.1 58.3 56.1Dadra & Nagar Haveli and Daman & Diu 2.4 2.1 0.4 0.3 0.0 0.0 0.0 0.0 0.0 0.0
Goa 4.6 2.6 2.3 1.4 2.1 1.4 0.8 0.6 0.4 0.4Gujarat 493.0 492.7 344.5 338.2 249.7 248.7 138.8 120.8 84.0 83.1Madhya Pradesh 442.4 427.2 345.0 336.9 336.2 325.9 260.7 238.5 213.4 187.1Maharashtra 563.6 518.0 384.7 377.8 286.7 241.9 106.5 52.9 46.5 21.6SUB TOTAL WEST 1641.4 1564.3 1192.0 1147.2 989.8 909.5 589.3 482.1 402.6 348.2Andhra Pradesh 225.7 191.5 56.4 26.6 0.0 0.0 0.0 0.0 0.0 0.0Karnataka 287.5 260.3 156.0 126.5 156.0 112.5 84.3 66.4 42.5 38.7Kerala 88.3 88.3 58.7 58.7 55.6 55.6 41.7 41.7 37.1 37.1Lakshadweep 0.9 0.9 0.8 0.8 0.8 0.8 0.8 0.6 0.8 0.9Puducherry 3.8 3.8 0.8 0.7 0.0 0.0 0.0 0.0 0.0 0.0Tamil Nadu 307.6 307.6 204.5 204.9 193.8 193.8 145.3 145.3 129.2 129.2Telengana 155.4 133.9 103.4 100.8 97.9 94.3 56.6 29.8 16.0 2.9SUB TOTAL SOUTH 1069.3 986.4 580.6 519.0 504.1 456.9 328.7 283.8 225.5 208.8 All India 6933.0 6678.4 5021.8 4669.2 4433.0 4152.1 3121.3 2793.2 2315.0 2038.8
Table 6.4 : PDS SKO allocation
Allocn= Allocation Source: MoP&NG • Delhi and Chandigarh have been declared kerosene-free from Q3, 2013-14 and Q1, 2016-17 respectively. Punjab and Haryana have been declared kerosene-free from Q1, 2017-18. PDS SKO allocation for Dadra & Nagar Haveli and Daman & Diu PDS SKO allocation has been reduced to “Zero” from Q2, 2017-18. PDS SKO allocation of Puducherry and Andhra Pradesh has been reduced to “Zero” wef 01.09.2017 and 01.10.2017 respectively. PDS SKO allocation for Andaman & Nicobar islands has been reduced to “Zero” effective from 01.09.2019. PDS SKO allocation for the state of Uttar Pradesh and Rajasthan has been reduced to “ZERO” from Q4 of 20-21.• On an all India basis, the drop in allocation in the last five years (till 2020-21) has been 66.6% due to voluntary surrender of PDS SKO allocation by some of the states in addition to nil PDS SKO allocation to the above states. The allocation drop has been steepest in the Northern region (85.8%) followed by Southern region (78.9%), Western region (75.5%), North Eastern region (43.0%) and North Eastern region (40.4%). Allocation during the year 2020-21 also decreased by 25.8% as compared with the allocation in the year 2019-20.

PPAC Ready Reckoner
54
State/UTNumber of Retail Outlets (as on) Number of SKO / LDO agencies (as on)
1.4.2017 1.4.2018 1.4.2019 1.4.2020 1.04.2021 (P) 1.4.2017 1.4.2018 1.4.2019 1.4.2020 1.04.2021 (P)
Chandigarh 41 41 42 42 47 12 12 12 12 12Delhi 396 397 398 398 400 116 116 116 116 111Haryana 2726 2862 2933 3060 3412 141 141 141 141 139Himachal Pradesh 414 432 439 494 563 26 26 26 26 26Jammu and Kashmir 491 500 504 530 552 45 45 45 45 45Ladakh 3 3 3 3 12 2 2 2 2 2Punjab 3380 3427 3453 3551 3772 237 237 237 237 237Rajasthan 4116 4476 4661 4967 5615 250 250 250 250 248Uttar Pradesh 7069 7473 7762 8210 9315 696 696 695 691 675Uttarakhand 570 590 601 629 686 73 73 73 73 69SUB TOTAL NORTH 19206 20201 20796 21884 24374 1598 1598 1597 1593 1564Andaman & Nicobar Islands 12 14 14 16 16 2 2 2 2 2Bihar 2604 2695 2860 2968 3158 372 372 371 371 362Jharkhand 1189 1207 1216 1358 1535 87 87 87 87 87Odisha 1639 1681 1704 1894 2070 177 177 177 177 176West Bengal 2299 2333 2363 2523 2750 458 458 458 457 455SUB TOTAL EAST 7743 7930 8157 8759 9529 1096 1096 1095 1094 1082Arunachal Pradesh 74 85 94 116 152 33 33 33 33 33Assam 828 871 897 979 1104 359 359 359 359 359Manipur 85 97 104 136 160 36 36 36 36 36Meghalaya 198 203 208 225 238 35 35 35 35 35Mizoram 37 41 43 45 55 19 19 19 19 19Nagaland 70 73 79 94 120 19 19 19 19 19Sikkim 50 51 51 55 57 12 12 12 12 12Tripura 68 71 72 79 94 40 40 40 40 40SUB TOTAL NORTH EAST 1410 1492 1548 1729 1980 553 553 553 553 553Chhattisgarh 1176 1249 1280 1462 1808 108 108 108 108 108Dadra & Nagar Haveli and Daman & Diu 63 63 62 61 61 7 7 7 7 7
Goa 115 116 118 118 122 22 22 22 22 22Gujarat 3765 4025 4159 4573 5149 478 476 473 473 470Madhya Pradesh 3528 3711 3832 4230 4981 284 284 284 284 284Maharashtra 5684 5970 6148 6457 7048 767 767 767 766 752SUB TOTAL WEST 14331 15134 15599 16901 19169 1666 1664 1661 1660 1643Andhra Pradesh 3197 3336 3430 3722 4047 413 413 394 394 384Karnataka 4027 4215 4385 4813 5499 323 318 315 315 311Kerala 2048 2100 2140 2238 2396 237 237 237 237 234Lakshadweep 0 0 0 0 0 0 0 0 0 0Puducherry 160 165 165 164 174 8 8 8 8 8Tamil Nadu 5039 5387 5638 5802 6355 466 466 466 465 458Telangana 2434 2625 2767 3077 3571 183 183 202 202 202SUB TOTAL SOUTH 16905 17828 18525 19816 22042 1630 1625 1622 1621 1597All India 59595 62585 64625 69089 77094 6543 6536 6528 6521 6439
Source: Oil companies (Includes dealers of private oil companies)
• On an all India basis the percentage growth in the number of retail outlets from 01.04.2017 to 01.04.2021 has been 29.4%. The region wise growth is highest for the North Eastern region (40.4%), followed by Western region (33.8%), Southern region (30.4%), Northern region (26.9%) and Eastern region (23.1%).
• As many states have become kerosene free in the last five years and due to voluntary surrender of PDS kerosene quota by some others there has been a decline in the number of kerosene dealers in the country.
Table 6.5 : Oil industry retail outlets & SKO / LDO agencies

PPAC Ready Reckoner
55
Category wise SKO/LDO dealers (Total 6439) on 01.04.2021 (P)
Note:(1) SC: Scheduled Caste; ST: Scheduled Tribe; UG: Unemployed Graduate; UEG: Unemployed Engineering Graduate.; PH: Physically Handicapped; DEF: Defence Category; FF: Freedom Fighter; OSP: Outstanding Sports Persons; OBC: Other Backward Classes; PMP: Para Military/Police/Govt. Personnel; Others: Includes Social Worker Category, Dealerships given on compassionate grounds/ under discretionary quota, 2/3 wheeler outlets and Company Owned and Operated outlets, Operation Vijay. (2) SKO/LDO dealers are only PSU OMC dealers.
Particulars IOCL BPCL HPCL RIL/RBML* NEL Shell Others Total
POL terminal/depots (Nos.)$ 118 79 80 18 3 - 6 304
Aviation fuel stations (Nos.)@ 121 61 46 31 - - 1 260
Retail Outlets (total) (Nos.),^ 32,062 18,637 18,634 1,420 6,059 264 18 77,094
out of which Rural ROs (Nos.) 9,915 4,258 4,543 127 1,998 56 3 20,900
SKO/LDO agencies (Nos.) 3,871 930 1,638 - - - - 6,439
LPG distributors (total) (Nos.) (PSUs only) 12,726 6,165 6,192 - - - - 25,083
LPG bottling plants (Nos.) (PSUs only)# 93 53 51 - - - 3 200
LPG bottling capacity (TMTPA) (PSUs only)& 10,244 4,920 5,912 - - - 173 21,249
LPG active domestic consumers (Nos. crore) (PSUs only) 13.6 7.4 7.9 - - - - 28.9
Table 6.6 : Industry marketing infrastructure as on 01.04.2021 (P)
$(Others=4 MRPL & 2 NRL); @(Others=ShellMRPL -1); ̂ (Others=MRPL); #(Others=NRL-1, OIL-1, CPCL-1); &(Others=NRL-30, OIL-23, CPCL-120); *RBML- Reliance BP Mobility Limited
Source: Oil companies
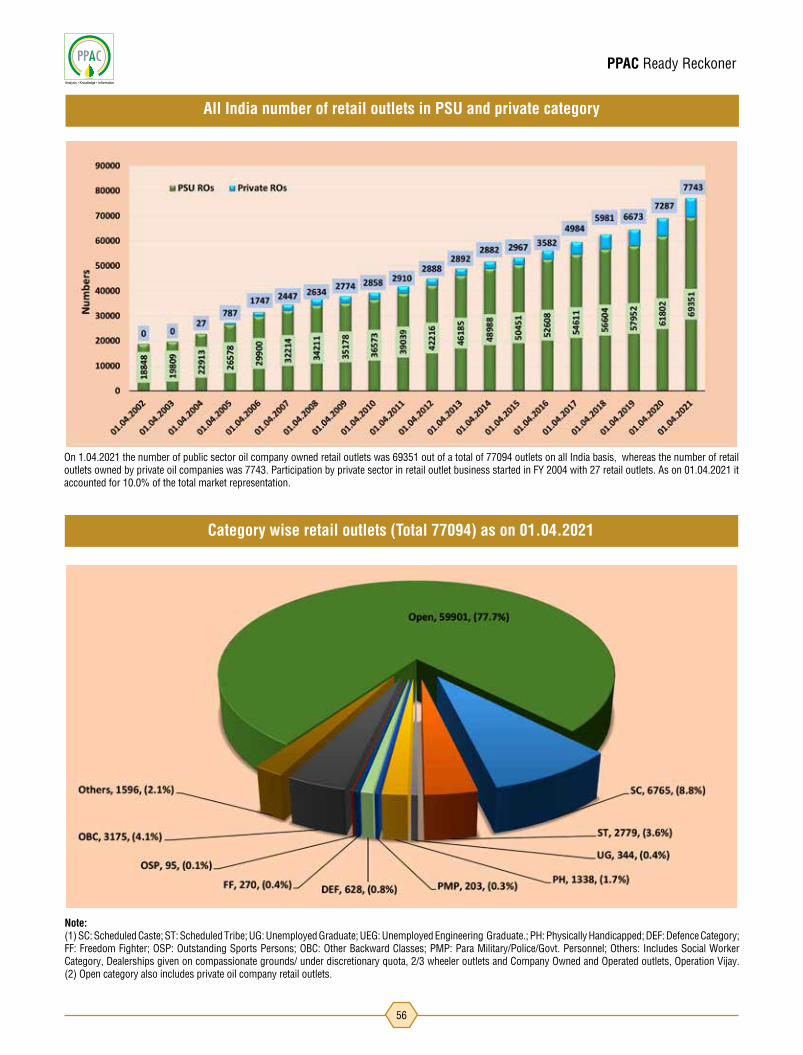
PPAC Ready Reckoner
56
Category wise retail outlets (Total 77094) as on 01.04.2021
On 1.04.2021 the number of public sector oil company owned retail outlets was 69351 out of a total of 77094 outlets on all India basis, whereas the number of retail outlets owned by private oil companies was 7743. Participation by private sector in retail outlet business started in FY 2004 with 27 retail outlets. As on 01.04.2021 it accounted for 10.0% of the total market representation.
All India number of retail outlets in PSU and private category
Note:(1) SC: Scheduled Caste; ST: Scheduled Tribe; UG: Unemployed Graduate; UEG: Unemployed Engineering Graduate.; PH: Physically Handicapped; DEF: Defence Category; FF: Freedom Fighter; OSP: Outstanding Sports Persons; OBC: Other Backward Classes; PMP: Para Military/Police/Govt. Personnel; Others: Includes Social Worker Category, Dealerships given on compassionate grounds/ under discretionary quota, 2/3 wheeler outlets and Company Owned and Operated outlets, Operation Vijay. (2) Open category also includes private oil company retail outlets.

PPAC Ready Reckoner
57
(Thousand metric tonne)
Product 2017-18 2018-19 2019-20 2020-21 (P)
PSU Private Total PSU Private Total PSU Private Total PSU Private Total
LPG 22977 364 23342 24591 316 24907 26126 204 26330 27476 115 27591
MS 24329 1846 26174 25959 2326 28284 27179 2797 29975 25159 2792 27951
Naphtha 5207 7681 12889 5583 8548 14131 6479 7789 14268 6041 8216 14257
ATF 6988 645 7633 7683 617 8300 7598 400 7999 3534 171 3705
SKO 3845 0 3845 3459 0 3459 2397 0 2397 1795 0 1795
HSD 74382 6692 81073 75775 7753 83528 73825 8777 82602 64490 8230 72720
LDO 519 0 519 577 21 598 602 25 628 713 132 845
Lubes 1345 2539 3884 1313 2355 3668 1317 2517 3833 1475 2063 3539
FO/LSHS 5665 1056 6721 5596 968 6564 5172 1129 6302 4925 1070 5995
Bitumen 4883 1202 6086 5683 1024 6708 4995 1725 6720 5356 1762 7118
PetCoke 5176 20480 25657 5770 15576 21346 5634 16074 21708 4419 13872 18291
Others 3422 4922 8343 4189 7534 11723 4381 6984 11365 3954 6871 10825
Total 158739 47427 206166 166178 47038 213216 165704 48422 214127 149337 45295 194632
Table 6.7 : Break-up of consumption data (PSU and Private)
Source: Oil companies, Directorate General of Commercial Intelligence and Statistics (DGCIS) & SEZ data (included from FY 2017-18 onwards). (Oil company sales+Private imports+SEZ sales to DTA=Consumption)Note: Private consumption includes direct imports as well as marketing by private oil companies.
2020-21 (P)
2019-20
• The share of the private sector in total consumption increased during 2020-21(P) by 0.7% as compared to the same period last year. • The share of the private sector during 2020-21(P) increased in MS (0.7%), HSD (0.7%) and Petcoke (1.8%) compared to 2019-20.• This was mainly because of lower de-growth in consumption of MS, HSD and ATF in private sector as compared to growth in PSU.• In the private sector growth has been observed for naphtha (5.5%), LDO (420.8%) and bitumen (2.1%).• In respect of all other products (except MS, HSD, ATF & petcoke) including lubes, bitumen, LDO and naphtha, the private sector share has decreased by -0.2% during
2020-21 (P) as compared to 2019-20.
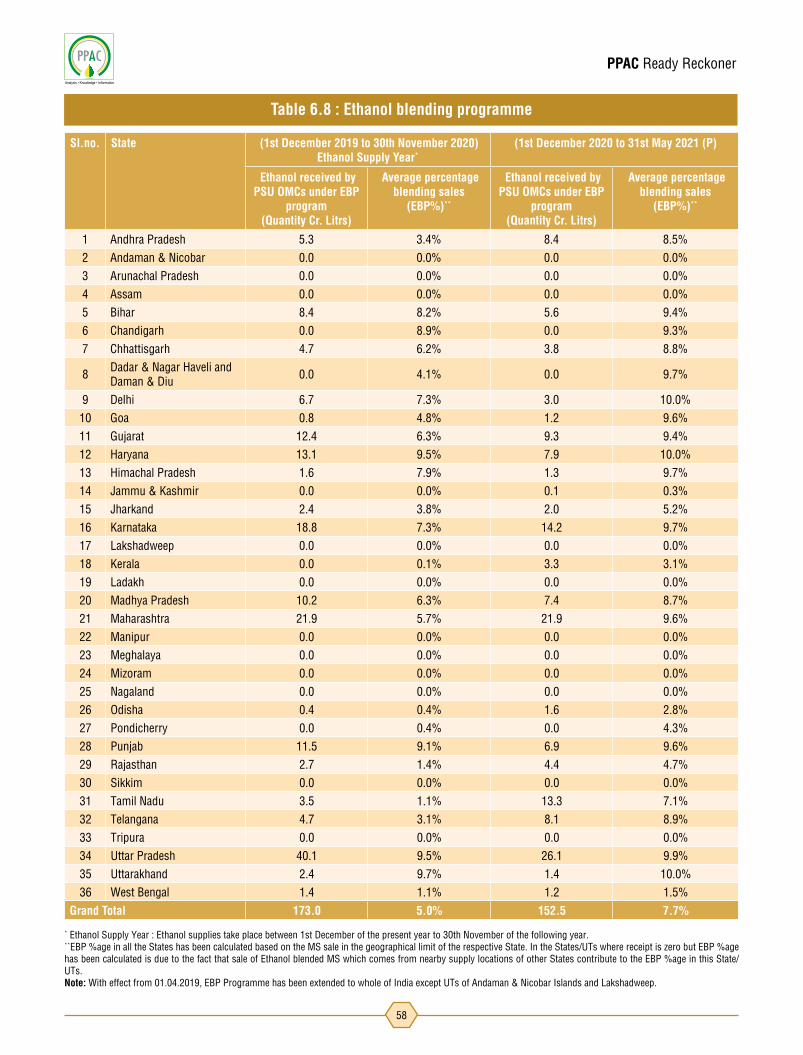
PPAC Ready Reckoner
58
Sl.no. State (1st December 2019 to 30th November 2020) Ethanol Supply Year*
(1st December 2020 to 31st May 2021 (P)
Ethanol received by PSU OMCs under EBP
program (Quantity Cr. Litrs)
Average percentage blending sales
(EBP%)**
Ethanol received by PSU OMCs under EBP
program (Quantity Cr. Litrs)
Average percentage blending sales
(EBP%)**
1 Andhra Pradesh 5.3 3.4% 8.4 8.5%
2 Andaman & Nicobar 0.0 0.0% 0.0 0.0%
3 Arunachal Pradesh 0.0 0.0% 0.0 0.0%
4 Assam 0.0 0.0% 0.0 0.0%
5 Bihar 8.4 8.2% 5.6 9.4%
6 Chandigarh 0.0 8.9% 0.0 9.3%
7 Chhattisgarh 4.7 6.2% 3.8 8.8%
8 Dadar & Nagar Haveli and Daman & Diu 0.0 4.1% 0.0 9.7%
9 Delhi 6.7 7.3% 3.0 10.0%
10 Goa 0.8 4.8% 1.2 9.6%
11 Gujarat 12.4 6.3% 9.3 9.4%
12 Haryana 13.1 9.5% 7.9 10.0%
13 Himachal Pradesh 1.6 7.9% 1.3 9.7%
14 Jammu & Kashmir 0.0 0.0% 0.1 0.3%
15 Jharkand 2.4 3.8% 2.0 5.2%
16 Karnataka 18.8 7.3% 14.2 9.7%
17 Lakshadweep 0.0 0.0% 0.0 0.0%
18 Kerala 0.0 0.1% 3.3 3.1%
19 Ladakh 0.0 0.0% 0.0 0.0%
20 Madhya Pradesh 10.2 6.3% 7.4 8.7%
21 Maharashtra 21.9 5.7% 21.9 9.6%
22 Manipur 0.0 0.0% 0.0 0.0%
23 Meghalaya 0.0 0.0% 0.0 0.0%
24 Mizoram 0.0 0.0% 0.0 0.0%
25 Nagaland 0.0 0.0% 0.0 0.0%
26 Odisha 0.4 0.4% 1.6 2.8%
27 Pondicherry 0.0 0.4% 0.0 4.3%
28 Punjab 11.5 9.1% 6.9 9.6%
29 Rajasthan 2.7 1.4% 4.4 4.7%
30 Sikkim 0.0 0.0% 0.0 0.0%
31 Tamil Nadu 3.5 1.1% 13.3 7.1%
32 Telangana 4.7 3.1% 8.1 8.9%
33 Tripura 0.0 0.0% 0.0 0.0%
34 Uttar Pradesh 40.1 9.5% 26.1 9.9%
35 Uttarakhand 2.4 9.7% 1.4 10.0%
36 West Bengal 1.4 1.1% 1.2 1.5%
Grand Total 173.0 5.0% 152.5 7.7%
Table 6.8 : Ethanol blending programme
* Ethanol Supply Year : Ethanol supplies take place between 1st December of the present year to 30th November of the following year.**EBP %age in all the States has been calculated based on the MS sale in the geographical limit of the respective State. In the States/UTs where receipt is zero but EBP %age has been calculated is due to the fact that sale of Ethanol blended MS which comes from nearby supply locations of other States contribute to the EBP %age in this State/UTs. Note: With effect from 01.04.2019, EBP Programme has been extended to whole of India except UTs of Andaman & Nicobar Islands and Lakshadweep.

PPAC Ready Reckoner
59
POL consumption by product
Distribution of total domestic POL sales in India
Million metric tonne


PPAC Ready Reckoner
62
Source: Source: Oil companies & Directorate General of Commercial Intelligence and Statistics (DGCIS) Note:1. Data in respect of enrolment, customers, distributors, ALDS and rated bottling capacity pertain to PSU OMCs only. 2. Gross tankage includes LPG tankage at LPG bottling plants owned by PSU oil companies, all refineries, fractionators and LPG import terminals.3. MOPNG vide letter no. P-20019/2/2016-LPG dated 23 June 2016 had issued unified guidelines for selection of LPG distributors. In the said guidelines, LPG
distributor categories have been redefined. The historical data on LPG distributors has been rearranged in line with the new classification for comparison.4. The methodology used by PSU OMCs for estimating LPG Coverage is under review.
Particulars 2015-16 2016-17 2017-18 2018-19 2019-20 2020-21 (P)
(Thousand metric tonne )
LPG production 10568 11253 12364 12786 12823 12072 LPG consumption 19623 21608 23342 24907 26330 27591 PSU sales 19134 21179 22977 24591 26126 27476 of which:
Domestic 17182 18871 20352 21728 23076 25117 Non-Domestic 1464 1776 2086 2364 2614 1885 Bulk 317 364 355 318 263 355 Auto LPG 171 167 184 180 172 118
Imports 8959 11097 11379 13235 14809 16527 of which:
PSU imports 8470 10668 11015 12919 14605 16412 Private imports 489 429 364 316 204 115
(Lakh) Enrolment (domestic) 204.5 331.7 284.7 455.1 161.1 85.8
As on 1.4.2016 1.4.2017 1.4.2018 1.4.2019 1.4.2020 1.4.2021LPG active domestic customers 1,663 1,988 2,243 2,654 2,787 2,895 PMUY beneficiaries - 200 356 719 802 800 Non-domestic customers 23.3 25.3 27.9 30.2 32.4 33.9
(Percent) LPG coverage (Estimated) 61.9 72.8 80.9 94.3 97.5 99.8
(Nos.) LPG distributors 17916 18786 20146 23737 24670 25083 of which:
Shehri Vitrak 7492 7677 7821 7908 7914 7899 Rurban Vitrak 2852 3152 3463 3626 3671 3697 Gramin & Durgam Kshetriya Vitrak 7572 7957 8862 12203 13085 13487
Auto LPG dispensing stations (ALDS) 676 675 672 661 657 651 (Thousand metric tonne per annum)
Bottling capacity (rated) 15172 16264 17395 18338 20292 21249 (Thousand metric tonne)
Gross tankage 869 878 912 929 978 994
Table 7.1 : LPG marketing at a glance

PPAC Ready Reckoner
63
(Number in lakhs)
State/UT No. of households Census 2011
Estimated households as on 1.04.2021
Active connections as on 1.04.2021
LPG coverage (%)
Chandigarh 2.35 2.76 2.82 102.1%Delhi 33.41 40.55 50.53 124.6%Haryana 47.18 56.65 72.11 127.3%Himachal Pradesh 14.77 16.69 20.53 123.0%Jammu & Kashmir 20.15 24.95 33.27 133.4%Punjab 54.10 61.68 88.51 143.5%Rajasthan 125.81 152.83 167.03 109.3%Uttar Pradesh 329.24 396.30 423.19 106.8%Uttarakhand 19.97 23.76 27.87 117.3%Sub Total North 646.98 776.16 885.85 114.1%Arunachal Pradesh 2.62 3.30 2.84 86.1%Assam 63.67 74.65 73.69 98.7%Manipur 5.07 6.02 5.93 98.5%Meghalaya 5.38 6.90 3.32 48.2%Mizoram 2.21 2.73 3.21 117.4%Nagaland 4.00 3.98 2.81 70.6%Sikkim 1.28 1.45 1.60 110.3%Tripura 8.43 9.69 7.59 78.4%Sub Total North East 92.66 108.72 100.99 92.9%Andaman & Nicobar Islands 0.93 1.00 1.17 116.9%Bihar 189.41 237.92 186.49 78.4%Jharkhand 61.82 75.78 57.67 76.1%Odisha 96.61 110.25 88.87 80.6%West Bengal 200.67 228.60 228.19 99.8%Sub Total East 549.44 653.54 562.38 86.1%Chhattisgarh 56.23 69.04 53.21 77.1%Dadra & Nagar Haveli 0.73 1.14 0.94 82.6%Daman & Diu 0.60 0.93 0.68 73.3%Goa 3.23 3.49 5.19 148.5%Gujarat 121.82 145.52 108.95 74.9%Madhya Pradesh 149.68 180.31 153.73 85.3%Maharashtra 238.31 276.75 287.57 103.9%Sub Total West 570.59 677.20 610.27 90.1%Andhra Pradesh 126.04 140.02 142.89 102.0%Karnataka 131.80 152.53 167.03 109.5%Kerala 77.16 80.98 91.00 112.4%Lakshadweep 0.11 0.11 0.10 88.5%Puducherry 3.01 3.87 3.81 98.4%Tamil Nadu 184.93 214.02 216.87 101.3%Telangana 84.21 93.55 113.64 121.5%Sub Total South 607.26 685.07 735.34 107.3%All India 2466.93 2900.68 2894.83 99.8%
Table 7.2: LPG coverage (estimated) as on 01.04.2021 (P)
Source: PSU OMCs (IOCL, BPCL and HPCL)Note: The methodology used by PSU OMCs for estimating LPG Coverage is under review.

PPAC Ready Reckoner
64
(Number in lakhs)
State/UT Number of BPL households
Chandigarh 0.00Delhi 0.76Haryana 7.27Himachal Pradesh 1.36J & K + LADAKH 12.41Punjab 12.20Rajasthan 63.60Uttar Pradesh 147.33Uttarakhand 4.03Sub Total North 248.96Arunachal Pradesh 0.45Assam 34.74Manipur 1.56Meghalaya 1.51Mizoram 0.28Nagaland 0.54Sikkim 0.09Tripura 2.72Sub Total North East 41.88Andaman & Nicobar Islands 0.13Bihar 85.24Jharkhand 32.59Odisha 47.37West Bengal 88.39Sub Total East 253.70Chhattisgarh 29.89Dadra & Nagar Haveli 0.15Daman & Diu 0.00Goa 0.01Gujarat 28.99Madhya Pradesh 71.44Maharashtra 44.20Sub Total West 174.68Andhra Pradesh 3.92Karnataka 31.43Kerala 2.56Lakshadweep 0.00Puducherry 0.14Tamil Nadu 32.38Telangana 10.71Sub Total South 81.14All India 800.36
Table 7.3: BPL households covered under PMUY Scheme as on 01.04.2021 (P)
Source: PSU OMCs (IOCL, BPCL and HPCL) “BPL households covered” refer to those households where subscription vouchers have been issued.
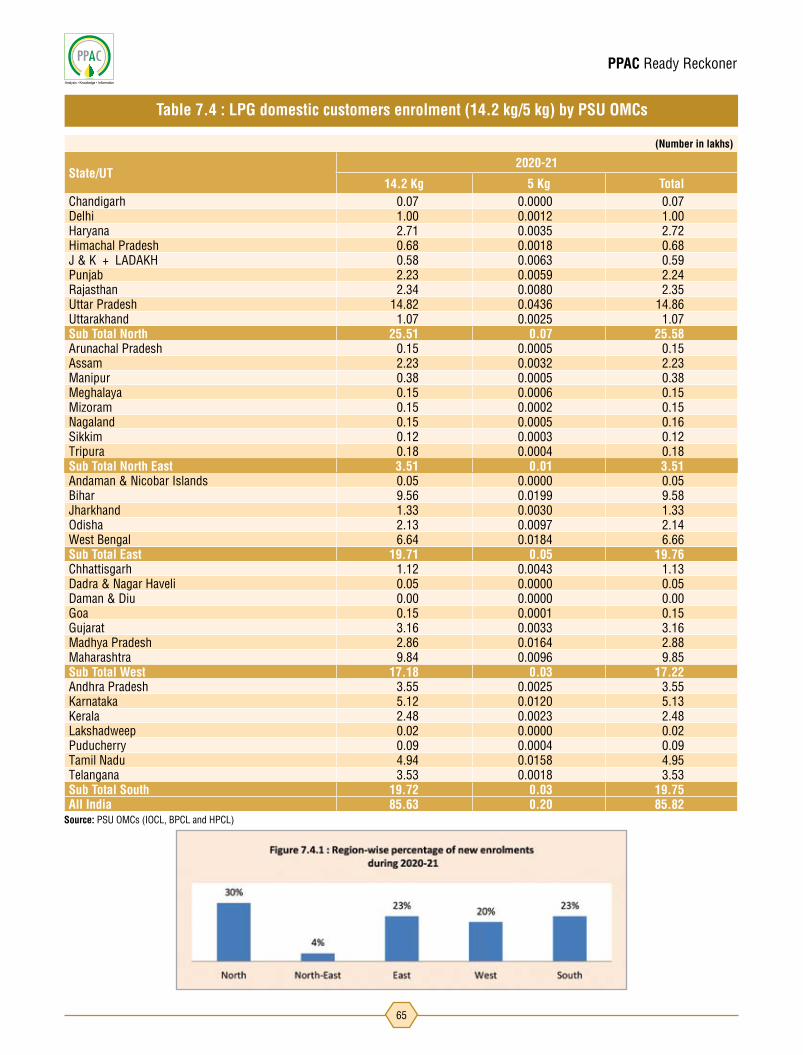
PPAC Ready Reckoner
65
(Number in lakhs)
State/UT2020-21
14.2 Kg 5 Kg TotalChandigarh 0.07 0.0000 0.07Delhi 1.00 0.0012 1.00Haryana 2.71 0.0035 2.72Himachal Pradesh 0.68 0.0018 0.68J & K + LADAKH 0.58 0.0063 0.59Punjab 2.23 0.0059 2.24Rajasthan 2.34 0.0080 2.35Uttar Pradesh 14.82 0.0436 14.86Uttarakhand 1.07 0.0025 1.07Sub Total North 25.51 0.07 25.58Arunachal Pradesh 0.15 0.0005 0.15Assam 2.23 0.0032 2.23Manipur 0.38 0.0005 0.38Meghalaya 0.15 0.0006 0.15Mizoram 0.15 0.0002 0.15Nagaland 0.15 0.0005 0.16Sikkim 0.12 0.0003 0.12Tripura 0.18 0.0004 0.18Sub Total North East 3.51 0.01 3.51Andaman & Nicobar Islands 0.05 0.0000 0.05Bihar 9.56 0.0199 9.58Jharkhand 1.33 0.0030 1.33Odisha 2.13 0.0097 2.14West Bengal 6.64 0.0184 6.66Sub Total East 19.71 0.05 19.76Chhattisgarh 1.12 0.0043 1.13Dadra & Nagar Haveli 0.05 0.0000 0.05Daman & Diu 0.00 0.0000 0.00Goa 0.15 0.0001 0.15Gujarat 3.16 0.0033 3.16Madhya Pradesh 2.86 0.0164 2.88Maharashtra 9.84 0.0096 9.85Sub Total West 17.18 0.03 17.22Andhra Pradesh 3.55 0.0025 3.55Karnataka 5.12 0.0120 5.13Kerala 2.48 0.0023 2.48Lakshadweep 0.02 0.0000 0.02Puducherry 0.09 0.0004 0.09Tamil Nadu 4.94 0.0158 4.95Telangana 3.53 0.0018 3.53Sub Total South 19.72 0.03 19.75All India 85.63 0.20 85.82
Table 7.4 : LPG domestic customers enrolment (14.2 kg/5 kg) by PSU OMCs
Source: PSU OMCs (IOCL, BPCL and HPCL)

PPAC Ready Reckoner
66
(Nos.)
State/UT Sheheri Vitrak Rurban Vitrak Gramin Vitrak Durgam Kshetriya Vitrak Total
Chandigarh 26 0 0 0 26Delhi 321 0 0 0 321Haryana 281 101 232 9 623Himachal Pradesh 69 13 93 31 206J & K + Ladakh 130 43 75 39 287Punjab 334 252 242 29 857Rajasthan 438 162 652 133 1385Uttar Pradesh 1004 705 2229 188 4126Uttarakhand 114 106 60 34 314Sub Total North 2717 1382 3583 463 8145Arunachal Pradesh 6 6 30 43 85Assam 128 104 305 53 590Manipur 15 13 35 38 101Meghalaya 22 9 18 15 64Mizoram 11 6 26 16 59Nagaland 15 11 17 40 83Sikkim 9 1 11 5 26Tripura 18 9 38 12 77Sub Total North-East 224 159 480 222 1085Andaman & Nicobar Islands 0 4 4 1 9Bihar 240 251 1453 49 1993Jharkhand 163 50 323 36 572Odisha 173 99 549 134 955West Bengal 399 163 909 58 1529Sub Total East 975 567 3238 278 5058Chhattisgarh 105 75 164 190 534Dadra & Nagar Haveli 2 1 0 0 3Daman & Diu 3 0 0 0 3Goa 44 4 6 1 55Gujarat 418 118 440 30 1006Madhya Pradesh 470 212 415 431 1528Maharashtra 1002 190 817 197 2206Sub Total West 2044 600 1842 849 5335Andhra Pradesh 317 241 397 107 1062Karnataka 534 141 512 74 1261Kerala 226 132 308 25 691Lakshadweep 1 0 0 0 1Puducherry 15 10 3 0 28Tamil Nadu 567 362 586 117 1632Telangana 279 103 336 67 785Sub Total South 1939 989 2142 390 5460All India 7899 3697 11285 2202 25083
Table 7.5 : Number of LPG distributors as on 01.04.2021 (New Scheme)
Source: PSU OMCs (IOCL, BPCL and HPCL) Note: MOPNG vide letter no. P-20019/2/2016-LPG dated 23 June 2016 has issued unified guidelines for selection of LPG distributors. In the said guidelines, LPG distributor categories have been redefined as above.
PPAC Ready Reckoner
67

PPAC Ready Reckoner
68
Year Indian basket ($/bbl)
2002-03 26.60
2003-04 27.98
2004-05 39.21
2005-06 55.72
2006-07 62.46
2007-08 79.25
2008-09 83.57
2009-10 69.76
2010-11 85.09
2011-12 111.89
2012-13 107.97
2013-14 105.52
2014-15 84.16
2015-16 46.17
2016-17 47.56
2017-18 56.43
2018-19 69.88
2019-20 60.47
2020-21 44.82
2021-22 (upto 31.05.2021) 65.03
2021 : Month wise
January 54.79
February 61.22
March 64.73
April 63.40
May 66.95
June 71.98
July 73.54
Table 8.1 : Price of crude oil & petroleum products in the international market
Note: The Indian basket of crude oil for the year 2020-21 & subsequent period is calculated based on a weightage of 75.62% for the price of sour grades of crude oil (average of Oman & Dubai) and 24.38% sweet grade of crude oil (Brent Dated).The percentages of 75.62 and 24.38 was based on the ratio of low sulphur and high sulphur crude oil processed (indigenous and imported) by all the Indian refineries (PSU and Pvt.) during the previous financial year i.e. 2019-20.

PPAC Ready Reckoner
69
Trend in spreads of petroleum products vs Indian basket of crude oil
Trend in spreads of international benchmark crude oils

PPAC Ready Reckoner
70
Elements Unit As on 1.06.2021
Price before taxes and dealers’ commission `/litre 34.93
Add : Dealers’ commission `/litre 2.64
Add : GST (incl GST on dealers’ commission) `/litre 1.88
Retail selling price `/litre 39.45
Table 8.2 : Price build-up of PDS kerosene at Mumbai
Table 8.3 : Price build-up of domestic LPG at Delhi
Elements Unit As on 1.06.2021
Price before taxes and distributors’ commission `/14.2 kg cylinder 708.63
Add : Distributors’ commission `/14.2 kg cylinder 61.84
Add : GST (including GST on Distributors’ Commission) `/14.2 kg cylinder 38.53
Retail selling price `/14.2 kg cylinder 809.00
Elements Unit As on 1.06.2021
Price charged to dealers (excluding excise duty and VAT) `/litre 35.99
Add : Excise duty `/litre 32.90
Add : Dealers' commission (average) R`/litre 3.79
Add : VAT (including VAT on dealers' commission) `/litre 21.81
Retail selling price `/litre 94.49
Table 8.4 : Price build-up of petrol at Delhi
-As per IOCL.
Elements Unit As on 1.06.2021
Price charged to dealers (excluding excise duty and VAT) `/litre 38.49
Add : Excise duty `/litre 31.80
Add : Dealers' commission (average) `/litre 2.59
Add : VAT (including VAT on dealer's commission) `/litre 12.50
Retail selling price `/litre 85.38
Table 8.5 : Price build-up of diesel at Delhi
-As per IOCL.
`/litre
Particulars Petrol DieselBasic duty 1.40 1.80 Additional excise duty (Road & Infrastructure Cess) 18.00 18.00 Special additional excise duty 11.00 8.00 Agriculture Infrastructure and Development Cess 2.50 4.00 Total excise duty 32.90 31.80
Table 8.6 : Break up of Central excise duty on petrol & diesel as on 01.06.2021

PPAC Ready Reckoner
71
Particulars `/litre Share in RSP (%)
Price before taxes and dealers' commission 34.93 88.5%
Customs duty - -GST (Including GST on dealers' commission) 1.88 -Total taxes 1.88 4.8%
Dealers' commission 2.64 6.7%
Retail selling price 39.45 100.0%
Table 8.7 : Share of taxes in retail selling price of PDS kerosene as on 1.06.2021 at Mumbai
Particulars `/14.2 kg cylinder
Share in RSP (%)
Price before taxes and distributors' commission 708.63 87.6%
Customs duty - -GST (including GST on distributors' commission) 38.53 -Total taxes 38.53 4.8%
Distributors' commission 61.84 7.6%
Retail selling price 809.00 100.0%
Table 8.8 : Share of taxes in retail selling price of domestic LPG as on 1.06.2021 at Delhi
Share of taxes in retail selling price of petroleum products
Product Weight in %
Crude Petroleum 1.95
Natural Gas 0.46
High Speed Diesel (HSD) 3.10
Petrol 1.60
Naphtha 0.87
Furnace Oil (FO) 0.67
LPG 0.64
Aviation Turbine Fuel (ATF) 0.32
Lube Oils 0.29
Bitumen 0.23
Kerosene 0.19
Petroleum Coke 0.05
Total 10.37
Table 8.9 : Weightage of crude oil, natural gas and petroleum products in Wholesale Price Index (WPI)
Source: Website of Office of the Economic Adviser, Ministry of Commerce & Industry

PPAC Ready Reckoner
72
Effective date Petrol Diesel
As on 1-Apr-04 707.00 425.00
21-Jun-05 778.00 467.00
01-Aug-05 848.00 509.00
01-Mar-07 894.00 529.00
16-May-07 1024.00 600.00
23-May-08 1052.00 631.00
27-Oct-09 1125.00 673.00
07-Sep-10 1218.00 757.00
01-Jul-11 1499.00 912.00
27-Oct-12 1794.00 1089.00
21-Dec-13 ` 1390.15/KL + 0.883% of product billable price 1186.00
23-Oct-14 ` 1499.37/KL + 0.887% of product billable price ` 1116.09/KL + 0.290% of product billable price
01-Aug-15 ` 1749.86/KL + 0.883% of product billable price ` 1301.70/KL + 0.286% of product billable price
16-Nov-15 ` 1750.08/KL + 0.883% of product billable price ` 1301.88/KL + 0.286% of product billable price
01-Jun-16 ` 1750.29/KL + 0.883% of product billable price ` 1302.06/KL + 0.286% of product billable price
05-Oct-16 ` 1868.14/KL + 0.875% of product billable price ` 1389.35/KL + 0.280% of product billable price
16-Nov-16 ` 2006.33/KL + 0.875% of product billable price ` 1491.72/KL + 0.280% of product billable price
01-Apr-17 ` 2020.38/KL + 0.859% of product billable price ` 1502.13/KL + 0.267% of product billable price
01-Jul-17 ` 2025.97/KL + 0.859% of product billable price ` 1506.81/KL + 0.267% of product billable price
01-Aug-17 ` 2674.74/KL + 0.859% of product billable price ` 2031.38/KL + 0.257% of product billable price
19-Feb-19 ` 2637.80/KL + 0.859% of product billable price ` 2000.60/KL + 0.257% of product billable price
Dealers’ / Distributors’ commission on petroleum productsTable 8.10 : Dealers’ commission on petrol & diesel
(`/KL)
Note: In addition to above, effective 1st August 2017, slab based incentive is also given to eligible dealers through credit notes.
(`/KL)
Effective date With form XV Other than form XV
As on 01-Apr-04 204.00 161.00
01-Mar-07 243.00 200.00
24-May-08 255.00 212.00
07-Jul-09 263.00 220.00
07-Sep-10 275.00 232.00
28-Dec-12 438.24 377.73
21-Oct-14 536.09 475.58
05-Feb-16 714.18 649.16
28-Oct-16 787.82 723.87
05-Sep-17 1008.83 928.10
04-Oct-18 1016.37 1005.95
22-Feb-19 1341.88 1230.98
Table 8.11 : Wholesale dealers’ commission on PDS kerosene

PPAC Ready Reckoner
73
(`/cylinder)
Effective date 14.2 KG cyl. Additional commission for sale at market determined price (`/14.2 KG cyl.) 5 KG cyl.
As on 01-April-04 16.71 NA 8.60
01-Mar-07 19.05 NA 9.81
04-Jun-08 20.54 NA 10.58
30-Jun-09 21.94 NA 11.30
01-Jul-11 25.83 NA 13.30
07-Oct-12 37.25 0.75 18.63
11-Dec-13 40.71 0.75 20.36
23-Oct-14 44.06 0.82 22.03
09-Dec-15 45.83 0.26 22.67
01-Jan-16 45.83 0.33 22.67
01-Feb-16 45.83 0.22 22.67
01-Mar-16 45.83 0.13 22.67
01-May-16 45.83 0.15 22.67
01-Jun-16 45.83 0.18 22.67
01-Jul-16 45.83 0.16 22.67
01-Aug-16 45.83 0.09 22.67
01-Sep-16 45.83 0.06 22.67
01-Oct-16 45.83 0.09 22.67
28-Oct-16 47.48 0.09 23.74
01-Nov-16 47.48 0.14 23.74
01-Dec-16 47.48 0.21 23.74
01-Feb-17 47.48 0.30 23.74
01-Mar-17 47.48 0.43 23.74
01-Apr-17 47.48 0.40 23.74
01-May-17 47.48 0.27 23.74
01-Jun-17 47.48 0.15 23.74
01-Jul-17 47.48 0.13 23.74
01-Aug-17 47.48 0.06 23.74
01-Sep-17 47.48 0.16 23.74
30-Sep-17 48.89 0.16 24.20
01-Oct-17 48.89 0.23 24.20
01-Nov-17 48.89 0.36 24.20
01-Jan-18 48.89 0.35 24.20
Table 8.12: Distributors’ commission on domestic LPG

PPAC Ready Reckoner
74
Source: MoP&NG circulars & OMCs
Indian rupees (`)/ litre/ 14.2 kg cyl.
Country Kerosene Domestic LPG
India (Delhi) 39.45# 809.00**
Pakistan 37.80 947.88
Bangladesh 56.64 593.90
Sri Lanka 25.86 626.55
Nepal (Kathmandu) 67.02 885.13
Table 8.13 : Retail selling price of major petroleum products in India & neighbouring countries
# at Mumbai effective 1.06.2021 for PDS Kerosene , **Non subsidised Domestic LPG effective 1.06.2021Note - Prices for neighboring countries as available on their respective website as on 1.06.2021.Sources:Websites: Pakistan- Pakistan State Oil (www.psopk.com) and Oil and Gas Regulatory Authority (www.ogra.org.pk); Bangladesh- Bangladesh Petroleum Corporation (www.bpc.gov.bd); Nepal- Nepal Oil Corporation (www.nepaloil.com.np); Sri Lanka- Petrol, Diesel & Kerosene- Ceylon Petroleum Corporation (www.ceypetco.gov.in); LPG- Litro Gas Lanka (www.litrogas.com); Exchange rate - www.oanda.com
01-Feb-18 48.89 0.34 24.20
01-Mar-18 48.89 0.28 24.20
01-Apr-18 48.89 0.23 24.20
01-Jun-18 48.89 0.29 24.20
01-Jul-18 48.89 0.36 24.20
01-Aug-18 48.89 0.42 24.20
01-Sep-18 48.89 0.46 24.20
01-Oct-18 48.89 0.54 24.20
01-Nov-18 48.89 0.63 24.20
07-Nov-18 50.58 0.63 25.29
01-Dec-18 50.58 0.45 25.29
01-Jan-19 50.58 0.28 25.29
01-Feb-19 50.58 0.24 25.29
01-Mar-19 50.58 0.30 25.29
01-Apr-19 50.58 0.31 25.29
01-Jun-19 50.58 0.35 25.29
01-Jul-19 50.58 0.21 25.29
01-Aug-19 56.20 - 28.10
01-Sep-19 59.02 - 29.51
01-Oct-19 61.84 - 30.92
(`/cylinder)
Effective date 14.2 KG cyl. Additional commission for sale at market determined price (`/14.2 KG cyl.) 5 KG cyl.
Table 8.12 : Continued

PPAC Ready Reckoner
75
State/Union Territory CityPetrol Diesel Domestic LPG
(`/14.2 KG Cylinder)
(`/litre) Non subsidized
Andaman & Nicobar Islands Port Blair 79.30 79.72 885.00Andhra Pradesh Vizag 99.42 93.73 817.50Arunachal Pradesh Itanagar 87.71 82.49 875.00Assam Guwahati 90.20 85.23 858.00Bihar Patna 96.64 90.66 907.50Chandigarh Chandigarh 90.89 85.04 818.50Chhattisgarh Raipur 92.76 92.38 880.50Dadra & Nagar Haveli Silvasa 90.13 90.56 824.00Daman & Diu Daman 90.02 90.45 819.00Delhi New Delhi 94.49 85.38 809.00Goa Panjim 92.39 90.11 823.00Gujarat Gandhinagar 91.68 92.13 835.00Haryana Ambala 91.78 85.46 827.00Himachal Pradesh Shimla 92.12 84.57 853.50Jammu & Kashmir Srinagar 97.67 89.03 925.00Jharkhand Ranchi 91.04 90.15 866.50Karnataka Bengaluru 97.64 90.51 812.00Kerala Thiruvananthapuram 96.47 91.74 818.50Ladakh Leh 100.12 92.02 1046.50Madhya Pradesh Bhopal 102.61 93.89 815.00Maharashtra Mumbai 100.72 92.69 809.00Manipur Imphal 98.45 89.11 961.00Meghalaya Shillong 90.03 84.21 876.50Mizoram Aizawl 91.61 84.57 961.00Nagaland Kohima 94.19 88.25 828.50Odisha Bhubaneswar 95.22 93.03 835.50Puducherry Puducherry 94.70 88.90 821.50Punjab Jullunder 95.65 87.38 839.00Rajasthan Jaipur 101.02 94.19 813.00Sikkim Gangtok 95.35 87.65 962.00Tamil Nadu Chennai 95.99 90.12 825.00Telangana Hyderabad 98.20 93.08 861.50Tripura Agartala 94.75 89.05 970.00Uttar Pradesh Lucknow 91.83 85.77 847.00Uttarakhand Dehradun 92.44 86.06 828.50West Bengal Kolkata 94.50 88.23 835.50
Table 8.14 : Retail selling price of petroleum products at State capitals / UTs as on 01.06.2021
Source: IOCL
Source: OMCsNote: The allocation of PDS kerosene in Delhi is nil presently.
Highest Lowest
State City (`/litre)
Maharashtra Mumbai 39.45
Tamil Nadu Chennai 15.00
West Bengal Kolkata 41.93
Table 8.15 : Retail selling price of PDS kerosene at major cities as on 01.06.2021

PPAC Ready Reckoner
76
Table 8.16 : Customs, excise duty and GST rates on petroleum products as on 01.06.2021
Particulars
Customs duty Central excise duty
Basic customs duty
Additional customs duty (CVD)
Additional customs
duty
Basic cenvat duty
Special additional excise duty
Additional excise duty (Road and
Infrastructure Cess)
Additional excise duty (Agriculture
Infrastructure & Development
Cess)
Crude oil Rs.1/MT + Rs. 50/MT as NCCD Rs.1/MT -
Rs.1/MT+ Cess @ 20% +Rs.50/
MT as NCCD- - -
Petrol 2.50%Rs.1.40/ltr. +
Rs.11.00/ ltr SAD + Rs.2.50/ ltr AIDC
Rs.18.00/ltr. Rs.1.40/ltr Rs.11.00/ltr Rs.18.00/ltr. Rs.2.50/ltr.
Petrol (branded) 2.50%Rs.2.60/ltr. +
Rs.11.00/ ltr SAD + Rs.2.50/ ltr AIDC
Rs.18.00/ltr. Rs.2.60/ltr Rs.11.00/ltr Rs.18.00/ltr. Rs.2.50/ltr.
High speed diesel 2.50%Rs.1.80/ltr. +
Rs.8.00/ ltr SAD + Rs.4.00/ ltr AIDC
Rs.18.00/ltr. Rs.1.80/ltr Rs.8.00/ltr Rs.18.00/ltr. Rs.4.00/ltr.
High speed diesel (branded) 2.50%Rs.4.20/ltr. +
Rs.8.00/ ltr SAD + Rs.4.00/ ltr AIDC
Rs.18.00/ltr. Rs.4.20/ltr Rs.8.00/ltr Rs.18.00/ltr. Rs.4.00/ltr.
Aviation Turbine Fuel (ATF) (note-2) 5.00% 11% - 11% - - -
Liquefied Natural Gas (LNG) 2.50% Nil - Nil - - -
Natural gas [gaseous state] 5.00% Nil - Nil - - -
Natural gas [compressed] 5.00% 14.00% - 14.00% - - -
Customs duty and Excise duty (Petroleum products on which GST is not levied)
ParticularsCustoms
GSTBasic Customs Duty CVD (in lieu of IGST)
LPGDomestic (Note-3) Nil 5.00% 5.00%
Non - Domestic 5.00% 18.00% 18.00%
KerosenePDS Nil 5.00% 5.00%
Non PDS 5.00% 18.00% 18.00%
NaphthaFertilizer Nil 18.00% 18.00%
Non- Fertilizer 2.50% 18.00% 18.00%
Butane / Propane Domestic Nil 5.00% 5.00%
Non - Domestic 2.50% 18.00% 18.00%
Bitumen & Asphalt 5.00% 18.00% 18.00%
Furnace OilFertilizer Nil 18.00% 18.00%
Non- Fertilizer 5.00% 18.00% 18.00%
Light Diesel Oil 5.00% 18.00% 18.00%
Low Sulphur Heavy Stock/ HPS & other ResidueFertilizer Nil 18.00% 18.00%
Non- Fertilizer 5.00% 18.00% 18.00%
Lube oil/greases 5.00% 18.00% 18.00%
Petroleum Coke 10.00% 18.00% 18.00%
Petroleum Jelly 5.00% 18.00% 18.00%
Transformer Oil 5.00% 18.00% 18.00%
Waxes all types 5.00% 18.00% 18.00%
Customs duty and GST rates (Petroleum products on which GST is levied)
Note: 1. In addition to the above , 10% Social Welfare Surcharge is also applicable on the total duties of Customs . However, where CVD is payable in lieu of IGST, social welfare surcharge is not applicable on the amount of CVD.
2. In case of ATF, Basic Excise Duty /Additional Customs Duty (CVD) is 2% in place of 11%, for supply to scheduled commuter airlines (SCA) from the regional connectivity scheme (RCS) airports.3. Basic Customs duty is Nil for import of domestic LPG sold to household consumers (including non domestic exempted category) by PSU OMCs. Basic Customs duty rate is 5% for other importers
of domestic LPG

PPAC Ready Reckoner
77
Note: 1. As per details provided by IOCL/HPCL2. For petrol & diesel, VAT/Sales Tax at applicable rates is also levied on dealer’s commission in Arunachal Pradesh, Delhi, Gujarat, Haryana, Madhya Pradesh, Punjab, Rajasthan,
Chandigarh, Puducherry, Andaman & Nikobar, Meghalaya , Dadar Nagar Haveli and Daman & Diu.
Sl.no. State/Union TerritoryPetrol Diesel PDS kerosene Domestic
LPG
Sales Tax /VAT GST
1 Andaman & Nicobar Islands 6% 6%
5% 5%
2 Andhra Pradesh 31% VAT + Rs.4/litre VAT+Rs.1/litre Road Development Cess and Vat thereon
22.25% VAT + Rs.4/litre VAT+Rs.1/litre Road Development Cess and Vat thereon
3 Arunachal Pradesh 20.00% 12.50%
4 Assam 32.66% or Rs.22.63 per litre whichever is higher as VAT minus Rebate of Rs.5 per Litre
23.66% or Rs.17.45 per litre whichever is higher as VAT minus Rebate of Rs.5 per Litre
5 Bihar 26% or Rs 16.65/Litre whichever is higher (30% Surcharge on VAT as irrecoverable tax)
19% or Rs 12.33/Litre whichever is higher (30% Surcharge on VAT as irrecoverable tax)
6 Chandigarh Rs.10/KL cess +22.45% or Rs.12.58/Litre whichever is higher
Rs.10/KL cess + 14.02% or Rs.7.63/Litre whichever is higher
7 Chhattisgarh 25% VAT + Rs.2/litre VAT 25% VAT + Rs.1/litre VAT
8 Dadra & Nagar Haveli and Daman & Diu 20% VAT 20% VAT
9 Delhi 30% VAT Rs.250/KL air ambience charges + 16.75% VAT
10 Goa 27% VAT + 0.5% Green cess 23% VAT + 0.5% Green cess
11 Gujarat 20.1% VAT+ 4% Cess on Town Rate & VAT 20.2% VAT + 4 % Cess on Town Rate & VAT
12 Haryana 25% or Rs.15.62/litre whichever is higher as VAT+5% additional tax on VAT
16.40% VAT or Rs.10.08/litre whichever is higher as VAT+5% additional tax on VAT
13 Himachal Pradesh 25% or Rs 15.50/Litre- whichever is higher 14% or Rs 9.00/Litre- whichever is higher
14 Jammu & Kashmir 24% MST+ Rs.5/Litre employment cess, Reduction of Rs.0.50/Litre 16% MST+ Rs.1.50/Litre employment cess
15 Jharkhand 22% on the sale price or Rs. 17.00 per litre , which ever is higher + Cess of Rs 1.00 per Ltr
22% on the sale price or Rs. 12.50 per litre , which ever is higher + Cess of Rs 1.00 per Ltr
16 Karnataka 35% sales tax 24% sales tax
17 Kerala 30.08% sales tax+ Rs.1/litre additional sales tax + 1% cess
22.76% sales tax+ Rs.1/litre additional sales tax + 1% cess
18 Ladakh 24% MST+ Rs.5/Litre employment cess, Reduction of Rs.2.5/Litre
16% MST+ Rs.1/Litre employment cess , Reduction of Rs.0.50/Litre
19 Lakshadweep Nil Nil
20 Madhya Pradesh 33 % VAT + Rs.4.5/litre VAT+1%Cess 23% VAT+ Rs.3/litre VAT+1% Cess
21 Maharashtra – Mumbai, Thane & Navi Mumbai 26% VAT+ Rs.10.12/Litre additional tax 24% VAT+ Rs.3.00/Litre additional tax
22 Maharashtra (Rest of State) 25% VAT+ Rs.10.12/Litre additional tax 21% VAT+ Rs.3.00/Litre additional tax
23 Manipur 36.50% VAT 22.50% VAT
24 Meghalaya 20% or Rs15.00/Litre- whichever is higher (Rs.0.10/Litre pollution surcharge)
12% or Rs9.00/Litre- whichever is higher (Rs.0.10/Litre pollution surcharge)
25 Mizoram 25% VAT 14.5% VAT
26 Nagaland 25% VAT or Rs. 16.04/litre whichever is higher +5% surcharge + Rs.2.00/Litre as road maintenance cess
16.50% VAT or Rs. 10.51/litre whichever is higher +5% surcharge + Rs.2.00/Litre as road
maintenance cess 27 Odisha 32% VAT 28% VAT
28 Puducherry 26% VAT 17.75% VAT
29 Punjab
Rs.2050/KL (cess)+ Rs.0.10 per Litre (Urban Transport Fund) + 0.25 per Litre (Special
Infrastructure Development Fee)+24.79% VAT+10% additional tax on VAT
Rs.1050/KL (cess) + Rs.0.10 per Litre (Urban Transport Fund) +0.25 per Litre (Special
Infrastructure Development Fee) + 15.94% VAT+10% additional tax on VAT
30 Rajasthan 36% VAT+Rs 1500/KL road development cess 26% VAT+ Rs.1750/KL road development cess
31 Sikkim 25.25% VAT+ Rs.3000/KL cess 14.75% VAT + Rs.2500/KL cess
32 Tamil Nadu 15% + Rs.13.02 per litre 11% + Rs.9.62 per litre
33 Telangana 35.20% VAT 27% VAT
34 Tripura 25% VAT+ 3% Tripura Road Development Cess 16.50% VAT+ 3% Tripura Road Development Cess
35 Uttar Pradesh 26.80% or Rs 18.74/Litre whichever is higher 17.48% or Rs 10.41/Litre whichever is higher
36 Uttarakhand 25% or Rs 19 Per Ltr whichever is greater 17.48% or Rs Rs 10.41 Per Ltr whichever is greater
37 West Bengal
25% or Rs.13.12/litre whichever is higher as sales tax+ Rs.1000/KL cess- Rs.17/KL exemption – Rs
1000/KL sales tax rebate (20% Additional tax on VAT as irrecoverable tax)
17% or Rs.7.70/litre whichever is higher as sales tax + Rs 1000/KL cess – Rs 1000/KL
sales tax rebate (20% Additional tax on VAT as irrecoverable tax)
Table 8.17 : Actual rate of Sales Tax/ VAT/GST and other taxes levied by State/UT Governments on major petroleum products as on 01.06.2021

PPAC Ready Reckoner
78
(` Crore)
Particulars 2017-18 2018-19 2019-20 2020-21 (P)
1. Contribution to Central exchequer
A. Tax/ duties on crude oil & petroleum products
Cess on crude oil 14514 17741 14789 10676
Royalty on crude oil / natural gas 4747 6062 5602 3590
Customs duty 11171 16035 22927 13512
NCCD on Crude Oil 968 1180 1130 1016
Excise duty 229716 214369 223057 371726
Service tax 1228 340 17 0
IGST 9211 16479 13099 11594
CGST 4488 7437 6831 6158
Others 125 204 88 365
Sub total (A) 276168 279847 287540 418637
B. Dividend to Government/ income tax etc.
Corporate/ income tax 33599 38561 23134 21909
Dividend income to Central Government 14575 15525 12270 10393
Dividend distribution tax 5981 6415 5462 0
Profit petroleum on exploration of oil/ gas* 5839 7694 5909 2873
Sub total (B) 59994 68194 46775 35174
Total contribution to Central exchequer (A+B) 336163 348041 334315 453812
2. Contribution to State exchequer
C. Tax/ duties on crude oil & petroleum products
Royalty on crude oil / natural gas 9370 13371 11882 7179
Sales tax/ VAT 185850 201265 200493 202937
SGST/UTGST 4974 7961 7345 6121
Octroi/ duties (incl. electricity duty) 1663 685 716 706
Entry tax / others 4745 4114 405 329
Sub total (C) 206601 227396 220841 217271
D. Dividend to Government/ direct tax etc.
Dividend income to State Government 262 195 215 379
Sub total (D) 262 195 215 379
Total contribution to State exchequer (C+D) 206863 227591 221056 217650
Total contribution of petroleum sector to exchequer (1+2) 543026 575632 555370 671461
Table 8.18 : Contribution of petroleum sector to exchequer
* as provided by MOP&NG. (P)- Provisional Note: Totals may not tally due to round off
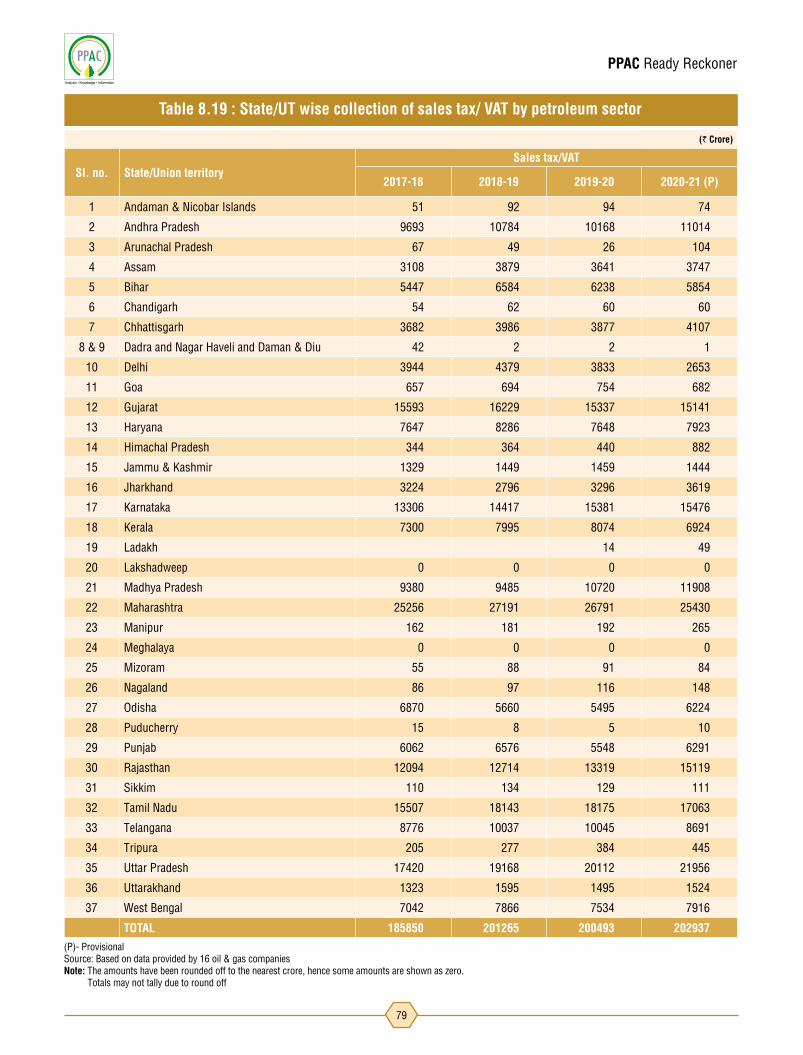
PPAC Ready Reckoner
79
(` Crore)
Sl. no. State/Union territorySales tax/VAT
2017-18 2018-19 2019-20 2020-21 (P)
1 Andaman & Nicobar Islands 51 92 94 74
2 Andhra Pradesh 9693 10784 10168 11014
3 Arunachal Pradesh 67 49 26 104
4 Assam 3108 3879 3641 3747
5 Bihar 5447 6584 6238 5854
6 Chandigarh 54 62 60 60
7 Chhattisgarh 3682 3986 3877 4107
8 & 9 Dadra and Nagar Haveli and Daman & Diu 42 2 2 1
10 Delhi 3944 4379 3833 2653
11 Goa 657 694 754 682
12 Gujarat 15593 16229 15337 15141
13 Haryana 7647 8286 7648 7923
14 Himachal Pradesh 344 364 440 882
15 Jammu & Kashmir 1329 1449 1459 1444
16 Jharkhand 3224 2796 3296 3619
17 Karnataka 13306 14417 15381 15476
18 Kerala 7300 7995 8074 6924
19 Ladakh 14 49
20 Lakshadweep 0 0 0 0
21 Madhya Pradesh 9380 9485 10720 11908
22 Maharashtra 25256 27191 26791 25430
23 Manipur 162 181 192 265
24 Meghalaya 0 0 0 0
25 Mizoram 55 88 91 84
26 Nagaland 86 97 116 148
27 Odisha 6870 5660 5495 6224
28 Puducherry 15 8 5 10
29 Punjab 6062 6576 5548 6291
30 Rajasthan 12094 12714 13319 15119
31 Sikkim 110 134 129 111
32 Tamil Nadu 15507 18143 18175 17063
33 Telangana 8776 10037 10045 8691
34 Tripura 205 277 384 445
35 Uttar Pradesh 17420 19168 20112 21956
36 Uttarakhand 1323 1595 1495 1524
37 West Bengal 7042 7866 7534 7916
TOTAL 185850 201265 200493 202937
Table 8.19 : State/UT wise collection of sales tax/ VAT by petroleum sector
(P)- Provisional Source: Based on data provided by 16 oil & gas companies Note: The amounts have been rounded off to the nearest crore, hence some amounts are shown as zero. Totals may not tally due to round off

PPAC Ready Reckoner
80
(` Crore)
Sl. no. State/Union territory/Others 2017-18 2018-19 2019-20 2020-21 (P)
States/UTs
1 Andaman & Nicobar Islands 1 0 0 0
2 Andhra Pradesh 172 257 156 112
3 Arunachal Pradesh 1 6 0 0
4 Assam 116 559 475 332
5 Bihar 91 159 145 122
6 Chandigarh 1 1 1 1
7 Chhattisgarh 39 18 9 14
8 & 9 Dadra and Nagar Haveli and Daman & Diu 10 12 20 20
10 Delhi 114 52 51 37
11 Goa 5 3 9 11
12 Gujarat 1022 2060 1801 1566
13 Haryana 379 659 685 529
14 Himachal Pradesh 15 3 4 6
15 Jammu & Kashmir 38 20 17 40
16 Jharkhand 57 13 16 12
17 Karnataka 329 356 269 260
18 Kerala 136 146 171 136
19 Ladakh 1 1
20 Lakshadweep 0 0 0 0
21 Madhya Pradesh 73 87 98 68
22 Maharashtra 797 1272 1126 932
23 Manipur 2 1 1 2
24 Meghalaya 0 1 0 0
25 Mizoram 1 1 1 0
26 Nagaland 1 1 1 0
27 Odisha 52 93 192 195
28 Puducherry 2 1 1 1
29 Punjab 157 116 128 43
30 Rajasthan 88 205 176 145
31 Sikkim 3 2 0 0
32 Tamil Nadu 517 642 562 439
33 Telangana 88 19 21 22
34 Tripura 6 20 17 38
35 Uttar Pradesh 362 616 619 603
36 Uttarakhand 20 6 7 8
37 West Bengal 272 545 553 418
Others
1 Other territory (Offshore areas of India beyond 12 Nautical Miles) 8 11 11 7
TOTAL 4974 7961 7345 6121
Table 8.20 : State/UT wise collection of SGST/UTGST by petroleum sector
(P)- Provisional Source: Based on data provided by 16 oil & gas companies Note: As the amounts have been rounded off to the nearest crore, hence some amounts are shown as zero. Totals may not tally due to round off Since GST was implemented w.e.f 01.07.2017, data for 2017-18 is for a period of nine months

PPAC Ready Reckoner
81
(` Crore)
Companies 2017-18 2018-19 2019-20 2020-21 (P)
PSU upstream/midstream companies
ONGC 19945 26765 13464 11246
OIL 2668 2590 2584 1742
GAIL 4618 6026 6621 4890
Total 27231 35380 22668 17878
PSU downstream Oil Marketing Companies (OMCs)
IOCL 21346 16894 1313 21836
BPCL 7919 7132 2683 19042
HPCL 6357 6029 2637 10664
Total 35622 30055 6634 51542
PSU stand alone refineries
MRPL 2224 332 (2740) (240)
CPCL 913 (213) (2078) 238
NRL 2044 1968 1381 3036
Total 5181 2087 (3437) 3033
PSU consultancy company
EIL 378 370 430 260
Total 378 370 430 260
Private sector companies
RIL 33612 35163 30903 31944
NEL 532 344 1485 *
Total 34144 35507 32388 31944
Table 8.21 : Profit After Tax (PAT) of oil companies
(P)- Provisional* details not provided.Source: Published results/ information provided by oil companies.Note: Financials are on standalone basis.

PPAC Ready Reckoner
82
2019-20
Particulars IOCL BPCL HPCL ONGC OIL GAIL MRPL CPCL NRL
(` Crore)
Sales turnover 562088 326393 286250 95701 11761 71730 60728 48624 14072
Profit Before Interest and Tax (PBIT) 2285 4853 2654 23698 2619 8052 (3213) (2603) 1737
Interest 5979 2182 1082 3310 499 109 745 413 2
Tax (5007) (12) (1065) 6924 (464) 1323 (1217) (938) 353
Profit After Tax (PAT) 1313 2683 2637 13464 2584 6621 (2740) (2078) 1381
Net worth 93769 33214 28962 193095 24387 41854 7767 1192 5304
Borrowings (loan fund) 116545 41875 43021 13949 8885 5257 11896 8698 74
Ratios
PAT as % of turnover (net sales) 0.23% 0.82% 0.92% 14.07% 21.97% 9.23% -4.51% -4.27% 9.82%
Debt (loan fund) to equity ratio 1.24 1.26 1.49 0.07 0.36 0.13 1.53 7.30 0.01
Earnings Per Share (EPS) 1.43 13.64 17.31 10.70 23.83 14.68 (15.64) (139.52) 18.78
Table 8.22 : Financial details of oil companies
(P) - ProvisionalSource: Published results/ Information provided by oil companies.
2020-21 (P)
Particulars IOCL BPCL HPCL ONGC OIL GAIL MRPL CPCL NRL
(` Crore)
Sales turnover 510546 300830 269243 67891 8410 56529 50974 41814 18542
Profit Before Interest and Tax (PBIT) 32810 23946 15162 18617 1222 6542 7 1652 4092
Interest 3094 1328 915 2215 499 156 352 375 9
Tax 7880 3576 3583 5156 (1019) 1496 (105) 1039 1047
Profit After Tax (PAT) 21836 19042 10664 11246 1742 4890 (240) 238 3036
Net worth 110500 54545 36186 204559 26211 46611 7528 1425 5596
Borrowings (loan fund) 102327 26315 40009 15023 15718 5991 16225 9167 0
Ratios
PAT as % of turnover (net sales) 4.28% 6.33% 3.96% 16.57% 20.71% 8.65% -0.47% 0.57% 16.37%
Debt (loan fund) to equity ratio 0.93 0.48 1.11 0.07 0.60 0.13 2.16 6.43 0.00
Earnings Per Share (EPS) 23.78 96.44 70.57 8.94 16.06 10.85 (1.37) 15.95 41.27

PPAC Ready Reckoner
83
Table 8.23 : Total subsidy/under-recovery on petroleum products & natural gas
(` Crore)
Particulars 2017-18 2018-19 2019-20 2020-21 (P)
Petrol 0 0 0 0
Diesel 0 0 0 0
PDS kerosene 4672 5950 1833 0
Domestic LPG 0 0 0 0
Total under-recoveries (A) 4672 5950 1833 0
Direct Benefit Transfer for LPG (DBTL) subsidy 20880 31447 22635 3559
Project Management Expenditure (PME)* 25 92 91 99
Total DBTL related subsidies (B) 20905 31539 22726 3658
Pradhan Mantri Ujjwala Yojana (PMUY) claims 2496 5636 1403 (34)
Project Management Expenditure (PME) & Information Education and Communication (IEC) expenditure under PMUY* 63 34 43 110
Total PMUY related subsidy (C) 2559 5670 1446 76
Direct Benefit Transfer of Kerosene (DBTK) subsidy (D) 113 98 42 0
PMGKY (E) 0 0 0 8162
Natural gas subsidy for North East 435 557 574 336
Other subsidies (F) 435 557 574 336
Total subsidy/ under-recovery on petroleum products & natural gas (A+B+C+D+E+F) 28684 43814 26621 12231
(P)- Provisional *on payment basis. Note: DBTK subsidy excludes cash incentive/assistance for establishment of institutional mechanism for direct transfer of subsidy paid to States/UTs. DBTK subsidy for 2019-20 is till October 2019.
Table 8.24 : Quantity and value of Indian crude oil imports
Year Quantity (MMT) Quantity (Million Bbl) $ Million ` Crore $/bbl (approx)
2017-18 220.4 1615.5 87,803 5,66,450 54.3
2018-19 226.5 1660.2 1,11,915 7,83,183 67.4
2019-20 227.0 1663.9 1,01,376 7,17,001 60.9
2020-21 (P) 198.1 1452.1 62,711 4,62,996 43.2
(P)- provisional Conversion factor taken 1 MT = 7.33 bbl


PPAC Ready Reckoner
86
Table 9.1 : Average international Calorific Values of different fuels
Table 9.3 : Volume conversion
Table 9.4 : Contents of LPG & Natural Gas
Conversion factors
Table 9.2 : Weight to volume conversion
A. Oil products M Cals/tonne or K Cal/Kg
NGL* 12135
Kerosene 10638
Motor Gasoline 11135
Fuel Oil 10440
B. Natural gas production (average) - India 8000-9480 K cal/SCM
C. India M Cals/tonne or K Cal/Kg
Charcoal 6900
Hard coal 5000
Firewood 4750
Lignite-Brown coal 2310
1 US Bbl. 159 Litres
1 US Gallon 3.78 Litres
1 Kilo Litre (KL) 6.29 Bbl.
1 US Bbl. 42 Gallons
1 MBD (million barrels per day) 50 MMTPA
Natural Gas Contains 60-95 % Methane
LPG Contains Propane (40%) & Butane (60%)
Product Weight (MT)
Volume (KL)
Bbl To convert volume at 29.5° C to volume at 15°C multiply by
Petrol 1 1.4110 8.88 0.9830
Diesel 1 1.2100 7.61 0.9879
Kerosene 1 1.2850 8.08 0.9864
ATF 1 1.2880 8.10 0.9862
Light Diesel Oil 1 1.1720 7.37 0.9877
Furnace Oil 1 1.0424 6.74 0.9899
Crude Oil 1 1.1700 7.33
Source : Indian Petroleum & Natural Gas Statistics, MOP&NG Conversion factor : 1 K Cal = 4.19 K Joules, *NGL : Natural Gas Liquids.
Note: Petrol and Diesel are as per BS-IV norms

PPAC Ready Reckoner
87
Source : GAIL (India) Ltd./ PPAC
Table 9.5 : Natural gas conversions
Table 9.6 : Major end use of petroleum products
1 SCM (Standard Cubic Meter) = 1 cubic metre @ 1 atmosphere pressure and 15.56 oC
1 Cubic Metre = 35.31 Cubic feet
1 BCM(Billion Cubic Metre) / Year of gas
= 2.74 MMSCMD 365 days a year
1 TCF (Trillion Cubic Feet) of Gas Reserve
= 3.88 MMSCMD 100% recoverable for 20 years @ 365 days / annum)
1 MMTPA of LNG = 3.60 MMSCMD Molecular weight of 18 @ 365 days/annum)
1 MT of LNG = 1314 SCM Molecular weight of 18
Gross Calorific Value (GCV) = 10000 Kcal/ SCM
Net Calorific Value (NCV) = 90% of GCV
1 Million BTU (MMBTU) = 25.2 SCM @10000 Kcal/SCM; 1 MMBTU= 252,000 Kcal)
Specific Gravity of Gas = 0.62 Molecular weight of dry air=28.964 gm/mole)
Density of Gas = 0.76 Kg/SCM Molecular weight of gas 18 gm/mol
Gas required for 1 MW of Power generation
= 4541 SCM per day Station Heat Rate (SHR);~1720 Kcal/Kwh-NCV (50% Thermal Efficiency); Natural Gas GCV-@10000Kcal/SCM
Power Generation from 1 MMSCMD Gas
= 220 MWH Station Heat Rate (SHR);~1720 Kcal/Kwh-NCV (50% Thermal Efficiency); Natural Gas GCV-@10000Kcal/SCM
Product Major end use
LPG Domestic and auto fuel. Also for industrial application where technically essential. Now permittes as auto fuel.
Naphtha Feedstock/fuel for fertiliser units, feedstock for petrochemical sector and fuel for power plants.
MS Fuel for passenger cars, taxies, two & three wheelers.
ATF Fuel for aircrafts.
SKO Fuel for cooking & lighting.
HSD Fuel for transport sector (railways/road), agriculture (tractors, pumpsets, threshers, etc.) and captive power generation.
LDO Fuel for agricultural pumpsets, small industrial units, start up fuel for power generation.
FO/LSHS Secondary fuel for thermal power plants, fuel/feedstock for fertiliser plants, industrial units.
Bitumen Surfacing of roads.
Lubes Lubrication for automotive and industrial applications.
Petrloleum coke Fuel grade petcoke is used as fuel for cement kilns and electric power plants. Calcined petcoke is used in manufacturing aluminium, graphite electrode, steel, titanium dioxide and other carbon consuming industries.
Other products (Benzene, Toluene, MTO, LABFS, CBFS, Paraffin wax etc.)
Feedstock for value added products.
PPAC Ready Reckoner
88
List of Abbreviations
BBL Barrel MMT Million Metric Tonne
BCM Billion Cubic Meter MMTPA Million Metric Tonne Per Annum
BPCL Bharat Petroleum Corporation Limited MoA Ministry of Agriculture
BPRL Bharat Petro Resources Limited MoC&I Ministry of Commerce & Industry
CBM Coal Bed Methane MoF Ministry of Finance
CBR Cauvery Basin Refinery MoP&NG Ministry of Petroleum & Natural Gas
CGD City Gas Distribution MoSPI Ministry of Statistics and Programme Implementation
CNG Compressed Natural Gas MRPL Mangalore Refinery and Petrochemicals Limited
DBTL Direct Benefit Transfer for LPG Mtoe Million tonnes of oil equivalent,
DGCIS Directorate General of Commercial Intelligence and Statistics NELP New Exploration Licensing Policy
DGH Directorate General of Hydrocarbons NGLs Natural Gas Liquids
DSF Discovered Small Field NRL Numaligarh Refinery Limited
EBP Ethanol Blending Programe OALP Open Acreage Licensing Policy
FBIL Financial Benchmark India Private Limited OECD Organisation for Economic Co-operation and Development
GA Geographical Areas OIL Oil India Limited
GAIL Gas Authority of India Limited OMCs Oil Marketing Companies
GREP Gas Rehabilitation and Expansion Project ONGC Oil and Natural Gas Corporation Limited
GRM Gross Refining Margins OPEC Organization of the Petroleum Exporting Countries
GSPL Gujarat State Petronet Limited PDS Public Distribution System
GST Goods & Service Tax PMUY Pradhan Mantri Ujjwala Yojana
HELP Hydrocarbon Exploration and Licensing Policy PNG Piped Natural Gas
HPCL Hindustan Petroleum Corporation Limited POL Petroleum, Oil and Lubricants
IEA International Energy Agency PPAC Petroleum Planning & Analysis Cell
IOCL Indian Oil Corporation Limited PSC Production Sharing Contracts
KL Kilo Litre PSU Public Sector Undertaking
LNG Liquified Natural Gas R/P ratio Reserves-to-production ratio
LPG Liquified Petroleum Gas RBI Reserve Bank of India
MBN MBTU/Bbl/NRGF SEZ Special Economic Zone
MBTU Thousand British Thermal Unit TCF Trillion cubic feet
MMBTU Metric Million British Thermal Unit Toe Tonnes of oil equivalent
MMSCMD Million Standard Cubic Meter Per Day WPI Wholesale Price Index

PPAC Ready Reckoner
89
Notes

PPAC Ready Reckoner
90
Notes