power and energy management of grid/pemfc/battery
TRANSCRIPT
1
Power and energy management of
grid/PEMFC/battery/supercapacitor hybrid power sources
for UPS applications
Yuedong Zhan a, *, Youguang Guo b, Jianguo Zhu b and Li Li a
a Department of Automation, Kunming University of Science and Technology
Kunming, 650500, China
b School of Electrical, Mechanical and Mechatronic Systems, University of
Technology, Sydney
PO Box 123, Broadway, NSW 2007, Australia
(Emails: [email protected], [email protected], [email protected])
*Corresponding author: Tel.: +86 871 5623806; Fax: +86 871 5916643, Email
address: [email protected] (Yuedong Zhan)
ABSTRACT
This paper presents a hybrid power and energy source supplied by a proton exchange
membrane fuel cell (PEMFC) as the main power source in an uninterruptible power
supply (UPS) system. To prevent the PEMFC from fuel starvation and degradation and
realize their seamless linking in the hybrid UPS system, the power and energy are
balanced by the battery and/or supercapacitor (SC) as two alternative auxiliary power
sources. Based on the modeling and sizing of hybrid power and energy components, the
power and energy management strategies and efficiency measurements of four
operating modes in UPS system are proposed. To evaluate the proposed strategies, an
2
experimental setup is implemented by a data acquisition system, a PEMFC generating
system, and an UPS system including AC/DC rectifier, DC/AC inverter, DC/DC
converter, AC/DC recharger and its intelligent control unit. Experimental results with
the characteristics of a 300W self-humidified air-breathing of PEMFC, 3-cell 12V/5Ah
of batteries, and two 16-cell 120F/2.7V of SCs in parallel corroborate the excellent
management strategies in the four operating modes of UPS system, which provides the
basis for the optimal design of the UPS system with hybrid PEMFC/battery/SC power
sources.
Keywords: Power and energy management; Proton exchange membrane fuel cell
(PEMFC); Lead-acid battery; Supercapacitor (SC); Uninterruptible power supply (UPS)
system
1. Introduction
An uninterruptible power supply (UPS) system based on traditional batteries only is
hard to provide sufficient backup power to critical loads, especially when relatively long
time supply is necessary. Other energy sources and storage technologies, such as a
proton exchange membrane fuel cells (PEMFC) and liquid-fed direct methanol fuel cell
(DMFC), have been investigated to replace the batteries. Since the PEMFCs can
provide electrical power with high energy density, high efficiency and no pollution,
they are considered as a promising technology for UPS products. Hence, compared with
other energy storage devices, such as battery and supercapacitor (SC), the PEMFCs can
offer longer continuous run-time of 24 hours and greater durability in harsh outdoor
environments under a wide range of temperature conditions. Compared with
conventional internal combustion generators, the PEMFCs are quieter and have low or
zero emissions depending on fuel source. Because the PEMFCs are modular, UPS
systems using them can be more readily sized to fit a wider variety of sites than those
3
using conventional generators [1].
The PEMFCs are emerging as an economically viable option for providing UPS
systems, which play a very important role as the backup and emergency power supply
for important applications, particularly for computers, medical/life support systems,
communication systems, office equipment, hospital instruments, industrial controls and
integrated data center to supply uninterruptible and reliable power with constant voltage
and frequency in case of power failure [2, 3]. For instance, US Department of Energy
(DOE) funded 18 fuel cell (FC) backup power systems at 10 installation sites will help
accelerate the deployment of clean technology at Federal government facilities and
provide valuable data and feedback for FCs [4].
When the utility grid power source is interrupted, the hydrogen will be supplied to the
PEMFCs stack in a UPS system. One of the main weak points of the PEMFCs, however,
is slow dynamic characteristics administrated by the fuel transport system, such as the
air and water pumps, control valves, pressure devices, mass flow devices, and a
hydrogen reformer. During the start-up of PEMFCs stack, or a sudden change of
external load, the hydrogen cannot be fed in time, and the stack may take a few seconds
to reach the required output voltage. As a result, fast load demand for the PEMFCs will
lead to a high voltage drop in a short time, which is recognized as a fuel starvation and
causes the degradation of FC. So, to overcome this issue, a PEMFC should be used as
the main power source in the UPS and vehicles applications. And at least a rechargeable
battery or a SC must be employed as an auxiliary power source to improve the
performance and prevent the PEMFC stack from degradation when the external loads
demand a high energy in a short time. It should ensure the enough fuel and battery/SC
capacity for providing the power needed by the external load [5].
4
The power control and energy management of hybrid power sources have already been
studied recently. For instant, Thounthong et al. [6] proposed a perfect energy source
supplied by a PEMFC as the main power source and storage devices: battery and SC,
for modern distributed generation system, particularly for future fuel cell vehicle
applications. Zhang et al. [7] proposed a seamless transfer control strategy by using a
power management unit, which was suitable for FC-UPS. García et al. [8] presented a
comparative study performed in order to select the most suitable control strategy for
high-power electric vehicles powered by FC, battery and SC, in which each energy
source uses a DC/DC converter to control the source power and adapt the output voltage
to the common DC bus voltage, from where the vehicle loads are supplied. Torreglosa
et al. [9] evaluated a hybrid power-train based on FC, battery and SC for a tramway,
which currently operates in the city of Zaragoza, Spain. Kyriakarakos et al. [10, 11]
presented an agent system for the multi-generation micro-grid topology which also
included the fuzzy logic and gray prediction algorithms for better management
respectively. Feroldi et al. [12] presented an energy management strategy for a
sustainable hybrid system, which is based on wind-solar energy and bioethanol.
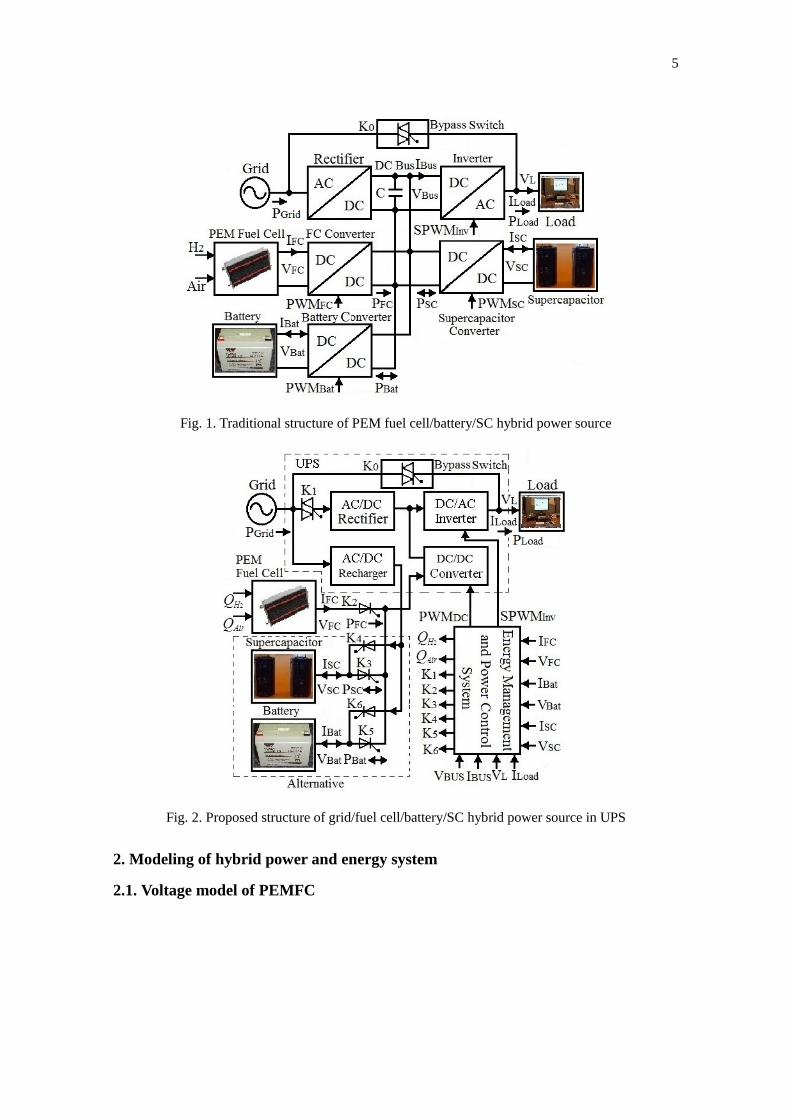
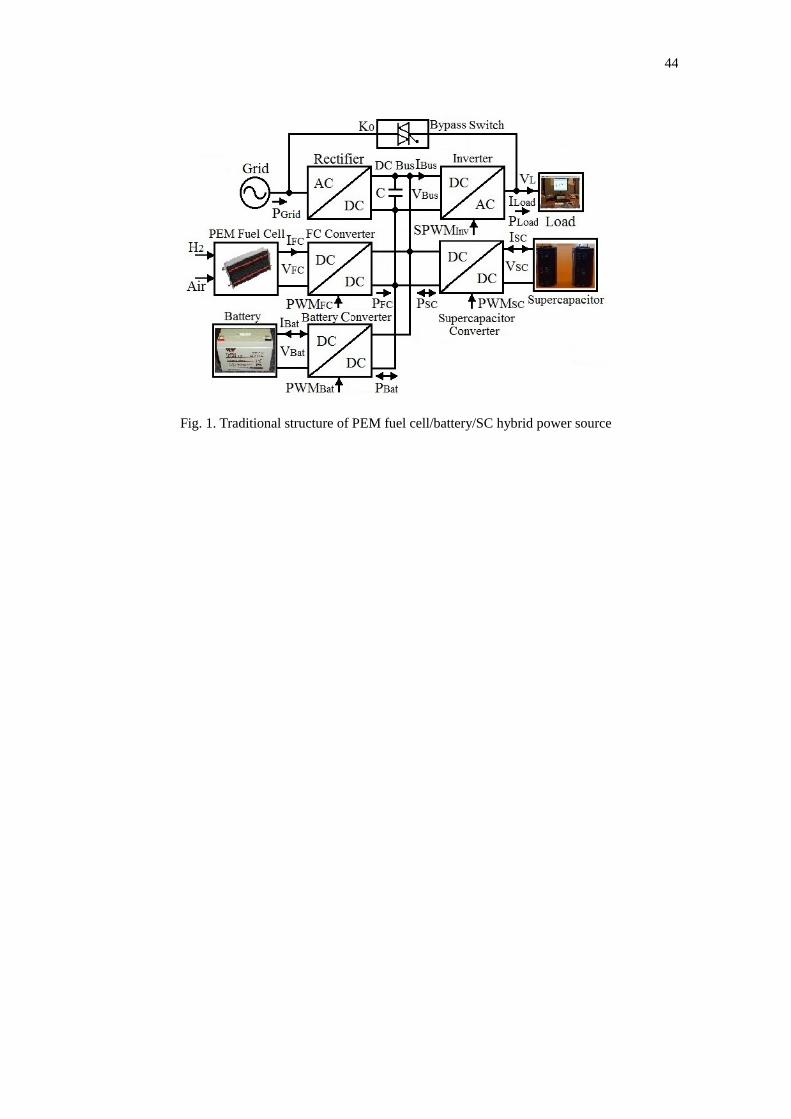
The major topology of parallel structures for a PEMFC/battery/SC hybrid power
sources UPS system is shown in Fig. 1, in which the three DC/DC converters in
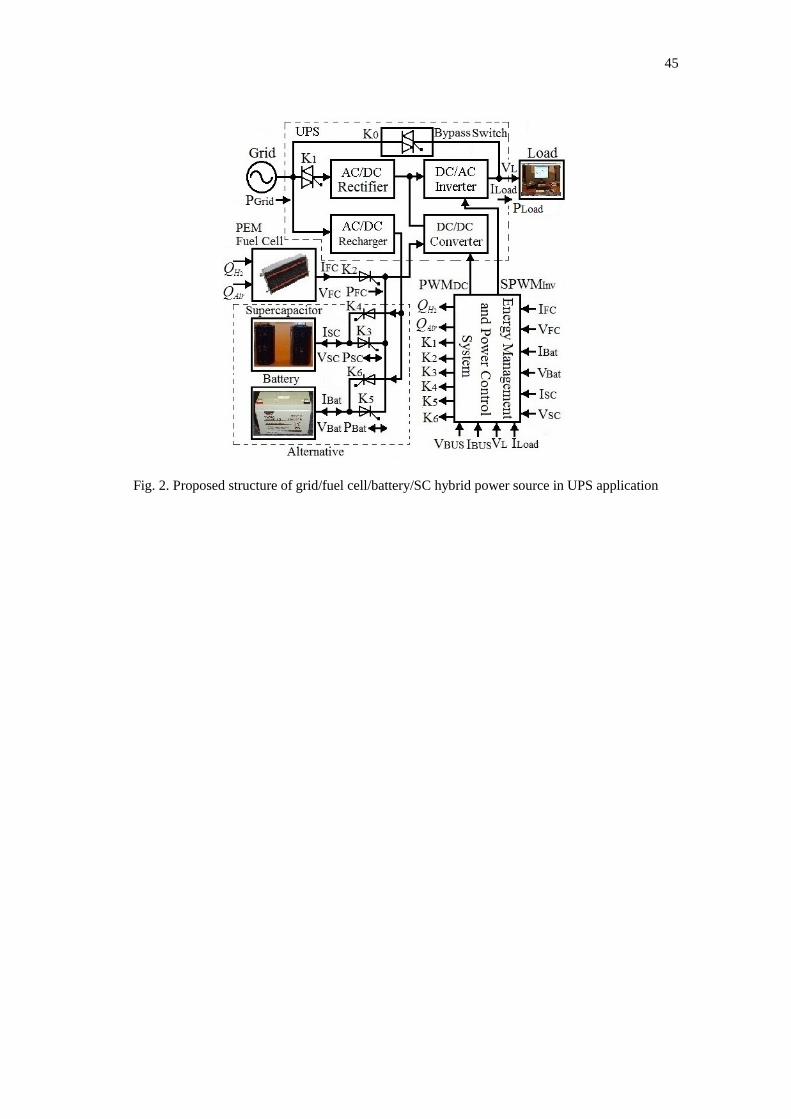
parallel is widely used. In this paper, in order to reduce the cost, improve the
performance, and decrease the losses for the UPS system, a structure of
grid/PEMFC/battery/SC hybrid power system is proposed in a high-frequency
single-phase small-power UPS system as depicted in Fig. 2. In Fig. 2, the outputs of
PEMFC, batteries and/or SCs are linked in parallel, and the outputs of power and energy
are controlled intelligently by power switches K0-K6 (thyristors) through the energy
management and power control system.
5
Fig. 1. Traditional structure of PEM fuel cell/battery/SC hybrid power source
Fig. 2. Proposed structure of grid/fuel cell/battery/SC hybrid power source in UPS
2. Modeling of hybrid power and energy system
2.1. Voltage model of PEMFC
6
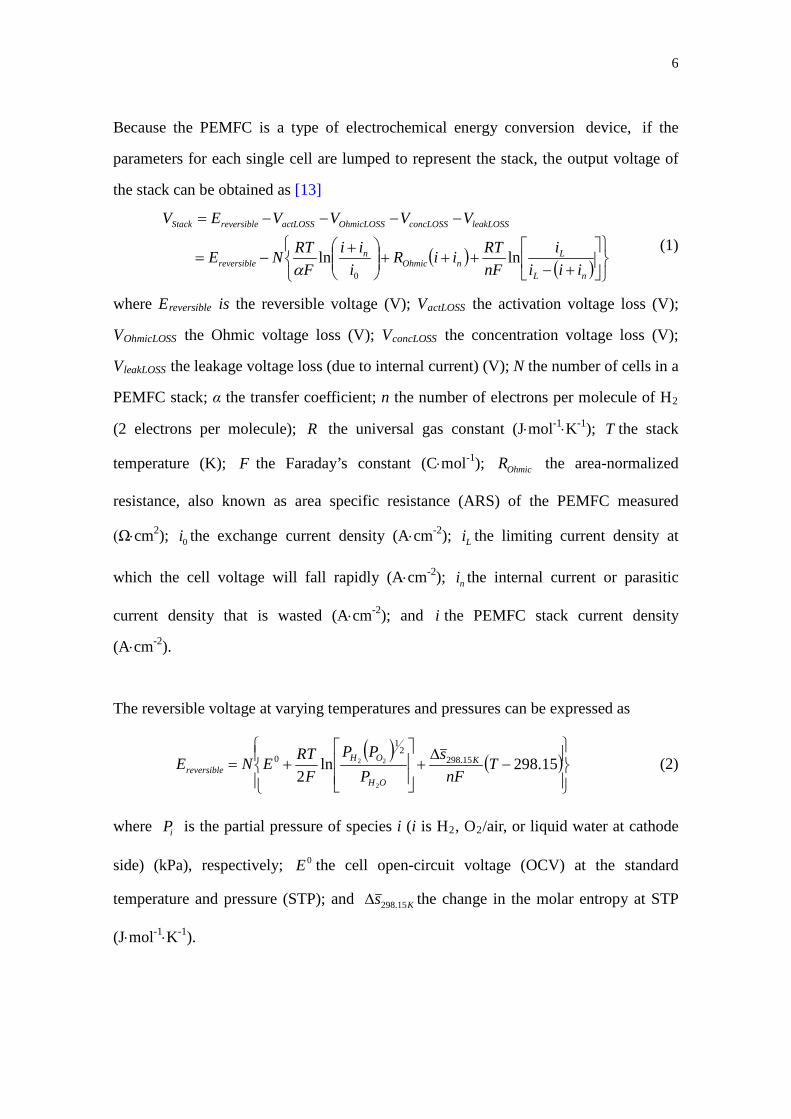
Because the PEMFC is a type of electrochemical energy conversion device, if the
parameters for each single cell are lumped to represent the stack, the output voltage of
the stack can be obtained as [13]
( ) ( )
+−
+++
+−=
−−−−=
nL
LnOhmic
nreversible
leakLOSSconcLOSSOhmicLOSSactLOSSreversibleStack
iiii
nFRTiiR
iii
FRTNE
VVVVEV
lnln0a
(1)
where Ereversible is the reversible voltage (V); VactLOSS the activation voltage loss (V);
VOhmicLOSS the Ohmic voltage loss (V); VconcLOSS the concentration voltage loss (V);
VleakLOSS the leakage voltage loss (due to internal current) (V); N the number of cells in a
PEMFC stack; α the transfer coefficient; n the number of electrons per molecule of H2
(2 electrons per molecule); R the universal gas constant (J⋅mol-1⋅K-1); T the stack
temperature (K); F the Faraday’s constant (C⋅mol-1); OhmicR the area-normalized
resistance, also known as area specific resistance (ARS) of the PEMFC measured
(Ω⋅cm2); 0i the exchange current density (A⋅cm-2); Li the limiting current density at
which the cell voltage will fall rapidly (A⋅cm-2); ni the internal current or parasitic
current density that is wasted (A⋅cm-2); and i the PEMFC stack current density
(A⋅cm-2).
The reversible voltage at varying temperatures and pressures can be expressed as
( ) ( )
−∆
+
+= 15.298ln
215.298
21
0
2
22 TnF
sP
PPF
RTENE K
OH
OHreversible (2)
where iP is the partial pressure of species i (i is H2, O2/air, or liquid water at cathode
side) (kPa), respectively; 0E the cell open-circuit voltage (OCV) at the standard
temperature and pressure (STP); and Ks 15.298∆ the change in the molar entropy at STP
(J⋅mol-1⋅K-1).
7
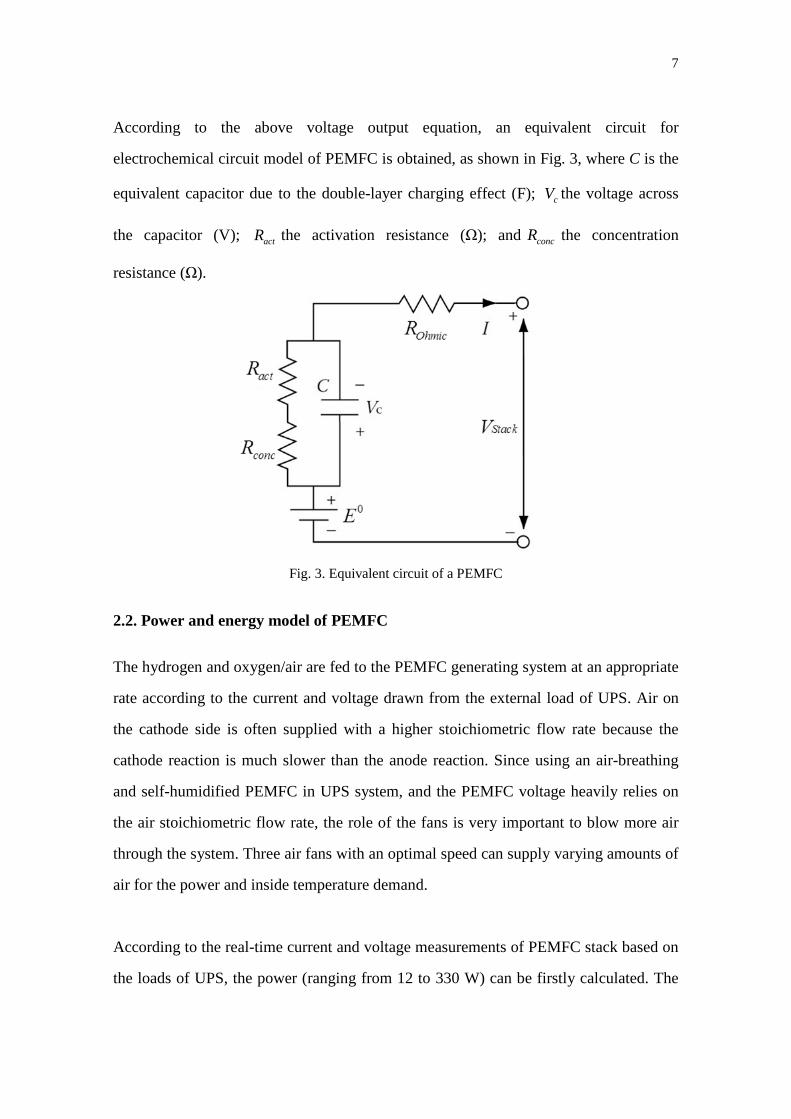
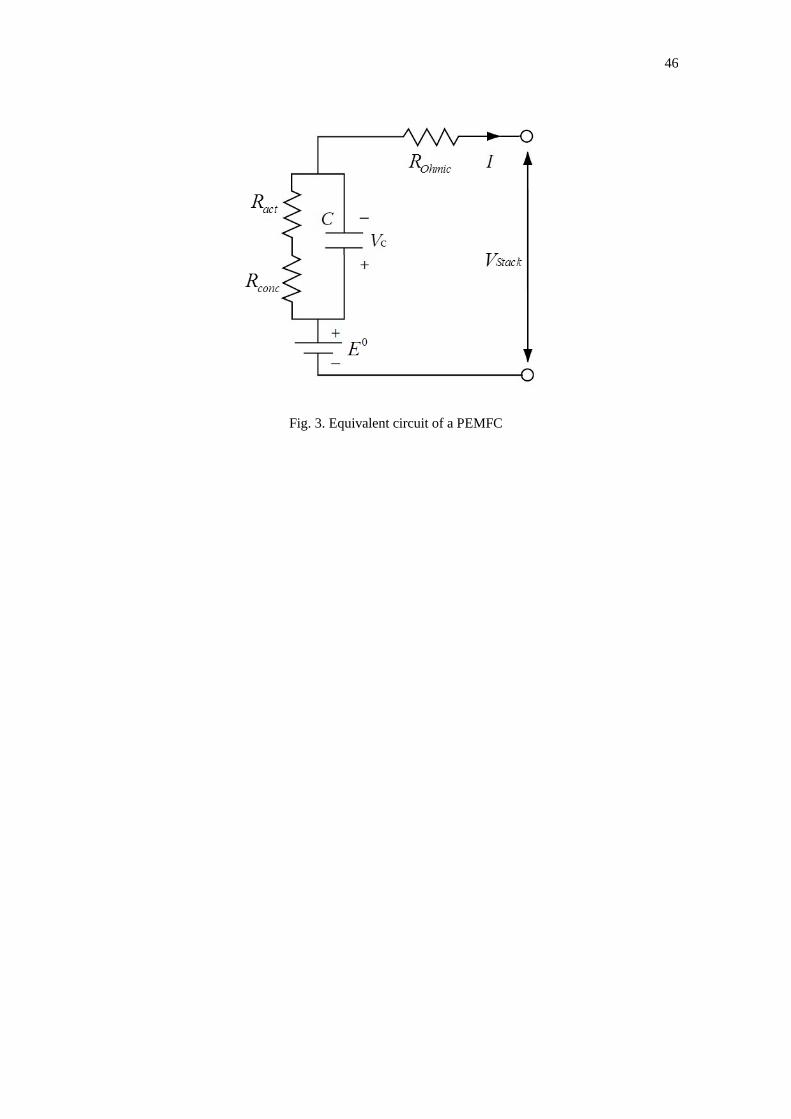
According to the above voltage output equation, an equivalent circuit for
electrochemical circuit model of PEMFC is obtained, as shown in Fig. 3, where C is the
equivalent capacitor due to the double-layer charging effect (F); cV the voltage across
the capacitor (V); actR the activation resistance (Ω); and concR the concentration
resistance (Ω).
Fig. 3. Equivalent circuit of a PEMFC
2.2. Power and energy model of PEMFC The hydrogen and oxygen/air are fed to the PEMFC generating system at an appropriate
rate according to the current and voltage drawn from the external load of UPS. Air on
the cathode side is often supplied with a higher stoichiometric flow rate because the
cathode reaction is much slower than the anode reaction. Since using an air-breathing
and self-humidified PEMFC in UPS system, and the PEMFC voltage heavily relies on
the air stoichiometric flow rate, the role of the fans is very important to blow more air
through the system. Three air fans with an optimal speed can supply varying amounts of
air for the power and inside temperature demand.
According to the real-time current and voltage measurements of PEMFC stack based on
the loads of UPS, the power (ranging from 12 to 330 W) can be firstly calculated. The
8
output power of the stack can be calculated by
IVP StackStack = (3)
where PStack is the output power (W), VStack the output voltage (V), and I the output
current of the stack (A).
Based on the external load at that time, an energy supply system of hydrogen and air is
designed to continuously distribute the current or real-time power by using the setup
value of the reference mass flow QrefH2 and Qref
O2 of hydrogen and air, according to the
stoichiometric ratios of PEMFC. The mass flow rates of hydrogen and air for the stack
can be calculated as follows. 2.2.1. Hydrogen mass flow rate At the standard conditions of the atmospheric pressure and temperature of 25oC, the
molar volume is
molLmolmP
RTVm /8.22/0228.0300,101
15.278314.8 3 ==×
== (4)
The reference volumetric flow rate of pure hydrogen consumption in standard liters per
minute or SL/min (SLPM) is
22 2
608.22 HrefH S
FINQ ×⋅
××= (5)
where 2HS is the stoichiometry ratio of hydrogen, which is selected within 1.2~1.5.
According to the hydrogen mass flow controller designed by fuzzy logic control rules,
the hydrogen flow rate varies between 0 and 4.7 SL/min at stoichiometric ratio of 1.2
and under the current variations of 0 to 9 A, while the air flow rate is supplied by the
three fans. The hydrogen flow rate can keep tracking the reference value given by
power tracking controller.
9
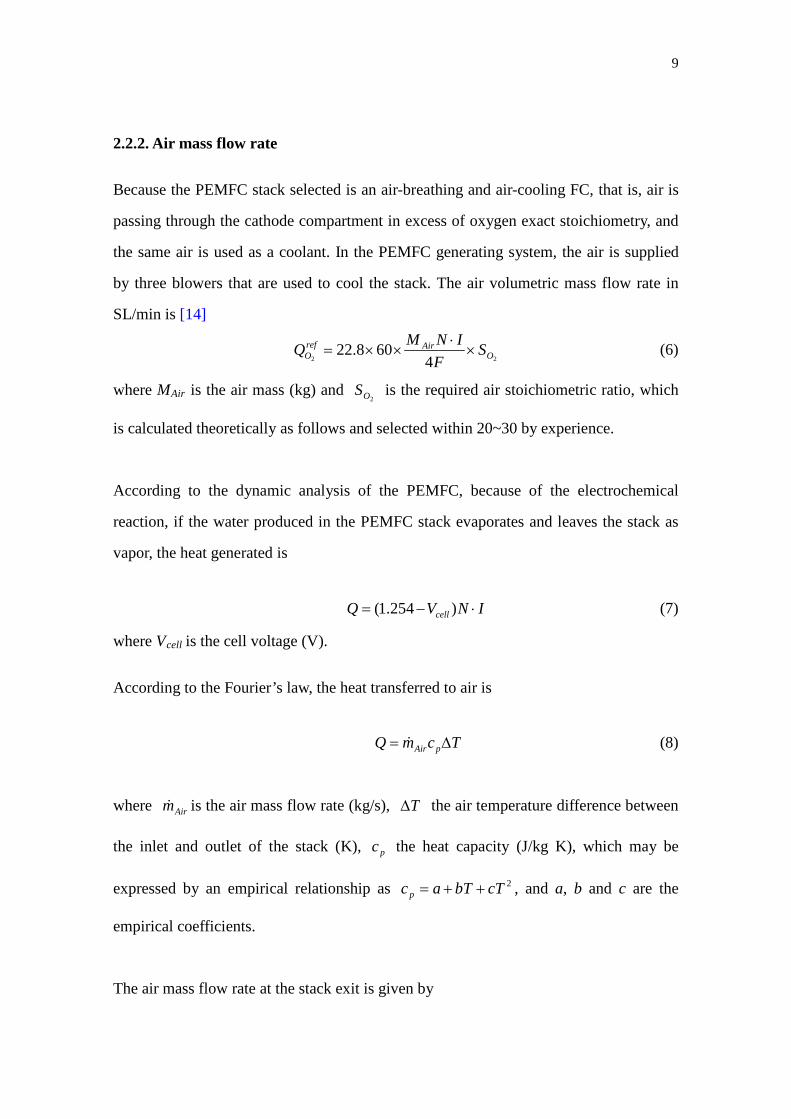
2.2.2. Air mass flow rate Because the PEMFC stack selected is an air-breathing and air-cooling FC, that is, air is
passing through the cathode compartment in excess of oxygen exact stoichiometry, and
the same air is used as a coolant. In the PEMFC generating system, the air is supplied
by three blowers that are used to cool the stack. The air volumetric mass flow rate in
SL/min is [14]
22 4608.22 O
AirrefO S
FINMQ ×⋅
××= (6)
where MAir is the air mass (kg) and 2OS is the required air stoichiometric ratio, which
is calculated theoretically as follows and selected within 20~30 by experience.
According to the dynamic analysis of the PEMFC, because of the electrochemical
reaction, if the water produced in the PEMFC stack evaporates and leaves the stack as
vapor, the heat generated is
INVQ cell ⋅−= )254.1( (7)
where Vcell is the cell voltage (V). According to the Fourier’s law, the heat transferred to air is
TcmQ pAir ∆= (8)
where Airm is the air mass flow rate (kg/s), T∆ the air temperature difference between
the inlet and outlet of the stack (K), pc the heat capacity (J/kg K), which may be
expressed by an empirical relationship as 2cTbTacp ++= , and a, b and c are the
empirical coefficients.
The air mass flow rate at the stack exit is given by
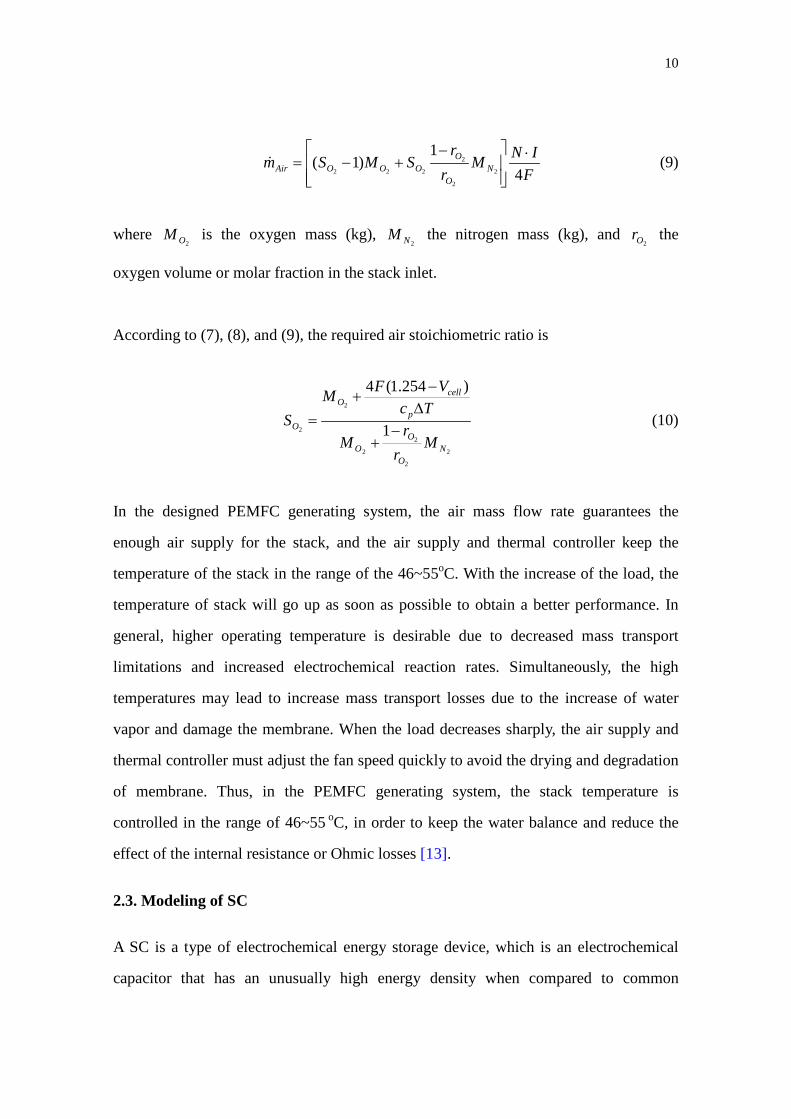
10
F
INMr
rSMSm N
O
OOOOAir 4
1)1(
2
2
2
222
⋅
−+−= (9)
where 2OM is the oxygen mass (kg),
2NM the nitrogen mass (kg), and 2Or the
oxygen volume or molar fraction in the stack inlet.
According to (7), (8), and (9), the required air stoichiometric ratio is
2
2
2
2
2
2 1
)254.1(4
NO
OO
p
cellO
O
Mr
rM
TcVFM
S−
+
∆−
+= (10)
In the designed PEMFC generating system, the air mass flow rate guarantees the
enough air supply for the stack, and the air supply and thermal controller keep the
temperature of the stack in the range of the 46~55oC. With the increase of the load, the
temperature of stack will go up as soon as possible to obtain a better performance. In
general, higher operating temperature is desirable due to decreased mass transport
limitations and increased electrochemical reaction rates. Simultaneously, the high
temperatures may lead to increase mass transport losses due to the increase of water
vapor and damage the membrane. When the load decreases sharply, the air supply and
thermal controller must adjust the fan speed quickly to avoid the drying and degradation
of membrane. Thus, in the PEMFC generating system, the stack temperature is
controlled in the range of 46~55 oC, in order to keep the water balance and reduce the
effect of the internal resistance or Ohmic losses [13]. 2.3. Modeling of SC A SC is a type of electrochemical energy storage device, which is an electrochemical
capacitor that has an unusually high energy density when compared to common
11
capacitors, typically thousands times greater than that of a high capacity electrolytic
capacitor. It also has almost 90% of high cycle efficiency. Because the SCs can improve
storage density through the use of a nano-porous material, two very high surface area
porous electrodes are soaked in electrolyte, and the charge is stored in electrochemical
double layers.
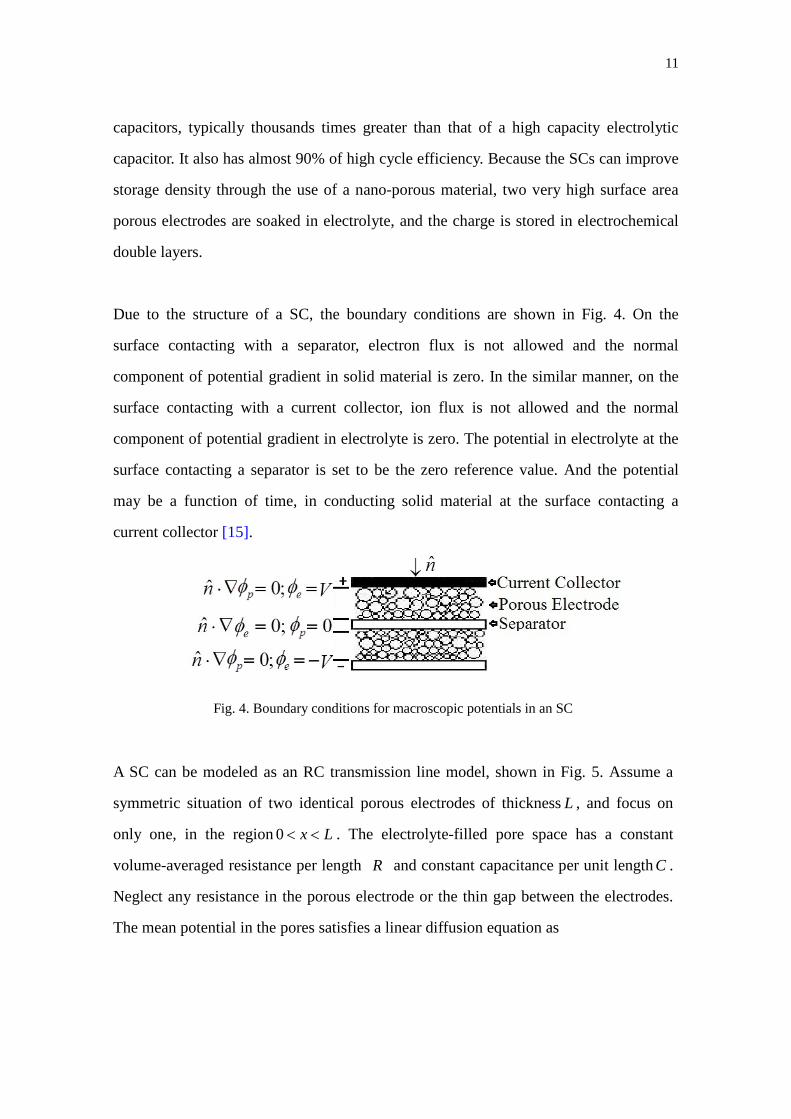
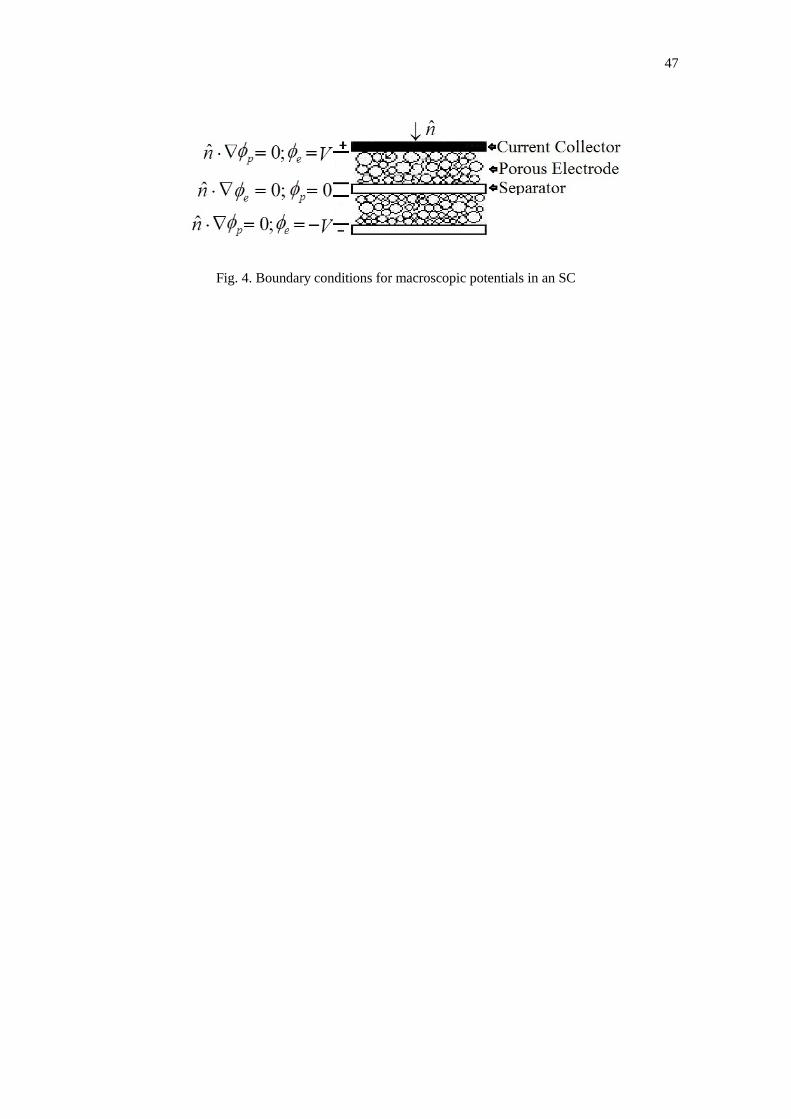
Due to the structure of a SC, the boundary conditions are shown in Fig. 4. On the
surface contacting with a separator, electron flux is not allowed and the normal
component of potential gradient in solid material is zero. In the similar manner, on the
surface contacting with a current collector, ion flux is not allowed and the normal
component of potential gradient in electrolyte is zero. The potential in electrolyte at the
surface contacting a separator is set to be the zero reference value. And the potential
may be a function of time, in conducting solid material at the surface contacting a
current collector [15].
Fig. 4. Boundary conditions for macroscopic potentials in an SC
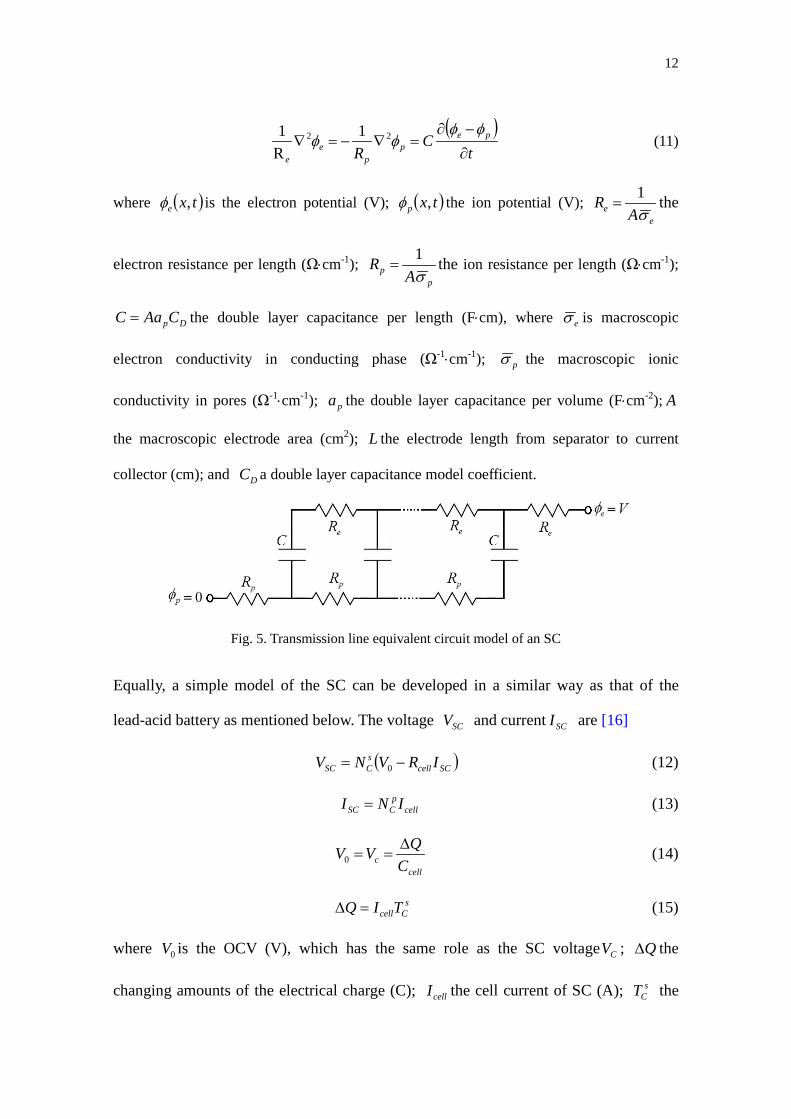
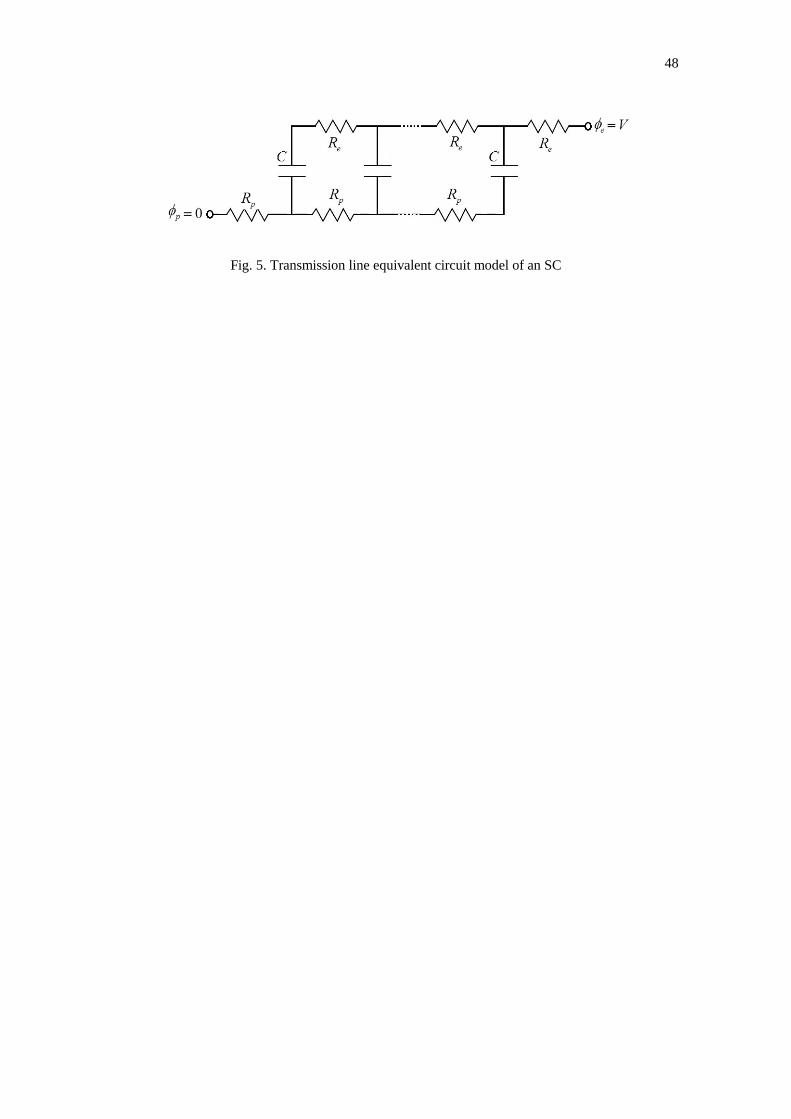
A SC can be modeled as an RC transmission line model, shown in Fig. 5. Assume a
symmetric situation of two identical porous electrodes of thickness L , and focus on
only one, in the region Lx <<0 . The electrolyte-filled pore space has a constant
volume-averaged resistance per length R and constant capacitance per unit length C .
Neglect any resistance in the porous electrode or the thin gap between the electrodes.
The mean potential in the pores satisfies a linear diffusion equation as
12
( )t
CR
pep
pe
e ∂
−∂=∇−=∇
φφφφ 22 1
R1 (11)
where ( )txe ,φ is the electron potential (V); ( )txp ,φ the ion potential (V); e
e AR
σ1
= the
electron resistance per length (Ω⋅cm-1); p
p AR
σ1
= the ion resistance per length (Ω⋅cm-1);
DpCAaC = the double layer capacitance per length (F⋅cm), where eσ is macroscopic
electron conductivity in conducting phase (Ω-1⋅cm-1); pσ the macroscopic ionic
conductivity in pores (Ω-1⋅cm-1); pa the double layer capacitance per volume (F⋅cm-2); A
the macroscopic electrode area (cm2); L the electrode length from separator to current
collector (cm); and DC a double layer capacitance model coefficient.
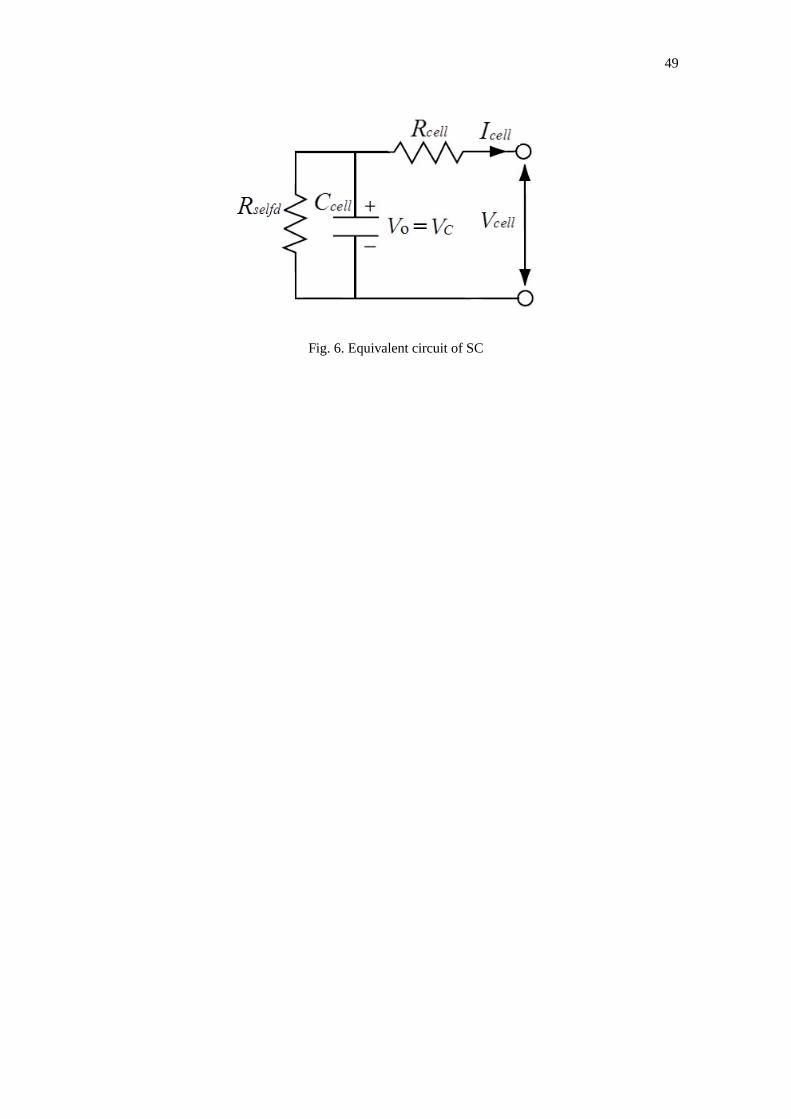
Fig. 5. Transmission line equivalent circuit model of an SC Equally, a simple model of the SC can be developed in a similar way as that of the
lead-acid battery as mentioned below. The voltage SCV and current SCI are [16]
( )SCcellsCSC IRVNV −= 0 (12)
cellp
CSC INI = (13)
cellc C
QVV ∆==0 (14)
sCcellTIQ =∆ (15)
where 0V is the OCV (V), which has the same role as the SC voltage CV ; Q∆ the
changing amounts of the electrical charge (C); cellI the cell current of SC (A); sCT the
13
discharging time (s); sCN the number of cells for SC in series; and p
CN the number of
series-cells for SC in parallel.
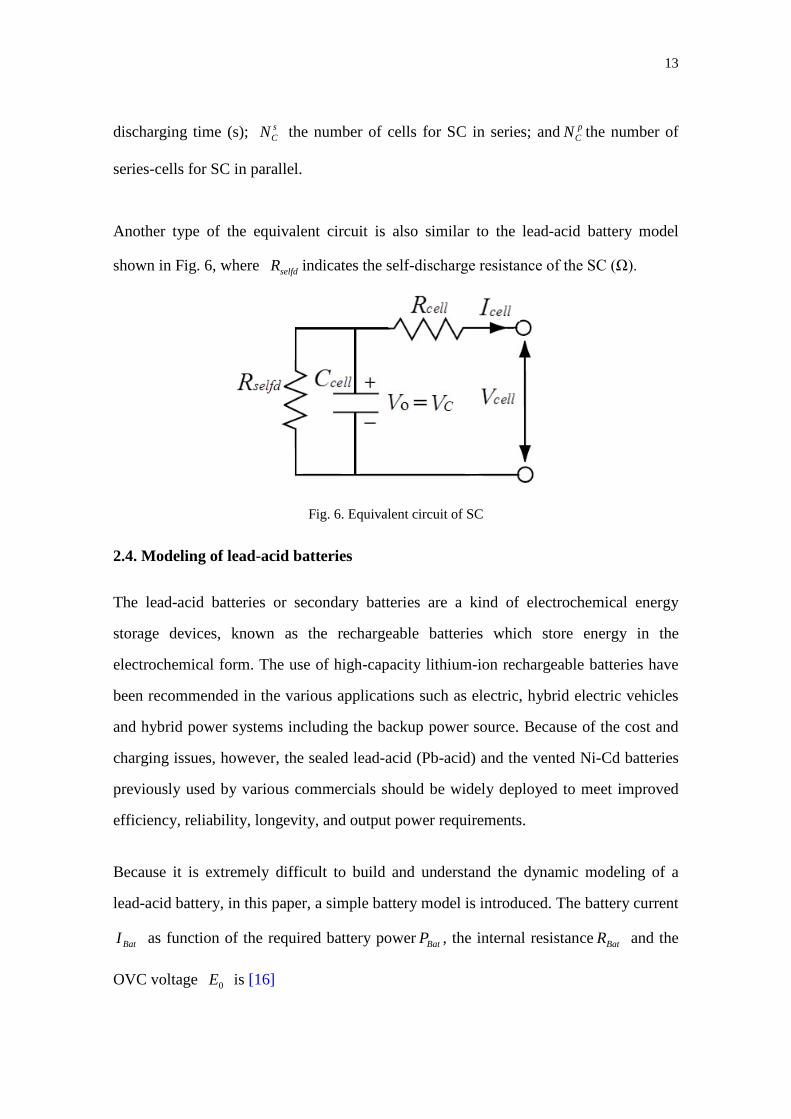
Another type of the equivalent circuit is also similar to the lead-acid battery model
shown in Fig. 6, where selfdR indicates the self-discharge resistance of the SC (Ω).
Fig. 6. Equivalent circuit of SC
2.4. Modeling of lead-acid batteries The lead-acid batteries or secondary batteries are a kind of electrochemical energy
storage devices, known as the rechargeable batteries which store energy in the
electrochemical form. The use of high-capacity lithium-ion rechargeable batteries have
been recommended in the various applications such as electric, hybrid electric vehicles
and hybrid power systems including the backup power source. Because of the cost and
charging issues, however, the sealed lead-acid (Pb-acid) and the vented Ni-Cd batteries
previously used by various commercials should be widely deployed to meet improved
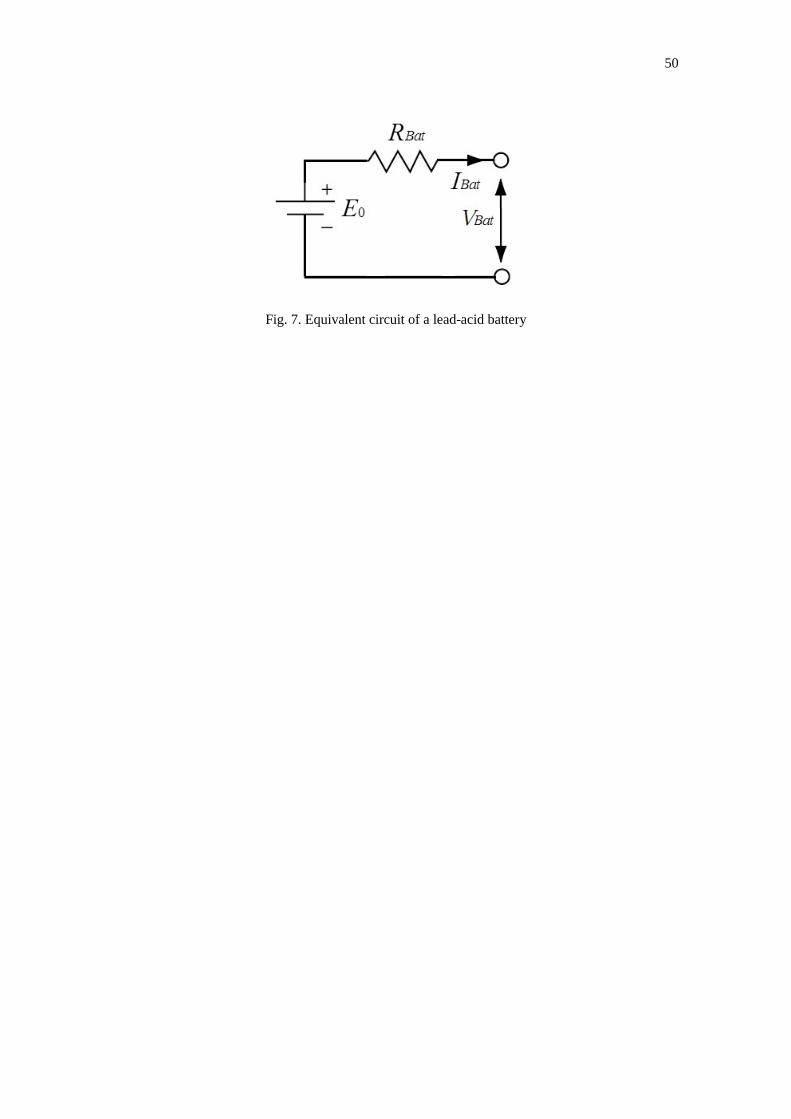
efficiency, reliability, longevity, and output power requirements. Because it is extremely difficult to build and understand the dynamic modeling of a
lead-acid battery, in this paper, a simple battery model is introduced. The battery current
BatI as function of the required battery power BatP , the internal resistance BatR and the
OVC voltage 0E is [16]
14
BatBatBat IREV −= 0 (16)
BatBatBat IVP = (17)
Bat
BatBatBat R
RPEEI
242
00 −−= (18)
where based on the empirical Peukert’s law, ),( 00 TSOCfNE s
B= ,
),( 0TSOCfNNR p
B
sB
Bat = , 1
5536001
−
−=
k
Bats
BBat
II
CTISOC . s
BN is the number of cells in
series; pBN the number of series-cells in parallel; 0T the cell temperature (°C); SOC
the state of charge (%); IC the relative remaining capacity of the battery, e.g. 5C the 5-h
rate capacity, in the number of Ampere–hours (Ah); sBT the discharging time of battery
(s); and k the Peukert number.
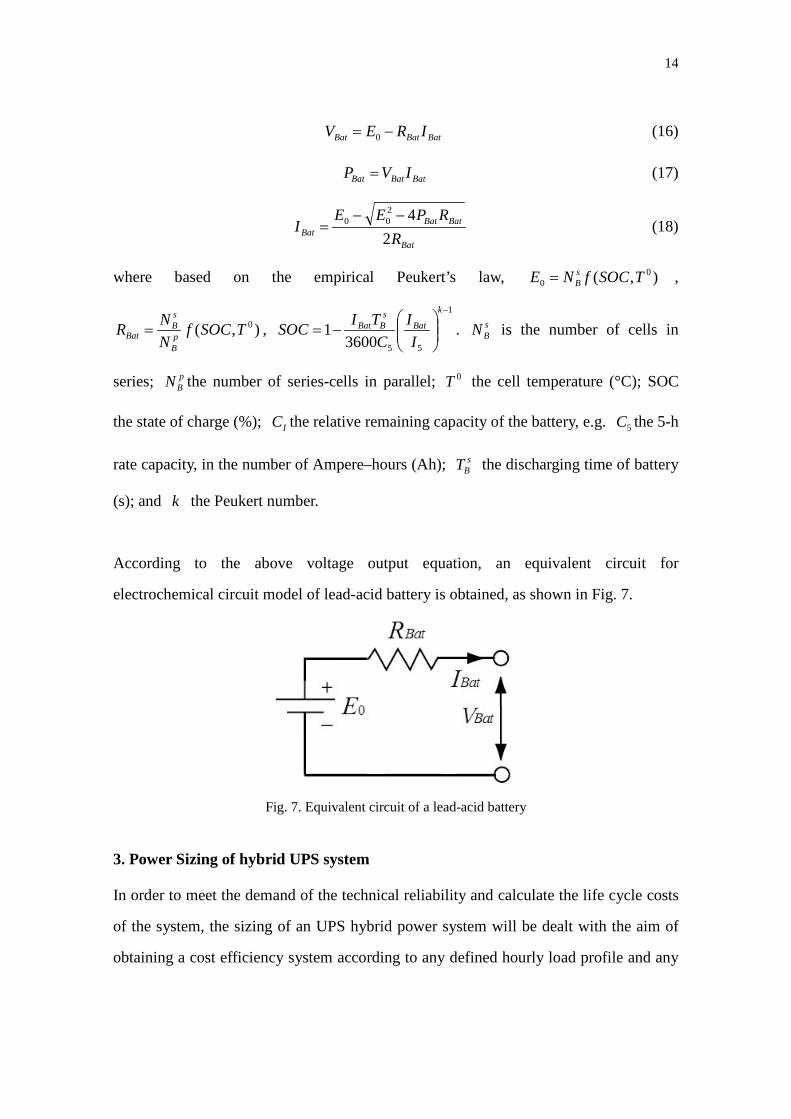
According to the above voltage output equation, an equivalent circuit for
electrochemical circuit model of lead-acid battery is obtained, as shown in Fig. 7.
Fig. 7. Equivalent circuit of a lead-acid battery
3. Power Sizing of hybrid UPS system
In order to meet the demand of the technical reliability and calculate the life cycle costs
of the system, the sizing of an UPS hybrid power system will be dealt with the aim of
obtaining a cost efficiency system according to any defined hourly load profile and any
15
defined backup time. A solution is defined by PEMFC, SC and battery sizes and the
energy management strategy.
3.1. Power sizing of PEMFC
In this UPS hybrid power system using PEMFC as backup power source, a 300W
single-phase high-frequency low-loss smart UPS has been designed, with nominal
voltage of 36V; minimum supply voltage of 30V; efficiency of 0.9; maximum load of
270W; backup time of 24 hours for PEMFC; backup time of 15 s for SC; and backup
time 20 min for battery.
The PEMFC size is the largest, the fuel cell capital cost is the highest, and the battery
and SC requirements are the least restrictive. Thus, in order to release a 24h continuous
backup operation mode, according to its working voltage of 31.5-56.7V, a 300W
(36V/8.4A) air-breathing air-cooling self-humidified PEMFC is employed to supply the
main power source for UPS system.
Because the PEMFC stack is a new type of self-humidified, air-breathing and
air-cooling together, some parameters are confidential to the manufacturer of the stack
such as the anode volume, cathode volume and so on, we have done some experiments,
but no simulations. The basic experimental conditions of PEMFC are: hydrogen
maximum input flow of 3.9 L/min; hydrogen pressure of 50-55kPa; number of cells of
63; effective area of 18 cm2; start up time of 10 s under the condition of constant
voltage; and maximum stack temperature of 55°C.
3.2. Power sizing of lead-acid battery
Because the PEMFC is the main power source and lead-acid battery is used as the
auxiliary power source in the UPS system, based on minimum cost profile, the sizing of
16
battery is designed taking into account the PEMFC start-up time of 10 s and
maintaining time of 10 min when PEMFC fails.
Based on the demand of UPS system, 3-cell Yuasa® NP deep cycle lead-acid batteries,
with nominal voltage of 12 V, are selected. Based on the rated power of 270W,
minimum discharging voltage of VV 30min = and the efficiency of UPS system
designed of 9.0=η , the discharging current is
)(109.030
270
min
AV
PI =×
==η
(19)
Because of the requirement of the battery discharging time of 10 min and the minimum
discharging voltage of 10 V for a lead-acid battery, according to the typical discharging
characteristics of batteries at an ambient temperature of 25°C through the discharge
current rates and the discharge time, the discharging current ratio approximately equals
2 CA, and the battery capacity selected is [17]
52
10===
CAAAh (20)
On the other hand, according to the recommended calculation method of battery size
required for constant power load conditions, calculating the battery capacity from the
list is 4.46 Ah, which is the minimum requirement.
At present, the lead-acid battery has two types of products: deep cycle battery and gel
battery. Based on the cost factor, we selected 3-cell series-connected deep cycle
lead-acid batteries with the main specifications as NPH5-12, 12V/5Ah/10HR,
and Ω= 043.0BatR , 3=sBN , 1=p
BN .
3.3. Power sizing of SC
The SC is used as a type of auxiliary power source in the UPS system, according to the
17
maximum charging voltage of 41 V, in which the recommended float voltage for NP
batteries at 25°C is 2.26 V per cell from the UPS system, and the voltage of
VVcell 7.2= for single cell SC, the number of SCs designed in series equals
167.2
41max ===cell
sC V
VN (21)
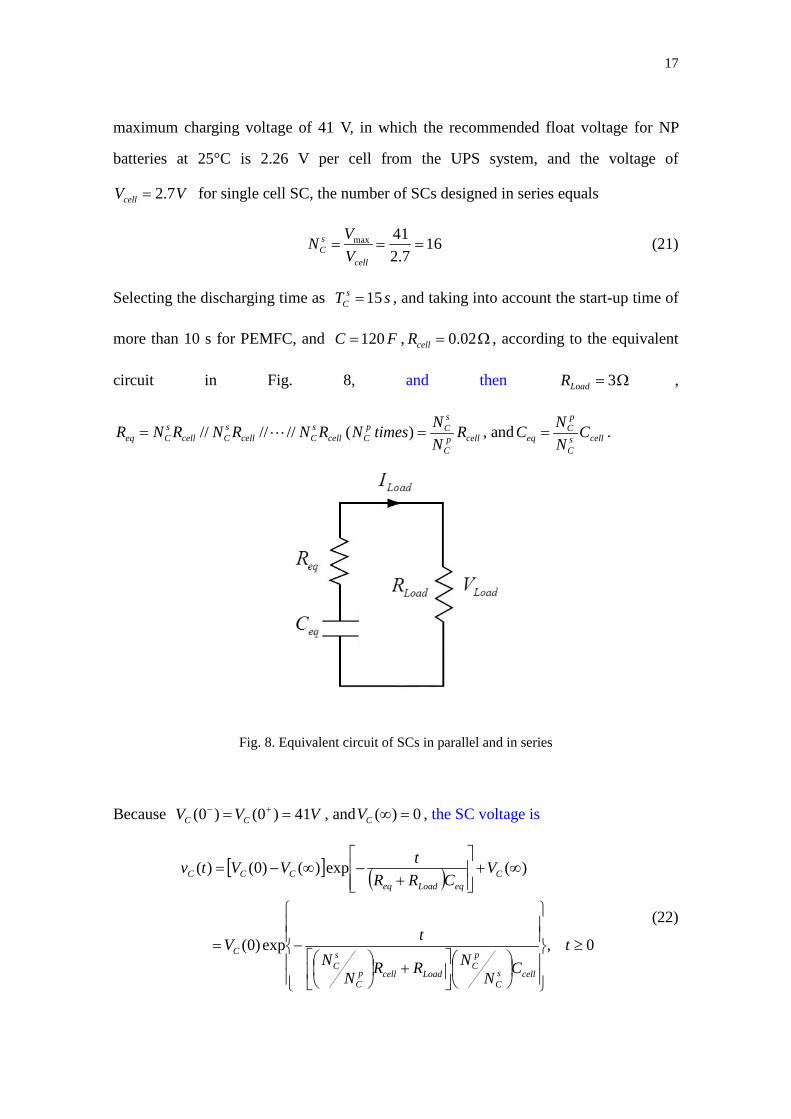
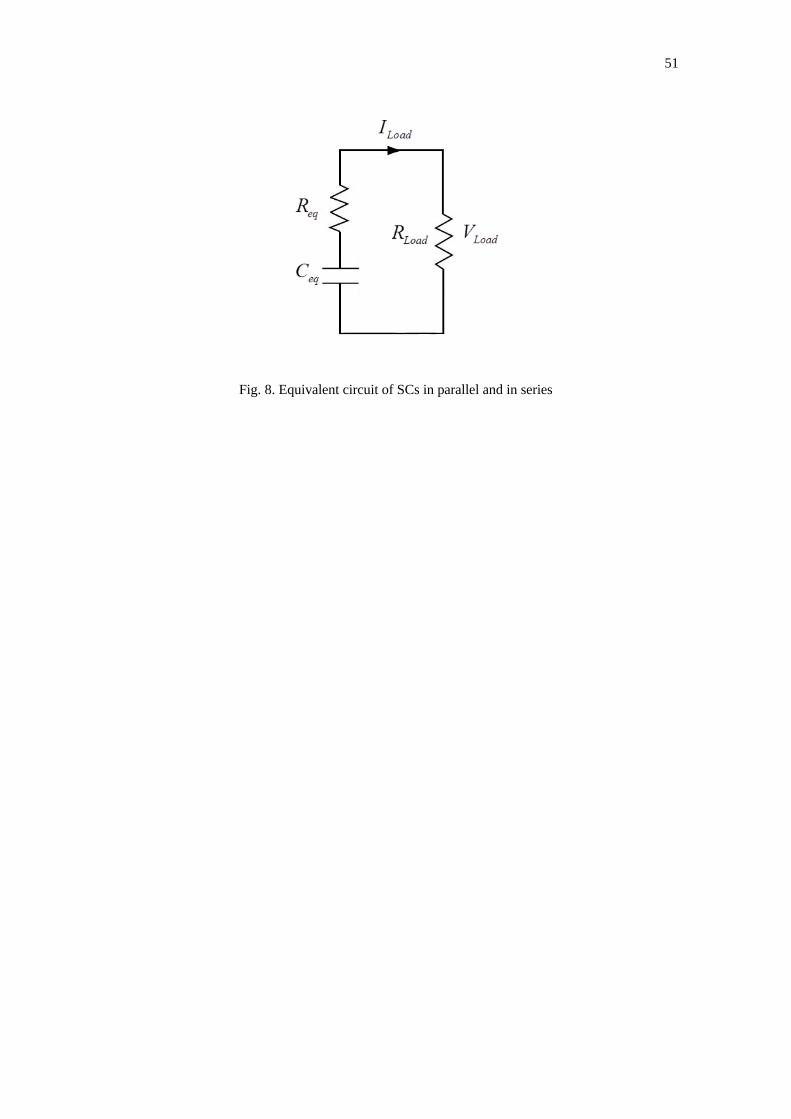
Selecting the discharging time as sT sC 15= , and taking into account the start-up time of
more than 10 s for PEMFC, and FC 120= , Ω= 02.0cellR , according to the equivalent
circuit in Fig. 8, and then Ω= 3LoadR ,
cellpC
sCp
CcellsCcell
sCcell
sCeq R
NNtimesNRNRNRNR == )(////// , and cells
C
pC
eq CNNC = .
Fig. 8. Equivalent circuit of SCs in parallel and in series
Because VVV CC 41)0()0( == +− , and 0)( =∞CV , the SC voltage is
[ ] ( )
0,exp)0(
)(exp)()0()(
≥
+
−=
∞+
+−∞−=
tCN
NRRNN
tV
VCRR
tVVtv
cellsC
pC
LoadcellpC
sC
C
CeqLoadeq
CCC
(22)
18
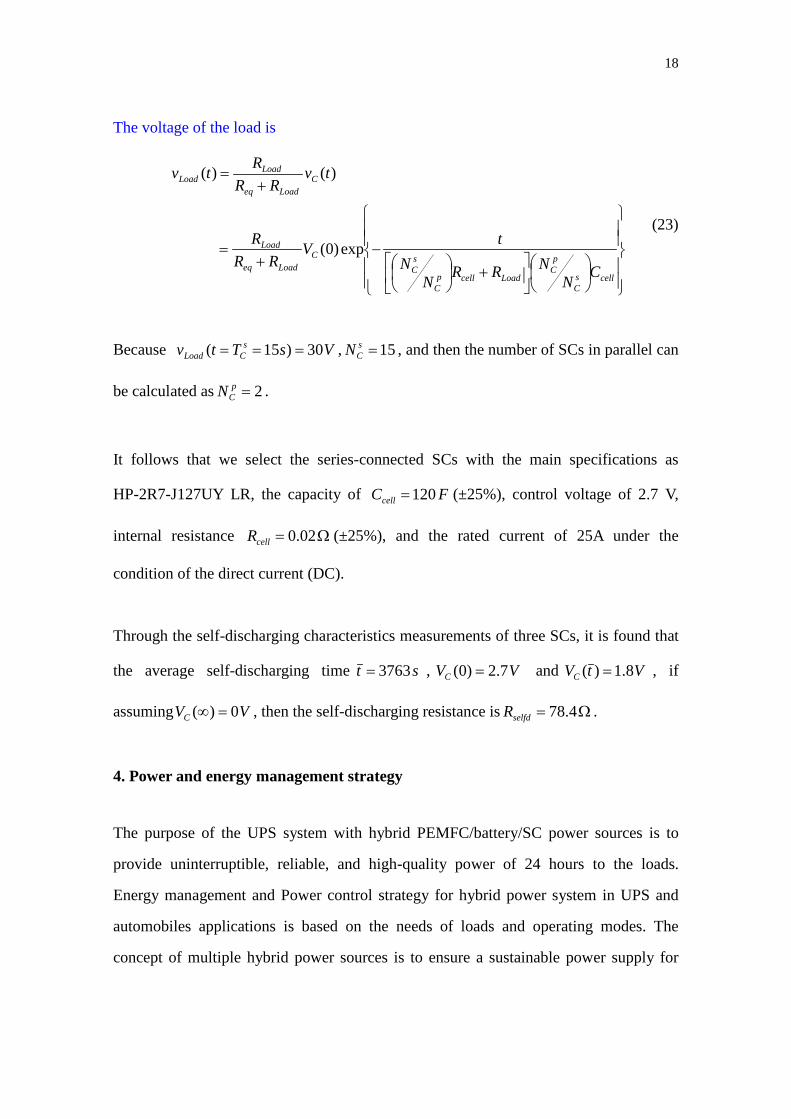
The voltage of the load is
+
−+
=
+=
cellsC
pC
LoadcellpC
sC
CLoadeq
Load
CLoadeq
LoadLoad
CNNRRN
NtV
RRR
tvRR
Rtv
exp)0(
)()(
(23)
Because VsTtv sCLoad 30)15( === , 15=s
CN , and then the number of SCs in parallel can
be calculated as 2=pCN .
It follows that we select the series-connected SCs with the main specifications as
HP-2R7-J127UY LR, the capacity of FCcell 120= (±25%), control voltage of 2.7 V,
internal resistance Ω= 02.0cellR (±25%), and the rated current of 25A under the
condition of the direct current (DC).
Through the self-discharging characteristics measurements of three SCs, it is found that
the average self-discharging time st 3763= , VVC 7.2)0( = and VtVC 8.1)( = , if
assuming VVC 0)( =∞ , then the self-discharging resistance is Ω= 4.78selfdR .
4. Power and energy management strategy
The purpose of the UPS system with hybrid PEMFC/battery/SC power sources is to
provide uninterruptible, reliable, and high-quality power of 24 hours to the loads.
Energy management and Power control strategy for hybrid power system in UPS and
automobiles applications is based on the needs of loads and operating modes. The
concept of multiple hybrid power sources is to ensure a sustainable power supply for
19
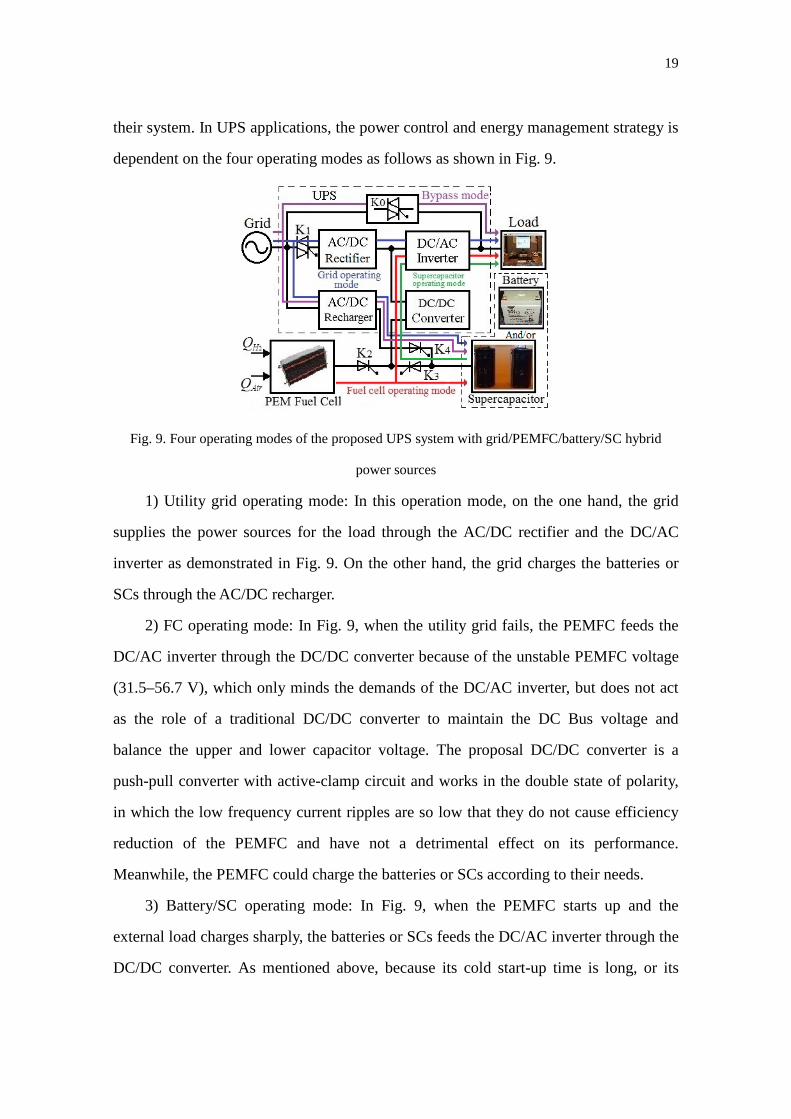
their system. In UPS applications, the power control and energy management strategy is
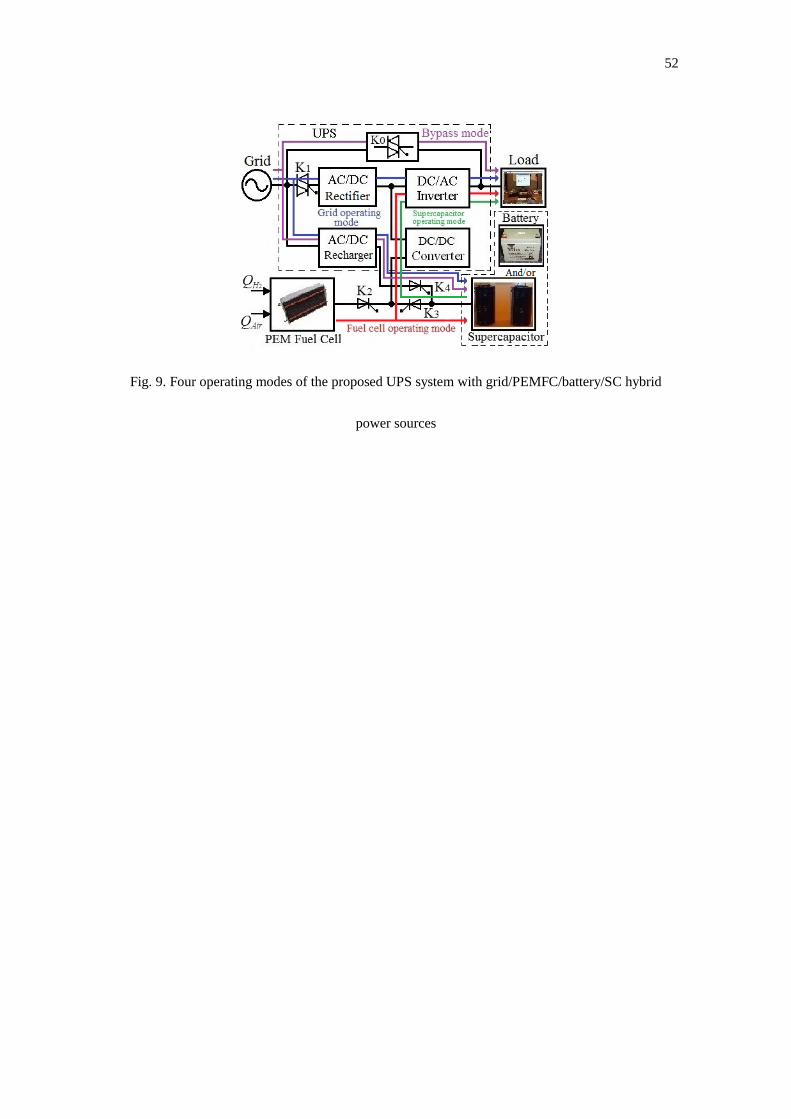
dependent on the four operating modes as follows as shown in Fig. 9.
Fig. 9. Four operating modes of the proposed UPS system with grid/PEMFC/battery/SC hybrid
power sources
1) Utility grid operating mode: In this operation mode, on the one hand, the grid
supplies the power sources for the load through the AC/DC rectifier and the DC/AC
inverter as demonstrated in Fig. 9. On the other hand, the grid charges the batteries or
SCs through the AC/DC recharger.
2) FC operating mode: In Fig. 9, when the utility grid fails, the PEMFC feeds the
DC/AC inverter through the DC/DC converter because of the unstable PEMFC voltage
(31.5–56.7 V), which only minds the demands of the DC/AC inverter, but does not act
as the role of a traditional DC/DC converter to maintain the DC Bus voltage and
balance the upper and lower capacitor voltage. The proposal DC/DC converter is a
push-pull converter with active-clamp circuit and works in the double state of polarity,
in which the low frequency current ripples are so low that they do not cause efficiency
reduction of the PEMFC and have not a detrimental effect on its performance.
Meanwhile, the PEMFC could charge the batteries or SCs according to their needs.
3) Battery/SC operating mode: In Fig. 9, when the PEMFC starts up and the
external load charges sharply, the batteries or SCs feeds the DC/AC inverter through the
DC/DC converter. As mentioned above, because its cold start-up time is long, or its
20
dynamical response is slow, that is, for a sudden change of external load, the hydrogen
cannot be fed fast enough, and the PEMFC stack may take a few seconds to reach the
required output voltage, which can lead to the fuel starvation and degradation of the
stack. To overcome this issue, the rechargeable batteries or SCs can be employed as the
auxiliary power source to respond fast to the external load and protect the PEMFC from
degradation and damage.
4) Bypass operating mode: In this operation mode, the grid feeds the load through
the bypass switch as shown in Fig. 9 when the UPS starts up and the DC/AC inverter
fails. Meanwhile, the grid charges the batteries or SCs through the AC/DC recharger.
4.1. Intelligent power control and energy management strategies
Besides the normal operating and controls of AC/DC rectifier, DC/AC inverter, DC/DC
converter and AC/DC recharger in the UPS system and PEMFC generating system, in
order to prevent the PEMFC from degradation and improve its performance, the
developed intelligent power control and energy management strategies in the UPS
system are as following and as shown in Fig. 2 and Fig. 9.
Strategy 1: Monitoring the power and energy (voltage LV and current LoadI ) of the
UPS load, and deciding if the UPS is supplied by the utility grid, PEMFC, and
battery or SC through the switches 0K , 1K , 2K , 3 5( )K K ;
Strategy 2: Monitoring the power changes (the changes of the voltages LV , FCV and
currents LoadI , FCI ) of the UPS load and PEMFC stack, and deciding if the UPS is
supplied by the stack, or battery/SC or in parallel through the switches 2K , 3 5( )K K ;
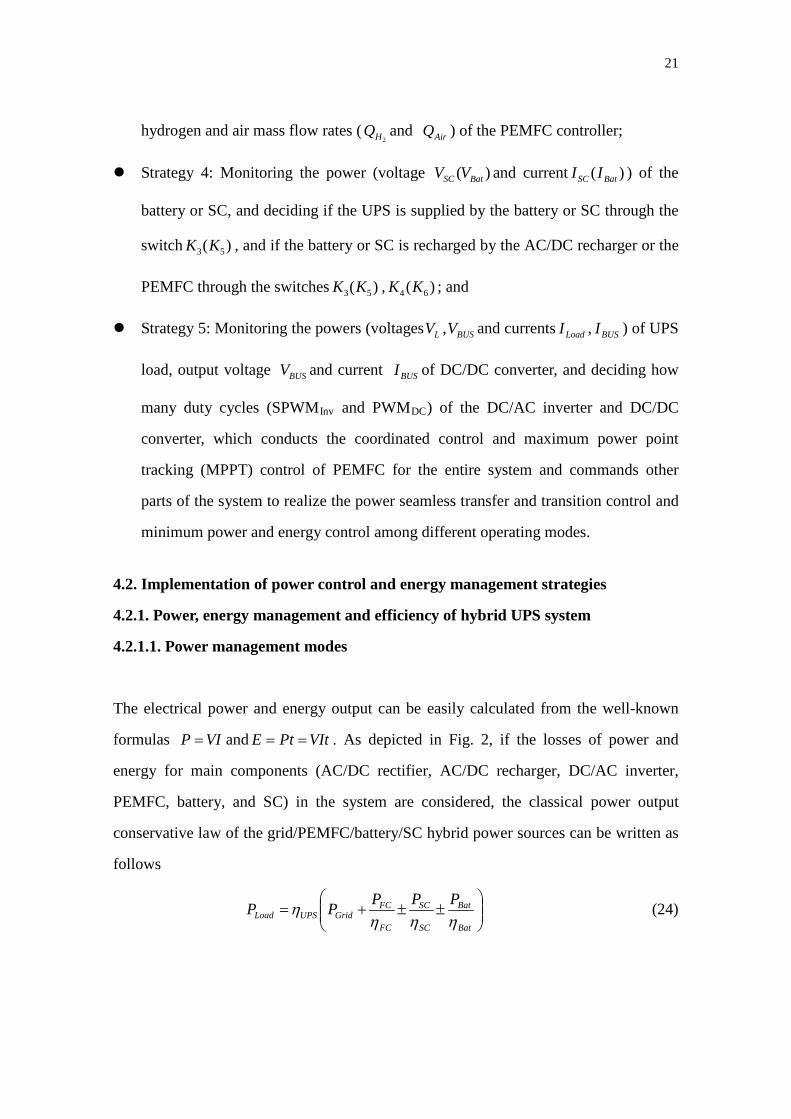
Strategy 3: Monitoring the power (voltage LV and current LoadI ) of UPS load and
the energy (hydrogen mass flow rate2HQ and air mass flow rate AirQ ) of PEMFC,
and deciding how much fuel and air are supplied with the stack through the
21
hydrogen and air mass flow rates (2HQ and AirQ ) of the PEMFC controller;
Strategy 4: Monitoring the power (voltage ( )SC BatV V and current ( )SC BatI I ) of the
battery or SC, and deciding if the UPS is supplied by the battery or SC through the
switch 3 5( )K K , and if the battery or SC is recharged by the AC/DC recharger or the
PEMFC through the switches 3 5( )K K , 4 6( )K K ; and
Strategy 5: Monitoring the powers (voltages LV , BUSV and currents LoadI , BUSI ) of UPS
load, output voltage BUSV and current BUSI of DC/DC converter, and deciding how
many duty cycles (SPWMInv and PWMDC) of the DC/AC inverter and DC/DC
converter, which conducts the coordinated control and maximum power point
tracking (MPPT) control of PEMFC for the entire system and commands other
parts of the system to realize the power seamless transfer and transition control and
minimum power and energy control among different operating modes. 4.2. Implementation of power control and energy management strategies
4.2.1. Power, energy management and efficiency of hybrid UPS system
4.2.1.1. Power management modes
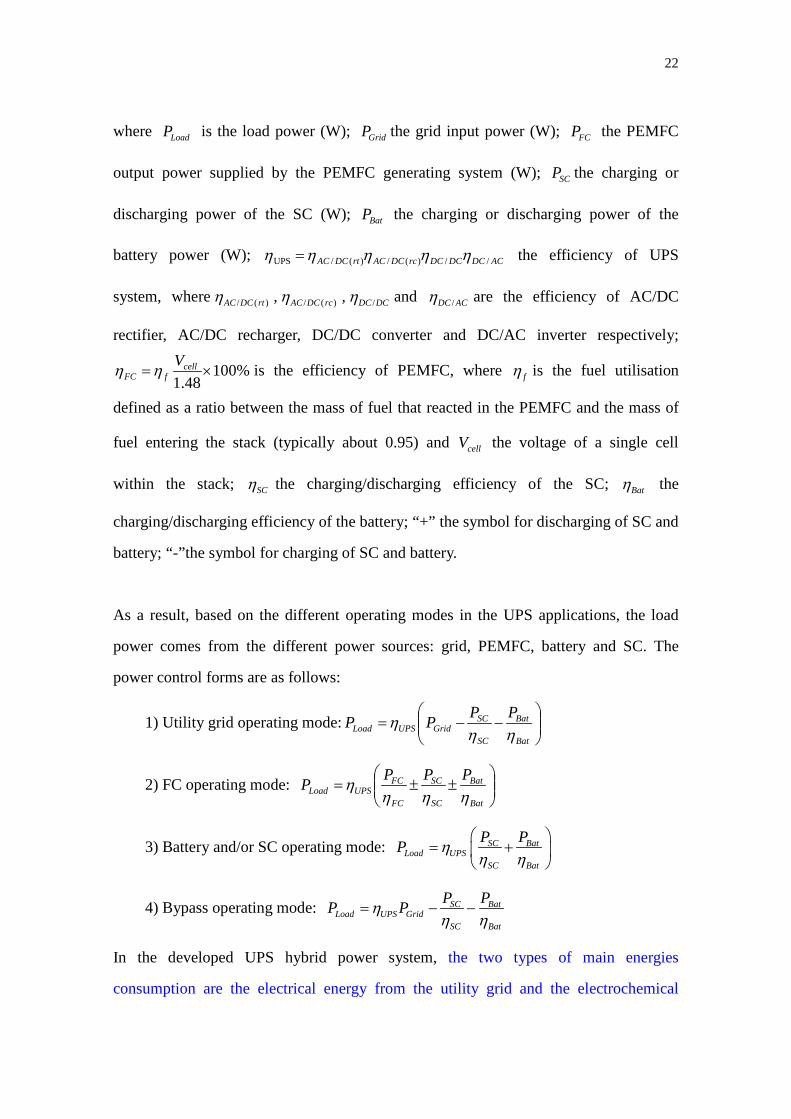
The electrical power and energy output can be easily calculated from the well-known
formulas P VI= and E Pt VIt= = . As depicted in Fig. 2, if the losses of power and
energy for main components (AC/DC rectifier, AC/DC recharger, DC/AC inverter,
PEMFC, battery, and SC) in the system are considered, the classical power output
conservative law of the grid/PEMFC/battery/SC hybrid power sources can be written as
follows
±±+=
Bat
Bat
SC
SC
FC
FCGridUPSLoad
PPPPPηηη
η (24)
22
where LoadP is the load power (W); GridP the grid input power (W); FCP the PEMFC
output power supplied by the PEMFC generating system (W); SCP the charging or
discharging power of the SC (W); BatP the charging or discharging power of the
battery power (W); ACDCDCDCrcDCACrtDCAC //)(/)(/UPS ηηηηη = the efficiency of UPS
system, where / ( )AC DC rtη , / ( )AC DC rcη , /DC DCη and /DC ACη are the efficiency of AC/DC
rectifier, AC/DC recharger, DC/DC converter and DC/AC inverter respectively;
%10048.1
×= cellfFC
Vηη is the efficiency of PEMFC, where fη is the fuel utilisation
defined as a ratio between the mass of fuel that reacted in the PEMFC and the mass of
fuel entering the stack (typically about 0.95) and cellV the voltage of a single cell
within the stack; SCη the charging/discharging efficiency of the SC; Batη the
charging/discharging efficiency of the battery; “+” the symbol for discharging of SC and
battery; “-”the symbol for charging of SC and battery.
As a result, based on the different operating modes in the UPS applications, the load
power comes from the different power sources: grid, PEMFC, battery and SC. The
power control forms are as follows:
1) Utility grid operating mode:
−−=
Bat
Bat
SC
SCGridUPSLoad
PPPPηη
η
2) FC operating mode:
±±=
Bat
Bat
SC
SC
FC
FCUPSLoad
PPPPηηη
η
3) Battery and/or SC operating mode: SC BatLoad UPS
SC Bat
P PP ηη η
= +
4) Bypass operating mode: SC BatLoad UPS Grid
SC Bat
P PP Pηη η
= − −
In the developed UPS hybrid power system, the two types of main energies
consumption are the electrical energy from the utility grid and the electrochemical
23
energy from the PEMFC, which is the electrochemical energy conversion device. That
is, hydrogen energy is converted into electrical energy and heat. However, the chemical
energy of input and output of H2, O2, and H2O is not so easily defined, and terms such
as the enthalpy, Helmholtz function, and Gibbs free energy are used. Since the PEMFC
uses materials that are usually burnt to release their energy, it would make sense to
compare the electrical energy produced with the heat that would be produced by
burning the fuel. So the energy and efficiency of a PEMFC are defined by the electrical
energy produced and the Gibbs free energy change.
4.2.1.2. Energy management modes
The SC and battery are the electrochemical energy storage devices. When their
electrochemical energy systems are connected to an external source, they are charged by
the electrical source from the utility grid or PEMFC and a finite charge Q is stored. So
the systems convert the electric energy into the stored chemical energy in charging
process. When the systems are connected to an external circuit DC/DC converter of
UPS system, they release the finite Q and drive a current through the external circuit.
The systems convert the stored chemical energy into electric energy in discharging
process.
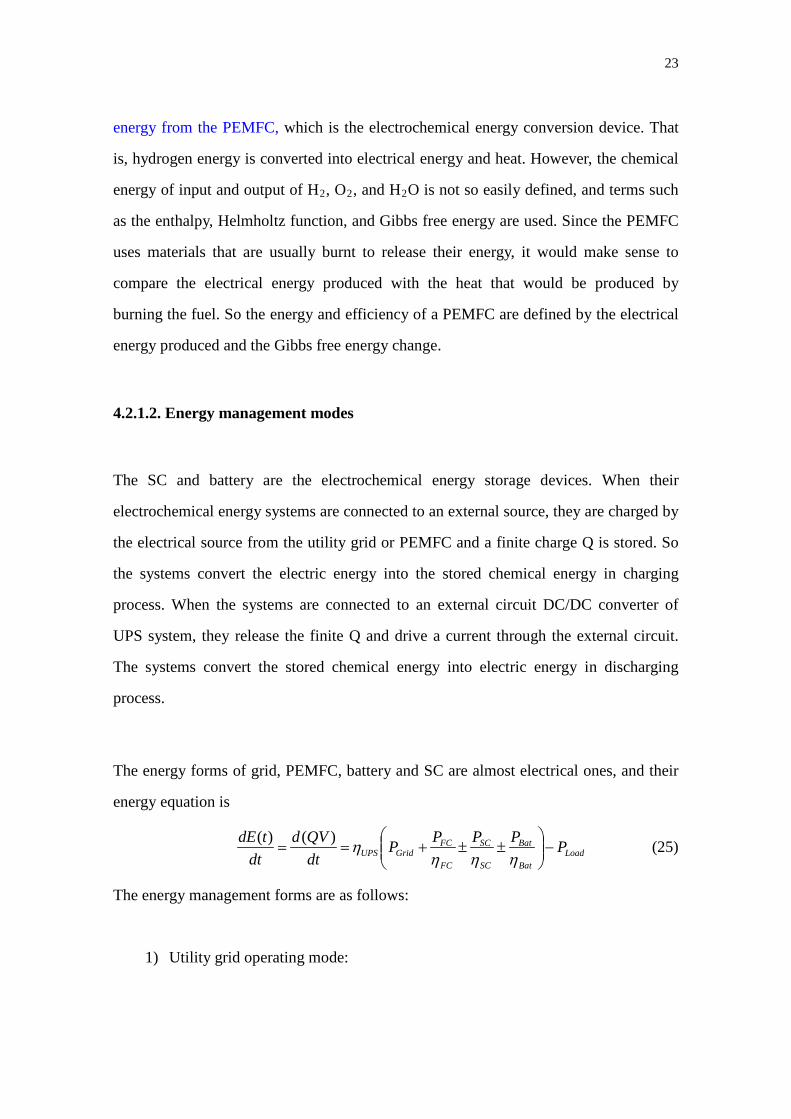
The energy forms of grid, PEMFC, battery and SC are almost electrical ones, and their
energy equation is
LoadBat
Bat
SC
SC
FC
FCGridUPS PPPPP
dtQVd
dttdE
−
±±+==ηηη
η)()( (25)
The energy management forms are as follows:
1) Utility grid operating mode:
24
LoadBat
Bat
SC
SCGridUPS
Grid PPPPdt
tdE−
−−=ηη
η)(
2) FC operating mode: LoadBat
Bat
SC
SC
FC
FCUPS
FC PPPPdt
tdE−
±±=ηηη
η)(
3) Battery operating mode:
LoadBat
BatUPS
Bat PPdt
tdE−=
ηη)(
And/or SC operating mode:
LoadSC
SCUPS
SC PPdt
tdE−=
ηη)(
4) Bypass operating mode: LoadBat
Bat
SC
SCGridUPS
Grid PPPPdt
tdE−−−=
ηηη)(
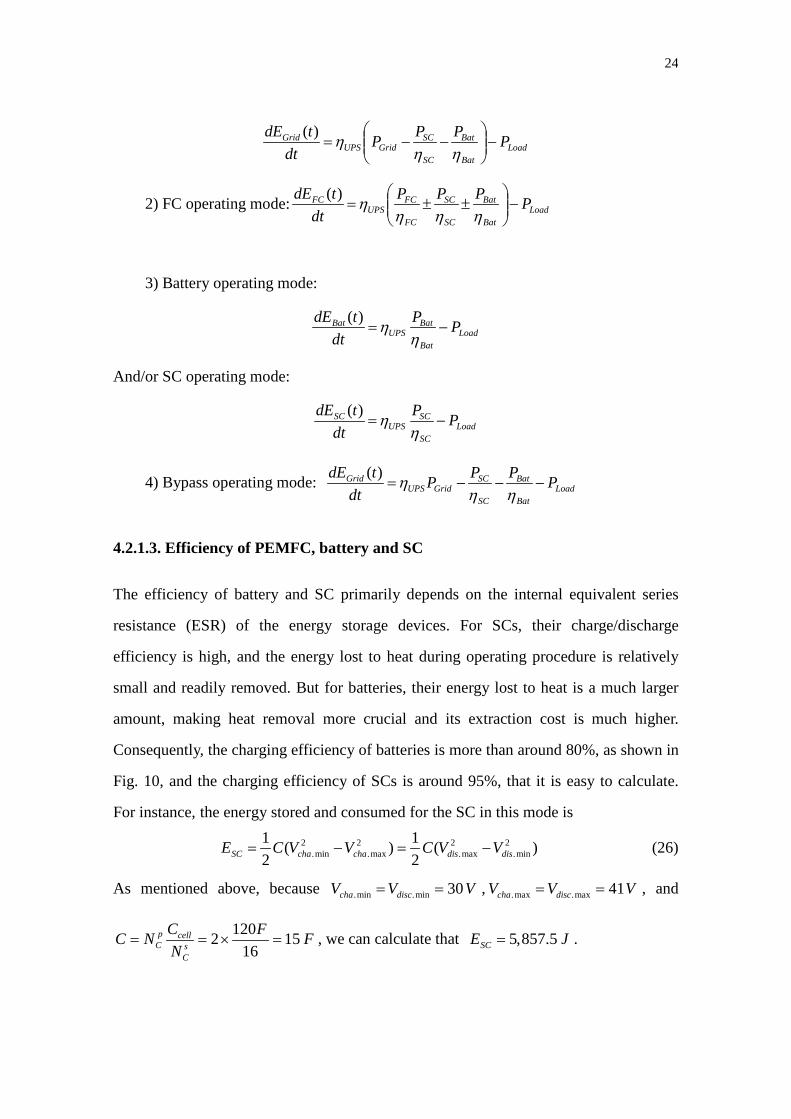
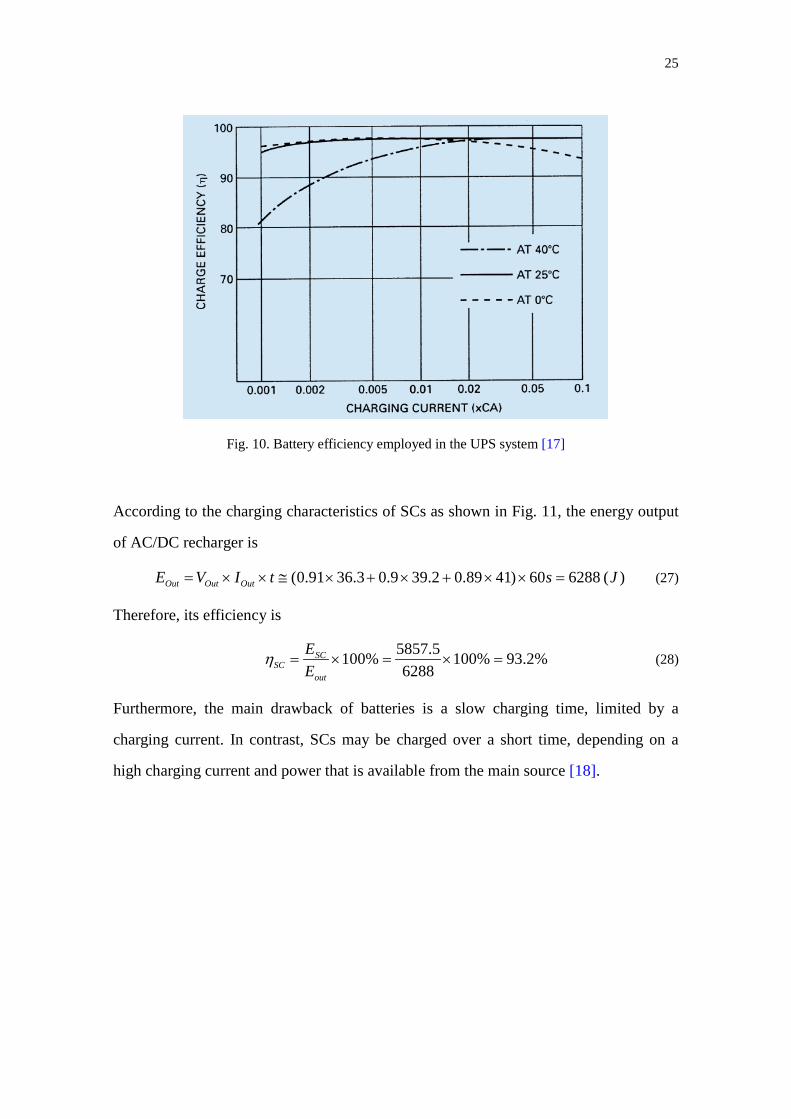
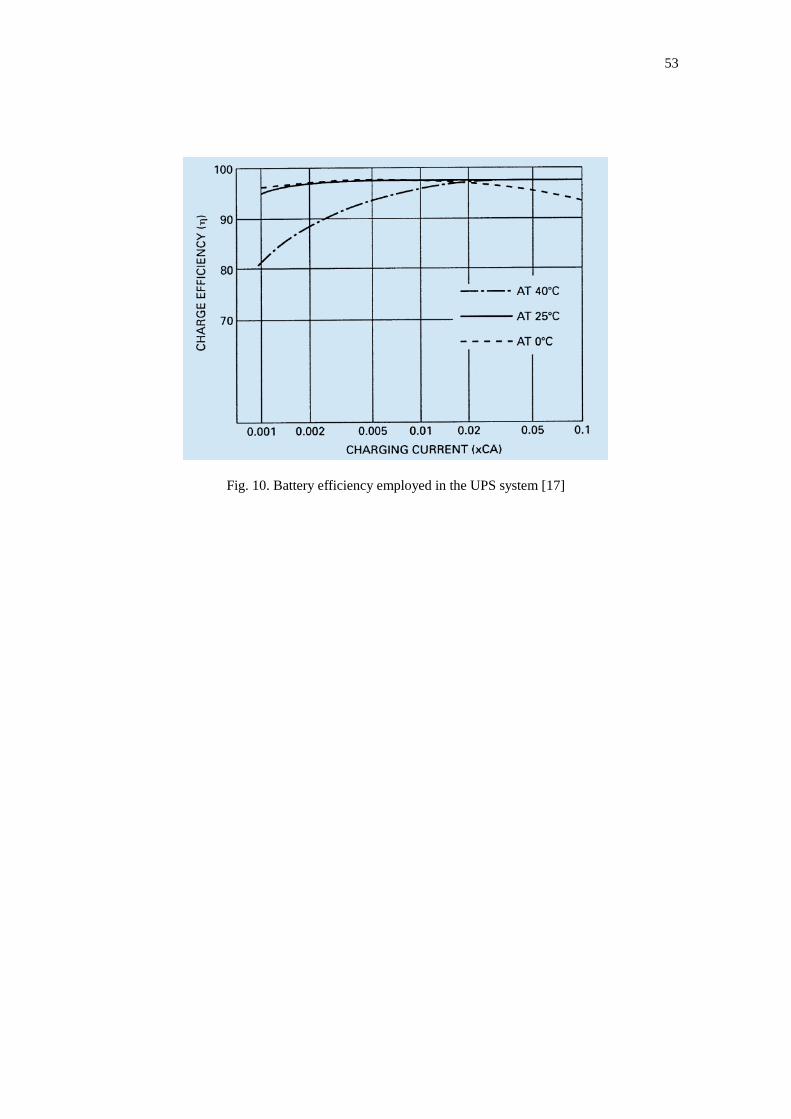
4.2.1.3. Efficiency of PEMFC, battery and SC The efficiency of battery and SC primarily depends on the internal equivalent series
resistance (ESR) of the energy storage devices. For SCs, their charge/discharge
efficiency is high, and the energy lost to heat during operating procedure is relatively
small and readily removed. But for batteries, their energy lost to heat is a much larger
amount, making heat removal more crucial and its extraction cost is much higher.
Consequently, the charging efficiency of batteries is more than around 80%, as shown in
Fig. 10, and the charging efficiency of SCs is around 95%, that it is easy to calculate.
For instance, the energy stored and consumed for the SC in this mode is
2 2 2 2.min .max .max .min
1 1( ) ( )2 2SC cha cha dis disE C V V C V V= − = − (26)
As mentioned above, because .min .min 30cha discV V V= = , .max .max 41cha discV V V= = , and
1202 1516
p cellC s
C
C FC N FN
= = × = , we can calculate that 5,857.5SCE J= .
25
Fig. 10. Battery efficiency employed in the UPS system [17]
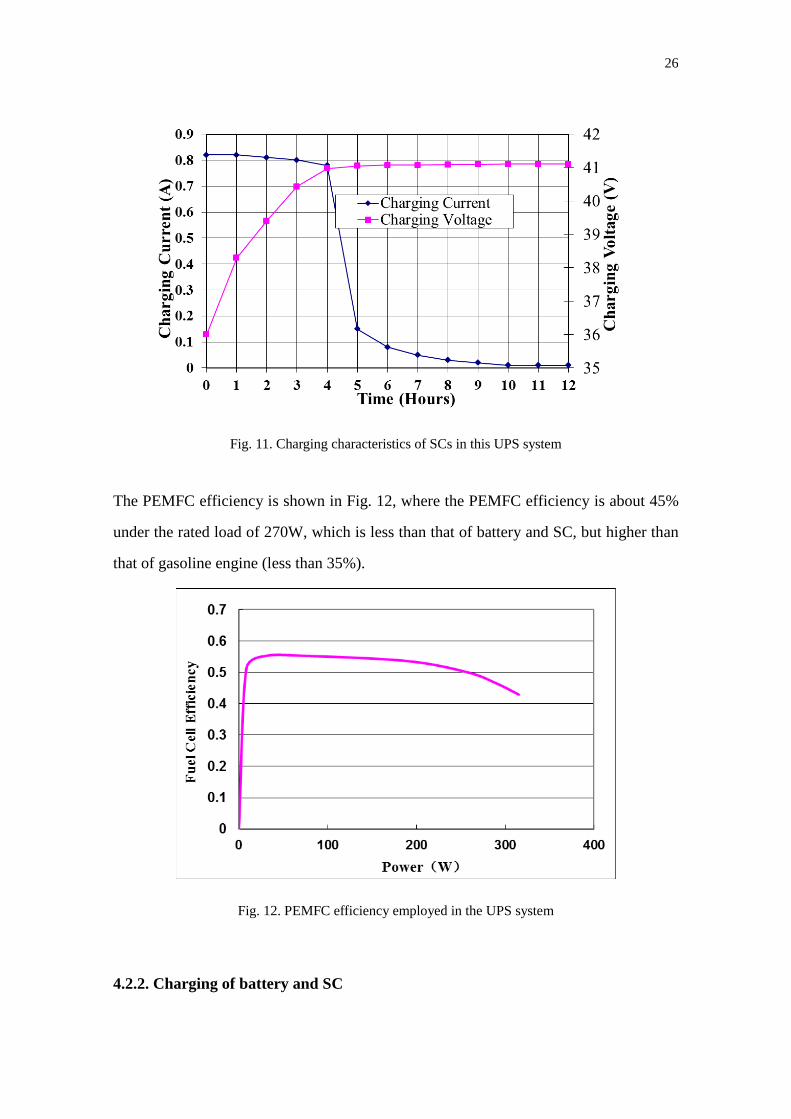
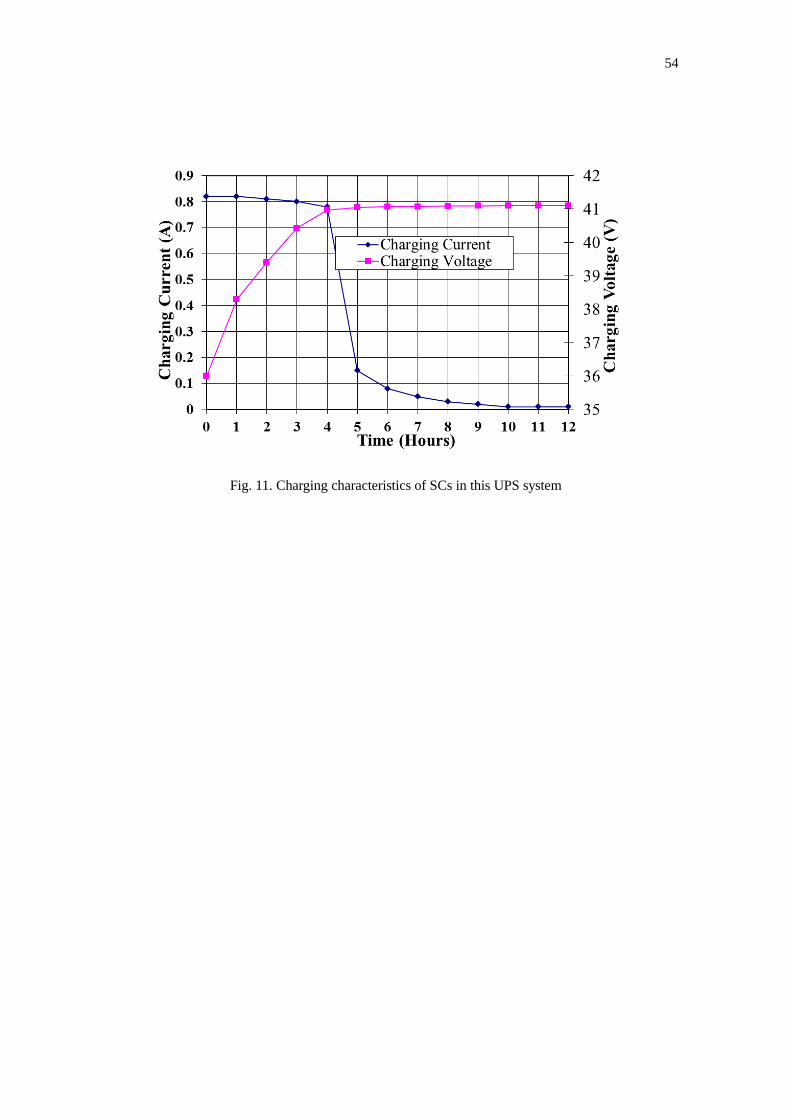
According to the charging characteristics of SCs as shown in Fig. 11, the energy output
of AC/DC recharger is
(0.91 36.3 0.9 39.2 0.89 41) 60 6288 ( )Out Out OutE V I t s J= × × ≅ × + × + × × = (27)
Therefore, its efficiency is
5857.5100% 100% 93.2%6288
SCSC
out
EE
η = × = × = (28)
Furthermore, the main drawback of batteries is a slow charging time, limited by a
charging current. In contrast, SCs may be charged over a short time, depending on a
high charging current and power that is available from the main source [18].
26
Fig. 11. Charging characteristics of SCs in this UPS system
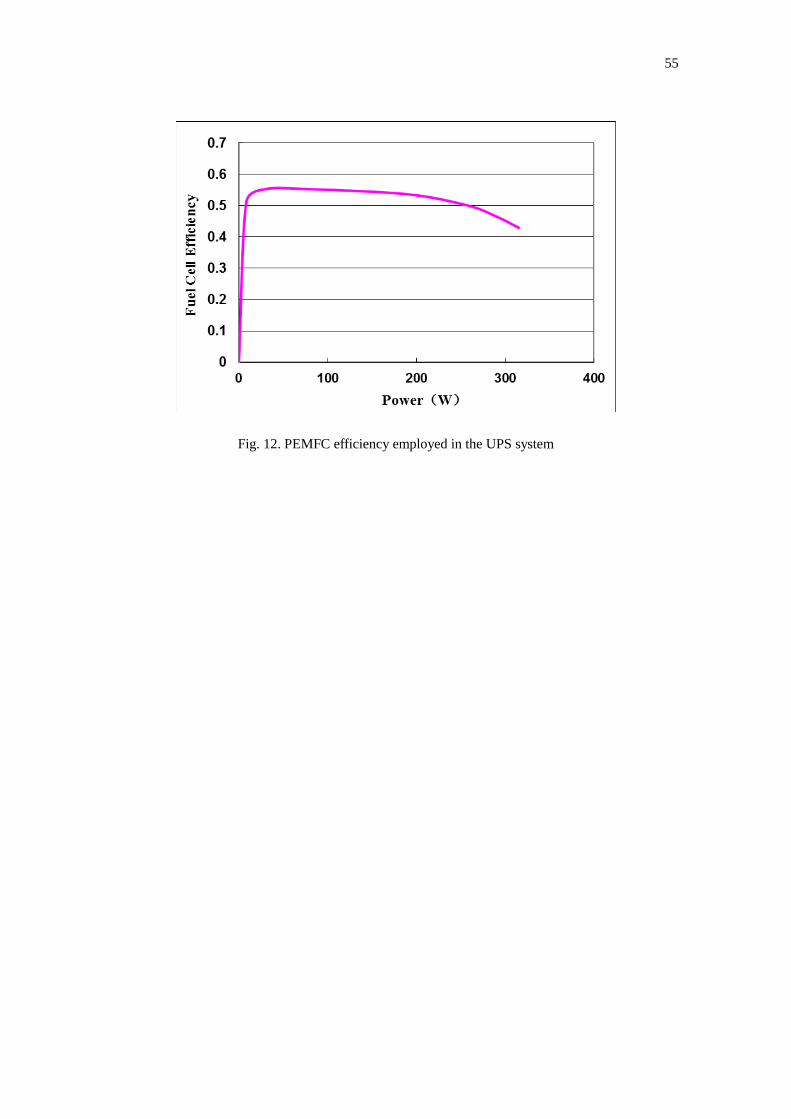
The PEMFC efficiency is shown in Fig. 12, where the PEMFC efficiency is about 45%
under the rated load of 270W, which is less than that of battery and SC, but higher than
that of gasoline engine (less than 35%).
Fig. 12. PEMFC efficiency employed in the UPS system
4.2.2. Charging of battery and SC
27
A basic switch power system with universal input voltage and adjustable output voltage
is designed as the battery charger based on a high-performance current mode PWM
controller UC3845, which is almost constant-current and constant-voltage charging
circuit. When the utility grid power fails and the PEMFC supplies the UPS hybrid
system in the normal mode, the PEMFC can also charge the battery if the battery
voltage is less than the rated value, but the PEMFC cannot release the charging of the
constant current and constant voltage (41V/1A) for lead-acid battery, unless a DC/DC
converter is designed to charge the battery through the PEMFC, or the system efficiency
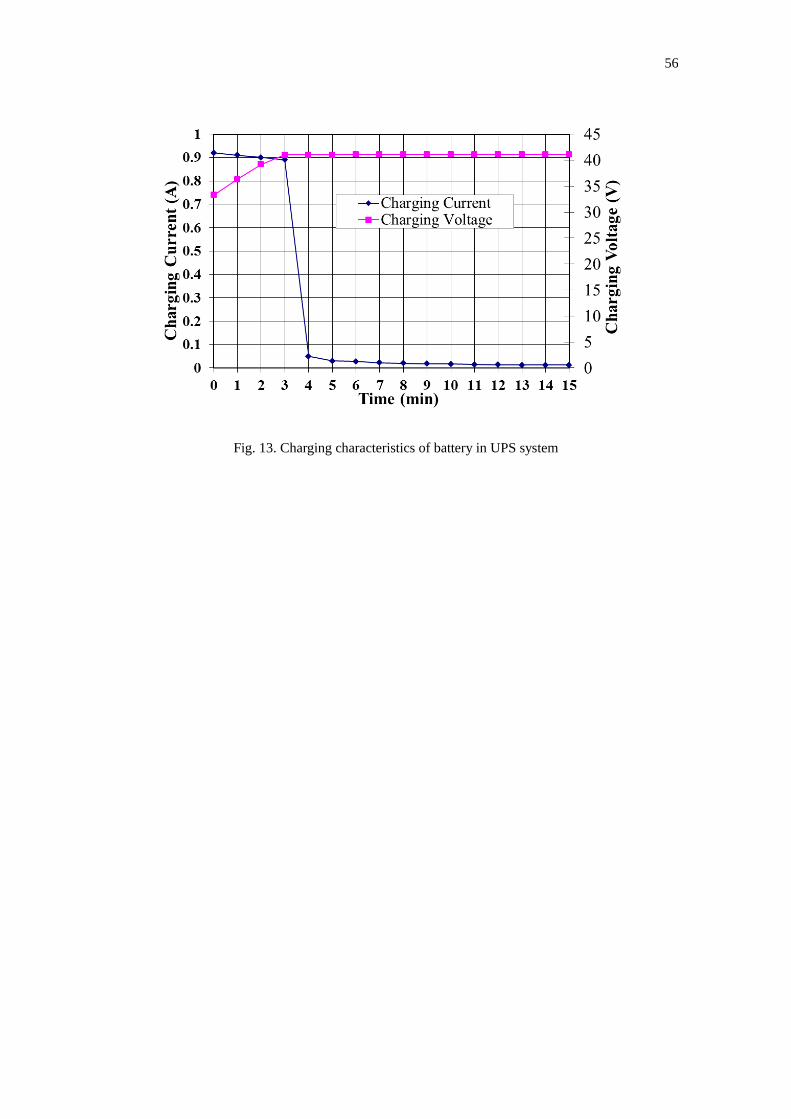
will be affected. On the other hand, when charging and discharging a battery, not all the
energy is delivered into and from the battery due to battery losses, which are
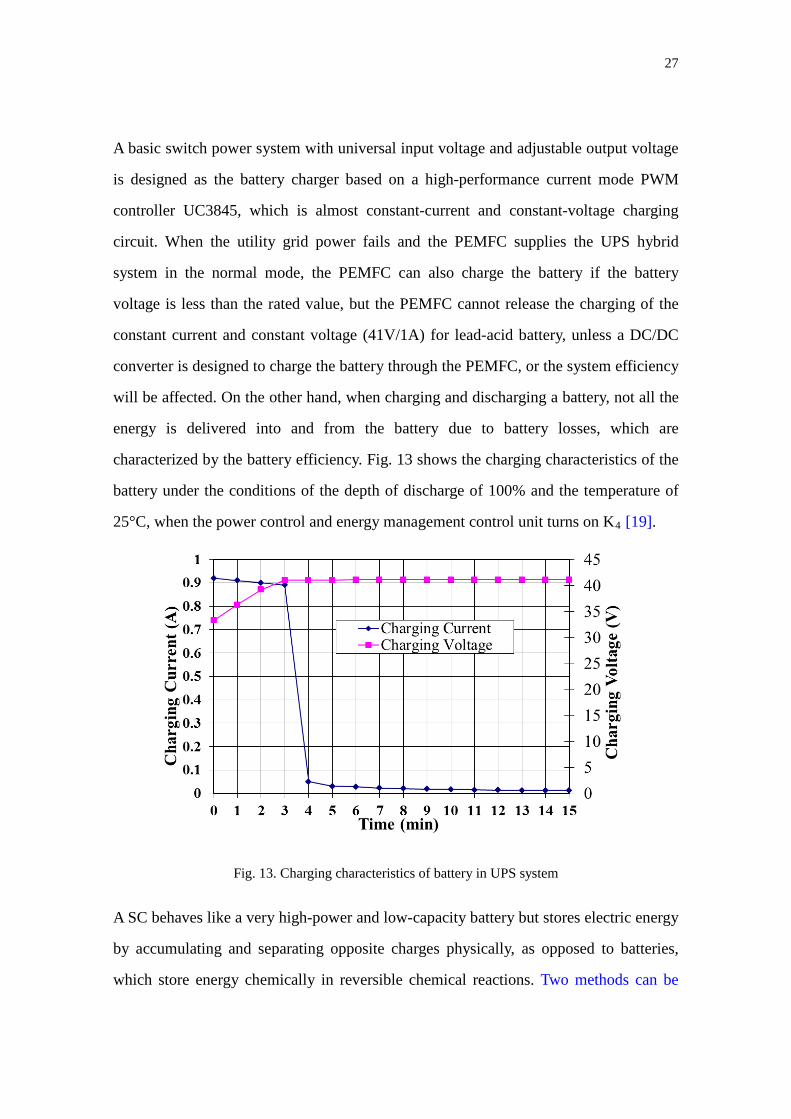
characterized by the battery efficiency. Fig. 13 shows the charging characteristics of the
battery under the conditions of the depth of discharge of 100% and the temperature of
25°C, when the power control and energy management control unit turns on K4 [19].
Fig. 13. Charging characteristics of battery in UPS system
A SC behaves like a very high-power and low-capacity battery but stores electric energy
by accumulating and separating opposite charges physically, as opposed to batteries,
which store energy chemically in reversible chemical reactions. Two methods can be
28
employed to charge the SC in the system. One is the same as the method to charge the
battery, and Fig. 12 shows the charging characteristics under the conditions of the
constant current and constant voltage when the power control and energy management
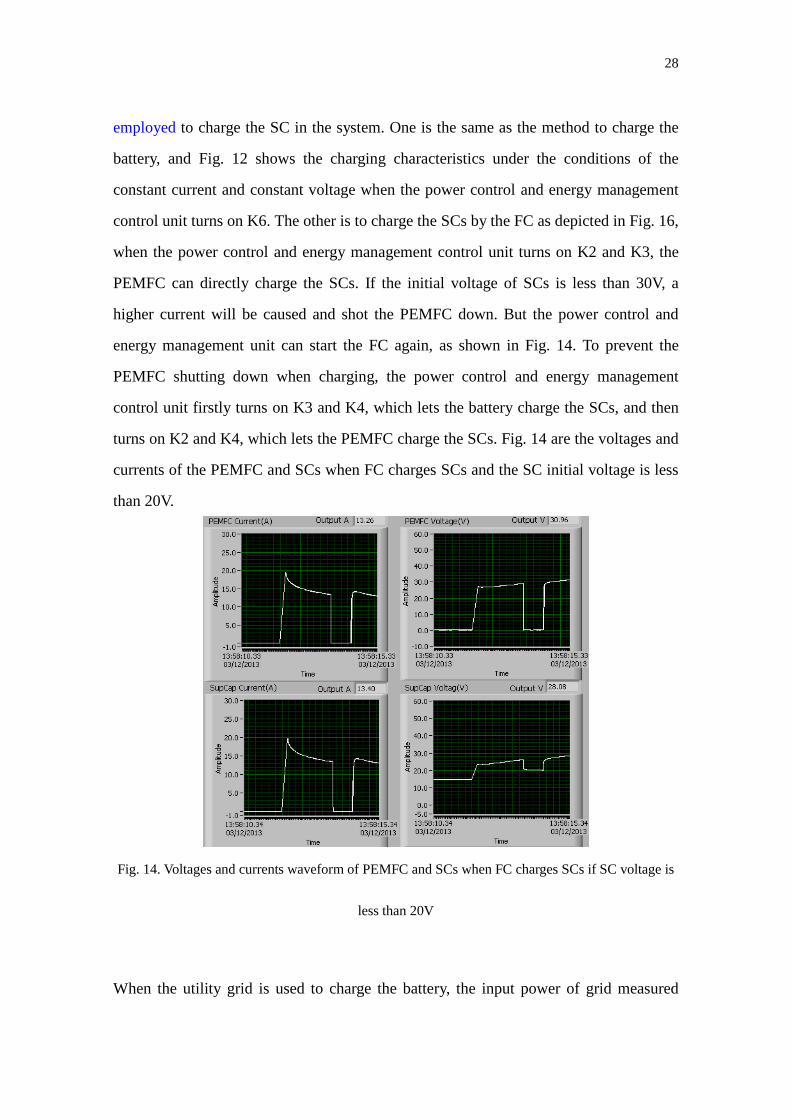
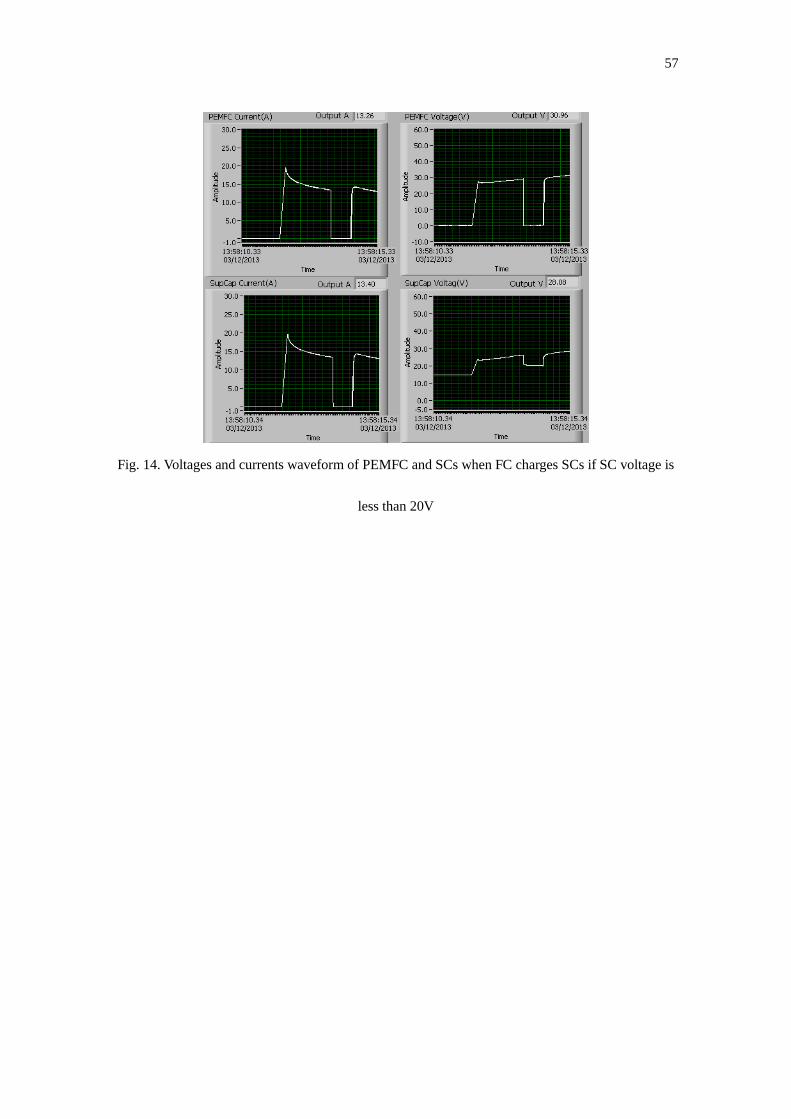
control unit turns on K6. The other is to charge the SCs by the FC as depicted in Fig. 16,
when the power control and energy management control unit turns on K2 and K3, the
PEMFC can directly charge the SCs. If the initial voltage of SCs is less than 30V, a
higher current will be caused and shot the PEMFC down. But the power control and
energy management unit can start the FC again, as shown in Fig. 14. To prevent the
PEMFC shutting down when charging, the power control and energy management
control unit firstly turns on K3 and K4, which lets the battery charge the SCs, and then
turns on K2 and K4, which lets the PEMFC charge the SCs. Fig. 14 are the voltages and
currents of the PEMFC and SCs when FC charges SCs and the SC initial voltage is less
than 20V.
Fig. 14. Voltages and currents waveform of PEMFC and SCs when FC charges SCs if SC voltage is
less than 20V
When the utility grid is used to charge the battery, the input power of grid measured
29
is 0.436 241.6 105.3GridP IV A V W= = × = , and the input power of battery measured
is 0.84 35.8 29.9BatP IV A V W= = × = , hence, the efficiency of AC/DC recharger
is ( . ) / ( ) 28.4%UPS Bat Cha AC DC rcη η= = .
When the utility grid is used to charge the SC, the input power of grid measured
is 0.321 242.1 77.7GridP IV A V W= = × = , and the input power of battery measured
is 0.92 33.3 30.6BatP IV A V W= = × = , consequently, the efficiency of AC/DC recharger
is ( . ) / ( ) 39.4%UPS SC Cha AC DC rcη η= = .
4.2.3. Discharging of SC and battery The discharging dynamics of battery and SC are dependent on the dynamics of their
equivalent circuits, which have a finite charge capacity maxQ , and their open circuit
voltages are dependent on their current charge stateQ .
4.2.3.1. Discharging of SC Discharging of a SC is a simple example of electrochemical energy storage device.
According to equation (14), the discharging current is
CdQ dVI Cdt dt
= − = − (29)
The voltage applied to the external resistance is
cell loadC
QV IR IRV
= − = (30)
Suppose the total resistance cell loadR R R= + , the discharging time sCT equals
approximately the decay time RCτ = .
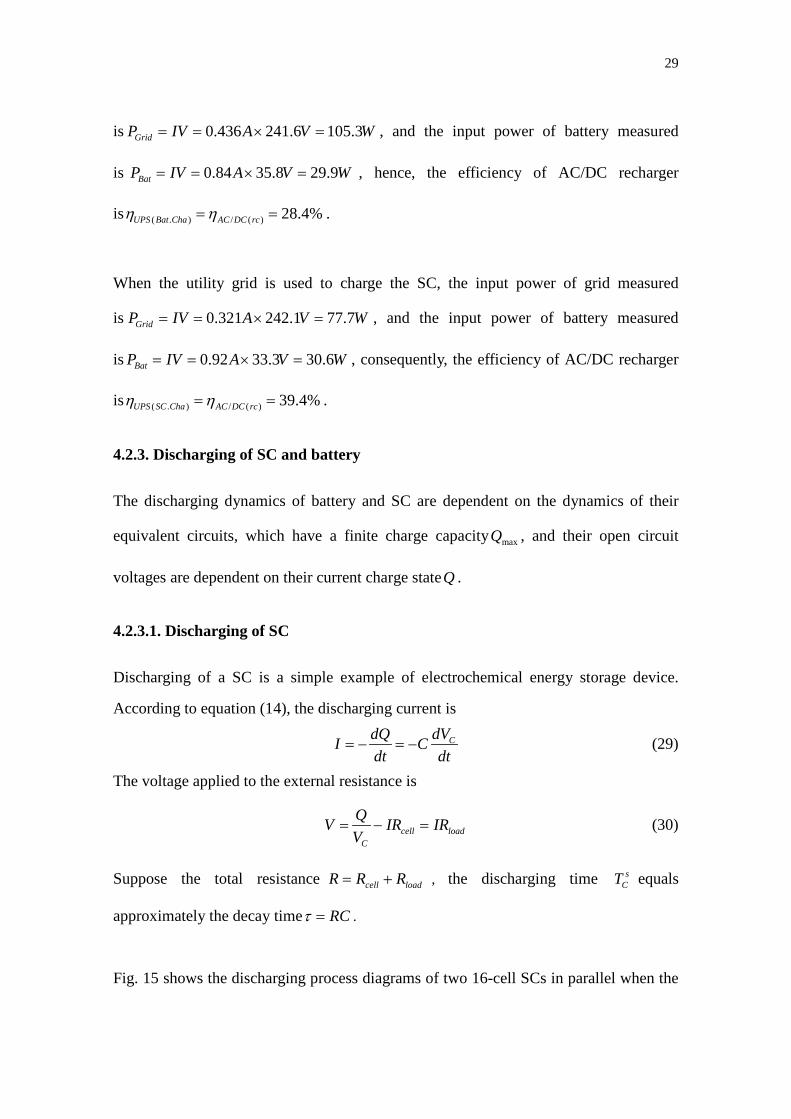
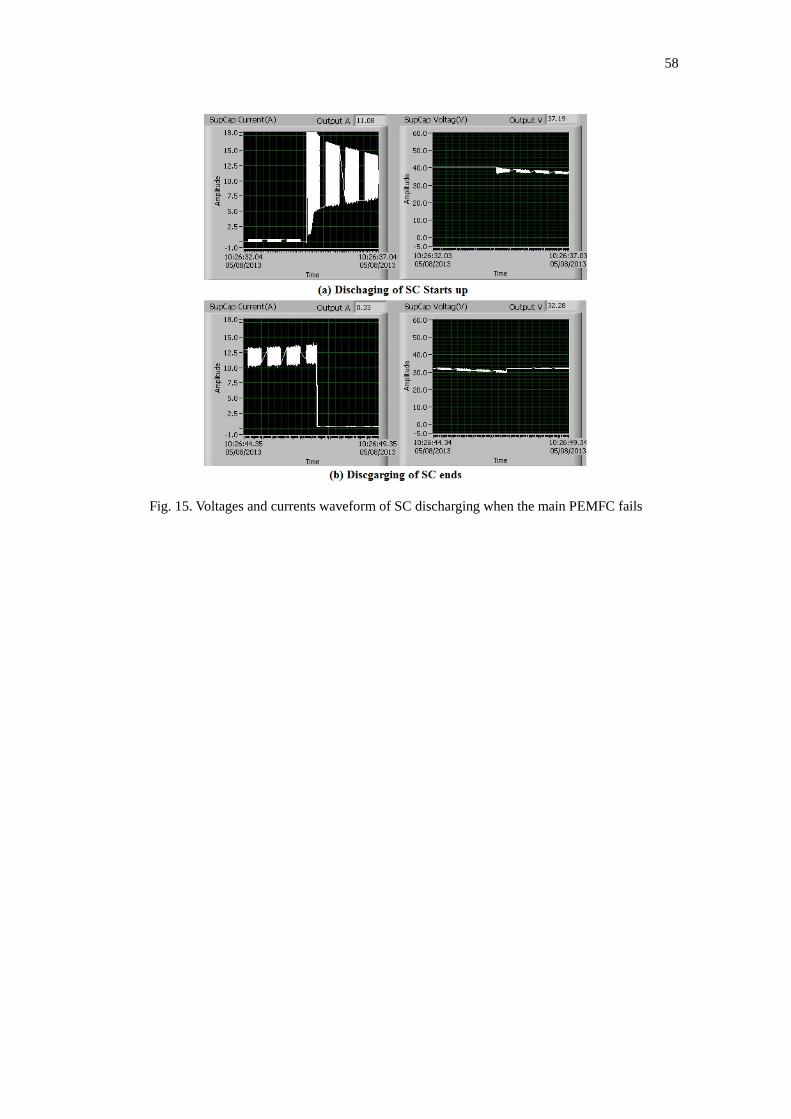
Fig. 15 shows the discharging process diagrams of two 16-cell SCs in parallel when the
30
main PEMFC fails. The load of UPS is at the rated power of 270W, and the minimum
SC discharging voltage is 30V. The discharging time is about 13 s (starting time:
10:26:34.04, ending time: 10:26:47.35, which does not meet the demand of theoretical
design of 15 s. Because the measured efficiency of UPS in this mode is 75%, the
discharging current is
min
270 12( )30 0.75
PI AV η
= = =×
On the other hand, the balance of the SCs used in series is a main issue, that is, some
cell voltages of them are less than 2.7 V after charged. The discharging time is less than
15 s (designed value).
Fig. 15. Voltages and currents waveform of SC discharging when the main PEMFC fails
4.2.3.2. Discharging of battery Because the open circuit voltage of lead-acid battery is a function of charge and the
current, a simple equivalent circuit for a battery can thus be written as
0( ) ( , ) loadV V Q V I Q IR= − = (31)
31
where 0( )V Q is the open circuit voltage when 0I = ; ( , )V I Q the cell overpotential
(relative to the equilibrium), which is a positive voltage loss for a positive (galvanic)
current 0I > , and negative for a negative (electrolytic) current 0I < . This model
assumes that the voltage depends only on the instantaneous current and state of charge,
and not on the prior history.
For the nonlinear electrical response of a battery, the different common modes of
discharge are constant current, constant load, and constant power. In the UPS system,
discharge of battery can occur at a constant power. The voltage will drop off even faster
than that at constant current, since the current must be increased with time to
compensate for the decreasing voltage and maintain constant power, which is
tanP IV Cons t= = (32)
Substituting (18) into (19), we have
0( ) ( , )dQ dQP V Q V Qdt dt
= − (33)
This is a first-order nonlinear ordinary differential equations (ODE). It can be solved by
first obtaining dQ dt as a function of ( )Q t , which is a first order separable ODE.
Considering again a battery with open circuit voltage, which is 2
0max
( ) 1 QV t VQ
= −
, (34)
and neglecting the internal resistance, then integrating equation (20), an implicit solution for
( )Q t can be obtained as
3
0 maxmax max
13
Q QP V QQ Q
= −
(35)
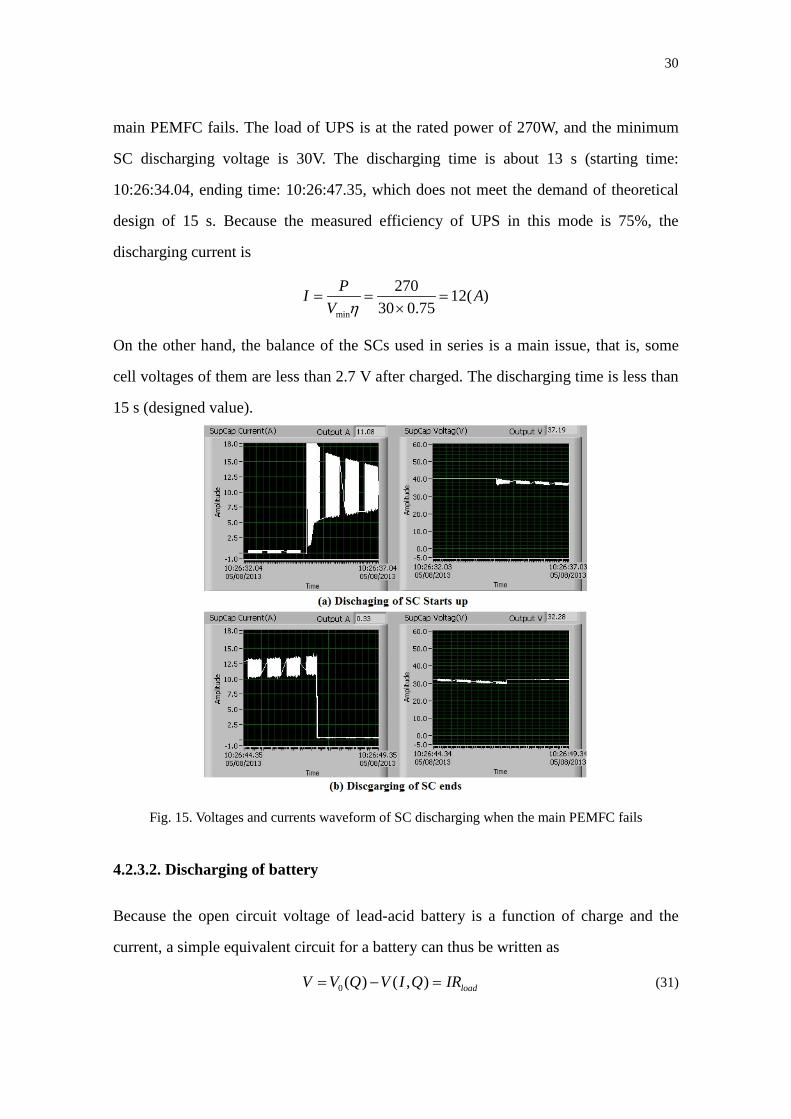
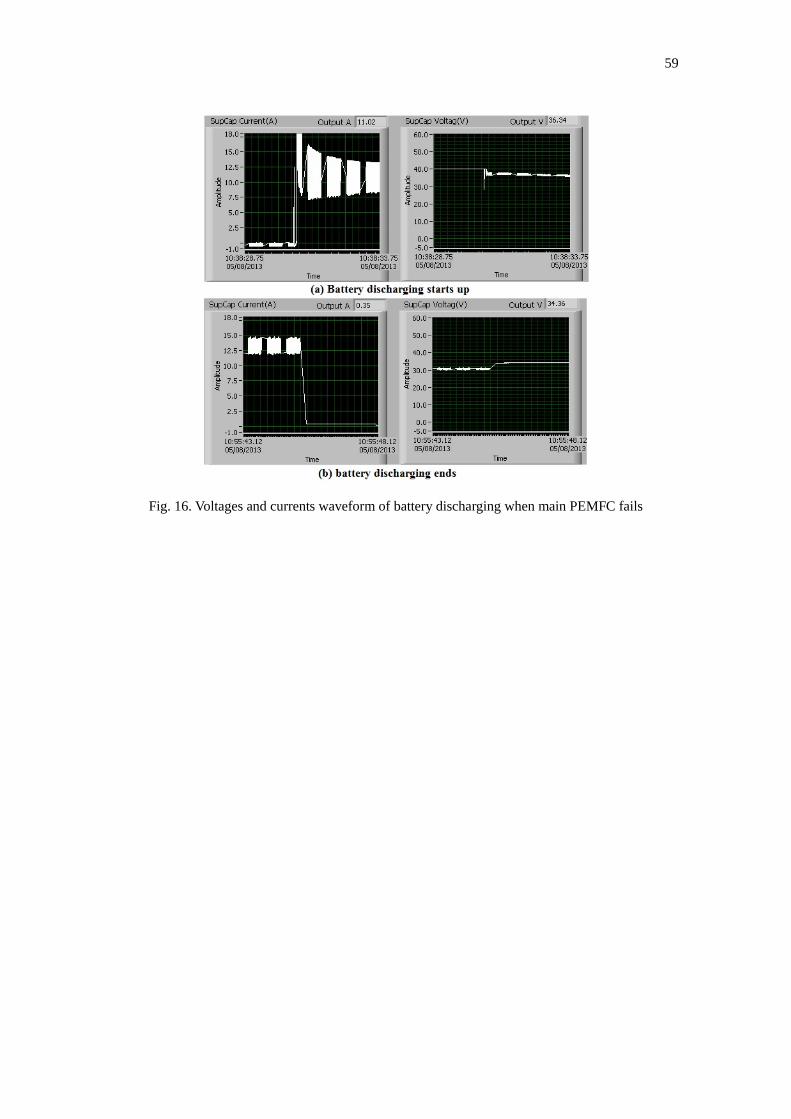
Fig. 16 shows the discharging process diagrams of 3-cell lead-acid batteries when the
main PEMFC fails, while the load of UPS is the rated power of 270W and the minimum
discharging voltage is 30V. The discharging time is 17 min and 15 s (starting time:
32
10:38:30.75, ending time: 10:55:45.75 ), which meets the demand of theoretical design.
Fig. 16. Voltages and currents waveform of battery discharging when main PEMFC fails
5. Experimental Setup and Validation
5.1. Experimental setup
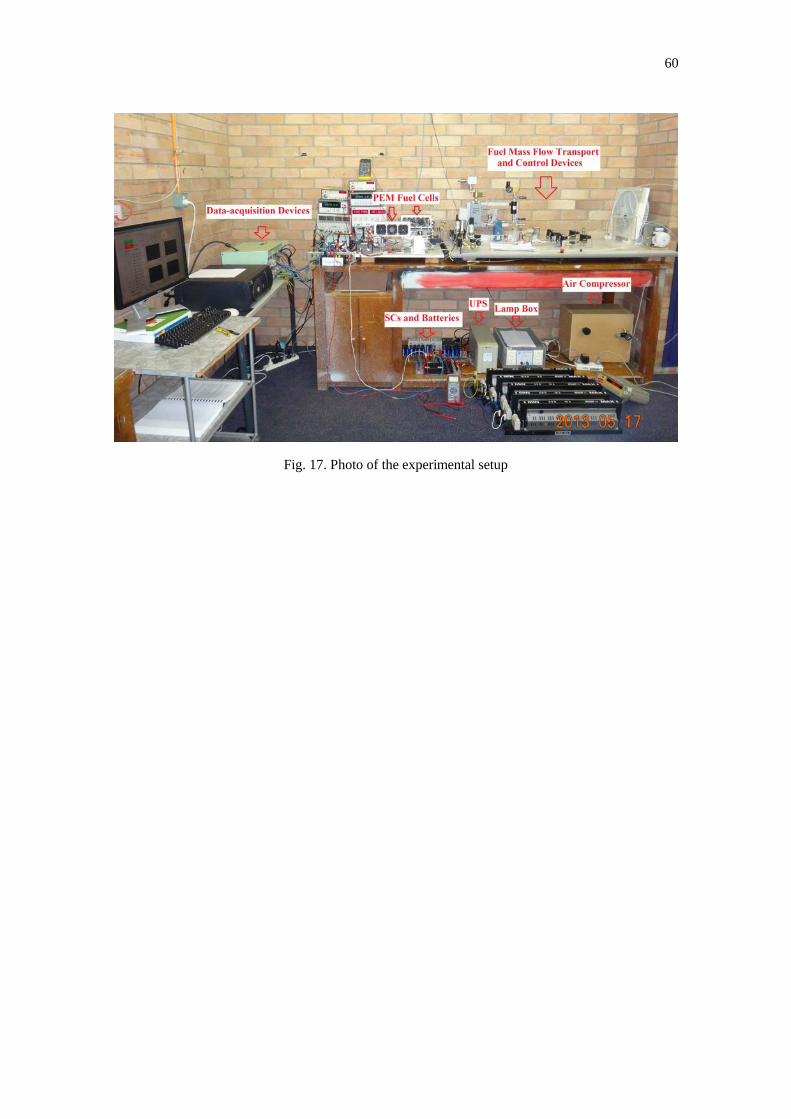
The experimental setup consists of a UPS hybrid power sources system and an intelligent
power control and energy management controller, 3-cell deep cycle lead-acid batteries,
two 16-cell 120F/2.7V of SCs, a 300W self-humidified air-breathing of PEMFC
generating system and the data-acquisition devices including multifunction analog input
unit PCI-6036E, analog output unit PCI-6713, parallel digital I/O interface PCI-6503 and
analog multiplexer with temperature sensor AMUX-64T (National Instruments). The
UPS hybrid system with backup PEMFC and SC/battery provides the AC power source
and controls the linear loads (e.g. lamp box and resistances) and nonlinear loads (i.e. PC),
while the data-acquisition system measures and records the required information. In the
PEMFC generating and testing system, both hydrogen and air are regulated by two mass
flow controllers (type: F-201C-GAS-22V and F-112AC-GAS-22V, Bronkhorst). The
33
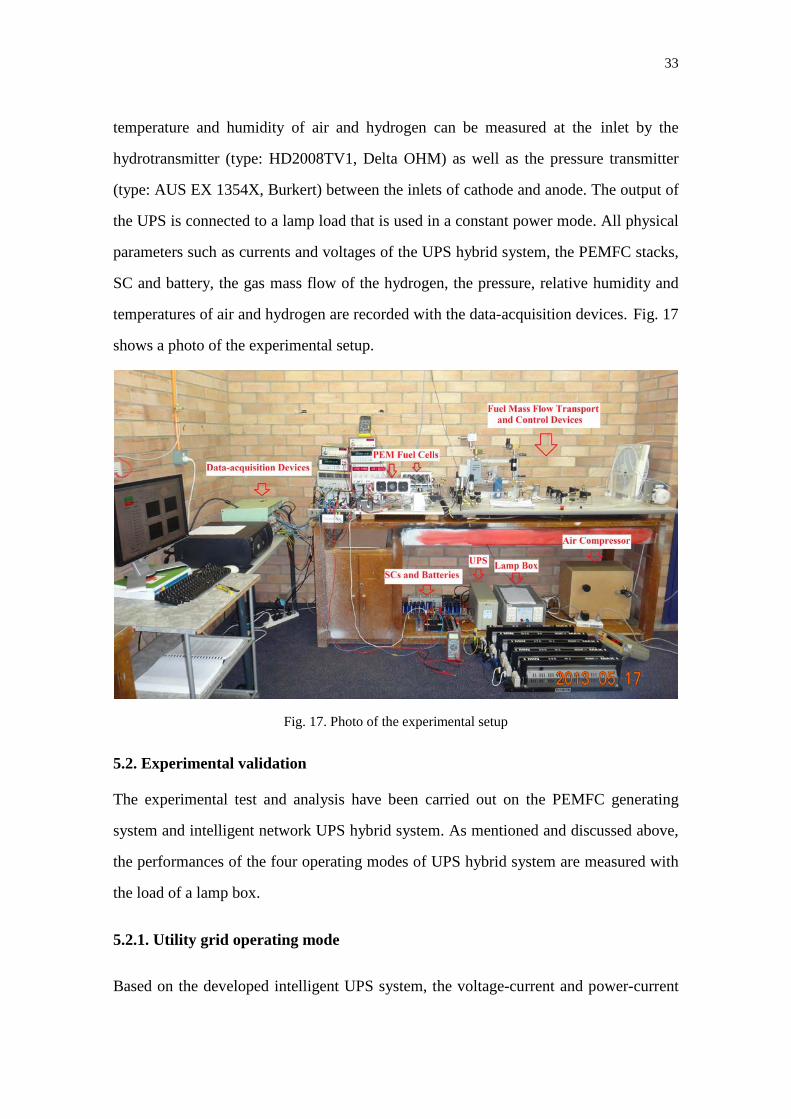
temperature and humidity of air and hydrogen can be measured at the inlet by the
hydrotransmitter (type: HD2008TV1, Delta OHM) as well as the pressure transmitter
(type: AUS EX 1354X, Burkert) between the inlets of cathode and anode. The output of
the UPS is connected to a lamp load that is used in a constant power mode. All physical
parameters such as currents and voltages of the UPS hybrid system, the PEMFC stacks,
SC and battery, the gas mass flow of the hydrogen, the pressure, relative humidity and
temperatures of air and hydrogen are recorded with the data-acquisition devices. Fig. 17
shows a photo of the experimental setup.
Fig. 17. Photo of the experimental setup
5.2. Experimental validation
The experimental test and analysis have been carried out on the PEMFC generating
system and intelligent network UPS hybrid system. As mentioned and discussed above,
the performances of the four operating modes of UPS hybrid system are measured with
the load of a lamp box.
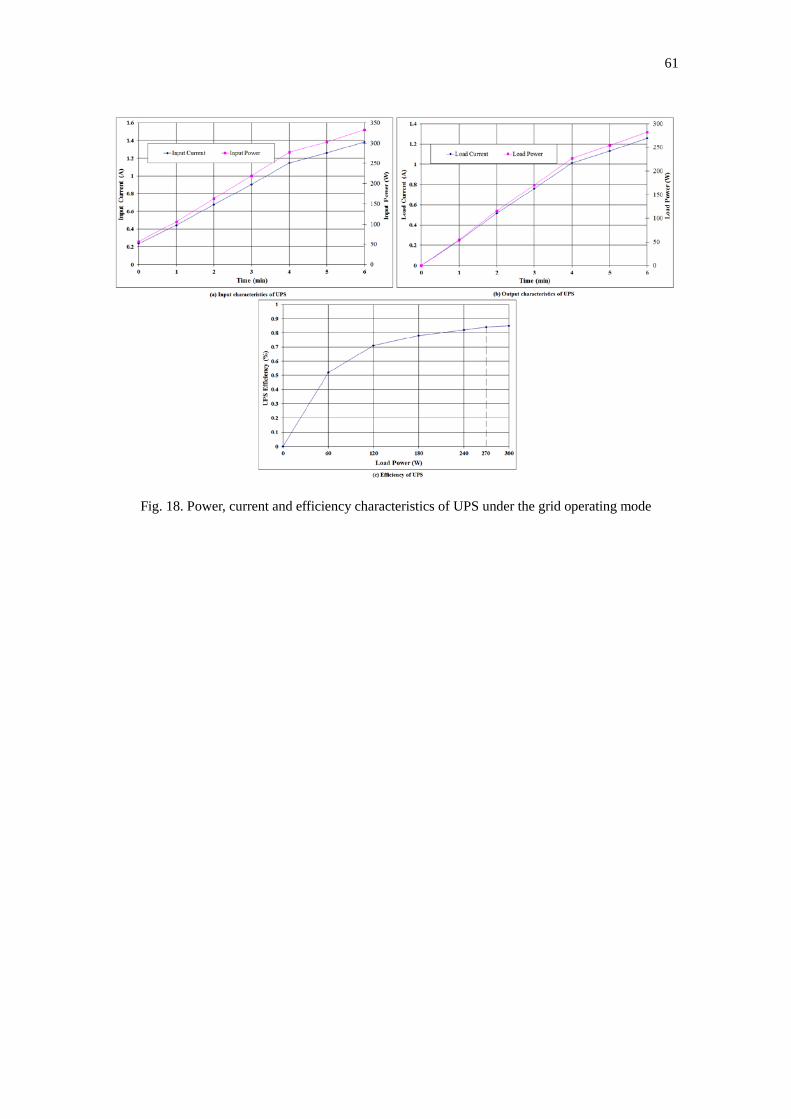
5.2.1. Utility grid operating mode Based on the developed intelligent UPS system, the voltage-current and power-current
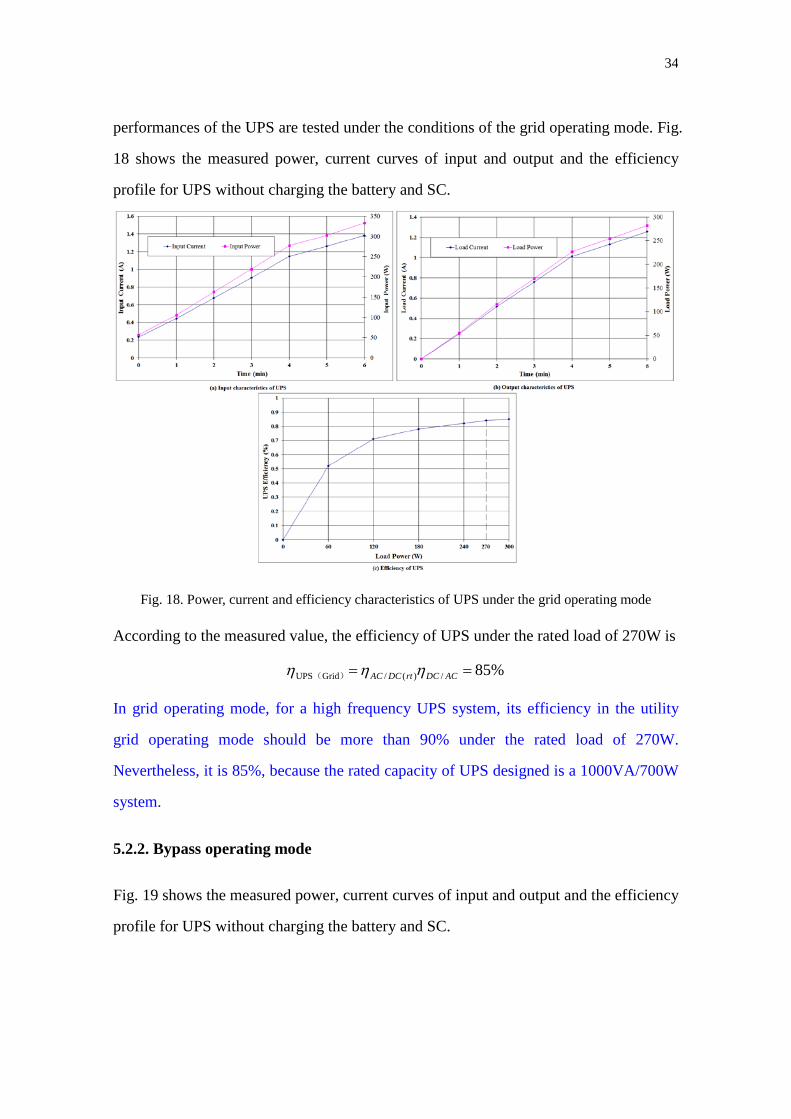
34
performances of the UPS are tested under the conditions of the grid operating mode. Fig.
18 shows the measured power, current curves of input and output and the efficiency
profile for UPS without charging the battery and SC.
Fig. 18. Power, current and efficiency characteristics of UPS under the grid operating mode
According to the measured value, the efficiency of UPS under the rated load of 270W is
%85/)(/GridUPS == ACDCrtDCAC ηηη )(
In grid operating mode, for a high frequency UPS system, its efficiency in the utility
grid operating mode should be more than 90% under the rated load of 270W.
Nevertheless, it is 85%, because the rated capacity of UPS designed is a 1000VA/700W
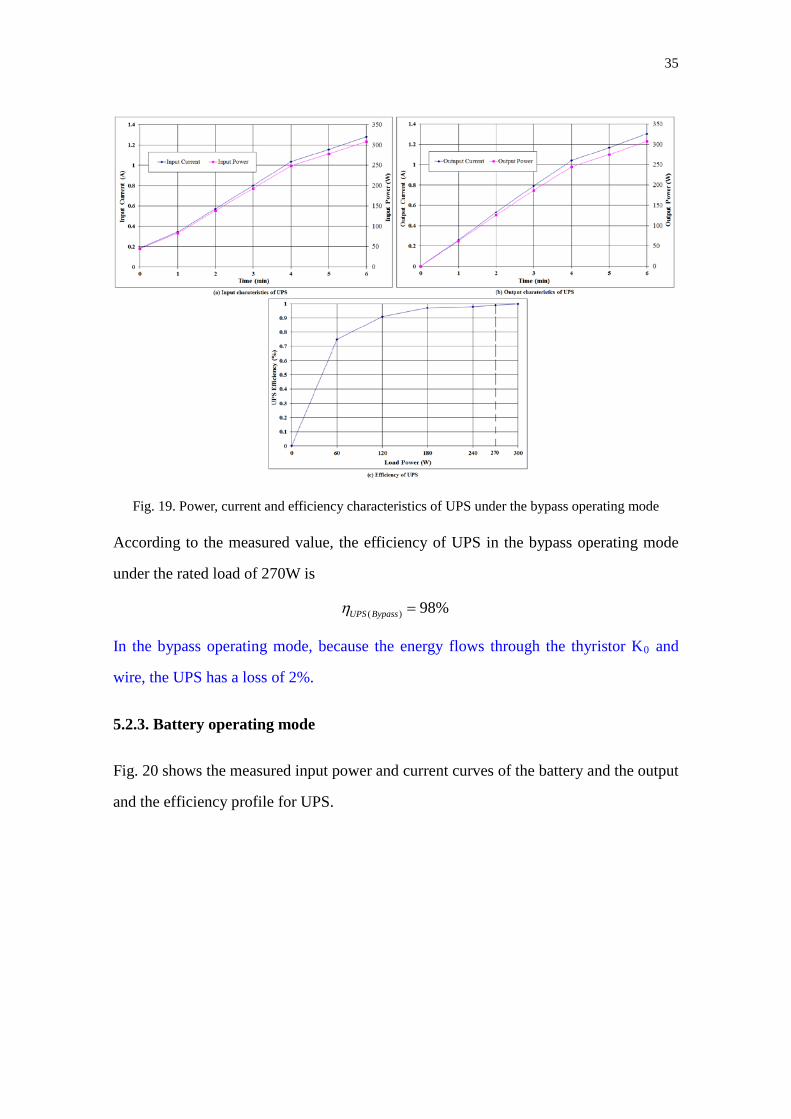
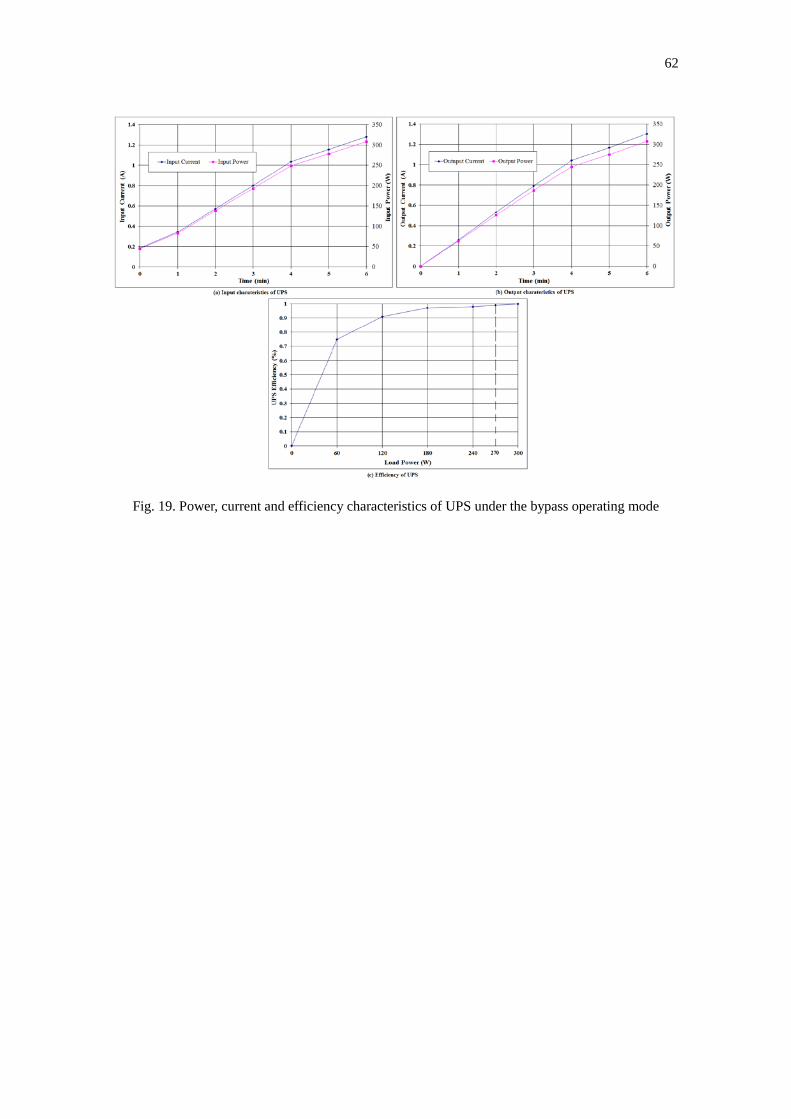
system. 5.2.2. Bypass operating mode Fig. 19 shows the measured power, current curves of input and output and the efficiency
profile for UPS without charging the battery and SC.
35
Fig. 19. Power, current and efficiency characteristics of UPS under the bypass operating mode
According to the measured value, the efficiency of UPS in the bypass operating mode
under the rated load of 270W is
( ) 98%UPS Bypassη =
In the bypass operating mode, because the energy flows through the thyristor K0 and
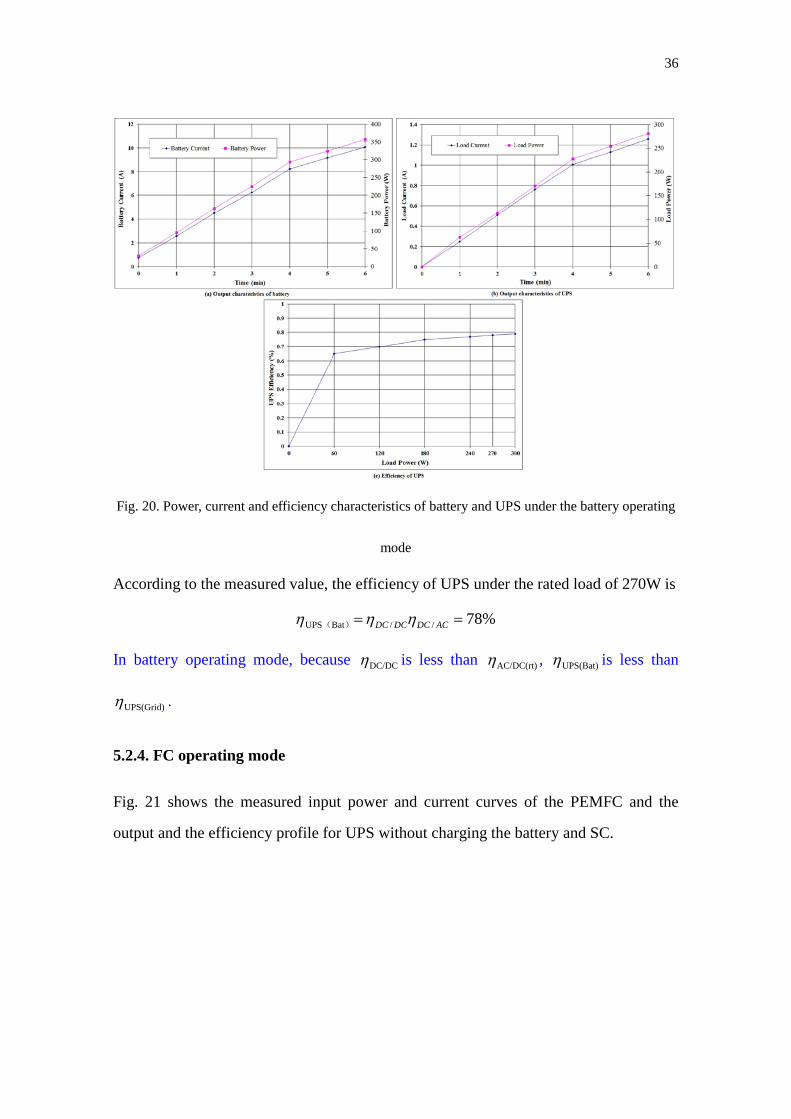
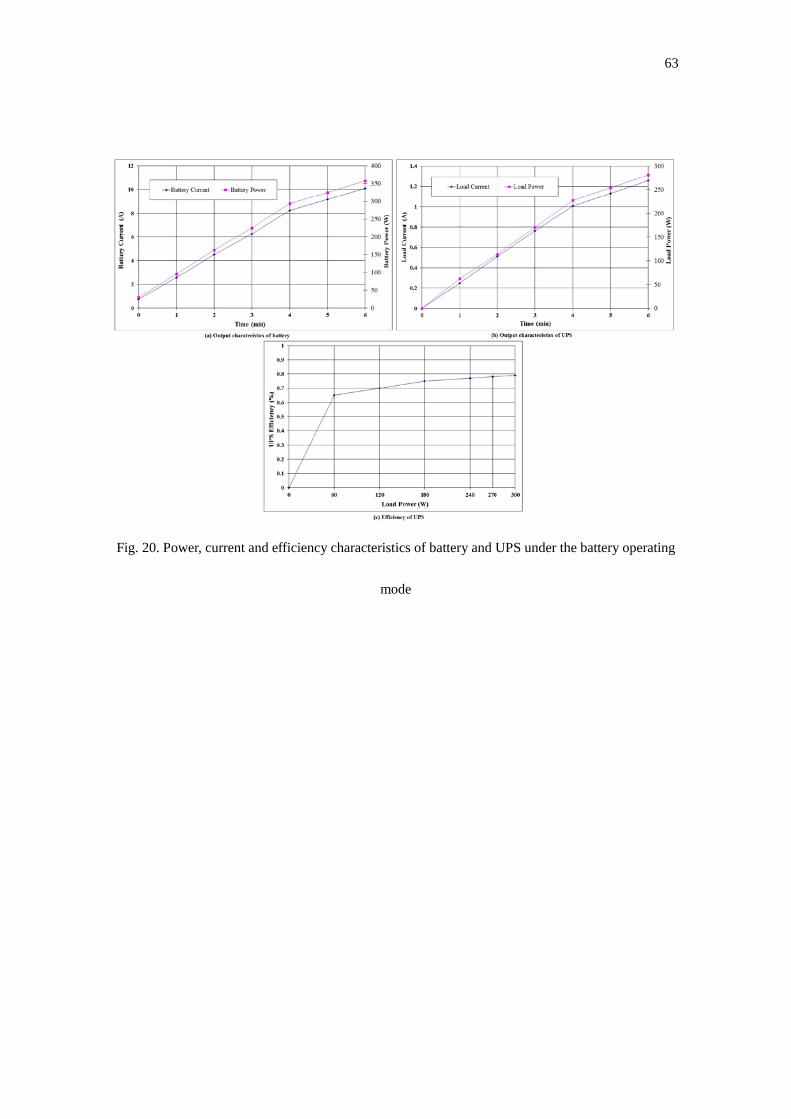
wire, the UPS has a loss of 2%. 5.2.3. Battery operating mode Fig. 20 shows the measured input power and current curves of the battery and the output
and the efficiency profile for UPS.
36
Fig. 20. Power, current and efficiency characteristics of battery and UPS under the battery operating
mode
According to the measured value, the efficiency of UPS under the rated load of 270W is
%78//BatUPS == ACDCDCDC ηηη )(
In battery operating mode, because DC/DCη is less than AC/DC(rt)η , UPS(Bat)η is less than
UPS(Grid)η .
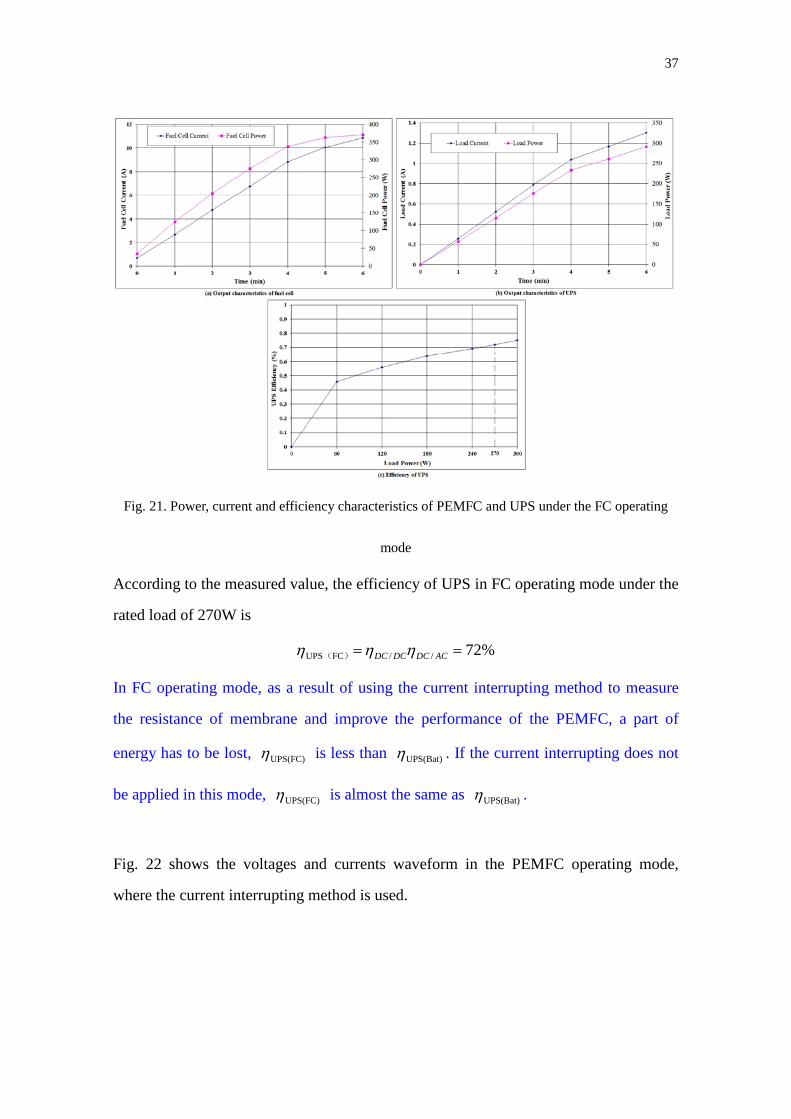
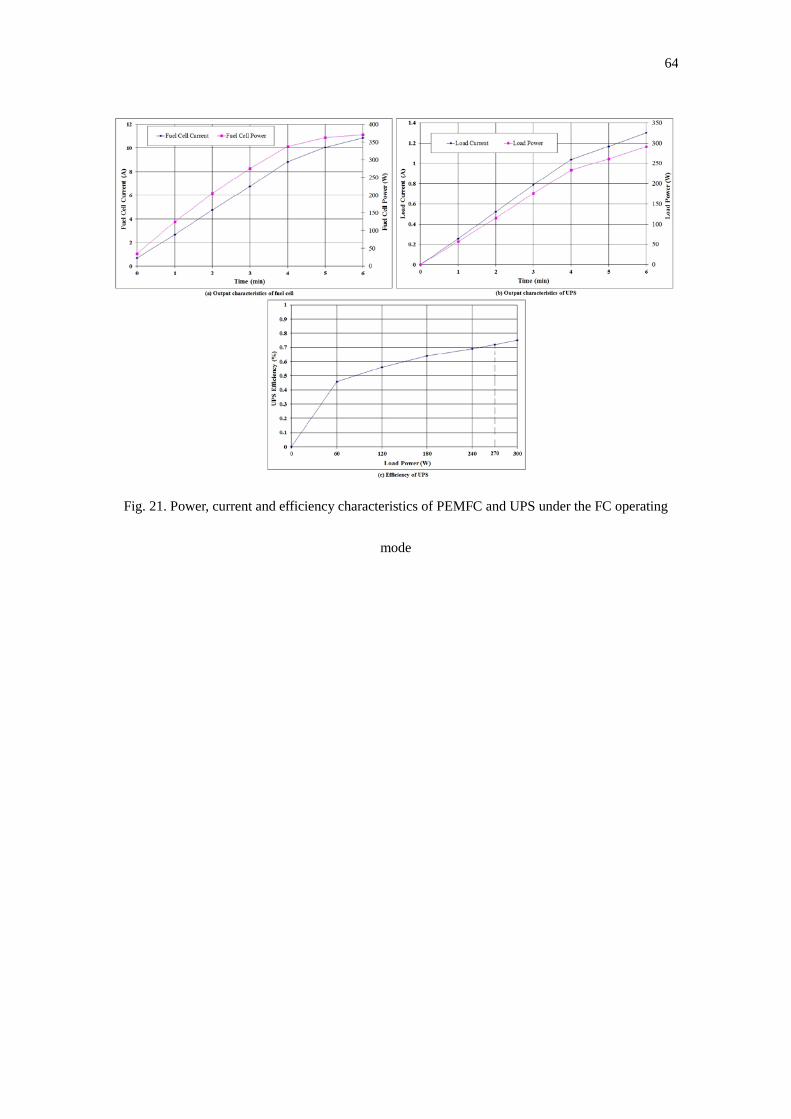
5.2.4. FC operating mode Fig. 21 shows the measured input power and current curves of the PEMFC and the
output and the efficiency profile for UPS without charging the battery and SC.
37
Fig. 21. Power, current and efficiency characteristics of PEMFC and UPS under the FC operating
mode
According to the measured value, the efficiency of UPS in FC operating mode under the
rated load of 270W is
%72//FCUPS == ACDCDCDC ηηη )(
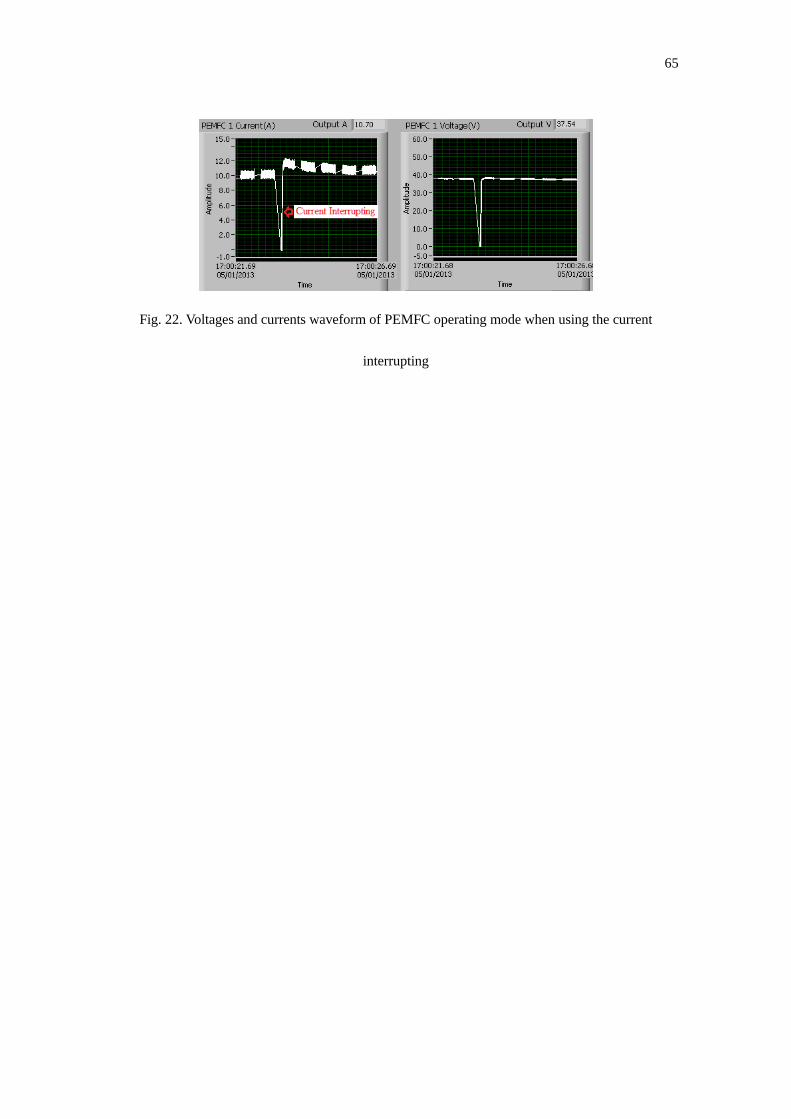
In FC operating mode, as a result of using the current interrupting method to measure
the resistance of membrane and improve the performance of the PEMFC, a part of
energy has to be lost, UPS(FC)η is less than UPS(Bat)η . If the current interrupting does not
be applied in this mode, UPS(FC)η is almost the same as UPS(Bat)η .
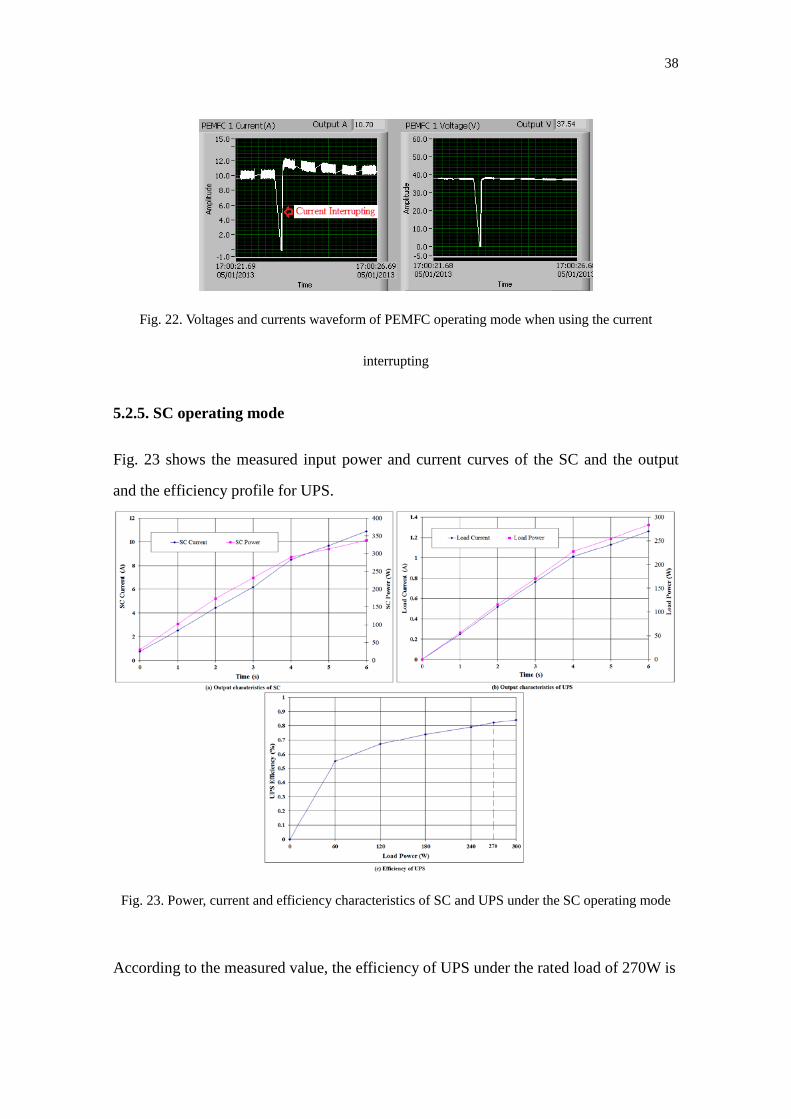
Fig. 22 shows the voltages and currents waveform in the PEMFC operating mode,
where the current interrupting method is used.
38
Fig. 22. Voltages and currents waveform of PEMFC operating mode when using the current
interrupting
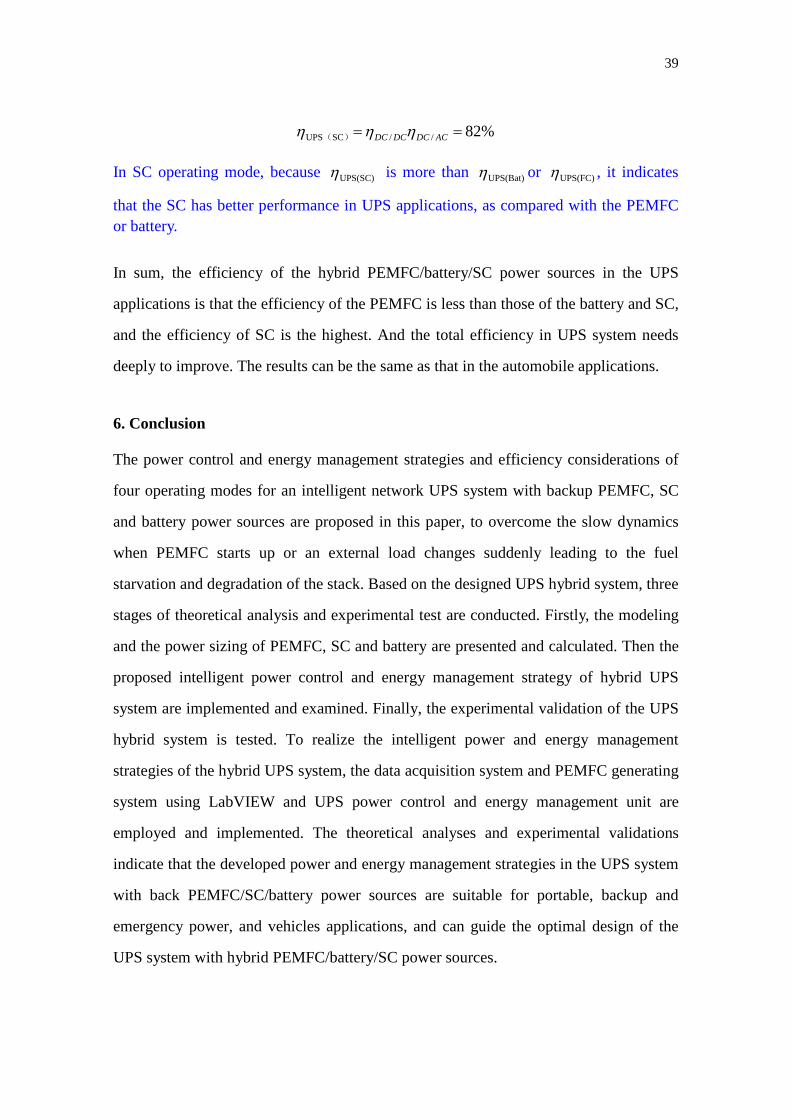
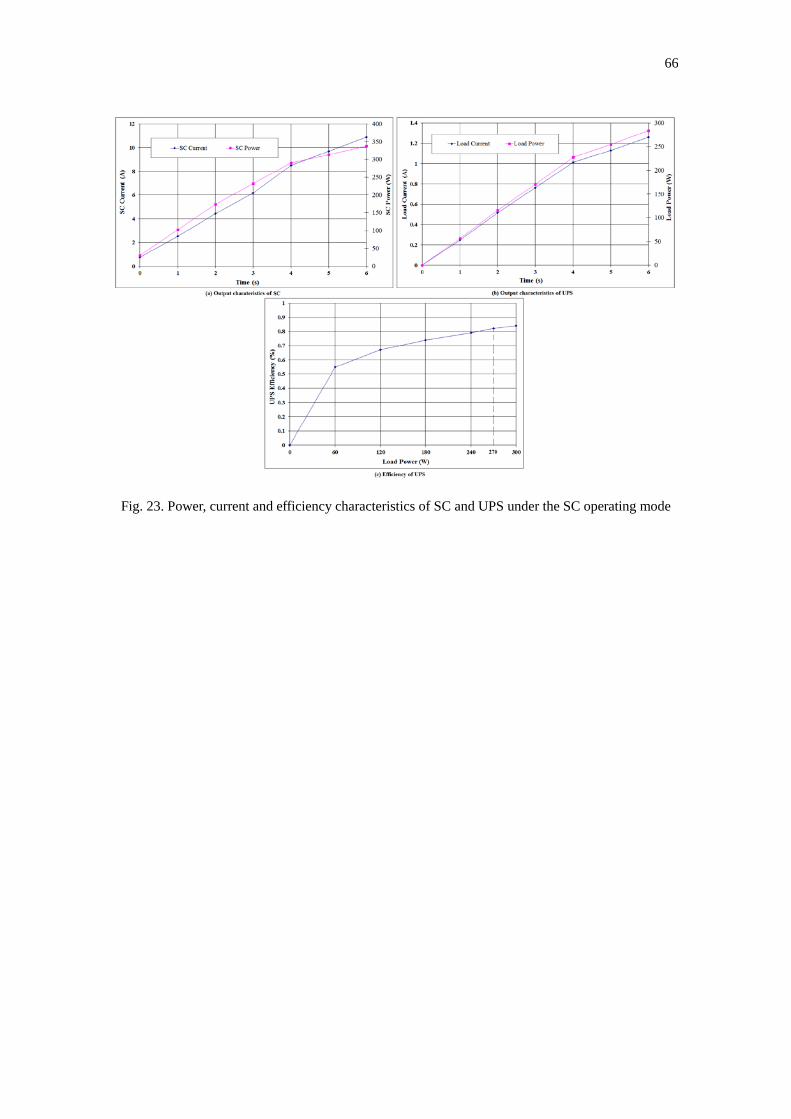
5.2.5. SC operating mode Fig. 23 shows the measured input power and current curves of the SC and the output
and the efficiency profile for UPS.
Fig. 23. Power, current and efficiency characteristics of SC and UPS under the SC operating mode
According to the measured value, the efficiency of UPS under the rated load of 270W is
39
%82//SCUPS == ACDCDCDC ηηη )(
In SC operating mode, because UPS(SC)η is more than UPS(Bat)η or UPS(FC)η , it indicates
that the SC has better performance in UPS applications, as compared with the PEMFC or battery. In sum, the efficiency of the hybrid PEMFC/battery/SC power sources in the UPS
applications is that the efficiency of the PEMFC is less than those of the battery and SC,
and the efficiency of SC is the highest. And the total efficiency in UPS system needs
deeply to improve. The results can be the same as that in the automobile applications.
6. Conclusion
The power control and energy management strategies and efficiency considerations of
four operating modes for an intelligent network UPS system with backup PEMFC, SC
and battery power sources are proposed in this paper, to overcome the slow dynamics
when PEMFC starts up or an external load changes suddenly leading to the fuel
starvation and degradation of the stack. Based on the designed UPS hybrid system, three
stages of theoretical analysis and experimental test are conducted. Firstly, the modeling
and the power sizing of PEMFC, SC and battery are presented and calculated. Then the
proposed intelligent power control and energy management strategy of hybrid UPS
system are implemented and examined. Finally, the experimental validation of the UPS
hybrid system is tested. To realize the intelligent power and energy management
strategies of the hybrid UPS system, the data acquisition system and PEMFC generating
system using LabVIEW and UPS power control and energy management unit are
employed and implemented. The theoretical analyses and experimental validations
indicate that the developed power and energy management strategies in the UPS system
with back PEMFC/SC/battery power sources are suitable for portable, backup and
emergency power, and vehicles applications, and can guide the optimal design of the
UPS system with hybrid PEMFC/battery/SC power sources.
40
References
[1] FC TECHNOLOGIES PROGRAM, FY 2013 Budget Request Rollout to
Stakeholders of U. S. Department of Energy, [online],
http://www1.eere.energy.gov/hydrogenandfuelcells/pdfs/fy13_budget_request_rol
lout.pdf
[2] US FCs: Multi-year Research, Development and Demonstration Plan, 2011
Executive Summary, [online], available at http: //www1.eere.energy.gov
/hydrogenandfuelcells/mypp/pdfs/exec_sum.pdf
[3] 2011 Technical Plan — FCs of U.S. Department of Energy, [online],
http://www1.eere.energy.gov/hydrogenandfuelcells/mypp/pdfs/fuel_cells.pdf
[4] DOE Hydrogen and FC Overview, ASME 2011- Plenary, 5th International
Conference on Energy Sustainability, Washington, DC, August 8, 2011,
http://www1.eere.energy.gov/hydrogenandfuelcells/pdfs/asme_aug2011_plenary_
overview.pdf
[5] Thounthong P, Chunkag V, Sethakul P, Davat, B, Hinaje M. Comparative study of
fuel-cell vehicle hybridization with battery or SC storage device. IEEE Trans on
Vehicular Technology 2009; 58(8):3892-904.
[6] Thounthong P, Rael, Davat B. Energy management of FC/battery/SC hybrid power
source for vehicle applications. J Power Sources 2009; 193(1):376-85.
[7] Zhang WP, Xu DH, Li X, Xie R, Li HJ, Dong DZ, Sun C, Chen M. Seamless
transfer control strategy for FC uninterruptible power supply system. IEEE Trans
on Power Electronics 2013; 28(2):717-28.
[8] García P, Torreglosa JP, Fernandez LM, Jurado F. Control strategies for high-power
electric vehicles powered by hydrogen FC, battery and SC. Expert Systems with
Applications 2013; 40(12):4791-804.
[9] Torreglosa JP, García P, Fernández LM, Jurado F. Predictive control for the energy
management of a FC-battery-SC tramway. IEEE Trans on Industrial Informatics
2014; 10(1):276-85.
41
[10] Kyriakarakos G, Dounis AI, Arvanitis KG, Papadakis G. A fuzzy logic energy
management system for polygeneration microgrids. Renewable Energy 2012;
41:315-27.
[11] Kyriakarakos G, Piromalis DD, Dounis AI, Arvanitis KG, Papadakis G.
Intelligent demand side energy management system for autonomous
polygeneration microgrids. Applied Energy 2013; 103:39-51.
[12] Feroldi D, Degliuomini LN, Basualdo M. Energy management of a hybrid system
based on wind-solar power sources and bioethanol. Chemical Engineering
Research and Design 2013; 91(8):1440-55.
[13] Zhan YD, Wang H,Zhu JG. Modelling and control of hybrid UPS system with
backup PEMFC/battery. Int J Electrical Power & Energy Systems 2012;
43(1):1322-31.
[14] Barbir F. FEM FC: Theory and Practice. Elsevier Academic Press, New York;
2005 [chapter 2].
[15] Faranda R. A new parameters identification procedure for simplified double layer
capacitor two-branch model. Electric Power Systems Research 2010;
80(4):363-71.
[16] Mierlo JV, Bossche PV, Maggetto G. Models of energy sources for EV and HEV:
FCs, batteries, ultracapacitors, flywheels and engine-generators. J Power Sources
2004; 128 (1): 76–89.
[17] Yuasa Battery Sales Ltd., NP Valve Regulated Lead Acid Battery Manual, 1999
[chapter 4].
[18] Burke AF. Batteries and Ultracapacitors for Electric, Hybrid, and FC Vehicles.
Proceedings of the IEEE 2007; 95(4):806-20.
[19] Zhan YD, Guo YG, Zhu JG, Wang H. Intelligent uninterruptible power supply
system with back-up FC/battery hybrid power source. J Power Sources 2008;
179(2):745-53.
42
Figure Captions:
1. Traditional structure of fuel cell/battery/SC hybrid power source
2. Proposed structure of grid/fuel cell/battery/SC hybrid power source in UPS
application
3. Equivalent circuit of a PEMFC
4. Boundary conditions for macroscopic potentials in an SC
5. Transmission line equivalent circuit model of an SC
6. Equivalent circuit of SC
7. Equivalent circuit of a lead-acid battery
8. Equivalent circuit of SCs in parallel and in series
9. Four operating modes of the proposed UPS system with grid/FC/battery/SC
hybrid power sources
10. Battery efficiency employed in the UPS system [17]
11. Charging characteristics of SC in this UPS system
12. PEMFC efficiency employed in the UPS system
13. Charging characteristics of battery in UPS system
14. Voltages and currents waveform of PEMFC and SCs when FC charges SCs if
SC voltage is less than 20V
15. Voltages and currents waveform of SC discharging when the main PEMFC fails
16. Voltages and currents waveform of battery discharging when main PEMFC fails
17. Photo of the experimental setup
43
18. Power, current and efficiency characteristics of UPS under the grid operating
mode
19. Power, current and efficiency characteristics of UPS under the bypass operating
mode
20. Power, current and efficiency characteristics of battery and UPS under the
battery operating mode
21. Power, current and efficiency characteristics of FC and UPS under the FC
operating mode
22. Voltages and currents waveform of PEMFC operating mode when using the
current interrupting
23. Power, current and efficiency characteristics of SC and UPS under the SC
operating mode
44
Fig. 1. Traditional structure of PEM fuel cell/battery/SC hybrid power source
45
Fig. 2. Proposed structure of grid/fuel cell/battery/SC hybrid power source in UPS application
46
Fig. 3. Equivalent circuit of a PEMFC
47
Fig. 4. Boundary conditions for macroscopic potentials in an SC
48
Fig. 5. Transmission line equivalent circuit model of an SC
49
Fig. 6. Equivalent circuit of SC
50
Fig. 7. Equivalent circuit of a lead-acid battery
51
Fig. 8. Equivalent circuit of SCs in parallel and in series
52
Fig. 9. Four operating modes of the proposed UPS system with grid/PEMFC/battery/SC hybrid
power sources
53
Fig. 10. Battery efficiency employed in the UPS system [17]
54
Fig. 11. Charging characteristics of SCs in this UPS system
55
Fig. 12. PEMFC efficiency employed in the UPS system
56
Fig. 13. Charging characteristics of battery in UPS system
57
Fig. 14. Voltages and currents waveform of PEMFC and SCs when FC charges SCs if SC voltage is
less than 20V
58
Fig. 15. Voltages and currents waveform of SC discharging when the main PEMFC fails
59
Fig. 16. Voltages and currents waveform of battery discharging when main PEMFC fails
60
Fig. 17. Photo of the experimental setup
61
Fig. 18. Power, current and efficiency characteristics of UPS under the grid operating mode
62
Fig. 19. Power, current and efficiency characteristics of UPS under the bypass operating mode
63
Fig. 20. Power, current and efficiency characteristics of battery and UPS under the battery operating
mode
64
Fig. 21. Power, current and efficiency characteristics of PEMFC and UPS under the FC operating
mode
65
Fig. 22. Voltages and currents waveform of PEMFC operating mode when using the current
interrupting
66
Fig. 23. Power, current and efficiency characteristics of SC and UPS under the SC operating mode