potential to operate greenhouses and aquaculture in - agricultural
TRANSCRIPT
A final report prepared for the Leopold Center for Sustainable Agriculture
February 29, 2008
Potential to Operate Greenhouses and Aquaculture in Conjunction with Iowa’s Ethanol Plants
M 2007-08
Ray S. Hansen ISU Extension
Value Added Agriculture Program 515-294-3890
Connie L. Hardy ISU Extension
Value Added Agriculture Program [email protected]
Contributing authors:
Richard D. Clayton, Dept. of Natural Resources Ecology and Management, Iowa State University, Ames, IA. Richard J. Gladon, Dept. of Horticulture, Iowa State University, Ames, IA Joseph E. Morris, Dept. of Natural Resources Ecology and Management, Iowa State University, Ames, IA. Norman K. Olson, Iowa Energy Center, BECON Facility, Nevada, IA
Project length: 1 year
Leopold funding: $14,957
Signature (PI):
Signature (co-PI):

Contents
Nontechnical Summary ...................................................................................................................... 1 Introduction ....................................................................................................................................... 3 Project design.................................................................................................................................... 3 Objectives ......................................................................................................................................... 4 Market summary – greenhouses ........................................................................................................ 4 Market summary – aquaculture .......................................................................................................... 5 Available energy ................................................................................................................................ 6 Aquaculture energy requirements ...................................................................................................... 7 Greenhouse energy requirements ...................................................................................................... 8 Combined aquaculture and greenhouse operation ........................................................................... 10 Conclusions ..................................................................................................................................... 10 Impact of the results ........................................................................................................................ 10 Budget report................................................................................................................................... 11 Appendix A. Waste products from ethanol plants as assets for greenhouses.................................... 12 Appendix B. A system to operate greenhouses and aquaculture in conjunction with Iowa‟s ethanol plants ....................................................................................................................... 19 Appendix C. Aquaponic greenhouse ................................................................................................ 28
1
Nontechnical Summary M2007-08
Ray S. Hansen and Connie L. Hardy ISU Extension Value Added Agriculture Program
Iowa State University 515-294-3890
The central question asked during this project was “Can waste heat energy from Iowa’s dry-grind ethanol plants be used to power greenhouse and aquaculture operations located near the ethanol plant?” Available heat energy from ethanol plants would come from flue gas resulting from the burning of natural gas and from cooling tower water used to cool the fermenters. In total, waste heat energy from a 50-million-gallon-per-year (mgy) ethanol plant could range from 9 to 17 million British thermal units per hour (Btu/h), enough to heat up to 5 acres of greenhouses or one hundred 30,000-gallon indoor aquaculture tanks in a reusable aquaculture system. This project was designed to estimate the energy needs of commercial aquaculture and greenhouse operations and to determine if there would be sufficient waste energy from Iowa‟s dry-grind ethanol plants to provide a significant portion of the total energy requirement of either operation. Points that could make this arrangement feasible but that require further research could then be identified. In addition, greenhouse crops and fish species were identified that would potentially carry high enough market value to sustain a profitable operation in Iowa. Recent inquiries about the feasibility of using waste energy from ethanol plants to power other agricultural operations led to the formation of a discussion group of Iowa State University (ISU) researchers involved with greenhouse, aquaculture, and biofuels production to pinpoint issues that currently affect each of these operations. This ad-hoc research team collected market and operational information about greenhouses and aquaculture facilities and estimated waste heat energy available from ethanol plants. Key issues were identified that could lead to success or failure in this joint arrangement. These issues include: selection of high-value crops or fish species; sufficient low-cost energy to overcome the high cost of heat and light during the winter months; planning for back-up power sources; and assurance of coordinated management between the ethanol plant and greenhouse/aquaculture facility to avoid costly mistakes. As Iowa‟s ethanol industry matures, plant managers may be seeking new ways to integrate within their communities, providing sustainability to their own and other agricultural operations. Nearby markets for co-products, including waste heat and carbon dioxide, could add profit as well as minimize the impact of environmental pollution, making ethanol plants good neighbors in their communities. Heat and carbon dioxide could potentially be used in greenhouse operations, and heat energy could also be used to maintain proper water temperature in aquaculture operations. Operating either greenhouse or aquaculture facilities in Iowa includes high energy costs for heat, particularly during the winter months, and long hours of darkness for 3 to 5 months that would require supplemental light to keep greenhouse plants efficient and productive. Cost of heat and lighting has always been a limiting factor in successful greenhouse and aquaculture operations in the Midwest. Equally important in determining the success of both operations is choosing crops or species of fish that can be grown in Iowa and have a high enough market value to be profitable. For example, greenhouse operators face tough competition from large commercial U.S. growers, and especially importers who sell tomatoes, variety lettuce, mushrooms, etc. However, ornamental crops, herbs, and berry fruits are high-value products that benefit from reduced shipping and handling and would likely benefit from an extended local growing season. Iowa-based aquaculture operations could provide Iowa, a net importer of fish, with fresh supplies of certain types of fish for restaurant and grocery sales as well as for stocking supplies and bait. In selected regions in the U.S., both greenhouse and aquaculture facilities have been, and continue to be, operated next to power plants and to reap energy savings by using waste energy from a power plant. Theoretically, this arrangement should work well, yet some operators have faced problems that forced
2
their operations to close. Because power plants need to shut down periodically for maintenance, interruptions in power to greenhouses have killed the crops, resulting in large financial losses. Similarly, aquaculture operations have suffered from transfer of chemicals in the water coming from the power plant directly into the tanks and killing the fish. Therefore, coordinated management of both facilities is required and back-up heaters are a must. Water from the power plant should be used only as a source of heat energy (run through a heat exchanger) but not as a water supply for either greenhouses or aquaculture tanks. Heat energy from a 50 mgy ethanol plant could be gathered from flue gas, resulting from burning of natural gas to power the plant, and from water in the cooling towers that cool the fermenters. Stack flue gas could yield 6 to 12 million Btu/h, and cooling tower water could yield 3 to 5 million Btu/h. This amount of heat energy could heat up to 5 acres of greenhouses on Iowa‟s coldest days or up to one hundred 30,000-gallon aquaculture tanks at an ambient temperature of 65
oF. Using lower-cost energy from an
ethanol plant, the production of high-value crops and/or fish could bring new opportunities for profitable agricultural enterprises and enhance supplies of these products in the local and regional marketplace.
3
Introduction With the rapid expansion of Iowa‟s ethanol-processing industry, the state has witnessed an unparalleled growth in dry-grind ethanol production facilities, which now total 29 plants. Eighteen additional plants are under construction or expansion, and more than 30 new projects are in various stages of planning. Iowa‟s ethanol production capacity is currently at 2 billion gallons per year (bgy), and construction/expansion projects will add another 2 bgy of processing capacity by 2010. The economics of producing ethanol for fuel continue to fluctuate with rising petroleum prices and rising corn prices; yet, investment in new facilities continues. As the fuel ethanol industry matures, operators of individual plants may be looking for opportunities to gain additional financial advantages. One such opportunity may be in co-locating new production facilities for fish, fruits, herbs, vegetables, and ornamental plants alongside the ethanol processing plants. The waste streams from ethanol processing could potentially supply water and heat to both greenhouse and aquaculture operations, and carbon dioxide (CO2) might also be captured for the benefit of greenhouse plants. These potentially compatible operations could stimulate more economic development within the community. According to managers interviewed in 2006 for the project “Sourcing Corn for Ethanol: Effects of Local Processing” (ISU Extension Grain Quality Initiative), two of the concerns voiced by ethanol plant managers were in finding new markets for co-products (distillers grains and CO2), and meeting current and future environmental regulations. At the time of the interviews, no Iowa ethanol plants were selling waste heat and carbon dioxide to greenhouses or aquaculture operations. However, economic development groups in Iowa counties where ethanol production is concentrated are seeking new agricultural business concepts that can be successfully replicated throughout their areas. Some greenhouses in the U.S. are currently operating, or have operated, using waste heat from electrical power plants as supplemental energy. The main greenhouse energy requirements are for heating and supplemental lighting for 3 to 5 months during the winter. The Archer-Daniels-Midland (ADM) corn processing plant in Decatur, Illinois, incorporated greenhouse/aquaculture production that uses waste heat and CO2 from its corn processing operation. The greenhouse has been in operation since the early 1980s and has grown several combinations of greenhouse products before converting to aquaculture products to maintain a profitable market position. ADM‟s experiences in selecting profitable crops are not unlike those of other greenhouse operators. Competition from imports and vertically integrated retailers makes large-scale production of some products (e.g., tomatoes, tilapia) less feasible for independent growers and operators. So, higher value food crops in either greenhouses (herbs, berries, ornamentals) or aquaculture (bass, walleye) may be more profitable. Entrepreneurs who are interested in agricultural production might regard a symbiotic relationship with ethanol processing as a unique new business opportunity, one that might attract support as “green” industry to lessen environmental impact and strengthen rural economies. These synergistic relationships provide an avenue to extend the growing season for fresh fruits, vegetables, and ornamental plants. Increased aquaculture and greenhouse production would provide fresh fish products to a region that is a net importer of fish, fresh produce, and ornamental plants. Growing these products in Iowa drastically reduces shipping costs and fuel emissions and provides fresher products to consumers. In concept, the notion of operating greenhouses and aquaculture in conjunction with ethanol plants seems like a good idea for several reasons, but there is not enough public information about the economics and potential problems of this business arrangement to lead innovators to try it. This project provides technical and anecdotal information to help estimate energy availability and requirements, and to suggest other research that could provide more specific data on which entrepreneurs interested in these operations could rely. Project design Preliminary discussions among Iowa State University (ISU) faculty and staff who were involved in ethanol processing, aquaculture, greenhouse production, and business development revealed the need to develop a better understanding of the true potential to capture and use waste heat and other co-products
4
(CO2 and distillers grains) from ethanol plants for other production enterprises. With sponsorship from the Leopold Center for Sustainable Agriculture, discussion group members from ISU Horticulture and ISU Natural Resources Ecology and Management were asked to describe greenhouse and aquaculture operations that were similar to those in Iowa, estimate their energy needs, and suggest crops/products with profit potential. In addition, a scientist at the Iowa Energy Center was asked to estimate available energy from a typical Iowa ethanol plant. ISU Extension Value Added Agriculture representatives were responsible for compiling the report and identifying the “gaps” or potential problems that would need to be overcome to make greenhouse/aquaculture operations feasible in conjunction with Iowa‟s ethanol plants. This report is a compilation of information and technical opinion based on the individual reports by experts in aquaculture, greenhouse management and greenhouse crop production, and energy production. These reports are attached as appendixes. The gap analysis is included to pinpoint areas where problems yet need to be solved to make the use of waste energy from ethanol processing feasible as an energy source for greenhouses and aquaculture. The gap analysis could serve as a reference for ethanol plant managers and for entrepreneurs who wish to build business communities around the rapidly expanding ethanol plants. This concept may also provide an additional market for ethanol co-products while helping alleviate environmental concerns about excess steam and carbon dioxide released into the atmosphere. Aquaculture and greenhouse businesses provide opportunities for economic development in rural areas and a way to provide locally grown fresh produce, flowers, and fish. Objectives 1. Conduct a “gap” analysis of available energy from ethanol plants and energy needs for greenhouse and aquaculture enterprises. 2. Maintain a research support group to evaluate opportunities and constraints related to building a biorefinery cluster of ancillary and/or related businesses adjacent to existing biofuel plants. Market summary – Greenhouses (based on Richard Gladon’s report in Appendix A.) In 2005, the greenhouse industry in Iowa ranked 25
th in the nation, just behind Indiana, considering
growers with at least $100,000 in wholesale volume. For this size of greenhouse operation in 2005, the total wholesale value of floricultural crops (ornamental only, not food) was $50,116,000 for Iowa versus $50,391,000 for Indiana. When considering greenhouse operations that have a total wholesale volume of at least $10,000 annually, Iowa is ranked 26
th with a wholesale volume of $54,299,000. The next-highest
state is Tennessee at $55,532,000, and the next states below Iowa are Utah at $52,191,000 and Missouri at $45,070,000. The majority of Iowa greenhouses grow ornamental flowers, and the facilities range in size from 0.5 acre to 6.5 acres. There are also two very large greenhouse operations that are 13 and 50 acres in size. In contrast, Iowa has only two food-based greenhouse operations, one growing hydroponic tomatoes in Carroll and the other growing herbs in Grinnell. Both operations are family-run and range in size from 0.5 to 1.0 acre. Though production and income data are unavailable, these operations are minor compared with the $50+-million ornamental business. Data from the State of Iowa Horticulturist Office shows that Iowa is a deficit producer of every one of the greenhouse-grown crops recorded, so Iowa is importing greenhouse products from other states and possibly from other countries. This information, as well as the increasing local interest in selected food crops, indicates an opportunity to expand greenhouse operations in Iowa.

5
Market Summary – Aquaculture (based on Joseph Morris’ and Richard Clayton’s report in Appendix B) The North Central Region (NCR) of the United States is poised for growth in the aquaculture industry. As discussed in the accompanying report by Morris and Clayton, transitions in the seafood industry are spurring growth in aquaculture as the percentage of seafood available from wild fisheries surpasses sustainable levels. World aquaculture production tripled between 1991 and 2002, and now nearly 40 percent of the fish and seafood consumed by humans comes from aquaculture.
Consumption of fishery products in the U.S. has grown since 2004 from approximately 15 pounds to 16.6 pounds of edible meat per person. The value of U.S. aquaculture production has grown by roughly 5 to 10 percent per year during the past decade, and aquaculture is regarded as the fastest growing segment of U.S. agriculture. Despite the recent growth in U.S. aquaculture, there was a seafood trade deficit of $7.8 billion in 2004.
Aquaculture-related business in the North Central Region (NCR) continues to be an "emerging" industry, with an estimated farm gate value over $70 million, resulting in more than one billion pounds of seafood consumed annually. Although the NRC contains approximately 25% of the US population, the regional aquaculture production accounts for less than 3% of all U.S. aquaculture production.
In addition to fish being cultured for the food market, culturists from both private and public sectors of the NCR produce fish for pond and lake stockings. In the 2005 National Aquaculture Census, over 1,000 private farms in the U.S. produced fish for either bait fish or lake/pond stockings with a total value of approximately $56 million. In addition to the private industry, federal and state public agencies produce vast numbers of fish for stocking into public waters. For instance, it has been estimated the public agencies have stocked over one billion walleye (Sander vitreus) fry and fingerlings into public waters.
The demand for baitfish in the NCR far exceeds the supply from within the region. To meet this demand, cultured fatheads (Pimephales promelas), golden shiners (Notemigonus crysoleucas), and goldfish (Carassius auratus) from Arkansas are imported into the NCR. Still, significant shortages of a variety of species [including the three primary NCR aquaculture species – fatheads, white suckers (Catostomus commersoni), and golden shiners – were reported by bait dealers]. Cultured baitfish ranked third in sales for the U.S. aquaculture industry, and the combined U.S. and Canadian industry is estimated to value approximately $1 billion annually. Compounding these shortages, the USDA-APHIS issued a federal order in October 2006 that prohibits the importation of 37 species of live fish from two Canadian provinces into the United States and the interstate movement of the same species from the eight states bordering the Great Lakes. In May 2007 the state of Ohio initiated interstate restrictions on live fish movement into that state. These restrictions have resulted in decreased availability of fish for both stocking and bait throughout this region. The emerging aquaculture industry combined with implications of the federal order on fish movement present opportunities to investigate potential alternative avenues of culture practices whereby alternative aquaculture practices with higher level of bio-security can be developed. Along with the changing role of aquaculture in this region, numerous ethanol plants have been developed, which generate various waste streams that might be useful in aquaculture operations. Co-product Choice The co-product that best suits aquaculture is the excess energy (heat) generated by these plants. One of the major constraints for fish production in the state of Iowa is the limited culture period dictated by our environment. For instance, the channel catfish (Ictalurus punctatus) industry has expanded in Mississippi even though the industry was initiated in Kansas, as the climatic conditions in Mississippi allows for an extra 6-week culture period in outdoor ponds. For successful production of fish, optimum temperatures need to be met and maintained to be both cost- and time-effective. By heating the water with this potential heat, fish can then be cultured year round at optimal temperatures, ensuring a consistent supply to the markets.

6
Available Energy (based on Norman Olson’s data from the Iowa Energy Center) There are opportunities to recover waste heat from an ethanol plant for use in heating co-located commercial operations such as greenhouses or aquaculture facilities. Two main sources of waste heat that have potential for recovery at ethanol plants are the cooling towers and the stack gases from boilers. Some discussion has also taken place about using stack gases as a source of heat and carbon dioxide for growing high-oil algae to produce feedstock for biodiesel production. Stack Gas Heat Recovery Many of Iowa‟s ethanol plants built between 2002 and 2006 have a rated ethanol production capacity of 50 million gallons per year (mgy), and they use natural gas as an energy source to heat the plant and fermentation tanks and to dry the distillers grains. A 50-mgy plant that produces 5,700 gallons of ethanol per hour requires an estimated 31,000 British thermal units (Btu) of energy for each gallon of ethanol produced (Equation 1.). One source of thermal energy that could be recovered during ethanol production is the flue gas from the boiler stack. Equation 1.
5700 gallon/hour x 31,000 Btu/gallon/0.80 (Boiler efficiency) = 220 million Btu/h boiler input Assuming that a boiler in an ethanol facility is 80 percent efficient, then 220 million Btu‟s per hour (Btu/h) would be in the flue gas. Approximately 3 to 6 percent of the boiler input (220 million Btu/h) is recoverable, depending on stack temperature, which says that 6 to12 million Btu/h of heat energy could be available from the flue gas. Cooling Tower Heat Recovery Ethanol plants also have cooling towers that cool the water from the fermenters. Heat energy recovery potential from the cooling tower system would range from 3 to 5 million Btu/h. This estimate is based on actual operations data from a 50-mgy ethanol plant in Iowa with approximately 600 gallons per minute (gpm) flowing through the cooling tower with an optimal temperature reduction of 20°F. Using a conversion factor of 500 described in Equation 2 Equation 2.
8.33 pounds per gallon x 60 minutes per hour = 500 Btu/pound-degree F available energy can be estimated as: 500 x 600 gpm x 20°F (temperature difference)= 6 million Btu/h A heat pump would be needed to boost the water temperature from the 85 to 90°F range to the 120 to 125°F range for more effective heating of the greenhouse. As noted by Dr. Gladon, the ADM (Decatur, IL) facility managers found that 140°F water could meet the heat demand for the coldest, windiest night in that region.
7
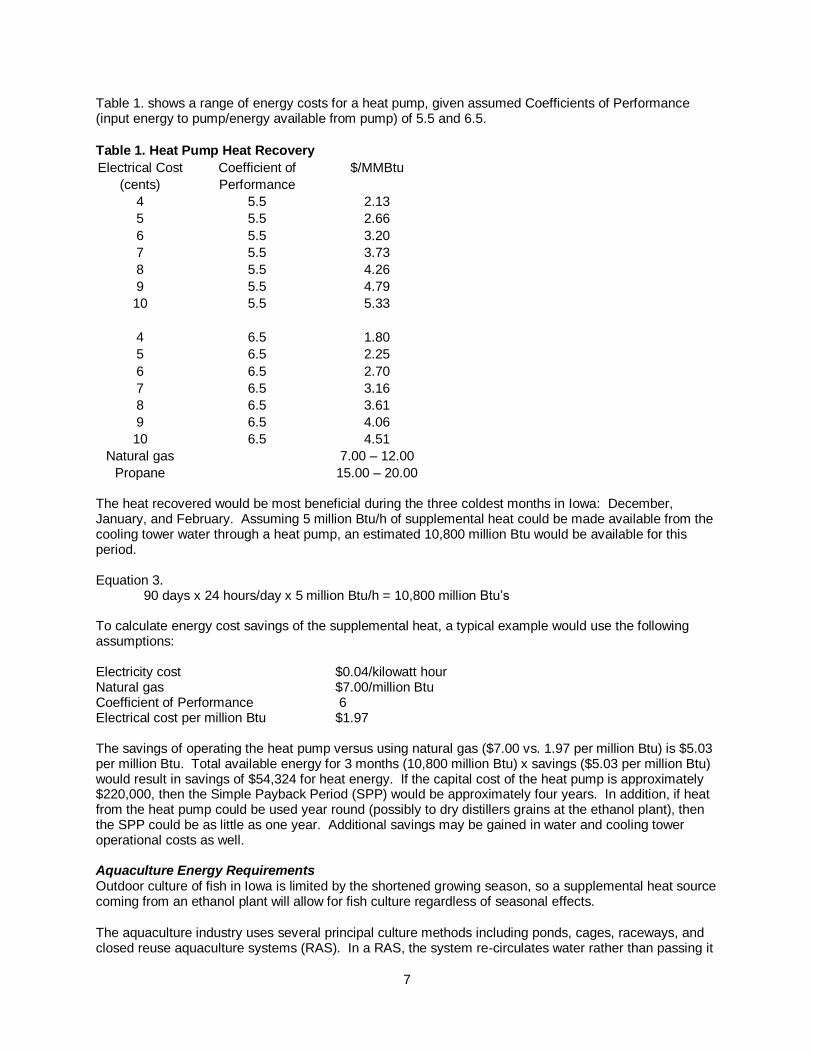
Table 1. shows a range of energy costs for a heat pump, given assumed Coefficients of Performance (input energy to pump/energy available from pump) of 5.5 and 6.5.
Table 1. Heat Pump Heat Recovery
Electrical Cost Coefficient of $/MMBtu
(cents) Performance
4 5.5 2.13
5 5.5 2.66
6 5.5 3.20
7 5.5 3.73
8 5.5 4.26
9 5.5 4.79
10 5.5 5.33
4 6.5 1.80
5 6.5 2.25
6 6.5 2.70
7 6.5 3.16
8 6.5 3.61
9 6.5 4.06
10 6.5 4.51
Natural gas 7.00 – 12.00
Propane 15.00 – 20.00 The heat recovered would be most beneficial during the three coldest months in Iowa: December, January, and February. Assuming 5 million Btu/h of supplemental heat could be made available from the cooling tower water through a heat pump, an estimated 10,800 million Btu would be available for this period. Equation 3.
90 days x 24 hours/day x 5 million Btu/h = 10,800 million Btu‟s To calculate energy cost savings of the supplemental heat, a typical example would use the following assumptions: Electricity cost $0.04/kilowatt hour Natural gas $7.00/million Btu Coefficient of Performance 6 Electrical cost per million Btu $1.97 The savings of operating the heat pump versus using natural gas ($7.00 vs. 1.97 per million Btu) is $5.03 per million Btu. Total available energy for 3 months (10,800 million Btu) x savings ($5.03 per million Btu) would result in savings of $54,324 for heat energy. If the capital cost of the heat pump is approximately $220,000, then the Simple Payback Period (SPP) would be approximately four years. In addition, if heat from the heat pump could be used year round (possibly to dry distillers grains at the ethanol plant), then the SPP could be as little as one year. Additional savings may be gained in water and cooling tower operational costs as well. Aquaculture Energy Requirements Outdoor culture of fish in Iowa is limited by the shortened growing season, so a supplemental heat source coming from an ethanol plant will allow for fish culture regardless of seasonal effects.
The aquaculture industry uses several principal culture methods including ponds, cages, raceways, and closed reuse aquaculture systems (RAS). In a RAS, the system re-circulates water rather than passing it
8
through the system only once. Less water is needed for this system than for ponds or raceways. Most reuse systems are located indoors, which allows the grower to maintain control over the water temperature and quality. Reuse systems have additional advantages; however, their major disadvantage is the start-up cost. Closed reuse systems have four parts: the culture chambers, a primary settling chamber, a biological filter, and a final clarifier or secondary settling chamber. Each unit is important to the system, although some closed systems do not contain all four components. Components may be separate units or they may be arranged in combinations that make the system appear to have only one or two units. Components may be large or relatively small, but each must be in proper proportion to the others if the system is to perform properly.
Morris and Clayton describe in their report (Appendix B) a RAS that uses 30,000 gallons of water with 3,000 gallons replaced daily. The replacement water would come in at approximately 50
oF and need to
be heated to the following temperatures for each fish species:
72-79°F Walleye 72°F Fathead minnows 77-80°F Hybrid striped bass
To heat the daily replacement water by a minimum of 22°F (to 72°F) would require 22,908 Btu/h as shown:
Equation 3. 3,000 gal/day x 1 day/24 hr x 8.33 lb/gal x 1 Btu/pound °F x 22°F = 22,908 Btu/h
Energy would also be required to keep the entire 30,000-gallon tank heated to 72°F, which would depend on the air temperature and humidity in the facility. Assuming the ambient temperature is 65°F:
Equation 4. 30,000 gal/day x 1 day/24 hr x 8.33 lb/gal x 1 Btu/pound °F x 7°F = 72,888 Btu/h
In total, the 30,000 gal/day RAS would require 95,796 Btu/h to heat the water for the aquaculture system, or about 1 percent of the available waste heat energy from a 50-mgy ethanol plant. Greenhouse energy requirements (based on study by Richard J. Gladon) The largest portion of greenhouse energy requirements is for heating during the winter months, although a significant expense for supplemental lighting should be expected during this 3- to 5-month period as well. Whether supplemental heat energy is available from an adjacent power plant, it is highly recommended to include back-up heaters when planning the greenhouse. Calculation of greenhouse energy requirements depends on several variables that are specific to locations, typical weather patterns, and design of the greenhouse. Two sources that can very helpful in understanding these variables are: 1) the text titled Greenhouse Operation and Management by Paul V. Nelson, which offers guidelines for calculations and the assumptions behind them; and 2) an online form by USDA titled Individual Greenhouse Energy Conservation Checklist that leads users through a planning process for a greenhouse. For the purpose of this report, a greenhouse design was chosen to illustrate variability in heat energy requirements for the “peak” or coldest time of the year. Calculations are shown in the following tables assuming a one-acre greenhouse that consists of 11 bays attached to one another. Full dimensions of the entire greenhouse are 220 feet long by 200 feet wide to cover a total of 44,000 square feet (1 acre = 43,560 square feet). The greenhouse is constructed of aluminum and single-layer glass with 24-inch x 26-inch glass panes in Table 2a.; however, in Table 2b. double polyethylene is used. The walls are 14 feet high with no curtain/knee wall. The crop needs to be kept at a minimum of 50°F. Table 2a. shows corrected heat loss of the greenhouse assuming the all-time lowest temperature of the region is -25°F

9
(ΔT=75°F) and wind speed is 35 mph, while Table 2b. shows corrected heat loss, assuming a low temperature of the region as -15°F (ΔT=65°F) and a wind speed of 20 mph. Table 2a. Heat loss assuming 75°F temperature change and 35-mph wind speed, glass and aluminum construction.
Component Standard Heat Loss*
(MBtu/h)
Climate Factor (K=)
Construction Factor (C=)
Corrected Heat Loss
(MBtu/h)
Walls 941 1.25 1.08 1270.35
Roofs 4290 1.25 1.08 5791.5
Gables 110 1.25 1.08 148.5
Total 7210.35
Table 2b. Heat loss assuming 65°F temperature change and 20-mph wind speed, double-layer polyethylene construction.
Component Standard Heat Loss*
(MBtu/h)
Climate Factor Construction Factor
Corrected Heat Loss
(MBtu/h)
Walls 941 0.96 0.70 632.35
Roofs 4290 0.96 0.70 2882.88
Gables 110 0.96 0.70 73.92
Total 3589.15
Notes: * Standard heat losses from Table 3.8 in Greenhouse Operation and Management (Nelson, P.V.) K = constant for temperature difference and wind speed C = constant for construction materials
(glass and aluminum in Table 2a., double polyethylene in Table 2b.) (polyethylene roofs/gables, double polycarbonate on side walls in Tables 3a. and 3b.)
For further comparison, the effect of using an arched roof design and including twin-layer polycarbonate for the side walls of the greenhouse is shown in Tables 3a. and 3b. Table 3a. Heat loss assuming 75
oF temperature change and 35-mph wind speed, polyethylene
roofs/gables and polycarbonate side walls. Component Standard Heat
Loss* (MBtu/h)
Climate Factor (K=)
Construction Factor (C=)
Corrected Heat Loss
(MBtu/h)
Walls 941 1.25 0.58 682.23
Roofs 4873 1.25 0.70 4263.88
Gables 220 1.25 0.70 192.5
Total 5138.6
Table 3b. Heat loss assuming 65°F temperature change and 20-mph wind speed, polyethylene roofs/gables and polycarbonate side walls.
Component Standard Heat Loss*
(MBtu/h)
Climate Factor Construction Factor
Corrected Heat Loss
(MBtu/h)
Walls 941 0.96 0.58 523.95
Roofs 4873 0.96 0.70 3274.20
Gables 220 0.96 0.70 147.84
Total 3946.5
Notes: * Standard heat losses from Table 3.8 in Greenhouse Operation and Management (Nelson, P.V.) K = constant for temperature difference and wind speed C = constant for construction materials (polyethylene roofs/gables, double polycarbonate on side walls)
10
The cost of supplemental lighting also needs to be considered if a greenhouse is operated through the winter when daylight hours are reduced. Typically, high pressure sodium lamps are used for this purpose at a purchase/installation cost of $2.75 to $3.00 per square foot of greenhouse. A one-acre greenhouse would need approximately 425 lamps to yield sufficient light (300 to 600 foot-candles) for ornamentals, and vegetable production would require approximately 850 lamps (600 to 1000 foot-candles) in a one-acre greenhouse. In the winter, these lamps are used 8 to16 hours per day. Typically 430-watt lamps use about 0.5 kilowatts per hour, so assuming the cost of electricity is 10 cents per kwh, running each lamp would cost 40 to 80 cents per day. Total daily charges for supplemental lighting could range $350 to $700 per day, depending on the cost of electricity and the light requirement of the crop. Combined aquaculture and greenhouse operation (Albert Bennett’s spreadsheet in Appendix C.) An adaptation of a detailed spreadsheet for building and operating a combined tilapia and tomato production unit was contributed by the author, Albert Bennett (PhD graduate of ISU Agricultural and Biosystems Engineering) and can be found in Appendix C. This spreadsheet was originally developed for an operation in Mexico but was adapted for the Midwest with updated prices for materials. Conclusions Based on the energy estimates and anecdotal information about current ethanol, greenhouse, and aquaculture operations provided by the contributing authors in this study, we can conclude:
There is sufficient waste heat energy from a 50-mgy ethanol plant to provide significant supplemental heating for greenhouse and aquaculture operations. Feasibility studies for specific greenhouse and aquaculture operations co-located with ethanol plants would be warranted.
Further study is needed to assess benefits and determine appropriate levels of using other co-products, such as carbon dioxide and distillers grains, in greenhouse and aquaculture operations.
Success of greenhouse and aquaculture operations co-located with power plants and ethanol plants is dependent on coordinated efforts and regular communication among the managers of each business to avoid costly operational mistakes.
Iowa, as a net importer of most greenhouse products and many fish species, would benefit from increased local production.
Greenhouse crops and fish species grown must be of relatively high market value to overcome high costs of energy, particularly for winter production. In Iowa, these might include ornamental plants and flowers and herbs for greenhouses, and walleye, fathead minnows, and hybrid striped bass for aquaculture.
Impact of the results This project met the objectives of forming a discussion/research team that could provide ongoing support to entrepreneurs who initiated coordinated greenhouse and/or aquaculture facilities to run in conjunction with Iowa‟s dry-grind ethanol plants. The basic calculations and anecdotal evidence in the summary report as well as in the accompanying individual reports provide significant insight into the current status of greenhouse and aquaculture operations as they relate to the Midwest and outline the considerations necessary in planning new enterprises in these areas. If calculations for specific sites indicate that co-locating these businesses is feasible, the model could be replicated in several communities where ethanol plants are located.

11
Budget Report This project‟s budget was mainly for salaries of the cooperating researchers in greenhouse operations, aquaculture, and energy generation. Individual written reports were submitted to Value Added Agriculture Program to incorporate into the final report for this project. Salaries for the project coordinators (Ray Hansen and Connie Hardy) covered final report writing and gap analysis for future recommendations. A list is found in the accompanying table. Travel expenses covered trips to greenhouse and aquaculture facilities to meet with managers and describe their operations. Printing costs were for individual and final report.
Salary
Norman Olson $1,512
Connie Hardy $1,500
Ray Hansen $1,500
Richard Gladon $3,000
Steve Ely $1,305
Richard Clayton $1,500
Expended Budgeted
Total Salary $10,317 $10,500
Total Benefits $2,842 $2,728
Travel $1,649 $1,379
Printing $145 $350
$14,953 $14,957

12
Appendix A.
Waste Products from Ethanol Plants as Assets for Greenhouses
Richard J. Gladon Associate Professor
Department of Horticulture 222 Horticulture Building
Iowa State University Ames, IA 50011

13
Waste Products from Ethanol Plants as Assets for Greenhouses
Dr. Richard J. Gladon Iowa State University
Department of Horticulture
Overview and Purpose
In 2005, the most recent year there are available data, the greenhouse industry in Iowa ranked 25th in the
nation but Iowa is only a fraction of a percentage point behind Indiana, the 24th-ranked state, when we
consider growers with at least $100,000 in wholesale volume. For this size of greenhouse operation in 2005, the total wholesale value of floricultural crops (ornamental only, not food) was $50,116,000 for Iowa versus $50,391,000 for Indiana. When we consider greenhouse operations that have a total wholesale volume of at least $10,000 annually, Iowa is ranked 26
th with a wholesale volume of $54,299,000. The
next-highest state is Tennessee at $55,532,000, and the next states below Iowa are Utah at $52,191,000 and Missouri at $45,070,000. Thus, the greenhouse industry for ornamentals is substantial but not huge. I do not know where I can get data on the food industry, but that will not make much of a difference as there are only two food-based greenhouses in Iowa. To my knowledge, there are only two bona fide food-production greenhouses in Iowa. These operations produce greenhouse, hydroponic tomatoes in Carroll, Iowa, and the other operation is a hydroponic herb producer in Grinnell. These are small, family-operated businesses, and they do not readily share information about income and production figures. Thus, the food sector of the greenhouse industry in Iowa is very minor, and most of this $50+ million industry is focused on ornamentals. Each of these two operations is 0.5 to 1.0 acre, and they are family-run operations that employ several outside individuals. Of course, either of these operations may be in the market to expand, and they could be possible tenants in a greenhouse associated with an ethanol plant. The size of the individual greenhouses producing ornamentals in Iowa varies greatly. The largest greenhouse in the tate is Dallas Johnson Greenhouses, Inc., Council Bluffs, at 50 acres under glass and plastic and twenty acres of seasonal, outdoor production. The next largest is Dallas‟s brother Russell in Red Oak, at Red Oak Greenhouses; Russ has about 13.5 acres. The next largest is Krieger‟s combined operation in Jefferson and Boone at about 10 or 11 total acres, followed by DeJong‟s Greenhouses, Inc., combined operations in Pella and in Oskaloosa at about 8.5 acres. To the best of my knowledge, the remainder of the greenhouses in Iowa are two acres or less, with many of them being 0.5 to 2.0 acre “Mom and Pop” operations run by a family. People I know who have looked into starting a greenhouse business in Iowa have stated that information they received from the State Horticulturist shows that Iowa is a deficit producer of every one of the greenhouse-grown crops recorded. (A deficit producer does not produce all that is needed for his own use, and therefore, Iowa is importing greenhouse products from other states.) I have not been able to find where I can get these data, but I believe it is true because I know much ornamental material comes from other states. The purpose of my portion of this grant was to visit and discuss several out-of-state operations to determine the feasibility of utilizing by-products of the manufacture of ethanol as resources for the production of crops in greenhouses. I discussed this general topic with several of my counterparts at other universities, and I found that there are only a few greenhouse operations that match our need for information with what information they could provide for us. These were operations in Colorado and New Jersey. There are several other units in other states, but these are minor compared with the Colorado and New Jersey operations. Other Waste-resource Operations in the United States There are two major waste-resource operations in the Upper Midwest. One is in Grand Rapids, Minnesota, and it runs off waste heat from a power plant and produces seedlings of several conifers,

14
many of which are used for Christmas tree production. The other operation is in Becker, Minnesota. This greenhouse complex uses waste heat from an adjacent power plant, and it produces several species of cut flowers. Back in the 1970s when the Becker complex was developed, there were several growers of food crops and a couple of growers of cut flowers, the main cut flower being roses. The cut rose grower, Hermes, Inc., was the only one that remained stable over the long run. During the 1980s and early 1990s, one by one everyone else went out of business except Hermes. As each of these greenhouse operations went out of business, Hermes bought them out (very cheaply, I might add, usually for 5 to 10 cents on the dollar), and Hermes linked each new greenhouse to their existing greenhouses. They were producing enough roses at the facility to meet their needs, and as they added each new operation, they started growing a new, more specialty species of cut flower in the newly obtained greenhouse range. This is still operational and doing well financially at this time. There also is a cut rose grower who uses a geothermal hot water system for heating a greenhouse in Sandy, Utah. This operation is doing well. The third operation is in central Pennsylvania. This operation is similar to the operation in Becker, Minnesota, in several ways. The Pennsylvania operation runs off waste heat from a Pennsylvania Power and Light power plant, and it started with a one-acre lettuce production facility, a five-acre tomato facility, and a five-acre potted plant, bedding plants, and spring garden plants facility, Bryfogle‟s. Over several years, the lettuce facility could not make it financially, and it went out of business. Next, the tomato operation, owned by Campbell Soup/Vlasic went out. Meanwhile, Bryfogle‟s operation did well. The lettuce facility was across the street from the other two operations, and no one has re-opened that operation. However, the tomato facility was next to Bryfogle‟s, and they bought out the Campbell Soup/Vlasic operation. They built a connecting tunnel between the two operations, along with a few more greenhouse units, and Bryfogle‟s now has a 12-acre potted plant, bedding plants, and spring garden plants facility that is doing quite well. Another operation, which would be very similar to what we would like to do with the ethanol plants, is the operation of Archer-Daniels-Midland (ADM) in Decatur, Illinois. This facility, called their Hydrofarm, started around 1980, and they tested many (maybe 50 different) crops for economic feasibility. Although they found ornamental crops to be profitable, because they were a food-based company, they tried to stick with foods as the crops they would produce in the facility. This actually was an act of trying to put a square peg in a round hole. This operation runs off waste heat and carbon dioxide from an ADM ethanol and corn sweetener plant that is adjacent to the greenhouse complex. They finally worked out the techniques and expanded the greenhouse to 10 acres, seven or so in butterhead Bibb lettuce and the other three acres in watercress and several other minor species. At one time, they produced 30,000 heads of lettuce per day, which were marketed to six major wholesalers. Still, they could not make it financially in the food from plants area. However, they now are moving toward converting the entire facility to tilapia and fresh-water shrimp production so that they can stay in the food production area. They have been very reluctant to allow me to enter their facility, and if they find out that we are planning to run greenhouse operations from waste heat from ethanol plants, they will never let me into the operation. I have even asked if they would take a horticulture major as an summer intern, and the general manager looked me right in the eyes and said no, because they would be training their competition. General Information The utilization of waste heat and other by-products from one operation as resources for a greenhouse has been done for the past 30 to 40 years. We have several examples of waste heat from electrical power plants being used to heat greenhouses; these may be found in Minnesota, Pennsylvania, and Colorado. In addition, and more closely tied to this project, is the ADM Hydrofarm in Decatur, Illinois. In addition, if there is a lumber or pulp wood industry nearby, several greenhouses have contracted to receive all of the waste wood products and burn them to heat a greenhouse. A good example of this is in Plymouth, Minnesota, at Len Busch Roses. For all intents and purposes, all of the engineering technology we need to use these waste products is available, and therefore, the holdup in adopting the use of those forms of technology are related to matching a willing donor of the waste material, whether it is heat or something else, with a willing user. This becomes a back and forth argument. Available donors often do not want to become beholden to the needs of a one-acre greenhouse when they need to shut down to clean their facility in the dead of winter and all the heat the greenhouse can get is needed and

15
used immediately. Likewise, small agri-business people often do not want to be subject to a 99-year lease on their growing facility; they want to own it outright. In addition, the agri-business person also may not want to build his or her greenhouse facility near the source because they have land somewhere else. However, they need to be close to the source of the resource so that it can be moved from supplier to user much more directly. Some form of technology for concentrating the energy from the waste heat from an ethanol plant must be used. A major problem with using waste heat from power plants is that the waste heat water is only about
93 to 97 F, and there is not enough energy in the water to heat or cool a reasonably sized greenhouse.
ADM uses 121 F water from their ethanol and corn sweetener plant, and this is not quite enough for the
coldest nights in Decatur, Illinois. They have calculated that they need water of at least 141 F to meet the needs of their coldest nights. This would be similar for an Iowa ethanol plant, or any other unit generating waste heat. Colorado During this portion of the project, I first found out that one of the original greenhouse operations that utilized waste heat from a power plant had just closed its doors and was to be dismantled. This operation was a large hydroponic tomato production facility near Rifle, Colorado. The lease had run its course, and the owner stated that a higher rental rate needed to be negotiated. The tenants could not pay the higher rate, due to the business being on a thin margin, and so the owner removed the tenants and began razing the greenhouse. This greenhouse operation was associated with a power plant, and the greenhouse used waste heat from the generation of electricity. This was one of three greenhouse operations in Colorado that took advantage of a federal government subsidy to tie a greenhouse food production facility into a stream of waste heat from a power plant. The other two are still in business, and they will be discussed below. The second greenhouse operation in Colorado that was tied to waste heat utilization from a power plant is located in Brush, Colorado. This is a 39-acre hydroponic tomato greenhouse facility. The business is a viable one, but at times has financial problems due to import markets undercutting his prices, and then he ends up not being able to sell his tomatoes for a price where he can make money. This individual would not allow me in their greenhouse operation, as many large hydroponic operations are very closed and will not let outsiders in the operation nor will they share any information with other people. They transport a lot of the produce from the greenhouse in Brush to a greenhouse operation in Ft. Lupton. The Ft. Lupton operation is owned by another person, below, who no longer is in the tomato business, and therefore, he allows the producer in Brush to use his grading and packing equipment for produce that will go into the Denver market and markets that will leave Colorado from the Denver area. The third greenhouse operation in Colorado that runs off waste heat from a power plant is located in Fort Lupton, Colorado. This operation was a 40-acre hydroponic tomato operation. The owner, Mr. Aarie van Wingerden, came to the greenhouse to meet with us and discuss what they have been doing lately. To my great surprise, he related to me that he had purchased it about eight years ago, and during the first two years, made great amounts of money from producing tomatoes. Then, about five to six years ago, certain trade agreements with Mexico went into effect, and low-priced tomatoes flowed into Colorado. Over a three-year period of time, all of his profits evaporated, and he could not find a way to grow and market his tomatoes profitably. He started looking for a buyer of his operation, and after about one year, he found a grower of ornamental plants who was a friend of the family. This person had just purchased the greenhouse, and there was nothing in the greenhouse when I visited it. The new owner was beginning to refit the greenhouse into an ornamentals production facility, which required a lot of changes in infrastructure of the greenhouse. The adjacent power plant provided low-grade waste heat that was
concentrated by a heat pump, because the low-grade heat came over to the greenhouse at 93 to 95 F. Water at this low level of heat content cannot provide much heat for the greenhouse in winter without concentrating it. Mr. van Wingerden also had the option of purchasing off-peak and lower-cost on-peak electricity, but he used it only for his basic electricity needs, rather than using it for supplemental lighting to increase his tomato yield. He said when he put the pencil to the economic feasibility of using the electricity for supplemental lighting, he could not justify the initial purchase of the lighting fixtures and the

16
cost of operating them. This is not uncommon for a greenhouse vegetable grower to find they cannot afford to install and/or run supplemental lighting to increase yield as the economics are simply not there. The cost of the lighting increases the cost of production such that the grower cannot make a profit on the crop because the public will not pay the amount needed to cover these expenses. Produce grown in a country that charges less becomes the source, and the U.S. grower loses his or her market, and never regains it. New Jersey The operation I visited in New Jersey was the Rutgers Eco-Complex located near Trenton. It actually was located in the small town of Bordentown, which was about 40 miles from New Brunswick, the location of Rutgers University, and about 40 miles from metropolitan Philadelphia. The main point of interest there was their capture of methane from their landfill area. I visited with Mr. Dave Specca, and he stated that they are focused on many projects all of which are related to recycling refuse. The greenhouse operation was one of several projects running concurrently at the Eco-Complex. I will focus only on the greenhouse area and items related to that. They have a large landfill there, although I do not believe that it is any larger than the one in Des Moines. The landfill in New Jersey, however, is capturing all the methane evolved from the landfill as the garbage decomposes. They built a 1.5-acre greenhouse facility that uses the methane produced by the landfill, and the purpose of this facility was for research and development. They readily showed that they could capture the methane and move it to the heating units and use it to heat the greenhouses. The purpose of the greenhouse was to let people do development work on crops they would produce in the greenhouse and how they could produce them more efficiently. They were hoping they could get greenhouse growers to build or lease a greenhouse from them using the methane from the landfill. This has not happened at all, and they have been releasing huge amounts of methane gas into the atmosphere until the EPA got after them. The item they really underestimated was the amount of methane produced by the decomposing garbage. They thought it would only be enough for heating a few acres, but it was enough, at the current rate, to heat about 40 acres of greenhouses. Because they had so much extra methane, and they had no use for it, they procured grants from the State of New Jersey and the EPA to build an electrical generation facility. This was being built when I was there in July, and the first of the five generators was to go on stream this fall, with all five generators going by the end of 2007. This facility will generate 7 megawatts of electricity, and it is in the process of integration into the local power grid. I asked Mr. Specca what they were doing with the excess methane now, and he informed me that the EPA made them burn it to carbon dioxide, as the EPA felt it was better to add carbon dioxide to the atmosphere than methane. I could not get a good answer out of him as to why they did not just collect it and add it to the gas used by local people to heat their homes, hot water heaters, etc. The greenhouse at the Rutgers Eco-Complex was not being used very efficiently. In a small research area, they produced tomatoes, but many of them had a mineral deficiency that made the tomatoes unsalable. In another section, a tenant just moved out, and this person was producing young plants of ornamental species. A potted orchid producer occupied the middle segment of the greenhouse. The greenhouse was only one-half full, and its purpose was to receive tissue-cultured orchids from Japan, transplant them into pots and acclimatize them to growing out of the test tube, and then finish them into flowering potted orchids in the greenhouse. The potted orchid is the number two potted plant in the United States, in wholesale dollar volume, behind the poinsettia, and they have found good markets for their finished potted plants. In the other segment of the greenhouse, there was research on tilapia and basil production, and both crops were being grown for applied research purposes. There was just not a whole lot of interest in what was going on in the greenhouse operation there. I discussed at length with Mr. Specca the utilization of carbon dioxide from the ethanol plant to enrich the atmosphere, and act as a fertilizer of carbon dioxide, in the greenhouses growing plants. He got out some calculations he had done for a projected ethanol plant in New Jersey, in which he and several engineers had looked at the production and utilization of several by-products from that ethanol plant. The bottom line is that a 10-acre greenhouse would only use < 0.01 percent of the daily carbon dioxide produced by their projected ethanol plant, and therefore, this would be great for the environment, but it
17
only would remove a tremendously small percentage of all the carbon dioxide produced by a typical ethanol plant. Major Conclusions My first major conclusion is that all the necessary information and engineering technology for the utilization of these by-products from an ethanol plant can be incorporated into a greenhouse production operation without any problem. All that is needed is the appropriate engineering firm needs to be hired to work through the design of the facility. However, only a small percentage of the total amount of waste resources will be used by even a large greenhouse operation. The main problem in the adoption of these technologies is that the ethanol production plant must be willing to link up with a user, and most importantly, that linkage needs to be a well developed, two-way street that provides the user with what is needed, when it is needed, at the appropriate level. The entire issue boils down to finding a match between a willing user (greenhouse operator), willing to locate next to the ethanol plant, with a willing supplier (ethanol production facility), who is willing to work with another party, so that they can negotiate a satisfactory arrangement that meets the needs of both parties. In many cases, there have been unwilling corporations that do not want to have to bother with making sure the heat and electricity are working for an adjacent greenhouse complex. Conversely, many growers do not want to have to re-locate or locate originally near a power plant or other facility that has heat and electricity for them at a low cost -- they want to build their greenhouse where they want to build it, not where someone else mandates it. The second major conclusion is that, more than likely, a food-production facility will not make it unless it is in a specialty area such as culinary or medicinal herb production. However, in my opinion, an operation that focuses on potted plants, bedding plants, and spring garden plants will be able to make it financially. The key issue here is that the greenhouse operation really needs to be associated with the bedding plant and spring garden plant segment of the greenhouse industry, because that is where the majority of the money can be made. This bedding plant and spring garden plant segment of the industry accounts for 52% of the entire wholesale business in the greenhouse industry. Certainly, I do not wish to exclude any segment of the industry from attempting this type of venture, but the odds are stacked against success quite strongly for an operation in the food segment of the greenhouse industry. My third major conclusion is that the operation will need to start small, unless it is a branch of a well established larger greenhouse operation that already has its markets developed and the increased production coming from this new operation will meet expanded needs already present. This occurred with a greenhouse in Iowa already. An established operation in Jefferson, which produced high-quality plant materials, purchased a large greenhouse operation in Boone. They felt they could increase their production of high-quality materials into the Central Iowa and surrounding area. They had not studied the market here well enough, and the market for high-quality material already was saturated. It took about one year for them to realize what the problem was, and they adjusted by producing lower-quality material for the big-box retailers (Wal-Mart, K-Mart, Target). This worked well until the box-box retailers decreased what they would pay for the material, and now the greenhouse can no longer supply them because what the big-box retailers will pay is less that their cost of production for the material. An operation will not be able to start with a large greenhouse because it will take several years for the market in Iowa to absorb the extra, new production coming out of the new greenhouse. However, if the new greenhouse belongs to someone that has large markets already established, and they are looking to fill the needs of markets that already have been established or they are in a position to quickly develop those markets, then a larger-sized greenhouse operation will be satisfactory. Overall Recommendations My overall recommendation is that Iowa State University, ethanol plants in Iowa, and surrounding states, and commercial investors continue to explore the possibilities of utilizing waste heat, carbon dioxide, and other waste by-products from ethanol production plants for growing plants. All of the necessary engineering technology has been developed in existing operations, and therefore, a great investment in time and energy into facilities development does not have to be done. More than likely, a greenhouse operation producing food crops will not prove financially solvent over a period of years, but I feel a grower

18
of specialty items such as herbs for either culinary or medicinal purposes, or other specialty food products may be able to find economic feasibility. On the other hand, I feel that greenhouses for the production of ornamental crops such as bedding plants, spring garden plants, and some potted plant species will be very profitable over a long period of time. I also recommend that the ethanol plants look for, and sign agreements with, only one or two larger producers tied to one ethanol plant, rather than, say, 10 to 12 small, one-acre, family-run operations in an agri-business park, in which there are 10 to 12 people to keep happy rather than just one or two. This latter situation would work only if one person oversaw the movement of the waste by-products to the agri-business park, rather than all 10 or 12 as individuals.
19
Appendix B.
A System to Operate Greenhouses and Aquaculture in Conjunction with Iowa‟s Ethanol Plants
Aquaculture White Paper
Joseph E. Morris and Richard D. Clayton
Aquatic Research Campus Facility, Iowa State University
Department of Natural Resource Ecology and Management
339 Science II, Ames, IA 50011-3221, USA

20
Introduction
Growth in the North Central Region‟s (NCR) aquaculture industry mirrors, and is driven by, broader U.S. and worldwide transitions in the seafood industry. The percentage of seafood from wild fisheries is near or above its sustainable capacity and a steadily increasing percentage of seafood in the U.S. and worldwide comes from aquaculture (FAO 2004). Global capture fisheries and aquaculture production supplied approximately 101 million tons of food fish in 2002. This resulted in an average per capita consumption of 16.2 kg (live weight equivalent). World aquaculture production in 1991 was 13,724,214 metric tons (NMFS 2002), and by 2002 had grown to 39,798,571 metric tons (FAO 2004). Currently, almost 40 percent of the fish and seafood consumed by humans is from aquaculture.
U.S. consumption of fishery products was 16.6 pounds (7.7 kg) of edible meat per person in 2004, an increase over the approximately 15 pounds (6.7 kg) per person level where it has remained over the last decade (NMFS 2004a). The value of U.S. aquaculture production has grown by roughly 5 to 10 percent each year during the past decade, and aquaculture is regarded as the fastest growing segment of U.S. agriculture. Fish are now farmed in every state and territory in the United States, and total U.S. aquaculture production in 2002 was approximately 393,401 metric tons valued at $866 million (NMFS 2004a). However, there is a wide disparity between domestic aquaculture production and demand, as indicated by a $7.8 billion 2004 U.S. seafood trade deficit (NMFS 2004b).
Aquaculture-related business in the NCR continues to be an "emerging" industry. This trend has continued into the 21st century, with an estimated farm-gate value of 70+ million dollars resulting in more than one billion pounds of seafood consumed annually. Although the NRC contains approximately 25 percent of the US population, the regional aquaculture production accounts for less than 3 percent of all U.S. aquaculture production (USDA-NASS 2000).
In addition to fish being cultured for the food fish market, culturists from both the private and public sectors of the NCR actively produce fish for pond and lake stockings. In the 2005 National Aquaculture Census, there were over 1,000 private farms in the U.S. that produced fish for either bait fish or lake/pond stockings with a value of ca. $56 million (USDA-NASS 2000). In addition to the private industry, federal and state public agencies produce vast numbers of fish for stocking into public waters. For instance, it has been estimated the public agencies have stocked over 1 billion walleye (Sander vitreus) fry and fingerlings into public waters (Conover 1986).
The demand for baitfish in the NCR far exceeds the supply from within the region (Gunderson and Tucker 2000). To meet this demand, cultured fatheads (Pimephales promelas), golden shiners (Notemigonus crysoleucas), and goldfish (Carassius auratus) from Arkansas are imported into the NCR. Still, significant shortages of a variety of species [including the three primary NCR aquaculture species – fatheads, white suckers (Catostomus commersoni), and golden shiners were reported by bait dealers (Meronek et al. 1997). Cultured baitfish ranked third in sales for the U.S. aquaculture industry (Mittelmark et al. 1993) and that the combined U.S. and Canadian industry is estimated to value approximately $1 billion annually (Litvak and Mandrak 1993). Compounding these shortages, the USDA-APHIS issued a federal order in October 2006 that prohibits the importation of 37 species of live fish from two Canadian provinces into the United States and the interstate movement of the same species from the eight states bordering the Great Lakes. In May 2007 the state of Ohio initiated interstate restrictions on live fish movement into that state. These restrictions have resulted in decreased availability of fish for both stocking and bait throughout this region. The emerging aquaculture industry combined with implications of the federal order on fish movement present opportunities to investigate potential alternative avenues of culture practices whereby alternative aquaculture practices with higher level of bio-security can be developed. Along with the changing role of aquaculture in this region, numerous ethanol plants have been developed, which do generate various waste streams.
21
Since dry-grind ethanol plants do produce excess co-products, can these products be used for other revenue streams, i.e., aquaculture? Distiller grains and/or waste heat are two products that might have an opportunity in the aquaculture industry. To understand the potential for either of these products, we must determine which one of these co-products best fits the needs of aquaculture production. The federal order issued in October 2006 was in response to an outbreak of Viral Hemorrhagic Septicemia (VHS) around the Great Lakes. This has limited (if not completely terminated) fish transportation of live fish among states surrounding the Great Lakes. With this stoppage, there is now a limited number of species that can be used for lake stocking or bait; bait fish are also used as live feed for culturing advanced fingerlings, e.g., walleye, as well as for bait. Entrepreneurs interested in aquaculture should regard the symbiotic relationship with ethanol processing as a unique opportunity. To help entrepreneurs with making the decision to start an aquaculture facility, a decision tree needs to be utilized to create a best management plan (BMP) for this opportunity. The species of fish to raise, co-product to use, fish marketability, and facility requirements that uses bio-security are just some of the parameters that need to be included in this decision tree. The goal of this white paper is to address some of the questions in the decision tree leading up to a working BMP. The addition of local fish producers in the state will help to increase fresh supplies of locally grown, higher value fish while also building an aquaculture community that reaches out beyond the traditional agriculture industry in this region.
Discussion
Co-product Choice
The first question that needs to be addressed is which co-product can be successfully used. We feel that the co-product that best suits aquaculture is the excess energy (heat) generated by these plants. One of the major constraints for fish production in the state of Iowa is the limited culture period dictated by our environment. For instance, the channel catfish (Ictalurus punctatus) industry has expanded in Mississippi even though the industry was initiated in Kansas as the climatic conditions in Mississippi allows for an extra 6-week culture period in outdoor ponds. For successful production of fish, optimum temperatures need to be met and maintained to be both cost- and time-effective. By heating the water with this potential heat, fish can then be cultured year around at optimal temperatures assuring a consistent supply to the markets.
Potential Species
The choice of which species to culture is determined by specific culture requirements, which temperature is a major parameter. First and foremost, the species needs to have a high market value in the local arena. Some possible species that meet this requirement in Iowa are walleye, hybrid striped bass (a cross between striped bass [Morone saxatilis] and white bass [M. chrysops]), and fathead minnow. A combination of these three species is a good mix of species for various markets. Walleye and hybrid striped bass can either be used as food fish or pond stockers while fathead minnows are a popular bait fish. Both walleye and hybrid striped bass have been recognized as potential food fish in the Midwest due to their temperature preferences, noted later, as well as their name recognition as desirable food fish in our region (Summerfelt 2000; Kohler 2004).
To date, there are 60+ aquaculture producers in Iowa. Since all three species noted in this project are available from local producers, their use in the project will serve to build a community of aquaculture producers and consumers in the state of Iowa similar to the swine industry.
In previous publications Tilapia, Oreochromis spp have often been noted as fish that are able to directly utilized distillers grains due to their ability to utilize these proteins directly. However, this species is often
22
characterized as a lower cost food fish unlike walleye. Although it first appears that this species could be cultured relatively cheaply given these characteristics, their local market value is impacted by imported fillets from other countries that have lower labor and environmental costs. In 2002, 100 million lbs were imported (Harvey 2003). In 2006, tilapia imports to the United States totaled 348.9 million pounds and were valued at $482.7 million (Burden 2007). For the fifth consecutive year, the quantity of imported tilapia increased as did the average price (USDA-ERS 2006).
Imported tilapia are sold as whole frozen fish at $0.30 to 0.70/pound wholesale (Kohler 2003). Morris (1999) estimated the cost of producing tilapia to be $1.20 to 1.80/pound depending on culture method. In addition, even if these fish could be cultured as cheaply using regional resources, they are not as readily recognized as a premier food fish as are walleye and hybrid striped bass in our region.
Heat requirements
As previously indicated, outdoor culture of fish in Iowa is limited by the shortened growing season. A supplemental heat source coming from an ethanol plant will allow for fish culture regardless of seasonal effects. The opportunity for a heat source to overcome this issue will present new opportunities and markets for Iowa‟s aquaculture industry.
The aquaculture industry uses several principle culture methods including ponds, cages, raceways and closed reuse aquaculture systems (RAS). In a RAS, the system recirculates water rather than passing it through the system only once. Less water is needed for this system than for ponds or raceways. Most reuse systems are located indoors, which allows the grower to maintain control over the water, such as temperature. Reuse systems have additional advantages; however, their major disadvantage is the start-up cost. Closed reuse systems have four parts: the culture chambers, a primary settling chamber, a biological filter, and a final clarifier or secondary settling chamber. Each unit is important to the system, although some closed systems do not contain all four components. Components may be separate units or they may be arranged in combinations that make the system appear to have only one or two units. Components may be large or relatively small, but each must be in proper proportion to one another if the system is to perform properly.
Production rates in closed reuse systems vary considerably depending upon the type of system and the user‟s expertise. Yields can range from 0.25 to 0.8 pounds per gallon, although these figures can be misleading. Large-scale reuse systems are not recommended for persons with little experience in aquaculture. In our analysis, we feel that too often these systems are „over engineered‟ to the point where operational and development costs far exceed potential outputs. Thus, the use of simplified RAS designs allow for lower break-even costs as well as simpler management scenarios.
The heat source for the RAS must be a reliable source with a back-up system in place to prevent catastrophic failures. The species mentioned above have similar temperature requirements. The optimum temperature for walleye is between 72 to 79°F depending on what life stage they are at. Optimum temperature for fathead minnows is 72°F (Becker 1983) and hybrid striped bass grow best at 77 to 80°F (Hodson 1989). Depending on the amount of heat available from the ethanol plant, the aquaculture facility could be built accordingly. In an earlier publication, Illinois State University researchers noted that the critical variable cost for tilapia culture in a RAS was the cost of heat (Rosati 1997).
A heat source coming from the ethanol plant will need to first go through a heat exchanger as opposed to directly used in the tanks as culture water quality needs to be maintained separated to prevent cross-contamination. There has been at least one large aquaculture facility in the Midwest that has closed due to a chlorine rinse in a power plant that directly killed the fish in the adjoining facility.
23
Facility Requirements
To be a successful culture facility, there are many parameters that must be met. There are many RAS designs from low-tech to high-tech systems used (Timmons et al. 2002). The first and foremost parameter for a successful RAS is water. A good, clean, and consistent source of water is needed for the aquaculture facility. With the use of a RAS, water consumption can be greatly reduced. A RAS recycles the majority of water needed for fish culture; roughly 10 percent of the total volume of make up water per day is needed. For instance, a facility with three systems (10,000 gallons each) will require 30,000 gallons to fill the system, and then an additional 3,000 gal/day for make-up water. Although 10% makeup water is needed daily you must anticipate higher rates for different occasions, e.g., flushing tanks for water quality issues or health issues.
The water source can either be a reliable well or an existing water source that the ethanol plant is using. However, the non-chlorinated water source needs to be controlled by the RAS operators and not someone else. Along the same lines as water control, heat inputs from the ethanol plant needs to be also controlled by the RAS operator. The RAS will need to have a back-up heat source for situations when the plant shuts down for maintenance.
The RAS also needs to be constructed within a suitable building, e.g., a typical pole-shed or hoop structure. In the building, electricity is needed to power the needed pumps, filters, etc. that are used in RASs. The electrical supply needs to be reliable and a back-up generator in place for emergencies. Given the inherent design of RASs, pumped water is the source of oxygen and waste removal for the cultured animals. Pump failure in these systems are much more problematic than more extensive culture systems, e.g., ponds and raceways.
As with other agriculture operations, truck access is critical. Both intrastate and interstate movement of aquaculture products naturally requires the use of larger trucks because not only are fish being transported but also water weighs 8+ pounds per gallon. Since fish are often transported in tanks at ca. ¼ pound per gallon, these trucks are naturally large and bulky. These vehicles need a loading area were they can pull in and turn around in addition to suitable all-season access roadways.
The RAS will produce a waste stream of effluent water. This water could either be run through a septic system (albeit as in the example above, 3,000 gallons/day), used in conjunction with a horticulture facility located at the same site, used as irrigation water for agriculture crops, or released to the environment. This water could also be released into surface run-off in the area; however, regulations are more stringent for this type of release. This waste stream of water will contain the fish waste and excess feed components not utilized by the fish; however, this relatively dilute waste stream is often minor compared to other agriculture operations. Some recent research projects have evaluated different methods of refining this product further for other markets e.g., dried for soil amendments (Yeo et al. 2004).
Laboratory and feed storage rooms also need to be included with the construction of the facility. Fish feed is usually ordered by the pallet and stored in a cold-storage facility. Food storage for a maximum 3-month supply is needed as aquaculture feeds become unstable after that time period.
As previously noted, bio-security issues are also a concern with aquaculture, especially in today‟s aquaculture regulatory climate. In addition to controlled access both for people and animals, there is a need to control water quality as well as for quarantined facilities within the aquaculture facilities.
Potential Markets
By culturing these three species together in one facility (in different tanks), different markets can then be assessed throughout the year. There are two markets for walleye and hybrid striped bass. First, they can be sold as stockers (for use as stocking a lake or pond for recreational fishing), and secondly as a food fish. If they are cultured as stockers, they can be sold anytime during the summer and fall season. The purpose of these stockings includes additional recreation fisheries as well as biological control for

24
problematic wild trash fishes. These fish can also be cultured to a food-size fish over the course of 18+ months depending on the culture environment and market needs.
Fathead minnows can be sold as bait fish and also as food for other species that are cultured in the state that require a live feed. Instead of the 1+ year of culture for food fish, these fish can be produced within 3 months for the bait fish market. In recent years the USDA-APHIS October 2006 ban of interstate transport of specific fishes has severely limited the use of wild-harvest minnows as live feed in Iowa‟s walleye culture as well as bait for sport fishers.
All fish could be marketed as “local” fish and be promoted in the state of Iowa‟s promotion for locally grown products for niche markets. All fish can be sold live to limit the amount of capital needed for state-inspected slaughter facility. If there is a need to produce processed fish, suitable facilities need to be developed that incorporates suitable Hazard Analysis Critical Control Point (HACCP) techniques.
Production Restraints
Heat source is a limiting factor in the decision tree. The amount of heat that can be gleaned from the ethanol plant and the temperature of the source water will dictate the overall facility production capacity. A concern with this heat source is any potential down time that might occur at the plant. The track record for ethanol production at the plant in question needs to be evaluated and the risk of down time then can be factored into the decision tree.
Additional Considerations
Other than the use of the heat co-product, various distillers grain waste has been investigated for use in aquaculture as a possible food component. The largest issue with this co-product is its economical utilization, variability of composition, as well as its availability given the fact that this waste stream is being utilized as other agriculture feedstuffs. Webster et al. (1993) found that distiller grain solubles can be up to 30 percent of channel catfish diet. However, given the ability of this species to consume relatively low-protein diets, we have concerns as to the utility of this research for walleye and hybrid striped bass given their need for higher protein diets that often include fish meal. If there is an effort to pursue this research agenda, then we will need to enlist fish nutritionist, e.g., James Tidwell and Carl Webster (Kentucky State University) or Paul Brown (Purdue University), who have the necessary background and interests to pursue that topic. At the same time these feedstuffs are now readily consumed by more traditional agriculture operations such as swine and cattle production.
Additional concerns are related to the need for research facilities to conduct basic and applied research to complement field applications of this research. These facilities need suitable research equipment to be able to replicate future studies while at the same time delivering suitable outputs to the industry.
Summary In summary, a decision tree and its related best management practice (BMP) for an aquaculture facility should include a combination of different aquaculture products for different markets. In this paper this combination consists of walleye, hybrid striped bass, and fathead minnows. This combination allows for different markets while using different culture technologies albeit they have similar culture requirements. Although RAS technology has often been noted being cost prohibitive, we feel that given our stated requirements RAS operations do have potential in the state of Iowa. The RAS technology can be used to maintain a more consistent culture environment while using a minimal amount of water. Fish can then be sold live as stockers, food fish, or bait. The size of the RAS needs to be related to the amount of the

25
potential heat coming from the ethanol plant. All aquaculture operations need back-up technologies in place to limit catastrophic failures.
The main co-product that we envision as being utilized is the heat waste stream whereby fish can be cultured throughout the year. This will result in a more consistent supply while at the same time produce fish that have undergone bio-security clearance. In additional to the stated operational concerns, a good BMP does require active participation of the ethanol operators in the proposed aquaculture operations. All too often, aquaculture operations have been viewed as separate entities by their associated plant cooperators and this has often resulted in catastrophic failures that needlessly occurred.

26
References Becker, G.C. 1983. Fishes of Wisconsin. The University of Wisconsin Press, Madison.
Burden, D. 2007. Tilapia profile. Agriculture Marketing Resource Center, Iowa State University, Ames,
Iowa. Web site http://www.agmrc.org/agmrc/commodity/aquaculture/tilapia/tilapiaprofile.htm viewed
on June 13, 2007.
Conover, C. E. 1986. Stocking cool-water species to meet management needs. Pages 31-39 In R. H.
Stroud, editor. Fish Culture in Fisheries Management. Fish Culture Section and Fisheries
Management Sections of the American Fisheries Society, Bethesda, Maryland.
FAO (Food and Agriculture Organization). 1995. The state of world fisheries and aquaculture. Food and
Agriculture Organization of the United Nations, Rome, Italy.
Gunderson, J. L. and P. Tucker. 2000. A white paper on the status and needs of baitfish aquaculture in
the North Central Region. North Central Regional Aquaculture Center, Ames, Iowa.
Harvey, D. J. 2003. Aquaculture outlook. USDA LDP-AQS-18. 18 pp.
Hodson, R.G. 1989. Hybrid striped bass biology and life history. Southern Regional Aquaculture Center,
web site - http://srac.tamu.edu/tmppdfs/205178-
300fs.pdf?CFID=205178&CFTOKEN=48527712&jsessionid=8e3036b924487f7e3114. Viewed on
June 12, 2007.
Kohler, C. C. 2004. A white paper on the status and needs of hybrid striped bass aquaculture in the North
Central Region. North Central Regional Aquaculture Center, Ames, Iowa.
Litvak, M.K., and N.E. Mandrak. 1993. Ecology and freshwater bait use in Canada and the United States.
Fisheries 18(12):6-12.
Meronek, T.G. 1994. Status of the bait industry in the north central region of the United States. Master‟s
thesis. University of Wisconsin, Stevens Point.
Meronek, T.J., F.A. Copes, and D.W. Coble. 1997. The bait industry in Illinois, Michigan, Minnesota, Ohio,
South Dakota, and Wisconsin. NCRAC Technical Bulletin Series #105. NCRAC Publications Office.
Iowa State University, Ames.
Mittelmark, J.J., J. Skurla, D. Landkamer, and A. Kapuscinski. 1993. Economic analysis of baitfish
aquaculture in Minnesota. Minnesota Sea Grant, St. Paul.
Morris, J. E. 1999. Tilapia culture in Iowa. Iowa State University Extension Publication Pm 1352g, Ames,
Iowa.
National Marine Fisheries Service (NMFS) 2004a. Fisheries of the United States 2003.
National Marine Fisheries Service (NMFS) 2004b. Current Fisheries Statistics no. 2004 2 Imports and
exports of Fisheries Products. Annual Summary, 2004.
http://www.st.nmfs.gov/st1/trade/documents/TRADE2004.pdf viewed on October 5, 2006.
National Marine Fisheries Service (NMFS) 2002. Fisheries of the United States 2001.
Rosati, R., P. Foley, P.D. O‟Rourke, K. Tudor. 1997. Operation of a Prototype Commercial-Scale
Hatchery System for Tilapia Aquaculture in Urban Oreochromis niloticus. Pages 319-329 In

27
Fitzsimmons, K. (Editor) Tilapia Aquaculture: Proceedings from the Fourth International Symposium
on Tilapia in Aquaculture. Volume 1. Ithaca, NY: Northeast Regional Agriculture Engineering Service.
Summerfelt, R. C. 2000. A white paper on the status and needs of walleye aquaculture in the North
Central Region. North Central Regional Aquaculture Center, Ames, Iowa.
Timmons, M. B., J. M. Ebeling, F. W. Wheaton, S. T. Summerfelt, and B. J. Vinci. 2002. Recirculating
aquaculture systems. Cayuga Aqua Ventures, New York, New York.
United States Department of Agriculture (USDA). 2000. 1997 Census of Agriculture. AC97 SP 3.
Census of Aquaculture (1998) Volume 3, Special Studies Part 3. National Agricultural Statistics
Service. Washington, DC.
Webster, C. D., J. H. Tidwell, L. S. Goodgame, and P. B. Johnsen. 1993. Growth, body composition, and
organoleptic evaluation of channel catfish fed diets containing different percentages of distillers‟
grains with solubles. The Progressive Fish-Culturist 55:95-100.
Yeo, S. E., F. P. Binkowski, and J. E. Morris. 2004. Aquaculture Effluents and Waste By-Products:
Characteristics, Potential Recovery, and Beneficial Reuse. North Central Regional Aquaculture
Center, Ames, Iowa.
28
Appendix C.
Aquaponic Greenhouse
Albert S. Bennett Graduate Research Associate
Agricultural and Biosystems Engineering 3144 NSRIC
Iowa State University Ames, IA 50011
Robert P. Anex
Associate Professor Agricultural and Biosystems Engineering
3202 NSRIC Iowa State University
Ames, IA 50011
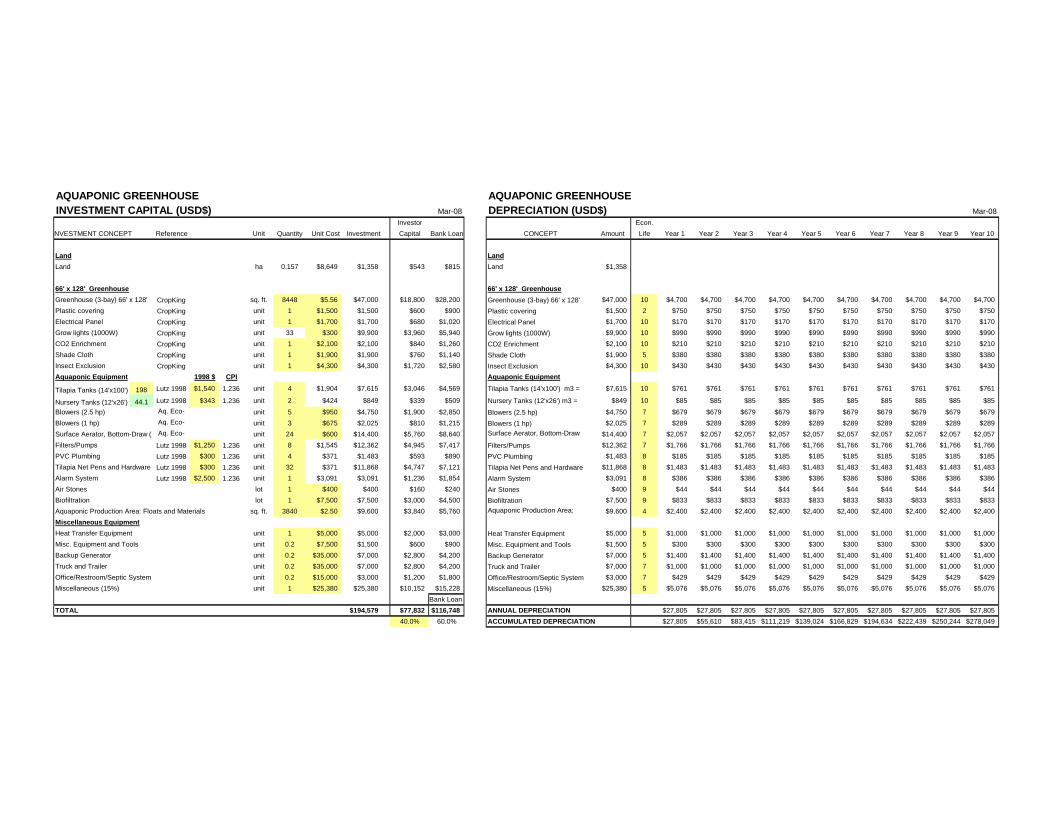
AQUAPONIC GREENHOUSE AQUAPONIC GREENHOUSE
INVESTMENT CAPITAL (USD$) Mar-08 DEPRECIATION (USD$) Mar-08
Investor Econ.
INVESTMENT CONCEPT Reference Unit Quantity Unit Cost Investment Capital Bank Loan CONCEPT Amount Life Year 1 Year 2 Year 3 Year 4 Year 5 Year 6 Year 7 Year 8 Year 9 Year 10
Land Land
Land ha 0.157 $8,649 $1,358 $543 $815 Land $1,358
66' x 128' Greenhouse 66' x 128' Greenhouse
Greenhouse (3-bay) 66' x 128' CropKing sq. ft. 8448 $5.56 $47,000 $18,800 $28,200 Greenhouse (3-bay) 66' x 128' $47,000 10 $4,700 $4,700 $4,700 $4,700 $4,700 $4,700 $4,700 $4,700 $4,700 $4,700
Plastic covering CropKing unit 1 $1,500 $1,500 $600 $900 Plastic covering $1,500 2 $750 $750 $750 $750 $750 $750 $750 $750 $750 $750
Electrical Panel CropKing unit 1 $1,700 $1,700 $680 $1,020 Electrical Panel $1,700 10 $170 $170 $170 $170 $170 $170 $170 $170 $170 $170
Grow lights (1000W) CropKing unit 33 $300 $9,900 $3,960 $5,940 Grow lights (1000W) $9,900 10 $990 $990 $990 $990 $990 $990 $990 $990 $990 $990
CO2 Enrichment CropKing unit 1 $2,100 $2,100 $840 $1,260 CO2 Enrichment $2,100 10 $210 $210 $210 $210 $210 $210 $210 $210 $210 $210
Shade Cloth CropKing unit 1 $1,900 $1,900 $760 $1,140 Shade Cloth $1,900 5 $380 $380 $380 $380 $380 $380 $380 $380 $380 $380
Insect Exclusion CropKing unit 1 $4,300 $4,300 $1,720 $2,580 Insect Exclusion $4,300 10 $430 $430 $430 $430 $430 $430 $430 $430 $430 $430
Aquaponic Equipment 1998 $ CPI Aquaponic Equipment
Tilapia Tanks (14'x100') m3 =198 Lutz 1998 $1,540 1.236 unit 4 $1,904 $7,615 $3,046 $4,569 Tilapia Tanks (14'x100') m3 = $7,615 10 $761 $761 $761 $761 $761 $761 $761 $761 $761 $761
Nursery Tanks (12'x26') m3 =44.1 Lutz 1998 $343 1.236 unit 2 $424 $849 $339 $509 Nursery Tanks (12'x26') m3 = $849 10 $85 $85 $85 $85 $85 $85 $85 $85 $85 $85
Blowers (2.5 hp) Aq. Eco-
Sys.unit 5 $950 $4,750 $1,900 $2,850 Blowers (2.5 hp) $4,750 7 $679 $679 $679 $679 $679 $679 $679 $679 $679 $679
Blowers (1 hp) Aq. Eco-
Sys.unit 3 $675 $2,025 $810 $1,215 Blowers (1 hp) $2,025 7 $289 $289 $289 $289 $289 $289 $289 $289 $289 $289
Surface Aerator, Bottom-Draw (1/2 hp)Aq. Eco-
Sys.unit 24 $600 $14,400 $5,760 $8,640 Surface Aerator, Bottom-Draw
(1/2 hp)$14,400 7 $2,057 $2,057 $2,057 $2,057 $2,057 $2,057 $2,057 $2,057 $2,057 $2,057
Filters/Pumps Lutz 1998 $1,250 1.236 unit 8 $1,545 $12,362 $4,945 $7,417 Filters/Pumps $12,362 7 $1,766 $1,766 $1,766 $1,766 $1,766 $1,766 $1,766 $1,766 $1,766 $1,766
PVC Plumbing Lutz 1998 $300 1.236 unit 4 $371 $1,483 $593 $890 PVC Plumbing $1,483 8 $185 $185 $185 $185 $185 $185 $185 $185 $185 $185
Tilapia Net Pens and Hardware Lutz 1998 $300 1.236 unit 32 $371 $11,868 $4,747 $7,121 Tilapia Net Pens and Hardware $11,868 8 $1,483 $1,483 $1,483 $1,483 $1,483 $1,483 $1,483 $1,483 $1,483 $1,483
Alarm System Lutz 1998 $2,500 1.236 unit 1 $3,091 $3,091 $1,236 $1,854 Alarm System $3,091 8 $386 $386 $386 $386 $386 $386 $386 $386 $386 $386
Air Stones lot 1 $400 $400 $160 $240 Air Stones $400 9 $44 $44 $44 $44 $44 $44 $44 $44 $44 $44
Biofiltration lot 1 $7,500 $7,500 $3,000 $4,500 Biofiltration $7,500 9 $833 $833 $833 $833 $833 $833 $833 $833 $833 $833
Aquaponic Production Area: Floats and Materials sq. ft. 3840 $2.50 $9,600 $3,840 $5,760 Aquaponic Production Area:
Floats and Materials$9,600 4 $2,400 $2,400 $2,400 $2,400 $2,400 $2,400 $2,400 $2,400 $2,400 $2,400
Miscellaneous Equipment
Heat Transfer Equipment unit 1 $5,000 $5,000 $2,000 $3,000 Heat Transfer Equipment $5,000 5 $1,000 $1,000 $1,000 $1,000 $1,000 $1,000 $1,000 $1,000 $1,000 $1,000
Misc. Equipment and Tools unit 0.2 $7,500 $1,500 $600 $900 Misc. Equipment and Tools $1,500 5 $300 $300 $300 $300 $300 $300 $300 $300 $300 $300
Backup Generator unit 0.2 $35,000 $7,000 $2,800 $4,200 Backup Generator $7,000 5 $1,400 $1,400 $1,400 $1,400 $1,400 $1,400 $1,400 $1,400 $1,400 $1,400
Truck and Trailer unit 0.2 $35,000 $7,000 $2,800 $4,200 Truck and Trailer $7,000 7 $1,000 $1,000 $1,000 $1,000 $1,000 $1,000 $1,000 $1,000 $1,000 $1,000
Office/Restroom/Septic System unit 0.2 $15,000 $3,000 $1,200 $1,800 Office/Restroom/Septic System $3,000 7 $429 $429 $429 $429 $429 $429 $429 $429 $429 $429
Miscellaneous (15%) unit 1 $25,380 $25,380 $10,152 $15,228 Miscellaneous (15%) $25,380 5 $5,076 $5,076 $5,076 $5,076 $5,076 $5,076 $5,076 $5,076 $5,076 $5,076
Bank Loan
TOTAL $194,579 $77,832 $116,748 ANNUAL DEPRECIATION $27,805 $27,805 $27,805 $27,805 $27,805 $27,805 $27,805 $27,805 $27,805 $27,805
40.0% 60.0% ACCUMULATED DEPRECIATION $27,805 $55,610 $83,415 $111,219 $139,024 $166,829 $194,634 $222,439 $250,244 $278,049

AQUAPONIC GREENHOUSECREDIT AMORTIZATION (USD$) Mar-08
PROJECT COST: $194,579 CREDIT: $116,748 Interest Rate 8.00%
Capital Total
DATE Loan Balance Interest Payment Interest Payment days
Dec-2007 $38,915.90 $38,915.90
Jan-2008 $38,915.90 $77,831.80 $528.83 31
Feb-2008 $38,915.90 $117,276.53 $796.84 31
Mar-2008 $118,073.36 $750.49 29
Apr-2008 $118,823.86 $807.35 31
May-2008 $119,631.21 $786.62 30
Jun-2008 $120,417.82 $818.18 31
Jul-2008 $121,236.01 $797.17 30
Aug-2008 $122,033.17 $829.16 31
Sep-2008 $122,862.33 $834.79 31
Oct-2008 $123,697.12 $813.35 30
Nov-2008 $124,510.47 $845.99 31
Dec-2008 $125,356.46 $824.26 $16,678.24 $9,433.03 $26,111.27 30
Dec-2009 $100,069.45 $8,005.56 $16,678.24 $8,005.56 $24,683.80 365
Dec-2010 $83,391.21 $6,671.30 $16,678.24 $6,671.30 $23,349.54 365
Dec-2011 $66,712.97 $5,337.04 $16,678.24 $5,337.04 $22,015.28 365
Dec-2012 $50,034.73 $4,013.74 $16,678.24 $4,013.74 $20,691.99 366
Dec-2013 $33,356.48 $2,668.52 $16,678.24 $2,668.52 $19,346.76 365
Dec-2014 $16,678.24 $1,334.26 $16,678.24 $1,334.26 $18,012.50 365
SUM $116,747.70 $37,463.44 $116,747.70 $37,463.44 $154,211.14
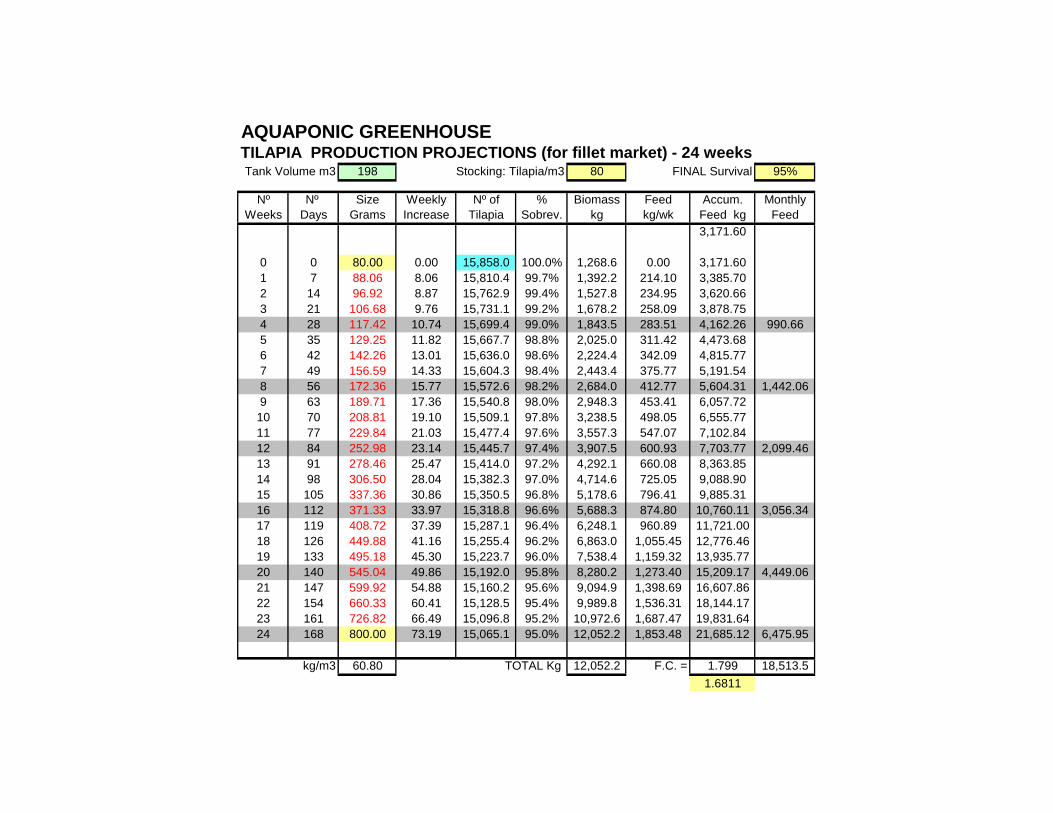
AQUAPONIC GREENHOUSETILAPIA PRODUCTION PROJECTIONS (for fillet market) - 24 weeksTank Volume m3 198 Stocking: Tilapia/m3 80 FINAL Survival 95%
Nº Nº Size Weekly Nº of % Biomass Feed Accum. Monthly
Weeks Days Grams Increase Tilapia Sobrev. kg kg/wk Feed kg Feed
3,171.60
0 0 80.00 0.00 15,858.0 100.0% 1,268.6 0.00 3,171.60
1 7 88.06 8.06 15,810.4 99.7% 1,392.2 214.10 3,385.70
2 14 96.92 8.87 15,762.9 99.4% 1,527.8 234.95 3,620.66
3 21 106.68 9.76 15,731.1 99.2% 1,678.2 258.09 3,878.75
4 28 117.42 10.74 15,699.4 99.0% 1,843.5 283.51 4,162.26 990.66
5 35 129.25 11.82 15,667.7 98.8% 2,025.0 311.42 4,473.68
6 42 142.26 13.01 15,636.0 98.6% 2,224.4 342.09 4,815.77
7 49 156.59 14.33 15,604.3 98.4% 2,443.4 375.77 5,191.54
8 56 172.36 15.77 15,572.6 98.2% 2,684.0 412.77 5,604.31 1,442.06
9 63 189.71 17.36 15,540.8 98.0% 2,948.3 453.41 6,057.72
10 70 208.81 19.10 15,509.1 97.8% 3,238.5 498.05 6,555.77
11 77 229.84 21.03 15,477.4 97.6% 3,557.3 547.07 7,102.84
12 84 252.98 23.14 15,445.7 97.4% 3,907.5 600.93 7,703.77 2,099.46
13 91 278.46 25.47 15,414.0 97.2% 4,292.1 660.08 8,363.85
14 98 306.50 28.04 15,382.3 97.0% 4,714.6 725.05 9,088.90
15 105 337.36 30.86 15,350.5 96.8% 5,178.6 796.41 9,885.31
16 112 371.33 33.97 15,318.8 96.6% 5,688.3 874.80 10,760.11 3,056.34
17 119 408.72 37.39 15,287.1 96.4% 6,248.1 960.89 11,721.00
18 126 449.88 41.16 15,255.4 96.2% 6,863.0 1,055.45 12,776.46
19 133 495.18 45.30 15,223.7 96.0% 7,538.4 1,159.32 13,935.77
20 140 545.04 49.86 15,192.0 95.8% 8,280.2 1,273.40 15,209.17 4,449.06
21 147 599.92 54.88 15,160.2 95.6% 9,094.9 1,398.69 16,607.86
22 154 660.33 60.41 15,128.5 95.4% 9,989.8 1,536.31 18,144.17
23 161 726.82 66.49 15,096.8 95.2% 10,972.6 1,687.47 19,831.64
24 168 800.00 73.19 15,065.1 95.0% 12,052.2 1,853.48 21,685.12 6,475.95
kg/m3 60.80 TOTAL Kg 12,052.2 F.C. = 1.799 18,513.5
1.6811

AQUAPONIC GREENHOUSEMONTHLY LABOR COSTS Mar-08
Concept Quant. Net Salary Benefits Salary / pers. TOTAL
ADMINISTRATION
Manager/Biologist 0.2 2,916.67 437.50 3,354.17 $670.83
ADMINISTRATION PERSONNEL 0.2 $670.83
PRODUCTION
Labor 2.0 1,560.00 234.00 1,794.00 $3,588.00
PRODUCTION PERSONNEL 2.0 $3,588.00

AQUAPONIC GREENHOUSE
YEAR 1: MONTHLY INCOME PROJECTIONS (USD$) Mar-08
Concept Unit. Mar-2008 Apr-2008 May-2008 Jun-2008 Jul-2008 Aug-2008 Sep-2008 Oct-2008 Nov-2008 Dec-2008 Jan-2009 Feb-2009 TOTAL 2008-9
TILAPIA PRODUCTION
Stocked Fingerlings fingerling 17,620 17,620 17,620 17,620 17,620 17,620 17,620 17,620 140,960
Nursery Tank A - BIOMASS kg 604 1,269 604 1,269 604 1,269 604 1,269
Nursery Tank A - FEED kg 983 2,189 983 2,189 983 2,189 983 2,189
Nursery Tank B - BIOMASS kg 604 1,269 604 1,269 604 1,269 604 1,269
Nursery Tank B - FEED kg 983 2,189 983 2,189 983 2,189 983 2,189
Growout Tank 1 - BIOMASS for fillet kg 1,843 2,684 3,907 5,688 8,280 12,052 1,843 2,684 3,907 5,688
Growout Tank 1 - FEED kg 991 1,442 2,099 3,056 4,449 6,476 991 1,442 2,099 3,056
Growout Tank 2 - BIOMASS for fillet kg 1,843 2,684 3,907 5,688 8,280 12,052 1,843 2,684 3,907
Growout Tank 2 - FEED kg 991 1,442 2,099 3,056 4,449 6,476 991 1,442 2,099
Growout Tank 3 - BIOMASS for fillet kg 1,843 2,684 3,907 5,688 8,280 12,052 1,843 2,684
Growout Tank 3 - FEED kg 991 1,442 2,099 3,056 4,449 6,476 991 1,442
Growout Tank 4 - BIOMASS for fillet kg 1,843 2,684 3,907 5,688 8,280 12,052 1,843
Growout Tank 4 - FEED kg 991 1,442 2,099 3,056 4,449 6,476 991
Tilapia Biomass Production kg 12,052 12,052 12,052 12,052 48,209
TOTAL Tilapia Fillet % dress out 33% kg 3,977 3,977 3,977 3,977 15,909
Tilapia By-Products (dry matter) % moisture 67% kg 2,665 2,665 2,665 2,665 10,659
TILAPIA INCOME
Tilapia Fillet Net $/kg $7.72 $ $30,694 $30,694 $30,694 $30,694 $122,776.49
Tilapia by-products Net $/kg dm $0.60 $ $1,599 $1,599 $1,599 $1,599 $6,395.35
(sq ft) (m2) (plant/sq ft) (plant/m2) (lb/plant/yr) (kg/m2/month)
TOMATO PRODUCTION & INCOME Production area: 3840.0 356.8 Plant density: 0.20 2.15 Yield data: 20.0 1.63 yields start 3 months after transplant
Tomato Biomass kg locate transplants 580.5 580.5 580.5 580.5 580.5 580.5 3483.0
Tomato Net Market Price $/kg $3.11 $2.37 $1.87 $0.88 $0.88 $0.88 $1.87 $2.37 $3.11 $3.86 $3.86 $3.86
Tomato Income $ $1,088 $1,376 $1,808 $2,240 $2,240 $2,240 $10,992.00
NET INCOME $0 $0 $0 $0 $0 $0 $1,088 $33,669 $34,101 $34,533 $34,533 $2,240 $140,164
AQUAPONIC GREENHOUSE
YEAR 1: MONTHLY OPERATIONAL COSTS (USD$) Mar-08
Concept Unit. Mar-2008 Apr-2008 May-2008 Jun-2008 Jul-2008 Aug-2008 Sep-2008 Oct-2008 Nov-2008 Dec-2008 Jan-2009 Feb-2009 TOTAL 2008-9
PRODUCTION COSTS
Fingerling Costs $0.15 /fingerling $2,643 $2,643 $2,643 $2,643 $2,643 $2,643 $2,643 $2,643 $21,144
Nursery Feed $0.80 /kg $483 $1,498 $1,498 $1,498 $1,015 $0 $483 $1,498 $1,498 $1,498 $1,015 $0 $11,987
Tilapia Feed - distillers grains & solubles 60% $0.06 /kg DM $0 $0 $66 $163 $304 $508 $740 $1,077 $1,003 $895 $738 $508 $6,003
Tilapia Feed - low protein, vitamin enriched 40% $0.50 /kg $0 $0 $369 $905 $1,687 $2,825 $4,112 $5,986 $5,573 $4,972 $4,097 $2,825 $33,350
Production Materials $250 /month $250 $250 $250 $250 $250 $250 $250 $250 $250 $250 $250 $250 $3,000
Production Personnel 2 $3,588 /month $3,588 $3,588 $3,588 $3,588 $3,588 $3,588 $3,588 $3,588 $3,588 $3,588 $3,588 $3,588 $43,056
ENERGY COSTS
Production Tank Operation (24/7) HP 3 5 11 17 21 24 27 29 29 29 27 24
kWh 1,388 2,686 6,105 9,131 11,378 13,321 14,234 16,096 15,576 16,096 14,708 12,031
Greenhouse Lighting 1,000 W / lamp
number lamps 33 33 33 33 33
hours operation 5 10 12 12 12
kWh 5,115 9,900 12,276 12,276 11,088
Energy Costs $0.07 /kWh $97 $188 $427 $639 $796 $932 $996 $1,485 $1,783 $1,986 $1,889 $1,618 $12,838
VARIABLE COSTS $7,062 $8,167 $8,842 $9,687 $7,640 $8,104 $12,813 $16,527 $16,339 $15,832 $11,577 $8,789 $131,378
ADMINISTRATION
Vehicles: Gasoline/Oils $30 /month $30 $30 $30 $30 $30 $30 $30 $30 $30 $30 $30 $30 $360
Administrative Personnel $671 /month $671 $671 $671 $671 $671 $671 $671 $671 $671 $671 $671 $671 $8,050
Maintenance 0.0% /year $0
Vehicle Insurance 0.2 $800 /unit/year $160 $160
Greenhouse/Aquaponic Insurance $750 /year $750 $750
ADMINISTRATIVE COSTS $1,611 $701 $701 $701 $701 $701 $701 $701 $701 $701 $701 $701 $9,320
FIXED COSTS $1,611 $701 $701 $701 $701 $701 $701 $701 $701 $701 $701 $701 $9,320
OPERATION COSTS $8,672 $8,868 $9,543 $10,388 $8,341 $8,804 $13,514 $17,228 $17,039 $16,533 $12,278 $9,490 $140,698
MONTHLY CASHFLOW ($8,672) ($8,868) ($9,543) ($10,388) ($8,341) ($8,804) ($12,426) $16,441 $17,062 $18,000 $22,255 ($7,250) ($535)
ACCUMULATED CASHFLOW ($8,672) ($17,541) ($27,083) ($37,471) ($45,812) ($54,616) ($67,042) ($50,601) ($33,539) ($15,540) $6,716 ($535) ($535)
WORKING CAPITAL $9,600 $9,800 $10,500 $11,300 $9,300 $9,700 $14,400 $74,600
Financial Costs 10.00% /year $82 $159 $254 $339 $429 $511 $613 $634 $613 $634 $634 $4,901
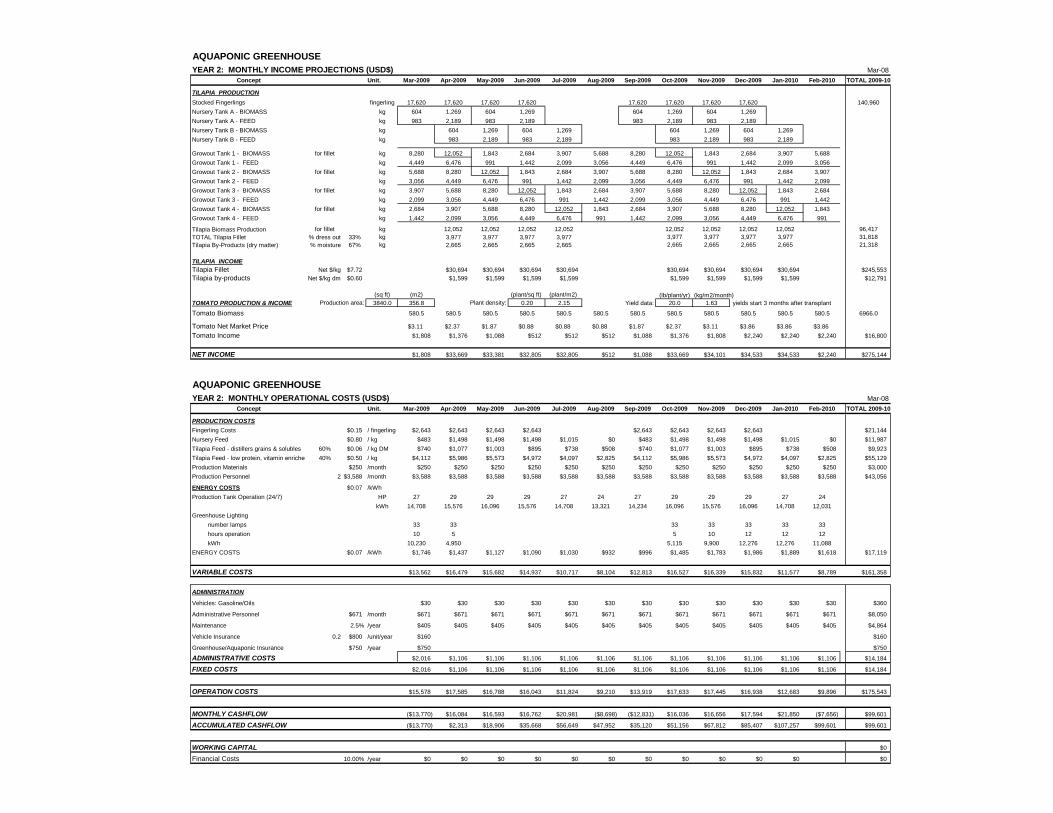
AQUAPONIC GREENHOUSE
YEAR 2: MONTHLY INCOME PROJECTIONS (USD$) Mar-08
Concept Unit. Mar-2009 Apr-2009 May-2009 Jun-2009 Jul-2009 Aug-2009 Sep-2009 Oct-2009 Nov-2009 Dec-2009 Jan-2010 Feb-2010 TOTAL 2009-10
TILAPIA PRODUCTION
Stocked Fingerlings fingerling 17,620 17,620 17,620 17,620 17,620 17,620 17,620 17,620 140,960
Nursery Tank A - BIOMASS kg 604 1,269 604 1,269 604 1,269 604 1,269
Nursery Tank A - FEED kg 983 2,189 983 2,189 983 2,189 983 2,189
Nursery Tank B - BIOMASS kg 604 1,269 604 1,269 604 1,269 604 1,269
Nursery Tank B - FEED kg 983 2,189 983 2,189 983 2,189 983 2,189
Growout Tank 1 - BIOMASS for fillet kg 8,280 12,052 1,843 2,684 3,907 5,688 8,280 12,052 1,843 2,684 3,907 5,688
Growout Tank 1 - FEED kg 4,449 6,476 991 1,442 2,099 3,056 4,449 6,476 991 1,442 2,099 3,056
Growout Tank 2 - BIOMASS for fillet kg 5,688 8,280 12,052 1,843 2,684 3,907 5,688 8,280 12,052 1,843 2,684 3,907
Growout Tank 2 - FEED kg 3,056 4,449 6,476 991 1,442 2,099 3,056 4,449 6,476 991 1,442 2,099
Growout Tank 3 - BIOMASS for fillet kg 3,907 5,688 8,280 12,052 1,843 2,684 3,907 5,688 8,280 12,052 1,843 2,684
Growout Tank 3 - FEED kg 2,099 3,056 4,449 6,476 991 1,442 2,099 3,056 4,449 6,476 991 1,442
Growout Tank 4 - BIOMASS for fillet kg 2,684 3,907 5,688 8,280 12,052 1,843 2,684 3,907 5,688 8,280 12,052 1,843
Growout Tank 4 - FEED kg 1,442 2,099 3,056 4,449 6,476 991 1,442 2,099 3,056 4,449 6,476 991
Tilapia Biomass Production for fillet kg 12,052 12,052 12,052 12,052 12,052 12,052 12,052 12,052 96,417
TOTAL Tilapia Fillet % dress out 33% kg 3,977 3,977 3,977 3,977 3,977 3,977 3,977 3,977 31,818
Tilapia By-Products (dry matter) % moisture 67% kg 2,665 2,665 2,665 2,665 2,665 2,665 2,665 2,665 21,318
TILAPIA INCOME
Tilapia Fillet Net $/kg $7.72 $30,694 $30,694 $30,694 $30,694 $30,694 $30,694 $30,694 $30,694 $245,553
Tilapia by-products Net $/kg dm $0.60 $1,599 $1,599 $1,599 $1,599 $1,599 $1,599 $1,599 $1,599 $12,791
(sq ft) (m2) (plant/sq ft) (plant/m2) (lb/plant/yr) (kg/m2/month)
TOMATO PRODUCTION & INCOME Production area: 3840.0 356.8 Plant density: 0.20 2.15 Yield data: 20.0 1.63 yields start 3 months after transplant
Tomato Biomass 580.5 580.5 580.5 580.5 580.5 580.5 580.5 580.5 580.5 580.5 580.5 580.5 6966.0
Tomato Net Market Price $3.11 $2.37 $1.87 $0.88 $0.88 $0.88 $1.87 $2.37 $3.11 $3.86 $3.86 $3.86
Tomato Income $1,808 $1,376 $1,088 $512 $512 $512 $1,088 $1,376 $1,808 $2,240 $2,240 $2,240 $16,800
NET INCOME $1,808 $33,669 $33,381 $32,805 $32,805 $512 $1,088 $33,669 $34,101 $34,533 $34,533 $2,240 $275,144
AQUAPONIC GREENHOUSE
YEAR 2: MONTHLY OPERATIONAL COSTS (USD$) Mar-08
Concept Unit. Mar-2009 Apr-2009 May-2009 Jun-2009 Jul-2009 Aug-2009 Sep-2009 Oct-2009 Nov-2009 Dec-2009 Jan-2010 Feb-2010 TOTAL 2009-10
PRODUCTION COSTS
Fingerling Costs $0.15 / fingerling $2,643 $2,643 $2,643 $2,643 $2,643 $2,643 $2,643 $2,643 $21,144
Nursery Feed $0.80 / kg $483 $1,498 $1,498 $1,498 $1,015 $0 $483 $1,498 $1,498 $1,498 $1,015 $0 $11,987
Tilapia Feed - distillers grains & solubles 60% $0.06 / kg DM $740 $1,077 $1,003 $895 $738 $508 $740 $1,077 $1,003 $895 $738 $508 $9,923
Tilapia Feed - low protein, vitamin enriched 40% $0.50 / kg $4,112 $5,986 $5,573 $4,972 $4,097 $2,825 $4,112 $5,986 $5,573 $4,972 $4,097 $2,825 $55,129
Production Materials $250 /month $250 $250 $250 $250 $250 $250 $250 $250 $250 $250 $250 $250 $3,000
Production Personnel 2 $3,588 /month $3,588 $3,588 $3,588 $3,588 $3,588 $3,588 $3,588 $3,588 $3,588 $3,588 $3,588 $3,588 $43,056
ENERGY COSTS $0.07 /kWh
Production Tank Operation (24/7) HP 27 29 29 29 27 24 27 29 29 29 27 24
kWh 14,708 15,576 16,096 15,576 14,708 13,321 14,234 16,096 15,576 16,096 14,708 12,031
Greenhouse Lighting
number lamps 33 33 33 33 33 33 33
hours operation 10 5 5 10 12 12 12
kWh 10,230 4,950 5,115 9,900 12,276 12,276 11,088
ENERGY COSTS $0.07 /kWh $1,746 $1,437 $1,127 $1,090 $1,030 $932 $996 $1,485 $1,783 $1,986 $1,889 $1,618 $17,119
VARIABLE COSTS $13,562 $16,479 $15,682 $14,937 $10,717 $8,104 $12,813 $16,527 $16,339 $15,832 $11,577 $8,789 $161,358
ADMINISTRATION
Vehicles: Gasoline/Oils $30 $30 $30 $30 $30 $30 $30 $30 $30 $30 $30 $30 $360
Administrative Personnel $671 /month $671 $671 $671 $671 $671 $671 $671 $671 $671 $671 $671 $671 $8,050
Maintenance 2.5% /year $405 $405 $405 $405 $405 $405 $405 $405 $405 $405 $405 $405 $4,864
Vehicle Insurance 0.2 $800 /unit/year $160 $160
Greenhouse/Aquaponic Insurance $750 /year $750 $750
ADMINISTRATIVE COSTS $2,016 $1,106 $1,106 $1,106 $1,106 $1,106 $1,106 $1,106 $1,106 $1,106 $1,106 $1,106 $14,184
FIXED COSTS $2,016 $1,106 $1,106 $1,106 $1,106 $1,106 $1,106 $1,106 $1,106 $1,106 $1,106 $1,106 $14,184
OPERATION COSTS $15,578 $17,585 $16,788 $16,043 $11,824 $9,210 $13,919 $17,633 $17,445 $16,938 $12,683 $9,896 $175,543
MONTHLY CASHFLOW ($13,770) $16,084 $16,593 $16,762 $20,981 ($8,698) ($12,831) $16,036 $16,656 $17,594 $21,850 ($7,656) $99,601
ACCUMULATED CASHFLOW ($13,770) $2,313 $18,906 $35,668 $56,649 $47,952 $35,120 $51,156 $67,812 $85,407 $107,257 $99,601 $99,601
WORKING CAPITAL $0
Financial Costs 10.00% /year $0 $0 $0 $0 $0 $0 $0 $0 $0 $0 $0 $0

AQUAPONIC GREENHOUSE
INCOME PROJECTION AND OPERATION COSTS (USD$) Mar-08
Concept Year 0 Year 1 Year 2 Year 3 Year 4 Year 5 Year 6 Year 7 Year 8 Year 9 Year 10
INCOME
Tilapia Sales $129,172 $258,344 $258,344 $258,344 $258,344 $258,344 $258,344 $258,344 $258,344 $258,344
Tomato Sales $10,992 $16,800 $16,800 $16,800 $16,800 $16,800 $16,800 $16,800 $16,800 $16,800
NET INCOME $140,164 $275,144 $275,144 $275,144 $275,144 $275,144 $275,144 $275,144 $275,144 $275,144
PRODUCTION COSTS
Fingerling Costs $21,144 $21,144 $21,144 $21,144 $21,144 $21,144 $21,144 $21,144 $21,144 $21,144
Nursery Feed $11,987 $11,987 $11,987 $11,987 $11,987 $11,987 $11,987 $11,987 $11,987 $11,987
Tilapia Feed - distillers grains & solubles $6,003 $9,923 $9,923 $9,923 $9,923 $9,923 $9,923 $9,923 $9,923 $9,923
Tilapia Feed - low protein vitamin enriched $33,350 $55,129 $55,129 $55,129 $55,129 $55,129 $55,129 $55,129 $55,129 $55,129
Production Materials $3,000 $3,000 $3,000 $3,000 $3,000 $3,000 $3,000 $3,000 $3,000 $3,000
Production Personnel $43,056 $43,056 $43,056 $43,056 $43,056 $43,056 $43,056 $43,056 $43,056 $43,056
Energy Costs $12,838 $17,119 $17,119 $17,119 $17,119 $17,119 $17,119 $17,119 $17,119 $17,119
VARIABLE COSTS $131,378 $161,358 $161,358 $161,358 $161,358 $161,358 $161,358 $161,358 $161,358 $161,358
ADMINISTRATION
Vehicles: Gasoline/Oils $360 $360 $360 $360 $360 $360 $360 $360 $360 $360
Administrative Personnel $8,050 $8,050 $8,050 $8,050 $8,050 $8,050 $8,050 $8,050 $8,050 $8,050
Maintenance $0 $4,864 $4,864 $4,864 $4,864 $4,864 $4,864 $4,864 $4,864 $4,864
Vehicle Insurance $160 $160 $160 $160 $160 $160 $160 $160 $160 $160
Greenhouse/Aquaponic Insurance $750 $750 $750 $750 $750 $750 $750 $750 $750 $750
FIXED COSTS $9,320 $14,184 $14,184 $14,184 $14,184 $14,184 $14,184 $14,184 $14,184 $14,184
OPERATION COSTS $140,698 $175,543 $175,543 $175,543 $175,543 $175,543 $175,543 $175,543 $175,543 $175,543
GROSS INCOME ($535) $99,601 $99,601 $99,601 $99,601 $99,601 $99,601 $99,601 $99,601 $99,601
Depreciation $27,805 $27,805 $27,805 $27,805 $27,805 $27,805 $27,805 $27,805 $27,805 $27,805
Financial Costs $14,334 $8,006 $6,671 $5,337 $4,014 $2,669 $1,334 $0 $0 $0
BEFORE TAX PROFIT $0 $63,791 $65,125 $66,459 $67,782 $69,128 $70,462 $71,796 $71,796 $71,796
Taxes 27.0% /year $0 $17,223 $17,584 $17,944 $18,301 $18,664 $19,025 $19,385 $19,385 $19,385
NET PROFIT ($535) $82,378 $82,017 $81,657 $81,300 $80,937 $80,576 $80,216 $80,216 $80,216
PAYMENTS
Working Capital Interest $4,901 $0 $0 $0 $0 $0 $0 $0 $0 $0
Loan Interest $9,433 $8,006 $6,671 $5,337 $4,014 $2,669 $1,334
Capital Payments $16,678 $16,678 $16,678 $16,678 $16,678 $16,678 $16,678
TOTAL PAYMENTS $31,012 $24,684 $23,350 $22,015 $20,692 $19,347 $18,013 $0 $0 $0
BALANCE ($194,579) ($31,547) $57,694 $58,668 $59,642 $60,608 $61,590 $62,564 $80,216 $80,216 $80,216
Payment Capacity -0.02 3.34 3.51 3.71 3.93 4.18 4.47
Breakeven 459.1% 34.2% 33.0% 31.8% 30.7% 29.5% 28.3% 12.5% 12.5% 12.5%
INTERNAL RATE OF RETURN -YEAR 10: 19.06%