potential of energy integration in mashreq and neighboring countries
TRANSCRIPT

Report No. 54455-MNA
Potential of Energy Integration in Mashreq and Neighboring
Countries
June 2010
Sustainable Development Department (MNSSD)
Middle East and North Africa Region (MNA)
Document of the World Bank

Copyright
Energy Sector Management Assistance Program (ESMAP) reports are published to
communicate the results of ESMAP’s work to the development community with the least
possible delay. Some sources cited in this paper may be informal documents that are not readily
available.
The finding, interpretations, and conclusion expressed in this report are entirely those of the
author(s) and should not be attributed in any manner to the World Bank, or its affiliated
organizations, or to members of its board of executive directors for the countries they represent,
or to ESMAP. The World Bank and ESMAP do not guarantee the accuracy of the data included
in this publication and accepts no responsibility whatsoever for any consequence of their use.
The boundaries, colors, denominations, other information sown on any map in this volume do
not imply on the part of the World Bank Group any judgment on the legal status of any territory
or the endorsement of acceptance of such boundaries.

Acknowledgement
This report was written by a team consisting of Husam Beides (Sr. Energy Specialist, team
leader); Hossein Razavi, Doug Bowman, and Khalid Boukantar. The team is grateful for the
guidance provided by Jonathan Walters, Sector Manager, and comments provided by peer
reviewers Jonathan d'Entremont Coony, Franz Gerner and Sameer Shukla. The report was
prepared under the context of the World Bank Arab World Initiative and was supported in part
by ESMAP.
The Financial and technical support by the Energy Sector Management Assistance Program
(ESMAP) is gratefully acknowledged. ESMAP-a global knowledge and technical assistance
partnership administered by the World Bank and sponsored by official bilateral donors-assists
low and middle income countries, its “clients,” to provide modern energy services for poverty
reduction and environmentally sustainable economic development. ESMAP is governed and
funded by Consultative Group (CG) comprised of official bilateral donors and multilateral
institutions, representing Australia, Austria, Canada, Denmark, Finland, France, Germany,
Iceland, the Netherlands, Norway, Sweden, the United Kingdom, and the World Bank Group
ABBREVIATIONS AND ACRONYMS
AERF Arab Electricity Regulators’ Forum
AC Alternating current
AFPC Al Furat Petroleum Oil Company
AGP Arab Gas Pipeline
AUPTDE Arab Union of Producers, Transporters and Distributors of Electricity
bbl Barrel
bcm Billion cubic meters
bcma Billion cubic meters per annum
BOO Build-own-operate
BOT Build-own-transfer
BOTAS Oil and Gas Pipeline Corporation (Turkey)
BOOT Build-own-operate-transfer
BTE Azeri-Turkish Baku-Tbilisi-Erzerum
BTU British thermal unit
CCGT Combined cycle gas turbine
CEGCO Central Electricity Generating Company
CFB Circulating fluidized bed
CNG Compressed natural gas
DC Direct current
EAMGCC Euro-Arab Mashreq Gas Co-operation Centre
ECA Energy conversion agreement
ECSEE Energy Community of South East Europe
EDC Electricity Distribution Company
EdL Electricité du Libon
EE Energy efficiency
EEHC Egyptian Electricity Holding Company
EGAS Egyptian Natural Gas Holding Company
EGPC Egyptian General Petroleum Corporation
EIA Energy Information Administration (US); environmental impact assessment
EIB European Development Bank
EIJLST Egypt-Iraq-Jordan-Lebanon-Syria-Turkey
ELTAM Egypt-Libya-Turkey-Algeria-Morocco
EMRA Electricity Market Regulatory Authority
EPC Engineering, procurement and construction (contract)
ERC Electricity Regulatory Commission
EU European Union
EUAS Electricity Generation Company of Turkey
GCC Gulf Cooperation Council
GE General Electric
GSA Gas sales agreement
GPC General Petroleum Corporation (WBG)
GWh Gigawatt hour
HFO Heavy fuel oil
HVDC High-voltage direct current
IDB Islamic Development Bank
IEA International Energy Agency
IGAT Iranian Gas Trunkline
INOGATE Interstate Oil and Gas Transport to Europe
IOC International Oil Company
IPP Independent power producer
JEPCO Jordan Electric Power Company
kV Kilovolt
kWh Kilowatt hour
LNG Liquefied natural gas
LPG Liquid petroleum gas
LTAM Libya-Tunisia-Algeria-Morocco
mbl Million barrels
mcm Million cubic meters
MEDELEC Euro-Mediterranean Electricity Cooperation (European)
MED-EMIP Euro-Mediterranean Energy Market Integration Project
MED-REG Mediterranean Working Group on Electricity and Natural Gas
MEMR Ministry of Energy and Mineral Resources (Jordan)
MEW Ministry of Energy and Water
MMBTU 1 million British thermal units
mmscm Million standard cubic meters
MTOE Million tons of oil equivalent
MVA Megavoltampere
MW Megawatt
NEPCO National Electric Power Company (Jordan)
NERC National Energy Research Center
NGL Natural gas liquids
NIGC National Iranian Gas Company
NIOC National Iranian Oil Company
O&M Operations and maintenance
PA Palestinian Authority
p.a. Per annum
PEA Palestinian Energy and natural Resources Authority
PERC Palestinian Energy Regulatory Commission
PETL Palestinian Energy Transmission Company
PNA Palestinian National Authority
PEEDEE Public Establishment for Distribution and Exploitation of Electric Energy
PEEGT Public Establishment for Electricity Generation and Transmission (Syria)
RCREEE Regional Centre for Renewable Energy and Energy Efficiency
RE Renewable energy
SCADA/EMS Supervisory Control and Data Acquisition/ Energy Management System
SGC Syrian Gas Company
SGDC Syrian Gas Distribution Company
SIGIR Special Inspector General for Iraq Reconstruction
TA Technical assistance
tcm Trillion cubic meters
TGI Turkey-Greece-Italy
TEIAS Turkish Electricity Transmission Company
TEN Trans-European Network
TETAS Turkish Electricity Trading and Contracting Company
TPS Thermal power station
TSO Transmission system operation
TWh Terawatt hour (= 1 billion kWh)
UAE United Arab Emirates
UCTE Union for the Co-ordination of Transmission of Electricity
WBG West Bank & Gaza
YTL Turkish Lira and New Turkish Liras

TABLE OF CONTENTS
Page
EXECUTIVE SUMMARY ........................................................................................................................ 1
Chapter 1. Introduction and background ............................................................................ 29
Chapter 2. Egypt Prospects For Energy Integration .......................................................... 32
2.1. Overview ................................................................................................................... 32
2.2. Power Sector Structures ............................................................................................. 32
2.3. Electricity Demand and Supply .................................................................................. 35
2.4. Gas Sector Structure .................................................................................................. 41
2.5. Gas Sector Demand and Supply ................................................................................. 43
Chapter 3. Iraq Prospects For Energy Integration............................................................. 46
3.1. Overview ................................................................................................................... 46
3.2. Power Sector Structure .............................................................................................. 46
3.3. Electricity Demand and Supply .................................................................................. 48
3.4. Gas Sector Structure .................................................................................................. 56
3.5. Gas Demand and Supply ............................................................................................ 56
Chapter 4. Jordan Prospects For Energy Integration ........................................................ 60
4.1. Overview ................................................................................................................... 60
4.2. Power Sector Structure .............................................................................................. 60
4.3. Electricity Demand and Supply .................................................................................. 62
4.4. Gas Sector Structure .................................................................................................. 68
4.5. Gas Demand and Supply ............................................................................................ 69
Chapter 5. Syria Prospects For Energy Integration ........................................................... 72
5.1. Overview ................................................................................................................... 72
5.2. Power Sector Structures ............................................................................................. 72
5.3. Electricity Demand and Supply .................................................................................. 73
5.4. Gas Sector Structure .................................................................................................. 82
5.5. Gas Demand and Supply ............................................................................................ 83
Chapter 6. Lebanon Prospect For Energy Integration....................................................... 86
6.1. Overview ................................................................................................................... 86
6.2. Power Sector Structure .............................................................................................. 86
6.3. Electricity Demand and Supply .................................................................................. 88
6.4. Gas Sector Structure .................................................................................................. 96
6.5. Gas Demand and Supply ............................................................................................ 96
Chapter 7. West Bank and Gaza Prospects For Enenergy Integration ............................ 99
7.1. Overview ................................................................................................................... 99
7.2. Power Sector Structure .............................................................................................. 99
7.3. Electricity Demand and Supply ................................................................................ 102
7.4. Gas Sector ............................................................................................................... 108
7.5. Gas Demand and Supply .......................................................................................... 109
Chapter 8. Mashreq’s Neighboring Countries .................................................................. 111
8.1. Case of Turkey ........................................................................................................ 111
8.2. Case of Iran ............................................................................................................. 119
Chapter 9. Analysis of Regional Power Interconnections ................................................ 128
9.1. Mashreq Electricity Demand and Supply: Past, Present, and Future ......................... 128
9.2. Mashreq Power Sector Fuel Requirements ............................................................... 130
9.3. Interconnection Capacity and Potential for Imports/Exports ..................................... 132
9.4. Potential Future Interconnection Projects ................................................................. 136
Chapter 10. ANALYSIS OF REGIONAL GAS INTERCONNECTIONS ...................... 142
10.1. Mashreq Natural Gas Demand: Past, Present, and Future ........................................ 142
10.2. Interconnection/Pipeline Capacity: Arab Gas Pipeline ............................................. 144
10.3. Potential for Expansion of Exports: Egypt and Iraq ................................................. 146
10.4. Potential Future Cross Boarder Projects ................................................................... 148
Chapter 11. Energy Integration Projects With Greater Potential For Implementation 151
11.1. Ongoing Mashreq Gas and Electricity Studies and Initiatives ................................... 151
11.2. Integration Projects with Greater Potential for Implementation ................................ 153
11.3. Impact of Renewable Energy Development on the Regional Integration Agenda ..... 161
Chapter 12. Conclusions ........................................................................................................ 166
12.1. Electricity and Gas Price .......................................................................................... 166
12.2. Pricing Gas Exports ................................................................................................. 169
12.3. Pricing Electricity Exports ....................................................................................... 174
12.4. Institutional Constraints ........................................................................................... 177
12.5. Next Steps ............................................................................................................... 180

LIST OF TABLES
Table 1. 1: Key Statistics of Mashreq Countries and Surrounding Area .................................... 30 Table 2. 1 Historical Demand .................................................................................................... 35 Table 2. 2 Forecast Demand ...................................................................................................... 36
Table 2. 3 Breakdown of Demand Forecast by Customer Class (GWh) ...................................... 36 Table 2. 4 Egypt’s Power Stations ............................................................................................. 37 Table 2. 5 Egypt’s Proposed Generation Expansion Plan, 2007–23 ........................................... 38 Table 2. 6 Total Plant Capacity Additions, 2008–23 (MW) ........................................................ 39 Table 2. 7 Forecast Fuel Consumption in Power Sector, 2007–2022 .......................................... 41
Table 3 1 Historical Demand ..................................................................................................... 48 Table 3 2 Forecast Demand ....................................................................................................... 49 Table 3 3 Recent Electricity Demand and Production ................................................................ 51
Table 3 4 Planned IPP Additions by 2015 ................................................................................. 53
Table 4. 1 Historical Demand .................................................................................................... 63 Table 4. 2 NEPCO’s Demand Forecast ...................................................................................... 63 Table 4. 3 Jordan’s Generating Stations..................................................................................... 64
Table 4. 4 Favored Generation Expansion Plan ......................................................................... 66 Table 4. 5 Contracted Gas Quantities (MCM) ............................................................................ 67
Table 4. 6 Forecast Fuel Supply Requirements for Power Generation ........................................ 68 Table 4. 7 Domestic Gas Production......................................................................................... 69 Table 4. 8 Natural Gas Forecast (bcm) ....................................................................................... 70
Table 5. 1 Historical Demand, 1990–2008 ................................................................................. 74 Table 5. 2 Forecast Demand, 2008–30 ....................................................................................... 75
Table 5. 3 Syria’s Power Generation Plants ............................................................................... 77 Table 5. 4 Unserved Demand, 2002–07 (GWh) ......................................................................... 78
Table 5. 5 New Generating Plant Additions ............................................................................... 79 Table 5. 6 Syria’s Electrical Interconnections with Neighboring Countries ................................ 79
Table 5. 7 Capacity Needed to Meet Demand 2008–20 (MW) ................................................... 80 Table 5. 8 Gas Demand in Syria, 2003–06 ................................................................................. 83
Table 6. 1 Historical Demand .................................................................................................... 88
Table 6. 2 Forecast Demand ...................................................................................................... 89 Table 6. 3 Lebanon’s Thermal Power Generation Plants ............................................................ 90
Table 7. 1 Historical Demand .................................................................................................. 102 Table 7. 2 Forecast Demand .................................................................................................... 103
Table 7. 3 Gasoil Consumption at GPP in 2005 and 2008 ........................................................ 108
Table 7. 4 Potential Gas Requirement for WBG Power Sector ................................................. 108
Table 8. 1: Turkey’s Transmission Interconnection ................................................................ 114 Table 8. 2: Details of Other Electricity Interconnection Proposals ........................................... 116
Table 8. 3: Average End-User Gas Prices in Turkey (US$/Giga Joule) .................................... 116 Table 8. 4: Turkey’s Supply Contracts through 2020 (bcm) ..................................................... 117
Table 8. 5: Details of the Existing Interconnections and Trade ................................................ 121 Table 8. 6: Electricity Interconnections under Construction or Planning .................................. 122

Table 8. 7: Natural Gas Retail Tariffs 2001–02 to 2006–07 (US cents/m3) ............................... 123
Table 9. 1: Historical and Forecast Demand in Mashreq Countries, 1990–2030 ....................... 128 Table 9. 2: Mashreq Historical and Forecast Generating Capacity (MW) ................................. 129 Table 9. 3: International Interconnections between Mashreq Countries .................................... 133 Table 9. 4: Power Transfer Limits (MW) ................................................................................. 134
Table 10. 1: Historical and Forecast Gas Consumption in Mashreq Countries (bcm) ............... 142 Table 10. 2: Mashreq Natural Gas Reserves (bcm) .................................................................. 143 Table 10. 3: Historical and Forecast Gas Production in Mashreq Countries, 1990–2030 (bcm) 143
Table 10. 4: Forecast Availability of Gas for Export from Egypt and Iraq (bcm) ..................... 147
Table 11. 1: Costs and Benefits of Regional Coordination Control Center (US$ mil) ............... 160 Table 11. 2: Levelized Cost of Electricity Generation from Renewable Energy Resources ...... 165
Table 12. 1: Mashreq Electricity Tariff Comparison (US cents/kWh) ...................................... 167 Table 12. 2: Mashreq Internal Bulk Price of Gas (US$/MMBTU) ........................................... 169 Table 12. 3: Estimated Price for Egyptian Gas (US $/MMBTU in 2009 Prices) ....................... 173 Table 12. 4: Expected Price for Egyptian Power (US cents/kWh in 2009 Prices) ..................... 177
LIST OF FIGURES
Figure 1. 1: Mashreq Region .................................................................................................... 29 Figure 2. 1: Electricity Sector Structure ..................................................................................... 33 Figure 2. 2: Organization of Egypt’s Electric Utilities ............................................................... 34
Figure 2. 3: Electricity Sales by Sector ...................................................................................... 35 Figure 2. 4: Egypt’s Demand/Supply Context, 1990–2030 (MW) .............................................. 40
Figure 2. 5: Historic and Forecast Growth in Gas Demand for Power Generation, ..................... 40 Figure 2. 6: Organization of Egypt’s Gas Sector ........................................................................ 42
Figure 2. 7: Gas Consumption by Consumer Category .............................................................. 43 Figure 2. 8: Egypt’s Gas Network and Associated Infrastructure ............................................... 45 Figure 2. 9: Gas Demand/Supply Balance (bcm) ....................................................................... 45
Figure 3. 1: Energy Sector Structure .......................................................................................... 47 Figure 3. 2: Demand Breakdown by Customer Class ................................................................. 48
Figure 3. 3: Schematic of Iraq’s Power Facilities ....................................................................... 50 Figure 3. 4: Recent Imports from Iran and Turkey ..................................................................... 51 Figure 3. 5: Forecast Peak Demand and Generation Capacity .................................................... 52
Figure 3. 6: Iraq’s Demand/Supply Situation (MW) ................................................................... 53 Figure 3. 7: Primary Fuel Supply Mix for Power Stations .......................................................... 54
Figure 3. 8: Historical Fuel Supply ............................................................................................ 55 Figure 3. 9: Forecast Primary Fuel Requirements for Power Sector ........................................... 56
Figure 3. 10: Associated Gas Produced and Flared in 2004 ....................................................... 57 Figure 3. 11: Gas Demand/Supply Balance, 1990–2030 (bcm) .................................................. 59 Figure 4. 1: Organization of Jordan’s Electricity Sector ............................................................. 62 Figure 4. 2: Breakdown of Jordan’s Electrical Energy Consumption by Class ........................... 63 Figure 4. 3: Map of Jordan’s Power System .............................................................................. 65 Figure 4. 4: Jordan’s Demand/Supply Situation (MW) ............................................................... 67 Figure 4. 5: Locations of Planned Gas Consumers ..................................................................... 70
Figure 4. 6: Gas Demand/Supply Balance (bcm) ....................................................................... 71 Figure 5. 1: Organization of Syria’s Electricity Sector ............................................................... 73
Figure 5. 2: Demand Breakdown by Customer Class, 2007 ....................................................... 74 Figure 5. 3: Power Generation Mix: Ownership and Technology ............................................... 75 Figure 5. 4: Peak Demand and Installed and Available Generation Capacity, 1997–2006 .......... 78 Figure 5. 5: Syria’s Electricity Imports and Exports, 2000–07 ................................................... 80 Figure 5. 6: Syria’s Demand/Supply Situation, 1990–2030 (MW) .............................................. 81
Figure 5. 7: Equivalent Fuel Consumption of PEEGT Power Plants, 1990–2007 ....................... 82 Figure 5. 8: Organization of Syrian Oil and Gas Sector ............................................................. 83 Figure 5. 9: Net Gas Production Trend, 1983–2005 .................................................................. 84 Figure 5. 10: SGC Forecast Gas Supply, 2005–20 ..................................................................... 85 Figure 5. 11: Gas Demand/Supply Balance, 1990–2030 (bcm) .................................................. 85
Figure 6. 1: Energy Sector Structure .......................................................................................... 87 Figure 6. 2: Electricity Consumption Breakdown (%) ............................................................... 89
Figure 6. 3: Lebanon’s Hydroelectric Output, 1998–2005 (GWh) .............................................. 91 Figure 6. 4: Supply Mix, 1998–2005 (GWh) .............................................................................. 92 Figure 6. 5: Daily Demand/Supply Balance ............................................................................... 93 Figure 6. 6: Lebanon’s Demand/Supply Situation, 1990–2030 (MW) ........................................ 94
Figure 6. 7: Government Subsidies Conveyed to Power Sector, 1982–2005 (US$ mil) .............. 94 Figure 6. 8: EdL Use of Fuel Oil and Gas Oil, 2000–05 (tons) ................................................... 95 Figure 6. 9: Forecast Savings from Switching to Natural Gas (US$ mil) .................................... 96
Figure 6. 10: Gas Demand Forecasts ......................................................................................... 97 Figure 6. 11: Gas Demand/Supply Balance (bcm)...................................................................... 98 Figure 7. 1: Structure of Palestinian Electricity Sector as Required by the Electricity Law 101 Figure 7. 2 Eleectricity Supply System in the West Bank and Gaza ........................................................ 105 Figure 7. 3 WBG’s Demand/Supply Situation, 1996–2030 (MW) ........................................................... 107 Figure 7. 4 Gas Demand/Supply Balance (bcm) .............................................................................. 10710
Figure 8. 1: Details of Existing interconnections between Turkey and Its Neighbors ............... 114 Figure 8. 2: Gas Imports into Turkey and Main Transmission System .................................... 118
Figure 8. 3: Iran’s Electricity Interconnections to its Neighboring Countries ........................... 121 Figure 9. 1: Mashreq Generation Capacity Breakdown by Technology (%) ............................. 129
Figure 9. 2: Mashreq Electricity Demand/Supply, 1990–2030 (MW) ....................................... 130 Figure 9. 3: Mashreq Generation Production by Fuel Type, 1990–2030 (%) ............................ 131
Figure 9. 4: Forecast Consumption of Gas and Oil by Mashreq Electricity Sector, 2007–30 .... 131 Figure 9. 5: Electric Interconnections in Mashreq and Bordering Countries ............................. 132 Figure 10. 1: Historical and Forecast Mashreq Gas Demand, 1990–2030 .............................. 1423 Figure 10. 2: Gas Demand/Supply Balance in Mashreq Countries, 1990–2030 (bcm) ............ 1434 Figure 10. 3: Arab Gas Pipeline............................................................................................. 1435
Figure 10. 4: Overview of Gas Infrastructure in Mashreq and Surrounding Area ..................... 147 Figure 12. 1: Comparison of Mashreq Residential Tariffs to Benchmark Tariff ....................... 168
Figure 12. 2: Comparison of Mashreq Industrial Tariffs to Benchmark Tariff (US cents/kWh) . 168 Figure 12. 3: Comparison of Mashreq Internal Bulk Price of Gas to Benchmark ..................... 169 Figure 12. 4: Natural Gas Import Prices (US$/MMBTU) .......................................................... 172
11
EXECUTIVE SUMMARY
E.1 The Context
A sustained and high economic growth in the Mashreq countries including Egypt, Iraq, Jordan,
Syria, Lebanon and the West Bank & Gaza has triggered a rapid increase in energy demand,
particularly electricity consumption. Although part of this growing demand may be curbed
through more effective energy conservation policies and technologies, there is a clear need to
expand electricity generating capacity in all countries of the region. Indeed, most countries have
been facing power disruptions which impose a heavy burden on economic activities. In order to
ensure a reliable electricity service, each country would need to maintain reserve margins
(difference between installed generating capacity and peak demand) typically of the order of
15%. The reserve margin in the Mashreq countries has declined from 50% in 1990 to – 6 % in
20081 resulting in frequent power outages.
One of the most significant bottlenecks in developing new power generating capacity is the
supply of the required fuel. The region depended in the older days on oil for power generation.
This dependence was substantially reduced (from 54% in 1990 to 43% in 2008) as gas became a
desirable substitute owing to its economic and environmental attributes. The share of gas in
power generation increased significantly from 25% to 48% during 1990 to 2008. However, in
recent years gas availability has turned into a serious issue as countries like Syria, Jordan, Saudi
Arabia, Kuwait, UAE, etc, have realized that their domestic gas production is not sufficient to
meet the needs of their power sectors. This has triggered a search for sources of imported gas
and/or electricity.
Unlike oil that is normally traded in a fluid and free market, gas and electricity trade require
construction of cross-border infrastructure facilities which in turn require well structured
regional integration schemes. Regional integration of gas and electricity systems enables the
connected countries to trade energy. However, the interconnected networks, particularly power
grids, impart other benefits such as increased reliability, reduced reserves, and economies of
scale in construction of larger plants.
Despite their benefits, cross-border projects face numerous technical, institutional and
implementation challenges. A distinct feature of regional integration projects is the length of
preparation time. Most of these projects have taken many years (or several decades) to prepare.
Each project has been structured and restructured a number of times. It is sometimes the
deficiency in the initial formulation that results in further revisions. It is also the difficulty of
working out the cross-border issues, and coordinating solutions amongst the participating
countries. This is indeed an area that the World Bank and its partners have a unique comparative
advantage and can help the countries foresee and resolve cross-border issues before they
paralyze the progress of the project.
1 The reserve figures for both 1990 and 2008 are somewhat overstated as available generation was likely lower.
12
E.2 Objective of the Study
The objective of this study is to carry out a country-by-country analysis of the power and gas
sector demand and supply picture in order to assess opportunities for regional energy
integration in the Mashreq and neighboring countries, and to identify specific interconnection
projects that may require support from the World Bank and other international financiers. The
study is conducted in the context of the World Bank Arab World Initiative. Although the
present study focuses on Mashreq countries, issues of regional integration are intertwined
among various MENA sub-regions, and Turkey with eventual integration with Europe, so
Mashreq is not considered in isolation.
There are two other parallel efforts to examine the energy integration potential in the Maghreb
and the GCC countries. In addition, the World Bank and its partners are implementing a major
Solar Power Initiative with support from the Clean Technology Fund (CTF) to assist the
MENA countries with development of large scale concentrated solar power (CSP) electricity
generation capabilities for their own use or for export to other countries. Large scale
development of solar power is expected to support and facilitate regional integration among
MENA countries and with Europe as well.
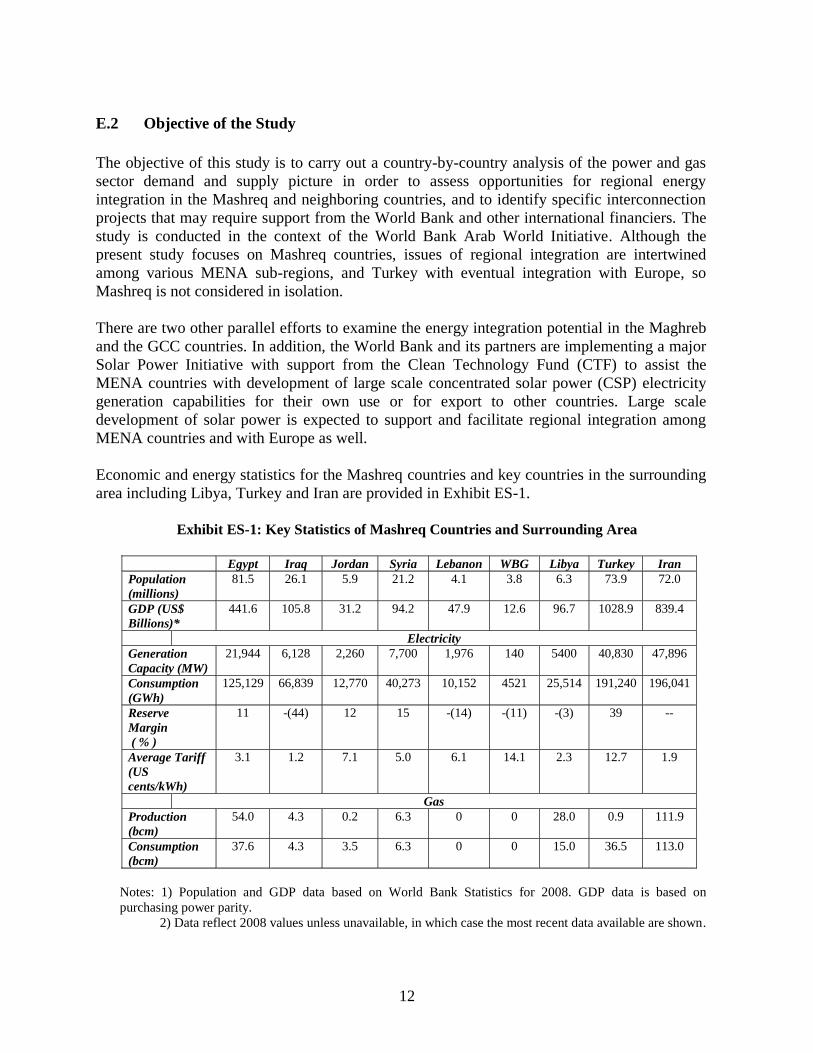
Economic and energy statistics for the Mashreq countries and key countries in the surrounding
area including Libya, Turkey and Iran are provided in Exhibit ES-1.
Exhibit ES-1: Key Statistics of Mashreq Countries and Surrounding Area
Notes: 1) Population and GDP data based on World Bank Statistics for 2008. GDP data is based on
purchasing power parity.
2) Data reflect 2008 values unless unavailable, in which case the most recent data available are shown.
Egypt Iraq Jordan Syria Lebanon WBG Libya Turkey Iran
Population
(millions)
81.5 26.1 5.9 21.2 4.1 3.8 6.3 73.9 72.0
GDP (US$
Billions)*
441.6 105.8 31.2 94.2 47.9 12.6 96.7 1028.9 839.4
Electricity
Generation
Capacity (MW)
21,944 6,128 2,260 7,700 1,976 140 5400
40,830 47,896
Consumption
(GWh)
125,129 66,839 12,770 40,273 10,152 4521 25,514 191,240 196,041
Reserve
Margin
( % )
11 -(44) 12 15 -(14) -(11) -(3) 39 --
Average Tariff
(US
cents/kWh)
3.1 1.2 7.1 5.0 6.1 14.1 2.3 12.7 1.9
Gas
Production
(bcm)
54.0 4.3 0.2 6.3 0 0 28.0 0.9 111.9
Consumption
(bcm)
37.6 4.3 3.5 6.3 0 0 15.0 36.5 113.0

13
3) Reserve margin is based on installed capacity, but could be much lower depending generation and
fuel availability.
E.3 Power Sector Issues and Options
Electricity demand has grown significantly in the Mashreq countries in recent years. Peak
electricity demand increased 145% from 1990 to 2008, growing from 17,446 MW in 1990 to
42,732 MW in 2008. From 2008 through 2030, peak demand is forecast to increase by almost
62,000 MW representing an average annual growth rate of about 4.1 % (see Exhibit ES-2).
Exhibit ES-2: Historical and Forecast Demand in Mashreq Countries2
Country 1990 2000 2008 2010 2020 2030
Peak Demand (MW)
Egypt 6902 11,736 19,738 22,587 42,263 56,716
Iraq 5162 4865 10,900 11,910 16,006 21,510
Jordan 624 1206 2260 2539 4547 6110
Syria 3258 5990 6715 7518 10,448 14,041
Lebanon 1220 1681 2309 2403 3059 3875
WBG 280 495 810 885 1393 2401
Mashreq Total 17,446 25,973 42,732 47,842 77,716 104,653
The total investment that will be needed for the expansion of generation, transmission and
distribution in the Mashreq countries is enormous, estimated at US$131 billion by 2020, and an
additional US$108 billion by 20303. Mobilizing such levels of investment will require substantial
changes in energy policy to increase electricity prices, improve the financial performance of the
power sector and attract private sector investors.
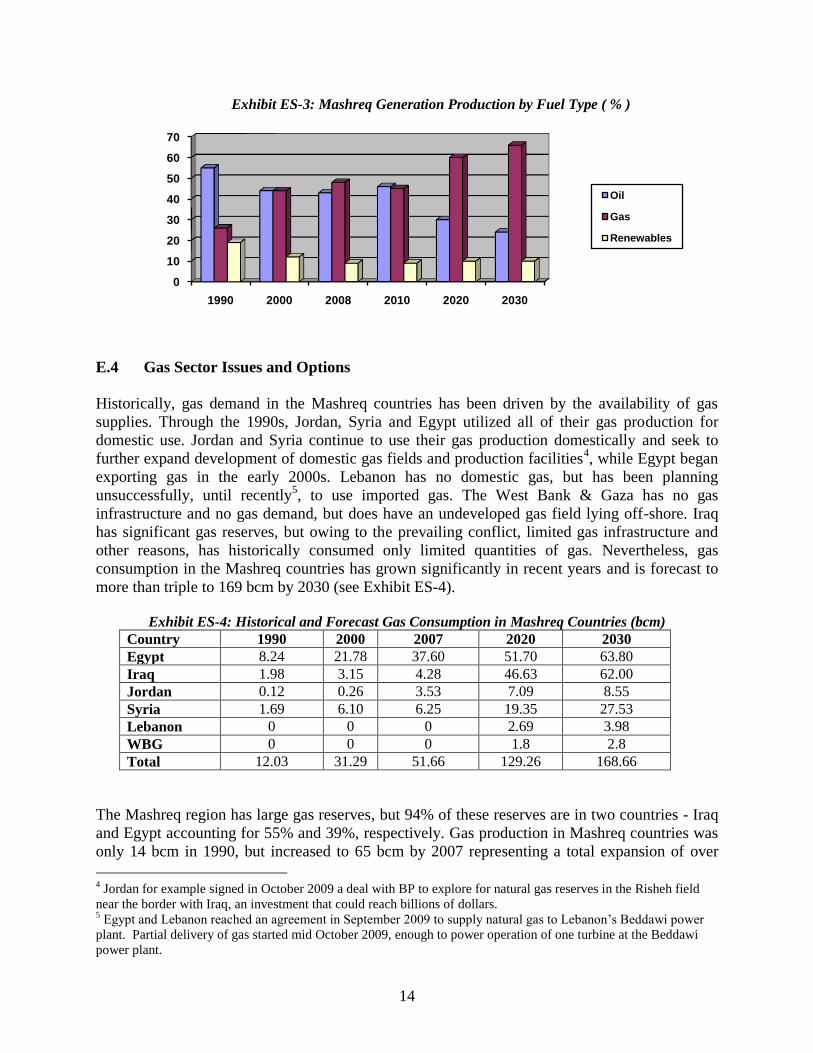
A further pre-requisite for expanding power generating capacity is an adequate supply of natural
gas. Exhibit ES-3 shows Mashreq electricity generation by fuel type. Total gas use in power
generation is projected to increase from 32.9 bcm in 2008 to 102 bcm in 2030. Adequate supply
of natural gas may prove most challenging in all Mashreq countries.
2 The Mashreq total peak demand is a simple sum of the individual country demands. It does not take into account
load diversity among the countries which is not currently known 3 Based on estimates for Egypt’s expansion plan of approximately US$101 billion to meet 150,000 GWh of demand
growth, with approximately 82% allocated for generation, 13% for transmission, and 5% for distribution (October
10, 2008 World-Bank-sponsored report, Energy Cost of Supply and Pricing Report).
14
Exhibit ES-3: Mashreq Generation Production by Fuel Type ( % )
E.4 Gas Sector Issues and Options
Historically, gas demand in the Mashreq countries has been driven by the availability of gas
supplies. Through the 1990s, Jordan, Syria and Egypt utilized all of their gas production for
domestic use. Jordan and Syria continue to use their gas production domestically and seek to
further expand development of domestic gas fields and production facilities4, while Egypt began
exporting gas in the early 2000s. Lebanon has no domestic gas, but has been planning
unsuccessfully, until recently5, to use imported gas. The West Bank & Gaza has no gas
infrastructure and no gas demand, but does have an undeveloped gas field lying off-shore. Iraq
has significant gas reserves, but owing to the prevailing conflict, limited gas infrastructure and
other reasons, has historically consumed only limited quantities of gas. Nevertheless, gas
consumption in the Mashreq countries has grown significantly in recent years and is forecast to
more than triple to 169 bcm by 2030 (see Exhibit ES-4).
Exhibit ES-4: Historical and Forecast Gas Consumption in Mashreq Countries (bcm)
Country 1990 2000 2007 2020 2030
Egypt 8.24 21.78 37.60 51.70 63.80
Iraq 1.98 3.15 4.28 46.63 62.00
Jordan 0.12 0.26 3.53 7.09 8.55
Syria 1.69 6.10 6.25 19.35 27.53
Lebanon 0 0 0 2.69 3.98
WBG 0 0 0 1.8 2.8
Total 12.03 31.29 51.66 129.26 168.66
The Mashreq region has large gas reserves, but 94% of these reserves are in two countries - Iraq
and Egypt accounting for 55% and 39%, respectively. Gas production in Mashreq countries was
only 14 bcm in 1990, but increased to 65 bcm by 2007 representing a total expansion of over
4 Jordan for example signed in October 2009 a deal with BP to explore for natural gas reserves in the Risheh field
near the border with Iraq, an investment that could reach billions of dollars. 5 Egypt and Lebanon reached an agreement in September 2009 to supply natural gas to Lebanon’s Beddawi power
plant. Partial delivery of gas started mid October 2009, enough to power operation of one turbine at the Beddawi
power plant.
0
10
20
30
40
50
60
70
1990 2000 2008 2010 2020 2030
Oil
Gas
Renewables
15
360%. The current plans indicate an increase of over 200% in gas production between 2007 and
2030. Almost all the increase in gas production is expected to come from Egypt (growing from
54 bcm to 92 bcm) and Iraq (growing from 4 bcm to 95 bcm). However, both Egypt and Iraq
face significant constraints in expanding their gas production capacity to the extent envisaged in
current plans. For Egypt the constraint is the size of its gas reserves, and for Iraq the constraint is
its implementation capacity.
Egypt’s gas program has been very successful. Since the early 1990s, gas reserves and
production have approximately quadrupled. Domestic consumption has been rapidly expanded,
LNG export terminals have been constructed and Egypt has become the main source of gas
imports for Jordan, Lebanon, Syria, and Israel. In 2007, Egypt’s gas production was 54 bcm, of
which 15.9 bcm, or 30%, was exported internationally. However, the rapid internal and external
demand for Egyptian gas has triggered political sensitivities to further exports and a technical
need to revisit gas allocation.
The government of Iraq has prepared an ambitious gas utilization plan in order to utilize its gas
fields in the south (which are the largest reserves and mostly associated with oil production) for
domestic use and for export to Kuwait. It would also develop the gas reserves in the north and
west for export to Syria and Turkey, and eventually Europe. The plan aims at producing about 60
bcm/year of gas by 2015 of which about half would be exported. Unfortunately the Iraqi plans
have not moved forward in recent years because of difficulties in implementation. In retrospect
these plans have turned out to be unrealistic. The Government is now preparing a consolidated
energy strategy. It is hoped that through this plan the Government will develop a comprehensive
and realistic gas production policy with clear guidelines for gas allocation to domestic versus
exports.
Considering the risks in the long-term supply of gas, the gas importing countries of the Region
are considering the LNG option. Several studies have been undertaken into the potential for LNG
supply to Lebanon indicating the economic viability of such an option to Lebanon. Jordan and
Syria may also consider the LNG option in the future.
E.5 Existing Regional Energy Networks
The Electricity Network
There is a regional electricity network and a regional gas pipeline in place in the Mashreq region.
The electricity network is part of the Arab power system which was initiated in 1988 by a five-
country agreement between Jordan, Syria, Egypt, Turkey and Iraq. Each country undertook to
upgrade its electricity system to a regional standard. The project was extended to eight countries
with the addition of Lebanon, Libya and the West Bank & Gaza (West Bank & Gaza was
officially included in the project in 2008). There are presently a number of high-voltage
interconnections between the national power systems of Egypt, Iraq, Jordan, Lebanon, Syria,
West Bank & Gaza, Libya, Turkey and Iran. A list of interconnections between the Mashreq
countries, and with neighboring Turkey, Iran and Libya is provided in Exhibit ES-5.
16
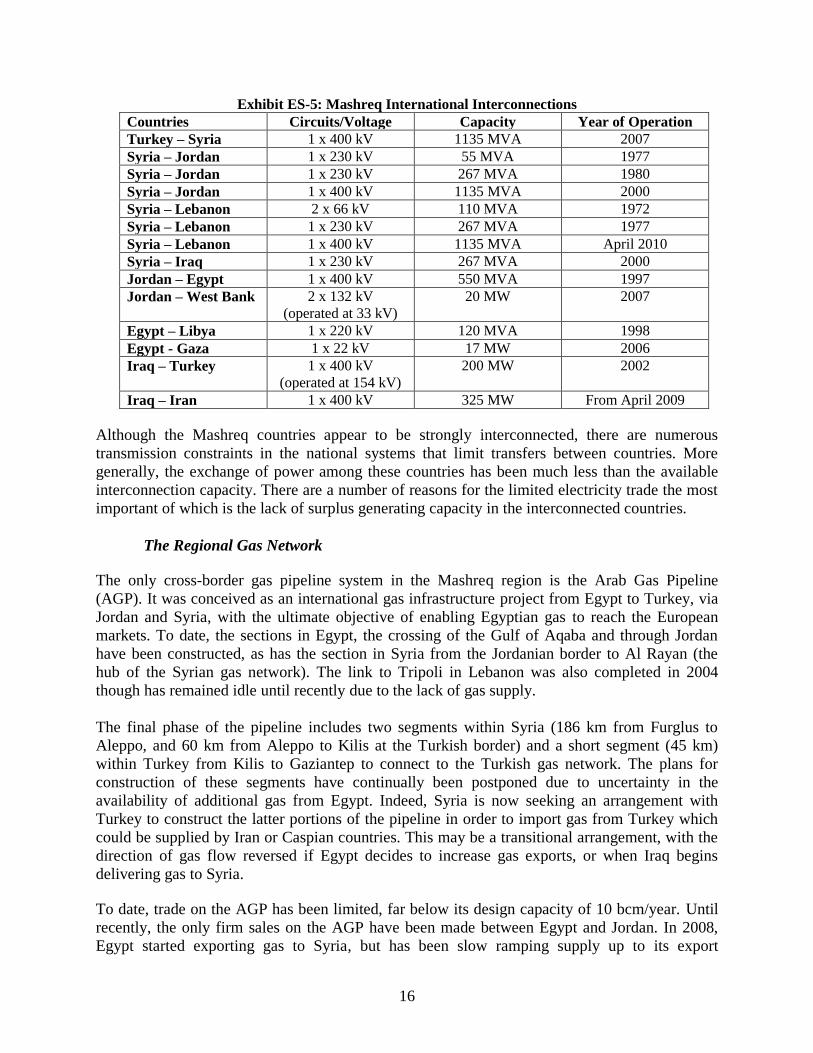
Exhibit ES-5: Mashreq International Interconnections
Countries Circuits/Voltage Capacity Year of Operation
Turkey – Syria 1 x 400 kV 1135 MVA 2007
Syria – Jordan 1 x 230 kV 55 MVA 1977
Syria – Jordan 1 x 230 kV 267 MVA 1980
Syria – Jordan 1 x 400 kV 1135 MVA 2000
Syria – Lebanon 2 x 66 kV 110 MVA 1972
Syria – Lebanon 1 x 230 kV 267 MVA 1977
Syria – Lebanon 1 x 400 kV 1135 MVA April 2010
Syria – Iraq 1 x 230 kV 267 MVA 2000
Jordan – Egypt 1 x 400 kV 550 MVA 1997
Jordan – West Bank 2 x 132 kV
(operated at 33 kV)
20 MW 2007
Egypt – Libya 1 x 220 kV 120 MVA 1998
Egypt - Gaza 1 x 22 kV 17 MW 2006
Iraq – Turkey 1 x 400 kV
(operated at 154 kV)
200 MW 2002
Iraq – Iran 1 x 400 kV 325 MW From April 2009
Although the Mashreq countries appear to be strongly interconnected, there are numerous
transmission constraints in the national systems that limit transfers between countries. More
generally, the exchange of power among these countries has been much less than the available
interconnection capacity. There are a number of reasons for the limited electricity trade the most
important of which is the lack of surplus generating capacity in the interconnected countries.
The Regional Gas Network
The only cross-border gas pipeline system in the Mashreq region is the Arab Gas Pipeline
(AGP). It was conceived as an international gas infrastructure project from Egypt to Turkey, via
Jordan and Syria, with the ultimate objective of enabling Egyptian gas to reach the European
markets. To date, the sections in Egypt, the crossing of the Gulf of Aqaba and through Jordan
have been constructed, as has the section in Syria from the Jordanian border to Al Rayan (the
hub of the Syrian gas network). The link to Tripoli in Lebanon was also completed in 2004
though has remained idle until recently due to the lack of gas supply.
The final phase of the pipeline includes two segments within Syria (186 km from Furglus to
Aleppo, and 60 km from Aleppo to Kilis at the Turkish border) and a short segment (45 km)
within Turkey from Kilis to Gaziantep to connect to the Turkish gas network. The plans for
construction of these segments have continually been postponed due to uncertainty in the
availability of additional gas from Egypt. Indeed, Syria is now seeking an arrangement with
Turkey to construct the latter portions of the pipeline in order to import gas from Turkey which
could be supplied by Iran or Caspian countries. This may be a transitional arrangement, with the
direction of gas flow reversed if Egypt decides to increase gas exports, or when Iraq begins
delivering gas to Syria.
To date, trade on the AGP has been limited, far below its design capacity of 10 bcm/year. Until
recently, the only firm sales on the AGP have been made between Egypt and Jordan. In 2008,
Egypt started exporting gas to Syria, but has been slow ramping supply up to its export

17
commitment owing to infrastructure constraints in Egypt. Further, Egypt has only recently
started exporting gas to Lebanon. In 2009, Egypt exported 3.3 bcm to Jordan, 0.9 bcm to Syria
and 0.3 bcm to Lebanon, representing about 45% of the AGP design capacity. By 2013, it is
expected that Egypt’s gas exports through the AGP will increase to 4.2 bcm to Jordan, 2.2 bcm
to Syria and 0.6 bcm to Lebanon, representing 70% of the AGP design capacity. Regional energy
networks are shown in Exhibit ES-6.

18
Exhibit ES-6: Regional Energy Networks
Electric Interconnection – Existing and Planned
Gas Pipelines

19
E.6 Main Bottlenecks to Regional Integration of Energy Systems
There are a number of institutional, regulatory and technical constraints to the expansion of
electricity and gas trade in the Mashreq countries. However, the overarching bottleneck is the
unavailability of gas or electricity to sell which is in turn influenced by the lack of
economic/financial incentive to develop export capacity. Gas/electricity trades impart significant
benefit to the importing countries. For example for most countries in the region the import of
gas yields a benefit of more than US$ 10/MMBTU, yet their expectation is to pay a substantially
lower price for the imported gas. The reason is that electricity and gas trade have traditionally
been viewed as a means of utilizing idle capacity or idle resources. However, the nature of the
business has changed; sellers need to develop additional capacity for export purposes and will
not undertake the required investments unless they are confident of an attractive return on their
investment.
Gas Pricing
The Mashreq countries have been planning and operating under the assumption that natural gas
is abundant and cheap. They are now forced to transit to a business environment in which gas has
become the fuel of choice, with scarce availability and a high premium. Many policymakers and
even planners have been surprised by the sudden shift of view about gas availability.
Nevertheless, there is a need for much stronger economic incentives if suppliers of gas and
electricity are to invest in capacity expansion aimed at energy exports.
There is not yet a generally accepted international price for gas, so cross-border transactions are
based on negotiated prices. There is often a wide range for price negotiation from the seller’s
cost of supply, typically ranging from US$ 1- 36/MMBTU, to the buyer’s benefit from using gas,
potentially exceeding US$ 11/MMBTU. This wide range creates a problem of differing
expectations between sellers and buyers. The LNG market has helped in narrowing the range of
price negotiation even though the LNG market accounts for only a small portion of the World’s
natural gas demand (about 7.5% in 2008). Despite its small share of the gas trade, LNG is linking
the gas prices in the markets of Asia, Europe and the US to the expectation of gas prices in the
local markets around the world. Since any significant gas exporter has the option of selling its
gas in the form of LNG, it expects at least the same net yield from selling piped gas.
It is not the intention of this study to play a role in gas price negotiations. However, the study
provides a framework for such negotiations. Exhibit ES-7 includes the main benchmarks to
consider in the discussion of gas prices. The estimated values are assumed based on Egyptian gas
information. The framework follows Egypt’s decision chain in determining:
(i) the amount of gas to be produced at each given time;
(ii) the amount to be allocated for domestic use;
(iii) the amount to be allocated to exports in the form of LNG; and
(iv) the amount to be allocated to exports in the form of piped gas to Mashreq countries.
6 Excluding depletion premium

20
Exhibit ES-7: Estimated Price for Egyptian Gas (US $ /MMBTU in 2009 Prices)
Estimated Price Explanation
Benchmarked on Egypt’s Cost of Gas Supply
LRMC - $1.5 to $2.6
Depletion premium - $1.4 to
$3.6
Economic cost - $2.90 to
$6.2
Cost of gas development and production in Egypt’s new gas
fields is expected to be much higher than in the past.7
Based on the projected gas production profile and current
reserves Egypt would need to switch to alternative fuels as gas
supply becomes a constraint resulting in a depletion premium of
$1.4 in 2010, increasing to $3.6 by 2020.
Benchmarked on Egypt’s Opportunity Cost
Benefit from Domestic Use:
Avoided cost in power -
$7.50 to $12.50
Avoided cost in residential
and commercial sectors - $11
The power sector serves as the first vehicle for shifting in and out
of gas consumption. The avoided cost (or netback value) in power
constitutes an important measure of gas use in the domestic
market estimated on the basis of a steam plant fired with heavy
fuel oil compared with gas use in a steam plant (lower netback),
or a combined cycle plant (higher netback).
The avoided cost in the residential/commercial sector is based on
the alternative of using diesel oil and LPG.
Benefit from LNG Export
Henry Hub gas price - $ 6.50
(-)
Re-gasification cost - $ 0.35
(-)
Shipping cost - $ 1.00
(-)
Liquefaction cost - $1.10
(-)
Pipeline cost - $0.25
(=)
$3.80
LNG prices are normally linked to a basket of energy products
but are increasingly correlated with the US gas prices. The
benchmark Henry Hub price is a long-term projection provided
by the US EIA.
Average levelized cost of re-gasifying LNG at the receiving
terminal.
Average shipping cost of LNG to the US Henry Hub market.
Average levelized cost of liquefaction based on data for the LNG
plants built in Egypt.
Average levelized cost of pipeline transportation of gas to LNG
plant.
Benchmarked on the Benefit of Gas Use in Receiving Countries
Netback value (avoided cost)
estimated for:
Jordan - $8.00
Syria - $7.60
Lebanon - $8.30 to $10.00
Turkey - $8.00
The alternative plant built in the absence of gas is steam plant
fired with heavy fuel oil. Jordan, Lebanon and Turkey import fuel
oil while Syria uses mostly domestic oil. Netback values are
reduced by the cost of transmission to the destination country.
Expected Price for Egyptian Gas
At the Egyptian border:
$4.00 to $6.00
Transport to Jordan - $0.50
Transport to Syria - $0.65
Transport to Lebanon - $0.70
Estimating a fair price is not an exact science; however, Egypt
should receive a price that would encourage gas exploration and
development, and allocation of gas to pipeline exports rather than
LNG.
Based on an average levelized cost of transportation from Egypt
to each of destination countries.
7 LRMC is estimated at $1.5 to $2.6. Financially, Egypt buys gas from producers at about $3 while receiving some
of the gas in return according to a production sharing contract. The average cost is about $1.6.
21
The results suggest that domestic gas use imparts the highest economic benefit to Egypt even
though the financial return may be low due to the prevailing energy price subsidies. Egypt should
therefore consider assigning the highest priority to meeting the (present and future) gas
requirements of its own economy. Should there be additional gas to allocate to exports, Egypt is
likely to give priority to LNG rather than piped gas to other Mashreq countries because of higher
commercial return on LNG exports (based on historical experience).
The essence of the recommendation here is that Jordan, Syria and Lebanon should provide a
commercial incentive to encourage Egypt to supply the Mashreq market via the AGP prior to any
further allocation to LNG. While the relevant price levels are subject to research and negotiation,
the emerging gas price is likely to be higher than the underlying prices of previous contracts
between Egypt, Jordan and Syria. Higher gas prices would provide a strong commercial
incentive for exploration and development of Egypt’s large estimated yet-to-find gas reserves. It
is also noted that the emerging gas network interconections through Turkey are creating market
signals that are eventually linked to the European market conditions.
Electricity Pricing
Electricity trade generally falls under two categories: short-term power exchanges and longer-
term power trades. Short-term power exchanges usually occur when there are surpluses and
deficits owing to daily or seasonal load variation or significant equipment outages, and diversity
in the marginal cost of supply between participating countries. These exchanges are normally
small in volume but very effective in sharing the reserve capacity. Longer-term power trades on
the other hand refer to significant volumes of energy transferred from one country to another on
a regular and more sustained basis.
Short-term exchanges are often based on idle capacity and are feasible as long as the price covers
variable costs including fuel and operation and maintenance. For example, there may be an
economic basis for short-term exchanges of electricity between Egypt and Syria because their
peak demand occurs at different times of the day. Longer-term trades generally occur when a
country has a cost comparative advantage over another country, or has excess generating
capacity forecast for an extended period of time. Currently, the more likely scenario is for Egypt
to export electricity to other Mashreq countries. The indicative costs for short and long-term
export of electricity from Egypt are summarized in Exhibit ES-8. Under the current conditions
the cost of electricity generated in Egypt for short-term power exchanges during the peak period
when it has oil plant on the margin would be 10.0 US cents/kWh. However, the cost of
electricity generation could be much lower (4.1 to 6.1 US cents/kWh) in the future if Egypt has
gas plants on the margin. Similarly, the longer-term electricity trade could be based on a cost of
generation ranging from3.9 to 5.1 US cents/kWh. Short-term exchanges and longer-term trades
of Egyptian electricity would only make sense if the importing countries were willing to pay
prices in excess of these levels plus the cost of transmission. A further implication is that Egypt
may want to weigh the potential returns from the export of electricity versus the export of gas. It
appears that electricity export to a market like Turkey where wholesale prices are quite high,
close to 11 US cents/kWh average in recent years, may prove more profitable than gas exports to
the same market.

22
Exhibit ES-8: Estimated Price for Egyptian Power (US cents/kWh in 2009 Prices) Expected Price (US
cents/kWh)
Explanation
Short-term Exchange-Oil
Fuel cost: 9.3
Variable O&M cost: 0.7
Generation cost: 10.0
Short-term Exchange-Gas
Fuel cost: 3.9 to 5.9
Variable O&M cost: 0.2
Generation cost: 4.1 to 6.1
Long-term Trade
Capital cost: 1.0
Fuel cost: 2.5 to 3.7
O&M cost: 0.4
Generation cost: 3.9 to 5.1
Market Price in Turkey
Wholesale: 10.8
Transmission Costs
To Jordan: 0.03
To WBG: 0.03
To Syria: 0.21
To Lebanon: 0.26
To Turkey: 0.36
In Egypt’s present configuration peaking and some intermediate units run
on HFO. The fuel cost is calculated as the levelized value of HFO based
on World Bank forecasts of international oil prices.
Egypt may have gas-fired open-cycle turbine generation available for sale
at certain times of the day and year. The fuel cost is calculated as the
levelized value of gas at US$ 4 to 6/MMBTU.
The long-term trade is based on a large volume electricity export over an
extended period of time in which case Egypt would invest in gas-based
combined cycle generation. Fuel cost is based on a natural gas price of
US$ 4.00 to 6.00 per MMBTU.
Average wholesale price in Turkey’s balancing market from August 2006
to April 2009 (73.88 Euros/MWh converted at exchange rate of 1 US$ =
0.6822 Euros)
Policy, Legal and Regulatory Constraints
Aside from providing sufficient economic incentive through the pricing policy, regional
integration of electricity and gas systems would require a proper policy, legal and regulatory
framework. In particular, the policy, legal and regulatory regimes should facilitate energy trade
through:
The removal of exclusive rights to supply;
Unbundling of supply and transmission;
The introduction of third party access to the transmission system; and
The establishment of an independent and informed regulatory agency to oversee the
market and regulate the monopoly transmission and distribution services including tariffs.
These steps are fundamental to the successful operation of a regional market. While the Mashreq
countries are at different stages of electricity market development, none of the countries meets
the basic requirements outlined above. Most importantly, all Mashreq countries face a serious
challenge of addressing the unwillingness, and in many cases, the inability of segments of the
population to pay prices that reflect the economic cost of supply.
E.7 The Relevance of the Neighboring Countries

23
Although the present study focuses on energy networks in the Mashreq countries, there are some
significant current or potential inter-linkages with some neighboring countries.. The linkages to
non-Arab neighboring countries were also studied here. In particular, the cases of Turkey,
European Union (EU) and Iran were reviewed to identify the relevant aspects to Mashreq energy
integration.
Mashreq countries have had an aspiration to connect their power grids to the EU system. This is
often envisaged to take place through Turkey. At the same time Turkey has pursued a vision of
becoming an energy hub and has restructured its gas and electricity sectors in line with the EU
practices and according to the standards that facilitate cross-border energy trade. Therefore study
of Turkey’s case provides very useful insights for integration of the Mashreq energy systems.
First, Turkey is an excellent destination for electricity exports with attractive prices and market
structures and market players. Second, Turkey has been rather successful in establishing a
market structure and regulation conducive to energy trade. The Electricity Market Law of 2001
obliges the transmission and distribution companies to allow open, guaranteed and non-
discriminatory access to the network by third parties to facilitate competition in the electricity
market. Similarly, the arrangements to facilitate cross-border gas trade have been also very
concrete and impressive. Till 2001 the state owned Oil and Gas Pipeline Corporation (BOTAS)
was the monopoly responsible for imports, transmission, wholesale operations, storage and
distribution of natural gas. The Natural Gas Market Law of 2001 reorganized the structure of the
market to enable private sector entry and competition on the lines of the EU gas directives.
Under this law BOTAS was not allowed to sign new import contracts till its market share fell to
20%, was obliged to transfer 80% of the existing contracts or the volumes of supply under them
to new entrants by 2009, was not allowed to carry on distribution activity anymore and was
obliged to privatize its distribution subsidiaries. Private sector investments were allowed in
imports, exports, gas trading, storage and distribution. Only transmission was envisaged to be in
the public sector.
Similar lessons emerge from studying the EU energy systems. The liberalization of the European
electricity markets has encouraged more integrated dispatch based on economic grounds across
larger and larger regions. Several reform measures have been undertaken in the EU through
various directives with the objective of promoting competition in the internal electricity market
and enabling cross-border transactions. The first package of directives, issued in 1996, enabled
the largest consumers to choose their suppliers and also provided for open access. A second
package of directives were issued in 2003 that required a step-wise opening of the retail market
with the target of full opening by July 2007. Still, there was a view that electricity markets
largely remained national in scope and had high levels of market concentration. This led to issue
of the third package of directives in June 2009 which aimed at full retail market liberalization
and a level of effective unbundling that would promote development of cross border transfer
capacity and cross-border competition.
Iran is another non-Arab country in the Middle East that in many areas complements the
Mashreq energy networks while at the same time has the potential to compete with some in
exporting electricity and gas to some common destinations particularly Turkey and Europe. The
24
study of the case of Iran is useful in separating real prospects from numerous ideas for cross-
border energy trade. Substantial gas reserves of Iran give it a comparative advantage in
electricity exports to Turkey and also possibly via Turkey to the European systems. Iran will also
be a key transit country for the electricity exports from Turkmenistan to Turkey and beyond. In
the short term a 180 km submarine HVDC link between Iran and UAE is imminent. The link will
have a transfer capacity of 1,500 MW and will connect Iran to the GCC Grid. However,
in view of the high growth in domestic electricity and gas demand and also the steeply growing
gas reinjection needs of the oil wells, the ability of Iran to increase dramatically its volume of gas
or electricity exports in the near future is considered doubtful by many, especially in the context
of international sanctions and a limited ability to attract foreign investment needed to increase
gas production.
E.8 The Impact of Renewable Energy Development on the Regional Integration Agenda
Regional integration efforts are becoming somewhat intertwined with the development of
renewable energy (RE). The impact is four folds. First, most RE sites (wind farms and solar
fields) are far from the power grids and would require dedicated transmission lines to evacuate
power to the grid; this affects the overall transmission capacity and the possibility of electricity
trade. Second, RE power supply is expected to grow substantially and provide a source of
electricity export. For example, Egypt alone is planning to add more than 7000 MW of wind
energy over the next 10 years. Third, regional integration of power networks results in larger
and more diversified power generation capacity than in isolated national markets, and thereby
provides a better opportunity for the development of RE and possibly stronger commercial
incentives for the development of a local industry in the manufacturing of the RE equipment.
Fourth, there is a substantial international financial support for RE development which could be
tapped into by the public and private entities in order to expand RE generating capacity while
strengthening cross-border interconnections that offer synergy between RE and regional
integration.
The impact of RE on the regional integration agenda has been explicitly addressed in various
solar initiatives. In particular, the Middle East and North Africa (MENA) Concentrated Solar
Power (CSP) Initiative is formulated to promote the application of CSP in the MENA region
which receives some of the most intensive solar radiation in the world and has some of the best
markets for solar energy within the region. The Initiative has received approval from the Clean
Technology Fund (CTF) for $750 million concessional financing in support of a proposed
investment plan with a total cost of $6 billion. It is also worth noting that the development of RE
in Mashreq (and more broadly MENA) will be further strengthened by the financial incentives
for export of clean energy to Europe. These exports will in turn require capacity reinforcement
of major transmission corridors within Mashreq countries (e.g. Egypt-Jordan-Syria transmission
corridor) as well as expansion of the transmission interconnection between Syria and Turkey.
Therefore, the completion of the synchronization of Turkey’s transmission network with the EU
grid and prospect of long term integration of the electricity networks of Turkey and the Mashreq
will provide a massive transformation opportunity to the entire Mediterranean Basin for
enhancing security of energy supply and in particular development of solar power in the MENA
region and green electricity exports to Europe.
25
E.9 Potential Projects for Regional Integration
The existing electricity interconnections are probably sufficient for the present short-term
exchanges though some improvement in the local systems would smoothen such transactions.
Energy trade, on the other hand, which refers to significant volumes of energy transferred from
one to another country on a regular basis would require substantially expanded and strengthened
cross-border gas and electricity systems.
A number of potential projects are identified to strengthen and expand the regional electricity
and gas networks. Projects with a greater potential for implementation follow.
1. Upgrade the interconnection between Iraq and Syria which includes a single circuit 400
kV overhead transmission line of about 165 km between Tayem substation in Syria and
Qa’im substation in Iraq. The primary benefits of the project are that it would help
address Iraq’s electricity shortage, improve energy security for the Mashreq region,
strengthen economic cooperation between Syria and Iraq and facilitate development of
the proposed regional electricity market initially including Syria, Iraq, Iran and Turkey.
The added benefit of this project is that it could be combined with development of the
Akass gas field (described below) for the potential swap of surplus Iraqi gas into
electricity which it has in deficit. The investment cost is estimated at US$ 115-125
million. The Syrian segment of the project is under construction. The Iraqi segment is at
the design stage and would require significant implementation support.
2. Expand and strengthen the transmission corridor from Egypt to Syria. This project would
have a number of components within each national grid which are currently insufficient
for large volume electricity transmission. Costs would range from US$ 400 to 735
million. The project could include reinforcement of interconnections with neighboring
countries. The justification and size of investments would depend on the availability of
electricity for transmission through the system.
3. Complete the Arab Gas Pipeline (AGP) through construction of two segments within
Syria and one segment in Turkey. The investment costs of these three segments are
estimated at: $350 million for Furglus-Aleppo within Syria; $80 million for Aleppo –
Kilis within Syria; and $67 million for Kilis - Goziantep within Turkey. The construction
of the first segment is not likely without a firm commitment from Egypt to supply gas.
However, construction of the other two segments is under serious consideration to enable
Syria to import gas via Turkey.
4. Construct Iraq-Syria gas pipeline which could be of small or large scale. The small scale
pipeline is intended to transport gas from the Akkas gas field in Iraq’s western desert to
Syria. This would be a 50 km pipeline with an estimated cost of US$ 75 million. It has
significant mutual benefits for Iraq and Syria. Iraq would not need to build a gas
processing plant at Akkas; Syria has the capacity to process the gas in its own plants. The
gas could be utilized for power generation in Syria with part of the power exported back
to Iraq. This would be highly beneficial to Iraq with a generation gap of about 50% and
fast growing demand. Iraq’s efforts to install new capacity have progressed very slowly.

26
The larger scale gas pipeline between Iraq and Syria would be of a completely different
nature, including an 800 km pipeline at a cost of about US$ 1.2 billion. This project
would represent a major source of gas input to the AGP and a major gas outlet from Iraq.
It could potentially be an avenue for selling Iraqi gas to Turkey and beyond. This pipeline
and the potential pipeline projects from Iraq to Jordan (Item 5) and from Iraq to Turkey
(Item 6) are likely to compete, so only one might proceed to implementation.
5. Construct Iraq-Jordan gas pipeline which would import gas from Iraq’s northern and/or
southern gas fields to the AGP via Jordan’s Risha gas field. It would include an 800 km
pipeline with an estimated cost of US$ 1.2 billion. It would enable regional gas trade, an
additional export route for Iraq, and second option for gas imports for Syria, Lebanon and
Jordan.
6. Construct Iraq-Turkey gas pipeline which would include two distinct (and not mutually
exclusive) alternatives for exporting gas from Iraq to Turkey and on to Europe. The first
option focuses on delivering gas from Iraq’s Kurdistan region to Turkey. Investment is
under way to develop the gas fields in Kurdistan for domestic use. Private firms involved
in the development of these fields are now negotiating gas sales to Turkey and others
through the Nabucco pipeline system that is expected to transport gas from the Caspian
countries to Europe. The second option for exporting Iraqi gas to Turkey is based on the
gas resources of Iraq’s northern and/or southern fields and possibly its Akass field in the
western desert, for export to Turkey via the AGP, either through Syria or Jordan. This
latter alternative has been addressed above.
7. Construct new generation capacity in Syria or Jordan for the benefit of the host country,
Iraq, Lebanon and the West Bank & Gaza. The first phase could cost $300 million for a
500 MW gas-based plant. Iraq has had significant difficulty building much needed
generation capacity and costs are very high owing to conflict, limited private sector
involvement, economies of scale, and other factors. Lebanon and the West Bank & Gaza
have problems of their own, although not on the same scale. Construction of generation
in either Jordan or Syria for the benefit of the host country, Iraq, Lebanon and the West
Bank & Gaza would significantly improve energy integration, particularly if tied to gas
exports from Iraq.
8. Construct new interconnection from Jordan to West Bank: A feasibility study on a new
Jordan – West Bank interconnection recommends further cooperation with Jordan, with
the first step including construction of a new 2 x 400 kV interconnection developed in
conjunction with a 132 kV transmission system in the West Bank. The favored
interconnection alternative would originate at the Samra Thermal Power Plant north of
Amman in Jordan, and connect to a new 400 kV substation in the Jerusalem area in the
West Bank. The length of the interconnection is estimated to be 101 km with a cost of
US$ 99.2 million (in 2008 Dollars). This estimate includes the cost of the interconnection
and substation investments in both Jordan and the West Bank.

27
9. Establish a regional coordination center to serve all Mashreq countries8. A consultant
study estimates the investment cost of the regional coordination center at US$ 16- 22
million. A regional coordination center would result in significant savings in the form of
more optimal generation planning (from a regional rather than national perspective),
reduced cost of settlement (one central system rather than five or more separate national
settlement systems), and reduced cost of load interruptions.
Finally, it is noted that in order to increase gas exports from Egypt there is a need to de-
bottleneck certain segments of Egyptian gas pipeline system which could constitute a relevant
project. Furthermore, there may be some potential interest from private sector to build power
plants that could target partly domestic supply and partly export to other countries. It would be
useful to explore these potential prospects in the form of developing private-public ventures that
would also serve cross-border energy trade.
E.10 Next Steps
Regional projects by their very nature are more complex than single country projects. To move
forward the preparation and implementation of gas and electricity integration in the Mashreq
region one should pursue two parallel tracks. The first track relates to the harmonization of: (i)
technical codes and standards for the national energy systems; (ii) regulation in the national
energy sectors; (iii) goals and milestones for energy sector reform relating to, in particular, open
access and consistent and fair pricing of transport; (iv) energy pricing and taxation; and (v)
identifying an independent process and procedure for resolving disputes relating to regional
energy transactions. The second track relates to help in cross-border transactions. This is an area
with significant gaps in terms of realistic information, preparatory steps and structuring such
transactions.
The World Bank plans to continue its support in both the above tracks. In the area of
harmonization, the Arab League and the World Bank have agreed to carry out a joint study on
the institutional and regulatory framework for electricity trade. The study will assist Arab
countries to develop and set up a harmonized legislative structure and electricity cross border
codes necessary for promoting electricity trade among Arab countries and with targeted
neighbouring regions including the EU market. There will be a comprehensive mechanism for
coordination and joint work among the stakeholders. A Steering Committee composed of
technical/policy representations from the member countries, the Arab League, the World Bank
and the Arab Fund for Economic and Social Development will provide strategic direction and
country input while also assessing the practical relevance of the study results. A Technical
Committee consisting of technical staff from the power utilities, or Ministries of Electricity, of
individual member countries, will also work directly with the study team to provide technical
details, and to convey the outcomes of various stages of the study to the Steering Committee, and
their own management and technical staff. The study will draw upon the work of various
8 The Regional Control Center could be expanded to serve countries outside Mashreq as well. In fact, the consultant
study considered the economics of serving the ELJIST and ELTAM countries including Egypt, Iraq, Jordan, Syria,
Lebanon, Turkey, Libya, Tunisia, Algeria and Morocco, 10 countries in all.

28
initiatives and forums9 that have in the past attempted to address the institutional and policy
issues relating to the integration of the energy markets in the region.
In regard to the second track, i.e., formulating transactions, the World Bank has planned an
operational activity to pursue with the participating countries the possibility of implementing
each of the projects identified in this study. These activities have varying time-frames and
degrees of uncertainty that would need to be clarified among the relevant stakeholders through a
systematic consultation process. The World Bank and its partners can assist Mashreq countries
in this particular area by:
Playing the role of convener and facilitator by bringing together the stakeholders:
governments, regional entities, private sector, financiers and donors, NGOs, etc.
Proposing specific schemes to the relevant sub-sets of stakeholders;
Supporting project implementation by providing finance from its own funds, and
mobilizing resources from other donors and the private sector, and
Coordinating project implementation, which is often the biggest challenge in regional
integration projects.
9 There have been a number of initiatives including: Euro-Arab Mashreq Gas Market Project; Euro-
Mediterranean Energy Market Integration Project; Mediterranean Working Group on Electricity and
Natural Gas; Energy Efficiency in Construction; MENA Regulatory Forum; and Regional Center for
Renewable Energy and Energy Efficiency. Substantial work is also being done by various regional
forums such as the Arab League; Arab Union of Electricity (AUE); the Arab Electricity Regulators’
Forum (AERF); the Energy Charter Treaty; Mediterranean Ring; and the Mediterranean Solar Plan.

29
Chapter 1. INTRODUCTION AND BACKGROUND
The Mashreq (“East”) region of the Middle East and North Africa region (MENA)
comprises Egypt, Iraq, Jordan, Lebanon, Syria and the West Bank & Gaza (figure 1.1).
This region is experiencing significant increases in energy demand. In spite of recent
additions of generating capacity, demand growth has often exceeded supply, leading to
widespread power interruptions in some countries, taking a significant toll on the
economies. Key statistics of the Mashreq countries and surrounding area are provided in
table 1.1.
Significant expansion of electricity generation, transmission, and distribution capacity as
well as primary fuel supply infrastructure are necessary if the capacity of the power sectors
of the Mashreq countries are to come back into balance with a reserve margin to ensure
adequate reliability. There are adequate reserves of gas in the region to serve as the primary
fuel for power generation. Nevertheless, development of the reserves and expansion of the
delivery infrastructure necessary to transport the fuel to the load centers, particularly the
generating stations, is lacking. Financing the huge investments necessary in gas and
electricity infrastructure will be challenging to say the least, particularly when there is no
clear picture of the magnitude and sources of energy supply.
Figure 1. 1: Mashreq Region

30
The development of the energy supply industries in the Mashreq countries would benefit
from the ability to access fuel resources and electricity generation available in other
countries in the MENA region. However, integration of the electricity and gas systems of
the Mashreq countries has been limited to only a few, relatively minor sales over existing
cross-border interconnections. Several Mashreq countries have expressed interest in
exploring the potential and benefits of expanding regional cross-border transactions and
energy trade between themselves, and with neighboring regions. However, a systematic
assessment of existing energy resources, consumption, and opportunities for regional gas
and electricity trade is lacking. Such an assessment is necessary to provide a quantitative
basis for any following detailed study of necessary investment in regional energy projects
and cross-border interconnections, as well as for the development of a framework to
encourage sustained regional energy trade in the future.
Table 1. 1: Key Statistics of Mashreq Countries and Surrounding Area
Notes: 1) Population and GDP data based on World Bank Statistics for 2008. GDP data is based on
purchasing power parity.
2) Data reflect 2008 values unless unavailable, in which case the most recent data available are shown.
3) Reserve margin is based on installed capacity, but could be much lower depending generation and
fuel availability.
As such, the objective of this study is to analyze the power and gas sectors in each country
to assess opportunities for regional energy integration in the Mashreq and neighboring
countries, and to identify specific integration projects that may require support from the
World Bank and other international financiers. This project is conducted in the context of
the World Bank Arab World Initiative, and is co-financed by ESMAP and the World Bank
Arab World Initiative. There are two other parallel efforts to examine the energy
integration potential in Maghreb and GCC countries. The study teams are working together
to ensure consistency and efficiency in the conduct of the three initiatives.
Egypt Iraq Jordan Syria Lebanon WBG Libya Turkey Iran
Population
(millions)
81.5 26.1 5.9 21.2 4.1 3.8 6.3 73.9 72.0
GDP (US$
Billions)*
441.6 105.8 31.2 94.2 47.9 12.6 96.7 1028.9 839.4
Electricity
Generation
Capacity (MW)
21,944 6,128 2,260 7,700 1,976 140 5400
40,830 47,896
Consumption
(GWh)
125,129 66,839 12,770 40,273 10,152 4521 25,514 191,240 196,041
Reserve
Margin
( % )
11 -(44) 12 15 -(14) -(11) -(3) 39 --
Average Tariff
(US
cents/kWh)
3.1 1.2 7.1 5.0 6.1 14.1 2.3 12.7 1.9
Gas
Production
(bcm)
54.0 4.3 0.2 6.3 0 0 28.0 0.9 111.9
Consumption
(bcm)
37.6 4.3 3.5 6.3 0 0 15.0 36.5 113.0
31
This report is organized in 11 chapters:
Chapter 1 Introduction and background
Chapters 2–7 Country chapters describing the energy context in Egypt, Iraq, Jordan,
Lebanon, Syria and West Bank & Gaza
Chapter 8 Description of energy context in neighboring jurisdictions including
EU, Iran, Libya, and Turkey
Chapter 9 Analysis of regional power interconnections
Chapter 10 Analysis of regional gas interconnections
Chapter 11 Energy integration projects with greater potential for implementation
and the impact of renewable energy development
Chapter 12 Conclusions including electricity and gas tariffs, electricity and gas
export pricing, institutional constraints and next steps.
32
Chapter 2. EGYPT PROSPECTS FOR ENERGY INTEGRATION
2.1. Overview
Egypt is a significant energy producer. It is anticipated that in coming years energy will continue
to play an important role in Egypt’s economy. Since the early 1990s, gas reserves and production
have approximately quadrupled, while electric generating capacity has doubled. Egypt has gas
reserves and successful gas exploration activities, a liquefied natural gas (LNG) export terminal,
the Arab Gas Pipeline (AGP), and electrical interconnections west through Libya and north to
the other Mashreq countries. Although its exports of oil-based products have declined in recent
years, higher world oil prices and exports of LNG have increased the country’s hydrocarbon
revenues.
Energy is poised to remain a significant contributor to Egypt’s economy for years to come.
However, it will require successful expansion of energy production and delivery systems.
Currently, Egypt’s electricity sector is in balance, with generation capacity in amounts necessary
to reliably meet the country’s demand, but levels of unsupplied energy have been increasing in
recent years. The electricity sector is heavily dependent on the use of natural gas to fuel its
generators. Electricity demand is forecast to grow at more than 6 percent annually in the coming
years placing considerable stress on electricity supply and gas infrastructure.
The cost of the expansion plan to meet the country’s future electricity requirement is enormous,
estimated at 570 billion EGP by 2022–23 (approximately US$101 billion). Financing this
aggressive expansion plan will be challenging because Egypt heavily subsidizes the domestic
prices for all forms of energy. Electricity prices would have to more than double in real terms to
fund the expansion plan. For example, if subsidies were to be removed at the class level,
residential tariffs would need to be increased by 83 percent. Assuming a five-year transition
period to bring tariffs up to the cost of supply, the residential class would require nominal tariff
increases of 47 percent in each year of the five-year transition period. Enormous political will is
necessary to address the subsidy issue, but appears to be the only means available if energy is to
remain a significant contributor to Egypt’s economy.
2.2. Power Sector Structures
The Ministry of Electricity and Energy is responsible for the electricity sector including policy
formation and implementation of Government decrees. The structure of the electricity sector is
shown in figure 2.1.
The Egyptian Electricity Utility and Consumer Protection Regulatory Agency has regulatory
oversight responsibility for the electricity sector. The agency’s role is to optimize the technical,
operational, financial, and procedural systems of the electricity business. However, noticeably
absent is the responsibility to regulate tariffs, which lies with Government. Not surprisingly,
tariffs are far below the cost of supply, and there are significant cross-subsidies among customer
classes. Residential customers in particular are heavily subsidized.
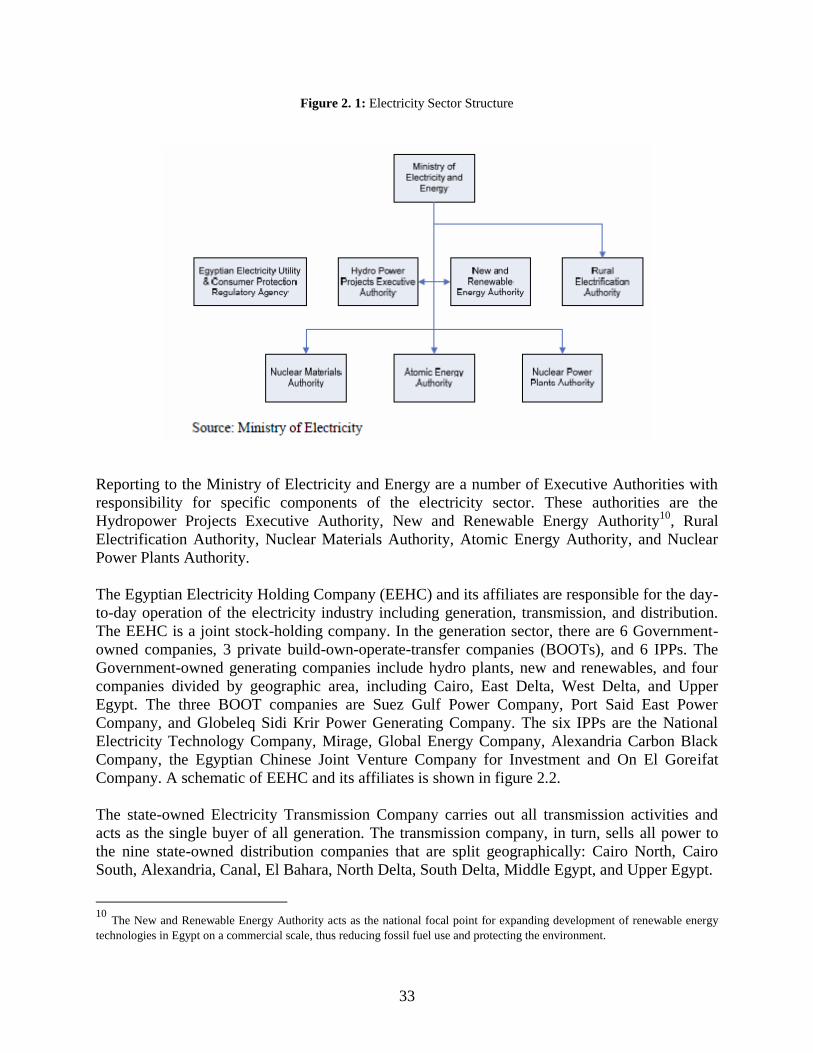
33
Figure 2. 1: Electricity Sector Structure
Reporting to the Ministry of Electricity and Energy are a number of Executive Authorities with
responsibility for specific components of the electricity sector. These authorities are the
Hydropower Projects Executive Authority, New and Renewable Energy Authority10
, Rural
Electrification Authority, Nuclear Materials Authority, Atomic Energy Authority, and Nuclear
Power Plants Authority.
The Egyptian Electricity Holding Company (EEHC) and its affiliates are responsible for the day-
to-day operation of the electricity industry including generation, transmission, and distribution.
The EEHC is a joint stock-holding company. In the generation sector, there are 6 Government-
owned companies, 3 private build-own-operate-transfer companies (BOOTs), and 6 IPPs. The
Government-owned generating companies include hydro plants, new and renewables, and four
companies divided by geographic area, including Cairo, East Delta, West Delta, and Upper
Egypt. The three BOOT companies are Suez Gulf Power Company, Port Said East Power
Company, and Globeleq Sidi Krir Power Generating Company. The six IPPs are the National
Electricity Technology Company, Mirage, Global Energy Company, Alexandria Carbon Black
Company, the Egyptian Chinese Joint Venture Company for Investment and On El Goreifat
Company. A schematic of EEHC and its affiliates is shown in figure 2.2.
The state-owned Electricity Transmission Company carries out all transmission activities and
acts as the single buyer of all generation. The transmission company, in turn, sells all power to
the nine state-owned distribution companies that are split geographically: Cairo North, Cairo
South, Alexandria, Canal, El Bahara, North Delta, South Delta, Middle Egypt, and Upper Egypt.
10
The New and Renewable Energy Authority acts as the national focal point for expanding development of renewable energy
technologies in Egypt on a commercial scale, thus reducing fossil fuel use and protecting the environment.
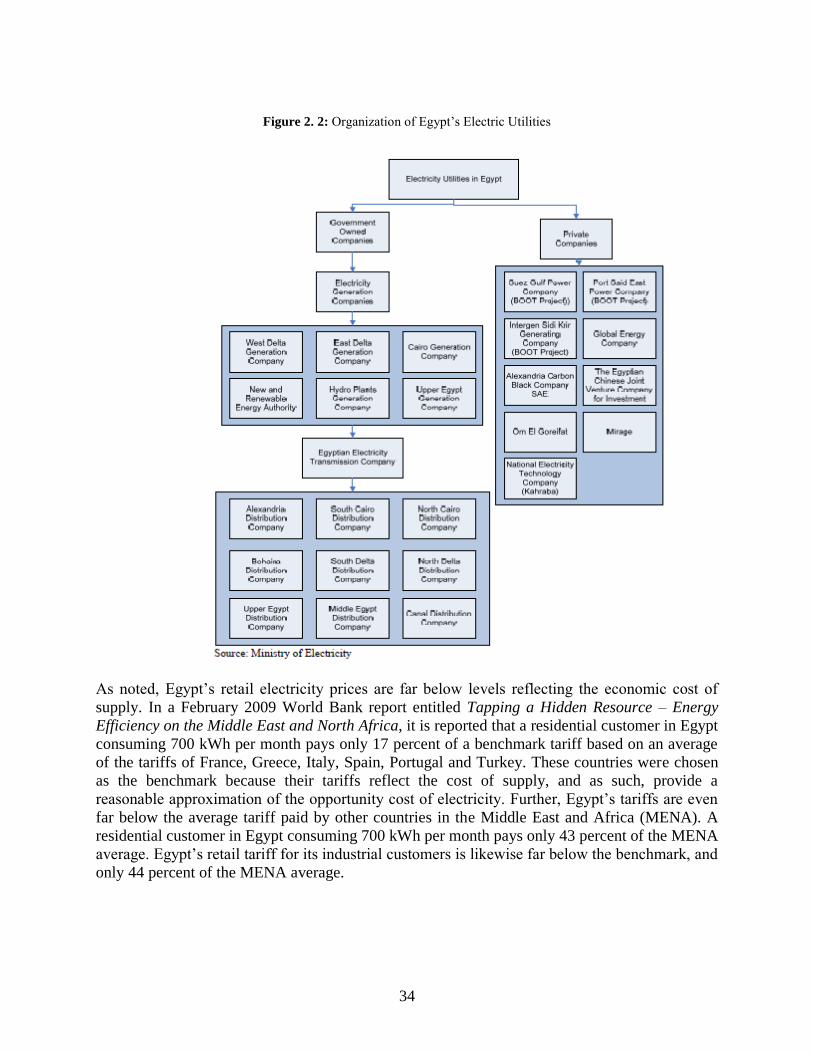
34
Figure 2. 2: Organization of Egypt’s Electric Utilities
As noted, Egypt’s retail electricity prices are far below levels reflecting the economic cost of
supply. In a February 2009 World Bank report entitled Tapping a Hidden Resource – Energy
Efficiency on the Middle East and North Africa, it is reported that a residential customer in Egypt
consuming 700 kWh per month pays only 17 percent of a benchmark tariff based on an average
of the tariffs of France, Greece, Italy, Spain, Portugal and Turkey. These countries were chosen
as the benchmark because their tariffs reflect the cost of supply, and as such, provide a
reasonable approximation of the opportunity cost of electricity. Further, Egypt’s tariffs are even
far below the average tariff paid by other countries in the Middle East and Africa (MENA). A
residential customer in Egypt consuming 700 kWh per month pays only 43 percent of the MENA
average. Egypt’s retail tariff for its industrial customers is likewise far below the benchmark, and
only 44 percent of the MENA average.
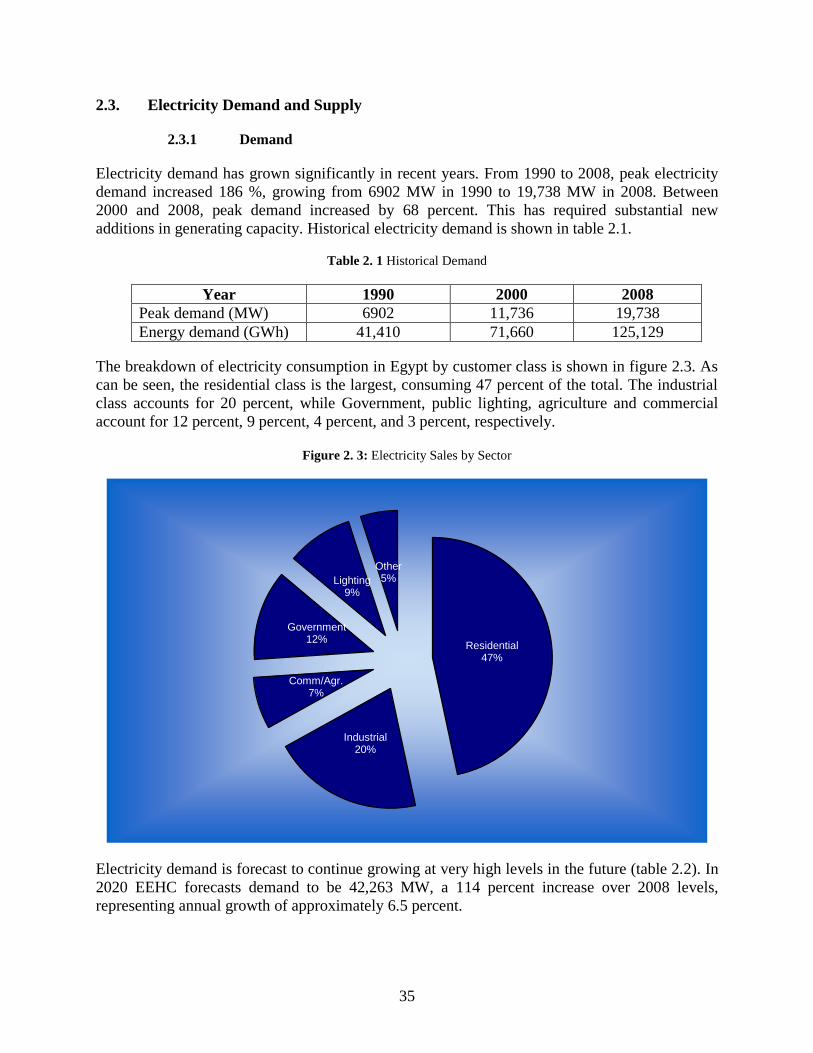
35
2.3. Electricity Demand and Supply
2.3.1 Demand
Electricity demand has grown significantly in recent years. From 1990 to 2008, peak electricity
demand increased 186 %, growing from 6902 MW in 1990 to 19,738 MW in 2008. Between
2000 and 2008, peak demand increased by 68 percent. This has required substantial new
additions in generating capacity. Historical electricity demand is shown in table 2.1.
Table 2. 1 Historical Demand
Year 1990 2000 2008
Peak demand (MW) 6902 11,736 19,738
Energy demand (GWh) 41,410 71,660 125,129
The breakdown of electricity consumption in Egypt by customer class is shown in figure 2.3. As
can be seen, the residential class is the largest, consuming 47 percent of the total. The industrial
class accounts for 20 percent, while Government, public lighting, agriculture and commercial
account for 12 percent, 9 percent, 4 percent, and 3 percent, respectively.
Figure 2. 3: Electricity Sales by Sector
Electricity demand is forecast to continue growing at very high levels in the future (table 2.2). In
2020 EEHC forecasts demand to be 42,263 MW, a 114 percent increase over 2008 levels,
representing annual growth of approximately 6.5 percent.
Residential47%
Industrial20%
Comm/Agr.7%
Government12%
Lighting9%
Other5%
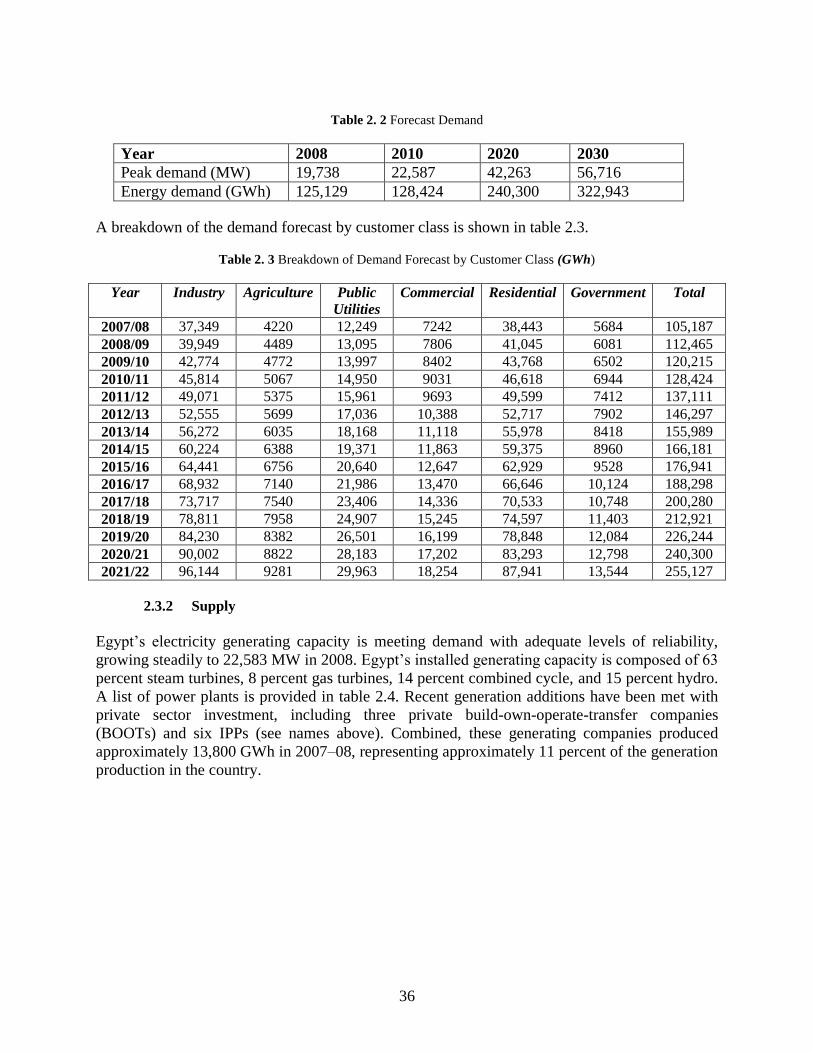
36
Table 2. 2 Forecast Demand
Year 2008 2010 2020 2030
Peak demand (MW) 19,738 22,587 42,263 56,716
Energy demand (GWh) 125,129 128,424 240,300 322,943
A breakdown of the demand forecast by customer class is shown in table 2.3.
Table 2. 3 Breakdown of Demand Forecast by Customer Class (GWh)
Year Industry Agriculture Public
Utilities
Commercial Residential Government Total
2007/08 37,349 4220 12,249 7242 38,443 5684 105,187
2008/09 39,949 4489 13,095 7806 41,045 6081 112,465
2009/10 42,774 4772 13,997 8402 43,768 6502 120,215
2010/11 45,814 5067 14,950 9031 46,618 6944 128,424
2011/12 49,071 5375 15,961 9693 49,599 7412 137,111
2012/13 52,555 5699 17,036 10,388 52,717 7902 146,297
2013/14 56,272 6035 18,168 11,118 55,978 8418 155,989
2014/15 60,224 6388 19,371 11,863 59,375 8960 166,181
2015/16 64,441 6756 20,640 12,647 62,929 9528 176,941
2016/17 68,932 7140 21,986 13,470 66,646 10,124 188,298
2017/18 73,717 7540 23,406 14,336 70,533 10,748 200,280
2018/19 78,811 7958 24,907 15,245 74,597 11,403 212,921
2019/20 84,230 8382 26,501 16,199 78,848 12,084 226,244
2020/21 90,002 8822 28,183 17,202 83,293 12,798 240,300
2021/22 96,144 9281 29,963 18,254 87,941 13,544 255,127
2.3.2 Supply
Egypt’s electricity generating capacity is meeting demand with adequate levels of reliability,
growing steadily to 22,583 MW in 2008. Egypt’s installed generating capacity is composed of 63
percent steam turbines, 8 percent gas turbines, 14 percent combined cycle, and 15 percent hydro.
A list of power plants is provided in table 2.4. Recent generation additions have been met with
private sector investment, including three private build-own-operate-transfer companies
(BOOTs) and six IPPs (see names above). Combined, these generating companies produced
approximately 13,800 GWh in 2007–08, representing approximately 11 percent of the generation
production in the country.

37
Table 2. 4 Egypt’s Power Stations
Notes:
1) Wind farm had entered with 80 MW
2) Steam component is not yet in operation
3) Naga Hamadi includes 5.4 MW retired in 9/2007 and four new units added in 3/2008.
4) Source: EEHC 2008 Annual Report

38
Egypt has electrical interconnections with Gaza, with the other Mashreq countries through
Jordan and with North African countries through Libya. The interconnection with Jordan is a 400
kV submarine cable across the Gulf of Aqaba. The link to Libya is a 220 kV line, and the link
with Gaza is a 22 kV line. In 2008 Egypt purchased 251 GWH over its interconnections, while
selling 814 GWh (net exports of 563 GWh). This level of exports represents about 0.5 percent of
Egypt’s total production.
As noted, EEHC is forecasting very high levels of demand growth of approximately 6.5 percent
annually through 2020. Such levels will require an aggressive generation expansion program if
future demand is to be met with adequate levels of supply reliability. The projected investment
plan includes construction of new plants to meet growing demand and allow for retirement of
older plants that are no longer economical to operate. Furthermore, significant investment in
transmission and distribution is necessary to transmit the new generating capacity to the load
centers.
Table 2.5 shows net capacity additions of each generation technology for each year through
2022–23. The table allows for retirements of 1344 MW, including 941 MW of open cycle gas
turbines, 398 MW of steam turbines, and 5 MW of hydro.
Table 2. 5 Egypt’s Proposed Generation Expansion Plan, 2007–23
Net expected capacity additions by 2022–23 exceed 41,000 MW. The majority of generation
capacity investment (74 percent) will be steam turbines and combined-cycle gas turbines, but a
significant portion (20 percent, or 8220 MW by 2022–23) will be met with renewable forms of
generation including wind turbines and one solar-thermal power plant. Open cycle gas turbine
technology used for peaking is expected to remain at current levels, that is, no net additions.
Rounding out the generation capacity additions are 2 new nuclear plants of 1000 MW each in

39
2017–18 and 2020–21. It is understood that Egypt signed an agreement with Russia in March
2008 to provide investment and technology assistance for the first nuclear project.
Table 2.6 shows total annual capacity additions and retirements for 2008–09 through 2022–23.
Table 2. 6 Total Plant Capacity Additions, 2008–23 (MW)
Year Opening
capacity
Capacity
additions
Capacity
retirements
Closing
capacity
2008–09 22,628 1870 163 24,335
2009–10 24,335 3090 48 27,376
2010–11 27,376 850 344 27,882
2011–12 27,882 2175 50 30,007
2012–13 30,007 3530 205 33,332
2013–14 33,332 1975 33 35,274
2014–15 35,274 2682 91 37,865
2015–16 37,865 2650 124 40,391
2016–17 40,391 2650 30 43,011
2017–18 43,011 2850 60 45,801
2018–19 45,801 2900 130 48,571
2019–20 48,571 3300 65 51,806
2020–21 51,806 2850 0 54,656
2021–22 54,656 3550 0 58,206
2022–23 58,206 3550 0 61,756 Source: EEHC.
The total cost of the expansion plan for generation, transmission, and distribution is enormous,
estimated at 570 billion EGP by 2022–23 (approximately US$101 billion based on an exchange
rate of US$1 = 5.62 EGP). Electricity prices will have to more than double in real terms to fund
the expansion plan. If subsidies were to be removed at the class level, using the residential class
as an example, tariffs would need to be increased by 83 percent. Assuming a 5-year transition
period to bring tariffs up to the cost of supply, the residential class would require nominal annual
tariff increases of 47 percent.11
Egypt’s electricity demand/supply picture is summarized in Figure 2.4. The blue bar shows
historical and forecast demand. The purple bar shows historical generation capacity, and existing
capacity (2008) going forward. The yellow bar shows the amount of new capacity needed to
meet growing demand with adequate levels of reliability (a 15% reserve margin is assumed for
Egypt consistent with its expansion plan). This new generating capacity is needed to supplement
existing generation capacity, but does not account for new investment needed to replace retired
plant. Egypt will need about 42,600 MW of capacity additions by 2030, almost double current
levels of capacity (88 %), if it is to supply increasing demand at adequate levels of reliability.
11
Information in this paragraph is from “Energy Cost of Supply and Pricing Report,” October 10, 2008, by Kantor
Management Consultants and Environmental Quality International, sponsored by the World Bank.

40
Figure 2. 4: Egypt’s Demand/Supply Context, 1990–2030 (MW)
Source: Various – see Appendix A
2.3.3 Power Sector Fuel Requirements
Gas demand for electricity generation has grown rapidly, increasing from 5 bcm in 1990 to
almost 23 bcm in 2008––or close to 9 percent annually. According to the Ministry of Electricity
and Energy Annual Report, 8 percent of electricity generation was produced from oil products,
81 percent from natural gas, 10 percent from hydro, and the remaining 1 percent from wind in
2007.
Gas demand by power generators is expected to continue to increase as numerous new gas-fired
power stations come on line. Future growth in gas consumption will be closely tied to growth in
electricity demand. Historic and forecast gas demand for power generation is shown in figure
2.5. The forecast shows that, by 2020, gas consumption for power generation will be about 80
percent greater than levels experienced in 2007–08.
Figure 2. 5: Historic and Forecast Growth in Gas Demand for Power Generation,
1990–2018 (mcm/yr)
0
10000
20000
30000
40000
50000
60000
1990 2000 2008 2010 2020 2030
Demand
Supply
New Capacity Needed

41
Currently, fuel oil is used for peaking generation and as a backup fuel, and is expected to
continue to be used in this manner in the future. The quantities of primary fuel forecast for the
Egyptian power sector are shown in table 2.7. Use of fuel oil for power generation is likewise
forecast to double by 2020. By 2030, it is forecast that the power sector will consume 60 bcm of
natural gas annually.
Table 2. 7 Forecast Fuel Consumption in Power Sector, 2007–2022
Year Natural Gas
(bcm)
Fuel Oil
(MTOE)
Uranium
(Metric Tons)
2008–09 22.8 5.02 0
2009–10 24.3 5.45 0
2010–11 25.8 5.78 0
2011–12 27.6 6.20 0
2012–13 29.5 6.69 0
2013–14 31.0 7.13 0
2014–15 33.0 7.62 0
2015–16 35.1 8.14 0
2016–17 37.3 8.68 0
2017–18 38.1 8.94 382.2
2018–19 40.5 9.55 384.6
2019–20 43.3 10.21 384.4
2020–21 44.4 10.57 770.8
2021–22 47.5 11.31 770.5 Source: EEHC.
2.4. Gas Sector Structure
The Ministry of Petroleum oversees the oil and gas sectors and is responsible for development
and maximization of oil, gas, and mineral reserves. The Government of Egypt has a gas reserve
depletion policy that one-third of reserves are to be monetized through export projects, one-third
are to be consumed domestically, and one-third are to be set aside for future generations.
The Egyptian Natural Gas Holding Company (EGAS) dominates natural gas activities in the
country, participating in upstream joint ventures and export schemes. EGAS is the single buyer
and seller of all gas in the domestic market. The upstream sector is open to participation by the
private sector through conventional Production Sharing Contracts (PSCs). GASCO is a 100
percent owned affiliate of EGAS responsible for transportation system operation and planning.
There are also 7 privately owned and 2 publicly owned local distribution companies responsible
for gas distribution services. The organization of the gas sector is shown in figure 2.6.

42
Figure 2. 6: Organization of Egypt’s Gas Sector
Source: World Bank, IPA Energy + Water Consulting
Egypt has no specific gas law. The policy and regulatory roles are not clearly defined and
separated, and third party access to transmission networks and independent regulation of gas
prices are not currently in place. Egypt does have a functionally separate transmission system
operator (GASCO). The Ministry of Petroleum is aware of the shortcomings of the gas market
and is in the process of making changes, including plans to establish an independent gas
regulator.
A number of policy decisions have led to the prominent rise in domestic gas consumption in
Egypt. In the early 1990s, attractive fiscal and gas pricing terms were introduced on the supply
side, creating the incentives necessary for upstream producers to develop existing reserves and
explore new gas reserves. However, domestic gas tariffs remain heavily subsidized, funded
through the State’s share of the natural gas rents. World Bank estimates indicate that natural gas
subsidies range from 32 percent–85 percent depending on the customer class, with the greatest
subsidies (85 percent) provided to the residential sector. It is understood that the Government
intends to phase out subsidies over time, while establishing other social protection measures that
target the truly needy. Such actions will dampen the rate of growth in domestic gas demand.

43
2.5. Gas Sector Demand and Supply
2.5.1 Demand
The Government of Egypt has aggressively pursued the use of gas since the early 1990s, not only
in power stations but also in industry. The electricity sector is the dominant gas consumer,
accounting for 56 percent of the total gas demand in the country in 2007–08. Figure 2.7 provides
a breakdown of gas consumption by consumer category.
Figure 2. 7: Gas Consumption by Consumer Category
Industry consumes approximately 11 percent of total gas consumption in Egypt and grew by 9.5
percent annually from the early 1990s through 2004–05. Egypt’s fertilizer and cement industries
are also large consumers of gas, accounting for 10 percent and 8 percent, respectively, of total
gas demand. Gas demand by the petroleum sector has grown rapidly as a result of increasing oil-
related activity in Egypt. The petroleum sector uses gas for gas lift, own use, and re-injection;
accounting for 5 percent of total gas consumption. Gas is delivered to the domestic sector
through low-pressure pipeline distribution systems and in liquid petroleum gas (LPG) cylinders
supplied by retailers. Combined, they account for 2 percent of Egypt’s total gas demand. Gas
consumption in the domestic sector has been growing rapidly at approximately 15 percent
annually. Finally, compressed natural gas (CNG) use in vehicles accounts for less than 2 percent
of total gas consumed in Egypt, but all taxis in the Cairo area must now run on CNG.
Approximately 60,000 of Egypt’s vehicles have been converted to run on CNG, and Egypt now
has the eighth largest CNG fleet in the World.
The Government of Egypt is committed to increase domestic gas consumption in the future.
Domestic gas demand is forecast to increase to 38.8 bcma by 2010 and 51.7 bcma by 2020.
Annual growth in domestic gas consumption is forecast at approximately 3 percent through
2020.
2.5.2 Reserves
From 1999 to 2007, Egypt's production of natural gas increased by over 30 percent. In 2006
Egypt produced 53.8 bcm of natural gas, consumed 36.8 bcm, and made the difference available
for export. According to the Oil and Gas Journal, Egypt’s proven gas reserves are 2.2 tcm,

44
representing roughly 1 percent of the World reserves. Undiscovered reserves are estimated to be
3.4 tcm, meaning that with successful exploration and appraisal, Egypt will continue to export
natural gas.
2.5.3 Exploration and Production
The majority of Egypt’s current exploration and production is in the Nile Delta area and the
Western Desert. Major non-associated fields include Abu Madi, Badreddin, and Abu Qir in the
Nile Delta, which, combined, account for approximately 50 percent of Egypt’s current gas
production. Other offshore developments include Port Fuad, South Temsah, Wakah, Rosetta, the
Scarab/Saffron fields, and the newly discovered Satis and Enil fields. EGAS expects gas
production to evolve in line with gas demand. A significant portion of demand will have to be
met from fields under development or with new resources.
2.5.4 Exports
The Arab Gas Pipeline (AGP) connects Egypt to Jordan and other Mashreq countries. Farther
extensions of the AGP will connect Mashreq to the Turkish grid. The Arish-Ashkelon gas
pipeline to Israel became operational in 2008 and began transferring what is expected to be 1.7
bcm per year.
Egypt has 3 LNG trains that in 2006 processed an estimated 15 bcm of LNG including 3.65 bcm
that was shipped to the United States. Union Fenosa, a Spanish firm, built a single train
liquefaction facility at Damietta which started production of 6.8 bcm per year in late 2004. In
June 2006, a consortium including Union Fenosa signed a framework agreement to expand the
plant and production with a second train planned to begin operation in 2010–11. However, this
agreement may be put on hold owing to the Government of Egypt’s June 2008 announcement
that all export contracts are on hold until 2010. Exports are facing pressure in Parliament as they
were signed when prices were significantly lower than they are today. A second LNG export
project referred to as Egyptian LNG at Idku was built by British Gas in partnership with Petronas
and has two 4.9-bcm-per-year trains. It is tied to British Gas’s Simian/Sienna offshore fields and
began production in 2005. British Gas anticipates building a third liquefaction plant for startup in
2011.
2.5.5 Domestic Gas Transmission
The domestic gas transport network is managed, operated, and maintained by GASCO, a
majority state-owned company. The Egyptian General Petroleum Corporation (EGPC) owns 70
percent of GASCO, while Petrojet and Egypt Gas each own 15 percent. Development of the gas
transport network has followed the development of gas production fields. By 2005 GASCO had
expanded the network to 5170 km with a capacity of 142 mmscm/day. By end-2009, natural gas
is expected to reach as far south as Aswan. A map of Egypt’s gas network and associated
infrastructure is shown in figure 2.8.

45
Figure 2. 8: Egypt’s Gas Network and Associated Infrastructure
2.5.6 Demand/Supply Balance and Export Potential
The gas demand/supply balance is shown in figure 2.10. It shows that Egypt will have 18 bcm
for export in 2010, increasing to 19 in 2020 and 28 bcm in 2030.
Figure 2. 9: Gas Demand/Supply Balance (bcm)
Source: Various – see Appendix A
.
0
10
20
30
40
50
60
70
80
90
100
1990 2000 2008 2010 2020 2030
Production
Demand
Export

46
Chapter 3. IRAQ PROSPECTS FOR ENERGY INTEGRATON
3.1. Overview
Iraq’s electricity sector is plagued with problems. The country produces enough electricity to
supply only approximately half of the estimated demand. Iraq has numerous power plants but
most are more than 20 years old and have suffered from years of sanctions and war. Proper
maintenance has been sorely lacking and is compounded by a shortage of spare parts.
Furthermore, there is a shortage of power sector expertise in the country, and primary fuel
supplies have been sporadic at best. From January to August 2008, electricity supply averaged
12 hours per day, but supply to a typical home may have averaged only 6 hours per day.
The Ministry of Electricity has an ambitious gas infrastructure program that, if successful, will
consume most of the gas production forecast by the Ministry of Oil. However, the program will
compete with other initiatives being undertaken by the Government, which are numerous in the
unstable political situation. The pressing demands on resources combined with low tariffs, high
technical losses, and poor collection rates means that the Ministry will be unable to cover
operating costs, let alone raise the required capital from revenues. The electricity sector receives
large subsidies from the Ministry of Finance paid for through oil sales. The required investment
in electricity generation and primary fuel infrastructure will not take place without alternative
sources of funds. An independent power producer (IPP) program is a means to raise private
sector capital, but this will require significant tariff increases and the establishment of the
necessary legal and regulatory framework. It could take years before investors have enough
confidence to proceed with such initiatives in Iraq. This probable delay suggests that Iraq is
likely to have surplus gas available for export over the next several years.
The Ministry of Oil forecasts that, by 2015, Iraq will be producing approximately 46 bcma of
natural gas, with approximately 20 bcma of this available for export. Some of Iraq’s gas supplies
are located near the border with Syria close to the Syrian gas network. As yet, no gas pipeline
links exist between Iraq and the AGP, but potential exists to develop such pipelines, opening the
way for gas exports to the Mashreq countries and farther to Turkey and the EU. Once the
security situation has improved, attention will turn to the production and possible export of gas
as part of a general reconstruction and to development of Iraq’s hydrocarbon industry.
3.2. Power Sector Structure
The Ministry of Electricity, which replaced the Commission of Electricity in 2003, is
responsible for generating, transmitting, and distributing electrical energy in Iraq. The Ministry
has three departments that report to the Minister: the Electric Energy Production Office, the
Electric Energy Transmission Office, and the Electric Energy Distribution Office. Each office
has a number of directors general within who cover different geographic areas of the country.
The organization of the ministry is shown in figure 3.1.
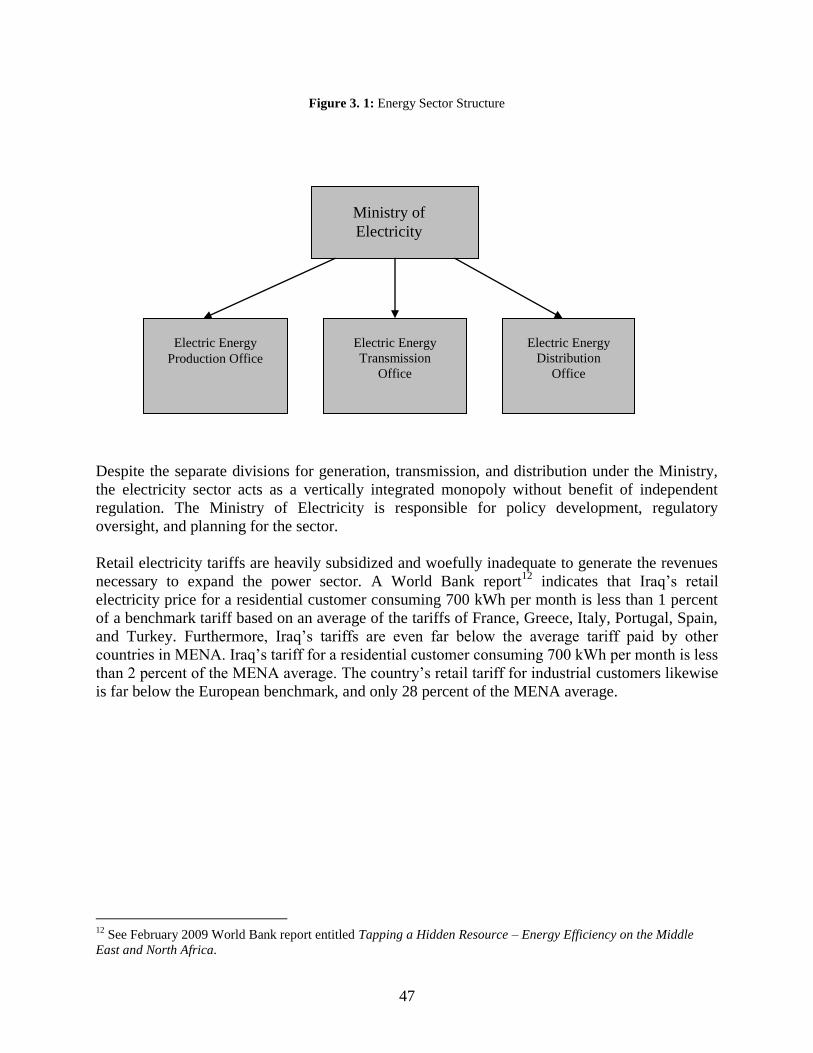
47
Figure 3. 1: Energy Sector Structure
Despite the separate divisions for generation, transmission, and distribution under the Ministry,
the electricity sector acts as a vertically integrated monopoly without benefit of independent
regulation. The Ministry of Electricity is responsible for policy development, regulatory
oversight, and planning for the sector.
Retail electricity tariffs are heavily subsidized and woefully inadequate to generate the revenues
necessary to expand the power sector. A World Bank report12
indicates that Iraq’s retail
electricity price for a residential customer consuming 700 kWh per month is less than 1 percent
of a benchmark tariff based on an average of the tariffs of France, Greece, Italy, Portugal, Spain,
and Turkey. Furthermore, Iraq’s tariffs are even far below the average tariff paid by other
countries in MENA. Iraq’s tariff for a residential customer consuming 700 kWh per month is less
than 2 percent of the MENA average. The country’s retail tariff for industrial customers likewise
is far below the European benchmark, and only 28 percent of the MENA average.
12
See February 2009 World Bank report entitled Tapping a Hidden Resource – Energy Efficiency on the Middle
East and North Africa.
Ministry of
Electricity
Electric Energy
Production Office
Electric Energy
Transmission
Office
Electric Energy
Distribution
Office
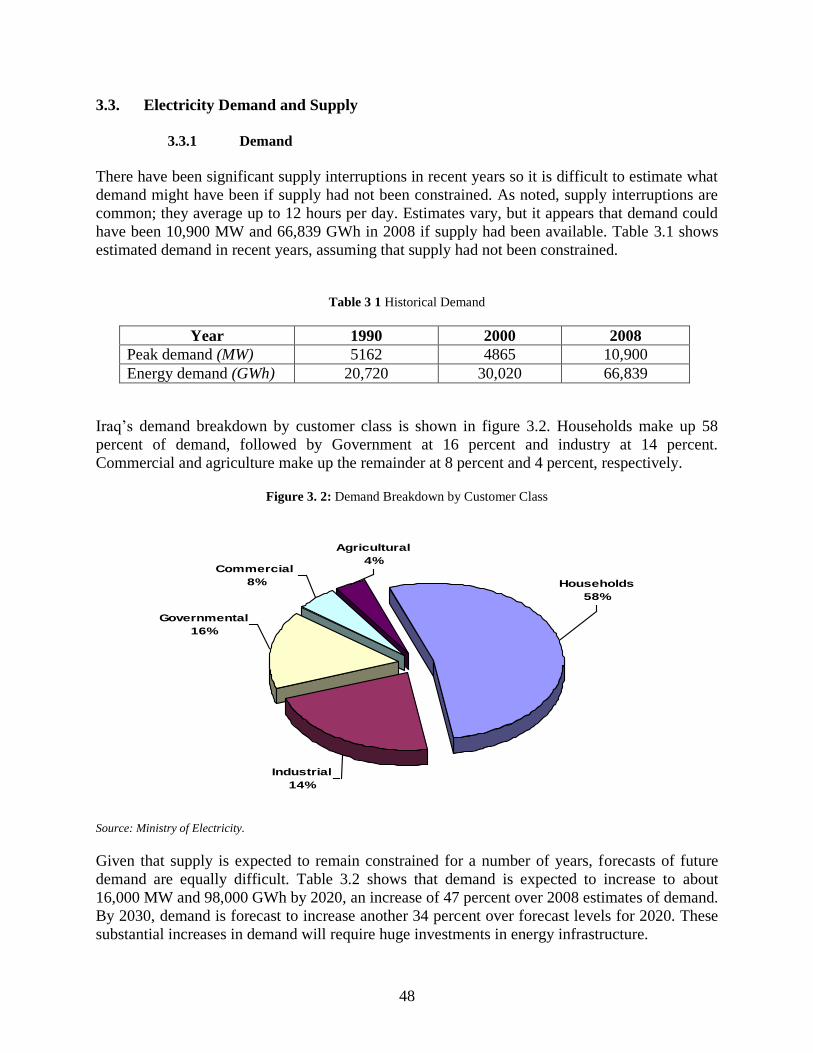
48
3.3. Electricity Demand and Supply
3.3.1 Demand
There have been significant supply interruptions in recent years so it is difficult to estimate what
demand might have been if supply had not been constrained. As noted, supply interruptions are
common; they average up to 12 hours per day. Estimates vary, but it appears that demand could
have been 10,900 MW and 66,839 GWh in 2008 if supply had been available. Table 3.1 shows
estimated demand in recent years, assuming that supply had not been constrained.
Table 3 1 Historical Demand
Year 1990 2000 2008
Peak demand (MW) 5162 4865 10,900
Energy demand (GWh) 20,720 30,020 66,839
Iraq’s demand breakdown by customer class is shown in figure 3.2. Households make up 58
percent of demand, followed by Government at 16 percent and industry at 14 percent.
Commercial and agriculture make up the remainder at 8 percent and 4 percent, respectively.
Figure 3. 2: Demand Breakdown by Customer Class
Source: Ministry of Electricity.
Given that supply is expected to remain constrained for a number of years, forecasts of future
demand are equally difficult. Table 3.2 shows that demand is expected to increase to about
16,000 MW and 98,000 GWh by 2020, an increase of 47 percent over 2008 estimates of demand.
By 2030, demand is forecast to increase another 34 percent over forecast levels for 2020. These
substantial increases in demand will require huge investments in energy infrastructure.
Industrial
14%
Governmental
16%
Commercial
8%
Agricultural
4%
Households
58%
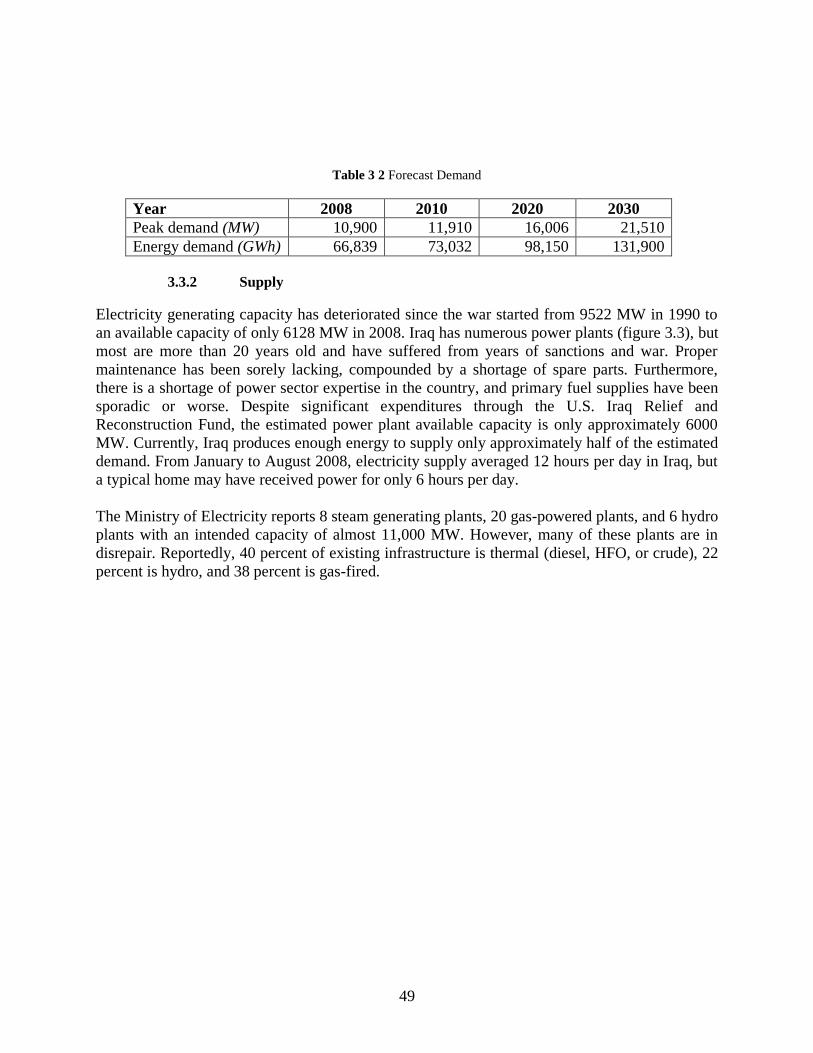
49
Table 3 2 Forecast Demand
Year 2008 2010 2020 2030
Peak demand (MW) 10,900 11,910 16,006 21,510
Energy demand (GWh) 66,839 73,032 98,150 131,900
3.3.2 Supply
Electricity generating capacity has deteriorated since the war started from 9522 MW in 1990 to
an available capacity of only 6128 MW in 2008. Iraq has numerous power plants (figure 3.3), but
most are more than 20 years old and have suffered from years of sanctions and war. Proper
maintenance has been sorely lacking, compounded by a shortage of spare parts. Furthermore,
there is a shortage of power sector expertise in the country, and primary fuel supplies have been
sporadic or worse. Despite significant expenditures through the U.S. Iraq Relief and
Reconstruction Fund, the estimated power plant available capacity is only approximately 6000
MW. Currently, Iraq produces enough energy to supply only approximately half of the estimated
demand. From January to August 2008, electricity supply averaged 12 hours per day in Iraq, but
a typical home may have received power for only 6 hours per day.
The Ministry of Electricity reports 8 steam generating plants, 20 gas-powered plants, and 6 hydro
plants with an intended capacity of almost 11,000 MW. However, many of these plants are in
disrepair. Reportedly, 40 percent of existing infrastructure is thermal (diesel, HFO, or crude), 22
percent is hydro, and 38 percent is gas-fired.

50
Figure 3. 3: Schematic of Iraq’s Power Facilities
Source: Ministry of Electricity.
Recent energy demand and production compared to pre-war levels are shown in table 3.3.
Production falls far short of demand and has not returned to pre-war levels. Supply remains
significantly constrained. The Government of Iraq is aggressively tackling this problem as
discussed below.
In 2008 approximately 95 percent of electricity production came from oil while hydro accounted
for the remaining 5 percent. The reliability and consistency of primary fuel supply, particularly
of gas, remains a significant problem.
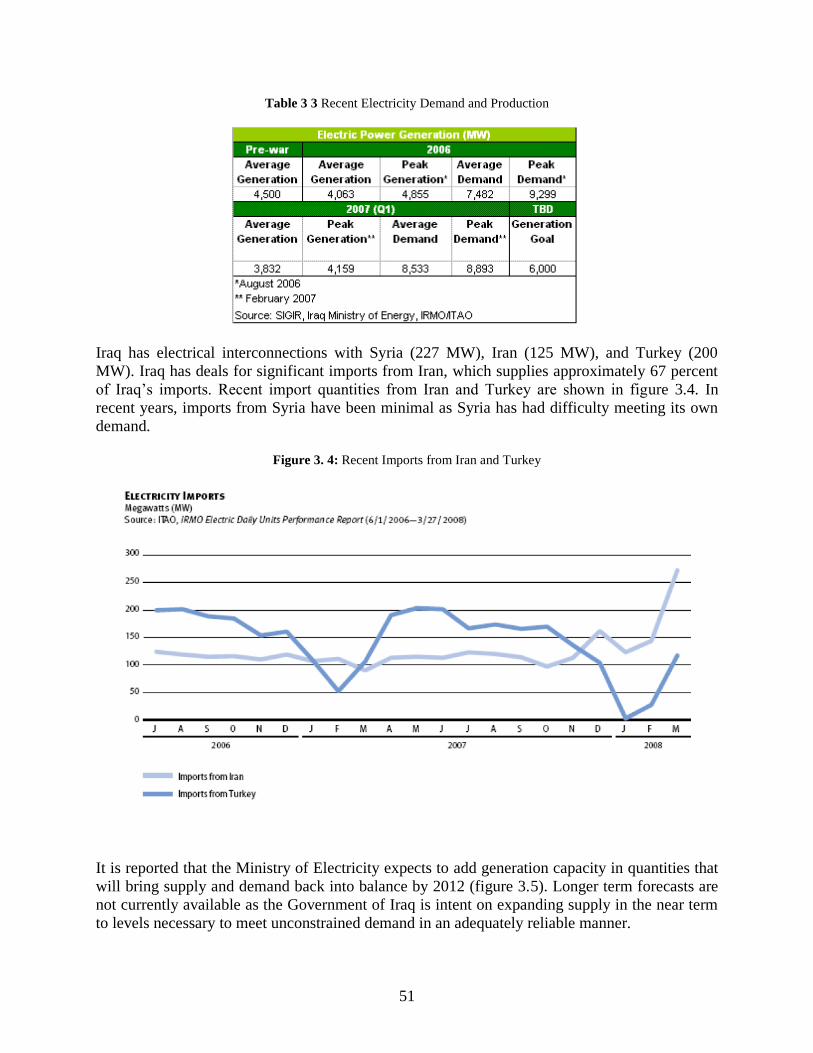
51
Table 3 3 Recent Electricity Demand and Production
Iraq has electrical interconnections with Syria (227 MW), Iran (125 MW), and Turkey (200
MW). Iraq has deals for significant imports from Iran, which supplies approximately 67 percent
of Iraq’s imports. Recent import quantities from Iran and Turkey are shown in figure 3.4. In
recent years, imports from Syria have been minimal as Syria has had difficulty meeting its own
demand.
Figure 3. 4: Recent Imports from Iran and Turkey
It is reported that the Ministry of Electricity expects to add generation capacity in quantities that
will bring supply and demand back into balance by 2012 (figure 3.5). Longer term forecasts are
not currently available as the Government of Iraq is intent on expanding supply in the near term
to levels necessary to meet unconstrained demand in an adequately reliable manner.
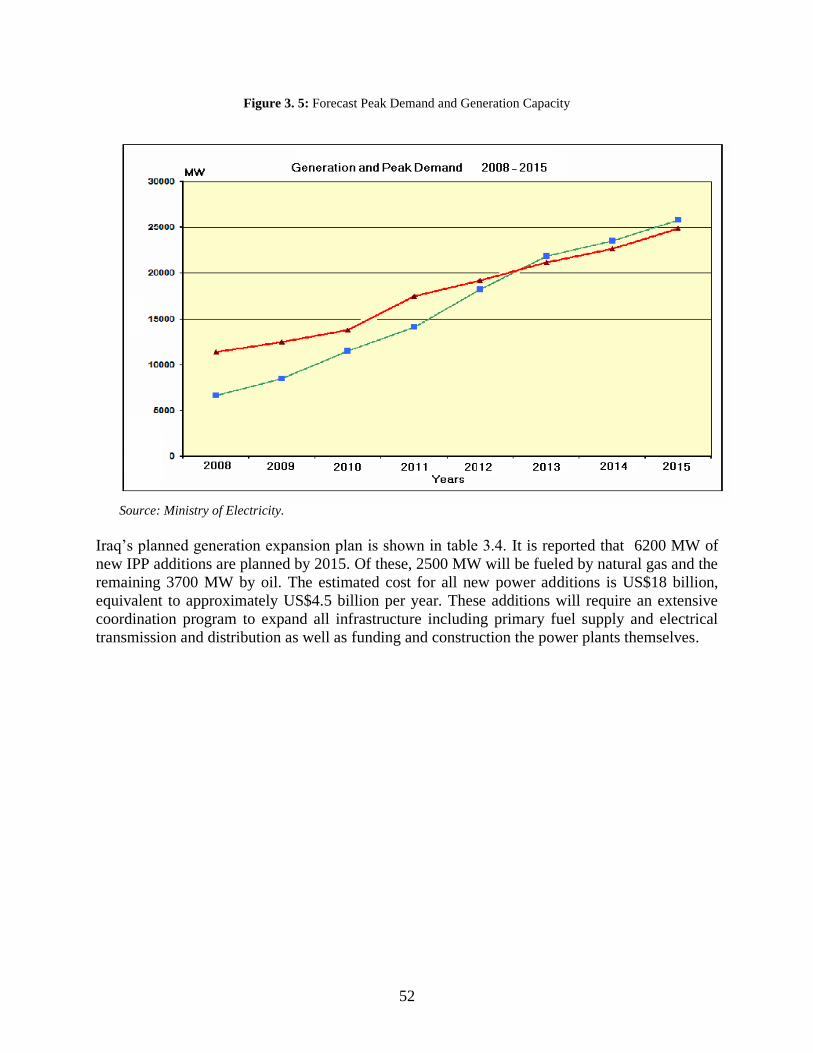
52
Figure 3. 5: Forecast Peak Demand and Generation Capacity
Source: Ministry of Electricity.
Iraq’s planned generation expansion plan is shown in table 3.4. It is reported that 6200 MW of
new IPP additions are planned by 2015. Of these, 2500 MW will be fueled by natural gas and the
remaining 3700 MW by oil. The estimated cost for all new power additions is US$18 billion,
equivalent to approximately US$4.5 billion per year. These additions will require an extensive
coordination program to expand all infrastructure including primary fuel supply and electrical
transmission and distribution as well as funding and construction the power plants themselves.

53
Table 3 4 Planned IPP Additions by 2015
Source: Ministry of Electricity
Iraq’s electricity demand/supply picture is summarized in figure 3.6. The blue bar shows historical and
forecast demand. The purple bar shows historical generation capacity, and existing capacity (2008) going
forward. The yellow bar shows the amount of new capacity needed to meet growing demand with
adequate levels of reliability (assuming a 10% reserve margin). This new generating capacity is needed to
supplement existing generation capacity, but does not account for new investment needed to replace
retired plant. Iraq’s required investment in new generation capacity is substantial to say the least, posing a
significant challenge.
Figure 3. 6: Iraq’s Demand/Supply Situation (MW)
0
5000
10000
15000
20000
25000
1990 2000 2008 2010 2020 2030
Demand
Supply
New Capacity Needed
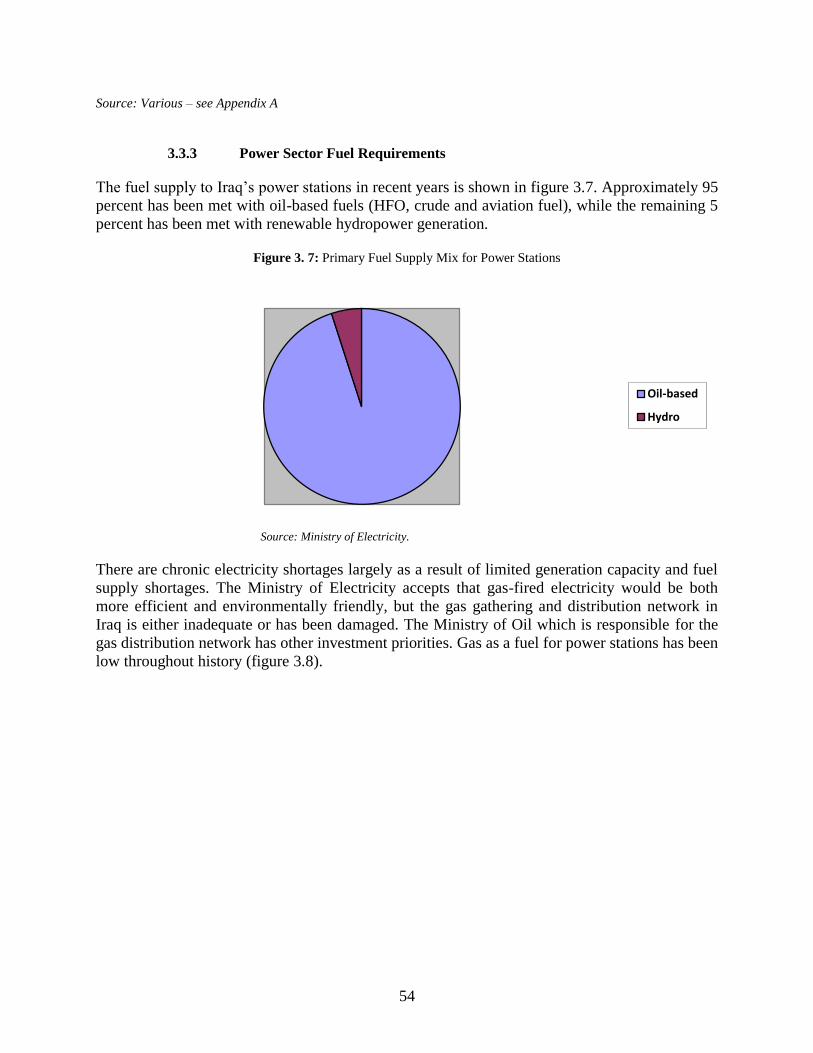
54
Source: Various – see Appendix A
3.3.3 Power Sector Fuel Requirements
The fuel supply to Iraq’s power stations in recent years is shown in figure 3.7. Approximately 95
percent has been met with oil-based fuels (HFO, crude and aviation fuel), while the remaining 5
percent has been met with renewable hydropower generation.
Figure 3. 7: Primary Fuel Supply Mix for Power Stations
Source: Ministry of Electricity.
There are chronic electricity shortages largely as a result of limited generation capacity and fuel
supply shortages. The Ministry of Electricity accepts that gas-fired electricity would be both
more efficient and environmentally friendly, but the gas gathering and distribution network in
Iraq is either inadequate or has been damaged. The Ministry of Oil which is responsible for the
gas distribution network has other investment priorities. Gas as a fuel for power stations has been
low throughout history (figure 3.8).
Oil-based
Hydro
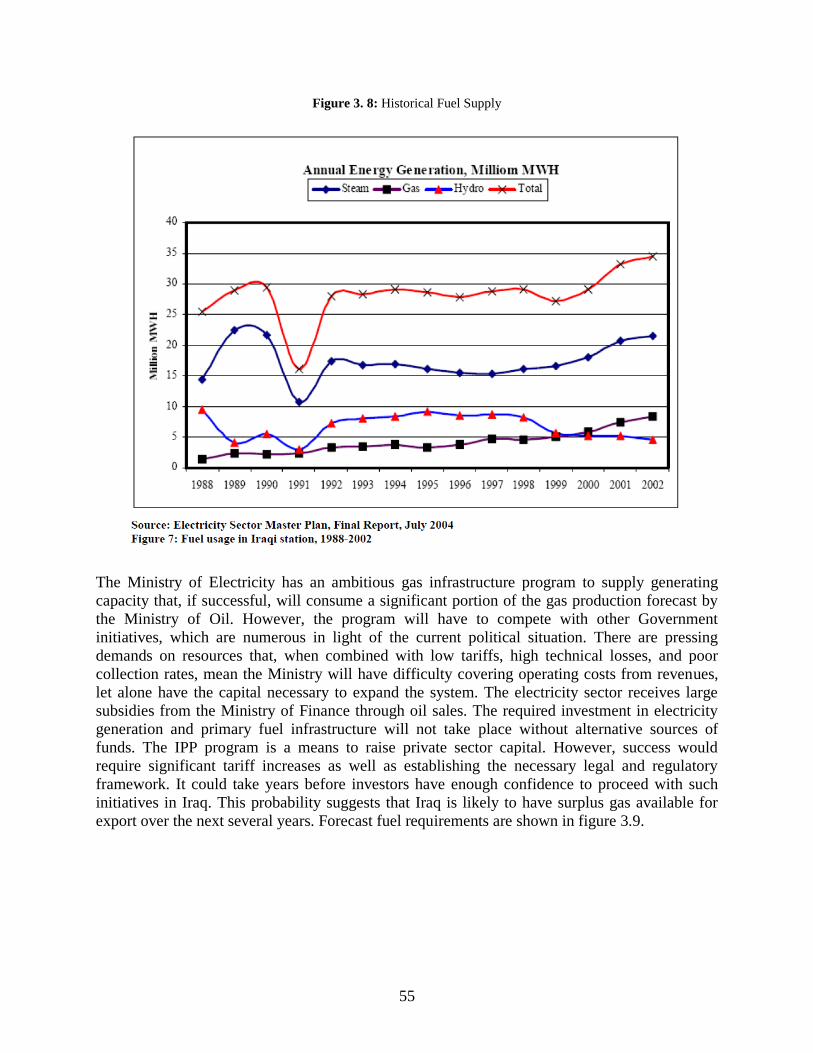
55
Figure 3. 8: Historical Fuel Supply
The Ministry of Electricity has an ambitious gas infrastructure program to supply generating
capacity that, if successful, will consume a significant portion of the gas production forecast by
the Ministry of Oil. However, the program will have to compete with other Government
initiatives, which are numerous in light of the current political situation. There are pressing
demands on resources that, when combined with low tariffs, high technical losses, and poor
collection rates, mean the Ministry will have difficulty covering operating costs from revenues,
let alone have the capital necessary to expand the system. The electricity sector receives large
subsidies from the Ministry of Finance through oil sales. The required investment in electricity
generation and primary fuel infrastructure will not take place without alternative sources of
funds. The IPP program is a means to raise private sector capital. However, success would
require significant tariff increases as well as establishing the necessary legal and regulatory
framework. It could take years before investors have enough confidence to proceed with such
initiatives in Iraq. This probability suggests that Iraq is likely to have surplus gas available for
export over the next several years. Forecast fuel requirements are shown in figure 3.9.
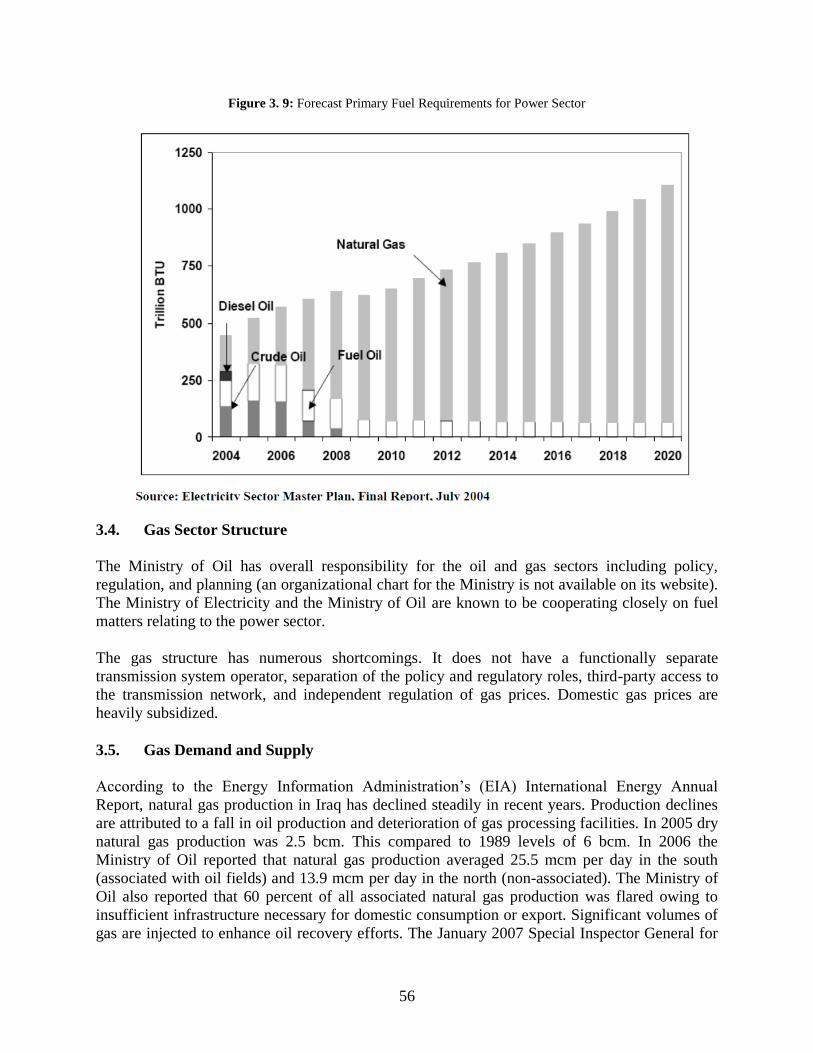
56
Figure 3. 9: Forecast Primary Fuel Requirements for Power Sector
3.4. Gas Sector Structure
The Ministry of Oil has overall responsibility for the oil and gas sectors including policy,
regulation, and planning (an organizational chart for the Ministry is not available on its website).
The Ministry of Electricity and the Ministry of Oil are known to be cooperating closely on fuel
matters relating to the power sector.
The gas structure has numerous shortcomings. It does not have a functionally separate
transmission system operator, separation of the policy and regulatory roles, third-party access to
the transmission network, and independent regulation of gas prices. Domestic gas prices are
heavily subsidized.
3.5. Gas Demand and Supply
According to the Energy Information Administration’s (EIA) International Energy Annual
Report, natural gas production in Iraq has declined steadily in recent years. Production declines
are attributed to a fall in oil production and deterioration of gas processing facilities. In 2005 dry
natural gas production was 2.5 bcm. This compared to 1989 levels of 6 bcm. In 2006 the
Ministry of Oil reported that natural gas production averaged 25.5 mcm per day in the south
(associated with oil fields) and 13.9 mcm per day in the north (non-associated). The Ministry of
Oil also reported that 60 percent of all associated natural gas production was flared owing to
insufficient infrastructure necessary for domestic consumption or export. Significant volumes of
gas are injected to enhance oil recovery efforts. The January 2007 Special Inspector General for

57
Iraq Reconstruction (SIGIR) report indicates that the gas flared and injected for oil recovery that
year was worth US$4 billion.
Little gas is being used for electricity production. A fertilizer factory and oil facilities are using
the majority of gas production that is not being flared. Production of associated gas remains low
owing to problems in the oil sector. Figure 3.10 shows associated gas production and amounts
flared in 2004.
Figure 3. 10: Associated Gas Produced and Flared in 2004
Source: Ministry of Oil
It is believed that Iraq’s oil reserves are second only to Saudi Arabia’s. Exploration in Iraq has
concentrated on oil, with little attention paid to gas. Iraq’s proven natural gas reserves are 3.0
tcm, but probable reserves have been estimated at 7.8–8.5 tcm (Oil and Gas Journal). Iraq’s
proven gas reserves are the tenth largest in the world. Approximately 70 percent of the gas is
associated with oil fields, while a little less than 20 percent is non-associated. Approximately 10
percent is estimated to be salt dome gas. Most of the non-associated reserves are in several
northern fields.
According to the Ministry of Oil, a number of these non-associated gas fields in the north are
slated for development, totaling approximately 285 bcm of reserves. These reserves could
produce 25.5–28.3 MMcm/d for export and 11.3 MMcm/d for domestic consumption.
It is reported thata large natural gas field has been discovered near Nineveh, west of Al-Qa’em
extending to the Iraqi-Saudi border. The field, known as Ukash, could produce 100,000 bbl per

58
day of gas and condensate. A find of a 60 bcm field of non-associated gas near Akkas in the
Western Desert was also reported. It was proposed that this field could be developed for export
to Syria through a pipeline from the Akkas field to the Arab Gas Pipeline in Syria.. The Akkas
field is 26 km from the Syrian/Iraqi border. It is more than 200 km from the nearest oil field,
suggesting that there may be additional gas discoveries in the Western Desert. Gas found in
Akkaz field may be more economical to process in Syria, particularly since the Omar and Deir
Ezzor gas processing plants in Syria have spare capacity.
As noted, Iraq’s gas processing facilities have deteriorated in recent years. According to reports,
prior to the war, the southern infrastructure included 9 gathering stations with a processing
capacity of 42.5 mcm/d, all intended for export. The associated dry gas gathered from the North
and South Rumaila and Az-Zubair fields was piped to a 16.3 MMcm/d natural gas liquids (NGL)
fractionation plant in Az-Zubair and a 2.8 MMcm/d processing plant in Basra. At Khor al-Jubair,
there is a 0.5 mcm LPG storage tank farm and loading terminals. Iraq also has a major domestic
natural gas pipeline in the south with capacity to deliver 6.8 MMcm/d of associated gas to
Baghdad from the West Qurna field. Gas processing facilities in the north gather supply from
Kirkuk, Bai Hassan, and Jambur for domestic consumption, including LPG. The EIA indicates
that the system is designed to supply LPG to Baghdad and other cities, as well as dry gas and
sulfur to power stations and industrial plants.
The main transmission line is a South to North pipeline running from Basra to the Hadithah and
Baija refineries north of Baghdad, plus a line from Kirkuk to Baija. Even though significant parts
of the gas network are limited for various reasons, it is understood that pipeline capacity is larger
than current requirements. The main constraint in the gas supply network is shortage of gas.
Major investments in gas infrastructure are needed if gas is to be a significant contributor to
Iraq’s electricity sector in the future.
The Government of Iraq has prepared an ambitious gas utilization plan for associated and non-
associated gas. According to this plan, Iraq would utilize its gas fields in the south (of which
most of the largest reserves are associated with oil production) for domestic use and for export to
Kuwait. It also would develop the gas reserves in the north and west for export to Syria and
Turkey, and eventually to Europe. The plan aims at producing approximately 60 bcm/year of gas
by 2015, approximately half of which would be exported. Unfortunately the Iraqi plans have not
moved forward in the last few years because of difficulties in implementation. The Government
is preparing a consolidated energy strategy with assistance from the World Bank. It is hoped that,
through this plan, the Government will develop a comprehensive and realistic gas production
policy with clear guidelines for gas allocation to domestic consumption versus exports.
Figure 3.11 illustrates historical and forecast gas production, domestic consumption, and gas
available for export. As noted, forecast values will change. However, they indicate that there
could be 32 bcma available for export by 2020, and 33 bcma by 2030, even after accounting for
increased gas use in power generation. It should be noted that reaching these forecasts will
require a return to civil order and considerable investment.

59
Figure 3. 11: Gas Demand/Supply Balance, 1990–2030 (bcm)
Source: Various – see Appendix A
0
10
20
30
40
50
60
70
80
90
100
1990 2000 2008 2010 2020 2030
Production
Demand
Export

60
Chapter 4. JORDAN PROSPECTS FOR ENERGY INTEGRATION
4.1. Overview
Demand for both primary energy and electricity is forecast to increase significantly in Jordan, as
is the share of natural gas in the primary energy mix. Jordan depends on imports for 95 percent
of its primary energy demand. Gas produced domestically supplies less than 10 percent of gas
demand, although recent gas exploration activities are promising. Jordan plans to continue
replacing oil-fired electricity generation with natural gas, and is well on its way towards its goal
of producing 80 percent of its electricity needs from gas. According to Government estimates,
the domestic market for gas is expected to grow to 5 bcm per annum by 2015. In the longer term,
Jordan hopes to make use of domestic oil shale resources.
With the Arab Gas Pipeline (AGP) and gas supplied from Egypt through a contract with Al Fajr
Company, Jordan is well positioned to meet most of its gas requirements through the mid-term.
As for the electricity sector, supply has been improved with the commissioning in 2008 of 344
MW of gas turbines, including two at Amman East and one at Samra. In 2009 the gas turbine at
Amman East was converted to combined cycle operation with the addition of a steam turbine and
in 2010, Samra’s second combined cycle plant is scheduled to come into operation with the
commissioning of the steam turbine. Furthermore, Jordan is investigating the possibility of using
additional wind power and domestic oil shale deposits using circulating fluidized bed (CFB)
technology for power generation. The electrical interconnections with Egypt and Syria have
provided significant operational benefits to Jordan, particularly with regard to capacity reserve
sharing. Use of the interconnections for economy energy exchanges has been limited in spite of
potential opportunities brought on by load diversity.
Jordan has proceeded farther down the reform path than other Mashreq countries. A single-buyer
market structure is in place in the electricity sector with significant private sector participation.
An independent regulatory authority is in place for the electricity sector, but there is currently
little regulation of natural gas other than through the contract with Al Fajr Company. It is
understood that the Government intends to extend the responsibilities of the electricity regulator
to include the oil and gas sectors in the future. Energy tariffs in Jordan are much closer to the
economic cost of supply than in other Mashreq countries, and there is less cross-subsidization
among customer classes.
4.2. Power Sector Structure
In light of the high levels of demand growth forecast in Jordan and to enable the power sector to
operate on a financially self-sustaining basis, in 1999 the National Electric Power Company
(NEPCO) was unbundled into three operating companies:
a. Central Electricity Generating Company (CEGCO), which became the generating
company
b. Electricity Distribution Company (EDC)
c. NEPCO, which retained responsibility for transmission.

61
In 2001 the Electricity Regulatory Commission (ERC) was formed to regulate the electricity
sector. The ERC is responsible for setting tariffs and issuing licenses for the activities in the
sector. The Commission monitors and ensures that entities operate consistently with the
obligations documented in their licenses. The ERC exists to ensure that tariffs enable power
companies to finance operations and earn a fair return on investment. The ERC improves
transparency, even though it resides within the Ministry of Energy and Mineral Resources
(MEMR) so is not quite as independent of Government as investors might like (figure 4.1). In the
future, the Government intends to extend the ERC’s responsibilities to encompass the oil and
natural gas sectors.
Jordan has a single-buyer market structure in place. State-owned NEPCO performs the role of
single buyer, purchasing all supply from generators and, and in turn, selling all purchased power
to the distribution companies and large consumers directly connected to the transmission system.
NEPCO is also responsible for transmission asset management, dispatch, demand forecasting,
and purchasing natural gas to meet the needs of the power generation companies.
CEGCO is the primary generation company in Jordan. The company was privatized in 2007 and
is currently 51 percent privately-owned. It has 1747 MW of generating capacity, which
accounted for almost 80 percent of the country’s total in 2006. Jordan has a second private power
generation company, AES PCS Jordan, and a state-owned generation company known as Samra.
Jordan has three private distribution companies including JEPCO, EDCO and IDECO. As a
result, the public sector is mainly responsible for generation and distribution while the public
sector is responsible for transmission and dispatch, with some limited involvement in generation.

62
Figure 4. 1: Organization of Jordan’s Electricity Sector
A World Bank report13
indicates that a residential customer in Jordan consuming 700 kWh per
month pays only about 50 percent of a benchmark tariff based on an average of the tariffs of
France, Greece, Italy, Portugal, Spain, and Turkey. Jordan’s retail tariff for its industrial
customers is likewise well below the benchmark. However, Jordan’s retail electricity prices
reflect the cost of electricity supply in the country. Jordan has done an excellent job of expanding
its electricity supply, relying on low-cost gas imports and on reserve sharing arrangements with
Egypt and Syria over its interconnections. Cost-reflective tariffs have enabled Jordan to launch a
successful IPP program aided by the elimination of all primary fuel subsidies in 2008.
4.3. Electricity Demand and Supply
4.3.1 Demand
Growth has been strong in recent years (table 4.1), exceeding 9 percent annually from 2000–07.
13
See February 2009 World Bank report entitled Tapping a Hidden Resource – Energy Efficiency on the Middle
East and North Africa.

63
Table 4. 1 Historical Demand
Year 1990 2000 2008
Peak demand (MW) 624 1206 2260
Energy demand (GWh) 2807 5712 12,770
The domestic and industrial customer classes accounted for 34 percent and 31 percent,
respectively, of the total energy consumed in Jordan in 2005. The commercial sector and water
pumping each accounted for 15 percent of total consumption, while street lighting and “other”
customers accounted for the remaining 5 percent. Consumption broken down by consumer group
is shown in figure 4.2.
Figure 4. 2: Breakdown of Jordan’s Electrical Energy Consumption by Class
Source: NEPCO.
Table 4.2 shows that growth in demand is expected to remain strong, growing at 6 percent
annually to 4547 MW and 25,700 GWh by 2020––more than double 2008 demand. By 2030,
demand is forecast to increase another 34 percent over the levels forecast for 2020.
Table 4. 2 NEPCO’s Demand Forecast
Year 2008 2010 2020 2030
Peak demand (MW) 2260 2539 4547 6110
Energy Demand (GWh) 12,770 14,348 25,695 34,532
Domestic34%
Industrial31%
Commercial15%
Water Pumping15%
Other5%
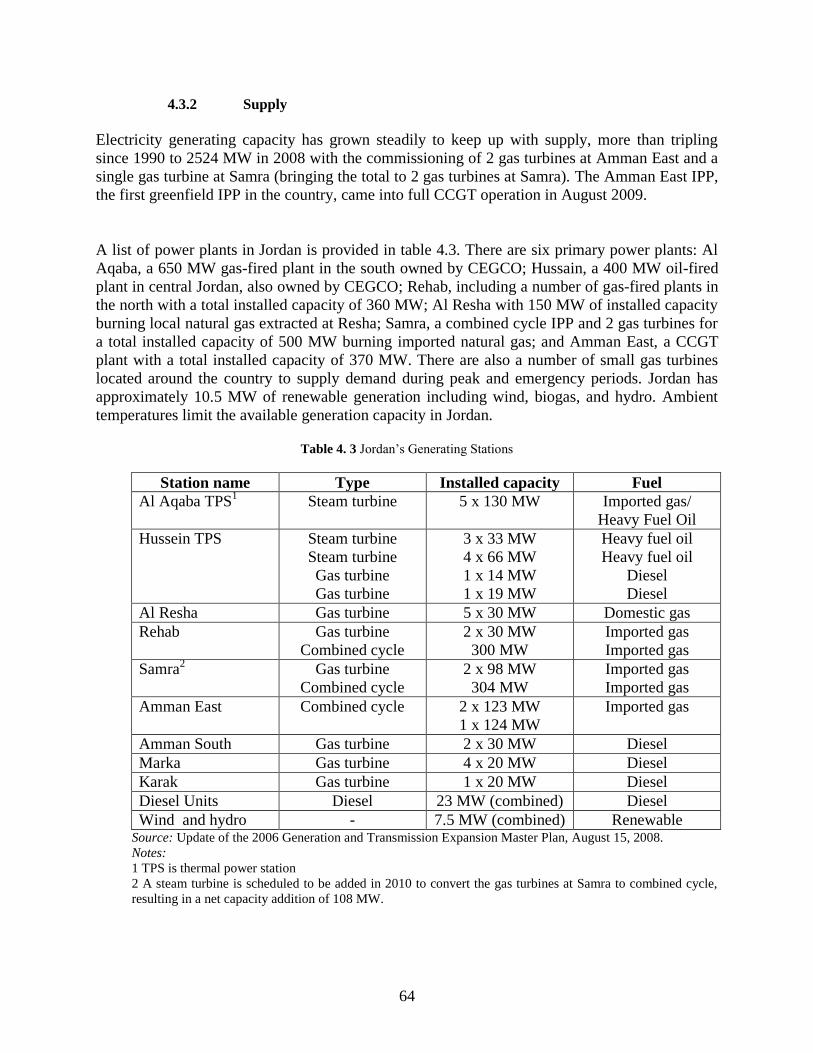
64
4.3.2 Supply
Electricity generating capacity has grown steadily to keep up with supply, more than tripling
since 1990 to 2524 MW in 2008 with the commissioning of 2 gas turbines at Amman East and a
single gas turbine at Samra (bringing the total to 2 gas turbines at Samra). The Amman East IPP,
the first greenfield IPP in the country, came into full CCGT operation in August 2009.
A list of power plants in Jordan is provided in table 4.3. There are six primary power plants: Al
Aqaba, a 650 MW gas-fired plant in the south owned by CEGCO; Hussain, a 400 MW oil-fired
plant in central Jordan, also owned by CEGCO; Rehab, including a number of gas-fired plants in
the north with a total installed capacity of 360 MW; Al Resha with 150 MW of installed capacity
burning local natural gas extracted at Resha; Samra, a combined cycle IPP and 2 gas turbines for
a total installed capacity of 500 MW burning imported natural gas; and Amman East, a CCGT
plant with a total installed capacity of 370 MW. There are also a number of small gas turbines
located around the country to supply demand during peak and emergency periods. Jordan has
approximately 10.5 MW of renewable generation including wind, biogas, and hydro. Ambient
temperatures limit the available generation capacity in Jordan.
Table 4. 3 Jordan’s Generating Stations
Station name Type Installed capacity Fuel
Al Aqaba TPS1 Steam turbine 5 x 130 MW Imported gas/
Heavy Fuel Oil
Hussein TPS Steam turbine
Steam turbine
Gas turbine
Gas turbine
3 x 33 MW
4 x 66 MW
1 x 14 MW
1 x 19 MW
Heavy fuel oil
Heavy fuel oil
Diesel
Diesel
Al Resha Gas turbine 5 x 30 MW Domestic gas
Rehab Gas turbine
Combined cycle
2 x 30 MW
300 MW
Imported gas
Imported gas
Samra2 Gas turbine
Combined cycle
2 x 98 MW
304 MW
Imported gas
Imported gas
Amman East Combined cycle 2 x 123 MW
1 x 124 MW
Imported gas
Amman South Gas turbine 2 x 30 MW Diesel
Marka Gas turbine 4 x 20 MW Diesel
Karak Gas turbine 1 x 20 MW Diesel
Diesel Units Diesel 23 MW (combined) Diesel
Wind and hydro - 7.5 MW (combined) Renewable Source: Update of the 2006 Generation and Transmission Expansion Master Plan, August 15, 2008.
Notes:
1 TPS is thermal power station
2 A steam turbine is scheduled to be added in 2010 to convert the gas turbines at Samra to combined cycle,
resulting in a net capacity addition of 108 MW.

65
The transmission network includes 2200 km of 132 kV circuits that traverse mainly from the
north to south of the country. The transmission system is radial without looping, except around
Amman. There are also 809 km of 400 kV transmission running through the country from the
south near Egypt through the north into Syria (figure 4-3).
The Jordanian grid is connected to Egypt through a 14 km, 400 kV submarine cable across the
Gulf of Aqaba. In the north, Jordan is connected to Syria through a 160 km, 400 kV single circuit
Figure 4. 3: Map of Jordan’s Power System
Source: MEMR
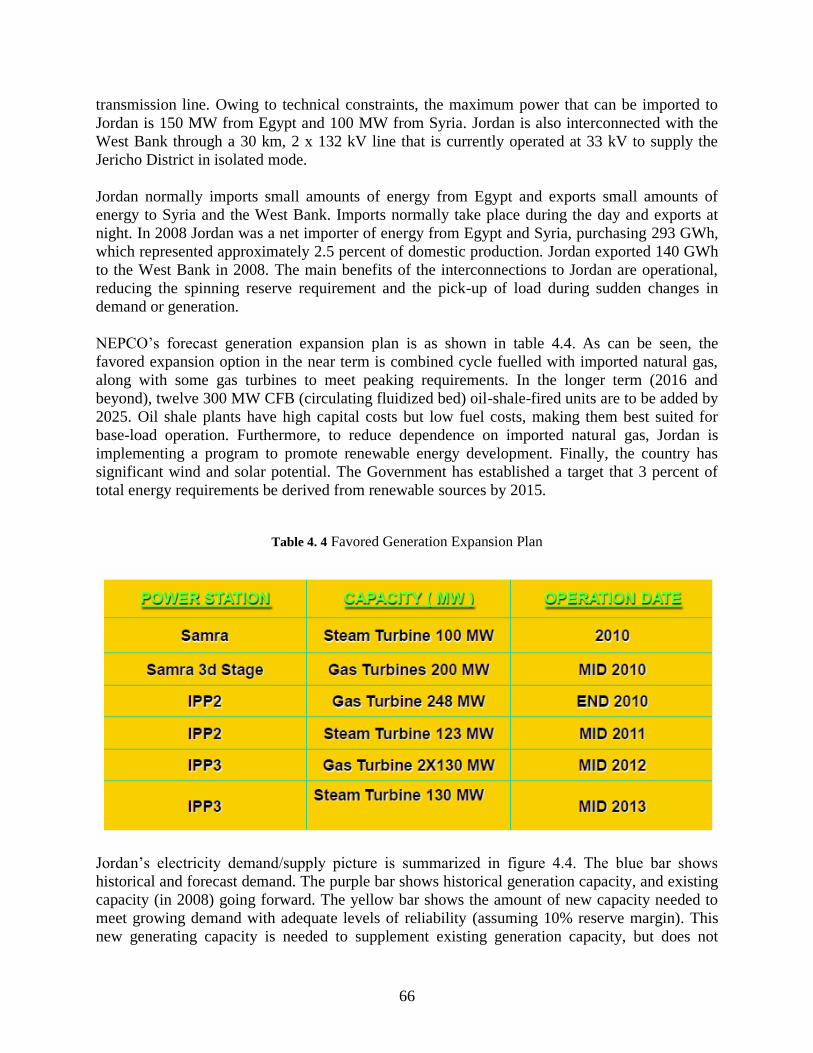
66
transmission line. Owing to technical constraints, the maximum power that can be imported to
Jordan is 150 MW from Egypt and 100 MW from Syria. Jordan is also interconnected with the
West Bank through a 30 km, 2 x 132 kV line that is currently operated at 33 kV to supply the
Jericho District in isolated mode.
Jordan normally imports small amounts of energy from Egypt and exports small amounts of
energy to Syria and the West Bank. Imports normally take place during the day and exports at
night. In 2008 Jordan was a net importer of energy from Egypt and Syria, purchasing 293 GWh,
which represented approximately 2.5 percent of domestic production. Jordan exported 140 GWh
to the West Bank in 2008. The main benefits of the interconnections to Jordan are operational,
reducing the spinning reserve requirement and the pick-up of load during sudden changes in
demand or generation.
NEPCO’s forecast generation expansion plan is as shown in table 4.4. As can be seen, the
favored expansion option in the near term is combined cycle fuelled with imported natural gas,
along with some gas turbines to meet peaking requirements. In the longer term (2016 and
beyond), twelve 300 MW CFB (circulating fluidized bed) oil-shale-fired units are to be added by
2025. Oil shale plants have high capital costs but low fuel costs, making them best suited for
base-load operation. Furthermore, to reduce dependence on imported natural gas, Jordan is
implementing a program to promote renewable energy development. Finally, the country has
significant wind and solar potential. The Government has established a target that 3 percent of
total energy requirements be derived from renewable sources by 2015.
Table 4. 4 Favored Generation Expansion Plan
Jordan’s electricity demand/supply picture is summarized in figure 4.4. The blue bar shows
historical and forecast demand. The purple bar shows historical generation capacity, and existing
capacity (in 2008) going forward. The yellow bar shows the amount of new capacity needed to
meet growing demand with adequate levels of reliability (assuming 10% reserve margin). This
new generating capacity is needed to supplement existing generation capacity, but does not
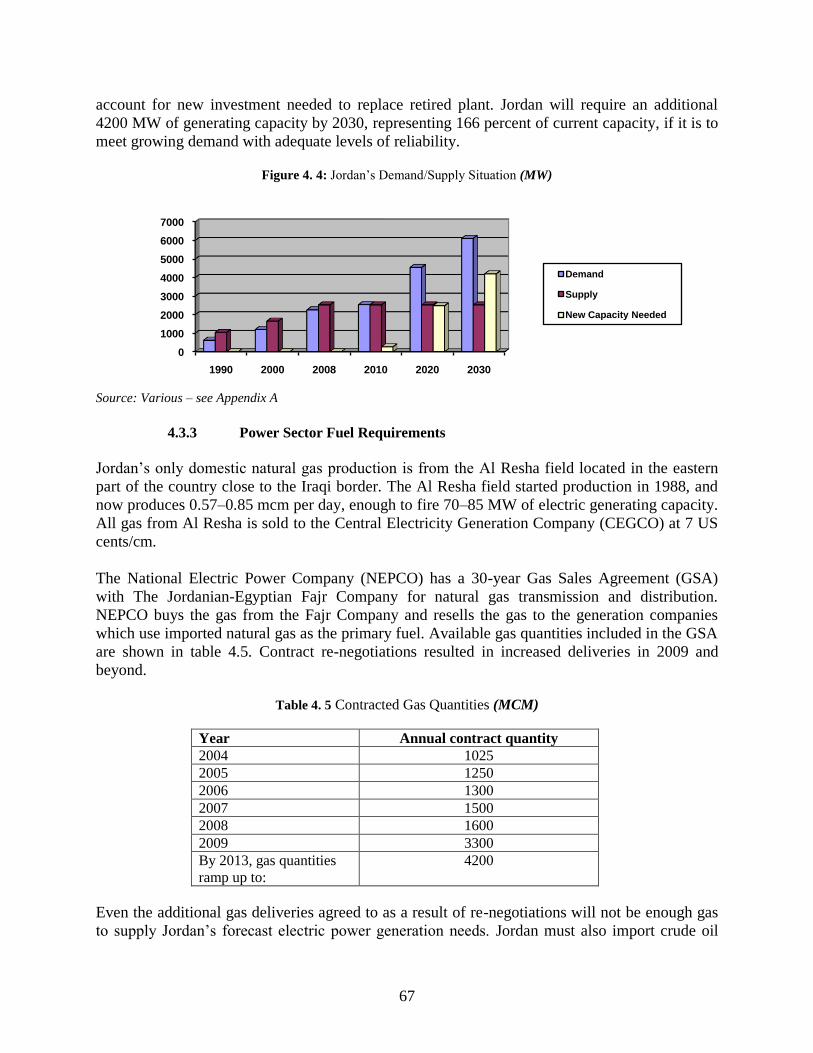
67
account for new investment needed to replace retired plant. Jordan will require an additional
4200 MW of generating capacity by 2030, representing 166 percent of current capacity, if it is to
meet growing demand with adequate levels of reliability.
Figure 4. 4: Jordan’s Demand/Supply Situation (MW)
Source: Various – see Appendix A
4.3.3 Power Sector Fuel Requirements
Jordan’s only domestic natural gas production is from the Al Resha field located in the eastern
part of the country close to the Iraqi border. The Al Resha field started production in 1988, and
now produces 0.57–0.85 mcm per day, enough to fire 70–85 MW of electric generating capacity.
All gas from Al Resha is sold to the Central Electricity Generation Company (CEGCO) at 7 US
cents/cm.
The National Electric Power Company (NEPCO) has a 30-year Gas Sales Agreement (GSA)
with The Jordanian-Egyptian Fajr Company for natural gas transmission and distribution.
NEPCO buys the gas from the Fajr Company and resells the gas to the generation companies
which use imported natural gas as the primary fuel. Available gas quantities included in the GSA
are shown in table 4.5. Contract re-negotiations resulted in increased deliveries in 2009 and
beyond.
Table 4. 5 Contracted Gas Quantities (MCM)
Year Annual contract quantity
2004 1025
2005 1250
2006 1300
2007 1500
2008 1600
2009 3300
By 2013, gas quantities
ramp up to:
4200
Even the additional gas deliveries agreed to as a result of re-negotiations will not be enough gas
to supply Jordan’s forecast electric power generation needs. Jordan must also import crude oil
0
1000
2000
3000
4000
5000
6000
7000
1990 2000 2008 2010 2020 2030
Demand
Supply
New Capacity Needed
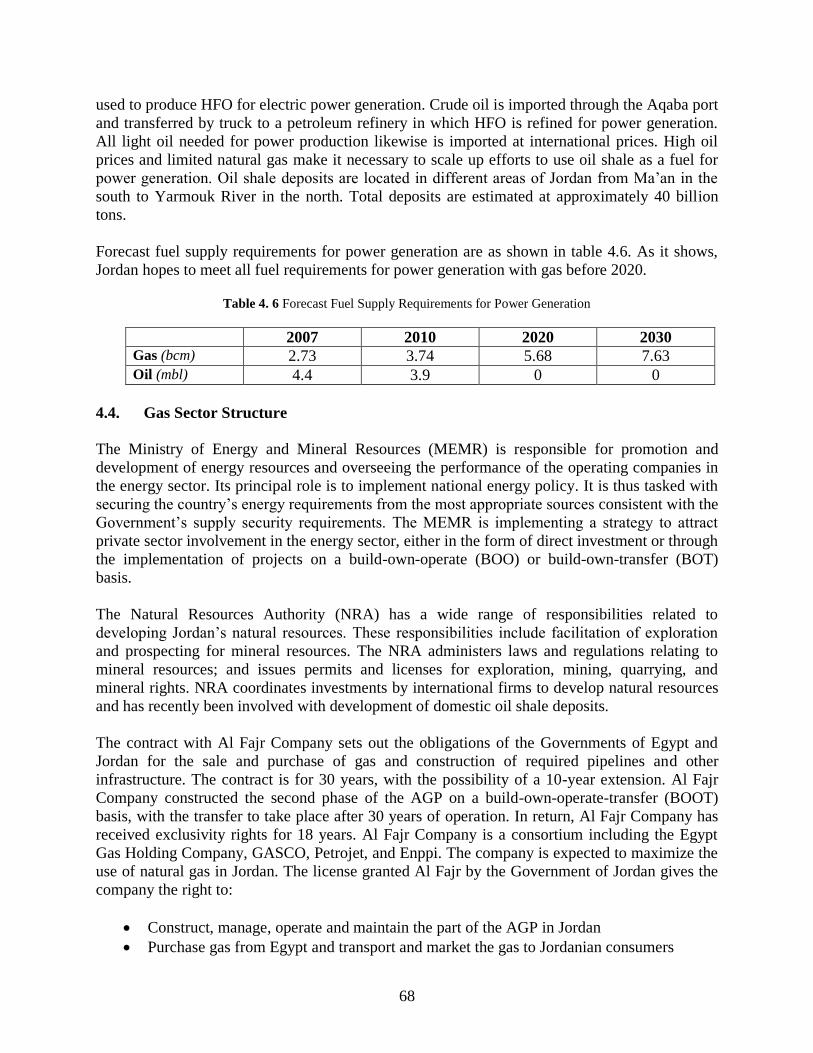
68
used to produce HFO for electric power generation. Crude oil is imported through the Aqaba port
and transferred by truck to a petroleum refinery in which HFO is refined for power generation.
All light oil needed for power production likewise is imported at international prices. High oil
prices and limited natural gas make it necessary to scale up efforts to use oil shale as a fuel for
power generation. Oil shale deposits are located in different areas of Jordan from Ma’an in the
south to Yarmouk River in the north. Total deposits are estimated at approximately 40 billion
tons.
Forecast fuel supply requirements for power generation are as shown in table 4.6. As it shows,
Jordan hopes to meet all fuel requirements for power generation with gas before 2020.
Table 4. 6 Forecast Fuel Supply Requirements for Power Generation
2007 2010 2020 2030 Gas (bcm) 2.73 3.74 5.68 7.63
Oil (mbl) 4.4 3.9 0 0
4.4. Gas Sector Structure
The Ministry of Energy and Mineral Resources (MEMR) is responsible for promotion and
development of energy resources and overseeing the performance of the operating companies in
the energy sector. Its principal role is to implement national energy policy. It is thus tasked with
securing the country’s energy requirements from the most appropriate sources consistent with the
Government’s supply security requirements. The MEMR is implementing a strategy to attract
private sector involvement in the energy sector, either in the form of direct investment or through
the implementation of projects on a build-own-operate (BOO) or build-own-transfer (BOT)
basis.
The Natural Resources Authority (NRA) has a wide range of responsibilities related to
developing Jordan’s natural resources. These responsibilities include facilitation of exploration
and prospecting for mineral resources. The NRA administers laws and regulations relating to
mineral resources; and issues permits and licenses for exploration, mining, quarrying, and
mineral rights. NRA coordinates investments by international firms to develop natural resources
and has recently been involved with development of domestic oil shale deposits.
The contract with Al Fajr Company sets out the obligations of the Governments of Egypt and
Jordan for the sale and purchase of gas and construction of required pipelines and other
infrastructure. The contract is for 30 years, with the possibility of a 10-year extension. Al Fajr
Company constructed the second phase of the AGP on a build-own-operate-transfer (BOOT)
basis, with the transfer to take place after 30 years of operation. In return, Al Fajr Company has
received exclusivity rights for 18 years. Al Fajr Company is a consortium including the Egypt
Gas Holding Company, GASCO, Petrojet, and Enppi. The company is expected to maximize the
use of natural gas in Jordan. The license granted Al Fajr by the Government of Jordan gives the
company the right to:
Construct, manage, operate and maintain the part of the AGP in Jordan
Purchase gas from Egypt and transport and market the gas to Jordanian consumers
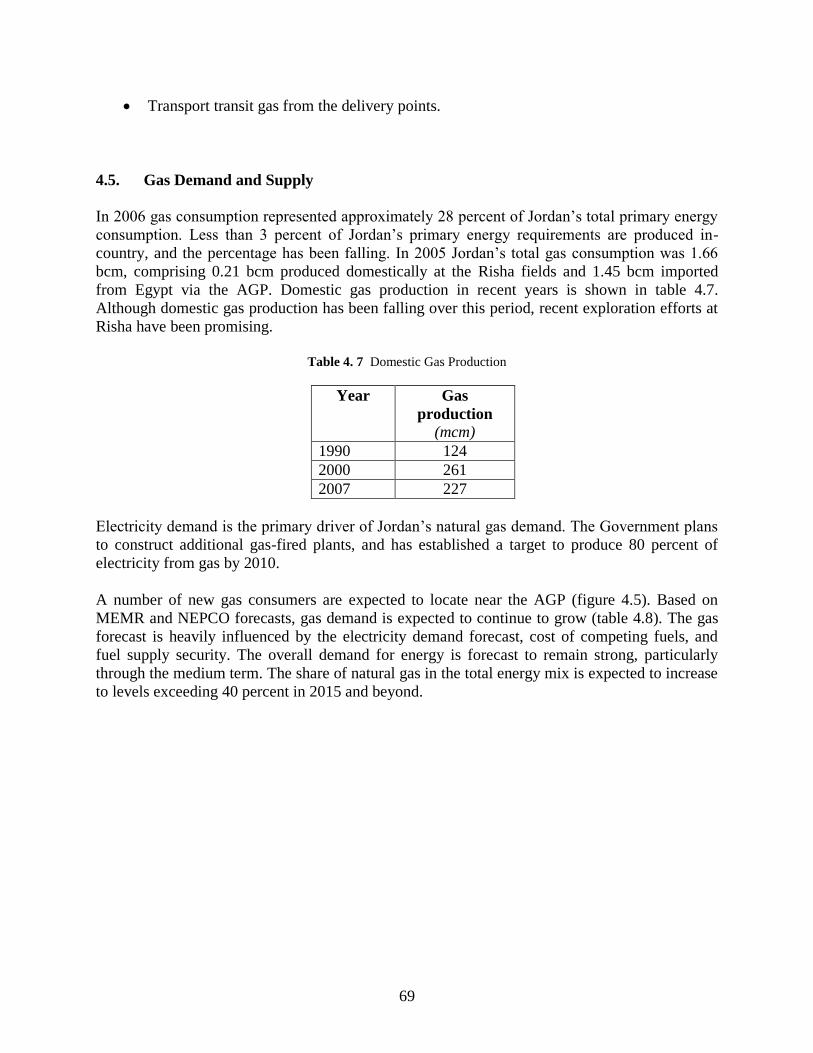
69
Transport transit gas from the delivery points.
4.5. Gas Demand and Supply
In 2006 gas consumption represented approximately 28 percent of Jordan’s total primary energy
consumption. Less than 3 percent of Jordan’s primary energy requirements are produced in-
country, and the percentage has been falling. In 2005 Jordan’s total gas consumption was 1.66
bcm, comprising 0.21 bcm produced domestically at the Risha fields and 1.45 bcm imported
from Egypt via the AGP. Domestic gas production in recent years is shown in table 4.7.
Although domestic gas production has been falling over this period, recent exploration efforts at
Risha have been promising.
Table 4. 7 Domestic Gas Production
Year Gas
production
(mcm)
1990 124
2000 261
2007 227
Electricity demand is the primary driver of Jordan’s natural gas demand. The Government plans
to construct additional gas-fired plants, and has established a target to produce 80 percent of
electricity from gas by 2010.
A number of new gas consumers are expected to locate near the AGP (figure 4.5). Based on
MEMR and NEPCO forecasts, gas demand is expected to continue to grow (table 4.8). The gas
forecast is heavily influenced by the electricity demand forecast, cost of competing fuels, and
fuel supply security. The overall demand for energy is forecast to remain strong, particularly
through the medium term. The share of natural gas in the total energy mix is expected to increase
to levels exceeding 40 percent in 2015 and beyond.
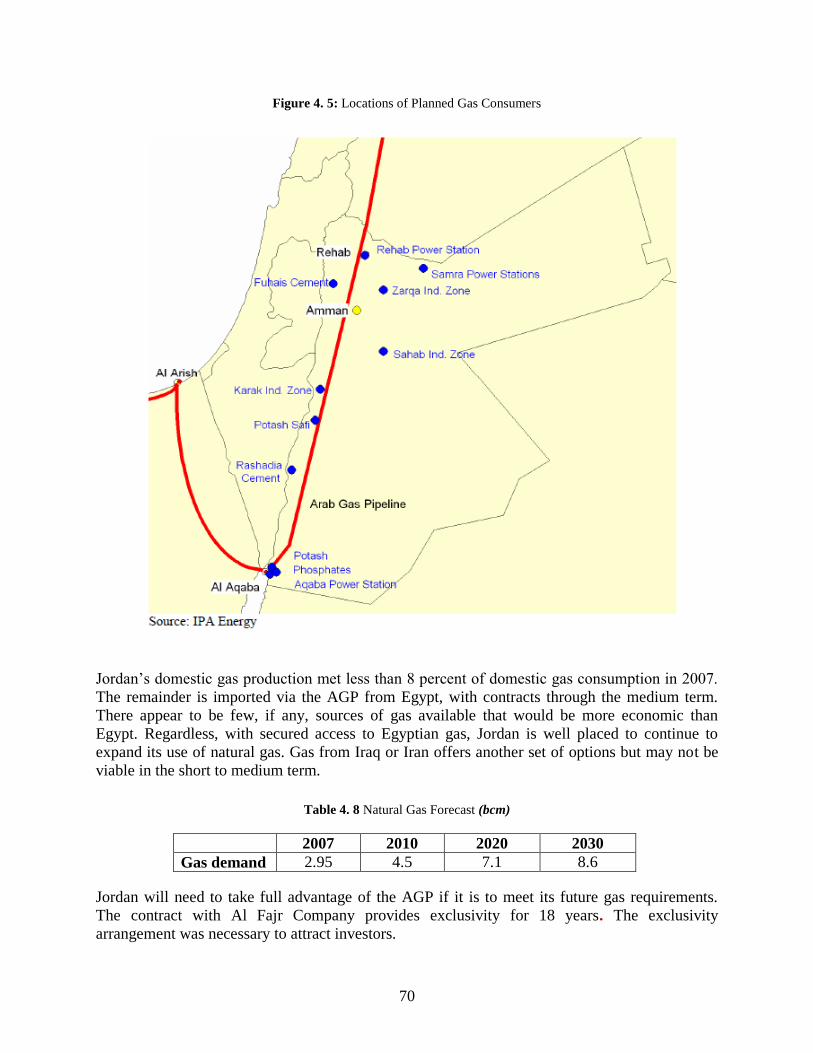
70
Figure 4. 5: Locations of Planned Gas Consumers
Jordan’s domestic gas production met less than 8 percent of domestic gas consumption in 2007.
The remainder is imported via the AGP from Egypt, with contracts through the medium term.
There appear to be few, if any, sources of gas available that would be more economic than
Egypt. Regardless, with secured access to Egyptian gas, Jordan is well placed to continue to
expand its use of natural gas. Gas from Iraq or Iran offers another set of options but may not be
viable in the short to medium term.
Table 4. 8 Natural Gas Forecast (bcm)
2007 2010 2020 2030
Gas demand 2.95 4.5 7.1 8.6
Jordan will need to take full advantage of the AGP if it is to meet its future gas requirements.
The contract with Al Fajr Company provides exclusivity for 18 years. The exclusivity
arrangement was necessary to attract investors.

71
The gas demand/supply balance is shown in figure 4.6. It shows that Jordan will remain a gas
importer with imports increasing from 3.3 bcm in 2009 to 8.3 bcm in 2030, representing a 150
percent increase in gas consumption.
Figure 4. 6: Gas Demand/Supply Balance (bcm)
Source: Various – see Appendix A.
0
1
2
3
4
5
6
7
8
9
1990 2000 2009 2010 2020 2030
Production
Demand
Import

72
Chapter 5. SYRIA PROSPECTS FOR ENERGY INTEGRATION
5.1. Overview
Syria’s power sector had been relatively stable until recent years when a number of challenges
arose as a result of rapidly growing electricity demand. High levels of demand growth have
eroded capacity reserve margins leading to frequent load shedding, negatively impacting Syria’s
economy. The financial performance of the electricity sector is deteriorating owing to high
technical and non-technical losses and inadequate tariffs. Supply reliability is further hampered
by generation fuel security issues owing to inadequate supplies of domestic gas. The power
sector requires large Government subsidies. While new electricity generation being brought on
will help to alleviate supply shortfalls, increasing electricity demand and plant retirements will
continue to put pressure on Syria’s electricity infrastructure. Syria is seeking private sector
investment in the power sector, but it will be difficult to attract such investment on a sustainable
basis without significant changes in energy policy.
Electricity generation is expected to consume the majority of Syria’s natural gas. Syria’s proven
reserves of natural gas could be sufficient to meet a significant portion of domestic needs over
the medium term, but inadequate investment to bring new gas reserves into production has lead
to greater reliance on other fuels and natural gas imports for electricity generation. Syria has
recently started importing gas from Egypt over the AGP, and is giving high priority to the
completion of the AGP link to Turkey to gain access to gas purchases from Turkey, Iran and
possibly Iraq. If successful, gas could become dominant in the electricity generation mix.
If Syria is to return the electricity sector to financial self-sufficiency while protecting the socially
disadvantaged it will need to make significant changes in policy such as industry restructuring,
regulation, and retail tariff increases. On the positive side, with improved energy policy, its
domestic natural gas resources, and its electricity and gas interconnections, Syria is well
positioned to benefit from the integrated regional market. The AGP runs through Syria, and Syria
has electricity interconnections with Iraq, Jordan, Lebanon, and Turkey, so Syria is well-
positioned as an energy transit country.
5.2. Power Sector Structures
Syria’s electricity sector is managed and regulated by the Ministry of Electricity. The Public
Establishment for Electricity Generation and Transmission (PEEGT) plans, develops, operates,
and maintains the generation and transmission components of the electricity sector.14
Similarly,
the Public Establishment for Distribution and Exploitation of Electric Energy (PEDEEE) and its
14 regional subsidiaries are responsible for the power distribution network.15
Figure 5.1 shows
the organization of Syria’s electricity sector.
14
PEEGT was created in 1994 by Legislation Decree 14. 15
PEDEE and its 14 establishments were created by Legislation Decrees 13 and 14.

73
Figure 5. 1: Organization of Syria’s Electricity Sector
The Ministry of Electricity is responsible for both policy and regulation. Regulatory decisions
have not been made in the best interest of the electricity sector as a whole and free of
Government influence as witnessed by the need for large Government subsidies. Although
distribution is separate from the generation and transmission components, the electricity sector
operates as a vertically integrated, monopolistic structure without competition.
In the summer of 2007, Damascus experienced daily power interruptions lasting as long as five
hours. The competitiveness of Syria’s industry is being hampered as a result of electricity supply
shortages, which numbered 43 days of power outages in 2005. This number compares to 18 days
in Egypt and 1 day in Malaysia in the same year. Poor reliability forces Syrian manufacturing
firms to install and operate their own high-cost generating equipment that decreases their
competitiveness.
Addressing electricity supply shortages is a top priority of Syria’s Government. However,
Syria’s retail electricity prices are far below the levels necessary to recover the economic cost of
supply. A report by the World Bank16
shows that Syria’s retail electricity prices for a residential
customer consuming 700 kWh per month are only 10 percent of a benchmark tariff based on an
average of the tariffs of France, Greece, Italy, Portugal, Spain, and Turkey. Syria’s tariffs are
even far below the average tariff paid by other countries in the Middle East and Africa (MENA).
Syria’s tariff for a residential customer consuming 700 kWh per month is only 24 percent of the
MENA average, and its retail tariff for industrial customers, although comparable to the MENA
average, is likewise far below the European benchmark.
5.3. Electricity Demand and Supply
5.3.1 Demand
Electricity demand has grown substantially in recent years, more than doubling between 1990
and 2008. In 2008 energy demand was over 40 TWh and peak demand was 6,715 MW. Growth
in electricity consumption has been 6.8 percent annually since 2000. Table 5.1 shows growth in
electricity demand in recent years.
16
See February 2009 World Bank report entitled Tapping a Hidden Resource – Energy Efficiency in the Middle East
and North Africa.
Ministry of Electricity
PEEGT PEDEENational Energy
Research Center
Electromechanical
Intermediate Institutes
Public Establishment for
Communication
Ministry of Electricity
PEEGT PEDEENational Energy
Research Center
Electromechanical
Intermediate Institutes
Public Establishment for
Communication

74
Table 5. 1 Historical Demand, 1990–2008
Year 1990 2000 2008
Peak demand (MW) 3258 5990 6715
Energy demand (GWh) 8310 23,870 40,273
Electricity demand grew rapidly after 2001 owing to an acceleration of the country’s
industrialization and growth in the commercial and service sectors. The residential sector has
experienced increased penetration of appliances and air conditioning as the economy modernizes
and the standard of living improves. In recent years, domestic consumption has been growing at
approximately 7.5 percent annually. Residential and industrial consumption now account for 45
percent and 37 percent, respectively, of total electricity consumption in the country. The
commercial sector accounts for approximately 9 percent. A breakdown of customer class
demand is shown in figure 5.2.
Figure 5. 2: Demand Breakdown by Customer Class, 2007
Source: .August 15, 2009 Syrian Arab Republic Electricity Sector Strategy Note, ESMAP, The World Bank.
Technical losses represent approximately 15 percent of the total demand, high by international
levels, which typically are 10 percent. Total nontechnical losses also are high. They accounted
for 10 percent of the total demand in 2007, far exceeding the 1 percent–2 percent levels accepted
by commercially operated power utilities.
Table 5.2 provides a forecast of peak and energy demand from 2008 through 2030. Electricity
demand is forecast to grow over 2008–30 at almost 3.7 percent annually. The slowdown in
demand growth from historical levels is due to the expected modernization of the Syrian
economy, a shift toward less energy-intensive activities, and loss reduction and energy efficiency
initiatives. The Government of Syria recently established the National Energy Research Center
(NERC) to be responsible for formulating; proposing; and coordinating policies, plans, and
programs in renewable energy and energy efficiency. Based on NERC’s estimates of the
45%
9%3%
4%
2%0%
37%Residential
Commercial
Street lighting
Government
Religion
Power sector
Industry
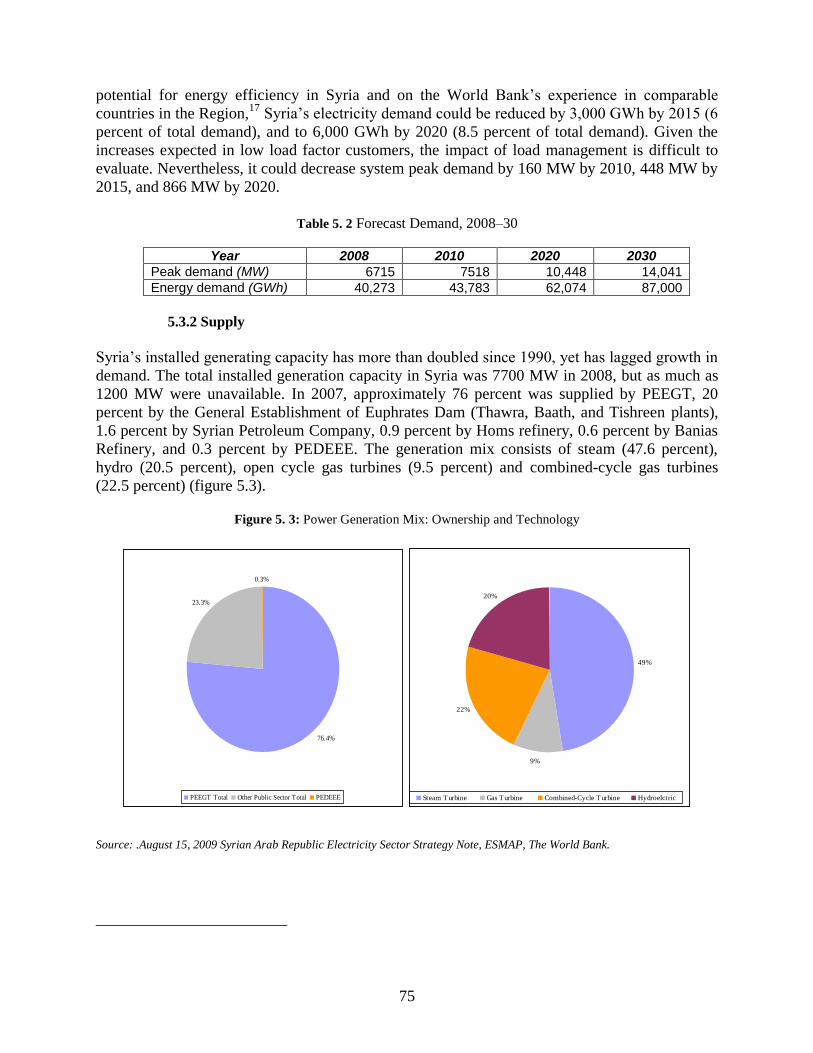
75
potential for energy efficiency in Syria and on the World Bank’s experience in comparable
countries in the Region,17
Syria’s electricity demand could be reduced by 3,000 GWh by 2015 (6
percent of total demand), and to 6,000 GWh by 2020 (8.5 percent of total demand). Given the
increases expected in low load factor customers, the impact of load management is difficult to
evaluate. Nevertheless, it could decrease system peak demand by 160 MW by 2010, 448 MW by
2015, and 866 MW by 2020.
Table 5. 2 Forecast Demand, 2008–30
Year 2008 2010 2020 2030
Peak demand (MW) 6715 7518 10,448 14,041
Energy demand (GWh) 40,273 43,783 62,074 87,000
5.3.2 Supply
Syria’s installed generating capacity has more than doubled since 1990, yet has lagged growth in
demand. The total installed generation capacity in Syria was 7700 MW in 2008, but as much as
1200 MW were unavailable. In 2007, approximately 76 percent was supplied by PEEGT, 20
percent by the General Establishment of Euphrates Dam (Thawra, Baath, and Tishreen plants),
1.6 percent by Syrian Petroleum Company, 0.9 percent by Homs refinery, 0.6 percent by Banias
Refinery, and 0.3 percent by PEDEEE. The generation mix consists of steam (47.6 percent),
hydro (20.5 percent), open cycle gas turbines (9.5 percent) and combined-cycle gas turbines
(22.5 percent) (figure 5.3).
Figure 5. 3: Power Generation Mix: Ownership and Technology
Source: .August 15, 2009 Syrian Arab Republic Electricity Sector Strategy Note, ESMAP, The World Bank.
76.4%
23.3%
0.3%
PEEGT Total Other Public Sector Total PEDEEE
49%
9%
22%
20%
Steam Turbine Gas Turbine Combined-Cycle Turbine Hydroelctric

76
A list of Syria’s power plants is provided in table 5.3. Steam power plants are used as base load,
and gas turbines for peaking. However, the generation deficit has resulted in greater reliance on
gas turbines to meet base load requirements.

77
Table 5. 3 Syria’s Power Generation Plants
Plant Organization Type No. of
units
Capacity (MW)
Unit Installed Available
Banias TPP
PEEGT
Gas turbine 1 30.0 30 0
Steam turbine 4 170.0 680 340
Mehardeh TPP Gas turbine 1 30.0 30 0
Steam turbine 2 165.0 330 290
2 150.0 300 240
Tishreen TPP Gas turbine 2 112.5 225 200
Steam turbine 2 200.0 400 400
Nassrieh CCPP Gas turbine 3 112.5 337.5 330
Steam turbine 1 150.0 150 150
Jandar CCPP Gas turbine 4 118.5 474 440
Steam turbine 2 114.0 228 200
Zayzoon CCPP Gas turbine 3 112.5 337.5 330
Steam turbine 1 150.0 150 150
Aleppo TPP (Halab) Gas turbine 1 30.0 30 0
Steam turbine 5 213.0 1065 1,065
Tayyem GTPP Gas turbine 3 34.0 102 68
Swedieh GTPP Gas turbine 5 34.0 170 136
Alzara TPP Steam turbine 3 220.0 660 660
Syrian Petroleum
Company
Other public
sector
Gas turbine 6 20.0 120 60
Homs Refinery Steam turbine 2 32.0 64 40
Banias Refinery Steam turbine 4 12.0 48 0
Thawra Dam Hydro 8 100.0 800 650
Baath Dam Hydro 3 25.0 75 51
Tishreen Dam Hydro 6 105.0 630 450
PEDEEE PEDEEE Hydro 2 8.0 16 0
1 7.0 7 0
System total 7,459 6,250
PEEGT total 5,699 4,999
Other public sector
total
1,737 1,251
PEDEEE 23 0
Steam turbine total 3,547 3,035
Gas turbine total 707 464
Combined-cycle
turbine total
1677 1600
Hydro turbine total 1,528 1,151
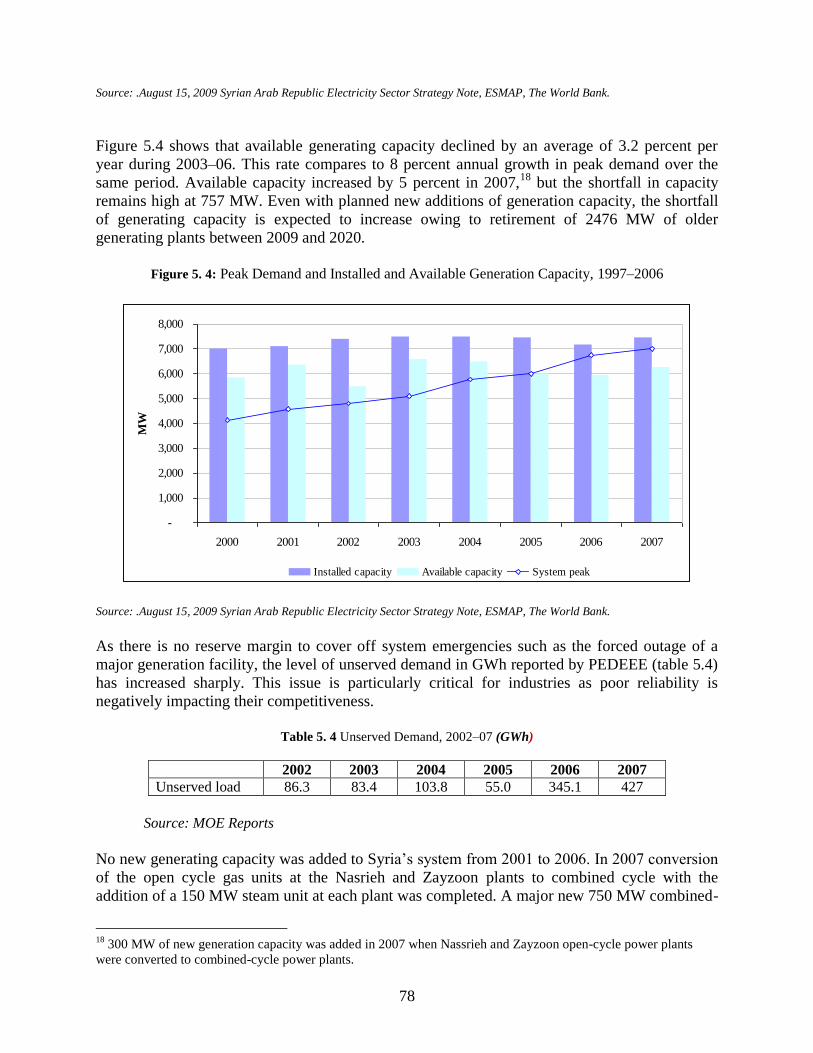
78
Source: .August 15, 2009 Syrian Arab Republic Electricity Sector Strategy Note, ESMAP, The World Bank.
Figure 5.4 shows that available generating capacity declined by an average of 3.2 percent per
year during 2003–06. This rate compares to 8 percent annual growth in peak demand over the
same period. Available capacity increased by 5 percent in 2007,18
but the shortfall in capacity
remains high at 757 MW. Even with planned new additions of generation capacity, the shortfall
of generating capacity is expected to increase owing to retirement of 2476 MW of older
generating plants between 2009 and 2020.
Figure 5. 4: Peak Demand and Installed and Available Generation Capacity, 1997–2006
Source: .August 15, 2009 Syrian Arab Republic Electricity Sector Strategy Note, ESMAP, The World Bank.
As there is no reserve margin to cover off system emergencies such as the forced outage of a
major generation facility, the level of unserved demand in GWh reported by PEDEEE (table 5.4)
has increased sharply. This issue is particularly critical for industries as poor reliability is
negatively impacting their competitiveness.
Table 5. 4 Unserved Demand, 2002–07 (GWh)
2002 2003 2004 2005 2006 2007
Unserved load 86.3 83.4 103.8 55.0 345.1 427
Source: MOE Reports
No new generating capacity was added to Syria’s system from 2001 to 2006. In 2007 conversion
of the open cycle gas units at the Nasrieh and Zayzoon plants to combined cycle with the
addition of a 150 MW steam unit at each plant was completed. A major new 750 MW combined-
18
300 MW of new generation capacity was added in 2007 when Nassrieh and Zayzoon open-cycle power plants
were converted to combined-cycle power plants.
-
1,000
2,000
3,000
4,000
5,000
6,000
7,000
8,000
2000 2001 2002 2003 2004 2005 2006 2007
MW
Installed capacity Available capacity System peak

79
cycle power plant at Deir Ali using natural gas as its main fuel became fully operational in 2009.
Expansion of the Tashreen power plant by 450 MW and the Banias power plant by 300 MW are
expected to be completed in 2010. The new additions are summarized in table 5.5.
Table 5. 5 New Generating Plant Additions
Power plant Type Capacity
(MW) Status Full operation yr
(est.)
Tishreen
extension
Combined cycle 450 Under
construction
2010
Banias extension Steam 300 Under
construction
2010
The transmission system is planned, operated, and maintained by PEEGT. The main
transmission network consists of 760 km of 230 kV and 5,080 km of 400kV lines and their
associated substations and transformers. The 400 kV south-north transmission interface connects
major generating power plants to the transmission grid while the load centers in the country’s
five regions are integrated and supplied by the major 230kV network. Internal constraints within
the 230 kV transmission network exist owing primarily to limited transformer capacity feeding
major load centers. PEEGT plans to expand the 400 kV transmission network to reinforce the
capacity of the national transmission network.
Syria is a member of the 8-member interconnection consortium that consists of the 400 kV and
500 kV power grid interconnections among the national power systems of Egypt, Iraq, Jordan,
Lebanon, Libya, Syria, Turkey, and the West Bank & Gaza (the West Bank & Gaza was
officially included in the project in 2008). The Syrian transmission system is strategically located
with 9 interconnections to the power systems of Iraq, Jordan, Lebanon, and Turkey at voltage
levels ranging from 66 kV to 400 KV (table 5.6).
Table 5. 6 Syria’s Electrical Interconnections with Neighboring Countries
Interconnection description Operational
year
Estimated
Thermal Limit
(MW)1
2006 use
(% thermal
capacity)
Syria-Lebanon, double-circuit, 66kV, 110MVA2 1972 94 1.5
Syria-Lebanon, single-circuit, 230kV, 267MVA 1977 227 3.6
Syria-Lebanon, single-circuit, 400kV, 1135MVA 2000 965 15.1
Syria-Lebanon, single-circuit, 400kV, 1135MVA April 2010 1000 N/A
Syria-Iraq, single-circuit, 230kV, 267MVA 2000 227 3.6
Syria-Jordan, single-circuit, 230kV, 55MVA 1977 47 0.7
Syria- Jordan, single-circuit, 230kV, 267MVA 1980 227 3.6
Syria-Jordan, single-circuit, 400kV, 1135MVA 2000 965 15.1
Syria-Turkey, single-circuit, 400kV, 1135MVA 2007 965 N/A Notes:
1 Assuming load factor of 0.85.
2. There is no source of the operational status to date for every interconnection. Therefore, imports and exports of energy
are an annual lump sum per country.
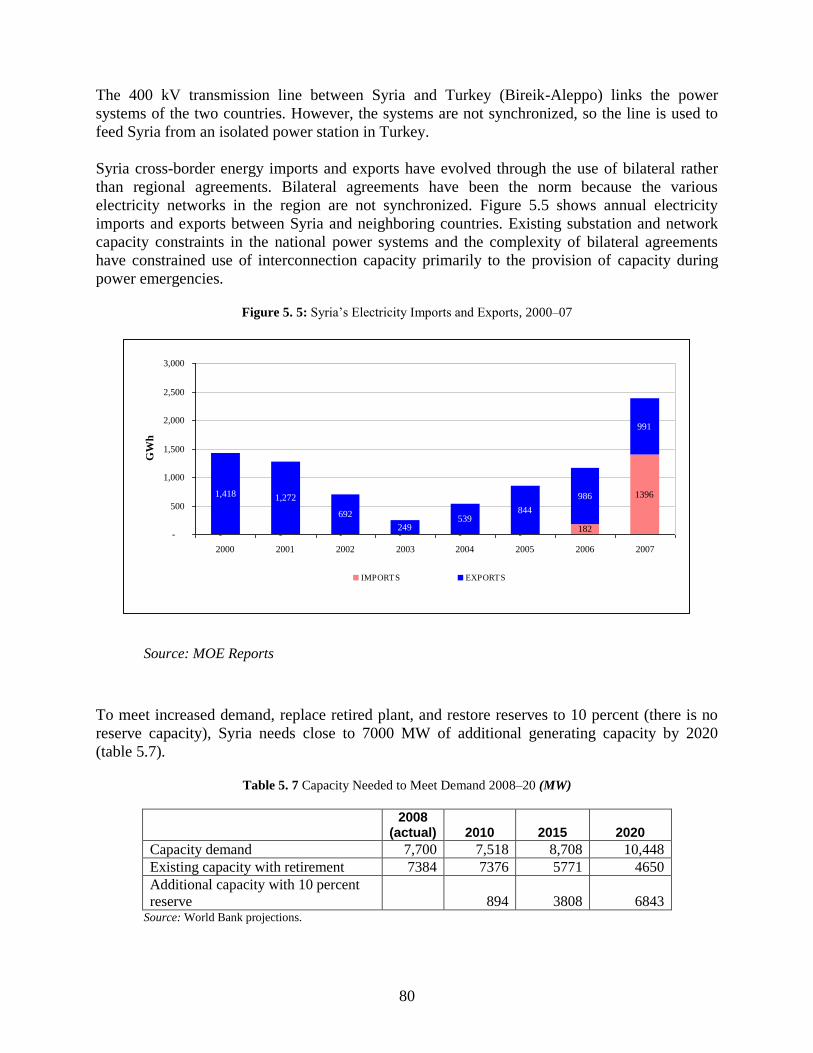
80
The 400 kV transmission line between Syria and Turkey (Bireik-Aleppo) links the power
systems of the two countries. However, the systems are not synchronized, so the line is used to
feed Syria from an isolated power station in Turkey.
Syria cross-border energy imports and exports have evolved through the use of bilateral rather
than regional agreements. Bilateral agreements have been the norm because the various
electricity networks in the region are not synchronized. Figure 5.5 shows annual electricity
imports and exports between Syria and neighboring countries. Existing substation and network
capacity constraints in the national power systems and the complexity of bilateral agreements
have constrained use of interconnection capacity primarily to the provision of capacity during
power emergencies.
Figure 5. 5: Syria’s Electricity Imports and Exports, 2000–07
Source: MOE Reports
To meet increased demand, replace retired plant, and restore reserves to 10 percent (there is no
reserve capacity), Syria needs close to 7000 MW of additional generating capacity by 2020
(table 5.7).
Table 5. 7 Capacity Needed to Meet Demand 2008–20 (MW)
2008
(actual) 2010 2015 2020
Capacity demand 7,700 7,518 8,708 10,448
Existing capacity with retirement 7384 7376 5771 4650
Additional capacity with 10 percent
reserve 894 3808 6843 Source: World Bank projections.
- - - - - -182
13961,418 1,272
692
249539
844
986
991
-
500
1,000
1,500
2,000
2,500
3,000
2000 2001 2002 2003 2004 2005 2006 2007
GW
h
IMPORTS EXPORTS
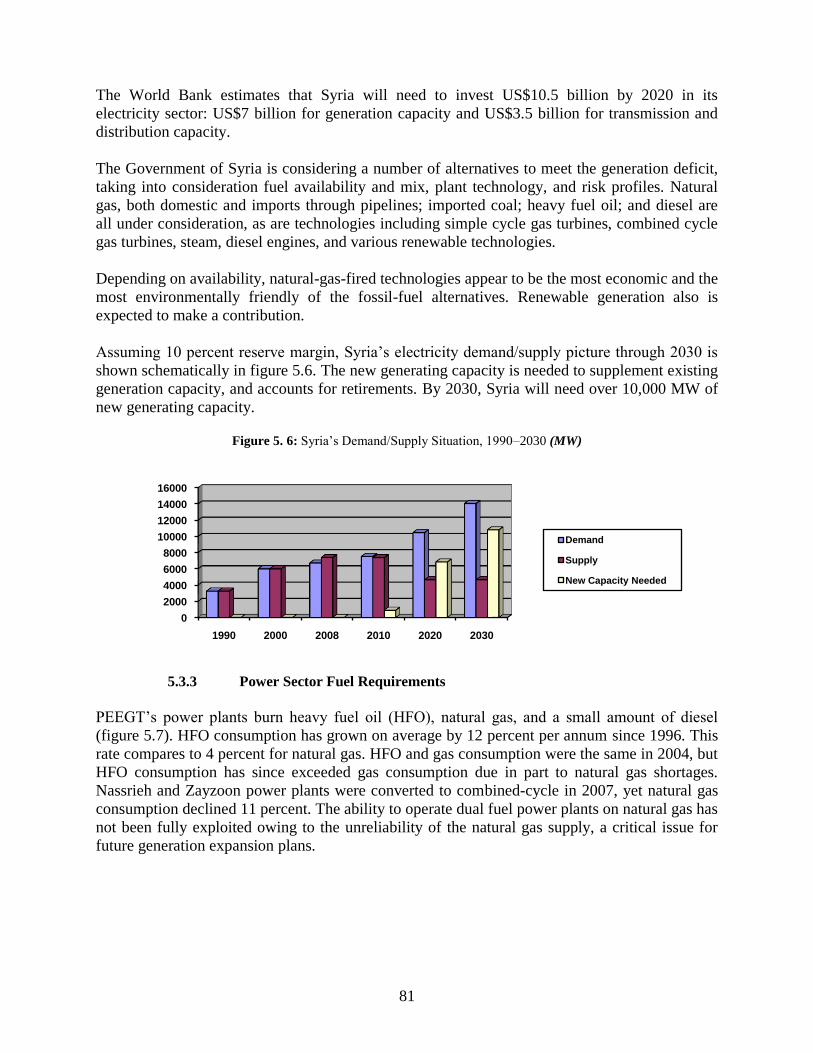
81
The World Bank estimates that Syria will need to invest US$10.5 billion by 2020 in its
electricity sector: US$7 billion for generation capacity and US$3.5 billion for transmission and
distribution capacity.
The Government of Syria is considering a number of alternatives to meet the generation deficit,
taking into consideration fuel availability and mix, plant technology, and risk profiles. Natural
gas, both domestic and imports through pipelines; imported coal; heavy fuel oil; and diesel are
all under consideration, as are technologies including simple cycle gas turbines, combined cycle
gas turbines, steam, diesel engines, and various renewable technologies.
Depending on availability, natural-gas-fired technologies appear to be the most economic and the
most environmentally friendly of the fossil-fuel alternatives. Renewable generation also is
expected to make a contribution.
Assuming 10 percent reserve margin, Syria’s electricity demand/supply picture through 2030 is
shown schematically in figure 5.6. The new generating capacity is needed to supplement existing
generation capacity, and accounts for retirements. By 2030, Syria will need over 10,000 MW of
new generating capacity.
Figure 5. 6: Syria’s Demand/Supply Situation, 1990–2030 (MW)
5.3.3 Power Sector Fuel Requirements
PEEGT’s power plants burn heavy fuel oil (HFO), natural gas, and a small amount of diesel
(figure 5.7). HFO consumption has grown on average by 12 percent per annum since 1996. This
rate compares to 4 percent for natural gas. HFO and gas consumption were the same in 2004, but
HFO consumption has since exceeded gas consumption due in part to natural gas shortages.
Nassrieh and Zayzoon power plants were converted to combined-cycle in 2007, yet natural gas
consumption declined 11 percent. The ability to operate dual fuel power plants on natural gas has
not been fully exploited owing to the unreliability of the natural gas supply, a critical issue for
future generation expansion plans.
0
2000
4000
6000
8000
10000
12000
14000
16000
1990 2000 2008 2010 2020 2030
Demand
Supply
New Capacity Needed
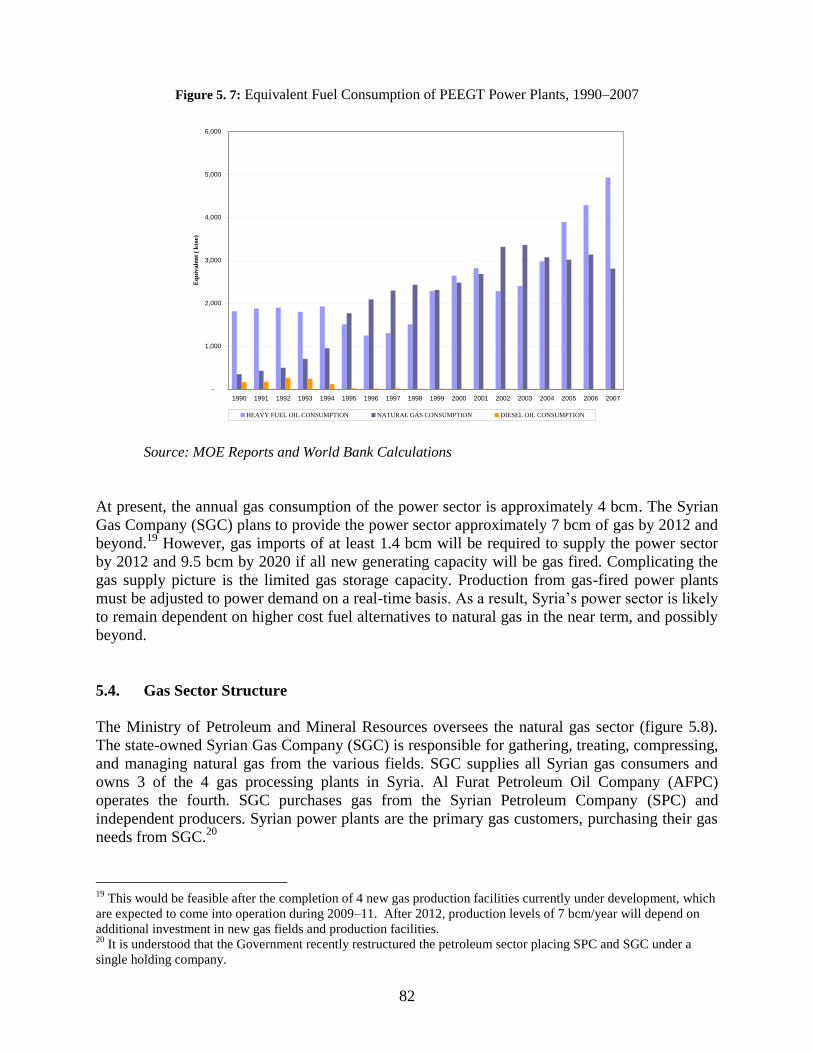
82
Figure 5. 7: Equivalent Fuel Consumption of PEEGT Power Plants, 1990–2007
Source: MOE Reports and World Bank Calculations
At present, the annual gas consumption of the power sector is approximately 4 bcm. The Syrian
Gas Company (SGC) plans to provide the power sector approximately 7 bcm of gas by 2012 and
beyond.19
However, gas imports of at least 1.4 bcm will be required to supply the power sector
by 2012 and 9.5 bcm by 2020 if all new generating capacity will be gas fired. Complicating the
gas supply picture is the limited gas storage capacity. Production from gas-fired power plants
must be adjusted to power demand on a real-time basis. As a result, Syria’s power sector is likely
to remain dependent on higher cost fuel alternatives to natural gas in the near term, and possibly
beyond.
5.4. Gas Sector Structure
The Ministry of Petroleum and Mineral Resources oversees the natural gas sector (figure 5.8).
The state-owned Syrian Gas Company (SGC) is responsible for gathering, treating, compressing,
and managing natural gas from the various fields. SGC supplies all Syrian gas consumers and
owns 3 of the 4 gas processing plants in Syria. Al Furat Petroleum Oil Company (AFPC)
operates the fourth. SGC purchases gas from the Syrian Petroleum Company (SPC) and
independent producers. Syrian power plants are the primary gas customers, purchasing their gas
needs from SGC.20
19
This would be feasible after the completion of 4 new gas production facilities currently under development, which
are expected to come into operation during 2009–11. After 2012, production levels of 7 bcm/year will depend on
additional investment in new gas fields and production facilities. 20
It is understood that the Government recently restructured the petroleum sector placing SPC and SGC under a
single holding company.
-
1,000
2,000
3,000
4,000
5,000
6,000
1990 1991 1992 1993 1994 1995 1996 1997 1998 1999 2000 2001 2002 2003 2004 2005 2006 2007
Eq
uiv
ale
nt
( k
toe)
HEAVY FUEL OIL CONSUMPTION NATURAL GAS CONSUMPTION DIESEL OIL CONSUMPTION

83
Figure 5. 8: Organization of Syrian Oil and Gas Sector
The Syrian Gas Distribution Company (SGDC) distributes liquid petroleum gas (LPG) to
industry and households. LPG is supplied in bottles to domestic consumers and small businesses
and delivered by private contractors. There is no natural gas distribution network in Syria.
5.5. Gas Demand and Supply
5.5.1. Gas Demand
Gas to fuel electricity-generating stations is the most significant component of gas demand, and
accounted for 99 percent of gas demand in 2007. Industrial demand makes up the remaining
component of gas demand. It comprises two refining facilities, a cement plant, and a fertilizer
plant at Homs. There is no domestic gas distribution network to supply residential and
commercial customers.
SGC gas sales in recent years to the power stations and industrial customers are shown in table
5.8. Gas consumption, although steady, has been constrained by the availability of gas supply.
Table 5. 8 Gas Demand in Syria, 2003–06
Mmcm 2003 2004 2005 2006 H1
Mahardeh PS 45 12 3 0.2
Tayyem PS 134 184 173 88
Tishreen PS 435 367 450 238
Jandar PS 1012 979 1049 496
Nasriah PS 416 429 522 211
Zaizoun PS 431 460 589 262
Zara PS 489 343 100 103
Aleppo PS 543 336 201 204
Swediah PS 0 358 372 187
Total PS 3505 3468 3459 1789
Urea Plant 326 308 289 208
Adra Cement 86 83 88 41
Total 412 391 377 249
Homs Refinery 240 244 229 112
T-3 Station 37 22 22 11

84
SPC 21
0 259 258 120
Total 278 526 509 243
Going forward, Syria has plans to develop three industrial cities at Homs, Adra, and Aleppo.
There are no plans to develop a local natural gas distribution network that would supply
residential and commercial customers. It is assumed that, in the long term, 75 percent of
electricity generation will be fueled by natural gas driven by high electricity demand growth and
substitution of gas for HFO. On this basis, SGC forecasts annual average increases in gas
demand of more than 6.5 percent through 2030.
5.5.2 Gas Supply
Syria’s proven gas reserves are estimated at 290 bcm. Gas production in Syria has been
dominated by non-associated, or free, gas supplied by the SPC fields in the northeast and
associated gas from AFPC. Recently, SPC has developed a number of non-associated gas fields
in central Yemen, and additional developments in this region are being planned. Figure 5.9
shows the gas production in recent years through 2005. It has risen with development of new
fields.
Figure 5. 9: Net Gas Production Trend, 1983–2005
In 2007, total natural gas production was 6.25 bcm. All gas production was consumed domestically.
There are 16 gas fields in the central part of Syria that are at various stages of development. Exploration is
initiated by the Ministry through the issue of agreements for exploration and development. Contracts for
blocks are negotiated between contractors and the Ministry. Only about one-third of Syria has been
explored for oil and gas, but gas exploration and development activity have recommenced. International
oil companies are bidding for new licenses being offered by the Ministry. SGC’s projections of future gas
supply are shown in figure 5.10.
21
Gas supply to SPC gas turbines to support oil recovery at remote sites with associated gas.

85
Figure 5. 10: SGC Forecast Gas Supply, 2005–20
Syria’s proven reserves of natural gas estimated at 290 bcm could be sufficient to supply new
generation capacity planned for development in the medium-term. However, constrained
production capacity and insufficient investment to bring gas reserves into production will make
domestic gas supply insufficient to meet future demand of the power sector. As a result, Syria
will continue to rely on other types of fuel such as HFO, or will alternatively require greater
levels of natural gas imports from the regional market.
Syria has reached an agreement with Egypt to purchase gas to supply the new Deir Ali 750 MW
CCGT plant. Under the agreement, Egypt will supply approximately 1 bcm starting in 2009. The
completion of the Arab Gas Pipeline and its interconnection with Turkey and the possibility of
interconnecting with Iraq in the long term could make several sources of imported gas available
in the future.
The historical and forecast gas demand/supply balance is shown in figure 5.11. Syria will have to
import 1.2 bcm in 2010, ramping up to 10.3 bcm in 2020 and 18.5 bcm in 2030.
Figure 5. 11: Gas Demand/Supply Balance, 1990–2030 (bcm)
Source: Various – see Appendix A
0
5
10
15
20
25
30
1990 2000 2007 2010 2020 2030
Production
Demand
Import

86
Chapter 6. LEBANON PROSPECTS FOR ENERGY INTEGRATION
6.1. Overview
Significant reform in Lebanon’s electricity sector is needed. The reliability and quality of
electricity supply is very poor. Supply interruptions are up to 3 hours per day in Beirut, and 12
hours per day in the more remote areas of the country. Electricity supply costs the public
considerably in the form of subsidies that go well beyond the levels warranted to assist the poor.
Electricity supply unreliability is causing significant spending by industrial and commercial
customers on back-up sources of generation estimated to cost the population an additional 25
percent in electricity costs. Furthermore, supply interruptions are estimated to cost industry
US$400 million.
State-owned Electricité du Libon (EdL), the major electric utility in Lebanon, has very high
operating costs that are not being recovered in tariffs for four main reasons: the use of high-cost
diesel fuel in two major power plants; the use of high-cost gas turbine peaking plants for base
load owing to supply shortages; high operation and maintenance (O&M) costs owing to
insufficient maintenance and spare parts; and high technical losses. Between 1997 and 2006,
subsidies are estimated to have reached 4 percent of GDP, and 39 percent of total Government
spending.
It is estimated that electricity demand will grow approximately 60 percent by 2015, resulting in
the need for an additional 1500 MW of generating capacity. The availability of natural gas is an
integral component of the Government’s strategy for the power sector. Lebanon has no gas
reserves, and no gas supply infrastructure with the exception of the gas pipeline link from the
Beddawi power plant to the AGP in Syria. Lebanon recently started importing gas from Egypt
over the AGP, but current imports meet only the requirements of a single turbine at the Beddawi
TPS. Gas infrastructure and alternative gas suppliers are badly needed, perhaps from Iraq,
Turkey and Iran when the AGP is completed or via an LNG terminal. Lebanon would benefit
from electricity imports from Syria and Egypt.
6.2. Power Sector Structure
The Ministry of Energy and Water (MEW) directs Lebanon’s energy sector through its policy
decisions. EdL is a state-owned, vertically integrated utility with a monopoly over generation,
transmission, and distribution of electricity. As noted, EdL incurs significant financial losses
owing to high primary fuel costs and low retail tariffs. As a result, the utility receives significant
subsidies from Government via the Ministry of Finance. A schematic of Lebanon’s energy sector
structure is provided in figure 6.1.
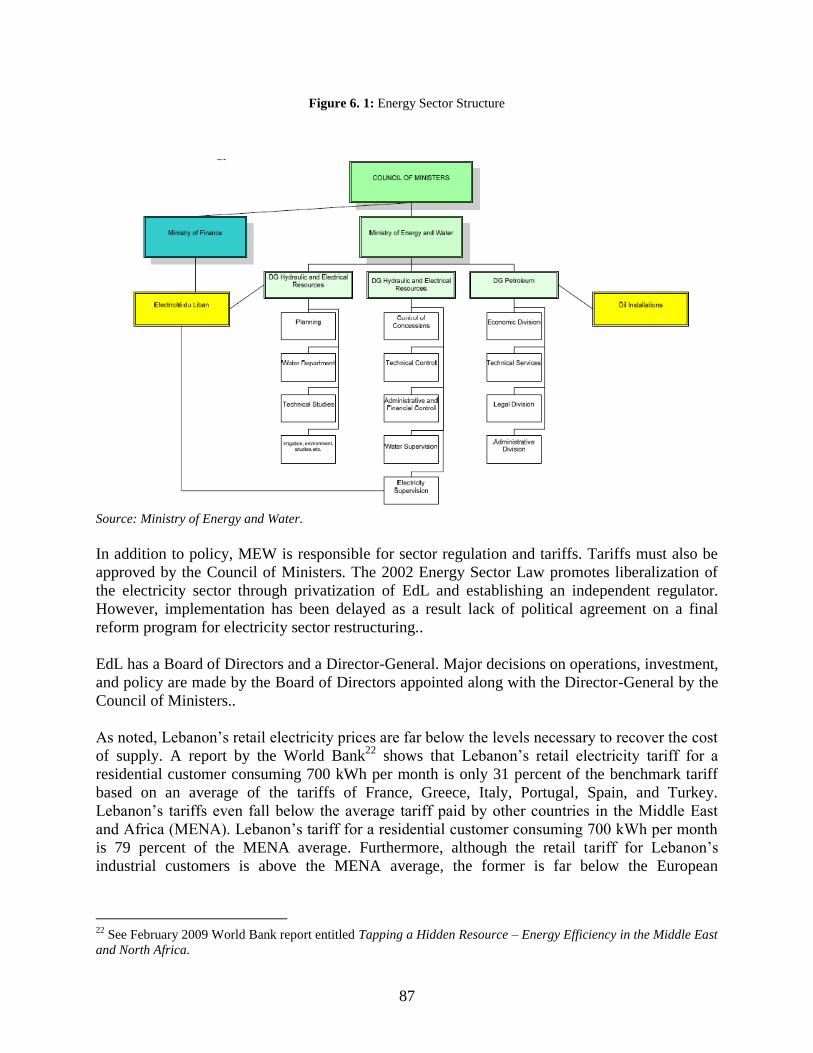
87
Figure 6. 1: Energy Sector Structure
Source: Ministry of Energy and Water.
In addition to policy, MEW is responsible for sector regulation and tariffs. Tariffs must also be
approved by the Council of Ministers. The 2002 Energy Sector Law promotes liberalization of
the electricity sector through privatization of EdL and establishing an independent regulator.
However, implementation has been delayed as a result lack of political agreement on a final
reform program for electricity sector restructuring..
EdL has a Board of Directors and a Director-General. Major decisions on operations, investment,
and policy are made by the Board of Directors appointed along with the Director-General by the
Council of Ministers..
As noted, Lebanon’s retail electricity prices are far below the levels necessary to recover the cost
of supply. A report by the World Bank22
shows that Lebanon’s retail electricity tariff for a
residential customer consuming 700 kWh per month is only 31 percent of the benchmark tariff
based on an average of the tariffs of France, Greece, Italy, Portugal, Spain, and Turkey.
Lebanon’s tariffs even fall below the average tariff paid by other countries in the Middle East
and Africa (MENA). Lebanon’s tariff for a residential customer consuming 700 kWh per month
is 79 percent of the MENA average. Furthermore, although the retail tariff for Lebanon’s
industrial customers is above the MENA average, the former is far below the European
22
See February 2009 World Bank report entitled Tapping a Hidden Resource – Energy Efficiency in the Middle East
and North Africa.

88
benchmark. The financial impact of Lebanon’s retail tariffs is particularly dismal when one
considers that the country’s cost to supply electricity is well above industry norms.
6.3. Electricity Demand and Supply
6.3.1 Demand
Electricity demand has grown steadily in recent years. It is very difficult to estimate electricity
demand in Lebanon owing to the very high levels of unsupplied energy and self-generation.
However, from 1990 to 2008, peak electricity demand is judged to have increased 89 percent,
growing from 1220 MW in 1990 to 2309 MW in 2008. Historical levels of demand are shown in
table 6.1. Lebanon has seasonal peaks in demand in both summer and winter. The daily load
curve includes an evening peak and an early morning off-peak period.
Table 6. 1 Historical Demand
Year 1990 2000 2008
Peak demand (MW) 1220 1681 2309
Energy demand (GWh) 2430 7390 10,152
The industrial and residential sectors account for 27 percent and 38 percent, respectively, of
Lebanon’s total electricity consumption. The commercial sector accounts for 17 percent, while
“other” accounts for 18 percent. Other includes technical losses. The breakdown is shown in
figure 6.2.
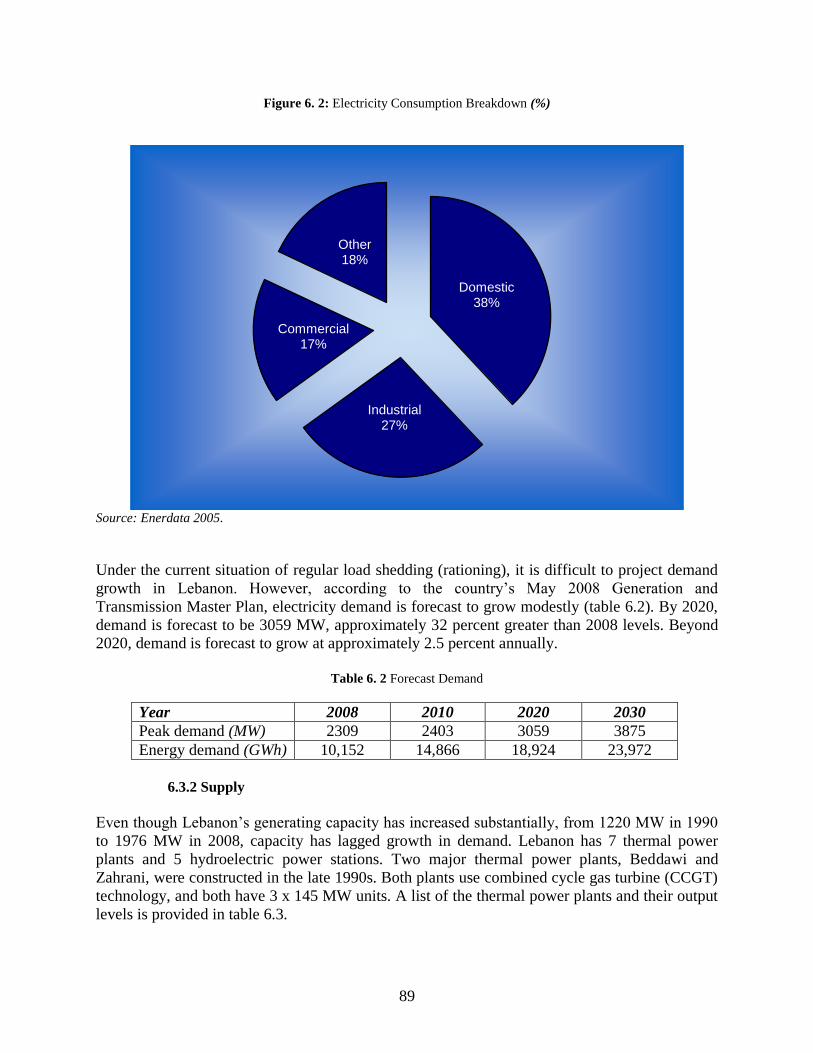
89
Figure 6. 2: Electricity Consumption Breakdown (%)
Source: Enerdata 2005.
Under the current situation of regular load shedding (rationing), it is difficult to project demand
growth in Lebanon. However, according to the country’s May 2008 Generation and
Transmission Master Plan, electricity demand is forecast to grow modestly (table 6.2). By 2020,
demand is forecast to be 3059 MW, approximately 32 percent greater than 2008 levels. Beyond
2020, demand is forecast to grow at approximately 2.5 percent annually.
Table 6. 2 Forecast Demand
Year 2008 2010 2020 2030
Peak demand (MW) 2309 2403 3059 3875
Energy demand (GWh) 10,152 14,866 18,924 23,972
6.3.2 Supply
Even though Lebanon’s generating capacity has increased substantially, from 1220 MW in 1990
to 1976 MW in 2008, capacity has lagged growth in demand. Lebanon has 7 thermal power
plants and 5 hydroelectric power stations. Two major thermal power plants, Beddawi and
Zahrani, were constructed in the late 1990s. Both plants use combined cycle gas turbine (CCGT)
technology, and both have 3 x 145 MW units. A list of the thermal power plants and their output
levels is provided in table 6.3.
Domestic38%
Industrial27%
Commercial17%
Other18%
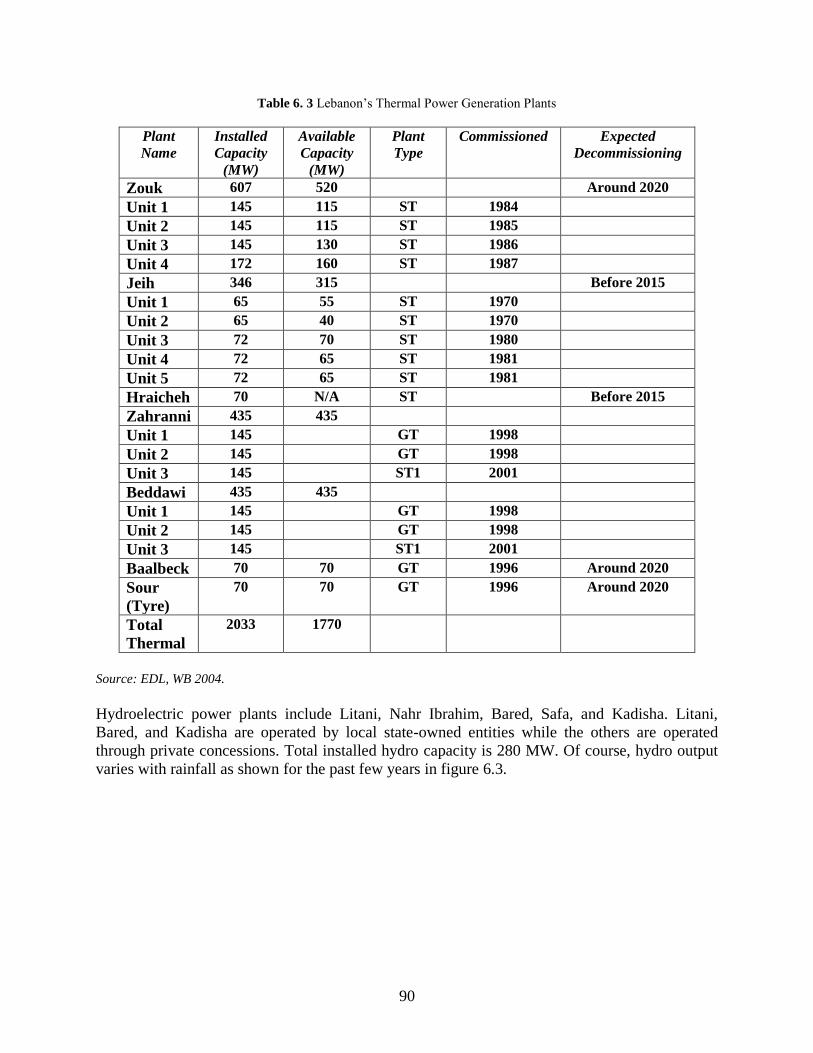
90
Table 6. 3 Lebanon’s Thermal Power Generation Plants
Plant
Name
Installed
Capacity
(MW)
Available
Capacity
(MW)
Plant
Type
Commissioned Expected
Decommissioning
Zouk 607 520 Around 2020
Unit 1 145 115 ST 1984
Unit 2 145 115 ST 1985
Unit 3 145 130 ST 1986
Unit 4 172 160 ST 1987
Jeih 346 315 Before 2015
Unit 1 65 55 ST 1970
Unit 2 65 40 ST 1970
Unit 3 72 70 ST 1980
Unit 4 72 65 ST 1981
Unit 5 72 65 ST 1981
Hraicheh 70 N/A ST Before 2015
Zahranni 435 435
Unit 1 145 GT 1998
Unit 2 145 GT 1998
Unit 3 145 ST1 2001
Beddawi 435 435
Unit 1 145 GT 1998
Unit 2 145 GT 1998
Unit 3 145 ST1 2001
Baalbeck 70 70 GT 1996 Around 2020
Sour
(Tyre)
70 70 GT 1996 Around 2020
Total
Thermal
2033 1770
Source: EDL, WB 2004.
Hydroelectric power plants include Litani, Nahr Ibrahim, Bared, Safa, and Kadisha. Litani,
Bared, and Kadisha are operated by local state-owned entities while the others are operated
through private concessions. Total installed hydro capacity is 280 MW. Of course, hydro output
varies with rainfall as shown for the past few years in figure 6.3.

91
Figure 6. 3: Lebanon’s Hydroelectric Output, 1998–2005 (GWh)
Lebanon is electrically interconnected with Syria through a 220 kV Tartous-Deir Nbouh line in
the north of Lebanon, a double circuit 66 kV Dimas-Anjar line in the center-east part of the
country, and a 400 kV line from Dimas to Kesara. Imports from Syria began in 1995 and have
since tripled. However, imports and hydro make only minor contributions to the overall supply
mix. Thermal generation provided the majority contribution. The supply mix in recent years is
shown in figure 6.4.
The transmission system is made up primarily of 220 kV, 150 kV, and 66 kV lines and sub-
stations. The transmission system runs principally from north to south along the coast where
most of the country’s population resides. There is also a transmission loop through the north-east
part of the country. Some components of the transmission system are obsolete and overloaded.
Transmission system upgrades have been underway for a number of years Losses are 4 percent,
but it is anticipated that, following the rehabilitation plan, losses will be reduced to
approximately 3 percent consistent with international standards.
The distribution system includes 12,000 km of overhead and underground 33 kV, 20 kV, 15 kV,
11 kV, and 5 kV lines; and 15,000 transformers. Rehabilitation of the distribution system is
ongoing and important to loss-reduction efforts. Technical losses are estimated at 10 percent.
Despite significant progress in recent years in commercial loss reduction, they are estimated at
25 percent, which is very high by international standards.
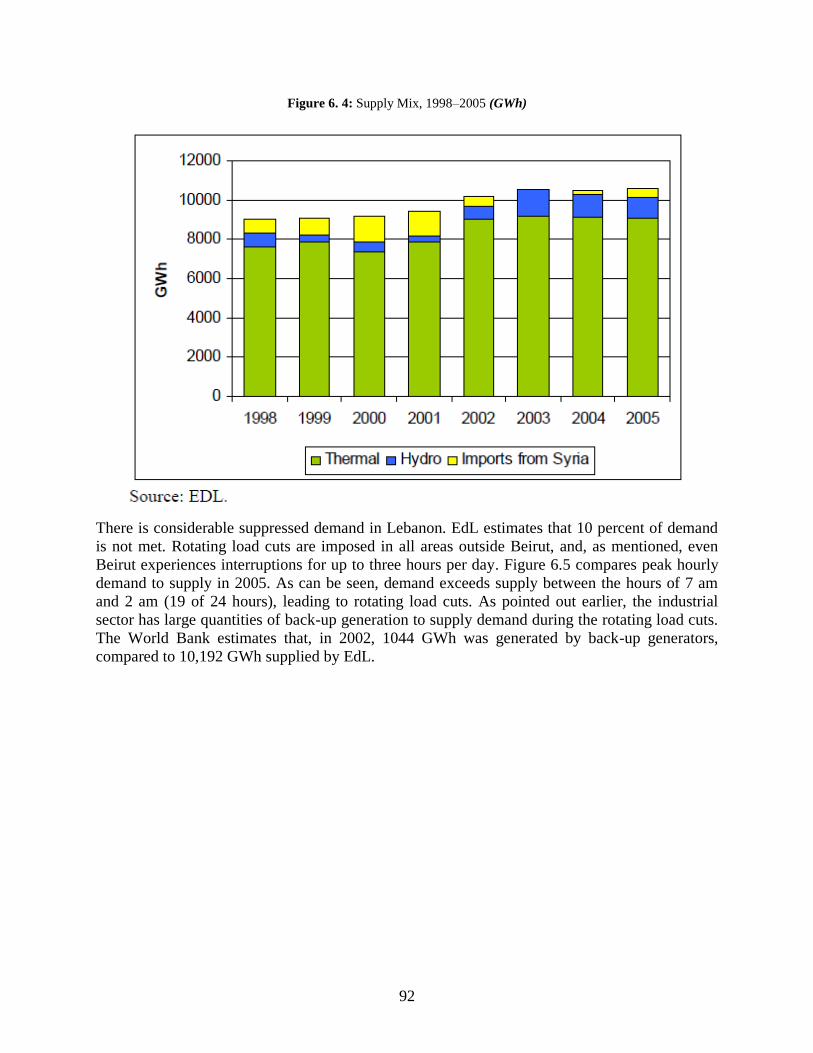
92
Figure 6. 4: Supply Mix, 1998–2005 (GWh)
There is considerable suppressed demand in Lebanon. EdL estimates that 10 percent of demand
is not met. Rotating load cuts are imposed in all areas outside Beirut, and, as mentioned, even
Beirut experiences interruptions for up to three hours per day. Figure 6.5 compares peak hourly
demand to supply in 2005. As can be seen, demand exceeds supply between the hours of 7 am
and 2 am (19 of 24 hours), leading to rotating load cuts. As pointed out earlier, the industrial
sector has large quantities of back-up generation to supply demand during the rotating load cuts.
The World Bank estimates that, in 2002, 1044 GWh was generated by back-up generators,
compared to 10,192 GWh supplied by EdL.

93
Figure 6. 5: Daily Demand/Supply Balance
At this point, there is no firm expansion plan. Studies are ongoing of both expansion and fuel
supply to existing generating stations at Beddawi and Zahrani. Lebanon recently started
importing natural gas from Egypt via the AGP, and one turbine at Beddawi is currently burning
the Egyptian gas. Zahrani might be fueled with liquefied natural gas (LNG), or alternatively,
with piped natural gas through the AGP which would require a new pipeline from Beddawi. The
issue of security of supply may necessitate further consideration of LNG. LNG would require
constructing a terminal to accept LNG deliveries, and pipelines to deliver the LNG to generating
stations. In the longer term, gas supplies may be available from other sources such as Iraq.
Lebanon’s electricity demand/supply picture is summarized in figure 6.6. The blue bar shows
historical and forecast demand. The purple bar shows historical generation capacity and existing
capacity (in 2008) going forward. The yellow bar shows the amount of new capacity needed to
meet growing demand with adequate levels of reliability (10% reserve margin). This new
generating capacity is needed to supplement existing generation capacity, but does not account
for new investment needed to replace retired plant. As can be seen, Lebanon will need almost
2300 MW of new capacity by 2030, doubling current levels.
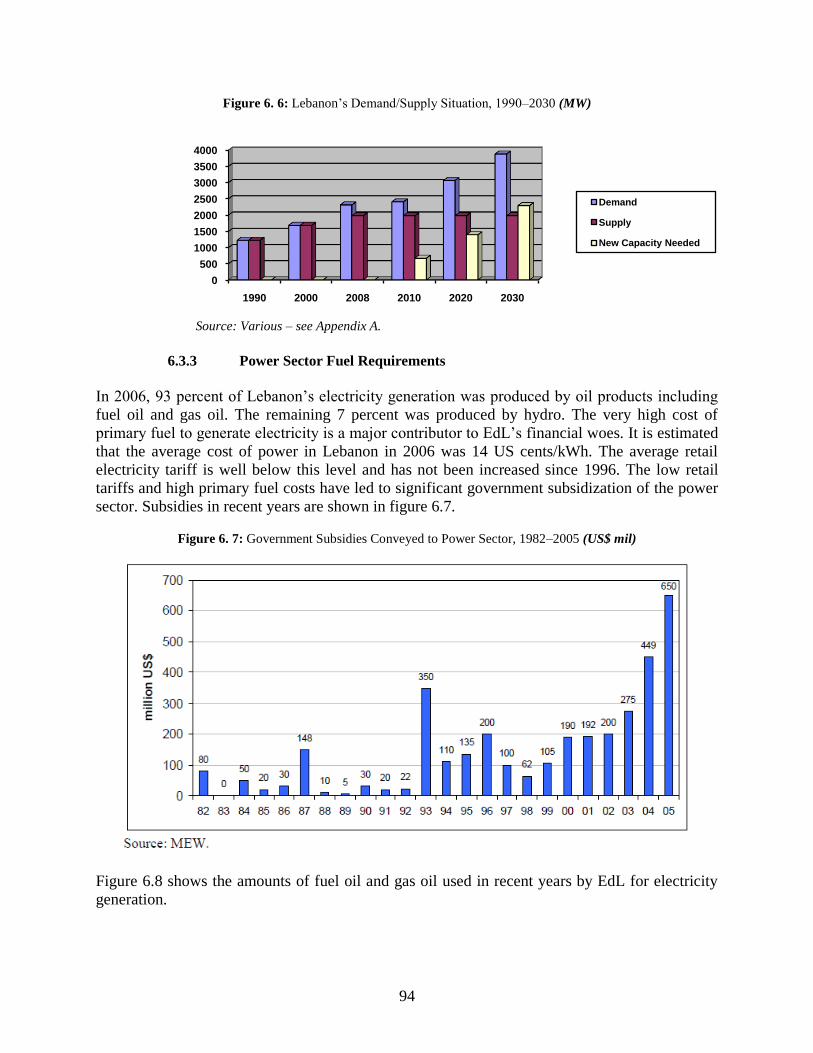
94
Figure 6. 6: Lebanon’s Demand/Supply Situation, 1990–2030 (MW)
Source: Various – see Appendix A.
6.3.3 Power Sector Fuel Requirements
In 2006, 93 percent of Lebanon’s electricity generation was produced by oil products including
fuel oil and gas oil. The remaining 7 percent was produced by hydro. The very high cost of
primary fuel to generate electricity is a major contributor to EdL’s financial woes. It is estimated
that the average cost of power in Lebanon in 2006 was 14 US cents/kWh. The average retail
electricity tariff is well below this level and has not been increased since 1996. The low retail
tariffs and high primary fuel costs have led to significant government subsidization of the power
sector. Subsidies in recent years are shown in figure 6.7.
Figure 6. 7: Government Subsidies Conveyed to Power Sector, 1982–2005 (US$ mil)
Figure 6.8 shows the amounts of fuel oil and gas oil used in recent years by EdL for electricity
generation.
0
500
1000
1500
2000
2500
3000
3500
4000
1990 2000 2008 2010 2020 2030
Demand
Supply
New Capacity Needed

95
Figure 6. 8: EdL Use of Fuel Oil and Gas Oil, 2000–05 (tons)
Source: MEW.
Switching from fuel oil and gas oil to natural gas as the primary fuel for generation could lead to
significant savings. The Beddawi and Zahrani power plants, which account for almost half of the
available thermal capacity in the country, can operate on natural gas. In fact, both plants were
designed for natural gas operation. Tyre and Baalbeck can be converted to gas at reasonable cost,
and new CCGT capacity would be operated on gas if available. The Ministry of Energy and
Water estimates that future electricity sector demand for gas could reach 3 bcm per year.
Beddawi and Zahrani alone would require 1.2 bcm per year if operated base load on gas.
Introducing natural gas to the electricity sector is a priority of the Government of Lebanon.
Savings would be a function of relative prices of the primary fuels. However, in 2005, MEW
estimated that savings from switching to natural gas would range from US$144 million–250
million for crude oil prices ranging from US$40–80/barrel (bbl). Figure 6.9 compares forecast
savings. In addition to fuel cost savings, O&M and pollution costs would be reduced.
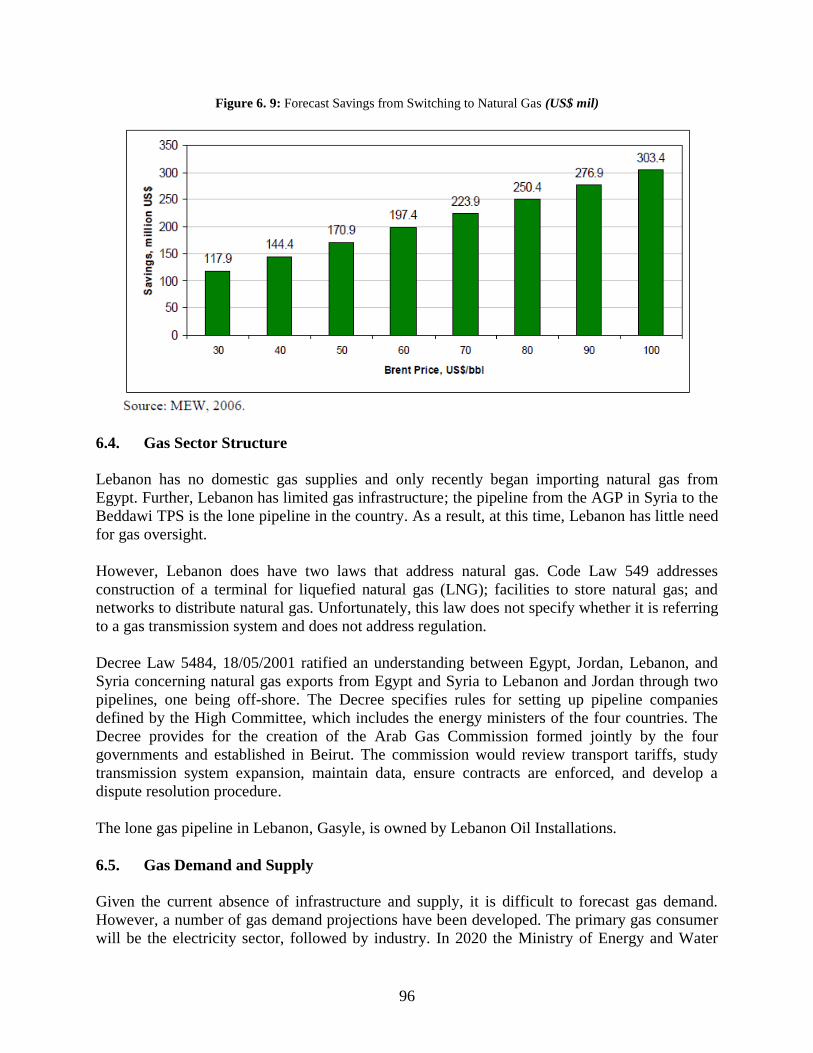
96
Figure 6. 9: Forecast Savings from Switching to Natural Gas (US$ mil)
6.4. Gas Sector Structure
Lebanon has no domestic gas supplies and only recently began importing natural gas from
Egypt. Further, Lebanon has limited gas infrastructure; the pipeline from the AGP in Syria to the
Beddawi TPS is the lone pipeline in the country. As a result, at this time, Lebanon has little need
for gas oversight.
However, Lebanon does have two laws that address natural gas. Code Law 549 addresses
construction of a terminal for liquefied natural gas (LNG); facilities to store natural gas; and
networks to distribute natural gas. Unfortunately, this law does not specify whether it is referring
to a gas transmission system and does not address regulation.
Decree Law 5484, 18/05/2001 ratified an understanding between Egypt, Jordan, Lebanon, and
Syria concerning natural gas exports from Egypt and Syria to Lebanon and Jordan through two
pipelines, one being off-shore. The Decree specifies rules for setting up pipeline companies
defined by the High Committee, which includes the energy ministers of the four countries. The
Decree provides for the creation of the Arab Gas Commission formed jointly by the four
governments and established in Beirut. The commission would review transport tariffs, study
transmission system expansion, maintain data, ensure contracts are enforced, and develop a
dispute resolution procedure.
The lone gas pipeline in Lebanon, Gasyle, is owned by Lebanon Oil Installations.
6.5. Gas Demand and Supply
Given the current absence of infrastructure and supply, it is difficult to forecast gas demand.
However, a number of gas demand projections have been developed. The primary gas consumer
will be the electricity sector, followed by industry. In 2020 the Ministry of Energy and Water
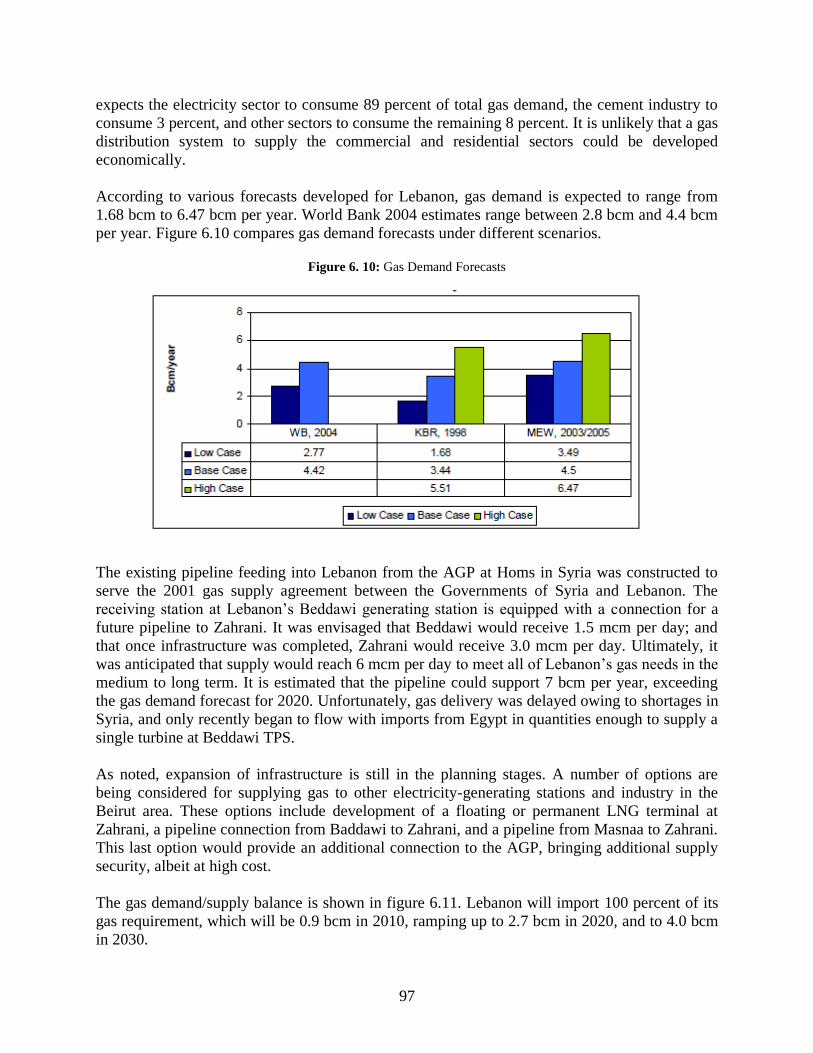
97
expects the electricity sector to consume 89 percent of total gas demand, the cement industry to
consume 3 percent, and other sectors to consume the remaining 8 percent. It is unlikely that a gas
distribution system to supply the commercial and residential sectors could be developed
economically.
According to various forecasts developed for Lebanon, gas demand is expected to range from
1.68 bcm to 6.47 bcm per year. World Bank 2004 estimates range between 2.8 bcm and 4.4 bcm
per year. Figure 6.10 compares gas demand forecasts under different scenarios.
Figure 6. 10: Gas Demand Forecasts
The existing pipeline feeding into Lebanon from the AGP at Homs in Syria was constructed to
serve the 2001 gas supply agreement between the Governments of Syria and Lebanon. The
receiving station at Lebanon’s Beddawi generating station is equipped with a connection for a
future pipeline to Zahrani. It was envisaged that Beddawi would receive 1.5 mcm per day; and
that once infrastructure was completed, Zahrani would receive 3.0 mcm per day. Ultimately, it
was anticipated that supply would reach 6 mcm per day to meet all of Lebanon’s gas needs in the
medium to long term. It is estimated that the pipeline could support 7 bcm per year, exceeding
the gas demand forecast for 2020. Unfortunately, gas delivery was delayed owing to shortages in
Syria, and only recently began to flow with imports from Egypt in quantities enough to supply a
single turbine at Beddawi TPS.
As noted, expansion of infrastructure is still in the planning stages. A number of options are
being considered for supplying gas to other electricity-generating stations and industry in the
Beirut area. These options include development of a floating or permanent LNG terminal at
Zahrani, a pipeline connection from Baddawi to Zahrani, and a pipeline from Masnaa to Zahrani.
This last option would provide an additional connection to the AGP, bringing additional supply
security, albeit at high cost.
The gas demand/supply balance is shown in figure 6.11. Lebanon will import 100 percent of its
gas requirement, which will be 0.9 bcm in 2010, ramping up to 2.7 bcm in 2020, and to 4.0 bcm
in 2030.
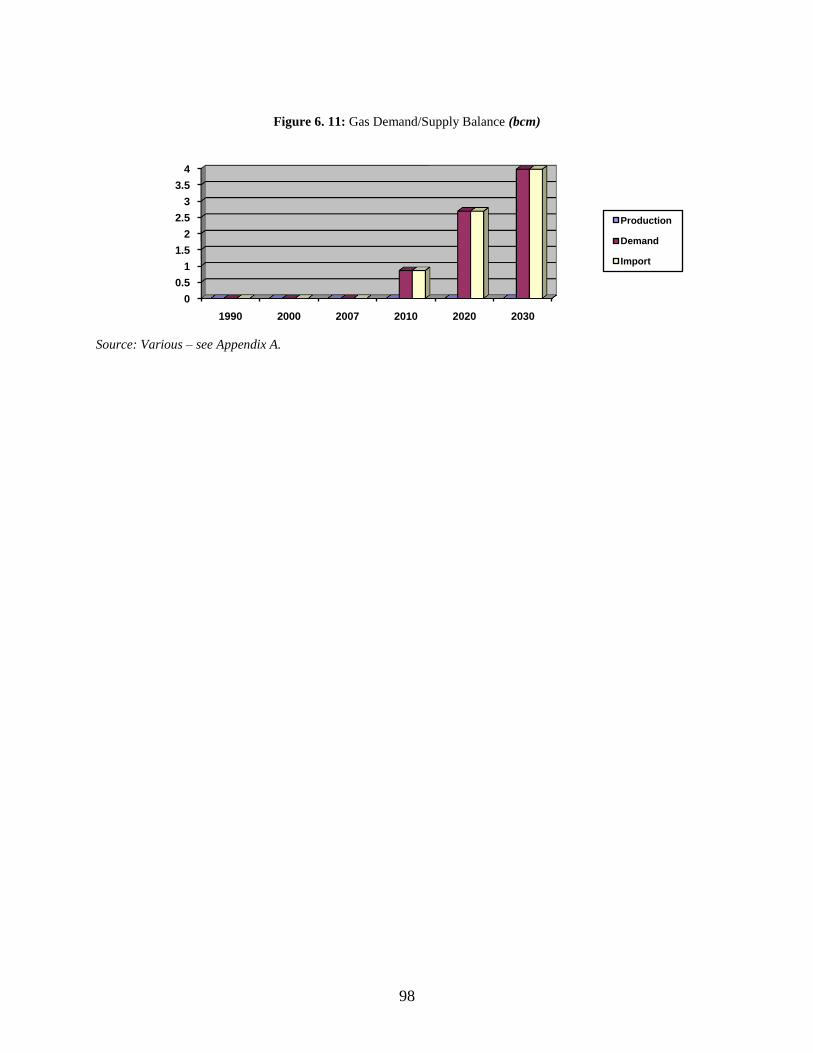
98
Figure 6. 11: Gas Demand/Supply Balance (bcm)
Source: Various – see Appendix A.
0
0.5
1
1.5
2
2.5
3
3.5
4
1990 2000 2007 2010 2020 2030
Production
Demand
Import
99
Chapter 7. WEST BANK AND GAZA PROSPECTS FOR ENTERY INTEGRATION
7.1. Overview
The West Bank and Gaza (WBG) has a population of about 3.84 million (2008) and a GDP of
12.6 billion US$ (2009 purchasing power parity). It has a small energy market with virtually no
developed domestic resources of energy, relying almost entirely on imports of electricity and oil
products. Nearly all of its energy imports at present come from Israel with some electricity
imports from Egypt and Jordan.
Aside from its dependence on Israel for energy, the separation of the West Bank and Gaza into
two geographical areas with divergent economic characteristics poses challenges. The two
geographic areas are not directly interconnected electrically. Most Palestinian economic activity
is in the West Bank, as is the majority of the population. The West Bank borders Jordan which
could become a regional energy transit center. Gaza has a smaller economy and population, but
has a more favorable energy supply as sizable gas reserves lie offshore. Further, it could receive
supplies by sea, and it borders Egypt, a country with energy resources that could provide an
alternative to imports from Israel. The lone power plant in the WBG, a combined cycle plant
burning expensive gasoil, is located in Gaza.
Gas reserves of about 35 bcm have been discovered off the coast of Gaza. These reserves are
significant relative to the WBG energy needs; however, the reserves remain undeveloped as the
consortium with the development rights has been unable to reach commercial agreement with a
buyer.
WBG has experienced significant growth in electricity demand, exceeding 6 percent annually
since 2000. The high levels of demand growth, constraints in fuel supply to Gaza power plant,
and existing political situations have led to significant levels of load shedding and unsupplied
energy mainly in Gaza area. Further, high commercial and technical losses and poor collection
rates have resulted in erratic growth patterns. . However, the Palestinian Authority (PA) has
embarked on a plan to address the situation, implementing a number of reforms to improve
losses and collections performance, form a new regulatory agency, establish regional distribution
companies, and develop a transmission system.
7.2. Power Sector Structure
The Palestinian Energy and Natural Resources Authority (PEA) was established in 1995 by Law
Nº (12/1995). The PEA’s roles and responsibilities were clarified under the Electricity Act by
Decision Nº (13/2009). PEA is responsible for overseeing energy sector development. Its powers
are wide-ranging, including responsibility for policy, coordination and development of the
energy sector.
The PEA is responsible for consolidating power supply and distribution arrangements in the
West Bank into four electricity distribution utilities. It has created three utilities: the Northern
Electric Distribution Company (NEDCO) that was established in the northern region of the West

100
Bank in January 2008, and Hebron Electric Power Company (HEPCO) and Southern Electric
Power Company (SELCO) created in 2003 in the southern region of the West Bank. NEDCO
and SELCO are planned to take over the electricity operating assets and services of the
municipalities and village councils in their areas. This process is taking several years to
complete, especially for NEDCO which is still not operational. These distribution companies are
in addition to the long-established utility serving the central area around Jerusalem - the
Jerusalem District Electricity Company (JDECO). The Gaza Electricity Distribution Company
(GEDCO) was established in the mid 1990s and is responsible for electricity transmission and
distribution in Gaza.
The PA encourages private sector investment in the energy sector. The new Electricity Law
requires that new generation capacity is developed by private sector and also allows private
participation as shareholders in the public distribution companies.
With respect to renewable energy, the PEA has established an internal Energy and Environment
Research Center in charge of preparing studies and conducting research on renewable energy,
and establishing the data and information needs for utilizing and developing renewable energy
sources with the cooperation of other research centers at Palestinian universities. The research
center will establish the Palestine Wind Atlas and Solar Energy Map, and establish an energy
efficiency laboratory
Retail electricity prices in the West Bank and Gaza are close to collecting the full economic cost
of supply. A report by the World Bank23
shows that the retail electricity tariff for a residential
customer in the WBG consuming 700 kWh per month is 86 percent of the benchmark tariff
based on an average of the tariffs of France, Greece, Italy, Portugal, Spain, and Turkey. The
WBG industrial tariff is about 65 percent of the European benchmark. The WBG’s tariffs are
well-above the average tariff paid by other countries in the Middle East and Africa (MENA),
with the tariff for a residential customer consuming 700 kWh per month being 156 percent of the
MENA average.
The new Electricity Law passed in May 2009 established the policy and framework for
developing the electricity sector in West Bank and Gaza including establishing a new regulatory
commission, transmission company and distribution companies to which electricity services will
be transferred from the municipal and villages. Figure 7.1 shows the structure of the electricity
sector to be developed as envisaged by the Electricity Law.
23
See February 2009 World Bank report entitled Tapping a Hidden Resource – Energy Efficiency in the Middle East
and North Africa.

101
Figure 7. 1: Structure of Palestinian Electricity Sector as Required by the Electricity Law
Source: Draft Energy Sector by PEA
Electric Power Transmission
• Power Transmission from power plants into distribution utilities and consumers supplied by over 36 kV
• Power importation and exportation trough Electric Interconnection
T h e P E ASetting the Policies and general regulations related to developing the Power Sector, licensing and concluding agreements for
power generation, concluding agreements concerning interconnections with the neighboring countries, issuing conditions and
regulations on public safety, issuing necessary environmental conditions implementation requirements, licensing power
distribution and sales, and setting the power tariffs approved by the Cabinet
RE Power Plant
Egypt
Jordan
North West Bank Power Plant
Gaza Power Plant
IEC
Power Distribution to Consumers
Gaza Governorates Distribution Co.
JEDCo
NEPCo
South West Bank (Hebron Governorate) Co.
Customers supplied by up to 36 kV
Customers supplied by over 36 kV
E l e c t r i c P o w e r R e g u l a t o r y C o u n c i l
Monitoring the application of agreements concerning generation, transmission, and Selling and distribution, reporting to the PEA to set the tariffs, recommend the acceptance or refusal of licensing, renewal of license, withdrawal of license, and forfeiting it. In addition to quality control of services provided to customers by distribution companies
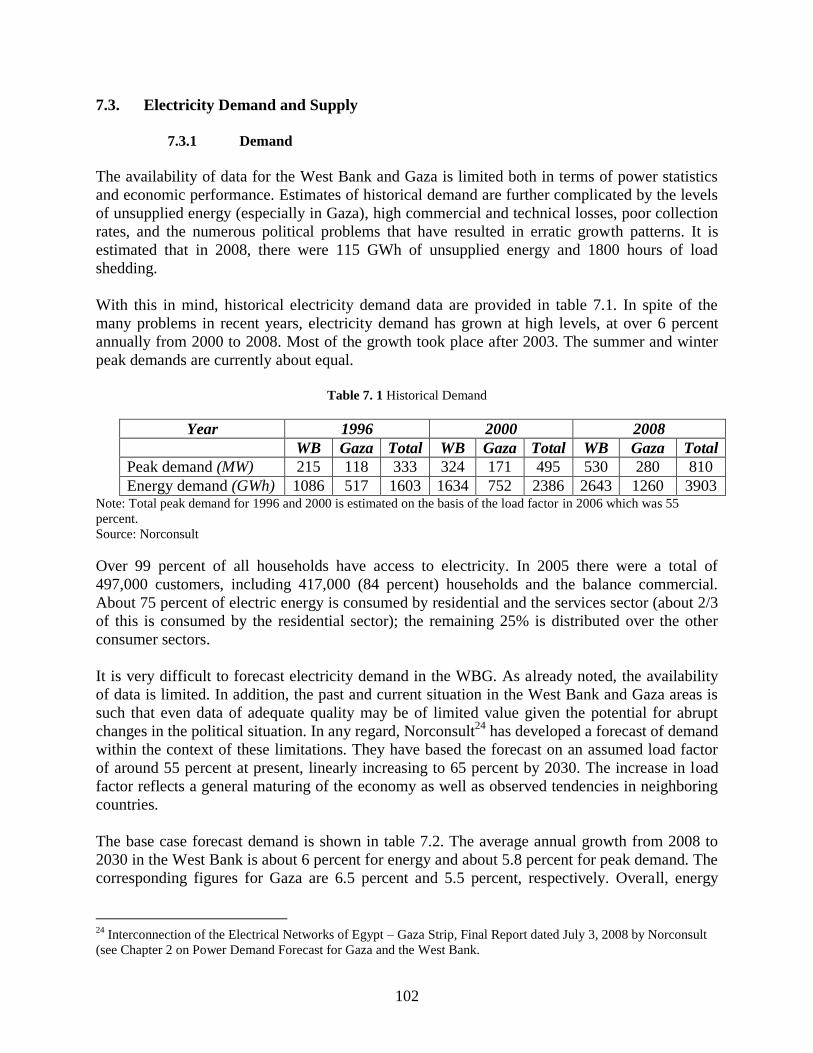
102
7.3. Electricity Demand and Supply
7.3.1 Demand
The availability of data for the West Bank and Gaza is limited both in terms of power statistics
and economic performance. Estimates of historical demand are further complicated by the levels
of unsupplied energy (especially in Gaza), high commercial and technical losses, poor collection
rates, and the numerous political problems that have resulted in erratic growth patterns. It is
estimated that in 2008, there were 115 GWh of unsupplied energy and 1800 hours of load
shedding.
With this in mind, historical electricity demand data are provided in table 7.1. In spite of the
many problems in recent years, electricity demand has grown at high levels, at over 6 percent
annually from 2000 to 2008. Most of the growth took place after 2003. The summer and winter
peak demands are currently about equal.
Table 7. 1 Historical Demand
Year 1996 2000 2008
WB Gaza Total WB Gaza Total WB Gaza Total
Peak demand (MW) 215 118 333 324 171 495 530 280 810
Energy demand (GWh) 1086 517 1603 1634 752 2386 2643 1260 3903 Note: Total peak demand for 1996 and 2000 is estimated on the basis of the load factor in 2006 which was 55
percent.
Source: Norconsult
Over 99 percent of all households have access to electricity. In 2005 there were a total of
497,000 customers, including 417,000 (84 percent) households and the balance commercial.
About 75 percent of electric energy is consumed by residential and the services sector (about 2/3
of this is consumed by the residential sector); the remaining 25% is distributed over the other
consumer sectors.
It is very difficult to forecast electricity demand in the WBG. As already noted, the availability
of data is limited. In addition, the past and current situation in the West Bank and Gaza areas is
such that even data of adequate quality may be of limited value given the potential for abrupt
changes in the political situation. In any regard, Norconsult24
has developed a forecast of demand
within the context of these limitations. They have based the forecast on an assumed load factor
of around 55 percent at present, linearly increasing to 65 percent by 2030. The increase in load
factor reflects a general maturing of the economy as well as observed tendencies in neighboring
countries.
The base case forecast demand is shown in table 7.2. The average annual growth from 2008 to
2030 in the West Bank is about 6 percent for energy and about 5.8 percent for peak demand. The
corresponding figures for Gaza are 6.5 percent and 5.5 percent, respectively. Overall, energy
24
Interconnection of the Electrical Networks of Egypt – Gaza Strip, Final Report dated July 3, 2008 by Norconsult
(see Chapter 2 on Power Demand Forecast for Gaza and the West Bank.
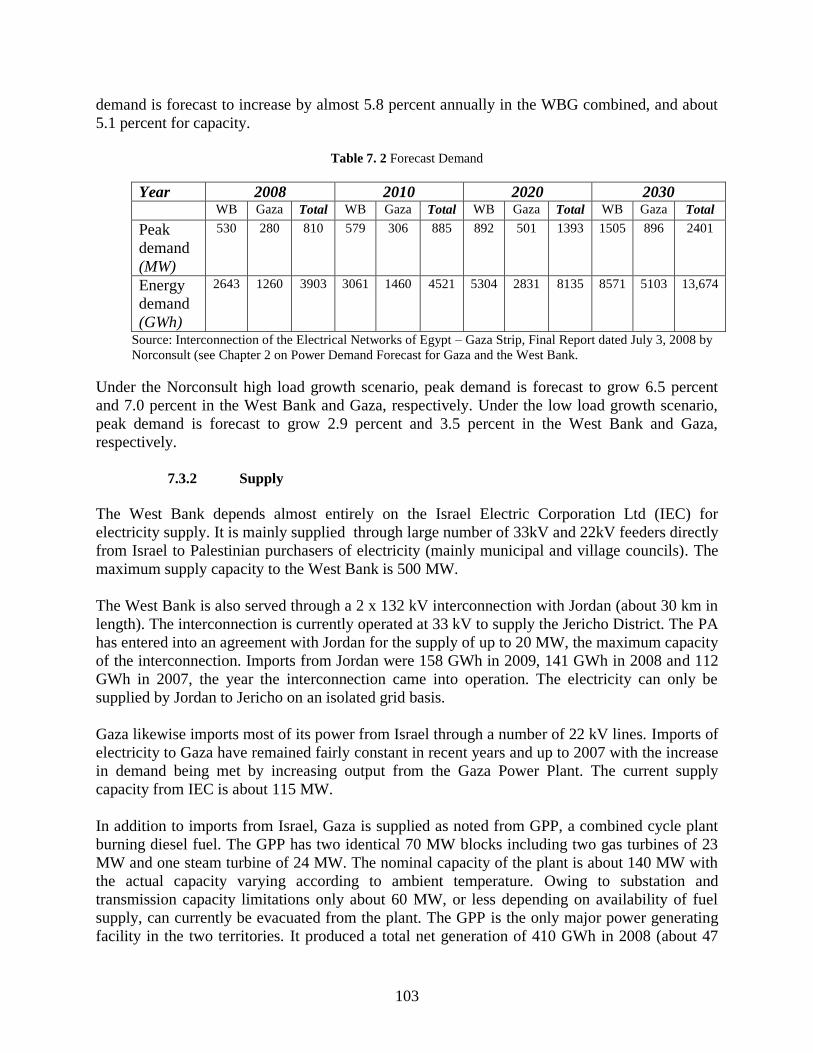
103
demand is forecast to increase by almost 5.8 percent annually in the WBG combined, and about
5.1 percent for capacity.
Table 7. 2 Forecast Demand
Year 2008 2010 2020 2030
WB Gaza Total WB Gaza Total WB Gaza Total WB Gaza Total
Peak
demand
(MW)
530 280 810 579 306 885 892 501 1393 1505 896 2401
Energy
demand
(GWh)
2643 1260 3903 3061 1460 4521 5304 2831 8135 8571 5103 13,674
Source: Interconnection of the Electrical Networks of Egypt – Gaza Strip, Final Report dated July 3, 2008 by
Norconsult (see Chapter 2 on Power Demand Forecast for Gaza and the West Bank.
Under the Norconsult high load growth scenario, peak demand is forecast to grow 6.5 percent
and 7.0 percent in the West Bank and Gaza, respectively. Under the low load growth scenario,
peak demand is forecast to grow 2.9 percent and 3.5 percent in the West Bank and Gaza,
respectively.
7.3.2 Supply
The West Bank depends almost entirely on the Israel Electric Corporation Ltd (IEC) for
electricity supply. It is mainly supplied through large number of 33kV and 22kV feeders directly
from Israel to Palestinian purchasers of electricity (mainly municipal and village councils). The
maximum supply capacity to the West Bank is 500 MW.
The West Bank is also served through a 2 x 132 kV interconnection with Jordan (about 30 km in
length). The interconnection is currently operated at 33 kV to supply the Jericho District. The PA
has entered into an agreement with Jordan for the supply of up to 20 MW, the maximum capacity
of the interconnection. Imports from Jordan were 158 GWh in 2009, 141 GWh in 2008 and 112
GWh in 2007, the year the interconnection came into operation. The electricity can only be
supplied by Jordan to Jericho on an isolated grid basis.
Gaza likewise imports most of its power from Israel through a number of 22 kV lines. Imports of
electricity to Gaza have remained fairly constant in recent years and up to 2007 with the increase
in demand being met by increasing output from the Gaza Power Plant. The current supply
capacity from IEC is about 115 MW.
In addition to imports from Israel, Gaza is supplied as noted from GPP, a combined cycle plant
burning diesel fuel. The GPP has two identical 70 MW blocks including two gas turbines of 23
MW and one steam turbine of 24 MW. The nominal capacity of the plant is about 140 MW with
the actual capacity varying according to ambient temperature. Owing to substation and
transmission capacity limitations only about 60 MW, or less depending on availability of fuel
supply, can currently be evacuated from the plant. The GPP is the only major power generating
facility in the two territories. It produced a total net generation of 410 GWh in 2008 (about 47

104
MW on average). The GPP output has been further limited owing to its high production cost
relative to imports from IEC.
Since 2006, Gaza has also received up to 17MW (the maximum capacity of the interconnection)
from Egypt on an emergency basis over a 1 x 22 kV interconnection. Imports in recent years
from Egypt have totaled: 134 GWH in 2009, 123 GWh in 2008 and 28 GWh in 2007.
Total supply capacity is about 520MW to the West Bank and about 202MW (272MW with
restored GPP transmission capacity) to Gaza. Load shedding is reportedly about 30-40MW
during the winter and summer peaks. Load shedding in the West Bank appears to be minimal
(although the load factor of 55% implies supply constraints). In 2008, the WBG imported 3291
GWh, or 92 percent, of its total consumption of 3590 GWh.. Load shedding has significantly
increased in Gaza in and after 2009.
The cost of supply from IEC was a little above 8/US cents/kWh (excluding VAT) in 2007.25
The
cost of supply from GPP is high and over 31 US cents/kWh (21.4 US cents/kWh excluding VAT
and taxes) due mainly to the high cost of fuel using imported oil gas from Israel instead of gas.
Imports from Egypt averaged 6.4 US cents/kWh in 2007.
There is good potential for renewable energy development in the West Bank and Gaza,
particularly for solar radiation (5.46 kWh/m2/day). Renewable thermal energy provides about
18% of the total energy consumed in the WBG. Solar water heaters have been extensively used
with more than 1.5 million m2 of solar water heater panels installed in about 70% of the homes.
Photovoltaic energy is being piloted, focusing on homes and community areas, and currently
there is a total installed capacity of around 85 kWp. Biomass and agricultural wastes are used for
cooking and heating in the rural areas, and provide about 9% of energy needs. Industrial
biomass waste is also used in some regions to provide energy.
At the current time, there is no transmission grid in the WBG, although there are plans to
develop one. The WBG has recently attained full membership in the seven (becoming eight with
Palestine) countries electric project EIJLLST including Egypt, Iraq, Jordan, Lebanon, Libya,
Syria and Turkey. The WBG has recently completed feasibility studies for interconnection of
the electricity networks of Egypt - Gaza and Jordan – West Bank.
Electricity is primarily distributed at 33 kV, 22 kV and 11 kV. The power system in the West
Bank and Gaza is shown in figure 7.2.
25
See West Bank and Gaza Energy Sector Review, May 2007 by the World Bank.

105
Figure 7. 2 Eleectricity Supply System in the West Bank and Gaza
Source: West Bank and Gaza Energy sector Review, May 2007, Sustainable Development Department, Middle
East and North Africa Region.

106
The Jordan – West Bank interconnection feasibility study considers three future power supply
scenarios for the West Bank:
Supply from thermal power plants in the West Bank (fuelled by natural gas)
Supply from Jordan
Supply from Israel
Two power plant developments were considered then by the study
A 180 MW combined cycle power plant at Jayyus (two units) located on the northern part
of the West Bank; and
A 180 MW or 240 MW combined cycle power plant at Turqumia (3x60 MW or 4x60
MW) located in the southern part of the West Bank.
The feasibility study also recommends that the generation and transmission system in the West
Bank be further developed based on cooperation with Jordan, with the first step including
implementation of a 400 kV interconnection. The required time for implementation of the
transmission and interconnection facilities is about the same as development of additional
generation capacity in Jordan for supply to the West Bank. . The favored interconnection
alternative with Jordan would originate at the Samra Thermal Power Plant north of Amman in
Jordan, and connect to a new 400 kV substation in the Jerusalem area in the West Bank. The
length of the interconnection is estimated to be 101 km.
There are three power supply options under consideration for Gaza:
Supply from the Gaza Thermal Power Plant
Supply from Egypt
Supply from Israel
The GPP is located in the centre of Gaza, about 10 km south of the Gaza City centre and 3 km
from the sea.. There is the possibility of expanding GPP to 280 MW in the medium term, and
560 MW in the longer term. Expansion of the GPP is possible as the seawater intake pipe has
been sized for a plant capacity of 280MW and the land allocated for the plant can accommodate
four generator blocks of 140MW each. Due to the current lack of a transmission system
(transmission lines, substations and transformers) to supply the distribution systems and fuel
supply constraints only 60-70 MW of the generation capacity at GPP can now be evacuated. The
GPP uses light fuel oil which is very expensive, close to 20 US cents/kWh. The plant might be
fuelled by natural gas via pipeline in the future.
Gaza might also be supplied in the future from Egypt in larger quantities over a 2 x 220 kV line
from the main transmission grid to El’Arish, a town located 50 km south-west of Gaza. Both the
GPP expansion and the Egyptian supply alternatives would require development of a 220 kV
transmission system in Gaza to transfer power imports from Egypt and power production from
GPP to substations on the Gaza strip. The 220 kV transmission alternative is favored over the 66
kV alternative because it has the capacity to transfer power to the West Bank if future conditions
allow.

107
While conventional power plants, transmission and imports from neighboring countries are all
potential supply options in the West Bank and Gaza, renewable energy is also under
consideration. The Energy Sector Strategy 2011-2013 produced by the PNA indicates that goals
for renewable energy will be established and suggests that 10 percent of locally-produced power
should be produced by renewable by 2020. Wind potential is being considered near Bethlehem
and Hebron city, with a capacity of 750 kWp. In addition, the Palestinian Authority is interested
in further exploitation of solar resources and is considering the development of a concentrated
solar power (CSP) plant in the Jericho area.
The WBG electricity demand/supply picture is summarized in figure 7.3. The blue bar shows
historical and forecast demand. The purple bar shows historical generation capacity and existing
capacity (in 2008) going forward. The yellow bar shows the amount of new capacity or imports
needed to meet growing demand with adequate levels of reliability (10% reserve margin). This
new generating capacity is needed to supplement existing generation capacity, and assumes the
current transmission limitations for evacuation of GPP capacity would be eliminated. As can be
seen, WBG will need 2500 MW of new capacity or purchases from neighboring countries by
2030.
Figure 7. 3 WBG’s Demand/Supply Situation, 1996–2030 (MW)
Source: Various – see Appendix A.
7.3.3 Power Sector Fuel Requirements
As noted, GPP is the sole generating station in the WBG, and it currently burns gasoil purchased
from Israel at market prices. Consumption of gasoil at GPP in 2005 and 2008 is shown in table
7.3. Owing to a number of reasons such as the cost of production and transmission limitations,
production from GPP has decreased since 2005.
0
500
1000
1500
2000
2500
3000
1996 2000 2008 2010 2020 2030
Demand
Supply
New Capacity Needed

108
Table 7. 3 Gasoil Consumption at GPP in 2005 and 200826
2005 2008
Production (GWh) 499.3 410
Plant Utilization Rate
(based on 140 MW capacity)
41% 33%
Gasoil Consumption (tonnes) 95,000 78,000
Conversion of the GPP to burn natural gas would produce substantial savings depending on the
purchase price of the gas. The West Bank and Gaza Energy Review estimates the savings at US$
45 million annually based upon recent usage of 70MW of capacity, increasing to at least US$ 83
million per year if the full capacity of 140 MW were utilized. The level of investment required
for conversion to gas use is estimated at about US$ 2.5 million. If natural gas supplied to the
GPP cost US$4/mmbtu, the fuel cost of power generated at the plant would be equal to about
US$0.03/kWh excluding taxes. This cost is only about 25% of the cost of power generated with
gasoil (US$0.124/kWh) in June 2006.
At this time, it is difficult to know how much of the electricity needs of the WBG will be met
with imports and how much will be met through construction of its own generation. It is also
difficult to know how much renewable generation might be developed. However, if it were
assumed that 5% of electrical energy requirements were met with renewable in 2020, increasing
to 10% in 2030, and that all remaining forecast electrical energy requirements of the WBG were
met by gas generation, the gas requirements for the electricity sector would be roughly as shown
in table 7.4. Table 7.4 shows estimates of the total gas requirement for electricity generation
whether the electrical energy is produced domestically or imported. This represents an upper
level of gas consumption since some of the electricity requirement is likely to be produced from
oil products.
Table 7. 4 Potential Gas Requirement for WBG Power Sector
2010 2020 2030
Energy Demand
(GWh)
4521 8135 13,674
Natural Gas
Requirement (bcm)
1.0 1.8 2.8
7.4. Gas Sector
A Cabinet Decision issued on October 8, 1994 granted Palestinian Petroleum Corporation (PPC).
responsibility for managing all oil, petroleum, and petrochemicals in the Palestinian Territories.
Cabinet Decision Nº (17/2008) granted PPC responsibility for licensing gas distribution stations
and agencies. A draft law concerning the PPC was prepared, approved on second reading by the
Legislative Council, and then submitted to late President Yasser Arafat on 1997 for approval, but
26
Based on data from West Bank and Gaza Energy Sector Review, May 2007, Sustainable Development
Department Middle East and North Africa Region.
109
has not yet been approved. As a result, PPC has partial, but not full, oversight responsibility for
the gas sector.
As noted, natural gas is not currently used as a fuel in the WBG. There are no developed gas
reserves, no gas pipelines, and no infrastructure that would enable imports of LNG. The PA does
however have natural gas reserves offshore. In 1999, the PNA granted a natural gas exploration
license to a coalition lead by BG International Limited. The license covered the entire marine
area offshore of Gaza for a term of 25 years. In 2000, the BG Group announced the successful
discovery of two natural gas wells with about 35 bcm gas reserves (proved). The Gaza Marine
field is located about 36 km offshore of Gaza.
In the ten years that have passed since the discovery of the gas, the fields have yet to be
developed. There are several options for marketing the gas such as exporting it abroad through
Egypt (in gaseous of liquid form), export via the AGP, or supplying Gaza power plant and
exporting it to Israel for later re-export to the West Bank.
7.5. Gas Demand and Supply
As noted, there is currently no gas demand in the WBG, primarily because there is no gas supply
and delivery infrastructure. The potential demand for gas in WBG is limited by its relatively
small size. The development and use of gas in the WBG is dependent on developments in the
larger Israeli market. In the short term, the only demand that could arise from conversion of
existing facilities would come from the Gaza Power Plant. Replacement of gasoil with gas at the
plant would require as much as 0.24 bcm/year if all power generating capacity could be used.
Beyond power, there is limited potential demand for gas from industry or other sectors in spite of
its environmental and cost advantages. Expanded use of gas would require development of a
domestic transmission and distribution system, or alternatively, demand could be met through
transport of compressed natural gas (CNG). CNG could be used for transport, particularly in fleet
applications where it might compete effectively with imported diesel and gasoline. Based solely
on the potential use of gas for power generation, future demand might be as shown previously in
table 7.5.
The gas demand/supply balance for WBG is shown in figure 7.4. The figure assumes:
GPP will be converted to burn imported gas by 2020;
All gas demand in WBG will relate to power generation; and
The Gaza Marine gas field will be developed to produce 2 bcm of gas annually by 2020.
As can be seen in figure 7.4, all gas demand for electricity generation in WBG in 2020 could be
met with gas from the Gaza Marine off-shore field. By 2030, WBG will need to import 0.8 bcm
of gas annually to meet its electric energy demand (or alternatively, import the equivalent of gas-
fired electricity). If gas customers other then the power sector are added to the system, there will
be a need to import greater amounts of gas.

110
Figure 7. 4 Gas Demand/Supply Balance (bcm)
Source: Various – see Appendix A.
In summary, even with development of the Gaza Marine off-shore gas field the West Bank and
Gaza will remain an energy importer, including some combination of petroleum products, natural
gas, and electricity. However, development of the Gaza Marine gas field would add considerably
to supply diversity, security and price stability in the WBG. Expanding the renewable energy
base with solar thermal and wind would further stabilize the WBG’s energy future.
0
0.5
1
1.5
2
2.5
3
1990 2000 2008 2010 2020 2030
Production
Demand
Import

111
Chapter 8. MASHREQ’S NEIGHBORING COUNTRIES
The present study focuses on energy networks in the Mashreq countries. However, these
countries also have significant current or potential inter-linkages with some neighboring
countries. In particular, energy sector developments in four countries––Saudi Arabia, Libya,
Turkey, and Iran––may have relevance to energy integration in Mashreq countries. Saudi Arabia
is an important neighbor not only because of its own energy potential but also because it could
serve as the gateway between Mashreq and the Gulf Cooperation Council (GCC) countries.
However, at this stage, Saudi Arabia’s energy linkage to Mashreq countries is limited to a
potential electricity interconnection with Egypt that is being explored. Similarly, Libya could
serve as a gateway between Mashreq and the Maghreb countries. However, at this stage, its
linkage is limited to a 220kV interconnection with Egypt, which might be upgraded to 400 kV.
On the other hand, Turkey and Iran are of significant relevance to Mashreq because of their
extensive present and potential linkages with the Mashreq countries. This chapter reviews these
linkages to assess the impact of developments in Turkey and Iran on energy trade among
Mashreq countries.
Mashreq countries have aspired to connect their gas and power grids to the European Union
(EU) system, and often envision this action taking place through Turkey. At the same time,
Turkey has pursued a vision of becoming an energy hub. It thus has restructured its gas and
electricity sectors in line with EU practices and according to the standards that facilitate cross-
border energy trade. More recently, Turkey also is being considered as an avenue to import
electricity/gas into Mashreq countries in the short to medium terms, when some of these
countries may be short of gas and electricity. Therefore, a study of the Turkish gas and power
systems and Turkey’s reform experience can benefit the understanding of the type of cross-
border practices that Mashreq countries should pursue as well as potentially energy trade (import
and export) between Mashreq and Turkey.
Iran is another important neighboring country that, in many areas, complements the Mashreq
energy network. At the same time, Iran has the potential to compete with the Mashreq region for
electricity and gas exports to some common destinations, particularly Europe and Turkey. Thus,
the Iranian impact on Mashreq energy networks is potentially substantial. However, the nature of
this impact is quite complex due to numerous existing and potential linkages, as well as to
uncertainty in Iran’s ability to fund and implement new projects. This chapter’s brief study of
Iran is intended to provide a realistic sense of major gas and electricity interconnections that may
affect the Mashreq countries.
8.1.Case of Turkey
Turkey has a population of 73.9 million and a per capita income of $8,020. Its economic growth
has been impressive: 7 percent p.a. in 2000–08. Nevertheless, Turkey is feeling the effect of the
worldwide recession through a decline in export demand and capital inflows.
Turkey’s energy consumption is dependent on oil (35 percent) followed by natural gas (29
percent), coal and lignite (25 percent), and hydropower and other renewable energy (11 percent).
Compared to the country’s needs, its energy resource endowments are modest. Furthermore,

112
major portions of the energy demand are met by gas, oil, and coal imports. The cost of energy
imports in 2008 amounted to $48 billion, or approximately 36 percent of the value of Turkey’s
corresponding total exports.
8.1.1 Electricity Demand and Supply
During 2000–08, Turkey’s electricity demand grew at 5 percent p.a. Industrial consumers had the
largest share of total consumption (approximately 48 percent), followed by residential consumers
(24 percent), and commercial consumers (15 percent). The daily peak occurs in the early evening
hours. The seasonal peak occurs in winter. Moreover, as a result of the rise in tourism and air
conditioning loads, summer loads (especially in July and August) are rising rapidly. From time to
time, summer peaks approach the level of winter peak loads.
At 2,150 kWh, per capita annual electricity consumption in Turkey is approximately one-third of
that in the EU, and income elasticity will have a major influence on demand growth. By 2020,
the annual per capita electricity consumption is expected to rise to 5,200 kWh. Overall, for
2010–20, growth in electricity consumption is forecast at 7 percent p.a.
During the last decade, electricity supply capacity expanded rapidly from 23,354 MW in 1998 to
42,186 MW in 2008. Even though the installed generation capacity was 42,186 MW, the
available capacity was only approximately 33,000 MW. The causes were the wide variations in
the river flows from year to year that affected hydropower units and the old age of the lignite-
fired thermal power plants. Consequently, balancing supply against the peak demand of
approximately 32,500 MW was quite tight. Hydropower had the largest share (32.9 percent) of
installed capacity, but contributed only 16.8 percent of the total generation. In contrast, natural-
gas-fired combined cycle units had 32.3 percent of the capacity, but made the largest
contribution to generation at 48.4 percent. Lignite and hard coal had 23.9 percent of the capacity
and contributed 29.0 percent of the generation. Regarding ownership of the plants, private sector
plants had 51.8 percent of total generation whereas the state-owned units had a lower share of
48.2 percent.
8.1.2 Structure of the Electricity Sector
The original state-owned vertically integrated Turkish Electricity Corporation (TEK) was
unbundled over several years to enable private sector participation and the emergence of a
competitive electricity market. Currently generation in the public sector is handled by the
Electricity Generation Company of Turkey (EUAS). It directly owns most hydropower units and
acts as the holding company for six portfolio-generation companies with thermal power units and
some hydropower units. In addition, the private sector has established several generating units on
the basis of power purchase agreements guaranteed by the Government. There are also a few
privately owned independent power producers (IPPs). Industries with captive generating units
(called auto-producers) and privately owned renewable energy units also supply to the grid.
Transmission and dispatch are being handled by the Turkish Electricity Transmission Company
(TEIAS). It also operates the balancing market and acts as the settlement agency. Distribution is
handled by 21 regional distribution companies. Turkish Electricity Trading and Contracting
Company (TETAS) acts as single buyer and markets the power to distribution companies.
113
Electricity Market Regulatory Authority (EMRA) is the independent regulator of power, gas,
petroleum, and LPG, and carries out licensing, tariff-setting, and other associated
responsibilities.
8.1.3 Electricity Prices
Electricity prices in the balancing market fluctuate according to the short-term supply and
demand conditions. During 2007, the average price in this market was YTL 128/MWh
(approximately 11 US cents/kWh). At the retail level, The Government is maintaining a national
uniform tariff scheme. It is accompanied by an equalization scheme involving transfer of
revenues across the various distribution companies, so that each distribution company is able to
secure a level of revenues warranted by its cost structure. The average end-user price/kWh in the
fourth quarter of 2008 was 15.28 US cents, including taxes (12.68 cents excluding taxes).
Corresponding average residential prices were at 15.81 cents (with taxes) and 12.82 cents
(without taxes). The average nonresidential prices stood at 15.02 cents (with taxes) and 12.62
cents (without taxes).27
8.1.4 Electricity Trade
The Turkish grid is interconnected to those of Armenia (220 kV), Azerbaijan (154 kV), Bulgaria
(400 kV), Georgia (220 kV), Greece (154 kV), Iran (154 kV and 400 kV), Iraq (400 kV), and
Syria (400 kV). However, in recent years, the volume of electricity exchanges had been modest
at less than 2 percent of Turkey’s annual consumption. Imports from Bulgaria (significant in the
earlier years) had ceased from 2004. Imports from Turkmenistan via Iran have been increasing
notably since 2003, after the commissioning of the 270-km-long 220 kV line from Balkanabat
(Turkmenistan) to Gonbad (Iran) and farther to Khoy Bashkale (Turkey) and the transmission
line linking Serakhs (in Turkmenistan) to Sarakhs (in Iran). In 2004 the price for Turkey for
imports from Turkmenistan was reported at 3.45 US cents/kWh. The transit fee payable to Iran
was 0.65 cents/kWh. Georgia and Azerbaijan are seriously examining the possibilities of
expanding their exports to Turkey by promoting investments in new Georgian hydropower
projects and Azeri thermal power projects. Turkey’s electricity exports increased steadily from
433 GWh in 2001 to 2422 GWh by 2007. Exports to Azerbaijan fell, reflecting the domestic
supply improvements there. Electricity exports to Iraq and Syria have increased significantly.
Import and export of electricity in Turkey have been liberalized. Turkish electricity market
import export regulations follow Regulation 1228/2003 of the European Commission. Besides
TETAS, the state-owned power trading company, and the 22 distribution companies, there were
over 36 licensed private sector wholesale power traders. All of them were eligible to import and
export through the national grid. Many of the private licensees are large multinational firms.
Details of the existing interconnections between Turkey and its neighbors are given in table 8.1
and figure 8.1.
27
Information from www.erra.net

114
Figure 8. 1: Details of Existing interconnections between Turkey and Its Neighbors
Source: Cem Ali Atilgan, A Spotlight on the Turkish Electricity Market, June 2009.
Table 8. 1: Turkey’s Transmission Interconnection
Country Details of existing interconnection
Bulgaria Two 400 kV lines from Babaeskito in Turkey to Maritsa East Power station
in Bulgaria. The first one is 136 km long; its thermal limit for transmission
is 1000 MW. The second line is 150 km long; its thermal limit for
transmission capacity is 2000 MW.
Greece 400 kV line from Babaaeski to Nea Santa in Greece. Turkish portion was
completed in 2006, operated at 154 kV, and connects to Greece 154 kV
network. Greece portion was completed in mid-2008. When operated at 400
kV, its transmission capacity will be 2000 MW.
Georgia 220 kV line from Hopa (Turkey) to Batumi.
Price paid was 2.6 cents/kWh in 2007. Import in island mode
Armenia 220 kV. This has never been operated in the recent years.
Azerbaijan One 110 kV line and one 154 kV line from Nakhchivan enclave of
Azerbaijan to Turkey via Iran. Operates in island mode for import and
export.
Iraq 400 kV line operated at 154 kV Exports to Iraq take place in the island
mode. Prices paid by Iraq were reported at 4.9 Euro cents/kWh
(approximately 6.3 US cents).
115
Iran 154 kV link currently not in operation. But the new 400 kV link is operated
at 154 kV. Import of power from Iran takes place in island mode. Import
price from Iran was reported at 3.5 US cents/kWh in 2007.
Syria 400 kV AC line from Birecik (Turkey) to Halep (Syria). Exports to Syria
were done in unit direction mode in 2007 and in 2008.
Turkey and UCTE: Turkey appears to be making good progress with its application
(made initially in 2001) to join the UCTE with its 640 GW of generating capacity, annual
consumption of 2,600 TWh, and population of 500 million covering 24 countries. Several
studies financed by the European Commission (EC) under the Trans-European Networks
(TEN) program have assessed different scenarios for connecting the Turkish system to
UCTE through Bulgaria and Greece. In 2005 a study was started by UCTE to complete
the transmission assessments including static and stability analyses to determine the
technical conditions under which the synchronization could take place. Needed changes
and improvements to the Turkish generation and transmission systems are being pursued
on a priority basis. Their objective is to ensure synchronized operation with UCTE grids
in 2010. When this happens, Turkey will become an active and physical part of the
European internal power market.
Turkey and ECSEE: Turkey also is a signatory of the Athens Memoranda of 2002 and
2003.The EC initiated these memoranda to develop the regional electricity and gas
market in South East Europe and eventually integrate it with the internal power and gas
market of the EU. Turkey had not signed the Energy Community of South East Europe
(ECSEE) Treaty of October 2005 because some of the provisions are intertwined with
Turkey’s negotiations with EU for full EU accession. The country remains committed to
the Athens Memorandum of 2003 and implements its provisions.
Turkey and Other Interconnection Initiatives: Turkey’s joining UCTE through
interconnections with Greece is a key element of the Mediterranean Electricity Ring. It
interconnects the systems of France, Spain, Morocco, Algeria, Tunisia, Libya, Egypt,
Near Eastern countries, Turkey, Greece, and Italy. Similarly, the Turkey-Bulgaria link is
a key element of the initiative of Black Sea Electricity Ring, which interconnects the
systems of Russia, Ukraine, Romania, Bulgaria, Turkey, and Georgia.
Interconnections of Turkey with Syria and Iraq are key components of the Eight Countries
Interconnection Project. It links the systems of Egypt, Iraq, Jordan, Lebanon, Libya, Syria,
Palestine and Turkey. Studies are being carried out under EU financing to facilitate all of these
interconnections.
Azerbaijan, Georgia, and Turkey recently signed a Memorandum of Understanding (MOU) for a
Power Bridge Project to facilitate a much greater level of electricity trade among the three
countries. The project envisages (a) the construction of a new 500 kV AC line from Azgunz
(Azerbaijan) to Zeastaponi (Georgia) via Garadabani (Georgia); (b) construction of 500 kV AC
lines from Zestaponi and Gardabani to Akhalsikhe (Georgia); (c) back-to-back AC to DC and
DC to AC facility at Akhalsikhe; and (d) construction of a 400 kV AC line from this facility (in
Georgia) to Borchka in northeastern Turkey. The power transfer capacity of this “Power Bridge”
would be approximately 1000MW. Georgia is promoting investments in hydropower projects
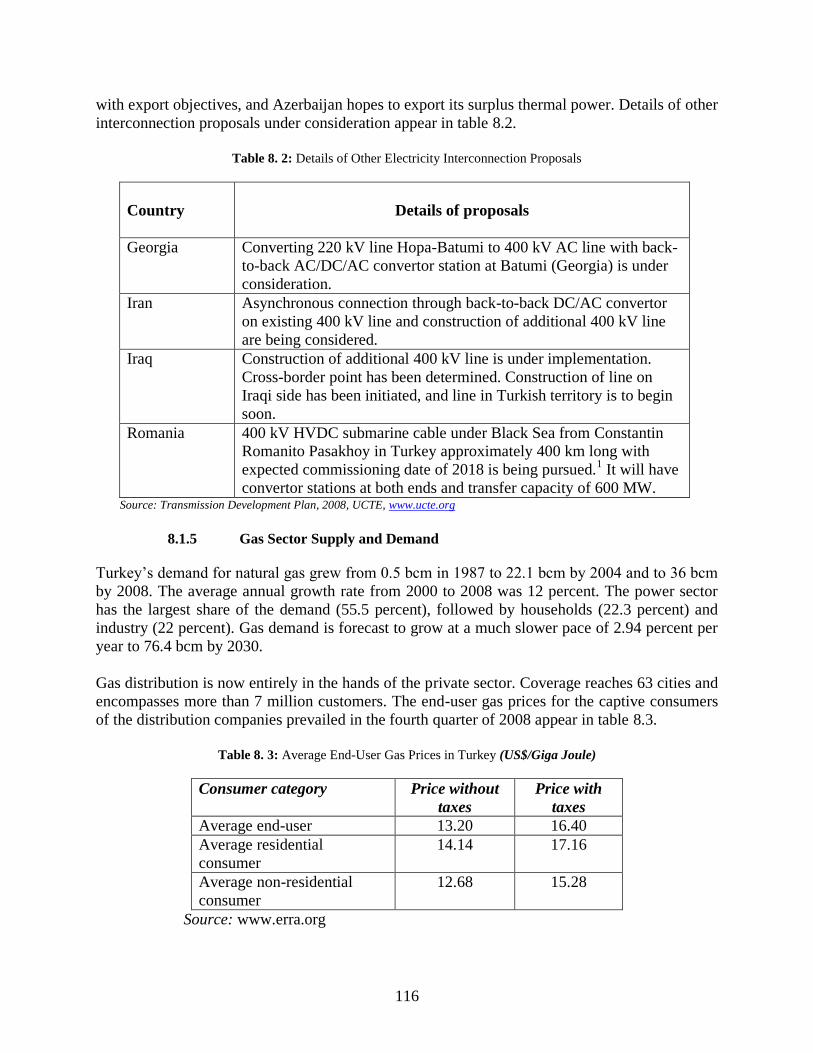
116
with export objectives, and Azerbaijan hopes to export its surplus thermal power. Details of other
interconnection proposals under consideration appear in table 8.2.
Table 8. 2: Details of Other Electricity Interconnection Proposals
Country
Details of proposals
Georgia Converting 220 kV line Hopa-Batumi to 400 kV AC line with back-
to-back AC/DC/AC convertor station at Batumi (Georgia) is under
consideration.
Iran Asynchronous connection through back-to-back DC/AC convertor
on existing 400 kV line and construction of additional 400 kV line
are being considered.
Iraq Construction of additional 400 kV line is under implementation.
Cross-border point has been determined. Construction of line on
Iraqi side has been initiated, and line in Turkish territory is to begin
soon.
Romania 400 kV HVDC submarine cable under Black Sea from Constantin
Romanito Pasakhoy in Turkey approximately 400 km long with
expected commissioning date of 2018 is being pursued.1 It will have
convertor stations at both ends and transfer capacity of 600 MW. Source: Transmission Development Plan, 2008, UCTE, www.ucte.org
8.1.5 Gas Sector Supply and Demand
Turkey’s demand for natural gas grew from 0.5 bcm in 1987 to 22.1 bcm by 2004 and to 36 bcm
by 2008. The average annual growth rate from 2000 to 2008 was 12 percent. The power sector
has the largest share of the demand (55.5 percent), followed by households (22.3 percent) and
industry (22 percent). Gas demand is forecast to grow at a much slower pace of 2.94 percent per
year to 76.4 bcm by 2030.
Gas distribution is now entirely in the hands of the private sector. Coverage reaches 63 cities and
encompasses more than 7 million customers. The end-user gas prices for the captive consumers
of the distribution companies prevailed in the fourth quarter of 2008 appear in table 8.3.
Table 8. 3: Average End-User Gas Prices in Turkey (US$/Giga Joule)
Consumer category Price without
taxes
Price with
taxes
Average end-user 13.20 16.40
Average residential
consumer
14.14 17.16
Average non-residential
consumer
12.68 15.28
Source: www.erra.org
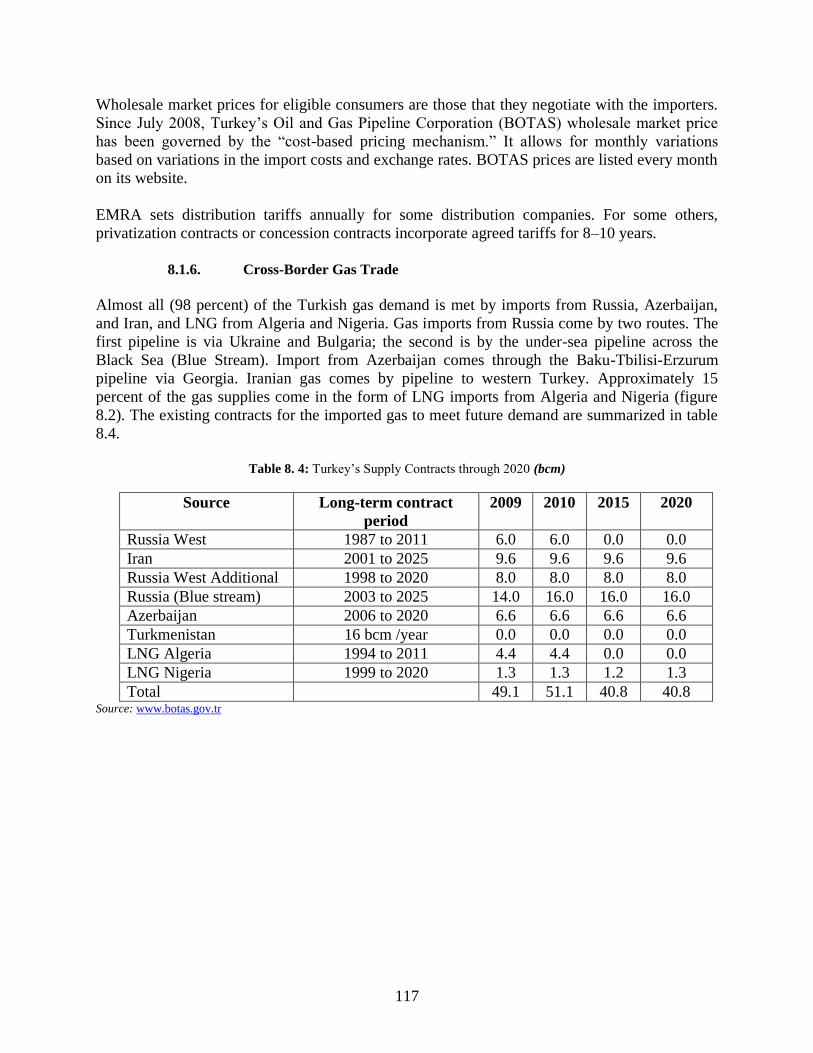
117
Wholesale market prices for eligible consumers are those that they negotiate with the importers.
Since July 2008, Turkey’s Oil and Gas Pipeline Corporation (BOTAS) wholesale market price
has been governed by the “cost-based pricing mechanism.” It allows for monthly variations
based on variations in the import costs and exchange rates. BOTAS prices are listed every month
on its website.
EMRA sets distribution tariffs annually for some distribution companies. For some others,
privatization contracts or concession contracts incorporate agreed tariffs for 8–10 years.
8.1.6. Cross-Border Gas Trade
Almost all (98 percent) of the Turkish gas demand is met by imports from Russia, Azerbaijan,
and Iran, and LNG from Algeria and Nigeria. Gas imports from Russia come by two routes. The
first pipeline is via Ukraine and Bulgaria; the second is by the under-sea pipeline across the
Black Sea (Blue Stream). Import from Azerbaijan comes through the Baku-Tbilisi-Erzurum
pipeline via Georgia. Iranian gas comes by pipeline to western Turkey. Approximately 15
percent of the gas supplies come in the form of LNG imports from Algeria and Nigeria (figure
8.2). The existing contracts for the imported gas to meet future demand are summarized in table
8.4.
Table 8. 4: Turkey’s Supply Contracts through 2020 (bcm)
Source Long-term contract
period
2009 2010 2015 2020
Russia West 1987 to 2011 6.0 6.0 0.0 0.0
Iran 2001 to 2025 9.6 9.6 9.6 9.6
Russia West Additional 1998 to 2020 8.0 8.0 8.0 8.0
Russia (Blue stream) 2003 to 2025 14.0 16.0 16.0 16.0
Azerbaijan 2006 to 2020 6.6 6.6 6.6 6.6
Turkmenistan 16 bcm /year 0.0 0.0 0.0 0.0
LNG Algeria 1994 to 2011 4.4 4.4 0.0 0.0
LNG Nigeria 1999 to 2020 1.3 1.3 1.2 1.3
Total 49.1 51.1 40.8 40.8 Source: www.botas.gov.tr
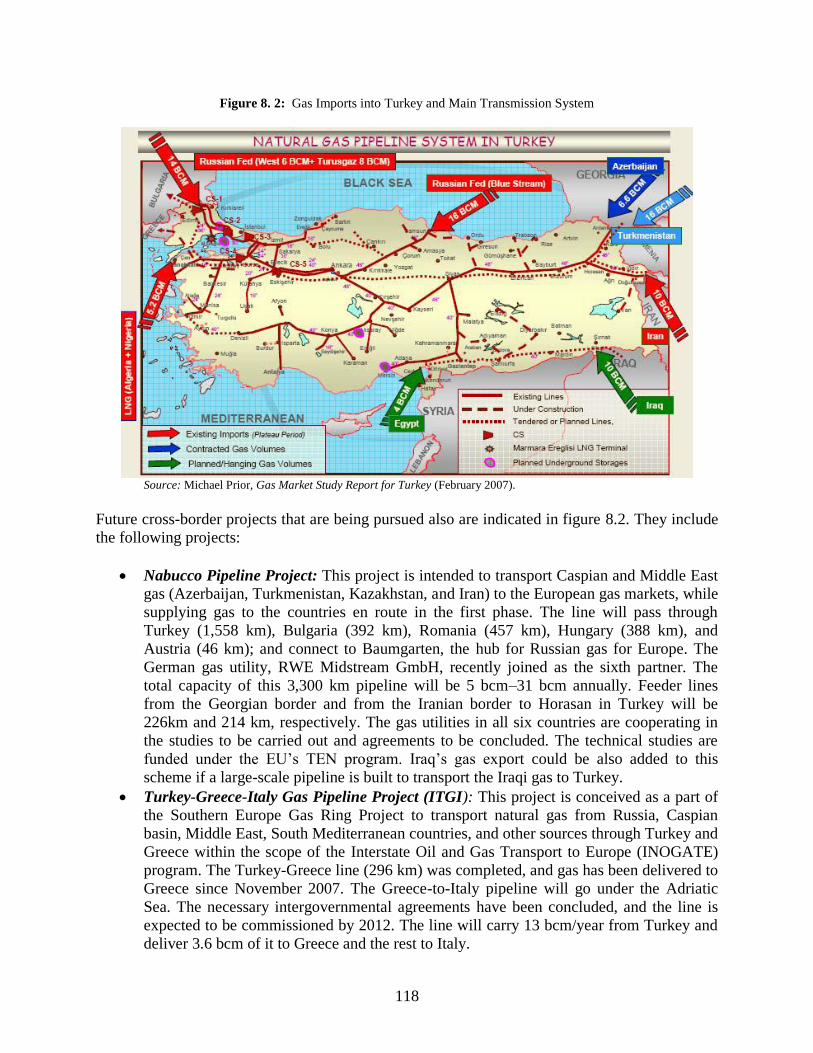
118
Figure 8. 2: Gas Imports into Turkey and Main Transmission System
Source: Michael Prior, Gas Market Study Report for Turkey (February 2007).
Future cross-border projects that are being pursued also are indicated in figure 8.2. They include
the following projects:
Nabucco Pipeline Project: This project is intended to transport Caspian and Middle East
gas (Azerbaijan, Turkmenistan, Kazakhstan, and Iran) to the European gas markets, while
supplying gas to the countries en route in the first phase. The line will pass through
Turkey (1,558 km), Bulgaria (392 km), Romania (457 km), Hungary (388 km), and
Austria (46 km); and connect to Baumgarten, the hub for Russian gas for Europe. The
German gas utility, RWE Midstream GmbH, recently joined as the sixth partner. The
total capacity of this 3,300 km pipeline will be 5 bcm–31 bcm annually. Feeder lines
from the Georgian border and from the Iranian border to Horasan in Turkey will be
226km and 214 km, respectively. The gas utilities in all six countries are cooperating in
the studies to be carried out and agreements to be concluded. The technical studies are
funded under the EU’s TEN program. Iraq’s gas export could be also added to this
scheme if a large-scale pipeline is built to transport the Iraqi gas to Turkey.
Turkey-Greece-Italy Gas Pipeline Project (ITGI): This project is conceived as a part of
the Southern Europe Gas Ring Project to transport natural gas from Russia, Caspian
basin, Middle East, South Mediterranean countries, and other sources through Turkey and
Greece within the scope of the Interstate Oil and Gas Transport to Europe (INOGATE)
program. The Turkey-Greece line (296 km) was completed, and gas has been delivered to
Greece since November 2007. The Greece-to-Italy pipeline will go under the Adriatic
Sea. The necessary intergovernmental agreements have been concluded, and the line is
expected to be commissioned by 2012. The line will carry 13 bcm/year from Turkey and
deliver 3.6 bcm of it to Greece and the rest to Italy.

119
Turkmenistan-Turkey-Europe Pipeline: Turkey and Turkmenistan concluded
agreements to supply 30 bcm/year of gas as far back as May 1999. Of this amount, 16
bcm was meant for Turkey and the rest for onward transit to Europe. Not much progress
has been made on this proposal, which involves a trans-Caspian submarine pipeline and
increasing the capacity of the existing Azeri-Turkish Baku-Tbilisi-Erzerum (BTE)
pipeline.
Egypt-Turkey Pipeline: This project is an extension of the Arab Gas Pipeline. The
former envisages supplying 2–4 bcm of Egyptian gas per year to Turkey and 2–6 bcm of
gas to Europe via Turkey. The MOU was signed by the two countries in February 2006.
Studies are being conducted.
Iraq-Turkey Pipeline: In August 2007, Iraq and Turkey agreed to carry out studies to
supply Iraqi gas to Turkey and Europe. Trade volumes of the order of 10 bcm/year were
envisaged in the discussions.
8.2.Case of Iran
Iran has a population of approximately 72 million and a per capita income of approximately
$3500. It is well endowed with oil and gas resources. Its proven oil reserves at the end of 2008
were estimated at 18.9 billion tons (10.9 percent of the world total and second largest in the
world after Saudi Arabia). Its proven gas reserves were estimated at 29.61 tcm (16 percent of the
world total and the second largest in the world after Russia). Its primary energy consumption in
2008 was estimated at 192.1 million tons of oil equivalent (MTOE), which comprised 55 percent
gas, 43 percent oil, and the rest hydroelectric.
8.2.1 Electricity Demand and Supply
In 2008 Iran’s electricity consumption reached 153 terawatt hour (TWh). The largest share (33.4
percent) belonged to the residential consumers followed by 32.6 percent to industrial consumers,
12.9 percent to public offices and services, 11.6 percent to agricultural consumers, and the rest to
miscellaneous consumers. The daily peak in the Iranian system is at approximately 9 PM. Base
load demand is approximately 40 percent of peak demand. The system’s annual peak occurs in
summer and minimum peak in winter or early spring. The seasonal variation in load is
significant. Peak demand of the system was forecast to grow from 37,053 MW in 2008 to 88,166
MW by 2020 at a rate of 8 percent p.a., tapering off to 5 percent p.a. by 2020.
Iran’s generating capacity reached 49,413 MW in 2008. Of this amount, 43,907 MW (or 88.9
percent) was in the public sector under the control of Ministry of Energy. The remaining 5,506
MW was in the private sector in the form of IPPs and as captive generating units of large
industries. Nearly 84.9 percent of the capacity was thermal, 15 percent hydroelectric, and
remaining 0.1 percent wind power stations.
To meet the growing demand, new generation capacity of 22,204 MW is expected to be added
from 2008 to 2016. Completion will bring the total installed capacity in the country to 71,617
MW. The new capacity will consist of 14,380 MW of gas-fired combined cycle units, 4,570 MW
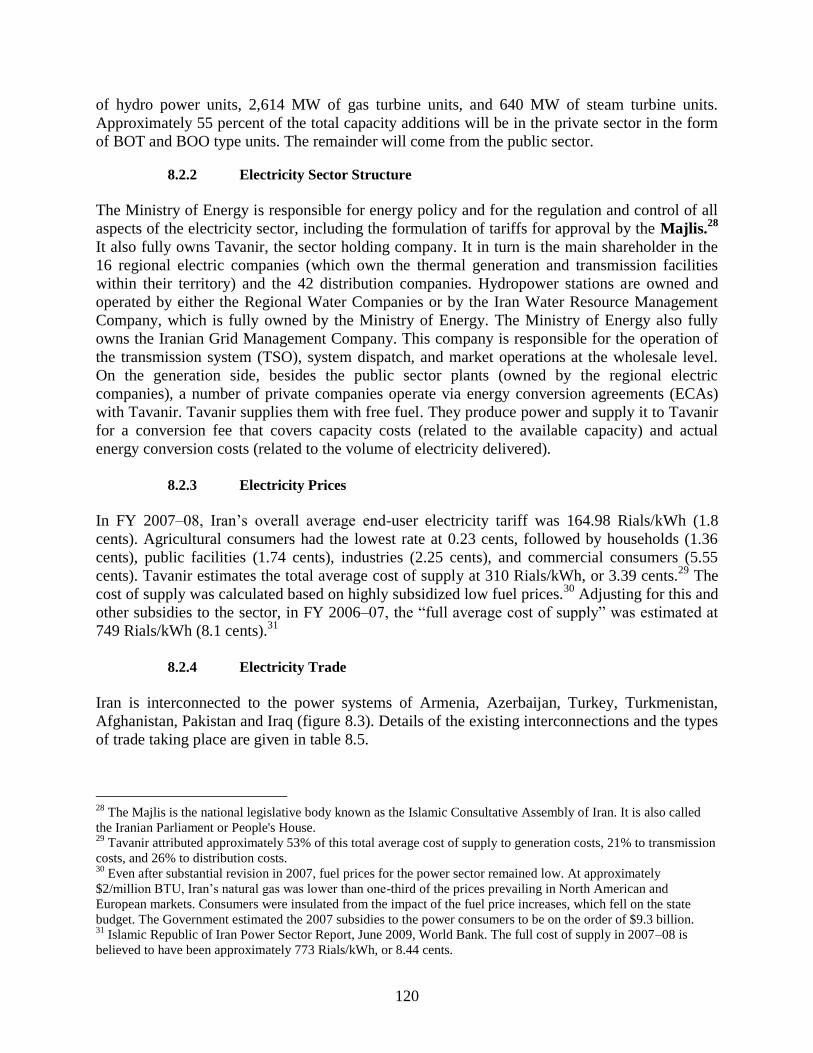
120
of hydro power units, 2,614 MW of gas turbine units, and 640 MW of steam turbine units.
Approximately 55 percent of the total capacity additions will be in the private sector in the form
of BOT and BOO type units. The remainder will come from the public sector.
8.2.2 Electricity Sector Structure
The Ministry of Energy is responsible for energy policy and for the regulation and control of all
aspects of the electricity sector, including the formulation of tariffs for approval by the Majlis.28
It also fully owns Tavanir, the sector holding company. It in turn is the main shareholder in the
16 regional electric companies (which own the thermal generation and transmission facilities
within their territory) and the 42 distribution companies. Hydropower stations are owned and
operated by either the Regional Water Companies or by the Iran Water Resource Management
Company, which is fully owned by the Ministry of Energy. The Ministry of Energy also fully
owns the Iranian Grid Management Company. This company is responsible for the operation of
the transmission system (TSO), system dispatch, and market operations at the wholesale level.
On the generation side, besides the public sector plants (owned by the regional electric
companies), a number of private companies operate via energy conversion agreements (ECAs)
with Tavanir. Tavanir supplies them with free fuel. They produce power and supply it to Tavanir
for a conversion fee that covers capacity costs (related to the available capacity) and actual
energy conversion costs (related to the volume of electricity delivered).
8.2.3 Electricity Prices
In FY 2007–08, Iran’s overall average end-user electricity tariff was 164.98 Rials/kWh (1.8
cents). Agricultural consumers had the lowest rate at 0.23 cents, followed by households (1.36
cents), public facilities (1.74 cents), industries (2.25 cents), and commercial consumers (5.55
cents). Tavanir estimates the total average cost of supply at 310 Rials/kWh, or 3.39 cents.29
The
cost of supply was calculated based on highly subsidized low fuel prices.30
Adjusting for this and
other subsidies to the sector, in FY 2006–07, the “full average cost of supply” was estimated at
749 Rials/kWh (8.1 cents).31
8.2.4 Electricity Trade
Iran is interconnected to the power systems of Armenia, Azerbaijan, Turkey, Turkmenistan,
Afghanistan, Pakistan and Iraq (figure 8.3). Details of the existing interconnections and the types
of trade taking place are given in table 8.5.
28
The Majlis is the national legislative body known as the Islamic Consultative Assembly of Iran. It is also called
the Iranian Parliament or People's House. 29
Tavanir attributed approximately 53% of this total average cost of supply to generation costs, 21% to transmission
costs, and 26% to distribution costs. 30
Even after substantial revision in 2007, fuel prices for the power sector remained low. At approximately
$2/million BTU, Iran’s natural gas was lower than one-third of the prices prevailing in North American and
European markets. Consumers were insulated from the impact of the fuel price increases, which fell on the state
budget. The Government estimated the 2007 subsidies to the power consumers to be on the order of $9.3 billion. 31
Islamic Republic of Iran Power Sector Report, June 2009, World Bank. The full cost of supply in 2007–08 is
believed to have been approximately 773 Rials/kWh, or 8.44 cents.
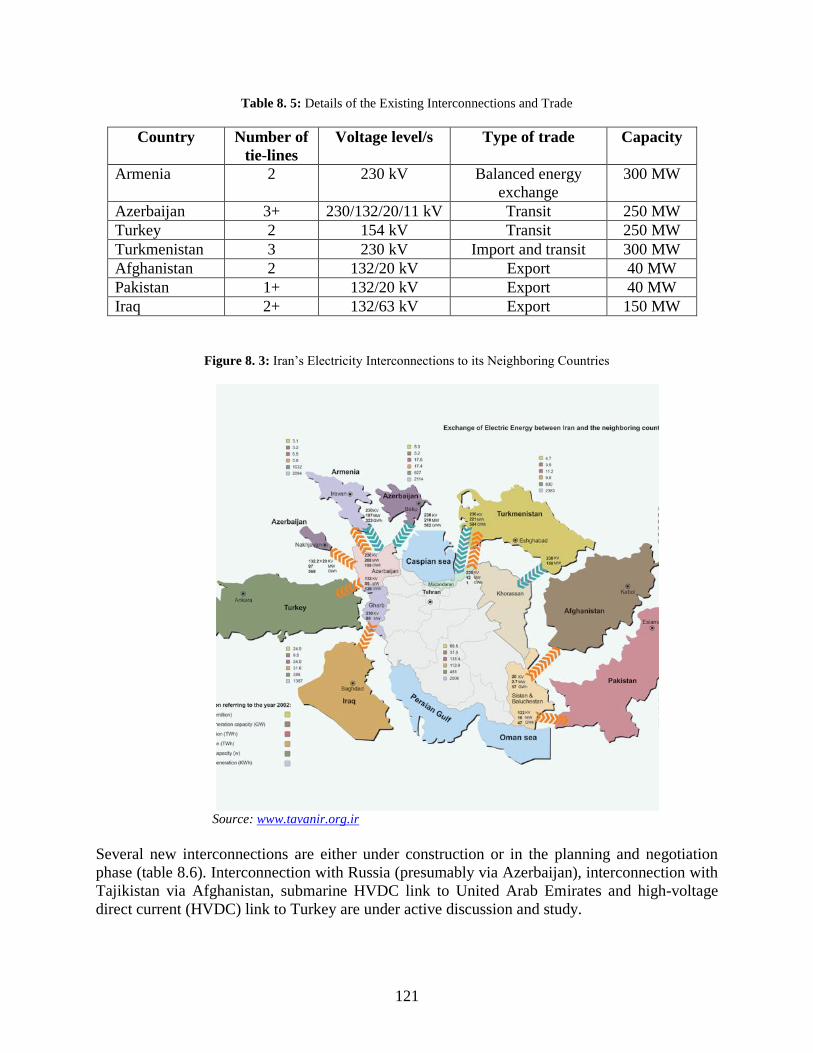
121
Table 8. 5: Details of the Existing Interconnections and Trade
Country Number of
tie-lines
Voltage level/s Type of trade Capacity
Armenia 2 230 kV Balanced energy
exchange
300 MW
Azerbaijan 3+ 230/132/20/11 kV Transit 250 MW
Turkey 2 154 kV Transit 250 MW
Turkmenistan 3 230 kV Import and transit 300 MW
Afghanistan 2 132/20 kV Export 40 MW
Pakistan 1+ 132/20 kV Export 40 MW
Iraq 2+ 132/63 kV Export 150 MW
Figure 8. 3: Iran’s Electricity Interconnections to its Neighboring Countries
Source: www.tavanir.org.ir
Several new interconnections are either under construction or in the planning and negotiation
phase (table 8.6). Interconnection with Russia (presumably via Azerbaijan), interconnection with
Tajikistan via Afghanistan, submarine HVDC link to United Arab Emirates and high-voltage
direct current (HVDC) link to Turkey are under active discussion and study.

122
Table 8. 6: Electricity Interconnections under Construction or Planning
Country Number of
tie-lines
Voltage
level/s
Type of trade Capacity
Armenia 1 400 kV Barter-ECA 300-600 MW
Azerbaijan 1 400 kV Interstate trade Under study
Russia NA Under
negotiation
Transit or Interstate
trades
Under negotiation
Turkey 1 400 kV Export 250-650 MW
Turkmenistan 1 400 kV Import and Transit 300 MW + 500
MW
Tajikistan Via
Afghanistan
400 kV
Swap
1000 MW
Pakistan Under
study
400 kV
Pakistan 1 230 kV Export 120 MW
Iraq Up to 9 400 /230/132
kV
Export 900 MW
Source: Presentation by the Iranian Ministry of Energy, February 19, 2008. www.igmc.ir/usrFiles/.../ElectricPowerIndustry-
IRI-Feb-2008.ppt -
8.2.5 Natural Gas Sector
Iran’s proven natural gas reserves were estimated at 29.61 tcm. Approximately one-third of the
reserves consist of associated gas. The rest is non-associated. Current production is
approximately 30 percent based on associated, and 70 percent based on non-associated, gas
resources. Most of the gas reserves are located in the southern and southwestern end of the
country. In contrast, most of the major demand centers are in the north and northwest and require
an extensive transmission system for domestic use. A notable percentage of the gas produced is
used for reinjection in oil fields to enhance oil recovery. It is reported that approximately 30 bcm
of gas was re-injected in oil wells in 2008. This volume will peak at100 bcm/year within the next
10 years. Another notable portion of the associated gas is simply flared. The amount of gas flared
came down from 11 bcm/year in prior years to approximately 8.4 bcm in FY 2007–08. This
wasted resource surpasses the volume of Iran’s gas exports to Turkey or imports from
Turkmenistan.
The National Iranian Gas Company (NIGC) is the key institution in the gas sector. It has 44
subsidiaries including 8 gas treatment companies, 1 gas transmission company, 1 gas storage
company, and 30 provincial gas companies. There also is a National Iranian Gas Export
Company handling gas exports. It is a subsidiary of the National Iranian Oil Company (NIOC),
not of NIGC. In the context of domestic gas shortages, this arrangement is not helpful. The need
is to carefully coordinate domestic needs and export commitments.
Gas production and consumption have grown rapidly at 8.6 percent p.a. and 8.1 percent p.a.,
respectively. Gas transmission system consists of 28000 km of (42 inch–56 inch diameter)
pipeline with a capacity of approximately500 mcm/day. The gas distribution network is

123
extensive (approximately 150,000 km) and serves 660 cities and 5,700 rural areas. Households
and commercial customers represent a major component of gas demand accounting for 40
percent of total consumption. The power sector uses 32 percent and the industrial sector 27
percent of the total gas sales. Encouraged by subsidized pricing, gas demand is forecast to grow
rapidly. Residential and commercial demand is expected to grow at 6.3 percent annually during
2008–20. The growth rates forecast for industrial demand is 5.1 percent and those for power and
transportation are 5.8 percent and 18.9 percent, respectively. Gas reinjection demand is expected
to increase more than three-fold to approximately 103 bcm/year. The overall gas demand growth
(including reinjection needs and other miscellaneous needs) is forecast at 6 percent/year during
2008–20.
8.2.6 Gas Prices
Gas prices for various categories of consumers range from 1–2 cents/m3 compared to the range
of 4–6 cents required for financial cost recovery in the sector. Retail tariffs in 2008 were
approximately $0.37/million BTU (MMBTU) for residential consumers; $0.75/MMBTU for
commercial, $0.47/MMBTU for industrial, and $0.15/MMBTU for the power sector. The
Government estimates that the state subsidy to gas consumers was $5.76 billion. Such low prices
have fostered rapid growth in consumption leading to a tight supply/demand balance, especially
during the winter season when domestic demand peaks. In January 2008, the weather became
very cold, and the demand for gas rose sharply. A gas crisis ensued. It was aggravated by the
price dispute with Turkmenistan (discussed below), which suspended exports to Iran. Iran then
had to renege on its export contracts to Turkey and divert export gas for domestic use. Similarly,
Iran suspended supplies to industries, and diverted gas to household use.
Table 8. 7: Natural Gas Retail Tariffs 2001–02 to 2006–07 (US cents/m3)
Consumer category 2001–02 2002–03 2003–04 2004–05 2005–06 2006–07
Residential 0.88 0.83 0.88 0.90 0.88 0.87
Commercial 1.93 2.00 2.04 2.25 2.19 2.16
Industry 1.67 1.52 1.51 1.56 1.52 1.50
Power plants 0.32 0.33 0.33 0.33 0.32 0.32
Public services 1.93 2.00 2.04 2.25 2.19 2.16
Special commercial 0.26 0.26 0.27 0.39 0.38 0.38
Special religious 0.07 0.37 0.37 0.39 0.38 0.38
Educational 1.18 1.08 1.08 0.79 0.77 0.76
Sports 1.18 1.08 1.08 0.79 0.77 0.76
In 2003 the gas price to the power sector was raised from 15 cents/million BTU to $2.0/million
BTU. However, retail power prices were not raised, so the costs had to be borne by state subsidy
to the power holding company (Tavanir).
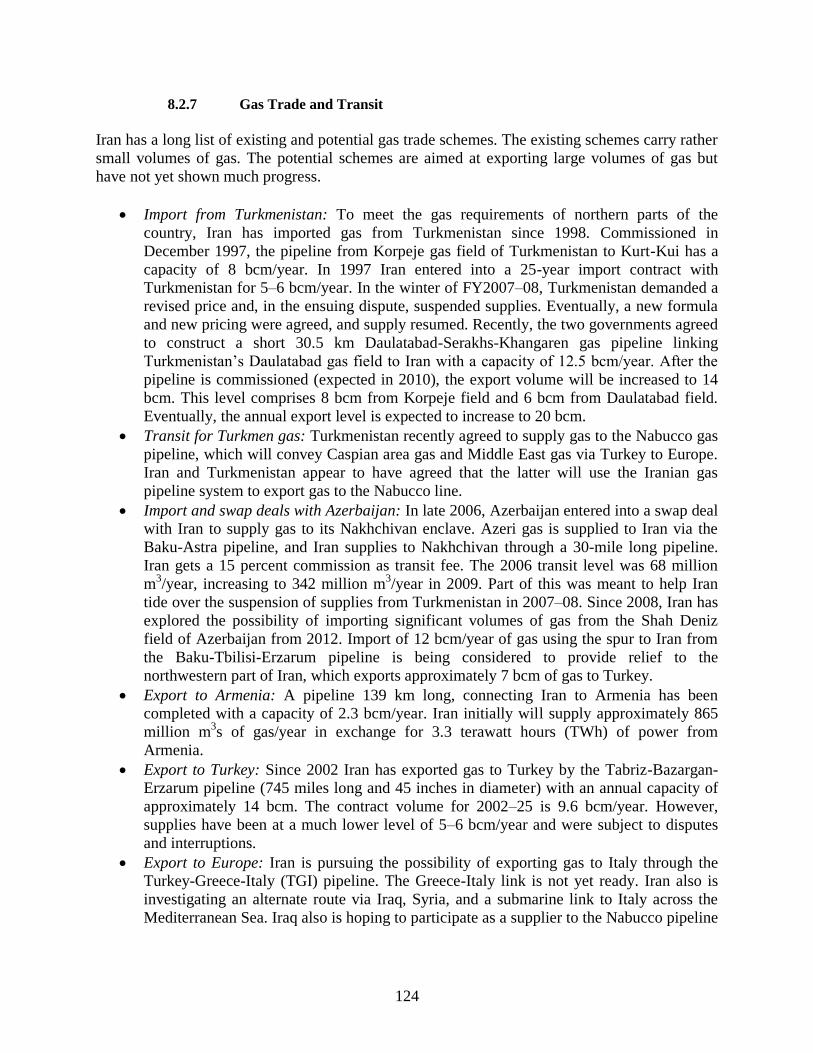
124
8.2.7 Gas Trade and Transit
Iran has a long list of existing and potential gas trade schemes. The existing schemes carry rather
small volumes of gas. The potential schemes are aimed at exporting large volumes of gas but
have not yet shown much progress.
Import from Turkmenistan: To meet the gas requirements of northern parts of the
country, Iran has imported gas from Turkmenistan since 1998. Commissioned in
December 1997, the pipeline from Korpeje gas field of Turkmenistan to Kurt-Kui has a
capacity of 8 bcm/year. In 1997 Iran entered into a 25-year import contract with
Turkmenistan for 5–6 bcm/year. In the winter of FY2007–08, Turkmenistan demanded a
revised price and, in the ensuing dispute, suspended supplies. Eventually, a new formula
and new pricing were agreed, and supply resumed. Recently, the two governments agreed
to construct a short 30.5 km Daulatabad-Serakhs-Khangaren gas pipeline linking
Turkmenistan’s Daulatabad gas field to Iran with a capacity of 12.5 bcm/year. After the
pipeline is commissioned (expected in 2010), the export volume will be increased to 14
bcm. This level comprises 8 bcm from Korpeje field and 6 bcm from Daulatabad field.
Eventually, the annual export level is expected to increase to 20 bcm.
Transit for Turkmen gas: Turkmenistan recently agreed to supply gas to the Nabucco gas
pipeline, which will convey Caspian area gas and Middle East gas via Turkey to Europe.
Iran and Turkmenistan appear to have agreed that the latter will use the Iranian gas
pipeline system to export gas to the Nabucco line.
Import and swap deals with Azerbaijan: In late 2006, Azerbaijan entered into a swap deal
with Iran to supply gas to its Nakhchivan enclave. Azeri gas is supplied to Iran via the
Baku-Astra pipeline, and Iran supplies to Nakhchivan through a 30-mile long pipeline.
Iran gets a 15 percent commission as transit fee. The 2006 transit level was 68 million
m3/year, increasing to 342 million m
3/year in 2009. Part of this was meant to help Iran
tide over the suspension of supplies from Turkmenistan in 2007–08. Since 2008, Iran has
explored the possibility of importing significant volumes of gas from the Shah Deniz
field of Azerbaijan from 2012. Import of 12 bcm/year of gas using the spur to Iran from
the Baku-Tbilisi-Erzarum pipeline is being considered to provide relief to the
northwestern part of Iran, which exports approximately 7 bcm of gas to Turkey.
Export to Armenia: A pipeline 139 km long, connecting Iran to Armenia has been
completed with a capacity of 2.3 bcm/year. Iran initially will supply approximately 865
million m3s of gas/year in exchange for 3.3 terawatt hours (TWh) of power from
Armenia.
Export to Turkey: Since 2002 Iran has exported gas to Turkey by the Tabriz-Bazargan-
Erzarum pipeline (745 miles long and 45 inches in diameter) with an annual capacity of
approximately 14 bcm. The contract volume for 2002–25 is 9.6 bcm/year. However,
supplies have been at a much lower level of 5–6 bcm/year and were subject to disputes
and interruptions.
Export to Europe: Iran is pursuing the possibility of exporting gas to Italy through the
Turkey-Greece-Italy (TGI) pipeline. The Greece-Italy link is not yet ready. Iran also is
investigating an alternate route via Iraq, Syria, and a submarine link to Italy across the
Mediterranean Sea. Iraq also is hoping to participate as a supplier to the Nabucco pipeline

125
via Turkey. Iran already agreed to allow Turkmenistan to supply the Nabucco line using
Iranian pipelines for transit through Iran.
Export to Pakistan and India: For over a decade, Iran pursued the idea of exporting gas
from South Pars field to Pakistan and India via a 2,670 km long 48-inch or 56-inch in
diameter pipeline at an estimated capital cost exceeding $7 billion. The pipeline would
have an annual capacity of 5.4 billion cubic feet/day (or 54.3 bcm/year). In 2007 Pakistan
and Iran agreed bilaterally that, for 30 years, Iran will supply 21.7 bcm/year of gas in the
first phase, and 33.1 bcm of gas/year in the second phase. Iran will extend its east-west
Iranian Gas Trunkline (IGAT) VII pipeline to the Pakistani border. Pakistan will
construct 1,042 km of pipeline in its territory up to India’s border. Pakistan will provide
security for the line and take the responsibility to deliver to India its share of gas, for
which Pakistan will charge a transit fee and a transmission charge. The prices discussed
at that time were $4.93/million Btu for delivery to the Iran-Pakistan border, and
$6.99/million Btu to the Pakistan- India border. Both were linked to the crude oil price of
$60/barrel prevailing then. However, until now, India has not agreed to the various
elements of the prices. It is possible that initially Pakistan will import approximately 30
bcm of gas/year and expect India to join at a later stage.
Trade with Other Gulf States: Iran had been pursuing the possibility of exporting gas to
UAE, Bahrain, Kuwait, Oman and also been looking to the possibility of gas exchange
with some of these countries, since Iran’s peak demand for gas occurs in winter, while
the Gulf states have their peak demands in summer.
Iran’s LNG schemes: Iran has been pursuing three LNG projects: Iran LNG, Pars LNG
and Persian LNG. South Pars Development Phases 11–14 is expected to provide the gas
for these three LNG projects. Iran LNG is supposed to go into production in 2011 with a
capacity of 10.8 million tons/year. Pars LNG, with a similar capacity, is scheduled to be
commissioned by 2012. Persian LNG with a capacity of 16.2 million tons/year has a
target commissioning date of 2013. Sanctions against Iran seem to be slowing investment
by international oil companies and the use of US technology to liquefy gas. The
commissioning dates of the Iran and Persian LNG plants are likely to be postponed. The
Chinese company CNOOC signed an MOU in December 2006 for the fourth LNG
project. It would have an annual capacity of 20 million tons with gas from the North Pars
gas field. In addition, MOUs have been signed with a Malaysian group and an Australian
group for a 10-million-ton plant using Golshan and Ferdowsi gas fields and a 3.5 ton
LNG plant in Qeshm Island. All of the LNG schemes are facing challenges in financing.
Prospects for implementation of these projects have further deteriorated due to the
increase in the capital costs of LNG facilities and the soft conditions of the LNG market.
8.2.8 Conclusions
Turkey’s case study provides very useful insights for the energy integration of Mashreq
countries. First, Turkey is an excellent destination for both electricity and gas exports. It has
attractive prices, market structures, and market players. In view of its impending membership in
UCTE and synchronous operation with the European grid, Turkey would seem a convenient
gateway to the European electricity markets. Turkey also is establishing itself as a transit country
for natural gas transport to the European market.

126
Second, Turkey has been successful in establishing a market structure and regulation conducive
to energy trade. This latter aspect provides very good lessons for Mashreq countries. Turkey’s
success in this area is to some extent related to its incentive to join the EU systems, but the
accomplishments in both electricity and gas markets are applicable to Mashreq countries. In the
electricity market, the approach is described well in the “Electricity Market and Security of
Supply Strategy Paper” approved by the High Planning Council of Turkey on May 18, 2009. The
approach for increasing electricity trade includes eight components:
The goal is to join UCTE and operate the Turkish system in a parallel and synchronous
manner with the European Transmission network in 2010.
The studies and improvements to the grid must be completed in time to achieve this goal.
The cross-border trade with Europe must conform to the EU Cross-Border Trade
Directive and national legislation.
Connections with other non-EU countries will have to comply with conditions required
for Turkey’s membership in UCTE and its connection to the European grid.
For such countries, the direct current (DC) method will be used involving the
construction and the use of AC to DC and DC to AC convertor stations. Convertor
stations and facilities that have to be constructed within Turkey’s border will be
constructed by TEIAS as part of the national transmission system.
Until such DC connection facilities become available, import /export will be possible
through unit direction.
Export/import also will be possible in an island mode.
Trade carried out by unit direction or in island mode must not adversely affect the quality
and security of supply on the Turkish system. Quality of imports must conform to
Turkish legislation.
The Electricity Market Law of 2001 obliges the transmission and distribution companies to allow
open, guaranteed, and nondiscriminatory access to the network by third parties to facilitate
competition in the electricity market. All such third-party access to the networks, connection
fees, and system usage tariffs are regulated by EMRA. The grid codes and electricity market
licensing regulations incorporate the principles and practices of third-party access and its
requirements. Transmission system capacity for export-import transactions is allocated pro-rata
by TEIAS. TEIAS is obliged to use a bidding process when such demand from traders exceeds
available capacity. Procedures relating to transmission access are broadly in line with EU
directives. When the capacity demand for imports/exports is within the available capacity,
normal regulated transmission tariffs apply.
The arrangements to facilitate cross-border gas trade have also been impressive. Until 2001,
BOTAS was the monopoly responsible for imports, transmission, wholesale operations, storage,
and distribution of natural gas. The Natural Gas Market Law of 2001 restructured the market to
enable private sector entry and competition along the lines of the EU gas directives. Under this
law, BOTAS was not allowed to sign new import contracts until its market share fell to 20
percent; was obliged to transfer 80 percent of the existing contracts or the volumes of supply
under them, to new entrants by 2009; no longer was allowed to carry on distribution activity; and
was obliged to privatize its distribution subsidiaries. Private sector investments were allowed in
imports, exports, gas trading, storage, and distribution. Only transmission was envisaged to be in

127
the public sector. BOTAS was further obliged to unbundle its transmission, trading, and storage
functions and privatize the last two functions by 2009. The distribution segment was privatized,
and some progress has been achieved on other aspects. However, the target date of 2009 proved
optimistic, especially in relation to the transfer of contracts or volumes of contracted gas to new
private entrants to the import trade.
Study of the Iran case is useful in that it separates real prospects from numerous ideas for cross-
border energy trade. Iran’s substantial gas reserves give it a comparative advantage in electricity
exports to Turkey and also possibly via Turkey to the European systems. Iran also will be a key
transit country for the electricity exports from Turkmenistan to Turkey and beyond. In the short
term, a 180-km submarine HVDC link between Iran and UAE is imminent. The link will have a
transfer capacity of 1,500 MW and will connect Iran to the Gulf Cooperation Council (GCC)
Grid comprising the six Arab states of Kuwait, Saudi Arabia, Bahrain, Qatar, United Arab
Emirates (UAE), and Oman.
Gas export projects include several LNG options as well as pipeline systems to South Asia and
also to Europe. The pipeline to Europe is envisaged to carry up to 35 bcm/year of gas through
either the proposed Nabucco pipeline system or alternative routes. Options for gas exports from
Iran have been under negotiation among the involved parties for a long time. Although these
options would have a significant impact on the regional markets, the likelihood of their
implementation appears low. In view of the high growth of domestic demand and the steeply
growing gas reinjection needs of the oil wells, Iran’s ability to increase dramatically its volume
of gas exports by pipeline in the near future is considered doubtful by many. This conclusion is
particularly likely given the international sanctions, domestic policy stance, and organizational
complexity of the country, which are unlikely to attract the foreign investment needed to increase
production.
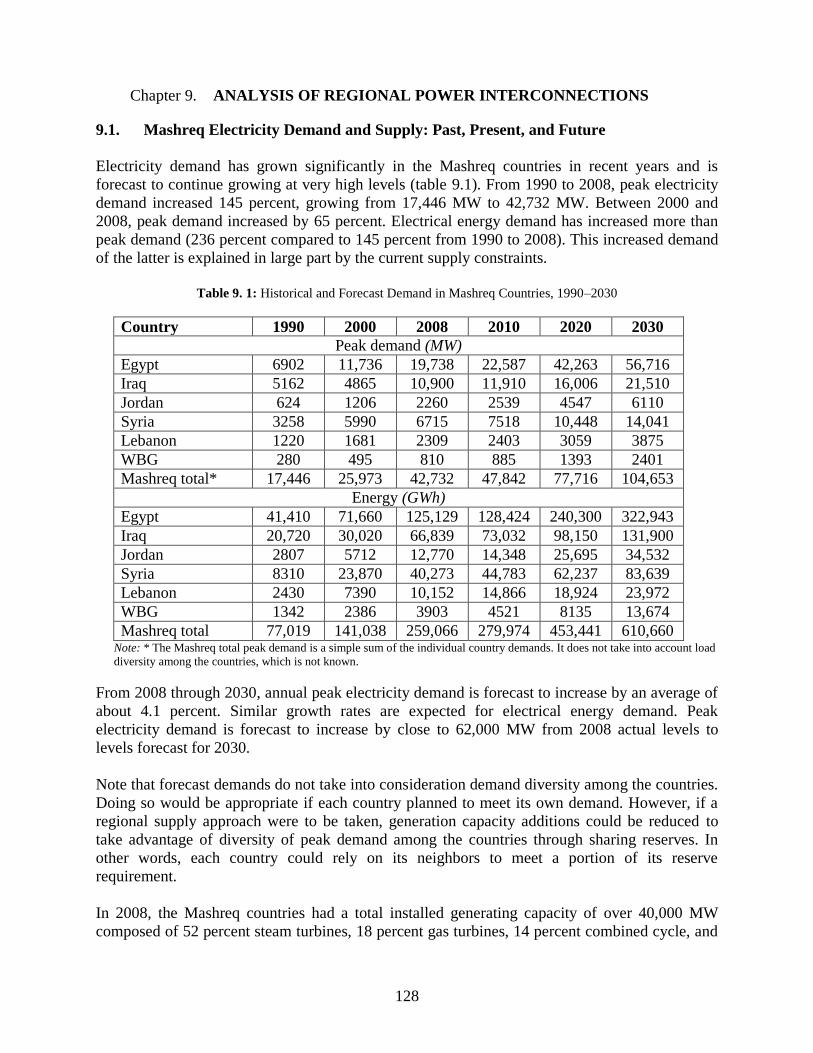
128
Chapter 9. ANALYSIS OF REGIONAL POWER INTERCONNECTIONS
9.1. Mashreq Electricity Demand and Supply: Past, Present, and Future
Electricity demand has grown significantly in the Mashreq countries in recent years and is
forecast to continue growing at very high levels (table 9.1). From 1990 to 2008, peak electricity
demand increased 145 percent, growing from 17,446 MW to 42,732 MW. Between 2000 and
2008, peak demand increased by 65 percent. Electrical energy demand has increased more than
peak demand (236 percent compared to 145 percent from 1990 to 2008). This increased demand
of the latter is explained in large part by the current supply constraints.
Table 9. 1: Historical and Forecast Demand in Mashreq Countries, 1990–2030
Country 1990 2000 2008 2010 2020 2030
Peak demand (MW)
Egypt 6902 11,736 19,738 22,587 42,263 56,716
Iraq 5162 4865 10,900 11,910 16,006 21,510
Jordan 624 1206 2260 2539 4547 6110
Syria 3258 5990 6715 7518 10,448 14,041
Lebanon 1220 1681 2309 2403 3059 3875
WBG 280 495 810 885 1393 2401
Mashreq total* 17,446 25,973 42,732 47,842 77,716 104,653
Energy (GWh)
Egypt 41,410 71,660 125,129 128,424 240,300 322,943
Iraq 20,720 30,020 66,839 73,032 98,150 131,900
Jordan 2807 5712 12,770 14,348 25,695 34,532
Syria 8310 23,870 40,273 44,783 62,237 83,639
Lebanon 2430 7390 10,152 14,866 18,924 23,972
WBG 1342 2386 3903 4521 8135 13,674
Mashreq total 77,019 141,038 259,066 279,974 453,441 610,660 Note: * The Mashreq total peak demand is a simple sum of the individual country demands. It does not take into account load
diversity among the countries, which is not known.
From 2008 through 2030, annual peak electricity demand is forecast to increase by an average of
about 4.1 percent. Similar growth rates are expected for electrical energy demand. Peak
electricity demand is forecast to increase by close to 62,000 MW from 2008 actual levels to
levels forecast for 2030.
Note that forecast demands do not take into consideration demand diversity among the countries.
Doing so would be appropriate if each country planned to meet its own demand. However, if a
regional supply approach were to be taken, generation capacity additions could be reduced to
take advantage of diversity of peak demand among the countries through sharing reserves. In
other words, each country could rely on its neighbors to meet a portion of its reserve
requirement.
In 2008, the Mashreq countries had a total installed generating capacity of over 40,000 MW
composed of 52 percent steam turbines, 18 percent gas turbines, 14 percent combined cycle, and
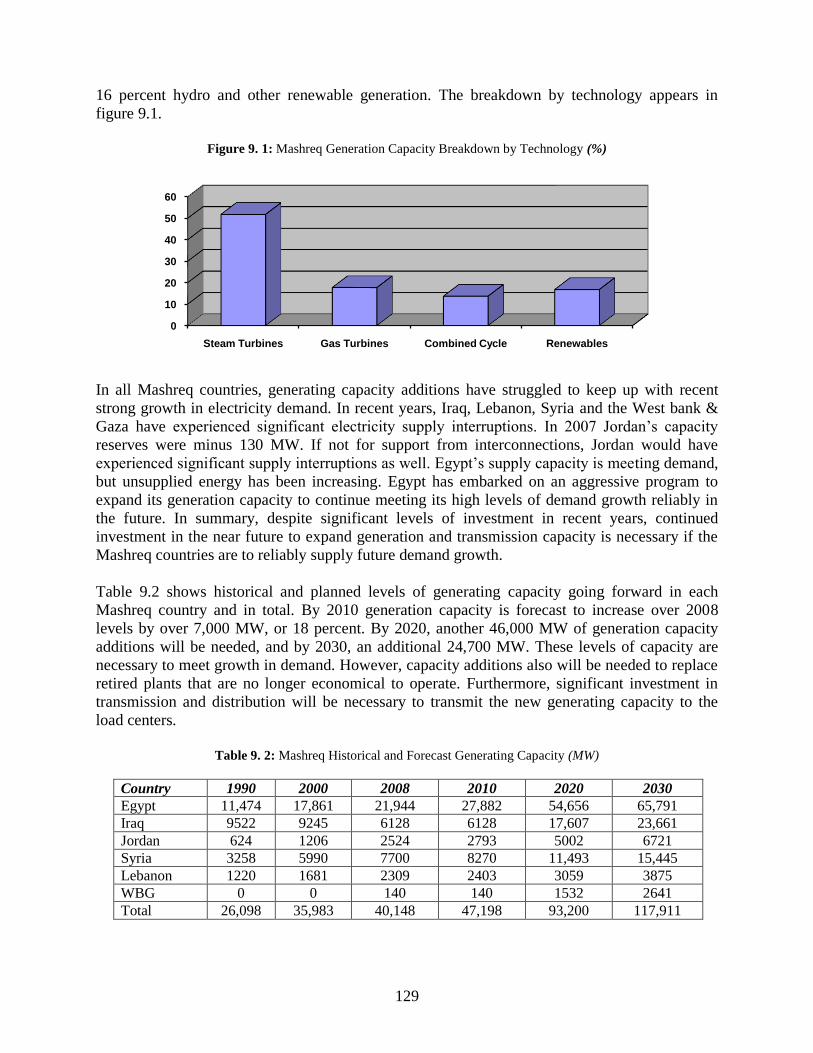
129
16 percent hydro and other renewable generation. The breakdown by technology appears in
figure 9.1.
Figure 9. 1: Mashreq Generation Capacity Breakdown by Technology (%)
In all Mashreq countries, generating capacity additions have struggled to keep up with recent
strong growth in electricity demand. In recent years, Iraq, Lebanon, Syria and the West bank &
Gaza have experienced significant electricity supply interruptions. In 2007 Jordan’s capacity
reserves were minus 130 MW. If not for support from interconnections, Jordan would have
experienced significant supply interruptions as well. Egypt’s supply capacity is meeting demand,
but unsupplied energy has been increasing. Egypt has embarked on an aggressive program to
expand its generation capacity to continue meeting its high levels of demand growth reliably in
the future. In summary, despite significant levels of investment in recent years, continued
investment in the near future to expand generation and transmission capacity is necessary if the
Mashreq countries are to reliably supply future demand growth.
Table 9.2 shows historical and planned levels of generating capacity going forward in each
Mashreq country and in total. By 2010 generation capacity is forecast to increase over 2008
levels by over 7,000 MW, or 18 percent. By 2020, another 46,000 MW of generation capacity
additions will be needed, and by 2030, an additional 24,700 MW. These levels of capacity are
necessary to meet growth in demand. However, capacity additions also will be needed to replace
retired plants that are no longer economical to operate. Furthermore, significant investment in
transmission and distribution will be necessary to transmit the new generating capacity to the
load centers.
Table 9. 2: Mashreq Historical and Forecast Generating Capacity (MW)
Country 1990 2000 2008 2010 2020 2030
Egypt 11,474 17,861 21,944 27,882 54,656 65,791
Iraq 9522 9245 6128 6128 17,607 23,661
Jordan 624 1206 2524 2793 5002 6721
Syria 3258 5990 7700 8270 11,493 15,445
Lebanon 1220 1681 2309 2403 3059 3875
WBG 0 0 140 140 1532 2641
Total 26,098 35,983 40,148 47,198 93,200 117,911
0
10
20
30
40
50
60
Steam Turbines Gas Turbines Combined Cycle Renewables

130
The electricity demand/supply picture for Mashreq is summarized in figure 9.2. The blue bar
shows historical and forecast demand. The purple bar shows historical and existing generation
capacity (in 2008). The yellow bar shows the amount of new capacity needed to meet growing
demand with adequate levels of reliability (assuming a 10 percent reserve margin). This new
generating capacity is needed to supplement existing generation capacity, but does not take into
account the new investment needed to replace retired plant. Mashreq will need almost 75,000
MW of capacity additions by 2030, representing a 187 percent increase over current levels of
capacity, if it is to supply increasing demand at adequate levels of reliability.
Figure 9. 2: Mashreq Electricity Demand/Supply, 1990–2030 (MW)
The total investment that will be needed for the expansion of generation, transmission and
distribution in the Mashreq countries is enormous, estimated at US$130 billion by 2020, and an
additional US$108 billion by 203032
. This will pose a huge challenge for the Mashreq countries.
9.2. Mashreq Power Sector Fuel Requirements
Figure 8.3 shows historical and forecast generation production by fuel type in percentage terms.
As can be seen, the Mashreq countries are increasing their reliance on natural gas as the primary
fuel supply for electricity generation. The share of gas in electricity production increased from
25 percent in 1990 to 48 percent in 2008. Going forward, reliance on gas will be even heavier,
increasing to 66 percent of all power generation by 2030.
Actual generation fuel mix going forward will be a function of gas availability and fuel diversity
considerations. Gas-fired generation expansion options include steam and combined cycle for
base load operation and gas turbines to meet peaking requirements. Going forward, renewable
generation including hydro, wind, and solar thermal is expected to hold steady at approximately
10 percent of total electrical energy production. As noted, Egypt plans to add two new nuclear
plants each with 1000 MW of capacity in 2017–18 and 2020–21. Jordan also is considering
nuclear as an option to meet future generation requirements.
32
Based on estimates for Egypt’s expansion plan of approximately US$101 billion to meet 150,000 GWh of demand
growth, with approximately 82% allocated for generation, 13% for transmission, and 5% for distribution (October
10, 2008 World-Bank-sponsored report, Energy Cost of Supply and Pricing Report).
0
20000
40000
60000
80000
100000
120000
1990 2000 2008 2010 2020 2030
Demand
Supply
New Capacity Needed

131
Figure 9. 3: Mashreq Generation Production by Fuel Type, 1990–2030 (%)
Forecast consumption of natural gas and oil products in the electricity sector are shown in figure
9.4. Total gas use is expected to triple from almost 33 bcm in 2008 to about 102 bcm in 2030, an
average annual increase of over 5 percent. While oil consumption for electricity generation is
increasing, it is forecast to do so at much lower growth levels of about 1.1 percent annually from
2008 to 2030. In any case, large increases in the amount of primary fuel for electricity generation
will be needed.
Figure 9. 4: Forecast Consumption of Gas and Oil by Mashreq Electricity Sector, 2007–30
0
10
20
30
40
50
60
70
1990 2000 2008 2010 2020 2030
Oil
Gas
Renewables
0
20
40
60
80
100
120
2008 2010 2020 2030
Gas (bcm)
0
20
40
60
80
100
120
140
160
180
200
2008 2010 2020 2030
Oil (mbl)
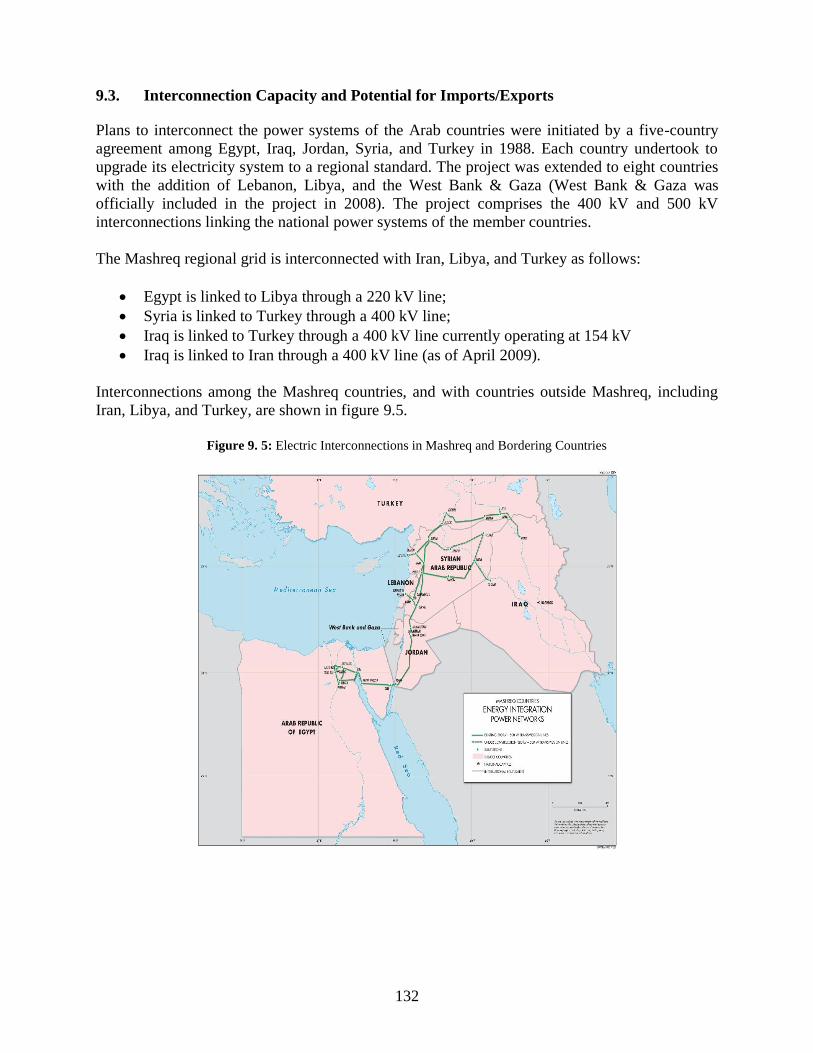
132
9.3. Interconnection Capacity and Potential for Imports/Exports
Plans to interconnect the power systems of the Arab countries were initiated by a five-country
agreement among Egypt, Iraq, Jordan, Syria, and Turkey in 1988. Each country undertook to
upgrade its electricity system to a regional standard. The project was extended to eight countries
with the addition of Lebanon, Libya, and the West Bank & Gaza (West Bank & Gaza was
officially included in the project in 2008). The project comprises the 400 kV and 500 kV
interconnections linking the national power systems of the member countries.
The Mashreq regional grid is interconnected with Iran, Libya, and Turkey as follows:
Egypt is linked to Libya through a 220 kV line;
Syria is linked to Turkey through a 400 kV line;
Iraq is linked to Turkey through a 400 kV line currently operating at 154 kV
Iraq is linked to Iran through a 400 kV line (as of April 2009).
Interconnections among the Mashreq countries, and with countries outside Mashreq, including
Iran, Libya, and Turkey, are shown in figure 9.5.
Figure 9. 5: Electric Interconnections in Mashreq and Bordering Countries

133
Table 9.3 sets out the voltage, capacity, and year of installation for each interconnection.
Table 9. 3: International Interconnections between Mashreq Countries, Selected Years 1993–2009
Countries Circuits/voltage Capacity Year of operation
Turkey-Syria 1 x 400 kV 1135 MVA 2007
Syria-Jordan 1 x 230 kV 55 MVA 1977
Syria-Jordan 1 x 230 kV 267 MVA 1980
Syria-Jordan 1 x 400 kV 1135 MVA 2000
Syria-Lebanon 2 x 66 kV 110 MVA 1972
Syria-Lebanon 1 x 230 kV 267 MVA 1977
Syria-Lebanon 1 x 400 kV 1135 MVA April 2010
Syria-Iraq 1 x 230 kV 267 MVA 2000
Jordan-Egypt 1 x 400 kV 550 MVA 1997
Jordan-West Bank 2 x 132 kV
(operated at 33 kV)
20 MW 2007
Egypt-Libya 1 x 220 kV 120 MVA 1998
Egypt-Gaza 1 x 22 kV 17 MW 2006
Iraq-Turkey 1 x 400 kV
(operated at 154 kV)
200 MW 2002
Iraq-Iran 1 x 400 kV 325 MW From April 2009
Although the Mashreq countries appear to be strongly interconnected, numerous transmission
constraints in the national systems limit transfers among countries and the systems are often not
synchronized, meaning that part of a national grid system may have to be isolated from the main
grid to accept imports from another country. For example, the interconnection between Syria and
Turkey is used to supply Syria from an isolated power station in Turkey. When Syria is
supplying Lebanon, part of the Lebanese grid must be disconnected from the main national grid.
Moreover, when Turkey is exporting to Iraq, the interconnection is operated in isolated mode.33
A study being carried out by the Turkish Electricity Transmission Company (TEIAS) is
analyzing the synchronization of Turkish, Syrian, Jordanian, and Egyptian electricity grids.
Northbound and southbound transfers along the transmission corridor between Turkey and Egypt
have a number of limitations owing to issues on the national systems. For example, low voltage
problems in Jordan limit Syrian imports from Egypt to 350 MW (when Syria is importing from
Egypt alone). Alternatively, generation capacity limitations in Jordan limit Syrian imports from
Jordan to 300 MW (when Syria is importing from Jordan alone). Finally, low voltage problems
in Jordan caused by the tripping of the 400 kV circuit between Aqaba Thermal Power Station
and Amman South limit Syrian imports from Egypt and Jordan combined to 400 MW. A
33
Electricity Network Interconnections of Turkey, MEDELEC Conference, March 24, 2009.
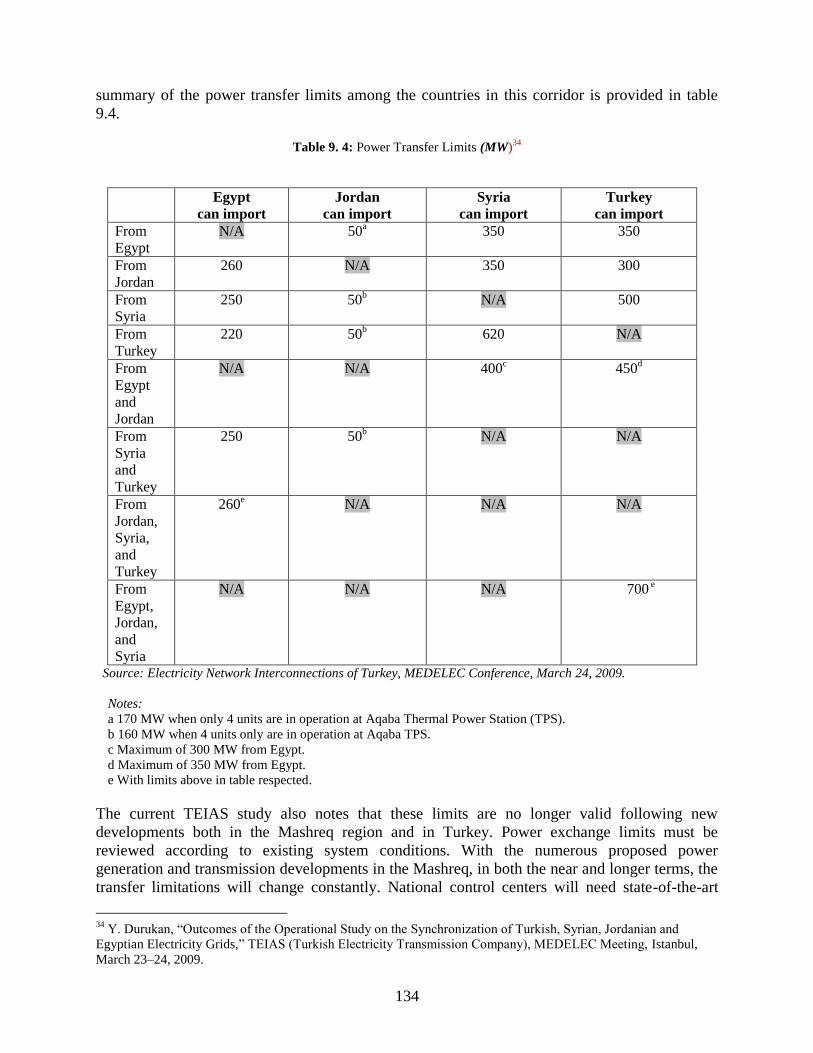
134
summary of the power transfer limits among the countries in this corridor is provided in table
9.4.
Table 9. 4: Power Transfer Limits (MW)34
Egypt
can import
Jordan
can import
Syria
can import
Turkey
can import
From
Egypt
N/A 50a 350 350
From
Jordan
260 N/A 350 300
From
Syria
250 50b N/A 500
From
Turkey
220 50b 620 N/A
From
Egypt
and
Jordan
N/A N/A 400c 450
d
From
Syria
and
Turkey
250 50b N/A N/A
From
Jordan,
Syria,
and
Turkey
260e N/A N/A N/A
From
Egypt,
Jordan,
and
Syria
N/A N/A N/A 700 e
Source: Electricity Network Interconnections of Turkey, MEDELEC Conference, March 24, 2009.
Notes:
a 170 MW when only 4 units are in operation at Aqaba Thermal Power Station (TPS).
b 160 MW when 4 units only are in operation at Aqaba TPS.
c Maximum of 300 MW from Egypt.
d Maximum of 350 MW from Egypt.
e With limits above in table respected.
The current TEIAS study also notes that these limits are no longer valid following new
developments both in the Mashreq region and in Turkey. Power exchange limits must be
reviewed according to existing system conditions. With the numerous proposed power
generation and transmission developments in the Mashreq, in both the near and longer terms, the
transfer limitations will change constantly. National control centers will need state-of-the-art
34
Y. Durukan, “Outcomes of the Operational Study on the Synchronization of Turkish, Syrian, Jordanian and
Egyptian Electricity Grids,” TEIAS (Turkish Electricity Transmission Company), MEDELEC Meeting, Istanbul,
March 23–24, 2009.
135
system simulation software and up-to-date data and information on their own and neighboring
systems if use of the interconnections is to be optimized through the use of multilateral trading
arrangements.
Although, with the exception of Iraq and the West Bank & Gaza, the Mashreq countries are
strongly interconnected, transactions between the countries are limited. There are a number of
reasons for this, including, but not limited to, the following:
There has been a shortfall of generation capacity in the Mashreq region, so there is little
power available to sell.
Primary fuel supply for generation is somewhat limited; when it is available, it tends to
be quite expensive, for example, oil.
The power sectors are in poor financial condition and are unable to afford the cost of
imported power that reflects the economic cost of supply;
The structures of the national markets generally are not set up for exchanges of capacity
and energy. For the most part, transactions are between governments. The national
markets do not allow for transactions among market participants. This lack of economic
infrastructure tends to limit transactions to longer term bilateral contracts between
directly connected countries.
There is no region coordination center and no formal regional market to facilitate market
transactions, promote regional trade and compensate entities for providing transport
services, or to determine the technical feasibility of transactions; that is, to simulate sales
to determine whether they can be made without destabilizing the system.
As stated in a January 2003 report concerning the establishment of a Coordination Control
Center for the Mashreq region,35
an interconnected power system requires the rational and secure
operation of every subcomponent of the network, especially if there are multiple parties
involved. The consultant who performed the study noted that it had not found thorough studies of
power system stability to synchronize the entire regional power system, thus illustrating the need
for coordinated action among the countries.
Despite the limited number of transactions over the interconnections, the interconnections still
provide significant benefits, as follows:
Reduced installed capacity
Reduced spinning reserves36
Construction of larger generating units with lower costs deriving from economies of
scale.
For example, Jordan can rely on its interconnections with Egypt and Syria for about 250 MW of
capacity during system emergencies. If Jordan alone had to supply this capacity, the annual
replacement capacity would cost approximately US$38 million (based on a long-run marginal
35
Final Report for “Feasibility for Establishment of a Coordination Control Center (CCC) for the Electrical
Interconnection between Turkey, Lebanon, Syria, Iraq, Jordan, Egypt, Libya, Tunisia, Algeria and Morocco,”
SwedPower, January 2003. 36
Spinning reserves include the unused portion of operable generating capacity which is synchronized to the system
and ready to pick up load.

136
cost of capacity of US$154/kW).37
In 2007 Jordan’s reserve margin was minus 130 MW. In the
absence of its interconnections, Jordan’s loss-of-load expectation was 53 hours, more than triple
the target level of 15 hours. The interconnections therefore enabled Jordan to avoid considerable
load shedding in 2007. In addition, Jordan carries approximately 33 MW of primary spinning
reserves and 32 MW of secondary reserves. The country relies on the reserves of Egypt and
Syria over the interconnections, providing a combined spinning reserve for the 3 countries of 400
MW. By minimizing spinning reserve requirements in this manner, generation is operated closer
to its optimum output level, thus improving efficiency and reducing fuel and maintenance costs.
Finally, interconnection capacity allows construction of larger power plants to capture the
economies of scale. For example, if Jordan’s interconnections with Egypt and Syria are
expanded to increase transfer capacity, in the future, Jordan may be able to construct 600 MW
generating units, rather than the 300 MW units currently assumed in its expansion plan.
Opportunities for short-term trades have been realized in the Mashreq countries to a limited
extent through the diversity of demand among the countries. For example, Syria has a winter
peak while Egypt and Jordan have summer peaks. Syria could make sales to Egypt and Jordan
during summer when it has surplus generating capacity, and Jordan and Egypt could make sales
to Syria in winter when they have surplus generating capacity. These staggered sales are
particularly relevant when there are different generation technologies in the countries. For
example, when Lebanon is forced to run its high-cost diesel turbines and Egypt has lower cost
gas turbines on the margin, Egypt could sell power to Lebanon, enabling it to back off its high-
cost diesel generation. Egypt and Lebanon could split the savings of increased revenues for
Egypt and reduced production costs for Lebanon.
With significant generation expansion anticipated in the Mashreq countries, at times some
countries will have capacity surpluses on their systems, enabling sales to countries in deficit
positions. The nature of generation expansion is that investments tend to be lumpy, meaning a
300 MW generating unit may be brought on line when demand is increasing at 100 MW
annually. During the early years of the generator’s operation, there will be surplus capacity
available for sale to other countries.
In summary, the existing interconnections among Mashreq countries provide significant value to
consumers. However, there is scope to increase the utilization of the interconnections to provide
greater value to the Mashreq region.
9.4. Potential Future Interconnection Projects
Interconnections linking Egypt, Jordan, Syria, Iraq, Lebanon and the West Bank & Gaza, and
linking the Mashreq countries to countries outside the Mashreq region, already are in place.
These interconnections are providing significant benefits, enabling construction of larger power
plants with the resulting economies of scale, increased sharing of planning and operating
capacity reserves, support during system emergencies, and economy energy exchanges taking
advantage of demand diversity and capacity surpluses when there are differences in marginal
production costs between systems.
37
See Update of the 2006 Generation and Transmission Expansion Master Plan, August 15, 2008, p. 98.

137
A number of potential upgrades to the Mashreq interconnections are being considered. The main
gaps within Mashreq are associated with Iraq and the West Bank & Gaza. The West Bank &
Gaza is almost entirely dependent on imports, and imports have reached the limits of existing
transmission capacity. Feasibility studies show that it is economic to increase interconnection
capacity with Egypt and Jordan. There is scope to increase Iraq’s import capacity since it cannot
meet demand at present, and its plans to increase generation capacity are moving very slowly.
Iraq already has a 400 kV link to Iran (recently completed), and 400 kV upgrades to
interconnections with Syria and Turkey are under development. An interconnection with Jordan
would be an attractive addition since Jordan’s successful reforms in generation have led to a
strong private generation sector. Furthermore, costs to construct generation in Jordan would be
much less than in Iraq owing to the ongoing conflict in the latter. There is potential to reinforce
interconnections between Mashreq and neighboring countries, notably between Egypt and Libya
and between Iraq and Turkey as discussed. There is also potential to build new interconnections
between a Mashreq country and Saudi Arabia. Egypt, Iraq, Jordan, and Syria all are possible
candidates for interconnecting with Saudi Arabia.
The Mashreq region as a whole is in an electricity capacity deficit situation. In other words, its
generation capacity falls short of both electricity demand and having a reserve margin to ensure
adequate reliability of supply, generally 10 percent–15 percent. Therefore, any new generation
project would provide economic benefits to the Mashreq region by reducing lost load.
Furthermore, generation that is added based on least-cost principles would improve generation
efficiency and reduce the overall cost of energy through both improved efficiency and
displacement of higher-cost with lower-cost fuel. Generation expansion plans at the national
level that are consistent with least-cost principles should be supported. However, generation
expansion at the region level consistent with least-cost principles would achieve greater benefits,
provided the countries can agree in principle to share the benefits. A generation project sized to
meet regional market needs and fueled with local natural gas from an as-yet undeveloped gas
field should be of significant interest.
Any new interconnection project should be accompanied by a technical assistance project that
includes detailed modeling of the regional transmission system. Without such detailed modeling,
it would not be possible to determine the increased transfer capacity between countries, as the
national grids often are the limiting factor. Until the true transfer capacities are determined, it
will not be possible to calculate the benefits arising from increased interconnection capacity. A
detailed transmission planning study would:
Identify the transfer capacities of the existing interconnection;
Identify various interconnection upgrade scenarios and their increased transfer capacities;
Determine benefits of various interconnection upgrade scenarios;
Determine the favored interconnection upgrade scenario from both the individual country
and the regional perspectives; and
Determine the cost/benefit ratio of the favored alternative and identify capital
requirements and schedule for implementation.
The analysis would have to be conducted in close coordination with the national counterparts,
particularly with regard to their generation and transmission expansion plans. It should leverage
the information and analyses being undertaken by the experts undertaking the TEIAS study.
138
Potential electric interconnection projects are summarized below. Projects with greater potential
for implementation are elaborated in chapter 11.
Second Line between Egypt and Jordan: The area of focus for strengthening the
Mashreq interconnection is the link between Egypt and Jordan. This link is the gateway
for trade between Egypt, the only Mashreq country that does not currently have a
capacity deficit, and the other four Mashreq countries, which all are in capacity deficit.38
Adding a second line from Egypt to Jordan has been under study for some time. It also
would require transmission upgrades to national grids, and to the interconnection between
Jordan and Syria. As a result, this project could be viewed as an upgrade to the main
Mashreq thoroughfare from Egypt through to Syria.
Upgrade Interconnection between Syria and Lebanon: In conjunction with the project
to construct a second interconnection between Egypt and Jordan, the interconnection
between Syria and Lebanon also might be upgraded. Currently, there are two 66kV and
one 230 kV interconnection between the two countries. A 400 kV interconnection
between the countries is expected to be completed by April 2010. Consideration is being
given to adding a second 400 kV interconnection. Upgrading this interconnection has
been under study, and construction could begin in 2012.
Upgrade Interconnection between Iraq and Syria: Although Iraq is interconnected
with Syria, and through Syria to the rest of the Mashreq network, Iraq has very little
energy trade with the Mashreq countries. This lack of trade is in large part a result of
electricity deficiencies in both Iraq and Syria, and in Mashreq as a whole. However, Iraq
has significant gas reserves––in particular, the undeveloped Akass field in the western
desert that is very close to the Syrian border. There are opportunities for Iraq to exchange
its gas, which is much needed in Syria, for electricity, which is much needed in Iraq.
Upgrading the interconnection between Syria and Iraq to 400 kV would be a critical step
in realizing such an exchange. In fact, such a project is being implemented. Furthermore,
construction of new generation in conjunction with the transmission upgrade would be far
less costly in Syria, owing to the current conflict in Iraq. As noted, in March 2009, Iran’s
energy minister announced that a quadripartite electricity network will be formed among
Syria, Iraq, Turkey and Iran and will include construction of generating plants. Details on
this agreement are not yet available, but it can be expected to result in new project
investment.
New Interconnection from Iraq to Jordan: Again, Iraq has significant electricity
shortfalls and significant gas reserves, so could benefit from development of additional
regional power interconnections and gas pipelines. There are reports that the Government
of Iraq is pursuing opportunities to link grids with Jordan. However, the recently
announced quadripartite agreement would appear to slant Iraq’s preferences toward trade
with Syria over constructing a new interconnection with Jordan. The latter alternative
does not forgo opportunities for Iraq electricity purchases from Jordan via Syria.
A 400 kV interconnecting transmission line between Iraq and Jordan would be costly and
would require an 800 km line at a cost of approximately US$560 million. However, the
38
Although Egypt’s current capacity surplus is limited, it has an aggressive generation expansion plan in place.
Jordan’s capacity situation has improved with its recent capacity additions, but supply is expected to remain tight in
the near-term.

139
costs of the line might be overcome by the cost advantages of building new generation in
Jordan rather than in Iraq, particularly considering Jordan’s success in attracting
independent power producers (IPPs).
Construct New Interconnection from Jordan to West Bank: The West Bank is
entirely dependent on imports, mostly from Israel, and a small amount from Jordan over
an existing 2 x 132 kV line that is currently operated at 33 kV. It is necessary to operate
this line in isolation mode. A feasibility study on a new Jordan – West Bank
interconnection recommends further cooperation with Jordan, with the first step including
construction of a new 2 x 400 kV interconnection developed in conjunction with a 132
kV transmission system in the West Bank. The favored interconnection alternative would
originate at the Samra Thermal Power Plant north of Amman in Jordan, and connect to a
new 400 kV substation in the Jerusalem area in the West Bank. The length of the
interconnection is estimated to be 101 km with a cost of US$ 99.2 million (in 2008
Dollars). This estimate includes the cost of the interconnection and substation
investments in both Jordan and the West Bank.
Construct New Interconnection from Egypt to Gaza: Gaza is likewise almost entirely
dependent on imports from Israel, and to a lesser extent, Egypt. Gaza might be supplied
in the future from Egypt in larger quantities over a 2 x 220 kV line from the main
transmission grid to El’Arish, a town located 50 km south-west of Gaza. A feasibility
study shows that the least costly alternative for meeting Gaza demand through 2030 is the
interconnection with Egypt, and recommends that further generation and transmission
system development in Gaza be based on power cooperation with Egypt. The report
suggests that the first step should be implementation of a 220 kV interconnection, and a
strong 220 kV transmission system on the Gaza Strip. New generation would be needed
in Egypt to support sales to Gaza. The estimated cost of the interconnection including
substations in Gaza and Egypt is US$ 37.4 million (2008 prices). The interconnection
would be a 2 x 220 kV line about 50 km in length.
Construct New Generation in Syria and/or Jordan: In light of the shortfall of
generation capacity in the Mashreq region, construction of new generation capacity
would provide significant benefits. A 500 MW gas-fired generating plant could cost $300
million. Iraq has had significant difficulty building much needed generation capacity
because costs are very high owing to conflict, limited private sector involvement,
economies of scale, and other factors. Lebanon and the West Bank & Gaza have similar
problems, although not on the same scale. Construction of generation in either Jordan or
Syria(or both) for the benefit of the host country and Iraq would significantly improve
energy integration, particularly if tied to gas exports from Iraq. New generation likely
would require upgrades to transmission capacity in both the national networks and the
regional interconnections, particularly between Iraq and Syria.
Mashreq Regional Coordination Center: As discussed, the structures of the national
markets generally are not set up for exchanges of capacity, energy, and ancillary services.
There are no regional coordination center and no formal regional market to facilitate
market transactions, relating both to promotion of regional trade and compensation to
entities providing transport services, and in terms of determining the technical feasibility
of making a transaction; that is, to simulate sales to determine if they can be made
without creating congestion or instability on the system. In the absence of a regional
coordination center, bilateral contracts can become complex, particularly when a

140
transaction is between nonadjacent countries. For instance, a sale by Egypt to Lebanon
would require agreement between Egypt and Lebanon on the terms and conditions of the
sale, as well as the agreement of Jordan and Syria to transport the energy.
An interconnected power system requires the rational and secure operation of every
subcomponent of the network. In general, there has been no thorough study of power
system stability to synchronize the entire regional power system. The TEIAS study is
reviewing transfer capacities between Mashreq countries and Turkey. However, the study
notes that (a) following new developments both in the Mashreq region and in Turkey, the
limits are no longer valid, and that (b) power exchange limits should be reviewed
according to existing system conditions. Numerous power generation and transmission
developments in the Mashreq region and Turkey have been proposed, so transfer limits
will be changing constantly. There is a need for ongoing monitoring and system
simulation to ensure that transactions can take place without disrupting supply. A
Regional Coordination Center can provide such services while ensuring fair and
transparent treatment of transaction between participants in the regional market. It is
important to understand that industry restructuring at the national level would not be a
requirement, but over time would increase liquidity in the regional market and the
benefits of a regional coordination center.
New Interconnection between Egypt and Saudi Arabia: It is understood that Egypt
and the Kingdom of Saudi Arabia are studying a potential electric interconnection. The
two systems could be connected through the Jordanian interconnection (land connection),
through the Gulf of Aqaba or close to Sharm el-Shekh at the islands of Tiran and Salah El
Din. The distance from Egypt (Sharm El-Sheikh and Nowiba) to large load/generating
centers in Saudi Arabia (Madina or Tabuk) is long at 400-500 km. The potential size of
the line might be 3000 MW. Owing to the large distances and the difference in standard
frequency (Egypt 50 Hz, Saudi Arabia 60 Hz), DC transmission is likely to be the most
feasible alternative.
New Interconnection between Iraq and Saudi Arabia: There are reports that the Iraqi
Government is considering construction of an interconnection with Saudi Arabia, but
discussions are very preliminary. Saudi Arabia has a generation capacity deficit as does
Iraq, so this potential project is not a high priority.
New Interconnection between Jordan and Saudi Arabia: Consideration reportedly is
being given to construction of a new interconnection between Jordan and Saudi Arabia,
but discussions are very preliminary. Both countries have supply shortages, so this
project is a low priority.
Upgrade Interconnection between Iraq and Turkey: Construction of an additional 400
kV line between Iraq and Turkey is being implemented.39
The cross-border point has
been determined, and construction of the Iraqi part of the line has been initiated. The
construction of the Turkish part of the line is expected to be initiated soon. Current
estimates are that the interconnection capacity with Turkey might be increased by an
additional 400 MW.
Upgrade Interconnection between Iraq and Iran: The interconnection between Iraq
and Iran reportedly was upgraded to 400 kV in April 2009, increasing the interconnection
capacity by 200 MW to 325 MW. There appears to be little need at this time for
39
Electricity Network Interconnections of Turkey, paper presented at MEDELEC Meeting, Istanbul, March 24,
2009.
141
additional upgrades to the interconnection. However, they may be under study as part of
the announced quadripartite electricity network to be formed among Syria, Turkey, Iraq,
and Iran.
Upgrade Interconnection between Egypt and Libya: Egypt is linked to Libya through
a 220 kV line. Reinforcement of this interconnection through the addition of a new 500
kV line has been investigated by both MEDRING and ELTAM. Commissioning of the
new line was envisaged in the year 2015. The project would reinforce the connection
between the Mashreq countries and Libya, and on to the Maghreb countries, including
Morocco, Algeria, and Tunisia. The Mediterranean Ring project sponsored by the EU
aims to create a transmission ring around the Mediterranean by interconnecting the
national grids, although reports are that work is progressing slowly. It is understood that
there are synchronization issues between Libya and the other northern African countries,
so a direct current (DC) back-to-back link may be needed between Egypt and Libya.40
Support Development of Proposed Syria-Turkey-Iraq-Iran Electricity Market: As
noted, recent press releases indicate that a quadripartite agreement has been reached
among Syria, Turkey, Iraq and Iran to develop transmission and, potentially, generation
projects. This agreement may result in projects to support integration of the Mashreq
energy market.
40
See Evolution of the Electrical Interconnections around the Mediterranean Sea, due to the Mediterranean Solar
Plan, March 19, 2009.
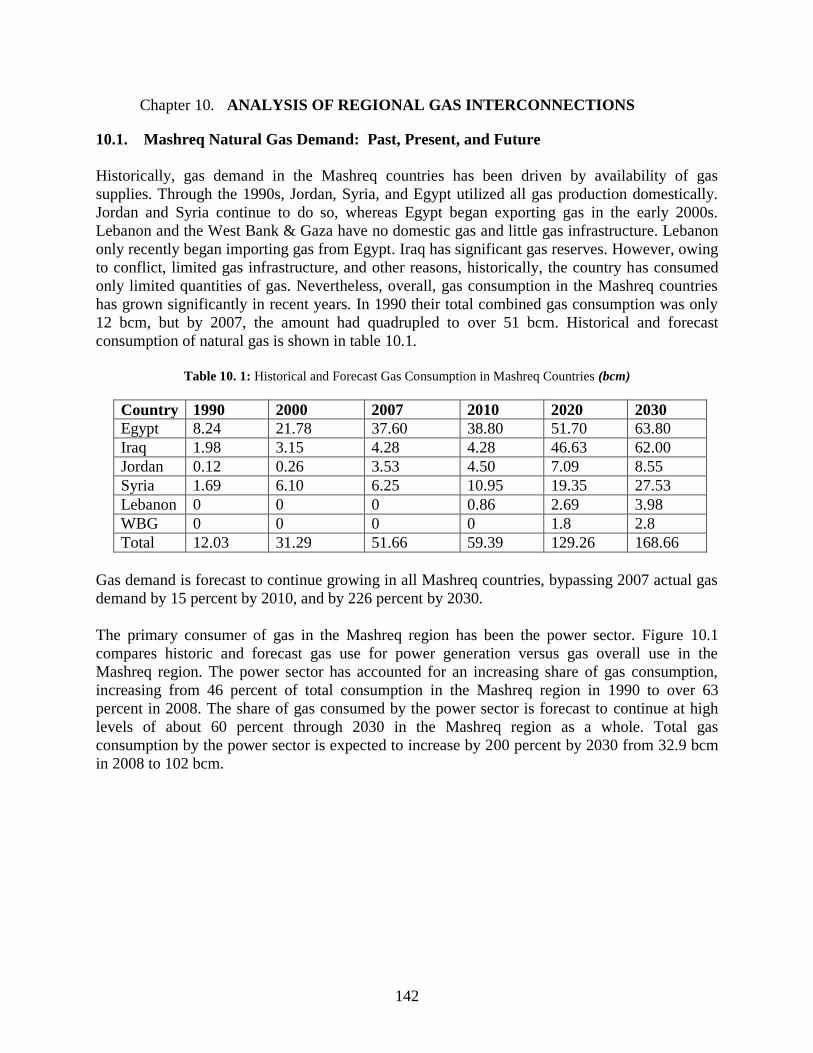
142
Chapter 10. ANALYSIS OF REGIONAL GAS INTERCONNECTIONS
10.1. Mashreq Natural Gas Demand: Past, Present, and Future
Historically, gas demand in the Mashreq countries has been driven by availability of gas
supplies. Through the 1990s, Jordan, Syria, and Egypt utilized all gas production domestically.
Jordan and Syria continue to do so, whereas Egypt began exporting gas in the early 2000s.
Lebanon and the West Bank & Gaza have no domestic gas and little gas infrastructure. Lebanon
only recently began importing gas from Egypt. Iraq has significant gas reserves. However, owing
to conflict, limited gas infrastructure, and other reasons, historically, the country has consumed
only limited quantities of gas. Nevertheless, overall, gas consumption in the Mashreq countries
has grown significantly in recent years. In 1990 their total combined gas consumption was only
12 bcm, but by 2007, the amount had quadrupled to over 51 bcm. Historical and forecast
consumption of natural gas is shown in table 10.1.
Table 10. 1: Historical and Forecast Gas Consumption in Mashreq Countries (bcm)
Country 1990 2000 2007 2010 2020 2030
Egypt 8.24 21.78 37.60 38.80 51.70 63.80
Iraq 1.98 3.15 4.28 4.28 46.63 62.00
Jordan 0.12 0.26 3.53 4.50 7.09 8.55
Syria 1.69 6.10 6.25 10.95 19.35 27.53
Lebanon 0 0 0 0.86 2.69 3.98
WBG 0 0 0 0 1.8 2.8
Total 12.03 31.29 51.66 59.39 129.26 168.66
Gas demand is forecast to continue growing in all Mashreq countries, bypassing 2007 actual gas
demand by 15 percent by 2010, and by 226 percent by 2030.
The primary consumer of gas in the Mashreq region has been the power sector. Figure 10.1
compares historic and forecast gas use for power generation versus gas overall use in the
Mashreq region. The power sector has accounted for an increasing share of gas consumption,
increasing from 46 percent of total consumption in the Mashreq region in 1990 to over 63
percent in 2008. The share of gas consumed by the power sector is forecast to continue at high
levels of about 60 percent through 2030 in the Mashreq region as a whole. Total gas
consumption by the power sector is expected to increase by 200 percent by 2030 from 32.9 bcm
in 2008 to 102 bcm.
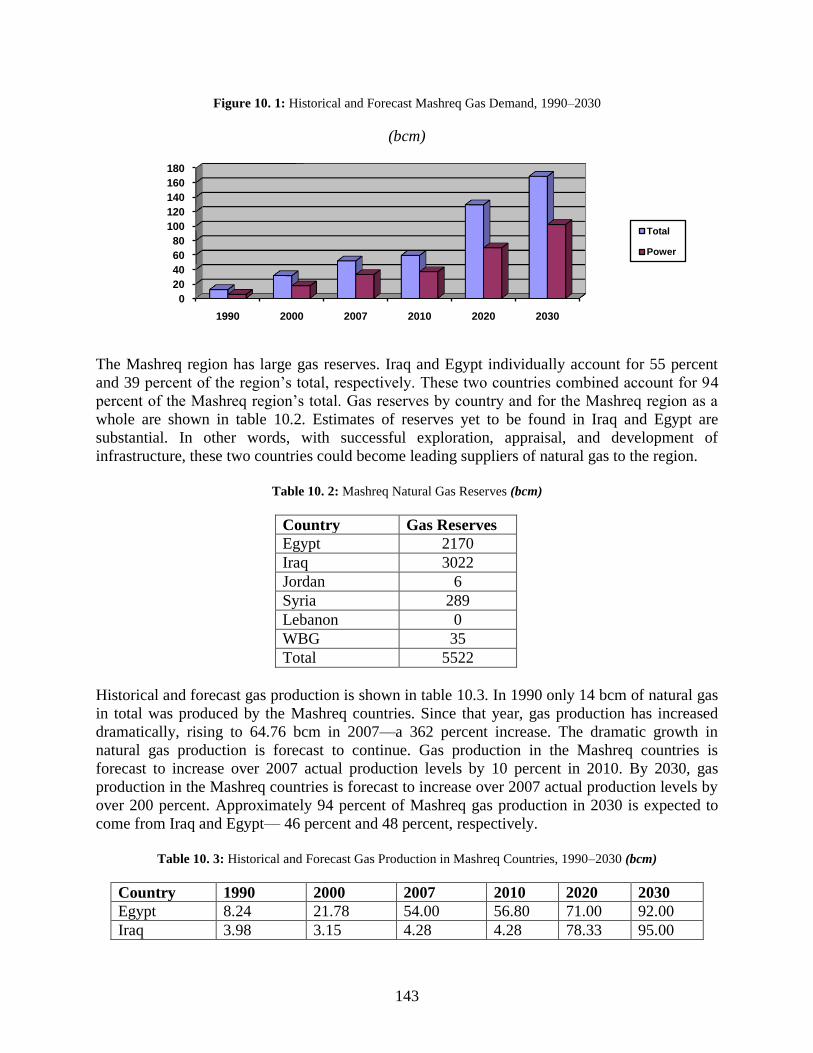
143
Figure 10. 1: Historical and Forecast Mashreq Gas Demand, 1990–2030
(bcm)
The Mashreq region has large gas reserves. Iraq and Egypt individually account for 55 percent
and 39 percent of the region’s total, respectively. These two countries combined account for 94
percent of the Mashreq region’s total. Gas reserves by country and for the Mashreq region as a
whole are shown in table 10.2. Estimates of reserves yet to be found in Iraq and Egypt are
substantial. In other words, with successful exploration, appraisal, and development of
infrastructure, these two countries could become leading suppliers of natural gas to the region.
Table 10. 2: Mashreq Natural Gas Reserves (bcm)
Country Gas Reserves
Egypt 2170
Iraq 3022
Jordan 6
Syria 289
Lebanon 0
WBG 35
Total 5522
Historical and forecast gas production is shown in table 10.3. In 1990 only 14 bcm of natural gas
in total was produced by the Mashreq countries. Since that year, gas production has increased
dramatically, rising to 64.76 bcm in 2007––a 362 percent increase. The dramatic growth in
natural gas production is forecast to continue. Gas production in the Mashreq countries is
forecast to increase over 2007 actual production levels by 10 percent in 2010. By 2030, gas
production in the Mashreq countries is forecast to increase over 2007 actual production levels by
over 200 percent. Approximately 94 percent of Mashreq gas production in 2030 is expected to
come from Iraq and Egypt–– 46 percent and 48 percent, respectively.
Table 10. 3: Historical and Forecast Gas Production in Mashreq Countries, 1990–2030 (bcm)
Country 1990 2000 2007 2010 2020 2030
Egypt 8.24 21.78 54.00 56.80 71.00 92.00
Iraq 3.98 3.15 4.28 4.28 78.33 95.00
0
20
40
60
80
100
120
140
160
180
1990 2000 2007 2010 2020 2030
Total
Power
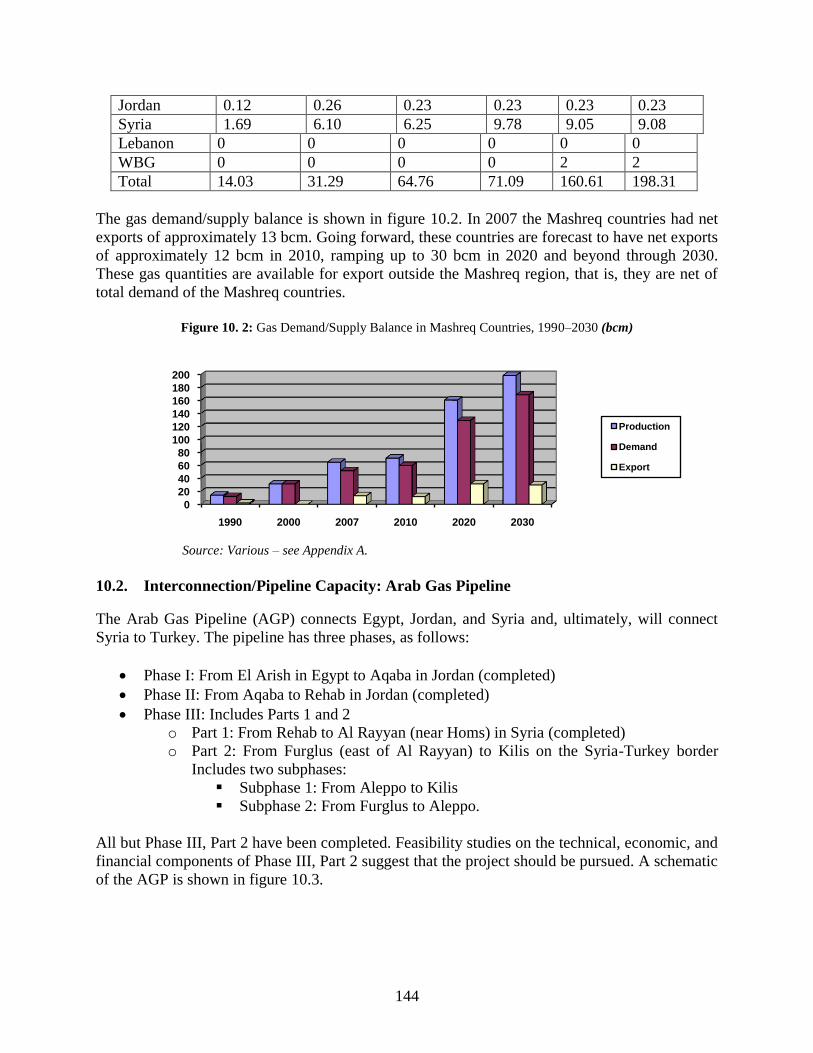
144
Jordan 0.12 0.26 0.23 0.23 0.23 0.23
Syria 1.69 6.10 6.25 9.78 9.05 9.08
Lebanon 0 0 0 0 0 0
WBG 0 0 0 0 2 2
Total 14.03 31.29 64.76 71.09 160.61 198.31
The gas demand/supply balance is shown in figure 10.2. In 2007 the Mashreq countries had net
exports of approximately 13 bcm. Going forward, these countries are forecast to have net exports
of approximately 12 bcm in 2010, ramping up to 30 bcm in 2020 and beyond through 2030.
These gas quantities are available for export outside the Mashreq region, that is, they are net of
total demand of the Mashreq countries.
Figure 10. 2: Gas Demand/Supply Balance in Mashreq Countries, 1990–2030 (bcm)
Source: Various – see Appendix A.
10.2. Interconnection/Pipeline Capacity: Arab Gas Pipeline
The Arab Gas Pipeline (AGP) connects Egypt, Jordan, and Syria and, ultimately, will connect
Syria to Turkey. The pipeline has three phases, as follows:
Phase I: From El Arish in Egypt to Aqaba in Jordan (completed)
Phase II: From Aqaba to Rehab in Jordan (completed)
Phase III: Includes Parts 1 and 2
o Part 1: From Rehab to Al Rayyan (near Homs) in Syria (completed)
o Part 2: From Furglus (east of Al Rayyan) to Kilis on the Syria-Turkey border
Includes two subphases:
Subphase 1: From Aleppo to Kilis
Subphase 2: From Furglus to Aleppo.
All but Phase III, Part 2 have been completed. Feasibility studies on the technical, economic, and
financial components of Phase III, Part 2 suggest that the project should be pursued. A schematic
of the AGP is shown in figure 10.3.
0
20
40
60
80
100
120
140
160
180
200
1990 2000 2007 2010 2020 2030
Production
Demand
Export

145
Figure 10. 3: Arab Gas Pipeline
A key gap in the AGP is the relatively short (45 km) onward link to the Turkish gas network
(Kilis to Gaziantep). BOTAS, the state-owned Turkish gas operator, reportedly was procuring
the pipe and other materials.. This pipeline is a priority for Syria, as it wishes to import gas from
Iran through Turkey to meet its supply shortfall.
A 43 km pipeline, Gasyle 1, which goes from Syria to the Beddawi Power Plant in Tripoli, north
Lebanon, is officially part of the AGP. Iraq and the West Bank & Gaza are the only Mashreq
countries not connected to the AGP. Once the AGP is completed, the planned Nabucco gas
project might be utilized for exports to Europe. New gas sources would reinforce the reliability
and security of gas supply in the region.
To date, trade on the AGP has been limited, far below its design capacity of 10 bcma. Until
recently, the only firm sales on the AGP have been made between Egypt and Jordan. The
contract with the Al Fajr Company is described in detail in chapter 4. The contract is for 30
years, with the possibility of a 10-year extension. The Al Fajr Company constructed the second

146
phase of the AGP on a build-own-operate-transfer basis, with transfer taking place after 30 years.
In return, the company received exclusivity rights for 18 years.
Egyptian gas piped via the AGP is a preferred fuel alternative for electricity generation in the
Mashreq countries. Egypt started exporting to Syria in 2008 to supply the Deir Ali 750 MW
combined cycle gas plant. Egypt’s gas exports to Syria reached 0.9 bcm in 2009 and are expected
to ramp up to 2.2 bcm by 2013. In addition, Egypt started exporting gas to Lebanon in late 2009
to supply the Beddawi power station. Egypt’s exports to Lebanon reached 0.3 bcm in 2009 and
are expected to ramp up to 0.6 bcm by 2013. Egypt exported 3.3 bcm to Jordan in 2009, and
expects to ramp up gas exports to Jordan to 4.2 bcm by 2013. Total exports on the AGP in 2009
reached 4.5 bcm, about 45 percent of the AGP capacity. By 2013, total exports on the AGP are
expected to reach 7 bcm, or about 70% of the full AGP capacity.
Egypt’s gas program has been hugely successful (chapter 2). Since the early 1990s, gas reserves
and production have approximately quadrupled. With its gas reserves and successful gas
exploration activities, its LNG export terminal, and the completion of the AGP, Egypt is poised
to remain an energy leader in the region. In 2007 Egypt’s gas production was approximately 54
bcm, of which 16.4 bcm, or 30 percent, was exported internationally.
After a tailing off of gas discoveries in Egypt, changes to the terms offered for exploration led
investment to pick up, and, more recently, there has been a string of new discoveries. Egypt is
the starting point and sole supplier for the AGP, although expectations that Egyptian gas will be
exported to Europe via Turkey appear optimistic. Egypt also has a gas pipeline to Israel.
As mentioned, gas exports have become politically sensitive in Egypt. Egyptian consumers enjoy
highly subsidized gas and are concerned about price increases. In 2008 consumers’ sensitivity on
this issue led the Ministry of Petroleum to announce a policy of allocating 33 percent of gas for
export, 33 percent for domestic consumption, and 33 percent to be reserved for future
generations, With increases in industrial gas prices, gradual tariff reform has begun, and the
Cabinet has agreed to establish an independent gas regulator.
Nevertheless, if Egypt is to continue to be a gas exporter, it will require successful expansion of
its production and delivery systems. Currently, Egypt’s electricity sector is in balance, with
generation capacity in amounts necessary to meet the country’s demand at reasonable levels of
reliability. However, in the coming years, the electricity demand is forecast to grow at more than
6 percent annually, placing considerable stress on electricity and gas infrastructure. Egypt’s
expansion plan to meet its future electricity requirement will be fuelled with a significant share
of the country’s domestic gas production. Furthermore, the ministry has announced an ambitious
expansion of residential gas connections. To date, progress has been slow due to difficulties with
financing. Financing its aggressive electricity and gas expansion will be challenging for Egypt
because domestic prices for all forms of energy are heavily subsidized.
10.3. Potential for Expansion of Exports: Egypt and Iraq
In the future, Jordan, Syria, Lebanon and the West Bank & Gaza expect to be net importers of
natural gas. Domestic demand will be driven primarily by power generation. Egypt is expected to

147
continue in its role as primary exporter of natural gas. To help finance its aggressive energy
expansion initiatives, Iraq is expected to develop its huge gas reserves for domestic consumption
and for export. Of course, if Iraq’s aggressive energy expansion is to be realized, considerable
progress must be made in resolving the current conflict. An overview of the Mashreq gas
infrastructure is provided in figure 10.4.
Figure 10. 4: Overview of Gas Infrastructure in Mashreq and Surrounding Area
Going forward, exports from Egypt and Iraq are forecast by the International Energy Agency
(IEA) (table 10.4). These export figures are over and above what Egypt and Iraq will need to
serve their domestic gas needs. As can be seen, the available export volumes increase steadily to
over 61 bcm by 2030.
Table 10. 4: Forecast Availability of Gas for Export from Egypt and Iraq (bcm)
2007 2010 2020 2030
Egypt 16.4 18.0 19.3 28.2
Iraq 0 0 31.7 33.0
Total 16.4 18.0 51.0 61.2
The development of Iraq's large gas endowments will provide the country with the potential to
become a major regional exporter of gas, both to its neighbors and to larger markets in Europe.
Prior to the 1990–91 Gulf War, Iraq exported natural gas to Kuwait through a pipeline that no
longer operates.

148
The Government of Iraq is understood to be interested in exporting gas from its northern gas
fields to Turkey and Europe, including linking up to the Azeri-Turkish Baku-Tbilisi-Erzerum
(BTE) line, the planned Nabucco (Iran-Europe) pipeline, or the Arab Gas Pipeline. Iraq plans to
use its southern gas reserves, which are associated primarily with oil production, for domestic
consumption and for export to points south, including Kuwait. There is also the possibility of
exporting gas from the new Akass Field in Iraq’s western desert. A connection with Iraq would
be of substantial benefit to Syria, not only as an alternate source of gas for its own use, but also
as a source of revenue from transporting gas to Turkey and perhaps beyond to Europe if the
Nabucco gas project goes ahead.
Syria had earlier signed an MoU to purchase gas from Iraq, initially 1.5 bcma from the Akass
field. One bcma of this is to be exported. Iraq’s Akass gas field is close to the border with Syria
and approximately 50 km from the Syrian gas network, in which Syria has spare processing
capacity at the nearby Deir Ezzor and Omar plants. Syria has let a contract to a Chinese company
to build the necessary pipeline, but it will have a relatively small diameter of only 10 inches. If
there are significant new discoveries at Akass, a new pipeline will be needed. Reports out of Iraq
initially indicated that Shell had been contracted to develop the Akass field, but reports now are
that it will be included in the upcoming Iraq oil and gas exploration licensing round. Syria and
Iraq have been discussing options for a second pipeline to carry gas from Iraq’s northern gas
fields across Iraq to the AGP and potentially to the port of Banias, from which it could be
exported as LNG. Unfortunately, these plans to connect Iraq’s Akkaz field to Syria were not
implemented as earlier envisaged.
In the short term, Egypt will be the likely supplier of gas to the AGP. The combined gas demand
of Jordan, Lebanon, Syria and the West Bank & Gaza to be supplied from imports in 2010 is 6.3
bcm. This amount is well below the AGP capacity of 10 bcma, but is consistent with gas
availability and contract negotiations. In the longer term, the combined gas import needs of
Jordan, Lebanon, Syria and the West Bank & Gaza will be approximately 20 bcm in 2020 and
over 31 bcm in 2030.
The combined gas export forecast from Egypt and Iraq will cover Mashreq needs with gas to
spare for export to other countries, including 51 bcm in 2020 and 61.2 bcm in 2030. However,
there are a number of competitors for this gas. For exports to be available in these quantities, a
continuation of Egypt’s highly successful gas exploration activities will be required to produce
gas from yet-to-be-found reserves. The competition for gas also will require progress on
development of gas delivery infrastructure. In Iraq’s case, conflict resolution combined with
substantial investment in exploration and development of its gas reserves and delivery
infrastructure will be necessary
10.4. Potential Future Cross Boarder Projects
The Arab Gas Pipeline connects Egypt, Jordan and Syria. The 43 km pipeline connecting the
Beddawi Power Plant in north Lebanon to the AGP in Syria also forms part of the AGP. The
AGP ultimately will connect to the Turkish pipeline network, which in future may include the
planned Nabucco pipeline, which will deliver gas to Europe.

149
The AGP design capacity is 10 bcma. Transport on the AGP has been well below that number.
Most activity has been associated with the gas contract between Egypt and Jordan. Under most
future scenarios, transport on the AGP will remain well below its design capacity in the near
future. However, longer term there is prospects which would materialize if gas supplies from
Egypt and/or Iraq are added to the system. The main gaps in the regional gas network are quite
clear. The most feasible candidates for future cross-border projects include extending the AGP to
other countries, including completing the final two stages of the AGP to connect the AGP to
Turkey, connecting Iraq to the AGP, and extending the AGP to countries outside Mashreq.
As noted in the previous chapter, there will be a need to accompany capital projects with
technical assistance projects. Furthermore, any new cross-border project should be coordinated
with other ongoing studies in the region to ensure consistency and avoid overlap. The gas
integration projects with greater potential for implementation are discussed in chapter 10 and
listed below for reference:
1. Completion of the Arab Gas Pipeline (AGP) through construction of two segments within
Syria and one segment in Turkey. The investment costs of these three segments are estimated
at: $350 million for Furglus-Aleppo within Syria; $80 million for Aleppo –Kilis within Syria;
and $67 million for Kilis - Goziantep within Turkey. The construction of the first segment is
not likely without a firm commitment from Egypt to supply gas. However, construction of
the other two segments is under serious consideration to enable Syria to import gas via
Turkey.
2. Construction of the Iraq-Syria gas pipeline which could be of small or large scale. The small
scale pipeline is intended to transport gas from the Akkas gas field in Iraq’s western desert to
Syria. This would be a 50 km pipeline with an estimated cost of US$ 75 million. It has
significant mutual benefits for Iraq and Syria. Iraq would not need to build a gas processing
plant at Akkas; Syria has the capacity to process the gas in its own plants. The gas could be
utilized for power generation in Syria with part of the power exported back to Iraq. This
would be highly beneficial to Iraq with a generation gap of about 50% and fast growing
demand. Iraq’s efforts to install new capacity have progressed very slowly. The larger scale
gas pipeline between Iraq and Syria would be of a completely different nature, including an
800 km pipeline at a cost of about US$ 1.2 billion. This project would represent a major
source of gas input to the AGP and a major gas outlet from Iraq. It could potentially be an
avenue for selling Iraqi gas to Turkey and beyond. This pipeline and the potential pipeline
projects from Iraq to Jordan (Item 5) and from Iraq to Turkey (Item 6) are likely to compete,
so only one might proceed to implementation.
3. Construction of the Iraq-Jordan gas pipeline which would import gas from Iraq’s northern
and/or southern gas fields to the AGP via Jordan’s Risha gas field. It would include an 800
km pipeline with an estimated cost of US$ 1.2 billion. It would enable regional gas trade, an
additional export route for Iraq, and second option for gas imports for Syria, Lebanon and
Jordan.

150
4. Construction of Iraq-Turkey gas pipeline which would include two distinct (and not mutually
exclusive) alternatives for exporting gas from Iraq to Turkey and on to Europe. The first
option focuses on delivering gas from Iraq’s Kurdistan region to Turkey. Investment is under
way to develop the gas fields in Kurdistan for domestic use. Private firms involved in the
development of these fields are now negotiating gas sales to Turkey and others through the
Nabucco pipeline system that is expected to transport gas from the Caspian countries to
Europe. The second option for exporting Iraqi gas to Turkey is based on the gas resources of
Iraq’s northern and/or southern fields and possibly its Akass field in the western desert, for
export to Turkey via the AGP, either through Syria or Jordan. This latter alternative has been
addressed above.

151
Chapter 11. ENERGY INTEGRATION PROJECTS WITH GREATER POTENTIAL FOR
IMPLEMENTATION
11.1. Ongoing Mashreq Gas and Electricity Studies and Initiatives
Identification and implementation of new energy integration projects must take account of
various studies and initiatives to ensure synergy and to avoid duplication and overlap. There
have been numerous studies and initiatives in the area of energy integration some of which have
resulted in significant findings. In particular the EU has funded and implemented a set of useful
initiatives summarized in the following table:
Name : Euro-Arab Mashreq Gas Market Project
Countries: Egypt, Jordan, Lebanon, and Syria (Iraq and Turkey are observers)
Summary: Aim: Contribute to integrate gas markets to create a regional internal gas market that will
be integrated with EU internal gas market.
Approach: Elaborate a regional Gas Master Plan; identify projects and prepare feasibility
studies; identify and facilitate legislative harmonization and reform needed to foster
creation of competitive and efficient Mashreq gas market; transfer know-how and
expertise to Partner Countries. Establish Euro-Arab Mashreq Gas Co-operation Centre in
Damascus. Phase 2 being prepared to start in 2010.
Name: Euro-Mediterranean Energy Market Integration Project (MED-EMIP)
Countries: Algeria, Egypt, Israel, Jordan, Lebanon, Morocco, Palestinian Territories, Syria, Tunisia,
and Turkey
Summary: Aim: Support implementation of Euro-Mediterranean Energy Partnership on key energy
policy and industry issues.
Approach: Acts as a catalyst to reinforce Euro-Mediterranean Partner Countries’ energy
cooperation, with emphasis on enhancing energy security and sustainability. This study
includes policy research, technical harmonization, and know-how transfer. Establish
Energy Information Centre in Cairo to assess progress and prospects for energy sector
reforms, particularly legal and regulatory framework, including a regional database of
information on status and progress of energy reforms in Mediterranean Partner Countries.
Name: Mediterranean Working Group on Electricity and Natural Gas (MED-REG)
Countries: Albania, Algeria, Bosnia-Herzegovina, Croatia, Cyprus, Egypt, France, Greece, Israel,
Italy, Jordan, Malta, Montenegro, Morocco, Palestinian Authority, Portugal, Slovenia,
Spain, Tunisia, and Turkey
Summary: Aim: Promote collaboration among energy regulatory authorities of EU, Energy
Community Member States, and other Mediterranean countries. Diffusion of modern
regulatory culture may accelerate deployment of infrastructure and improved quality of
service with reasonable electricity and gas prices.
Approach: Exchange information; develop common positions on regulatory issues;
promote Euro-Mediterranean regional electricity and natural gas markets; promote
harmonized, transparent, and nondiscriminatory market rules; and exchange energy
regulation know-how. Project is run from Italian electricity regulator’s office in Milan.
Name: Energy Efficiency in Construction (MED-ENEC)
Countries: Algeria, Egypt, Israel, Jordan, Lebanon, Morocco, Palestinian Territories, Syria, Tunisia,
and Turkey
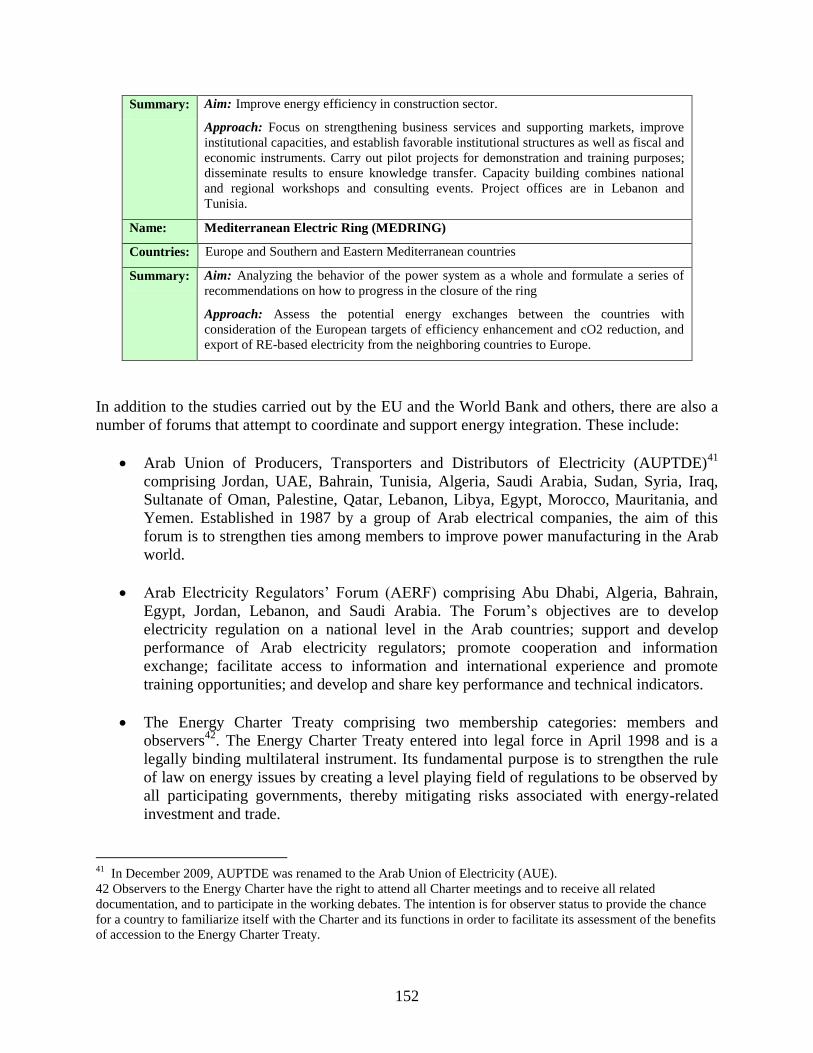
152
Summary: Aim: Improve energy efficiency in construction sector.
Approach: Focus on strengthening business services and supporting markets, improve
institutional capacities, and establish favorable institutional structures as well as fiscal and
economic instruments. Carry out pilot projects for demonstration and training purposes;
disseminate results to ensure knowledge transfer. Capacity building combines national
and regional workshops and consulting events. Project offices are in Lebanon and
Tunisia.
Name: Mediterranean Electric Ring (MEDRING)
Countries: Europe and Southern and Eastern Mediterranean countries
Summary: Aim: Analyzing the behavior of the power system as a whole and formulate a series of
recommendations on how to progress in the closure of the ring
Approach: Assess the potential energy exchanges between the countries with
consideration of the European targets of efficiency enhancement and cO2 reduction, and
export of RE-based electricity from the neighboring countries to Europe.
In addition to the studies carried out by the EU and the World Bank and others, there are also a
number of forums that attempt to coordinate and support energy integration. These include:
Arab Union of Producers, Transporters and Distributors of Electricity (AUPTDE)41
comprising Jordan, UAE, Bahrain, Tunisia, Algeria, Saudi Arabia, Sudan, Syria, Iraq,
Sultanate of Oman, Palestine, Qatar, Lebanon, Libya, Egypt, Morocco, Mauritania, and
Yemen. Established in 1987 by a group of Arab electrical companies, the aim of this
forum is to strengthen ties among members to improve power manufacturing in the Arab
world.
Arab Electricity Regulators’ Forum (AERF) comprising Abu Dhabi, Algeria, Bahrain,
Egypt, Jordan, Lebanon, and Saudi Arabia. The Forum’s objectives are to develop
electricity regulation on a national level in the Arab countries; support and develop
performance of Arab electricity regulators; promote cooperation and information
exchange; facilitate access to information and international experience and promote
training opportunities; and develop and share key performance and technical indicators.
The Energy Charter Treaty comprising two membership categories: members and
observers42
. The Energy Charter Treaty entered into legal force in April 1998 and is a
legally binding multilateral instrument. Its fundamental purpose is to strengthen the rule
of law on energy issues by creating a level playing field of regulations to be observed by
all participating governments, thereby mitigating risks associated with energy-related
investment and trade.
41
In December 2009, AUPTDE was renamed to the Arab Union of Electricity (AUE).
42 Observers to the Energy Charter have the right to attend all Charter meetings and to receive all related
documentation, and to participate in the working debates. The intention is for observer status to provide the chance
for a country to familiarize itself with the Charter and its functions in order to facilitate its assessment of the benefits
of accession to the Energy Charter Treaty.
153
o Members: Albania, Armenia, Australia, Austria, Azerbaijan, Belarus, Belgium,
Bosnia and Herzegovina, Bulgaria, Croatia, Cyprus, Czech Republic, Denmark,
Estonia, European Communities, Finland, France, Georgia, Germany, Greece,
Hungary, Iceland, Ireland, Italy, Japan, Kazakhstan, Kyrgyzstan, Latvia,
Liechtenstein, Lithuania, Luxembourg, Malta, Moldova, Mongolia, the
Netherlands, Norway, Poland, Portugal, Romania, Russian Federation, Slovakia,
Slovenia, Spain, Sweden, Switzerland, Tajikistan, Macedonia, Turkey,
Turkmenistan, Ukraine, United Kingdom, and Uzbekistan
o Observers: Afghanistan, Algeria, Bahrain, China, Canada, Egypt, Iran, Jordan
(moving to full member status), Korea, Kuwait, Morocco, Nigeria, Oman,
Pakistan, Palestinian National Authority, Qatar, Saudi Arabia, Serbia, Tunisia,
United Arab Emirates, United States of America, Venezuela.
11.2. Integration Projects with Greater Potential for Implementation
Based on the overall analysis of regional integration opportunities in chapters 8 and 9, the cross-
border projects with the greatest potential for implementation are identified and discussed below.
11.2.1 Upgrade Electrical Interconnection between Iraq and Syria
This project is in the implementation phase, but there are still further investment needs. The
project includes completion of the 400 kV interconnection between Syria and Iraq. The project’s
focus is on the Iraqi side, although there may be a need to complete the Syrian side as well. The
project includes a single circuit 400 kV overhead line of 165 km from Tayem Substation in Syria
to Qa’im Substation in Iraq. The estimated cost of the project ranges from US$700,000–
750,000/km (US$115 million–125 million).43
The primary benefits of the project are that it would help address Iraq’s electricity shortage,
improve energy security for the Mashreq region, strengthen economic cooperation between Syria
and Iraq, and facilitate development of a proposed regional electricity market, which initially
would include Iran, Iraq, Syria, and Turkey. The added benefit of this project is that it could be
combined with development of the Akass gas field for the potential swap of surplus Iraqi gas into
electricity, in which Iraq has a deficit.
On the downside, neither country has an electricity surplus at this stage. Syria may be unable or
unwilling to export power that it needs for domestic supply. But still the project presents a strong
business case. Iraq has an electricity crisis, with a generation gap of approximately 50 percent
and fast-growing demand . Efforts to install new generating capacity have progressed very
slowly. The Akass field is close to the Syrian gas network, which has spare processing capacity,
and Syria has let a contract for construction of the pipeline on its side of the border. Therefore,
this project could be put in place more quickly than building a new power plant and associated
gas infrastructure in Iraq itself.
43
Based on 2004 figures for construction of a 400 kV line in Iraq. These costs included US$375,000/km plus line
bays, transformers, and a 43.5% mark-up for design and management. These figures illustrate the very high costs of
construction in Iraq under the current conflict conditions.

154
Although Syria has its own generation gap, its gap is due in part to insufficient gas rather than to
insufficient generation capacity. Between Iraq’s need for electricity and Syria’s need for gas,
there is space to reach commercial agreement. Syria has exported electricity to Iraq in the past,
curtailed only by its own shortage of supply, so there is an established path for this arrangement.
The project is at a fairly advanced stage and could be implemented relatively quickly.
11.2.2 Expand and Strengthen Electrical Transmission Corridor from Egypt to
Syria
This project involves upgrading the main trunk of the Mashreq interconnected system between
Egypt and Syria via Jordan. According to Jordan’s Updated Master Plan, the existing
interconnection with Egypt was designed for potential future expansion, including possible
conversion to DC operation, which would make use of a spare fourth cable and increase the
capacity of the interconnection to 1000 MW. It would be necessary to construct additional AC
circuits in both Egypt and Syria. The project would increase interconnection capacity not only
between Jordan and Egypt but also between Jordan/Egypt and Syria, and potentially on to
Lebanon and Turkey. The total cost of the reinforcement is estimated at US$735 million.
An alternative would be to install 2 more submarine cables and operate the interconnection as a
double circuit 400 kV AC link, increasing interconnection capacity to 1100 MVA. This
alternative also would require upgrades to the national power systems including the link between
Jordan and Syria. Thus, it would increase the transfer capacity between Jordan/Egypt and Syria
as well, and potentially on to Lebanon and Turkey. The estimated cost of this alternative is
US$400 million.
Benefits from increasing interconnection capacity are numerous, although difficult to define in
the absence of a detailed transmission modeling study. Egypt’s system is summer-peaking while
Jordan’s system is winter-peaking. Furthermore, there are opportunities for energy exchanges
during the day owing to diversity in daily peak demands between the two countries. Upgrading
the interconnection also would improve system security; improve the ability to install larger
generating units, thus taking advantage of economies of scale (unit sizes could be larger than the
300MW units assumed in Jordan’s expansion plan); increase potential for integrating renewable
energy resources and eventual export of electricity to Turkey and Europe and increase income to
Jordan from wheeling energy from Egypt to Syria and Lebanon, and perhaps Iraq and the West
Bank & Gaza. The system security benefits are probably the most significant. With energy
shortages expected in Lebanon, Syria and the West Bank & Gaza, Jordan and Syria are likely to
gain increased revenues from wheeling. Finally, it is noted that the transmission corridor,
particularly the segment in Jordan would facilitate the development of renewable energy and
could be eligible for financial support from the Clean Technology Fund (CTF).
The interconnections between Syria and Lebanon, Jordan and the West Bank, and Egypt and
Gaza represent important components of the integrated Mashreq transmission system. Therefore,
upgrades to these interconnections (or new interconnections) should be considered in
conjunction with this project. Otherwise, it would be very difficult to determine the benefits and
resulting cost-sharing arrangements. For example, there could be little benefit in upgrading the
interconnection between Syria and Lebanon if Syria remains in a capacity deficit and Egypt is
unable to sell any capacity surplus that it might have to Lebanon owing to transmission limits.

155
11.2.3 Complete Arab Gas Pipeline (AGP)
This project would complete the construction of the remaining links of the Arab Gas Pipeline
(AGP). Feasibility studies show that completion of the AGP is economical and should be
pursued.
Completion of the AGP requires construction of 2 pipeline segments within Syria and one
pipeline segment within Turkey. The total cost of the 3 segments is estimated at US$497 million.
The three segments would be:
Furglus-Aleppo (186 km within Syria) at an estimated cost of $350 million
Aleppo-Kilis (60 km within Syria) at an estimated cost of $80 million
Kilis-Gaziantep (within Turkey) at an estimated cost of $67 million (based on 45 km of
36-inch pipe at US$1.5 million/km).
Construction of the first segment is not likely before Egypt provides a firm commitment to
supply gas. Homs and Aleppo already are indirectly linked. However, bottlenecks in the Syrian
system would prevent significant traffic from the south of the country to the north. This project
will address these bottlenecks.
Preparation and implementation of the second and third segments are at advanced stages. Indeed,
the second segment is already tendered and being constructed with an estimated cost of US$80
million. The third segment would tie the AGP to the Turkish gas network. Preparation and
implementation arrangements are proceeding for a 10 inches pipeline with a capacity of 3-4
bcma.
The project addresses Syria’s gas shortages by enabling it to import from Iran through Turkey. In
the longer term, it would provide a route for gas from Egypt and Iraq to Europe. An MOU
between Syria and Iran provides for sales of up to 3 bcma. This amount may be increased.
Failure to meet gas demand shortfalls will exacerbate existing electricity shortages. The project
also provides an opportunity for Lebanon and possibly Jordan to purchase gas from other
sources. In the longer term, the project provides an export route for Syria if future exploration
identifies significant gas reserves. At 40 inches, the Iran-Turkey pipeline should be sufficient to
allow enough gas to be delivered from Iran to Turkey, although the transit route across Turkey
would be complex. Furthermore, the project provides an export route for significant quantities
(10 bcma, up to 15 bcma with compression) from Egypt/Iraq to Turkey and Europe, with
significant benefits for European energy security and gas supply diversity.
The project provides an uninterrupted north-south link within Syria, allowing for a more efficient
network configuration and use. It completes the AGP and locks in many of the benefits of the
entire pipeline: “The costs of failing to invest are likely to be significantly greater than the
investment cost.”44
The Euro-Arab Mashreq Gas Co-operation Centre’s (EAMGCC) financial
and economic analysis concludes that there is sufficient evidence that the project is justifiable
44
EAMGCC Financial and Economic Analysis, 2008.
156
economically and viable financially.45
In the wake of the global recession, construction costs are
falling, which could further improve the economics. The Feasibility Study, environmental impact
assessment (EIA), and tender documents are largely complete, drawn up by EAMGCC to
international (EIB) standards. The project could proceed relatively quickly to implementation.
11.2.4 Construct Iraq-to-Syria Gas Pipeline
A number of alternatives are under consideration for exporting Iraqi gas to Turkey and perhaps
onward to Europe. The export route would include construction of a new pipeline, either directly
from Iraq to Turkey, or from Iraq to the AGP, terminating in either Syria or Jordan. The export
routes to Turkey and Jordan are discussed below. This section focuses on options for exporting
Iraqi gas to the AGP in Syria.
The primary alternatives for exporting Iraqi gas to Syria include both smaller scale and larger
scale projects. The alternative ultimately chosen will be influenced by the amount of gas
available for export from the Akass field in Iraq’s western desert. As noted earlier, Syria signed a
MOU to purchase gas from Iraq, initially 1.5 bcma from the Akass field, with 1 bcma of this to
be exported. The Akass gas field in Iraq is close to the border with Syria and approximately 50
km from the Syrian gas network, where Syria has spare processing capacity at the nearby Deir
Ezzor and Omar plants. It is understood that Syria has let a contract to a Chinese company to
build the necessary pipeline but that it will have a relatively small diameter of only 10 inches. If
there are significant new discoveries at Akass, a new pipeline will be needed. Initial reports from
Iraq indicated that Shell had been contracted to develop the Akass field but that it now will be
included in the upcoming Iraq oil and gas exploration licensing round.
Syria is the only viable export route for gas from Akass. If exploration identifies significant
reserves, the planned 10-inch pipeline would limit exports. Consequently, a second pipeline
would be required to carry gas from Akass to the AGP in Syria. This smaller scale alternative is
estimated to cost US$75million. The larger scale alternative would include construction of a gas
pipeline from central Iraq to export gas from its northern and/or southern gas fields to the Syrian
port of Banias via the AGP. The project would include approximately 800 km of pipeline at an
estimated cost of US$1.2 billion and would take approximately 60 months to complete.
Project benefits include:
It would enable regional and extra-regional gas trade.
It would provide a gas export route for Iraq.
It would channel gas to the AGP, strengthening its economics.
It would provide a second option for Syria gas imports from Iraq (after Akass, in the
larger scale alternative).
It would provide potential to link up with Iran (the announced “Peace Pipeline”),
providing additional supplies and sponsorship for the project.
45
The purpose of the EAMGCC is “To contribute to the integration of the gas markets of Egypt, Jordan, Lebanon
and Syria in view of creating a regional internal gas market to be integrated with the EU Internal Gas Market.”
www.eamgcc.org
157
It would provide an alternative source of supply for Lebanon.
Project constraints include that:
Building an LNG terminal at Banias would be expensive and time consuming, although
there may be potential for offshore gasification (possibly as an interim solution).
Gas reserves in the unexplored areas in west Iraq need to be confirmed. Confirmation is
dependent on the upcoming exploration license round in Iraq for which details have not
yet been finalized.
The pipeline route has yet to be determined. While the obvious route parallels the oil
pipeline that is being restored, the governments also are considering alternatives, which
could lead to further delays.
There could be competition for gas supplies if the pipeline via Jordan or Turkey is built.
However, the size of the Iraqi reserves and the long-term demand potential indicates
sufficient justification for 2 of the 3 alternatives.
The project would allow Syria to import sufficient gas from Iraq to meet its long-term demand
requirements. It also would provide an opportunity for Lebanon and Jordan to purchase gas from
Iraq. The project provides Iraq access to gas export markets46
and opens up the western desert
areas for gas development.
11.2.5 Construct Iraq-to-Jordan Gas Pipeline
This project would include construction of a gas pipeline from central Iraq to export gas from its
northern and/or southern gas fields to the AGP through Jordan via the Jordanian Risha gas field.
The project would include construction of approximately 800 km of pipeline for US$1.2 billion,
and take approximately 60 months to complete.
Project benefits include:
It would enable regional and extra-regional gas trade.
It would provide a southern gas export route for Iraq.
It would channel gas to the AGP, strengthening its economics.
It would provide a second option for Jordan to import gas (after Egypt).
In the longer term, it would facilitate export of Iraqi gas to Egypt, and potentially, the
West Bank & Gaza.
It would provide a route to the AGP for gas from the Risha field.
Project constraints include:
Gas reserves in the unexplored areas in the west of Iraq need to be confirmed.
Confirmation will depend on the upcoming exploration license round in Iraq, for which
details are not yet finalized.
46
The Akass connection, which will be completed earlier, is only 10 inches in diameter so will have
limited capacity.
158
Possible competition for gas supplies and exports with the potential pipeline through
Syria, and/or the potential pipeline through Turkey. On the other hand, the size of the
Iraqi reserves and the long-term demand suggest that there could be sufficient
justification for 2 of these 3 alternatives for exporting Iraqi gas; i.e., through Turkey,
Jordan or Syria.
The project would enhance Jordan’s energy security and ensure that sufficient gas is available to
meet its growing demand. The recent positive results for gas exploration at Risha improve the
economics of the project since Jordan will need a way to transport the gas to other parts of the
country where it is needed.47
The project would provide access to gas export markets for Iraq (if
the Akass connection were completed, it would be only 10 inches diameter, so would have
limited capacity) and open up the western desert areas for gas development.
The project further strengthens the economics of the AGP by linking to a second large supply
source. Egypt no longer would be the sole supplier of gas to the AGP, reducing the pressure on it
to exploit its resources in the face of public opposition. In the longer term, the project offers
Egypt a source of supply once its own reserves are used up.
11.2.6 Construct Iraq-to-Turkey Gas Pipeline
As noted, there are two distinct––and not mutually exclusive––alternatives for exporting gas
from Iraq to Turkey and Europe. The first option focuses on delivering gas from Iraq’s Kurdistan
region to Turkey where investments are underway to develop the gas fields in Kurdistan for
domestic use. Already discussed, the second option for exporting Iraqi gas to Turkey is based on
the gas resources of Iraq’s northern and/or southern fields, and possibly its Akass field in the
western desert via the AGP through Syria or Jordan. The latter alternative is addressed above.
Project benefits include:
It would provide an additional northern gas export route for Iraq to Turkey and on to
Europe.
It would provide an additional options *(other than Egypt) for Syria, Jordan and Lebanon
to import gas via Turkey; i.e., Iran (assuming the AGP is completed).
In the longer term, it would facilitate export of Iraqi gas to Egypt (assuming the AGP is
completed.
This project would be consistent with the quadripartite agreement among Iraq, Syria,
Turkey, and Iran.
Project constraints include:
It would enable regional gas trade only if the AGP were completed.
It likely would weaken the economics of the AGP.
It could compete for gas supplies and exports with the proposed pipeline through Syria.
Without contracts, demand for the pipeline will be uncertain.
47
Risha is distant from population centers.

159
Transit tariffs in Turkey are undecided and politically sensitive, linked to EU accession.
The project may risk getting caught up in the ongoing Turkey-EU dispute over gas transit
and EU membership.
11.2.7 Construct New Electric Generating Capacity in Syria or Jordan
The Mashreq region as a whole has an electricity capacity deficit. In other words, generation
capacity falls short of electricity demand plus a reserve margin necessary to ensure adequate
reliability of supply, generally 10 percent–15 percent. Therefore, any new generation project
would provide economic benefits to the region in reductions of lost load. Generation that is
added based on least-cost principles would be more efficient. Using least-cost principles also
would reduce the overall cost of power, through both improved efficiency and displacement of
higher-cost with lower-cost fuel. Generation expansion plans at the national level that are
consistent with least-cost principles should be supported. However, generation expansion at the
regional level consistent with least-cost principles would achieve greater benefits provided the
countries could agree in principle on how to share the benefits. A generation project sized to
meet regional market needs and fueled with local natural gas from an as-yet undeveloped gas
field should receive significant interest from the region’s Governments.
Iraq has a significant supply gap in electricity generation capacity and meets only approximately
half of current demand. The Ministry of Electricity’s Master Plan indicates that substantial
investment in generation and transmission capacity is needed through 2015 to raise capacity to
the levels necessary to meet projected demand. Financial constraints mean that private investors
will be needed to fill much of the gap. Iraq has had significant difficulty in building much needed
generation capacity, and its costs are very high owing to conflict, limited private sector
involvement, lack of economies of scale, and other factors. Lebanon and the West Bank & Gaza
have similar problems, although not on the same scale. Current cost estimates for gas-fired plants
in Iraq are approximately US$1300/kW. Plants in Turkey, Jordan, or Syria are likely to cost
significantly less, closer to US$800/kW for a 500 MW combined-cycle gas plant. Investors
would be less concerned about building a power plant in Jordan or Syria. Jordan has experience
with IPPs.
This project would explore the potential for private sector-funded-power plants in Syria and
Jordan for export of electricity to Iraq and possibly Lebanon and the West Bank & Gaza.
Construction of new generation capacity in Syria or Jordan would benefit the host country, Iraq,
Lebanon and the West Bank & Gaza. Locating such plants near gas pipelines would improve the
economics and reduce risks by guaranteeing a supply of primary fuel. These investments would
be linked to proposed electrical interconnections and pipeline projects. The first phase could cost
$400 million for a 500 MW gas-fired plant. A regional generation project would significantly
improve energy integration, particularly if tied to gas exports from Iraq.
11.2.8 De-bottleneck Gas and Electricity Supply Systems in Egypt
The Egyptian gas supply system has been expanded rapidly. However, there is a need to de-
bottleneck certain segments of Egyptian gas pipeline system in order to increase gas exports
from Egypt. The resultant project should be supported as a regional integration project while will
also serve the domestic needs. Similarly, there may be some potential interest from private sector
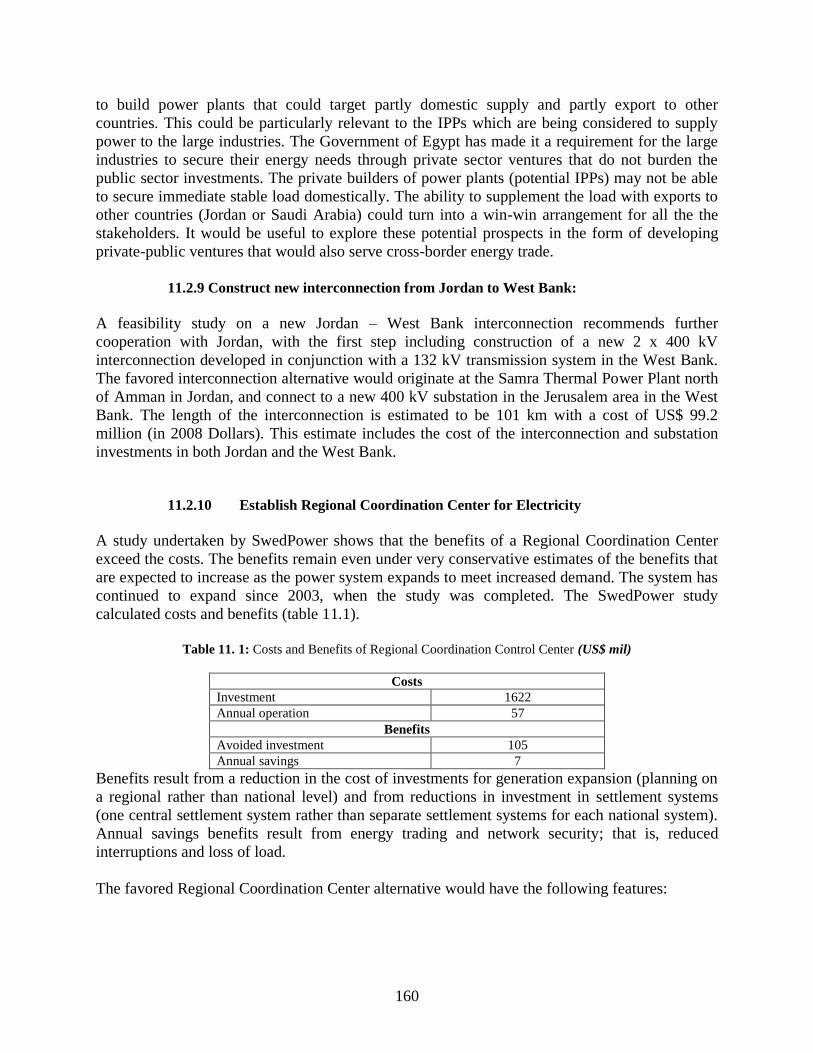
160
to build power plants that could target partly domestic supply and partly export to other
countries. This could be particularly relevant to the IPPs which are being considered to supply
power to the large industries. The Government of Egypt has made it a requirement for the large
industries to secure their energy needs through private sector ventures that do not burden the
public sector investments. The private builders of power plants (potential IPPs) may not be able
to secure immediate stable load domestically. The ability to supplement the load with exports to
other countries (Jordan or Saudi Arabia) could turn into a win-win arrangement for all the the
stakeholders. It would be useful to explore these potential prospects in the form of developing
private-public ventures that would also serve cross-border energy trade.
11.2.9 Construct new interconnection from Jordan to West Bank:
A feasibility study on a new Jordan – West Bank interconnection recommends further
cooperation with Jordan, with the first step including construction of a new 2 x 400 kV
interconnection developed in conjunction with a 132 kV transmission system in the West Bank.
The favored interconnection alternative would originate at the Samra Thermal Power Plant north
of Amman in Jordan, and connect to a new 400 kV substation in the Jerusalem area in the West
Bank. The length of the interconnection is estimated to be 101 km with a cost of US$ 99.2
million (in 2008 Dollars). This estimate includes the cost of the interconnection and substation
investments in both Jordan and the West Bank.
11.2.10 Establish Regional Coordination Center for Electricity
A study undertaken by SwedPower shows that the benefits of a Regional Coordination Center
exceed the costs. The benefits remain even under very conservative estimates of the benefits that
are expected to increase as the power system expands to meet increased demand. The system has
continued to expand since 2003, when the study was completed. The SwedPower study
calculated costs and benefits (table 11.1).
Table 11. 1: Costs and Benefits of Regional Coordination Control Center (US$ mil)
Costs
Investment 1622
Annual operation 57
Benefits
Avoided investment 105
Annual savings 7
Benefits result from a reduction in the cost of investments for generation expansion (planning on
a regional rather than national level) and from reductions in investment in settlement systems
(one central settlement system rather than separate settlement systems for each national system).
Annual savings benefits result from energy trading and network security; that is, reduced
interruptions and loss of load.
The favored Regional Coordination Center alternative would have the following features:
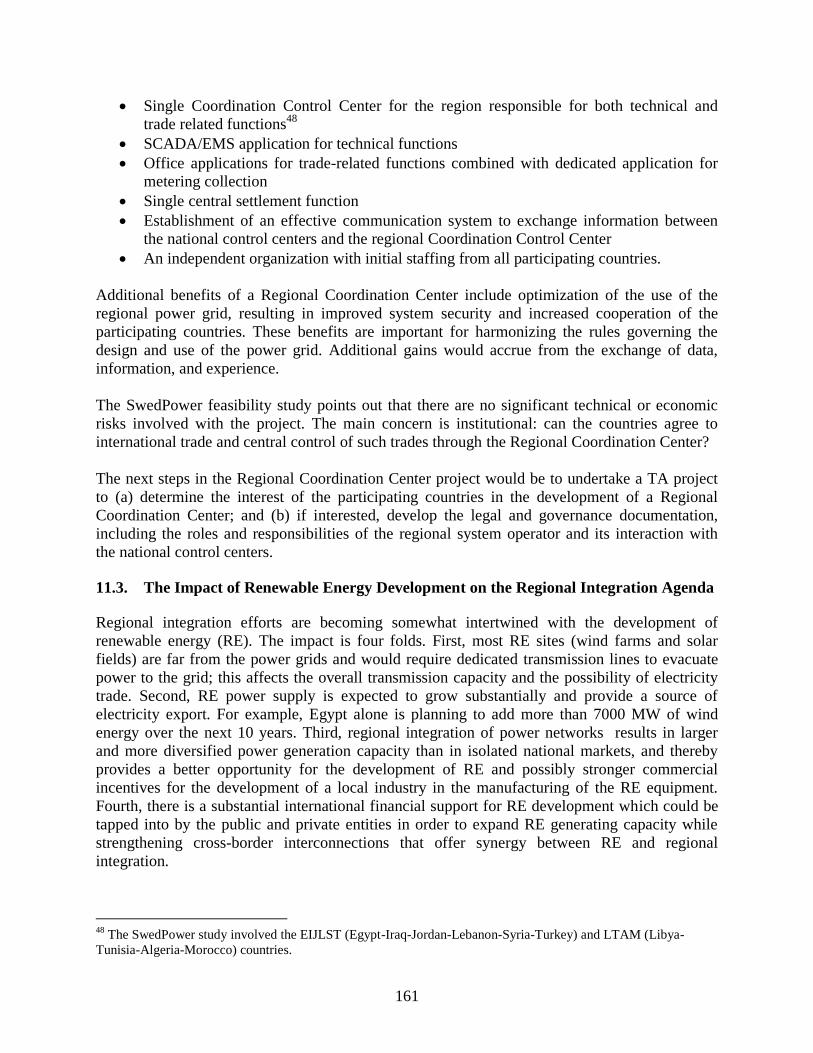
161
Single Coordination Control Center for the region responsible for both technical and
trade related functions48
SCADA/EMS application for technical functions
Office applications for trade-related functions combined with dedicated application for
metering collection
Single central settlement function
Establishment of an effective communication system to exchange information between
the national control centers and the regional Coordination Control Center
An independent organization with initial staffing from all participating countries.
Additional benefits of a Regional Coordination Center include optimization of the use of the
regional power grid, resulting in improved system security and increased cooperation of the
participating countries. These benefits are important for harmonizing the rules governing the
design and use of the power grid. Additional gains would accrue from the exchange of data,
information, and experience.
The SwedPower feasibility study points out that there are no significant technical or economic
risks involved with the project. The main concern is institutional: can the countries agree to
international trade and central control of such trades through the Regional Coordination Center?
The next steps in the Regional Coordination Center project would be to undertake a TA project
to (a) determine the interest of the participating countries in the development of a Regional
Coordination Center; and (b) if interested, develop the legal and governance documentation,
including the roles and responsibilities of the regional system operator and its interaction with
the national control centers.
11.3. The Impact of Renewable Energy Development on the Regional Integration Agenda
Regional integration efforts are becoming somewhat intertwined with the development of
renewable energy (RE). The impact is four folds. First, most RE sites (wind farms and solar
fields) are far from the power grids and would require dedicated transmission lines to evacuate
power to the grid; this affects the overall transmission capacity and the possibility of electricity
trade. Second, RE power supply is expected to grow substantially and provide a source of
electricity export. For example, Egypt alone is planning to add more than 7000 MW of wind
energy over the next 10 years. Third, regional integration of power networks results in larger
and more diversified power generation capacity than in isolated national markets, and thereby
provides a better opportunity for the development of RE and possibly stronger commercial
incentives for the development of a local industry in the manufacturing of the RE equipment.
Fourth, there is a substantial international financial support for RE development which could be
tapped into by the public and private entities in order to expand RE generating capacity while
strengthening cross-border interconnections that offer synergy between RE and regional
integration.
48
The SwedPower study involved the EIJLST (Egypt-Iraq-Jordan-Lebanon-Syria-Turkey) and LTAM (Libya-
Tunisia-Algeria-Morocco) countries.

162
The impact of RE on the regional integration agenda has been explicitly addressed in various
solar initiatives. In particular, the Middle East and North Africa (MENA) Concentrated Solar
Power (CSP) Initiative has received a lot of support from the international community. It follows
the recommendation of the International Energy Agency that identifies CSP as a key technology
that would drive the forthcoming energy revolution aimed at reducing greenhouse gas emissions.
It is at the same time recognized that CSP has higher costs and risks than current technologies,
and that these costs and risks can only be reduced by a large scale deployment of the technology.
The MENA Solar Initiative is formulated to promote the application of CSP in the MENA region
which receives some of the most intensive solar radiation in the world and has some of the best
markets for solar energy within the region. The Initiative has received approval from the Clean
Technology Fund (CTF) for $750 million concessional financing in support of a proposed
investment plan with a total cost of $6 billion. The investment plan is aimed at:
Supporting the deployment of about 1 Gigawatt of generation capacity (about 15% of the
projected pipeline globally) in five CTF-eligible countries that have demonstrated strong
commitment to participate: Algeria, Egypt, Jordan, Morocco and Tunisia.
Supporting associated transmission infrastructure for domestic supply and exports, as part
of Mediterranean grid enhancement.
Leveraging over US$ 3 billion in public and private investments for CSP power plants
alone (thereby tripling current global investments in CSP),
Helping MENA countries contribute the benefit of their unique geography to global
climate change mitigation, and
Helping MENA countries achieve their development goals of energy security, industrial
growth and diversification, and regional integration.
A Gigawatt-scale regional CSP deployment program has the potential to trigger significant cost
reductions by virtue of volume of production, increased plant size, and technological advance. A
deployment program of 10-12 utility-scale CSP plants in a number of countries would send a
strong signal to the market that would enable the industry to plan manufacturing capacity
expansions, which is central to driving down the costs of solar thermal technology and
production processes. Moreover, the program utilizes the best solar resources in the world to help
bring down cost of production. Deployment of this program would also provide the critical mass
of investments necessary to attract private sector interest.
Presently, three countries – Morocco, Algeria and Egypt have each a 20 MW CSP plant under
construction, and the UAE is implementing a 100 MW CSP plant in Abu Dhabi. However, these,
as well as some other countries in the region have much larger CSP projects under preparation
(Chart below).

163
In the course of the past few years, several MENA countries have set specific targets for RE’s
share of national power generation. These targets range between 6 to 20% by 2020. Most
notably, The Government of Egypt has committed to increasing the share of renewable energy to
20% by year 2020 as a means of meeting growing electricity demand and achieving the
economic objective of utilizing natural gas for higher value purposes. A 2500 MW wind scale-
up program is under implementation which is envisaged to be expanded even further to more
than 7000 MW. The country’s generation expansion plan also includes 100 MW of CSP
capacities to be implemented by 2017. The Government of Egypt is a champion of RE in the
Mashreq and more broadly the MENA region and has taken significant leadership in this regard
through the creation of a regional Renewable Energy and Energy Efficiency Center, supported
by the European Commission, GTZ and Danida, and is co-President of the Mediterranean Solar
Plan.
Jordan has also a keen interest to develop RE generation capacity considering the fact that it is
almost entirely dependent on fuel imports for its energy requirements. The new energy strategy,
which was adopted in 2007, emphasizes RE and sets a target of 10% by 2020. Jordan is taking
some concrete steps to develop its RE resources, including installation of wind, solar, and
landfill gas plants. With respect to CSP, the first pilot facility and training center is being
proposed under grant support from the European Commission. The first commercial scale CSP
project is being proposed in the range of 100 MW, as a private sector project in the Maan
province in Southern Jordan.
Syria is embarking on implementation of an ambitious wind power program that aims for
development of up to 2500 MW of wind power plants by 2030. This policy is based on wind
measurements obtained from the 17 sites identified for potential development of wind farms.
Syria is also keen to develop solar power projects based on CSP and PV technologies. The West
Bank & Gaza are likewise showing an interest in CSP and wind power.
Finally, it is worth noting that the regional CSP scale-up program will be further strengthened by
some relevant developments in the European Union. In 2008, the EU adopted a landmark piece
of legislation that will drive the expansion of RE in its member countries and the neighboring

164
regions. Each of the 27 EU member states will be obliged to increase its share of energy from RE
sources in gross final consumption of energy from 8.5% in 2008 to 20% by 2020. The legislation
provides the flexibility that the EU member states can import electricity from non-EU member
countries and count it towards the RE target if two criteria are fulfilled:
Renewable capacity in the corresponding non-EU country is installed or added
after June 25, 2009.
The amount of renewable electricity produced and exported has not received
support from the host country other than investment aid granted to the installation.
If the above conditions are fulfilled, the EU Member States may decide to support imported
electricity from non-EU countries within their national support schemes in effect making their
subsidized tariffs available to non-EU countries. Projects under the MENA CSP program could
be eligible for such sale of electricity to Europe.
Financial support for the development of RE generating capacity is essential in order to make RE
commercially competitive with the conventional sources of power generation. The cost of RE
electricity generation is higher than that of conventional power due RE’s high upfront capital
cost and its low capacity factor. In the case of wind power both of these factors have improved
substantially in the last two decades though still the average cost of delivered electricity is
somewhat above a conventional plant such as natural gas fired combined cycle power generation
(Table 11.2). The CSP technology, on the other hand, is still at an early stage of the cost cycle
and will not be competitive with a conventional plant without a significant reduction in its capital
costs. For example, a CSP plant with US$4,000/kW capital cost operating at 20% capacity factor
(most likely parameters in MENA countries) would be 3.7 time as expensive as combined cycle
gas turbine technology (CCGT). Under a more optimistic scenario, a CSP plant with
US$2,696/kW (the cheapest model currently available) at 30% capacity factor (which could be
possible in MENA), would be 66% more expensive than the CCGT power plant. The comparison
becomes more favorable to CSP if one adds the environmental benefits of CSP, such as climate
change mitigation and reduction of local air pollution. For example, 1 MWh of electricity
produced from CSP would reduce CO2 emissions in MENA countries by 0.51 tons to 0.83 tons.
This implies that even if the CO2 mitigation is sold at US10/tCO2, the economic costs of CSP
would be reduced from 13.2 to 8.2 cents/kWh.
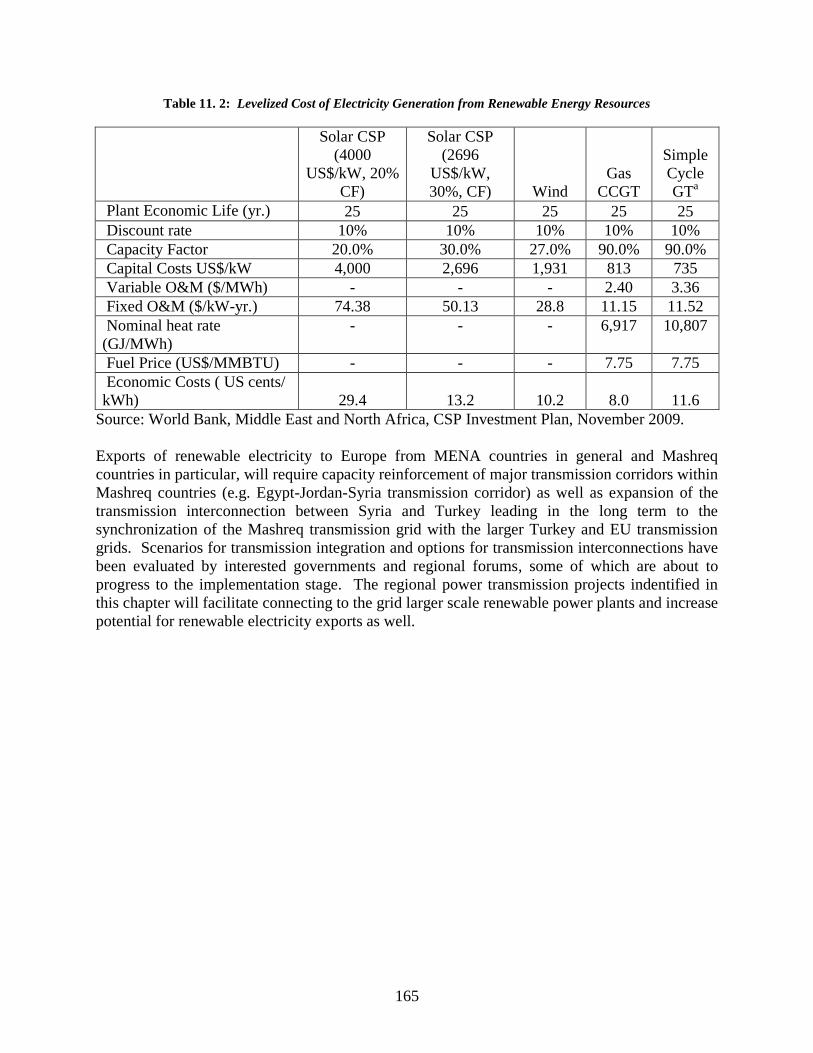
165
Table 11. 2: Levelized Cost of Electricity Generation from Renewable Energy Resources
Solar CSP
(4000
US$/kW, 20%
CF)
Solar CSP
(2696
US$/kW,
30%, CF) Wind
Gas
CCGT
Simple
Cycle
GTa
Plant Economic Life (yr.) 25 25 25 25 25
Discount rate 10% 10% 10% 10% 10%
Capacity Factor 20.0% 30.0% 27.0% 90.0% 90.0%
Capital Costs US$/kW 4,000 2,696 1,931 813 735
Variable O&M ($/MWh) - - - 2.40 3.36
Fixed O&M ($/kW-yr.) 74.38 50.13 28.8 11.15 11.52
Nominal heat rate
(GJ/MWh)
- - - 6,917 10,807
Fuel Price (US$/MMBTU) - - - 7.75 7.75
Economic Costs ( US cents/
kWh) 29.4 13.2 10.2 8.0 11.6
Source: World Bank, Middle East and North Africa, CSP Investment Plan, November 2009.
Exports of renewable electricity to Europe from MENA countries in general and Mashreq
countries in particular, will require capacity reinforcement of major transmission corridors within
Mashreq countries (e.g. Egypt-Jordan-Syria transmission corridor) as well as expansion of the
transmission interconnection between Syria and Turkey leading in the long term to the
synchronization of the Mashreq transmission grid with the larger Turkey and EU transmission
grids. Scenarios for transmission integration and options for transmission interconnections have
been evaluated by interested governments and regional forums, some of which are about to
progress to the implementation stage. The regional power transmission projects indentified in
this chapter will facilitate connecting to the grid larger scale renewable power plants and increase
potential for renewable electricity exports as well.

166
Chapter 12. CONCLUSIONS
The country analyses contained in this study show significant benefits for integration of electricity and
gas networks of Mashreq countries. These countries are facing a rather unprecedented situation where
they are all potential buyers of electricity due to the rapid growth in electricity demand and tight reserve
margins. Thus the demand-supply picture indicates significant opportunities for electricity and gas trade.
Aside from the trade opportunities, electricity interconnections impart other benefits such as peak sharing,
improved system reliability, reduced reserve margin, reactive power support, etc. However, despite their
substantial benefits, cross-border projects face significant economic and institutional constraints. The
main recommendation of this study is that the governments of Mashreq countries should attempt to
alleviate these constraints improving economic incentives and reducing institutional risks.
12.1. Electricity and Gas Price
Mashreq countries have energy prices that are far below the economic cost of supply. As discussed in
the country chapters (chapters 2–7), with the exception of Jordan, none of the Mashreq countries
has truly “independent and informed” regulation.49
With the exception of Jordan and the West
Bank & Gaza, tariffs do not reflect the economic cost of supply, requiring Governments to
convey substantial subsidies to the domestic energy sector and cross-subsidization between and
within customer classes that goes well beyond assistance to the socially disadvantaged. In some
cases, segments of the population are unable to pay prices that reflect the economic cost of
supply, but the difficult challenge facing Governments is that the long history of subsidization
and cross-subsidization in fuels and electricity prices has resulted in the population’s
unwillingness to pay for energy. It is proving to be a difficult task to eliminate the complex
system of subsidies that have developed over the years. As noted, Jordan is the exception in that
its regulatory authority is able to act in an independent and informed manner, establishing tariffs
that reflect the cost of supply. Not surprisingly, Jordan’s privatization and IPP programs have
enjoyed a high level of success.
The countries that are energy deficient are under pressure to reduce subsidization, which is
taking a significant toll on their treasuries. Even countries that are relatively rich in energy
resources, such as Egypt, Syria and Iraq, will not be able to sustain subsidies indefinitely,
particularly under the very high levels of growth in energy consumption forecast in the
immediate and longer terms. Subsidies lead to numerous problems, three of which are:
Utilities do not have the funds necessary to maintain, let alone expand, the system to
meet increasing demands and replace retired plant, decreasing reliability.
The signals for investment are distorted, leading to less than optimal investment decisions
and higher energy costs.
Subsidies distort consumption decisions, resulting in an inefficient allocation of
resources. Generally, subsidized prices lead to increased consumption. They also provide
incentives for consumers to use the subsidized energy form rather than alternative energy
forms that may be more economical in certain applications.
49
“Independent and informed” regulation means that an entity exists with extensive expertise and background in the
energy sector and that is able to make decisions and establish tariffs free of political interference and that are in the
best interests of the energy sector as a whole including suppliers and consumers.
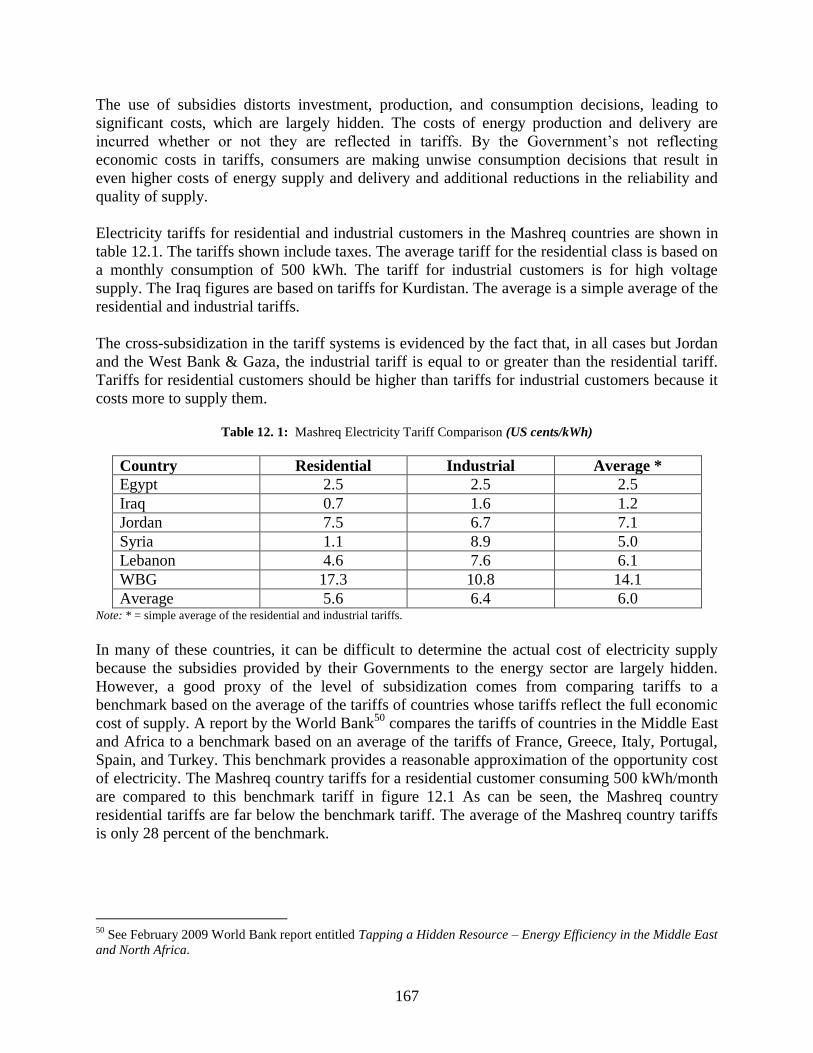
167
The use of subsidies distorts investment, production, and consumption decisions, leading to
significant costs, which are largely hidden. The costs of energy production and delivery are
incurred whether or not they are reflected in tariffs. By the Government’s not reflecting
economic costs in tariffs, consumers are making unwise consumption decisions that result in
even higher costs of energy supply and delivery and additional reductions in the reliability and
quality of supply.
Electricity tariffs for residential and industrial customers in the Mashreq countries are shown in
table 12.1. The tariffs shown include taxes. The average tariff for the residential class is based on
a monthly consumption of 500 kWh. The tariff for industrial customers is for high voltage
supply. The Iraq figures are based on tariffs for Kurdistan. The average is a simple average of the
residential and industrial tariffs.
The cross-subsidization in the tariff systems is evidenced by the fact that, in all cases but Jordan
and the West Bank & Gaza, the industrial tariff is equal to or greater than the residential tariff.
Tariffs for residential customers should be higher than tariffs for industrial customers because it
costs more to supply them.
Table 12. 1: Mashreq Electricity Tariff Comparison (US cents/kWh)
Country Residential Industrial Average *
Egypt 2.5 2.5 2.5
Iraq 0.7 1.6 1.2
Jordan 7.5 6.7 7.1
Syria 1.1 8.9 5.0
Lebanon 4.6 7.6 6.1
WBG 17.3 10.8 14.1
Average 5.6 6.4 6.0 Note: * = simple average of the residential and industrial tariffs.
In many of these countries, it can be difficult to determine the actual cost of electricity supply
because the subsidies provided by their Governments to the energy sector are largely hidden.
However, a good proxy of the level of subsidization comes from comparing tariffs to a
benchmark based on the average of the tariffs of countries whose tariffs reflect the full economic
cost of supply. A report by the World Bank50
compares the tariffs of countries in the Middle East
and Africa to a benchmark based on an average of the tariffs of France, Greece, Italy, Portugal,
Spain, and Turkey. This benchmark provides a reasonable approximation of the opportunity cost
of electricity. The Mashreq country tariffs for a residential customer consuming 500 kWh/month
are compared to this benchmark tariff in figure 12.1 As can be seen, the Mashreq country
residential tariffs are far below the benchmark tariff. The average of the Mashreq country tariffs
is only 28 percent of the benchmark.
50
See February 2009 World Bank report entitled Tapping a Hidden Resource – Energy Efficiency in the Middle East
and North Africa.
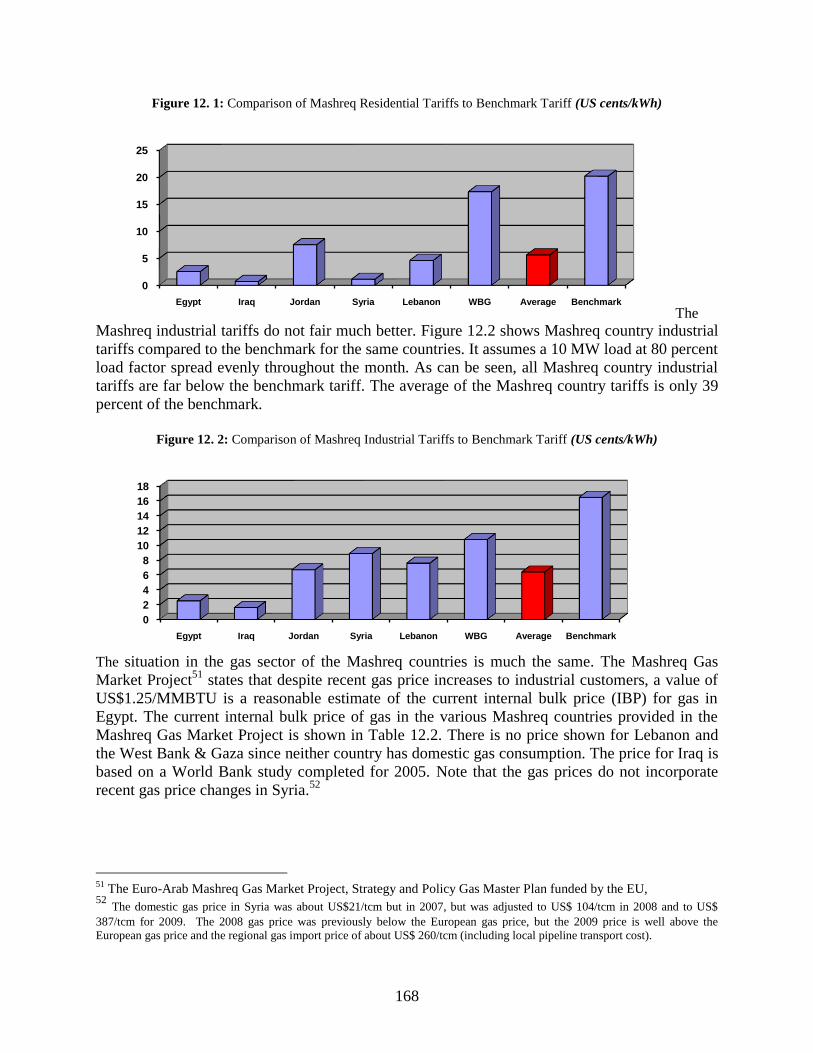
168
Figure 12. 1: Comparison of Mashreq Residential Tariffs to Benchmark Tariff (US cents/kWh)
The
Mashreq industrial tariffs do not fair much better. Figure 12.2 shows Mashreq country industrial
tariffs compared to the benchmark for the same countries. It assumes a 10 MW load at 80 percent
load factor spread evenly throughout the month. As can be seen, all Mashreq country industrial
tariffs are far below the benchmark tariff. The average of the Mashreq country tariffs is only 39
percent of the benchmark.
Figure 12. 2: Comparison of Mashreq Industrial Tariffs to Benchmark Tariff (US cents/kWh)
The situation in the gas sector of the Mashreq countries is much the same. The Mashreq Gas
Market Project51
states that despite recent gas price increases to industrial customers, a value of
US$1.25/MMBTU is a reasonable estimate of the current internal bulk price (IBP) for gas in
Egypt. The current internal bulk price of gas in the various Mashreq countries provided in the
Mashreq Gas Market Project is shown in Table 12.2. There is no price shown for Lebanon and
the West Bank & Gaza since neither country has domestic gas consumption. The price for Iraq is
based on a World Bank study completed for 2005. Note that the gas prices do not incorporate
recent gas price changes in Syria.52
51
The Euro-Arab Mashreq Gas Market Project, Strategy and Policy Gas Master Plan funded by the EU, 52
The domestic gas price in Syria was about US$21/tcm but in 2007, but was adjusted to US$ 104/tcm in 2008 and to US$
387/tcm for 2009. The 2008 gas price was previously below the European gas price, but the 2009 price is well above the
European gas price and the regional gas import price of about US$ 260/tcm (including local pipeline transport cost).
0
5
10
15
20
25
Egypt Iraq Jordan Syria Lebanon WBG Average Benchmark
0
2
4
6
8
10
12
14
16
18
Egypt Iraq Jordan Syria Lebanon WBG Average Benchmark
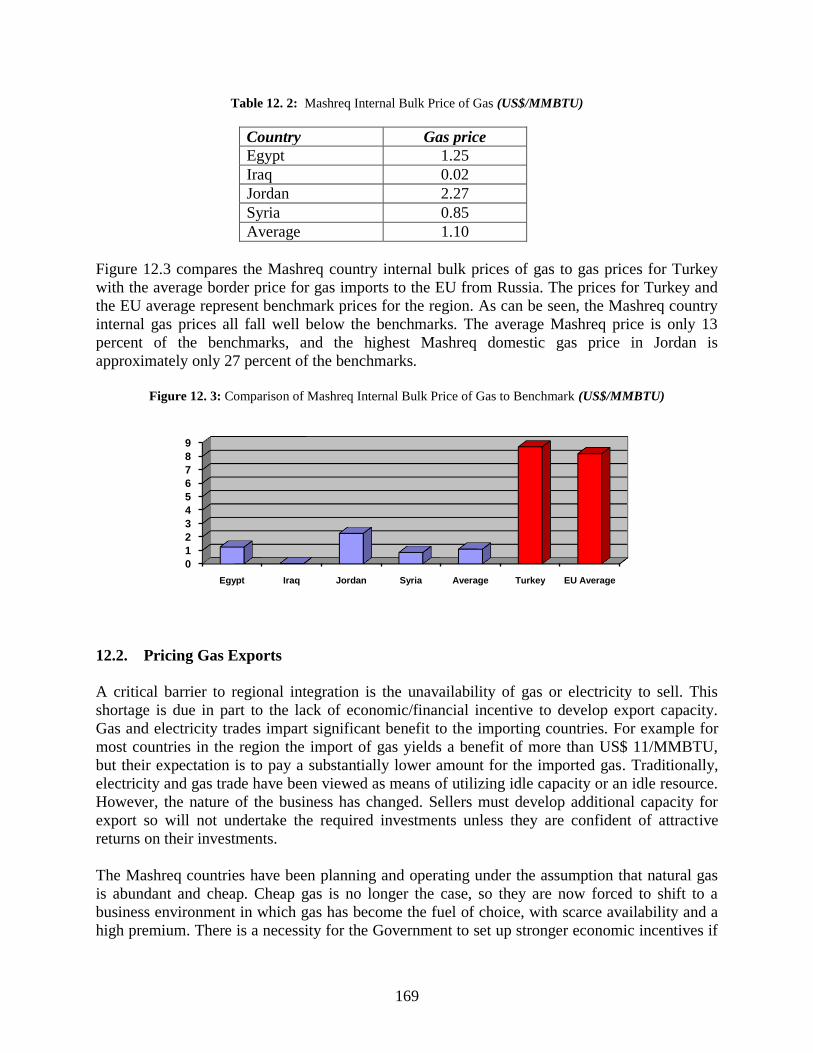
169
Table 12. 2: Mashreq Internal Bulk Price of Gas (US$/MMBTU)
Country Gas price
Egypt 1.25
Iraq 0.02
Jordan 2.27
Syria 0.85
Average 1.10
Figure 12.3 compares the Mashreq country internal bulk prices of gas to gas prices for Turkey
with the average border price for gas imports to the EU from Russia. The prices for Turkey and
the EU average represent benchmark prices for the region. As can be seen, the Mashreq country
internal gas prices all fall well below the benchmarks. The average Mashreq price is only 13
percent of the benchmarks, and the highest Mashreq domestic gas price in Jordan is
approximately only 27 percent of the benchmarks.
Figure 12. 3: Comparison of Mashreq Internal Bulk Price of Gas to Benchmark (US$/MMBTU)
12.2. Pricing Gas Exports
A critical barrier to regional integration is the unavailability of gas or electricity to sell. This
shortage is due in part to the lack of economic/financial incentive to develop export capacity.
Gas and electricity trades impart significant benefit to the importing countries. For example for
most countries in the region the import of gas yields a benefit of more than US$ 11/MMBTU,
but their expectation is to pay a substantially lower amount for the imported gas. Traditionally,
electricity and gas trade have been viewed as means of utilizing idle capacity or an idle resource.
However, the nature of the business has changed. Sellers must develop additional capacity for
export so will not undertake the required investments unless they are confident of attractive
returns on their investments.
The Mashreq countries have been planning and operating under the assumption that natural gas
is abundant and cheap. Cheap gas is no longer the case, so they are now forced to shift to a
business environment in which gas has become the fuel of choice, with scarce availability and a
high premium. There is a necessity for the Government to set up stronger economic incentives if
0
1
2
3
4
5
6
7
8
9
Egypt Iraq Jordan Syria Average Turkey EU Average
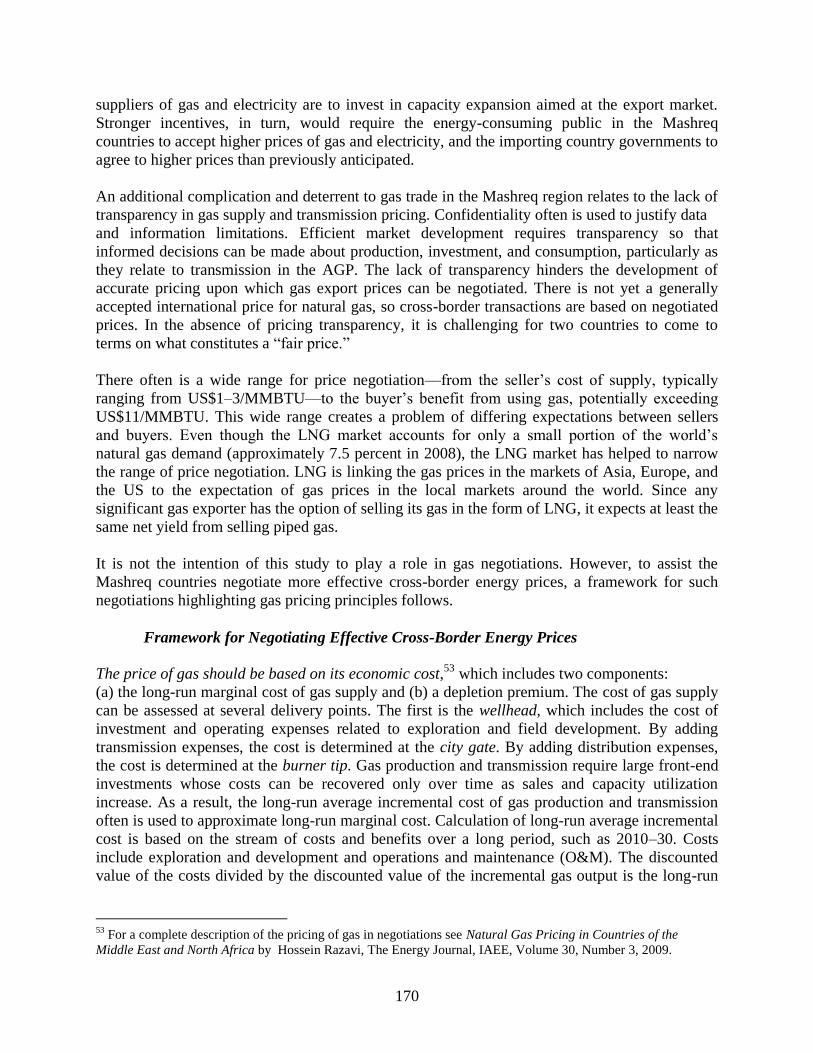
170
suppliers of gas and electricity are to invest in capacity expansion aimed at the export market.
Stronger incentives, in turn, would require the energy-consuming public in the Mashreq
countries to accept higher prices of gas and electricity, and the importing country governments to
agree to higher prices than previously anticipated.
An additional complication and deterrent to gas trade in the Mashreq region relates to the lack of
transparency in gas supply and transmission pricing. Confidentiality often is used to justify data
and information limitations. Efficient market development requires transparency so that
informed decisions can be made about production, investment, and consumption, particularly as
they relate to transmission in the AGP. The lack of transparency hinders the development of
accurate pricing upon which gas export prices can be negotiated. There is not yet a generally
accepted international price for natural gas, so cross-border transactions are based on negotiated
prices. In the absence of pricing transparency, it is challenging for two countries to come to
terms on what constitutes a “fair price.”
There often is a wide range for price negotiation––from the seller’s cost of supply, typically
ranging from US$1–3/MMBTU––to the buyer’s benefit from using gas, potentially exceeding
US$11/MMBTU. This wide range creates a problem of differing expectations between sellers
and buyers. Even though the LNG market accounts for only a small portion of the world’s
natural gas demand (approximately 7.5 percent in 2008), the LNG market has helped to narrow
the range of price negotiation. LNG is linking the gas prices in the markets of Asia, Europe, and
the US to the expectation of gas prices in the local markets around the world. Since any
significant gas exporter has the option of selling its gas in the form of LNG, it expects at least the
same net yield from selling piped gas.
It is not the intention of this study to play a role in gas negotiations. However, to assist the
Mashreq countries negotiate more effective cross-border energy prices, a framework for such
negotiations highlighting gas pricing principles follows.
Framework for Negotiating Effective Cross-Border Energy Prices
The price of gas should be based on its economic cost,53
which includes two components:
(a) the long-run marginal cost of gas supply and (b) a depletion premium. The cost of gas supply
can be assessed at several delivery points. The first is the wellhead, which includes the cost of
investment and operating expenses related to exploration and field development. By adding
transmission expenses, the cost is determined at the city gate. By adding distribution expenses,
the cost is determined at the burner tip. Gas production and transmission require large front-end
investments whose costs can be recovered only over time as sales and capacity utilization
increase. As a result, the long-run average incremental cost of gas production and transmission
often is used to approximate long-run marginal cost. Calculation of long-run average incremental
cost is based on the stream of costs and benefits over a long period, such as 2010–30. Costs
include exploration and development and operations and maintenance (O&M). The discounted
value of the costs divided by the discounted value of the incremental gas output is the long-run
53
For a complete description of the pricing of gas in negotiations see Natural Gas Pricing in Countries of the
Middle East and North Africa by Hossein Razavi, The Energy Journal, IAEE, Volume 30, Number 3, 2009.

171
average incremental cost of gas at the wellhead. The same methodology yields the long-run
average incremental cost of transmission and distribution.
The depletion premium is determined by a country’s gas reserves. It represents the opportunity
cost of consuming a unit of an exhaustible resource now rather than in the future. This
calculation is somewhat arbitrary because assumptions must be made relating to the price of the
alternative fuel and the time over which the exhaustible resource will be utilized. The depletion
premium is based on the cost of the substitute fuel at the time that the depletion constraint
becomes binding and users would need to switch to the alternative fuel. Countries that have large
gas reserves expected to support forecast production for 40–50 years or more have a negligible
depletion premium because the present value becomes insignificant. In their case, the economic
cost of gas becomes the long-run average incremental cost of gas supply. Countries that have
constrained reserves have a large depletion premium approaching the price of the alternative
fuel, that is, the cost to convert a power plant and produce electricity from oil.
In addition to the concepts of long-run marginal cost and depletion premium, negotiations often
take into account the “market,” or “netback,” value, which refers to the economic benefit of
using gas for various purposes, that is, power production. In a free market environment, the
economic benefit of gas, or its “market value,” is based on the economic cost of the replaced fuel
with adjustments to take account of differences in capital costs, operating costs, thermal
efficiency, and the cost of fuel processing and delivery. However, in countries in which the
Government sets prices of gas and alternative fuels, “netback” value often is used as a substitute
for “market” value. Netback value can be used to estimate the net gain from (a) gas exports, (b)
using gas as a feedstock for fertilizer and petrochemicals, or (c) using gas for gas-to-liquid
conversion processes to identify the most economically attractive purposes for gas allocation.
The netback value can represent an opportunity cost benchmark for internal gas use. It is
obtained by deducting the cost of delivering the gas to the consumer from the market value. The
netback value of gas use in the power sector often is used as the benchmark for gas pricing and
for decisions relating to gas allocation. Power generation in the Mashreq countries primarily
consists of oil- and gas-fired plants, supported by some renewable generation, mostly hydro. In
the short to medium term, generating stations usually can be converted from oil to gas, or vice
versa. In the longer term, new plants can be constructed to burn either oil or gas, so netback
values are calculated assuming an oil plant as the alternative to gas-fired generation.
In the future, the growth of the LNG market could become an accepted international reference
price benchmark, and to some extent already has. Many countries now use LNG prices in
negotiations for gas export contracts. The 2008 piped gas prices in Europe closely tracked the
2007 Japanese LNG prices (IEA Statistics 2008) (Figure 12.4).
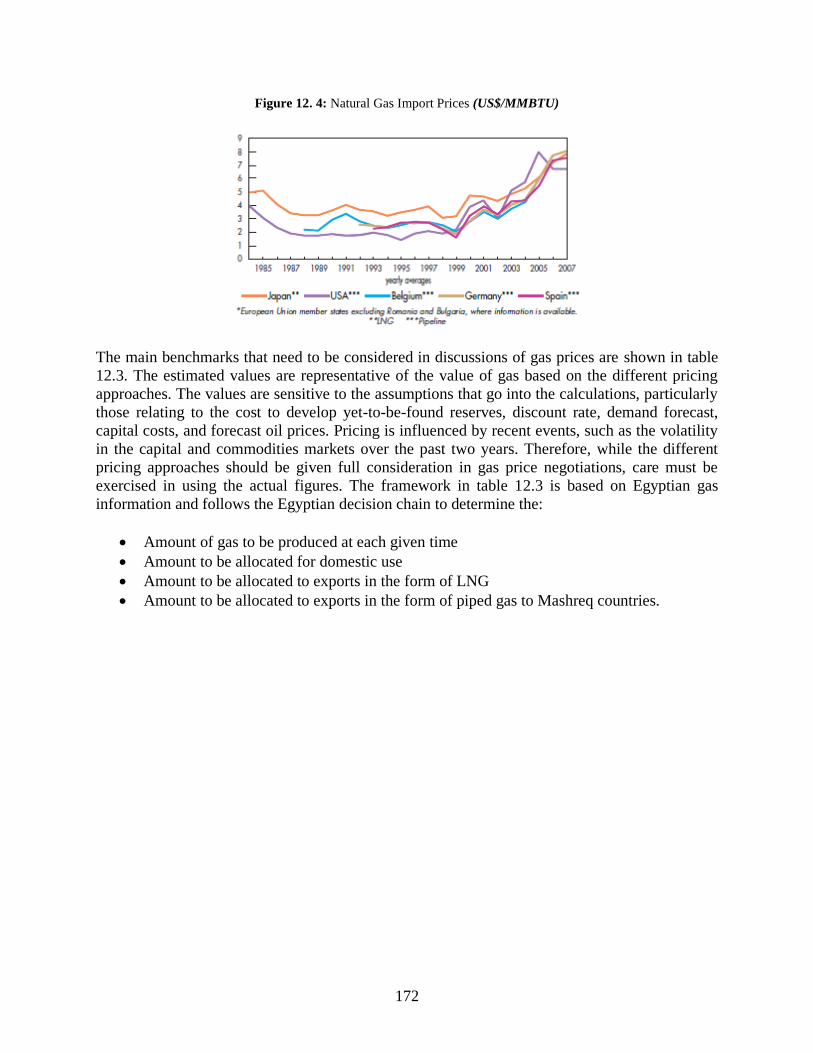
172
Figure 12. 4: Natural Gas Import Prices (US$/MMBTU)
The main benchmarks that need to be considered in discussions of gas prices are shown in table
12.3. The estimated values are representative of the value of gas based on the different pricing
approaches. The values are sensitive to the assumptions that go into the calculations, particularly
those relating to the cost to develop yet-to-be-found reserves, discount rate, demand forecast,
capital costs, and forecast oil prices. Pricing is influenced by recent events, such as the volatility
in the capital and commodities markets over the past two years. Therefore, while the different
pricing approaches should be given full consideration in gas price negotiations, care must be
exercised in using the actual figures. The framework in table 12.3 is based on Egyptian gas
information and follows the Egyptian decision chain to determine the:
Amount of gas to be produced at each given time
Amount to be allocated for domestic use
Amount to be allocated to exports in the form of LNG
Amount to be allocated to exports in the form of piped gas to Mashreq countries.
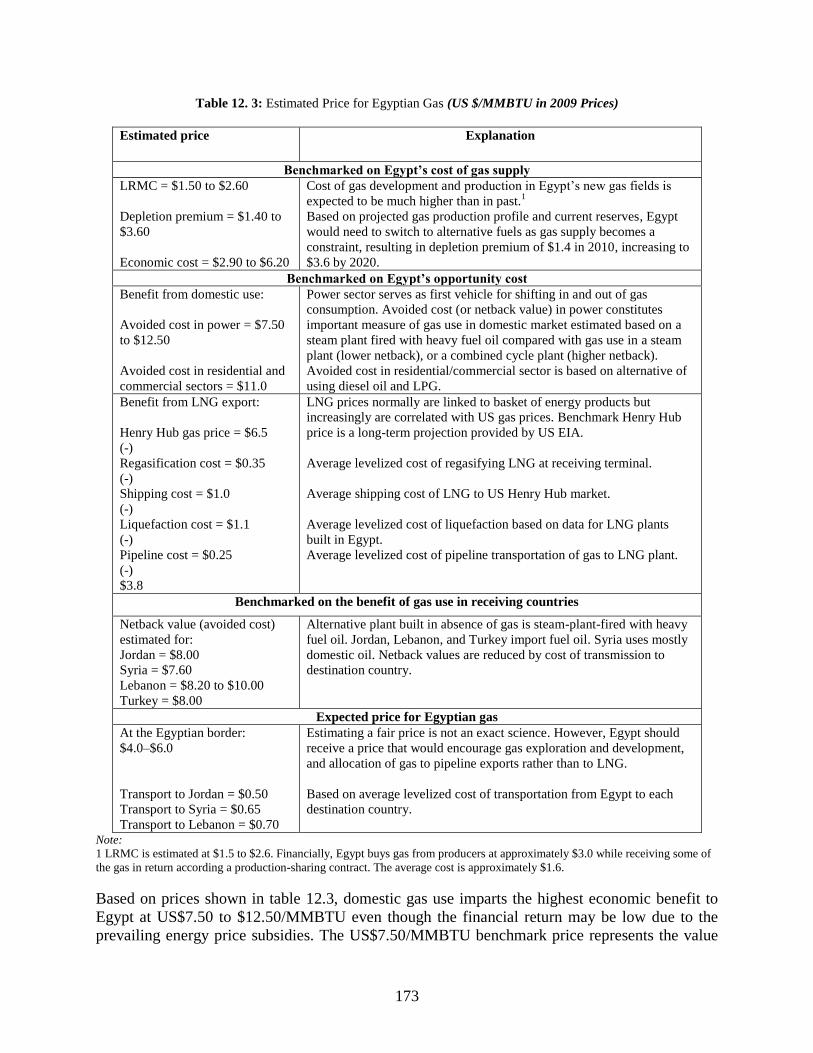
173
Table 12. 3: Estimated Price for Egyptian Gas (US $/MMBTU in 2009 Prices)
Estimated price Explanation
Benchmarked on Egypt’s cost of gas supply
LRMC = $1.50 to $2.60
Depletion premium = $1.40 to
$3.60
Economic cost = $2.90 to $6.20
Cost of gas development and production in Egypt’s new gas fields is
expected to be much higher than in past.1
Based on projected gas production profile and current reserves, Egypt
would need to switch to alternative fuels as gas supply becomes a
constraint, resulting in depletion premium of $1.4 in 2010, increasing to
$3.6 by 2020.
Benchmarked on Egypt’s opportunity cost
Benefit from domestic use:
Avoided cost in power = $7.50
to $12.50
Avoided cost in residential and
commercial sectors = $11.0
Power sector serves as first vehicle for shifting in and out of gas
consumption. Avoided cost (or netback value) in power constitutes
important measure of gas use in domestic market estimated based on a
steam plant fired with heavy fuel oil compared with gas use in a steam
plant (lower netback), or a combined cycle plant (higher netback).
Avoided cost in residential/commercial sector is based on alternative of
using diesel oil and LPG.
Benefit from LNG export:
Henry Hub gas price = $6.5
(-)
Regasification cost = $0.35
(-)
Shipping cost = $1.0
(-)
Liquefaction cost = $1.1
(-)
Pipeline cost = $0.25
(-)
$3.8
LNG prices normally are linked to basket of energy products but
increasingly are correlated with US gas prices. Benchmark Henry Hub
price is a long-term projection provided by US EIA.
Average levelized cost of regasifying LNG at receiving terminal.
Average shipping cost of LNG to US Henry Hub market.
Average levelized cost of liquefaction based on data for LNG plants
built in Egypt.
Average levelized cost of pipeline transportation of gas to LNG plant.
Benchmarked on the benefit of gas use in receiving countries
Netback value (avoided cost)
estimated for:
Jordan = $8.00
Syria = $7.60
Lebanon = $8.20 to $10.00
Turkey = $8.00
Alternative plant built in absence of gas is steam-plant-fired with heavy
fuel oil. Jordan, Lebanon, and Turkey import fuel oil. Syria uses mostly
domestic oil. Netback values are reduced by cost of transmission to
destination country.
Expected price for Egyptian gas
At the Egyptian border:
$4.0–$6.0
Transport to Jordan = $0.50
Transport to Syria = $0.65
Transport to Lebanon = $0.70
Estimating a fair price is not an exact science. However, Egypt should
receive a price that would encourage gas exploration and development,
and allocation of gas to pipeline exports rather than to LNG.
Based on average levelized cost of transportation from Egypt to each
destination country.
Note:
1 LRMC is estimated at $1.5 to $2.6. Financially, Egypt buys gas from producers at approximately $3.0 while receiving some of
the gas in return according a production-sharing contract. The average cost is approximately $1.6.
Based on prices shown in table 12.3, domestic gas use imparts the highest economic benefit to
Egypt at US$7.50 to $12.50/MMBTU even though the financial return may be low due to the
prevailing energy price subsidies. The US$7.50/MMBTU benchmark price represents the value
174
of gas when used in a steam plant and compared with the alternative of HFO-fired plant. The
economic value of gas will be much higher at $12.50/MMBTU if the gas is used in a combined
cycle power plant. The price of oil is based on World Bank forecasts of international oil prices.
Domestic use imparts the greatest economic benefit, suggesting that Egypt should assign the
highest priority to meeting the (present and future) gas requirements of its own economy.
Should there be additional gas to allocate to exports, Egypt is likely to give priority to LNG with
a net benefit of US$3.80/MMBTU rather than piped gas to other Mashreq countries because of
the lower commercial return on piped gas exports (based on historical experience). The essence
here is that Jordan, Syria, and Lebanon54
should provide a commercial incentive to encourage
Egypt to supply the Mashreq market via the AGP prior to any additional allocation to LNG.. The
benchmark benefit of gas in countries receiving (importing) Egyptian gas is calculated based on
the long-run average incremental cost of a 500 MW oil plant in each country with the price of oil
based on World Bank forecasts of international oil prices. The avoided cost figures are reduced
to account for the cost of transmission to deliver the power from Egypt to the importing country.
In summary, while the relevant price levels are subject to research and negotiation, the emerging
gas price is likely to be much than the underlying price of previous contracts among Egypt,
Jordan, and Syria. Higher gas prices would provide a strong commercial incentive for gas
exploration and the development of Egypt’s large estimated yet-to-be-found reserves.
While Egypt has potential to expand its gas exports, any significant gas increase is likely to come
from Iraq. Therefore, a gas price that would encourage development and export of Iraq’s gas
supply also should be assessed. Unfortunately, there is little reliable cost data for gas production
in Iraq. Nevertheless, it is clear that gas development and transportation would be undertaken
through private sector investment and management. Thus, access to gas exports from Iraq is
likely to be on commercial terms. Since the Iraqi gas can be sold directly to Turkey, the price at
the Turkish network represents a benchmark for Iraqi gas sales to Jordan and Syria
12.3. Pricing Electricity Exports
In a competitive electricity market such as that of the EU, market participants, including
generators, customers, and traders/suppliers, are allowed to freely negotiate contracts whose
supply terms, conditions, and prices are determined by the parties to the contract. Open and equal
access to the transmission and distribution networks is ensured through commercial/market
codes, grid codes, and metering codes. Opening up the electricity market to numerous buyers and
sellers able to trade domestically and internationally creates competition, with its attendant
incentives to improve efficiency. Furthermore, regulation is reduced and market liquidity (that is,
transactions) is increased, as is price transparency. None of this now exists in Mashreq. Not
surprisingly, the number of international transactions countries is minimal; subsidization and
cross-subsidization in the tariff regime are significant; and price transparency is limited. In
addition, the efficiency of the electricity sectors is suboptimal.
Although open access and competition do not exist in the Mashreq countries, there are some
signs of movement in that direction. Furthermore, bordering on the Mashreq region, Turkey has
54
Currently, the West Bank & Gaza does not have the pipeline infrastructure to enable gas imports.
175
taken significant strides in this direction. Turkey has unbundled its power sector into generation,
transmission, and distribution functions. The Turkish Electricity Transmission Company
(TEIAS) provides transmission and dispatch services, operates the balancing market, and act as
the settlement agency. Turkey has also established the Electricity Market Regulatory Authority
(EMRA) to act as the independent regulator over power, gas, petroleum, and LPG. In all, Turkey
has 129 licensed market participants consisting of 103 private entities and more than 20 regional
distribution companies.
Prices in Turkey’s electricity market are allowed to move freely in step with the market and
changing primary fuel prices. For example, the balancing market, which is used to settle
differences between contracted amounts and actual deliveries and off-takes, reflects the marginal
cost of electricity at the wholesale level. The average price at which power was sold in the
balancing market in 2007 was approximately 11 US cents/kWh. By March 2008, the average
price had risen approximately 25 percent to 13.7 US cents/kWh, reflecting the increasingly tight
supply position.55
From May 2007 to May 2008, prices were in the range of 4–7 US cents/kWh
during the off-peak load period (1AM–7AM), and 11–14 cents/kWh during the remainder of the
day, reflecting both high gas prices and the relative tight supply position.56
The average base
load price from August 2006 to April 2009 was Euro 73.88/MWh (approximately 10.8 US
cents/kWh at an exchange rate of 1 US$= 0.6822 Euros). These wholesale prices are well above
the average Mashreq retail tariff of 6.0 US cents/kWh.57
By any standard, competitive market conditions do not yet exist in the Mashreq countries.
Consequently, cross-border electricity transactions have been limited, generally falling under two
categories: short-term power exchanges and longer term power trades. Short-term power
exchanges usually occur when there are surpluses and deficits owing to daily or seasonal load
variation or significant equipment outages, and diversity in the marginal cost of supply among
participating countries. These exchanges normally are small in volume. On the other hand,
longer term power trades refer to significant volumes of energy transferred from one to another
country on a regular and more sustained basis. The framework discussed here takes account of
the short-term and long-term nature of electricity transactions. The economics of such
transactions are summarized in table 12.4.
Short-term exchanges often are based on idle capacity and are feasible so long as the price covers
variable costs including fuel and O&M. For example, there may be an economic basis for short-
term exchanges of electricity between Egypt and Syria because their peak demand occurs at
different times of the day. However, the exchange will be feasible only if there is a difference in
marginal operating costs among the countries. The costs will not vary if both countries have oil-
based generation with high production costs on the margin. The benefits of such exchanges must
exceed the transaction costs, which are quite high in the Mashreq region owing to the limited
number of market participants with access to the transmission systems. The lack of transparency
55
World Bank, Implementation Completion Report on Turkish National Transmission Grid Project, June 2008. 56
Electricity Export Opportunities from Georgia and Azerbaijan to Turkey. A Report Prepared by A.S. Poyry,
Norway, for the Government of Georgia. www.minenergy.gov.ge 57
Retail prices should be greater than wholesale prices owing to higher equipment costs and losses associated with
distribution facilities.

176
and defined rules governing transmission costs also increases transaction costs and has a
dampening effect on the number of transactions.
Longer-term trades generally occur when a country has a comparative advantage over another
country, or has excess generating capacity forecast for an extended period of time. Currently, the
more likely scenario is for Egypt to export electricity to other Mashreq countries and Turkey.
Egypt has committed to an aggressive generation expansion program while the other Mashreq
countries and Turkey have shortages. Furthermore, as discussed, Turkey is subject to
significantly higher wholesale electricity prices at present and for the foreseeable future.
Indicative calculations of the cost of electricity generated in Egypt for short-term power
exchanges during the peak period when it has an oil plant on the margin would be 10.0 US
cents/kWh (based on World Bank forecasts of international oil prices) (table 10.9). This scenario
is representative of the case today when Egypt’s demand and supply are in balance. However,
indicative calculations of the cost of electricity generated in Egypt for short-term power
exchanges when it has a gas plant on the margin would be much lower at 4.1–6.1 US cents/kWh
(based on an open-cycle plant fired with natural gas at prices ranging from US$4 to 6/MMBTU).
There is much greater latitude for short-term power exchanges if Egypt has a gas plant on the
margin.
In the future, indicative calculations of Egypt’s cost of electricity for longer-term trades range
from 3.9– 5.1 US cents/kWh. This cost assumes that Egypt would construct a new combined-
cycle power plant fired with gas at prices ranging from US$4.00 –6.00/MMBTU to support the
export. Short-term exchanges and longer-term trades of Egyptian electricity would make sense
only if the importing countries were willing to pay prices in excess of these levels plus the cost
of transmission, ranging from a low of 0.03 US cents/kWh to Jordan to a high of 0.36 US
cents/kWh for Turkey. Another implication is that Egypt may want to weigh the potential returns
from the export of electricity versus the export of gas. It appears that electricity export to a
market such as Turkey, whose wholesale prices are quite high at close to 11 US cents/kWh
average in recent years, may prove more profitable than gas exports to the same market. A
detailed simulation and analysis of Turkey’s electricity market would be necessary to confirm
this.
Note that the terms of delivery would need to be clearly stated in the export contract, particularly
with regard to the firmness, or reliability, of supply. Shorter term exchanges recover variable
costs plus a profit only, so must not hold the exporting country, in this case Egypt, responsible if
unable to make delivery. In this case, power is delivered only when available. Egypt would make
a profit on each kWh delivered, so has the incentive to continue exports except when it has a
power system emergency.
In the case of a longer-term trade similar to that discussed above, the importer is effectively
buying a “piece” of the power plant. In other words, the importer receives delivery only when the
particular combined-cycle power plant is available. For example, if Egypt agreed to sell 200 MW
of a 500 MW combined-cycle power plant to Syria at a price determined in accordance with
table 10.9, Syria would receive 200 MW as long as the combined-cycle plant is operating. The
combined-cycle plant would be expected to be operating approximately 80 percent of the time. If

177
Egypt were to guarantee delivery consistent with the reliability of its own network, Syria would
in effect be buying “system energy.” It would be worth much more than the 3.9–5.1 US
cents/kWh price shown in the table because Egypt would need to set aside an additional 30 MW
of peaking capacity to supply the export (assuming a 15 percent reserve margin on a 200 MW
export).
Table 12. 4: Expected Price for Egyptian Power (US cents/kWh in 2009 Prices)
Expected price Explanation
Short-term exchange-oil:
Fuel cost: 9.3
Variable O&M cost: 0.7
Generation cost: 10.0
Short-term exchange-gas:
Fuel cost: 3.9–5.9
Variable O&M cost: 0.2
Generation cost: 4.1–6.1
Long-term trade:
Capital cost: 1.0
Fuel cost: 2.5–3.7
O&M cost: 0.4
Generation cost: 3.9–5.1
Market price in Turkey:
Wholesale: 10.8
Transmission costs:
To Jordan: 0.03
To WBG: 0.03
To Syria: 0.21
To Lebanon: 0.26
To Turkey: 0.36
In Egypt’s present configuration, peaking and some intermediate units run
on HFO. Fuel cost is calculated as levelized value of HFO based on World
Bank forecasts of international oil prices.
Egypt may have gas-fired open-cycle generation available for sale at
certain times of the day and year. Fuel cost is calculated as levelized value
of gas at US$4–6/MMBTU.
The long-term trade is based on a large volume electricity export over an
extended period in which Egypt would invest in gas-based, combined-
cycle generation. Fuel cost is based on a natural gas price of US$4–6 per
MMBTU.
Average wholesale price in Turkey’s balancing market from August 2006–
April 2009 (73.88 Euros/MWh converted at exchange rate of US$1=
0.6822 Euros).
12.4. Institutional Constraints
Technology risks associated with the potential regional integration projects identified earlier are
relatively minor. The generation, transmission, and pipeline technologies all are well developed,
having been implemented in numerous countries around the world including the Mashreq
countries. If tariffs reflected costs, the economic risks would be relatively minor as demand is
increasing significantly in all Mashreq countries. Economic risks would be further reduced as a
result of moving to a regional market. However, while increasing demand reduces market risk by
increasing the probability of a buyer for generation and transmission services, it also elevates
risks in the Mashreq countries in that it will place increasing pressure on the financial, economic
and technical capacity of each country. Development of a regional market with regional
coordination would reduce pressures in each of these areas because it would optimize generation,
transmission, and pipeline planning and operations for a broader region as opposed to having a
much smaller, national perspective.
178
Nevertheless, development of a regional market has its own set of problems. Similarly to the
problems described above, regional problems relate to domestic tariffs and export prices. They
also relate generally to the policy, legal, and regulatory framework necessary to make a regional
market successful. A successful regional market is amenable to raising the necessary capital to
reliably meet expanding energy demand. Regardless of the type of energy integration project, a
legal, regulatory, and governance structure conducive to international trade must be in place. The
participating countries must have the political will to relinquish a portion of their energy supply
responsibilities for the greater good of the region.
There are numerous challenges to establishing competitive electricity trade among the Mashreq
countries. The challenges to energy market reform include:
Natural monopoly characteristics of electricity/gas transmission and distribution
Lack of fungibility of energy commodity. A kWh has different values in different time
periods. In other words, a kWh is worth more during peak periods of demand than during
off-peak periods of demand
State control of utilities
Difficulty in imposing change on monopolistic electric utilities.
Considerable experience has been gained in recent years in addressing these challenges in both
the European Union and elsewhere, including:
Reforming the existing structure of vertical integration
Defining the form and jurisdiction of regulation
Establishing the contractual basis for transmission capacity
Ensuring that traded markets have sufficient liquidity.
Changes to policy, legislation, and regulation normally are required to achieve truly competitive
energy markets, as described below.
Removing Exclusive Rights to Supply
This change entails removing the exclusive right of a single supplier, often a state-owned entity,
to supply all energy to the market by opening up the supply component to any entity with the
technical expertise and financial resources necessary to produce natural gas or generate
electricity. By opening up the supply component to multiple sellers, supply entities are forced to
compete with one another for sales. Competition forces them to continue to maintain their
facilities and improve efficiency. Otherwise, they will be unable to remain a going concern.
Competition results in improved supply reliability and reduced costs for consumers.
Unbundling Supply and Transmission and Introducing Third-Party Access to the
Transmission System
Fundamental to the success of a competitive energy market is open and equal access to the
transport/transmission system. To ensure open and equal access, the transmission function (that
is, operation and asset management) must be unbundled from the supply and distribution
179
functions to guard against one entity having a technical advantage over another entity. The
transmission network must be operated by an independent entity. In addition, all market
participants including suppliers and buyers must be subject to the same terms, conditions, and
prices for similar uses of the transmission system.
Establishing an Independent and Informed Regulatory Agency to Oversee the Market and
Regulate the Monopoly Transmission and Distribution Services Including Tariffs
An independent regulatory agency is an entity that is able to make decisions that are in the best
interests of the energy industry without fear of Government intervention. An informed regulatory
agency is an entity that has the background and experience necessary to make decisions that are
in the best interests of the industry, in contrast to a political appointee who lacks the necessary
background in the industry. It is paramount that the regulatory agency has full authority to
establish tariffs based on the cost to provide service. The Government is reduced to a legislative
and policy role in the energy sector. The regulatory agency makes the decisions, consistent with
the law and the Government’s documented energy policy.
As proven in market reform efforts around the world, an independent and informed regulatory
agency is fundamental to the successful operation of a competitive energy market. In fact, it is
enshrined in the European Community Directives which are a requirement of any country
wishing to join the European Union. It is not expected that a country will implement all such
steps at once, but rather reform its energy sector over a transition period to allow time to address
the various constraints peculiar to its particular energy sector. Turkey provides a good example.
It has adopted the EU model, with independent regulation, unbundling, and private investment in
generation and distribution; but it has taken many years to reach this stage. Furthermore, state
ownership remains dominant in Turkey’s power sector, and retail tariff increases are staged
through long-term wholesale transitional, or vesting, contracts that will remain beyond 2010.
While the Mashreq countries are at different stages of market development, none of the countries
meets the basic requirements for competition outlined above. None of the countries has third-
party access or independent and informed regulation. Furthermore, as discussed, all Mashreq
countries face an additional daunting challenge to address the unwillingness, and in many cases,
the inability of large segments of the population to pay prices that reflect the cost to produce and
deliver electricity.
In addition to these challenges, regional projects by their very nature are more complex than
single-country projects. The number and scope of risks and the likelihood of their occurrence
increase exponentially with the number of countries involved. Similarly, the cost of
administering and implementing multi-country projects is significantly higher due to increased
travel and communication requirements, greater complexity in getting the necessary permits
(especially for infrastructure projects), and the need in some cases to negotiate international
agreements as well as address country-specific issues. Moreover, regional projects are higher
profile and more politically sensitive than single-country projects. Considerations of national
pride and international relations become significantly more complex. Thus, not only are the risks
of failure greater, so are the costs. Therefore, the economic justification for a regional project
must be greater to counterbalance the increased cost, complexity, and risk.

180
12.5. Next Steps
Regional projects by their very nature are more complex than single country projects. The
number and scope of risks increase exponentially with the number of countries involved.
Similarly, the cost of administering and implementing multi-country projects is significantly
higher due to greater complexity in getting the necessary permits and the need to negotiate
international agreements as well as to address country-specific issues.
To move forward the preparation and implementation of gas and electricity integration in the
Mashreq region one should pursue two parallel tracks. The first track relates to the
harmonization of: (i) technical codes and standards for the national energy systems; (ii)
regulation in the national energy sectors; (iii) goals and milestones for energy sector reform
relating to, in particular, open access and consistent and fair pricing of transport; (iv) energy
pricing and taxation; and (v) identifying an independent process and procedure for resolving
disputes relating to regional energy transactions.
Most of these issues have been addressed by various initiatives including: Euro-Arab Mashreq
Gas Market Project; Euro-Mediterranean Energy Market Integration Project; Mediterranean
Working Group on Electricity and Natural Gas; Energy Efficiency in Construction; MENA
Regulatory Forum; and Regional Center for Renewable Energy and Energy Efficiency.
Substantial work is also being done by various regional forums such as:
The Arab League;
Arab Union of Electricity (AUE);
The Arab Electricity Regulators’ Forum (AERF);
The Energy Charter Treaty;
Mediterranean Ring; and
Mediterranean Solar Plan.
The second track relates to help in cross-border transactions. This is an area with significant gaps
in terms of realistic information, preparatory steps and structuring such transactions. The World
Bank and its partners can assist Mashreq countries in this particular area by:
Playing the role of convener and facilitator by bringing together the stakeholders:
governments, regional entities, private sector, financiers and donors, NGOs, etc.
Proposing specific schemes to the relevant sub-sets of stakeholders;
Supporting project implementation by providing finance from its own funds, and
mobilizing resources from other donors and the private sector, and
Coordinating project implementation, which is often the biggest challenge in regional
integration projects.
The World Bank plans to continue its support in both the above tracks. In the area of
harmonization, the Arab League and the World Bank have agreed to carry out a joint study on
the institutional and regulatory framework for electricity trade. The study will assist Arab
countries to develop and set up a harmonized legislative structure and electricity cross border
181
codes necessary for promoting electricity trade among Arab countries and with targeted
neighbouring regions including the EU market. There will be a comprehensive mechanism for
coordination and joint work among the stakeholders. A Steering Committee composed of
technical/policy representations from the member countries, the Arab League, the World Bank
and the Arab Fund for Economic and Social Development will provide strategic directions and
country input while also assessing the practical relevance of the study results. A Technical
Committee consisting of technical staff from the power utilities, or Ministries of Electricity, of
individual member countries, will also work directly with the study team to provide technical
details, and to convey the outcomes of various stages of the study to the Steering Committee, and
their own management and technical staff.
In regard to the second track, i.e., formulating transactions, the World Bank has planned an
operational activity to pursue with the participating countries the possibility of implementing
each of the projects identified in this study. These activities have varying time-frames and
degrees of uncertainty that would need to be clarified among the relevant stakeholders through a
systematic consultation process. A distinct feature of regional energy projects is the length of
preparation time. Many regional projects have taken years (or several decades) to prepare.
Projects tend to be structured and restructured a number of times owing to the long
implementation periods. It is sometimes the deficiency in the initial formulation that results in
further revisions. It is also the difficulty of working out the cross-border issues, and coordinating
solutions among the participating countries. This is an area that the World Bank and its partners
can help countries foresee and resolve cross-border issues before they paralyze the progress of
the project.