trade activity between the eu and its neighboring ... · wp2/18 search working paper trade activity...
TRANSCRIPT

WP2/18 SEARCH WORKING PAPER
Trade activity between the EU and its
neighboring countries: trends and potentialKallioras Dimitris, Pinna Anna Maria
November 2013

Trade activity between the EU and its neighboring countries: trends and potential•
Kallioras Dimitris* & Pinna Anna Maria**
* University of Thessaly, Department of Planning and Regional Development; SEED Center,
** University of Cagliari, Department of Economics; CRENoS, [email protected]
Abstract
The objective of the paper is to examine whether trade activity intensifies over time as the outcome
of signed bilateral trade agreements. Focusing on (the trade component of) the European
Neighborhood Policy, the paper conducts an in-depth study of trade activity between the EU and its
neighboring countries, attempting to offer a detailed analysis in terms of trade patterns and to
investigate whether proximity is combined with higher trade flows, within the framework of a free
trade agreement. The analysis utilizes data derived from BACI database and covers the period from
1995 to 2011. The findings of the paper indicate that there is a lot of potential for the expansion of
trade activity between the EU and its neighboring countries and accentuate the crucial determinants
in this direction.
Key-words: EU, ENP, neighboring countries, trade, trends, potential
1. Introduction
Neighboring countries provide the easiest market access for the majority of tradable goods as trade
costs are, ceteris paribus, lower over small distances (Leamer & Levinsohn 1995; Evenett & Keller
2002). Furthermore, when one country is much richer than the other, proximity trade is mutually
beneficial as the richer country, usually, offers a wide variety of goods, with superior quality, while
the poorer country, usually, offers lower prices and attractive productive locations (Venables &
Limão 2002; Ago et al. 2006). Free trade agreements (FTAs) are, strongly, based on this argument.
Overcoming national borders is meant to create larger economic spaces for exploiting economies of
scale, thereby reducing production costs. This means that trade activity among the counterparts
involved in a FTA is expected to intensify over time (Burke 1973). The objective of the paper is to
examine whether trade activity intensifies over time as the outcome of signed bilateral trade
agreements. To this end, focusing on (the trade component of) the European Neighborhood Policy
(ENP), the paper conducts an in-depth study of trade activity between the EU and its neighboring
countries, attempting to offer a detailed analysis in terms of trade patterns and to investigate
whether proximity is combined with higher trade flows, within the framework of a FTA.

The recent (i.e. years 2004, 2007 and 2013) EU enlargements brought the borders of the EU to a set
of countries in the East with historically less intensive economic relations. These countries have been
part of the (former) Soviet Union and are characterized by lower development levels and significant
institutional and structural deficiencies. At the same time, in the Southern and the Eastern rim of the
Mediterranean Sea, the EU is faced with countries that are linked to individual EU countries through
their colonial past. Both bordering areas, in the EU East and the EU South, have been gaining
significance as they “include emerging economies, energy suppliers, or, simply, a large neighboring
market, which is crucial for the EU economy” (Petrakos et al. 2013, p. 2). Thus, the EU launched, in
2004, the ENP, a unified policy framework towards its neighboring countries (Wesselink & Boschma
2012). The ENP aims at strengthening the prosperity, stability and security of the EU, creating a “ring
of friends” around the EU political borders. The ENP framework applies to a wide array of
neighboring countries (hereinafter: the ENCs); in particular, to Armenia, Azerbaijan, Belarus, Georgia,
Moldova and Ukraine (the ENP East) as well as to Algeria, Egypt, Israel, Jordan, Lebanon, Libya,
Morocco, Occupied Palestinian Territory (hereinafter: Palestine), Syria and Tunisia (the ENP South).
Even though the ENP is a distinct and separate process from the EU enlargement (Emerson 2004;
Browning & Joenniemi 2008), the ENCs operate, in practice, under conditions of “neighborhood
Europeanization” (Gawrich et al. 2010), tantamount to economic integration. This is because the
progressive compliance with the acquis communautaire (i.e. the corpus of EU laws and policies) is
considered to be a necessary condition for the ENCs in order to increase their “weight” on the EU
market (Havlik et al. 2012; Petrakos et al. 2013). From the EU perspective, according to the Treaty of
Lisbon, forced in 2009, EU policies with a bearing on relations to third countries (such as the ENCs)
should be guided by the policies related to the internal market as well as by a common set of
principles and objectives such as the consolidation and support of democracy and the preservation of
peace (Koopmann & Wilhelm 2010; Woolcock 2010). From the viewpoint of the ENCs, even in the
absence of the proper “membership anchor”, “the European perspective acts as a very strong
stimulus for - and facilitator of - economic, political and institutional development by providing not
only the incentives but also the (financial) resources to promote economic restructuring and
institutional capacity-building” (Monastiriotis et al. 2010, p. 11).
To analyze trade flows between the ENCs and the EU as well as between the ENCs and the non-EU
countries, the paper utilizes trade data, expressed in value terms, derived, mostly, from BACI1
database. The analysis covers the period from 1995 to 2011 so as to gauge the latest shifts operated
1 BACI is a detailed international trade database, which includes more than 200 countries and provides values
and quantities of trade at the 6-digit level of the first Harmonized System (HS) classification. See http://www.cepii.fr/anglaisgraph/bdd/baci.htm for details.
in trade structures in the countries of interest and world-wide and to describe the situation before
and after the signature of the various bilateral trade agreements between the EU and the ENCs.
The remainder of the paper is as follows: The next section reviews concisely the theoretical literature
dealing with the impact of international trade on economic growth. The third section presents the
main trends as regards trade activity between the EU and the ENCs. The fourth section attempts to
explain the trends provided. The last section of the paper offers the conclusions and some policy
recommendations.
2. The impact of international trade on economic growth: review of the theoretical literature
Long ago, Marshall (1890, p. 225) pointed out that “the causes which determine the economic
progress of nations belong to the study of international trade”. Indeed, there is a great body of
literature dealing with the impact of international trade on economic growth (see Hofmann 2013 for
a comprehensive review), discussing both the static and the dynamic effects of international trade.
Static effects of international trade are closely linked to traditional theories of international trade
and to the concept of comparative advantage, in particular. On the basis of the concept of absolute
advantage, first mentioned by Smith (1776), the concept of comparative advantage, formulated by
Ricardo (1817), refers to the ability of a country to produce a particular commodity at a lower
opportunity cost over another country. In order to gain from international trade, countries are
expected to export commodities for which their relative prices in an autarchy (i.e. no trade) situation
are lower than other countries. Building on the concept of comparative advantage, the Heckscher-
Ohlin-Samuelson (H-O-S) model (Heckscher 1919; Ohlin 1933; Samuelson 1948) predicts the patterns
of production and trade on the basis of the factor endowments of trading countries. In particular, the
H-O-S model supports that countries will export commodities that use their abundant and cheap
factor(s) of production in order to gain from international trade. Overall, traditional theories of
international trade indicate that gains from international trade should be greatest among countries
with the greatest differences either in terms of opportunity costs or in terms of factor endowments.
Hence, international trade should cause countries to export commodities distinctly different from the
ones they import.
The theoretical development afforded by the endogenous growth theory (Romer 1986; Lucas 1988),
primarily associating economic growth with endogenous - and not exogenous - forces, stimulated a
debate about the dynamic effects of international trade. Besides the benefits that may arise in terms
of market expansion (Myint 1958) and economies of scale (Krueger 1978), international trade might
generate positive externalities and spillover effects by transmitting and disseminating technological
progress (Grossman & Helpman 1991) and ideas (Rivera-Batiz & Romer 1991). However, this might
not be the case when trading partners are asymmetric in the sense that exhibit considerable

differences in terms of endowments and level of technology (Grossman & Helpman 1991; Deveraux
& Lapham 1994). International trade might push some economies to specialize in low value-added
sectors (i.e. sectors not associated with increasing returns to scale (IRS) activities), with an, overall,
detrimental impact on long-term economic growth (Young 1991; Rivera-Batiz & Xie 1993).
Studying both the traditional and the modern theories of international trade (see Gandolfo 2014 for
a comprehensive review), it is evident that the level and the type of specialization are essential
parameters accounting for economic growth. In an open economy, specialization is related to the
export base of an economy (Tiebout 1956). International trade allows for greater specialization -
since domestic demand for some commodities can be served by imports - allowing inherent and
acquired comparative advantages to be exploited more intensively (Weinhold & Rauch 1999). Of
course, the positive impact of specialization may be weaker in economies that are not specialized in
sectors associated with IRS (Paci & Usai 2000), such as the case for the vast majority of the ENCs.
Moreover, excessive specialization might convert possible industry-specific shocks into country-
specific shocks, with overall negative effect on growth (Kallioras & Petrakos 2010). Diversification, in
contrast, might work as a safeguard as downturn movements in some sectors would not be as
harmful to the local economy because human and other resources can be diverted to other existing
and more secure alternatives (Acemoglu & Zilibotti 1997). Therefore, trading different types of
commodities is not neutral with reference to the capability of an economy to promote (sustainable)
growth.
Moving from traditional to modern theories of international trade, the idea that developing
countries have to increase the variety of their export basket, in order to boost growth, stabilize
exports earnings and upgrade value-added, started to prevail (Conkling & McConnell 1973; Amable
2000). This is so as it is recognized that not all commodities are equal and they may have very
different effects on growth performance (Hidalgo et al. 2007). Hence, there is a growing consensus
that patterns of economic development are associated with structural change (i.e. capital deepening)
in exports and, thus, increased export diversification. In particular, the WTO (2010) pointed out that
specialization in natural resources brings potential negative effects as the latter present negative
externalities, arising from their extraction and consumption, and are subject to extreme, though not
permanent, price volatility consequences. Trade in capital goods, in contrast, has been recognized an
important role in spreading the benefits of technological advances (Eaton and Kortum 2001). In fact,
the relative weight of capital goods in total exports of low-middle income countries (such as the
ENCs) has been enormously increasing (moving from 9% to 20% over the period 1995-2008) (WTO
2010). Moving to intermediates, their increased importance in international trade provides another
indication of the multi-country nature of commodities. If the chain value is dependent on the actions
of many countries, international ties become more important.

Together, the aforementioned arguments suggest that in order to determine the nature and the
quality of trade activity between the EU and the ENCs, the analysis of trade by type of product is
extremely relevant.
3. The main facts of trade activity among the EU and its neighboring countries
3.1 The importance of neighboring countries for the EU trade activity
The ENCs don't play a key role in EU trade. In the list of the most important exports and imports EU
partners, for the year 2011, none of the ENCs are in the first ten positions (Table 1). Despite their
proximity, the ENCs don’t trade a lot with the EU. Of course, some of them occupy an important
position: in particular, Ukraine and Algeria are the most important EU exports and imports partners,
respectively; in contrast, Armenia and Georgia (for exports) and Armenia and Jordan (for imports) are
the least important ones. The gravity approach suggests that the size of trade activity is proportional
to the economic size of the partners involved and inversely proportional to their distance (Tinbergen
1962). Thus, disproportional relative size may provide an explanation for the rather low levels of
trade activity between the EU and the each of the ENCs. Of course, disproportional relative size is not
an issue for countries such as Norway and Switzerland. Thereafter, a better role for countries which
share land borders (Eastern ENCs) and seashores (Southern ENCs) with the EU would be expected. It
is quite clear that size, distance and borders play a different role with reference to the ENCs area.
Insert Table 1 around here
Yet, what would it happen if the ENCs where a single country? Adding the values of EU exports and
imports to all ENCs, makes the ENCs (as a whole) the third and the fourth, respectively, most
important EU partner. This means that the ENCs as a whole are more important EU trading partners
comparing to economies like Japan, Turkey, India and Brazil, making evident that proximity increases
its role with size. This exercise indicates that the neighboring area of the EU suffers the presence of
many borders. When taking into account each single ENC, its role in EU trade is weak and not
predominant in the global scene. Aggregating the ENCs as a single economic space, things change.
ENCs gain a key role in international trade, becoming one of the most important EU partners, both in
exports and imports.
3.2 The trade structure of neighboring countries, by origin and destination
During the last fifteen years, the ENCs have increased their trade activity with the EU countries2. In
particular, the Eastern ENCs and the new EU countries (EU12)3 have been exhibiting the highest
increases. Yet, in year 2010, the Southern ENCs and the old EU countries (EU15) have a dominant
position, in terms of both exports and imports shares, in relation to the total ENCs and EU shares,
respectively. Noteworthy is, also, the fact that while, at the beginning of the period under
consideration (year 1995), the ENCs were, mainly, importers, at the end of the period (year 2010),
the situation, as regards the EU-ENCs trade relations, is more balanced.
Adopting a wider view, leaving the European perspective, for including all world partners, growth
rate trends reveal an increasing role for BRICS economies (i.e. Brazil, Russia, India, China, South
Africa), for goods both entering to and exiting from the ENCs. Differences across the sub-regions
reflect, clearly, the heterogeneous composition of the ENCs group (Graph 1). For each single ENCs
sub-region, trade destinations (origins) are distinguished in “intra” (i.e. trade with the other ENCs
sub-regions), “rest of intra” (i.e. trade within the particular ENCs sub-region), and “world”. “World” is
further distinguished in the EU15, the EU12, the BRICS, the USA, and the “rest of the world (RoW)
countries”.
Insert Graph 1 around here
Geographic analysis proves the erosion of the EU shares in ENCs’ trade. While in year 1995, the EU15
was the most important partner for the Eastern ENCs, starting from year 2000, the BRICS started
their path to become their main export and import partner. The southern ENCs have always referred
to the EU15 countries as their main export and import partner. Starting from year 2005, the BRICS
are gaining position, particularly for imports. In the Middle East ENCs, the erosion of the EU15
position has to be coupled with the increasing role of the RoW countries; looking at imports, the
BRICS are, also, gaining shares. Concerning Israel, there is no reverse of position in the last fifteen
years: the USA and the RoW countries have reinforced their position; the EU15 is still the most
important source but (together with the USA) it is losing its role in favor of the BRICS and the RoW
countries.
2 For the needs of the study, the ENCs were classified in three sub-regions: Eastern ENCs (Armenia, Azerbaijan,
Belarus, Georgia, Moldova, and Ukraine); Southern ENCs (Algeria, Egypt, Libya, Morocco, and Tunisia); and Middle East ENCs (Jordan, Lebanon, and Syria). Israel is considered to be an outlier as it enjoys a level of economic performance significantly higher even than the corresponding level of many EU countries. Due to lack of data, Palestine is not included in the analysis. 3 These are the countries acceded (to the EU) in the years 2004 and 2007. Croatia (acceded to the EU in the
year 2013) is not included in the analysis.

3.3 The geographical trade structure of neighboring countries, by type of product
The increasing role of exchanges of intermediates is one chief characteristic of the globalization wave
over the last thirty years. In fact, the relative weight of intermediates in total exports of low-middle
income countries has been increasing (moving from 30% to 40% over the period 1995-2008) (WTO
2010). Since the type of goods exchanged is not neutral with reference to the capability that trade
has to promote stable and sustainable growth (Hidalgo et al. 2007), the analysis distinguishes trade
flows by type of product. In particular, the Broad Economic Categories (BEC)4 classification allows for
distinguishing final and intermediates goods, and within the former group, consumption, capital and
primary goods5. The geographical composition of exports and imports (Graph 2) for the ENCs’ group
provides, indeed, valuable insight. Changes in time are reported for consumption (C), capital (K), and
primary (P) final products as well as for parts and components (PD) and processed (T) intermediate
products.
Insert Graph 2 around here
In year 1995, the EU was the most important export destination for all types of products. In year
2010, however, the situation has changed substantially. The most extreme case is the Eastern ENCs
sub-region: the EU has lost its position and the BRICS have become the principal destination and
origin. The Eastern ENCs shifted to the emerging economies their exports of consumption, capital
and intermediate products, while the EU remains the main destination for their primary products
(fuel commodities, in particular). When looking at imports, shares are more balanced between the
EU15 and the BRICS. The erosion of the EU position, though slower, is still present and it embraces,
also, primary products. Similar is the case for the Middle East ENCs, where trade for all product
types, except for primary goods, has moved to the RoW countries. The EU15 still maintain a
prominent position in sourcing capital goods and parts and components. The Southern ENCs are the
ones where the EU15 still plays an important role in both exports and imports. The EU15 relative
presence has been anyhow reducing in time. The BRICS still don’t have a role. The EU15 is an
important source of demand for consumption, primary goods and parts and accessories, while it is
quite important in offering parts and accessories. In Israel, the USA hold and reinforce their position
as best partner, where the EU follows (their distance is increasing though). During the last years of
4 See http://unstats.un.org/unsd/cr/registry/regcst.asp?Cl=10 for details. The BACI database contains
information on the classification of products according to BEC. 5 Capital goods are machinery and equipment that is used for producing other goods and industrial transport
equipment, while primary goods are raw materials and resources used in the productive process.

the analysis, the BRICS start to play a role, particularly in Israeli exports. All in all, the importance of
the EU in the ENCs’ trade has witnessed strong erosion in time, mostly in favor of the BRICS
economies.
The aforementioned facts open several questions about the role of EU trade policy and the ENCs’
trade structure:
a) How EU trade policy intervenes in reducing the role of borders and distance? Trade policy has an
important role in shaping the economic space between trade partners. The EU chose to follow the
road of bilateralism (and not the one of multilateralism) in respect to its relation with the ENCs. What
does this mean for the ENCs?
b) How different are the ENCs between themselves and, notably, with respect to the EU? The use of
indicators which measure the degree of similarity of trade may explain why there is not much trade
between the ENCs and the EU. The limited role of each single ENC can be attributed to the
fragmented role of their production structure.
c) How diversified are trade structures of the ENCs with respect to sectors and destination? If the
ENCs trade different types of product in different origins/destinations, the evaluation of the nature
and the quality of their trade relationships may help to evaluate, also, the possible evolution of their
trade relation with the EU.
The answers to the aforementioned questions are going to shed light on the reasons why the ENCs
lose their role as EU trading partners. The first two explanations raise the point of the fragmentation
of the ENCs area. The third one relates to the weaknesses generated by the low level of
diversification in the goods which are exported from the neighboring area of the EU.
4. The determinants of trade activity among the EU and its neighboring countries
4.1 Is the EU trade policy keeping the neighboring countries too distant?
In its basic form, the gravity model assumes that only distance and economic size matter in bilateral
trade (Tinbergen 1962). Looking at the EU, it could be interesting to analyze how the EU trade policy
can contribute to increase/decrease the distance with its neighbors (the ENCs). The EU follows the
road of bilateralism in respect to its relation with the ENCs. The main reason for this is its objective to
deepen the substance of trade agreements, enhancing more comprehensive trade relations with its
neighbors, and, thus, bringing its neighbors gradually closer to the Single Market. Of course, the
(recent) emphasis on behalf of the EU towards bilateral agreements, rather than multilateral ones,
brings both positive and negative elements (Liargovas 2013). In particular, bilateral agreements seem
easier to conclude, can cover more areas, take note of any geopolitical considerations and offer a
strong leverage for domestic reform. In contrast, bilateral agreements create discrimination, are not
able to solve systemic issues and may complicate the trade environment.

In contrast to the rigid Copenhagen criteria that characterized the EU (eastwards) enlargement
policy, the EU started to pursue FTAs, bilaterally with targeted economies. For the EU, FTAs represent
a subway to implement Deep and Comprehensive Free Trade Agreements (DCFTAs) with its
neighboring countries (Liargovas 2013; Pinna, 2013). DCFTAs, involving tailor-made agreements and
conditions, go beyond tariff reductions to cover, more extensively, regulatory issues such as
investment protection, public procurement and competition policy. In other words, DCFTAs are,
basically, FTAs with serious one-way conditionalities related to progress required on political and
institutional issues on behalf of the ENCs. Such conditionalities represent a “carrot and stick” tactic
that considers mandatory acquis communautaire compliance as a precondition for trade negotiations
(and agreements) (Wesselink & Boschma 2012; Petrakos et al. 2013). The political upheaval in the
ENP South and the slow reforms in the ENP East (Blockmans & van Vooren 2013), provide a strong
proof that the goals of the ENP undertaking (i.e. prosperity, stability and security at the EU external
borders) have, still, a long way ahead. This mirrors to the (s)low progress of the DCFTAs, with an
impact on the trade component of the ENP.
Without getting into a discussion about the existing non-tariff barriers to trade (see Sklenkovà 2012),
the level of tariff barriers – probably, the most important condition for the success of a FTA – is
enough to provide a strong indication about the progress of the DCFTAs between the EU and the
ENCs (Dreyer 2012). Yet, in year 2010, the EU imposes relatively high (simple) average tariffs to trade
with the ENCs6, on both agricultural and manufacturing goods, especially on the former. The
reluctance of the EU to remove its tariff barriers to trade with the ENCs leads to deadlock as it raises
major hurdles for the ENCs to export, to the EU market, the products on which they mainly
specialize. This is so as the EU attempts to create “neighborhood Europeanization” conditions with
countries that, on aggregate, form an area which is sensitive in both economic (i.e. low welfare level)
and demographic (i.e. high presence of rural population) terms (Petrakos et al. 2013).7
6 See http://stat.wto.org/TariffProfile/WSDBTariffPFReporter.aspx?Language=E for details.
7 To better understand the EU-ENCs case, a parallelism with the USA-Mexico case can be made (see Hanson
1996). Mexico is for the USA its second export destination and its third import origin. The USA-Mexico case has many similarities to the EU-ENCs case. The GDP of the USA is 13 times higher than Mexican GDP; the EU GDP is 13.5 times higher than the GDP of the ENCs. The population of the USA is 2.71 times bigger than Mexican one; the EU population is about 1.78 times bigger than the population of the ENCs. The USA manufactured products enjoy duty free import benefits under the North American Free Trade Agreement (NAFTA) giving the USA businesses a quality versus cost advantage over other foreign manufacturers. In fact, as of year 2008, all tariffs and quotas were eliminated on USA exports to Mexico (and Canada) under the NAFTA. The NAFTA created the world’s largest free trade area, which, in year 2010, links 454 million people producing over $17.2 trillion worth of goods and services. The NAFTA provides coverage to services with the exception of aviation transport, maritime, and basic telecommunications. The agreement also provides intellectual property rights protection in a variety of areas including patent, trademark, and copyrighted material. Additionally, the USA investors are guaranteed equal treatment to domestic investors in Mexico (and Canada). The dismantling of trade barriers and the opening of markets has led to economic growth and rising prosperity in all three countries.

4.2 Are the neighboring countries too different in their trade structures?
Having observed the geographical orientation of the ENCs’ trade and the catalytic influence of the EU
trade policy, it is important to discuss trade asymmetries and dependencies between the EU and the
ENCs along with differences across their trade structure. For this purpose, the analysis utilizes the
UNCTAD classification (UNCTAD 1996), which classifies commodities into non-fuel primary
commodities, fuel primary commodities, labor- and resource-intensive commodities, low-skill,
medium-skill, and high-skill capital-intensive commodities. Looking at the sectoral shares of the ENCs
exports to the EU (Graph 3), it is evident that many ENCs (i.e. Algeria, Azerbaijan, Belarus, Egypt,
Georgia, Libya, and Syria) export mainly (or even, in many cases, almost exclusively) fuel primary
commodities (i.e. petroleum and natural gas). Moreover, many ENCs (i.e. Lebanon, Moldova,
Morocco, and Tunisia) export, mainly, labor-intensive and resource-based commodities. Only a few
countries export mainly low-skill capital-intensive commodities (i.e. Armenia and Ukraine) and high-
skill capital-intensive commodities (i.e. Israel and Jordan). Overall, the ENCs present an unbalanced
sectoral allocation of exports to the EU. Especially countries such as Algeria, Azerbaijan, Libya and
Syria, which export mainly fuel primary commodities, exhibit sectoral shares that surpass even the
level of 85%.8 The asymmetry that characterizes the EU-ENCs trade relations has its explanation on
the revealed comparative advantage (RCA)9 of the ENCs against the EU. Indeed, all ENCs exhibit a
RCA, against the EU, in non-fuel primary commodities and/or in fuel primary commodities (Petrakos
et al. 2013). The sector of fuel primary commodities, in particular, is a key-sector for the EU-ENCs
trade relations, given that the EU is a major energy importer (Ratner et al. 2013).
Insert Graph 3 around here
It is evident that the ENCs have developed an inter-industry type of trade relations with the EU.10 The
persistency of the inter-industry type of trade relations between the EU and the ENCs has its
explanation on the diachronic evolution of the sectoral shares of the corresponding trade activity.
Indeed (Graph 4), the sectoral composition of exports flows from the ENP countries to the EU
remains, more or less, unchanged (i.e. high levels of positive correlation) over time. The rather low
8 Looking at the ENCs imports, it is revealed that the ENCs, mainly, import, from the EU, medium-skill capital-
intensive commodities. Moreover, it can be observed that all ENCs mainly import, from the EU, products other than the ones that mainly export (to the EU). 9 RCA against a partner country (or the world) refers to the proportion of the country under consideration
exports’ in a specific sector divided by the proportion of a partner country (or world) exports’ in the same specific sector (Balassa 1965). 10
Inter-industry trade means that more trade occurs between sectors rather than within sectors (Grubel & Lloyd 1971).

changes in the sectoral composition of the ENCs’ exports to the EU provide strong indication that the
ENCs, in their great majority, have not (successfully) implemented export-led growth strategies
towards the diversification (expansion) of their exports bases (Havlik et al. 2012; Boschma and
Capone, 2013; Petrakos et al. 2013). Thus, the ENCs are in weak position to penetrate into the EU
markets: on the one hand they are unable (with the exceptions of Israel and Jordan) to compete with
their EU counterparts in the markets for capital-intensive products and on the other hand they face
the tariff (and non-tariff) barriers imposed on behalf of the EU on imports of labor-intensive and
resource-intensive products due to the conditionalities related to the DCFTAs. This means that
especially the ENCs that do not exhibit RCA in the sector of fuel primary commodities are “urged” to
find new markets to export their products.
Insert Graph 4 around here
4.3 How diversified are the neighboring countries’ trade structures?
Slight trade between the ENCs and the EU could also be explained by the level of diversification in
ENCs trade structures. Export diversification is variously defined as the change in the composition of
a country’s existing export product mix or export destination (Ali et al. 1991), or as the spread of
production over many sectors (Berthelemy and Chauvin 2000). There are well known (political and
economic) risks (Collier 2003) in concentrating exports in a few primary commodities; it exposes a
country to the negative effects of unfavorable characteristics of world demand and to the negative
supply-side features of these primary products. Evaluating (Table 2) the level of sectorial
concentration/diversification, using the Herfindahl Index11, it becomes evident that, in terms of
exports, the vast majority of the ENCs exhibit, in year 2010, higher levels of concentration either in
the EU market or in the BRICS market, comparing to the world market. The same stands for imports,
even though the differences are, in general, smaller. Overall, imports are more diversified than
exports in all markets under consideration.
Insert Table 2 around here
The point that can be made here is quite intuitive: if a country concentrates its flows in few
destinations and, on top of this, only some sectors are considered, the vulnerability of the whole
trading system increases. Providing a brief analysis of the best export and import partner for each
11 Herfindahl Index is a measure of concentration/diversification and is calculated, in particular, by squaring the
share of each sector in the total trade activity, and then summing the resulting numbers (Hirschman 1964). It takes values in interval [0, 1]. Values close to 0 indicate high levels of diversification.

ENC, looking at both the world and the EU market, may deepen the aforementioned point (see also,
Pinna 2013). In particular, looking at exports (Table 3), a good number of ENCs, especially the
Southern ones (i.e. Algeria, Egypt, Libya, and Syria), mainly export in their main destination fuel
primary commodities. The respective share matters for about 80%. The eastern ENCs mainly export
machinery or agricultural products. Middle East ENCs and Israel have no predominant sector; it
depends on the destination. In general, at the world level, even when the first destination does not
have a big share, in seven out of fifteen ENCs, the first exporting sector accounts for more than 50%
of total exports in the country. When concentrating in the EU market, in eight out of fifteen ENCs,
the best exporting industry accounts for more than 80% of total exports. Apparently, when such a
sectorial concentration is recorded in the destination where exports are higher, the presence of
export differentiation in other destinations has a smaller weight. Moving to imports (Table 4),
machinery and textile products predominate. The corresponding percentages are not so high,
comparing to exports, verifying that imports are more diversified than exports.
Insert Tables 3 and 4 around here
5. Conclusions and policy recommendations
The gradual dismantling of economic borders between the EU and the ENCs allows for the expansion
of the EU-ENCs trade activity. Yet, despite the fact that the EU-ENCs trade activity is growing over
time, there are a couple of findings that generate concerns about its progress. The first finding is that
the vast majority of the ENCs don’t play a key role in EU trade, despite their proximity. The role of
ENCs in EU trade is weak, and not predominant in the global scene. However, aggregating the ENCs
as a single economic space, things change. ENCs gain a key role in international trade, becoming one
of the most important EU partners, in both exports and imports terms. Such an exercise indicates
that the neighboring area of the EU suffers the presence of many (economic) borders. The second
finding is that the EU loses, over time, its relative position in the ENCs’ trade activity. In contrast, the
corresponding shares of the BRICS, especially, and the RoW countries are getting increased. Such a
trend must be alarming for the EU since the BRICS may, also, increase their political influence in the
ENCs’ area.
The trends that characterize trade activity between the EU and the ENCs may attribute to the EU
trade policy and to the ENCs’ trade structures. The DCFTAs among the EU and the ENCs do not seem
to provide a solid stimulus in the process of “neighborhood Europeanization”. In particular, the
reluctance on behalf of the EU to remove its tariff barriers, especially the ones imposed on
agricultural products, does not favor trade creation conditions, raising major hurdles for the ENCs to
export, to the EU market, the products on which they, mainly, specialize. The EU might examine the
possibility that mandatory acquis communautaire compliance related to political requirements
should not be a precondition for the progress of the FTAs with the ENCs. Of course, besides the EU
external trade policy, the ENCs trade structures have, also, an impact on the EU-ENCs trade activity.
By and large, the ENCs, presenting high degree of geographical and sectorial concentration,
especially in exports, are locked-in an inter-industry type of trade integration with their more
advanced EU counterparts. This type of trade relations is, mostly, the outcome of the inability of the
ENCs to diversify and expand their export bases, implementing export-led growth strategies. Even
though, for the moment, it provides the only feasible route for the conduct of trade activity with the
EU, it is doubtful whether such type of trade integration can narrow the welfare gap between the
ENCs and the EU.
The in-depth study of the EU-ENCs trade activity reveals that, in relative terms, the latter is not
intensified over time, within the ENP framework. The trends recorded cast doubts on the
mainstream win-win models of trade and provide support to alternative theories relating trade
outcomes on structural and development gaps, initial conditions, market size, scale effects and
geographical coordinates. There is a lot of potential, however, for the increase of the EU-ENCs trade
activity. Yet, there is one condition: EU policy-makers need to abandon the idea that the ENCs can be
integrated to the EU economic space without altering the basic model of integration and without
incurring any costs for anyone.
References
ACEMOGLU, D. & F. ZILLIBOTI (1997), Was Prometheus unbound by chance? Risk, diversification and
growth. Journal of Political Economy 105, pp. 709-751.
AGO, T., I. ISONO & T. TABUCHI (2006), Locational disadvantage of the hub. Annals of Regional
Science 40, pp. 819-848.
ALI, R., J. ALWANG & P. B. SIEGEL (1991), Is export diversification the best way to achieve export
growth and stability? A look at three African Countries. World Bank Working Papers 729.
AMABLE, B. (2000), International specialisation and growth. Structural Change and Economic
Dynamics 11, pp. 413-431.
BACI DATABASE, http://www.cepii.fr/anglaisgraph/bdd/baci.htm, (retrieved in February, 2012).
BALASSA, B. (1965), Trade liberalization and revealed comparative advantage. The Manchester
School 33(2), pp. 99-123.
BERTHELEM, J.-C. & S. CHAUVIN (2000), Structural changes in Asia and growth prospects after the
crisis, CEPII Working Papers, 00-09.

BLOCKMANS, S. & B. VAN VOOREN (2013), Editorial. CEPS European Neighborhood Watch: Thinking
ahead for Europe 90.
BOSCHMA, R. & G. CAPONE (2013), Mind your step: The heterogeneous effect of relatedness on the
diversification process in EU and ENP countries. SEARCH Working Paper 2/09.
BROWNING, C. S. & P. JOENNIEMI (2008), Geostrategies of the European Neighborhood Policy.
European Journal of International Relations 14(3), pp. 519-551.
BURKE, J. D. (1973), The effects of economic integration on the geographic concentration of trade: A
case study. Tijdschrift voor Economische en Sociale Geografie 64(4), pp. 258-269.
COLLIER, P. (2003), Primary commodity dependence and Africa’s future. In: B. Pleskovic and N. Stern,
eds., Annual Proceedings of the World Bank Conference on Development Economics. pp. 139-
162. New York: World Bank and Oxford University Press.
CONKLING, E. C. & J. E. McCONNELL (1973), A co-operative approach to problems of trade and
development: The Central American experience. Tijdschrift voor Economische en Sociale
Geografie 64(6), pp. 363-377.
DEVEREUX, M. B. & B. J. LAPHAM (1994), The stability of economic integration and endogenous
growth. Quarterly Journal of Economics 109(1), pp. 299-305.
DREYER, I. (2012), Trade policy in the EU’s neighborhood: Ways forward for the Deep and
Comprehensive Free Trade Agreements. Notre Europe Study & Research 90.
EATON, J. & S. KORTUM (2001), Trade in capital goods. European Economic Review 45(1), pp. 1195-
1235.
EMERSON, M. (2004), European Neighborhood Policy: Strategy of placebo? CEPS Working Document
215.
EUROSTAT, COMEXT statistical regime 4,
http://trade.ec.europa.eu/doclib/docs/2006/september/tradoc_122530.xls (retrieved in
February 2013).
EVENETT, S. J. & W. KELLER (2002), On theories explaining the success of the gravity equation.
Journal of Political Economy 110, pp. 281-316.
GANDOLFO, G. (2014), International trade theory and policy. Berlin: Springer.
GAWRICH, A., I. MELNYKOVSKA & R. SCHWEICKERT (2010), Neighborhood Europeanization through
ENP: The case of Ukraine. Journal of Common Market Studies 48(5), pp. 1209-1235.
GROSSMAN, G. & E. HELPMAN (1991), Trade, knowledge spillovers and growth. European Economic
Review 35(2), pp. 517-526.
GRUBEL, H. G. & P. J. LLOYD (1971), The empirical measurement of intra-industry trade. Economic
Record 47(4), pp. 494-517.

HANSON, G. H. (1996), Integration and the location of activities: Economic integration, intraindustry
trade, and frontier regions. European Economic Review 40, pp. 941-949.
HAVLIK, P., V. ASTROV, M. HOLZNER, G. HUNYA, I. MARA, S. RICHTER, R. STÖLLINGER & H. VIDOVIC
(2012), European Neighborhood – Challenges and opportunities for EU competitiveness.
WIIW Research Reports 382.
HECKSCHER, E. (1919), The effects of foreign trade on the distribution of income. Ekonomisk Tidskrift
21, pp. 497-512.
HIDALGO, C. A., B. KLINGER, A. L. BARÀBASI & R. HAUSMANN (2007), The product space conditions
the development of nations. Science 317, pp. 482-487.
HIRSCHMAN, A. O. (1964), The paternity of an index. American Economic Review 54(5), p. 761.
HOFMANN, P. (2013), The impact of trade on technological change and long-run growth. In: P.
HOFMANN, ed., The impact of international trade and FDI on economic growth and
technological change. pp. 29-100. Berlin: Springer Verlag.
KALLIORAS, D. & G. PETRAKOS (2010), Growth, integration and structural change in the regions of the
EU new member-states. Annals of Regional Science 45(3), pp. 667-680.
KOOPMANN, G. & M. WILHELM (2010), EU trade policy in the age of bilateralism. Intereconomics
45(5), pp. 305-312.
KRUEGER, A. O. (1978), Foreign trade regimes and economic development: Liberalization attempts
and consequences. Cambridge Mass.: Ballinger for the NBER.
LEAMER, E. E. & J. LEVINSOHN (1995), International trade theory: The evidence. NBER Working Paper
4940.
LIARGOVAS, P. (2013), EU trade policies towards neighboring countries. SEARCH Working Paper 2/01.
LUCAS, R. E. (1988), On the mechanics of economic development. Journal of Monetary Economics 22,
pp. 3-42.
MARSHALL, A. (1890), Principles of economics. London: Macmillan.
MONASTIRIOTIS, V., G. PETRAKOS, D. KALLIORAS, B. DJURDJEV, D. ARSENOVIC & V. DRAGISEVIC
(2010), Serbia’s integration with the EU: Analysis of the impact on Vojvodina. Report
submitted to the Vojvodina Centre for Strategic Economic Studies (Vojvodina-CESS).
MYINT, H. (1958), The classical theory of international trade and the underdeveloped countries.
Economic Journal 68(270), pp. 317-337.
OHLIN, B. (1933), Interregional and international trade. Cambridge Mass.: Harvard University Press.
PACI, R. and S. USAI (2000), Technological enclaves and industrial districts: An analysis of the regional
distribution of innovative activity in Europe. Regional Studies 34(2), pp. 97-114.

PETRAKOS, G., D. KALLIORAS & P. ARTELARIS (2013), The geography of trade relations between the
EU and the ENP countries: Emerging patterns and policy recommendations. SEARCH Working
Paper 2/07.
PINNA, A. M. (2013), Is the EU the best trade partner for its neighbors? SEARCH Working Paper 2/02.
RATNER, M., P. BELKIN, J. NICHOL & S. WOEHREL (2013), Europe’s Energy Security: Options and
Challenges to Natural Gas Supply Diversification. CRS Report for Congress.
RICARDO, D. (1817), On the principles of political economy and taxation. London: John Murray.
RIVERA-BATIZ, L. A. & P. M. ROMER (1991), Economic integration and endogenous growth. Quarterly
Journal of Economics 106, pp. 531-556.
RIVERA-BATIZ, L. A. & D. XIE (1993), Integration among unequals. Regional Science and Urban
Economics 23, pp. 337-354.
ROMER, P. M. (1986), Increasing returns and long-run growth. Journal of Political Economy 94(5), pp.
1002-1038.
SAMUELSON, P. A. (1948), International trade and the equalization of factor prices. Economic Journal
58, pp. 163-184.
SKLENKOVÀ, V. (2012), Integration potential of the European Neighborhood Policy. Slovak Journal of
Political Sciences 12(1), pp. 21-41.
SMITH, A. (1776), An inquiry into the nature and causes of the wealth of nations. London: Strahan
and Cadell.
TIEBOUT, C. M. (1956), Exports and regional economic growth. Journal of Political Economy 64, pp.
160-164.
TINBERGEN, J. (1962), Shaping the world economy. New York: The Twentieth Century Fund.
UNCTAD (1996), Trade and development report 1996. New York and Geneva: UN.
VENABLES, A. J. and N. LIMÃO (2002), Geographical disadvantage: a Heckscher-Ohlin-von Thünen
model of international specialization. Journal of International Economics 58, pp. 239-263.
WEINHOLD, D. & J. E. RAUCH (1999), Openness, specialization and productivity growth in less
developed countries. Canadian Journal of Economics 32, pp. 1009-1027.
WESSELINK, E. & R. BOSCHMA (2012), Overview of the European Neighborhood Policy: Its history,
structure and implemented policy measures. SEARCH Working Paper 1/04.
WOOLCOCK, S. (2010), EU trade and investment policymaking after the Lisbon Treaty. Intereconomics
45(1), pp. 22-25.
WORLD BANK, BEC Classification http://unstats.un.org/unsd/cr/registry/regcst.asp?Cl=10 (retrieved
in February 2013).
WTO, http://stat.wto.org/TariffProfile/WSDBTariffPFReporter.aspx?Language=E (retrieved in
February 2013).

WTO (2010), World Trade Report 2010. Geneva: WTO.
YOUNG, A. (1991), Learning by doing and the dynamics effects of international trade. Quarterly
Journal of Economics 106(2), pp. 369-405.
APPENDIX
Table 1: Major EU export and import partners, year 2011
EU exports to
EU imports from
(year 2011) (year 2011)
rank partner volume
rank partner volume
(million €)
(million €)
1 U.S. 260,553 1 China 292,130
2 China 136,222 2 Russia 198,343
3 Switzerland 121,671 3 U.S. 184,246
4 Russia 108,434 4 Norway 93,450
5 Turkey 72,671 5 Switzerland 91,205
6 Japan 48,968 6 Japan 67,452
7 Norway 46,529 7 Turkey 47,593
8 India 40,425 8 India 39,315
9 Brazil 35,729 9 Brazil 37,776
10 UAE 32,615 10 South Korea 36,101
19 Ukraine 21,196 12 Algeria 27,678
21 Algeria 17,205 24 Ukraine 14,987
22 Israel 16,836 25 Azerbaijan 14,842
24 Morocco 15,168 29 Israel 12,645
25 Egypt 13,944 33 Libya 10,437
31 Tunisia 10,931 35 Tunisia 9,874
38 Belarus 7,218 36 Egypt 9,511
43 Lebanon 5,267 39 Morocco 8,689
55 Jordan 3,258 51 Belarus 4,220
57 Syria 3,020 57 Syria 3,071
60 Azerbaijan 2,862 81 Moldova 842
65 Libya 2,066 88 Georgia 614
67 Moldova 1,858 100 Lebanon 411
72 Georgia 1,588 109 Armenia 319
107 Armenia 641 111 Jordan 313
3 ENCs as a whole 123,059 4 ENC's as a whole 118,454
10 Eastern ENCs 35,364 11 Eastern ENCs 35,825
5 Southern & Middle East ENCs (without Israel)
70,859 6 Southern & Middle East ENCs (without Israel)
69,984
5 Southern & Middle East ENCs (with Israel)
87,695 6 Southern & Middle East ENCs (with Israel)
82,629
Sources: EUROSTAT (COMEXT, statistical regime 4) / Authors’ elaboration

Table 2: Sectorial diversification (Herfindahl Index) in terms of exports and imports, years 1995 and
2010
Exports Imports
1995 1995
world market EU market BRICS market world market EU market BRICS market
Algeria 0.47 0.57 0.26 0.07 0.07 0.08
Armenia 0.19 0.28 0.77 0.17 0.12 0.24
Azerbaijan 0.19 0.21 0.84 0.14 0.13 0.25
Belarus 0.13 0.13 0.12 0.05 0.05 0.12
Egypt 0.14 0.18 0.35 0.06 0.07 0.06
Georgia 0.34 0.14 0.19 0.17 0.17 0.26
Israel 0.10 0.06 0.09 0.06 0.06 0.08
Jordan 0.13 0.12 0.47 0.04 0.06 0.08
Lebanon 0.06 0.05 0.15 0.03 0.04 0.08
Libya 0.63 0.68 0.72 0.06 0.07 0.22
Moldova 0.13 0.16 0.23 0.05 0.05 0.17
Morocco 0.11 0.14 0.67 0.04 0.06 0.08
Syria 0.42 0.55 0.57 0.07 0.09 0.07
Tunisia 0.18 0.24 0.90 0.05 0.07 0.07
Ukraine 0.10 0.07 0.49 0.04 0.04 0.09
2010 2010
world market EU market BRICS market world market EU market BRICS market
Algeria 0.56 0.65 0.46 0.07 0.07 0.08
Armenia 0.12 0.22 0.21 0.03 0.06 0.06
Azerbaijan 0.80 0.95 0.35 0.05 0.09 0.05
Belarus 0.11 0.40 0.09 0.10 0.10 0.23
Egypt 0.07 0.12 0.17 0.05 0.07 0.05
Georgia 0.08 0.14 0.12 0.05 0.09 0.06
Israel 0.09 0.06 0.12 0.04 0.06 0.05
Jordan 0.08 0.11 0.54 0.04 0.08 0.05
Lebanon 0.07 0.17 0.83 0.05 0.07 0.04
Libya 0.79 0.82 0.97 0.06 0.09 0.05
Moldova 0.07 0.09 0.09 0.04 0.05 0.09
Morocco 0.09 0.11 0.33 0.04 0.05 0.06
Syria 0.27 0.76 0.15 0.05 0.08 0.05
Tunisia 0.09 0.12 0.36 0.05 0.06 0.08
Ukraine 0.08 0.08 0.07 0.06 0.05 0.17
Sources: BACI Database / Authors’ elaboration

Table 3: Best sector in the ENCs’ best export destination, years 1995 and 2010
World market 1995 2010
Best destination
Best sector in the best destination
Best sector share
Best destination
Best sector in the best destination
Best sector share
Algeria Italy Crude Petroleum and
Natural Gas Production 75% USA &
Puerto Rico Crude Petroleum and
Natural Gas Production 74%
Armenia Belgium & Luxemburg
Other Manufacturing Industries 79% Russia Beverage industries 55%
Azerbaijan Turkey Manufacture of textiles 27% Italy Crude Petroleum and
Natural Gas Production 99%
Belarus Germany Manufacture of industrial
chemicals 29% Russia Food manufacturing 26%
Egypt Italy Crude Petroleum and
Natural Gas Production 51% Italy Crude Petroleum and
Natural Gas Production 34%
Georgia Turkey Iron and steel basic
industries 82% Turkey Iron and steel basic
industries 50%
Israel USA &
Puerto Rico Other Manufacturing
Industries 41% USA &
Puerto Rico Other Manufacturing
Industries 37% Jordan Iraq Food manufacturing 72% Iraq Food manufacturing 17%
Lebanon Saudi Arabia
Agriculture and livestock production 34%
Switzerland &
Liechtenstein Non-ferrous metal basic
industries 74%
Libya Italy Crude Petroleum and
Natural Gas Production 81% Italy Crude Petroleum and
Natural Gas Production 87%
Moldova Russia Beverage industries 40% Russia Agriculture and livestock
production 24%
Morocco France Manufacture of wearing apparel, except footwear 39% France
Manufacture of electrical machinery apparatus… 25%
Syria Germany Crude Petroleum and
Natural Gas Production 87% Germany Crude Petroleum and
Natural Gas Production 91%
Tunisia France Manufacture of wearing apparel, except footwear 55% France
Manufacture of electrical machinery apparatus… 38%
Ukraine Turkey Iron and steel basic
industries 38% Russia Manufacture of transport
equipment 21% EU market
1995 2010
Best destination
Best sector in the best destination
Best sector share
Best destination
Best sector in the best destination
Best sector share
Algeria Italy Crude Petroleum and
Natural Gas Production 75% Italy Crude Petroleum and
Natural Gas Production 91%
Armenia Belgium & Luxemburg
Other Manufacturing Industries 79% Bulgaria Metal Ore Mining 100%
Azerbaijan Italy Agriculture and livestock
production 57% Italy Crude Petroleum and
Natural Gas Production 99%
Belarus Germany Manufacture of industrial
chemicals 29% Netherlands Petroleum refineries 98%
Egypt Italy Crude Petroleum and
Natural Gas Production 51% Italy Crude Petroleum and
Natural Gas Production 34%
Georgia Italy Iron and steel basic
industries 59% Bulgaria Metal Ore Mining 92%
Israel UK Other Mining 15% Belgium & Luxemburg Other Mining 40%
Jordan Italy Other Mining 29% Italy Non-ferrous metal basic 50%

industries
Lebanon France Manufacture of wearing apparel, except footwear 31% France
Manufacture of machinery except electrical 84%
Libya Italy Crude Petroleum and
Natural Gas Production 81% Italy Crude Petroleum and
Natural Gas Production 87%
Moldova Romania Food manufacturing 53% Romania Manufacture of electrical
machinery apparatus… 34%
Morocco France Manufacture of wearing apparel, except footwear 39% France
Manufacture of electrical machinery apparatus… 25%
Syria Germany Crude Petroleum and
Natural Gas Production 87% Germany Crude Petroleum and
Natural Gas Production 91%
Tunisia France Manufacture of wearing apparel, except footwear 55% France
Manufacture of electrical machinery apparatus… 38%
Ukraine Italy Iron and steel basic
industries 34% Italy Iron and steel basic
industries 61%
Sources: BACI Database / Authors’ elaboration
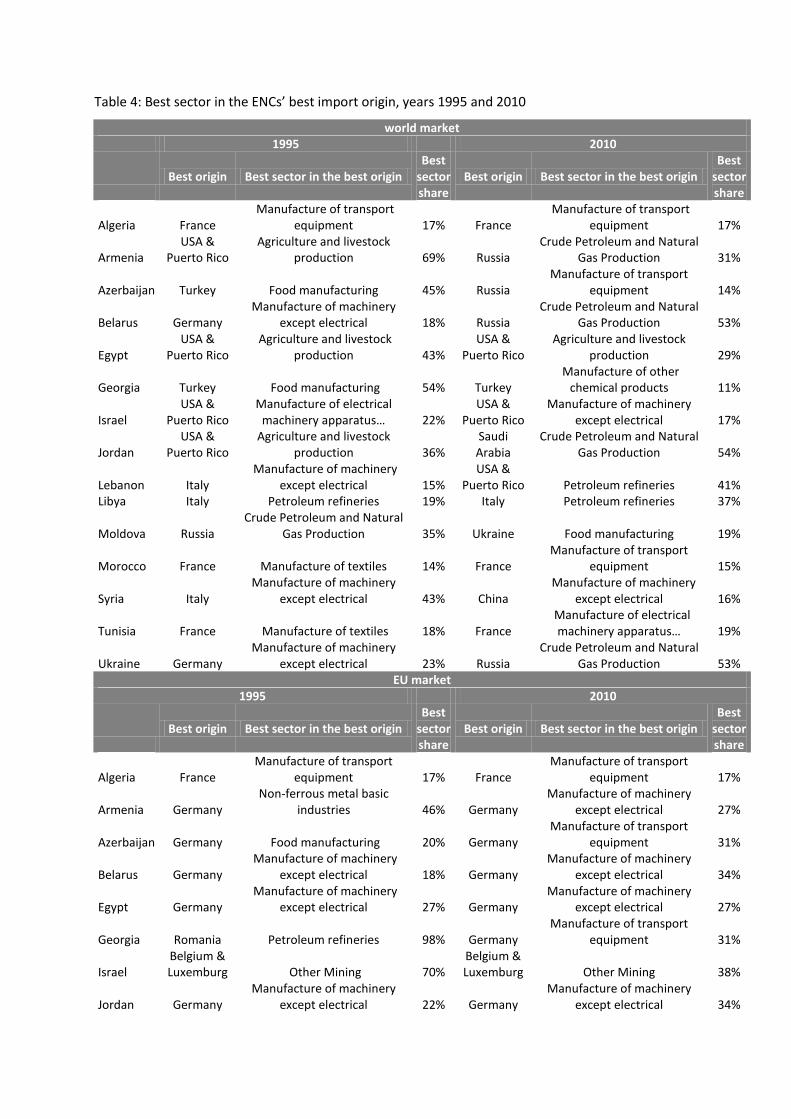
Table 4: Best sector in the ENCs’ best import origin, years 1995 and 2010
world market 1995 2010
Best origin Best sector in the best origin
Best sector share
Best origin Best sector in the best origin Best
sector share
Algeria France Manufacture of transport
equipment 17% France Manufacture of transport
equipment 17%
Armenia USA &
Puerto Rico Agriculture and livestock
production 69% Russia Crude Petroleum and Natural
Gas Production 31%
Azerbaijan Turkey Food manufacturing 45% Russia Manufacture of transport
equipment 14%
Belarus Germany Manufacture of machinery
except electrical 18% Russia Crude Petroleum and Natural
Gas Production 53%
Egypt USA &
Puerto Rico Agriculture and livestock
production 43% USA &
Puerto Rico Agriculture and livestock
production 29%
Georgia Turkey Food manufacturing 54% Turkey Manufacture of other
chemical products 11%
Israel USA &
Puerto Rico Manufacture of electrical
machinery apparatus… 22% USA &
Puerto Rico Manufacture of machinery
except electrical 17%
Jordan USA &
Puerto Rico Agriculture and livestock
production 36% Saudi Arabia
Crude Petroleum and Natural Gas Production 54%
Lebanon Italy Manufacture of machinery
except electrical 15% USA &
Puerto Rico Petroleum refineries 41% Libya Italy Petroleum refineries 19% Italy Petroleum refineries 37%
Moldova Russia Crude Petroleum and Natural
Gas Production 35% Ukraine Food manufacturing 19%
Morocco France Manufacture of textiles 14% France Manufacture of transport
equipment 15%
Syria Italy Manufacture of machinery
except electrical 43% China Manufacture of machinery
except electrical 16%
Tunisia France Manufacture of textiles 18% France Manufacture of electrical
machinery apparatus… 19%
Ukraine Germany Manufacture of machinery
except electrical 23% Russia Crude Petroleum and Natural
Gas Production 53% EU market
1995 2010
Best origin Best sector in the best origin
Best sector share
Best origin Best sector in the best origin Best
sector share
Algeria France Manufacture of transport
equipment 17% France Manufacture of transport
equipment 17%
Armenia Germany Non-ferrous metal basic
industries 46% Germany Manufacture of machinery
except electrical 27%
Azerbaijan Germany Food manufacturing 20% Germany Manufacture of transport
equipment 31%
Belarus Germany Manufacture of machinery
except electrical 18% Germany Manufacture of machinery
except electrical 34%
Egypt Germany Manufacture of machinery
except electrical 27% Germany Manufacture of machinery
except electrical 27%
Georgia Romania Petroleum refineries 98% Germany Manufacture of transport
equipment 31%
Israel Belgium & Luxemburg Other Mining 70%
Belgium & Luxemburg Other Mining 38%
Jordan Germany Manufacture of machinery
except electrical 22% Germany Manufacture of machinery
except electrical 34%

Lebanon Italy Manufacture of machinery
except electrical 15% Italy Petroleum refineries 35% Libya Italy Petroleum refineries 19% Italy Petroleum refineries 37%
Moldova Germany Manufacture of machinery
except electrical 24% Romania Petroleum refineries 43%
Morocco France Manufacture of textiles 14% France Manufacture of transport
equipment 15%
Syria Italy Manufacture of machinery
except electrical 43% Italy Petroleum refineries 47%
Tunisia France Manufacture of textiles 18% France Manufacture of electrical
machinery apparatus… 19%
Ukraine Germany Manufacture of machinery
except electrical 23% Germany Manufacture of machinery
except electrical 19%
Sources: BACI Database / Authors’ elaboration

Graph 1: ENCs sub-regions’ exports and imports composition by world destination, years 1995 and
2010
Sources: BACI Database / Authors’ elaboration
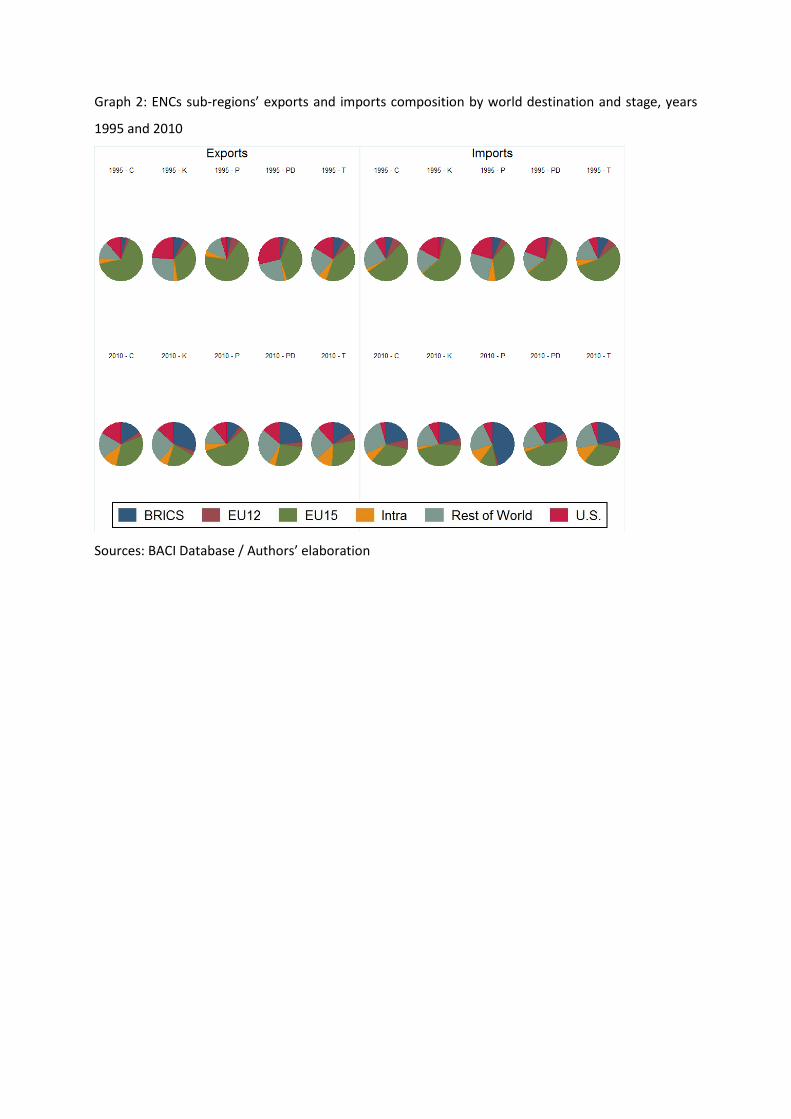
Graph 2: ENCs sub-regions’ exports and imports composition by world destination and stage, years
1995 and 2010
Sources: BACI Database / Authors’ elaboration
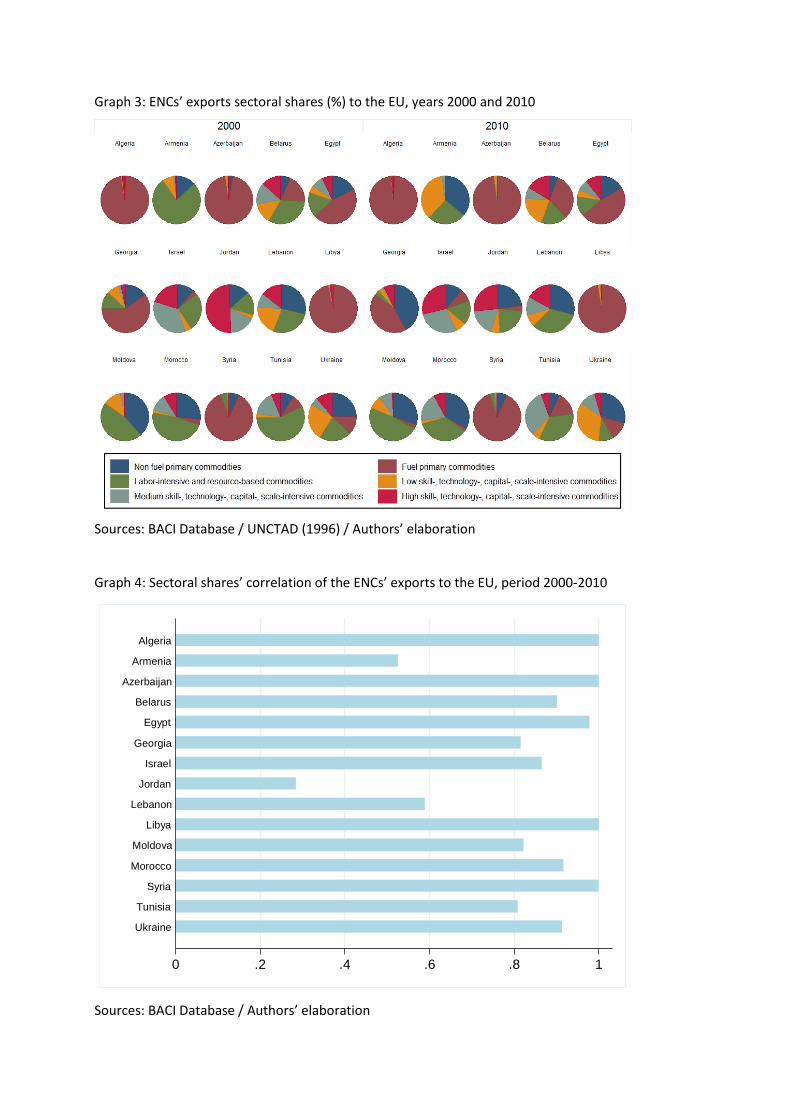
Graph 3: ENCs’ exports sectoral shares (%) to the EU, years 2000 and 2010
Sources: BACI Database / UNCTAD (1996) / Authors’ elaboration
Graph 4: Sectoral shares’ correlation of the ENCs’ exports to the EU, period 2000-2010
0 .2 .4 .6 .8 1
Ukraine
Tunisia
Syria
Morocco
Moldova
Libya
Lebanon
Jordan
Israel
Georgia
Egypt
Belarus
Azerbaijan
Armenia
Algeria
Sources: BACI Database / Authors’ elaboration
