potential energy and free energy surfaces of glycyl-phenyalanyl
TRANSCRIPT
1
Potential energy and free energy surfaces of
glycyl-phenyalanyl-alanine (GFA) tripeptide: experiment and theory
Haydee Valdes,a Vojtech Spiwok,b Jan Rezac,a David Reha,c Ali G. Abo-Riziqd,
Mattanjah S. de Vries, d Pavel Hobzaa,*
a) Institute of Organic Chemistry and Biochemistry, Academy of Sciences of the Czech
Republic and Center for Biomolecules and Complex Molecular Systems, 166 10 Prague
6, Czech Republic. FAX: +420-220 410 320
b) Department of Biochemistry and Microbiology. Institute of Chemical Technology of
Prague. Technicka 3, 166 28 Prague 6, Czech Republic.
c) IRC Polymer and Complex Fluids. School of Physics and Astronomy. University of
Leeds. Leeds. LS2 9JT. UK
d) Department of Chemistry and Biochemistry, University of California Santa Barbara,
CA 93106, USA
e-mail: [email protected]
Abstract
The free energy surface (FES) of glycyl-phenyalanyl-alanine (GFA) tripeptide
was explored with molecular dynamic simulations in combination with high level
correlated ab initio quantum chemical calculations. The molecular dynamics employed
the tight-binding DFT method, accounting for the dispersion energy, instead of the
AMBER empirical force field, which yielded inaccurate results. We classified the
minima, localized in the FESs, according to two different criteria namely: (a) the
2
backbone conformational arrangement and its resemblance to the secondary structure of
proteins (families βL, 311, γ and γ -311); and (b) the existence of a COOH···O=C
intramolecular H-bond between the hydrogen of the terminus carboxyl group and the
backbone CO of residue i+1 (families CO2Hfree and CO2Hbonded). Comparison with
experiment shows that the theoretically predicted most stable minima in the FES
correspond to the observed experimentally structures and the theoretically scaled
frequencies match reasonably well those measured spectroscopically. Remarkably,
however, we do not experimentally observe the CO2Hbonded family, although its stability
is comparable to that of the CO2Hfree structures. Motivated by this result we
reinvestigated the FES of GFA with a completely different method, metadynamics, which
includes the anharmonic effects. This is the first combination of the metadynamics
approach with the tight-binding DFT-D procedure. Metadynamics confirms the existence
and comparable stability of the two families of structures. The fact that we do not observe
structures of the CO2Hbonded experimentally was explained by their short excited state
lifetime. Additionally, we also carried out ab initio calculations using DFT theory either
in its augmented version by dispersion interaction (DFT-D) or by using the M06-2X
functional. The importance of the dispersion energy in stabilizing peptide conformers is
well reflected by our pioneer analysis using the DF-DFT-SAPT method on the nature of
the backbone/side chain interactions.
3
Introduction
The secondary structure of proteins is defined to a large extent by a network of
hydrogen bonds between the backbone amide groups (-C(O)-N-H···O=C)1 but other non-
covalent interactions play a structural role as well. Steiner and Koellner2 have stressed the
importance of the X-H···π H-bonds (X= N, O, S) in the stabilization of termini of helices,
ends and edges of strands, B-bulges and turns. These structural motifs include H-bonds
from peptide N-H groups, i.e. N-H···π H-bonds, which are known to be formed quite
frequently. 2-6 Amide-aromatic interactions have been the subject of a number of
theoretical and experimental studies, both in aqueous solution7,8 and in the gas phase.9 N-
H···π H-bonds in proteins have typically been modeled by much simpler systems such as
isolated ammonia-benzene,10,11 formamide-benzene,12-14 N-methylformamide-
benzene12,15 and N-methylacetamide12 molecular complexes. In essence, these studies
focused on the calculation of the stabilization energies of these complexes by means of
density functional theory (DFT) and/or wave-function theory (WFT) methods. These
calculations provided an estimation of the strength of the hypothetically analog
interaction in proteins. In the model systems the orientation of the amide moiety relative
to the benzene ring depends primarily on the electrostatic force and is also affected by
dispersion and electrostatic interactions (e.g. dipole(NH)-quadrupole(benzene)).
While very valuable, these prototype systems do not model the N-H···π
interactions occurring in proteins completely accurately. Geometries in the simpler
models are quite unrealistic because the interacting monomers adopt an optimal geometry
minimizing the energy of the given complex with no hint of any of the geometrical
restrictions present in proteins. First it is well known that the orientation of the peptide
bonds (modeled by the free ammonia, formamide, N-methylformamide or N-
methylacetamide) depends on the values of the φ and ψ backbone dihedral angles, as
defined in Ramachandran plots. Secondly, the nitrogen of the amide groups tends to
adopt the orientation in which it achieves its maximal hydrogen-binding capacity,
forming additional H-bonds.8,16-18 This geometrical arrangement can work against the
nitrogen´s optimal interaction with the aromatic side chain, as modeled by a free benzene
in the prototype systems but known to be mainly constrained to the gauche+ (g+), gauche-

4
(g-) or trans(a) orientations in proteins. In peptides or proteins the nature of the backbone-
aromatic side chain interaction is quite delicate. Studies performed on model systems so
far suggest that a subtle modification in the geometry of the system can result in a
significantly different forces scenario. Therefore we wish to investigate to what extent
conclusions drawn from the model systems can be extrapolated to real geometries of
isolated peptides.
To this end we have studied the glycyl-phenyalanyl-alanine (GFA) tripeptide. In
order to work with real gas-phase structures we have proceeded as follows. First, we have
scanned the potential energy surface (PES) by means of the tight-binding DFT method
covering the London dispersion energy (DF-TB-D) (see more detailed information in the
computational details and methods section) finding all the existing minima in the PES.
This is a critical step and the use of a DFT-D based procedure in the first screening of the
PES is essential. When instead of an ‘accurate’ DFT method an empirical force field is
applied, inaccurate structures result. This is mainly due to the fact that the DFT-D
procedure is free of problems with the definition of atomic charges and properly covers
the dispersion energy. Second, we recalculated the most stable conformers using both,
DFT and WFT methods. In the next step the thermodynamic characteristics were
determined on the basis of standard statistical thermodynamic calculations based on the
rigid rotor-harmonic oscillator-ideal gas (RR-HO-IG) approximation. This is another
critical step and here again a proper evaluation of the free energy surface (FES) is
essential. The harmonic approach and/or empirically based calculations are questionable
to some extent. The thermodynamic characteristics are mainly determined from low-
frequency modes and anharmonic effects are for these modes critical. For this reason, we
have also scanned the FES using metadynamics,19,20 a free energy modeling technique
effectively covering anharmonic effects, which is used here for the first time in
combination with tight-binding DFT-D. The approximate DFT-D method is thus used
systematically in evaluating the PES and FES. Next, we made a prediction which
structures should be observed experimentally, which we verified by comparing the
theoretical frequencies with experimental gas phase infrared (IR) spectra. Finally, we
studied the conformational preferences of the peptide backbone and the nature of the
backbone-aromatic side chain interaction in the GFA tripeptide. This constitutes, to our
5
knowledge, the first study of the nature of backbone-aromatic side chain interactions
performed on the basis of real gas-phase peptide structures and an ab initio quantum
chemical methodology.
At the same time, we take advantage of this system to continue with the
assessment of the performance of the DFT-D method (Density Functional Theory
augmented with an empirical dispersion term)21 in the study of isolated small peptides
which we began in earlier work for the tryptophyl-glycine (Trp-Gly) and tryptophyl-
glycyl-glycine (Trp-Gly-Gly) peptides.22 We have extended our former database of 30
different peptide conformers by another 16 structures for which we have compared the
DFT-D electronic relative energies and geometries with CCSD(T)/CBS energies and RI-
MP2/cc-pVTZ geometries, respectively. These results will be further included in an
extensive benchmark database of accurate relative energies and geometries of isolated
small peptides that we are currently preparing. Furthermore, we verified our prediction of
the most stable conformers on the DFT-D FES against the experimental results.
Additionally, we have assessed the newly developed M06-2X functional particularly
developed to cover the London dispersion energy.23 Assessing the DFT-D -or any other-
methodology or new functional is of particular relevance in the quantum chemical
calculation of the structure and properties of isolated peptides, particularly those
containing at least one aromatic side chain. A vast majority of the functionals used for the
DFT calculations fails for the study of systems where the dispersion energy is an
important component of the stabilization energy24-26 and the MP2 method (even with the
resolution of identity approximation) is already at the edge of its computational-time
applicability for a tripeptide. Thus, even when accurate, the study by means of WFT
methods becomes very tedious with the increase of the systems size. Additionally, MP2
relative energies of any peptide suffer from the intramolecular basis set superposition
error27-29 whereas this error is negligible when DFT methodologies are used.30

6
Experimental setup.
The experimental setup has been described elsewhere31. We obtained GFA from
Sigma-Aldrich and used it without further purification. In brief, we prepare samples by
applying the neat compound to the surface of a graphite substrate. To bring the molecules
into the gas phase, we employ laser desorption using a Nd:YAG laser operating at its
fundamental wavelength (1064 nm). The laser is attenuated to 1mJ/cm2 and focused to a
spot approximately 0.5 mm diameter within 2 mm in front of a pulsed nozzle. We
translate the sample in order to expose fresh sample to successive laser shots. The nozzle
consists of a pulsed valve with a nozzle diameter of 1 mm and a backing pressure of 5
atm. of argon drive gas.
To obtain a resonant two-photon ionization (R2PI) spectrum, we use a frequency
doubled dye laser and detect the photo-ions in a time-of-flight mass spectrometer. By
monitoring specific mass peaks while varying the two-photon ionization wavelength, we
obtain mass selected excitation spectra. We perform double resonance spectroscopy by
applying two successive laser pulses separated by a delay of about 200 ns. As a result of
this delay we obtain two peaks in the time-of-flight spectrum that can be monitored
individually. The first laser pulse serves as an intense “burn” laser, and is scanned over
the desired wavelength region, while the delayed laser is used as the “probe” laser, and is
fixed on one resonance. The burn laser depletes the ground state and when both lasers are
tuned to a resonance of the same conformer, this causes a decrease in the signal of the
probe laser. To obtain IR spectra for each conformer, we use IR-UV double resonance
spectroscopy by employing an IR laser as the burn laser32-34. For this purpose we use an
OPO system (LaserVision) pumped by a Nd:YAG laser. The output of the OPO system is
8 mJ/pulse and the bandwidth is 3 cm-1.
7
Computational details and methods.
1. Molecular dynamics/quenching (MD/Q) technique.
We used the MD/Q technique, described elsewhere,35 to scan the PES of the GFA
tripeptide, employing the self-consistent charge density functional tight-binding method
extended by an empirical dispersion term (SCC-DF-TB-D).36 Typically, the MD/Q
technique is confirmed with an empirical potential. In our previous paper37 we have
shown, however, that the PES determined with the AMBER potential differs substantially
from that evaluated with the SCC-DF-TB-D method. The SCC-DF-TB-D method is
based formally on DFT theory since the equations applied are derived from a second-
order expansion of the DFT total energy functional with respect to charge density
fluctuations about a given reference density. We have explicitly added an empirical
dispersion term to cover the London-type dispersion energy not otherwise included in the
parameterization of the model. We have already demonstrated the SCC-DF-TB-D
method to be efficient for the screening of the PES of isolated small peptides containing
aromatic rings. After scanning the conformational landscape, we sorted all the
conformers on the basis of the SCC-DF-TB-D energies and geometries. This procedure
reduced the initial set of energy minimized structures to a set of geometrically distinct
structures corresponding to all the existing minima in the PES.
2. Ab initio quantum-chemical calculations.
The lowest energy minima (within a relative energy of ~3.5 kcal/mol) obtained
from the MD/Q calculations were optimized at the RI38,39-MP2/cc-pVDZ40 level of
theory (see Chart 1). Next, the lowest energy conformers from this set (within a relative
energy of ~2 kcal/mol) were again recalculated at the RI-MP2/cc-pVTZ level of theory.
The MP2/cc-pVTZ calculations are known to provide rather accurate geometries of
molecular clusters and we believe that the same will be true for the peptides here
investigated. However, reliable geometries obtained at this level are due to a

8
compensation of errors; the effect of improving the basis set at the MP2 level is
compensated by the neglected higher-order correlation effects. We performed RI-
MP2/cc-pVQZ40//RI-MP2/cc-pVTZ single-point calculations on these geometries and
used the extrapolation scheme of Helgaker and co-workers41 in order to obtain complete
basis set (CBS) limit energies (MP2CBS). Additionally we added higher-order
contributions to the correlation energy beyond the second perturbation order, the MP2CBS
energies, by calculating the difference between CCSD(T) and MP2 relative energies
(CCSD(T)-MP2) determined with the 6-31G*(0.25) basis set. This correction term is
known to be essentially independent of the basis set size, contrary to the MP2 and
CCSD(T) energies themselves.42 We computed theoretical infrared (IR) spectra only for
the conformers calculated at the highest level of theory, i.e. CCSD(T)/CBS. We
employed scaled harmonic frequencies for the calculation of zero-point vibrational
energies (ZPVE), enthalpies, entropies and Gibbs energies (T = 300K) in the context of
RR-HO-IG approximation. The scaling factors43 employed were 0.958, 0.951 and 0.956
for the NHind, NHpep and OH frequencies, respectively. The latter, was also used for all
the mid-IR bands.
3. Resolution of Identity density functional theory augmented with an empirical
dispersion term (RI-DFT-D).
The idea behind this method21 is conceptually straight forward: the DFT theory is
improved by adding an empirical term describing the dispersion energy, while
maintaining practically the same CPU time requirements. Augmenting the DFT energy
by dispersion is not a new concept and it was used for the first time in our previous
paper36 in whch we combined tight-binding DFT energy with empirical London
dispersion energy. A van der Waals correction to DFT theory has also been developed by
Grimme.44-46 Essentially, in the RI-DFT-D method, the London dispersion energy is
included by a damped pair-potential which has been parameterized against
CCSD(T)/CBS results for model complexes containing important non-covalent binding
motifs. We performed all the calculations using the TPSS47 functional which gives results
comparable with those of the B3LYP48 hybrid functional but at a lower computational

9
cost. We used the Pople 6-311++G(3df,3pd)49 (abbreviated as LP in this paper) for the
geometry optimizations and frequency calculations. We have tested the performance of
this procedure for a set of 22 noncovalent complexes containing H-bonded, dispersion-
controlled and mixed complexes and the mean-averaged error (with respect to accurate
CCSD(T)/CBS values) was the lowest among various WFT and DFT techniques
including the MP2/CBS ones. All the thermodynamic properties presented here were
calculated under the assumption of the RR-HO-IG approximation. We applied scaling
factors of 0.984, 0.976 and 0.98822 for the OH, NHind and NHpep frequencies,
respectively, with a universal scaling factor of 0.984 for the remaining vibrational modes.
4. M06-2X functional. We used the M06-2X functional of Truhlar23 in combination with
6-311+G(2df,2p)49 basis sets for geometry optimizations and single-point energy
calculations, respectively. The M06-2X functional belongs to a new generation of hybrid
meta-generalized-gradient-approximation exchange–correlation functionals which
include an accurate treatment of the London dispersion energy. The method performs
very well for predicting noncovalent interactions.
5. Metadynamics
Metadynamics19,20 is a recently introduced free energy modelling technique. In
metadynamics a system is simulated by a standard molecular dynamics simulation to
which a history-depended bias potential is added. This bias potential continuously floods
free energy basins and thus enhances sampling of configurational space by disfavouring
previously explored regions. Moreover, after flooding all basins, this bias potential
approximates a free energy surface of the system. A free energy surface calculated by
metadynamics is a function of a limited number of collective variables (typically two).
Collective variables are geometric parameters that are selected to determine progress of
the studied process. The pair of collective variables used in this study were a
conformational change and intramolecular hydrogen bond formations, specifically the
10
Ramachandran φ angle of the alanine residue and the distance, d, between the hydrogen
atom of the carboxyl termini group and the oxygen atom of residue i+1 (see Chart 3).
We performed metadynamics in its direct formulation50 both at the SCC-DF-TB-
D level of theory and using an empirical force field (AMBER 99).51 For the latter, two
sets of RESP (Restricted electrostatic potential fit) charges served as partial atomic
charges. The HF/6-31G* RESP charges are the default choice for this force field but are
known to be more suitable for the condensed phase calculations and the B3LYP/cc-pVTZ
charges provide a more realistic description of isolated molecules. A more detailed
discussion about the atomic charges can be found in the results and discussion section.
AMBER runs comprised 5 million steps (5 ns). Every 500 steps (0.5 ps) we added a
Gaussian hill of 0.05 kcal/mol height and a weight definded by a dihedral angle of 0.3 rad
and a distance of 0.6 Å. The metadynamics run at SCC-DF-TB-D level comprised
600.000 steps (600 ps). In this case, every 100 steps (0.1 ps) a Gaussian hill was added.
This Gaussian hill was 0.1 kcal/mol in height from 0 to 500 ps and 0.05 kcal/mol in
height from 500 to 600 ps. Their widths were the same as for metadynamics using the
AMBER force field.
6. Symmetry-Adapted Perturbation Theory combined with DFT (DFT-SAPT).
This work represents a first analysis of the nature of the peptide backbone-
aromatic side chain intramolecular interaction by means of the symmetry-adapted
perturbation theory combined with DFT and implemented using density fitting (DF-DFT-
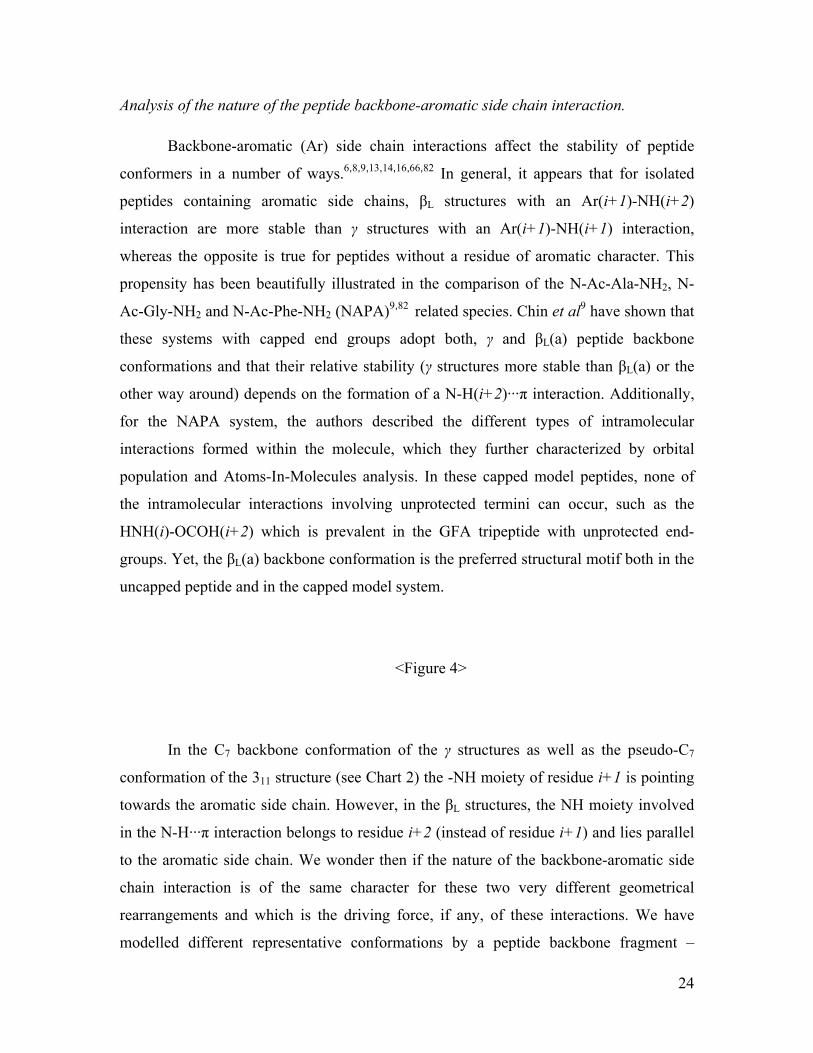
SAPT).52-57 For this purpose we modelled the isolated peptide by the complex resulting
from the splitting of the peptide into the backbone and aromatic side chain interacting
fragments (see Figure 4). We added hydrogen atoms a posteriori and for the sake of
simplicity we later reduced the peptide backbone to the fragment likely interacting with
the aromatic side chain (see Figure 4). The conformation and spatial arrangements of the
resulting complexes was identical to that obtained at the RI-MP2/cc-pVTZ level of theory
for the given isolated peptide conformer.
11
At the present time, DF-DFT-SAPT is the only methodology providing physically
meaningful information about the nature of the intermolecular interaction of molecular
systems with up to several dozens of atoms. The reason is that the SAPT intersystem58
treatment is combined with a DFT description of the subsystems allowing for the study of
large molecules. Furthermore, its implementation using the density fitting of two-electron
objects56 drastically reduces the cost of the conventional DFT-SAPT method. In DF-
DFT-SAPT, the intermolecular interaction energy is decomposed as the sum of the first
order electrostatic (Eel(1)) and exchange-repulsion (Eexch
(1)) contributions, and the second-
order induction (Eind(2)), exchange-induction (Eexch-ind
(2)), dispersion (Edisp(2)) and
exchange-dispersion (Eexch-disp(2)) contributions. Induction, exchange-induction and
charge-transfer effects of higher than second order in the intermolecular perturbation
operator are estimated from supermolecular Hartree-Fock calculations and denoted as
δ(HF).52 The computational details of the DF-DFT-SAPT calculations here performed are
analogous to those described by Jansen et al.55
Codes
We determined energies, geometries, harmonic vibrational frequencies and
thermodynamic characteristics with RI-MP2 and RI-DFT-D (in our own implementation)
methods using the TURBOMOLE 5.8 program package.59 We performed CCSD(T) and
DF-DFT-SAPT calculations with the MOLPRO 2002.1 program60 and MD/Q simulations
with the DFTB+ program. 61 Additionally, we used our own scripts for the selection of
the geometrically distinct structures. For the metadynamic calculations with the AMBER
force field we used the GROMACS package62 with a metadynamics extension50 whereas
for the SCC-DF-TB-D metadynamics run, we used our own MD code interfaced to
DFTB+ program61 performing the energy and gradient calculations. Fot the latter case we
implemented metadynamics50 in a formulation identical to the one used in GROMACS.62
The DFT calculations using the recently introduced M06-2X functional employed
QChem 3.1.23,63

12
Results and discussion
Localization of conformers coexisting in the gas phase
MD simulations using empirical force fields, e. g. AMBER, are typically used for
the study of multiconformational systems such as peptides. However, atomic charges of a
flexible molecule may vary significantly from one conformation to the other
consequently affecting the final results. Therefore, in order to assess the applicability of
the AMBER force field for the study of peptides, we have calculated the RESP atomic
charges for six geometrically distinct conformers out of the 15 most stable conformers in
the PES determined at the B3LYP/cc-pVTZ and HF/6-31G* levels of theory (see Tables
S1 and S2 in the supplementary information). The first technique (DFT) is used when
accurate charges for gas-phase simulations are to be determined while the second
technique (HF) is applied for simulations in the water environment.
Tables S1 and S2 reveal a very large dispersion of atomic charges for single
conformers. The largest dispersion concerns internal carbon and nitrogen atoms where
single conformer charges differ even more than 100% (e.g. C2 in Table S1). But charges
at vicinal hydrogen atoms differ dramatically as well. For example, charges on H1 (see
Table S1) in various structures vary by +13% and -31%. Evidently, introducing an
average charge brings some uncertainty which results in incorrect structural predictions
when an empirical potential is used. On the other hand, this finding supports the use of an
ab initio procedure for scanning the PES. Such a procedure reduces the uncertainty since
the charges are calculated for each structural arrangement.
< Chart 1>
Consequently we investigated the PES of the GFA tripeptide by means of the
strategy of calculation shown in Chart 1, namely: implementing MD/Q35 simulations
using tight-binding DFT-D theory36 followed by accurate quantum chemical calculations.
in our previous paper we used a less sophisticated strategy.37 The present procedure

13
allows us to localize all the existing minima in the PES, the most stable of which are
further recalculated at different ab initio levels of theory. The quality of this step thus
clearly affects the quality of all following steps. The number of calculated conformers
decreases with the increasing level of theory. The outcome of this sequence of
calculations is a set of conformers, which we may expect to include the ones detected
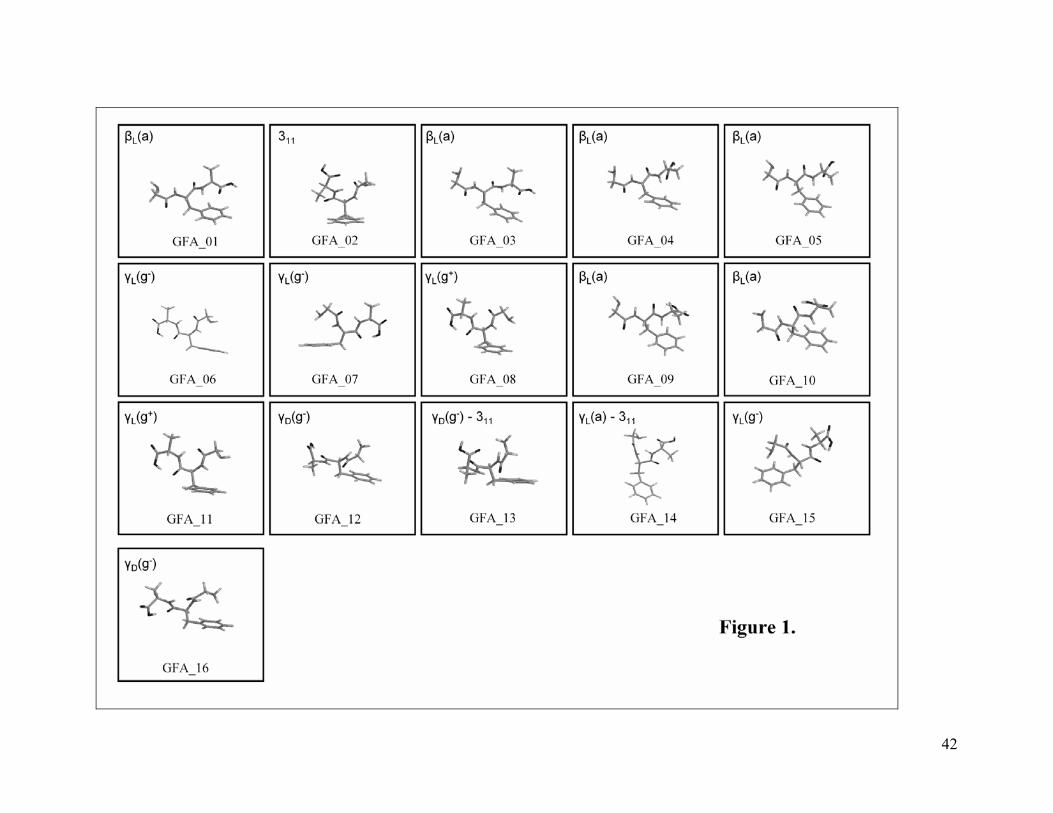
experimentally in the gas phase (see Figure 1).
<Figure 1>
Structural analysis.
Figure 1 displays all conformers within a relative energy interval less than 2
kcal/mol and ordered according to the Gibbs energy scale (T = 300K). The reasons why
the relative energy interval is based on Gibbs energy scale and not potential energy scale
are discussed at the beginning of the next paragraph. Before going into a more detailed
analysis of the structural features of the GFA conformers, we would like to point out that
the root-mean-square deviations (RMSDs) between the RI-MP2/cc-pVTZ and RI-DFT-
D/TPSS/LP geometries is only 0.11Å, meaning that both methods provide almost
identical geometries and thus reinforcing the efficacy of the RI-DFT-D method as an
adequate tool for the study of larger peptides.22
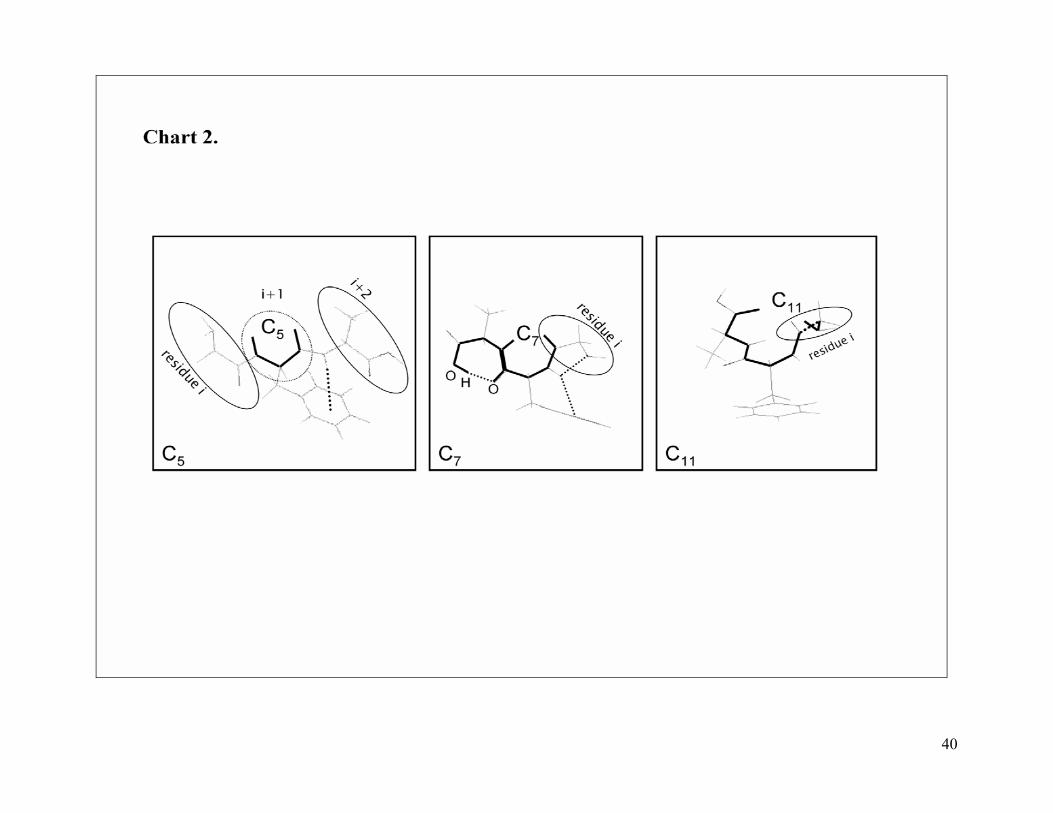
<Chart 2>
The structures shown in Figure 1 can be grouped in different families of
conformers, labelled following the Ramachandran terminology1 as βL (structures 1, 3, 4,
5, 9 and 10) and γ (structures 6, 7, 8, 11, 12, 15 and 16), since they resemble the β-strands
14
and γ-turns encountered in proteins.64 There are still two additional families, designated
as 311 (structure 2) and γ-311 (structures 13 and 14). The main structural difference among
the families concerns obviously the backbone conformations. In the β strand-like (βL)
structures the peptide backbone is fully extended favouring the C=O[i+1]···HN[i+1]
interaction (referred to as C5 conformation; see Chart 2) whereas in the γ-structures the
C=O[i]···HN[i+2] interaction is formed via a seven atom ring (referred to as C7
conformation; see Chart 2) involving, the three amino acid residues of the peptide. The γ-
311 family shows common structural features (local backbone/backbone interactions) with
both, the γ and 311 families, the latter describing a peptide backbone conformation in
which the –CO2H and –NH2 termini groups form an intramolecular H-bond
(HOC=O···HNH) involving the 3 residues via an eleven atom ring (C11 conformation in
Chart 2). The existence of this intramolecular interaction has been reported in proteins65
and has also been observed for our previously studied tripeptides Phe-Gly-Gly37 and Trp-
Gly-Gly.43
In the βL structures the aromatic side chain is systematically oriented towards the
–COOH terminus whereas in the γ structures it is systematically oriented towards the –
NH2 terminus. Notice as well that in the γ structures, the –NH2 terminus prefers the
orientation where the lone pair electrons of the nitrogen atom are pointing towards the -
NH moiety of residue i+1, which itself points towards the aromatic side chain,
consequently favouring the establishment of a network of weak intramolecular
interactions (see e.g. C7 conformation in Chart 2). In the γ family, the aromatic side chain
could never be oriented towards the –COOH terminus since the oxygen atoms of residues
i+1 and i+2, and the π cloud will strongly repel each other. There is no βL structure in
which the aromatic ring is oriented towards the –NH2 terminus. The reason for this
absence follows from the structures GFA_01 and GFA_06 in Figure 1: when the aromatic
side chain is oriented towards the –NH2 terminus, the extended peptide backbone of the
βL structure (e.g. GFA_01) folds into a γ conformation (e. g. GFA_06). It is not clear
whether the peptide backbone conformation determines the orientation of the aromatic
side chain or whether conversely the aromatic side chain induces the different folded
backbone conformations. However, the NH(i+2)-aromatic side chain interaction in

15
combination with successive C5 (see Chart 2) appears characteristic for the existence of
βL peptide backbone conformations.
There is, also, an alternative classification of the conformers based on the
existence of an (C=O)OH···O=C intramolecular H-bond between the hydrogen of the
termini carboxyl group and the backbone CO of residue (i+1) (see e.g. C7 conformation
in Chart 2). According to this classification two families of structures exist, designated as
CO2Hbonded for all the γ structures and two βL (GFA_09,10) and as CO2Hfree for the
remaining structures. Such intramolecular interaction is interesting for various reasons.
To start with, it is responsible for the folding of the backbone into a C7 conformation
suggesting the possible appearance of consecutive γ-turns if the peptide backbone would
be extended by additional residues (see Chart 2). The existence of multiple γ-turns in a
peptide backbone has been addressed in the literature.66,67 More interestingly and
analogous to the case of Phe-Gly-Gly,37 Trp-Gly43,68,69 and Trp-Gly-Gly,43,68,69 we
observed none of the predicted CO2Hbonded structures experimentally. This quite
intriguing observation motivated us to review our calculations on the free energy surface.
This normally forms the least reliable step of the theoretical procedure because usually
free energy calculations are based on the RR-HO-IG approximation which limits the level
of the entire theoretical procedure. However, in the present paper we employed the
metadynamics procedure based on tight-binding DFT-D which goes beyond the harmonic
approximation.
Stability of the conformers.
According to the H-bond pattern presented by the conformers shown in Figure 1,
one would expect that the γ structures will be followed in stability by the βL CO2Hbonded,
the γ-311, 311 and βL CO2Hfree structures since the higher number of H-bonds would be
expected to correlate with more stable structures. This hypothesis is confirmed by the
relative electronic energies obtained at the RI-DFT-D/TPSS/LP level of theory (see
column 8 in Table 1) and verified as well against CCSD(T)/CBS benchmark data (see
column 2 in Table 1), having a mean unsigned error of the RI-DFT-D with respect to

16
CCSD(T) relative energies of 1.26 kcal/mol. The absolute values of the relative energies
at these two levels of theory are somewhat different, however the trends are the same.
First and significantly, both methods predict the same global minimum structure
(GFA_15). Secondly, both predict CO2Hbonded structures to be more stable than CO2Hfree
conformers. Furthermore, the ordering of structures within the CO2Hbonded family at the
RI-DFT-D/TPSS/LP level of theory matches pretty well, except for the GFA_16
conformer, with that of the benchmark data. The CO2Hfree subfamily exhibits larger
disagreements although both methods agree in predicting the structures with a folded
backbone (e.g. GFA_02) to be more stable than those with an extended one (e.g.
GFA_01).
< Table 1>
Column 6 in Table 1 lists the single-point energies obtained at the M06-2X/6-
311+G(2df,2dp) level of theory for the RI-MP2/cc-pVTZ geometries. A first conclusion
that can be drawn from these data is that the global minimum at the DFT level of theory,
i.e. GFA_16 (see column 6, Table 1) is not the same as the global minimum predicted at
the benchmark level of theory, i. e. GFA_15 (see column 2, Table 1). The difference in
energy between GFA_16 (global DFT minimum) and GFA_15 (benchmark data
minimum) at the M06-2X/6-311+G(2df,2dp) level is 1.54 kcal/mol. There is also a
disagreement in the order of structures in the two sets. According to the benchmark data
calculations the CO2Hbonded family of structures is more stable than the CO2Hfree family.
In the case of the M06-2X functional, this order is not that well established and structures
from different families are interspersed. Furthermore, GFA_01, the least stable conformer
in the benchmark database, is in the sixth position in the ranking of energies calculated
using the M06-2X functional. The same situation occurs when looking at structures
GFA_10 and GFA_11, occupying the third and sixth position at the benchmark level,
respectively (column 2 of Table 1) and being the two least stable structures in the DFT
scale (column 6 in Table 1).

17
The level of calculations performed is very high and we can thus be confident
about the quality of the PES obtained. This means that the lowest energy structures
should co-exist and should thus be detected experimentally at very low temperatures (the
calculations correspond to 0 K). At very low temperatures the entropy term in the
expression for the Gibbs energy is small and can be neglected against the enthalpy
(energy) term. However, the spectroscopic measurements are done on a distribution of
structures established right after the peptide is laser desorbed, implying that free energy
and not enthalpy (energy) will be controlling the final relative population of these
structures. With this assumption, the final selection of conformers should be based on
Gibbs energies (T = 300K) instead of electronic energies. In other words, zero-point
vibrational energies (ZPVE), thermal corrections to the enthalpy and entropies should be
taken into account in the calculation of the relative stabilities of the conformers. The
population in the beam is not known, however one possible assumption is that the
population distribution, originated before the expansion taks place, is preserved to a large
extent during the relatively fast supersonic cooling.70 In other words, although the cooling
is a non-equilibrium process, the final conformations may still at least partly reflect the
original thermodynamic distribution. In this simplified model we can roughly estimate
the populations according to a Maxwell-Boltzman distribution.
Table 1 shows the thermodynamic functions ∆H0 and ∆G, and populations at
300K for the studied conformers. The inclusion of the ZPVE (i.e. passing from ∆E to
∆H0), reduces the energy interval, which is covered by these structures, from 2.14 and
4.08 kcal/mol to 0.62 and 0.68 kcal/mol at the CCSD(T)/CBS and RI-DFT-D/TPSS/LP
levels of theory, respectively. Furthermore, it significantly changes the order of the
structures. Unlike in the ∆E scale where the CO2Hbonded structures are the most stable
ones, in the ∆H0 scale, the CO2Hfree structures are favoured (both at the CCSD(T)/CBS
and RI-DFT-D/TPSS/LP level of theory).
Neither the inclusion of the thermal correction to the enthalpy nor the inclusion of
entropic contributions alter the order of conformers any further and thus, the CO2Hfree
structures remain as the most stable ones in the FES. Conformers with a larger number of
intramolecular H-bonds have a higher relative order within the backbone conformation,

18
and as expected, are less affected by the entropic contributions. One effect of the
inclusion of the entropic contribution is the increase of the energy differences between
conformers, now lying within an interval of approximately 3 kcal/mol at both, the
CCSD(T)/CBS and RI-DFT-D/TPSS/LP levels of theory (the mean unsigned error of the
relative Gibbs energies between the RI-DFT-D and CCSD(T) method is 0.5 kcal/mol).
We have used these Gibbs relative energies for the calculation of the relative population
of structures according to a Maxwell-Boltzmann distribution at T=300K which are listed
in Table 1. In essence five conformers (GFA_01, 02, 03, 04 and 05) are entropically
favored (i.e. have lower relative Gibbs energies) over the others. Namely, four βL and the
311 structures or according to our second structural classification, five out of the seven
CO2Hfree structures.
Free energy surface analysis by metadynamics.
Gibbs energies and populations obtained from ab initio quantum chemical
calculations assuming a RR-HO-IG approximation are only accurate to some extent.
Indeed, a population analysis based on MD is more robust, because it samples the whole
conformational space and goes beyond the harmonic approximation. However, the SCC-
DF-TB-D trajectories ran in this work are too short to provide reliable thermodynamic
data and as discussed above the use of empirical force fields is not recommendable for
the study of isolated small peptides.
In order to overcome these limitations and to make sure that the conformational
landscape obtained by the combination of MD/Q simulations with high-level correlated
ab initio quantum chemical calculations including the RR-HO-IG approximation for
determining the thermodynamic characteristics (MD/Q+QM) is correct, we have
employed the metadynamics algorithm to independently explore the free energy surface
of GFA tripeptide. Metadynamic calculations yield two-dimensional free energy surfaces
from shorter simulations than standard MD simulations. The reason is that it allows
controlled sampling of specific structural features and thus the simulation time needed is
significantly reduced. For the present case, the two selected coordinates (see Chart 3)
19
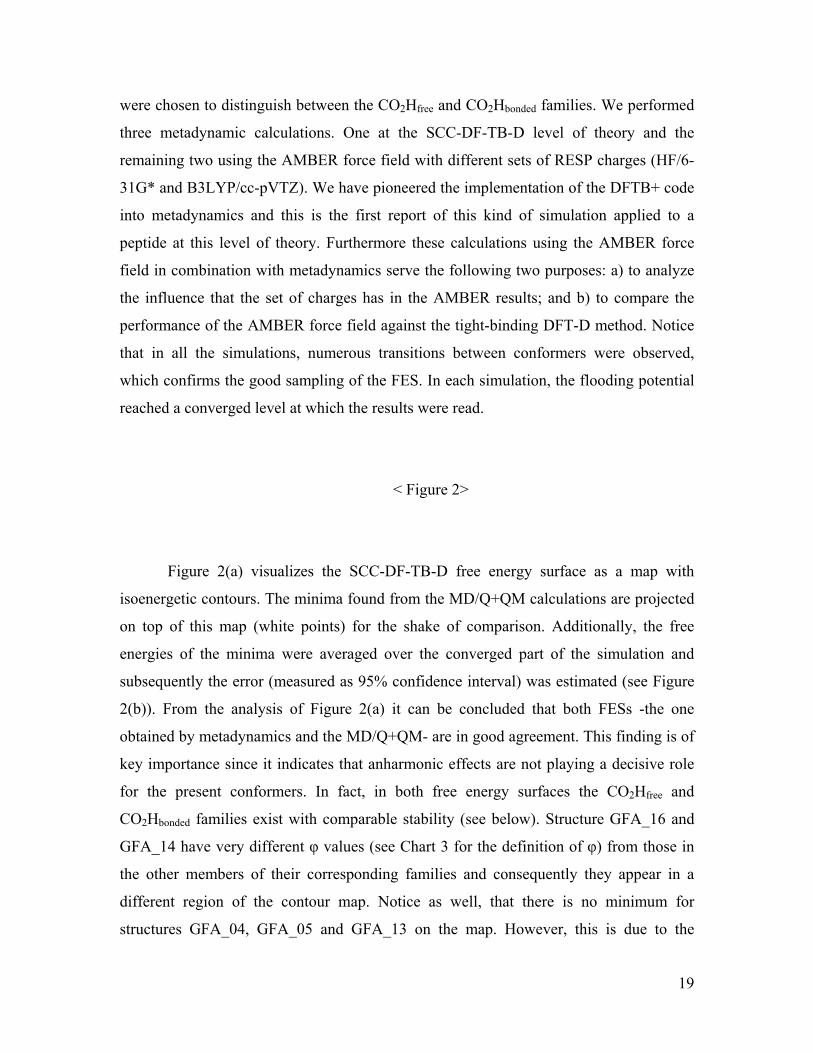
were chosen to distinguish between the CO2Hfree and CO2Hbonded families. We performed
three metadynamic calculations. One at the SCC-DF-TB-D level of theory and the
remaining two using the AMBER force field with different sets of RESP charges (HF/6-
31G* and B3LYP/cc-pVTZ). We have pioneered the implementation of the DFTB+ code
into metadynamics and this is the first report of this kind of simulation applied to a
peptide at this level of theory. Furthermore these calculations using the AMBER force
field in combination with metadynamics serve the following two purposes: a) to analyze
the influence that the set of charges has in the AMBER results; and b) to compare the
performance of the AMBER force field against the tight-binding DFT-D method. Notice
that in all the simulations, numerous transitions between conformers were observed,
which confirms the good sampling of the FES. In each simulation, the flooding potential
reached a converged level at which the results were read.
< Figure 2>
Figure 2(a) visualizes the SCC-DF-TB-D free energy surface as a map with
isoenergetic contours. The minima found from the MD/Q+QM calculations are projected
on top of this map (white points) for the shake of comparison. Additionally, the free
energies of the minima were averaged over the converged part of the simulation and
subsequently the error (measured as 95% confidence interval) was estimated (see Figure
2(b)). From the analysis of Figure 2(a) it can be concluded that both FESs -the one
obtained by metadynamics and the MD/Q+QM- are in good agreement. This finding is of
key importance since it indicates that anharmonic effects are not playing a decisive role
for the present conformers. In fact, in both free energy surfaces the CO2Hfree and
CO2Hbonded families exist with comparable stability (see below). Structure GFA_16 and
GFA_14 have very different φ values (see Chart 3 for the definition of φ) from those in
the other members of their corresponding families and consequently they appear in a
different region of the contour map. Notice as well, that there is no minimum for
structures GFA_04, GFA_05 and GFA_13 on the map. However, this is due to the

20
resolution of the free energy surface rather than to failure of the method. Most
importantly the two independent methods of identifying the most stable conformations of
the peptide at the free energy surface comparable results.
Regarding the order of stabilities of the conformers it should be mentioned that
one point on the 2D surface corresponds to more structures differing in other structural
motifs than those described by coordinates selected for metadynamics. For instance,
structures GFA_06 and GFA_09 (see Figure 1) correspond to the CO2Hbonded family, but
GFA_06 is a γ structure whereas GFA_09 is a βL structure. The resulting free energy
should be thermodynamic average of these structures. From the analysis of Figure 2(b) it
can be concluded that the best overall agreement with the quantum chemical Gibbs
energies was achieved at the SCC-DF-TB-D level of theory, although in our simulation it
overestimates hydrogen bonding by about 3 kcal/mol. This is in contrast with normal
behaviour of SCC-DF-TB-D, which tends to underestimate intersystem hydrogen
bonds.71 This can be at least partially attributed to an artifact of the simulation, because
the preference of non H-bonded structures is possible within given error bars (Figure
2(b)).
Similar free energy surfaces were evaluated using the AMBER force field and
two different sets of charges (HF/6-31G* and B3LYP/cc-pVTZ) for the sake of
comparison. The contour maps of these FES can be found in the supplementary
information (see Figure S1) and the free energies of the minima are listed in Figure 2(b).
From the data in Figure 2(b), it is clear that the force field using the B3LYP/cc-pVTZ
charges underestimates the hydrogen bonding whereas using HF/6-31G* charges
provides the best description from the potentials we tested. More importantly, AMBER
results are strongly biased towards negative values of the dihedral angle φ and thus, the
procedure cannot be recommended for the evaluation of thermodynamic characteristics.
Similar behaviour of the AMBER ff99 is discussed in Ref. 72.

21
Comparison with the experiment.
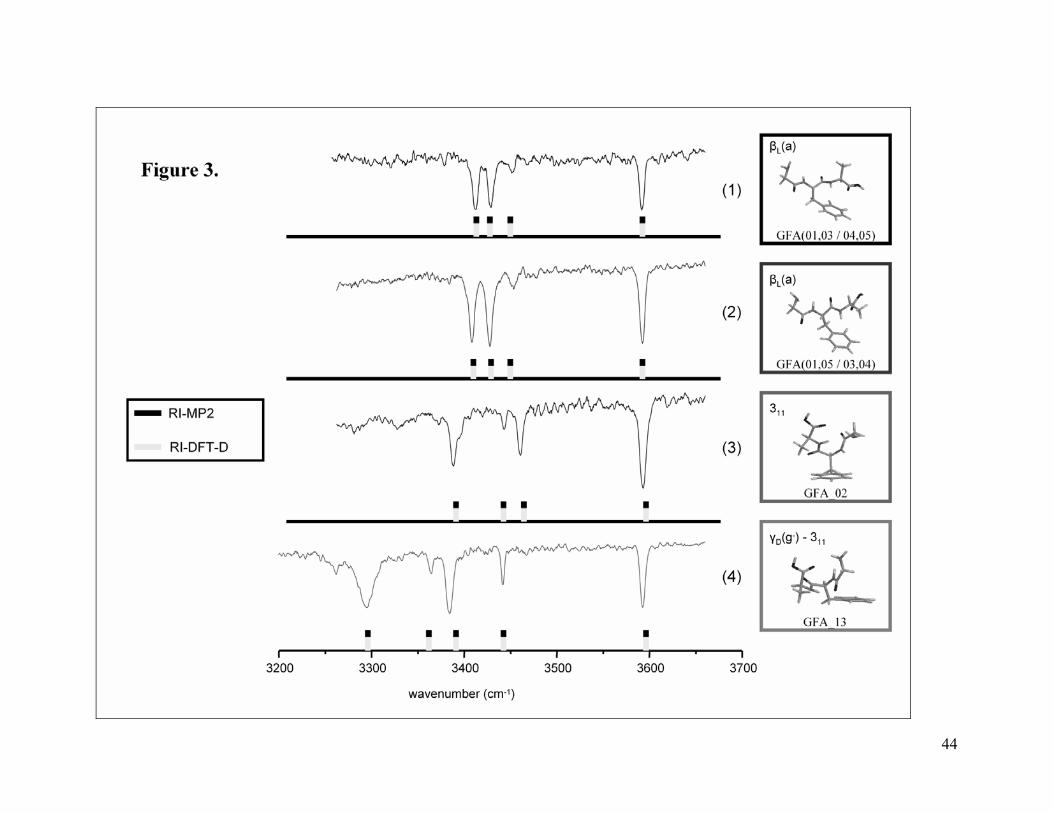
<Figure 3>
Figure 3 shows the ground state IR spectra measured for GFA tripeptide in the
3200 – 3700 cm-1 region. We obtained each of these IR-UV hole burning traces by setting
the UV probe wavelength at the origin of a different one of the four conformers in the
R2PI spectrum. Scaled theoretical spectra of the assigned structures (see below)
calculated using both RI-MP2 and RI-DFT-D methods appear as well. Table S3 and
Table S4 of the Supporting Information list the exact values of the calculated and
experimental frequencies. According to the experimental data four different conformers
within the CO2Hfree family, characterised by a free OH stretch frequency in the spectra,
co-exist in the gas-phase. The theoretical data predict a larger number of structures than
the number we observe experimentally. The same phenomenon has previously been
reported for several other peptides.70,73,74 This raises the question how to reconcile the
more complicated conformational landscape predicted theoretically with the apparently
‘simpler’ conformational picture derived experimentally.
One possible explanation is that the experimental data could be incomplete for
which there could be several reasons. Oscillator strengths or Frank-Condon factors for
certain conformers might be too small to permit their measurement. It is possible to miss
conformations when their UV spectrum is shifted outside the experimental range. It is
also possible to miss structures if their ionisation potential is more than twice the photon
energy used. However, it is not obvious why any of these conditions would apply
selectively to any of the calculated conformations. The same holds for the assumption
that collisional relaxation in the free jet expansions selects specific conformers.
Another intriguing possibility why we might not observe specific structures in our
R2PI experiments is a short excited state lifetime. A sub-picosecond excited state lifetime
could preclude detection in our experiment, because we employ two photon ionization

22
with nanosecond laser pulses. For nucleobases a number of excited state calculations
suggest that rapid internal conversion (IC) can be highly structure selective. Several
groups have proposed models in which IC takes place via conical intersections.75-80
Whether or not these intersections have barriers depends very sensitively on molecular
structure, which can lead to lifetimes that can differ by orders of magnitude between
fairly similar structures. The failure to experimentally observe selected tautomers and
cluster structures appears to be consistent with these models. One of several proposed IC
pathways involves πσ* states with motion along an H-bond N-H coordinate. Sobolewski
and Domcke have recently proposed that such excited state dynamics can also occur in
peptides.81 The predicted structures that go unobserved in our experiment all involve an
internal hydrogen bond of CO2Hbonded. As previously reported, for the case of Phe-Gly-
Gly, Trp-Gly and Trp-Gly-Gly peptides, the structures containing an (C=O)OH···O=C
intramolecular H-bond were not observed experimentally. We are currently undertaking
experiments to see if we can observe the “missing” structures by using femtosecond
ionisation and by bypassing the S1 state with single photon ionization.
Our theoretical calculations suggest the existence of four different families in the
PES (or FES): βL, 311, γ and γ -311, two of which, βL and 311, are predicted to be
entropically favoured, that is to be more stable in the FES.
(a) βL family of structures: In a βL structure (see Figure 1), the peptide backbone is
extended so five IR lines should be observed in the 3200-3700 cm-1 spectral region
corresponding to the carboxyl O-H stretch (OH), the amino NH2(S), symmetric, and
NH2(A), antisymmetric, stretches and the peptide N-H stretch (NHpep) vibrations. Our
conformational search, suggest the existence of four very stable structures within the βL
family (GFA_01, 03, 04, 05) which themselves can be clustered into two subfamilies
according to the orientation of the –NH2 and CO2H terminal groups. However, the
classification of these four structures is not fully straightforward since it depends on the
criteria of selection. On the one hand, we could consider structures GFA_01 and
GFA_03, and consequently GFA_04 and GFA_05, to be members of the same family
showing different orientations of the –NH2 terminal group and similar orientation of the
CO2H termini group. Alternatively we could consider structures GFA_01 and GFA_05,
23
and consequently GFA_03 and GFA_04, to be members of the same family showing
different orientations of the CO2H terminal group and similar orientation of the –NH2
terminal group. What seems to be clear is that there are two βL subfamilies
distinguishable in the spectroscopic record, since two of the experimental spectra
(spectrum (1) and (2) in Figure 3) nicely match those calculated for the GFA_01, 03, 04
and 05 βL structures. We can not determine whether the experimentally reported spectra
result from the contribution of one or two βL conformers and which of the βL subfamilies
is represented by which of the spectra.
(b) 311 family of structures. The assignment of the spectra of the GFA_02
structure, representing the 311 family, is more straightforward. From inspection of Figure
3 it can be clearly seen that its scaled theoretical spectrum agrees well with the
experimental spectrum (3).
(c) The γ family of structures. We have observed in the structural analysis that all
the γ structures belong to the CO2Hbonded family. Thus, all of these structures show a
spectral line in the 3200 cm-1 spectral region (see Tables S3 and S4) resulting from the
involvement of the OH group in an intramolecular H-bond. Consequently, none match
any of the experimental structures. The same is true for the GFA_09 and 10 βL structures.
After excluding structures GFA_06 to GFA_12, the spectrum of the next
conformer in the Gibbs energy ranking is GFA_13. The frequencies for this structure
agree quite well with spectrum (4) of Figure 3. Two observations should be made here.
First, GFA_13 belongs to a new family of conformers with a different conformational
peptide backbone than that for the βL and 311 families of structures. Second, there is a
second member of the γ-311 family (structure GFA_14) which we don’t observe
experimentally (see Table S3 and S4 for its spectroscopic data) but which is equally
populated to structure GFA_13.
24
Analysis of the nature of the peptide backbone-aromatic side chain interaction.
Backbone-aromatic (Ar) side chain interactions affect the stability of peptide
conformers in a number of ways.6,8,9,13,14,16,66,82 In general, it appears that for isolated
peptides containing aromatic side chains, βL structures with an Ar(i+1)-NH(i+2)
interaction are more stable than γ structures with an Ar(i+1)-NH(i+1) interaction,
whereas the opposite is true for peptides without a residue of aromatic character. This
propensity has been beautifully illustrated in the comparison of the N-Ac-Ala-NH2, N-
Ac-Gly-NH2 and N-Ac-Phe-NH2 (NAPA)9,82 related species. Chin et al9 have shown that
these systems with capped end groups adopt both, γ and βL(a) peptide backbone
conformations and that their relative stability (γ structures more stable than βL(a) or the
other way around) depends on the formation of a N-H(i+2)···π interaction. Additionally,
for the NAPA system, the authors described the different types of intramolecular
interactions formed within the molecule, which they further characterized by orbital
population and Atoms-In-Molecules analysis. In these capped model peptides, none of
the intramolecular interactions involving unprotected termini can occur, such as the
HNH(i)-OCOH(i+2) which is prevalent in the GFA tripeptide with unprotected end-
groups. Yet, the βL(a) backbone conformation is the preferred structural motif both in the
uncapped peptide and in the capped model system.
<Figure 4>
In the C7 backbone conformation of the γ structures as well as the pseudo-C7
conformation of the 311 structure (see Chart 2) the -NH moiety of residue i+1 is pointing
towards the aromatic side chain. However, in the βL structures, the NH moiety involved
in the N-H···π interaction belongs to residue i+2 (instead of residue i+1) and lies parallel
to the aromatic side chain. We wonder then if the nature of the backbone-aromatic side
chain interaction is of the same character for these two very different geometrical
rearrangements and which is the driving force, if any, of these interactions. We have
modelled different representative conformations by a peptide backbone fragment –

25
benzene intermolecular complex (see Figure 4 and Computational details and Method
section for a description of the models) and we have performed a qualitative analysis
based on the importance of the different components of the interaction energy provided
by DF-DFT-SAPT (see Table S5 in the Supporting information). In the case of structure
GFA_02, we had to split the peptide backbone fragment into two subfragments in order
to avoid an artificial repulsion between the components originating from the proximity of
the a posteriori added hydrogen to the benzene ring.
The stick spectrum of Figure 4 shows that the dispersion energy, Edisp(2), is the
largest attractive contribution to the interaction energy. The importance of the
electrostatic contribution (Eel(1)) varies slightly depending on the directionality of the –
NH moiety: The more pointing the –NH, the higher the Eel(1) component. This result is in
agreement with the conclusion by Tsuzuki et al.11 for the benzene-ammonia model
system that the electrostatic force (dipole(NH)- quadrupole(benzene)) dominates the
directionality of the NH···π interactions. Finally, the induction contribution (Eind(2)) plays
a minor -though not negligible- role in the interaction and the repulsion energy –mainly
coming from the Eexch(1) exchange contribution- has a significant influence on the
equilibrium of the forces. An overall conclusion that can be obtained from the SAPT
analysis is, the important role played by the dispersion energy (Edisp(2)) in the peptide
backbone-aromatic side chain interaction. This conclusion supports our observation that
the DFT methodology, which does not cover the London dispersion energy, insufficiently
describes peptides of aromatic character.
Conclusions.
Localizing the different conformations co-existing in the gas phase of a peptide
requires exploration of the free energy surface of the system. Part of the conformers
predicted to be more stable for the GFA tripeptide according to the Gibbs energies by
statistical thermodynamics and metadynamics calculations agree well with those
observed experimentally. However, there is an additional family reported theoretically
26
and not observed experimentally. One possible explanation is a short excited state
lifetime in the structures which we failed to observe experimentally.
A proper scan of the FES requires the use of a non-empirical method. The
AMBER empirical force field fails mainly due to a large variety of atomic charges for
individual conformers. Additionally, we can not fully disregard the possibility of
attributing the failure of AMBER to an inaccurate fitting to the dihedral term during the
force field development. The FES obtained by means of the combination of MD/Q
simulations using the tight-binding DFT-D method with high-level correlated ab initio
quantum chemical calculations followed by statistical thermodynamics RR-HO-IG
calculations is confirmed by the FES obtained independently with the metadynamics
calculations based on the tight-binding DFT-D method. This proves both methodologies
to be suitable for the study of isolated small peptides.
Metadynamics is a fast and convenient tool modelling the free energy surface of a
peptide. However, in combination with the AMBER force field the method provides
inaccurate results originating in the failure of AMBER and not in the metadynamics
method itself. The use of metadynamics in combination with tight-binding DFT-D is far
more recommendable. The use of metadynamics demands a good knowledge of the
inherent behaviour of the system under study since the data obtained are largely
dependent on the variables chosen to scan the FES. Indeed, relevant structural
information can be hidden if the selection of variables is not appropriate.
For the electronic energies and geometries, the TPSS functional augmented with a
dispersion term (TPSS-D) provides reasonable results in comparison with the benchmark
data at the CCSD(T)/CBS level of theory. However, in case of the M06-2X functional the
performance is not that satisfactory probably due to the inaccurate description of the
long-range interactions provided by the functional.
The most stable conformers of the GFA tripeptide can be clustered into four
families according to the conformational preferences of the peptide backbone. The
backbone arrangement of two of these families resembles the β-strands and γ-turns

27
encountered in analogue capped peptides and in proteins. βL structures are stabilized by
successive C5 motifs in combination with NH(i+2)···aromatic side chain interactions
whereas the γ structures are stabilized by C7 conformations and a H-bond network
involving the amino termini group, the NH(i+1) residue and the aromatic side chain. As
for the nature of the backbone/side chain interactions, the dispersion energy is proven to
play a relevant role.
We did not experimentally observe the predicted family of γ structures with
hydrogen bonded COOH terminal group and we are further exploring the reasons for this
intriguing discrepancy.

28
Acknowledgments
This work was supported by Grant No. A400550510 and LC512 from the Grant
Agency of the Academy of Sciences of the Czech Republic and MSMT of the Czech
Republic; it was also part of the research project No. Z40550506. A portion of the
research described in this paper was performed in the Environmental Molecular Sciences
Laboratory, a national scientific user facility sponsored by the Department of Energy’s
Office of Biological and Environmental Research and located at Pacific Northwest
National Laboratory. The research done by V. Spiwok was supported by the Czech
Ministry of Education (MSM6046137305). The experimental work is based upon work
supported by National Science Foundation (CHE-0615401)
Supporting Information Available:
Tables S1 and S2 containing B3LYP/cc-pVTZ and HF/6-31G* RESP charges,
respectively. Tables S3 and S4 containing experimental and scaled theoretical (RI-
MP2/cc-pVDZ and RI-DFT-D/TPSS/LP) vibrational frequencies. Table S5 containing
the energy contributions to the interaction energy as calculated with DF-DFT-SAPT.
Chart S1 with the atoms numbering of Tables S1 and S2. Figure S2 with contour maps
obtained using metadynamics in combination with AMBER. This material is available
free of charge via the Internet at http://pubs.acs.org.
29
Figure Captions
Chart 1. Strategy of calculation used for: a) scanning the PES of GFA tripeptide; b)
localization of the most stable minima in it and c) calculation of the thermodynamic
properties.
Chart 2. Nomenclature definition.
Chart 3. Definition of the collective variables for the metadynamics study.
Figure 1. RI-MP2/cc-pVTZ geometries for the 16 most stable structures of Gly-Phe-Ala
tripeptide. The stability of the individual conformers decreases from left to right. The
structural family to which conformer belongs is included in the upper left corner.
Figure 2. a) Free energy surface calculated using metadynamics at the SCC-DF-TB-D
level of theory. Collective variables are described in text. Free energy minima obtained
using MD/Q+QM are illustrated as points labelled according to Figure 1. Distances are
given in Å and dihedral angle in degrees; b) free energies (kcal/mol) calculated using
metadynamics combined with tight-binding DFT-D and AMBER empirical force field
with either HF/6-31G* (AMBER+HF) or B3LYP/cc-pVTZ (AMBER+DFT) set of
charges. Labelling according to Figure 1. The energy scale corresponds to the quantum
chemical Gibbs energy (see Table 1). CO2Hfree structures 1 to 3 were set as zero.
Figure 3. IR ground state experimental spectra of the Gly-Phe-Ala tripeptide. Schematic
scaled harmonic spectra at the RI-MP2/cc-pVDZ (dark bars) and RI-DFT-D/TPSS/LP
(light bars) levels of theory are also included for comparison.
Figure 4. Intermolecular complexes modeling backbone–aromatic side chain interactions
in the GFA conformers. All distances are given in Å. The different components of the
interaction energy of representative structures are illustrated in bar diagrams
30
Reference List
1. C.Branden; J.Tooze Introduction to Protein Structure; New York, 1999.
2. Steiner, T.; Koellner, G. J. Mol. Biol. 2001, 305 (3), 535-557.
3. Burley, S. K.; Petsko, G. Febs Lett. 1986, 203 (2), 139-143.
4. Levitt, M.; Perutz, M. F. J. Mol. Biol. 1988, 201 (4), 751-754.
5. Steiner, T. Angew. Chem.-Int. Edit. 2002, 41 (1), 48-76.
6. Toth, G.; Watts, C. R.; Murphy, R. F.; Lovas, S. PROTEINS 2001, 43 (4),
373-381.
7. Palermo, N. Y.; Csontos, J.; Owen, M. C.; Murphy, R. F.; Lovas, S. J.
Comput. Chem. 2007, 28 (7), 1208-1214.
8. Toth, G.; Murphy, R. F.; Lovas, S. J. Am. Chem. Soc. 2001, 123 (47),
11782-11790.
9. Chin, W.; Mons, M.; Dognon, J. P.; Mirasol, R.; Chass, G.; Dimicoli, I.;
Piuzzi, F.; Butz, P.; Tardivel, B.; Compagnon, I.; von Helden, G.; Meijer, G. J. Phys.
Chem. A 2005, 109 (24), 5281-5288.
10. Rodham, D. A.; Suzuki, S.; Suenram, R. D.; Lovas, F. J.; Dasgupta, S.;
Goddard, W. A.; Blake, G. A. Nature 1993, 362 (6422), 735-737.
11. Tsuzuki, S.; Honda, K.; Uchimaru, T.; Mikami, M.; Tanabe, K. J. Am.
Chem. Soc. 2000, 122 (46), 11450-11458.

31
12. Bendova, L.; Jurecka, P.; Hobza, P.; Vondrasek, J. J. Phys. Chem. B 2007,
111 (33), 9975-9979.
13. Duan, G.; Smith, V. H.; Weaver, D. F. J. Phys. Chem. A 2000, 104 (19), 4521-
4532.
14. Duan, G. L.; Smith, V. H.; Weaver, D. F. Chem. Phys. Lett. 1999, 310 (3-4), 323-
332.
15. Cheng, J.; Kang, C.; Zhu, W.; Luo, X.; Puah, C. M.; Chen, K.; Shen, J.; Jiang,
H. J. Org. Chem. 2003, 68 (19), 7490-7495.
16. Flocco, M. M.; Mowbray, S. L. J. Mol. Biol. 1994, 235 (2), 709-717.
17. Mitchell, J. B. O.; Nandi, C. L.; Mcdonald, I. K.; Thornton, J. M.; Price, S.
L. J. Mol. Biol. 1994, 239 (2), 315-331.
18. Worth, G. A.; Wade, R. C. J. Phys. Chem. 1995, 99 (48), 17473-17482.
19. Iannuzzi, M.; Laio, A.; Parrinello, M. Phys. Rev. Lett. 2003, 90 (23).
20. Laio, A.; Parrinello, M. PNAS 2002, 99 (20), 12562-12566.
21. Jurecka, P.; Cerny, J.; Hobza, P.; Salahub, D. R. J. Comput. Chem. 2007,
28 (2), 555-569.
22. Cerny, J.; Jurecka, P.; Hobza, P.; Valdes, H. J. Phys. Chem. A 2007, 111
(6), 1146-1154.
32
23. Zhao, Y.; Truhlar, D. G. Theor. Chem. Acc., D.O.I.: 10.1007/s00214-007-
0310-x
24. Dabkowska, I.; Gonzalez, H. V.; Jurecka, P.; Hobza, P. J. Phys. Chem. A
2005, 109 (6), 1131-1136.
25. Tsuzuki, S.; Luthi, H. P. J. Chem. Phys. 2001, 114 (9), 3949-3957.
26. Wu, X.; Vargas, M. C.; Nayak, S.; Lotrich, V.; Scoles, G. J. Chem. Phys.
2001, 115 (19), 8748-8757.
27. Holroyd, L. F.; van Mourik, T. Chem. Phys. Lett. 2007, 442 (1-3), 42-46.
28. Toroz, D.; van Mourik, T. Mol. Phys. 2006, 104 (4), 559-570.
29. van Mourik, T.; Karamertzanis, P. G.; Price, S. L. J. Phys. Chem. A 2006,
110 (1), 8-12.
30. Valdes, H.; Klusak, V.; Pitonak, M.; Exner, O.; Stary, I.; Hobza, P.;
Rulisek, L. J. Comput. Chem. D.O.I.: 10.1002/jcc.
31. Meijer, G.; de Vries, M. S.; Hunziker, H. E.; Wendt, H. R. Appl. Phys. B-
Lasers Opt. 1990, 51 (6), 395-403.
32. Kim, W.; Schaeffer, M. W.; Lee, S.; Chung, J. S.; Felker, P. M. J. Chem.
Phys. 1999, 110 (23), 11264-11276.
33. Pribble, R. N.; Zwier, T. S. Faraday Discuss. 1994, (97), 229-241.

33
34. Schmitt, M.; Muller, H.; Kleinermanns, K. Chem. Phys. Lett. 1994, 218
(3), 246-248.
35. Ryjacek, F.; Engkvist, O.; Vacek, J.; Kratochvil, M.; Hobza, P. J. Phys.
Chem. A 2001, 105 (7), 1197-1202.
36. Elstner, M.; Hobza, P.; Frauenheim, T.; Suhai, S.; Kaxiras, E. J. Chem.
Phys. 2001, 114 (12), 5149-5155.
37. Reha, D.; Valdes, H.; Vondrasek, J.; Hobza, P.; Abu-Riziq, A.; Crews, B.;
de Vries, M. S. Chem.-Eur. J. 2005, 11 (23), 6803-6817.
38. Eichkorn, K.; Treutler, O.; Ohm, H.; Haser, M.; Ahlrichs, R. Chem. Phys.
Lett. 1995, 240 (4), 283-289.
39. Eichkorn, K.; Weigend, F.; Treutler, O.; Ahlrichs, R. Theor. Chem. Acc.
1997, 97 (1-4), 119-124.
40. Kendall, R. A.; Dunning, T. H.; Harrison, R. J. J. Chem. Phys. 1992, 96
(9), 6796-6806.
41. Halkier, A.; Helgaker, T.; Jorgensen, P.; Klopper, W.; Koch, H.; Olsen, J.;
Wilson, A. K. Chem. Phys. Lett. 1998, 286 (3-4), 243-252.
42. Jurecka, P.; Hobza, P. Chem. Phys. Lett. 2002, 365 (1-2), 89-94.
43. Valdes, H.; Reha, D.; Hobza, P. J. Phys. Chem. B 2006, 110 (12), 6385-
6396.

34
44. Antony, J.; Grimme, S. Phys. Chem. Chem. Phys. 2006, 8 (45), 5287-
5293.
45. Grimme, S. J. Comput. Chem. 2004, 25 (12), 1463-1473.
46. Grimme, S. J. Comput. Chem. 2006, 27 (15), 1787-1799.
47. Tao, J. M.; Perdew, J. P.; Staroverov, V. N.; Scuseria, G. E. Phys. Rev.
Lett. 2003, 91 (14).
48. Becke, A. D. Phys. Rev. A 1988, 38 (6), 3098-3100.
49. Hehre, W. J.; Radom, L.; Schleyer, P. v. R.; Pople, J. A. Ab
InitioMolecular Orbital Theory; New York, 1986.
50. Piana, S.; Laio, A. J. Phys. Chem. B 2007, 111 (17), 4553-4559.
51. Wang, J. M.; Cieplak, P.; Kollman, P. A. J. Comput. Chem. 2000, 21 (12),
1049-1074.
52. Hesselmann, A.; Jansen, G. Chem. Phys. Lett. 2002, 357 (5-6), 464-470.
53. Hesselmann, A.; Jansen, G. Chem. Phys. Lett. 2002, 362 (3-4), 319-325.
54. Hesselmann, A.; Jansen, G. Chem. Phys. Lett. 2003, 367 (5-6), 778-784.
55. Hesselmann, A.; Jansen, G. Phys. Chem. Chem. Phys. 2003, 5 (22), 5010-
5014.
56. Hesselmann, A.; Jansen, G.; Schutz, M. J. Chem. Phys. 2005, 122 (1).
35
57. Jansen, G.; Hesselmann, A. J. Phys. Chem. A 2001, 105 (49), 11156-
11157.
58. Jeziorski, B.; Moszynski, R.; Szalewicz, K. Chem. Rev. 1994, 94 (7),
1887-1930.
59. Ahlrichs, R.; Bar, M.; Haser, M.; Horn, H.; Kolmel, C. Chem. Phys. Lett.
1989, 162 (3), 165-169.
60. MOLPRO is a package of ab initio programs written by Werner, H.-J. et
al.
61. Aradi, B.; Hourahine, B.; Frauenheim, T. J. Phys. Chem. A 2007, 111
(26), 5678-5684.
62. van der Spoel, D.; Lindahl, E.; Hess, B.; Groenhof, G.; Mark, A. E.;
Berendsen, H. J. C. J. Comput. Chem. 2005, 26 (16), 1701-1718.
63. Shao, Y. et al. Phys. Chem. Chem. Phys. 2006, 8 (27), 3172-3191.
64. Chou, K. C. Anal. Biochem. 2000, 286 (1), 1-16.
65. Lansbergen, G.; Komarova, Y.; Modesti, M.; Wyman, C.; Hoogenraad, C.
C.; Goodson, H. V.; Lemaitre, R. P.; Drechsel, D. N.; van Munster, E.; Gadella, T. W. J.;
Grosveld, F.; Galjart, N.; Borisy, G. G.; Akhmanova, A. J. Cell Biol. 2004, 166 (7),
1003-1014.
66. Chin, W.; Mons, M.; Dognon, J. P.; Piuzzi, F.; Tardivel, B.; Dimicoli, I. C
Phys. Chem. Chem. Phys. 2004, 6 (10), 2700-2709.

36
67. Fricke, H.; fer, G.; Schrader, T.; Gerhards, M. Phys. Chem. Chem. Phys.
2007, 9 (32), 4592-4597.
68. Bakker, J. M.; Plutzer, C.; Hunig, I.; Haber, T.; Compagnon, I.; von
Helden, G.; Meijer, G.; Kleinermanns, K. ChemPhysChem 2005, 6 (1), 120-128.
69. Hunig, I.; Kleinermanns, K. Phys. Chem. Chem. Phys. 2004, 6 (10), 2650-
2658.
70. Robertson, E. G.; Simons, J. P. Phys. Chem. Chem. Phys. 2001, 3 (1), 1-
18.
71. Kabelac, M.; Valdes, H.; Sherer, E. C.; Cramer, C. J.; Hobza, P. Phys.
Chem. Chem. Phys. 2007, 9 (36), 5000-5008.
72. Lwin, T. Z.; Luo, R. Protein Sci. 2006, 15 (11), 2642-2655.
73. Godfrey, P. D.; Brown, R. D. P. J. Am. Chem. Soc. 1998, 120 (41), 10724-
10732.
74. Sanz, M. E.; Cortijo, V.; Caminati, W.; Lopez, J. C.; Alonso, J. L. Chem.-
Eur. J. 2006, 12 (9), 2564-2570.
75. Kistler, K. A.; Matsika, S. J. Phys. Chem. A 2007, 111 (35), 8708-8716.
76. Kistler, K. A.; Matsika, S. J. Phys. Chem. A 2007, 111 (14), 2650-2661.
77. Marian, C. M. J. Phys. Chem. A 2007, 111 (8), 1545-1553.
37
78. Perun, S.; Sobolewski, A. L.; Domcke, W. Chem. Phys. 2005, 313 (1-3),
107-112.
79. Seefeld, K. A.; Plutzer, C.; Lowenich, D.; Haber, T.; Linder, R.;
Kleinermanns, K.; Tatchen, J.; Marian, C. M. Phys. Chem. Chem. Phys. 2005, 7 (16),
3021-3026.
80. Sobolewski, A. L.; Domcke, W.; Hattig, C. PNAS 2005, 102 (50), 17903-
17906.
81. Sobolewski, A. L.; Domcke, W. ChemPhysChem 2006, 7 (3), 561-564.
82. Chass, G. A.; Mirasol, R. S.; Setiadi, D. H.; Tang, T. H.; Chin, W.; Mons,
M.; Dimicoli, I.; Dognon, J. P.; Viskolcz, B.; Lovas, S.; Penke, B.; Csizmadia, I. G. J.
Phys. Chem. A 2005, 109 (24), 5289-5302.

38
Table 1. Relative energies (C), enthalpies (ΔH0) and Gibbs energies (ΔG) (in kcal/mol) calculated at different levels of theory for the most
stable conformers of GFA tripeptide. Structures are ordered according to ΔG. Labelling according to Figure 1. The relative population (Pop)
of conformers according to a Maxwell-Boltzman distribution at T = 300K is also included. Scaled frequencies have been considered for the
calculation of the thermodynamical properties.
CCSD(T)/CBS ΔE[M06-2X/ RI-DFT-D/TPSS/LP
Structure ΔEa ΔH0b ΔG Pop 6-311+G(2df,2dp)c] Structure ΔE ΔH0
d ΔG Pop
GFA_01 [ßL(a)] 2.14 0.00 0.00 1000 0.83 GFA_04 [ßL(a)] 4.00 0.00 0.00 1000
GFA_02 [311] 1.70 0.26 0.06 916 0.95 GFA_05 [ßL(a)] 4.08 0.08 0.35 554
GFA_03 [ßL(a)] 2.02 0.01 0.07 894 0.95 GFA_03 [ßL(a)] 3.53 0.04 0.52 419
GFA_04 [ßL(a)] 1.72 0.18 0.54 409 1.33 GFA_02 [311] 2.90 0.16 0.53 414
GFA_05 [ßL(a)] 1.80 0.18 0.69 317 1.28 GFA_01 [ßL(a)] 3.65 0.07 0.68 319
GFA_06 [γL(g-)] 0.93 0.28 1.25 125 0.58 GFA_06 [γL(g-)] 1.81 0.02 1.58 70
GFA_07 [γL(g-)] 0.41 0.3 1.27 122 1.26 GFA_09 [ßL(a)] 1.31 0.16 1.74 54
GFA_08 [γL(g+)] 0.97 0.35 1.47 88 0.68 GFA_10 [ßL(a)] 1.19 0.14 1.75 53
GFA_09 [ßL(a)] 0.52 0.2 1.61 69 2.00 GFA_07 [γL(g-)] 1.17 0.09 1.79 50
GFA_10 [ßL(a)] 0.43 0.21 1.65 64 2.09 GFA_08 [γL(g+)] 1.89 0.10 1.96 37
GFA_11 [γL(g+)] 0.89 0.34 1.73 56 0.70 GFA_13 [γD(g-)311] 3.12 0.49 2.00 35
GFA_12 [γD(g-)] 0.54 0.46 1.83 48 0.76 GFA_14 [γL(a)311] 3.88 0.30 2.01 35
GFA_13 [γD(g-)311] 1.15 0.62 2.34 21 0.92 GFA_12 [γD(g-)] 0.70 0.32 2.24 23
GFA_14 [γL(a)311] 1.00 0.5 2.54 15 1.37 GFA_11 [γL(g+)] 1.79 0.12 2.35 19
GFA_15 [γL(g-)] 0.00 0.46 2.57 14 1.54 GFA_16 [γD(g-)] 0.71 0.49 3.39 3
GFA_16 [γD(g-)] 1.46 0.53 2.87 9 0.00 GFA_15 [γL(g-)] 0.00 0.68 3.67 2 aTotal relative energy evaluated as a sum of CBS RI-MP2 relative energy and the difference between CCSD(T) and MP2 relative energies. bZPVE were calculated at RIMP2/cc-pVDZ level of theory. cSingle-point energy calculations on RI-MP2/cc-pVTZ geometries. dZPVE were calculated at RI-DFT-D/TPSS/LP level of theory.

39
SCC-DF-TB-DMD/Q RI-MP2/cc-pVDZ
optimizationRI-MP2/cc-pVTZ//RI-MP2/cc-pVDZ
RI-MP2/cc-pVTZRI-DFT-D/TPSS/6-311++G(3df,3pd)
optimization
selection ofthe most
stable structures
Accurate ECBS & CCSD(T)
selection ofthe most
stable structures
Chart 1.
Frequency calculations
RI-MP2/cc-pVDZRI-DFT-D/TPSS/6-311++G(3df,3pd)
Thermodynamicproperties
40

41
42

43
44

45
46
TOC