port sedimentation solutions for the tennessee-tombigbee waterway in...
TRANSCRIPT
Port Sedimentation Solutions for the Tennessee-Tombigbee Waterway in Mississippi
William H. McAnally, Julia F. Haydel, and Gaurav Savant Department of Civil Engineering
James Worth Bagley College of Engineering Mississippi State University
8 January 2004
Prepared for Ports and Waterways Division
Mississippi Department of Transportation
EXECUTIVE SUMMARY Sedimentation of the navigation channel and ports on the Tennessee-Tombigbee Waterway has averaged over 800,000 yd3 per year since completion of the Waterway. The standard solution for the past 17 years has been to dredge the accumulated sediment and place it in upland confined disposal sites. That solution has become less effective as dredging costs have risen and dredging contracts have become more difficult to obtain. Sedimentation of waterways is a natural and ubiquitous phenomenon, and artificially deepened navigation facilities often accumulate sediment faster than waterways of natural depth. Engineering solutions that reduce or eliminate the excess sedimentation are available, and, if they can be designed to be economical, effective, and environmentally sustainable, may offer viable alternatives to dredging. Design of engineering solutions tends to be unique to each site’s characteristics – facilities’ size and layout, waterway hydrography, flows, and sediment supply and characteristics, but they can be classified by the basic mechanisms that they employ into three methods: those that keep sediment out, those that keep sediment moving, and those that remove sediment after it has deposited. Mississippi’s public ports on the Tenn-Tom Waterway experience sedimentation that reduces efficiency and limits barge access. Dredging for small projects is expensive and sometimes difficult to obtain. Typical sedimentation rates range from 1,500 cu yd per yr at Port of Amory to 10,000 cu yd per year at Port of Aberdeen. Causes of port sedimentation include tow-induced suspension from the waterway bed flowing as a density current into the port (a major factor at Yellow Creek’s Northeast Mississippi Waterfront Industrial Park, Port Itawamba, and Port of Amory) and through-flow sediment depositing in the port (the major contributor in Port of Aberdeen, Clay County Port, and Lowndes County Port). Solutions appropriate to each port, based on analyses of local hydrodynamics and transport, have been examined and a recommended approach given for each port. The general design, cost, and expected sedimentation reduction for the recommended solution in each port has been estimated. In addition, local purchase and operation of a dredge has been examined. The ports community has six choices for dealing with sedimentation:
1. Do nothing 2. Continue the present practice of individual port dredging contracts 3. Contract with the winner of the Corps’ Tenn-Tom dredging award to dredge the
ports 4. Contract as a group for dredging
ii

5. Employ the dredging-reduction solutions described here and dredge the remainder of depositing sediment
6. Purchase and operate a dredge The consequences of “do nothing” range from reduced efficiency to port closure, depending on the amount of sedimentation. Option 2, continue present practice, has prompted the present work and is considered untenable by some of the ports, but may be acceptable for others. The costs of the other choices are discussed below. Options 3 and 4 offer the potential for reduced unit dredging costs, but require coordination and continued availability of disposal areas. We assume that continuing present practice of individual port dredging contracts, adding port dredging to the large Corps of Engineers projects, and contracting for dredging as a group (choices 2, 3 and 4) will cost from $4 to $10 per cu yd. Individual contracts will tend to cost the higher end of that range and adding onto the Corps’ contracts will tend toward the lower end of the range. Option 5 recommended solutions are agitation dredging of Northeast Mississippi Waterway Industrial Park, Port Itawamba, and Port of Amory; reshaping the upstream end of the notch at Port of Aberdeen, abandonment of the notch port and investigation of training structures at Clay County, and training structures at Port of Lowndes County. Dredging reductions ranging from 45 percent to 70 percent are expected to result from adopting the recommended solutions. No serious environmental obstacles to the recommended solutions were identified, but each will require permitting from the Corps of Engineers and Mississippi Department of Environmental Quality. Option 5 solutions will not significantly increase overall waterway dredging because port dredging is such a small fraction of total dredging. Option 6 consists of purchasing a small cutterhead dredge and operating it. Initial costs are about $550,000 for the dredge and associated equipment and $65,000 for a workboat if one is not already available. Annual operating costs are estimated to be $458,000. Some costs can be recouped if dredging services are sold to the Corps of Engineers and private terminal operators. Analysis of the costs shows that any solution is sensitive to the dredging cost per cubic yard. At the low estimate of $4 per cu yd, Northeast Mississippi Waterway Industrial Park, Itawamba, and Amory will save money by continuing conventional dredging; whereas, Aberdeen, Clay and Lowndes will save money by adopting the non-dredging solution. At $10 per cu yd, all the ports will save money by implementing the recommended non-dredging solutions. Implementing all the recommended dredging reduction measures offers an overall annual savings of 50 to 57 percent over continuing present dredging practices, exclusive of the cost of amortizing the first costs. Purchase and operation of a dredge is the most expensive option at $458,000, if selling dredging services is neglected.
iii
Amortized initial costs with annual maintenance costs at a discount rate of 6 percent shows that the recommended non-dredging solutions, considered system wide, will save about $14,000 to $44,000 per year over the present dredging practice. The dredge purchase and operation option costs more than either option, again neglecting the possibility of recouping all or part of the extra expense by selling dredging services to others. None of these costs address the issue of diminishing dredged material disposal space on the waterway. To the extent that disposal capacity is a problem, solutions that reduce dredged volume are to be preferred. This work has shown that a number of solutions are available to address port sedimentation problems. In some cases standard dredging and disposal of material is the most economical solution, provided that disposal space is available. In other cases, a significant reduction in the volume of required dredging can be achieved at an effective annual cost less than standard dredging.
iv
PREFACE The work described here was performed by the Civil Engineering Department of the James Worth Bagley College of Engineering at Mississippi State University with funding and guidance from the Ports and Waterways Division of the Mississippi Department of Transportation (MDOT). Funding was provided under the terms of a master agreement between MDOT and the Transportation Research Center at MSU. Project monitors at MDOT were James Moak, Director, and Wayne Parrish, Former Director of the Ports and Waterways Division, and Randy Beatty, Director of the Research Division. Dr. Thomas D. White, Head of the Civil Engineering Department and Director of the Transportation Research Institute at MSU, supervised the work. Field measurements were made by the authors, Cristhian A. Mancilla, and W. Jarrod Walker of MSU, with boats provided by the port authorities and Adam W. McAnally. The authors extend their thanks to the U. S. Army Corps of Engineers Mobile District for generous sharing of their data and time, with special appreciation to Allan Brewer, Peter Grace, and Albert Wise of the Tenn-Tom Waterway Management Office, and Doug Otto and Maurice James of the Hydraulics and Hydrology Section. We also thank the directors of the public ports on the Tenn-Tom – John Hardy, Perry Lucas, William Tisdale, Frank Peeler, Tim Weston, and Eugene Bishop – for their information, support and excellent insights.
v
CONTENTS Executive Summary .........................................................................................................ii Preface............................................................................................................................ v 1. Introduction ................................................................................................................. 1
Purpose.................................................................................................................... 1 Background.............................................................................................................. 1 Approach.................................................................................................................. 1 Scope....................................................................................................................... 3
2. Tennessee-Tombigbee Waterway............................................................................... 4 3. Sedimentation ............................................................................................................. 7
Sediment and Sediment Behavior............................................................................ 7 Sediment Transport.................................................................................................. 8 Sedimentation in Ports ........................................................................................... 10 Sediment Transport in the Tenn-Tom Waterway.................................................... 10
4. Engineering Solutions ............................................................................................... 14 Solution Concepts .................................................................................................. 14 Methods that keep sediment out ............................................................................ 14 Methods that keep sediment moving...................................................................... 14 Specific Solutions................................................................................................... 15 Purchase and Operation of a Dredge..................................................................... 23
5. Yellow Creek Port...................................................................................................... 25 Description ............................................................................................................. 25 Sedimentation and Dredging History...................................................................... 25 Sediment Transport Processes.............................................................................. 25 Engineering Solutions ............................................................................................ 27 Designs .................................................................................................................. 28 Costs...................................................................................................................... 30 Recommendations ................................................................................................. 31
6. Port Itawamba .......................................................................................................... 36 Description ............................................................................................................. 36 Sedimentation and Dredging History...................................................................... 36 Field Investigations ................................................................................................ 37 Sediment Transport Processes.............................................................................. 37 Engineering Solutions ............................................................................................ 38 Designs .................................................................................................................. 38 Costs...................................................................................................................... 40 Recommendations ................................................................................................. 41
7. Port of Amory ............................................................................................................ 46 Description ............................................................................................................. 46 Sedimentation and Dredging History...................................................................... 46 Field Investigations ................................................................................................ 47 Sediment Transport Processes.............................................................................. 47 Engineering Solutions ............................................................................................ 49 Designs .................................................................................................................. 50 Costs...................................................................................................................... 52
vi
Recommendations ................................................................................................. 53 8. Port of Aberdeen ....................................................................................................... 56
Description ............................................................................................................. 56 Sedimentation and Dredging History...................................................................... 56 Field Investigations ................................................................................................ 56 Sediment Transport Processes.............................................................................. 57 Engineering Solutions ............................................................................................ 58 Designs .................................................................................................................. 59 Costs...................................................................................................................... 60 Recommendations ................................................................................................. 61
9. Port of Clay County ................................................................................................... 65 Description ............................................................................................................. 65 Sedimentation and Dredging History...................................................................... 65 Sediment Transport Processes.............................................................................. 65 Engineering Solutions ............................................................................................ 67 Design and Cost..................................................................................................... 69 Recommendations ................................................................................................. 70
10. Lowndes County Port .............................................................................................. 76 Description ............................................................................................................. 76 Sedimentation and Dredging History...................................................................... 76 Field Investigations ................................................................................................ 77 Sediment Transport Processes.............................................................................. 77 Engineering Solutions ............................................................................................ 78 Designs .................................................................................................................. 79 Costs...................................................................................................................... 80 Recommendations ................................................................................................. 81
11. Summary and Conclusions ..................................................................................... 86 References.................................................................................................................... 91 Appendix A: Port Itawamba Calculations ...................................................................... 95 Appendix B: Port of Aberdeen Calculations .................................................................. 96 Appendix C: Port of Lowndes County Calculations ..................................................... 100 Appendix D: Clay County Port Calculations ................................................................ 106 Appendix E: Sediment Resuspension by Tows at Port of Amory ................................ 108
vii
1. INTRODUCTION
Purpose The purpose of this work is to determine if there are feasible, affordable engineering solutions to reduce or eliminate dredging requirements at docks and mooring areas at the Mississippi public ports on the Tennessee-Tombigbee Waterway and to compare those solutions to purchase and operation of a dredge. The purpose of this report is to present findings of Tasks II and III of this effort and provide recommendations on engineering solutions.
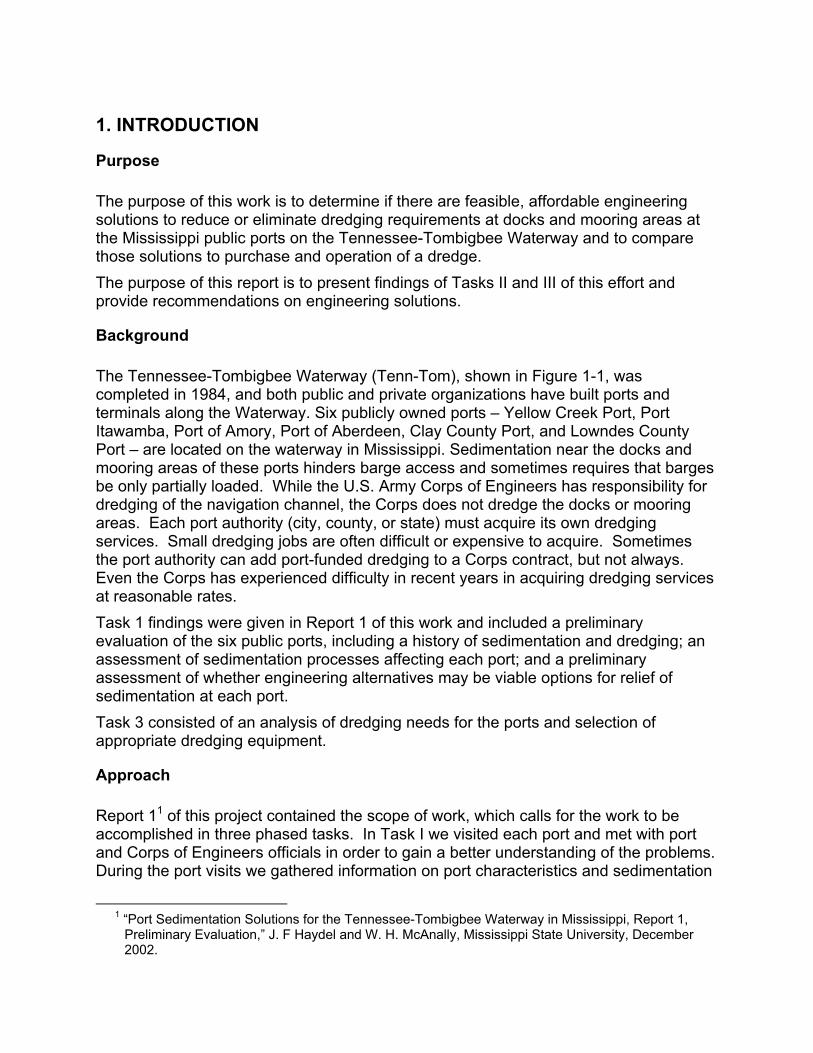
Background The Tennessee-Tombigbee Waterway (Tenn-Tom), shown in Figure 1-1, was completed in 1984, and both public and private organizations have built ports and terminals along the Waterway. Six publicly owned ports – Yellow Creek Port, Port Itawamba, Port of Amory, Port of Aberdeen, Clay County Port, and Lowndes County Port – are located on the waterway in Mississippi. Sedimentation near the docks and mooring areas of these ports hinders barge access and sometimes requires that barges be only partially loaded. While the U.S. Army Corps of Engineers has responsibility for dredging of the navigation channel, the Corps does not dredge the docks or mooring areas. Each port authority (city, county, or state) must acquire its own dredging services. Small dredging jobs are often difficult or expensive to acquire. Sometimes the port authority can add port-funded dredging to a Corps contract, but not always. Even the Corps has experienced difficulty in recent years in acquiring dredging services at reasonable rates. Task 1 findings were given in Report 1 of this work and included a preliminary evaluation of the six public ports, including a history of sedimentation and dredging; an assessment of sedimentation processes affecting each port; and a preliminary assessment of whether engineering alternatives may be viable options for relief of sedimentation at each port. Task 3 consisted of an analysis of dredging needs for the ports and selection of appropriate dredging equipment.
Approach Report 11 of this project contained the scope of work, which calls for the work to be accomplished in three phased tasks. In Task I we visited each port and met with port and Corps of Engineers officials in order to gain a better understanding of the problems. During the port visits we gathered information on port characteristics and sedimentation
1 “Port Sedimentation Solutions for the Tennessee-Tombigbee Waterway in Mississippi, Report 1,
Preliminary Evaluation,” J. F Haydel and W. H. McAnally, Mississippi State University, December 2002.
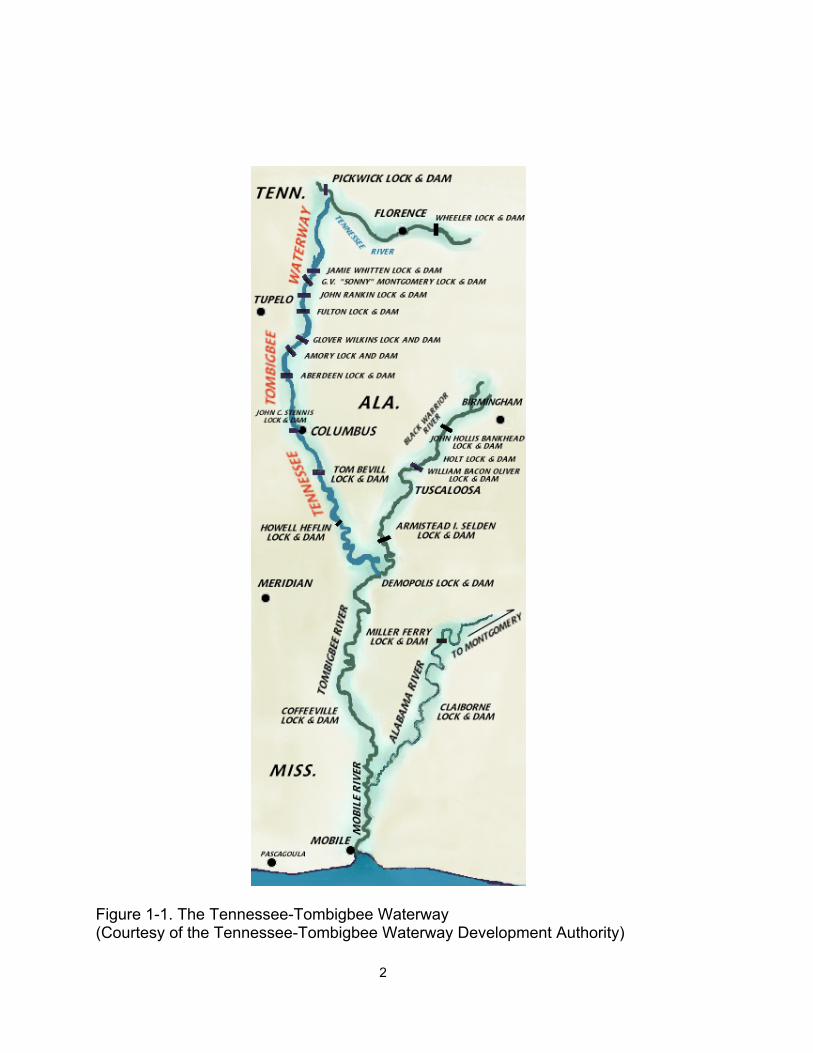
Figure 1-1. The Tennessee-Tombigbee Waterway (Courtesy of the Tennessee-Tombigbee Waterway Development Authority)
2
and dredging history. We met with Corps of Engineers personnel at the Tenn-Tom Waterway Management Center and at the Mobile District to collect information and obtain advice on probable solutions. We attended the annual meeting of the Tennessee-Tombigbee Waterway Development Authority to discuss approaches. We examined the available data and formed hypotheses on the primary sedimentation mechanisms at each port. Finally, we formulated a set of possible engineering solutions to each set of port-specific processes. In Task II we asked the Mississippi Department of Environmental Quality to review the report on Task I and to comment on any environmental quality concerns that agency might have about the list of possible solutions. We collected additional data at representative ports in order to confirm or revise our hypotheses about sedimentation mechanisms. Using that information, we selected the engineering solutions most likely to meet the constraints of effectiveness, cost, and environmental effects and performed a feasibility level design for each of three ports – Port Itawamba, Port of Aberdeen, and Lowndes County Port. Finally, we extrapolated our findings from those three ports to the remaining three. In Task III we consulted an expert in dredging equipment and its operation to specify a dredge, attendant equipment, and staffing capable of performing maintenance dredging at the six ports and estimate first costs and annual costs of that option. Details are given by Seagren (2003).
Scope This report covers Tasks II and III of the Scope of Work assessment of engineering alternatives, including the dredge purchase option. It includes recommendations for solution designs at Yellow Creek Port – Northeast Mississippi Waterway Industrial Park, Port Itawamba, Port of Amory, Aberdeen Port, Clay County Port and Lowndes County Port, and estimates costs for the recommended solutions. The cost of local ownership of a dredge is presented and compared with the individual port solutions. In order to make each port section of the report clear without the reader turning back and forth to other sections, we have duplicated some text material in more than one place. Conversely, to avoid burdening the reader with data and calculations, we have moved backup calculations to port-specific appendices.
3

2. TENNESSEE-TOMBIGBEE WATERWAY The Tennessee-Tombigbee Waterway is a 234-mile-long inland waterway providing a navigation connection between the Tennessee River (and thus the Cumberland, Ohio, and Mississippi Rivers) and the Gulf of Mexico via the Black Warrior-Tombigbee Waterway and Mobile Bay. It passes through Mississippi and Alabama as shown in Figure 1-1. Constructed by the U. S. Army Corps of Engineers, it was completed in 19841. The Waterway consists of three distinct sections River, Canal, and Divide Cut as shown in Figure 2-1. The River portion extends upstream from Mile 217, where the Waterway connects to the Black Warrior River, to Mile 356 near Amory, Mississippi, generally following the course of the Tombigbee River. The Canal section starts at Mile 356 and departs from the Tombigbee River course to trend generally northward to Jamie Whitten (Bay Springs) Lock and Dam at Mile 412. The Divide Cut section connects the Canal section to the Tennessee River at Pickwick Lake near the Mississippi-Tennessee boundary. The 149-mile-long River section lies within the Tombigbee River flood plain and generally follows the course of the river. A number of river meanders have been cut off, leaving 71 miles of meander loops that are still connected to the Waterway. Four lock and dam structures raise the water level a total of 117 ft. The navigation channel has a bottom width of 300 ft and dredged depths of 9 or 12 ft plus 1 ft of allowable overdepth dredging. Numerous tributaries drain into the River section, bringing significant quantities of sediment. The 46-mile-long Canal section is located near the eastern edge of the Tombigbee River floodplain and was formed by constructing a levee to serve as the western boundary of the section while natural high ground serves as the eastern boundary. Five pools result in a chain-of-lakes configuration to provide navigable depths with a 300-ft-wide by 12-ft-deep channel. Inflow to the Canal section is limited to discharges from Whitten Lock and Dam and small tributaries on the eastern edge of the floodplain. The Divide Cut section connects the separate river basins by an excavated cut through the basin divide and extends 39 miles from Bay Springs Dam to Pickwick Lake. The navigation channel has a bottom width of 280 ft and a depth of 12 ft during minimum (winter) pool on Pickwick Lake. Inflows to the section consist of minor local inflows and flow from Pickwick Lake to replace water released downstream at Bay Springs Dam. Table 2-1 lists the pools and structures of the Waterway and their dimensions. Each dam forms an upstream pool, which in some cases has the same name as the dam.
1 Information in this section was drawn from materials of the Corps of Engineers and the Tennessee-Tombigbee Waterway Development Authority and
from a special issue of Environmental Geology and Water Sciences, Vol 7, Nos. 1/2, 1985. .
4
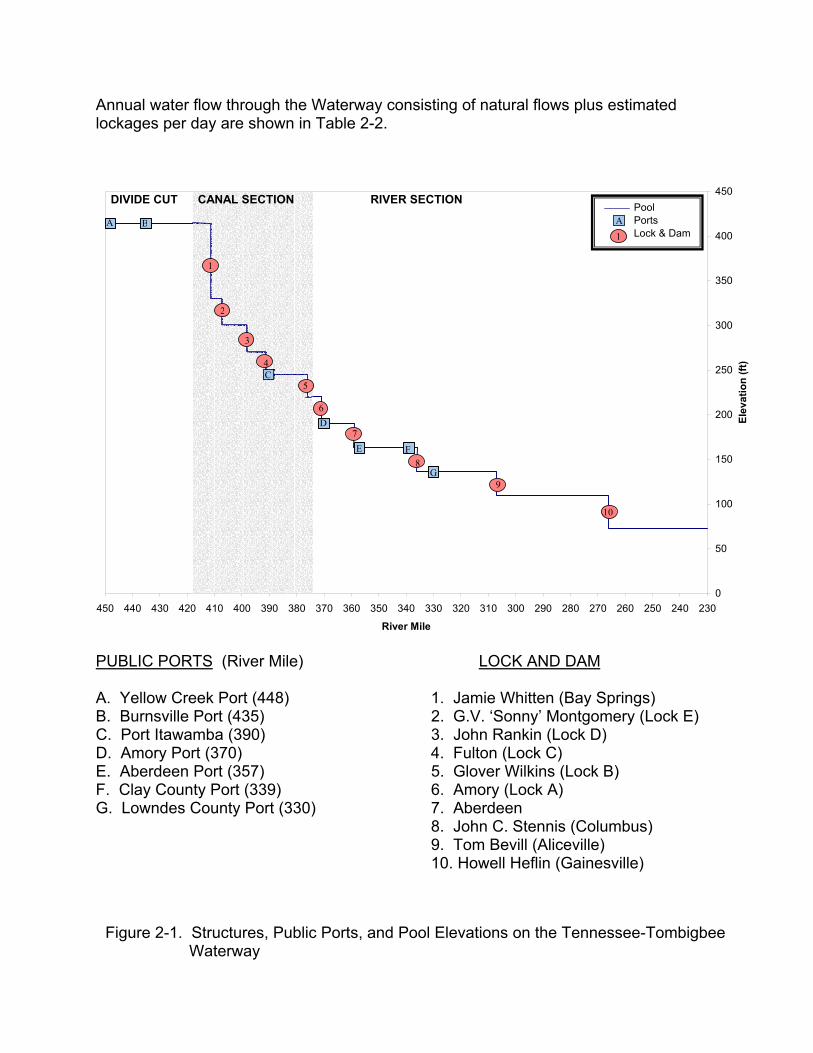
Annual water flow through the Waterway consisting of natural flows plus estimated lockages per day are shown in Table 2-2.
0
50
100
150
200
250
300
350
400
450
230240250260270280290300310320330340350360370380390400410420430440450
River Mile
Elev
atio
n (ft
)
DIVIDE CUT CANAL SECTION RIVER SECTION
1
2
10
3
4
5
6
7
8
9
A BPoolPortsLock & Dam1
A
C
D
E F
G
PUBLIC PORTS (River Mile) LOCK AND DAM A. Yellow Creek Port (448) 1. Jamie Whitten (Bay Springs) B. Burnsville Port (435) 2. G.V. ‘Sonny’ Montgomery (Lock E) C. Port Itawamba (390) 3. John Rankin (Lock D) D. Amory Port (370) 4. Fulton (Lock C) E. Aberdeen Port (357) 5. Glover Wilkins (Lock B) F. Clay County Port (339) 6. Amory (Lock A) G. Lowndes County Port (330) 7. Aberdeen 8. John C. Stennis (Columbus) 9. Tom Bevill (Aliceville) 10. Howell Heflin (Gainesville)
5
Figure 2-1. Structures, Public Ports, and Pool Elevations on the Tennessee-Tombigbee Waterway
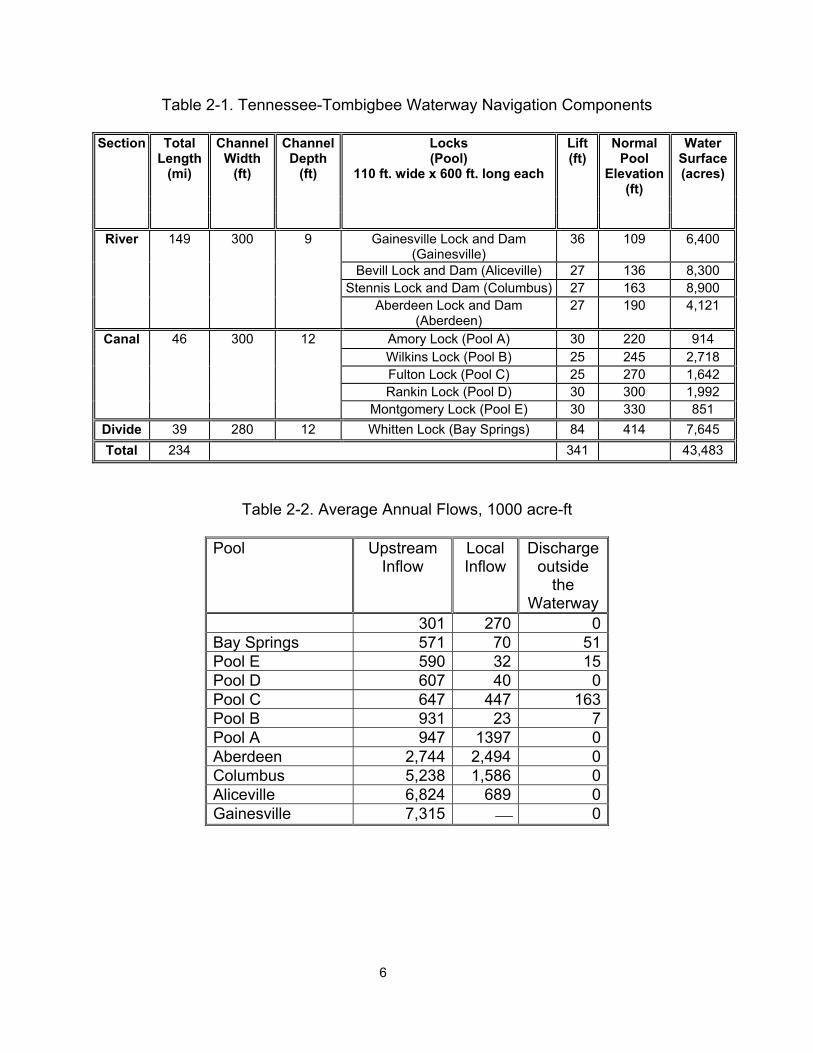
Table 2-1. Tennessee-Tombigbee Waterway Navigation Components
Section Total
Length (mi)
Channel Width
(ft)
Channel Depth
(ft)
Locks (Pool)
110 ft. wide x 600 ft. long each
Lift (ft)
Normal Pool
Elevation(ft)
Water Surface (acres)
River 149 300 9 Gainesville Lock and Dam (Gainesville)
36 109 6,400
Bevill Lock and Dam (Aliceville) 27 136 8,300 Stennis Lock and Dam (Columbus) 27 163 8,900 Aberdeen Lock and Dam
(Aberdeen) 27 190 4,121
Canal 46 300 12 Amory Lock (Pool A) 30 220 914 Wilkins Lock (Pool B) 25 245 2,718 Fulton Lock (Pool C) 25 270 1,642 Rankin Lock (Pool D) 30 300 1,992 Montgomery Lock (Pool E) 30 330 851
Divide 39 280 12 Whitten Lock (Bay Springs) 84 414 7,645 Total 234 341 43,483
Table 2-2. Average Annual Flows, 1000 acre-ft
Pool Upstream Inflow
Local Inflow
Discharge outside
the Waterway
301 270 0 Bay Springs 571 70 51 Pool E 590 32 15 Pool D 607 40 0 Pool C 647 447 163 Pool B 931 23 7 Pool A 947 1397 0 Aberdeen 2,744 2,494 0 Columbus 5,238 1,586 0 Aliceville 6,824 689 0 Gainesville 7,315 0
6
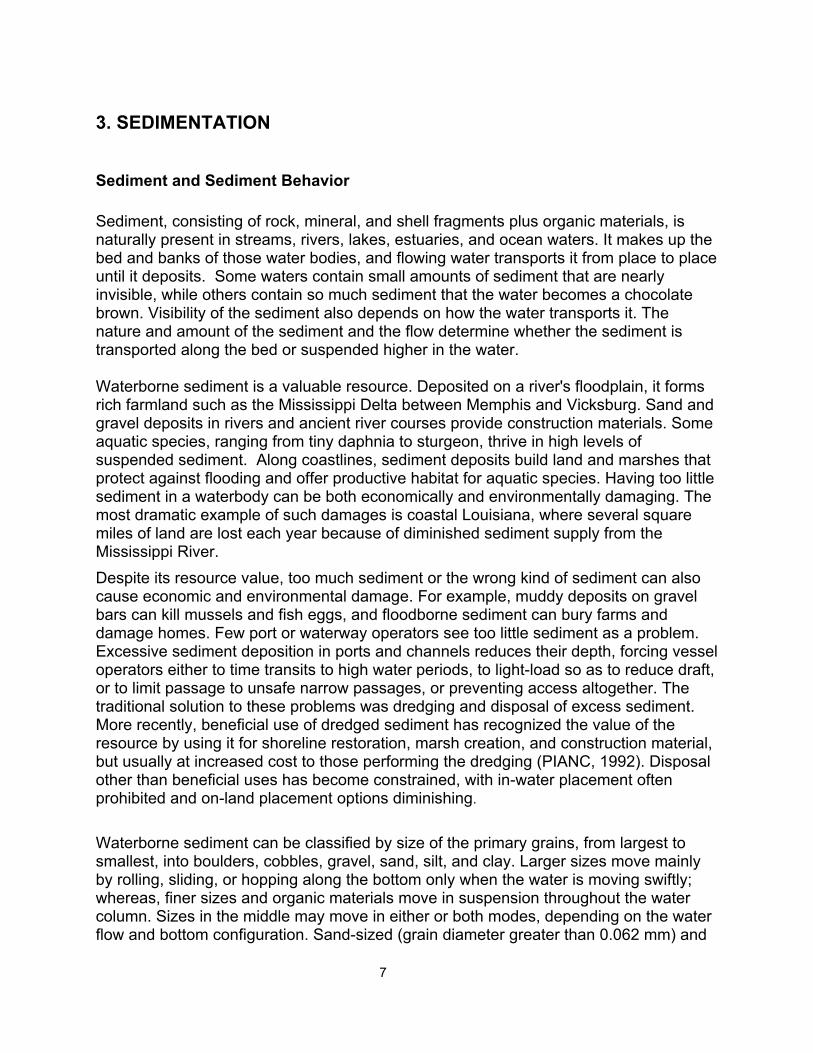
3. SEDIMENTATION
Sediment and Sediment Behavior Sediment, consisting of rock, mineral, and shell fragments plus organic materials, is naturally present in streams, rivers, lakes, estuaries, and ocean waters. It makes up the bed and banks of those water bodies, and flowing water transports it from place to place until it deposits. Some waters contain small amounts of sediment that are nearly invisible, while others contain so much sediment that the water becomes a chocolate brown. Visibility of the sediment also depends on how the water transports it. The nature and amount of the sediment and the flow determine whether the sediment is transported along the bed or suspended higher in the water. Waterborne sediment is a valuable resource. Deposited on a river's floodplain, it forms rich farmland such as the Mississippi Delta between Memphis and Vicksburg. Sand and gravel deposits in rivers and ancient river courses provide construction materials. Some aquatic species, ranging from tiny daphnia to sturgeon, thrive in high levels of suspended sediment. Along coastlines, sediment deposits build land and marshes that protect against flooding and offer productive habitat for aquatic species. Having too little sediment in a waterbody can be both economically and environmentally damaging. The most dramatic example of such damages is coastal Louisiana, where several square miles of land are lost each year because of diminished sediment supply from the Mississippi River. Despite its resource value, too much sediment or the wrong kind of sediment can also cause economic and environmental damage. For example, muddy deposits on gravel bars can kill mussels and fish eggs, and floodborne sediment can bury farms and damage homes. Few port or waterway operators see too little sediment as a problem. Excessive sediment deposition in ports and channels reduces their depth, forcing vessel operators either to time transits to high water periods, to light-load so as to reduce draft, or to limit passage to unsafe narrow passages, or preventing access altogether. The traditional solution to these problems was dredging and disposal of excess sediment. More recently, beneficial use of dredged sediment has recognized the value of the resource by using it for shoreline restoration, marsh creation, and construction material, but usually at increased cost to those performing the dredging (PIANC, 1992). Disposal other than beneficial uses has become constrained, with in-water placement often prohibited and on-land placement options diminishing.
Waterborne sediment can be classified by size of the primary grains, from largest to smallest, into boulders, cobbles, gravel, sand, silt, and clay. Larger sizes move mainly by rolling, sliding, or hopping along the bottom only when the water is moving swiftly; whereas, finer sizes and organic materials move in suspension throughout the water column. Sizes in the middle may move in either or both modes, depending on the water flow and bottom configuration. Sand-sized (grain diameter greater than 0.062 mm) and
7
larger particles are noncohesive, so they move nearly independently of other particles. Because they are relatively large, they settle very rapidly to the bottom when flow slows down or stops. Clay particles are tiny (grain size 0.004 mm and smaller), and they tend to stick together (flocculate) and move as aggregates of many individual grains. They may settle very slowly, even in quiet water. Silt, falling between sand and clay in size, may behave either like sand or like clay. Organic materials include plant and animal detritus. They settle very slowly and may help bind sediment grains together. Cohesion of sediment particles influences bed behavior also. New clay deposits are usually porous and easily resuspended. With time and overburden pressure clay deposits consolidate and become denser and more resistant to erosion.
Sediment Transport Sediment is transported from one place to another by flowing water. Depending on the size and degree of cohesion of the sediment grains and intensity of the flow, the amount transported may be proportional to the speed of the flow or proportional to the speed squared, cubed, etc. So a doubling of flow speed may increase sediment transport as much as eight-fold. In some cases more sediment is transported in one storm event than in all the rest of the year. The proportionality effect described above can also cause substantial sediment deposition. If a waterway's cross-section is suddenly increased by increased depth or width, the flow speed drops and the capacity to transport sediment falls even faster, so sediment will tend to deposit. This effect is a common cause of sedimentation in navigation channels and ports, and is sometimes used to force sediment deposition in a particular location, such as sediment trap. Vessel traffic can suspend sediment from the bed and banks of a waterway through:
• Flow under and around the vessel as water moves from the front end of the vessel to the back.
• Pressure fluctuations beneath the vessel. • Propwash striking the bed. • Bow and stern waves agitating the bed and breaking against the bank.
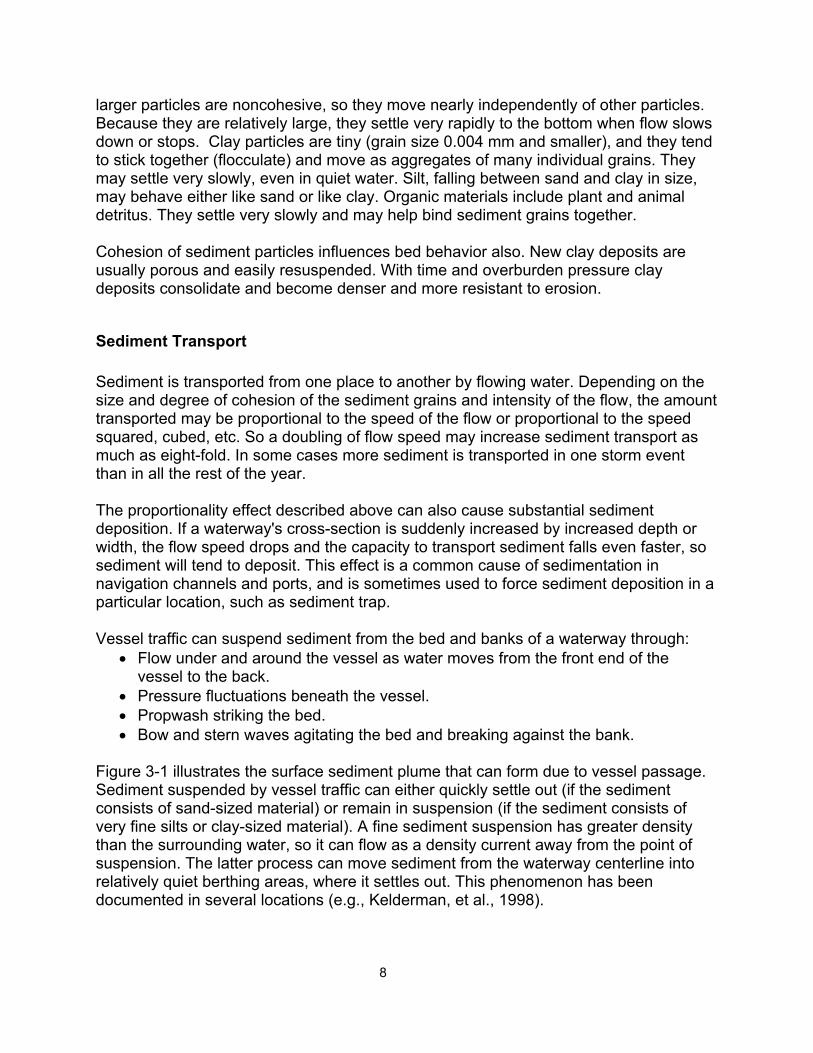
Figure 3-1 illustrates the surface sediment plume that can form due to vessel passage. Sediment suspended by vessel traffic can either quickly settle out (if the sediment consists of sand-sized material) or remain in suspension (if the sediment consists of very fine silts or clay-sized material). A fine sediment suspension has greater density than the surrounding water, so it can flow as a density current away from the point of suspension. The latter process can move sediment from the waterway centerline into relatively quiet berthing areas, where it settles out. This phenomenon has been documented in several locations (e.g., Kelderman, et al., 1998).
8
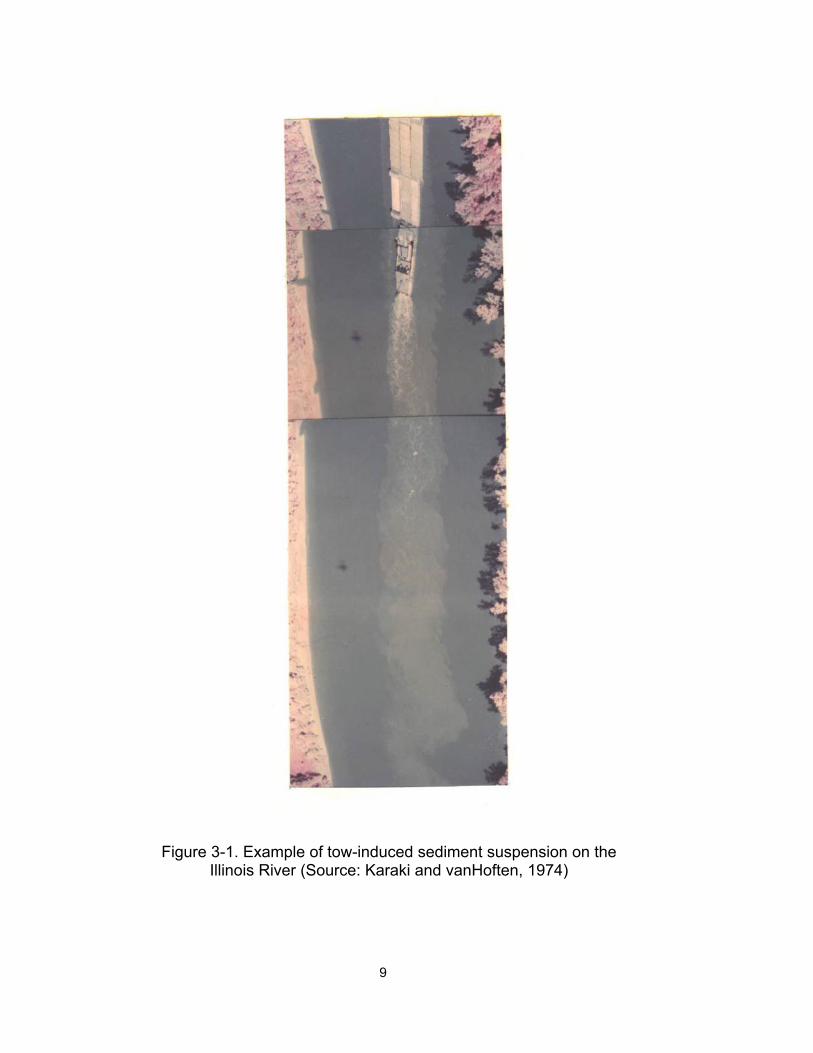
Figure 3-1. Example of tow-induced sediment suspension on the Illinois River (Source: Karaki and vanHoften, 1974)
9
Eddies, circular flow patterns formed by flow past an obstruction or in front of an opening like a port slip, have a complex three-dimensional circular structure with flow inward near the bottom and outward near the surface with a quieter zone in the middle. Sediment passing near an eddy is drawn into the eddy and pushed toward the center, like loose tea leaves in a stirred cup, where it tends to deposit. This phenomenon is a common cause of sedimentation in slips, side channels and berthing areas.
Sedimentation in Ports Commercial vessels deep water ships and shallow water tows require navigable water depths that are equal to or greater than the sum of the draft of the vessel plus under-keel clearance allowances for vessel motion, water level fluctuations, etc. If available water depth in a port is less than navigable depth for a commercial vessel, the vessel must light-load (load less than a full cargo) to reduce draft if it is to use the port. Natural waterways exhibit shallow areas and deep areas that may shift as flows change, sediment supply changes, or features migrate. They may naturally be deep enough in some locations to accommodate navigation, but often have at least some areas shallower than navigable depth. Ports are usually built close to shorelines where water is naturally shallow and so they tend to suffer sediment deposition that reduces the depth available for navigation. Some ports have no significant sediment deposition, either because they are built in water naturally deeper than needed for navigability, because the sediment supply is very small, or because the waterway's currents sweep the sediment away. An example on the Tenn-Tom Waterway is Yellow Creek Port on the Pickwick Lake section. Sediment inflow to the lake is relatively low and most of that deposits at the mouths of streams or in the deep sections of the lake, and lake currents themselves are small enough that they do not deliver sediment to the port area, so the port experiences minor or no deposition and has never required maintenance dredging.
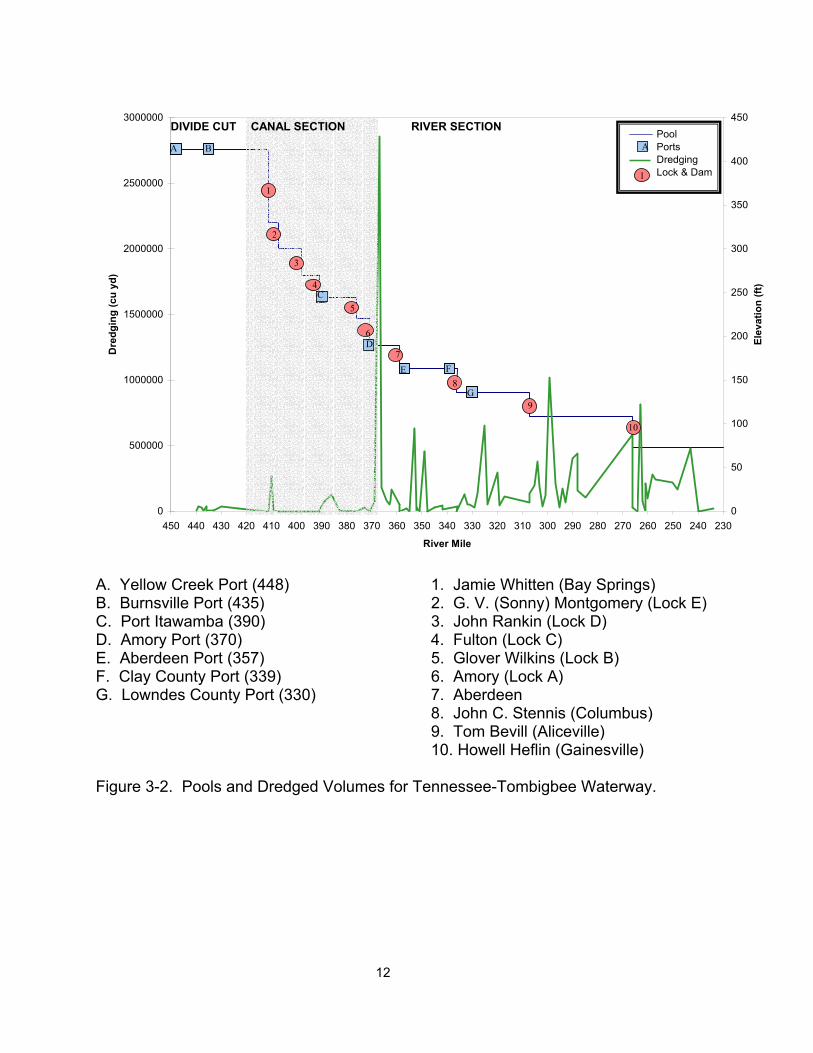
Sediment Transport in the Tenn-Tom Waterway Prior to construction of the Waterway, the Tombigbee River carried an estimated 2.39 tons of sediment per year at Gainesville, Alabama. (Underwood, 1985) Table 3-1 shows 50 percent suspended sediment concentration exceedance levels (half the time concentrations were lower and half the time concentrations were higher) at several measurement stations on the Tombigbee River before construction of the Waterway. Total maintenance dredging quantities for the Waterway from 1985 through 2001 are given in Table 3-2 and Figure 3-2. They show that the average annual dredging quantities for the sections of interest was about 825,000 cu yd. These figures do not include port and terminal dredging quantities.
10
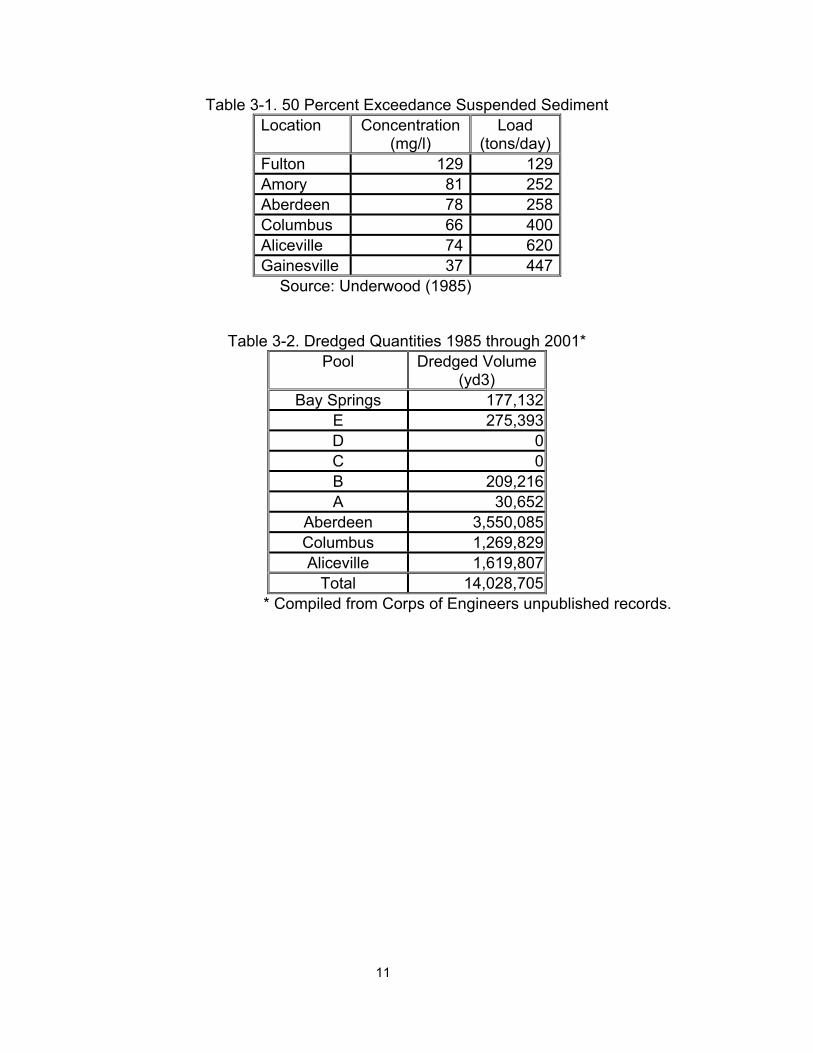
Table 3-1. 50 Percent Exceedance Suspended Sediment Location Concentration
(mg/l) Load
(tons/day)Fulton 129 129Amory 81 252Aberdeen 78 258Columbus 66 400Aliceville 74 620Gainesville 37 447
Source: Underwood (1985)
Table 3-2. Dredged Quantities 1985 through 2001* Pool Dredged Volume
(yd3) Bay Springs 177,132
E 275,393D 0C 0B 209,216A 30,652
Aberdeen 3,550,085Columbus 1,269,829Aliceville 1,619,807
Total 14,028,705* Compiled from Corps of Engineers unpublished records.
11
0
50
100
150
200
250
300
350
400
450
230240250260270280290300310320330340350360370380390400410420430440450
River Mile
Elev
atio
n (ft
)
0
500000
1000000
1500000
2000000
2500000
3000000D
redg
ing
(cu
yd)
DIVIDE CUT CANAL SECTION RIVER SECTION
1
2
10
3
4
5
6
7
8
9
PoolPortsDredgingLock & Dam1
A
E F
G
A B
C
D
A. Yellow Creek Port (448) 1. Jamie Whitten (Bay Springs) B. Burnsville Port (435) 2. G. V. (Sonny) Montgomery (Lock E) C. Port Itawamba (390) 3. John Rankin (Lock D) D. Amory Port (370) 4. Fulton (Lock C) E. Aberdeen Port (357) 5. Glover Wilkins (Lock B) F. Clay County Port (339) 6. Amory (Lock A) G. Lowndes County Port (330) 7. Aberdeen 8. John C. Stennis (Columbus) 9. Tom Bevill (Aliceville) 10. Howell Heflin (Gainesville) Figure 3-2. Pools and Dredged Volumes for Tennessee-Tombigbee Waterway.
12
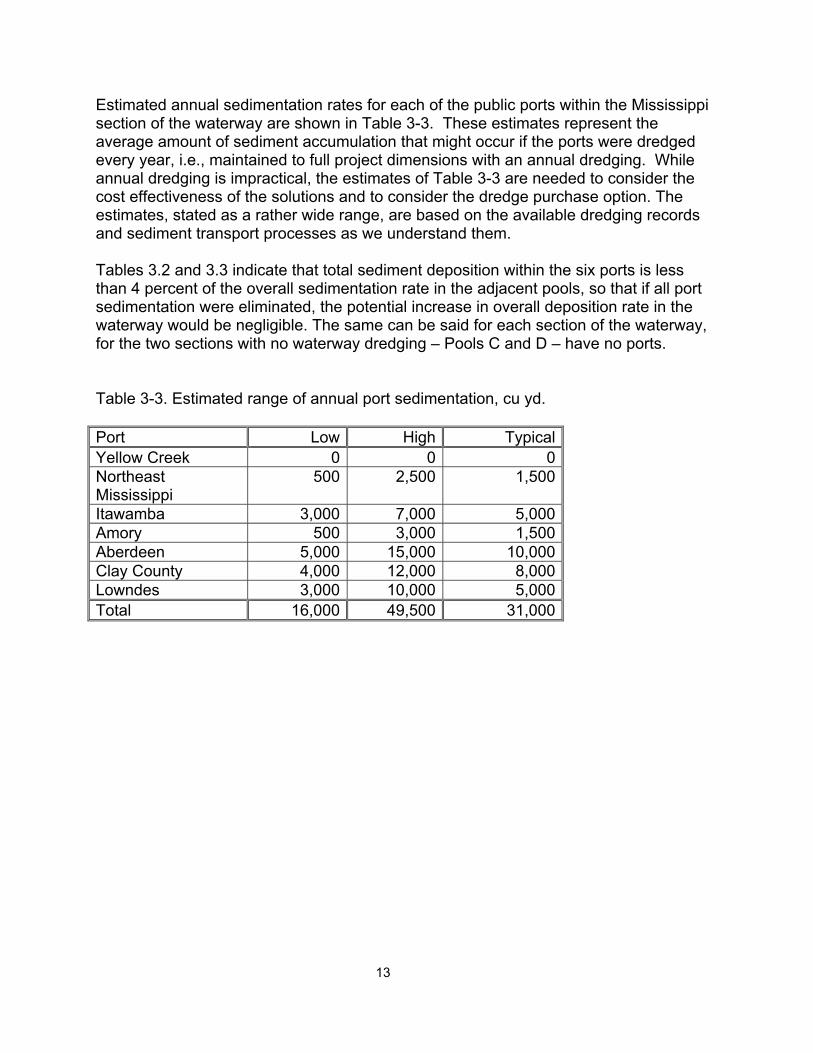
Estimated annual sedimentation rates for each of the public ports within the Mississippi section of the waterway are shown in Table 3-3. These estimates represent the average amount of sediment accumulation that might occur if the ports were dredged every year, i.e., maintained to full project dimensions with an annual dredging. While annual dredging is impractical, the estimates of Table 3-3 are needed to consider the cost effectiveness of the solutions and to consider the dredge purchase option. The estimates, stated as a rather wide range, are based on the available dredging records and sediment transport processes as we understand them. Tables 3.2 and 3.3 indicate that total sediment deposition within the six ports is less than 4 percent of the overall sedimentation rate in the adjacent pools, so that if all port sedimentation were eliminated, the potential increase in overall deposition rate in the waterway would be negligible. The same can be said for each section of the waterway, for the two sections with no waterway dredging – Pools C and D – have no ports. Table 3-3. Estimated range of annual port sedimentation, cu yd. Port Low High Typical Yellow Creek 0 0 0Northeast Mississippi
500 2,500 1,500
Itawamba 3,000 7,000 5,000Amory 500 3,000 1,500Aberdeen 5,000 15,000 10,000Clay County 4,000 12,000 8,000Lowndes 3,000 10,000 5,000Total 16,000 49,500 31,000
13
4. ENGINEERING SOLUTIONS When ports experience sediment deposition that will ultimately lead to unacceptable loss of water depth, solutions are needed to maintain navigability. Solutions can be complete eliminating sediment deposition or partial reducing sediment deposition so as to better manage the problem.
Solution Concepts A variety of engineered solution approaches to reduce deposition problems is available. Solutions tend to be unique to each port, for a successful design depends on port layout, waterway configuration, flow conditions, and sediment type and supply; however, all solutions can be placed in three categories methods that keep sediment out of the port, methods that keep sediment that enters the port moving (and prevents net deposition), and methods that remove sediment after it has deposited in the port. The following lists some of these solutions.
Methods that keep sediment out Keeping excess sediment out of the port that might otherwise enter and deposit can be accomplished by:
• Stabilizing sediment sources. • Diverting sediment-laden flows. • Trapping sediment before it enters. • Blocking sediment entry.
Examples include diverting freshwater flow out of Charleston Harbor, SC which reduced port and channel sedimentation by more than 70 percent (Teeter, 1989), and a sediment trap and tide gate combination in Savannah Harbor, GA that reduced port and waterway dredging by more than 50 percent (Committee on Tidal Hydraulics, 1995). The inland Port of Toronto (Torontoport, 2003) employs a sediment trap to keep its entrance channel open.
Methods that keep sediment moving
If very fine, slow-settling sediment can be kept suspended while the flow passes through the port, or if the flow maintains high enough tractive force (usually expressed as shear stress, or drag force per unit area) to keep coarser particles moving, sediment can enter the port and pass on through without depositing. Methods to keep sediment moving include:
• Structural elements that train natural flows. • Devices that increase tractive forces on the bed.
14
• Designs and equipment that increase sediment mobility. • Designs that reduce cohesive sediment flocculation.
Structural elements include transverse training (spur) dikes that are used in many locations to train flow and prevent local deposition of sediment. Devices to increase bed tractive forces, including submerged wings (Jenkins, 1987) and water jet manifolds (Bailard, 1987) were tested in the Navy berths of Mare Island Strait, CA and found to be effective in reducing sediment deposition locally. Cohesive sediment flocculation can be reduced by designs that reduce turbulence, such as solid wharf walls instead of piling supported wharfs. Methods that remove deposited sediment Sediment can be removed after it deposits. Methods include:
• Traditional dredging and disposal. • Agitation of deposits so that the sediment becomes mobile again.
Removing sediment includes traditional dredging disposal such as has been practiced on the Tenn-Tom Waterway, but also includes sediment agitation methods of intentional overflow, dragging, and propwash erosion. Agitation dredging is subject to regulation, just as traditional dredging is, and can be perceived as contributing to water quality problems.
These methods and their applicability to waterway ports are described further in subsequent parts of this report.
Specific Solutions The succeeding parts describe engineering solutions for each port, customized to conditions at that port. The following provides a general discussion of those solutions that are common to each. Estimated dredging costs are presented here, and estimated port-specific solutions are given in the respective port chapters. Agitation Removing deposited sediment by agitation includes using standard dredging equipment with intentional overflow or discharge into nearby waters, dragging, and propwash erosion. It is usually intended to suspend sediment such that currents carry it away. Anchorage Harbor, AK was dredged with a combination of agitation and dredge-and-haul in 2000 when normal dredge-and-haul could not achieve desired results soon enough. (Hilton, 2000) Dragging a rake behind a vessel to suspend sediment so that it can be carried away by currents has been practiced for centuries in China (Luo, 1986) and propeller wash is used in the
15
same way in some ports, either intentionally or incidental to normal port operations (Richardson, 1984). Propeller wash resuspension of deposited fine sediment can be achieved by a vessel (such as a tow) running its propeller at a high rate in areas of the port to disrupt and resuspend the deposited sediment. Once resuspended, some of the resuspended sediment will flow or diffuse out of the port, but some or even most will redeposit in the port. This method requires no design time, installation, or specialized training. Agitation can be scheduled so as not to conflict with other port operations or access. Prop agitation is widely used in tidal areas, where the agitation can be timed to coincide with seaward flowing currents to move the resuspended sediment away from the port, but can be employed in inland ports, also, if the sediment is sufficiently fine grained and either currents or slope is present to move the resuspended sediment away from the port.1 A special case of agitation dredging involves use of specialized, vessel-mounted equipment to fluidize bed sediment such that it flows downslope or with ambient currents. (Hales, 1995) Agitation dredging is prohibited in some locations because it increases turbidity, at least locally. Using agitation where it is not prohibited will require a Corps of Engineers permit. It will, by definition, increase turbidity in the Tenn-Tom Waterway; however, it will increase it by no more than normal tow traffic does, and our observations (see Appendix E) show that turbidity returns to ambient levels within 15 minutes. If the sediment contains organic materials in an anaerobic state, resuspension will increase the biological oxygen demand and depress dissolved oxygen (Johnson, 1976). Another aspect to this question is reaeration caused by barge traffic. Qaisi, et al, (1997) note that as much as 30% reaeration in high traffic waterways is due to barge traffic, so it might be expected that agitation dredging of the port by propwash may either increase or decrease DO, depending on local conditions. DO impacts will be minimized if the practice is employed at least once per month. A pilot study can be performed in which port deposits are agitated and DO measurements taken to document the degree and duration of impact.
1 Personal communication with Charlie Haun of Parker Towing, Tuscaloosa, AL,
September 2003.
16
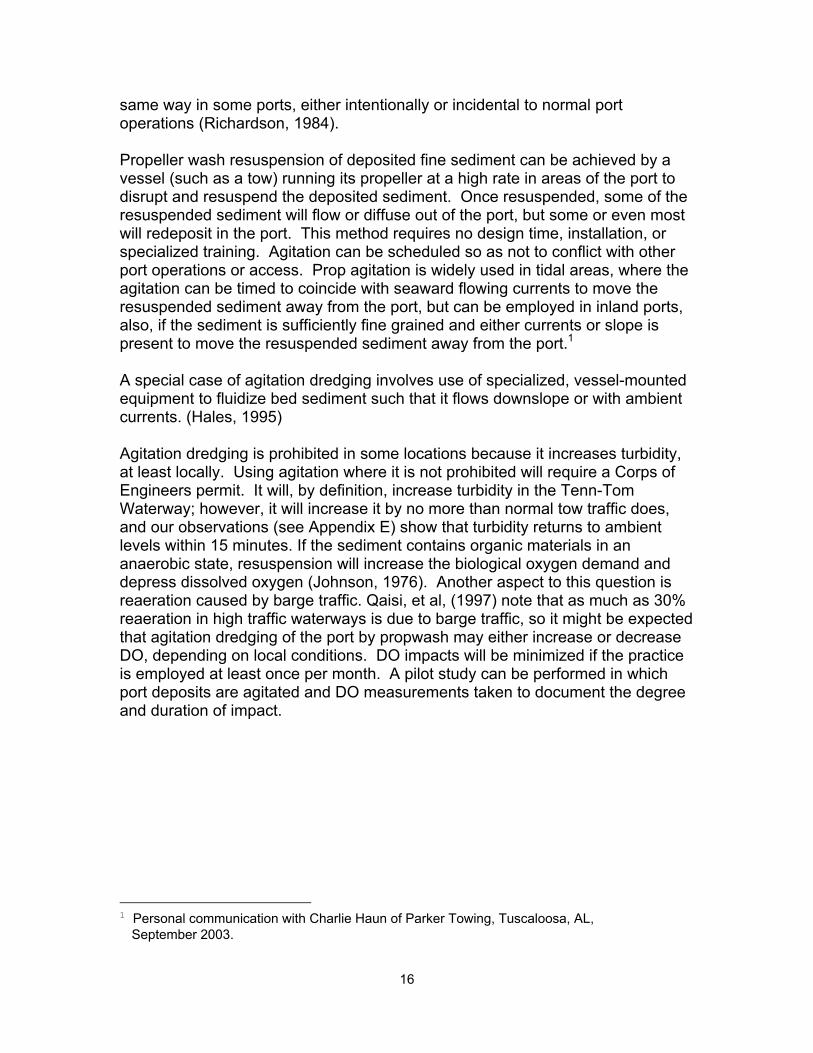
Pneumatic Barrier A pneumatic barrier, or bubble curtain, pumps compressed air through a submerged manifold. Bubbles rising from the manifold create a current that flows in toward the manifold at the bottom, upward toward the surface, and outward at the surface. As sediment particles approach the rising current they are carried upward away from the bed and toward the surface, then away from the bubbler. Figure 4-1 illustrates the flows resulting from operation of a pneumatic barrier in salinity-stratified flow, which will be similar to that caused by a turbidity flow. The two most common configurations of pneumatic barriers are in a line across the mouth of a basin or in clusters throughout the basin (e.g., Figure 5-3). In the line arrangement, the pneumatic barrier acts as a curtain across the mouth of the port to reduce the amount of depositing sediment in two ways. The rising current of air entrains water, creating an upward flow near the bubble curtain, an inward flow near the bottom, and an outward flow at the surface. This flow pattern carries suspended fine particles upward, and a portion is transported away from the barrier. The rising air bubbles act as a physical barrier limiting the passage of particles to the other side of the curtain, thus reducing the amount of sediment entering the protected area. Increased bottom currents near the curtain will also prevent close-by deposition of fine sediments. Although the pneumatic barrier does not prevent all sediment from passing through it and depositing, it is a potential tool in the reduction of sedimentation (e.g., Gray’s Harbor College, 1973). Pneumatic systems are typically composed of three parts: an onshore air compressor, supply line, and a diffuser system. It is advised that a steel pipe be used as the first reach of the supply line to dissipate heat generated by compression of air. The air exiting the compressor is extremely hot and should be cooled before entering the water to prevent artificial warming. The cluster arrangement consists of several bubblers throughout an area. This configuration does not attempt to prevent the entrance of sediment into the port. Its objective is to prevent the deposition of sediment. The layout of the clusters depends on the size of the port and the depth of the water. This method will not completely prevent the deposition of sediment, but has shown reduction in sediment accumulation (e.g., Chapman and Douglas, 2003). Installation of either pneumatic barrier arrangement will require port down time. Operation of the line pneumatic barrier could be continuous, but, depending on experience with the system, also could be activated only during tow passages in the waterway. Regular, periodic maintenance will be required of the compressor and the manifold.
17
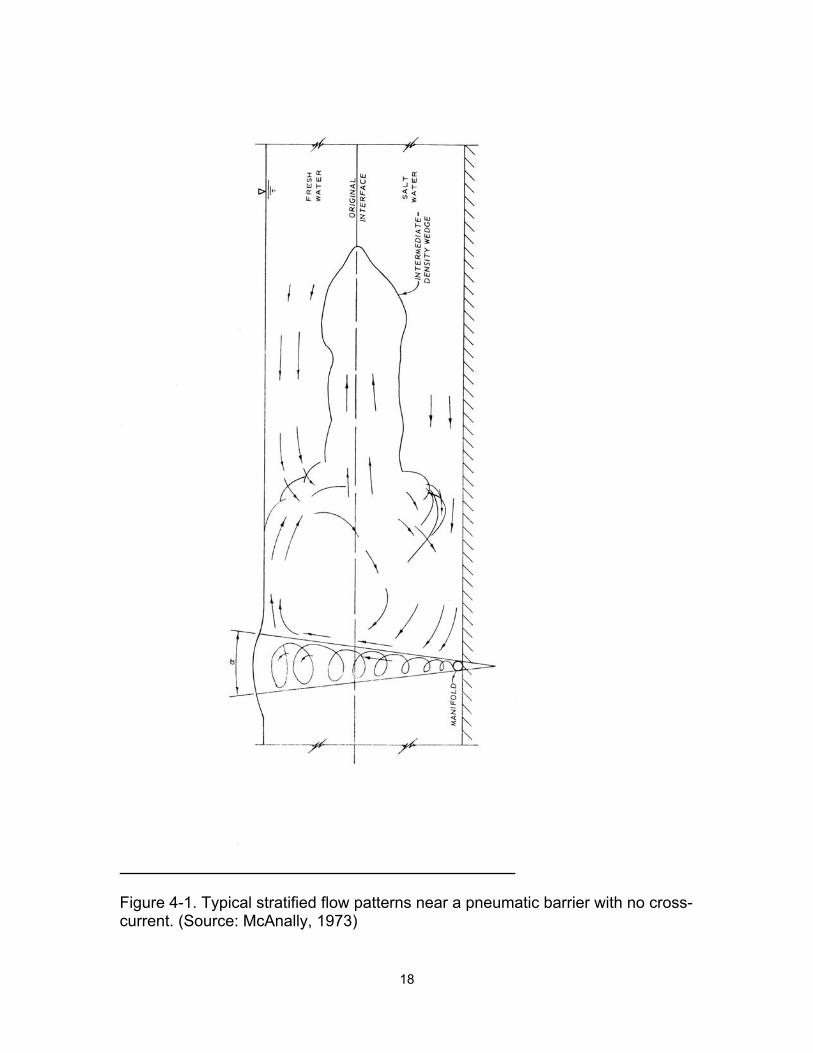
Figure 4-1. Typical stratified flow patterns near a pneumatic barrier with no cross-current. (Source: McAnally, 1973)
18
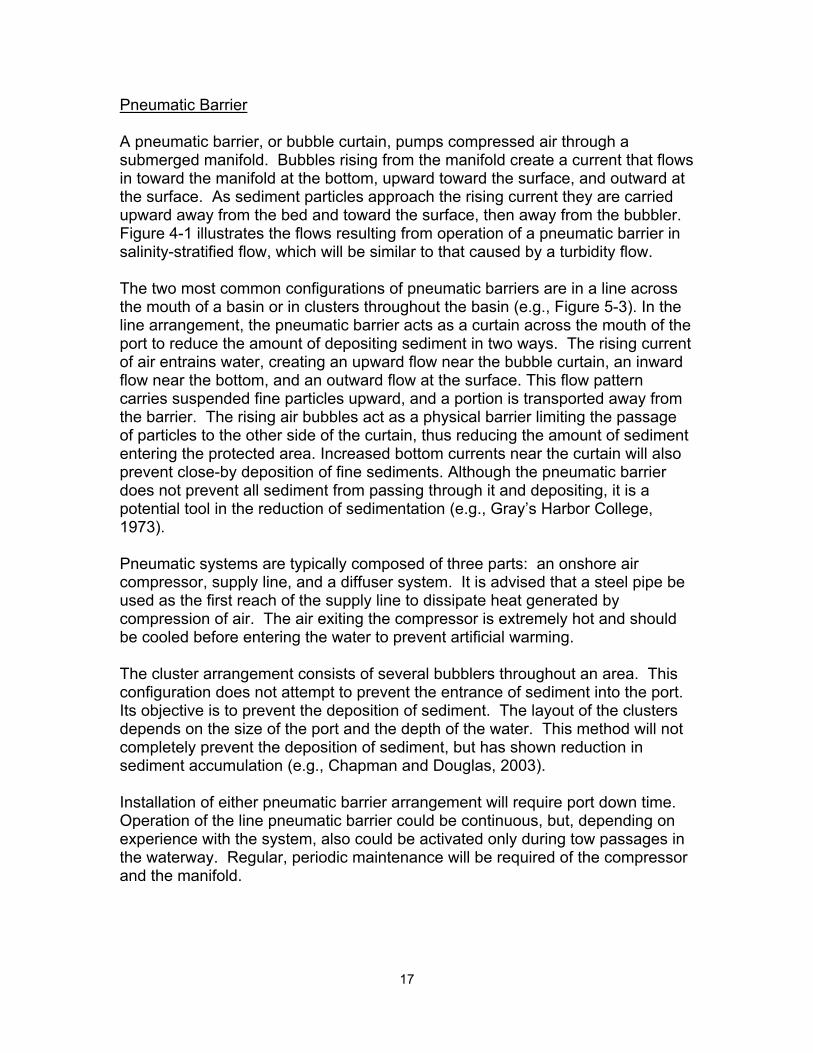
Silt Screen A silt screen, or silt curtain, a physical barrier that is opened only to allow the passage of vessels, provides positive control of sediment influx. Figures 4-2 and 4-3 illustrate a silt curtain that can be deployed to exclude sediment. It consists of a fabric curtain, weights along the bottom edge, floats along the top edge, and associated hardware. Silt screens are typically used to contain sediment plumes during dredging and disposal, as shown in Figure 4-3, but can be used to exclude sediment from a port (Van Dorn, et al., 1975) if port traffic or current conditions do not make it impractical. As it is a solid membrane, no sediment will pass through it into the port while in use; however, if there are gaps in the curtain, particularly at the bed, some sediment will get past. The primary drawback of the sediment curtain solution is that it will require special training and a work boat to open it for vessel passage it and may disrupt daily activities of the port.
Figure 4-2. Components of a Silt Curtain. (Source, Francinques, et al., 2002)
19
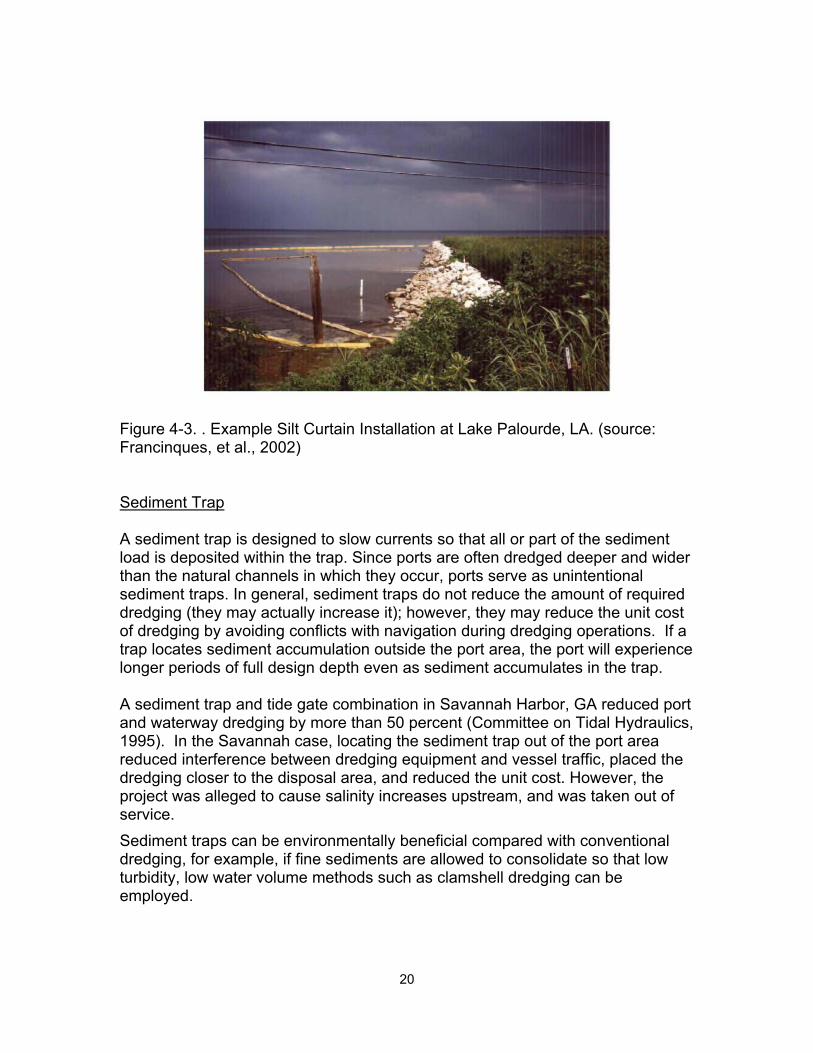
Figure 4-3. . Example Silt Curtain Installation at Lake Palourde, LA. (source: Francinques, et al., 2002) Sediment Trap A sediment trap is designed to slow currents so that all or part of the sediment load is deposited within the trap. Since ports are often dredged deeper and wider than the natural channels in which they occur, ports serve as unintentional sediment traps. In general, sediment traps do not reduce the amount of required dredging (they may actually increase it); however, they may reduce the unit cost of dredging by avoiding conflicts with navigation during dredging operations. If a trap locates sediment accumulation outside the port area, the port will experience longer periods of full design depth even as sediment accumulates in the trap. A sediment trap and tide gate combination in Savannah Harbor, GA reduced port and waterway dredging by more than 50 percent (Committee on Tidal Hydraulics, 1995). In the Savannah case, locating the sediment trap out of the port area reduced interference between dredging equipment and vessel traffic, placed the dredging closer to the disposal area, and reduced the unit cost. However, the project was alleged to cause salinity increases upstream, and was taken out of service. Sediment traps can be environmentally beneficial compared with conventional dredging, for example, if fine sediments are allowed to consolidate so that low turbidity, low water volume methods such as clamshell dredging can be employed.
20
A sediment trap can either be dredged at intervals or regularly pumped out. eductor-type pumps have been used for sediment removal in a number of locations, usually in sand environments (e.g., Richardson and McNair, 1981; McClellan and Hopman, 2000). In a mud environment they will tend to be made inoperative unless operated regularly, since consolidated mud will not flow toward the pump. Deposition in a trap can be moved to a piece of fixed dredging equipment by a fluidizing pipe – a perforated pipe through water is pumped to fluidize the bed and cause it to flow down the trench. Fluidizing pipes have been used in sand bed locations but should work in mud beds if operated before the mud consolidates (Van Dorn, 1975). Training Structures Training structures are used worldwide to keep sediment moving and prevent deposition. Numerous examples are described by Parchure and Teeter (2002). They include transverse training (spur) dikes that are used in many locations to train flow and prevent local deposition of sediment, as in the Red River, LA (Pinkard, 1995) and specialized training structures such as the Current Deflector Wall, a curved training structure that reduced sedimentation in Hamburg Harbor’s Kohlfleet basin by 40 percent (Smith et al., 2001). Unlike some solutions, training dikes can be constructed so as to confer positive habitat benefits based on studies by multiple agencies (U. S. Army Corps of Engineers, 2003; Byars, et al., 2000; Lower Mississippi River Conservation Committee, 2003; Kuhnle, et al., 2003; Stauffer, 1991; and Shields, et al., 1995) Transverse dikes have been found to be most effective when submerged during high flow events (Parchure and Teeter, 2002). Corps of Engineers’ guidelines (Biedenharn et al., 1997) and generally accepted principles for training structures call for a dike top elevation between low water level and bankful stage, long enough to constrict the channel cross section to covey the sediment load, and dike spacing about 3 to 5 times the dike length. Figure 4-4 illustrates a particular form of transverse training dikes, called Bendway Weirs, which have been used extensively in the Mississippi River (Parchure and Teeter, 2002). Dikes may be constructed of riprap (stone), piles, and/or geotubes (geotextile fabric tubes filled with dredged material. If constructed of riprap, the dikes may be made solely of stone or of earth or rubble fill covered with a riprap blanket. Geotubes covered with riprap have been used in training structures and dredged material containment dikes. Dikes may present a hazard to vessels, or they may prevent current conditions that adversely affect navigability. Dike placement can and must be designed with safe commercial and recreational traffic in mind.
21
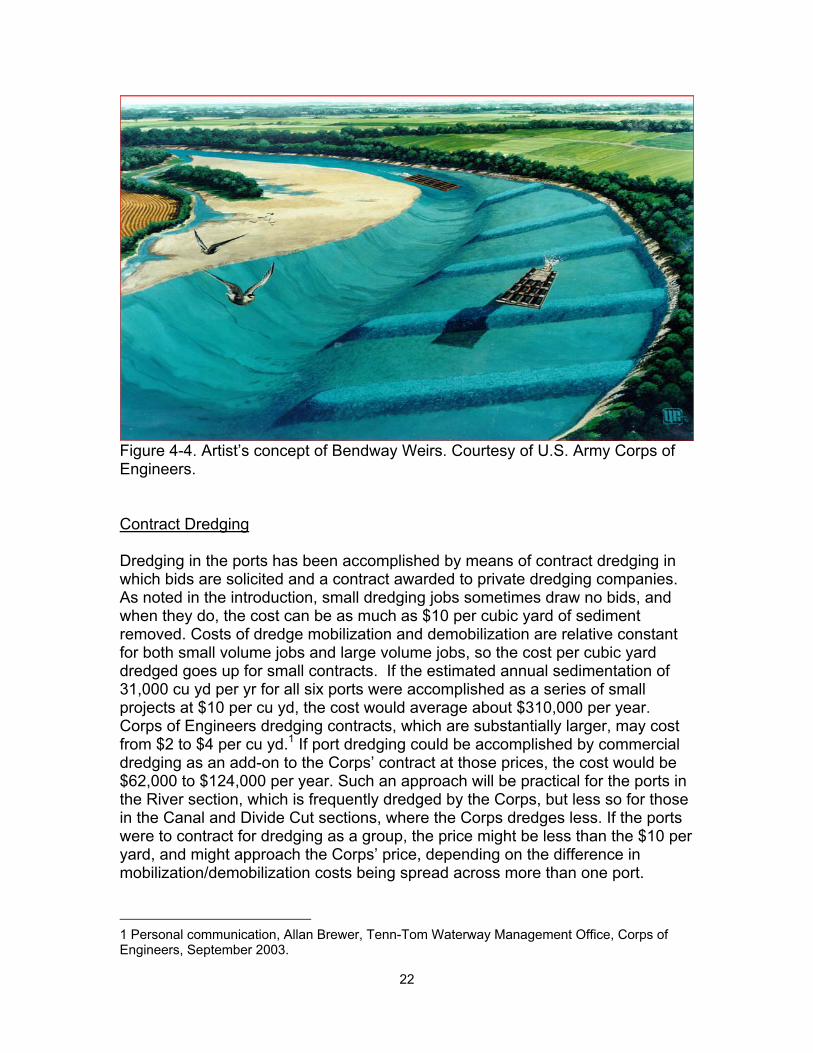
Figure 4-4. Artist’s concept of Bendway Weirs. Courtesy of U.S. Army Corps of Engineers. Contract Dredging Dredging in the ports has been accomplished by means of contract dredging in which bids are solicited and a contract awarded to private dredging companies. As noted in the introduction, small dredging jobs sometimes draw no bids, and when they do, the cost can be as much as $10 per cubic yard of sediment removed. Costs of dredge mobilization and demobilization are relative constant for both small volume jobs and large volume jobs, so the cost per cubic yard dredged goes up for small contracts. If the estimated annual sedimentation of 31,000 cu yd per yr for all six ports were accomplished as a series of small projects at $10 per cu yd, the cost would average about $310,000 per year. Corps of Engineers dredging contracts, which are substantially larger, may cost from $2 to $4 per cu yd.1 If port dredging could be accomplished by commercial dredging as an add-on to the Corps’ contract at those prices, the cost would be $62,000 to $124,000 per year. Such an approach will be practical for the ports in the River section, which is frequently dredged by the Corps, but less so for those in the Canal and Divide Cut sections, where the Corps dredges less. If the ports were to contract for dredging as a group, the price might be less than the $10 per yard, and might approach the Corps’ price, depending on the difference in mobilization/demobilization costs being spread across more than one port.
1 Personal communication, Allan Brewer, Tenn-Tom Waterway Management Office, Corps of Engineers, September 2003.
22
Purchase and Operation of a Dredge Local purchase and operation of a dredge for Tenn-Tom ports was examined by Seagren (2003) and is summarized here. A swinging ladder dredge with 8-inch suction and discharge lines plus 8,000 ft of 9.48 inch ID DR-17 high density polyethylene pipe and attendant accessories is capable of dredging at least 35,000 cu yd per year from the public ports on the Tenn-Tom and discharging dredged material up to 7,000 ft away from the port. It will also be capable of dredging at other locations on the waterway. . It is capable of producing about 100 cu yd per hr. The total dredging time to dredge and dispose of required annual sedimentation in all six ports is estimated to be 48 days, to which must be added time for mobilization, demobilization, and movement from one site to the next. A dredge tender workboat is required for transporting personnel, re-fueling, assisting in pipeline placement across water, dredge maintenance, and tool storage. The recommended workboat is 25-ft-long with a 180 hp engine, an A-frame hoist with 2000 lb capacity, push knees, and hand winches. Other equipment needed intermittently includes a stake-body truck capable of hauling 50-ft-long pipe sections and a small cherry picker. The recommended dredge can be moved on the waterway by commercial tug or can be lifted out and trucked to a new site. Its weight out of the water is estimated to be 70,000 lbs. Purchase and delivery cost of the dredge and equipment (not including workboat) is estimated to be about $550,000. Estimated cost of the workboat is $65,000. For 5 years of 2000 hours per year, the cost to own the dredge (including depreciation, insurance, and interest) is estimated to be $71 per hour. Five persons can operate the dredge and workboat and manage the disposal operation. The workboat operator must have a commercial license and the dredge operator must be a skilled dredge leverman. The other three workers can be cross-trained from other positions commonly employed by local governments. Operating costs will include personnel costs of about $200 per hour, fuel, lubricants, and repairs for an estimated total of $229 per hour, or about $458,000 per year. At the estimated costs above, the cost to own and operate the dredge will be about $300 per hour for 2000 hours of operation per year. Dredging the volumes shown in Table 3-3 would require 40 to 50 hours per year plus mobilization/demobilization at each port. Allowing for 12 weeks of mobilization/demobilization per year leaves 30 to 40 weeks per year that the dredge would be available for contract dredging, providing an income to offset
23

the costs of ownership. Whether a sufficient market exists for that is beyond the scope of this report, but can be determined through a market survey of private terminals on the waterway and assessment of Corps of Engineers interest in dredge rental for smaller volume shoals not included in the main Corps’ dredging contract. Dredge ownership and operation is an expensive option, but offers some advantages beyond the sale of dredging services. For example, having a dedicated dredge on hand means that port dredging can be accomplished when needed, without delays inherent in the bidding process, and port depths can be maintained at or near design depths at all times.
24
5. YELLOW CREEK PORT
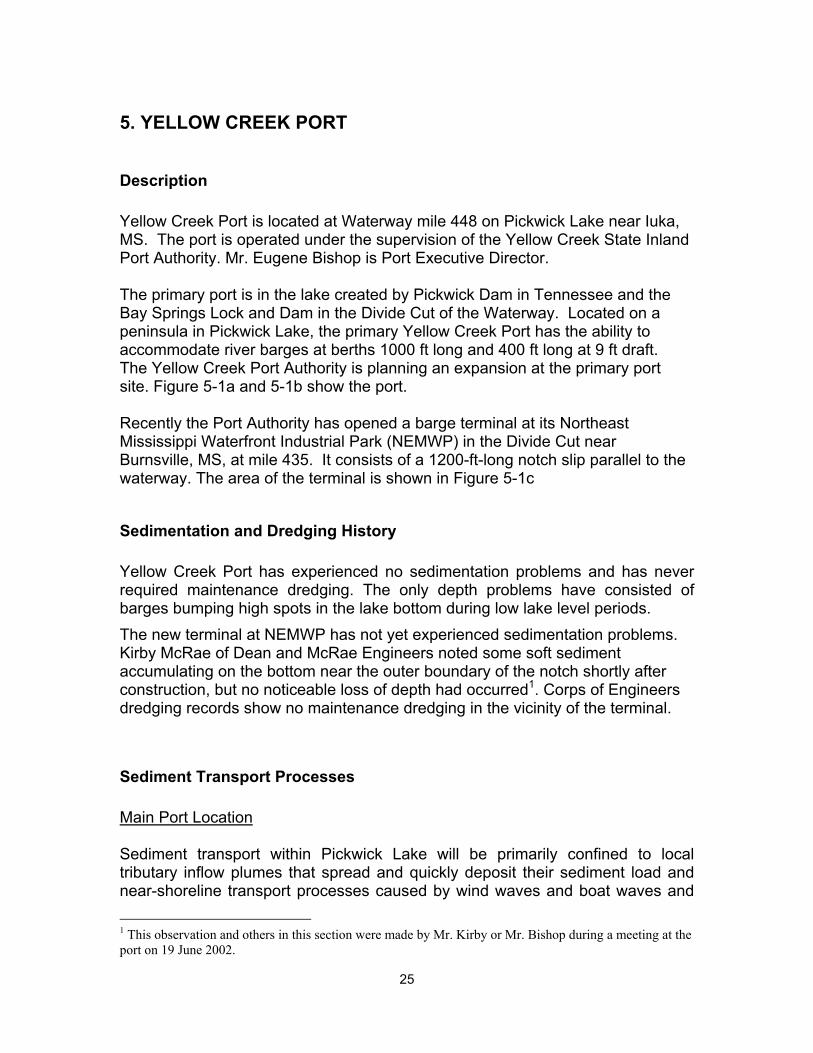
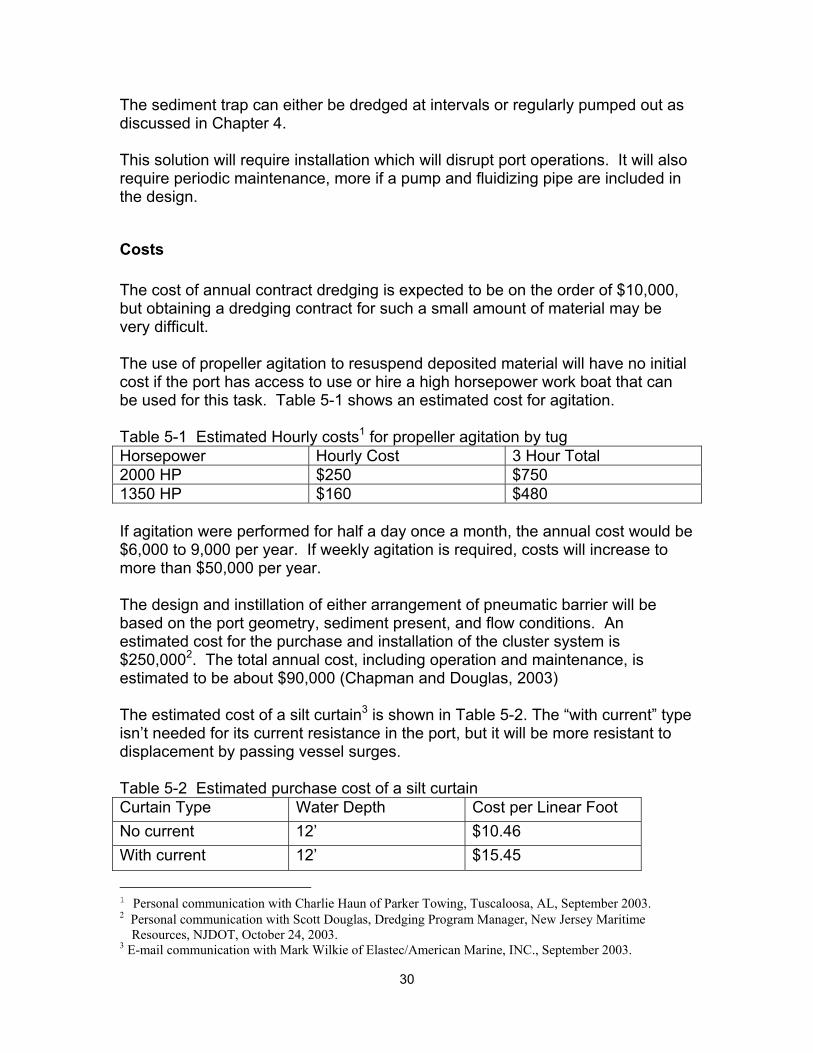
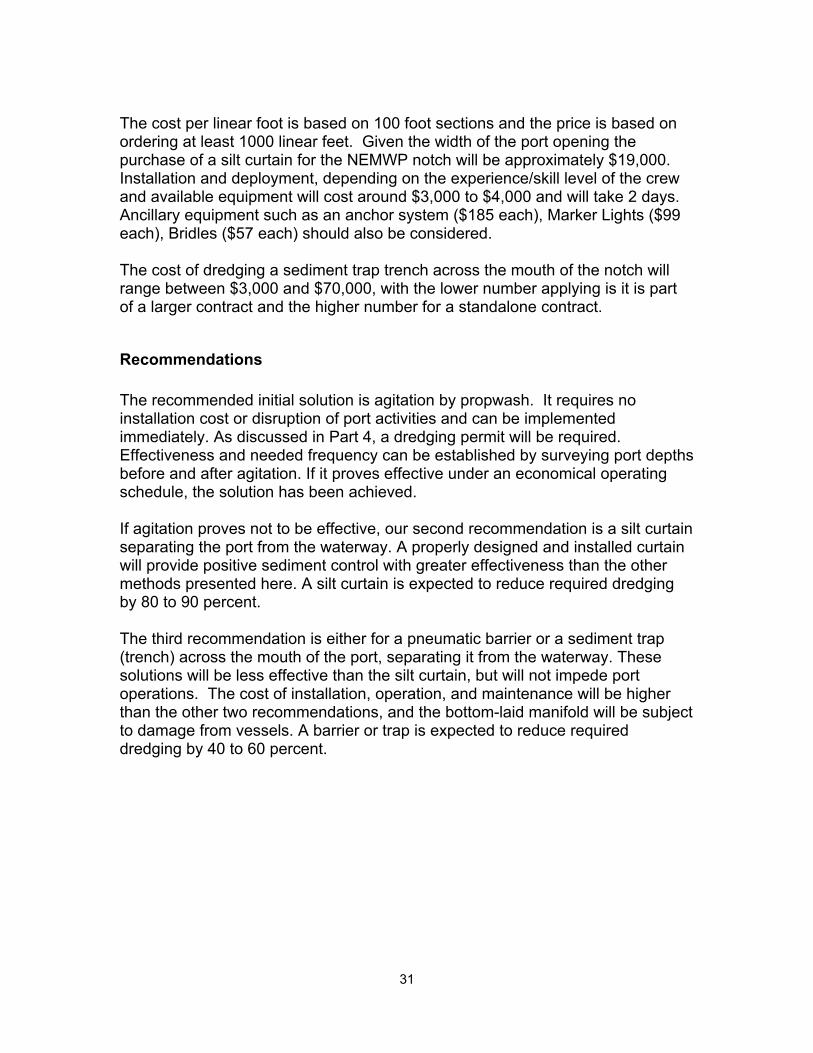
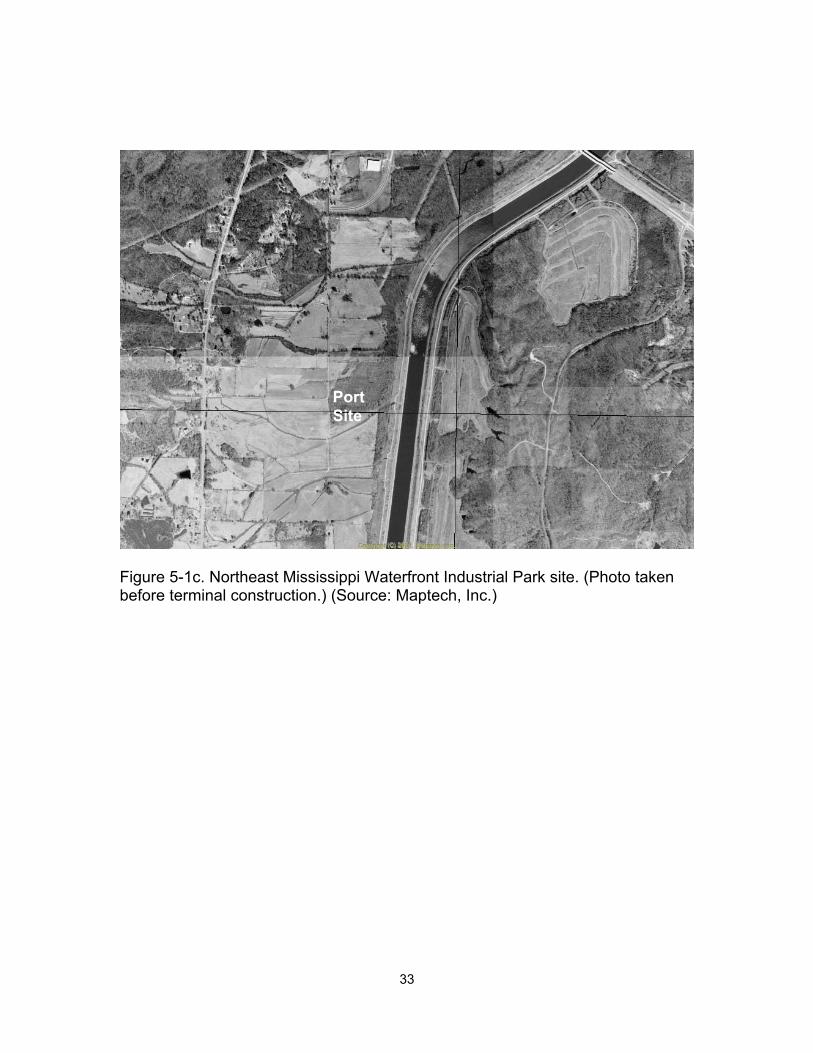
Description Yellow Creek Port is located at Waterway mile 448 on Pickwick Lake near Iuka, MS. The port is operated under the supervision of the Yellow Creek State Inland Port Authority. Mr. Eugene Bishop is Port Executive Director. The primary port is in the lake created by Pickwick Dam in Tennessee and the Bay Springs Lock and Dam in the Divide Cut of the Waterway. Located on a peninsula in Pickwick Lake, the primary Yellow Creek Port has the ability to accommodate river barges at berths 1000 ft long and 400 ft long at 9 ft draft. The Yellow Creek Port Authority is planning an expansion at the primary port site. Figure 5-1a and 5-1b show the port. Recently the Port Authority has opened a barge terminal at its Northeast Mississippi Waterfront Industrial Park (NEMWP) in the Divide Cut near Burnsville, MS, at mile 435. It consists of a 1200-ft-long notch slip parallel to the waterway. The area of the terminal is shown in Figure 5-1c
Sedimentation and Dredging History Yellow Creek Port has experienced no sedimentation problems and has never required maintenance dredging. The only depth problems have consisted of barges bumping high spots in the lake bottom during low lake level periods. The new terminal at NEMWP has not yet experienced sedimentation problems. Kirby McRae of Dean and McRae Engineers noted some soft sediment accumulating on the bottom near the outer boundary of the notch shortly after construction, but no noticeable loss of depth had occurred1. Corps of Engineers dredging records show no maintenance dredging in the vicinity of the terminal.
Sediment Transport Processes Main Port Location Sediment transport within Pickwick Lake will be primarily confined to local tributary inflow plumes that spread and quickly deposit their sediment load and near-shoreline transport processes caused by wind waves and boat waves and
1 This observation and others in this section were made by Mr. Kirby or Mr. Bishop during a meeting at the port on 19 June 2002.
25
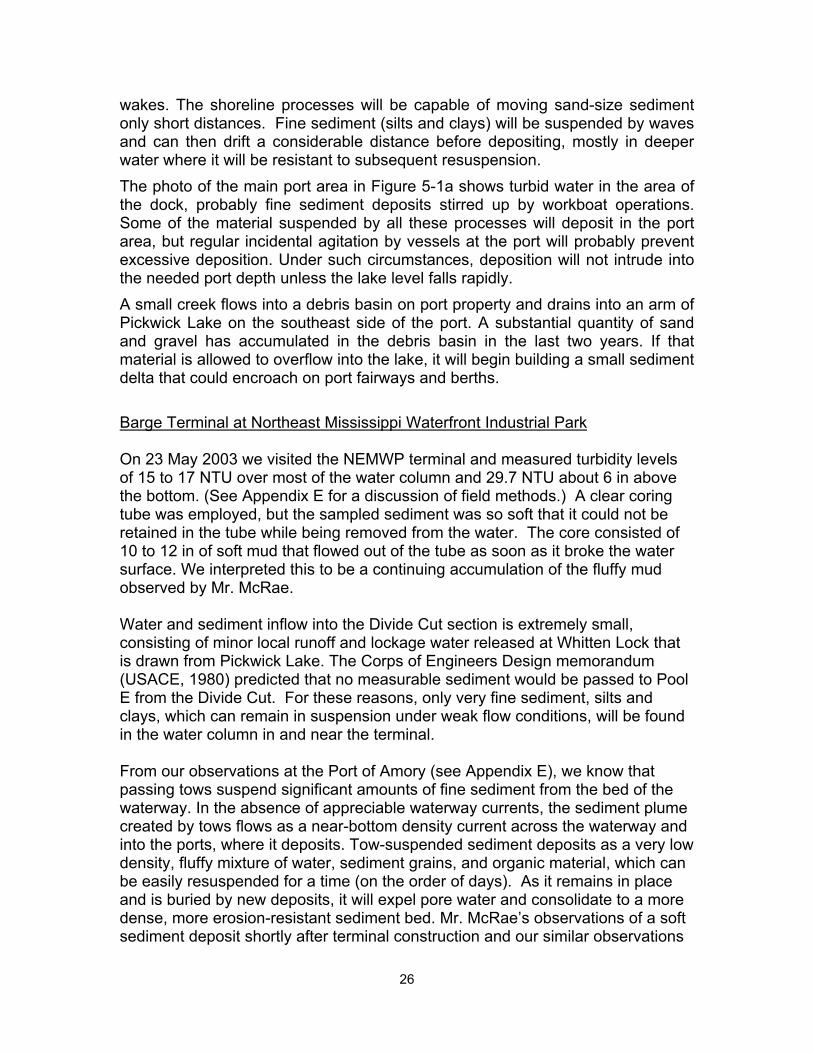
wakes. The shoreline processes will be capable of moving sand-size sediment only short distances. Fine sediment (silts and clays) will be suspended by waves and can then drift a considerable distance before depositing, mostly in deeper water where it will be resistant to subsequent resuspension. The photo of the main port area in Figure 5-1a shows turbid water in the area of the dock, probably fine sediment deposits stirred up by workboat operations. Some of the material suspended by all these processes will deposit in the port area, but regular incidental agitation by vessels at the port will probably prevent excessive deposition. Under such circumstances, deposition will not intrude into the needed port depth unless the lake level falls rapidly. A small creek flows into a debris basin on port property and drains into an arm of Pickwick Lake on the southeast side of the port. A substantial quantity of sand and gravel has accumulated in the debris basin in the last two years. If that material is allowed to overflow into the lake, it will begin building a small sediment delta that could encroach on port fairways and berths. Barge Terminal at Northeast Mississippi Waterfront Industrial Park On 23 May 2003 we visited the NEMWP terminal and measured turbidity levels of 15 to 17 NTU over most of the water column and 29.7 NTU about 6 in above the bottom. (See Appendix E for a discussion of field methods.) A clear coring tube was employed, but the sampled sediment was so soft that it could not be retained in the tube while being removed from the water. The core consisted of 10 to 12 in of soft mud that flowed out of the tube as soon as it broke the water surface. We interpreted this to be a continuing accumulation of the fluffy mud observed by Mr. McRae. Water and sediment inflow into the Divide Cut section is extremely small, consisting of minor local runoff and lockage water released at Whitten Lock that is drawn from Pickwick Lake. The Corps of Engineers Design memorandum (USACE, 1980) predicted that no measurable sediment would be passed to Pool E from the Divide Cut. For these reasons, only very fine sediment, silts and clays, which can remain in suspension under weak flow conditions, will be found in the water column in and near the terminal. From our observations at the Port of Amory (see Appendix E), we know that passing tows suspend significant amounts of fine sediment from the bed of the waterway. In the absence of appreciable waterway currents, the sediment plume created by tows flows as a near-bottom density current across the waterway and into the ports, where it deposits. Tow-suspended sediment deposits as a very low density, fluffy mixture of water, sediment grains, and organic material, which can be easily resuspended for a time (on the order of days). As it remains in place and is buried by new deposits, it will expel pore water and consolidate to a more dense, more erosion-resistant sediment bed. Mr. McRae’s observations of a soft sediment deposit shortly after terminal construction and our similar observations
26
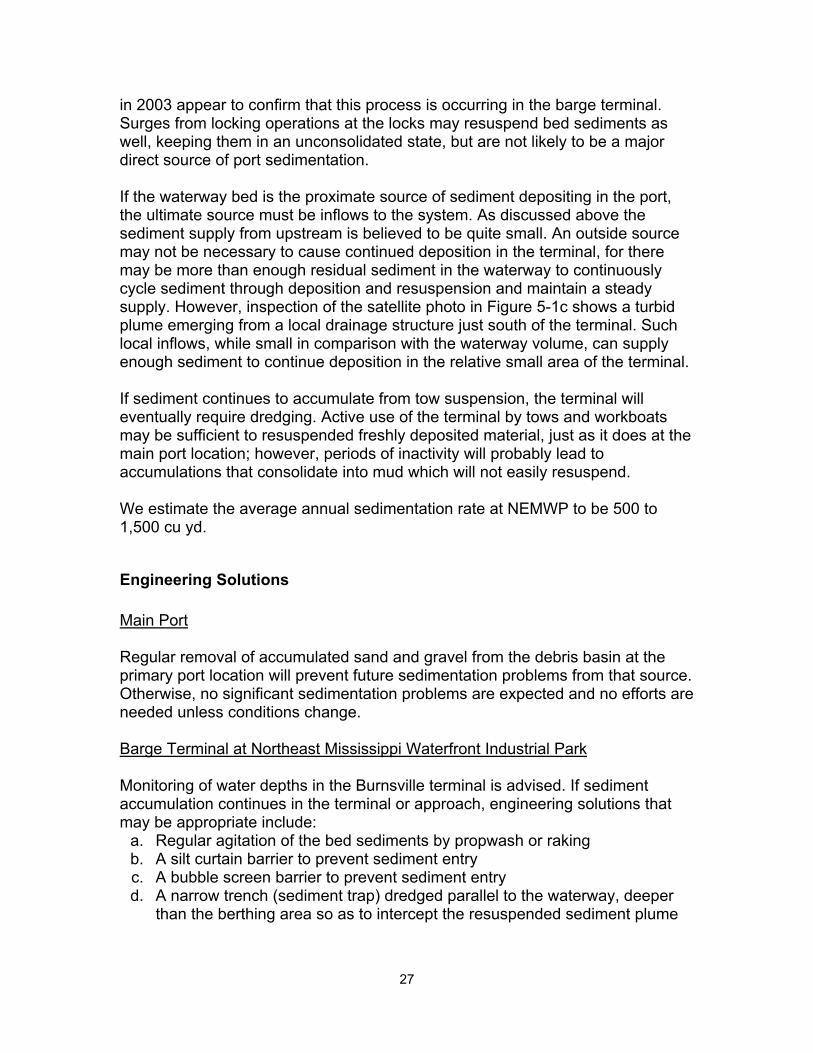
in 2003 appear to confirm that this process is occurring in the barge terminal. Surges from locking operations at the locks may resuspend bed sediments as well, keeping them in an unconsolidated state, but are not likely to be a major direct source of port sedimentation. If the waterway bed is the proximate source of sediment depositing in the port, the ultimate source must be inflows to the system. As discussed above the sediment supply from upstream is believed to be quite small. An outside source may not be necessary to cause continued deposition in the terminal, for there may be more than enough residual sediment in the waterway to continuously cycle sediment through deposition and resuspension and maintain a steady supply. However, inspection of the satellite photo in Figure 5-1c shows a turbid plume emerging from a local drainage structure just south of the terminal. Such local inflows, while small in comparison with the waterway volume, can supply enough sediment to continue deposition in the relative small area of the terminal. If sediment continues to accumulate from tow suspension, the terminal will eventually require dredging. Active use of the terminal by tows and workboats may be sufficient to resuspended freshly deposited material, just as it does at the main port location; however, periods of inactivity will probably lead to accumulations that consolidate into mud which will not easily resuspend. We estimate the average annual sedimentation rate at NEMWP to be 500 to 1,500 cu yd.
Engineering Solutions Main Port Regular removal of accumulated sand and gravel from the debris basin at the primary port location will prevent future sedimentation problems from that source. Otherwise, no significant sedimentation problems are expected and no efforts are needed unless conditions change. Barge Terminal at Northeast Mississippi Waterfront Industrial Park Monitoring of water depths in the Burnsville terminal is advised. If sediment accumulation continues in the terminal or approach, engineering solutions that may be appropriate include:
a. Regular agitation of the bed sediments by propwash or raking b. A silt curtain barrier to prevent sediment entry c. A bubble screen barrier to prevent sediment entry d. A narrow trench (sediment trap) dredged parallel to the waterway, deeper
than the berthing area so as to intercept the resuspended sediment plume
27

Approach (a) requires no installation or disruption of port activities and can be implemented immediately. However, as discussed in Chapter 4, it may not provide as complete a remedy as desired. Approach (b) requires installation, operation, and maintenance, plus disruption of port routines. As vessels approach the port, the curtain will have to be opened for their passage and perhaps closed behind them. It will provide the most positive control over sedimentation, since a close-fitting curtain will form an effective barrier against most tow-induced sedimentation. Approach (c) also requires installation, operation, and maintenance, plus disruption of port routines, but will not disrupt port operations for opening and closing as a silt curtain does. Approach (d) will require initial dredging and maintenance, both of which may disrupt port routines. As the sediment plume approaches the port and encounters the trench, a portion of the plume will be captured by the trench. Additional details of these solutions are given below.
Designs Chapter 4 of this report provides general information on the solutions described here. Resuspension of the deposited material can be achieved by propeller agitation. This method requires no design time, installation, or specialized training and can be scheduled so as not to conflict with other port operations or access. The lack of ambient currents means that some of the sediment will simply redeposit in the port, but some will travel out of the port in a density flow, the same way it moves in. Combining agitation with bubble curtains (below) will further increase effectiveness. A pneumatic barrier, or bubble curtain, pumps compressed air through a submerged manifold. Bubbles rising from the manifold create a current that flows in toward the manifold at the bottom, upward toward the surface, and outward at the surface. As sediment particles approach the rising current they are carried upward away from the bed and toward the surface, then away from the bubbler. The two most common configurations of pneumatic barriers are in a line across the mouth of the notch (Figure 5-2) or in clusters throughout the area. In the line arrangement, the pneumatic barrier will act as a curtain across the mouth of the port to reduce the amount of depositing sediment in two ways. The rising current of air entrains water, creating an upward flow near the bubble curtain, an inward flow near the bottom, and an outward flow at the surface. This
28
flow pattern carries suspended fine particles upward, and a portion is transported out away from the port and into the main channel area. The rising air bubbles act as a physical barrier limiting the passage of particles to the other side of the curtain thus reducing the amount of sediment entering the port. Increased bottom currents near the curtain will also prevent close-by deposition of fine sediments. A barrier across the notch will require a total of 1200 ft of perforated pipe supplied by at least two compressors. Installation of either pneumatic barrier arrangement will require port down time. Operation of the line pneumatic barrier could be continuous, but, depending on experience with the system, also could be activated only during tow passages in the waterway. Regular, periodic maintenance will be required of the compressor and the manifold. The prospective solution that will prevent virtually all sediment from entering the port is a silt curtain, a physical barrier that is opened only to allow the passage of vessels. Figures 4-2 and 4-3 illustrate a silt curtain that can be deployed across the mouth of both the notch and basin to exclude sediment. As it is a solid membrane, no sediment will pass through it into the port while in use; however, if there are gaps in the curtain, particularly at the bed, some sediment will get past. The primary drawback of the sediment curtain solution is that it will require special training and a work boat to open it for vessel passage it and may disrupt daily activities of the port. Installation and maintenance will also cause periodic disruption of vessel traffic into and out of the port. A single 1200-ft-long curtain will protect the notch. The curtain fabric should be a reinforced PVC (or equivalent) material. Given the low flow conditions, the minimum fabric weight should be 13 oz/sq yd. The fabric surface should be easy cleaning and resistant to marine growth, ultraviolet light, and mildew with all fabric seams heat sealed. Flotation sections should have a maximum length no greater than 10 feet for ease of storage. Due to the negligible current conditions no additional tensioning members, other than the fabric itself, are necessary.1 Figure 5-3 illustrates a sediment trap design in the form of an interceptor trench across the mouth of the basin. Sizing of a trench to optimally intercept the sediment plume will require detailed analysis. For purposes of this report we have assumed a trench of depth and width equal to the height of the sediment plume. As the sediment plume advances across the waterway bed, it will flow into the trench which will slow, if not stop, its advance. Sediment depositing in the trench will settle and eventually consolidate, keeping it from returning to the water column, but requiring eventually requiring maintenance dredging. Creating a sloped (i.e., stepped) bottom in the trench can direct the plume to another sediment trap/sump, where it can be dredged or pumped out, reducing the frequency of dredging the trench. 1 Specifications from Elastec/American Marine, INC. web-site (www.turbiditycurtains.com) accessed 17 October, 2003.
29
The sediment trap can either be dredged at intervals or regularly pumped out as discussed in Chapter 4. This solution will require installation which will disrupt port operations. It will also require periodic maintenance, more if a pump and fluidizing pipe are included in the design.
Costs The cost of annual contract dredging is expected to be on the order of $10,000, but obtaining a dredging contract for such a small amount of material may be very difficult. The use of propeller agitation to resuspend deposited material will have no initial cost if the port has access to use or hire a high horsepower work boat that can be used for this task. Table 5-1 shows an estimated cost for agitation. Table 5-1 Estimated Hourly costs1 for propeller agitation by tug Horsepower Hourly Cost 3 Hour Total 2000 HP $250 $750 1350 HP $160 $480 If agitation were performed for half a day once a month, the annual cost would be $6,000 to 9,000 per year. If weekly agitation is required, costs will increase to more than $50,000 per year. The design and instillation of either arrangement of pneumatic barrier will be based on the port geometry, sediment present, and flow conditions. An estimated cost for the purchase and installation of the cluster system is $250,0002. The total annual cost, including operation and maintenance, is estimated to be about $90,000 (Chapman and Douglas, 2003) The estimated cost of a silt curtain3 is shown in Table 5-2. The “with current” type isn’t needed for its current resistance in the port, but it will be more resistant to displacement by passing vessel surges. Table 5-2 Estimated purchase cost of a silt curtain Curtain Type Water Depth Cost per Linear Foot No current 12’ $10.46 With current 12’ $15.45
1 Personal communication with Charlie Haun of Parker Towing, Tuscaloosa, AL, September 2003. 2 Personal communication with Scott Douglas, Dredging Program Manager, New Jersey Maritime
Resources, NJDOT, October 24, 2003. 3 E-mail communication with Mark Wilkie of Elastec/American Marine, INC., September 2003.
30
The cost per linear foot is based on 100 foot sections and the price is based on ordering at least 1000 linear feet. Given the width of the port opening the purchase of a silt curtain for the NEMWP notch will be approximately $19,000. Installation and deployment, depending on the experience/skill level of the crew and available equipment will cost around $3,000 to $4,000 and will take 2 days. Ancillary equipment such as an anchor system ($185 each), Marker Lights ($99 each), Bridles ($57 each) should also be considered. The cost of dredging a sediment trap trench across the mouth of the notch will range between $3,000 and $70,000, with the lower number applying is it is part of a larger contract and the higher number for a standalone contract.
Recommendations The recommended initial solution is agitation by propwash. It requires no installation cost or disruption of port activities and can be implemented immediately. As discussed in Part 4, a dredging permit will be required. Effectiveness and needed frequency can be established by surveying port depths before and after agitation. If it proves effective under an economical operating schedule, the solution has been achieved. If agitation proves not to be effective, our second recommendation is a silt curtain separating the port from the waterway. A properly designed and installed curtain will provide positive sediment control with greater effectiveness than the other methods presented here. A silt curtain is expected to reduce required dredging by 80 to 90 percent. The third recommendation is either for a pneumatic barrier or a sediment trap (trench) across the mouth of the port, separating it from the waterway. These solutions will be less effective than the silt curtain, but will not impede port operations. The cost of installation, operation, and maintenance will be higher than the other two recommendations, and the bottom-laid manifold will be subject to damage from vessels. A barrier or trap is expected to reduce required dredging by 40 to 60 percent.
31
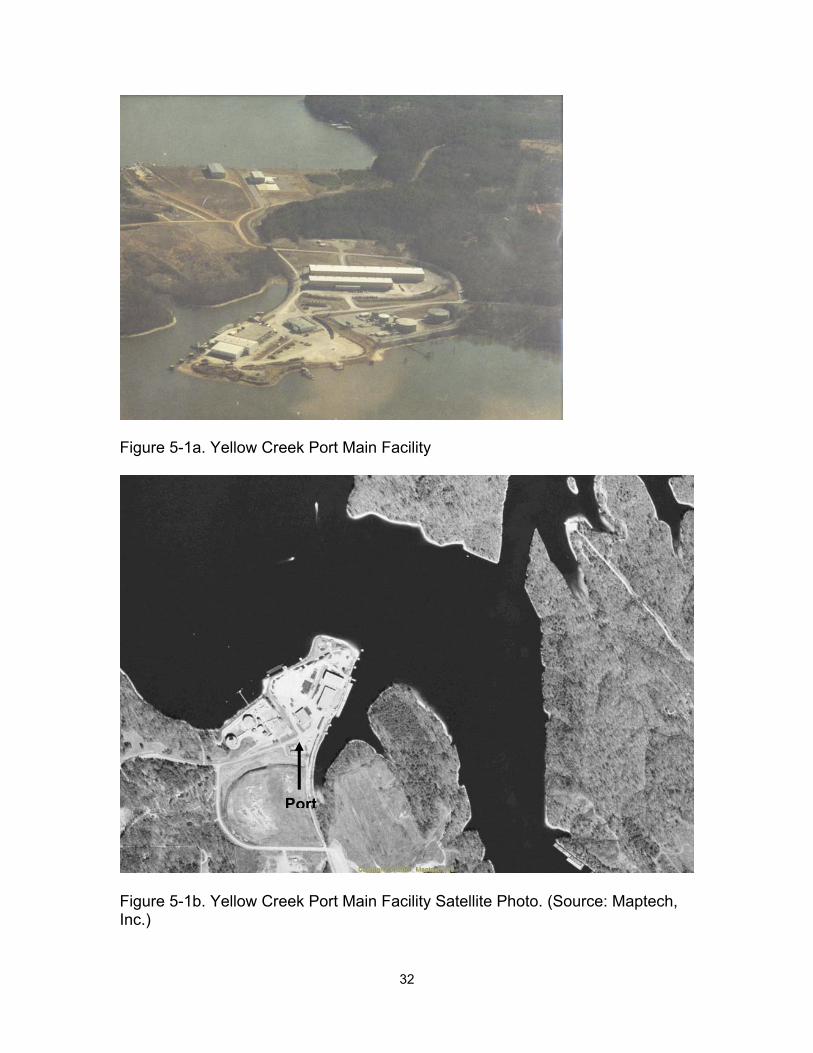
Figure 5-1a. Yellow Creek Port Main Facility
t
Figure 5-1b. Yellow CrInc.)
Por
eek Port Main Facility Satellite Photo. (Source: Maptech,
32
Port Site
Figure 5-1c. Northeast Mississippi Waterfront Industrial Park site. (Photo taken before terminal construction.) (Source: Maptech, Inc.)
33
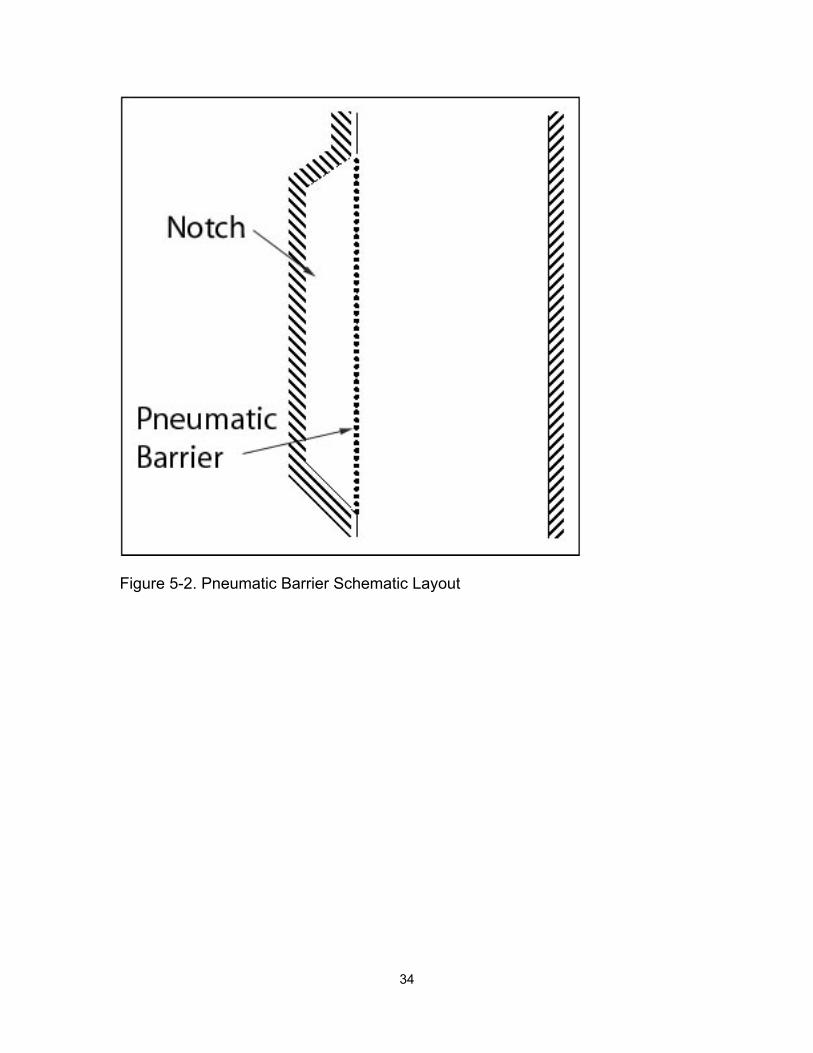
Figure 5-2. Pneumatic Barrier Schematic Layout
34
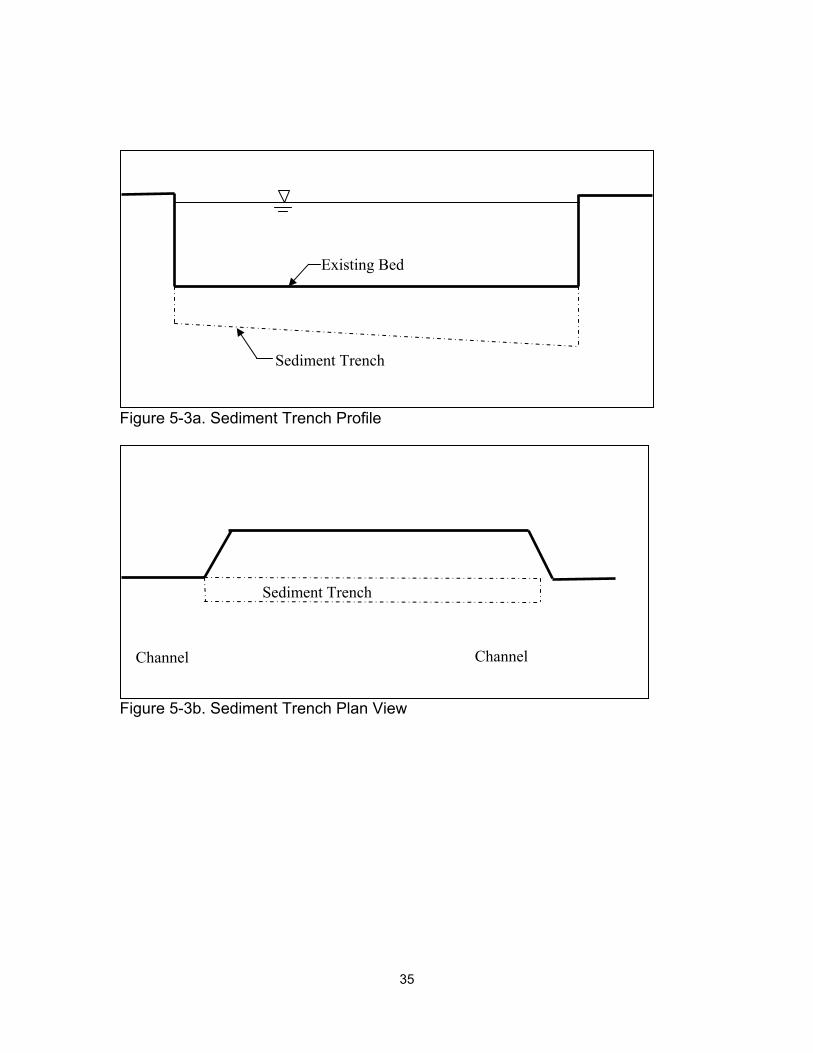
Existing Bed
Sediment Trench
Figure 5-3a. Sediment Trench Profile
Sediment Trench
ChannelChannel
Figure 5-3b. Sediment Trench Plan View
35
6. PORT ITAWAMBA
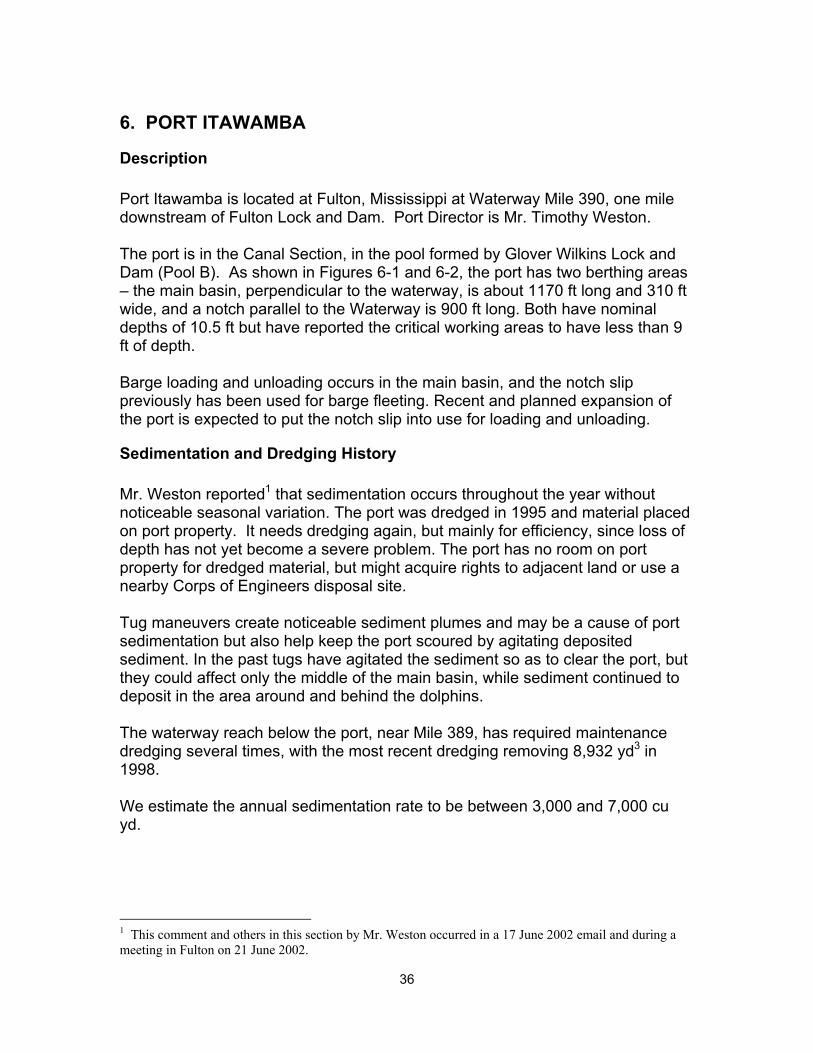
Description Port Itawamba is located at Fulton, Mississippi at Waterway Mile 390, one mile downstream of Fulton Lock and Dam. Port Director is Mr. Timothy Weston. The port is in the Canal Section, in the pool formed by Glover Wilkins Lock and Dam (Pool B). As shown in Figures 6-1 and 6-2, the port has two berthing areas – the main basin, perpendicular to the waterway, is about 1170 ft long and 310 ft wide, and a notch parallel to the Waterway is 900 ft long. Both have nominal depths of 10.5 ft but have reported the critical working areas to have less than 9 ft of depth. Barge loading and unloading occurs in the main basin, and the notch slip previously has been used for barge fleeting. Recent and planned expansion of the port is expected to put the notch slip into use for loading and unloading.
Sedimentation and Dredging History Mr. Weston reported1 that sedimentation occurs throughout the year without noticeable seasonal variation. The port was dredged in 1995 and material placed on port property. It needs dredging again, but mainly for efficiency, since loss of depth has not yet become a severe problem. The port has no room on port property for dredged material, but might acquire rights to adjacent land or use a nearby Corps of Engineers disposal site. Tug maneuvers create noticeable sediment plumes and may be a cause of port sedimentation but also help keep the port scoured by agitating deposited sediment. In the past tugs have agitated the sediment so as to clear the port, but they could affect only the middle of the main basin, while sediment continued to deposit in the area around and behind the dolphins. The waterway reach below the port, near Mile 389, has required maintenance dredging several times, with the most recent dredging removing 8,932 yd3 in 1998. We estimate the annual sedimentation rate to be between 3,000 and 7,000 cu yd.
1 This comment and others in this section by Mr. Weston occurred in a 17 June 2002 email and during a meeting in Fulton on 21 June 2002.
36
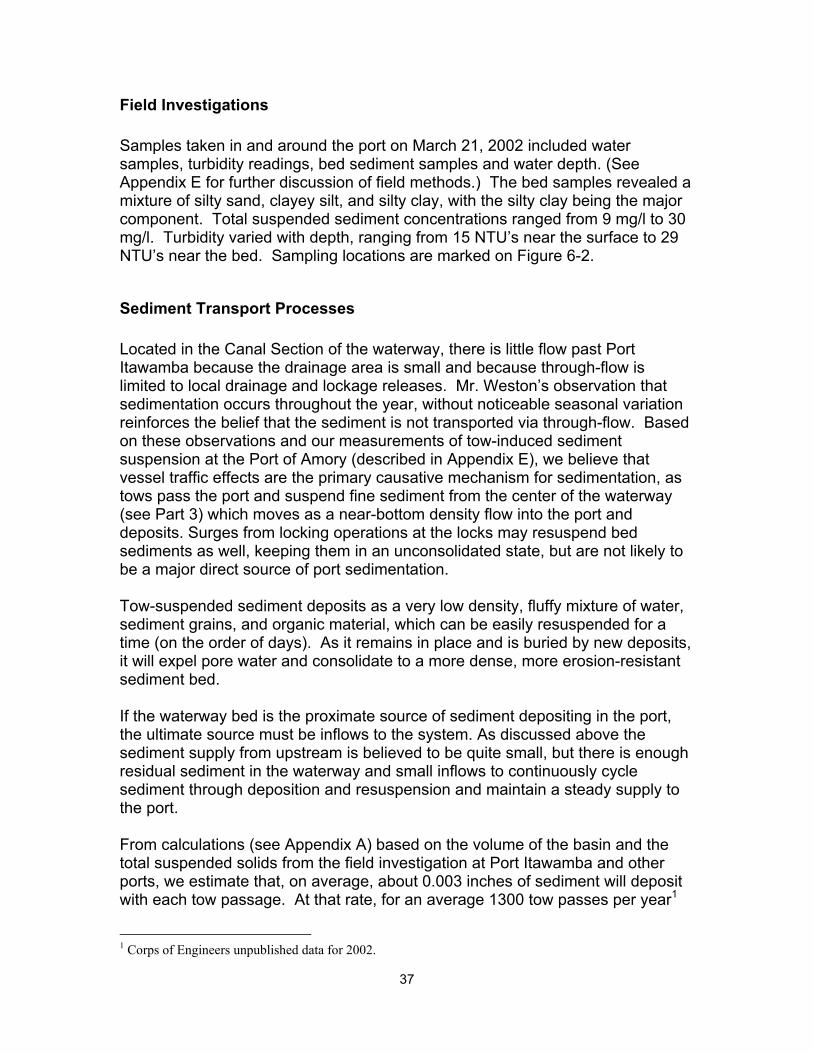
Field Investigations Samples taken in and around the port on March 21, 2002 included water samples, turbidity readings, bed sediment samples and water depth. (See Appendix E for further discussion of field methods.) The bed samples revealed a mixture of silty sand, clayey silt, and silty clay, with the silty clay being the major component. Total suspended sediment concentrations ranged from 9 mg/l to 30 mg/l. Turbidity varied with depth, ranging from 15 NTU’s near the surface to 29 NTU’s near the bed. Sampling locations are marked on Figure 6-2.
Sediment Transport Processes Located in the Canal Section of the waterway, there is little flow past Port Itawamba because the drainage area is small and because through-flow is limited to local drainage and lockage releases. Mr. Weston’s observation that sedimentation occurs throughout the year, without noticeable seasonal variation reinforces the belief that the sediment is not transported via through-flow. Based on these observations and our measurements of tow-induced sediment suspension at the Port of Amory (described in Appendix E), we believe that vessel traffic effects are the primary causative mechanism for sedimentation, as tows pass the port and suspend fine sediment from the center of the waterway (see Part 3) which moves as a near-bottom density flow into the port and deposits. Surges from locking operations at the locks may resuspend bed sediments as well, keeping them in an unconsolidated state, but are not likely to be a major direct source of port sedimentation. Tow-suspended sediment deposits as a very low density, fluffy mixture of water, sediment grains, and organic material, which can be easily resuspended for a time (on the order of days). As it remains in place and is buried by new deposits, it will expel pore water and consolidate to a more dense, more erosion-resistant sediment bed. If the waterway bed is the proximate source of sediment depositing in the port, the ultimate source must be inflows to the system. As discussed above the sediment supply from upstream is believed to be quite small, but there is enough residual sediment in the waterway and small inflows to continuously cycle sediment through deposition and resuspension and maintain a steady supply to the port. From calculations (see Appendix A) based on the volume of the basin and the total suspended solids from the field investigation at Port Itawamba and other ports, we estimate that, on average, about 0.003 inches of sediment will deposit with each tow passage. At that rate, for an average 1300 tow passes per year1
1 Corps of Engineers unpublished data for 2002.
37
an average of more than 4 inches of sediment will deposit in a year. That sediment will be redistributed by tug operations within the port so that some locations experience no net sedimentation and other locations, such as corners, accumulate more than 4 inches per year.
Engineering Solutions If transport from vessel resuspension is the only substantial source of shoaling material, then several approaches may reduce port sedimentation. Four of the possible solutions considered technically most feasible are:
a. Resuspend the deposited material by propeller agitation b. Use a pneumatic bubbler to limit the amount of sediment entering the port
or prevent the sediment from depositing c. Install a moveable silt screen to prevent sediment from entering the port d. Excavate a trench to capture and redirect the sediment plume with the
possible assistance of a pump before it enters the port. Approach (a) requires no installation and no disruption of port activities, plus it can be implemented immediately. However, as discussed in Chapter 5, it may not provide as complete a remedy as desired. Approach (b) will require installation and periodic maintenance of equipment. It is also subject to damage from anchors. A customized design will be necessary based on the Port’s size, flow conditions, sediment present and other factors. It also may not provide a complete remedy, since the area of bottom influence will be small and, for example, the bubble plumes will send at least some sediment deeper into the basin. Approach (c) also requires installation, operation, and maintenance, plus disruption of port routines. As vessels approach the port, the curtain will have to be opened for their passage and perhaps closed behind them. It will provide the most positive control over sedimentation, since a close-fitting curtain will form an effective barrier against most tow-induced sedimentation. Approach (d) will require installation and maintenance, both of which may disrupt port routines. As the sediment plume approaches the port and encounters the trench, a portion of the plume will be captured by the trench. Additional details of these solutions are given below.
Designs See Part 4 for more information on each of the designs described below.
38
Agitation by propwash can be effective in the port, since sediments transported in from tows can, at least in part, be transported back out again. Agitation can be scheduled so as not to conflict with other port operations or access. Working from the rear of the basin to the front and from the upstream end of the notch in a downstream direction, with the propwash directed toward the waterway will increase the effectiveness of the method, and combining it with bubble curtains (below) will further increase effectiveness. A pneumatic barrier, or bubble curtain, pumps compressed air through a submerged manifold. Bubbles rising from the manifold create a current that flows in toward the manifold at the bottom, upward toward the surface, and outward at the surface. As sediment particles approach the rising current they are carried upward away from the bed and toward the surface, then away from the bubbler. The two most common configurations of pneumatic barriers are in a line across the mouth of a basin or in clusters throughout the basin (Figure 6-3). In the line arrangement, the pneumatic barrier will act as a curtain across the mouth of the port to reduce the amount of depositing sediment in two ways. The rising current of air entrains water, creating an upward flow near the bubble curtain, an inward flow near the bottom, and an outward flow at the surface. This flow pattern carries suspended fine particles upward, and a portion is transported out away from the port and into the main channel area. The rising air bubbles act as a physical barrier limiting the passage of particles to the other side of the curtain thus reducing the amount of sediment entering the port. Increased bottom currents near the curtain will also prevent close-by deposition of fine sediments. A barrier across the basin and notch will require a total of 1300 ft of perforated pipe supplied by at least two compressors. Installation of either pneumatic barrier arrangement will require port down time. Operation of the line pneumatic barrier could be continuous, but, depending on experience with the system, also could be activated only during tow passages in the waterway. Regular, periodic maintenance will be required of the compressor and the manifold. The prospective solution that will prevent virtually all sediment from entering the port is a silt curtain, a physical barrier that is opened only to allow the passage of vessels. Figures 4-2 and 4-3 illustrate a silt curtain that can be deployed across the mouth of both the notch and basin to exclude sediment. As it is a solid membrane, no sediment will pass through it into the port while in use; however, if there are gaps in the curtain, particularly at the bed, some sediment will get past. The primary drawback of the sediment curtain solution is that it will require special training and a work boat to open it for vessel passage it and may disrupt daily activities of the port. Installation and maintenance will also cause periodic disruption of vessel traffic into and out of the port. A two-segment silt curtain will provide the most flexibility and speed of operation. One 260-ft-long segment will protect the main port basin, and a second, 900-ft-
39
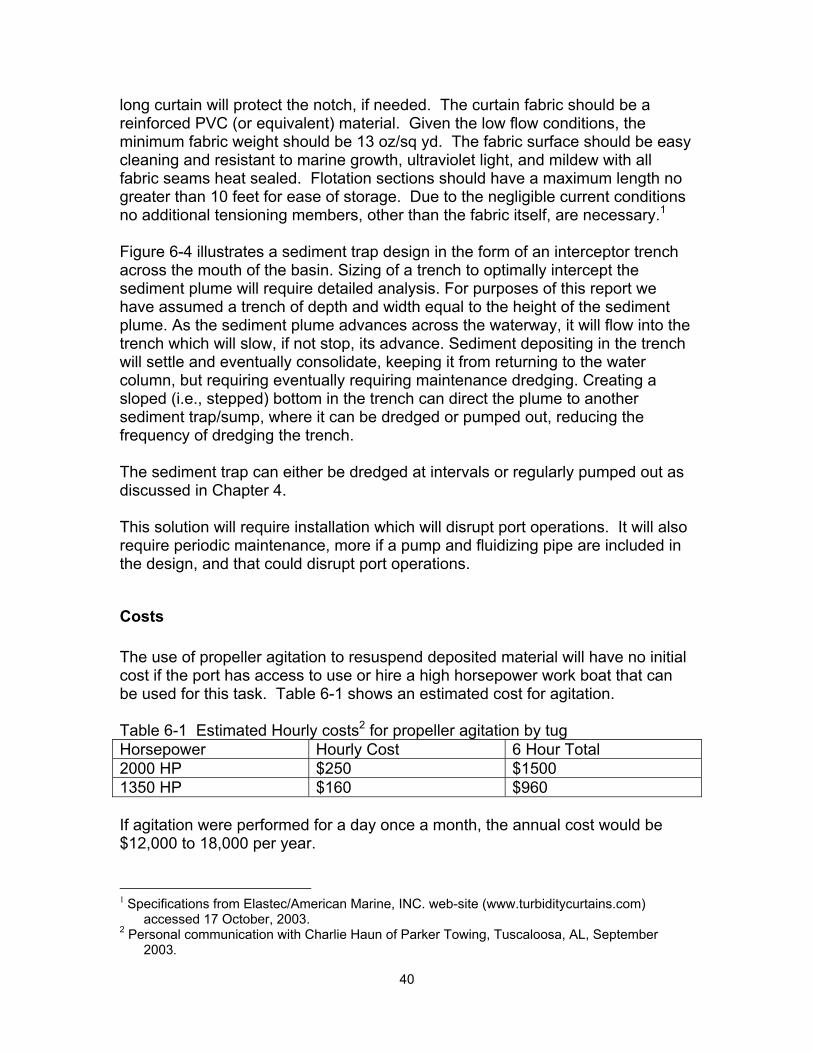
long curtain will protect the notch, if needed. The curtain fabric should be a reinforced PVC (or equivalent) material. Given the low flow conditions, the minimum fabric weight should be 13 oz/sq yd. The fabric surface should be easy cleaning and resistant to marine growth, ultraviolet light, and mildew with all fabric seams heat sealed. Flotation sections should have a maximum length no greater than 10 feet for ease of storage. Due to the negligible current conditions no additional tensioning members, other than the fabric itself, are necessary.1 Figure 6-4 illustrates a sediment trap design in the form of an interceptor trench across the mouth of the basin. Sizing of a trench to optimally intercept the sediment plume will require detailed analysis. For purposes of this report we have assumed a trench of depth and width equal to the height of the sediment plume. As the sediment plume advances across the waterway, it will flow into the trench which will slow, if not stop, its advance. Sediment depositing in the trench will settle and eventually consolidate, keeping it from returning to the water column, but requiring eventually requiring maintenance dredging. Creating a sloped (i.e., stepped) bottom in the trench can direct the plume to another sediment trap/sump, where it can be dredged or pumped out, reducing the frequency of dredging the trench. The sediment trap can either be dredged at intervals or regularly pumped out as discussed in Chapter 4. This solution will require installation which will disrupt port operations. It will also require periodic maintenance, more if a pump and fluidizing pipe are included in the design, and that could disrupt port operations.
Costs The use of propeller agitation to resuspend deposited material will have no initial cost if the port has access to use or hire a high horsepower work boat that can be used for this task. Table 6-1 shows an estimated cost for agitation. Table 6-1 Estimated Hourly costs2 for propeller agitation by tug Horsepower Hourly Cost 6 Hour Total 2000 HP $250 $1500 1350 HP $160 $960 If agitation were performed for a day once a month, the annual cost would be $12,000 to 18,000 per year.
1 Specifications from Elastec/American Marine, INC. web-site (www.turbiditycurtains.com)
accessed 17 October, 2003. 2 Personal communication with Charlie Haun of Parker Towing, Tuscaloosa, AL, September
2003.
40
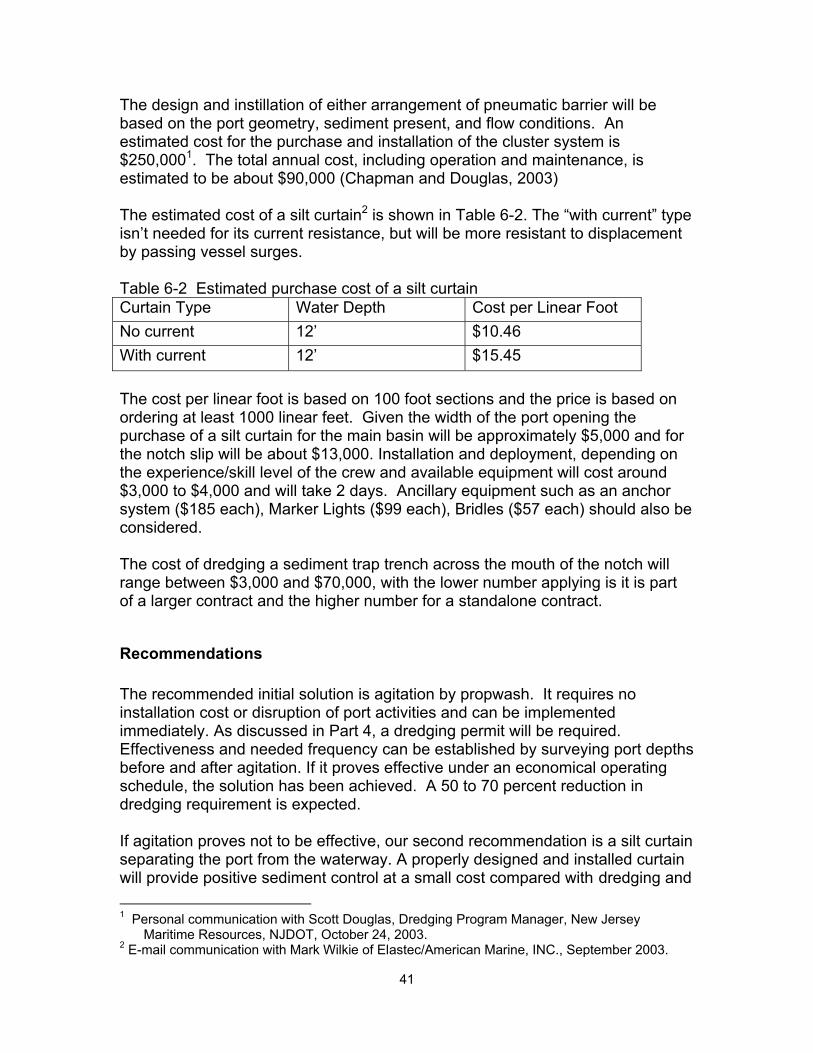
The design and instillation of either arrangement of pneumatic barrier will be based on the port geometry, sediment present, and flow conditions. An estimated cost for the purchase and installation of the cluster system is $250,0001. The total annual cost, including operation and maintenance, is estimated to be about $90,000 (Chapman and Douglas, 2003) The estimated cost of a silt curtain2 is shown in Table 6-2. The “with current” type isn’t needed for its current resistance, but will be more resistant to displacement by passing vessel surges. Table 6-2 Estimated purchase cost of a silt curtain Curtain Type Water Depth Cost per Linear Foot No current 12’ $10.46 With current 12’ $15.45 The cost per linear foot is based on 100 foot sections and the price is based on ordering at least 1000 linear feet. Given the width of the port opening the purchase of a silt curtain for the main basin will be approximately $5,000 and for the notch slip will be about $13,000. Installation and deployment, depending on the experience/skill level of the crew and available equipment will cost around $3,000 to $4,000 and will take 2 days. Ancillary equipment such as an anchor system ($185 each), Marker Lights ($99 each), Bridles ($57 each) should also be considered. The cost of dredging a sediment trap trench across the mouth of the notch will range between $3,000 and $70,000, with the lower number applying is it is part of a larger contract and the higher number for a standalone contract.
Recommendations The recommended initial solution is agitation by propwash. It requires no installation cost or disruption of port activities and can be implemented immediately. As discussed in Part 4, a dredging permit will be required. Effectiveness and needed frequency can be established by surveying port depths before and after agitation. If it proves effective under an economical operating schedule, the solution has been achieved. A 50 to 70 percent reduction in dredging requirement is expected. If agitation proves not to be effective, our second recommendation is a silt curtain separating the port from the waterway. A properly designed and installed curtain will provide positive sediment control at a small cost compared with dredging and 1 Personal communication with Scott Douglas, Dredging Program Manager, New Jersey
Maritime Resources, NJDOT, October 24, 2003. 2 E-mail communication with Mark Wilkie of Elastec/American Marine, INC., September 2003.
41
with greater effectiveness than the other methods presented here. A silt curtain will reduce the dredging requirement by 80 to 90 percent. The third recommendation is either for a pneumatic barrier or a sediment trap (trench) across the mouth of the port, separating it from the waterway. These solutions will be somewhat less effective than the silt curtain, but will not impede port operations. The cost of installation, operation, and maintenance will be higher than the other two recommendations, and the bottom-laid manifold will be subject to damage from vessels. A barrier or trap is expected to reduce sedimentation by 40 to 60 percent.
42
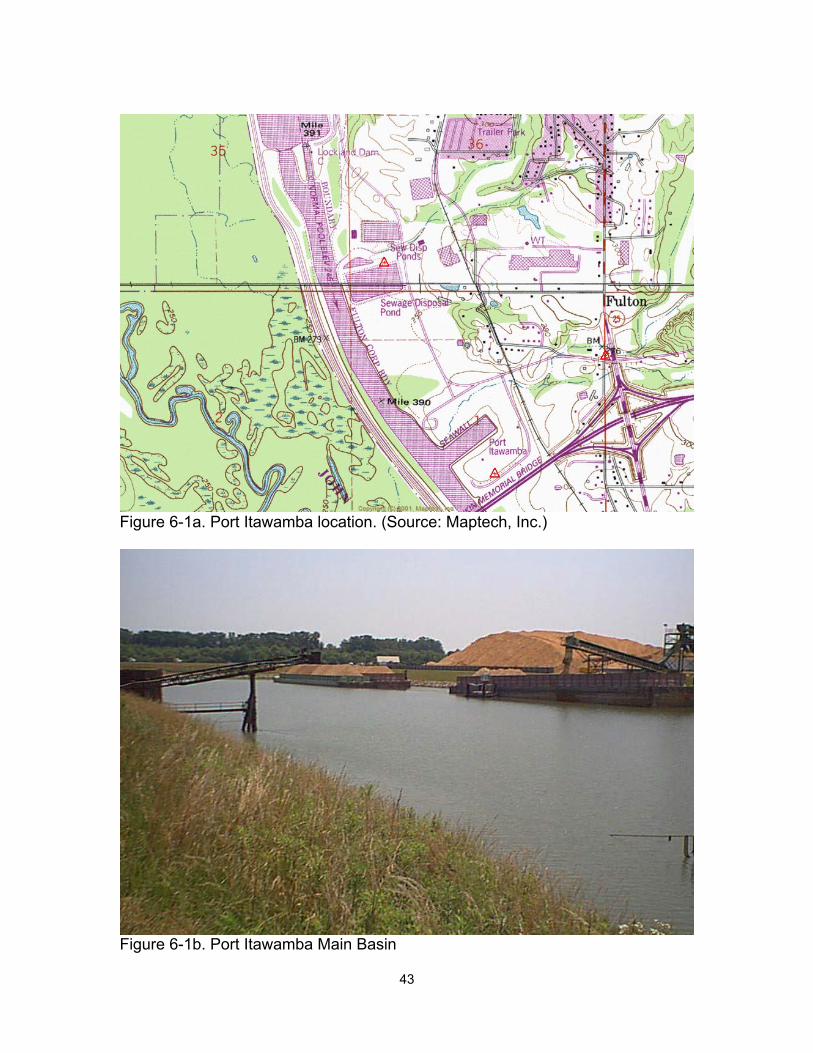
Figure 6-1a. Port Itawamba location. (Source: Maptech, Inc.)
Figure 6-1b. Port Itawamba Main Basin
43
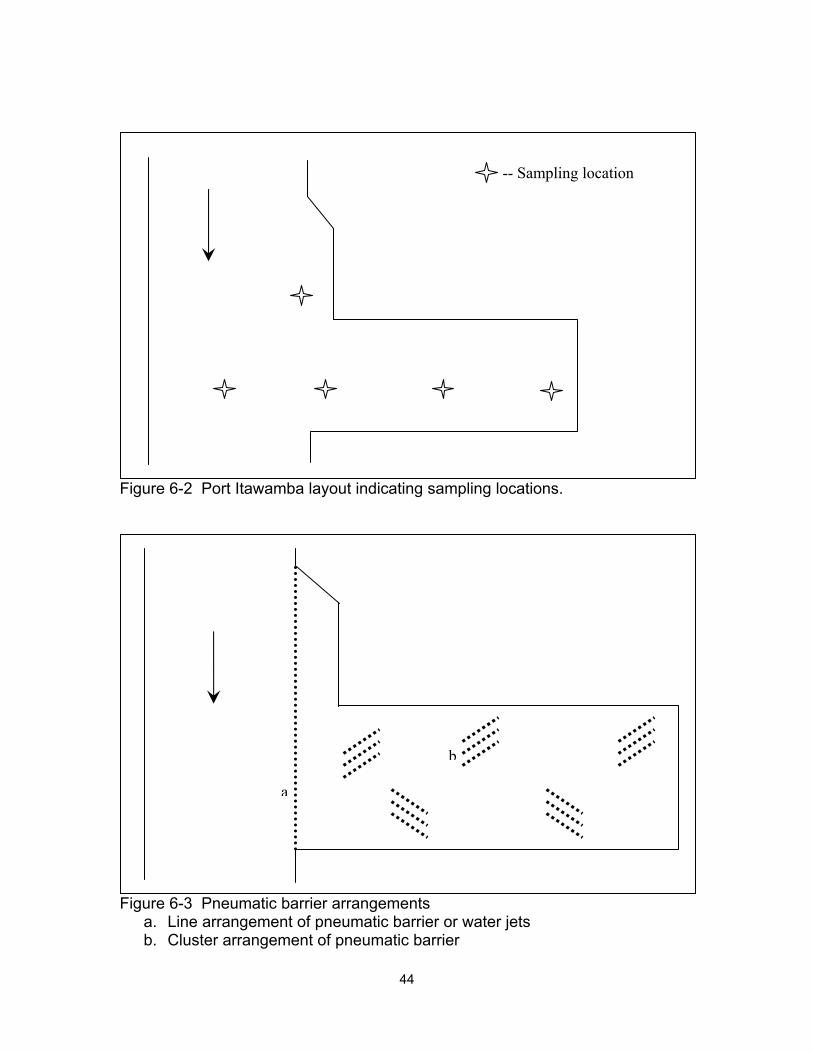
-- Sampling location
Figure 6-2 Port Itawamba layout indicating sampling locations.
b
a
Figure 6-3 Pneumatic barrier arrangements a. Line arrangement of pneumatic barrier or water jets b. Cluster arrangement of pneumatic barrier
44
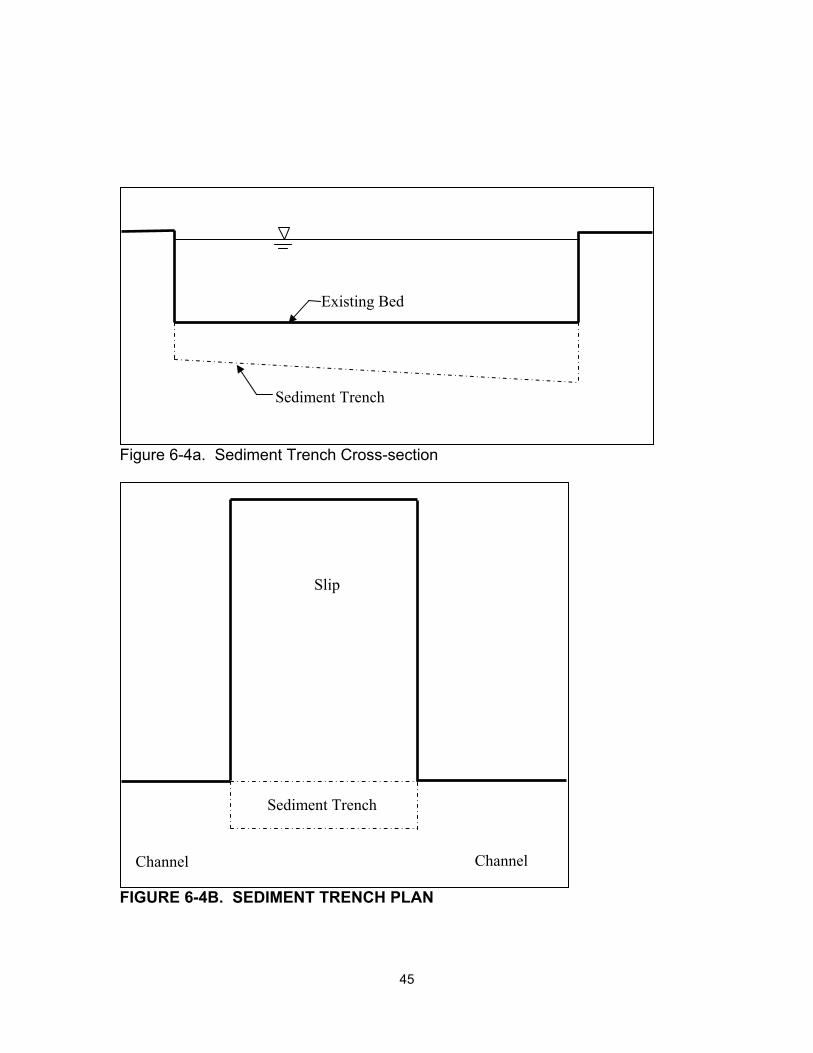
Existing Bed
Sediment Trench
Figure 6-4a. Sediment Trench Cross-section
Slip
Sediment Trench
ChannelChannel
FIGURE 6-4B. SEDIMENT TRENCH PLAN
45
7. PORT OF AMORY
Description
Port of Amory is located at river mile 369.5 in Amory, MS. Mr. Frank Peeler, was formerly City Planner for Amory and served as liaison during the initial work. Mr. Russell G. Butler is present City Planner and manages the port under the direction of Amory Mayor Thomas Griffith. The port is in the Canal Section of the waterway, in the Aberdeen Pool created by the Aberdeen Lock and Dam. The barge berthing area, shown in Figure 7-1, is 834 ft long at 9 ft draft. The Port of Amory has no present users/tenants, but planning is underway for an ethanol plant that will bring in raw materials by highway and ship ethanol product by tanker barge. Immediately adjacent to Amory's dock is a Weyerhaeuser facility that operates a wood chipping mill and its own dock. Both berthing areas share the same notch cut in the waterway bank.
Sedimentation and Dredging History The Port obtained a Corps’ dredging permit in June 1999 for up to 10,000 cu yd but did not dredge. The Amory side of the berthing area has never been dredged, and barges report that that cannot get close to the dock because of a shoal. Mayor Griffith believes that the Weyerhaeuser berth has been dredged in the last few years. The port has an option to place dredged material on top of a Corps-owned dredge fill created during waterway construction. Corps of Engineers records show that the Waterway reach below the port has required maintenance dredging several times, with 19,355 cu yd in 1997 and 52,734 cu yd in 1993. The bulk of that material appears to come from the Tombigbee River, which enters the waterway at Mile 366.3, about 3 miles downstream of the port. A recent survey of the berthing area showed about 3 ft of sediment accumulated above the 9 ft nominal depth next to the berth wall, tapering down to nominal depth toward the waterway over a distance of about 500 ft.
46
Mayor Griffith1 believes that settling of sediment suspended from the main waterway channel by tow traffic causes port shoaling. He notes that a noticeable turbidity plume occurs behind every tow. Field measurements under this project tend to confirm that view, as discussed below. We estimate the annual sedimentation rate to be between 500 and 3,000 cu yd.
Field Investigations Field measurements at the Port of Amory are described in Appendix E. They showed that under the measurement conditions, currents were very low (under 0.1 m/sec), background turbidity ranged from 15 to 35 NTU, and background total suspended solids ranged from 20 to 40 mg/l. Bed sediments in the port consisted of a surface layer 1 to 3 inches thick consisting of either an extremely low density mud (fluff) or silty-sand with clay lumps, an intermediate 3 to 4-inch-thick layer of dark silty clay, and a base layer of compacted, blue-gray clay. Bed samples near the waterway centerline at the port consisted of about 1 inch of fluff over the compacted blue-gray clay. Turbidity was measured during several tow and recreational fishing boat transits. Surges of about a foot were observed in the port during locking operations at Amory Lock and turbidity in the port 2 ft above the bed increased 5 to 15 NTU with each surge, then fell to background levels within 5 minutes. Turbidity in the waterway centerline immediately behind a tow was 100 to 200 NTU. Within the port, turbidity near the bed increased by about 5 to 20 NTU’s 5 to 10 minutes after tow passage, then fell to background levels over a period of 10 to 25 minutes. No measurable turbidity increase was observed from recreational boat passages, but they do produce sizable bow waves that strike the port wall.
Sediment Transport Processes The berth wall along the Amory dock consists of H-beam piles with stoplogs between the piles. Filter cloth was originally placed behind the wall, but it has deteriorated and moved. According to design plans, the stoplogs have a bottom elevation of 178 ft, 12 ft below the Normal pool elevation of 190 ft. The wall has experienced some movement toward the waterway and slumping of soil between it and the concrete dock surface, which is supported on H-beam pilings. One dock cleat has moved about 10 inches toward the water, leaving a crack in the soil behind it. Several large cracks in the earth indicated block failure of the soil
1 This comment and others in this section by Mayor Griffith and Mr. Peeler occurred during a meeting in Amory on 14 June 2002.
47
behind the quay wall. Slumping of soil under the quay wall, piping, or washing of fines between the stoplogs has probably contributed to loss of depth at the berth. Water and sediment inflow into the canal section is relatively small, and some of that passes out of the waterway via the Glover Wilkins Lock and Dam (Lock B) Spillway, at Mile 377, and two pools – A and B – lie between most of that drainage and the Port of Amory. The Corps of Engineers Design memorandum (USACE, 1980) predicted that no measurable sediment would be passed to Pool A from Pool B. Further, Pool A above Amory Lock and Dam drains only about 20 sq miles of basin, so the volume of water and sediment passing Amory from upstream is quite small and the sediment consists exclusively of extremely fine-grained sediment. Local drainage, including Burketts Creek, the Weyerhaeuser chipping mill, and effluent from the Amory sewage treatment facility contributes another small volume of flow and some particulate material to the port reach, but flow velocities in the waterway are usually too small to move sand-sized sediment beyond its inflow point. For these reasons, very fine sediment – silts and clays – which can remain in suspension under weak flow conditions, will dominate sediment transport in the waterway adjacent to the port. To the extent that the port creates a cross-section about one-third larger than the waterway, already weak currents will be further diminished, permitting even fine sediments to deposit; however those sediments will be spread over the cross-section and be easily resuspended by vessel traffic. Observations and consideration of known flows and transport indicate that the primary mechanism for waterborne sediments depositing in the port is suspension of fine sediment by surges from Amory Lock operations and tow passage. The process of tow suspension is discussed in Chapter 3. For the Port of Amory, we believe that, along with slumping, vessel traffic effects are the primary causative mechanism for sedimentation, with the following processes occurring:
• Pressure fluctuations in the soil behind the port wall due to emptying of the lock and vessel-induced waves and drawdown cause exfiltration of sediment through the wall and deposition near the wall.
• Tows passing the port suspend fine sediment from the center of the waterway which moves as a near-bottom density flow into the port and deposits more or less uniformly.
Tow-suspended sediment deposits as a very low density, fluffy mixture of water, sediment grains, and organic material, which can be easily resuspended for a time (on the order of days). As it remains in place and is buried by new deposits, it will expel pore water and consolidate to a more dense, more erosion-resistant sediment bed. If the waterway bed is the proximate source of sediment depositing in the port, the ultimate source must be inflows to the system. As discussed above the sediment supply from upstream is believed to be quite small. Although the port is
48
in the Canal section of the Waterway, it is in Aberdeen Pool and the River section begins just three miles below the port. The Waterway dredging quantities profile peaks in the mile 366-367 reach where the River section begins, and fine sediment brought into the Waterway by the Tombigbee River could be a source of shoaling material for the port during low flow periods, if sediment resuspended by tows moved upstream as density or diffusive transport. Such a mechanism may not be necessary, for there may be more than enough residual sediment in the waterway and small inflows to continuously cycle sediment through deposition and resuspension and maintain a steady supply to the port.
Engineering Solutions Slumping and exfiltration of soil fill behind the port wall can be corrected. A geotechnical analysis will reveal whether slumping or piping is pushing material under the bottom of the wall, and if so, what repairs, such as extension into the bed, are needed. Repair of the wall can be accompanied by sealing it to prevent washing out of fines, backfilling, and sealing the ground surface above to prevent surface water percolation behind the wall. If transport from vessel resuspension is the only other substantial source of shoaling material, then several approaches may reduce port sedimentation. Four of the possible solutions considered technically most feasible are: Resuspend the deposited material by propeller agitation
a. Use a pneumatic bubbler to limit the amount of sediment entering the port or prevent the sediment from depositing
b. Install a moveable silt screen to prevent sediment from entering the port c. Excavate a trench to capture and redirect the sediment plume with the
possible assistance of a pump before it enters the port. Approach (a) requires no installation, disruption of port activities and can be implemented immediately. However, as discussed in Section 5, it may not provide as complete a remedy as desired. Approach (b) will require installation and periodic maintenance of equipment. It is also subject to damage from anchors. A customized design will be necessary based on the Port’s size, flow conditions, sediment present and other factors. It also may not provide a complete remedy, since the area of bottom influence will be small and, for example, the bubble plumes will send at least some sediment deeper into the basin. Approach (c) also requires installation, operation, and maintenance, plus disruption of port routines. As vessels approach the port, the curtain will have to be opened for their passage and perhaps closed behind them. It will provide the most positive control over sedimentation, since a close-fitting curtain will form an effective barrier against most tow-induced sedimentation.
49
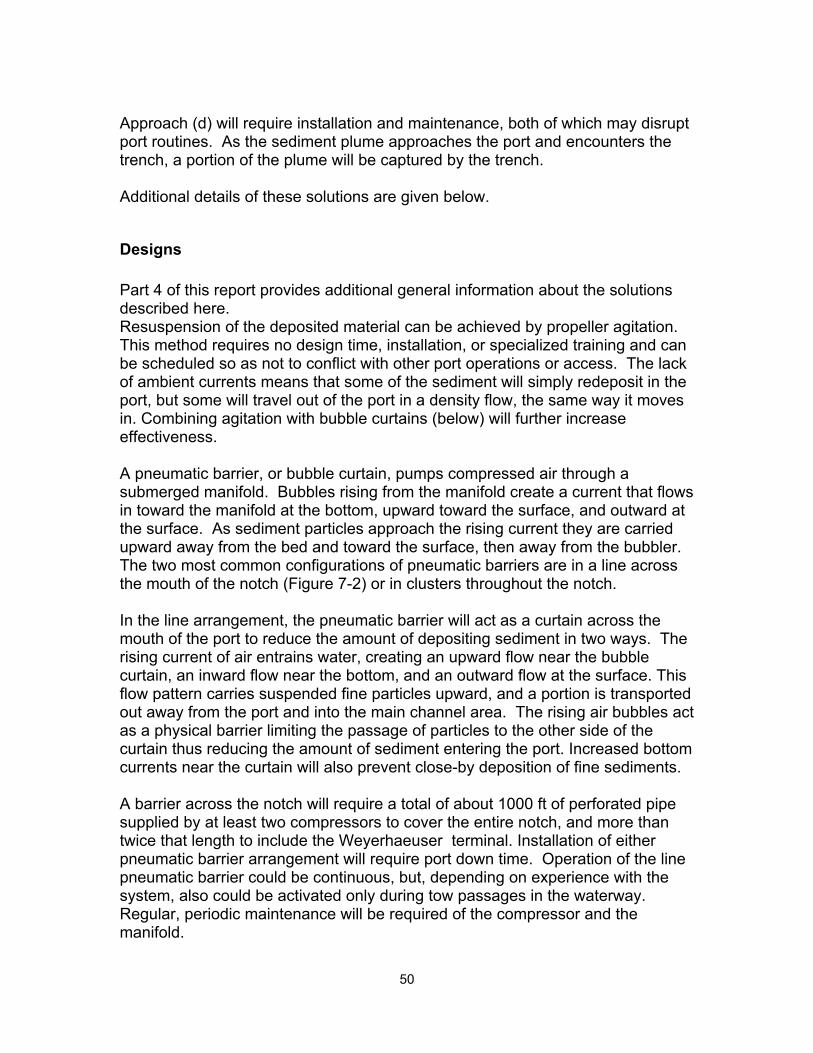
Approach (d) will require installation and maintenance, both of which may disrupt port routines. As the sediment plume approaches the port and encounters the trench, a portion of the plume will be captured by the trench. Additional details of these solutions are given below.
Designs Part 4 of this report provides additional general information about the solutions described here. Resuspension of the deposited material can be achieved by propeller agitation. This method requires no design time, installation, or specialized training and can be scheduled so as not to conflict with other port operations or access. The lack of ambient currents means that some of the sediment will simply redeposit in the port, but some will travel out of the port in a density flow, the same way it moves in. Combining agitation with bubble curtains (below) will further increase effectiveness. A pneumatic barrier, or bubble curtain, pumps compressed air through a submerged manifold. Bubbles rising from the manifold create a current that flows in toward the manifold at the bottom, upward toward the surface, and outward at the surface. As sediment particles approach the rising current they are carried upward away from the bed and toward the surface, then away from the bubbler. The two most common configurations of pneumatic barriers are in a line across the mouth of the notch (Figure 7-2) or in clusters throughout the notch. In the line arrangement, the pneumatic barrier will act as a curtain across the mouth of the port to reduce the amount of depositing sediment in two ways. The rising current of air entrains water, creating an upward flow near the bubble curtain, an inward flow near the bottom, and an outward flow at the surface. This flow pattern carries suspended fine particles upward, and a portion is transported out away from the port and into the main channel area. The rising air bubbles act as a physical barrier limiting the passage of particles to the other side of the curtain thus reducing the amount of sediment entering the port. Increased bottom currents near the curtain will also prevent close-by deposition of fine sediments. A barrier across the notch will require a total of about 1000 ft of perforated pipe supplied by at least two compressors to cover the entire notch, and more than twice that length to include the Weyerhaeuser terminal. Installation of either pneumatic barrier arrangement will require port down time. Operation of the line pneumatic barrier could be continuous, but, depending on experience with the system, also could be activated only during tow passages in the waterway. Regular, periodic maintenance will be required of the compressor and the manifold.
50
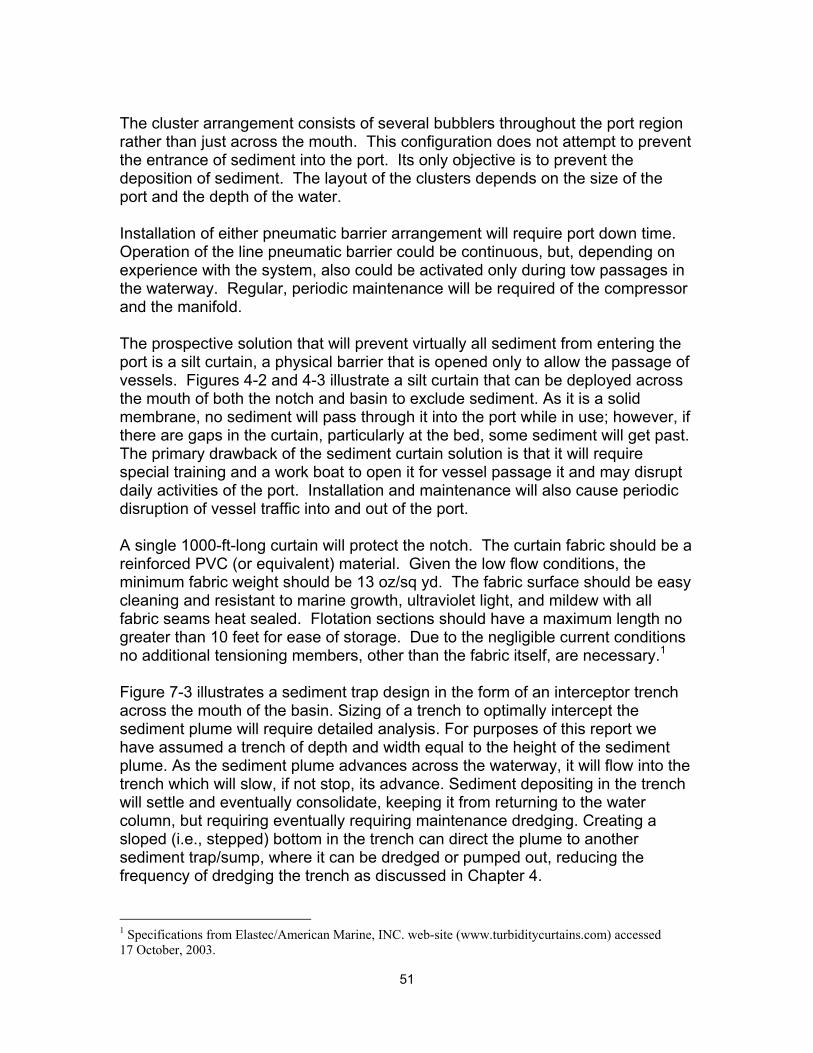
The cluster arrangement consists of several bubblers throughout the port region rather than just across the mouth. This configuration does not attempt to prevent the entrance of sediment into the port. Its only objective is to prevent the deposition of sediment. The layout of the clusters depends on the size of the port and the depth of the water. Installation of either pneumatic barrier arrangement will require port down time. Operation of the line pneumatic barrier could be continuous, but, depending on experience with the system, also could be activated only during tow passages in the waterway. Regular, periodic maintenance will be required of the compressor and the manifold. The prospective solution that will prevent virtually all sediment from entering the port is a silt curtain, a physical barrier that is opened only to allow the passage of vessels. Figures 4-2 and 4-3 illustrate a silt curtain that can be deployed across the mouth of both the notch and basin to exclude sediment. As it is a solid membrane, no sediment will pass through it into the port while in use; however, if there are gaps in the curtain, particularly at the bed, some sediment will get past. The primary drawback of the sediment curtain solution is that it will require special training and a work boat to open it for vessel passage it and may disrupt daily activities of the port. Installation and maintenance will also cause periodic disruption of vessel traffic into and out of the port. A single 1000-ft-long curtain will protect the notch. The curtain fabric should be a reinforced PVC (or equivalent) material. Given the low flow conditions, the minimum fabric weight should be 13 oz/sq yd. The fabric surface should be easy cleaning and resistant to marine growth, ultraviolet light, and mildew with all fabric seams heat sealed. Flotation sections should have a maximum length no greater than 10 feet for ease of storage. Due to the negligible current conditions no additional tensioning members, other than the fabric itself, are necessary.1 Figure 7-3 illustrates a sediment trap design in the form of an interceptor trench across the mouth of the basin. Sizing of a trench to optimally intercept the sediment plume will require detailed analysis. For purposes of this report we have assumed a trench of depth and width equal to the height of the sediment plume. As the sediment plume advances across the waterway, it will flow into the trench which will slow, if not stop, its advance. Sediment depositing in the trench will settle and eventually consolidate, keeping it from returning to the water column, but requiring eventually requiring maintenance dredging. Creating a sloped (i.e., stepped) bottom in the trench can direct the plume to another sediment trap/sump, where it can be dredged or pumped out, reducing the frequency of dredging the trench as discussed in Chapter 4. 1 Specifications from Elastec/American Marine, INC. web-site (www.turbiditycurtains.com) accessed 17 October, 2003.
51
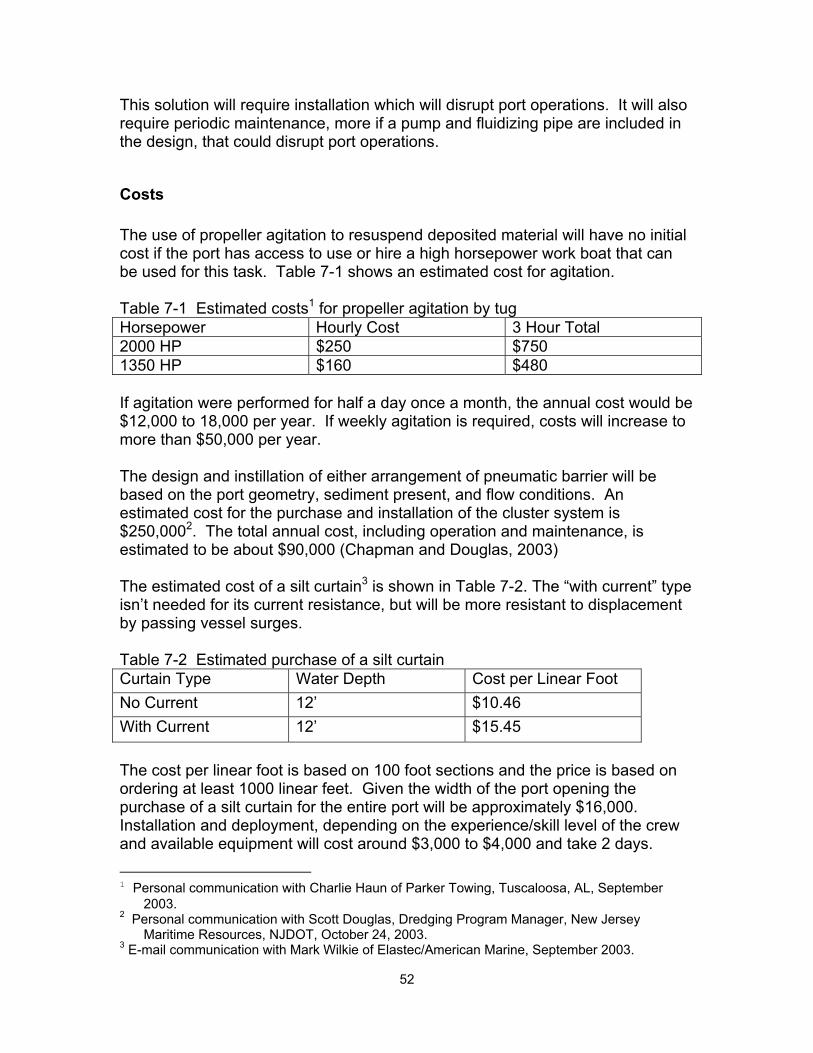
This solution will require installation which will disrupt port operations. It will also require periodic maintenance, more if a pump and fluidizing pipe are included in the design, that could disrupt port operations.
Costs The use of propeller agitation to resuspend deposited material will have no initial cost if the port has access to use or hire a high horsepower work boat that can be used for this task. Table 7-1 shows an estimated cost for agitation. Table 7-1 Estimated costs1 for propeller agitation by tug Horsepower Hourly Cost 3 Hour Total 2000 HP $250 $750 1350 HP $160 $480 If agitation were performed for half a day once a month, the annual cost would be $12,000 to 18,000 per year. If weekly agitation is required, costs will increase to more than $50,000 per year. The design and instillation of either arrangement of pneumatic barrier will be based on the port geometry, sediment present, and flow conditions. An estimated cost for the purchase and installation of the cluster system is $250,0002. The total annual cost, including operation and maintenance, is estimated to be about $90,000 (Chapman and Douglas, 2003) The estimated cost of a silt curtain3 is shown in Table 7-2. The “with current” type isn’t needed for its current resistance, but will be more resistant to displacement by passing vessel surges. Table 7-2 Estimated purchase of a silt curtain Curtain Type Water Depth Cost per Linear Foot No Current 12’ $10.46 With Current 12’ $15.45 The cost per linear foot is based on 100 foot sections and the price is based on ordering at least 1000 linear feet. Given the width of the port opening the purchase of a silt curtain for the entire port will be approximately $16,000. Installation and deployment, depending on the experience/skill level of the crew and available equipment will cost around $3,000 to $4,000 and take 2 days.
1 Personal communication with Charlie Haun of Parker Towing, Tuscaloosa, AL, September
2003. 2 Personal communication with Scott Douglas, Dredging Program Manager, New Jersey
Maritime Resources, NJDOT, October 24, 2003. 3 E-mail communication with Mark Wilkie of Elastec/American Marine, September 2003.
52
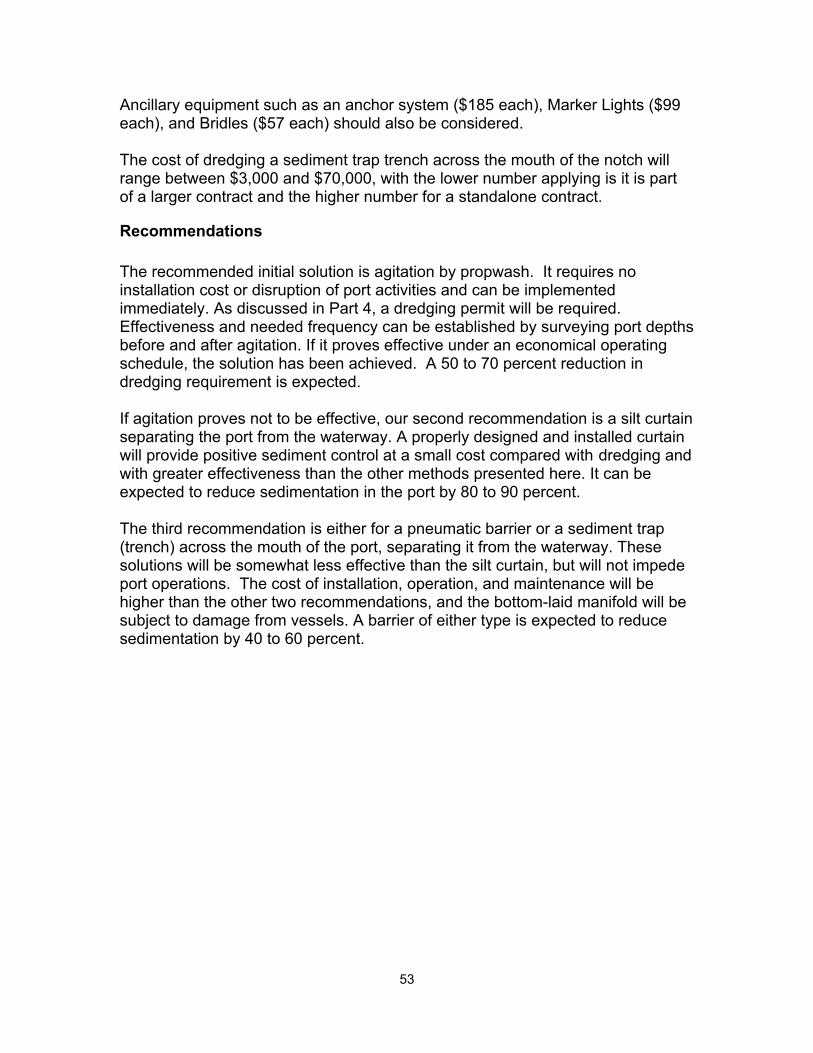
Ancillary equipment such as an anchor system ($185 each), Marker Lights ($99 each), and Bridles ($57 each) should also be considered. The cost of dredging a sediment trap trench across the mouth of the notch will range between $3,000 and $70,000, with the lower number applying is it is part of a larger contract and the higher number for a standalone contract.
Recommendations The recommended initial solution is agitation by propwash. It requires no installation cost or disruption of port activities and can be implemented immediately. As discussed in Part 4, a dredging permit will be required. Effectiveness and needed frequency can be established by surveying port depths before and after agitation. If it proves effective under an economical operating schedule, the solution has been achieved. A 50 to 70 percent reduction in dredging requirement is expected. If agitation proves not to be effective, our second recommendation is a silt curtain separating the port from the waterway. A properly designed and installed curtain will provide positive sediment control at a small cost compared with dredging and with greater effectiveness than the other methods presented here. It can be expected to reduce sedimentation in the port by 80 to 90 percent. The third recommendation is either for a pneumatic barrier or a sediment trap (trench) across the mouth of the port, separating it from the waterway. These solutions will be somewhat less effective than the silt curtain, but will not impede port operations. The cost of installation, operation, and maintenance will be higher than the other two recommendations, and the bottom-laid manifold will be subject to damage from vessels. A barrier of either type is expected to reduce sedimentation by 40 to 60 percent.
53
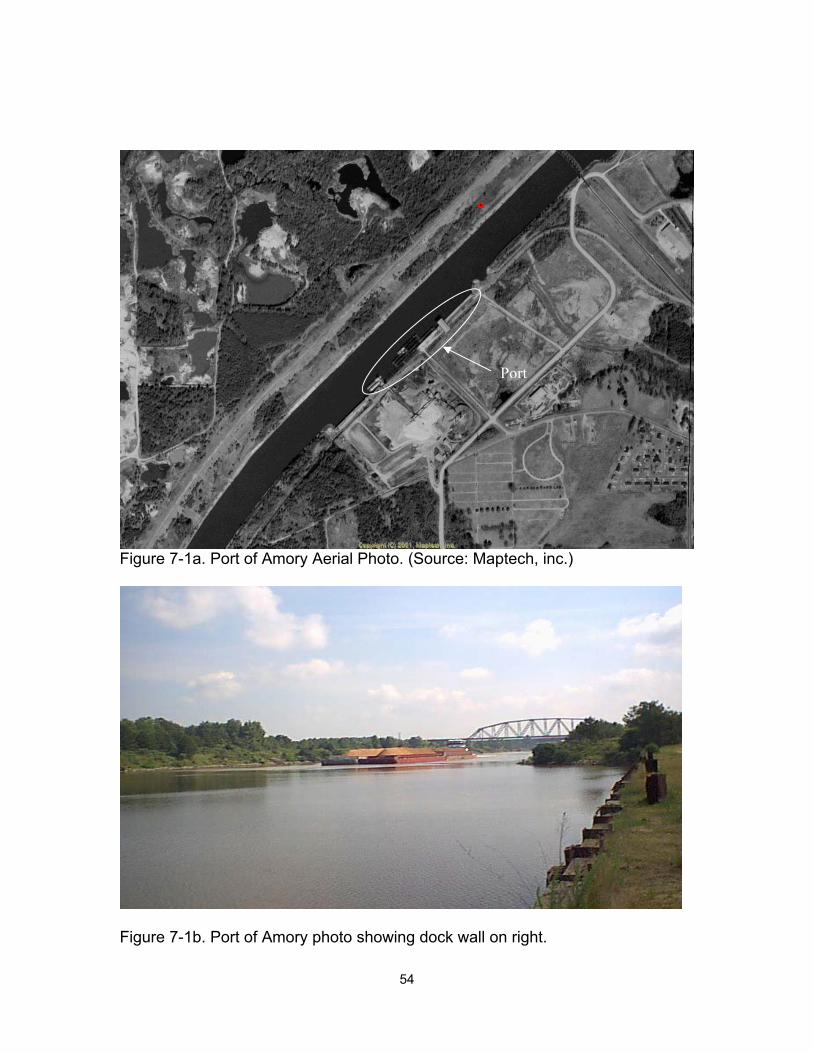
Figure 7-1a. Port of Amory Aerial Photo. (Source: Ma
Figure 7-1b. Port of Amory photo showing dock wall o
54
Port
ptech, inc.)
n right.
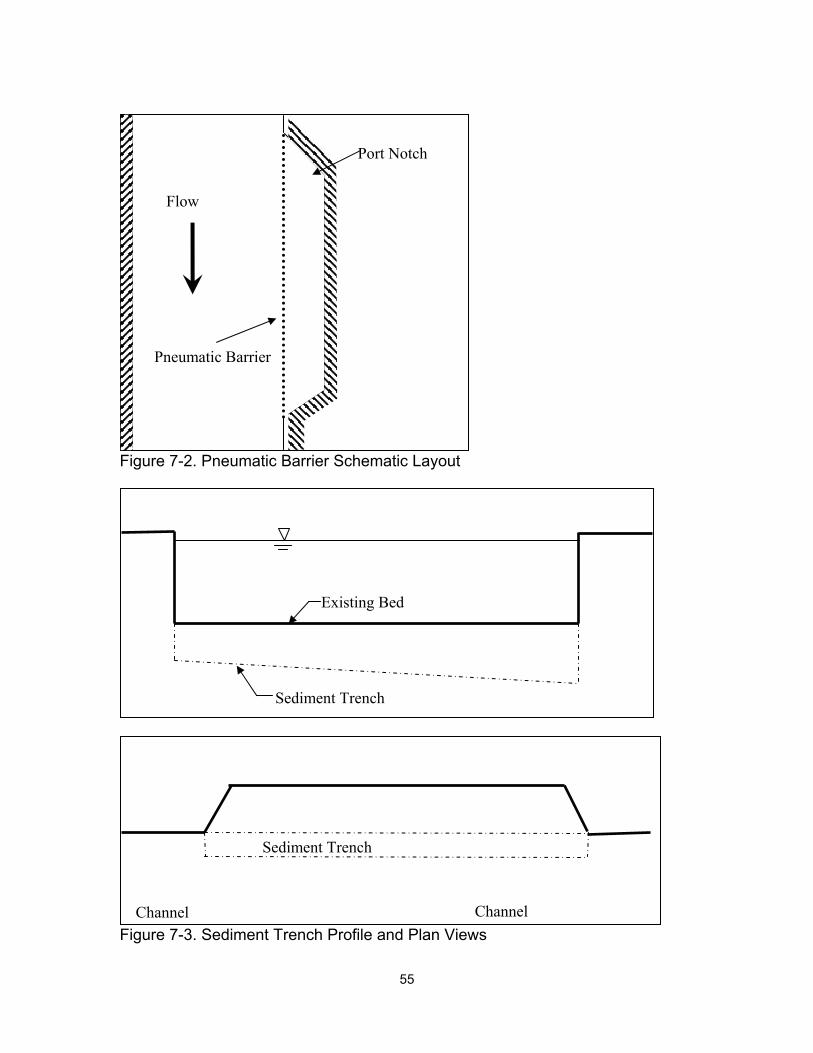
Figure 7-2. Pneumatic Barrier Schematic Layout
Port Notch
Flow
Pneumatic Barrier
Existing Bed
Sediment Trench
Sediment Trench
ChannelChannel Figure 7-3. Sediment Trench Profile and Plan Views
55

8. PORT OF ABERDEEN
Description Port of Aberdeen is located in Aberdeen, MS, at river mile 357. Mr. Perry Lucas manages the Port under the direction of Mayor William Tisdale of Aberdeen and Mr. Louis Burroughs of the Public Works Department. The port is in the River Section of the Waterway, in the Columbus Pool, about one mile below Aberdeen Lock and Dam. Port Aberdeen is a notch cut port on the main channel of the Waterway as shown in Figure 8-1. Its barge berthing area is 1000 ft long at 9 ft draft.
Sedimentation and Dredging History The port has been dredged several times. According to port records:
• The port has been dredged 5 times since 1987. • The most recent dredging was in 2001 at a cost of $75,000, but only 3
months later a barge hit bottom while loading. • Since 2001 several large sediment deposits have been removed using
clamshell. • The current disposal area is owned by an outside party that wants the
area filled. Two permanent pipes run from the port under the road to the spoil area.
Corps of Engineers records show no waterway dredging requirements in the immediate vicinity of the port, but 23,724 yd3 were removed from the reach downstream near mile 356 in 1991. We estimate the annual average maintenance dredging requirement to be in the range of 5,000 to 15,000 cu yd.
Field Investigations Measurements made in the port during February-March 2003 included bed sediment samples, water samples, turbidities and water depths. Results of the sampling and analysis are shown in Appendix B.
56
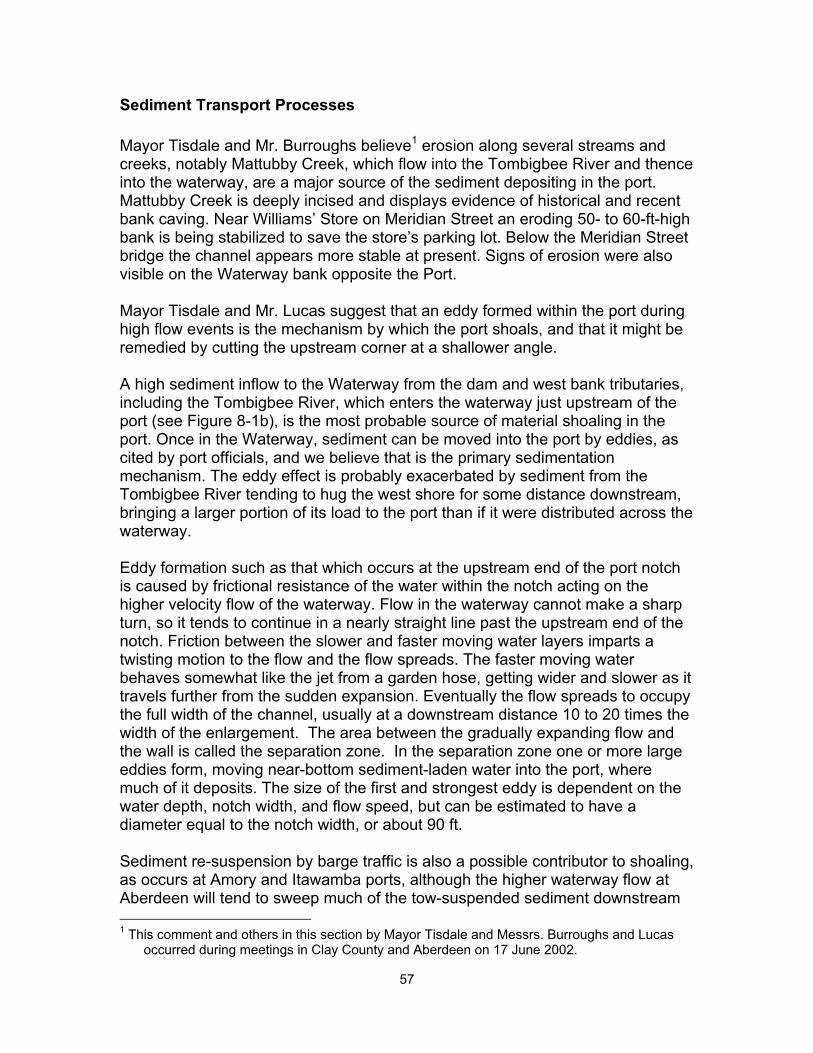
Sediment Transport Processes Mayor Tisdale and Mr. Burroughs believe1 erosion along several streams and creeks, notably Mattubby Creek, which flow into the Tombigbee River and thence into the waterway, are a major source of the sediment depositing in the port. Mattubby Creek is deeply incised and displays evidence of historical and recent bank caving. Near Williams’ Store on Meridian Street an eroding 50- to 60-ft-high bank is being stabilized to save the store’s parking lot. Below the Meridian Street bridge the channel appears more stable at present. Signs of erosion were also visible on the Waterway bank opposite the Port. Mayor Tisdale and Mr. Lucas suggest that an eddy formed within the port during high flow events is the mechanism by which the port shoals, and that it might be remedied by cutting the upstream corner at a shallower angle. A high sediment inflow to the Waterway from the dam and west bank tributaries, including the Tombigbee River, which enters the waterway just upstream of the port (see Figure 8-1b), is the most probable source of material shoaling in the port. Once in the Waterway, sediment can be moved into the port by eddies, as cited by port officials, and we believe that is the primary sedimentation mechanism. The eddy effect is probably exacerbated by sediment from the Tombigbee River tending to hug the west shore for some distance downstream, bringing a larger portion of its load to the port than if it were distributed across the waterway. Eddy formation such as that which occurs at the upstream end of the port notch is caused by frictional resistance of the water within the notch acting on the higher velocity flow of the waterway. Flow in the waterway cannot make a sharp turn, so it tends to continue in a nearly straight line past the upstream end of the notch. Friction between the slower and faster moving water layers imparts a twisting motion to the flow and the flow spreads. The faster moving water behaves somewhat like the jet from a garden hose, getting wider and slower as it travels further from the sudden expansion. Eventually the flow spreads to occupy the full width of the channel, usually at a downstream distance 10 to 20 times the width of the enlargement. The area between the gradually expanding flow and the wall is called the separation zone. In the separation zone one or more large eddies form, moving near-bottom sediment-laden water into the port, where much of it deposits. The size of the first and strongest eddy is dependent on the water depth, notch width, and flow speed, but can be estimated to have a diameter equal to the notch width, or about 90 ft. Sediment re-suspension by barge traffic is also a possible contributor to shoaling, as occurs at Amory and Itawamba ports, although the higher waterway flow at Aberdeen will tend to sweep much of the tow-suspended sediment downstream 1 This comment and others in this section by Mayor Tisdale and Messrs. Burroughs and Lucas
occurred during meetings in Clay County and Aberdeen on 17 June 2002.
57
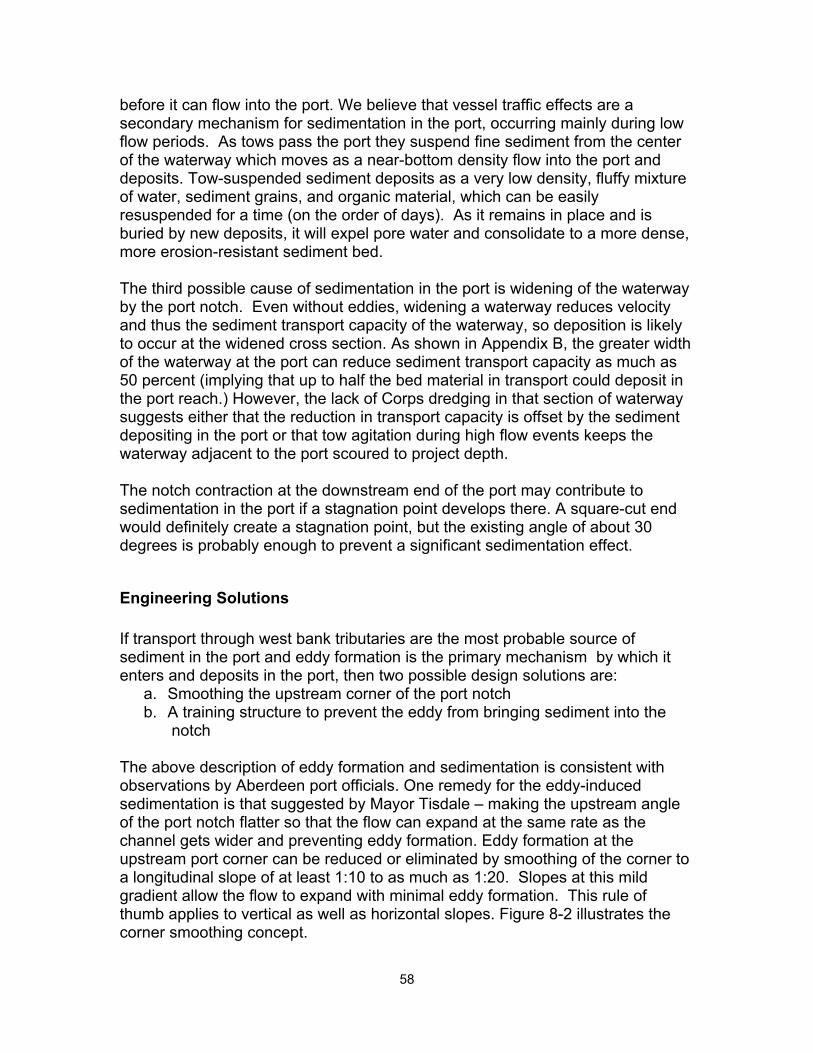
before it can flow into the port. We believe that vessel traffic effects are a secondary mechanism for sedimentation in the port, occurring mainly during low flow periods. As tows pass the port they suspend fine sediment from the center of the waterway which moves as a near-bottom density flow into the port and deposits. Tow-suspended sediment deposits as a very low density, fluffy mixture of water, sediment grains, and organic material, which can be easily resuspended for a time (on the order of days). As it remains in place and is buried by new deposits, it will expel pore water and consolidate to a more dense, more erosion-resistant sediment bed. The third possible cause of sedimentation in the port is widening of the waterway by the port notch. Even without eddies, widening a waterway reduces velocity and thus the sediment transport capacity of the waterway, so deposition is likely to occur at the widened cross section. As shown in Appendix B, the greater width of the waterway at the port can reduce sediment transport capacity as much as 50 percent (implying that up to half the bed material in transport could deposit in the port reach.) However, the lack of Corps dredging in that section of waterway suggests either that the reduction in transport capacity is offset by the sediment depositing in the port or that tow agitation during high flow events keeps the waterway adjacent to the port scoured to project depth. The notch contraction at the downstream end of the port may contribute to sedimentation in the port if a stagnation point develops there. A square-cut end would definitely create a stagnation point, but the existing angle of about 30 degrees is probably enough to prevent a significant sedimentation effect.
Engineering Solutions If transport through west bank tributaries are the most probable source of sediment in the port and eddy formation is the primary mechanism by which it enters and deposits in the port, then two possible design solutions are:
a. Smoothing the upstream corner of the port notch b. A training structure to prevent the eddy from bringing sediment into the
notch The above description of eddy formation and sedimentation is consistent with observations by Aberdeen port officials. One remedy for the eddy-induced sedimentation is that suggested by Mayor Tisdale – making the upstream angle of the port notch flatter so that the flow can expand at the same rate as the channel gets wider and preventing eddy formation. Eddy formation at the upstream port corner can be reduced or eliminated by smoothing of the corner to a longitudinal slope of at least 1:10 to as much as 1:20. Slopes at this mild gradient allow the flow to expand with minimal eddy formation. This rule of thumb applies to vertical as well as horizontal slopes. Figure 8-2 illustrates the corner smoothing concept.
58
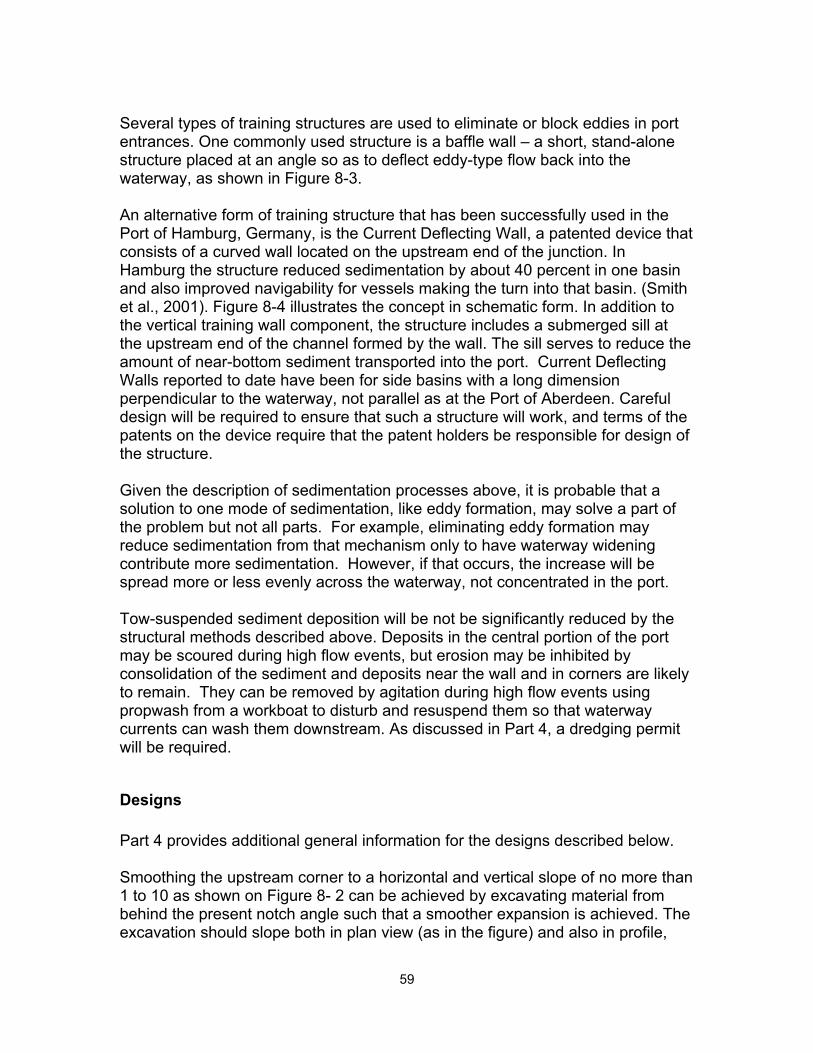
Several types of training structures are used to eliminate or block eddies in port entrances. One commonly used structure is a baffle wall – a short, stand-alone structure placed at an angle so as to deflect eddy-type flow back into the waterway, as shown in Figure 8-3. An alternative form of training structure that has been successfully used in the Port of Hamburg, Germany, is the Current Deflecting Wall, a patented device that consists of a curved wall located on the upstream end of the junction. In Hamburg the structure reduced sedimentation by about 40 percent in one basin and also improved navigability for vessels making the turn into that basin. (Smith et al., 2001). Figure 8-4 illustrates the concept in schematic form. In addition to the vertical training wall component, the structure includes a submerged sill at the upstream end of the channel formed by the wall. The sill serves to reduce the amount of near-bottom sediment transported into the port. Current Deflecting Walls reported to date have been for side basins with a long dimension perpendicular to the waterway, not parallel as at the Port of Aberdeen. Careful design will be required to ensure that such a structure will work, and terms of the patents on the device require that the patent holders be responsible for design of the structure. Given the description of sedimentation processes above, it is probable that a solution to one mode of sedimentation, like eddy formation, may solve a part of the problem but not all parts. For example, eliminating eddy formation may reduce sedimentation from that mechanism only to have waterway widening contribute more sedimentation. However, if that occurs, the increase will be spread more or less evenly across the waterway, not concentrated in the port. Tow-suspended sediment deposition will be not be significantly reduced by the structural methods described above. Deposits in the central portion of the port may be scoured during high flow events, but erosion may be inhibited by consolidation of the sediment and deposits near the wall and in corners are likely to remain. They can be removed by agitation during high flow events using propwash from a workboat to disturb and resuspend them so that waterway currents can wash them downstream. As discussed in Part 4, a dredging permit will be required.
Designs Part 4 provides additional general information for the designs described below. Smoothing the upstream corner to a horizontal and vertical slope of no more than 1 to 10 as shown on Figure 8- 2 can be achieved by excavating material from behind the present notch angle such that a smoother expansion is achieved. The excavation should slope both in plan view (as in the figure) and also in profile,
59
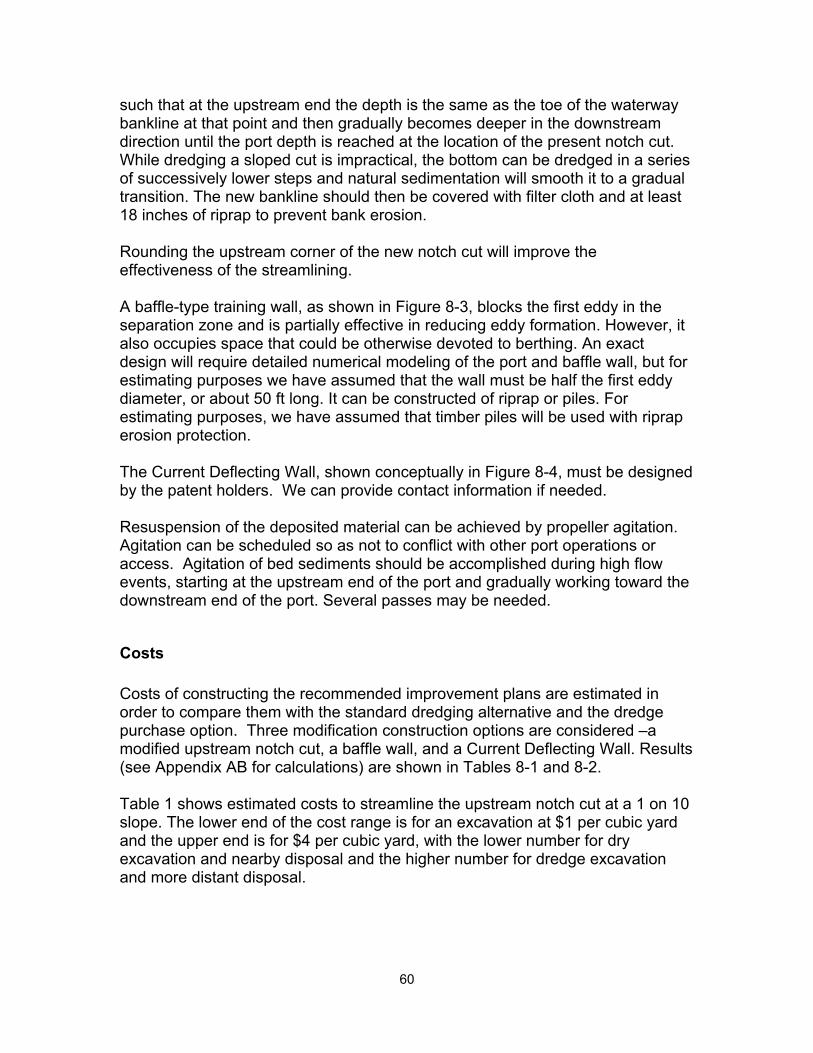
such that at the upstream end the depth is the same as the toe of the waterway bankline at that point and then gradually becomes deeper in the downstream direction until the port depth is reached at the location of the present notch cut. While dredging a sloped cut is impractical, the bottom can be dredged in a series of successively lower steps and natural sedimentation will smooth it to a gradual transition. The new bankline should then be covered with filter cloth and at least 18 inches of riprap to prevent bank erosion. Rounding the upstream corner of the new notch cut will improve the effectiveness of the streamlining. A baffle-type training wall, as shown in Figure 8-3, blocks the first eddy in the separation zone and is partially effective in reducing eddy formation. However, it also occupies space that could be otherwise devoted to berthing. An exact design will require detailed numerical modeling of the port and baffle wall, but for estimating purposes we have assumed that the wall must be half the first eddy diameter, or about 50 ft long. It can be constructed of riprap or piles. For estimating purposes, we have assumed that timber piles will be used with riprap erosion protection. The Current Deflecting Wall, shown conceptually in Figure 8-4, must be designed by the patent holders. We can provide contact information if needed. Resuspension of the deposited material can be achieved by propeller agitation. Agitation can be scheduled so as not to conflict with other port operations or access. Agitation of bed sediments should be accomplished during high flow events, starting at the upstream end of the port and gradually working toward the downstream end of the port. Several passes may be needed.
Costs Costs of constructing the recommended improvement plans are estimated in order to compare them with the standard dredging alternative and the dredge purchase option. Three modification construction options are considered –a modified upstream notch cut, a baffle wall, and a Current Deflecting Wall. Results (see Appendix AB for calculations) are shown in Tables 8-1 and 8-2. Table 1 shows estimated costs to streamline the upstream notch cut at a 1 on 10 slope. The lower end of the cost range is for an excavation at $1 per cubic yard and the upper end is for $4 per cubic yard, with the lower number for dry excavation and nearby disposal and the higher number for dredge excavation and more distant disposal.
60
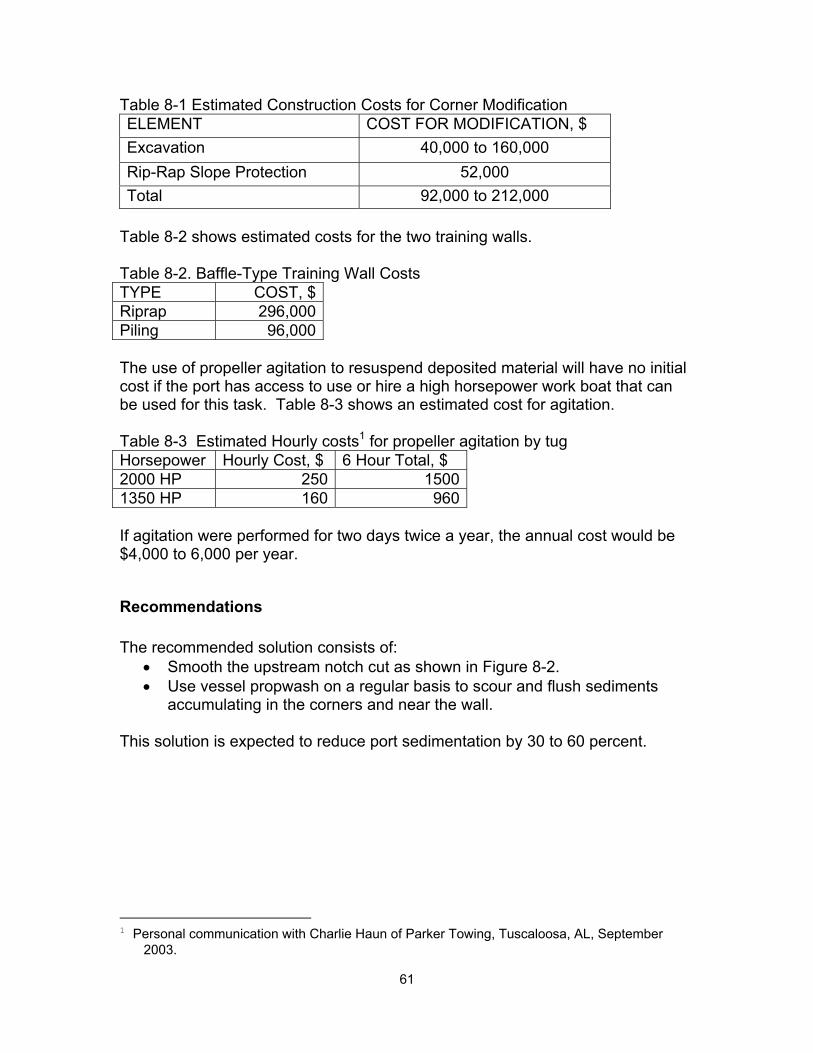
Table 8-1 Estimated Construction Costs for Corner Modification ELEMENT COST FOR MODIFICATION, $ Excavation 40,000 to 160,000 Rip-Rap Slope Protection 52,000 Total 92,000 to 212,000
Table 8-2 shows estimated costs for the two training walls. Table 8-2. Baffle-Type Training Wall Costs TYPE COST, $ Riprap 296,000 Piling 96,000 The use of propeller agitation to resuspend deposited material will have no initial cost if the port has access to use or hire a high horsepower work boat that can be used for this task. Table 8-3 shows an estimated cost for agitation. Table 8-3 Estimated Hourly costs1 for propeller agitation by tug Horsepower Hourly Cost, $ 6 Hour Total, $ 2000 HP 250 15001350 HP 160 960 If agitation were performed for two days twice a year, the annual cost would be $4,000 to 6,000 per year.
Recommendations The recommended solution consists of:
• Smooth the upstream notch cut as shown in Figure 8-2. • Use vessel propwash on a regular basis to scour and flush sediments
accumulating in the corners and near the wall. This solution is expected to reduce port sedimentation by 30 to 60 percent.
1 Personal communication with Charlie Haun of Parker Towing, Tuscaloosa, AL, September
2003.
61
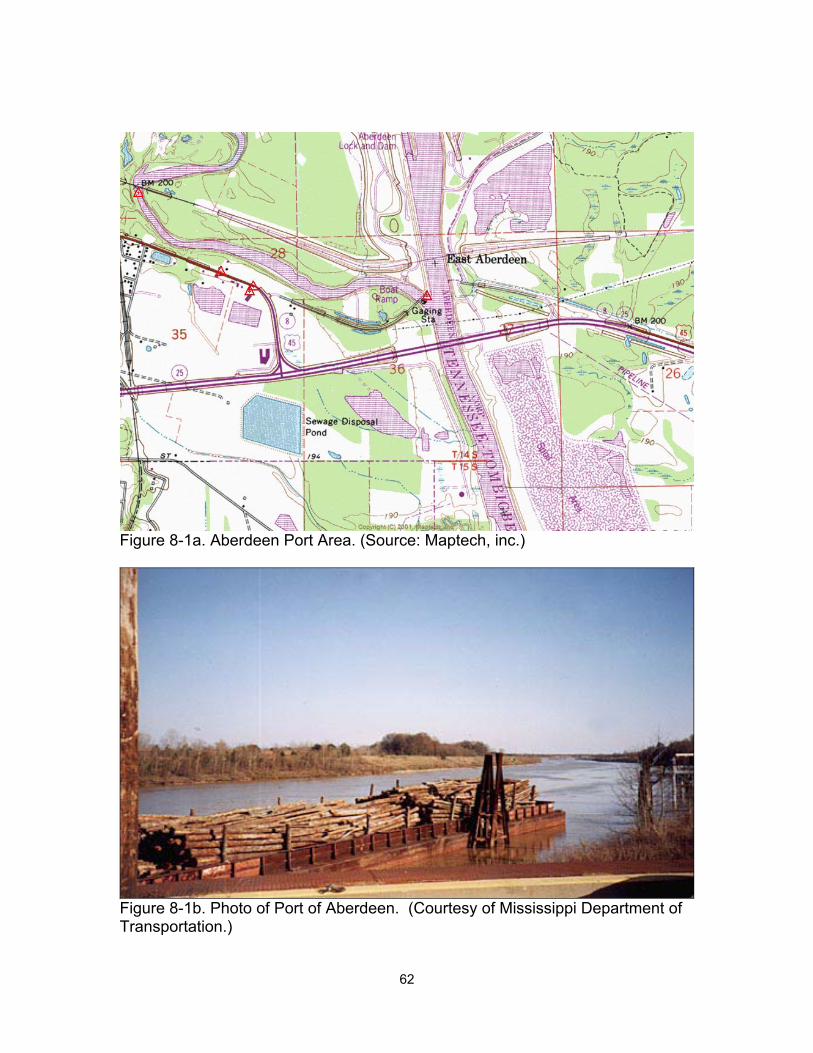
Figure 8-1a. Aberdeen Port Area. (Source: Maptech, inc.)
Figure 8-1b. Photo of Port of Aberdeen. (Courtesy of Mississippi Department of Transportation.)
62
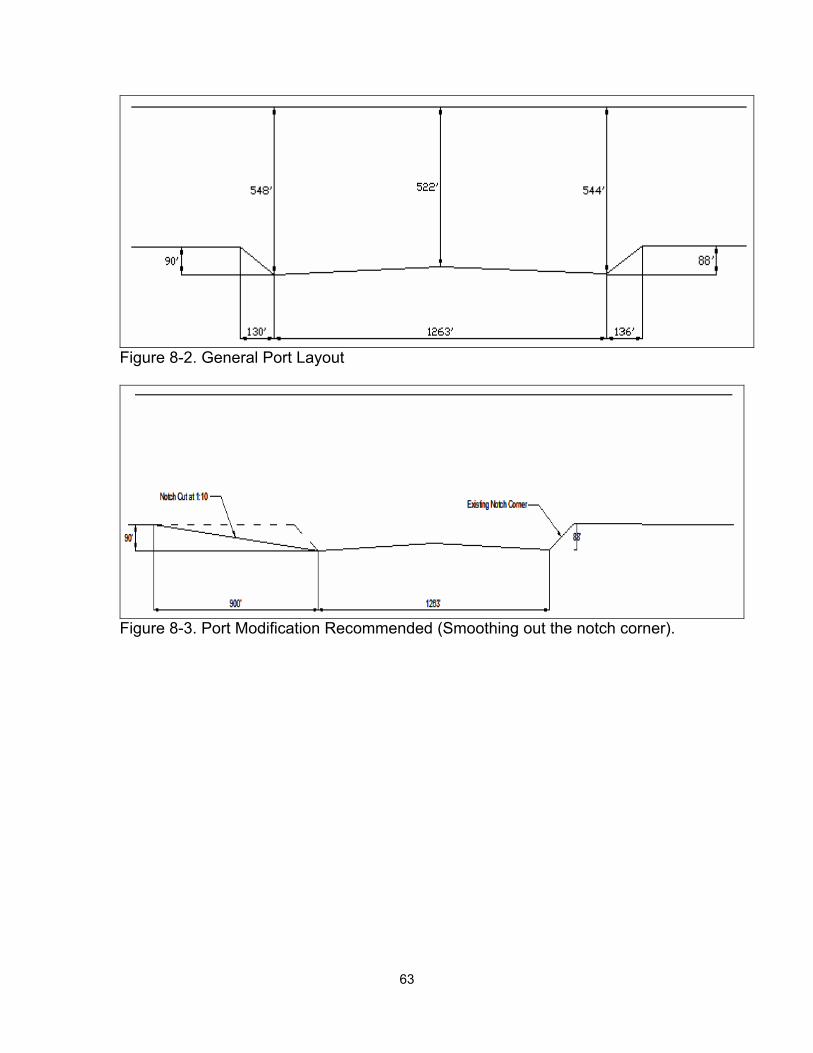
Figure 8-2. General Port Layout
Figure 8-3. Port Modification Recommended (Smoothing out the notch corner).
63
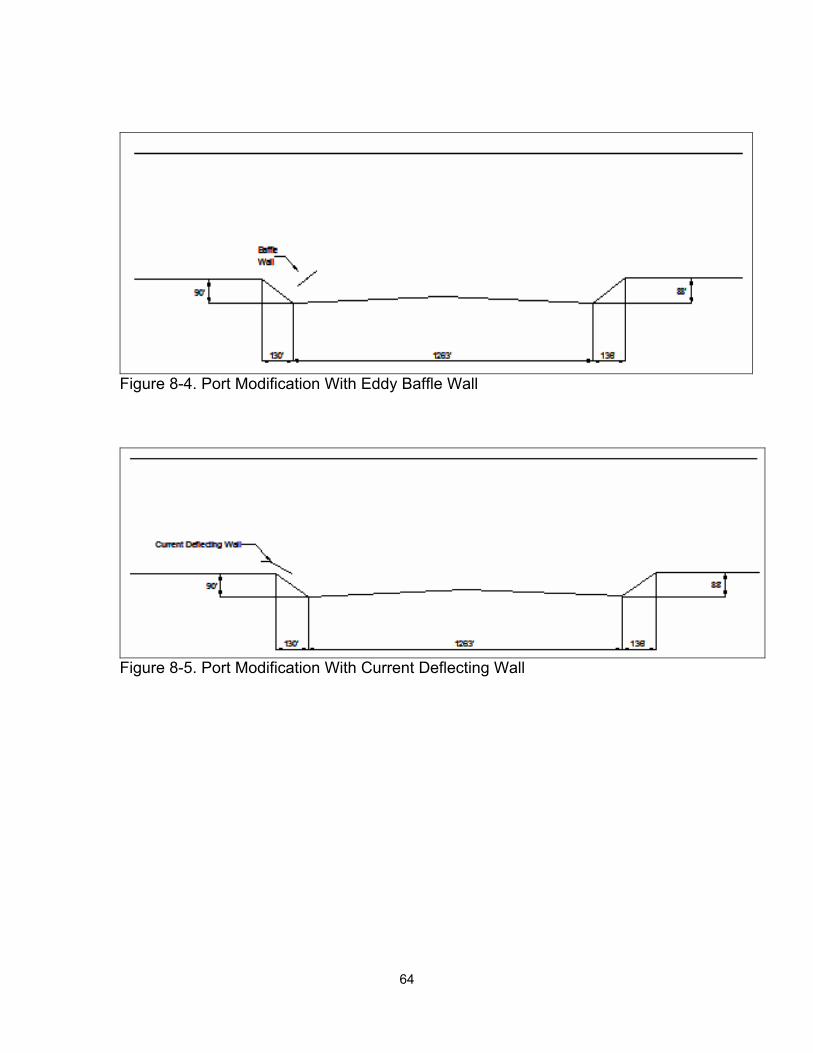
Figure 8-4. Port Modification With Eddy Baffle Wall
Figure 8-5. Port Modification With Current Deflecting Wall
64
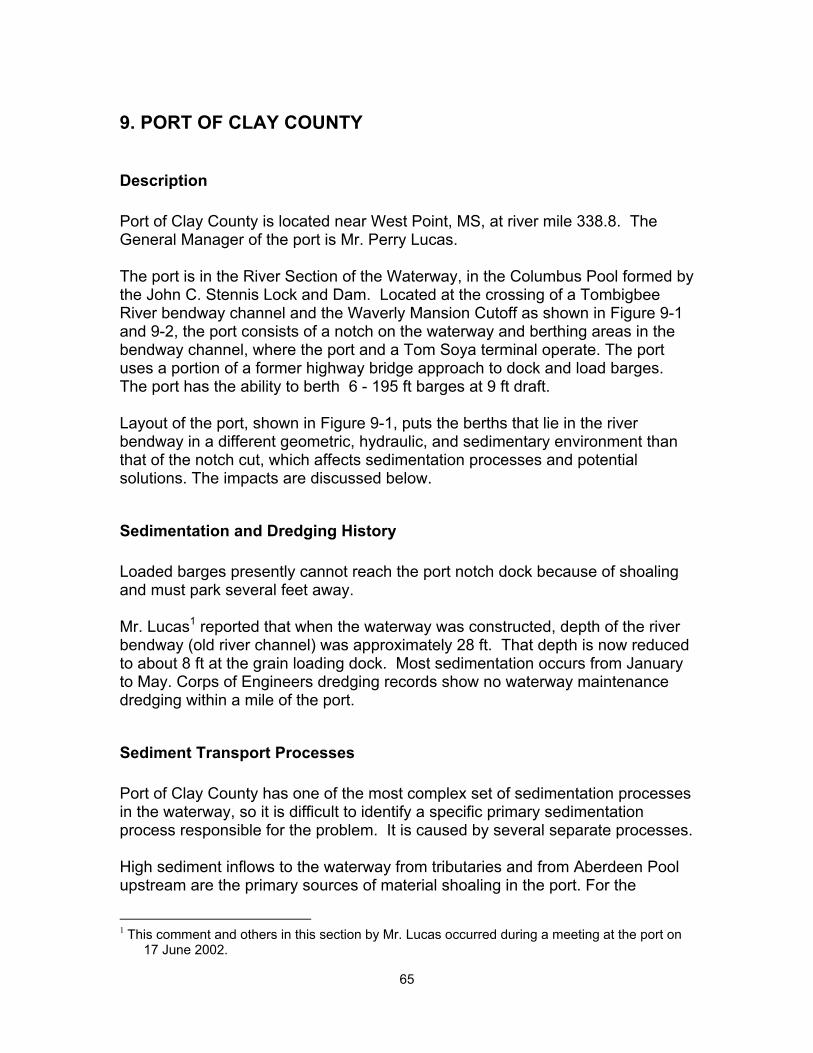
9. PORT OF CLAY COUNTY
Description Port of Clay County is located near West Point, MS, at river mile 338.8. The General Manager of the port is Mr. Perry Lucas. The port is in the River Section of the Waterway, in the Columbus Pool formed by the John C. Stennis Lock and Dam. Located at the crossing of a Tombigbee River bendway channel and the Waverly Mansion Cutoff as shown in Figure 9-1 and 9-2, the port consists of a notch on the waterway and berthing areas in the bendway channel, where the port and a Tom Soya terminal operate. The port uses a portion of a former highway bridge approach to dock and load barges. The port has the ability to berth 6 - 195 ft barges at 9 ft draft. Layout of the port, shown in Figure 9-1, puts the berths that lie in the river bendway in a different geometric, hydraulic, and sedimentary environment than that of the notch cut, which affects sedimentation processes and potential solutions. The impacts are discussed below.
Sedimentation and Dredging History Loaded barges presently cannot reach the port notch dock because of shoaling and must park several feet away. Mr. Lucas1 reported that when the waterway was constructed, depth of the river bendway (old river channel) was approximately 28 ft. That depth is now reduced to about 8 ft at the grain loading dock. Most sedimentation occurs from January to May. Corps of Engineers dredging records show no waterway maintenance dredging within a mile of the port.
Sediment Transport Processes Port of Clay County has one of the most complex set of sedimentation processes in the waterway, so it is difficult to identify a specific primary sedimentation process responsible for the problem. It is caused by several separate processes. High sediment inflows to the waterway from tributaries and from Aberdeen Pool upstream are the primary sources of material shoaling in the port. For the
1 This comment and others in this section by Mr. Lucas occurred during a meeting at the port on
17 June 2002.
65
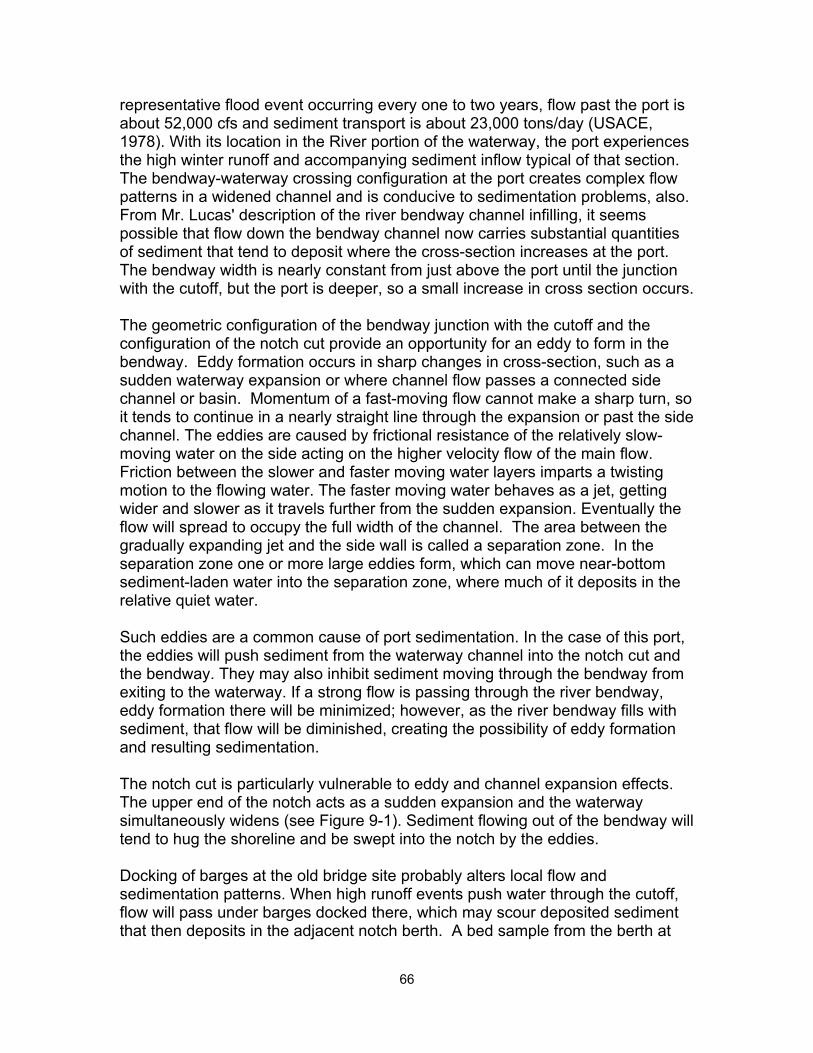
representative flood event occurring every one to two years, flow past the port is about 52,000 cfs and sediment transport is about 23,000 tons/day (USACE, 1978). With its location in the River portion of the waterway, the port experiences the high winter runoff and accompanying sediment inflow typical of that section. The bendway-waterway crossing configuration at the port creates complex flow patterns in a widened channel and is conducive to sedimentation problems, also. From Mr. Lucas' description of the river bendway channel infilling, it seems possible that flow down the bendway channel now carries substantial quantities of sediment that tend to deposit where the cross-section increases at the port. The bendway width is nearly constant from just above the port until the junction with the cutoff, but the port is deeper, so a small increase in cross section occurs. The geometric configuration of the bendway junction with the cutoff and the configuration of the notch cut provide an opportunity for an eddy to form in the bendway. Eddy formation occurs in sharp changes in cross-section, such as a sudden waterway expansion or where channel flow passes a connected side channel or basin. Momentum of a fast-moving flow cannot make a sharp turn, so it tends to continue in a nearly straight line through the expansion or past the side channel. The eddies are caused by frictional resistance of the relatively slow-moving water on the side acting on the higher velocity flow of the main flow. Friction between the slower and faster moving water layers imparts a twisting motion to the flowing water. The faster moving water behaves as a jet, getting wider and slower as it travels further from the sudden expansion. Eventually the flow will spread to occupy the full width of the channel. The area between the gradually expanding jet and the side wall is called a separation zone. In the separation zone one or more large eddies form, which can move near-bottom sediment-laden water into the separation zone, where much of it deposits in the relative quiet water. Such eddies are a common cause of port sedimentation. In the case of this port, the eddies will push sediment from the waterway channel into the notch cut and the bendway. They may also inhibit sediment moving through the bendway from exiting to the waterway. If a strong flow is passing through the river bendway, eddy formation there will be minimized; however, as the river bendway fills with sediment, that flow will be diminished, creating the possibility of eddy formation and resulting sedimentation. The notch cut is particularly vulnerable to eddy and channel expansion effects. The upper end of the notch acts as a sudden expansion and the waterway simultaneously widens (see Figure 9-1). Sediment flowing out of the bendway will tend to hug the shoreline and be swept into the notch by the eddies. Docking of barges at the old bridge site probably alters local flow and sedimentation patterns. When high runoff events push water through the cutoff, flow will pass under barges docked there, which may scour deposited sediment that then deposits in the adjacent notch berth. A bed sample from the berth at
66
the bridge (provided by Mr. Lucas) in June 2002 (low flow period) consisted of a black organic mud with mostly fine-grained sediment particles. It would almost certainly be eroded by high river flows. Visible sediment plumes from tug prop wash are reported by tug pilots in the vicinity of the port and other locations in the waterway, so during low flow seasons vessel resuspension of sediment may be contributing to deposition in the port. Sediment suspension by tow traffic is am primary contributor to shoaling in ports in the Canal and Divide Cut sections, but the higher waterway flow at the Port of Clay County during much of the year will tend to sweep much of the tow-suspended sediment downstream before it can flow into the port. As tows pass the port they suspend fine sediment from the center of the waterway (see Chapter 3) which, in the absence of strong currents, moves as a near-bottom density flow into the port and deposits. Tow-suspended sediment deposits as a very low density, fluffy mixture of water, sediment grains, and organic material, which can be easily resuspended for a time (on the order of days). As it remains in place and is buried by new deposits, it will expel pore water and consolidate to a more dense, more erosion-resistant sediment bed. The bed sample cited above could have been material originating from tow-induced sedimentation. We believe tow-induced sedimentation to be a smaller contribution to Port of Clay County sedimentation compared with sediment delivered by flow. We estimate that the annual sedimentation rate for the public portion of the port is in the range of 4,000 to 12,000 cu yd, with perhaps 90 percent of that occurring in the notch cut.
Engineering Solutions If transport through the cutoff channel were the only substantial source of shoaling material, then any of several approaches might reduce port sedimentation. However, since eddy formation may be a significant contributor during high flows, and tow-induced sedimentation may contribute during low flows, it’s unlikely that a single solution approach will provide a substantial improvement. Four possible solutions are considered here:
a. Training structures that constrict flow in the bendway adjacent to the port b. Dredging a sediment trap at the upstream end of the bendway or port c. Smoothing the upstream corner of the notch d. Training structures to reduce eddy formation e. Agitation of deposited sediment by propwash
Approach (a) can be accomplished building transverse dikes from the east bank of the river bendway toward the navigation channel. Transverse dikes can be
67
perpendicular to the flow or angled. The Corps of Engineers has experienced considerable success with dikes angled slightly (about 30 degrees) in the upstream direction, with a particular design called bendway weirs that have been used with success in several small streams and on the Mississippi River. Dikes angled downstream are not recommended since they tend to cause bank erosion on the downstream side. Dikes can be effective at reasonable cost within the river bendway and at the highway bridge dock, but not at the notch cut since the waterway is so wide at that point. Approach (b) will require dredging to create and maintain the sediment trap, but will localize the dredging outside the berthing areas, making it less expensive, less disruptive, and more amenable to permanent plant to accomplish the removal of accumulated sediment. However, if formation of an eddy at the bendway-cutoff junction is a significant cause of sedimentation, both training dikes in the bendway and an upstream sediment trap will be of limited value in preventing sedimentation in the notch. For the case of eddy-induced sedimentation, two types of solutions can be used – smoothing the transition and training the flow with structures. Smoothing the transition requires that the increase in cross-section occur gradually – at a 1 on 10 to 1 on 20 slope. Such a solution is impractical at the bendway-cutoff junction, for it will widen the channel so much as to cause sediment deposition by itself. It is also impractical for the port notch, since an excavation to smooth the upstream end of the notch will not contribute materially to waterway cross-section where it is already growing wider in the downstream direction (see Figure 9-1). A training dike extending downstream from the tip of the island, parallel to the navigation channel, may prevent or reduce eddy formation, but may also make tow access to the port more difficult. A downstream end top elevation that is submerged during high flow events will increase the effectiveness of such a structure, but a submerged design will require careful marking so as to avoid vessels accidentally striking the structure. A dike length on the order of 200 ft would both constrict the channel and limit (but not eliminate) eddy formation. An alternative form of training structure that has been successfully used in the Port of Hamburg, Germany, is the Current Deflecting Wall, a patented device that consists of a curved wall located on the upstream end of the junction. (See section 4.) Such a structure could be used both at the junction and in the notch. Other structure solutions to eddy formation are available, but are not considered further here. Tow-suspended sediment deposition will be not be significantly reduced by the structural methods described above. Deposits in the central portion of the port may be scoured during high flow events, but erosion may be inhibited by consolidation of the sediment and deposits near the wall and in corners are likely to remain. They can be removed by agitation during high flow events using
68
propwash from a workboat to disturb and resuspend them so that water way currents can wash them downstream. The variety of probable sedimentation causes in the port and uncertainty about their relative magnitudes make it impossible to recommend a specific solution design. The uncertainty can be resolved only by a program of detailed field measurements and numerical modeling of the port and adjacent waterway. Measurements will include flow velocities and sediment sampling under at least three conditions – normal summer flow, normal winter flow, and a flood event representing a recurrence interval of 1 to 2 years. At least three cross-sections (bendway above port, cutoff above junction, and junction) should be sampled, with measurements at 4 equally spaced locations on each cross-section and 3 depths at each location. The port should have a hydrographic survey, covering the bendway from above the port through the junction, performed before the measurement period and after the measurements are complete. The numerical model should be a 3-dimensional flow and sediment transport model of the port area, with upstream boundary at or above about Mile 340 and downstream boundary at or below about Mile 338.
Design and Cost General designs and approximate costs of some representative solutions are offered so that the magnitude of such measures can be understood before embarking on further studies. Constricting flow in the channel adjacent to the port can be accomplished by building one to several short training dikes from the shore of the island as shown in Figure 9-3. Dikes above the junction would need to be only about 60 ft long and would cost about $8000 if constructed with a soil core and a riprap cover and about $32,000 if constructed of solid riprap. A dike from the tip of the island, as shown, will need to be as much as 260 ft long and cost from $55,000 to $252,000, depending on construction material. (See Appendix D.) A Current Deflector Wall that will remedy sedimentation caused by eddy formation at the junction of river and cutoff channel is shown schematically in Figure 9-5. A Current Deflecting Wall must be designed by the patent holders, so no further design or cost information is given here. If the port wishes to pursue the concept, we can provide contact information for the patent holders. A sediment trap in the river above the port can be designed to intercept sediment and hold it until dredging can be performed. A sediment trap designed for material in transport in the area is discussed in Appendix D. The cost is estimated to be $55,000 to $408,000. Regular maintenance dredging of the sediment trap will be required to maintain its effectiveness. The combination of a
69
comparatively high initial cost with continued maintenance costs makes a sediment trap impractical here. Smoothing of the notch cut can be accomplished by excavating land between the notch and the old bridge berth, as shown in Figure 9-6. As described in Appendix D, the estimated cost to excavate that area and protect the exposed side slopes with a riprap blanket will cost between $50,000 and $150,000, with the lower range applying to dry excavation and near-by disposal and the higher figure applying to dredging and/or further excavation. In addition to the cost, this design removes land from the port area, but adds potential berth space. It is unlikely to cause enough of a sedimentation reduction to justify the cost. Resuspension of deposited fine-grained material can be achieved by propeller agitation, in which a vessel (such as a tugboat) runs its propeller at a high rate in all areas of the port to disrupt and resuspend the deposited sediment. Once resuspended, ambient currents will tend to move the sediment downstream, but some will redeposit in the port unless a strong current is present. Agitation of bed sediments should be accomplished during high flow events, starting at the upstream end of the port and gradually working toward the downstream end of the port. Several passes may be needed. Agitation can be scheduled so as not to conflict with other port operations or access. The use of propeller agitation to resuspend deposited material will have no initial cost if the port has access to use or hire a high horsepower work boat that can be used for this task. Table 9-1 shows an estimated cost for agitation. Table 9-1 Estimated Hourly costs1 for propeller agitation by tug Horsepower Hourly Cost 6 Hour Total 2000 HP $250.00 $1500.00 1350 HP $160.00 $960.00 If agitation were performed for two days twice a year, the annual cost would be $4,000 to 6,000 per year.
Recommendations Agitation dredging is a comparatively low cost option, so it can be tried and evaluated before any other actions are seriously considered; however, it will work well only with very fine (silts and clay size) sediments, which may not be the largest part of the problem. We recommend that the notch cut be left to natural processes and not maintained. Any action that will reduce sedimentation there is likely to be cost
1 Personal communication with Charlie Haun of Parker Towing, Tuscaloosa, AL, September
2003.
70
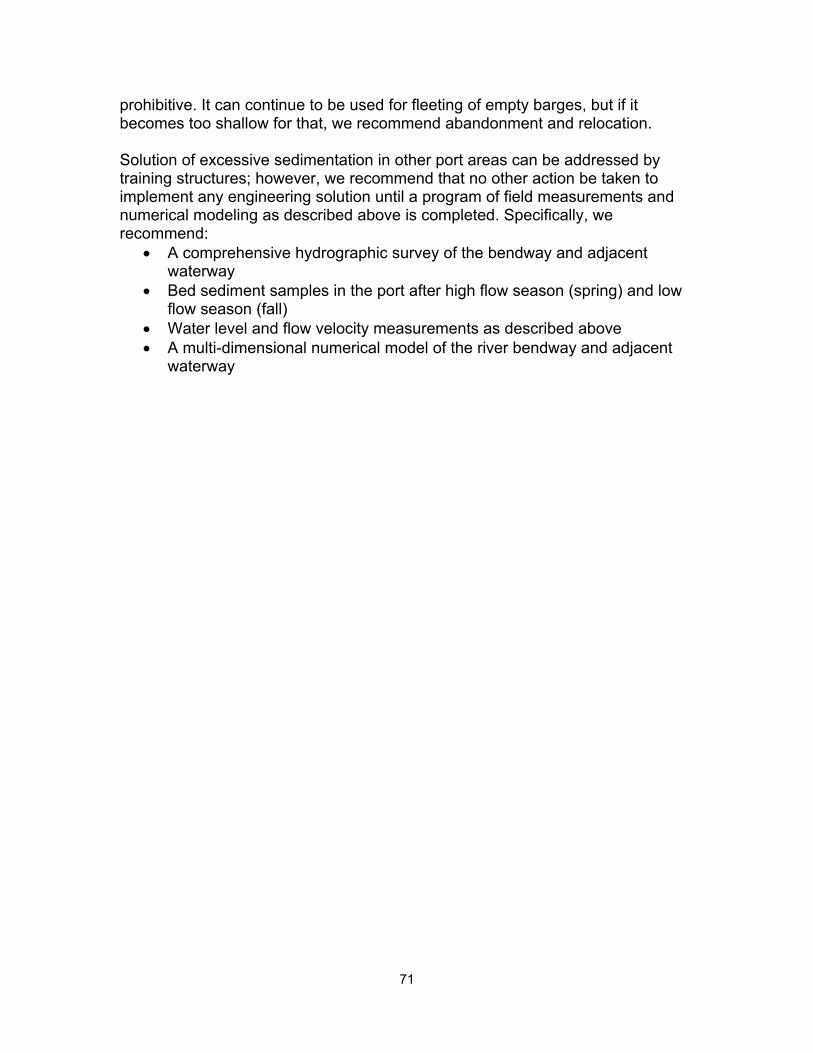
prohibitive. It can continue to be used for fleeting of empty barges, but if it becomes too shallow for that, we recommend abandonment and relocation. Solution of excessive sedimentation in other port areas can be addressed by training structures; however, we recommend that no other action be taken to implement any engineering solution until a program of field measurements and numerical modeling as described above is completed. Specifically, we recommend:
• A comprehensive hydrographic survey of the bendway and adjacent waterway
• Bed sediment samples in the port after high flow season (spring) and low flow season (fall)
• Water level and flow velocity measurements as described above • A multi-dimensional numerical model of the river bendway and adjacent
waterway
71
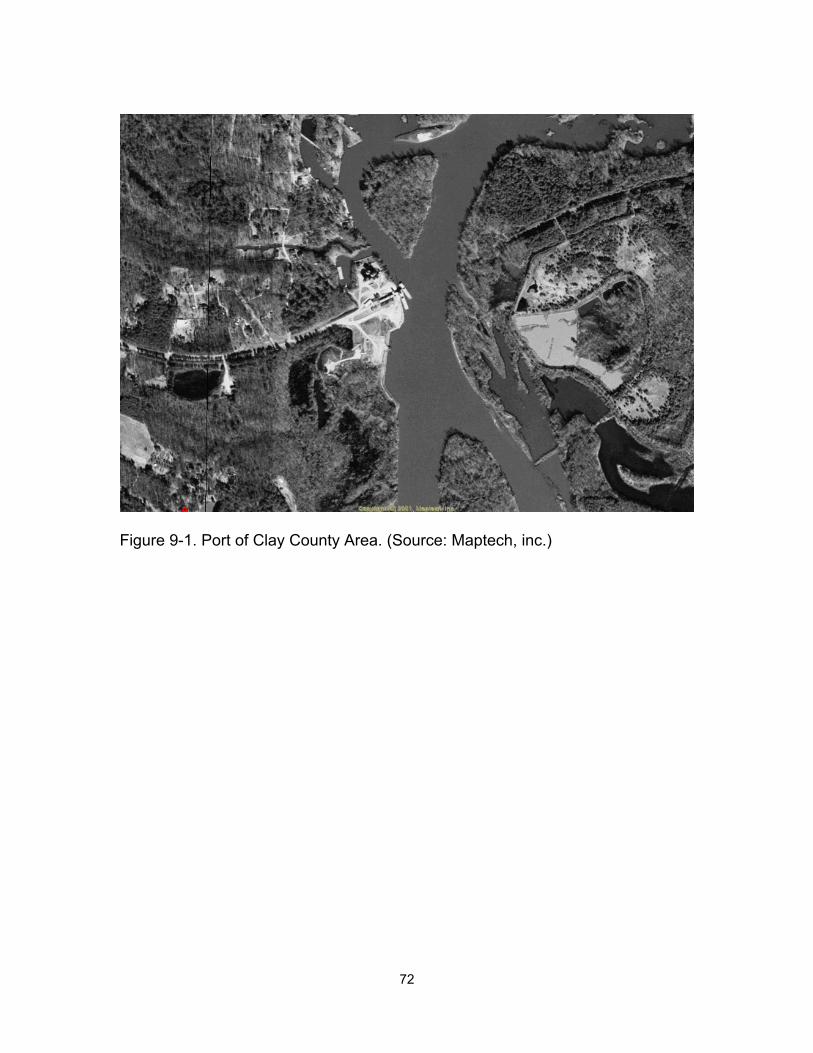
Figure 9-1. Port of Clay County Area. (Source: Maptech, inc.)
72
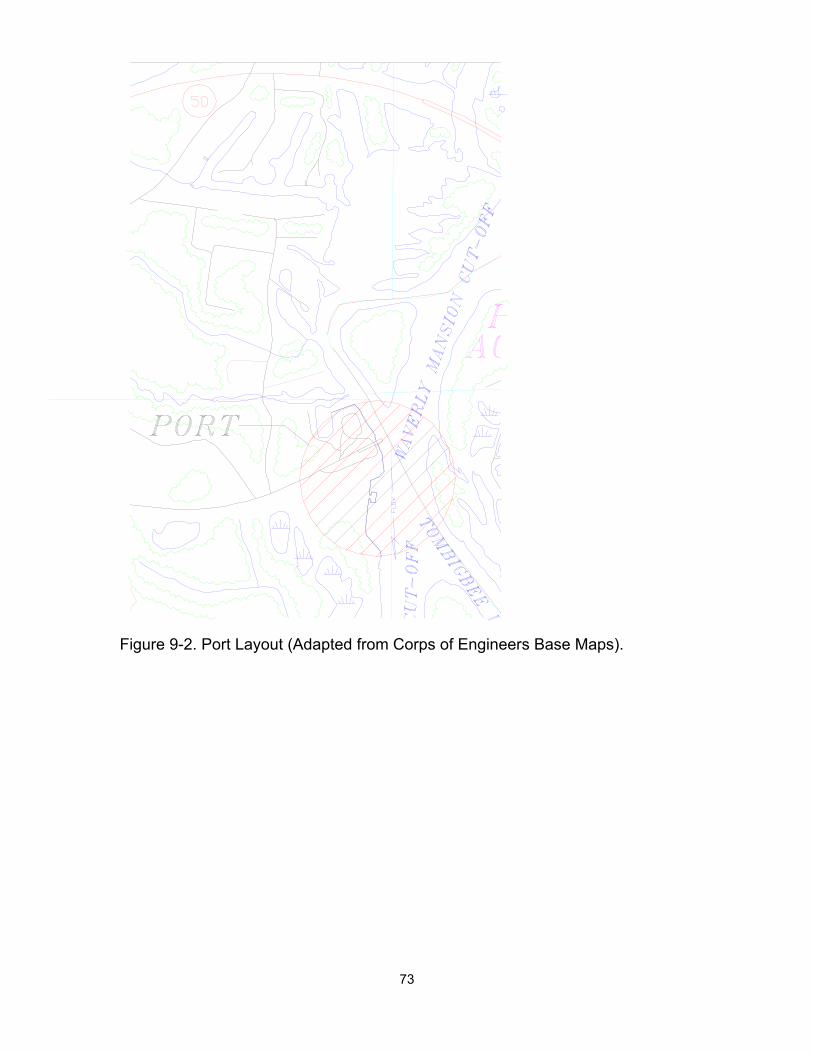
Figure 9-2. Port Layout (Adapted from Corps of Engineers Base Maps).
73
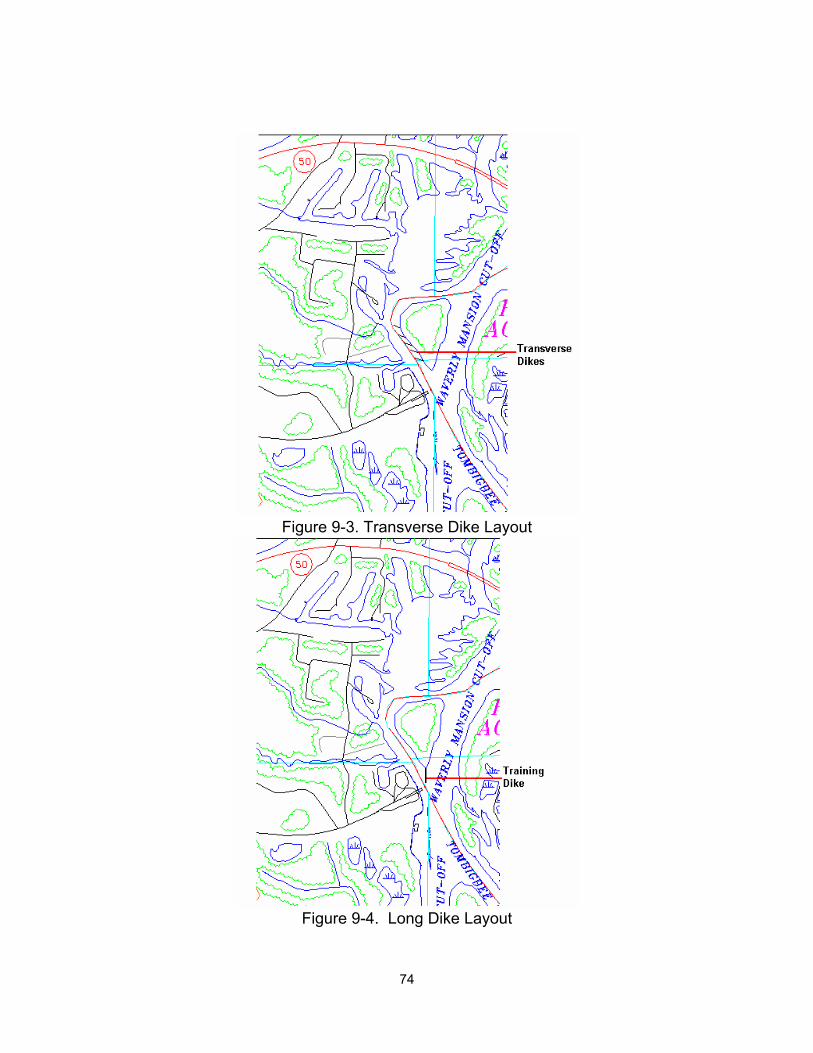
Figure 9-3. Transverse Dike Layout
Figure 9-4. Long Dike Layout
74
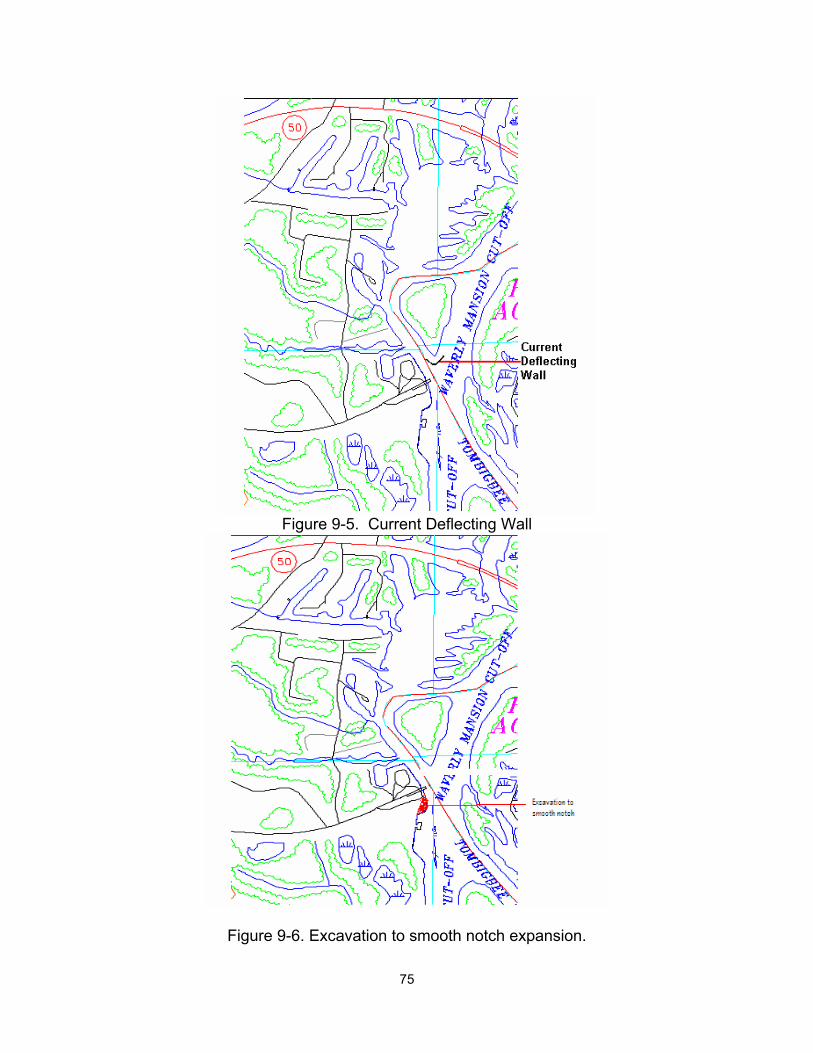
Figure 9-5. Current Deflecting Wall
Figure 9-6. Excavation to smooth notch expansion.
75
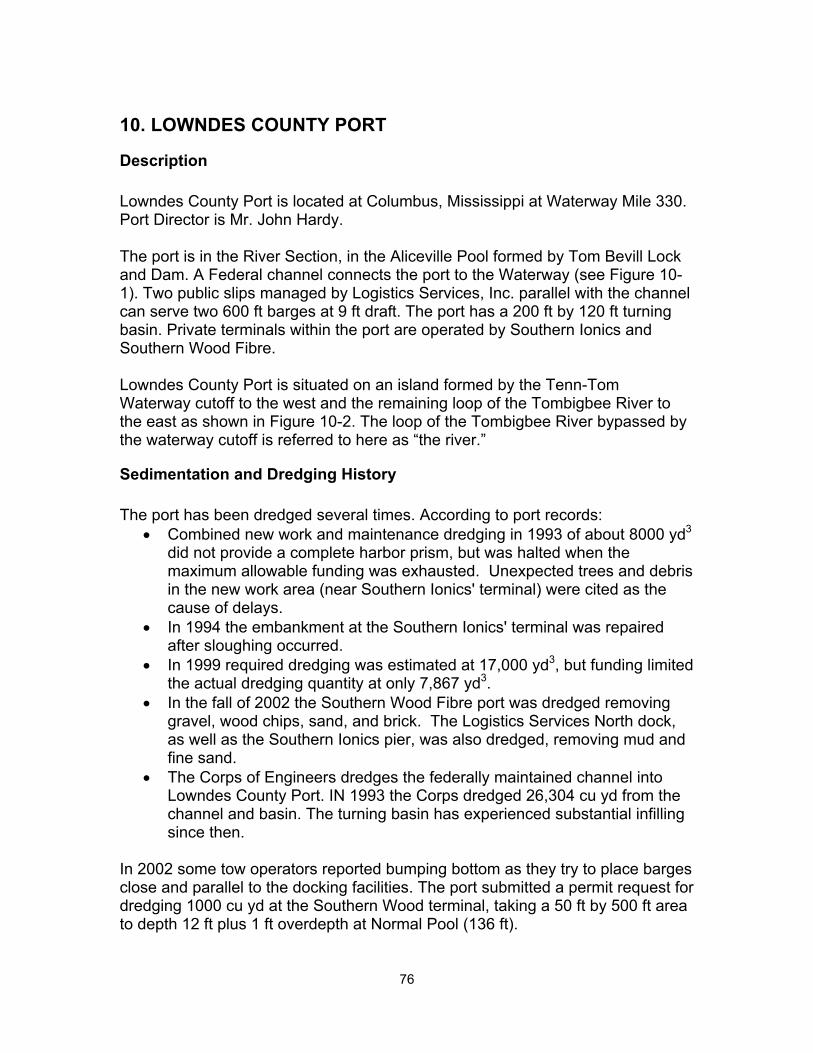
10. LOWNDES COUNTY PORT
Description Lowndes County Port is located at Columbus, Mississippi at Waterway Mile 330. Port Director is Mr. John Hardy. The port is in the River Section, in the Aliceville Pool formed by Tom Bevill Lock and Dam. A Federal channel connects the port to the Waterway (see Figure 10-1). Two public slips managed by Logistics Services, Inc. parallel with the channel can serve two 600 ft barges at 9 ft draft. The port has a 200 ft by 120 ft turning basin. Private terminals within the port are operated by Southern Ionics and Southern Wood Fibre. Lowndes County Port is situated on an island formed by the Tenn-Tom Waterway cutoff to the west and the remaining loop of the Tombigbee River to the east as shown in Figure 10-2. The loop of the Tombigbee River bypassed by the waterway cutoff is referred to here as “the river.”
Sedimentation and Dredging History The port has been dredged several times. According to port records:
• Combined new work and maintenance dredging in 1993 of about 8000 yd3 did not provide a complete harbor prism, but was halted when the maximum allowable funding was exhausted. Unexpected trees and debris in the new work area (near Southern Ionics' terminal) were cited as the cause of delays.
• In 1994 the embankment at the Southern Ionics' terminal was repaired after sloughing occurred.
• In 1999 required dredging was estimated at 17,000 yd3, but funding limited the actual dredging quantity at only 7,867 yd3.
• In the fall of 2002 the Southern Wood Fibre port was dredged removing gravel, wood chips, sand, and brick. The Logistics Services North dock, as well as the Southern Ionics pier, was also dredged, removing mud and fine sand.
• The Corps of Engineers dredges the federally maintained channel into Lowndes County Port. IN 1993 the Corps dredged 26,304 cu yd from the channel and basin. The turning basin has experienced substantial infilling since then.
In 2002 some tow operators reported bumping bottom as they try to place barges close and parallel to the docking facilities. The port submitted a permit request for dredging 1000 cu yd at the Southern Wood terminal, taking a 50 ft by 500 ft area to depth 12 ft plus 1 ft overdepth at Normal Pool (136 ft).
76
The port uses an on-site confined dredged material placement area. Dredged material (from the 1999 dredging) in the disposal area consists of sandy silt with a significant fraction of large gravel near the disposal discharge point and organic mud at the far end of the disposal site. Corps of Engineers' dredging records show some maintenance dredging of the Waterway above and below the port channel in 1991 and 1993.
Field Investigations Measurements made in the port in March 2003 included bed sediment samples, water samples, turbidity and water depths. Bed sediments exhibited mean grain sizes ranging from 0.15 mm to .25 mm. (Grab samples from the bed of the port area in October 2002 consisted of very soft organic black mud with a small fraction of fine sand.) Total suspended sediment concentrations ranged from about 20 mg/l to 70 mg/l. Data and calculations are shown in Appendix C. Figure 10-3 shows two cross-sectional profiles in the port taken in March 2003.They show that the upper end of the port, including the turning basin, has the greatest loss of depth.
Sediment Transport Processes Mr. Hardy believes that most shoaling occurs during the high water season of January-April, and that dryer years produce less shoaling1. During high flows on the Waterway, currents exceeding 3 ft per sec are observed in the river channel. The location of the port and its dredging history suggest that the primary source of sediment depositing in the port is transport through the river channel. That channel has a maximum depth of 15 to 20 ft over much of its length, but is shallow (less than 5 ft) at its upstream junction with the Waterway. During high flow events sand may be moved through the river channel, depositing when it reaches the enlarged cross-section of the port area as described in Part 3. The data described above, along with observations of depth from a depth-sounder aboard the data collection boat, suggest that the port is filling from the upstream direction and adjacent to the terminals. These depositional patterns are consistent with a sediment supply from upstream, redistribution of deposited sediment by high flows and vessel agitation, and slumping of side slopes. Inspection of the topography shown in Figure 10-2 shows that within the port property, the land rises to elevation 160 ft NAD within 50 ft of the river, either uniformly in a steep, riprapped slope or in two steps with an intervening flatter 1 This observation and others in this section were expressed by Mr. Hardy during at meeting in Columbus on 12 June 2002.
77
slope. On average, the slope is about 1:3 (1 ft vertical on 3 ft horizontal). On the east bank opposite the port the slope is more variable, with a small urban catchment draining to the river near the upstream end of the port and a low area surrounding Lake Catherine just opposite the central portion of the port. Around Lake Catherine the 160 ft contour is as much as half a mile from the normal pool water level. At these locations the flow velocity will be even lower than in the other areas of the port and increased deposition rates can be expected during times of bed material transport through the river. Simple calculations of bed sediment transport rates with a uniform cross-section (see Appendix C) suggest that the river reach above the port has a transport capacity about 26 percent greater than the port reach for a representative high flow event. The design event was the 1.5 year return discharge, the flow that occurs on average every one to two years. The 1.5 year event is commonly used as representative of the flows that move most of the sediment in a river and corresponds qualitatively to Mr. Hardy’s observations of maximum port sedimentation. Appendix C shows that water levels in the port area will be at about 159 ft NAD during the 1.5 year event. During the design event, then, about 26 percent of the bed material in transport will deposit in the port reach, with the greatest accumulations near the berthing areas and at the locations where the distance between the east and west 160 ft contours bracketing the river are greatest. The annual sedimentation rate in the port, exclusive of the Federal channel, is 3,000 to 10,000 cu yd.
Engineering Solutions If transport through the cutoff channel is the only substantial source of shoaling material, then any of several approaches might reduce port sedimentation. Judged on the basis of probability of effectiveness, safety, and environmental quality, two of the possible solutions are recommended:
a. Constricting flow in the river adjacent to the port so as to pass sediment from upstream on through the port
b. Dredging a sediment trap at the upstream end of the river or the port. Approach (a) is the preferred alternative, for it will reduce the overall dredging requirement and will provide improved fish habitat as described in Chapter 4. It can be accomplished in several ways, including transverse dikes built from the east bank of the river toward the navigation channel or a longitudinal training wall parallel to the channel. Transverse dikes can be perpendicular to the flow or angled. The Corps of Engineers has experienced considerable success with dikes angled slightly (about 30 degrees) in the upstream direction, with a particular design called bendway weirs that have been used with success in several small streams and on the Mississippi River. Dikes angled downstream
78
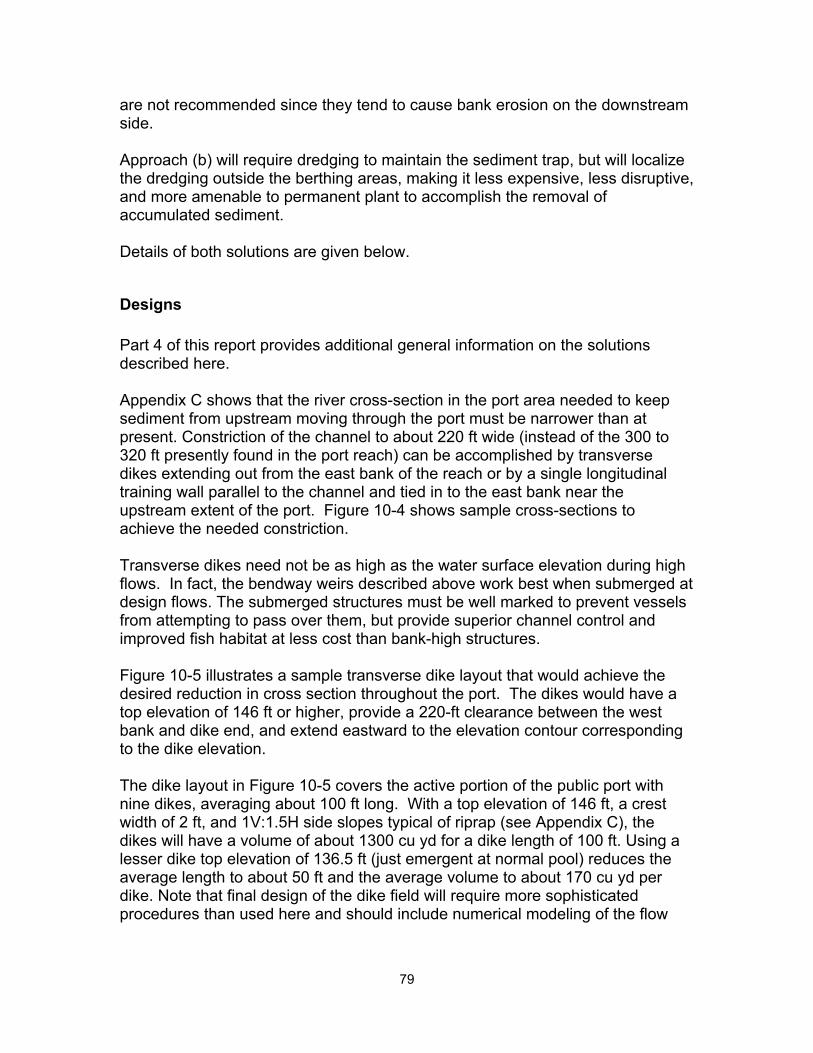
are not recommended since they tend to cause bank erosion on the downstream side. Approach (b) will require dredging to maintain the sediment trap, but will localize the dredging outside the berthing areas, making it less expensive, less disruptive, and more amenable to permanent plant to accomplish the removal of accumulated sediment. Details of both solutions are given below.
Designs Part 4 of this report provides additional general information on the solutions described here. Appendix C shows that the river cross-section in the port area needed to keep sediment from upstream moving through the port must be narrower than at present. Constriction of the channel to about 220 ft wide (instead of the 300 to 320 ft presently found in the port reach) can be accomplished by transverse dikes extending out from the east bank of the reach or by a single longitudinal training wall parallel to the channel and tied in to the east bank near the upstream extent of the port. Figure 10-4 shows sample cross-sections to achieve the needed constriction. Transverse dikes need not be as high as the water surface elevation during high flows. In fact, the bendway weirs described above work best when submerged at design flows. The submerged structures must be well marked to prevent vessels from attempting to pass over them, but provide superior channel control and improved fish habitat at less cost than bank-high structures. Figure 10-5 illustrates a sample transverse dike layout that would achieve the desired reduction in cross section throughout the port. The dikes would have a top elevation of 146 ft or higher, provide a 220-ft clearance between the west bank and dike end, and extend eastward to the elevation contour corresponding to the dike elevation. The dike layout in Figure 10-5 covers the active portion of the public port with nine dikes, averaging about 100 ft long. With a top elevation of 146 ft, a crest width of 2 ft, and 1V:1.5H side slopes typical of riprap (see Appendix C), the dikes will have a volume of about 1300 cu yd for a dike length of 100 ft. Using a lesser dike top elevation of 136.5 ft (just emergent at normal pool) reduces the average length to about 50 ft and the average volume to about 170 cu yd per dike. Note that final design of the dike field will require more sophisticated procedures than used here and should include numerical modeling of the flow
79
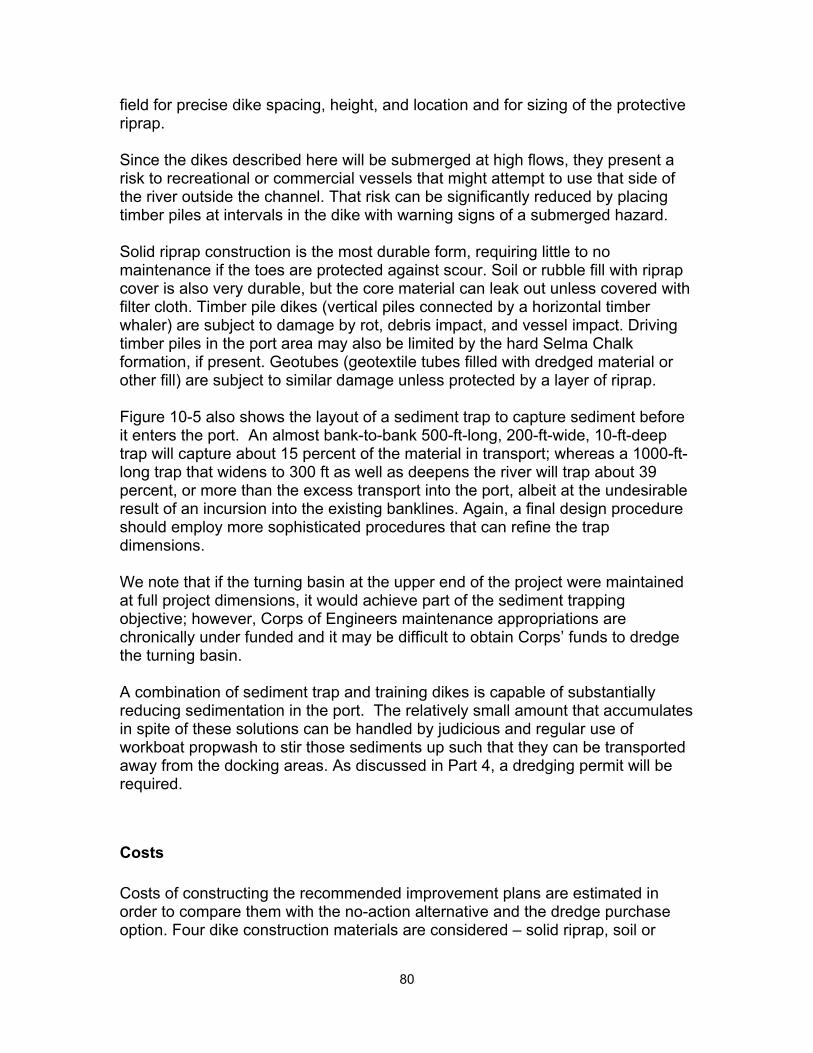
field for precise dike spacing, height, and location and for sizing of the protective riprap. Since the dikes described here will be submerged at high flows, they present a risk to recreational or commercial vessels that might attempt to use that side of the river outside the channel. That risk can be significantly reduced by placing timber piles at intervals in the dike with warning signs of a submerged hazard. Solid riprap construction is the most durable form, requiring little to no maintenance if the toes are protected against scour. Soil or rubble fill with riprap cover is also very durable, but the core material can leak out unless covered with filter cloth. Timber pile dikes (vertical piles connected by a horizontal timber whaler) are subject to damage by rot, debris impact, and vessel impact. Driving timber piles in the port area may also be limited by the hard Selma Chalk formation, if present. Geotubes (geotextile tubes filled with dredged material or other fill) are subject to similar damage unless protected by a layer of riprap. Figure 10-5 also shows the layout of a sediment trap to capture sediment before it enters the port. An almost bank-to-bank 500-ft-long, 200-ft-wide, 10-ft-deep trap will capture about 15 percent of the material in transport; whereas a 1000-ft-long trap that widens to 300 ft as well as deepens the river will trap about 39 percent, or more than the excess transport into the port, albeit at the undesirable result of an incursion into the existing banklines. Again, a final design procedure should employ more sophisticated procedures that can refine the trap dimensions. We note that if the turning basin at the upper end of the project were maintained at full project dimensions, it would achieve part of the sediment trapping objective; however, Corps of Engineers maintenance appropriations are chronically under funded and it may be difficult to obtain Corps’ funds to dredge the turning basin. A combination of sediment trap and training dikes is capable of substantially reducing sedimentation in the port. The relatively small amount that accumulates in spite of these solutions can be handled by judicious and regular use of workboat propwash to stir those sediments up such that they can be transported away from the docking areas. As discussed in Part 4, a dredging permit will be required.
Costs Costs of constructing the recommended improvement plans are estimated in order to compare them with the no-action alternative and the dredge purchase option. Four dike construction materials are considered – solid riprap, soil or
80
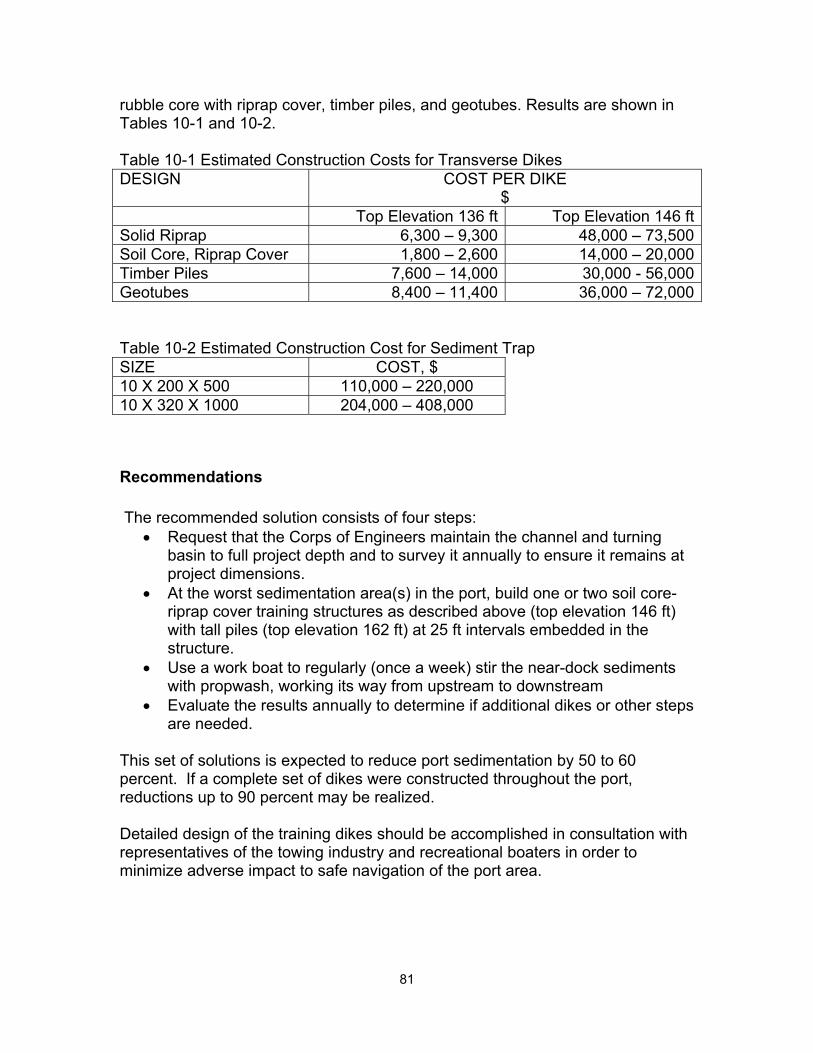
rubble core with riprap cover, timber piles, and geotubes. Results are shown in Tables 10-1 and 10-2. Table 10-1 Estimated Construction Costs for Transverse Dikes DESIGN COST PER DIKE
$ Top Elevation 136 ft Top Elevation 146 ftSolid Riprap 6,300 – 9,300 48,000 – 73,500Soil Core, Riprap Cover 1,800 – 2,600 14,000 – 20,000Timber Piles 7,600 – 14,000 30,000 - 56,000Geotubes 8,400 – 11,400 36,000 – 72,000 Table 10-2 Estimated Construction Cost for Sediment Trap SIZE COST, $ 10 X 200 X 500 110,000 – 220,000 10 X 320 X 1000 204,000 – 408,000
Recommendations The recommended solution consists of four steps:
• Request that the Corps of Engineers maintain the channel and turning basin to full project depth and to survey it annually to ensure it remains at project dimensions.
• At the worst sedimentation area(s) in the port, build one or two soil core-riprap cover training structures as described above (top elevation 146 ft) with tall piles (top elevation 162 ft) at 25 ft intervals embedded in the structure.
• Use a work boat to regularly (once a week) stir the near-dock sediments with propwash, working its way from upstream to downstream
• Evaluate the results annually to determine if additional dikes or other steps are needed.
This set of solutions is expected to reduce port sedimentation by 50 to 60 percent. If a complete set of dikes were constructed throughout the port, reductions up to 90 percent may be realized. Detailed design of the training dikes should be accomplished in consultation with representatives of the towing industry and recreational boaters in order to minimize adverse impact to safe navigation of the port area.
81
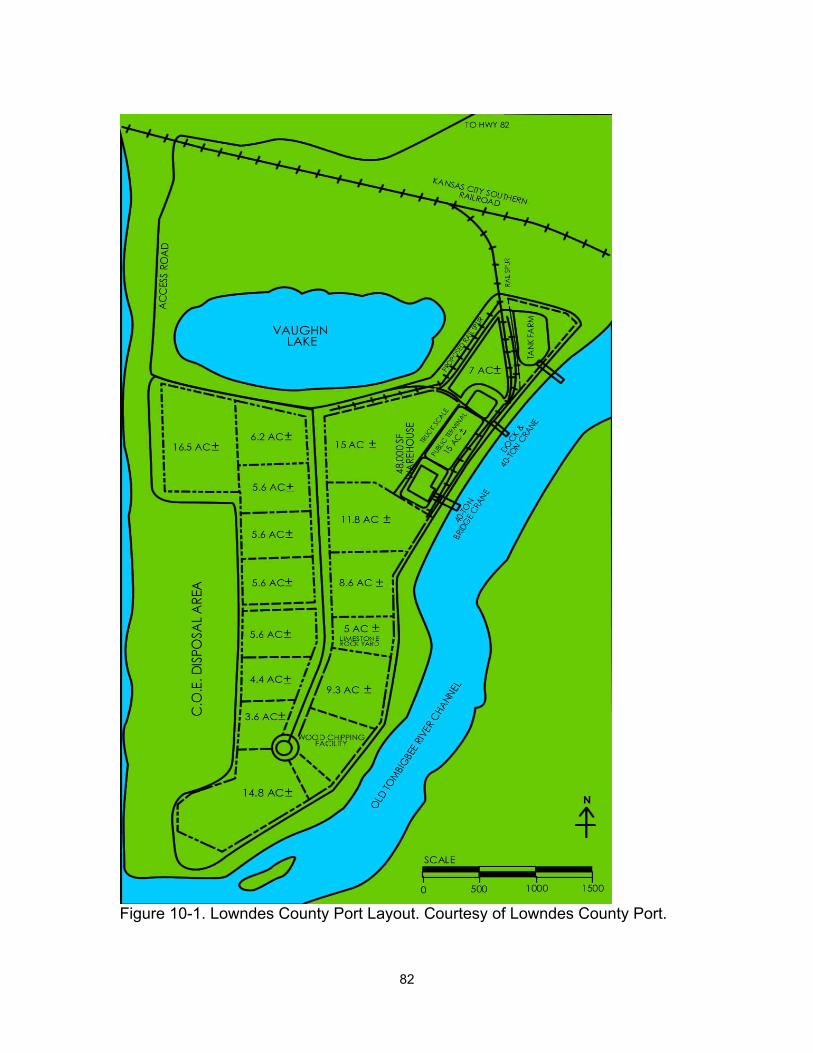
Figure 10-1. Lowndes County Port Layout. Courtesy of Lowndes County Port.
82
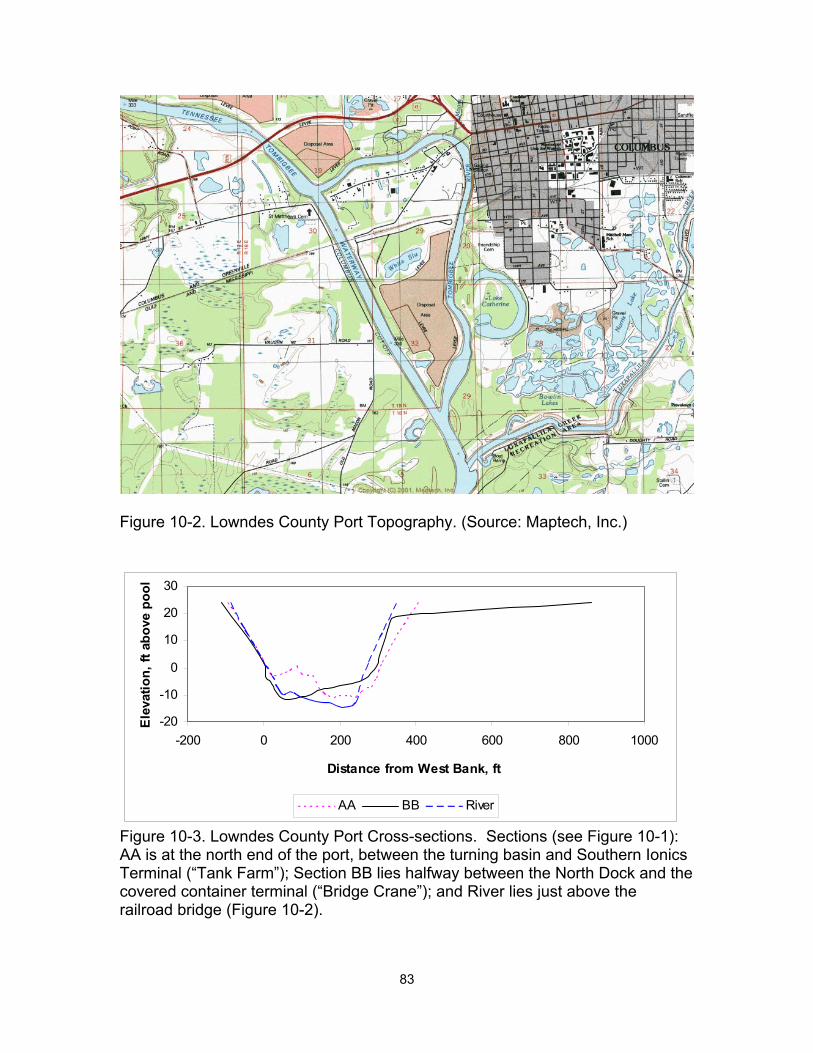
Figure 10-2. Lowndes County Port Topography. (Source: Maptech, Inc.)
-20
-10
0
10
20
30
-200 0 200 400 600 800 1000
Distance from West Bank, ft
Ele
vatio
n, ft
abo
ve p
ool
AA BB River
Figure 10-3. Lowndes County Port Cross-sections. Sections (see Figure 10-1): AA is at the north end of the port, between the turning basin and Southern Ionics Terminal (“Tank Farm”); Section BB lies halfway between the North Dock and the covered container terminal (“Bridge Crane”); and River lies just above the railroad bridge (Figure 10-2).
83
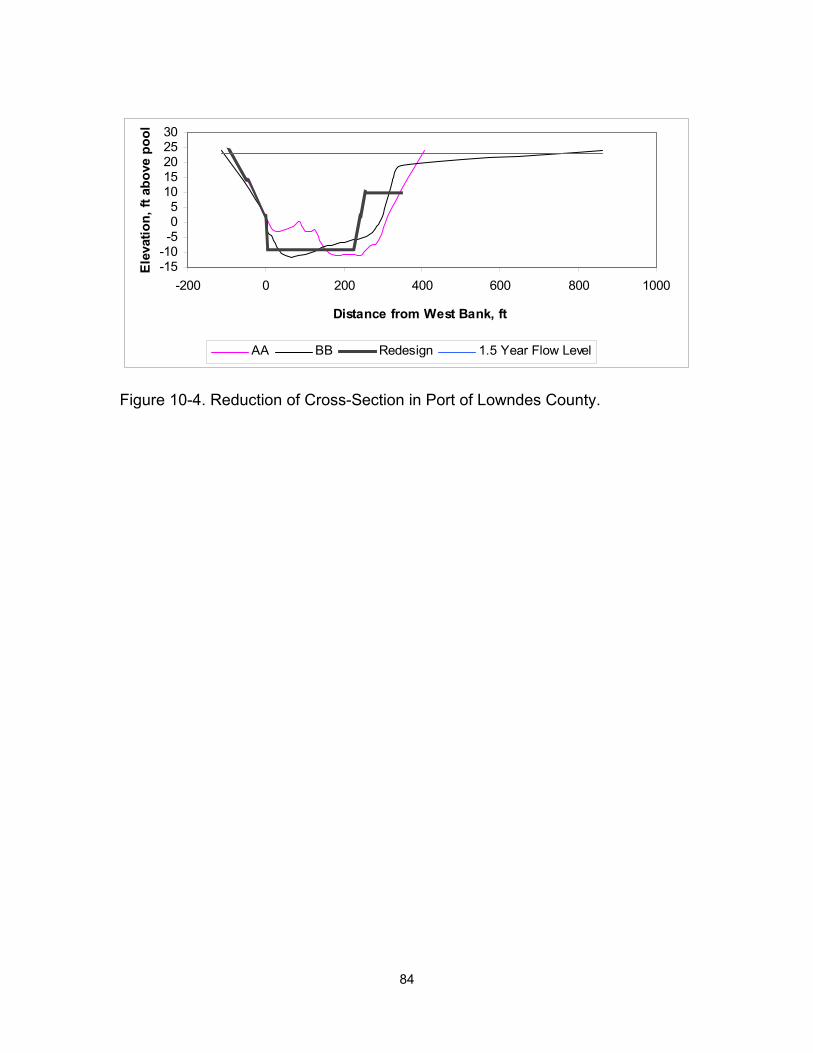
-15-10-505
1015202530
-200 0 200 400 600 800 1000
Distance from West Bank, ft
Ele
vatio
n, ft
abo
ve p
ool
AA BB Redesign 1.5 Year Flow Level
Figure 10-4. Reduction of Cross-Section in Port of Lowndes County.
84
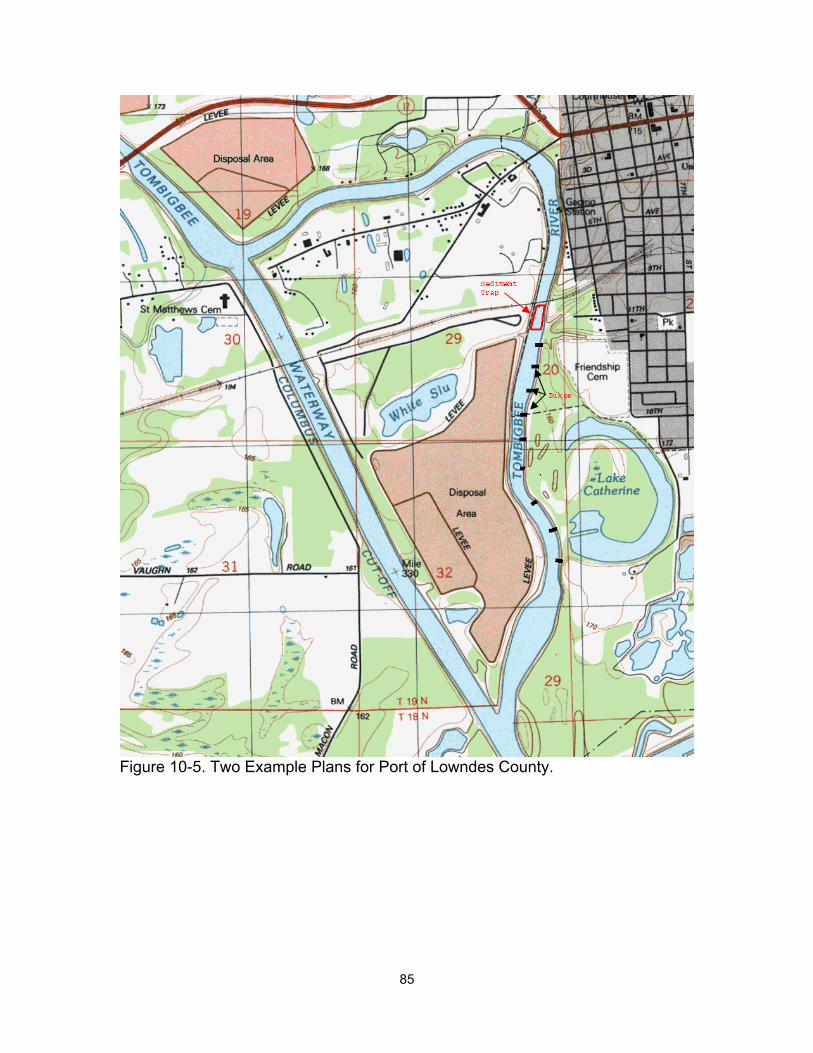
Figure 10-5. Two Example Plans for Port of Lowndes County.
85
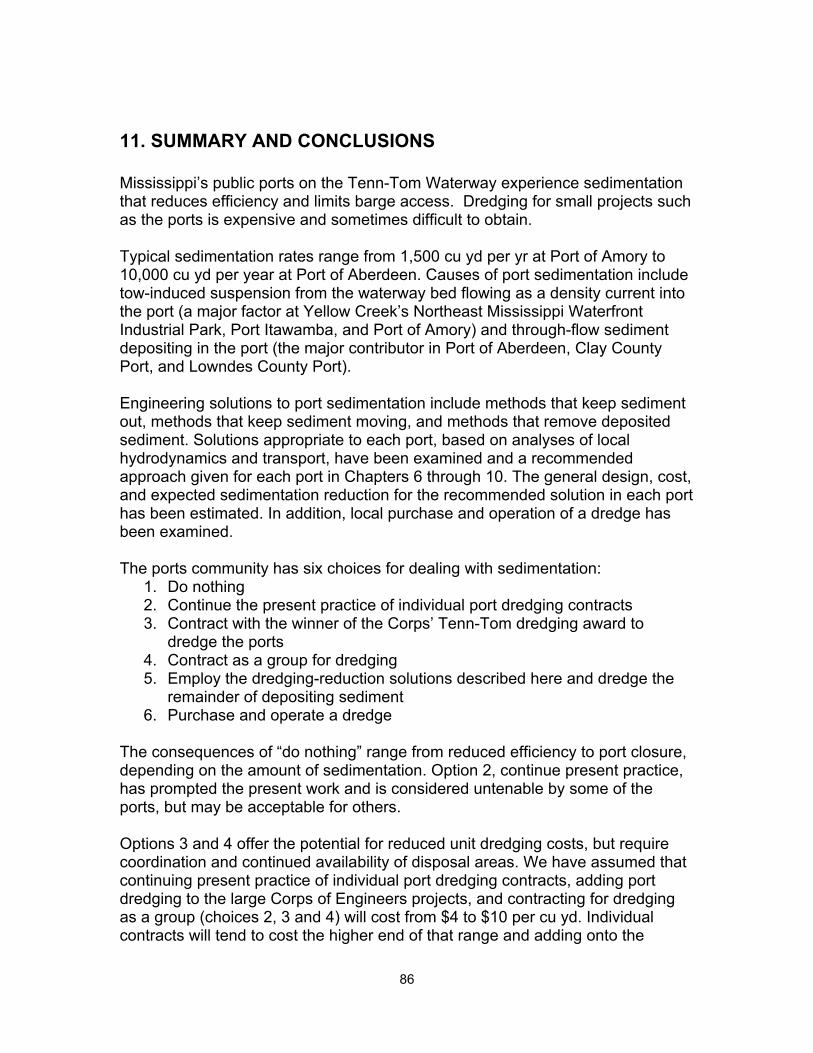
11. SUMMARY AND CONCLUSIONS Mississippi’s public ports on the Tenn-Tom Waterway experience sedimentation that reduces efficiency and limits barge access. Dredging for small projects such as the ports is expensive and sometimes difficult to obtain. Typical sedimentation rates range from 1,500 cu yd per yr at Port of Amory to 10,000 cu yd per year at Port of Aberdeen. Causes of port sedimentation include tow-induced suspension from the waterway bed flowing as a density current into the port (a major factor at Yellow Creek’s Northeast Mississippi Waterfront Industrial Park, Port Itawamba, and Port of Amory) and through-flow sediment depositing in the port (the major contributor in Port of Aberdeen, Clay County Port, and Lowndes County Port). Engineering solutions to port sedimentation include methods that keep sediment out, methods that keep sediment moving, and methods that remove deposited sediment. Solutions appropriate to each port, based on analyses of local hydrodynamics and transport, have been examined and a recommended approach given for each port in Chapters 6 through 10. The general design, cost, and expected sedimentation reduction for the recommended solution in each port has been estimated. In addition, local purchase and operation of a dredge has been examined. The ports community has six choices for dealing with sedimentation:
1. Do nothing 2. Continue the present practice of individual port dredging contracts 3. Contract with the winner of the Corps’ Tenn-Tom dredging award to
dredge the ports 4. Contract as a group for dredging 5. Employ the dredging-reduction solutions described here and dredge the
remainder of depositing sediment 6. Purchase and operate a dredge
The consequences of “do nothing” range from reduced efficiency to port closure, depending on the amount of sedimentation. Option 2, continue present practice, has prompted the present work and is considered untenable by some of the ports, but may be acceptable for others. Options 3 and 4 offer the potential for reduced unit dredging costs, but require coordination and continued availability of disposal areas. We have assumed that continuing present practice of individual port dredging contracts, adding port dredging to the large Corps of Engineers projects, and contracting for dredging as a group (choices 2, 3 and 4) will cost from $4 to $10 per cu yd. Individual contracts will tend to cost the higher end of that range and adding onto the
86

Corps’ contracts will tend toward the lower end of the range. The results of various combinations are described below. Option 5 recommended solutions are agitation dredging of Northeast Mississippi Waterway Industrial Park, Port Itawamba, and Port of Amory; reshaping the upstream end of the notch at Port of Aberdeen, abandonment of the notch port and investigation of training structures at Clay County, and training structures at Port of Lowndes County. Dredging requirement reductions ranging from 45 percent to 90 percent are expected to result from adopting the recommended solutions. No serious environmental obstacles to the recommended solutions were identified, but each will require permitting from the Corps of Engineers and Mississippi Department of Environmental Quality. As noted in Part 3, port sedimentation volumes are a very small fraction of waterway sedimentation volumes, so implementation of the option 5 solutions will not significantly increase dredging requirements for the waterway channel, except perhaps in local redistribution of shoaling materials. Option 6 consists of purchasing a small cutterhead dredge and operating it. Initial costs are about $550,000 for the dredge and associated equipment and $65,000 for a workboat if one is not already available. Annual operating costs are estimated to be $458,000. Some costs can be recouped if dredging services are sold to the Corps of Engineers and private terminal operators. Table 11-1 lists the recommended dredging-reduction solution for each port and gives a range of expected costs. Cost is expressed as a first cost, the initial capital investment to purchase equipment and materials and construct the necessary solution; operating cost, annual operating expenses such as fuel and labor; and residual dredging cost, the cost of dredging sediment that will deposit in the port despite solution implementation. In some cases, more than one solution has been recommended, but only the first one is listed in Table 11-1. While each port will make independent decisions about choosing from among possible solutions, presenting the first recommended solution for each enables a systematic comparison of the options. Table 11-2 shows the annual cost information of Table 11-1 and adds the cost of continuing to dredge each port. It shows that the advisability of any solution is sensitive to the dredging cost per cubic yard. At the low estimate of $4 per cu yd, Northeast Mississippi Waterway Industrial Park, Itawamba, and Amory will save money by continuing conventional dredging; whereas, Aberdeen, Clay and Lowndes will save money by adopting the non-dredging solution. At $10 per cu yd, all the ports will save money by implementing the recommended non-dredging solutions. This simple analysis neglects the first cost and the availability of disposal space, either of which can alter the result. Table 11-3 presents an annual cost comparison of the present dredging practice, the recommended solutions for each port, and local purchase and operation of a
87

dredge. It shows that purchase and operation of a dredge is the most expensive option at $458,000 per year if selling dredging services is neglected. Implementing all the recommended dredging reduction measures offers an overall annual savings of 50 to 57 percent over continuing present dredging practices, exclusive of first cost amortization. Table 11-4 shows the cost information in a present worth average annual cost figure that includes the amortized initial costs with annual maintenance costs at a discount rate of 6 percent. The present practice and dredging reduction solutions are calculated for a 50-year service life, which is customary for structural solutions; whereas the dredge purchase option is calculated for 50 years for comparison (although it is an unrealistically long life for a dredge) and for 20 years. It shows that the recommended non-dredging solutions, considered system wide, will save about $14,000 to $44,000 per year over the present dredging practice. The dredge purchase and operation option costs more than either option, again neglecting the possibility of recouping all or part of the extra expense by selling dredging services to others. Selling dredging services to private terminal operators and Corps of Engineers will serve to offset the cost of owning and operating the dredge; however, forecasting the success of that practice is beyond the scope of this report. A small dredge is needed on the waterway, since there are a number of terminals that require maintenance dredging and dredges used for the larger Corps’ jobs are too large to efficiently remove smaller shoals in the waterway. Nevertheless, dredging is a difficult business and many smaller dredging firms have found it difficult to survive. Fielding and operating a community or public-owned dredge will require a substantial commitment by the state or other organization. None of these costs address the issue of diminishing dredged material disposal space on the waterway. To the extent that disposal capacity is a problem, solutions that reduce dredged volume are to be preferred. This work has shown that a number of solutions are available to address port sedimentation problems. In some cases standard dredging and disposal of material is the most economical solution, provided that disposal space is available. In some cases, a significant reduction in the volume of required dredging can be achieved at an effective annual cost less than standard dredging.
88
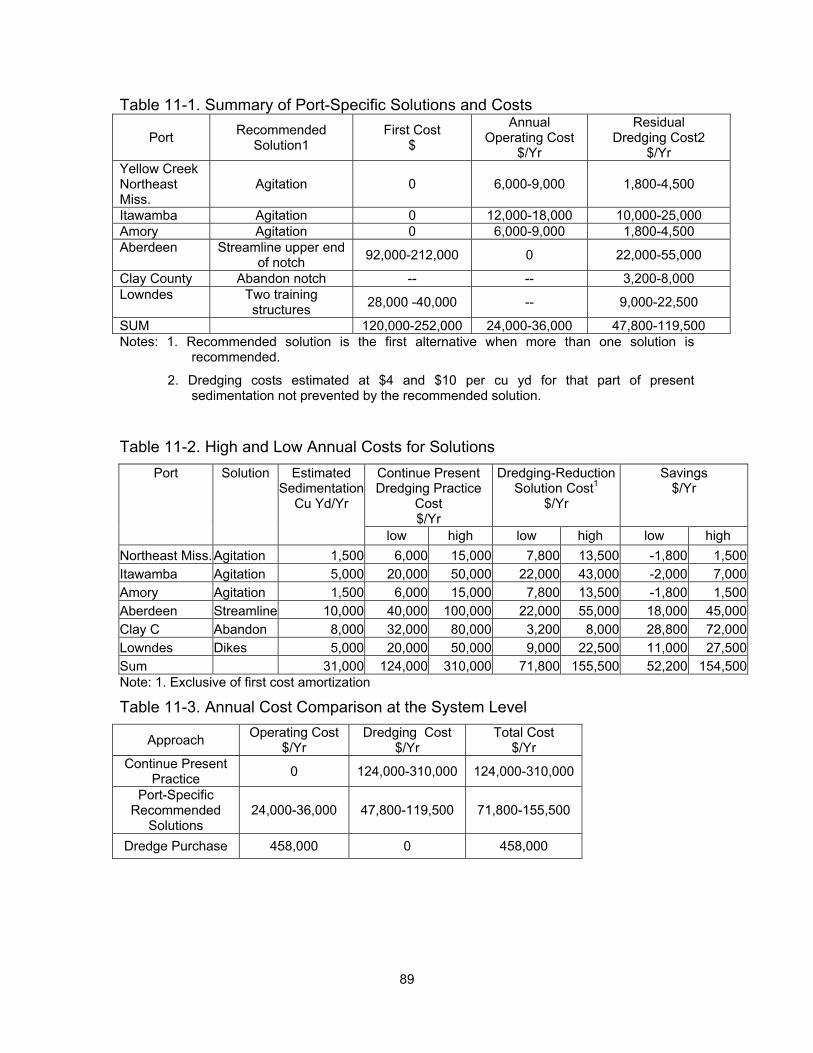
Table 11-1. Summary of Port-Specific Solutions and Costs
Port Recommended Solution1
First Cost $
Annual Operating Cost
$/Yr
Residual Dredging Cost2
$/Yr Yellow Creek Northeast Miss.
Agitation 0 6,000-9,000 1,800-4,500
Itawamba Agitation 0 12,000-18,000 10,000-25,000 Amory Agitation 0 6,000-9,000 1,800-4,500 Aberdeen Streamline upper end
of notch 92,000-212,000 0 22,000-55,000
Clay County Abandon notch -- -- 3,200-8,000 Lowndes Two training
structures 28,000 -40,000 -- 9,000-22,500
SUM 120,000-252,000 24,000-36,000 47,800-119,500 Notes: 1. Recommended solution is the first alternative when more than one solution is
recommended.
2. Dredging costs estimated at $4 and $10 per cu yd for that part of present sedimentation not prevented by the recommended solution.
Table 11-2. High and Low Annual Costs for Solutions
Continue Present Dredging Practice
Cost $/Yr
Dredging-Reduction Solution Cost1
$/Yr
Savings $/Yr
Port Solution Estimated Sedimentation
Cu Yd/Yr
low high low high low high Northeast Miss. Agitation 1,500 6,000 15,000 7,800 13,500 -1,800 1,500Itawamba Agitation 5,000 20,000 50,000 22,000 43,000 -2,000 7,000Amory Agitation 1,500 6,000 15,000 7,800 13,500 -1,800 1,500Aberdeen Streamline 10,000 40,000 100,000 22,000 55,000 18,000 45,000Clay C Abandon 8,000 32,000 80,000 3,200 8,000 28,800 72,000Lowndes Dikes 5,000 20,000 50,000 9,000 22,500 11,000 27,500Sum 31,000 124,000 310,000 71,800 155,500 52,200 154,500Note: 1. Exclusive of first cost amortization
Table 11-3. Annual Cost Comparison at the System Level
Approach Operating Cost $/Yr
Dredging Cost $/Yr
Total Cost $/Yr
Continue Present Practice 0 124,000-310,000 124,000-310,000
Port-Specific Recommended
Solutions 24,000-36,000 47,800-119,500 71,800-155,500
Dredge Purchase 458,000 0 458,000
89
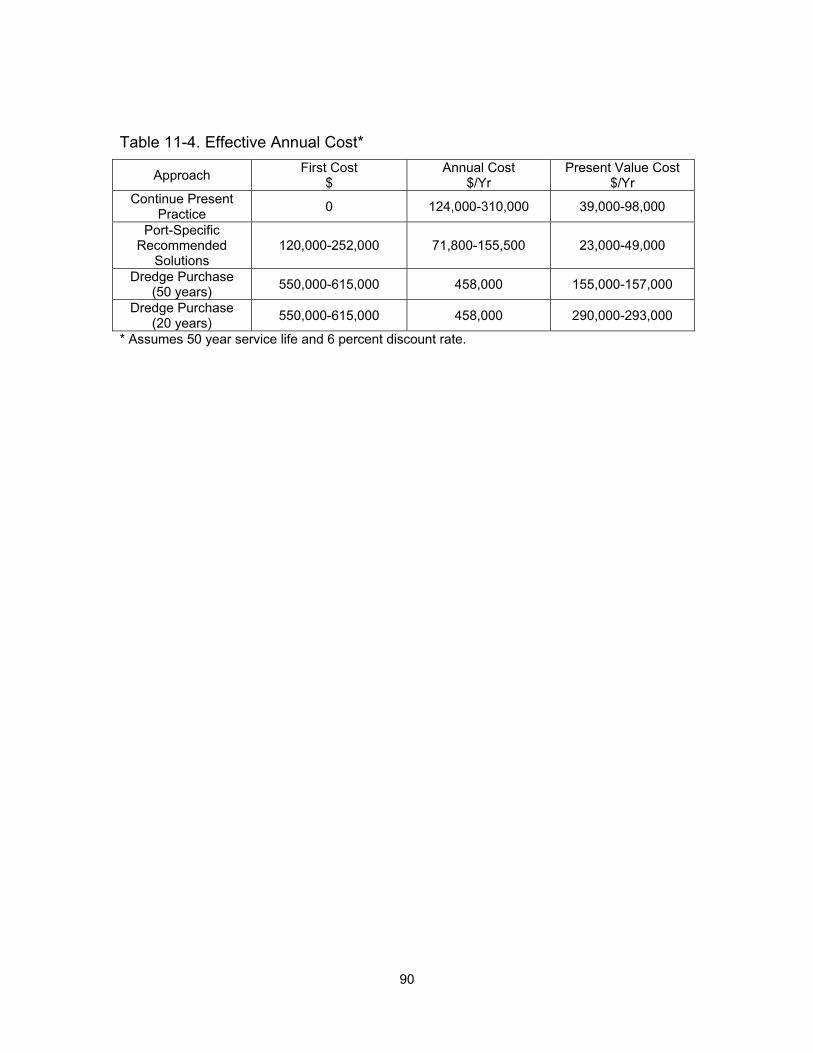
Table 11-4. Effective Annual Cost*
Approach First Cost $
Annual Cost $/Yr
Present Value Cost $/Yr
Continue Present Practice 0 124,000-310,000 39,000-98,000
Port-Specific Recommended
Solutions 120,000-252,000 71,800-155,500 23,000-49,000
Dredge Purchase (50 years) 550,000-615,000 458,000 155,000-157,000
Dredge Purchase (20 years) 550,000-615,000 458,000 290,000-293,000
* Assumes 50 year service life and 6 percent discount rate.
90
REFERENCES Abraham, D., Copeland, R., Nail, G. and Brown, G. 1999, Numerical Modeling of
Tow Induced Suspended Sediments, Proceedings of the 1999 International Water Resources Engineering Conference, Seattle, WA.
Bailard, J. A. 1987, Controlling Sedimentation in Harbor Berthing Areas Using Scour Jet Array Systems, in Sedimentation Control to Reduce Maintenance Dredging of Navigational Facilities in Estuaries, Marine Board, National Research Council, 141-152
Bhowmik, N. G., Adams, J. R., Bonini, A. P., Gou, C. Y., Kisser, D. J. and Sexton, M. A. 1981, Resuspension and Lateral Movement of Sediment by Tow Traffic on the Upper Mississippi and Illinois Rivers, Contract Report 269, State Water Survey Division, Illinois Institute of Natural Resources.
Butts, T.A. 1974, Measurements of Sediment Oxygen Demand Characteristics of the Upper Illinois Waterway, Report of Investigation 76, Illinois State Water Survey.
Byars, Morgan. S., Lyle W. Zevenbergen, and Peter F. Lagasse, 2000, Hydraulic Design for Channel restoration on the Santa Ana Reach of the Rio Grande, Building Partnerships, Joint conference on Water Resources Engineering and Water Resources Planning and Management, 91/4, American Society of Civil Engineers, Washington, DC.
Chapman, J. E., and W. S. Douglas, 2003, Evaluation of a Berth Sedimentation Control Technology in the Kill can Kull: The Airguard Pneumatic Barrier System, http://www.state.nj.us/transportation/maritime/FINAL%20DRAFT%20022502.pdf Accessed: August 2003.
Committee on Tidal Hydraulics, 1995, Reviews of Problems in Tidal Waterways Considered by the Committee on Tidal Hydraulics, Headquarters, U.S. Army Corps of Engineers, June.
Francingues, N. R., Clarke, D. G and Palermo, M. R. 2002, “Silt Curtains: A Water Column Control Measure for Dredging Operations.” DOER Technical Notes Collection. U.S. Army Engineer Research and Development Center, Vicksburg, MS.
Garcia, M., Rodriguez, J., and Admiraal, D. 1999, Effects of navigation on sedimentation, Proceedings of the 28th Congress of the International Association for Hydraulic Research, Graz, Austria.
Grays Harbor Community College, 1973, Research to determine the Effectiveness of the Air Bubbler System, Grays Harbor, Wash. Aberdeen, Washington.
Hales, L. Z. 1995, Dredge Plant Equipment and Systems Processes; Summary Report For Technical Area 3, TR DRP-95-10, U.S. Army Engineer Research and Development Center, Vicksburg, MS.
Hilton, James D. 2000, U.S. Army Corps of Engineers Dredging Program, Sea Technology, Vol 41, No. 3, March, 21-24.
91
Jenkins, S. A. 1987, Passive Remedial Sedimentation Control in Parallel Berths and Channels, in Sedimentation Control to Reduce Maintenance Dredging of Navigational Facilities in Estuaries, Marine Board, National Research Council, 153-176.
Johnson, J. 1976, Technical Report Y-76-1: Effects of tow traffic on the resuspension of sediments and on dissolved oxygen concentrations in the Illinois and Upper Mississippi Rivers under normal pool conditions, Environmental Effects Laboratory, U.S. Army Engineer Waterways Experiment Station.
Karaki, S, and J. vanHoften, 1974, Resuspension of Bed Material and Wave Effects on the Illinois and Upper Mississippi Waterways Caused by Boat Traffic, Engineering Research Center, Colorado State University, Fort Collins.
Kelderman, P. D. B. Kassie, M. M+Bijlsma, L. C. Okonkwo, and A. A. T. Doppenberg, 1998, Effect of External Shipping Traffic on the tRansport of Polluted Sediments into the Inner City Canals of Delft, Water Science and Technology, Vol 37, No. 6-7, pp 63-70.
Kuhnle, Roger A., Carlos V. Alonzo, and Fletcher D. Shields, Jr. 2003, Local Scour Associated with Angled Spur Dikes: Implications for Bank Stability and Aquatic Habitat, U.S. Agricultural Research Service TEKTRAN, March.
Lower Mississippi River Conservation Committee, 2003, Habitat, http://lmrcc.org/Recreation/Fishing/habitat.htm, Accessed 20 October 2003.
Luo, Zhaosen, and Gu Peiyu, 1982, Sedimentation Associated with Tidal Barriers in Chinas Estuaries and Measures for its Reduction, in Estuarine Comparisons, Victor Kennedy, ed., Academy Press, New York. pp 611-622.
McAnally, W. H. 1973, Mixing of Salinity-Stratified Waters by Pneumatic Barriers, Research Report H-73-4, USAE Waterways Experiment Station, Vicksburg, MS.
McLellan, T. Neil and Robert J. Hopman, 2000, Innovations In Dredging Technology: Equipment, Operations, and Management, ERDC DOER TR-5, U.S. Army Engineer Research and Development Center, Vicksburg, MS.
Parchure, T. M. and A. M. Teeter, 2002, Potential Methods of Reducing Shoaling in Harbors and Navigation Channels, CHETN-XIV-6, Engineer Research and Development Center, Vicksburg, MS, June.
PIANC, 1992, Beneficial Uses of Dredged Material, Report of PIANC Working Group 19, International Navigation Association, Brussels.
Pinkard, C. Fred, 1995, Red River Waterway: A Sedimentation Challenge, Proceedings of the 1st International Conference on Water Resources, Part 1, American Society of Civil Engineers, Washington, DC.
Qaisi, K.M.; Constant, W.D.; Thibodeaux, L.J. 1997, Impact of Barge Traffic on Stream reaeration: Laboratory Experiments, Journal of Environmental Engineering, p 716-719, July.
Reine, K.J., Clarke, D. G., and Dickerson, C. 2002, Acoustic characterization of suspended sediment plumes resulting from barge overflow, DOER Technical Notes Collection (ERDC TN-DOER-E15), U.S. Army Engineer Research and Development Center, Vicksburg, MS.
92
Richardson, T. W. 1984, Agitation Dredging: Lessons and Guidelines from Past Projects, Technical Report HL-84-6, US Army Engineer Waterways Experiment Station, Vicksburg, MS.
Richardson, T. W. and E. C. McNair, 1981, A guide to the Planning and Hydraulic Design of Jet Pump Remedial Sand Bypassing Systems, IR-81-1, USAE Waterways Experiment Station, Vicksburg, MS.
Rodriguez, F. J., Garcia, M. H., Admiraal, D. M. and Lopez, F. 2000, Statistical analysis of unsteady bed shear stresses: Implications for sediment resuspension,” Proceedings 14th Engineering Mechanics Conference, Austin, TX.
Rodriguez, F. J., Garcia, M. H., and Admiraal, D. M. 1999, Computation of Navigation-Induced Sediment Resuspension, Proceedings of the 1999 International Water Resources Engineering Conference, Seattle, WA.
Seagren, Eric H. 2003, Evaluation of Hydraulic Dredging for Six Designated Ports Located on the Tennessee-Tombigbee Waterway, The Seagren Corporation, St. Louis, MO.
Shields, F. D., S. S. Knight, and C. M. Cooper, 1995, Streambank Protection and Habitat Restoration, Proceedings of the 1st International Conference on Water Resources, Part 1, American Society of Civil Engineers, Washington, DC.
Shindala, A., D. D. Truax, and K-R Jin, 1991, Development of a Water Quality Model for the Upper Tennessee-Tombigbee Waterway, Mississippi State University, Starkville.
Smith, T. J., R. Kirby, and H. Christiansen, 2001, “Entrance flow control to reduce siltation in tidal basins,” in Coastal and Estuarine Fine Sediment Processes, W. H. McAnally and A. J. Mehta, Eds., Elsevier, Amsterdam.
Stauffer, K. W. 1991, Habitat Use and Growth of Juvenile Catfish in the Missouri River and a Tributary, the Lamine River, M.S. Thesis, University of Missouri-Columbia.
Teeter, A. M. 1989, Effects of Cooper River Rediversion flows on shoaling Conditions at Charleston Harbor, Charleston, South Carolina, Technical Report HL-89-3, U.S. Army Engineer Waterways Experiment Station, Vicksburg, MS.
Torontoport. 2003, Dredging up an environmental solution, http://www.torontoport.com/thc/portprofile.asp, accessed October 2003.
Underwood, Kenneth D., and F. D. Imsand, 1985, Hydrology, Hydraulic, and Sediment Considerations of the Tennessee-Tombigbee Waterway. Environmental Geology and Water Sciences, v 7, n 1-2, p 69-90.
USACE, 1978, Columbus Lock and Dam, Design Memorandum No. 18, Sedimentation Program, Tennessee-Tombigbee Waterway, Alabama and Mississippi, U. S. Army Engineer District, Mobile.
USACE, 1979, Aberdeen Lock and Dam, Design Memorandum No. 17, Sedimentation Program, Tennessee-Tombigbee Waterway, Alabama and Mississippi, U. S. Army Engineer District, Mobile.
93
USACE, 1980, Canal Section, Design Memorandum No. 29, Sedimentation Program, Tennessee-Tombigbee Waterway, Alabama and Mississippi, U. S. Army Engineer District, Mobile.
USACE, 1986, Section 107, Detailed Project Report, Tombigbee River at Columbus, Mississippi, U. S. Army Engineer District, Mobile.
USACE, 2003, Environmental Engineering on the Mississippi River, The Solutions, St. Louis District, http://www.mvs.usace.army.mil/engr/river/EnvironEng/en12.htm. Accessed 25 July 2003.
Van Dorn, William G., D. L. Inman, and R. W. Harris, 1975, The Evaluation of Sediment Management Procedures, Phase I Final Report, 1974-1975. SIP Reference Series 75-32, Scripps Institution of Oceanography, University of California, La Jolla.
94
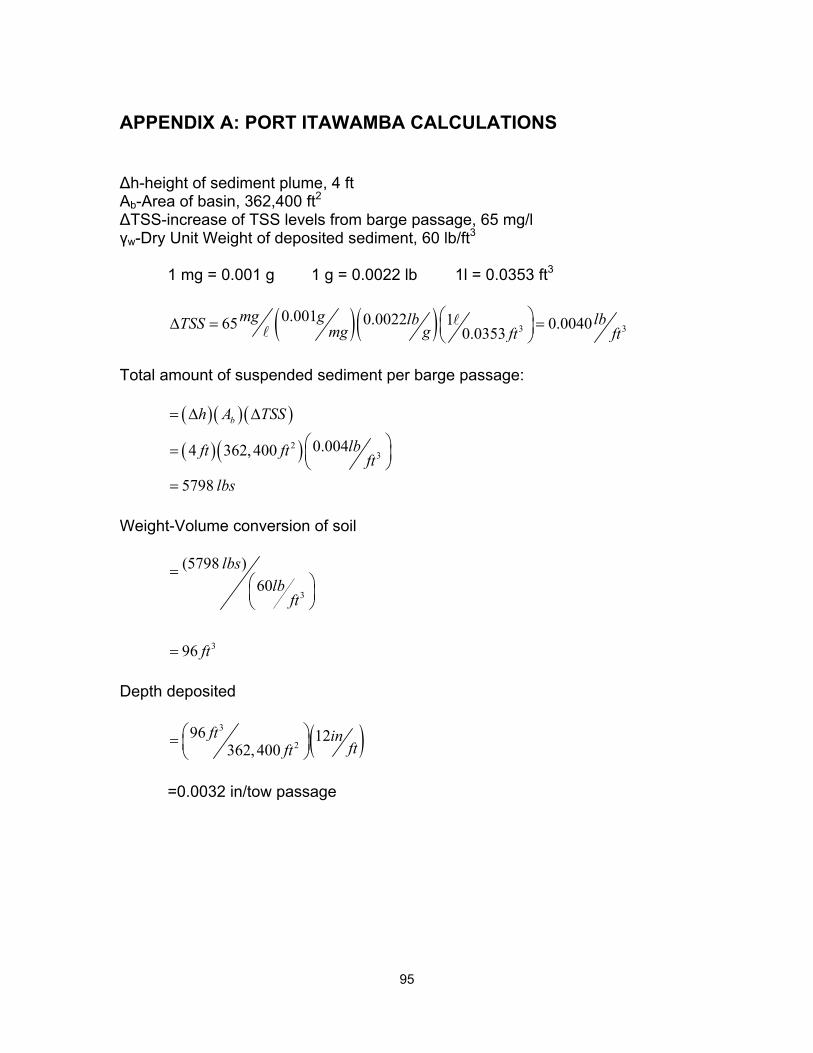
APPENDIX A: PORT ITAWAMBA CALCULATIONS ∆h-height of sediment plume, 4 ft Ab-Area of basin, 362,400 ft2 ∆TSS-increase of TSS levels from barge passage, 65 mg/l γw-Dry Unit Weight of deposited sediment, 60 lb/ft3
1 mg = 0.001 g 1 g = 0.0022 lb 1l = 0.0353 ft3
( )( ) 3 30.001 0.0022 165 0.00400.0353
mg g lb lbTSS mg g ft f ∆ = = t
Total amount of suspended sediment per barge passage:
( )( )( )
( )( )23
0.0044 362,400
5798
bh A TSS
lbft ft ftlbs
= ∆ ∆
=
=
Weight-Volume conversion of soil
3
3
(5798 )60
96
lbslbft
ft
=
=
Depth deposited
( )3
296 12
362,400ft in
ftft =
=0.0032 in/tow passage
95
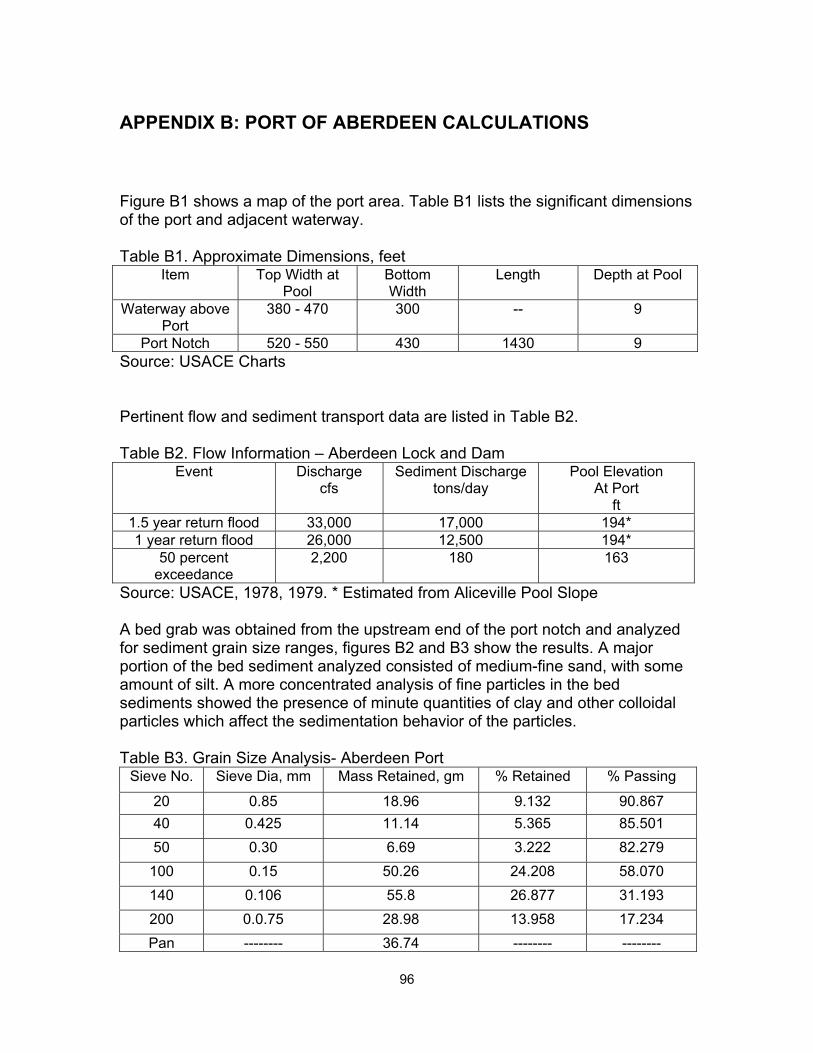
APPENDIX B: PORT OF ABERDEEN CALCULATIONS Figure B1 shows a map of the port area. Table B1 lists the significant dimensions of the port and adjacent waterway. Table B1. Approximate Dimensions, feet Item Top Width at
Pool Bottom Width
Length Depth at Pool
Waterway above Port
380 - 470 300 -- 9
Port Notch 520 - 550 430 1430 9 Source: USACE Charts Pertinent flow and sediment transport data are listed in Table B2. Table B2. Flow Information – Aberdeen Lock and Dam
Event Discharge cfs
Sediment Discharge tons/day
Pool Elevation At Port
ft 1.5 year return flood 33,000 17,000 194* 1 year return flood 26,000 12,500 194*
50 percent exceedance
2,200 180 163
Source: USACE, 1978, 1979. * Estimated from Aliceville Pool Slope A bed grab was obtained from the upstream end of the port notch and analyzed for sediment grain size ranges, figures B2 and B3 show the results. A major portion of the bed sediment analyzed consisted of medium-fine sand, with some amount of silt. A more concentrated analysis of fine particles in the bed sediments showed the presence of minute quantities of clay and other colloidal particles which affect the sedimentation behavior of the particles. Table B3. Grain Size Analysis- Aberdeen Port
Sieve No. Sieve Dia, mm Mass Retained, gm % Retained % Passing
20 0.85 18.96 9.132 90.867 40 0.425 11.14 5.365 85.501 50 0.30 6.69 3.222 82.279
100 0.15 50.26 24.208 58.070 140 0.106 55.8 26.877 31.193 200 0.0.75 28.98 13.958 17.234 Pan -------- 36.74 -------- --------
96
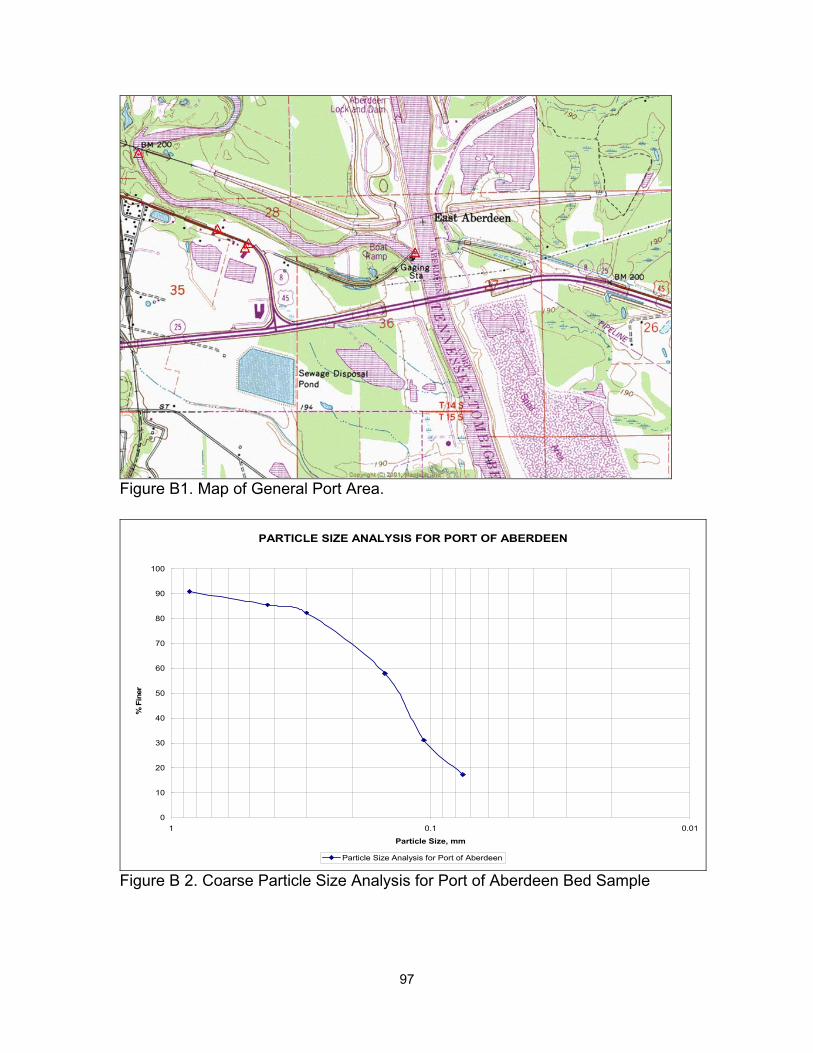
Figure B1. Map of General Port Area.
PARTICLE SIZE ANALYSIS FOR PORT OF ABERDEEN
0
10
20
30
40
50
60
70
80
90
100
0.010.11
Particle Size, mm
% F
iner
Particle Size Analysis for Port of Aberdeen
Figure B 2. Coarse Particle Size Analysis for Port of Aberdeen Bed Sample
97
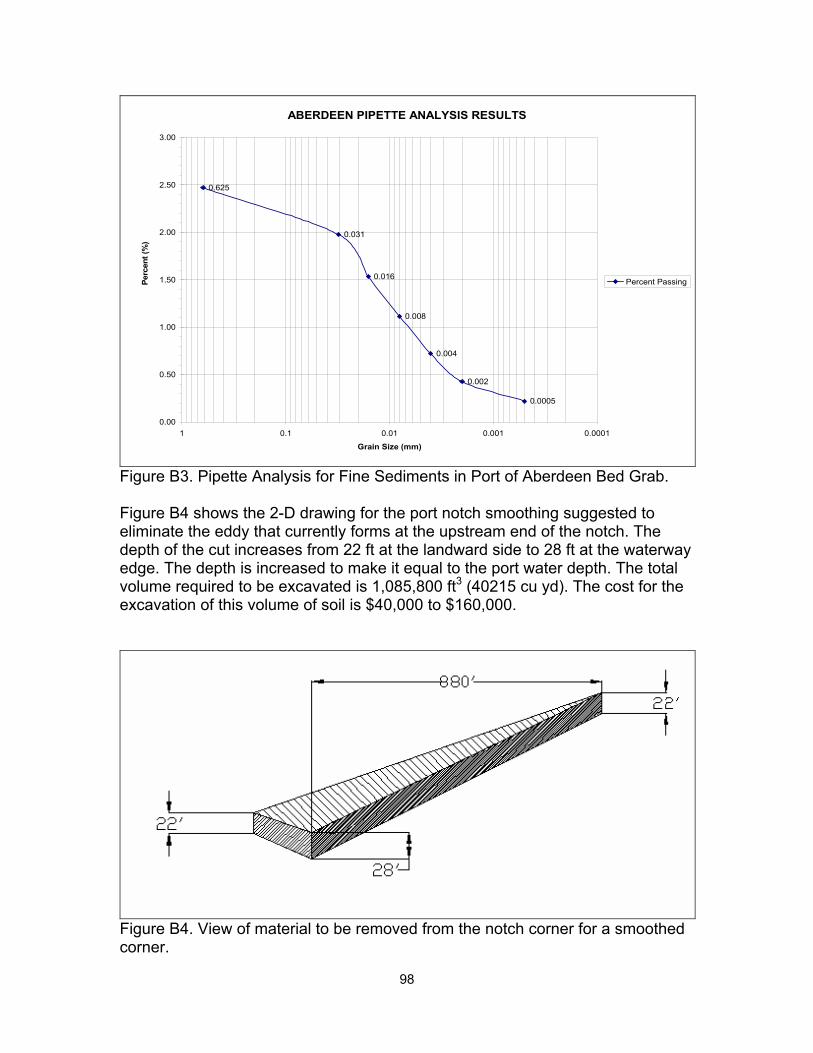
ABERDEEN PIPETTE ANALYSIS RESULTS
0.625
0.031
0.016
0.008
0.004
0.002
0.0005
0.00
0.50
1.00
1.50
2.00
2.50
3.00
0.00010.0010.010.11
Grain Size (mm)
Perc
ent (
%)
Percent Passing
Figure B3. Pipette Analysis for Fine Sediments in Port of Aberdeen Bed Grab. Figure B4 shows the 2-D drawing for the port notch smoothing suggested to eliminate the eddy that currently forms at the upstream end of the notch. The depth of the cut increases from 22 ft at the landward side to 28 ft at the waterway edge. The depth is increased to make it equal to the port water depth. The total volume required to be excavated is 1,085,800 ft3 (40215 cu yd). The cost for the excavation of this volume of soil is $40,000 to $160,000.
Figure B4. View of material to be removed from the notch corner for a smoothed corner.
98
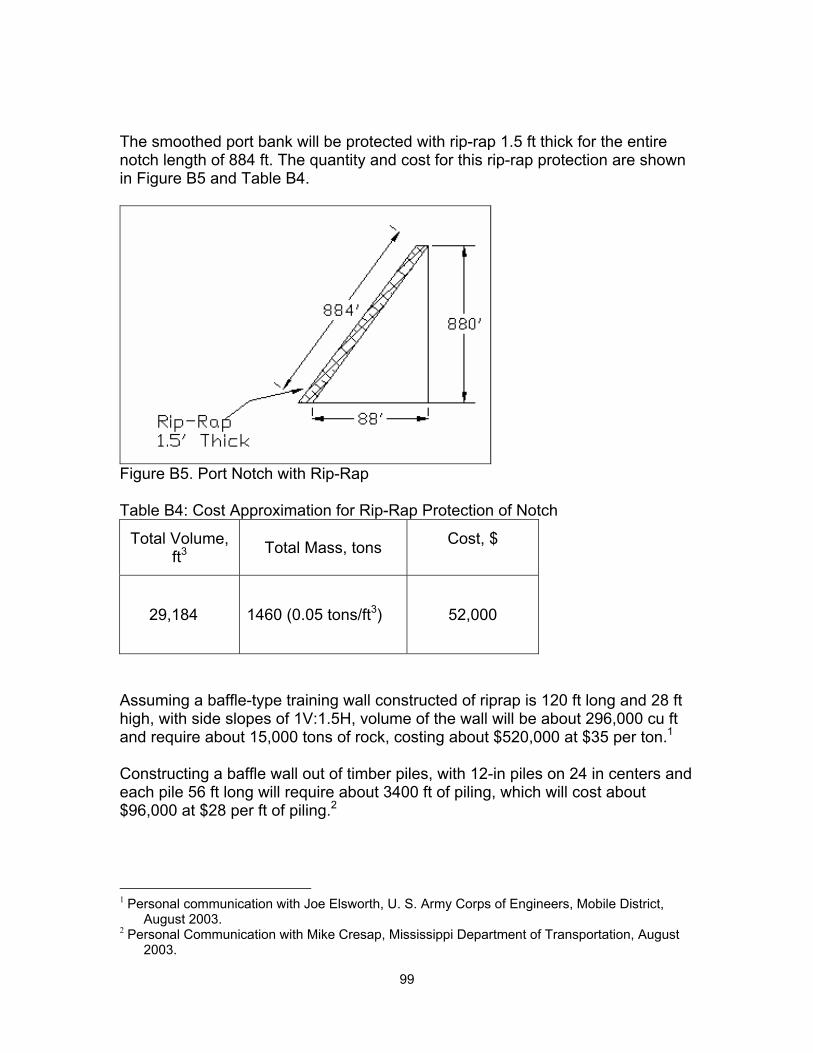
The smoothed port bank will be protected with rip-rap 1.5 ft thick for the entire notch length of 884 ft. The quantity and cost for this rip-rap protection are shown in Figure B5 and Table B4.
Figure B5. Port Notch with Rip-Rap Table B4: Cost Approximation for Rip-Rap Protection of Notch
Total Volume, ft3
Total Mass, tons
Cost, $
29,184 1460 (0.05 tons/ft3) 52,000
Assuming a baffle-type training wall constructed of riprap is 120 ft long and 28 ft high, with side slopes of 1V:1.5H, volume of the wall will be about 296,000 cu ft and require about 15,000 tons of rock, costing about $520,000 at $35 per ton.1 Constructing a baffle wall out of timber piles, with 12-in piles on 24 in centers and each pile 56 ft long will require about 3400 ft of piling, which will cost about $96,000 at $28 per ft of piling.2
1 Personal communication with Joe Elsworth, U. S. Army Corps of Engineers, Mobile District,
August 2003. 2 Personal Communication with Mike Cresap, Mississippi Department of Transportation, August
2003.
99
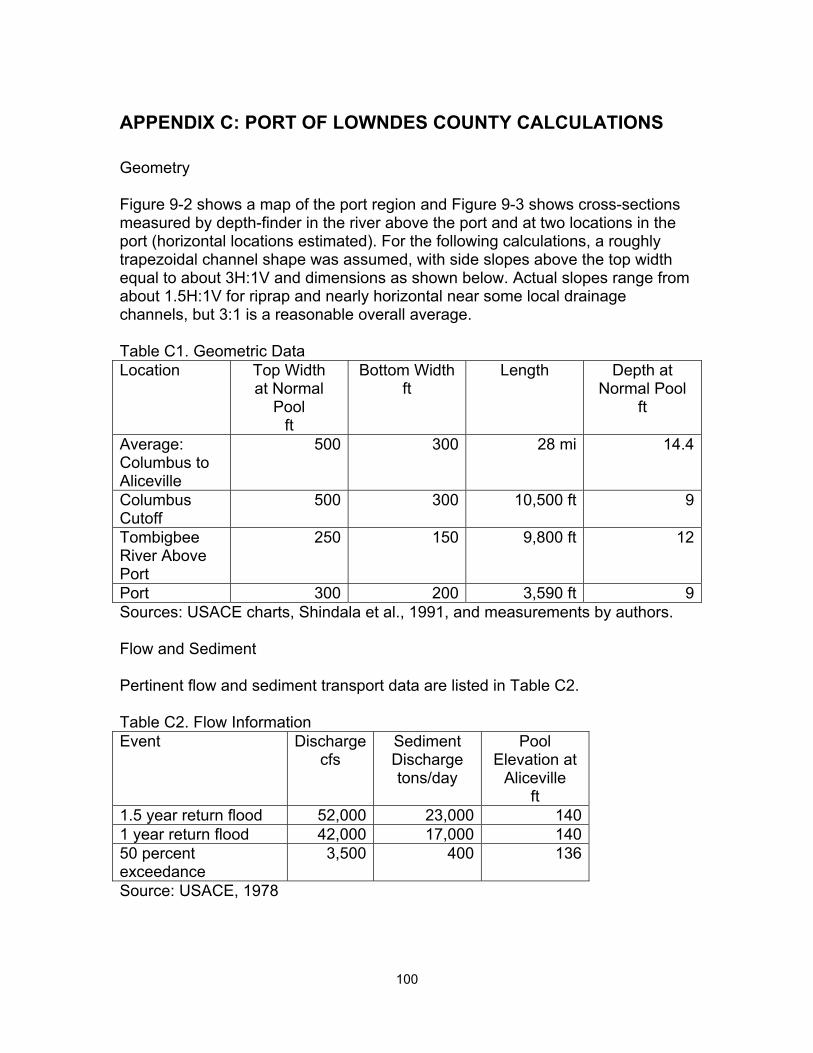
APPENDIX C: PORT OF LOWNDES COUNTY CALCULATIONS Geometry Figure 9-2 shows a map of the port region and Figure 9-3 shows cross-sections measured by depth-finder in the river above the port and at two locations in the port (horizontal locations estimated). For the following calculations, a roughly trapezoidal channel shape was assumed, with side slopes above the top width equal to about 3H:1V and dimensions as shown below. Actual slopes range from about 1.5H:1V for riprap and nearly horizontal near some local drainage channels, but 3:1 is a reasonable overall average. Table C1. Geometric Data Location Top Width
at Normal Pool
ft
Bottom Width ft
Length
Depth at Normal Pool
ft
Average: Columbus to Aliceville
500 300 28 mi 14.4
Columbus Cutoff
500 300 10,500 ft 9
Tombigbee River Above Port
250 150 9,800 ft 12
Port 300 200 3,590 ft 9Sources: USACE charts, Shindala et al., 1991, and measurements by authors. Flow and Sediment Pertinent flow and sediment transport data are listed in Table C2. Table C2. Flow Information Event Discharge
cfs Sediment Discharge tons/day
Pool Elevation at
Aliceville ft
1.5 year return flood 52,000 23,000 140 1 year return flood 42,000 17,000 140 50 percent exceedance
3,500 400 136
Source: USACE, 1978
100
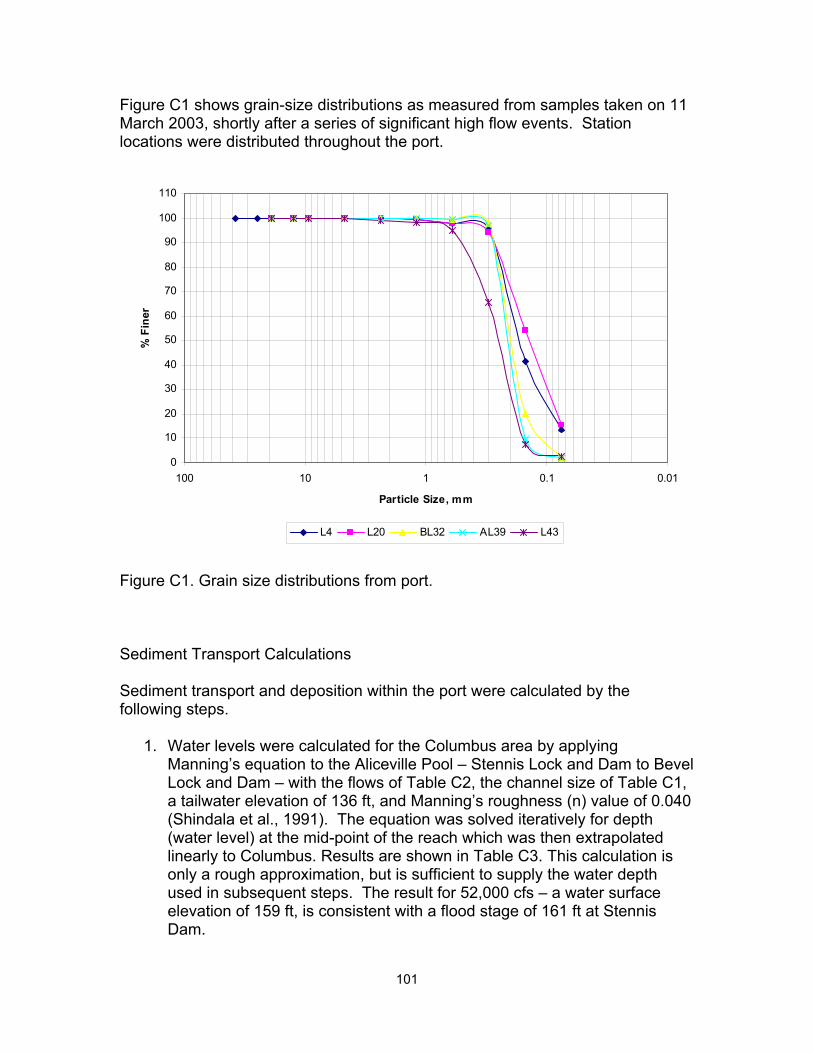
Figure C1 shows grain-size distributions as measured from samples taken on 11 March 2003, shortly after a series of significant high flow events. Station locations were distributed throughout the port.
0
10
20
30
40
50
60
70
80
90
100
110
0.010.1110100
Particle Size, mm
% F
iner
L4 L20 BL32 AL39 L43
Figure C1. Grain size distributions from port. Sediment Transport Calculations Sediment transport and deposition within the port were calculated by the following steps.
1. Water levels were calculated for the Columbus area by applying Manning’s equation to the Aliceville Pool – Stennis Lock and Dam to Bevel Lock and Dam – with the flows of Table C2, the channel size of Table C1, a tailwater elevation of 136 ft, and Manning’s roughness (n) value of 0.040 (Shindala et al., 1991). The equation was solved iteratively for depth (water level) at the mid-point of the reach which was then extrapolated linearly to Columbus. Results are shown in Table C3. This calculation is only a rough approximation, but is sufficient to supply the water depth used in subsequent steps. The result for 52,000 cfs – a water surface elevation of 159 ft, is consistent with a flood stage of 161 ft at Stennis Dam.
101
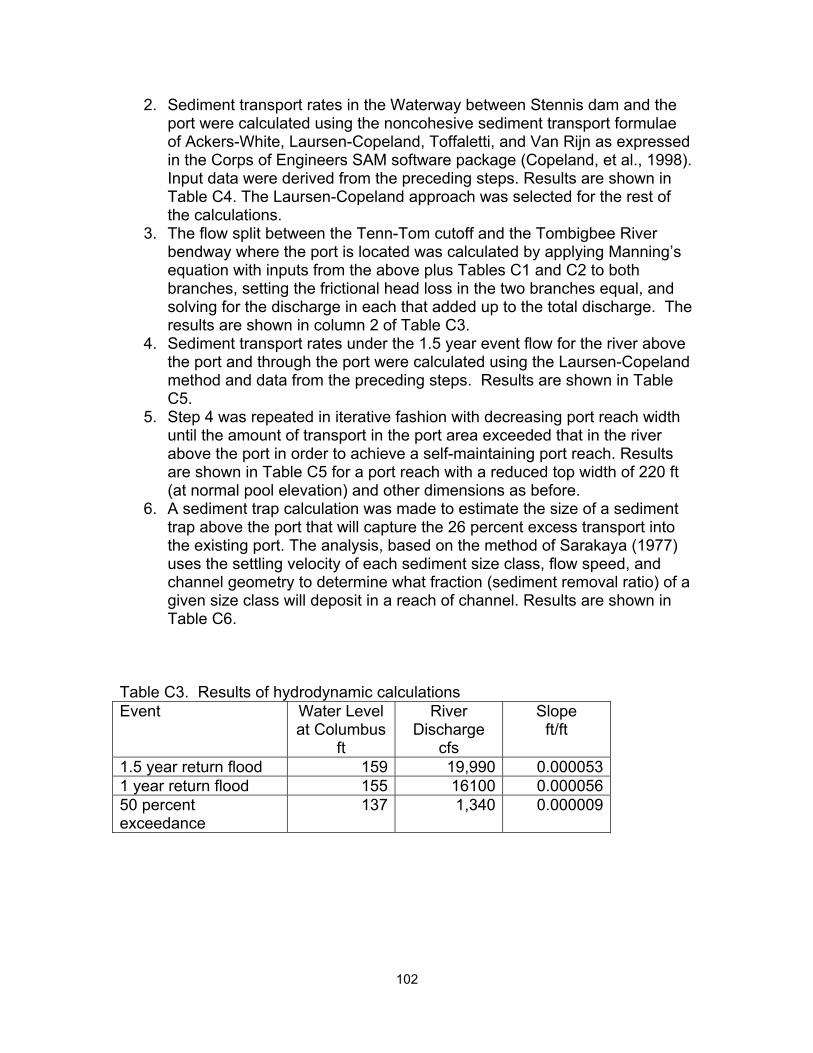
2. Sediment transport rates in the Waterway between Stennis dam and the port were calculated using the noncohesive sediment transport formulae of Ackers-White, Laursen-Copeland, Toffaletti, and Van Rijn as expressed in the Corps of Engineers SAM software package (Copeland, et al., 1998). Input data were derived from the preceding steps. Results are shown in Table C4. The Laursen-Copeland approach was selected for the rest of the calculations.
3. The flow split between the Tenn-Tom cutoff and the Tombigbee River bendway where the port is located was calculated by applying Manning’s equation with inputs from the above plus Tables C1 and C2 to both branches, setting the frictional head loss in the two branches equal, and solving for the discharge in each that added up to the total discharge. The results are shown in column 2 of Table C3.
4. Sediment transport rates under the 1.5 year event flow for the river above the port and through the port were calculated using the Laursen-Copeland method and data from the preceding steps. Results are shown in Table C5.
5. Step 4 was repeated in iterative fashion with decreasing port reach width until the amount of transport in the port area exceeded that in the river above the port in order to achieve a self-maintaining port reach. Results are shown in Table C5 for a port reach with a reduced top width of 220 ft (at normal pool elevation) and other dimensions as before.
6. A sediment trap calculation was made to estimate the size of a sediment trap above the port that will capture the 26 percent excess transport into the existing port. The analysis, based on the method of Sarakaya (1977) uses the settling velocity of each sediment size class, flow speed, and channel geometry to determine what fraction (sediment removal ratio) of a given size class will deposit in a reach of channel. Results are shown in Table C6.
Table C3. Results of hydrodynamic calculations Event Water Level
at Columbus ft
River Discharge
cfs
Slope ft/ft
1.5 year return flood 159 19,990 0.000053 1 year return flood 155 16100 0.000056 50 percent exceedance
137 1,340 0.000009
102
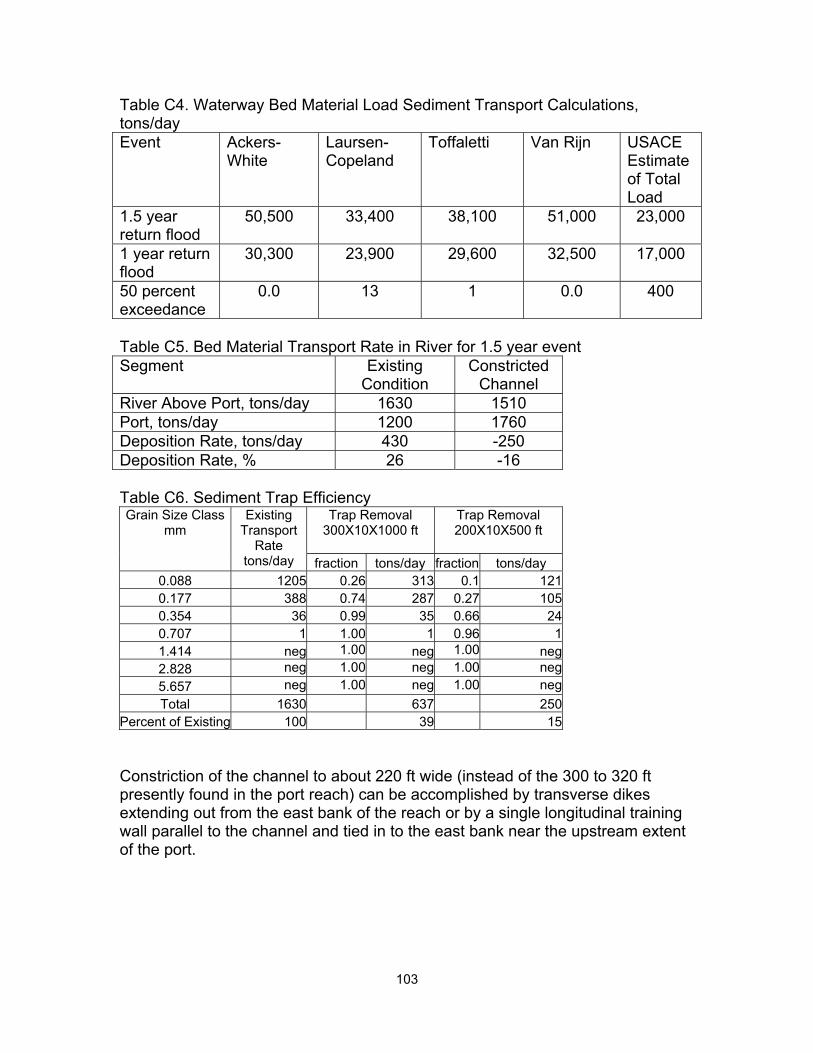
Table C4. Waterway Bed Material Load Sediment Transport Calculations, tons/day Event Ackers-
White Laursen-Copeland
Toffaletti Van Rijn USACE Estimate of Total Load
1.5 year return flood
50,500 33,400 38,100 51,000 23,000
1 year return flood
30,300 23,900 29,600 32,500 17,000
50 percent exceedance
0.0 13 1 0.0 400
Table C5. Bed Material Transport Rate in River for 1.5 year event Segment Existing
Condition Constricted
Channel River Above Port, tons/day 1630 1510 Port, tons/day 1200 1760 Deposition Rate, tons/day 430 -250 Deposition Rate, % 26 -16 Table C6. Sediment Trap Efficiency
Trap Removal 300X10X1000 ft
Trap Removal 200X10X500 ft
Grain Size Class mm
Existing Transport
Rate tons/day fraction tons/day fraction tons/day
0.088 1205 0.26 313 0.1 1210.177 388 0.74 287 0.27 1050.354 36 0.99 35 0.66 240.707 1 1.00 1 0.96 11.414 neg 1.00 neg 1.002.828 neg 1.00 neg 1.00 neg5.657 neg 1.00 neg 1.00 negTotal 1630 637 250
Percent of Existing 100 39 15
neg
Constriction of the channel to about 220 ft wide (instead of the 300 to 320 ft presently found in the port reach) can be accomplished by transverse dikes extending out from the east bank of the reach or by a single longitudinal training wall parallel to the channel and tied in to the east bank near the upstream extent of the port.
103
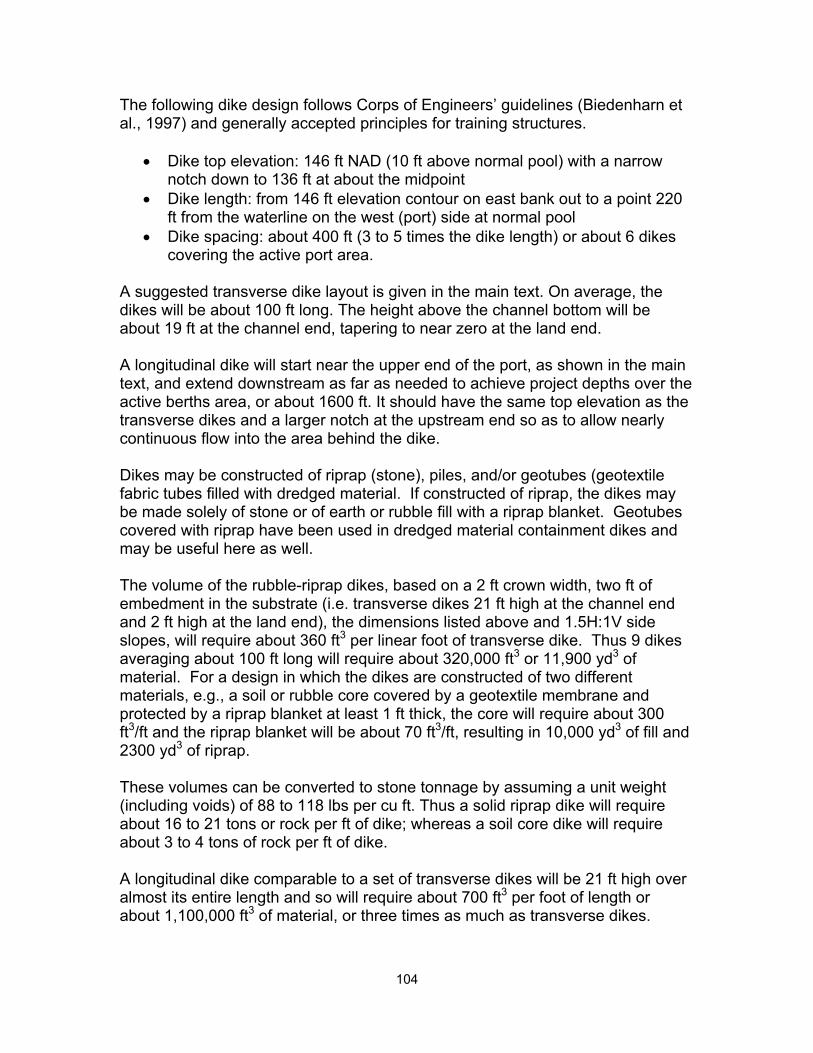
The following dike design follows Corps of Engineers’ guidelines (Biedenharn et al., 1997) and generally accepted principles for training structures.
• Dike top elevation: 146 ft NAD (10 ft above normal pool) with a narrow notch down to 136 ft at about the midpoint
• Dike length: from 146 ft elevation contour on east bank out to a point 220 ft from the waterline on the west (port) side at normal pool
• Dike spacing: about 400 ft (3 to 5 times the dike length) or about 6 dikes covering the active port area.
A suggested transverse dike layout is given in the main text. On average, the dikes will be about 100 ft long. The height above the channel bottom will be about 19 ft at the channel end, tapering to near zero at the land end. A longitudinal dike will start near the upper end of the port, as shown in the main text, and extend downstream as far as needed to achieve project depths over the active berths area, or about 1600 ft. It should have the same top elevation as the transverse dikes and a larger notch at the upstream end so as to allow nearly continuous flow into the area behind the dike. Dikes may be constructed of riprap (stone), piles, and/or geotubes (geotextile fabric tubes filled with dredged material. If constructed of riprap, the dikes may be made solely of stone or of earth or rubble fill with a riprap blanket. Geotubes covered with riprap have been used in dredged material containment dikes and may be useful here as well. The volume of the rubble-riprap dikes, based on a 2 ft crown width, two ft of embedment in the substrate (i.e. transverse dikes 21 ft high at the channel end and 2 ft high at the land end), the dimensions listed above and 1.5H:1V side slopes, will require about 360 ft3 per linear foot of transverse dike. Thus 9 dikes averaging about 100 ft long will require about 320,000 ft3 or 11,900 yd3 of material. For a design in which the dikes are constructed of two different materials, e.g., a soil or rubble core covered by a geotextile membrane and protected by a riprap blanket at least 1 ft thick, the core will require about 300 ft3/ft and the riprap blanket will be about 70 ft3/ft, resulting in 10,000 yd3 of fill and 2300 yd3 of riprap. These volumes can be converted to stone tonnage by assuming a unit weight (including voids) of 88 to 118 lbs per cu ft. Thus a solid riprap dike will require about 16 to 21 tons or rock per ft of dike; whereas a soil core dike will require about 3 to 4 tons of rock per ft of dike. A longitudinal dike comparable to a set of transverse dikes will be 21 ft high over almost its entire length and so will require about 700 ft3 per foot of length or about 1,100,000 ft3 of material, or three times as much as transverse dikes.
104
Constructing the dikes with wooden piles driven into the bed will require some toe and root (bank end) protection at the dike ends to prevent erosion and undermining of the piles. One ton of rock per dike is expected to be sufficient. Piles should be as much as 38 ft long, so that at least half the pile is beneath the bed. Assuming 12-inch piles with an average length of 20 ft, 20 linear ft of treated timber pile will be required for each foot of dike. Costs of materials and construction for dike construction are based on $30 to $35 per ton for riprap and $4 to $5 per cu yd for soil1; and $25 to 28 per ft of dike for piles2. Dikes are thus estimated to cost, on average, about $480 to $735 per ft for solid riprap; $136 to $199 per ft for a soil/rubble core with riprap cover, and about $560 per ft for timber pile dikes. Geotubes are available with a 30 ft circumference, which are about 5 ft high when filled, and cost about $18 per foot of length. Each foot of length requires about 2 yd3 of fill, which costs $5 to $15 per yd3. Pyramid-stacking three of them to attain a height of about 10 ft would then cost $84 to $144 per linear foot of dike, and stacking ten geotubes to reach a height of about 20 ft would cost $360-$720 per ft.3 A sediment trap 500 ft long, 10 ft deep, and 200 ft wide with side slopes of 1V: on 3H represents an excavation of about 55,000 cu yd. Extending the length to 1000 ft increases the volume to 102,000 cu yd. Dredging costs for these quantities are expected to be from $1 to $4 per cu yd.
1 Personal communication with Joe Elsworth, U. S. Army Corps of Engineers, Mobile District,
August 2003. 2 Personal Communication with Mike Cresap, Mississippi Department of Transportation, August
2003. 3 Data in this paragraph were provided in a personal communication by Jack Fowler, Geotec
Associates, Vicksburg, MS, September 2003.
105
APPENDIX D: CLAY COUNTY PORT CALCULATIONS Geometry Figure 10-2 shows a map of the port region. Clay County Port is located on the Columbus Pool. The river bendway left by the Waverly Mansion Cutoff is about 250 ft wide at normal pool but widens to about 460 ft at the lower junction with the cutoff. The cutoff is about 490 ft wide just above the junction and the waterway is about 790 ft wide at the junction of cutoff and bendway. Flow and Sediment Normal pool level for Columbus Pool is 163 ft (all elevations refer to msl datum). Standard project flood levels are 199 ft at Aberdeen Lock and Dam at the upper end of the pool and 175 ft at Columbus Lock and Dam at the lower end. Pertinent flow and sediment transport data are listed in Table D1. Table D1. Flow Information Event Discharge
cfs Sediment Discharge tons/day
1.5 year return flood 52,000 23,0001 year return flood 42,000 17,00050 percent exceedance
3,500 400
Source: USACE, 1978 Given the standard project flood elevations at the upstream and downstream locks, a linear interpolation gives a flood elevation of 180 ft at the port. Training Structures Training dikes may be constructed of riprap (stone), piles, and/or geotubes (geotextile fabric tubes filled with dredged material. If constructed of riprap, the dikes may be made solely of stone or of earth or rubble fill with a riprap blanket. Geotubes covered with riprap have been used in dredged material containment dikes and may be useful here as well. Constriction of the bendway channel to about 200 ft wide (instead of the 240 to 280 ft presently in the port reach) can be accomplished by short (60-ft long) transverse dikes extending out from the east bank of the reach. Constriction of the junction with the cutoff will require a longer dike, perhaps as much as 260 ft long.
106
Assuming a bed elevation of 154 ft, and a trapezoidal dike extending from 1 ft below the bed to a level (172 ft.) halfway between normal pool and standard flood stage, with 2-ft-wide crown, 1V:1.5H side slopes, yields a 19-ft-tall dike with cross-sectional area of 580 sq ft. If a 60 ft dike has that area on the channel end and ties into the bank only 2 ft tall (area of 10 sq ft.) the volume of the dike will be about 18,000 cu ft. A 260-ft-long dike, with a 19-ft height over most of its length will have a volume of about 150,000 cu ft. These volumes can be converted to stone tonnage by assuming a unit weight (including voids) of 88 to 118 lbs per cu ft. Assuming solid riprap construction with an average in-place unit weight of 0.05 tons/cu ft. and a materials plus construction cost or $35 per ton1 yields a cost of $32,000 for one 60-ft-long dike and $262,000 for one 260-ft-long dike. For a design in which the dikes are constructed of two different materials, e.g., a soil or rubble core covered by a geotextile membrane and protected by a riprap blanket at least 1 ft thick, the core for a 60-ft-long and 260-ft-long dike will require about 2200 cu ft and 130,000 cu ft of soil, respectively, and the riprap blanket will be about 3,000 cu ft and 20,000 cu ft, respectively. Applying the same cost figures as above results in a cost of about $8,000 for a 60-ft-long dike and $55,000 for a 260-ft-long dike. A sediment trap 500 ft long, 10 ft deep, and 200 ft wide with side slopes of 1V: on 3H represents an excavation of about 55,000 cu yd. (See Appendix L.) Extending the length to 1000 ft increases the volume to 102,000 cu yd. Dredging costs for these quantities are expected to be from $1 to $4 per cu yd, or $55,000 to $408,000. Removing the soil at the upper end of the notch to create a smoother transition will require excavation of a rounded plug about 90 ft wide with a chord length of about 330 ft and a depth of 28 ft will involve over 30,000 cu yd, which will cost $50,000 to $150,000, including riprap bank protection, with the lower end of the range for in-the-dry excavation and a short haul.
1 Personal communication with Joe Elsworth, U. S. Army Corps of Engineers, Mobile District, August 2003.
107
APPENDIX E: SEDIMENT RESUSPENSION BY TOWS AT PORT OF AMORY
The effect of a vessel’s passage through water is easily observable on the surface by the bow and stern waves and propwash. But, it is beneath the surface that the impact of the passage may be felt the greatest. Forces on the bed of a water channel during and after a vessel passage include pressure waves (normal stress) and bed shear stresses. These stresses can cause the resuspension of bed material into the water column. The resuspended sediment increases turbidity and often deposits in ports and backwater areas. Increased sedimentation in backwater areas may have a direct negative environmental impact on habitats, and the dredging required to remove the deposited sediment in the ports may have secondary environmental consequences.
The purpose of this appendix is to examine the impact tow traffic can have
on sediment resuspension at the Port of Amory, and by extension, the other ports on the Tenn-Tom. Other Field Studies
Johnson (1976) discusses the effects of tow traffic on the resuspension of sediments and on dissolved oxygen concentrations in the Illinois and Upper Mississippi Rivers. Total suspended solids and turbidity were monitored to reflect the level of resuspension occurring in the rivers. Water samples collected in the field were laboratory analyzed for suspended solids and turbidity using gravimetric and optical measurements, respectively. Dissolved oxygen measurements were made in situ at pre-determined depths at specific time intervals for up to 180 minutes after each tow passage. Specific sampling sites were selected so that maximum changes in concentrations by tow traffic on potentially productive side channel habitats could be observed. These analyses indicated tow traffic on the Illinois and Upper Mississippi Rivers does contribute to existing levels of suspended sediment measured as both total suspended solids and turbidity, and, furthermore, that sediments resuspended from the main channel move laterally to shoreward areas, including productive side channel areas. In this report a study by Butts (1974) is quoted as stating that “the resuspension of sediments by barge traffic may increase short-term localized oxygen demand loads by seven or eight fold”; however, the authors noted potential sources of error in Butts’ experiment and cast doubt on his results.
A subsequent study on the Illinois and Upper Mississippi Rivers (Bhowmik, et al, 1981) also monitored suspended sediment variations after tow passage events. The emphasis of this study was not if the passing of a tow would cause sediment resuspension, but rather, the tracking of the lateral movement of the resuspended material. Through gravimetric measurements of field samples and close monitoring of flow conditions the observed results
108
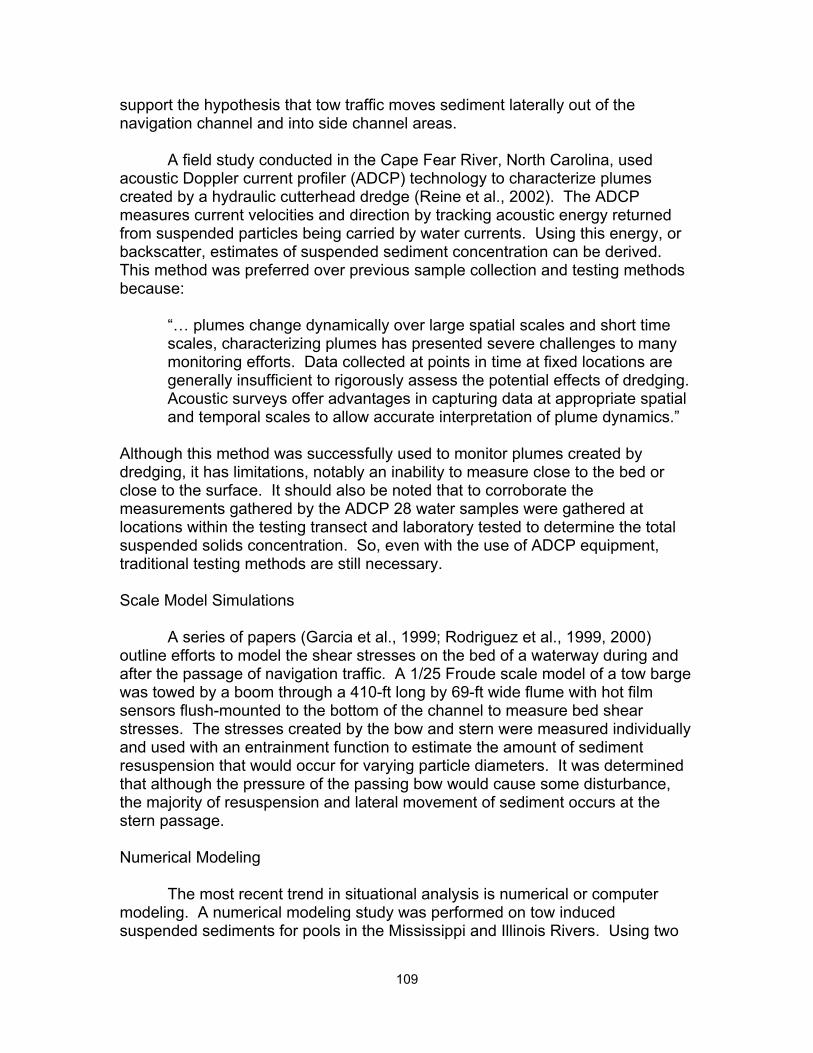
support the hypothesis that tow traffic moves sediment laterally out of the navigation channel and into side channel areas.
A field study conducted in the Cape Fear River, North Carolina, used acoustic Doppler current profiler (ADCP) technology to characterize plumes created by a hydraulic cutterhead dredge (Reine et al., 2002). The ADCP measures current velocities and direction by tracking acoustic energy returned from suspended particles being carried by water currents. Using this energy, or backscatter, estimates of suspended sediment concentration can be derived. This method was preferred over previous sample collection and testing methods because:
“… plumes change dynamically over large spatial scales and short time scales, characterizing plumes has presented severe challenges to many monitoring efforts. Data collected at points in time at fixed locations are generally insufficient to rigorously assess the potential effects of dredging. Acoustic surveys offer advantages in capturing data at appropriate spatial and temporal scales to allow accurate interpretation of plume dynamics.”
Although this method was successfully used to monitor plumes created by dredging, it has limitations, notably an inability to measure close to the bed or close to the surface. It should also be noted that to corroborate the measurements gathered by the ADCP 28 water samples were gathered at locations within the testing transect and laboratory tested to determine the total suspended solids concentration. So, even with the use of ADCP equipment, traditional testing methods are still necessary. Scale Model Simulations
A series of papers (Garcia et al., 1999; Rodriguez et al., 1999, 2000) outline efforts to model the shear stresses on the bed of a waterway during and after the passage of navigation traffic. A 1/25 Froude scale model of a tow barge was towed by a boom through a 410-ft long by 69-ft wide flume with hot film sensors flush-mounted to the bottom of the channel to measure bed shear stresses. The stresses created by the bow and stern were measured individually and used with an entrainment function to estimate the amount of sediment resuspension that would occur for varying particle diameters. It was determined that although the pressure of the passing bow would cause some disturbance, the majority of resuspension and lateral movement of sediment occurs at the stern passage. Numerical Modeling
The most recent trend in situational analysis is numerical or computer modeling. A numerical modeling study was performed on tow induced suspended sediments for pools in the Mississippi and Illinois Rivers. Using two
109
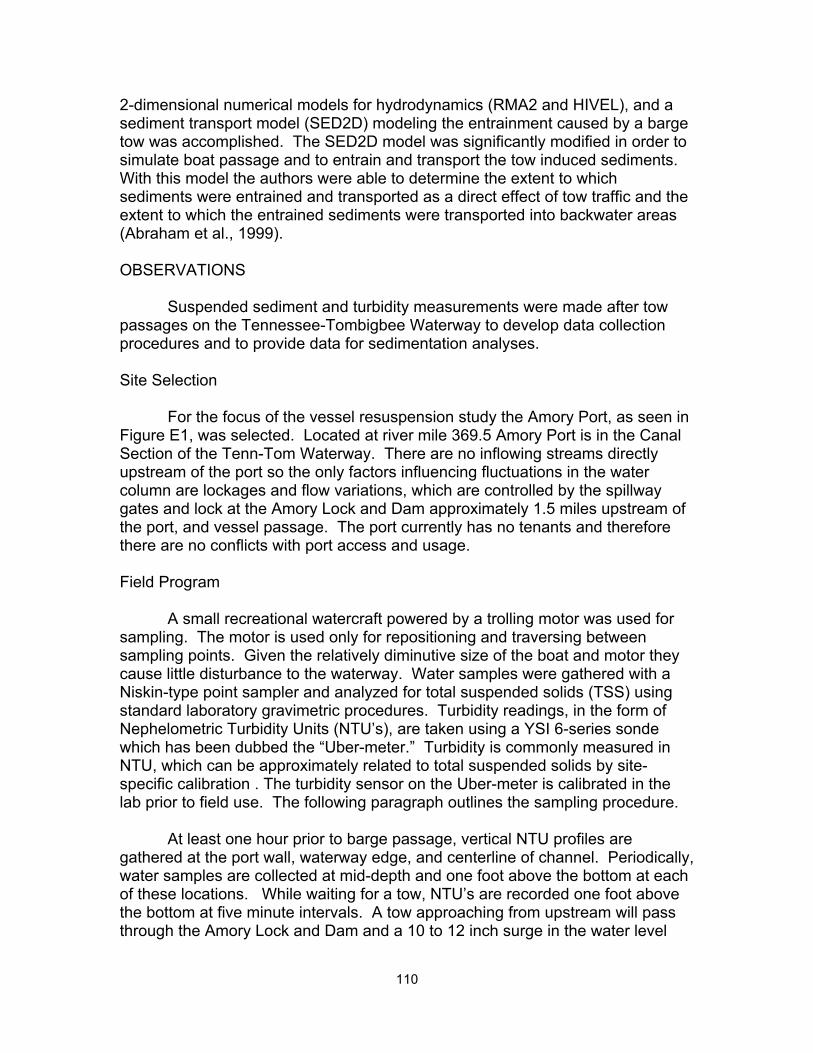
2-dimensional numerical models for hydrodynamics (RMA2 and HIVEL), and a sediment transport model (SED2D) modeling the entrainment caused by a barge tow was accomplished. The SED2D model was significantly modified in order to simulate boat passage and to entrain and transport the tow induced sediments. With this model the authors were able to determine the extent to which sediments were entrained and transported as a direct effect of tow traffic and the extent to which the entrained sediments were transported into backwater areas (Abraham et al., 1999). OBSERVATIONS
Suspended sediment and turbidity measurements were made after tow passages on the Tennessee-Tombigbee Waterway to develop data collection procedures and to provide data for sedimentation analyses. Site Selection
For the focus of the vessel resuspension study the Amory Port, as seen in Figure E1, was selected. Located at river mile 369.5 Amory Port is in the Canal Section of the Tenn-Tom Waterway. There are no inflowing streams directly upstream of the port so the only factors influencing fluctuations in the water column are lockages and flow variations, which are controlled by the spillway gates and lock at the Amory Lock and Dam approximately 1.5 miles upstream of the port, and vessel passage. The port currently has no tenants and therefore there are no conflicts with port access and usage. Field Program
A small recreational watercraft powered by a trolling motor was used for sampling. The motor is used only for repositioning and traversing between sampling points. Given the relatively diminutive size of the boat and motor they cause little disturbance to the waterway. Water samples were gathered with a Niskin-type point sampler and analyzed for total suspended solids (TSS) using standard laboratory gravimetric procedures. Turbidity readings, in the form of Nephelometric Turbidity Units (NTU’s), are taken using a YSI 6-series sonde which has been dubbed the “Uber-meter.” Turbidity is commonly measured in NTU, which can be approximately related to total suspended solids by site-specific calibration . The turbidity sensor on the Uber-meter is calibrated in the lab prior to field use. The following paragraph outlines the sampling procedure.
At least one hour prior to barge passage, vertical NTU profiles are
gathered at the port wall, waterway edge, and centerline of channel. Periodically, water samples are collected at mid-depth and one foot above the bottom at each of these locations. While waiting for a tow, NTU’s are recorded one foot above the bottom at five minute intervals. A tow approaching from upstream will pass through the Amory Lock and Dam and a 10 to 12 inch surge in the water level
110
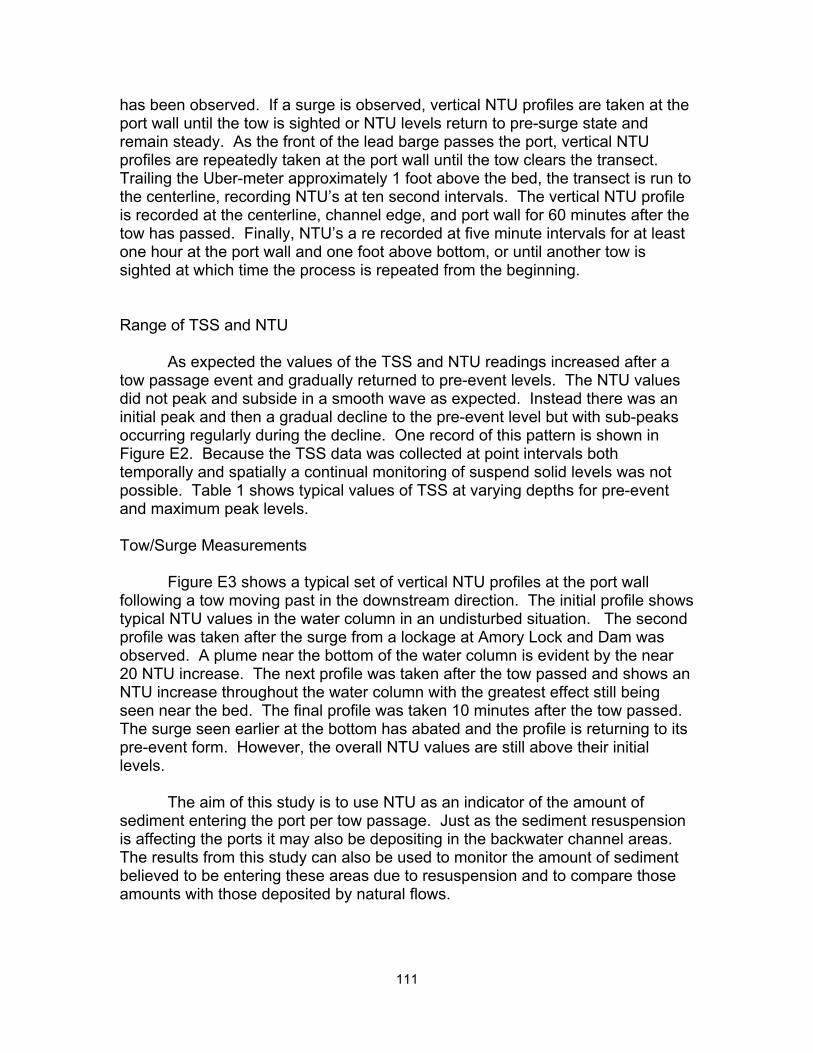
has been observed. If a surge is observed, vertical NTU profiles are taken at the port wall until the tow is sighted or NTU levels return to pre-surge state and remain steady. As the front of the lead barge passes the port, vertical NTU profiles are repeatedly taken at the port wall until the tow clears the transect. Trailing the Uber-meter approximately 1 foot above the bed, the transect is run to the centerline, recording NTU’s at ten second intervals. The vertical NTU profile is recorded at the centerline, channel edge, and port wall for 60 minutes after the tow has passed. Finally, NTU’s a re recorded at five minute intervals for at least one hour at the port wall and one foot above bottom, or until another tow is sighted at which time the process is repeated from the beginning. Range of TSS and NTU
As expected the values of the TSS and NTU readings increased after a tow passage event and gradually returned to pre-event levels. The NTU values did not peak and subside in a smooth wave as expected. Instead there was an initial peak and then a gradual decline to the pre-event level but with sub-peaks occurring regularly during the decline. One record of this pattern is shown in Figure E2. Because the TSS data was collected at point intervals both temporally and spatially a continual monitoring of suspend solid levels was not possible. Table 1 shows typical values of TSS at varying depths for pre-event and maximum peak levels. Tow/Surge Measurements
Figure E3 shows a typical set of vertical NTU profiles at the port wall following a tow moving past in the downstream direction. The initial profile shows typical NTU values in the water column in an undisturbed situation. The second profile was taken after the surge from a lockage at Amory Lock and Dam was observed. A plume near the bottom of the water column is evident by the near 20 NTU increase. The next profile was taken after the tow passed and shows an NTU increase throughout the water column with the greatest effect still being seen near the bed. The final profile was taken 10 minutes after the tow passed. The surge seen earlier at the bottom has abated and the profile is returning to its pre-event form. However, the overall NTU values are still above their initial levels.
The aim of this study is to use NTU as an indicator of the amount of sediment entering the port per tow passage. Just as the sediment resuspension is affecting the ports it may also be depositing in the backwater channel areas. The results from this study can also be used to monitor the amount of sediment believed to be entering these areas due to resuspension and to compare those amounts with those deposited by natural flows.
111
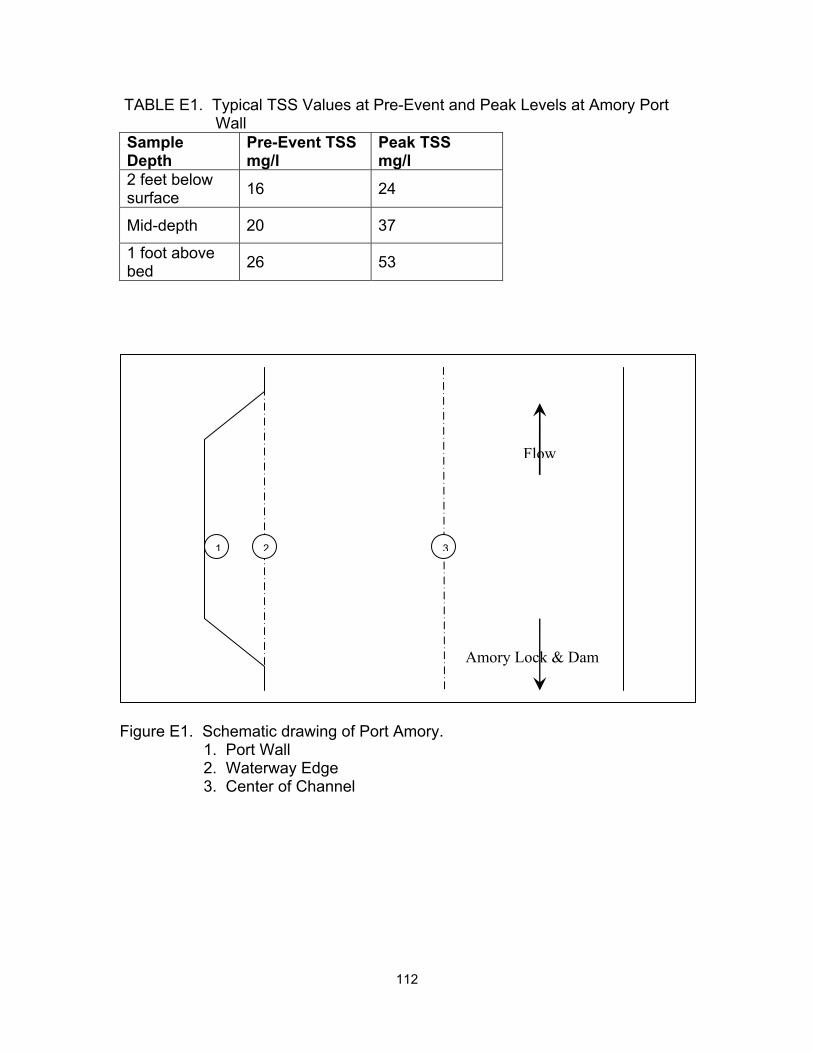
TABLE E1. Typical TSS Values at Pre-Event and Peak Levels at Amory Port Wall
Sample Depth
Pre-Event TSS mg/l
Peak TSS mg/l
2 feet below surface 16 24
Mid-depth 20 37
1 foot above bed 26 53
Flow
1 2 3
Amory Lock & Dam
Figure E1. Schematic drawing of Port Amory. 1. Port Wall 2. Waterway Edge 3. Center of Channel
112
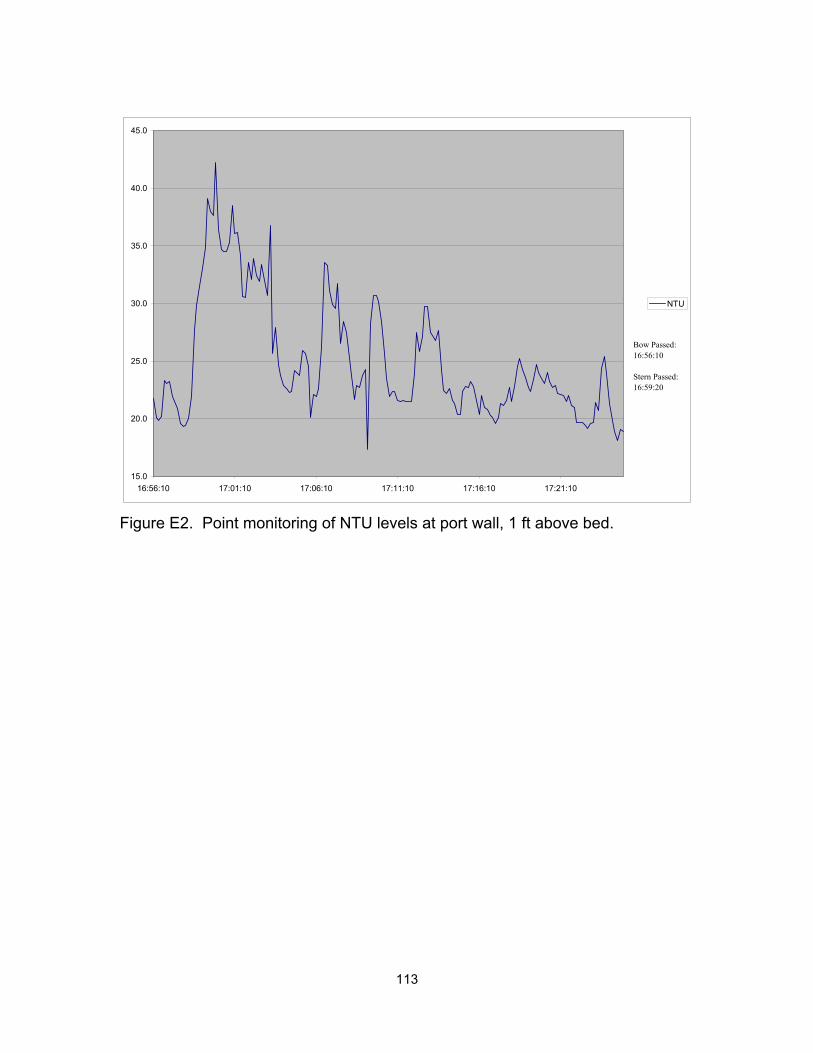
15.0
20.0
25.0
30.0
35.0
40.0
45.0
16:56:10 17:01:10 17:06:10 17:11:10 17:16:10 17:21:10
NTU
Bow Passed: 16:56:10
Stern Passed: 16:59:20
Figure E2. Point monitoring of NTU levels at port wall, 1 ft above bed.
113
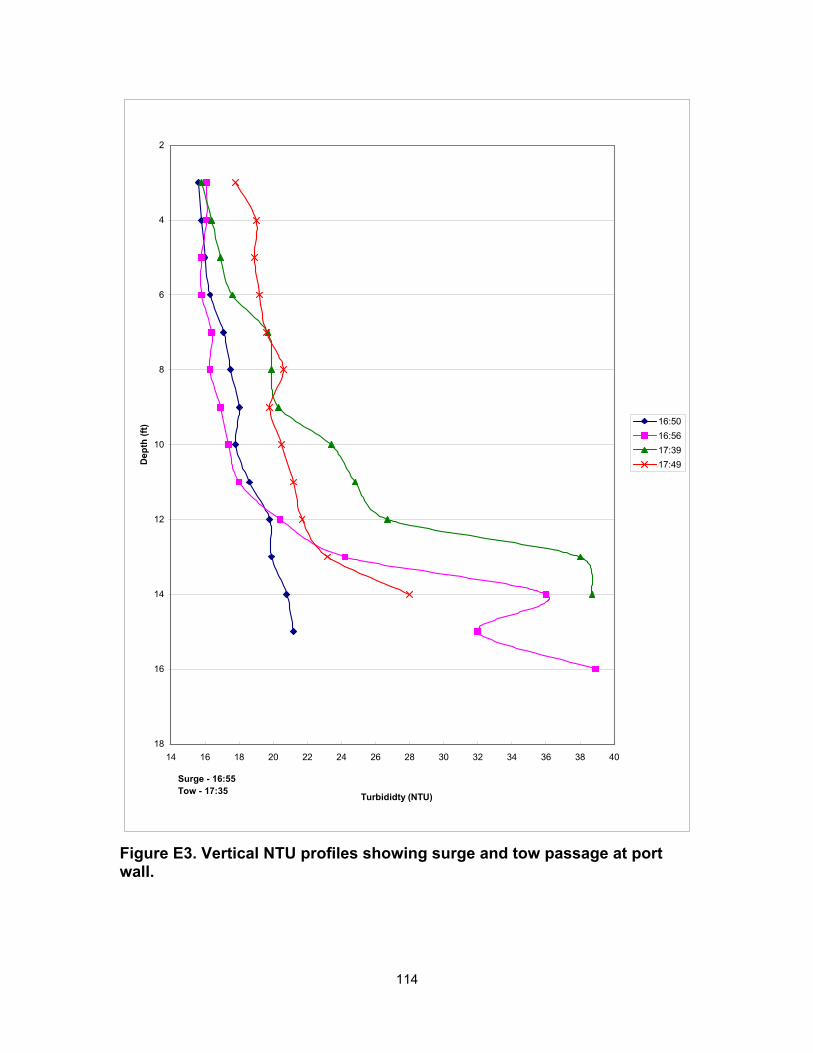
2
4
6
8
10
12
14
16
1814 16 18 20 22 24 26 28 30 32 34 36 38 40
Turbididty (NTU)
Dep
th (f
t) 16:5016:5617:3917:49
Surge - 16:55Tow - 17:35
Figure E3. Vertical NTU profiles showing surge and tow passage at port wall.
114