population growth of northern anchovy and pacific sardine using
TRANSCRIPT

Vol. 127: 15-26,1995 MARINE ECOLOGY PROGRESS SERIES
Mar Ecol Prog Ser 1 Published November 2
Population growth of northern anchovy and Pacific sardine using stage-specific matrix models
Nancy C. H. Lo*, Paul E. Smith, John L. Butler
Southwest Fisheries Science Center, PO Box 271. La Jolla, California 92038, USA
ABSTRACT: We applied a stage-specific population matrix, the Lefkovitch matrix, to the northern anchovy Engraulis mordax and the Pacific sardine Sardinops sagax to determine which vital rates in the life history have the most effect on population growth. Three vital rates considered are the daily stage-specific instantaneous mortality rate, stage duration and daily age-specific fecundity per female. The models incorporate variability in growth rates among individuals and link simpler stage-based and more complicated individual-based modeling approaches. The elasticity of population growth rate for anchovy (percentage change from a 1 % change of a vital rate) was greatest for mortality in yolk-sac larvae, fecundity of 2 yr old fish (111 to 135 mm), and stage duration in late larvae (11 to 35 mm). For sardine, elasticity was greatest for mortality in life stages of egg and yolk-sac larvae, fecundity of 5 and 6 yr old fish (211 to 250 mm), and stage duratlon in the early larvae (5 to 10 mm). When stage duration was variable, elasticity was !:;(l as large as when stage duration was constant, indicating that sensitivity of populations to changes in vital rates IS reduced by variation In growth rates. Population growth rates for both specles increased with variance in individual growth rates. Thus, a population with individu- als that grow at varying rates is more likely to increase. Our models indicate that growth rates are important determinants of population growth and recruitment and it is likely that growth and mortality rates are linked. We suggest, therefore, that inexpensive estimates of larval growth rates could be used to help forecast future recruitment.
KEY WORDS. Population matrix projection model . Sensihvity . Stage-specific vltal rates . Pelagic fish. Stage duration
INTRODUCTION
Recruitment of juveniles is the key factor controlling population abundance of short-lived fish such as anchovies and sardines. Recruitment prediction, a subject of considerable practical significance, requires detailed knowledge of the factors influencing survival in the first months of life. These fish inhabit diverse and variable regions of the coastal ocean, and the processes controlling their recruitment are complex. Thus, we may expect regional differences, nonlinear relationships, and stochastic variability of parameters in the underlying models. Once plausible models are identified, missing or imprecise parameter estimates often hinder recruitment prediction. Existing assess- ment procedures, e .g . the egg production method (Lasker 1985) and fishery catch-at-age models
(Megrey 1989, Methot 1989, Deriso 1993), provide estimates of spawning biomass and vital rates for some life stages (Smith 1985, Butler et al. 1993). There are an increasing number of estimates of larval fish mortality (Beyer 1989, Pepin 1991) from laboratory and field studies (reviewed by Houde & Zastrow 1993). The collection of vital rates for various life stages, although not contemporaneous, provides a basis for studying population changes (Crouse e t al. 1987).
Determining the sensitivity of population growth to changes in vital rates of each life stage is a useful way to study the mechanisms underlying population growth and recruitment of marine fish (MacCall 1980). Smith (1985) advanced this idea using a life table ap- proach, in which he determined the stage-specific vital rates which could cause a 5-fold change in recruitment of the northern anchovy Engraulis mordax. Smith et al. (1992) extended this work to the Pacific sardine
O Inter-Research 1995 Resale of full article not permitted

16 Mar Ecol Prog Ser
Sardinops sagaxusing the Lefkovitch matrix, which is a generallzation of the Leslie matrix (Lefkovitch 1965, Crouse et al. 1987, Caswell 1989). Smith et al. (1992) changed the value of each vital rate while holding oth- ers unchanged to achieve a 30 % annual increase or de- crease from a stationary population, a typical rate of population change during periods of sharp growth or decline. Barnes et al. (1992) demonstrated a 27 % an- nual increase of Pacific sardine during 1983 to 1991 in the presence of a fishery. Butler et al. (1993) reviewed the literature, including recent estimates, and com- pared population growth for the minimum and maxi- mum value for each parameter to identify critical life history stages for recruitment prediction.
In Smith e t al. (1992) and Butler et al. (1993), the vital rates were first tuned to reach a stationary population (h = 1 where h = N , / N , _ , and N, is the population size at time t ) . These 2 studies assumed that fish grew at the same rate, so that the time spent in each stage was constant. Recent modeling work has shown, however, that changes in the variance as well as mean growth may affect fish survivorship (Pepin 1989, DeAngelis et al. 1993, Rice et al. 1993). Thus, variation in indivldual growth rates within stages may be important. In this paper, we relaxed the assumption of fixed stage dura- tion and allowed the duration to vary because fish grow at different rates. We used a general formula to compute the sens~tlvity for each stage-specific vital rate and used a measure of elasticity which makes it easier to compare the sensitivity of the population to vital rate changes. In addition, we approximated 95 % confidence intervals of the population growth index through simulations and investigated the impact of variance of duration within stages on population growth.
MATERIALS AND METHODS
Model. The Lefkovitch matrix (A) describes the pro- jection of a population from time t to time t + 1 in terms of the vital rates of each life stage:
An, = n,,,
where n , is a q x 1 vector describing the stage distribu- tion of population a t time t, g is the number of stages, and t is measured in days.
A is the population projection matrix:
where P, is the probability of surviving and staying in Stage i, G, IS the probability of surviving and growing into the next stage, and F, is the fertility per fish per day; i = 1, ..., g. For a stable population, the dominant eigenvalue of matrix A, h, measures the population growth on the unit time basis. The corresponding eigenvector (W) is the stable stage distribution because
AW = ?,W and
An, = hn, = n,, , .
The natural logarithm of h [ln(h) = r] is the intrinsic rate of population change.
In Eq. (l), each of the elements, Pi, G,, and F,, depends on the probability of growing into the next stage, y, (Appendix A). Various methods are available for estimating the growth probability which primarily depends on the duration within a stage (Caswell 1989). We assumed the duration (d,) follows a negative bino- mial distribution with parameters (probability of suc- cesses) and k , (number of successes), because this dis- tribution is flexible and is widely used in modeling the duration distribution (Blythe et al. 1984, Caswell 1989). The 2 parameters, y, and k,, of a negative binomial dis- tribution are the growth probability and number of pseudostages within a stage. The pseudostages are imaginary stages which help to model the distribution of duration within stage. The duration is analogous to the number of trials taken to observe ki successes. Esti- mates of mean duration and the coefficient of variation [CV(d) = SD(d)/mean(d)] are then used to estimate the 2 parameters (Table 1). For details of description of matnx A and procedures of modeling growth rates, see Appendix A.
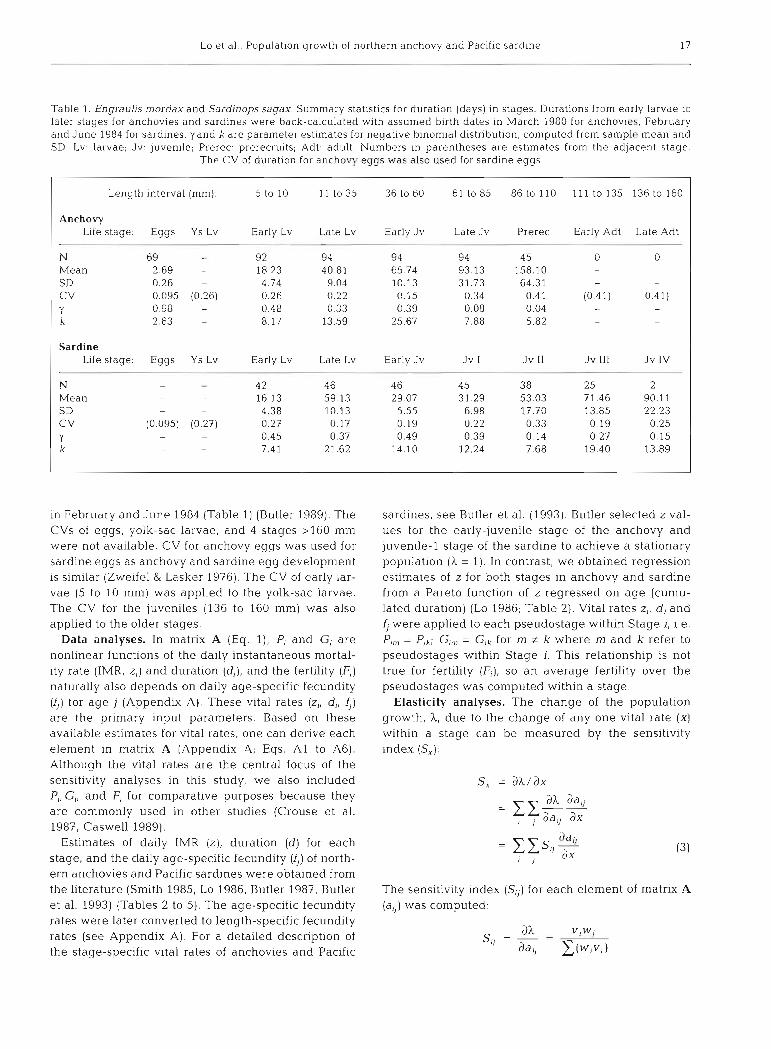
For the anchovy, 9 life stages were defined: eggs, yolk-sac larvae, larvae < l 0 mm in length, and larvae to adults grouped by 25 mm length intervals. The Interval size of 25 mm was an arbitrary choice. The CVs of duratlon were available for 6 stages. The CV for anchovy eggs (= 0.10) was computed from the incuba- tion time of eggs in laboratory rearing experiments (Lo 1983). CVs for 5 stages from 5 to 110 mm were com- puted from back-calculated growth rates from dally increments in otoliths of 94 juvenile anchovies born in March 1980 (Butler 1989) (Table 1). No CVs were available for the yolk-sac larval stage and the 2 adult stages, so values from adjacent stages were used: the CV of the early larvae (5 to 10 mm) was applied to the yolk-sac stage, and the CV for the prerecruits was also applied to the adult stages.
For the sardine, 13 life stages were defined in the same way as for the anchovy. CVs for 7 stage durations from 5 to 110 mm were computed from back-calcu- lated length-age data for 46 sardines with birth dates
Lo et al.. Population growth of northern anchovy and Pac~fic sardine 17
Table 1. Engraulis mordax and Sardinops sagax. Summary statistics for duration (days) In stages. Durations from early larvae to later stages for anchovies and sardines were back-calculated with assumed birth dates in March 1980 for anchovies. February and June 1984 for sardines. y and k are parameter estimates for negative binomial distribution, computed from samplc mean and SD. Lv: larvae; Jv: juvenile; Prerec: prerecruits; Adt: adult. Numbers in parentheses are estimates from the adjacent stage.
The CV of duration for anchovy eggs was also used for sardine eggs
Length interval (mm): 5 to 10 11 to 35 36 to 60 61 to 85 86 to 110 111 to 135 136 to 160
Anchovy Life stage: Eggs
N 69 Mean 2.69 SD 0.26 CV 0.095 Y 0.98 k 2.63
Ys Lv Early Lv Late Lv Early Jv
- 92 94 94 - 18 23 40.81 65 74 - 4.74 9.04 10.13
(0.26) 0.26 0.22 0.15 - 0.48 0.33 0.39 - 8.17 13.59 25.67
Late Jv Prerec Early Adt Late Adt
Sardine Life stage: Eggs Ys Lv Early Lv Late Lv Early J v Jv I Jv I1 Jv 111 Jv IV
~ -
N - - 42 46 4 6 45 38 25 2
Mean - - 16.13 59 13 29.07 31.29 53.03 71.46 90 11 SD - 4.38 10 13 5.55 6.98 17.70 13.85 22.23 CV (0.095) (0.27) 0 27 0.17 0.19 0.22 0.33 0 19 0.25 Y - 0.45 0.37 0.49 0.39 0.14 0.27 0.15 k - - 7.41 21.62 14.10 12.24 7.68 19.40 13.89
in February and June 1984 (Table 1) (Butler 1989). The CVs of eggs, yolk-sac larvae, and 4 stages >l60 mm were not available. CV for anchovy eggs was used for sardine eggs as anchovy and sardine egg development is similar (Zweifel & Lasker 1976). The CV of early lar- vae (5 to 10 mm) was applied to the yolk-sac larvae. The CV for the juveniles (136 to 160 mm) was also applied to the older stages.
Data analyses. In matrix A (Eq. l ) , P, and Gi are nonlinear functions of the daily instantaneous mortal- ity rate (IMR, z,) and duration (d,), and the fertility (F,) naturally also depends on daily age-specific fecundity ( f , ) for age j (Appendix A). These vital rates (zi, di, f , ) are the primary input parameters. Based on these available estimates for vital rates, one can derive each element in matrix A (Appendix A; Eqs. A1 to A6). Although the vital rates are the central focus of the sensitivity analyses in this study, we also included Pi, G,, and F, for con~parative purposes because they are commonly used in other studies (Crouse et al. 1987, Caswell 1989).
Estimates of daily IMR (z), duration (d) for each stage, and the daily age-specific fecundity (f,) of north- ern anchovies and Pacific sardines were obtained from the literature (Smith 1985, Lo 1986, Butler 1987, Butler et al. 1993) (Tables 2 to 5). The age-specific fecundity rates were later converted to length-specific fecundity rates (see Appendix A). For a detailed description of the stage-specific vital rates of anchovies and Pacific
sardines, see Butler et al. (1993). Butler selected z val- ues for the early-juvenile stage of the anchovy and juvenile-l stage of the sardine to achieve a stationary population ( h = 1) . In contrast, we obtained regression estimates of z for both stages in anchovy and sardine from a Pareto function of z regressed on age (cumu- lated duration) (Lo 1986; Table 2). Vital rates z,, d i and fi were applied to each pseudostage within Stage i, i.e. P,, = Plk; Gim = G,k for m # k where m and k refer to pseudostages within Stage i. This relationship is not true for fertility (Fi), so an average fertility over the pseudostages was computed within a stage.
Elasticity analyses. The change of the population growth, h, due to the change of any one vital rate (X) within a stage can be measured by the sensitivity index (S,):
The sensitivity index (S,,) for each element of matrix A (ai,) was conlputed:

18 Mar Ecol Prog Ser 127: 15-26, 1995
Table 2. Engraulis mordax. Daily instantaneous mortality rate (IMR) and stage duration for anchovies. SD is computed from CV, which measures among-year variation. Lv: larvae; Jv: juvenile; Adt: adult
Stage Name IMR Duration (days) - Length (mm)
Estimates C V SD Estimatesd C V SD
1 Egg 0.2310 0.36 0.0832 2.90 0.22 0.63 2 Yolk-sac 0.3660 0.15 0.0560 3.60 0.17 0.62 H'-4 3 Early Lv 0.2860 0.05 0.0147 12.00 0.31 3.75 5 - 4 Late Lv 0.0719 0.05 0.0038 45.00 0.20 9.00 11- 5 Early Jv 0.0107' 0.05 0.0006 62.00 0.22 13.75 36- 6 Late Jv 0.0044 0.05 0.0002 80.00 0.24 19.50 61- 7 Prerecruit 0.0031 0.05 0.0001 287.00 0.38 108.00 86- 8 Early Adt 0.0021 0.18 0.0004 1000.00 0.13 125.00 111- 9 Late Adt 0.0021 0.18 0.0004 1250.00 0.10 125.00 136-160
dValues of this column were derived from growth curves (Butler et al. 1993) and may differ from Table 1 bHatching =Regression estimate from ln(z) = 0.47 - 1.0347 ln(age + 1) based on data from Stages 1 to 7 where age is cumulative duration
where W, is the ith element of the right eigenvector and Variability of estimate of daily population growth v, is the jth element of the left eigenvector (AW = LW, rate h . Once matrix A is determined, A can be VA= AV) (Caswell 1989). For example, Slz is the sen- computed by using mathematical packages (e.g. sitivity index for G1 (Eq. 1). Formulas for the sensitivity MATLAB) or by continuous multiplication of matrix index of vital rates are given in Appendix B. A with an arbitrary initial stage vector (no): A' no =
When vital rates differ in magnitude, it is useful to n,; h. = n,/n,-, for large t. We used the continuous examine the percentage change of population growth multiplication procedure. The elements of matrix A due to a 1 % change of a vital rate. The elasticity (ex) (aij) are functions of vital rates, which are estimated can be used to compute the daily population growth with errors, thus the estimate of h is also subject to when vital rates change. The proportional sensitivity or error. elasticity, ex, is defined: Monte Carlo sirnulations were used to estimate the
variance of jL and as % confidence interval (CI) of h. dh/ h In this simulation, IMR, d within each stage, and the
ex = - ax X (4) daily f i were drawn independently from normal distri-
bution with means equal to best estimates (Butler et For example, if e , is -0.005, then the population de- al. 1993; Tables 2 to 5). The SDs of vital rates of both creases by 0.005 % for a 1 % increase of vital rate X. The species were estimated from range values reported in elasticities are computed from an expanded matrix A, Butler et al. (1993) as SD(x) = [max(x) - min(x)]M, the dimensions of which are n X n, where n = Ekj and k, except for the IMR of anchovy eggs and daily fecun- is the number of pseudostages within Stage i. dity rates. The CV for anchovy eggs is 0.36 (Jacobson
& Lo 1992); for fecundity of anchovy, Table 3. Engraulis mordax. Batch fecundity/1000 by age for northern 0.03 (Hunter et a1 1985). The CV for
anchovy population in whlch gof% of females mature in the first year fecundity was also apphed to the sardme (Tables 3 & 5).
In the simulation, vital rates were checked to be sure they were biologically reasonable (no negative values were allowed). For each set of simulated input parameters, Eqs. A1 to A6 (Appendix A) were used to compute elements in matrlx A. jL was calculated by continuous multi- plication of matrix A 3000 times. Mean and SD were obtained from 1000 simula- t ion~ . The 95% C1 for h was also obtained.
Age Fish Batches Eggs Eggs female-' d-I ( I , ) (yr) weight (g) yr.' batch-' Estimates SD"
1 8.7 5.3 4.2378 61.5352 1.85 2 14.6 11.9 7.8604 256.2706 7.69 3 18.3 19.2 10.1322 532.9815 15.99 4 21.2 23.5 11.9128 766.9885 23.01 5 24.5 23 5 13.9390 897.4425 26.92 6 24.2 23 5 13.9390 897.4425 26.92 7 24.5 23.5 13.9390 897.4425 26.92
"SD = estimates X 0.03 (Hunter et al. 1985)

Lo et al.: Population growth of northern anchovy and Pacific sardine 19
Table 4. Sardinops sagax. Daily instantaneous mortality rates (IMR) and stage duration for Pacific sardines SD is computed from CV which measures among-year variation. Lv: larvae; Jv: juvenile, Adt: adult
I Stage Name IMR-- Duration (days)- Length (mm) I I Estimates CV SD Estimates" CV SD I
Egg Yolk-sac Early Lv Late Lv Early Jv Jv I Jv 11 Jv I11 Jv IV Prerecruit Early Adt Adult Late Adt
"Values of this column were derived from growth curves (Butler e t al. 1993) and may differ from Table 1 bHatching CRegression estimate from In(z) = 2.03 - 1.29 In(age + 1) based on data from Stages 1 to 10 where age is the cumulative duration
RESULTS ln(1.00105) = 0.00105 (Table 7). A crude estimate of the annual population growth rate is 1.46 (1.001053G5).
Northern anchovy The elasticity analysis indicated that a relative change in the IMR of yolk-sac anchovy larvae results
The projection matrix A with time step equal to 1 d in the largest percentage change in population growth. was constructed (Table 6). Each entry of matrix A was For fecundity, the population is most sensitive to the used for all pseudostages within a stage. The dimen- 1 % change in daily fecundity rate of 2 yr old fish (111 sions of the expanded matrix A are 79 x 79. The domi- to 135 mm; Stage 8) . For the duration of stages, the nant eigenvalue of the expanded matrix A is 1.00105. population growth is mostly sensitive to a percentage The intrinsic daily population growth rate is change in late larvae (Stage 4; Fig. 1).
Elasticity estimates for 3 vital rates can be used to compute the percentage
Table 5. Sardjnops sagax. Batch fecundity/1000 by age for Pacific sardlne change of population grotvth for population In which 50% of females mature at age 2 change of 1 particular vital rate. For exam-
ple, if the IMR of yolk-sac larvae is re-
205.0 53.915 5908.493 177.25 obtained the mean and SD for as 1.0016 205.0 53.915 5908.493 177.25 and 0.001 1. The 95 % C1 for h is 0.9992 to 205.0 53.915 5908.493 177.25
1.0054, and includes h = 1. Thus, the null
aSD = estimates X 0.03 (Hunter et al. 1985) hypothesis of a stationary population is not rejected.
Age Fish Batches Eggs Eggs female-' d - ' (f,) (yr) weight (g) y batch-' Estimates SDa
1 52.7 0 0 0 0 2 93.0 6 24.459 402.066 12.06 3 123.0 12 32.349 1063.529 31.91 4 152.0 15 39.976 1642.849 49.29 5 170.0 19 44.710 2327.370 69.82 6 193.0 23 50.759 3198.512 95.96 7 202.0 2 8 53.126 4075.419 122.26 8 205.0 3 0 53.915 4431.370 132.94 9 205.0 35 53.915 5169.932 155.10
10 205.0 40 53.915 5908.493 177.25
duced by 10%, i.e. from 0.37 to 0.33 (Table 2), then the daily population growth will be increased by 0.0052 % (e,x 10%; Table 7). If the duration of the late larval stage is increased by 10% from 45 to 49 d, the population would be de- creased by 0.00212 % daily. If the daily fe- cundity of 2 yr old females is increased by 5 % from 256 to 269, the population would be increased by 0.00428 % (e,x 5 %) daily.
From the 1000 simulation runs, we

2 0 mar Ecol Prog Ser 127- 15-26, 1995
Table 6. Engraulis mordax. The projection matrix (Eq. 1) of northern anchovy with variable duration and number of pseudostages within each stage. h = 1.00105. k: number of pseudostages (Eq. A4). For stage definition, see Table 2
I Stage 1 2 3 4 5 6 7 8 9 I
I Total number of pseudostages = 79 I The expanded projection matrix consists of the first 3 'pseudostages' with P, = 0.0224 and G, = 0.771 and the next 3 pseudo- stages with P, = 0.136 and G, = 0.558. etc. Fertilities for the last 3 stages are the averages of fertilities for the pseudostages within stages
Pacific sardine
The projection matrix A with time steps equal to 1 d was constructed (Table 8). The dimensions of the expanded matrix A are 167 X 167 and the dominant eigenvalue is 1.00014. The intrinsic daily population growth rate is ln(1.00014) = 0.00014 (Table 7) . A crude estimate of the annual population growth rate would be 1 052 (1.00014365).
Table 7. Engraulis mordax and Sardinops sagax. Estimates of daily population growth rate (A), standard errors in parenthe- ses and the most elastic stages of anchovy and sardine for 2 models: fixed duration and variable duration within stage. IMR: ~nstantaneous mortality rate; YL: yolk-sac larvae; EL.
early larvae; LL: late larvae; Cl: confidence interval
Fixed duratlon Variable duration within stage within stage
Anchovy ?L
D~rect computation 1.000479 1.00105 Simulation 1.0016 (0 0011)
95% C1 0.9992-1.0054
Elasticity (e,) IMR EL: -0.0048 YL: -0.00052 Duration EL: -0.0048 LL: -0.000212 Fecundity Age 2: 0.00043 Age 2: 0.000857
Sardine h
Direct computation. 0.99983 1.00014 Simulation 1.0003 (0.0011)
95% C1 0.9987-1 002
Elasticity ( e , ) IMR LL: -0.00160 Egg, YL: -0.0004 Duration LL: -0.00161 EL: -0.00007 Fecundity Age 5: 0.0008 Age 5: 0.0002
Similar to northern anchovies, the elasticity analysis for sardines indicated that the largest percentage change in population growth came from a relative change in the IMR of egg and yolk-sac sardine larvae, followed by larval stages (Table 7, Fig. 2). For f, per female, population growth is most sensitive to the percent-age change in 5 yr old females (21 1 to 235 mm; Stage 12). For stage duration, the population growth is most sensitive to a relative change in early larvae (Stage 3).
A 10% increase of the daily IMR for the yolk-sac larvae from 0.67 to 0.74 (Table 4) would result in a decrease of 0.004 % for the population. Likewise, with a 10% decrease of duration for the early larvae from 11 to 10 d , the population would be increased by 0.0007% dailv. If the dailv fecunditv of 5 vr old females IS increased by 20% from 2321 to 2792, the population would be increased by 0.004% daily (Table 7).
From the simulation, we obtained mean and SD of h as 1.0003 and 0.0011. The 95% C1 for ?, is 0.9987 to 1.0028. From the 95% C1 of 1, we cannot ascertain the direction of population growth of sar- dines
Elasticity of entries of matrix A (P,, Gi and Fi)
For both anchovies and sardines, the elasticity of population growth to the probability of survival and staying in the stage (P,) increases with stages until the last stage. Population size apparently is more sensitive to P, than to the probability of survival and growing into the next stage, G,, and fertility, F, (Figs. 3 & 4).

Lo et al.. Populat~on growth of northern anchovy and Pacific sardine 2 1
\ FECUNDITY
i \
Fig. 1. Engraulis mordax. Elasticity of instantaneous mortality rate (IMR), duration (DURA) within each stage and daily age- specific fecundity for northern anchovy. YL yolk-sac larvae; EL: early larvae (4 to 10 mm); LL: late larvae (1 1 to 35 mm); EJ: early juvenile (36 to 60 mm); LJ: late juvenile (61 to 85 mm); PR: prerecruits (86 to 110 mm): EA: early adult (111 to
135 mm); LA: late adult (136 to 160 mm)
-0.0006 I I I I I I I I I
STAGE
Fig. 3. Enyraulis mordax. Elasticity of P,, G, and F,, elements of matrlx A (Eq. 1) within each stage for northern anchovy. YL: yolk-sac larvae; EL: early larvae (5 to 10 mm); LL: late lar- vae (11 to 35 mm); EJ: early juvenile (36 to 60 mm); U: late juvenile (61 to 85 mm); PR: prerecruits (86 to 110 mm); EA:
early adult ( l 11 to 135 mm), LA: late adult (136 to 160 mm)
F
Relationship between variations of stage duration and h
YL LL ILJ EA 3 5 7 9
STAGE AGE (YR)
EL
In order to see how the variability of stage duration affects the rate of population growth, we considered 8 cases. In each case, all the initial CV values (Table 1) were multiplied by a constant, c, between 0 and 3.0.
EJ PR
STAGE AGE (Y R)
_I" -3.0304 1 I I I I I I I I I I I
LA
Fig. 2. Sardinops sagax. Elasticity of instantaneous mortality rate (IMR), duration (DURA) within each stage and daily age- specific fecundity for Pacif~c sardine. YL: yolk-sac larvae; EL: early larvae (5 to 10 mm), LL: late larvae (11 to 35 mm); EJ: early juvenile (36 to 60 mm); J1. juvenile (61 to 85 mm); 52: juvenile (86 to 110 mm); 53: juvenile (111 to 135 mm); 54: juve- nile (136 to 160 mm); PR: prerecruits (161 to 185 mm); EA: early adult (186 to 210 mm); A: adult (211 to 235 mm); LA:
late adult (236 to 250 mm)
EGG 4 6
YS LL J1 J3 PR A STAGE
8
Fig. 4 . Sardinops sagax. Elasticity of P,. G, and F,, elements of matrix A (Eq. 1) within each stage for Pacific sardine. YL: yolk-sac larvae; EL: early larvae (5 to 10 mm); LL: late larvae ( l 1 to 35 mm); EJ: early luvenile (36 to 60 mm); J1: luvenile (61 to 85 mm); 52: juvenile (86 to 110 mm); 53: juvenile (110 to 135 mm); 54: juvenile (135 to 160 mm); PR: prerecruits (161 to 185 mm); EA- early adult (186 to 210 mm); A: adult (211 to
235 mm); LA: late adult (236 to 250 mm)
YS LL J1 23 PR A 3 5 7 9 11 13 EL
For example, when c = 0, the duration within a stage does not vary. For c = 2, this set of C V is twice those CV values given in Table 1. We then computed 1 L for each case. For both species, k increases with the constant (Fig. 5). Thus, a population with variable growth among individuals is more likely to increase in the long run, if everything is equal. These results are consistent
EJ J2 J4 EA LA 4 6 8 10 12

22 Mar Ecol Prog Ser 127: 15-26, 1995
with the findings by Caswell (1989), Such a popu- lation does not readily react to the change of vital rates because of low elasticities (Table 7).
DISCUSSION
Our model incorporated the variation of somatic growth within stage (variable growth). We believe that this is more realistic than models assuming fixed stage duration (fixed growth). If the variances of somatic duration are unknown, fixed stage durations may have to be assumed although the results might be biased. For com- parison purposes, we computed the population growth (k) and elasticity of vital rates for both species using fixed growth (Appendices A & B). Our results for anchovies and sardines show that the A. from models with variable duration was always higher than the \ from models with fixed duration (Table 7). These results indicated that variation in growth rates of individuals enhanced the population growth, primarily due to size- dependent mortality (Tables 2 & 4). While the mathematical consequences of growth variability within each stage are clear, it will also be neces- sary to confirm the importance of these phenom- ena by field measurements. Pepin (1989) reported that mean and variance of growth rates of 1 cohort affect the survival rates of the popula- tion. Rice et al. (1993) found that high variation in larval growth leads to increased cohort sur- vival after 60 d, when the predation is size- dependent.
Population growth in our models for anchovies and sardines with variable duration is more sen- sitive to the percentage change of IMR and fecundity than to the percentage change in stage duration. With fixed duration, population growth is equally sensitive to the percentage change of mortality (IMR) and growth (duration) and not so sensitive to fecundity (Table 7). Elasticity values for IMR and duration from fixed growth are nearly 10 times that from variable growth. This difference implies that when the variance in the growth rates of individuals increases, the sensi- tivity of the population to changes in those rates decreases. The most elastic stages for both IMR and duration may differ depending on models used, yet the most elastic stages are from eggs to late larvae. Butler (1989) found that population growth of sardines was correlated with mortality of larvae, which is consistent with this study.
The population growth is a function of mean and variance of stage-specific vital rates, as

Lo et al.: Population growth of nor1 thern anchovy and Pacific sardine 23
I C15
0 039
0 03.5
1 ;,34
1 L132
i son
CONSTANT
Fig 5. Engrauljs mordax and Sardinops sagax Relationship between the population growth rate (h) and the constant used to multiply the coefficient of variation (CV) of stage duration for northern anchovy and Pacific sardine (Table 1). For exam- ple, when constant = 0.5, the CV values for anchovy are 0.5 times the CV values of stage duration (Table 1): e.g. CV of stage duration is 0.0475 (= 0.5 X 0.095) for anchovy eggs. 0.13
(= 0.5 x 0.26) for yolk-sac larvae, 0.21 for prerecruits
demonstrated by the relationship between population growth and the constant used to multiply the CV of stage duration (Fig. 5). For northern anchovies and Pacific sardines, the most sensitive stages are early life stages whose vital rates have reasonable estimates. However, as for most fish populations, precise esti- mates of CVs for stage duration are not available. It would be useful to investigate the robustness and bias of population growth estimates from matrix models introduced by using crude estimates of both mean and CV of vital rates.
The most elastic stages for both species are similar: for the IMR, they are egg and yolk-sac larval stages, and for stage duration, they are early and late larval stages (Figs. 1 & 2). The correspondence may be due to biological similarities between anchovies and sar- dines, and, perhaps, a general pattern in short-lived pelagic fish. Alternatively, it may result from use of identical parameter values in our models for both spe- cies, e.g. CV of egg duration. Maximum elasticities were greater for anchovies than for sardines. Thus, our models project that anchovy populations would change size more quickly than sardine populations, in response to proportional changes in a vital rate (Table 7) .
Results from our models indicate that growth rates of early life history stages are important determi- nants of recruitment and population growth. It may be possible, therefore, to provide fishery managers with useful indicators of future recruitment based on
larval growth rate data (Huppert et al. 1980). Pepin (1990) found that short-term variability in recruit- ment was associated with fluctuation in plankton abundance, indicating that growth rates may be an important factor in determining year-class strength. These fluctuations may be correlated with large- scale climatic forcing (Koslow e t al. 1987). Predator and prey abundance are often correlated (Pepin 1990), suggesting that large year classes in pelagic fish may occur when increases in predator abun- dance lag behind prey abundance.
Mortality rates are another important determinant of population growth and recruitment success. In practice, growth rates are much easier and cheaper to estimate because they require smaller sample sizes than estimating mortality. Representative specimens have several weeks or months of growth history stored in their otoliths. In addition, growth rate (the inverse of stage duration) and stage mortality may covary because mortality is due largely to predation risks that depend on size. Linkages between growth and mortality rates could be evaluated empirically if sufficient growth and mortality rate data were avail- able (Butler 1989).
In the future, our assumptions require closer scru- tiny. We need to improve the precision and accuracy of estimates of parameter values. Also, field research is required to refine and determine the covariance of vital rates. For example, rapid growth in one stage may confer growth rate advantages in subsequent stages, hasten the onset of maturity and provide additional advantages for evading sources of mortality a s indi- cated by DeAngelis et al. (1993) from their individual- based models. The covariance is also essential for ana- lytical computation of variance of h estimates. This material was not pursued in this paper because we lacked data on covariance (Houllier et al. 1989, Alvaarez-Buylla & Slatkin 1991).
Our analyses demonstrate that matrix population models a re useful tools for examining population changes which respond to changes of vital rates of certain llfe stages more readily than to others. Although we do not have contemporaneous sets of vital rates for anchovies and sardines, the results of our analyses provide insight into population changes in these 2 species and help define the future research directions on the vital rates of important life stages. These stages may have a direct impact on the success of recruitment.
Acknowledgements. We thank Drs Larry B. Crowder of North Carolina State University, and John Hunter, Larry Jacobson, Geoffrey Moser, and Barbara Taylor of Southwest Fisheries Science Center for providing valuable suggestions. We also thank 3 referees for their constructive criticisms which improved the focus of the paper.

24 Mar Ecol Prog Ser 127: 15-26, 1995
Appendix A. Description of matrix A
To construct matnx A (Eq l ) , we used the procedures based on Caswell (1989)
P, and G,. Both P, and G, are funct~ons of the survival probability (p,) and the growth probability (y,) on a dally basis
where p, is computed as
and z, is the daily instantaneous mortality rate (IMR). y, is computed as follows, assuming fixed or variable stage
duration models. Fixed duration: Duration (days, d, ) in each stage 1s the
same for all individuals. Under the assumption of a stable age distribution [ l , p, /h, ..., within a stage, the growth probability was computed as the proportion of the oldest age group to all age groups:
An iterative procedure was used with an initial guess far h because y, depends on h. The iteration stops when the dlf- ference of the last 2 1 s is less than 0.0001.
Variable duration: d, within a stage was modelled by a negative binomial distribution with parameters y, and k,:
where -I, is the probability of growing into the next pseudo- stage (analogous to probability of success) and k, is the number of pseudostages within Stage i (number of suc- cesses). In other words, a fish in Stage 1 is assumed to pass through each of k, pseudostages with the growth probabll- ity y,. Pr(d, = X) glves the probabil~ty that a fish in Stage I
will pass through all k, pseudostages and graduate to Stage i + 1 in X days. No assumption was imposed on the within-stage age distribution. For y, = 1, P,(d, = k,) = 1. Both '(, and k, were computed as functions of the mean and \ran- ance of duration, d,, that follows a negative binomial distn- bution.
and
where CV, is the coefficient of variation of d,. The quantity d, is the average d_uration for Stage i. When the CV = 0, theny, = 1 and k, = d,, the durat~on for each stage IS fixed as in fixed duration. When CV increases, k decreases and can be less than 1. We set 1 as the lower bound for k, as k is theoretically the number of pseudostages.
For the matrix model based on variable duration, the com- putation of A is based on an expanded matrix A, which includes all the pseudostages wlth dimension equal to Zk,. In the case where k, = l , the dimension of the expanded matrix A is reduced to that of the original matrix A. In Eq. (A4), the mean values, d,, are listed in column 6 of Tables 2 & 4 and the CVs are listed in Table 1. Sensitivity analyses were conducted for each of the 2 models (see Appendix B).
F,(fertility). LVe computed the daily fecundity per fish for Stage i [m,) as
where T, is the age-specific fecundity rate (the number of eggs per female of age j per unlt time) (Tables 3 & 5). The weight, W,,, is the proportion of fish that are of age j:
where t , , is the beginning age and t5 is the ending age for the fish of age group j.
Cas~vell (1989) provided the general procedure for com- puting the stage-specific fertility (F,): fertility varies with egg mortahty, adult mortality, growth probability, spawning time and the time of census. For anchovies and sardines, plankton surveys are usually conducted continuously throughout the day. If we take stage distribution at the peak spawning time as n, (Eq. 2) and assume fish spawn only at the peak spawning time, the fertility at the sampling time will be surviving eggs [Butler et al. 1993). The F, values computed in this paper may differ from Butler et al. (1993) because Butler et al. (1993) assumed only 1 survey within 1 time unit.
The peak spawning time is 22:OO h for anchovies and 20:OO h for sardines. In our case. the time unit is 1 d . If a tow was taken at 01:OO h, for anchovies U = 'h1 and for sardines U = "'24. For a census taken at the elapsed tlme after spawn- ing, U (0 < U < l ) , the stage-specific fertility as a function of time (start) of tow ful:
We integrated the above equation to obtain an average fertility for Stage i (F,):

Lo et al.: Population growth of northern anchovy and Paclflc sardine
Appendix B. Sensitivity indices for vital rates
The basic formula for sensitivity indices for vital rates is a-/ J G - y+- - -
ax a?, ;)a,, JP 3~
- - - XI-- 3x , , d a , ax where 3Uap is computed from Eq. (A3):
The elasticity index can be obtained from Eq (4 ) . The quantlty Jhida,, was glven In Eq. (3). In the following sec- .* = -
L
[(l - qd)(d - l - qd) + ( l - q)qdd] tions, we derived formulas primarily for Ja, lax where X are ;)P [ l - q"]'h vital rates specifically for our matrix population models. The subscripts for stages are om~t t ed for simplicity. where q = pf l .
Fixed duration. Sensitivity to age-specific fecundity ( f , ) Sensitivity to stage duration (d,) a m d : aklaf ,~From Eqs. (A5) & (A6). w e have
8, da,, Jh adll, - = -)-Ep7 x7 -..r- afl , k 3alR df, k dalk df,
ah aF, = X-- r aFk af,
where
C ) F ~ - 2~~ am, - - -- ar, amk brl
Indlces j and k refer to stage, and index j refers to age.
Sensitivity to instantaneous mortality rate (2;) ahlaz:
where aUap is derived as follows:
where
ah a G SA J P - +-- ~ a , + , , , a d ad,,, a d
where
The quantity aylad is computed from Eq. (A3)
Variable duration: The sensitivities to both age-specific fecundity (4) and IMR (2,) are computed the same way as in fixed duration. The sensitivity to the stage duration (di). Eq. (AS), still applies, except the quantity ahlad needs to be computed from Eq. (A4):
LITERATURE CITED
Alvaarez-Buylla R, Slatkln M (1991) Finding confidence limits on population growth rates. Trends Ecol Evol 6 (7): 221-224
Barnes JT, Jacobson LD, MacCall AD, Wolf P (1992) Recent population trends and abundance estimates for the Pacific sardine Sardinops sagax. CalCOFl Rep 33:60-75
Beyer JE (1989) Recruitment stability and survlval - simple
size-specific theory with examples from the early life dynamics of marine fish. Dana Rep 7:45-147
Blythe SP, Nisbet RM, Gurney WSC (1984) The dynamics of population models with distributed maturation periods. Theor Populat Biol25:289-311
Butler JL (1987) Cornpanson of the early life history parame- ters of Pacific sardine and northern anchovy and implica- tions for species interactions. PhD thesis, Univ California, San Diego

26 Mar Ecol Prog Ser 127: 15-26. 1995
Butler J L (1989) Growth during the larval and juvenile stages of the northern anchovy, Engraulis mordax, in the Califor- nia Current during 1980-84. Fish Bull US 87:645-652
Butler JL, Smith PE, Lo NCH (1993) The effect of natural vari- ability of life-history parameters on anchovy and sardine populations. CalCOFI Rep 34: 104-1 11
Caswell H (1989) Matrix population models: construction, analysis and interpretation. Sinauer Associates, Inc, Sun- derland, MA
Crouse DT, Crowder LB, Caswell H (1987) A stage-based population model for loggerhead sea turtles and irnplica- tions for conservation. Ecology 68(5):14 12-1423
DeAngelis DL, Rose DA, Crowder LB. Marschall EA, Lika D (1993) Fish cohort dynamics: application of complemen- tary modeling approaches. Am Nat 142:604-622
Deriso R (1993) A report on integrated stock assessment of Pacific sardine, Appendix 2. In: Hester FJ (ed) Project report on Pacific sardine (Sardinops sagax) resource research, 1991/1992 phase 111. California Seafood Council, Santa Barbara
Houde ED, Zastrow CE (1993) Ecosystem- and taxon-speclfic dynamic and energetics properties of larval fish assem- blages. Bull mar Sci 53(2):290-335
Houllier F, Lebreton JD, Pontier D (1989) Sampling properties of the asymptotic behavior of age- or stage-grouped popu- lation models. Math Biosci 95161-l??
Hunter JR, Lo NCH, Leong RHH (1985) Batch fecundity in multiple spawning flshes. In: Lasker R (ed) An egg pro- duction method for estimating spawning biomass of pelagic fish: application to the northern anchovy. NOAA Tech Rep NMFS 30, p 67-78
Huppert DD, MacCall AD, Stauffer GD (1980) A review of technical issues in the anchovy management plan. SWFSC Adm~n Rep, La Jolla, CA, LJ-80-12
Jacobson LD, Lo NCH (1992) Spawning b~omass of the north- ern anchovy in 1992. Administrative report U-92-24, Southwest Fisheries Science Center. National Marine Fisheries Service, La Jolla, CA
Koslow JA, Thompson KR, Silvert M' (1987) Recruitment to northwest Atlant~c cod and haddock stocks: influence of stock size and climate. Can J Fish Aquat Sci 44:26-39
Lasker R (1985) An egg production method for estimating spawning biomass of pelagic fish: application to the northern anchovy, Engraulis rnordax. NOAA Tech Rep NMFS 36
Lefkovitch LP (1965) The study of population growth in organisms grouped by stages. Biometncs 21:l-18
This article was submitted to the editor
Lo NCH (1983) Re-estlmatlon of three parameters associated with anchovy egg and larval abundance; temperature dependent incubation time, yolk-sac growth rate and egg and larval retention in mesh nets. NOAA-TM-NMFS- SWFC-31, Southwest Fisheries Center, National Marine Fisheries Service, National Oceanic and Atmospheric Administration, US Department of Commerce, La Jolla, CA, p 1-33
Lo NCH (1986) Modeling life-stage-specific instantaneous mortality rates, an application to northern anchovy, Engraulis mordax, eggs and larvae. Fish Bull US 84: 395-407
MacCall AD (1979) Population estimates for the waning years of the Pacific sardine fishery. CalCOFI Rep 20:72-82
MacCall AD (1980) The consequence of cannibalism in the stock-recruitment relationship of planktivorous pelagic fishes such as Engraulis. In: Sharp G (ed) Workshop on the effects of environmental variation on the survival of larval pelagic fishes. UNESCO, Intergovernmental Oceanographic Commission, Lima, Peru, Workshop Report 28:201-220
Megrey BA (1989) Review and construction of age-structured stock assessment models from theoretical and applied points of view. Am Fish Soc Symp 6:8-48
Methot RD (1989) Synthetic estimates of historical abundance and mortality for northern anchovy. Am Fish Soc Symp 6: 66-82
Pepin P (1989) Using growth histories to estimate larval fish mor- tality rates. Rapp P-v Reun Cons int Explor Mer 191:324-329
Pepin P (1990) Biological correlates of recruitment variab~lity in North Sea fish stocks. J Cons int Explor Mer 4?:89-98
Pepin P (1991) Effect of temperature and size on development, mortality, and survival rates of the pelagic life history stages of marine fish Can J Fish Aquat Sci 48:503-518
Rice JA, Miller TJ. Rose KA, Crowder LB, Marschall EA, Trebitz AS, DeAngelis DL (1993) Growth rate variation and larval survival: inferences from an individual-based slze-dependent predation model. Can J Fish Aquat Sci 50.133-142
Smith PE (1985) Year-class strength and survival of 0-group clupeoids. Can J F ~ s h Aquat Sci 42(Suppl 1):69-82
Smith PE. Lo NCH, Butler JL (1992) Variation of life stage du- ration and survival parameters as related to interdecadal population variability in Pacific sardine. CalCOFI Rep 33: 41-49
Zweifel JR, Lasker R (1976) Prehatch and posthatch growth of flshes - a general model. Fish Bull US 74(3):609-621
Manuscript first received: July 26, 1994 Revised version accepted: May 3, 1995