characterization of the anchovy (engraulis encrasicholus ... doccuments/2004/q/q0604.pdf ·...
TRANSCRIPT
ICES CM 2004/Q:06
Characterization of the anchovy (Engraulis encrasicholus) and sardine (Sardinia pilchardus) spawning habitats in the Bay of Biscay from the routine application of the annual DEPM surveys in the Southeast Bay of Biscay. Y. Sagarminaga1, X Irigoien1, A. Uriarte1, M. Santos1, L. Ibaibarriaga1, P.Alvarez1, V. Valencia1
The purpose of this paper is to analyse the spatial distribution of anchovy (Engraulis encrasicholus) and sardine (Sardinia pilchardus) spring spawning and its relationship with the environmental parameters and processes affecting the Bay of Biscay in that period.
To do this, egg abundances and environmental data acquired during the Bay of Biscay DEPM survey series, held in May from 1999 to 2002, have been used. The main spawning grounds for each species were identified and the coincidences and dissimilarities in their spatial distribution were analysed, revealing a spatial segregation of the main spawning grounds and a coexistence in secondary spawning grounds. Regarding the relationship of the spawning distribution with the environmental parameters analysed (sea surface temperature, sea surface salinity, and surface chlorophyll-a concentration), it was observed that sardine may be more strongly influenciated by sea surface temperature than anchovy because it is in an edge of its spawning period and this could have a limitating effect. Nevertheless anchovy, which is at the peak spawning period, benefits from the optimal temperature conditions and its distribution may be more strongly affected by the distribution of the main primary production areas. Anyway, the temperature has an important role in defining the kick off of the anchovy spawning period which starts when the steep increase of sea surface temperatures begins during spring in the area of study. Keywords: Spawning, Bay of Biscay, small pelagics, Anchovy, Sardine, spatial distribution, environment. 1 AZTI, Food and Fish Technological Institute, Marine Research Unit. Herrera Kaia Portualdea z/g. 20110 PASAIA(Gipuzkoa) Basque Country. Spain. (Ph: + 34 943 00 48 00, fax: + 34 943 00 48 01)[email protected]. http://www.azti.es
INTRODUCTION Anchovy (Engraulis encrasicholus) and sardine (Sardinia pilchardus), are two small cupleoid species found in the bay of Biscay waters. Apart from the socio-economic interest of these fisheries, these species have an important ecological role in the bay of Biscay. Both species are multiple spawners but during spring, whereas anchovy is at its spawning peak period, sardine is at the end of its spawning period in the bay of Biscay whose peak is found in February-March (Lucio & Uriarte, 1990; Figueiredo et al 1989). The bay of Biscay, located in the NW Atlantic ocean, (cf. Figure 1) presents a mid-latitude temperate hydroclimatic regime with a main primary production peak in spring and some secondary vernal blooms (Valencia et al, 1989). During the studied period (around May), the most relevant physical processes are the increase of sea surface temperature and the stabilization of vertical fluxes, as a consequence of the decrease of the wind speed and the increase of solar irradiance (cf Figure 2). Consequently, a stratification process of the water column begins that will reach its maximum in late summer. Moreover, there are several rivers (Gironde, Loire, Adour and Cantabrian rivers) that fertilize large areas of the Armorican, Aquitanian shelves and to a less extent the Cantabrian shelf. All these processes give raise to the phytoplankton growth (mostly on the shelf) and other ecological processes such as spawning of several species. The spatial distribution of the average values of sea surface temperature and surface chlorophyll-a concentration that reflect the environmental framework of the area during May are shown in figure 3. Through this paper we will try to address the following questions:
Where are the main spawning grounds of anchovy and sardine in the bay of Biscay in spring?
Do these two species overlap in space?
How are the spawning grounds related to environmental factors such as
temperature, salinity and phytoplankton biomass? DATA The data used for the purpose of this study are the egg abundances and environmental data acquired during the bay of Biscay DEPM (Daily Egg Production Method) survey series, held in May from 1999 to 2002. These DEPM surveys (Santos et al, 2003) are focussed on anchovy spawning and are carried out during the peak spawning period of this species in the area. However it is important to bear in mind that these dates do not coincide with the spawning peak period for sardine which is known to occur earlier in the months of February and March. The strategy of egg sampling during the DEPM surveys, consists on a systematic central sampling scheme where 3 mile apart stations were located along 15-mile-apart transects perpendicular to the coast. The transects end up further the shelf edge where various
null anchovy egg stations are found and thus the limit of the spawning area is assumed to have been found. In figure 4 are shown the sampled stations from 1999-2002, As a consequence of the adaptative sampling strategy in the edges of the transects, the sampling effort performed on the individual stations varies in the area of study. Sampling effort performed in each station is also represented in figure 4. Egg sampling is performed by vertical plankton hauls made in each station, using a PAIROVET net (Smith et al., 1985) of 150 microns. The net was lowered to a maximum depth of 100 m or 5 m above the bottom in shallower stations. After allowing 30 seconds on the surface and 10 seconds at the maximum depth for stabilisation, the net was retrieved to the surface at a speed of 1 m/s. Environmental data concerned in this study are sea surface temperature (SST), sea surface salinity (SSS), and surface chlorophyll-a concentration (CHLA). Sea surface temperatures (SST) were measured at each station with mercuric thermometers, and sea surface salinities from part of the stations (approx 1/3 of the whole number of stations) were measured at lab by conductivity from samples gathered on board. CHLA were retrieved SEAWIFS-CHLA satellite images. The methodology used to estimate the values of chl-a from SEAWIFS raw data include the radiometric calibration (Barnes et al, 1994), the atmospheric correction (Gordon and Wang, 1994) and the SIMBIOS OC4 bio-optical algorithm (O’Reilly et al, 2000). RESULTS i. Where are the main spawning grounds of anchovy and sardine in the Bay of Biscay in
spring? In this study we searched for spatial distribution of spawning grounds regardless of the yearly stock biomass. Thus, prior to any data analysis a data standardizing task was done and a relative egg abundance parameter (RA) was calculated as follows:
∑=i
yi
yiyi N
NRA,
,,
where N= Number of eggs, i = station, and y = year. The spatial distribution of relative egg abundances (RA) was mapped for all years and the mean surface was calculated to identify the most common spawning areas for both species. (cf. Figure 5) The maps obtained, show that for anchovy, two main spawning grounds are found in the proximity of Gironde and Adour rivers over the French shelf (areas 1 & 2 in Figure 5). There is also a noticeable ground in the mid-outer Armorican shelf (area 3 in Figure 5). For sardine, in the southern Bay of Biscay, two main spawning grounds are found over the Cantabrian shelf and close to the Adour outfall (areas 4 & 5 in Figure 5).
On the northern part of the Bay, one linear shaped area is found just over the shelf edge and another one over the mid-inner Armorican shelf between the Gironde and Loire rivers estuaries. (areas 6 & 7 in Figure 5).
These observations (true for the period between 1999-2002) well outline the general main spawning areas (Motos et al, 1996). However, as revealed in previous DEPM surveys, other areas showed occasionally important spawning activity. That is the case for the southern offshore grounds over the cantabrian sea, where from 1999 to 2002 no significant spawning has been detected.
ii. Do these two species overlap in space? To address this question, both, presence/absence and abundance data were used. Firstly, we calculated the percentage of the RA of anchovy for each station through all years:
sardineyianchovyyi
yiyi RARA
RARA.,.,
,,% +=
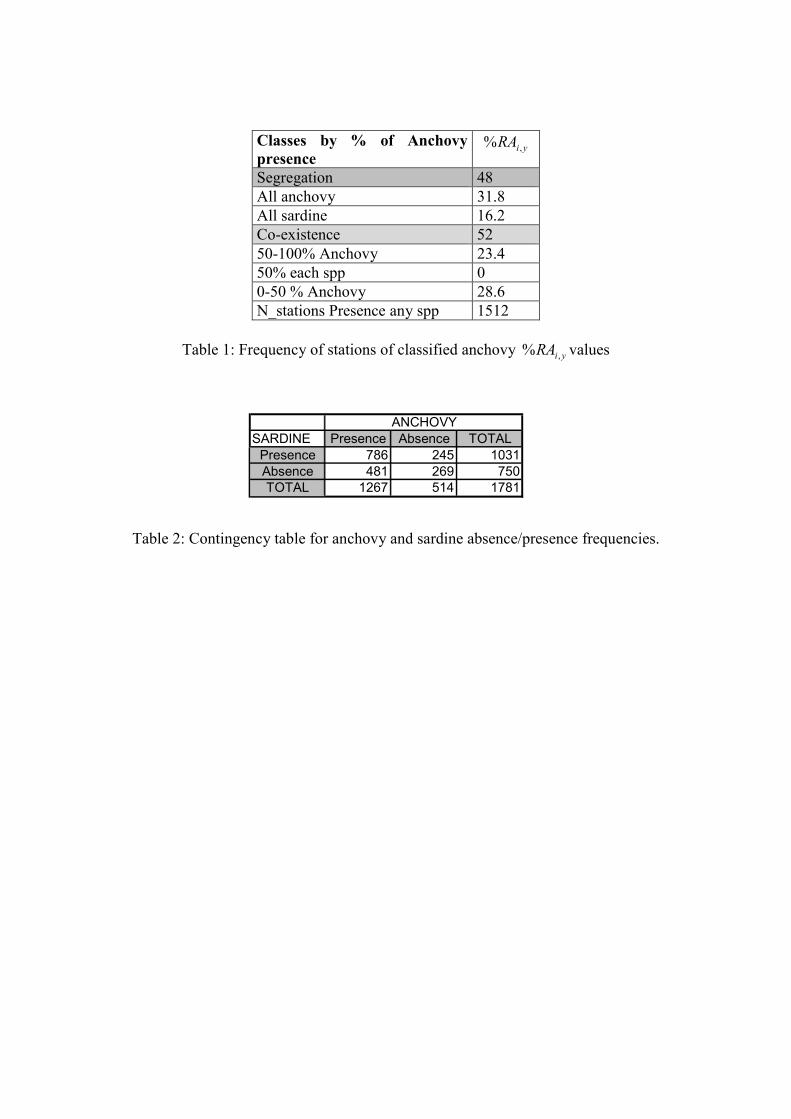
Survey stations were classified according to the yiRA ,% values obtained. Table 1 shows the frequency of stations found in each of the classes. The results obtained show that there are nearly as many stations in which both species segregate (48%). as stations in which they coexist (52%). When both species are present there is generally a dominance of one of them. Then, we used a presence/absence contingency table (table 2) to calculate Jaccard’s similarity coefficient.
Si =A ∩∩∩∩ B/A ∪∪∪∪ B Si value (0.51) is in the middle of the possible range (0-1) were 0 means no association and 1 complete association. So in our case we could say that there is a weak association between those species but no further conclusions may be yielded from this value. However, when mapping the %RA values we find that the level of association is distributed differently over space (cf Figure 6) and that both species tend to occupy separated areas: Complete segregation is found in the North, where sardine grounds are found close to coast, next to the Loire river (C) and over the far shelf (A). anchovy ground is left in the middle of these sardine grounds. anchovy also spawns alone off the french shelf break (D). Partial segregated areas with anchovy dominance are found next to the Gironde estuary (I) and near the shelf break over the Armorican shelf (D). Sardine, dominates the eastern Cantabrian Sea (e) and the area close to coast over the Aquitanian shelf where the Adour outfalls (g).
Thus, in general, the highest segregation values (either for anchovy or sardine) are located over the main spawning grounds of each species. However, this segregation is not observed in the areas of low relative abundances values, in which both species spawning coexist. An exception to this is the Aquitanian shelf (area 8 in Figure 5) where both species spawn jointly with relatively high abundances
iii. How are the spawning grounds related to environmental factors such as temperature, salinity and phytoplankton biomass?
To address this question quotient line graphs were created to illustrate the distribution of eggs through the value ranges for SST, SSS and chlorophyll-a concentration. The results are shown in figure 7. The distribution of the sum of the relative abundances through sea surface temperatures, shows a mode at around 15ºC for sardine. For anchovy, there is not a clear mode but the relative abundances are distributed more preferably above 15º. The big values of RA at high SST(above 19 ºC) both for sardine and anchovy represent a very localised area over the Adour plume which is an important spawning ground for both species and where high SST are recorded in May (cf Figure 3). For sea surface salinity (SSS) the distribution of spawned eggs of sardine shows an important peak in very desalted waters (30.5-31psu). Then, in more saline waters the shape is quite regular with some decrease in waters of around 33-33.5 psu. Anchovy also shows a peak at very desalted waters but at a less extent that that of sardine. This region may well correspond to the Adour outfall. Anchovy eggs abundances drop at values above 35 psu whereas sardine goes a little further in the rasnge of salinity values. The relationship between sardine relative egg abundances and the surface chlorophyll-a concentration, shows a primary peak at low values of chlorophyll-a concentration (1mg/m3) and a secondary peak at very high values at the mouth of the rivers. Anchovy shows its main peak at values around 4,5 mg/m3 and a secondary one at 1.5-2 mg/m3. Thus, sardine occupies the more extreme values of the chl-a range whereas anchovy tend to occupy the middle values which as a matter of fact, represent quite high values corresponding to phytoplankton bloom conditions. The general interpretation of these graphs tells that sardine spawning occurs in areas of lower sea surface temperature values with ongoing primary production. In the bay of Biscay, these situation is found in deep offshore areas in which late vernal blooms take place, and in cooler coastal areas like the Cantabrian sea or the Loire river outfall. Anchovy spawns in areas of higher sea surface temperature with high primary production. These zones mostly correspond to the areas over the Aquitanian and Armorican shelves influenced by the Gironde and Adour river plumes. Both species behave similarly with respect to the salinity.
CONCLUSION During May, in the bay of Biscay, anchovy and sardine seem to occupy different areas with slightly different environmental characteristics: Sardine may be more strongly influenciated by sea surface temperature than anchovy because it is in an edge of its spawning period and this could have a limitating effect. Nevertheless anchovy, which is at the peak spawning period, benefits from the optimal temperature conditions and its distribution may be more strongly affected by the distribution of the main primary production areas. Apart from these factors, the population stock biomass and the population age structure have an influence on the distribution of spawners in the area. In this sense, some studies dealing with adults distribution have indicated that older sardines exploit more offshore areas whereas younger ones spawn in coastal areas. In the same way older anchovies seem to start spawning earlier in lower temperatures in offshore areas and younger ones spawn later in the season in warmer waters close to the coast (Petitgas et al, 2003, Uriarte el al,1996). Some on-going works are under process in order to better decipher the relationship between adult population, egg distribution and environmental factors.
Acknowledgements This work was supported by funds of the European Commission and the Department of Agriculture and Fisheries of the Basque Government.
REFERENCES Barnes.AW.m Holmes W.L, Barnes W.E Essaias anc C.R. Mc Clain 1994, "SEAWIFS prelaunch Radiometric Calibration and Spectral Characterization". NASA Tech Memo. 107566 Vol 23, 55pp. Figueiredo, I.M., Santos,A.M.P.,1989. Reproductive biology of Sardina pilchardus (Walb.): seasonal maturity evolution (1986 to 1988).ICES CM 1989/H:40,4pp. Gordon, H.R., Wang,M., 1994. "Retrieval of water leaving radiance and aerosol optical thickness over the oceans with SEAWIFS: a preliminary algorithm". In Applied optics, Vol33, No 3,pp 443,452. Lucio P., A. Uriarte,, 1990: Aspects of the reproductive biology of the anchovy (Engraulis encrasicholus L. 1758) during 1987 and 1988 in the Bay of Biscay. ICES Doc.C.M.1990/H:27. Motos L., A. Uriarte & V. Valencia (1996) The spawning environment of the Bay of Biscay anchovy (Engraulis encrasicolus L.). Sci Mar 60 (Suppl 2): 117-140. O'Reilly, J.E. and co-authors, 2000: "Ocean color chlorophyll a algorithms for SeaWiFS, OC2, and OC4: Version 4." In: J.E. O'Reilly and co-authors, SeaWiFS Postlaunch Calibration and Validation Analyses, Part 3. NASA Tech. Memo. 2000-206892, Vol. 11, S.B. Hooker and E.R. Firestone, Eds., NASA Goddard Space Flight Center, Greenbelt, Maryland, 9-23 Petitgas P., J. Massé, P. Grellier, & P. Beillois 2003: Variation in the spatial distribution of fish length: a multi-annual geostatistics approach on anchovy in Biscay. 1985–2002. ICES CM 2003/Q:15 Santos, M., A. Uriarte and L. Ibaibarriaga, 2003: Estimates of the Spawning Stock Biomass of the Bay of Biscay anchovy (Engraulis encrasicolus, L. ) in 2002. Working Document to the ICES Working Group on the assessment of Mackerel, Horse Mackerel, Sardine and Anchovy. Copenhagen, 9-19 September 2003. Smith, P.E., Flerx W., Hewitt R.H.,"The CALCOFI Vertical egg tow(CALVET) Net.In R.Lasker ed,: An egg production method for estimating spawning biomass of pelagic fish: an application to E. mordax. pp27-32.NOAA tech rep.NMFS 36. Uriarte A., P. Prouzet & B. Villamor, 1996. Bay of Biscay and Ibero Atlantic anchovy populations and their fisheries. Sci Mar 60(Suppl 2): 237-255 Valencia, V., Motos, L., Urrutia, J.,1989. Estudio de la variación temporal de la hidrografía y el plancton de la zona nerítica frente a San Sebastián. Informes Técnicos de Departamento de Agricultura y Pesca del Gobierno Vasco 20,81 pp.
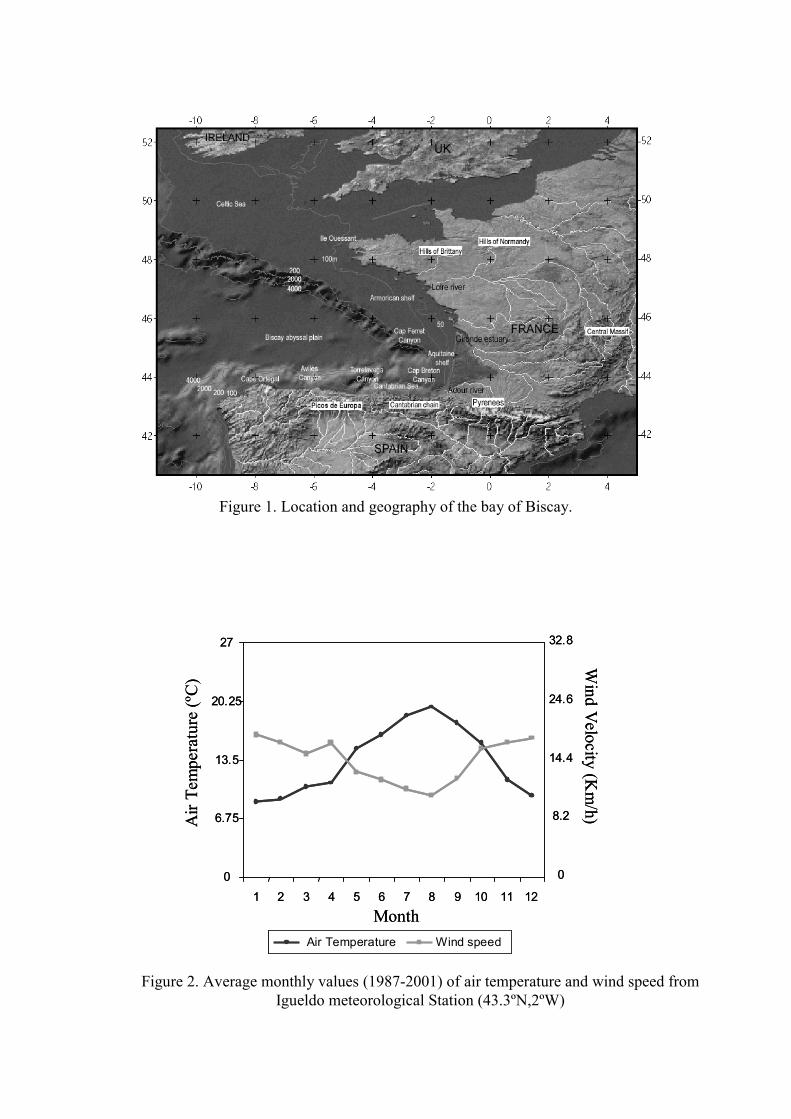
Figure 1. Location and geography of the bay of Biscay.
Figure 2. Average monthly values (1987-2001) of air temperature and wind speed from Igueldo meteorological Station (43.3ºN,2ºW)
0
6.75
13.5
20.25
27
1 2 3 4 5 6 7 8 9 10 11 12
Air Temperature Wind speed
0
8.2
14.4
24.6
32.8
Air
Tem
pera
ture
(ºC
)W
ind Velocity (K
m/h)
Month
0
6.75
13.5
20.25
27
1 2 3 4 5 6 7 8 9 10 11 12
Air Temperature Wind speedAir Temperature Wind speed
0
8.2
14.4
24.6
32.8
Air
Tem
pera
ture
(ºC
)W
ind Velocity (K
m/h)
Month
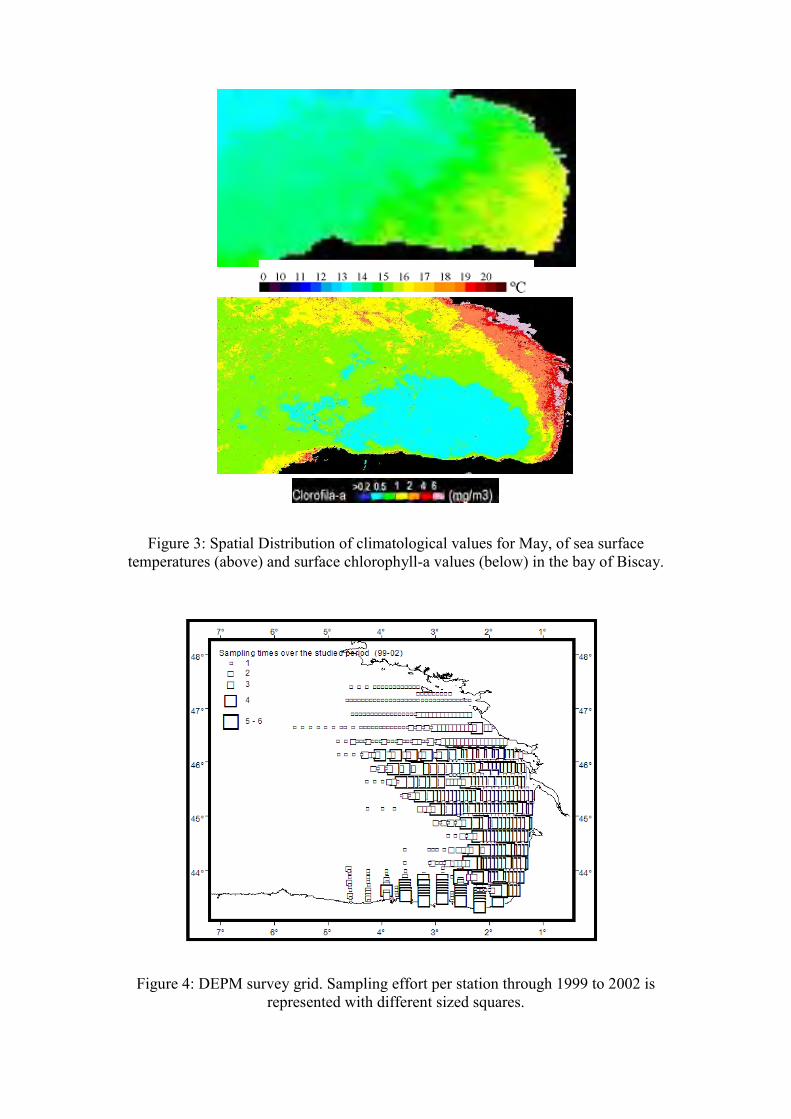
Figure 3: Spatial Distribution of climatological values for May, of sea surface
temperatures (above) and surface chlorophyll-a values (below) in the bay of Biscay.
Figure 4: DEPM survey grid. Sampling effort per station through 1999 to 2002 is represented with different sized squares.
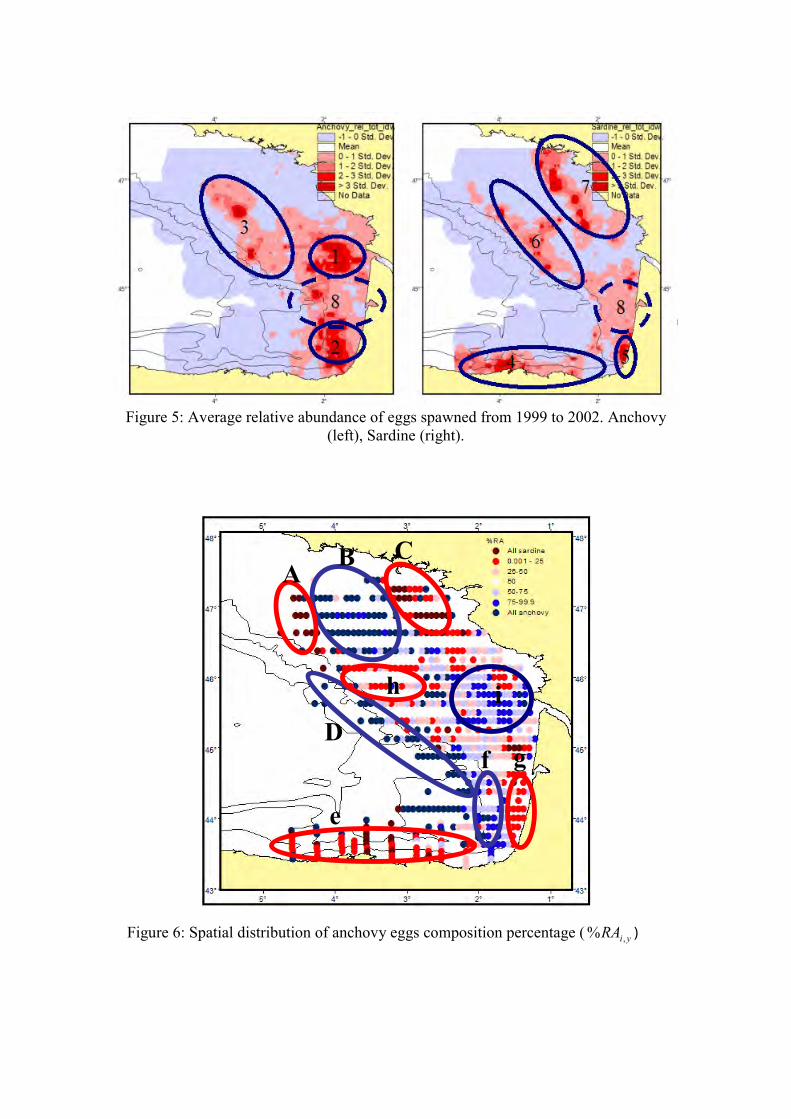
Figure 5: Average relative abundance of eggs spawned from 1999 to 2002. Anchovy
(left), Sardine (right).
Figure 6: Spatial distribution of anchovy eggs composition percentage ( yiRA ,% )
A B C
D
e
f g
h i
A B C
D
e
f g
h i
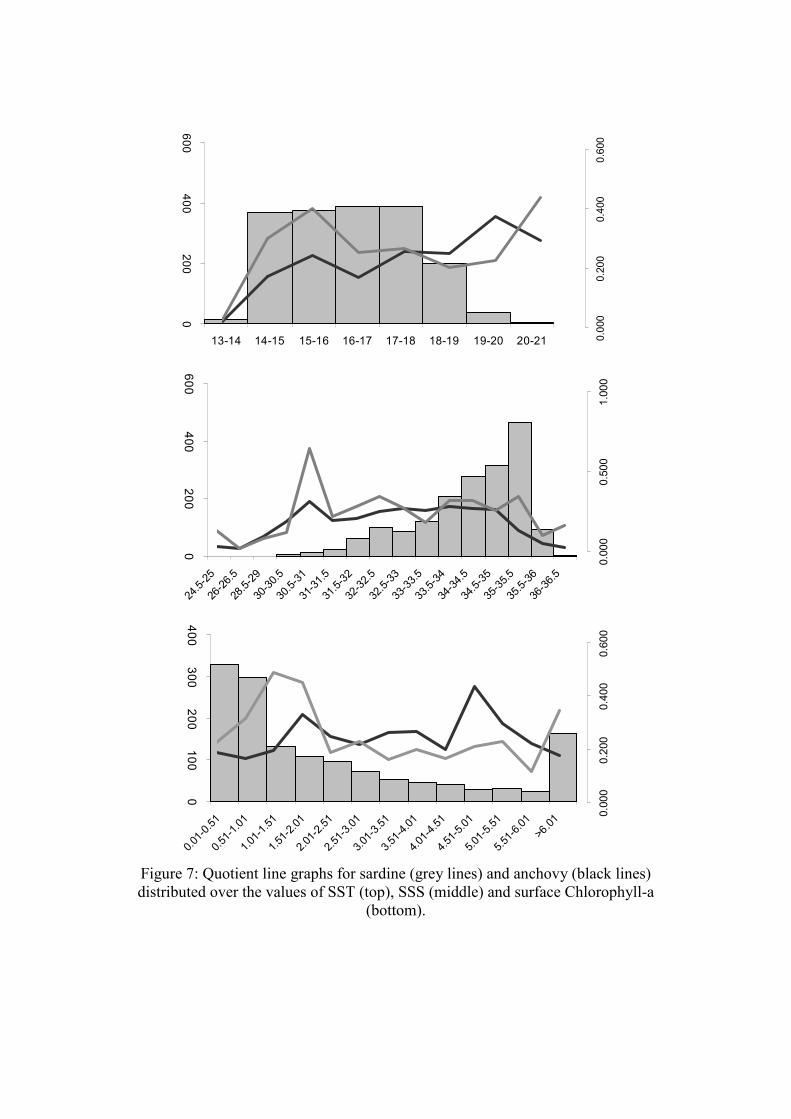
Figure 7: Quotient line graphs for sardine (grey lines) and anchovy (black lines) distributed over the values of SST (top), SSS (middle) and surface Chlorophyll-a
(bottom).
0100
200300
400
0.01-0
.51
0.51-1
.01
1.01-1
.51
1.51-2
.01
2.01-2
.51
2.51-3
.01
3.01-3
.51
3.51-4
.01
4.01-4
.51
4.51-5
.01
5.01-5
.51
5.51-6
.01>6
.01
0.00
00.
200
0.40
00.
600
0200
400600
13-14 14-15 15-16 16-17 17-18 18-19 19-20 20-21 0.00
00.
200
0.40
00.
600
0200
400600
24.5-
25
26-26
.5
28.5-
29
30-30
.5
30.5-
31
31-31
.5
31.5-
32
32-32
.5
32.5-
33
33-33
.5
33.5-
34
34-34
.5
34.5-
35
35-35
.5
35.5-
36
36-36
.5
0.00
00.
500
1.00
0
Classes by % of Anchovy presence
yiRA ,%
Segregation 48 All anchovy 31.8 All sardine 16.2 Co-existence 52 50-100% Anchovy 23.4 50% each spp 0 0-50 % Anchovy 28.6 N_stations Presence any spp 1512
Table 1: Frequency of stations of classified anchovy yiRA ,% values
Table 2: Contingency table for anchovy and sardine absence/presence frequencies.
ANCHOVYSARDINE Presence Absence TOTAL
Presence 786 245 1031Absence 481 269 750TOTAL 1267 514 1781