modelling the biophysical dynamics of sardine and anchovy
TRANSCRIPT
A biophysical model to study the dynamics of sardine and anchovy ichthyoplankton in the
Canary Upwelling System
II. Continent-archipelago interactionsTimothée Brochier, Eurocean PhD student, IRD
Azeddine Ramzi INRH, MoroccoChristophe Lett IRD, FranceEric Machu IRD - INRH, MoroccoSantiago Hernández-León ULPGC, SpainPierre Fréon IRD, France
Modelling the biophysical dynamics of sardine and
anchovy ichthyoplankton in the Canary Upwelling
System: continent-archipelago interactions
Summary
1. Issues:a. Filament-eddy systemb. Spawning patterns (anchovy and sardine)c. Larval presence in Canary area
II. Method:a. Hypotheses to testb. Modelling toolsc. Simulation design
III.Results and discussion
Filament-eddy system
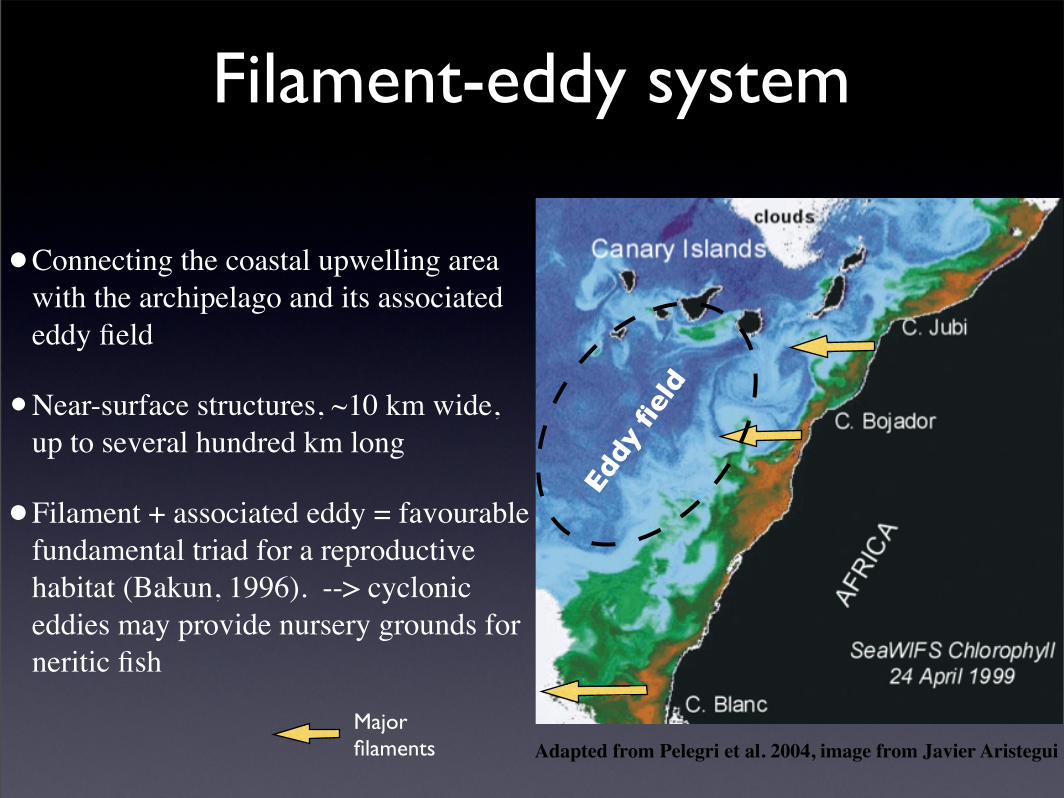
•Connecting the coastal upwelling area with the archipelago and its associated eddy field
•Near-surface structures, ~10 km wide, up to several hundred km long
•Filament + associated eddy = favourable fundamental triad for a reproductive habitat (Bakun, 1996). --> cyclonic eddies may provide nursery grounds for neritic fish
Major filaments Adapted from Pelegri et al. 2004, image from Javier Aristegui
Eddy
fiel
d
Spawning patterns(Sardine and anchovy)
Sard
ine
Anchovy
Sardin
eAnchovy
Winter
6
5
4
3
2
1
6
5
4
3
2
1
0 225 450 675 900
Anchovy Sardine
Coa
stal
Are
aC
oast
al A
rea
Summer(eggs.m-3)
Winter(eggs.m-3)
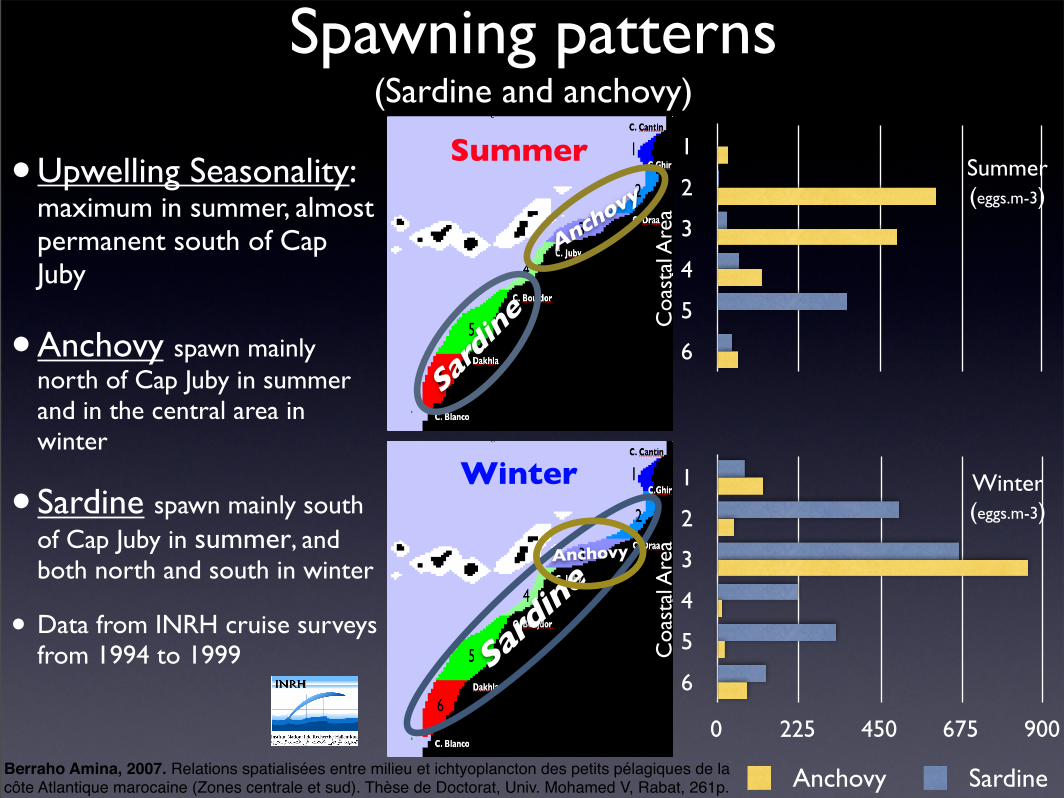
•Upwelling Seasonality: maximum in summer, almost permanent south of Cap Juby
•Anchovy spawn mainly north of Cap Juby in summer and in the central area in winter
• Sardine spawn mainly south of Cap Juby in summer, and both north and south in winter
• Data from INRH cruise surveys from 1994 to 1999
Berraho Amina, 2007. Relations spatialisées entre milieu et ichtyoplancton des petits pélagiques de la côte Atlantique marocaine (Zones centrale et sud). Thèse de Doctorat, Univ. Mohamed V, Rabat, 261p.
Summer
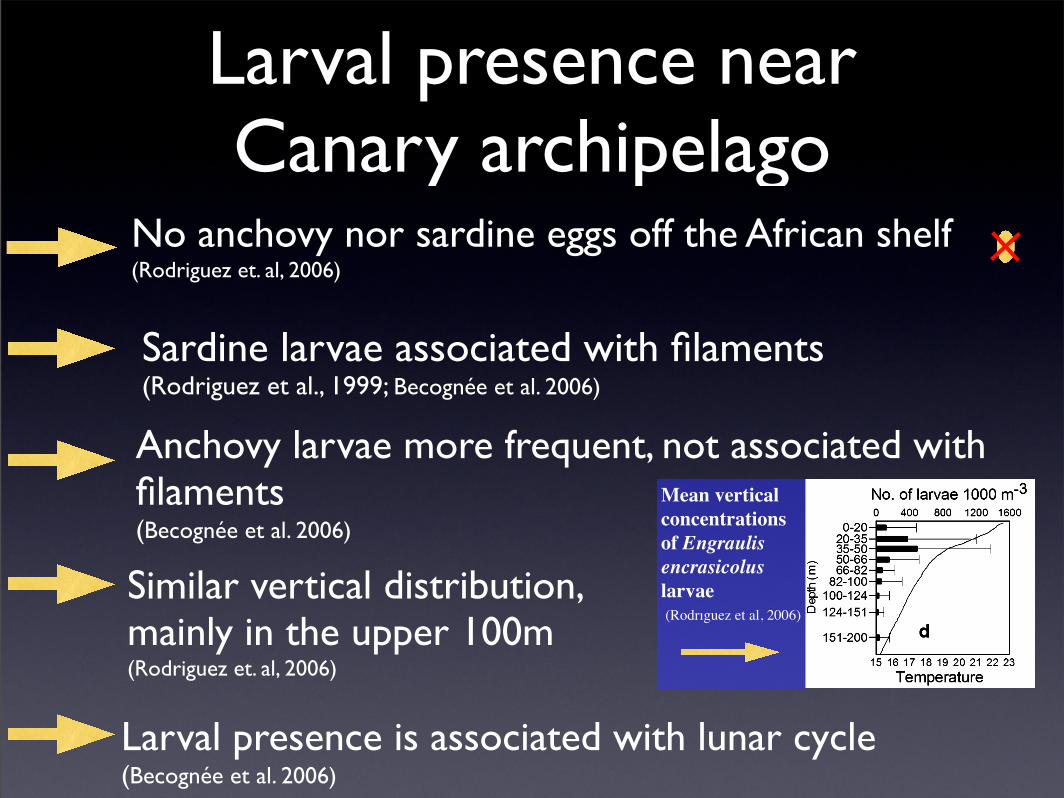
Larval presence near Canary archipelago
Anchovy larvae more frequent, not associated with filaments(Becognée et al. 2006)
Sardine larvae associated with filaments(Rodriguez et al., 1999; Becognée et al. 2006)
No anchovy nor sardine eggs off the African shelf(Rodriguez et. al, 2006)
Larval presence is associated with lunar cycle(Becognée et al. 2006)
Similar vertical distribution, mainly in the upper 100m(Rodriguez et. al, 2006)
Fig. 5 Mean vertical concentrations of a mesozooplankton, b totalfish larvae, c larval taxonomic diversity, d Engraulis encrasicoluslarvae, e E. encrasiclous eggs, f Sardina pilchardus larvae, g Anthiasanthias larvae, h Cyclothone braueri larvae, i Ceratoscopelusmaderensis larvae, j Notolichnus valdiviae larvae, k Diogenichthys
atlanticus larvae and l Myctophum punctatum larvae (horizontallines indicate positive values of standard error). The mean verticalprofile of temperatures recorded at the ichthyoplankton stations isoverlapped to the vertical distributions of mesozooplankton andfish larvae
891
Mean vertical concentrations of Engraulis encrasicolus larvae (Rodrıguez et al, 2006)
Hypotheses to test1. Ichthyoplankton transport to Canary islands is
associated with filaments of upwelled waters
2. Ichthyoplankton transport to Canary island coasts is more frequent from anchovy spawning areas than sardine spawning areas
3. Vertical migration of larvae impact their transport in filaments
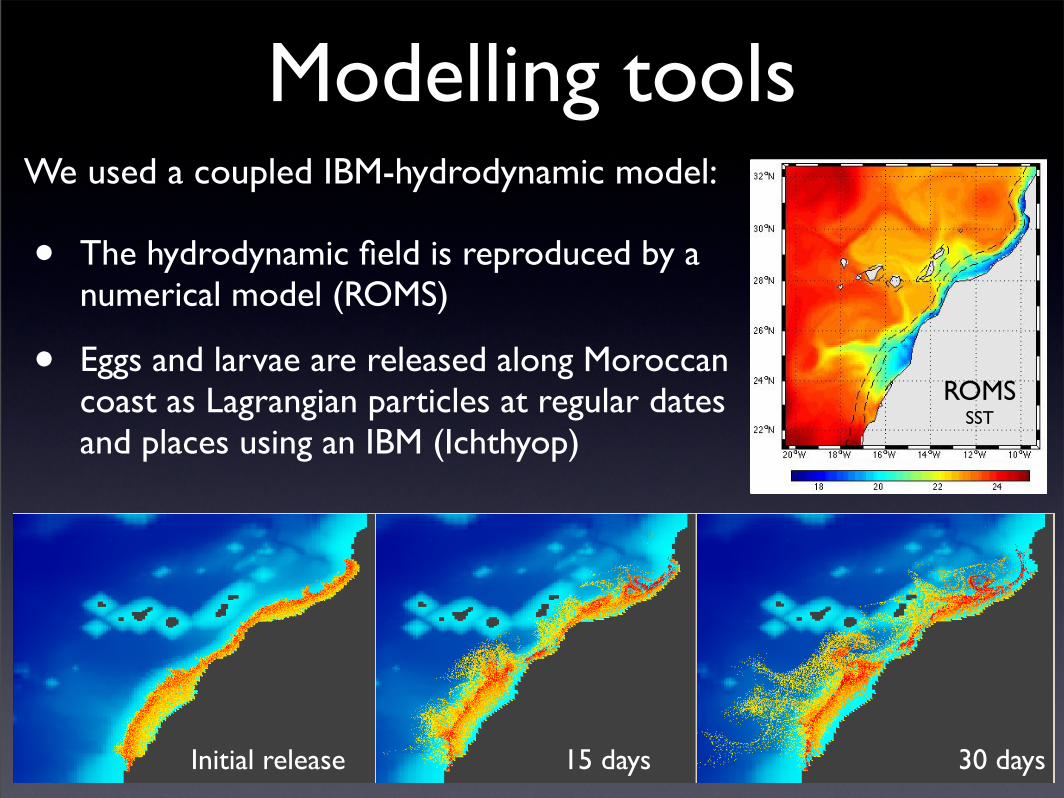
Modelling tools
• The hydrodynamic field is reproduced by a numerical model (ROMS)
• Eggs and larvae are released along Moroccan coast as Lagrangian particles at regular dates and places using an IBM (Ichthyop)
We used a coupled IBM-hydrodynamic model:
30 daysInitial release 15 days
ROMSSST
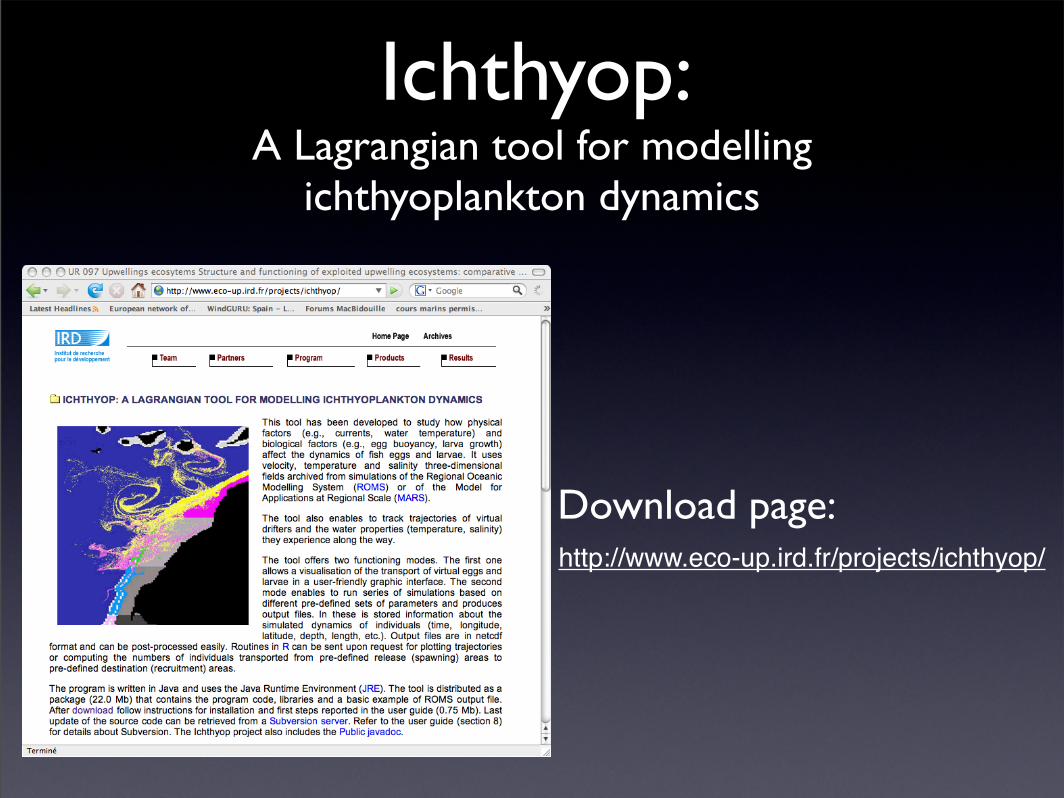
http://www.eco-up.ird.fr/projects/ichthyop/
Ichthyop: A Lagrangian tool for modelling
ichthyoplankton dynamics
Download page:
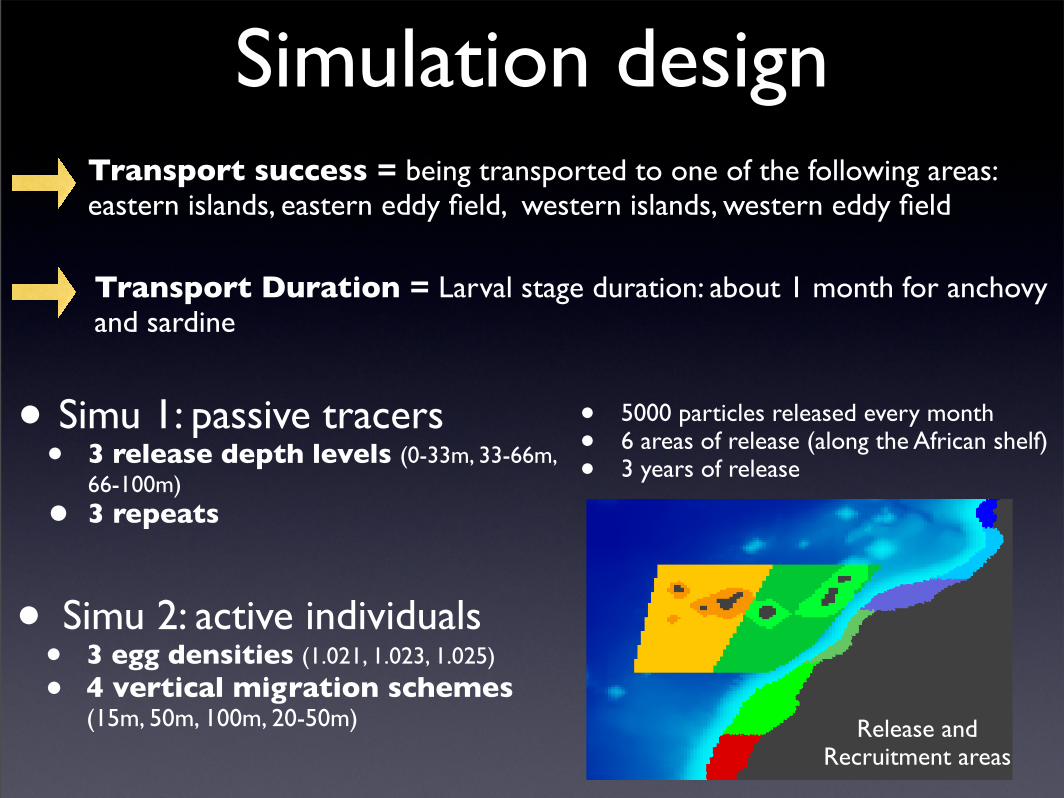
Simulation design
• Simu 1: passive tracers• 3 release depth levels (0-33m, 33-66m,
66-100m)
• 3 repeats
• Simu 2: active individuals• 3 egg densities (1.021, 1.023, 1.025)
• 4 vertical migration schemes (15m, 50m, 100m, 20-50m)
Transport Duration = Larval stage duration: about 1 month for anchovy and sardine
Transport success = being transported to one of the following areas: eastern islands, eastern eddy field, western islands, western eddy field
• 5000 particles released every month• 6 areas of release (along the African shelf)• 3 years of release
Release and Recruitment areas
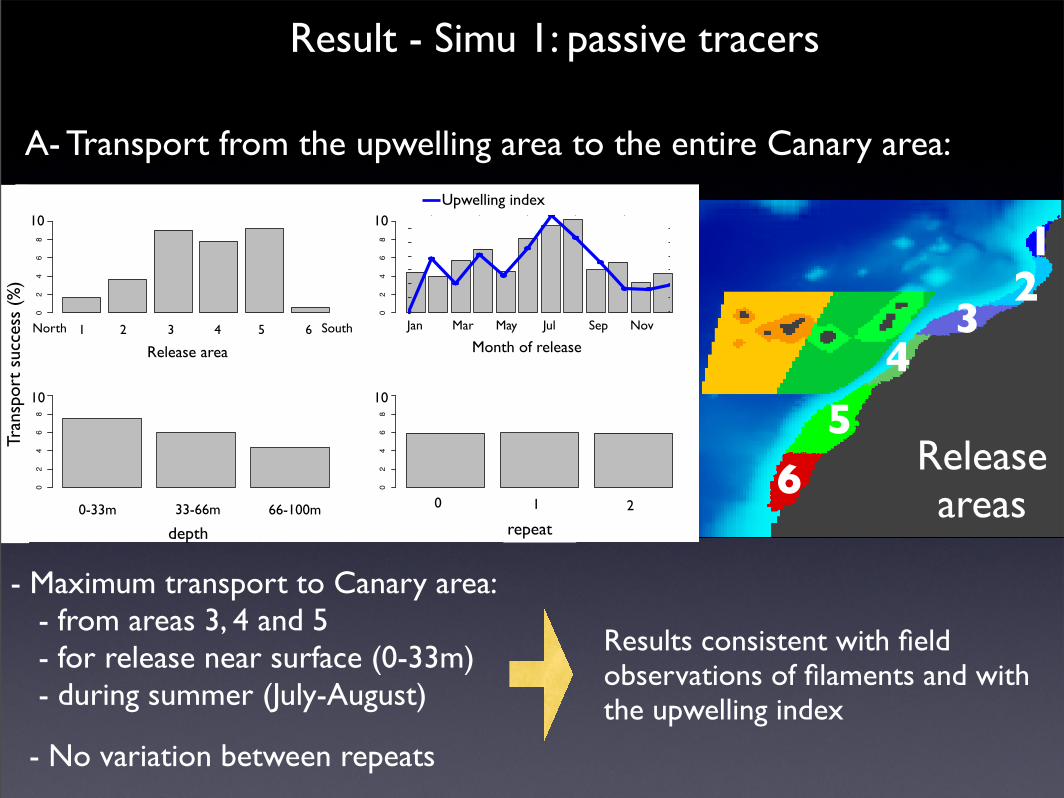
Result - Simu 1: passive tracers
- Maximum transport to Canary area:- from areas 3, 4 and 5- for release near surface (0-33m)- during summer (July-August)
- No variation between repeats
Results consistent with field observations of filaments and with the upwelling index
A- Transport from the upwelling area to the entire Canary area:
1_nord 2 3 4 5 6_sud
Release area
Tran
spor
t suc
cess
(%)
02
46
810
Jan Feb Mar Apr May Jun Jul Aug Sep Oct Nov Dec
Release month
Tran
spor
t suc
cess
(%)
02
46
810
97 98 99
Release year
Tran
spor
t suc
cess
(%)
02
46
810
−0.0 to −66.0 −33.0 to −66.0 −66.0 to −66.0
Release depth (m)
Tran
spor
t suc
cess
(%)
02
46
810
0 1 2
Replicate
Tran
spor
t suc
cess
(%)
02
46
810
05
1015
20
Release month
Tran
spor
t suc
cess
(%)
01 02 03 04 05 06 07 08 09 10 11 12
dataset$ReleaseArea123456
02
46
810
Release depth (m)
Tran
spor
t suc
cess
(%)
−0.0 to −66.0 −33.0 to −66.0 −66.0 to −66.0
dataset$ReleaseArea123456
24
68
10
Release month
Tran
spor
t suc
cess
(%)
01 02 03 04 05 06 07 08 09 10 11 12
dataset$Year979899
Release area
1 2 3 4 5 6North South
Month of releaseJan Mar May Jul Sep Nov
depth0-33m 33-66m 66-100m 0 21
repeat
Tran
spor
t su
cces
s (%
)
12
34
56 Release
areas
10 10
1010
40
60
80
100
120
140
160
180
2 4 6 8 10 12
Upwelling index
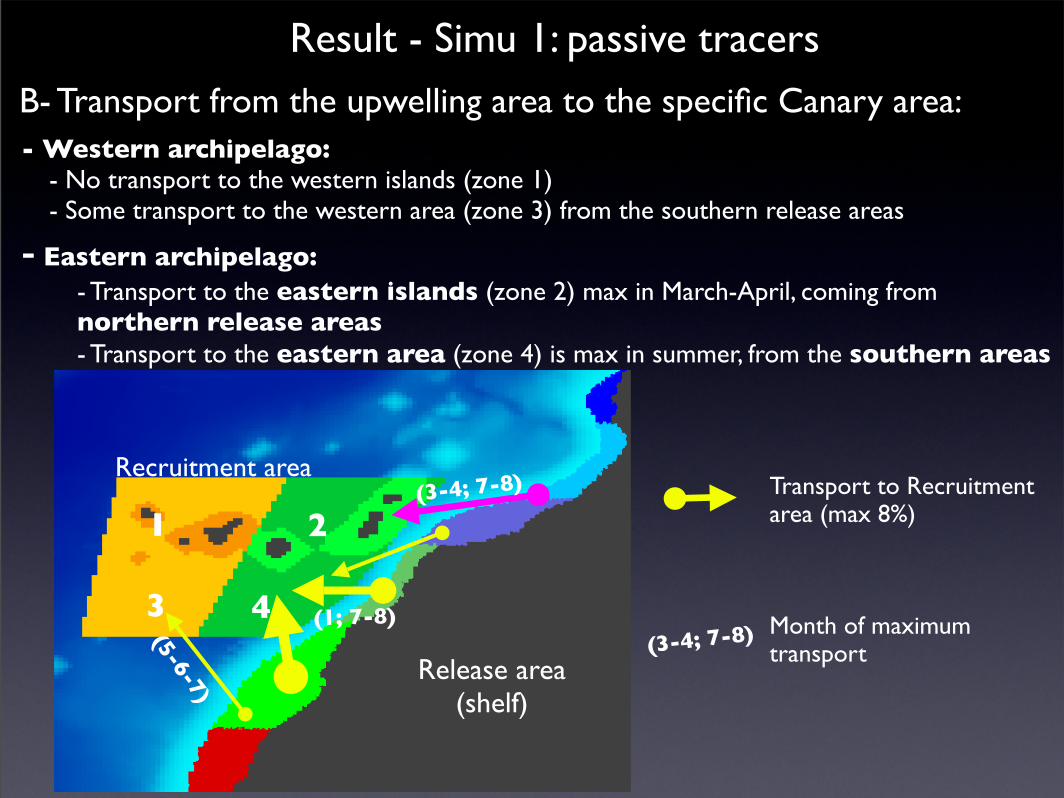
Result - Simu 1: passive tracers
- Western archipelago: - No transport to the western islands (zone 1)- Some transport to the western area (zone 3) from the southern release areas
- Eastern archipelago: - Transport to the eastern islands (zone 2) max in March-April, coming from northern release areas - Transport to the eastern area (zone 4) is max in summer, from the southern areas
B- Transport from the upwelling area to the specific Canary area:
Transport to Recruitment area (max 8%)
Month of maximum transport(3-4; 7-8)
I 2
3 4
(5-6-7)
(3-4; 7-8)
(1; 7-8)
Recruitment area
Release area(shelf)
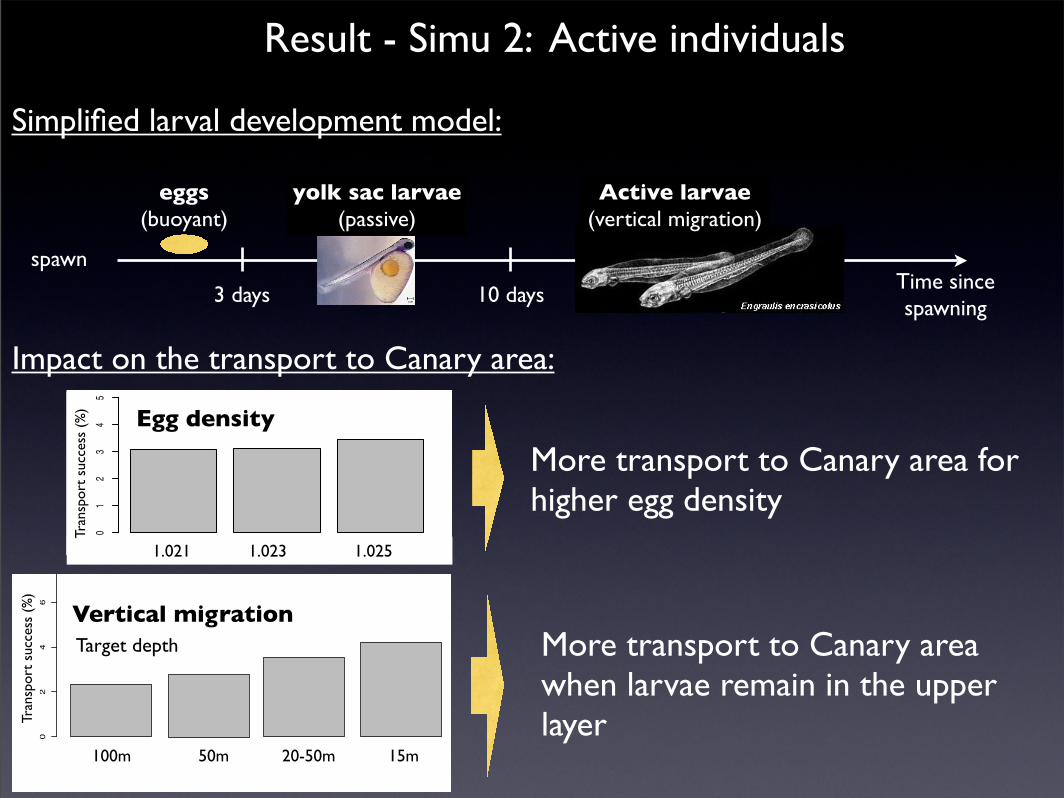
Result - Simu 2: Active individuals
More transport to Canary area when larvae remain in the upper layer
More transport to Canary area for higher egg density
Time since spawning
spawn
3 days 10 days
eggs(buoyant)
yolk sac larvae (passive)
Active larvae(vertical migration)
Impact on the transport to Canary area:1_nord 2 3 4 5 6_sud
Release area
Tran
spor
t suc
cess
(%)
01
23
45
Jan Mar May Jul Sep Nov
Release month
Tran
spor
t suc
cess
(%)
01
23
45
97 98 99
Release year
Tran
spor
t suc
cess
(%)
01
23
45
1.021 1.023 1.025
Egg dentity
Tran
spor
t suc
cess
(%)
01
23
45
1 2 3 4
Target depth (m)
Tran
spor
t suc
cess
(%)
01
23
45
1.5
2.0
2.5
3.0
3.5
4.0
target_depth
Tran
spor
t suc
cess
(%)
1 2 3 4
dataset$Year
97
98
99
02
46
Release depth (m)
Tran
spor
t suc
cess
(%)
1 2 3 4
dataset$ReleaseArea
1
2
3
4
5
6
02
46
8
Release month
Tran
spor
t suc
cess
(%)
01 02 03 04 05 06 07 08 09 10 11 12
dataset$target_depth
1
2
3
4
Egg density
1.021 1.023 1.025
Tran
spor
t su
cces
s (%
)
1_nord 2 3 4 5 6_sud
Release area
Tra
nsport
success (
%)
02
46
810
Jan Feb Mar Apr May Jun Jul Aug Sep Oct Nov Dec
Release month
Tra
nsport
success (
%)
02
46
810
97 98 99
Release year
Tra
nsport
success (
%)
02
46
810
1.021 1.023 1.025
Egg dentity
Tra
nsport
success (
%)
02
46
810
!100.0 to !100.0 !15.0 to !15.0 !20.0 to !50.0 !50.0 to !50.0
Target depth (m)
Tra
nsport
success (
%)
02
46
810
100m
1_nord 2 3 4 5 6_sud
Release area
Tra
nsport
success (
%)
02
46
810
Jan Feb Mar Apr May Jun Jul Aug Sep Oct Nov Dec
Release month
Tra
nsport
success (
%)
02
46
810
97 98 99
Release year
Tra
nsport
success (
%)
02
46
810
1.021 1.023 1.025
Egg dentity
Tra
nsport
success (
%)
02
46
810
!100.0 to !100.0 !15.0 to !15.0 !20.0 to !50.0 !50.0 to !50.0
Target depth (m)
Tra
nsport
success (
%)
02
46
810
50m 20-50m
1_nord 2 3 4 5 6_sud
Release area
Tra
nsport
success (
%)
02
46
810
Jan Feb Mar Apr May Jun Jul Aug Sep Oct Nov Dec
Release month
Tra
nsport
success (
%)
02
46
810
97 98 99
Release year
Tra
nsport
success (
%)
02
46
810
1.021 1.023 1.025
Egg dentity
Tra
nsport
success (
%)
02
46
810
!100.0 to !100.0 !15.0 to !15.0 !20.0 to !50.0 !50.0 to !50.0
Target depth (m)
Tra
nsport
success (
%)
02
46
810
15m
Tran
spor
t su
cces
s (%
)
Vertical migration
100m 50m 20-50m 15m
Target depth
Simplified larval development model:
Conclusions• The results comfort our hypotheses:
• The transport patterns correspond to filament characteristics (seasonality, location and depth structure)
• The sardine spawning area is exposed to transport toward the eddy field south of the islands (~8%), but rarely to the islands (<1%)
• At the opposite, the anchovy spawning area is subject to transport towards the eastern islands (~6%), but less to the southern eddy field (~4%)
• No ichthyoplankton transport to the western islands
• Larval vertical migration can double the transport to the Canary area, from 2% (100m) to 4% (15m)

Questions?