political credit cycles: the case of the euro zone · pdf filepolitical credit cycles: the...
TRANSCRIPT
Political Credit Cycles: The Case of the Euro Zone∗
Jesus Fernandez-Villaverde† Luis Garicano‡ Tano Santos§
March 15, 2013
Abstract
We study the mechanisms through which the adoption of the Euro delayed, rather
than advanced, economic reforms in the Euro zone periphery and led to the deterio-
ration of important institutions in these countries. We show that the abandonment of
the reform process and the institutional deterioration, in turn, not only reduced their
growth prospects but also fed back into financial conditions, prolonging the credit
boom and delaying the response to the bubble when the speculative nature of the
cycle was already evident. We analyze empirically the interrelation between the fi-
nancial boom and the reform process in Greece, Spain, Ireland, and Portugal and, by
way of contrast, in Germany, a country that did experience a reform process after the
creation of the Euro.
Keywords : Financial crisis, bubbles, Euro crisis, political economy.
JEL classification numbers : E0, D72, G15.
∗We sincerely thank Costas Arkolakis, Markus Brunnermeier, Manolis Galenianos, Dirk Krueger, Philip Lane,Martin Oehmke, Stavros Panageas, Elias Papaioannou, Canice Prendergast, Ricardo Reiss, Waltraud Schalke,Dimitri Vayanos, and Pierre Yared for their generosity with their time in discussing this paper with us. Allremaining errors are ours, of course.
†University of Pennsylvania, NBER, and CEPR.‡London School of Economics, Centre for Economic Performance, and CEPR§Columbia University

1. Introduction
“After entry into the euro area, the Bank of Greece will be implementing the single
monetary policy decided by the Governing Council of the European Central Bank and
it will certainly be impossible to improve the economy’s international competitiveness
by changing the exchange rate of our new currency, the euro. The objectives of higher
employment and output growth will therefore have to be pursued through structural
reforms and fiscal measures aimed at enhancing international competitiveness by in-
creasing productivity, improving the quality of Greek goods and services and securing
price stability.” (Lucas Papademos, Greece Central Bank Governor, at a conference to
mark Greece’s entry to the Euro, 2001).
Before monetary union took place with the fixing of parities on January 1, 1999, the conven-
tional wisdom was that it would cause its least productive members -particularly Greece, Portugal,
Spain, and Ireland1- to undertake structural reforms to modernize their economies and improve
their institutions.2 This paper argues that, due to the impact of the global financial bubble on the
Euro peripheral countries, the result was the opposite: reforms were abandoned and institutions
deteriorated. Moreover, it argues that the abandonment of reforms and the institutional deteri-
oration prolonged the credit bubble, delayed the response to the burst, and reduced the growth
prospects of these countries.
In the past, the peripheral European countries had used devaluations to recover from adverse
business cycle shocks, but without correcting the underlying imbalances of their economies. The
Euro promised to impose a time-consistent monetary policy and force a sound fiscal policy. It
would also induce social agents to change their inflation-prone ways. Finally, as in the opening
quote, it would trigger a thorough modernization of the economy.
As section 7 shows, this was the case for a different economy: Germany. Faced with a limited
margin of maneuver allowed by the Maastricht Treaty and with a stagnant economy, Germany
chose the path of structural reforms, giving a new lease on life to German exports. But this did
not happen in the peripheral countries. Instead, the underlying institutional divergence between
them and the core increased. The efforts to reform key institutions that burden long-run growth,
such as rigid labor markets, monopolized product markets, failed educational systems, or hugely
distortionary tax systems plagued by tax evasion, were abandoned and often reversed. Behind a
shining facade laid unreformed economies.
The common origins of the financial boom are well understood. The elimination of exchange
rate risk, an accommodative monetary policy, and the worldwide easing in financial conditions
1Our narrative centers on the four countries subject to “Troika” programs as of early 2013. We also discussGermany by way of contrast. We believe much of what we say applies to Italy and France, but we do not addressthem due to space limitations.
2For example, Bentolila and Saint-Paul (2000) say, “Indeed the conventional wisdom is that EMU will eventuallyremove some barriers to reform.” Bean (1998) argued that, once monetary and fiscal policies were out of the handsof governments, they would have no alternative but to carry out reforms.
1

resulted in a large drop in interest rates (see figure 1) and a rush of financing into the peripheral
countries, which had traditionally been deprived of capital.3 Furthermore, demographics in Ireland
and Spain favored the start of a construction boom with some foundations in real changes in
housing demand, the opposite of Germany, where demographics depressed housing demand. As
figure 2 shows, the percentage of the population between 15 and 64 increased dramatically in
Ireland and, to a lesser degree, in Spain between the mid 1970s and 2007. In France and Germany,
the peak happened about two decades earlier. Since then, both countries have experienced a slow
decay in this segment of the population. These demographic trends were accompanied by an
increase in the employment to population ratio and, thus, resulted in strong rates of growth even
in the absence of productivity gains.
Section 2 identifies two channels through which the large inflows of capital into the peripheral
economies led to a gradual end to and abandonment of reforms. The first one is the relaxation
of constraints affecting all agents. It has long been observed in the political economy literature
that for growth-enhancing reforms to take place, things must get “sufficiently bad” (see Sachs and
Warner, 1995, and Rodrik, 1996). And, as the development literature has emphasized, foreign
aid loosens these constraints by allowing those interest groups whose constraints are loosened
to oppose reforms for longer. As explained in section 2, Vamvakidis (2007) also finds that this
mechanism operates when debt grows, rather than aid.
The second mechanism is more novel. It affects the ability and willingness of principals to
extract signals from the realized variables in a bubble, where everything suggests all is well. A
sequence of good realizations of observed outcomes leads principals to increase their priors of the
agents’ quality. When all banks are delivering great profits, all managers look competent; when
all countries are delivering the public goods demanded by voters, all governments look efficient
(this mechanism applies both to real estate bubbles, as in Ireland and Spain, and to sovereign
debt bubbles, as in Portugal and Greece). This information problem has negative consequences
for selection and incentives. Bad agents are not fired: incompetent managers keep their jobs and
inefficient governments are reelected. The lack of selection has particularly negative consequences
after the crisis hits. Moreover, incentives worsen and agents provide less effort.
Both of these mechanisms, the relaxation of constraints and the signal extraction problem,
led to a reversal of reforms and a deterioration in the quality of governance in these countries.
Somewhat counterintuitively, this observation implies that being able to finance oneself at low (or
negative) real interest rates may have negative long-run consequences for growth.
3Although there are alternative explanations for the Euro crisis, the view that the credit bubble itself is thesource of the disturbance is hard to counter. As shown by Forbes and Warnock (2012), there is a clear globalfactor, linked to financial volatility, in gross capital flow patterns. Lane and McQuade (2012) report a strongcorrelation between net debt flows and domestic credit: the ability of banks to raise external finance was crucial inallowing lending to increase faster than deposits, helping to finance construction booms and public debt. Finally,Lane (2012) documents how the nontraded sector expanded in the deficit countries, such as Greece, Spain, andIreland, while it contracted in surplus countries, such as Germany. Our reading of the evidence is thus that thecausality mainly runs from the credit bubble to the real changes and not in the opposite direction.
2
Other economists have already pointed out that the financial cycle reduces future growth,
simply because of the debt overhang (Reinhart and Rogoff, 2009; Bernanke, Gertler, and Gilchrist,
1999). Also, researchers working on resource booms have suggested mechanisms that delay growth
that apply here by analogy (a financial bubble is, in a way, a form of a resource boom). Grand,
ill-conceived government programs involve lasting commitments that lead to higher taxes in the
long run. Also, the “Dutch disease” suffered most clearly by Ireland and Spain (with land playing
the role of a natural resource here) spreads, whereby human and physical capital moves from the
export-oriented sector toward real estate and the government sector. But in our view, the reform
reversal and institutional deterioration suffered by these countries are likely to have the largest
negative consequences for growth.
Our work is also related to Rajan (2011), who links the real estate bubble in the U.S. with
an attempt by politicians to shore up the fortunes of a dwindling middle class. We emphasize,
instead, that in Europe the real estate boom interacted with the political-economic coalition that
blocked reforms, allowing large policy errors to remain uncorrected and institutions to deteriorate.
After presenting our analytic framework in section 2, the rest of the paper focuses on the ex-
periences of five countries (Spain, Ireland, Greece, Portugal, and Germany) and how membership
in the Euro affected reform processes in these countries as well as introduced additional political
economy constraints when the crisis came. In section 3, we explore the complex relation between
politics and finance that characterized the growth of the cajas, the Spanish credit institutions that
were dominated by the local political elites and that were responsible for the financial crisis in
that country. Our contention is that membership in the Euro zone interacted with this peculiar
sector, first to create the real estate bubble and, second, to bias the initial response to the crisis.
Section 4 focuses on Ireland. Recent Irish economic growth can be best thought of as having two
phases. The first was a healthy growth cycle characterized by strong increases in the employment
to population ratios as well as reforms in key markets. The second was dominated by the real
estate bubble fueled by systematic cuts in stamp duties associated with real estate transactions,
increases in the income tax ceiling to qualify for mortgage interest rate deductability, and other
similar policies. This created an environment in which loose corporate governance standards in
the banking sector led to an unprecedented lending boom, which fatefully ended with the public
guarantee of all banks’ liabilities. Sections 5 and 6 deal with Greece and Portugal, respectively,
and the stalling of the reform processes in those countries. Section 7 describes the very different
situation in Germany, where a unique constellation of factors, including Euro membership, pro-
duced the conditions under which reforms could take place. In sum, the bubble that the Euro
brought, instead of completing the modernization of peripheral Europe’s institutions, became the
sedative against any reform. We discuss now in detail why and how it happened.
3
2. Analytical Framework: The Political Economy of Reforms, Institu-
tions, and Monetary Unions
The Euro project had four goals (see James, 2012, for a historical narrative). The first was to
build a unified European identity. The second was to eliminate nominal exchange rate fluctuations
and the large imbalances that those could create. Of special concern was channeling the export
dynamism that Germany had displayed since the 1960s. Third, it would create a monetary
authority isolated from political pressures. This was particularly welcomed by countries with poor
inflation records such as Italy or Portugal. The fourth goal, the one we analyze in this section,
was to broaden support for structural, supply-side reforms to improve Europe’s growth rate. The
main channel through which a monetary union was thought to affect the political economy of
reform was by imposing additional constraints on monetary and fiscal policy. Without their own
monetary authority and with fiscal policy limited by the Maastricht Treaty, national governments
would have few options but to implement structural reforms they had previously been reluctant
to undertake.
In fact, the steep drop in interest rates in the peripheral countries allowed by the Euro meant
that the budget constraints that these countries faced were loosened rather than tightened. More-
over, the resulting financial bubble fueled the deterioration of governance and of the institutional
arrangements on the Euro periphery through several mechanisms we will describe momentarily.
Therefore, the Euro might have led to a persistently negative impact on the peripheral countries
that goes beyond the usual arguments for slow recoveries after a financial crisis.
We provide here a framework to analyze these issues. Specifically, we discuss the three ques-
tions begotten by the logic above. First, how does an irrevocably fixed exchange rate regime affect
the political economy of reform? Second, how does financial integration, and the ensuing credit
boom, alter this logic? And third, how persistent would we expect these effects to be?
2.1. The Arguments 15 Years Ago: Reforms Under Fixed Exchange Rates
The debate on the Euro and the political economy of reform centered on the impact of the loss
of monetary and fiscal autonomy implied by the new fixed exchange rate regime. Interestingly,
the debate largely ignored the channel that proved, in retrospect, to be crucial: the increasing
financial flows and the credit cycle they generated.4
The pre-Euro literature (see the summary in Bean 1998) presented four optimistic reasons to
argue that the Euro would favor structural reforms. First, it was suggested that governments
that cannot use demand-side policies to lower (even if temporarily) unemployment would have
no choice but to use structural reforms as a substitute. Second, the ability of business to more
4There was also a large literature on the effects of the Euro on trade, macroeconomic performance, and in-ternational finance, but we omit its discussion to center our presentation on the political economy aspects of thecommon currency.
4

easily switch between countries would lead European nations to compete by offering the better
business environment fostered by those reforms. Third, a Euro zone was likely to increase de-
centralization in wage bargaining to allow firms to adapt to changing circumstances without the
help of monetary policy. Since wage bargaining had been shown to work best when it was entirely
decentralized (such as in the U.S.) or totally centralized (such as in the Scandinavian countries),
this increased flexibility would help the peripheral countries where wage bargaining was done at
an inefficient, intermediate level (Danthine and Hunt, 1994). Finally, the Euro could increase the
market discipline on government borrowing because domestic private institutions would be able
to lend in other countries of the Euro area without exchange rate risk instead of just to their own
treasuries. Indeed, the Delors Report that informed the creation of the Euro expected this market
discipline to be even more formidable than the formal constraints of the Maastricht Treaty.
The literature also worried about the opposite effect. The absence of an accommodating
monetary and fiscal policy meant that the structural reforms must take place “without anesthesia,”
increasing the pain that must be endured by losers and making it less likely that the reforms could
be implemented. The “two-handed approach” famously proposed by Blanchard, Dornbusch, and
Layard (1986) would become impossible (Bentolila and Saint Paul, 2000). Absent supportive
macroeconomic policies, the pain from reforms would be harder to tolerate and the coalition
supporting reform could dissolve.5
In retrospect, during the first years of the Euro, this “rigidity of macro policy” channel played
a role only in Germany -absent fiscal and monetary flexibility, Germany had to undertake painful
structural reforms, as we discuss in section 7. But it did not play its expected role, either favorably
or unfavorably, in any of the peripheral countries. This was because a different mechanism, the
financial boom, gave national governments a tool to avoid painful reforms. We discuss this in the
next section.
2.2. Booms, Reforms and Information Extraction, Selection, and Incentives
While the literature on the impact of the Euro disagreed on the ultimate likelihood of reforms, it
mostly agreed on the channel through which the impact would take place: tighter macroeconomic
policies would affect, positively or negatively, reform incentives. However, the Euro did not make
government budget constraints tighter. On the contrary, it made them looser.
Coinciding with the Euro entry, and caused by it, the peripheral countries enjoyed a gigantic
credit inflow. As figure 3, panel A shows, while all of these countries started the decade with
sustainable external debt positions, by 2010 all four countries we examine had reached net ex-
ternal debt close to 100 percent of GDP, either through the accumulation of public (Greece and
Portugal) or private (Spain and Ireland) debt. This large inflow of capital was largely due to the
5Chari and Kehoe (2008) also pointed out the danger of “free-riding” in a monetary union. Given that theeffects of labor market policies, bank supervision, or fiscal policy of an individual country could negatively affect thewelfare of the entire union, the monetary authority could be forced, by the uncoordinated action of each member,to generate high inflation.
5

misperception of the risk existing once the exchange rate uncertainty had been eliminated. True,
the Maastricht criteria placed limits on budget deficits. But the unprecedented financial booms
enjoyed by these countries, as we shall see in the country sections below, allowed them to hugely
expand their budgets, paying for it either directly through the issuance of historically cheap debt,
as Greece or Portugal did, or through the extraordinary tax revenue related to the real estate
bubble, as was the case in Spain (see figure 4, panel A), or even allowed for more procyclical fiscal
policies as in Ireland (figure 5, panel C.)
The consequences for economic reform of such a windfall would not have surprised researchers
working on the impact on reforms of foreign aid. Alesina and Drazen (1991) have argued that the
political decision process for economic reform is a war of attrition, in which all groups try to delay
the reform for as long as possible (with a cost to all) until one group has no more “budget” and
gives up, bearing the largest cost. Casella and Eichengreen (1996) show that, in this context, if
these groups expect foreign aid, they will delay concessions and reforms. Svensson (1999) shows,
in a game-theory model, that any windfall (including aid) increases rent-seeking and reduces
productive public spending, and he presents empirical evidence (see also Drazen, 2000) consistent
with the proposition that aid delays reforms. Vamvakidis (2007) extends these arguments to the
case of financial booms: a government that can easily borrow abroad may use such borrowing to
postpone otherwise necessary reforms. Using an index of economic freedom to measure reform,
he finds empirically in a panel of 81 developing and emerging countries that increases in external
debt are correlated with slowdowns in economic reforms. Finally, Tornell and Lane (1999) present
a model of a voracity effect where a windfall gain in an economy populated by many interest
groups causes more redistribution and a reduction in growth.6
A second channel from the financial boom to the political economy of reforms is more novel
in the literature and concerns how the credit bubble affected information extraction about the
performance of financial institutions and governmental agencies. It is hard to obtain good signals
of performance in a bubble. As Warren Buffet has most famously put it, “You never know who’s
swimming naked until the tide goes out.” During the bubble, accountability is lost. A manager of
a caja in Spain, or of a Greek pension fund, can make bad decisions without any negative short-
run consequences because the rising asset prices in the bubble hide any mistakes. But managers
and politicians understand that, thanks to the bubble, they can extract more rents without fear
of punishment. Consequently, governance deteriorates and weak institutions become weaker.7
Our argument, essentially, is that voters, shareholders, lenders, and other interested parties
face, as principals, a complicated signal extraction problem: given the sequence of outcomes that
they observe from the agent, they need to infer how good the agent is or, similarly, how much
6See also Battaglini and Coate (2008), who present a model where lower debt leads, in expectation, to morepork barrel spending. In our paper, instead of a lower debt, we have a debt that is cheaper to finance. Similarly,in Yared (2010), a relaxed budget constraint induces policymakers to waste resources.
7Barro (1973) introduced the idea of politicians as agents in a principal-agent relationship. Ferejohn (1986) isan early example of the idea of voters basing their decisions on the observed behavior of politicians and politiciansbehaving based on those decisions by voters.
6

effort the agent is exerting. To be more concrete, consider the following problem in which the
principal (voters, shareholders, ...) needs to filter signals to understand the quality of governance
by the agent (government, top management, ...). First, we specify a transition equation for the
evolution over time of the quality of governance qt, which is stock:
qt = f (qt−1, et, ηt) (1)
that tells us that qt evolves as a function of its own lagged value, qt−1, the effort exerted, et, a flow
measure, and a random shock, ηt.8 The function f encodes the dynamics of a key state variable:
the capital of governance in a society. In the absence of “investment,” et, governance depreciates.
We are interested in the social incentives to exert costly effort to maintain the stock of corporate
governance. To inform this decision we assume that agents observe
yt = h (qt, et, νt) (2)
that relates a performance variable yt (dividends, economic growth, value at risk in a portfolio,...)
to the quality of governance, the effort exerted, et, and a random shock, νt. To ease notation,
we assume that et affects both equations (1) and (2), although one can easily think about et
as a vector, with one component affecting the quality of governance (for example, searching for
independent outside experts for a board of directors) and another component influencing the
results (for example, the time spent by management with the board of directors laying out a
strategy for the company). Persistence in the quality of governance is justified because bad
decisions (low et) lead to more bad decisions: Naming someone with no background in banking
but who is politically well-connected leads to persistent low governance as he stuffs the board
with like-minded individuals more interested in repaying the favor than in monitoring the bank’s
financial statements.
The combination of the transition and measurement equation is often known as a state-space
representation of a dynamic system and can be derived from microeconomic fundamentals of a
fully-specified model through the cross-equation restrictions implied by rational expectations and
equilibrium dynamics (Fernandez-Villaverde et al., 2007). Agents observe a sequence {yi}ti=0 and
must update their beliefs about the quality of governance at time t, expressed as a conditional
distribution p(qt| {yi}ti=0
)given some initial prior p (q0). This is a standard filtering problem that
can be solved, under some technical assumptions, using recursively the Chapman-Kolmogorov
equation and the Bayes’ theorem (see Cappe, Moulines, and Ryden, 2010).
8It is straightforward to extend the transition equation to more general setups, for example, by making qt avector that includes the leads and lags of relevant state variables. For clarity of exposition, though, we centeron the simplest case in the main text. Also, we do not need to impose much structure on the function f (·)beyond measurability. In the same way, the shock ηt can have an arbitrary distribution. While assumptions suchas linearity of f (·) or normality of ηt are often computationally convenient, they are somewhat irrelevant for thetheoretical point we are making here. A similar argument works for the measurement equation below.
7

How does a financial boom affect the signal extraction problem given by equations (1) and
(2)? In particular, what happens if, for several periods in a row, the measurement equation is
hit by large and positive realizations of νt that deliver large and positive values of yt? Think, as
an example, of yt being the profits of a bank and νt as the increase in the value of its loan book
triggered by a real estate bubble.
The key step in our argument is that bubbles make signal extraction harder. By the properties
of filtering problems, no matter how bad a shareholder’s original estimate of the quality of the
bank’s governance was, a sequence of large profits forces the shareholder to move this estimate
toward higher quality. Unless qt and et are perfectly observed, the principal has to divide the
observation of a high yt between a positive update of its estimate of the quality of governance
(i.e., a shift to the right of the distribution p(qt| {yi}ti=0
)) and a higher estimate of νt. The
concrete division would depend on the parameters of the problem: for instance, if νt has a high
variance, the principal will update its estimate of the quality of governance less than if νt has low
variance.9 In other words, when all banks are delivering great profits, all managers look competent
and when all countries are delivering the public goods demanded by voters, all governments look
efficient. This mechanism applies, therefore, both to the real estate bubble in Ireland and Spain
and to the sovereign debt bubble in Portugal and Greece.
This increased difficulty has two consequences: one in selection and one in incentives. First,
bad agents are not fired: incompetent managers are able to keep their jobs and inefficient govern-
ments are reelected. If the principal’s estimate of an agent’s quality is sufficiently high, there is
no reason to replace the agent. As we will see later, this lack of selection will have negative con-
sequences when the crisis hits. Second, incentives deteriorate. Since there is a lower probability
of underperforming, agents exert less effort. From the agent’s perspective, there is little reason
to spend effort if they believe that things will turn out positively in all events. Through equation
(1), this translates into a lower qt, which again will add persistence over time to bad governance.
But there are also three additional consequences that, although not necessary for our argument
to hold, quantitatively amplify the mechanisms we are highlighting. First, the basic filtering prob-
lem in equations (1) and (2) assume that the principal has all the computational power required
to perform the filtering at zero cost. Both assumptions are unrealistic: computational power is
severely limited in practice and, more important, filtering requires hard work by the filterer. For
instance, shareholders need to study the accounts of the firm and voters need to be informed
about the issues. When downside risk is perceived as being capped by quasi sovereign guarantees
by the other member states of the monetary union, both on states (Greece and Portugal) and
on banks/cajas (Spain and Ireland), voters, shareholders and investors worry less about risk and
9We omit a thorough discussion of the update. In general, since we are not imposing linearity and normalityin the state-space representation, each new observation yt will have three effects on the conditional distributionof qt: a change to its mean (translation), a change to its variance (spreading), and a change to higher moments(deformation), which raise some nuances beyond the scope of our brief description. With a linear-normal state-space representation, we will only have translations and spreadings.
8

decrease their investment in monitoring. This leads to a further deterioration in the signals about
governance quality and again increases the decision makers’ moral hazard.
Second, during the boom times, agents have considerable discretion over the timing of payoffs
and can choose to generate large positive payoffs up front and postpone the negative ones. For
instance, bank managers can issue highly risky loans that deliver high yields in the short run and
that will only become non-performing years later. Or politicians can implement popular spending
programs that, while initially cheap, have costs that will quickly escalate over time (this was
particularly true in the case of Spain). The result is a large amount of equity extraction from
corporate bosses (salaries, options. . . ) or rents by politicians.
Third, we hypothesize that signal extraction is harder when economic activity is concentrated
in real estate or finance than in manufacturing. In manufacturing there are accurate, concrete
measures of performance: how productive a factory is, how third parties rank the good, and so
on. In real estate or finance, it is much harder to assert where the “fundamentals” are: what
is the real value of a loan or what will the market price of a condo be in 5 years? Hence, as
economies focus more on real estate and finance (such as Spain or Ireland), the signal extracted
from performance will deteriorate more than in more manufacturing-based economies (such as
Germany), even if both types of economies are simultaneously booming.10
Finally, behavioral biases also contribute to the difficulty in providing good incentives during
booms, specifically in the form of self-attribution bias: it is hard to convince agents that the good
things that are happening are not a result of their own outstanding decisions (in particular, as
their bonuses depend on this). As they become more overconfident, they are increasingly likely
to overreach, as cajas did in Spain and Anglo Irish Bank did in Ireland.
As a result of the deterioration -for statistical, strategic, and behavioral reasons- in the quality
of the signals of performance obtained by principals (shareholders, voters, etc.), financial booms
lead to weaker monitoring and a deterioration in governance. Our next step is to argue that, due
to the reform reversals and the fall in the institutional quality brought about by the mechanisms
above, economic performance will be worse after the end of the financial boom. That is, we
present a new channel for the persistence of the negative macroeconomic shocks.
2.3. Persistence of the Effects of Bubbles on Governance and Performance
The financial boom in Europe amounted to obtaining finance at low nominal interest rates, which
were for some time even negative in real terms. A priori, financing private and public investments
at negative interest rates involves receiving a subsidy from lenders. Hence, it is not obvious why
this situation should be bad for a country’s growth. However, one can identify multiple paths
that lead countries on the receiving end of such financial largesse to suffer from persistently lower
growth rates. The first two paths are borrowed from the “resource curse” literature, the third
10This point is related to the difficulty of measuring services in comparison with measuring manufactures innational accounts (Berndt and Hulten, 2007).
9

from the literature on financial crisis, and the fourth is the novel path proposed by this paper.
First, similar to the grandiose investments of the oil producers in the 1970s (Gelb, 1988),
governments that can borrow freely are likely to waste enormous resources (new hospitals and
universities in all towns, airports in the middle of nowhere). These unproductive expenditures
create persistently lower growth, since they involve multi-year commitments that must be funded
through future distortionary taxation.
Second, also as in the resource curse literature, countries with easy access to large capital
inflows suffer a variant of the “Dutch disease” (Sachs and Warner, 1995). The credit bubble leads
to a reallocation effect: relative price changes shift the allocation of capital -physical and human-
toward activities such as construction investment and away from the production of tradable goods.
While some of the inputs can be moved back to the tradable goods sector after the bubble explodes,
others are sector-specific and have little scrapping value. Moreover, the investments in human
capital are sticky: countries are left with large segments of the population unprepared for more
sustainable activities. In the European periphery, a large part of the work force is poorly prepared
to take advantage of a knowledge economy in which the returns to skill have been rising, rather
than dropping (such as had appeared in the bubble years).
Third, the literature on financial frictions has argued that the recovery from financial crisis is
inherently slow because agents suffer from a debt overhang: they need to deleverage and rebuild
their capital. The point has been made empirically by Reinhart and Rogoff (2009) and, in a
financial accelerator model, by Bernanke, Gertler, and Gilchrist (1999), among others.
The fourth channel is the institutional deterioration caused by the bubble. That is, the
political economy of finance booms itself becomes a drag on recovery. There are two reasons
for this persistence. First, there is the argument by Vamvakidis (2007) that debt buys time and
can be used to postpone structural reforms. The second channel can be understood using our
state-space representation in equations (1) and (2). First, as we have seen, the complication of
signal extraction during a boom means that bad managers and politicians are not weeded out.
When the bad times arrive, at the collapse of the boom, these bad managers and politicians are
unwilling to act or are unable to cope with the situation. Furthermore, since collective action is
always slow, it takes time to find more talented agents.11 This slow turnover at the top deepens
and prolongs the recession.
Second, the lower et in equation (1) yields a lower qt, which has persistence over time. For
instance, when politicians dismantle the human capital of a central bank to better make it a
servant of their own interest, it takes years to rebuild the know-how of the institution. Similarly,
bad management at the top of a firm deteriorates the quality of middle management. Thus, when
agents need to be replaced, there is not enough talent in the firm’s pipeline.
Third, weakened institutions affect the political-economic equilibrium by strengthening the
11In some countries, staying in power may be sought after as a means to avoid legal prosecution for allegedcorruption crimes.
10

forces against reform and providing few rewards for those in favor. Normally, political success will
reflect economic success: if a group grows, its lobby power will be larger and it would be able to
push for institutions favorable to its interests (see for this point, Acemoglu and Robinson, 2013,
and more in general, North, 1990). In a bubble, the success is a mirage. Money flows into the
coffers of developers and builders, allowing them to increase their political power, a particularly
dangerous proposition given the extent to which real estate depends on the discretional decisions
of the authorities. At the same time, the agents in the tradable goods sector have less income
and employ fewer workers, reducing their political influence. That is, the bubble creates its own
constituency that is only interested in the bubble continuing. And even after the bubble has
burst, the constituency is reluctant to accept the required changes in economic policies.
We turn next to arguing that this simple framework can explain the different paths followed
by some countries during the early years of the Euro. These countries (Ireland, Spain, Portugal,
and Greece) had different dynamics prior to membership in the monetary union, partially driven
by demographic factors, and were engaged, to some degree, in reform processes. We will show how
these processes were slowed by membership in the monetary union. Specifically, the relaxation of
the credit constraints that either the public or the private sector (or both) were subject to delayed
either the transition to different economic growth models or simply the adoption of reforms. We
then turn to Germany, a country that engaged in long-postponed and painful reforms in its welfare
state in the same period, and argue that the circumstances that allowed delays in the periphery
actually forced reform on a reluctant Germany
3. Spain
The years before the Euro were auspicious ones for reform efforts in Spain. The fiscal position
was consolidated, a wave of privatizations created strong multinationals such as Telefonica and
the conditions for the emergence of global companies such as Inditex (Zara) and Iberdrola were
laid down for the first time. Moreover, the financial system was strong and well capitalized, and
some of the Spanish banks, such as Santander and BBVA, became global powerhouses.
However, the real estate bubble led to the loss of the reform impulse. Between 1999 and
2007, Spain experienced a period of rapid growth, averaging 3.6 percent -higher than the growth
rates of both the Euro area (around 2 percent) and the U.S. (2.6 percent). This growth was the
result of a favorable external environment, due largely to the adoption of the Euro: real ex-post
interest rates dropped by 10 points between 1990 and 2005. During this expansion, the grave
problems in the Spanish labor market, education system, and institutional design went untouched
or worsened. In the face of opposition, the attempts at reforming the labor market (in 2002) were
quickly abandoned by the Aznar government. Also, the educational system suffered an increase
in the dropout rate and local governments were infected by the pervasive corruption engendered
by the real estate boom.
The drop in interest rates had a stronger effect in Spain than in other countries due to pecu-
11

liarities unique to that country. Spaniards hold a very large share of their wealth in real estate: 83
percent of households live in dwellings they own, and 80 percent of Spaniards’ wealth is invested
in real estate, a significantly larger share than in other countries (Bover, 2011). This makes them
particularly sensitive to perceived increases in housing wealth. Moreover, nearly the entire mort-
gage market is priced at variable interest rates, and thus it is extremely responsive to the sudden
increase in the availability of credit. Finally, in addition to the demographic factors already men-
tioned, Spain received large immigrant inflows: foreign-born residents went from 2 percent of the
Spanish population to 12 percent between 1999 and 2009.12
Not all was well in the Spanish economy, though. First, the economy was growing by using
more labor and capital, but had no gains in total factor productivity since 1995. Along this
dimension, the contrast with Germany was striking (see figure 4, panel B.) Moreover, this was not
the result of a pattern of growth concentrated in low-productivity sectors. On the contrary, more
than 50 percent of the gap in productivity growth with Europe was due to lower productivity
within each sector. A second concern was the reliance on internal demand and the consequent
external imbalances. While imports of goods and services grew between 1995 and 2008 at a
rate of 10.1 percent, exports were growing at 8.5 percent. The consequent large current account
deficits meant that, from 2000 to 2009, Spain required 520 billion Euros of external financing (in
undiscounted terms). The end result was a deterioration of Spain’s net international investment
position (figure 3, panel A). A third concern was the size of the real estate boom: at the peak,
25 percent of all male Spanish workers were employed in construction (Bonhomme and Hospido,
2012). Finally, the impact of the bubble on the government’s budget was significant: by 2007,
tax revenue was at least 2 percentage points of output higher exclusively due to the extra house
transactions (Fernandez-Villaverde and Rubio-Ramırez, 2009). As shown in figure 4, panel A,
starting in the first half of the 2000s there was a significant acceleration in income tax and
value-added tax revenues. Even though the public sector presented a small budgetary surplus, it
committed itself to expenditure programs that, given the cyclical nature of the revenue, were not
sustainable.
The pattern of Spanish economic growth in the decade between 1997 and 2007 drew the
attention of academics, journalists, and observers and there was a lively debate about many of
these issues in the press. In addition the 2004 general election, which the socialist party went
on to win over the incumbent conservative party, rotated precisely around the issue of Spain’s
economic growth model. For example, Miguel Angel Fernandez-Ordonez, the governor of the
Bank of Spain from 2006 to 2012, wrote in 200313 (our translation): “When we see mortgage
lending growing at 22 percent and we know that the injection of EU funds will continue through
2006, we see the growth differential due to domestic demand and concentrated in construction
can be maintained for some time. The problem is what will happen when the drug of domestic
12Gonzalez and Ortega (2009) use regional variation in immigrant numbers within Spain to argue that theimmigration inflow is responsible for a 52 percent increase in house prices.
13“El legado de Rato,” El Pais, September 11, 2003.
12

demand is exhausted. (. . . ) We will see negative effects appear on the demand arising from the
accumulation of household debt and the debt of public enterprises that the government hides
today. Moreover, the failure to improve our productivity over the years means we will not be able
to compensate for the future reduction of domestic demand with a greater contribution of the
external sector.” Miguel Sebastian, an economist who became prime minister Rodrıguez Zapatero’s
main economic advisor, wrote numerous op-eds warning of the many imbalances building in the
Spanish economy.14 Official institutions were also aware of the peculiar dynamics developing in
Spain. The European Commission in its 2003 Fall Report warned about the risks associated
with real estate appreciation in Spain,15 and the International Monetary Fund, in its June 2006
Technical Note, described the imbalances in the Spanish housing market.
But the proverbial punch bowl remained at the party. Neither the Aznar nor the Rodrıguez
Zapatero government took any significant measures to curtail the speculative process. This com-
placency extended to the Bank of Spain, where first the conservative appointee Jaime Caruana,16
and then Miguel Angel Fernandez Ordonez, the governor named by prime minister Rodrıguez Za-
patero upon the expiration of Mr. Caruana’s term,, let risks accumulate in the Spanish financial
system. And that is why we turn next to the role played by the Spanish banks.
3.1. The Cajas and the Real Estate Bubble
As we argued before, while some demand factors -immigration, a drop in real interest rates-
contributed to the start of the real estate boom in Spain, those demand factors cannot matter much
over the long run. Spain has a low population density and an excellent transportation system.
Thus, while demand may explain a short-run burst in prices, it cannot account for a persistent price
appreciation from 1997 to 2007 and the build-up of external and internal imbalances. Instead, the
combination of the institutional redesign of the Spanish administration after 1975 and the legal
changes that favored the growth of the cajas led to a significant fraction of the credit market to
being determined by short-term political considerations.
A key aspect of the transition from dictatorship to democracy in Spain was an ambitious
decentralization process. The years after the Constitution of 1978 witnessed the creation of 17
autonomous regions (Comunidades Autonomas) endowed with a wide range of powers. Among
these powers were urban planning and zoning regulation. After some disputes -the 1978 Con-
stitution being deliberately ambiguous about the details of the division of power between the
14See, for example, “El ladrillo y la burbuja,” (The brick and the bubble) El Pais, June 22, 2003.15See “Bruselas Alerta a Espana sobre el riesgo derivado de los precios de la vivienda,” El Pais, October 29,
2003.16In an unusually harsh move, the supervision staff from the Bank of Spain wrote a collective letter to the
minister of finance on May 26, 2006 in which they questioned Governor Caruana’s “optimistic” handling of thecrisis. The last phrase of the document summarizes it as follows: “For all these reasons, we, the Inspectors of theBank of Spain, do not share the candid optimism of the Governor about the predictable evolution of the Spanisheconomy and that, from our perspective, and without wanting to spread alarm, there are enough reasons to worry,particularly if one considers the legacy of the six years of the governor Caruana’s tenure.” [our translation, fromthe original at http://www.fluzo.org/media/resources/1295/files/inspectores banco espana caruana.pdf]
13

central and regional governments- the Spanish Constitutional Court, in a 1997 landmark decision,
gave regions nearly complete control over zoning. The regions rushed to take full advantage of
this decision. Interestingly, the most active region was Valencia, which would later become the
epicenter of the real estate bubble, and which, in 1994, before the Constitutional Court decision,
had already enacted its own regulation.
Most of the new regional legislation introduced two figures that had been nearly non-existent
on the traditional Spanish zoning and planning system, which had relied in urban development
plans approved decades in advance and that had received much criticism for its inflexibility and
for the slowness it generated. The first figure was the real estate developer (Agente Urbanizador,
although different regions came up with slightly different terminology). This was a private person
or firm that could elaborate a detailed plan to build a whole area of a township (with condos,
apartments, shops, etc.) and present it to the city council. The township would usually receive
payment in terms of lots or cash. Eminent domain clauses could be used to force the owners of
the land in the area to be developed to sell to the developer at some “fair price.” Then, the real
estate developer would prepare the land, divide it into lots, and sell them to builders for a profit.
The second figure was the collective zoning agreement (Convenio Urbanıstico), whereby a group
of landowners could present to the township a development plan of the area they controlled. If
the city council approved it -again, thanks to the payment in terms of building lots or cash- the
landowners were not bound by any previous zoning restriction.
These two figures, by giving nearly complete freedom to the townships to ignore zoning rules,
opened the floodgates to institutional deterioration. Suddenly, an entrepreneur could make mil-
lions of Euros developing areas that had never been on the market before if he could just get the
city council’s approval. This created a strong incentive for politically well-connected individuals to
become real estate developers and widespread corruption followed. Similarly, it was too tempting
for a small city mayor to pass up millions of Euros in side payments by denying his signature
to a new development plan. Moreover, since the city would also receive “legal” payments from
the developer in cash or in lots, land development became an important revenue source for local
authorities, which could use the new-found riches to finance public programs that voters approved
of. For the local political elites this was a powerful instrument to foster local economic activity.
But Spanish regions are mostly financed through transfers from the central administration and
run the health care and education systems. Thus, funding ambitious real estate projects was
challenging and a third party was needed to provide the required capital. The cajas, the credit
institutions that are unique to Spain, were ready to fill this gap.
The Spanish financial system was divided into two more or less equal parts between the non-
profit (or cajas) sector and the for-profit bank segment. Originally created to provide banking
services to the middle-class and working population, mainly ignored by traditional banks, the
cajas had a strong provincial or territorial basis and a conservative outlook. Also the profits
generated by their activities were destined for a variety of social activities (support of the arts,
fellowships, etc.). It was only in 1971 that the cajas were equated with banks and came under
14
the supervision of the Bank of Spain.
Two key aspects of the regulation of cajas changed with the arrival of democracy. First, the
governance of the cajas was changed in 1985, when their control was transferred to the regions. The
regions were given full legislative powers over the cajas and the door was opened to their capture by
local politicians. Also, the law did not address their liability structure. In particular, and fatally
once the crisis started, it did not clarify the procedure to be followed for the recapitalization of an
insolvent caja. Second, the cajas were allowed to expand territorially.17 Initially, the cajas were
basically only allowed to operate in the province in which they were headquartered (a province
being a subdivision of a region in Spain). From 1988, they were allowed to operate in the entire
region with some exceptions. These regulations were eliminated with the Second European Union
Directive on Banking, effective December 31, 1992. From then on, the cajas were free to operate
throughout the country, with exceptions only if they did not reach the legal solvency ratios. As a
result, the expansion of the cajas was relentless and involved an intense geographic diversification.
While in 1991, a single caja had a 75 percent market share in 25 provinces, this was the case in
only 17 provinces in 1995, 10 in 1999, and none in 2007. Similarly, the number of branches
skyrocketed. By January 1, 2008, Spain had almost 25,000 caja branches, one for every 1,800
inhabitants.18 Not surprisingly, over this period the cajas were continuously gaining market share
versus banks (figure 4, panel C.)
Furthermore, the cajas channeled lending in an indiscriminate manner to real estate developers.
Because the growth in deposits was not enough to cope with the lending boom, they resorted to
wholesale funding on an unprecedented scale. Since the loans were obviously Euro-denominated
and against physical collateral (real estate assets), international institutions were able and willing
to lend. The cajas, but also the traditional banking sector, were an important conduit through
which international savings were recycled in Spanish real estate assets. Spain would soon find
out, though, that monetary union exposes a member country to the perils of sudden stops (see
figure 4, panel D). Moreover, the international flow of funds into Spain was partially channeled
through institutions that were singularly badly prepared to handle it.
Indeed, the growth of this sector was not accompanied by improvements in their governance. In
their past as small, local institutions, the cajas never had an incentive to improve their corporate
governance. Cajas did not have shareholders: instead, they were governed by a board selected
by the regional and local governments, employees, and clients. These boards were the perfect
target for takeovers by low-human-capital managers with the right political alliances and who
could finance politically motivated projects.
This point is clearly seen in Cunat and Garicano (2009 and 2010), who document that the
human capital of managers in the cajas was low and that those cajas where human capital was
particularly low had the highest amounts of real estate lending and non-performing loans. Specifi-
17For a description of the cajas sector on the eve of the crisis, see International Monetary Fund (2006b).18See Calvo and Martın de Vidales (2010) for a detailed analysis of the provincial expansion of the cajas.
15

cally, they find that a caja run by someone with a post-graduate education, with previous banking
experience, and with no previous political appointments is likely to have significantly less real es-
tate lending as a share of total lending, a larger share of loans to individuals, a lower rate of
non-performing loans, and a lower downgrade in its rating.
The combination of local political elites only too willing to foster real estate activity and poorly
managed and politicized cajas led to a real estate lending boom. Between 1995 and 2005, lending
for construction and development went from 8 percent to 29 percent of GDP, eventually reaching
42 percent of all lending to productive activities. At the peak of the cycle (2009Q2) the real estate
developer portfolio of Spanish credit institutions was 324.7 billion Euros. Lending to households
for housing purchases grew from 17 percent of GDP to 49 percent over the same period (Beltran
et al., 2010) and the mortgage portfolio of Spanish credit institutions reached a peak of 662.8
billions Euros in 2010Q3.19 This lending boom was accompanied by a boom in construction. The
number of housing units built every year went steadily upward from 150,000 in 1995 to 600,000 in
2007 and the price increase was large by any metric. According to data from the Spanish Ministry
of Housing, between 1998 and the peak of the boom in 2008, nominal housing prices increased
by 175 percent, compared to a 61.5 percent increase in the CPI. The price increases were larger
than the ones observed in the UK and the U.S. While in the U.S. the price to income ratio grew
from 3 to 4 from bottom (2001) to top (end 2007) and is now back at 3, in Spain it went from 4
to almost 8 and is only back at 6.5.
3.2. An Example of Institutional Deterioration: Bankia
The collapse of Bankia, a banking giant with assets equal to 33 percent of Spanish output, with
the resignation of its CEO, Rodrigo Rato, on May 9, 2012 led directly to Spain’s request to the
European Union for a “banking bailout.” How two long-lived cajas, Caja Madrid and Bancaja,
had come to an ignominious end less than 2 years after merging to form Bankia is a telling story
of institutional deterioration triggered by the real estate boom.
Caja Madrid was one the oldest cajas. For the first decade after the passage of the 1985
law discussed earlier, Caja Madrid was run with the consensus of the main political parties of
the rich region of Madrid. Its head, Jaime Terceiro, a distinguished academic economist, ran
the entity professionally and managed to make Caja Madrid a fierce competitor in the credit
market. In 1996, one year after the conservative party (PP) gained control of the region from
the socialist party (PSOE), the PP put in place a coalition that pooled its votes with those of
the trade union closely affiliated with the communist party (CC.OO.) in order to wrest control
of Caja Madrid. The union lent its votes to the conservatives for the removal of Caja Madrid’s
head and its replacement by Miguel Blesa, a close friend of the newly elected prime minister Jose
Marıa Aznar. In exchange, the conservative party granted veto power to the union on personnel
19The Bank of Spain’s statistics regarding credit institutions are summarized in Chapter 4 of its “BoletıinEstadıstico,” which is available at http://www.bde.es/bde/en/areas/estadis/.
16

appointments and guaranteed that Caja Madrid would never allow the entry of private capital on
the board, even if needed to ensure the solvency of the entity. In addition, the agreement called
for the reactivation of the relationship with real estate developers, although it also warned against
over-reliance on wholesale funding.20
Starting in 1996, Caja Madrid expanded aggressively, participating and aiding in the real estate
bubble. It also gained significant stakes in strategic segments of corporate Spain, thickening the
complex web of politics, finance, and business interests that characterize Spanish capitalism. The
apex of political intervention came when, in turn, Blesa was forced to step down by the head of the
regional government of Madrid, who proceeded to nominate a close political ally with no experience
in banking as the head of Caja Madrid. The resulting infighting within the conservative party led
to the appointment of another of its powerful members, the IMF’s former managing director and
ex-Minister of Finance, Rodrigo Rato, who ran the entity until its nationalization in the spring
of 2012 with the help of a board composed entirely of political appointees.
The other half of what was to become Bankia was Bancaja, the main caja in the region
of Valencia. Also an old institution, it was established in 1878 and it stayed local for most of
its history. Only around 1997, with the real estate bubble in its incipient stage, did it start a
breakneck expansion and for the first time tapped the international debt markets.
The politicization of Bancaja deepened after the Valencia regional government modified the
law regulating the Valencia’s cajas in 1997. This law essentially handed control of the caja
to the local government. In addition this law vested supervisory authority in a local entity,
the Valencian Institute of Finance, which was an arm of the regional government without any
supervisory authority at the time. This arrangement weakened the Bank of Spain, which retained
ultimate responsibility for financial stability.
Perhaps few anecdotes illustrate as well the connection between politics and finance than the
fact that the person appointed as president of Bancaja when the real estate bubble got going in
earnest was Jose Luis Olivas, the very same politician who, as Valencia’s finance minister, drafted
the l997 law regulating the local cajas (and who, in the meantime, had also been president of the
regional government). Olivas had no experience in banking.21
As was also the case with Caja Madrid, Bancaja became an additional instrument of the
region’s political aims in several areas such as housing, energy, telecommunications, and enter-
tainment.22 Over the next decade, Bancaja would participate in financing all of the major infras-
tructure projects of the Valencia government, including the Formula 1 in Valencia (at a cost of
20The “Acuerdo PP-CCOO sobre Caja Madrid” was signed by the secretary general of the PP in Madrid and atrade union representative and was made available by CC.OO. This agreement was published in the Spanish press(see “El PP modificara la Ley de Cajas de Madrid para cumplir el compromiso con CCOO” and “El contrato deBlesa,” both in Cinco Dıas, September 9, 1996) and it was openly discussed in the Spanish press (see “CCOO y elPP rubrican el acuerdo para que Blesa presida Cajamadrid,” El Paıs, September 7, 1996.)
21Olivas also became the president of Banco de Valencia, a publicly traded bank that was owned by Bancajaand that was also nationalized in the recent crisis.
22See “Lo que vale Bancaixa para el Consell,” El Paıs, Nov 4, 2003.
17

244 million Euros), the Castellon Airport (200 million Euros; a plane is yet to land there), Terra
Mitica (300 million Euros, an amusement park that entered bankruptcy in 2004), etc. As the
decade progressed, the link between politics, developers, and cajas tightened further. The burst-
ing of the real estate bubble has brought to light numerous corruption scandals in this otherwise
wealthy region of Spain.23
When problems started in 2009, the same political economy constraints that were behind the
fueling of the bubble informed the early stages of the response to the crisis. Caja Madrid and
Bancaja were merged into a large systemic institution, Bankia, dominated by the same political
interests that had run both entities during the bubble years and with the Bank of Spain’s consent.
Two bad Cajas do not make a good bank, and Bankia, after an IPO that perfectly illustrated
Spain’s institutional weaknesses, was effectively nationalized in the spring of 2012.
4. Ireland
After a deep recession and huge budget deficits in the late 1970s and early 1980s, Ireland intro-
duced important economic policy reforms in the second half of the 1980s. These reforms happened
in the benign demographic context already discussed (see figure 2.) These two factors contributed
to a sound recovery that delivered a real annual output growth that averaged more than 6 percent
from 1987 to 2000. By 1999, Ireland had an unemployment rate of 5.5 percent. By contrast,
Spain’s unemployment was still hovering above 15 percent (see figure 5, panel A.)
First, after the 1987 elections, a broad consensus emerged among the political parties for a
more constructive approach to policy. The Fine Gael, the main opposition party, committed itself
to supporting those reforms -in particular budgetary measures- that it considered were in the
national interest, especially if they helped in reducing tax rates. Second, the reforms in labor
market institutions -combined with persistent high unemployment- kept real wage growth below
that of Ireland’s major trading partners. Third, strategic sectors of the economy were liberalized,
such as air transport (Barrett, 1997) or the telecommunication system (Burnham, 2003), which
was, at the time, reputed to be the worst in Western Europe. Finally, the European Union
increased its generous transfers up to around 4 to 5 percent of Ireland’s output throughout the
1980s and early 1990s.
As already mentioned, by 2000, this exceptional growth spurt seemed to be coming to an
end. From the late 1980s, Ireland’s growth had been fueled by an increase in hours worked,
while productivity was growing at a rate similar to that of other European countries.24 This
was possible because in 1989 Ireland -due to high unemployment and a late baby boom- had the
lowest employment ratio in the OECD, 31 percent (Whelan, 2010). By the end of the millennium,
additional labor as a source of growth was essentially exhausted as unemployment had fallen to
23An absorbing description can be found in “Tierra de saqueo,” El Paıs, January 15, 2012.24Here productivity growth controls for the effect of multinationals that book a large fraction of their international
profits in Ireland to benefit from low taxation (Honohan and Walsh 2002, figure 13).
18

4 percent. Ireland was facing a significant slowdown in growth. And yet, the slowdown never
happened.
Instead, real interest rates dropped throughout the 1990s, reaching negative values in 1998,
where they stayed for most of the early years of the Euro’s existence (see figure 5, panel B.)
Not surprisingly, this led to an increase in valuations and a higher private investment in housing.
While many observers complained that a simple Taylor rule dictated that the nominal interest
rate in Ireland should have been several hundred basis points above where it was, this was no
longer feasible.
In the 1990s, Ireland combined a high incidence of owner occupation -driven by a low user
cost of housing, fiscal incentives, and regulation- with the smallest number of dwellings relative
to its population in the European Union (Somervile, 2007). Thus, the Celtic Tiger years started
with an abnormally low stock of housing. As is always the case with real estate bubbles, there
was a “fundamental” component to the Irish housing boom. Housing construction accelerated in
the 1990s, with house completions going from 19,000 in 1990 to 50,000 in 2000 and to 93,000 in
2006.25 Soon, Ireland was the country in the European Union with the highest share of housing
investment in gross capital formation and construction became the dominant sector driving growth
and employment. By 2007, 13.3 percent of all employment was in the construction sector (in the
United Kingdom and the U.S. that same number never went above 8 percent). Given that the labor
market was already tight in 1998, the housing boom put undue pressure on wages, which led to
a loss of competitiveness and large current account deficits. Irish financial institutions expanded
credit considerably, borrowing from international wholesale markets to fund the housing cycle
(figure 3, panel B). Instead of transitioning toward a lower, more sustainable rate of growth based
on productivity gains, Ireland went from growth based on increases in the employment ratio to a
massive speculative cycle.
Instead of reining in the bubble, governmental policy accentuated it through a procyclical fiscal
policy and regulatory and tax changes that made real estate development even more attractive.
That is, Irish policy makers, rather than leaning against the considerable forces of the credit
expansion, introduced measures that added to the virulence of the cycle, giving the Celtic Tiger
a few more years of intense growth.
First, fiscal policy became extremely procyclical. Government expenditures doubled in real
terms, with an annual growth rate of 6 percent between 1995 and 2007. Taxes were repeatedly
lowered during the boom, particularly tax incentives for the real estate sector (Honohan, 2010).
The income tax was cut several times, until Ireland reached a stunning income tax and employee
contribution average rate of 6.7 percent of gross wage earnings for a single-earning married couple
with two children (see figure 5, panel C). In the housing sector, stamp duties (a sales tax on homes)
were lowered in 2001, 2002, 2003, 2005, and 2007, while the ceiling on income tax deductibility
25The ratio of house prices to disposable income remained stable until the second half of the 1990s, when it grewfrom 7 to 12 in less than a decade (see Whelan, 2010 Figure 8).
19

of mortgage interest was increased in 2000, 2003, and 2008.26 Tax concessions were granted for
urban renewal, multi-story car parks, student accommodations, nursing homes, hotels, and holiday
camps. Finally, the special incentive tax rate for developers between 2000 and 2007 sought to free
up land for development by taxing the proceeds at 20 percent rather than at the higher 42 percent
that prevailed before, with an estimated loss of revenue of 800 million Euros (Byrne, 2012).
Second, several major legislative changes limited the regulatory oversight of financial insti-
tutions. The 2003 act that established the Central Bank and Financial Services Authority of
Ireland (CBFSAI) divided supervisory responsibilities between the newly created Irish Financial
Services Regulatory Authority (IFSRA) and the Central Bank of Ireland. This reorganization
contributed to the lax banking supervision that characterized this period and which forced the
(re)establishment of a single fully integrated regulatory institution in June 2009. Some informed
parties such as Bertie Ahern, Ireland’s former prime minister, have gone as far as identifying this
regulatory overhaul as the main culprit in the crisis (Brown, 2009).
This new regulatory framework perniciously interacted with a particular development in the
Irish banking sector: the emergence of Anglo Irish Bank. 27 If the Irish economy did well during
the early years of the Euro, Anglo did even better. Its balance sheet grew by a factor of 14 between
1999 and 2007, transforming it into a systemic risk for Ireland: At its peak Ango Irish’s balance
sheet was 57 percent of Irish GDP (figure 5, panel D). This phenomenal expansion was rooted in
a business model that emphasized speed in loan approval and a disregard of bank rules. It was
common that a customer would apply to Anglo for a loan of several million Euros for a property
development project on a Monday and receive approval by the end of the week (Carswell 2011).
Anglo’s strategy of relationship lending led to a double concentration in its loan portfolio: a few
large borrowers and, in a single sector, property development. Furthermore, Anglo’s minuscule
branch network meant that the loan expansion had to be funded by the international wholesale
markets.
But the real impact of Anglo Irish Bank was to change the whole Irish banking sector as other
banks reacted by loosening standards to match Anglo in profitability and avoid losing customers.
As the Nyberg report states, the problems at Anglo Irish were in plain sight for the regulators, but
bank management and boards could not recall a meaningful engagement on prudential issues with
the IRSRA. The failure of the Irish banking system was not related to financial innovations or
regulatory arbitrage but to a failure to follow up on supervisory oversight on credit concentration
risk and fragile funding (Whelan, 2010). It was low-quality governance.
26These measures added to an already overfriendly tax environment for housing. In general, Ireland has themost generous tax provisions for owner-occupied housing, “largely because it is the only OECD country thatallows households a tax deduction for mortgage interest payments at the same time as not taxing property values,capital gains or imputed rents” (Rae and van de Noord, 2006, p. 8). For a description of the main tax provisionsfor housing, see Rae and van de Noord (2006, box 1).
27For fascinating accounts of the rise and fall of Anglo Irish Bank, see Carswell (2011) and Lyons and Carey(2011). A more systematic survey of governance issues in the Irish banking sector is the “Nyberg report” (Nyberg,2011).
20

Why this tolerant governmental policy toward the boom? Given that the problem had been
diagnosed at the time by international organizations such as the IMF and the OECD and by
Irish economists (Honohan and Walsh, 2002), why did the government add more gas to the fire?
The evidence is suggestive that Irish policy makers, confronted with the end of the growth of the
1990s, preferred to ride and fuel the housing bubble and delay the inevitable slowdown. Voters,
as explained in the analytic framework section, faced a difficult filtering problem regarding the
true state of the Irish economy, which was steadily growing. The pro-real estate measures were
accompanied by a flow of political donations. From 1997 to 2007, 35 percent of disclosed donations
to Fianna Fail -the party in government- were from property developers and the construction
industry, by far the largest group in terms of donations (Byrne, 2012). Adding hotels (9 percent)
and banks and insurance companies (5 percent) shows that 49 percent of disclosed donations were
from parties that had a direct interest in the real estate bubble. The coalition of interest groups
and an electorate demanding easier access to housing was too powerful to resist.
Whether the close relationship between bankers, developers, and government was at the heart
of the crucial decision to provide a blanket bank guarantee on Sunday September 30, 2008 may
never be known (see Honohan, 2010, ch. 8), but, at the very least, it did not help the case against
it. The Irish government extended the guarantee to all existing and new debt -deposits, including
corporate and even interbank deposits, covered bonds, senior debt, and some subordinated debt.28
The decision went against the advice of Merrill Lynch, which rightly noted the previous Friday that
the guarantee would have a negative effect on the national rating.29 Prominent Irish economists
such as Patrick Honohan, the current Governor of the Central Bank of Ireland, were in favor of
some guarantee, though clearly not the overly broad one that was extended. While it is possible
that there is nothing more here than the rushed decision of an exhausted cabinet under stressful
conditions, it is true that as Byrne (2012, p. 202) points out, the “[k]ey political decisions were
insulated from critical debate because they were executed within a closed and cartelized system
which facilitated regulatory capture.”
In sum, the lax financial conditions allowed by the Euro undermined governmental policy,
which contributed to increase the virulence of the financial cycle and extended as far as bailing
out private creditors from their mistakes during the crisis, with enormous consequences for Irish
taxpayers’ welfare.
28In comparison, when the Spanish government launched its own guarantee program in December of that year,it only guaranteed new debt.
29The rating companies did not see it the same way. For instance, Fitch affirmed the AAA rating on Irelandfollowing the guarantee decision, stating, “This proactive measure should help buttress confidence in the Irishfinancial system and limit the risks of a deeper and more-prolonged-than necessary recession at a time of unusualstress in global banking markets” Bloomberg (2008).
21

5. Greece
5.1. Public Imbalances
In the decade after the accession to the Euro zone, Greece enjoyed growth rates of over 2 percent in
every year from 2000 to 2008, peaking at almost 6 percent in the pre-Olympic 2003. This growth
was higher than in the Euro area as a whole. Among the factors behind this strong performance
(apart from issues related to national accounting) were financial liberalization coupled with mem-
bership in the monetary union, strong export growth, and the fiscal stimulus associated with the
Olympic games. Mitsopoulos and Pelagidis (2012) add to these factors partial improvements in
the regulation of product markets, although these were concentrated in the telecommunications
sector;30 transportation and energy remain essentially regulated and non-competitive.
And yet, the imbalances building in the Greek economy were there for all to see. The current
account deficit, already at almost 8 percent in 2000, reached 15 percent in 2008 and was always
above 5 percent. Even after the recession, it was 9.8 percent in 2011. As a result of these large
deficits, net external debt rose from 42.7 percent of output in 2000 to 82.5 percent in 2009. This
current account deficit was not, as in Ireland and Spain, the counterpart of large inflows of money
into the private sector. The entirety of Greece’s net external debt is accounted for by the public
sector, which in 2009 had debt of over 100 percent of output (see figure 3, panels A and B).
Euro zone membership did little to alter these dynamics. An unsustainable situation had been
developing since 1980. During the 1980s and the 1990s, the yearly average government deficit
was over 8 percent of output. Similarly, the foreign international position of Greece was a long-
running problem, with average yearly current account deficits of over 10 percent in the 1990s and
the 2000s. In 2004, the Greek electorate gave a strong mandate to the New Democracy Party,
after 11 years of PASOK rule, to tackle the many problems afflicting the Greek economy, but the
results were disappointing at best.
Greece’s problem, more than any of the other peripheral countries, was that of an unreformed
economy. The report on governance in Greece by the OECD in June 2012 is a grim indictment
of the current state of Greek institutions. One of its conclusions was: “The combination of these
factors – a weak Centre of Government, legal formalism, the absence of basic data, the lack of
evidence-based policy making and an undeveloped HR strategy – has created an environment
conducive to rent seeking.” As Mitsopoulos and Pelagidis (2012, page 131) note, Greece can be
seen as a country with almost first-class per capita output, but second-class governance, institu-
tions, business environment, and corruption. The evidence of institutional deterioration in Greece
is widespread, from the decreasing reliability of government statistics, to the drop in corruption
rankings such as that supplied by Transparency International where Greece has dropped consis-
30Throughout this period Greece’s inflation rate was consistently above that of its trading partners, except forthe telecommunications price index (Mitsopoulos and Pelagides, 2012, figure 5.9), which reflects the deregulationin this sector relative to other sectors in the economy.
22

tently down to its current position (78).31 Given the obvious challenges that the Greek economy
has been facing, the lack of reform efforts is puzzling.
The answer is straightforward. For no country was the Euro as large a boon as for Greece.
In 1994, the interest on the 10-year bond had reached almost 22 percent, for a differential with
Germany of 1500 basis points. By June 2003, the combination of the global lending boom and
the perceived disappearance of currency and default risk meant that Greece was paying a mere
3.6 percent and the spread with the German bund was virtually nil.
The impact of this drop in the funding cost on the political economy of Greece was large.
Although the examples of arrested reforms are many, one of the clearest ones is the pension
system, a costly and inefficient system that faced considerable demographic challenges. Figure 6,
panel A, documents how Greece has a very high replacement ratio, at 95.7 percent, in fact the
largest among OECD members. Moreover, figure 6, panel B, shows how the Greek pension system
is on a path well beyond that of the other countries considered in this paper. The Greek political
class had been aware of the need for reform for more than two decades. The next section offers a
brief survey of the many failed attempts at accomplishing this reform.
5.2. The Political Economy of the Non-Reform of the Greek Pension System
Pension reform has been recognized as essential in Greece for more than two decades.32 As
Featherstone (2003, p. 8) writes, the “first serious moves for reform came in 1990-92 when Greek
public finances were in deep crisis and the EMU tests where being established. Fiscal laxity
imperiled Greece’s European membership.” Upon the election of Mitsotaki’s New Democracy
government in 1990, a renewed impulse for pension reform was initiated. Timid reforms such as
the Souflias Law (so named after the National Economy Minister, Georgios Souflias) left structural
problems untouched and the government promised a new round of reforms to tackle long-term
problems with the pension system. A second attempt under Souflias’ successor, Stefanos Manos,
was met with widespread opposition and once again many of the structural problems of the system
went unaddressed.
The electoral defeat of the Mitsotaki government in 1993 brought back Andreas Papandreou
and pension reform was shelved. The new prime minister, Costas Simitis, brought a renewed sense
of urgency to the issue after the election of 1996. Several proposals were floated during this period.
Perhaps the most far reaching of them was the one put forth in 2001 by Tassos Yiannitsis, the
minister of labor. This proposal contemplated several far-reaching measures: the retirement age
was to be raised; the required insurance period for a seniority pension increased; the replacement
rate reduced to 60 percent of reference earnings; the minimum pension raised but means-tested;
and the lower retirement age for mothers of younger children replaced. But in the face of massive
31The number of countries covered by Transparency International increased during the decade. Holding thesample constant, Greece would be on position 61 by 2010.
32This description of the several attempts at pension reform in Greece is taken from Featherstone (2005).
23

protests, the proposals were withdrawn. A new reform package, by the new minister Reppas,
characterized by creative accounting -no increase in the retirement age, while some would be able
to retire early (Featherstone, 2005) and little real reform- sailed through parliament in 2002. The
key issues identified by observers as problematic (sustainability, inequality, and fragmentation)
remained untouched, and the reform impetus started in 1992 was abandoned.
Thus, the year 2001 saw the defeat of the last effort at pension reform in Greece even when it
was considered to be “extremely urgent” (Borsh-Supan and Tinios, 2001). With a system that was
overly generous and on an unsustainable path, Greece’s partners “saw her convergence as being
partially dependent on pension reform” (Featherstone 2005). The European Union, rather than
imposing real budget constraints, saw itself at that point as simply “facilitating policy learning.”
At the time of the adoption of the Euro, the Greek pension system was seen as a key problem-
pensions consumed 12.1 percent of output and 52 percent of total social expenditure, versus 28
percent on average in the European Union. And yet, the poverty risk for pensioners was 2.3
times larger than for the general population, the largest by far in the European Union (where the
same figure is 1.2). Moreover, the system was extremely fragmented, with 236 separate funds in
2003 (O’Donnell and Tinios 2003). The fragmentation not only caused multiple inefficiencies and
duplications, but it also had a negative effect on labor mobility, as moving jobs often meant losing
previous entitlements. Finally, the system was extremely unequal, with large privileges handed
to the liberal professions and public-sector employees.
Once Greece had entered the Euro zone, Europe’s role changed. There was no more real reform
pressure and even fewer constraints on Greece’s decisions. Rather, the pressure from the accession
negotiations was replaced by “soft” pressure in the form of what the European bureaucracy
referred to as the “open method of coordination,” based on benchmarking, surveillance, and
sharing of best practices, assuming countries wanted to undertake reforms but were constrained
by lack of knowledge. In other words, once Greece had dealt with the challenges of the Euro
accession, and its budget was sustainable thanks to the large drop in interest payments, the
reform momentum was gone. The reform that was supposed to be the culmination of the entire
process started in 1992 was not taken up again until the recent crisis.
6. Portugal
After the long 15 years of economic growth that followed Portugal’s accession to the European
Union, the country’s economy started to stagnate around 2000. It is hard to come up with a
starker number to show this point than to note that, in 2012, Portugal’s output was lower than
in 2001. Just as a comparison, Spain’s output was still nearly 17 percent higher in 2012 than in
2001 (see figure 7, panel A) and in Ireland it was 19 percent higher. Only in one year, 2007, of
the entire decade 2001-2010 was Portugal able to grow more than 2 percent.
Researchers have pointed to different factors behind this poor macroeconomic performance but,
perhaps, the most salient is the disappointing performance of total factor productivity, which
24

according to the KLEMS data set (see O’Mahony and Timmer, 2009, for a description of the
data) fell in every year between 1999 and 2005. Restrictions to competition on many sectors, the
dominant position of large firms in several key industries, the difficulties for foreign management to
take over low-productivity Portuguese firms, and a dysfunctional labor market are prime suspects
in accounting for this drop in TFP.33
The government’s budget did not present a more positive picture. The headline deficit never
fell below 2.9 percent and the primary balance was constantly in deficit even after controlling
for the effects of the business cycle and one-off and temporary adjustments (Marinheiro, 2006,
updated 2011). The constant deficits led to a fast accumulation of public debt, from 51.2 percent
of output in 2001 to 92.4 percent in 2010.
The private sector responded to this stagnant outlook by reducing its saving rate and heavily
borrowing from abroad to finance current consumption (investment actually fell as a percentage
of national demand). This translated into large and persistent current account deficits (between
6 to 12 percent of output), an acute deterioration in the real exchange rate, and an increasingly
negative net asset position, most of which was held by banks (that had borrowed abroad to lend
to local households).
Observers might have predicted a decisive program of structural reforms as a response to the
previous figures. The behavior of both the public and the private sector was unsustainable in the
middle run, a point well-recognized by most economists at the time. However, little action was
taken and the parliamentary elections of 2002 and 2005 returned governments with little appetite
for real change. Instead of forcing a positive institutional evolution in Portugal, the Euro allowed
both the public and the private sector to postpone the day of reckoning.
In particular, the Euro brought historically low nominal interest rates. For example, the yield
on the 10-year government bond fell from 12 percent in 1995 to slightly less than 4 percent by
early 2005. Consequently, and while public debt was quickly growing, its service did not. In 2001,
the interest paid on the debt was 2.9 percent of GDP. Ten years later, in 2010, and with 41.2
additional points of debt, the interest paid was 3.0 percent of GDP (figure 7, panel B). A similar
situation occurred with private debt. A decade of heavy borrowing had been accomplished at a
minimal cost in terms of interest payments.
The fact is that there was no push for reform in Portugal because there was no “demand” for
it, even less a “supply,” and the Euro allowed the political-economic equilibrium to be sustained
in the middle run by the large capital inflows from the rest of the world even if a correction was
eventually unavoidable.
With respect to the demand side, there was no constituency for reform. Large firms were
reluctant to accept the liberalization of the markets for goods and services, entrenched managers
were unwilling to be substituted by newcomers, inside workers resisted attempts at introducing
33Portugal also had to face the entry into the European Union of countries such as Poland that specialized insimilar low- and middle-technology manufacturing goods and that had more attractive wage costs.
25

more efficient labor regulations, and many low-income households benefited from increased social
transfers (a rise of 4 points in GDP from 2000 to 2005) that actually succeeded in reducing
Portugal’s large income inequality and poverty rates. A broad coalition that cut across traditional
party lines supported the status quo. The inheritance from Portugal’s historical pattern of inward
development34 and the constraints created by the sudden change to democracy in 1974 made this
coalition more powerful than in other European countries and limited the scope of a more dynamic
export sector that could support reforms.35
From the supply side, the parliamentary system created by the 1976 constitution disincentivizes
cooperation among the main political agents and makes decisive reforms difficult to approve. First,
Portugal divides executive power between the president and the prime minister to a larger extent
than other European countries, lacking the virtues of either purer presidential systems, such as
France, or parliamentarian systems, such as Germany. The conflict between the two was clearly
seen when President Jorge Sampaio called for an early parliamentary election in 2005, an election
centered to a large extent on the economic policies that Portugal needed to reactivate its economy,
despite the fact that the government at the time held a solid parliamentary majority and that no
special event had occurred. Second, the electoral law, based on proportional representation, makes
it hard for a single party to win an outright majority and forces coalition governments. Third,
even during single- party governments, the power of the prime minister has been curtailed by the
need to placate different party factions. This has been particularly true during the governments
of the Social Democratic Party, which, despite what its name would suggest, is a big-tent party
that has included, over time, a large range of positions from the right to the center-left.
When the economic crisis hit Portugal in 2008, private capital flows suddenly stopped. Initially,
the financing requirements were met with TARGET liabilities and, after May 2011, with the funds
from the Economic Adjustment Programme agreed with the European Union and the IMF. The
Portuguese banks, deeply exposed to the sovereign debt of their own government, cut loans to
firms, and the feedback loop from lower economic activity into lower tax revenue and higher
sovereign risk left Portugal in a deep recession and with a banking sector in urgent need of
recapitalization. Even if exports have shown over the last few years some dynamism, the fixed
exchange rate has prevented a faster adjustment and the current account still presents a substantial
deficit that requires fresh external financing. At the same time, the institutional barriers we
identified above, including the lack of a broad coalition supporting reform and the constitutional
arrangements, have not been removed. If anything, 10 more years of no reforms may have solidified
them. Finally, the reduced degrees of freedom of the Portuguese government under the programme
34See Bermeo (2002) for details on the strong support of Portuguese voters for aggressive redistribution policies–for example, in comparison with the much milder preference in Spain; Costa, Lains, and Miranda (2011) for a dis-cussion of Portugal’s historical pattern of growth; Fishman (2005) for the long-run political-economic consequencesof the Revolution of Carnations of 1974, and Torres (2006), for the reluctance of important sectors of Portugueseelites to adopt the Euro, including the CDS-PP, the smaller of the two right-wing parties in Portugal.
35For instance, in comparison with Spain, Portugal liberalized its economy much less during the 1960s, and itwas less transformed by foreign capital and managerial know-how.
26
leaves it with little room to gather public support.
7. Germany
In the years after the introduction of the Euro, Germany undertook painful reforms of its welfare
state. Why did the Euro not have the same impact on Germany as on the peripheral countries,
namely, to buy time and postpone reforms? The answer is in figure 1: neither the Euro nor the
bubble changed financial conditions in Germany. The Euro meant the convergence of the other
countries’ interest rates toward “German” levels, but Germany’s rates were, obviously, already
at German levels. Thus, for Germany, the Euro had the implications described in section 2.1 -
tighter budgetary and fiscal constraints- and not the ones in section 2.2 -looser financial conditions.
Absent the leeway provided by the financial boom, politicians had no choice but to act.
Germany was, a decade ago, the “sick man” of Europe. After the years of fast growth that
followed reunification, the German economy slowed down. The average growth rate in the second
half of the 1990s and first years of the Euro was barely above 1 percent. As a result, unemployment
in Germany stayed stubbornly high and reached 11 percent in 2005 (figure 8, panel D.) In addition,
the demographic factors that were so helpful in Ireland and Spain were not present in Germany
(figure 2.) The share of the population between 15 and 64 years of age peaked in 1987 at slightly
above 70 percent and then declined steadily for the next two decades. The sorry state of the East
German economy and the crisis that followed unification only added to the challenges (Akerlof et
al., 1991) and thus, while Spain and Ireland were enjoying real estate booms, Germany’s prices
were actually declining (figure 8, panel C.)
This mediocre economic performance, the negative demographic trends, and the costs of the
reunification shock put the German welfare state under severe strain. The consequent higher social
security taxes and non-wage labor costs endangered German competitiveness. As documented
by figure 8, panel A, the combined social insurance contributions increased considerably as a
percentage of gross wages during the years preceding the introduction of the Euro. Compared with
other countries, Germany’s labor market policies were characterized by high expenditures and long
duration of programs. Since social insurance schemes were essentially paid by employees, a decline
in hours worked made the situation dire (Jacobi and Kluve, 2007). The unification exacerbated an
already problematic state of affairs. Indeed, between 1990 and 1998 social insurance contribution
rates increased from 35.5 percent to 42.1 percent; German unification accounted for about half of
that increase (Streeck and Trampusch, 2005, p. 176).
The constraints faced by German politicians were severe. First, wage rigidities led to unem-
ployment in times of economic crisis. According to Manow and Seils (2000), the independence
of the Bundesbank and the political fragmentation associated with federalism prevented the ex-
pansionary demand policies needed to sustain employment. This left the German welfare state
as the only mechanism of adjustment. Given the rigidities of the real wage bargaining system,
the increases in labor taxation needed to fund social schemes (see figure 8, panel A) translated
27

into higher labor costs and thus higher unemployment. Shortfalls in the social program funds
(pensions, health care, and unemployment) could only be met through recourse to the general
budget, but this conflicted with the constraints on fiscal policy already mentioned.
Reunification and the opening of Eastern Europe to German capital increased the pressure
on an overstretched welfare state and the arrival of the Euro tightened the constraints further.
But even with reunification, a unique catalyst for change, reforms were slow in coming.36 As
mentioned, delays in the reform of the welfare state meant that shortfalls in the different social
security schemes were increasingly covered by federal subsidies. For instance, federal subsidies
to the pension insurance fund were 18.5 percent of total fund revenues, but reached 26.4 percent
in 2003 (see figure 8, panel B). In 1997, Chancellor Helmut Kohl introduced reforms aimed at
stabilizing contribution rates by including the use of demographic factors to account for increases
in life expectancy. These measures were firmly opposed by the social democrats, who made large
gains in the 1998 election by campaigning on the repeal of these changes (which in fact they did
as they came to power). This reversal increased expenditures and the Schroder cabinet reacted
with a battery of measures aimed at increasing revenues. That is, Gerhard Schroder’s first term
was characterized by policies similar to those of other countries confronted with unsustainable
welfare states: further fiscal commitments to maintain benefits. But as Streeck and Trampusch
emphasize (2005, page 181): “[h]aving stretched the federal budget to its limits, the measures
of 1999 unintentionally forced the government to consider structural reform that went beyond
short-term fiscal remedies.”
Hence, Germany entered the Euro zone in a state of distress and the sustained drop in interest
rates the world experienced during those years did little to alleviate these long-run problems. The
European Central Bank was setting a monetary policy for a newly created Euro area that was too
tight for Germany. In addition, the European Central Bank was establishing its reputation and
was unwilling to concede to German politicians’ wishes.37 Unpopular reform was the only road
left open.
In particular, Schroder launched the Agenda 2010, the core of which was the Hartz I-IV reforms
that constitute the greatest overhaul of the German welfare state since World War II.38 The Hartz
reforms came only after much resistance -and a serious corruption scandal that finally forced the
issue on the sitting cabinet- and probably cost Schroder the 2005 election (Helms, 2007). The
36Hassel (2010) summarizes the prevalent view among German scholars on the dynamics of reform in Germany,“[t]he fall of the Berlin Wall was a catalyst for a major transformation of the German welfare state and labormarket. The adjustment process that started in the early 1990s was prompted by multi-layered challenges ofunification and the consequent institutional adaptation, the changing role of Germany in European MonetaryUnion, the recession prompted by unification, and the long-term structure problems of the Bismarckian welfarestate, which had been building up since the early 1970s.”
37For example, as Schroder put it, “As well as their obligation to ensure price stability, the ECB also has thetask of keeping growth in mind. And one can be sure that they also will do this” “German Slump Prompts Pushfor Lower Rates: Schroeder Urges the ECB To Focus on Growth, Too.” New York Times, June 30, 2001.
38For a view of welfare reforms in the context of risk-taking behavior on the part of policy makers, see Vis (2010),pages 127-130, for the Hartz reforms in particular as a gamble for resurrection.
28

reforms changed a core principle of the German welfare state: whereas the system prevailing prior
to these reforms was meant to preserve the social status of workers through retraining and public
work schemes, the new system emphasized instead quick and sustainable job placement.39 In
particular, job seekers were required to accept any offer of suitable work, where the definition of
suitable was considerably broadened.
Could German authorities have used the Euro to kick the can further down the road to avoid
these reforms? As we mentioned before, Germany did not see a drop in interest rates because rates
were already low. Second, the kernel of “truth” behind the bubbles in Ireland and Spain -favorable
demographics and strong growth in the late 1990s- was absent in Germany. Thus, welfare reform
was the sole option. The long-run effects of the Hartz reforms are still being debated (Jacobi and
Kluve, 2007). Since the early years of the Hartz welfare state were characterized by strong growth
in the periphery and in China -with which German exports have a high positive correlation- it
remains to be seen how the German welfare state progresses when these factors are no longer
active.
8. Conclusions
Observers expected the arrival of the Euro to lead to a modernization of the peripheral European
economies. Lacking monetary and fiscal autonomy, governments would have to adopt structural
reforms they had been previously refused to implement. In fact, as we have shown in this paper,
the steep financial boom derived from the drop in exchange rate risk and from the Euro wide
financial bubble meant that the budget constraints that these countries faced were loosened,
rather than tightened. Countries that could cheaply borrow delayed painful reforms. Moreover,
accountability was lost during the bubble as bad decisions have no negative short-run consequences
when rising asset prices hide all mistakes. As a result, the financial bubble fueled the deterioration
of governance and of the institutional arrangements on the Euro’s periphery. After laying out this
argument, we have studied the different ways politics and economics connected in the different
countries that enjoyed a financial boom, and we have contrasted them with the discipline that
the Euro imposed on a country that did not experience any boom.
Our work suggests several avenues for future research. First, while case studies are ideal
for providing a careful analysis of the mechanisms at play, a more systematic empirical analysis
of public and private governance in bubbles is necessary to test our theory. Second, as we are
currently doing in a work in progress, our hypothesis on signal extraction in bubbles needs to be
formalized so that the problem can be analyzed with more depth. Third, our theory suggests that
there may be differences between how damaging private and public bubbles are -private bubbles
appear to be more damaging, since they not only affect the sustainability of public finances, but
also damage governance in the private sector.
39See Bruttel and Sol (2006) for the historical evidence on the adoption of “work first” approaches.
29

A final issue concerns the broader applicability of our analysis. Are all situations where financ-
ing is plentiful and cheap conducive to the lowering of standards, the deterioration of governance
and the abandonment of economic reforms? If so, this situation is currently the one the United
States, at the zero lower bound, is facing, in which case our analysis suggests that a similar
deterioration public and private governance may occur.
30
References
[1] Acemoglu, Daron and James A. Robinson (2013). “Economics versus Politics: Pitfalls ofPolicy Advice.” Journal of Economic Perspectives, forthcoming.
[2] Akerlof, George A., Andrew K. Rose, Janet L. Yellen, and Helga Hessenius (1991). “EastGermany in from the Cold: The Economic Aftermath of Currency Union.” Brookings Paperson Economic Activity 1991(1), 1-106.
[3] Alesina, Alberto and Allan Drazen (1991). “Why Are Stabilizations Delayed?” AmericanEconomic Review 81(5), 1170-1188.
[4] Barrett, Sean D. (1997). “The Implications of the Ireland-UK Airline Deregulation for an EUInternal Market.” Journal of Air Transport Management 3(2), 67-73.
[5] Barro, Robert (1973). “The Control of Politicians: An Economic Model.” Public Choice 14,19-42.
[6] Battaglini, Marco and Stephen Coate (2008). “A Dynamic Theory of Public Spending, Tax-ation and Debt.” American Economic Review 98, 201-36.
[7] Bean, Charles (1998). “Monetary Policy under EMU.” Oxford Review of Economic Policy14(3), 41-53.
[8] Beltran, Alejandro, Michele Boldrin, Nicolas Borges, Joao Castello-Branco, J. Ignacio Conde-Ruız, Enrique Garcıa, Luıs Garicano and Pablo Vazquez, A Growth Agenda for Spain.Madrid, McKinsey and Co and FEDEA, 2010.
[9] Bentolila, Samuel and Gilles Saint-Paul (2000). “Will EMU Increase Eurosclerosis?” CEPRDiscussion Papers 2423.
[10] Bermeo, Nancy (2002). “Portuguese Democracy in Comparative Perspective.” PortugueseStudies Review 10(1), 1-11 2002
[11] Berndt, Ernst and Charles Hulten (2007). Hard-to-Measure Goods and Services: Essays inHonor of Zvi Griliches. University of Chicago Press, Chicago.
[12] Bernanke, Ben S., Mark Gertler, and Simon Gilchrist (1999). “The Financial Accelerator in aQuantitative Business Cycle Framework.” John B. Taylor and Mike Woodford (ed.) Handbookof Macroeconomics volume 1, chapter 21, 1341-1393, Elsevier.
[13] Blanchard, Olivier J., Rudiger Dornbusch, and Richard Layard (1986). Restoring Europe’sProsperity, Cambridge University Press, Cambridge.
[14] Bloomberg (2008). “Ireland Guarantees Bank Deposit, Debt for Two Years.” September 30.
[15] Bonhomme, Stephane and Laura Hospido (2012). “The Cycle of Earnings Inequality: Evi-dence from Spanish Social Security Data.” Banco de Espana Working Papers 1225.
[16] Borsh-Supan, Axel and Platon Tinios (2001). “The Greek Pension System: Strategic Frame-work for Reform.” in Greece’s Economic Performance and Prospects, Ralph C. Bryant,Nicholas C. Garganas, and George S. Tavlas, editors, Bank of Greece and Brookings In-stitution, Athens.
31

[17] Bover, Olimpia (2011). “Efecto de la Rentabilidad de la Vivienda como Inversion sobre lasDecisiones de Compra: Evidencia Empırica a partir de la EFF.” Bank of Spain, BoletinEconomico, May 2011.
[18] Brown, John Murray (2009). “Ahern Admits to Part in Irish Crisis.” Financial Times, Oc-tober 15.
[19] Bruttel, Oliver and Els Sol (2006). “Work First as a European Model? Evidence from Ger-many and the Netherlands.” Policy and Politics 34 (1), 69-89.
[20] Burnham, James B. (2003). “Why Ireland Boomed.” The Independent Review VII(4), Spring,537-556.
[21] Byrne, Elaine A. (2012). Political Corruption in Ireland, 1922-2012: A Crooked Harp?Manchester University Press, Manchester.
[22] Calvo Bernardino, Antonio and Irene Martın de Vidales (2010). “La Expansion de la Red deOficinas de las Cajas de Ahorro Espanolas: un Analisis desde la Pespectiva de la Provincia”(2010). Boletın Economico de ICE N. 2987, April. 16-30.
[23] Cappe, Olivier, Eric Moulines, and Tobias Ryden (2010). Inference in Hidden Markov Models.Springer.
[24] Carswell, Simon (2011). Anglo Republic: Inside the Bank That Broke Ireland. Penguin Books,London.
[25] Casella, Alessandra, and Barry Eichengreen (1996). “Can Foreign Aid Accelerate Stabiliza-tion?” Economic Journal 106, 605–619.
[26] Chari, Varadarajan V. and Patrick J. Kehoe (2008). “Time Inconsistency and Free-Riding ina Monetary Union.” Journal of Money, Credit and Banking 40(7), 1329-1356.
[27] Costa, Leonor Freire, Pedro Lains, and Susana Munch Miranda (2011). Historia Economicae Portugal, 1143-2010. Esfera dos Livros, Lisbon
[28] Cunat, Vicente and Luis Garicano (2009). “Did Good Cajas Extend Bad Loans? The Role ofGovernance and Human Capital in Cajas’ Portfolio Decisions.” Mimeo, FEDEA Annual Con-ference at Bank of Spain, 2009. http://www.crisis09.es/monografia2009/cajas.html.
[29] Cunat, Vicente and Luis Garicano (2010). “¿Concedieron las cajas “buenas” creditos “ma-los”? Gobierno corporativo, capital humano y carteras de creditos.”. in Samuel Bentolila,Michele Boldrin, Javier Dıaz-Gimenez and Juan J. Dolado (ed.) La Crisis de la EconomiaEspanola, Fedea Monograph, http://www.crisis09.es/crisis.html.
[30] Danthine, Jean-Pierre and Jennifer Hunt (1994). “Wage Bargaining Structure, Employmentand Economic Integration.” Economic Journal 104, 528-41.
[31] Drazen, Allan (2000). Political Economy in Macroeconomics. Princeton University Press,Princeton.
[32] Featherstone, Kevin (2003). “The Politics of Pension Reform in Greece: Modernization De-feated by Fridlock.” Mimeo, London School of Economics.
32

[33] Featherstone, Kevin (2005). “‘Soft’ Co-ordination Meets ‘Hard’ Politics: The European Unionand Pension Reform in Greece.” Journal of European Public Policy 12(4), 733 –750.
[34] Ferejohn, John (1973). “Incumbent Performance and Electoral Control.” Public Choice 50,5-25.
[35] Fernandez-Villaverde, Jesus, Juan F. Rubio-Ramırez, Thomas Sargent, and Mark Watson(2007). “A, B, C, (and D)s for Understanding VARs.” American Economic Review 97, 1021-1026.
[36] Fernandez-Villaverde, Jesus and Juan F. Rubio-Ramırez, (2009). “Una Propuesta de PolıticaFiscal ante la Crisis.” In La Crisis de la Economıa Espanola: Lecciones y Propuestas, FEDEA,Madrid.
[37] Fishman, Robert M. (2005). “Legacies of Democratizing Reform and Revolution: Portugaland Spain Compared.” Instituto de Ciencias Sociais, Lisbon.
[38] Forbes, Kristin J. and Francis E. Warnock (2012). “Debt- and Equity-Led Capital FlowEpisodes.” NBER Working Papers 18329.
[39] Gelb, Alan H. (1988). Oil Windfalls: Blessing Or Curse? Oxford University Press and WorldBank Research Publications, Washington DC.
[40] Gonzalez, Libertad and Francesc Ortega (2009). “Immigration and Housing Booms: Evidencefrom Spain.” CREAM, UCL, Discussion Paper, CDP No 19/09.
[41] Hassel, Anke. 2010. “Twenty Years after German Unification: The Restructuring of theGerman Welfare and Employment Regime.” German Politics & Society 28, no. 2: 102-15.
[42] Helms, Ludger (2007). “The German Federal Election, September 2005,” Electoral Studies26 (1), 196-231.
[43] Honohan, Patrick (2010). “The Irish Banking Crisis, Regulatory and Financial StabilityPolicy, 2003-2008: A Report to the Minister for Finance by the Governor of the CentralBank.” http://www.bankinginquiry.gov.ie.
[44] Honohan, Patrick and Brendan Walsh (2002). “Catching up with the Leaders: The IrishHare.” Brookings Papers on Economic Activity 33(1), 1-78.
[45] IMF (2004). “Ireland: Selected Issues.” IMF Country Report, no. 04.349, November.
[46] IMF (2006a). “Spain: Financial Sector Assessment Program - Technical Note - HousingPrices, Household Debt and Financial Stability.” IMF Country Report, no. 06.210, June.
[47] IMF (2006b). “Spain: Financial Sector Assessment Program - Technical Note - Regulation,Supervision, and Governance of teh Spanish Cajas.” IMF Country Report, no. 06.215, June.
[48] Jacobi, Lena and Jochen Kluve (2007). “Before and After the Hartz Reforms: The Perfor-mance of Active Labour Market Policy in Germany.” Journal of Labor Market Research 40,45-64.
[49] James, Harold (2012). Making the European Monetary Union. Belknap Press, Cambridge.
33

[50] Lane, Philip (2012). “The European Sovereign Debt Crisis.” Journal of Economic Perspec-tives 26(3), 49-68.
[51] Lane, Philip and Peter McQuade (2012). “Domestic Credit Growth and International CapitalFlows.” Mimeo, Trinity College Dublin.
[52] Lyons, Tom and Brian Carey (2011). The FitzPatrick Tapes. Penguin Books, London.
[53] Manow, Philip and Eric Seils (2000). “The Employment Crisis of the German Welfare State.”West European Politics 23(2), 137-160.
[54] Marinheiro, Carlos (2006). “The Sustainability of Portuguese Fiscal Policyfrom a Historical Perspective.” Empirica 33(2), 155-179 (updated in 2011:http://www4.fe.uc.pt/carlosm/research/pdf/Data-CMarinheiro2006-Update2011.xlsx).
[55] Mitsopoulos, Michael and Theodore Pelagidis (2012). Understanding the Crisis in Greece,Revised Edition. Palgrave MacMillan, London.
[56] Nyberg, Peter (2011). “Misjudging Risk: Causes of the Systemic Banking Crisis in Ireland,”available at http://www.bankinginquiry.gov.ie/Documents.
[57] North, Douglass (1990). Institutions, Institutional Change, and Economic Performance. Cam-bridge University Press, Cambridge.
[58] O’Donnell, Owen and Platon Tinios (2003). “The Politics of Pension Reform: Lessons fromPublic Attitudes in Greece.” Political Studies 51(2), 262–81.
[59] OECD (2006). Economic Policy Reforms: Going for Growth 2006: Progress in Respondingto the 2005 Policy Priorities - Ireland Country Note, Ch. 2.
[60] OECD (2009), Pensions at a Glance 2009: Retirement-Income Systems in OECD Countries,OECD Publishing.doi: 10.1787/pension glance-2009-en
[61] OECD (2011). “Long-Term Projections of Public Pension Expenditure.” in Pensions at aGlance 2011: Retirement-income Systems in OECD and G20 Countries, OECD Publishing.http://dx.doi.org/10.1787/pension glance-2011-32-en.
[62] O’Mahony, Mary and Marcel P. Timmer (2009). “Output, Input and Productivity Measuresat the Industry Level: the EU KLEMS Database.” Economic Journal 119, F374–F403.
[63] Rae, David and Paul van de Noord (2006). “Ireland’s Housing Boom: What Has Driven Itand Have Prices Overshot?” OECD Economics Department.
[64] Rajan, Raghuram (2011). Fault Lines: How Hidden Fractures Still Threaten the World Econ-omy. Princeton University Press, Princeton.
[65] Reinhart, Carmen M. and Kenneth Rogoff (2009). This Time Is Different: Eight Centuriesof Financial Folly. Princeton University Press, Princeton.
[66] Rodrik, Dani (1996). “Understanding Economic Policy Reform.” Journal of Economic Liter-ature 34(1), 9–41.
[67] Sachs, Jeffrey D., and Andrew Warner (1995). “Economic Reform and the Process of GlobalIntegration.” Brookings Papers on Economic Activity 1995,1, 1–95.
34

[68] Somerville, R. A. (2007). “Housing Tenure in Ireland.” Economic and Social Review 38(1),107-134.
[69] Svensson, Jakob (1999). “Foreign Aid and Rent-Seeking.” Journal of International Economics51, 437–461.
[70] Streeck, Wolgang and Christine Trampusch (2005). “Economic Reform and the PoliticalEconomy of the German Welfare State.” German Politics 14 (2), 176.
[71] Tornell, Aaron and Philip R. Lane (1999). “The Voracity Effect.” American Economic Review89, 22-46.
[72] Torres, Francisco (2006). “A Convergencia Monetaria: Portugal e a Uniao Europeia.” Work-ing Papers de Economia 39, Departamento de Economia, Gestao e Engenharia Industrial,Universidade de Aveiro.
[73] Vamvakidis, Athanasios (2007). “External Debt and Economic Reform: Does a Pain RelieverDelay the Necessary Treatment.” IMF Working Paper No. 07/50.
[74] Vis, Barbara (2010). Politics of Risk-taking: Welfare State Reform in Advanced Democracies.Amsterdam University Press, Amsterdam.
[75] Whelan, Karl (2010). “Policy Lessons from Ireland’s Latest Depression.” Economic and SocialReview 41(2), 225-254.
[76] Yared, Pierre (2010). “Politicians, Taxes and Debt.” Review of Economic Studies 77, 806–840.
35

Figure 1: Convergence in yields
Government bonds, 10-year yields. Monthly: 1993M01-2005M12. Source: Eurostat
0.00
5.00
10.00
15.00
20.00
25.00
30.00
19
93
M0
1
19
93
M0
5
19
93
M0
9
19
94
M0
1
19
94
M0
5
19
94
M0
9
19
95
M0
1
19
95
M0
5
19
95
M0
9
19
96
M0
1
19
96
M0
5
19
96
M0
9
19
97
M0
1
19
97
M0
5
19
97
M0
9
19
98
M0
1
19
98
M0
5
19
98
M0
9
19
99
M0
1
19
99
M0
5
19
99
M0
9
20
00
M0
1
20
00
M0
5
20
00
M0
9
20
01
M0
1
20
01
M0
5
20
01
M0
9
20
02
M0
1
20
02
M0
5
20
02
M0
9
20
03
M0
1
20
03
M0
5
20
03
M0
9
20
04
M0
1
20
04
M0
5
20
04
M0
9
20
05
M0
1
20
05
M0
5
20
05
M0
9
Germany Ireland Greece Spain Portugal
36

Figure 2: Demographic factors
Percentage of the population between 15 and 64 years of age. Annual data: 1956-2011. Source:OECD
55
60
65
70
19
56
19
58
19
60
19
62
19
64
19
66
19
68
19
70
19
72
19
74
19
76
19
78
19
80
19
82
19
84
19
86
19
88
19
90
19
92
19
94
19
96
19
98
20
00
20
02
20
04
20
06
20
08
20
10
France Germany Ireland Spain
37

Figure 3: External indebtness and private credit
Panel A: Net International Investment Position (NIIP) as a percentage of GDP. Source: Eurostat.Panel B: Loans to other residents granted by monetary financial institutions as a percentage of(annualized) GDP. Quarterly: 2000Q1-2010Q4. Smoothed with an MA-4. Source: Eurostat
-120
-100
-80
-60
-40
-20
0
20
40
60
Panel A
2000 2005 2010
Ireland Greece Spain Portugal France Italy
Germany
0
50
100
150
200
250
20
00
Q1
20
00
Q4
20
01
Q3
20
02
Q2
20
03
Q1
20
03
Q4
20
04
Q3
20
05
Q2
20
06
Q1
20
06
Q4
20
07
Q3
20
08
Q2
20
09
Q1
20
09
Q4
20
10
Q3
Panel B
Germany Ireland Greece
Spain Portugal
38

Figure 4: Spain
Panel A: Income tax revenues and value-added tax (VAT) revenues in billions of euros. Monthly: 1996M01-2012M11; smoothed with an MA-12. Source: Ministerio de Hacienda y AA.PP., Agencia Tributaria. Panel B:TFP (value-added-based) growth, Total Manufacturing, 1995 = 100 for Germany and Spain. Source: EUKLEMSdatabase, November 2009 release, March 2011 update. Panel C: Loans to the private sector by banks and cajas asa fraction of loans to the private sector by credit institutions. Monthly: January 1962 to November 2010. Source:Bank of Spain. Panel D: Credit to other resident sectors by credit institutions as a fraction of GDP. Quarterly:1974Q4 to 2010Q2. Source: Bank of Spain and INE.
0
1
2
3
4
5
6
7
1/1
/19
96
1/1
/19
97
1/1
/19
98
1/1
/19
99
1/1
/20
00
1/1
/20
01
1/1
/20
02
1/1
/20
03
1/1
/20
04
1/1
/20
05
1/1
/20
06
1/1
/20
07
1/1
/20
08
1/1
/20
09
1/1
/20
10
1/1
/20
11
1/1
/20
12
Panel A: Tax revenues
Income Tax VAT
0
0.2
0.4
0.6
0.8
1
EN
E 1
96
2
Fe
b-6
4
Ma
r-6
6
AB
R 1
96
8
Ma
y-7
0
Jun
-72
Jul-
74
AG
O 1
97
6
Se
p-7
8
Oct
-80
No
v-8
2
DIC
19
84
EN
E 1
98
7
Fe
b-8
9
Ma
r-9
1
AB
R 1
99
3
Ma
y-9
5
Jun
-97
Jul-
99
AG
O 2
00
1
Se
p-0
3
Oct
-05
No
v-0
7
DIC
20
09
Panel C: The growth of the cajas
Banks Cajas
0
0.2
0.4
0.6
0.8
1
1.2
1.4
1.6
1.8
2
DIC
19
74
DIC
19
76
DIC
19
78
DIC
19
80
DIC
19
82
DIC
19
84
DIC
19
86
DIC
19
88
DIC
19
90
DIC
19
92
DIC
19
94
DIC
19
96
DIC
19
98
DIC
20
00
DIC
20
02
DIC
20
04
DIC
20
06
DIC
20
08
Panel D: Credit as a fraction of GDP
80.0
90.0
100.0
110.0
120.0
130.0
140.0
19
91
19
92
19
93
19
94
19
95
19
96
19
97
19
98
19
99
20
00
20
01
20
02
20
03
20
04
20
05
20
06
20
07
Panel B: TFP - Manufacturing
Germany Spain Ireland
39

Figure 5: Ireland
Panel A: Unemployment rates in Ireland and Spain. Annual: 1980-2012. Source: IMF. Panel B: Real interestrate. Source: International Monetary Fund, International Financial Statistics and data files using World Bankdata on the GDP deflator. Panel C: Income tax plus employee and employer contributions less cash benefits,married couple at 100 percent of average earnings. Tax burden as a percentage of labor costs, one-earner marriedcouple with two children. Source: OECD. Panel D: Total Assets of Anglo Irish Bank as a percentage of Irish GDP.Source: Anglo Irish Bank Annual Reports and IMF.
0
10
20
30
40
50
60
19
99
20
00
20
01
20
02
20
03
20
04
20
05
20
06
20
07
20
08
20
09
Panel D: The rise of Anglo Irish Bank
-4
-2
0
2
4
6
8
10
12
19
85
19
87
19
89
19
91
19
93
19
95
19
97
19
99
20
01
20
03
20
05
Panel B: Real interest rates
0
5
10
15
20
25
30
19
80
19
82
19
84
19
86
19
88
19
90
19
92
19
94
19
96
19
98
20
00
20
02
20
04
20
06
20
08
20
10
20
12
Panel A: Unemployment rates
Ireland Spain
0.0
10.0
20.0
30.0
40.0
2000 2003 2004 2005 2006 2007 2008 2009 2010 2011
Panel C: Tax rates
Ireland Germany Spain
40

Figure 6: Greece
Panel A: Gross pension replacement rates: average earners. Source: OECD, Pensions at a Glance, 2011. Panel B:Projected public pension expenditure as a share of GDP. Source: OECD.
0.0
5.0
10.0
15.0
20.0
25.0
20
07
20
10
20
15
20
20
20
25
20
30
20
35
20
40
20
45
20
50
20
55
20
60
Panel B: The need for Greek pension reform
Greece Portugal Spain
Germany Ireland
0.0
10.0
20.0
30.0
40.0
50.0
60.0
70.0
80.0
90.0
100.0
Greece Spain Portugal Germany Ireland OECD 34
Panel A: Pension replacement rates
41
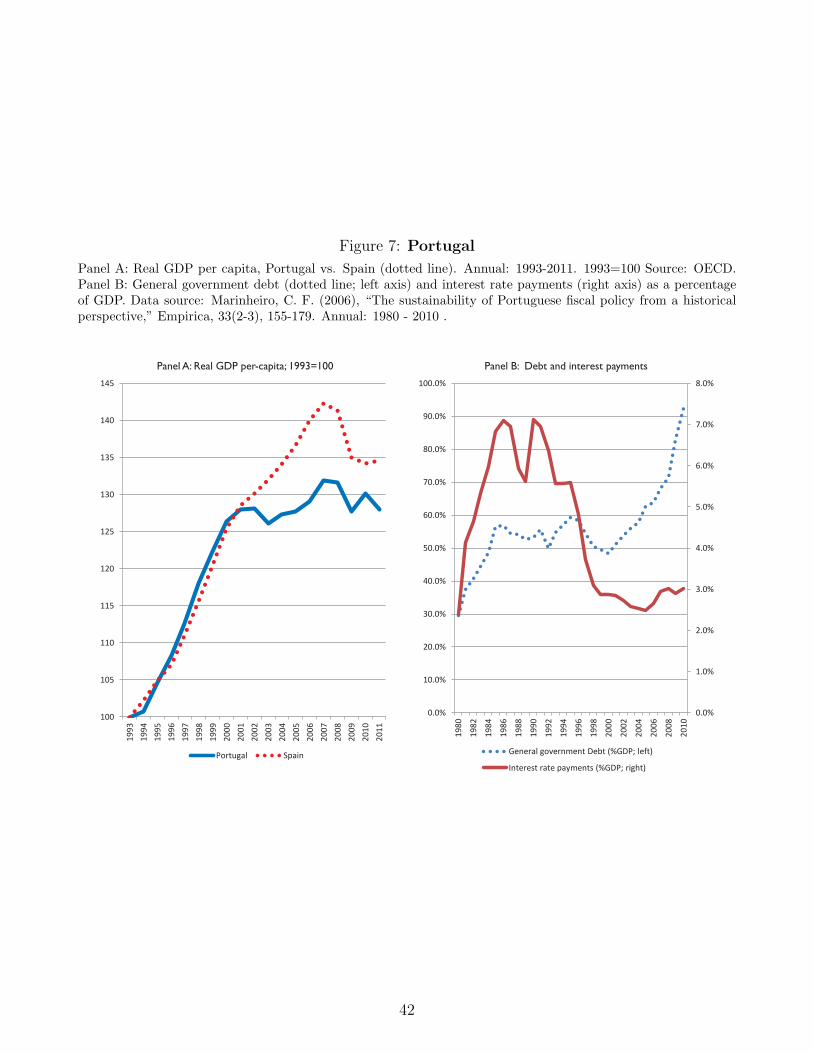
Figure 7: Portugal
Panel A: Real GDP per capita, Portugal vs. Spain (dotted line). Annual: 1993-2011. 1993=100 Source: OECD.Panel B: General government debt (dotted line; left axis) and interest rate payments (right axis) as a percentageof GDP. Data source: Marinheiro, C. F. (2006), “The sustainability of Portuguese fiscal policy from a historicalperspective,” Empirica, 33(2-3), 155-179. Annual: 1980 - 2010 .
0.0%
1.0%
2.0%
3.0%
4.0%
5.0%
6.0%
7.0%
8.0%
0.0%
10.0%
20.0%
30.0%
40.0%
50.0%
60.0%
70.0%
80.0%
90.0%
100.0%
19
80
19
82
19
84
19
86
19
88
19
90
19
92
19
94
19
96
19
98
20
00
20
02
20
04
20
06
20
08
20
10
Panel B: Debt and interest payments
General government Debt (%GDP; left)
Interest rate payments (%GDP; right)
100
105
110
115
120
125
130
135
140
145
19
93
19
94
19
95
19
96
19
97
19
98
19
99
20
00
20
01
20
02
20
03
20
04
20
05
20
06
20
07
20
08
20
09
20
10
20
11
Panel A: Real GDP per-capita; 1993=100
Portugal Spain
42
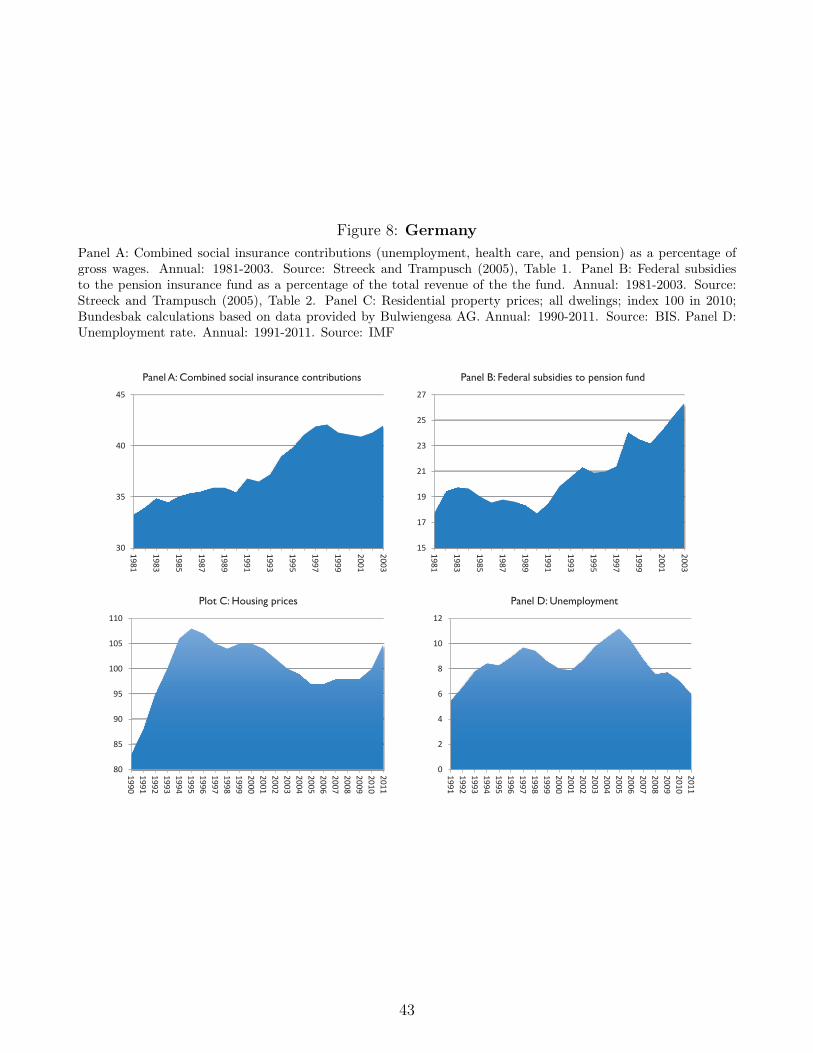
Figure 8: Germany
Panel A: Combined social insurance contributions (unemployment, health care, and pension) as a percentage ofgross wages. Annual: 1981-2003. Source: Streeck and Trampusch (2005), Table 1. Panel B: Federal subsidiesto the pension insurance fund as a percentage of the total revenue of the the fund. Annual: 1981-2003. Source:Streeck and Trampusch (2005), Table 2. Panel C: Residential property prices; all dwelings; index 100 in 2010;Bundesbak calculations based on data provided by Bulwiengesa AG. Annual: 1990-2011. Source: BIS. Panel D:Unemployment rate. Annual: 1991-2011. Source: IMF
30
35
40
45
19
81
19
83
19
85
19
87
19
89
19
91
19
93
19
95
19
97
19
99
20
01
20
03
Panel A: Combined social insurance contributions
15
17
19
21
23
25
27
19
81
19
83
19
85
19
87
19
89
19
91
19
93
19
95
19
97
19
99
20
01
20
03
Panel B: Federal subsidies to pension fund
80
85
90
95
100
105
110
19
90
19
91
19
92
19
93
19
94
19
95
19
96
19
97
19
98
19
99
20
00
20
01
20
02
20
03
20
04
20
05
20
06
20
07
20
08
20
09
20
10
20
11
Plot C: Housing prices
0
2
4
6
8
10
12
19
91
19
92
19
93
19
94
19
95
19
96
19
97
19
98
19
99
20
00
20
01
20
02
20
03
20
04
20
05
20
06
20
07
20
08
20
09
20
10
20
11
Panel D: Unemployment
43