plug loads - mathematics awareness month
TRANSCRIPT

Plug LoadsStudents explore ways to save energy at school by investigating electricity consumption of electrical devices and determining ways to reduce that consumption.
Grade Levels:n Intermediaten SecondarySubject Areas:n Sciencen Social Studiesn Mathn Language Artsn Technology
2012-2013

2 Plug Loads
Teacher Advisory Board
Printed on Recycled Paper
NEED Mission StatementThe mission of The NEED Project is to promote an energy conscious and educated society by creating effective networks of students, educators, business, government and community leaders to design and deliver objective, multi-sided energy education programs.
Teacher Advisory Board StatementIn support of NEED, the national Teacher Advisory Board (TAB) is dedicated to developing and promoting standards-based energy curriculum and training.
Permission to CopyNEED materials may be reproduced for non-commercial educational purposes.
Energy Data Used in NEED MaterialsNEED believes in providing the most recently reported energy data available to our teachers and students. Most statistics and data are derived from the U.S. Energy Information Administration’s Annual Energy Review that is published in June of each year. Working in partnership with EIA, NEED includes easy to understand data in our curriculum materials. To do further research, visit the EIA web site at www.eia.gov. EIA’s Energy Kids site has great lessons and activities for students at www.eia.gov/kids.
1.800.875.5029www.NEED.org
© 2012
Shelly BaumannRockford, MI
Constance BeattyKankakee, IL
Sara BrownellCanyon Country, CA
Loree BurroughsMerced, CA
Amy ConstantRaleigh, NC
Joanne CoonsClifton Park, NY
Nina CorleyGalveston, TX
Regina DonourWhitesburg, KY
Linda FonnerNew Martinsville, WV
Samantha Forbes Vienna, VA
Viola HenryThaxton, VA
Robert HodashBakersfield, CA
DaNel HoganKuna, ID
Greg HolmanParadise, CA
Linda HuttonKitty Hawk, NC
Matthew InmanSpokane, Washington
Michelle LambBuffalo Grove, IL
Barbara LazarAlbuquerque, NM
Robert LazarAlbuquerque, NM
Leslie LivelyReader, WV
Mollie MukhamedovPort St. Lucie, FL
Don PruettSumner, WA
Josh RubinPalo Alto, CA
Joanne SpazianoCranston, RI
Gina SpencerVirginia Beach, VA
Tom SpencerChesapeake, VA
Joanne Trombley West Chester, PA
Jim WilkieLong Beach, CA
Carolyn WuestPensacola, FL
Wayne YonkelowitzFayetteville, WV
© 2012 The NEED Project P.O. Box 10101, Manassas, VA 20108 1.800.875.5029 www.NEED.org 3
Table of Contents �Correlations to National Science Education Standards 4
� Introduction to Plug Loads 6
�Using the Plug Load Spreadsheet 7
�Phantom Loads 9
�Conducting the Activities 11
�Extension Activities 13
�Home Extension 15
�Glossary 16
�Plug Load Spreadsheet Samples 17
�Evaluation Form 19
Plug Loads
4 Plug Loads
Content Standard A | Science aS inquiry � Understandings about Scientific Inquiry
� Different kinds of questions suggest different kinds of scientific investigations. Some investigations involve observing and describing objects, organisms, or events; some involve collecting specimens; some involve experiments; some involve seeking more information; some involve discovery of new objects and phenomena; and some involve making models.
� Current scientific knowledge and understanding guide scientific investigations. Different scientific domains employ different methods, core theories, and standards to advance scientific knowledge and understanding.
� Mathematics is important in all aspects of scientific inquiry.
� Technology used to gather data enhances accuracy and allows scientists to analyze and quantify results of investigations.
� Scientific explanations emphasize evidence, have logically consistent arguments, and use scientific principles, models, and theories. The scientific community accepts and uses such explanations until displaced by better scientific ones. When such displacement occurs, science advances.
Content Standard B | PhySical Science � Transfer of Energy
� Electrical circuits provide a means of transferring electrical energy when heat, light, sound, and chemical changes are produced.
Content Standard E | Science and Technology � Understandings about Science and Technology
� Scientific inquiry and technological design have similarities and differences. Scientists propose explanations for questions about the natural world, and engineers propose solutions relating to human problems, needs, and aspirations. Technological solutions are temporary; technologies exist within nature and so they cannot contravene physical or biological principles; technological solutions have side effects; and technologies have costs, carry risks, and provide benefits.
� Science and technology are reciprocal. Science helps drive technology, as it addresses questions that demand more sophisticated instruments and provides principles for better instrumentation and technique. Technology is essential to science, because it provides instruments and techniques that enable observations of objects and phenomena that are otherwise unobservable due to factors such as quantity, distance, location, size, and speed. Technology also provides tools for investigations, inquiry, and analysis.
� Perfectly designed solutions do not exist. All technological solutions have trade-offs, such as safety, cost, efficiency, and appearance. Engineers often build in back-up systems to provide safety. Risk is part of living in a highly technological world. Reducing risk often results in new technology.
� Technological designs have constraints. Some constraints are unavoidable, for example, properties of materials, or effects of weather and friction; other constraints limit choices in the design, for example, environmental protection, human safety, and aesthetics.
� Technological solutions have intended benefits and unintended consequences. Some consequences can be predicted, others cannot.
Content Standard F | Science in PerSonal and Social PerSPecTiveS � Populations, Resources, and Environments
� Causes of environmental degradation and resource depletion vary from region to region and from country to country.
� Science and Technology in Society � Societal challenges often inspire questions for scientific research, and social priorities often influence research priorities through the availability of funding for research.
� Technology influences society through its products and processes. Technology influences the quality of life and the ways people act and interact. Technological changes are often accompanied by social, political, and economic changes that can be beneficial or detrimental to individuals and to society. Social needs, attitudes, and values influence the direction of technological development.
� Science and technology have advanced through contributions of many different people, in different cultures, at different times in history. Science and technology have contributed enormously to economic growth and productivity among societies and groups within societies.
� Science cannot answer all questions and technology cannot solve all human problems or meet all human needs. Students should understand the difference between scientific and other questions. They should appreciate what science and technology can reasonably contribute to society and what they cannot do. For example, new technologies often will decrease some risks and increase others.
Correlations to National Science Education Standards: Grades 5-8This book has been correlated to National Science Education Content Standards.
For correlations to individual state standards, visit www.NEED.org.

© 2012 The NEED Project P.O. Box 10101, Manassas, VA 20108 1.800.875.5029 www.NEED.org 5
Content Standard A | Science aS inquiry � Understandings about Scientific Inquiry
� Scientists conduct investigations for a wide variety of reasons. For example, they may wish to discover new aspects of the natural world, explain recently observed phenomena, or test the conclusions of prior investigations or the predictions of current theories.
� Scientists rely on technology to enhance the gathering and manipulation of data. New techniques and tools provide new evidence to guide inquiry and new methods to gather data, thereby contributing to the advance of science. The accuracy and precision of the data, and therefore the quality of the exploration, depends on the technology used.
� Mathematics is essential in scientific inquiry. Mathematical tools and models guide and improve the posing of questions, gathering data, constructing explanations and communicating results.
Content Standard E | Science and Technology � Understandings about Science and Technology
� Science often advances with the introduction of new technologies. Solving technological problems often results in new scientific knowledge. New technologies often extend the current levels of scientific understanding and introduce new areas of research.
� Science and technology are pursued for different purposes. Scientific inquiry is driven by the desire to understand the natural world, and technological design is driven by the need to meet human needs and solve human problems. Technology, by its nature, has a more direct effect on society than science because its purpose is to solve human problems, help humans adapt, and fulfill human aspirations. Technological solutions may create new problems. Science, by its nature, answers questions that may or may not directly influence humans. Sometimes scientific advances challenge people’s beliefs and practical explanations concerning various aspects of the world.
� Technological knowledge is often not made public because of patents and the financial potential of the idea or invention. Scientific knowledge is made public through presentations at professional meetings and publications in scientific journals.
Content Standard F | Science in PerSonal and Social PerSPecTiveS � Natural Resources
� Human populations use resources in the environment in order to maintain and improve their existence. Natural resources have been and will continue to be used to maintain human populations.
� The earth does not have infinite resources; increasing human consumption places severe stress on the natural processes that renew some resources, and it depletes those resources that cannot be renewed.
� Humans use natural systems as resources. Natural systems have the capacity to reuse waste, but that capacity is limited. Natural systems can change to an extent that exceeds the limits of organisms to adapt naturally or humans to adapt technologically.
� Environmental Quality � Materials from human societies affect both physical and chemical cycles of the earth.
� Many factors influence environmental quality. Factors that students might investigate include population growth, resource use, population distribution, overconsumption, the capacity of technology to solve problems, poverty, the role of economic, political, and religious views, and different ways humans view the earth.
� Science and Technology in Local, National, and Global Challenges � Understanding basic concepts and principles of science and technology should precede active debate about the economics, policies, politics, and ethics of various science- and technology-related challenges. However, understanding science alone will not resolve local, national, or global challenges.
� Progress in science and technology can be affected by social issues and challenges. Funding priorities for specific health problems serve as examples of ways that social issues influence science and technology.
Correlations to National Science Education Standards: Grades 9-12This book has been correlated to National Science Education Content Standards.
For correlations to individual state standards, visit www.NEED.org.
6 Plug Loads
OverviewThese activities teach students how to determine the annual energy consumption and operating cost of appliances found in the school building by using a Microsoft Excel spreadsheet. Students will be able to see how energy-saving actions can impact the energy consumption of their school. While using the spreadsheet, students will also be able to calculate the amount of carbon dioxide (CO2) produced by the generation of electricity to power each appliance. In addition, the activities teach the students about the electricity consumed even when certain appliances are turned off and how these “phantom loads” affect school energy bills and CO2 emissions.
BackgroundPlug Loads is designed to complement the National Energy Education Development (NEED) Project’s existing Energy Management curricula, Monitoring and Mentoring and Learning and Conserving. These units guide students and teachers through a comprehensive study of how energy is used at school and at home. Plug Loads provides an additional component to the students’ energy assessment of the school building, which is the culminating activity of NEED’s Energy Management lessons. In Plug Loads, students will gather data on electrical appliances in their building and utilize a spreadsheet to calculate their energy consumption and cost over time. Through this study, students will gain a greater understanding of how plug loads affect the overall energy consumption of a building and how using plug loads efficiently can lower energy costs and improve environmental quality.
What are Plug Loads? Plug loads are electrical devices or appliances that draw power through an electric outlet. Schools typically have 120/240-volt electrical systems with many different loads. A load is any device that is powered by an electrical system and requires electricity to do work. Look around any classroom and see the many appliances and devices that are turned on. Anything that has an ON/OFF switch can be a load and managing the use of these loads can help save electricity and money. A quick survey of the typical classroom and school building reveals many kinds of plug loads, such as:
Introduction to Plug Loads
�coffee makers
�computers/monitors
�fans
�desk and table lamps
�microwaves
�refrigerators
�televisions
�DVD/VCR players
�window air conditioners
�vending machines
�printers and scanners
�fax machines
�copiers
�fish tanks
�projectors
�ranges and stoves
�vocational equipment
�refrigerated drinking fountains
�clocks
Many of these devices are important to the learning environment. In addition, there are appliances that teachers and school staff bring from home that are not related to teaching, but are routine products found in any office or classroom. A survey of all plug loads in the school will help students, teachers, and school staff find ways to reduce electricity use and save money.
Once students, teachers, and staff are educated about the impacts of energy consumption, they are often willing to reduce their use of these devices. By simply monitoring daily use of plug loads, students and staff can lower the school’s utility bills, saving the school system money. This could make additional funding available for educational materials such as textbooks, school supplies, and other equipment.
How Much Electricity Do Plug Loads Use?Estimates are that up to 25 percent of the total electricity consumed by a school is from plug loads. Managing the use of such equipment can greatly reduce a school’s electricity consumption.
© 2012 The NEED Project P.O. Box 10101, Manassas, VA 20108 1.800.875.5029 www.NEED.org 7
To estimate how much electricity is consumed by plug loads in your school, you can use the Plug Load Spreadsheet. The spreadsheet is a tool that helps students quantify the relationship between plug loads and energy usage. The spreadsheet can be downloaded from www.NEED.org. This analysis of the Plug Load Spreadsheet can be integrated with data gathered using NEED’s Monitoring and Mentoring, Learning and Conserving, or Energy Survey activities to give students a better understanding of energy consumption, resulting in real opportunities for reducing energy use and lowering the school’s utility bill.
The Plug Load Spreadsheet was designed to simulate real world computer programs used by professional energy analysts. The students’ exposure to gathering and analyzing electrical use data demonstrates the importance of energy management and builds an essential foundation needed for entering this growing career field.
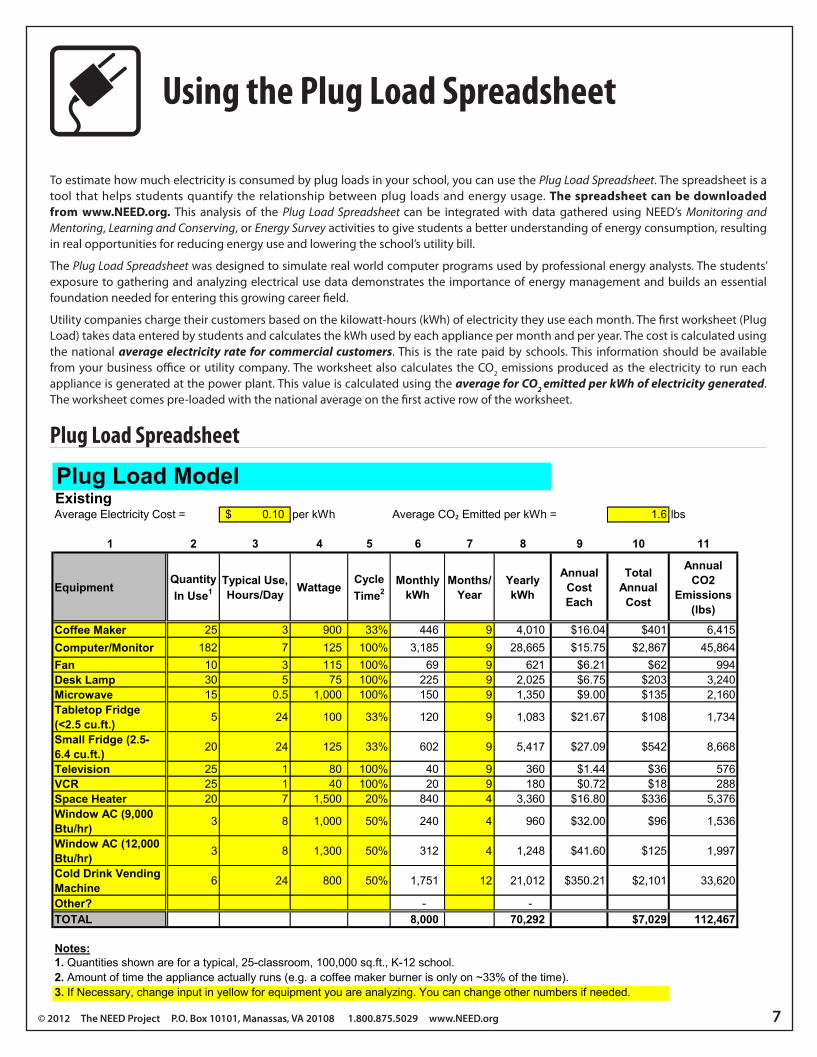
Utility companies charge their customers based on the kilowatt-hours (kWh) of electricity they use each month. The first worksheet (Plug Load) takes data entered by students and calculates the kWh used by each appliance per month and per year. The cost is calculated using the national average electricity rate for commercial customers. This is the rate paid by schools. This information should be available from your business office or utility company. The worksheet also calculates the CO2 emissions produced as the electricity to run each appliance is generated at the power plant. This value is calculated using the average for CO2 emitted per kWh of electricity generated. The worksheet comes pre-loaded with the national average on the first active row of the worksheet.
Plug Load Spreadsheet
Plug Load ModelExistingAverage Electricity Cost = 0.10$ per kWh 1.6 lbs
1 2 3 4 5 6 7 8 9 10 11
EquipmentQuantity In Use1
Typical Use, Hours/Day Wattage
Cycle Time2
Monthly kWh
Months/Year
Yearly kWh
Annual Cost Each
Total Annual
Cost
Annual CO2
Emissions (lbs)
Coffee Maker 25 3 900 33% 446 9 4,010 $16.04 $401 6,415Computer/Monitor 182 7 125 100% 3,185 9 28,665 $15.75 $2,867 45,864Fan 10 3 115 100% 69 9 621 $6.21 $62 994Desk Lamp 30 5 75 100% 225 9 2,025 $6.75 $203 3,240Microwave 15 0.5 1,000 100% 150 9 1,350 $9.00 $135 2,160Tabletop Fridge (<2.5 cu.ft.) 5 24 100 33% 120 9 1,083 $21.67 $108 1,734
Small Fridge (2.5-6.4 cu.ft.) 20 24 125 33% 602 9 5,417 $27.09 $542 8,668
Television 25 1 80 100% 40 9 360 $1.44 $36 576VCR 25 1 40 100% 20 9 180 $0.72 $18 288Space Heater 20 7 1,500 20% 840 4 3,360 $16.80 $336 5,376Window AC (9,000 Btu/hr) 3 8 1,000 50% 240 4 960 $32.00 $96 1,536
Window AC (12,000 Btu/hr) 3 8 1,300 50% 312 4 1,248 $41.60 $125 1,997
Cold Drink Vending Machine 6 24 800 50% 1,751 12 21,012 $350.21 $2,101 33,620
Other? - - TOTAL 8,000 70,292 $7,029 112,467
Notes:1. Quantities shown are for a typical, 25-classroom, 100,000 sq.ft., K-12 school.2. Amount of time the appliance actually runs (e.g. a coffee maker burner is only on ~33% of the time).3. If Necessary, change input in yellow for equipment you are analyzing. You can change other numbers if needed.
Average CO₂ Emitted per kWh =
May 2004 TRC Energy Services is under contract to NYSERDA to manage its Energy Smart Schols Program
Using the Plug Load Spreadsheet

8 Plug Loads
Using the Plug Load Spreadsheet
� Columns 1-5 and Column 7Data can be entered into Columns 1-5 and Column 7. Column 6 and Columns 8-11 all contain formulas and perform calculations based on the data entered in Columns 1-5 and 7. The worksheet is pre-loaded with values for Columns 1-5 and 7. The cells in Columns 1-5 and 7 are yellow, indicating cells that can be filled in with building-specific data. The best way to obtain values for Column 4 is by using a plug-in watt meter, which is included in NEED’s Energy Management Kits, Monitoring and Mentoring and Learning and Conserving. Below is a description of data in each column:
Column 1: Lists appliances commonly found in school buildings.
Column 2: Gives typical quantities of these appliances found in schools.
Column 3: Gives typical usage in hours per day.
Column 4: Gives typical wattages of appliances. If students meter the appliances directly or determine the wattage from appliance nameplates (see Monitoring and Mentoring or Learning and Conserving sections on nameplate data), their data should be entered in this column.
Column 5: Gives the amount of time these appliances are typically running when turned on. Some appliances, such as refrigerators, are always “on” when they are plugged in. However, they are controlled by thermostats so that the units only run when the temperature inside rises above a pre-set point. The percentage listed in this column is the percentage of time the appliance is typically running.
Column 7: Gives the number of months per year the equipment is operated. Nine months is the default value for schools, a value that can be changed if the school is in use for longer periods.
Each of these columns contains typical values. The actual appliances, quantities, hours of use, run time, and cycle time can vary widely. The more data your students gather and enter into these six columns, the more accurate the assessment you will have of the actual energy use in the building.
When determining values for Columns 3 and 7, it may be necessary to interview school personnel. For instance, asking a school secretary may be the best way to determine the hours of operation for a copier in the main office. The interview is an important part of any energy analysis because there is always information that is available no other way. The interview provides necessary data and incorporates a language arts element into the student energy analysis.
� Column 6 and Columns 8-11Columns 6 and 8-11 contain exact formulas and should not be modified.
Column 6: Determines the monthly electricity usage in killwatt-hours (kWh) by multiplying the number of appliances by the appliance wattage and the hours of operation per day, then multiplying that figure by the percentage of time the appliance is actually running when it is turned on. Finally, this formula converts the watts to kilowatts by dividing by 1,000, then multiplies the product by the number of days per month the equipment is operated (assumed to be 20 on average for most appliances and 30.4 for refrigerators and freezers).
Column 8: Multiplies the kilowatt-hours per month by the number of months to yield the kWh per year consumed by the appliances.
Column 9: Multiplies the kWh per year by the average electricity cost and then divides by the number of pieces of equipment to show the yearly cost of operating each piece of equipment.
Column 10: Multiplies the kWh per year by the average electricity cost to yield the yearly operating cost of all pieces of equipment in this category.
Column 11: Multiplies the kWh per year by the average amount of CO2 (in pounds) produced by generating one kWh of electricity.
Often, there is more than one kind of appliance within a category of equipment. For instance, the school’s computers could include older machines with CRT (cathode ray tube) monitors and newer ones with LCD (liquid crystal display) monitors. In such cases, each of these kinds of computers should be treated as separate pieces of equipment and have their own rows on the worksheet. Similarly, there may be categories of equipment in which some pieces have longer run times or are used year-round as opposed to nine months. Each of these run times should also be considered as distinct pieces of equipment.
Finally, some pieces of equipment (such as computers and copiers) often spend much of their time in low power or sleep modes. In many cases, appliances also consume power when turned off (see Phantom Loads section). An advanced analysis would take this into account, as well. As with the cases mentioned above, it is necessary to use a separate row for the machine in sleep mode, with the estimated amount of hours the machine spends in that mode.
*REMINDER: Download the spreadsheets from www.NEED.org.

© 2012 The NEED Project P.O. Box 10101, Manassas, VA 20108 1.800.875.5029 www.NEED.org 9
Phantom Electrical LoadsThe DVD in a classroom has been flashing the time “12:00 a.m.” since it was installed four years ago. The only time it has not been flashing is when a power outage occurred last winter. This is a prime example of an electronic device in today’s classroom that consumes energy when the switch indicates it is off. The cost for this flashing for four years could add up to more than $10. With hundreds of these devices in a district, that can amount to a significant energy cost. This consumption of electrical energy is classified as a phantom load. Phantom loads are also known as standby power or leaking electricity.
Phantom loads exist in many electronic or electrical devices found in schools. Equipment with electronic clocks or timers, with remote controls, portable equipment, and office equipment with wall cubes (small box-shaped plugs that plug into AC outlets to power appliances) all have phantom loads. This equipment can consume from three to 20 watts when turned off. The Department of Energy’s Federal Energy Management Program (FEMP) has determined the average phantom load of many devices. On the next page is a diagram of examples of these values. Note that as technology changes, these values are being reduced and it is estimated that with new technology as much as 75 percent of this phantom load can be reduced.
Calculating Phantom LoadTo find the phantom load for an appliance, you must know how many hours per day the appliance is turned off and what the phantom load is. Below is an example for a TV in a school building:
Appliance: TV Phantom Load: 5.5 watts Hours per day turned off: 22
The total energy used during the year would be 5.5 watts x 22 hours/day x 365 days/year = 44,165 watt-hours or 44 kWh. At the average commercial rate of $0.10/kWh, the cost would be $4.40. (Note: A home TV’s phantom load cost would be different, due to an average residential rate of $0.12/kWh and an average turned off time of 19 hours per day.)
Of course, the usage would vary depending on the day. To get a more accurate figure, you would have to take into account the number of days when the TV is not used at all (summer vacation, weekends, holidays, etc.) where the phantom load would be drawn for 24 hours instead of 22. Taking these factors into account, the standby usage and cost would be higher. Remember, this is just for one TV. In a large school district, there could be a hundred or more TVs. To get an accurate measure of how much TV phantom load consumption there is district-wide, you would multiply the number of TVs by the average usage.
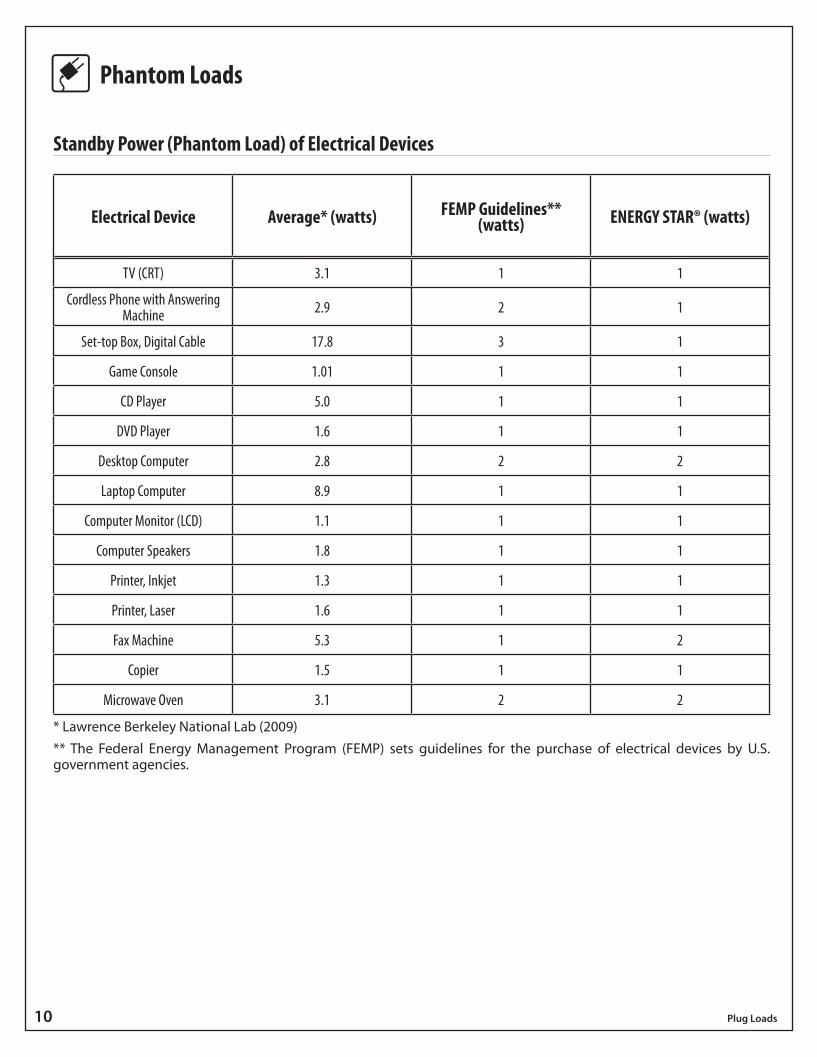
To reduce this energy consumption, unplug the TV when not in use. Consider this suggestion for other electronic devices that may not need to be continuously plugged in for educational value. On the next page is a chart showing the following:
�Average standby power (phantom load) consumption of appliances (from research conducted by Lawrence Berkeley National Lab);
�Federal Energy Management Program (FEMP) Guidelines for standby power (phantom load) usage; these guidelines are used by federal agencies when purchasing new equipment; and
�ENERGY STAR® requirements for standby (phantom load) power consumption.
Significant savings can be achieved by reducing phantom loads. But more important than the energy reduction is the educational value for students as they gain an understanding of phantom loads and what actions can be taken to manage their impact.
In addition to the recommendation above, procurement specifications for future electronic purchases should include a requirement for minimum “Standby/Phantom Load” in accordance with FEMP recommendations.
A listing of products to be used is at www1.eere.energy.gov/femp/technologies/standby_power.aspx.
You can use the Phantom Load Worksheet available from www.NEED.org to calculate phantom loads. This worksheet is set up exactly like the Plug Load Worksheet, but is pre-loaded with average values for standby wattages and average times spent in standby. Only enter data for the appliance for the times when it is turned off.
Phantom Loads
10 Plug Loads
Standby Power (Phantom Load) of Electrical Devices
Electrical Device Average* (watts) FEMP Guidelines** (watts) ENERGY STAR® (watts)
TV (CRT) 3.1 1 1
Cordless Phone with Answering Machine 2.9 2 1
Set-top Box, Digital Cable 17.8 3 1
Game Console 1.01 1 1
CD Player 5.0 1 1
DVD Player 1.6 1 1
Desktop Computer 2.8 2 2
Laptop Computer 8.9 1 1
Computer Monitor (LCD) 1.1 1 1
Computer Speakers 1.8 1 1
Printer, Inkjet 1.3 1 1
Printer, Laser 1.6 1 1
Fax Machine 5.3 1 2
Copier 1.5 1 1
Microwave Oven 3.1 2 2
* Lawrence Berkeley National Lab (2009)** The Federal Energy Management Program (FEMP) sets guidelines for the purchase of electrical devices by U.S. government agencies.
Phantom Loads
© 2012 The NEED Project P.O. Box 10101, Manassas, VA 20108 1.800.875.5029 www.NEED.org 11
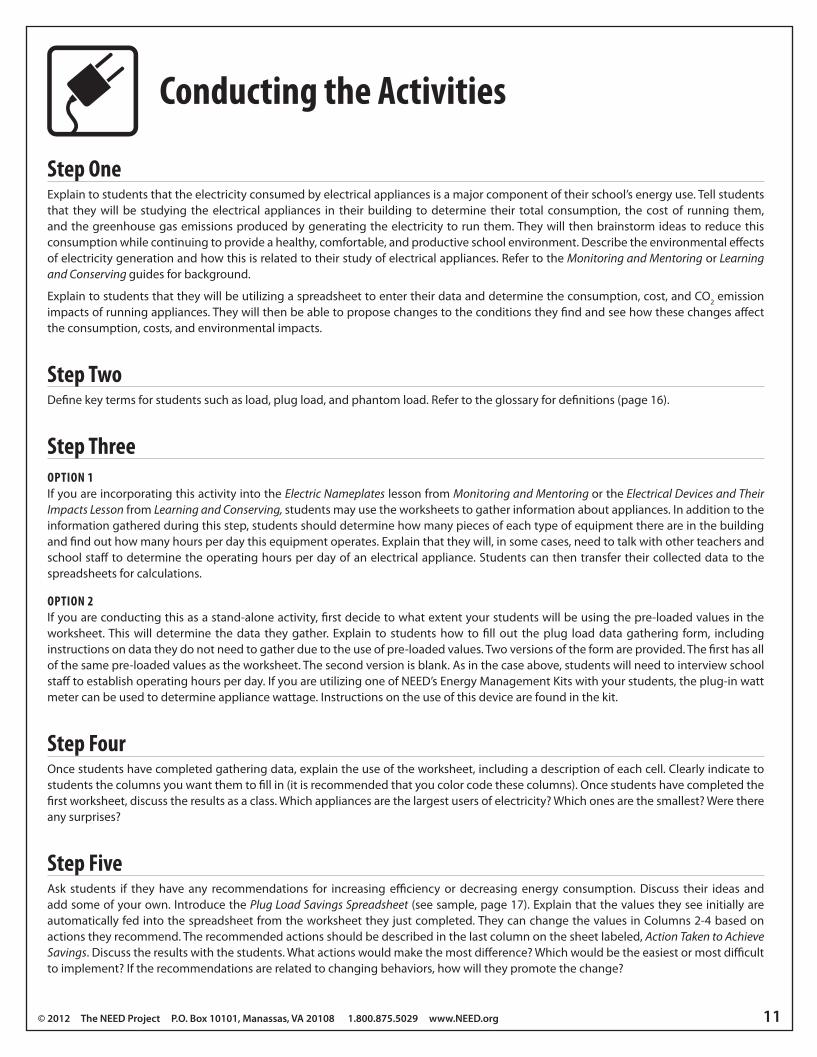
Step OneExplain to students that the electricity consumed by electrical appliances is a major component of their school’s energy use. Tell students that they will be studying the electrical appliances in their building to determine their total consumption, the cost of running them, and the greenhouse gas emissions produced by generating the electricity to run them. They will then brainstorm ideas to reduce this consumption while continuing to provide a healthy, comfortable, and productive school environment. Describe the environmental effects of electricity generation and how this is related to their study of electrical appliances. Refer to the Monitoring and Mentoring or Learning and Conserving guides for background.
Explain to students that they will be utilizing a spreadsheet to enter their data and determine the consumption, cost, and CO2 emission impacts of running appliances. They will then be able to propose changes to the conditions they find and see how these changes affect the consumption, costs, and environmental impacts.
Step TwoDefine key terms for students such as load, plug load, and phantom load. Refer to the glossary for definitions (page 16).
Step ThreeOPTION 1If you are incorporating this activity into the Electric Nameplates lesson from Monitoring and Mentoring or the Electrical Devices and Their Impacts Lesson from Learning and Conserving, students may use the worksheets to gather information about appliances. In addition to the information gathered during this step, students should determine how many pieces of each type of equipment there are in the building and find out how many hours per day this equipment operates. Explain that they will, in some cases, need to talk with other teachers and school staff to determine the operating hours per day of an electrical appliance. Students can then transfer their collected data to the spreadsheets for calculations.
OPTION 2If you are conducting this as a stand-alone activity, first decide to what extent your students will be using the pre-loaded values in the worksheet. This will determine the data they gather. Explain to students how to fill out the plug load data gathering form, including instructions on data they do not need to gather due to the use of pre-loaded values. Two versions of the form are provided. The first has all of the same pre-loaded values as the worksheet. The second version is blank. As in the case above, students will need to interview school staff to establish operating hours per day. If you are utilizing one of NEED’s Energy Management Kits with your students, the plug-in watt meter can be used to determine appliance wattage. Instructions on the use of this device are found in the kit.
Step FourOnce students have completed gathering data, explain the use of the worksheet, including a description of each cell. Clearly indicate to students the columns you want them to fill in (it is recommended that you color code these columns). Once students have completed the first worksheet, discuss the results as a class. Which appliances are the largest users of electricity? Which ones are the smallest? Were there any surprises?
Step FiveAsk students if they have any recommendations for increasing efficiency or decreasing energy consumption. Discuss their ideas and add some of your own. Introduce the Plug Load Savings Spreadsheet (see sample, page 17). Explain that the values they see initially are automatically fed into the spreadsheet from the worksheet they just completed. They can change the values in Columns 2-4 based on actions they recommend. The recommended actions should be described in the last column on the sheet labeled, Action Taken to Achieve Savings. Discuss the results with the students. What actions would make the most difference? Which would be the easiest or most difficult to implement? If the recommendations are related to changing behaviors, how will they promote the change?
Conducting the Activities
12 Plug Loads
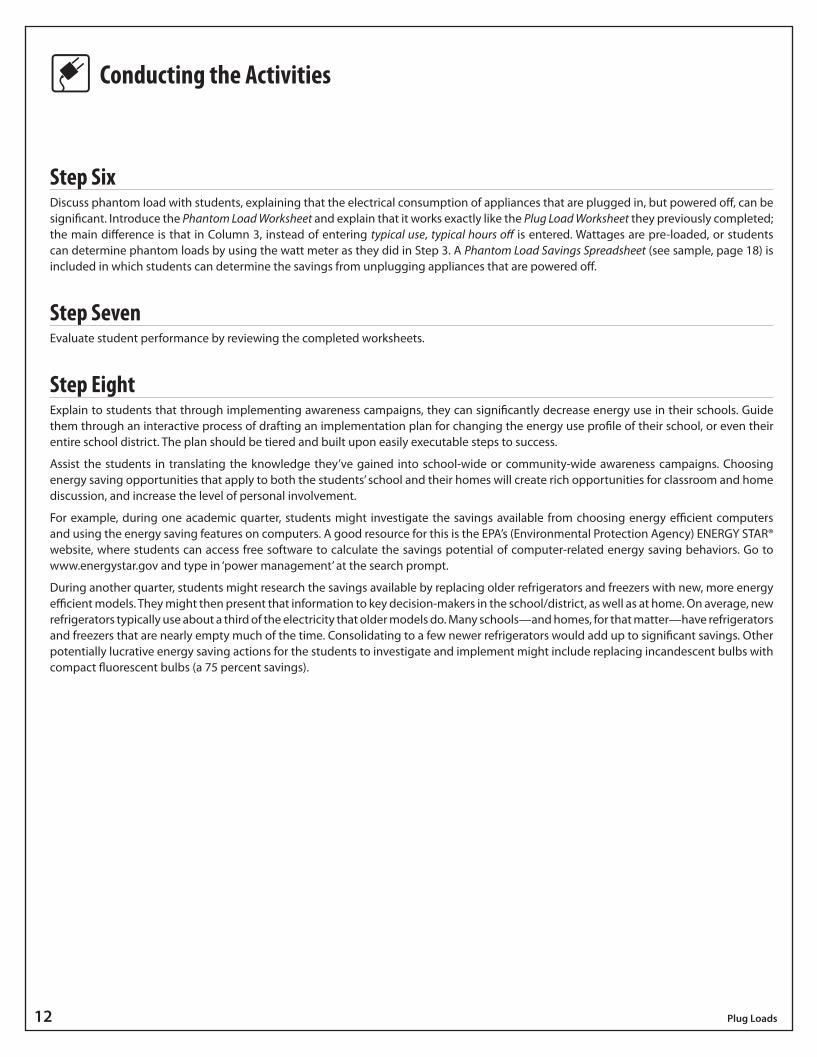
Step SixDiscuss phantom load with students, explaining that the electrical consumption of appliances that are plugged in, but powered off, can be significant. Introduce the Phantom Load Worksheet and explain that it works exactly like the Plug Load Worksheet they previously completed; the main difference is that in Column 3, instead of entering typical use, typical hours off is entered. Wattages are pre-loaded, or students can determine phantom loads by using the watt meter as they did in Step 3. A Phantom Load Savings Spreadsheet (see sample, page 18) is included in which students can determine the savings from unplugging appliances that are powered off.
Step SevenEvaluate student performance by reviewing the completed worksheets.
Step EightExplain to students that through implementing awareness campaigns, they can significantly decrease energy use in their schools. Guide them through an interactive process of drafting an implementation plan for changing the energy use profile of their school, or even their entire school district. The plan should be tiered and built upon easily executable steps to success.
Assist the students in translating the knowledge they’ve gained into school-wide or community-wide awareness campaigns. Choosing energy saving opportunities that apply to both the students’ school and their homes will create rich opportunities for classroom and home discussion, and increase the level of personal involvement.
For example, during one academic quarter, students might investigate the savings available from choosing energy efficient computers and using the energy saving features on computers. A good resource for this is the EPA’s (Environmental Protection Agency) ENERGY STAR® website, where students can access free software to calculate the savings potential of computer-related energy saving behaviors. Go to www.energystar.gov and type in ‘power management’ at the search prompt.
During another quarter, students might research the savings available by replacing older refrigerators and freezers with new, more energy efficient models. They might then present that information to key decision-makers in the school/district, as well as at home. On average, new refrigerators typically use about a third of the electricity that older models do. Many schools—and homes, for that matter—have refrigerators and freezers that are nearly empty much of the time. Consolidating to a few newer refrigerators would add up to significant savings. Other potentially lucrative energy saving actions for the students to investigate and implement might include replacing incandescent bulbs with compact fluorescent bulbs (a 75 percent savings).
Conducting the Activities
© 2012 The NEED Project P.O. Box 10101, Manassas, VA 20108 1.800.875.5029 www.NEED.org 13
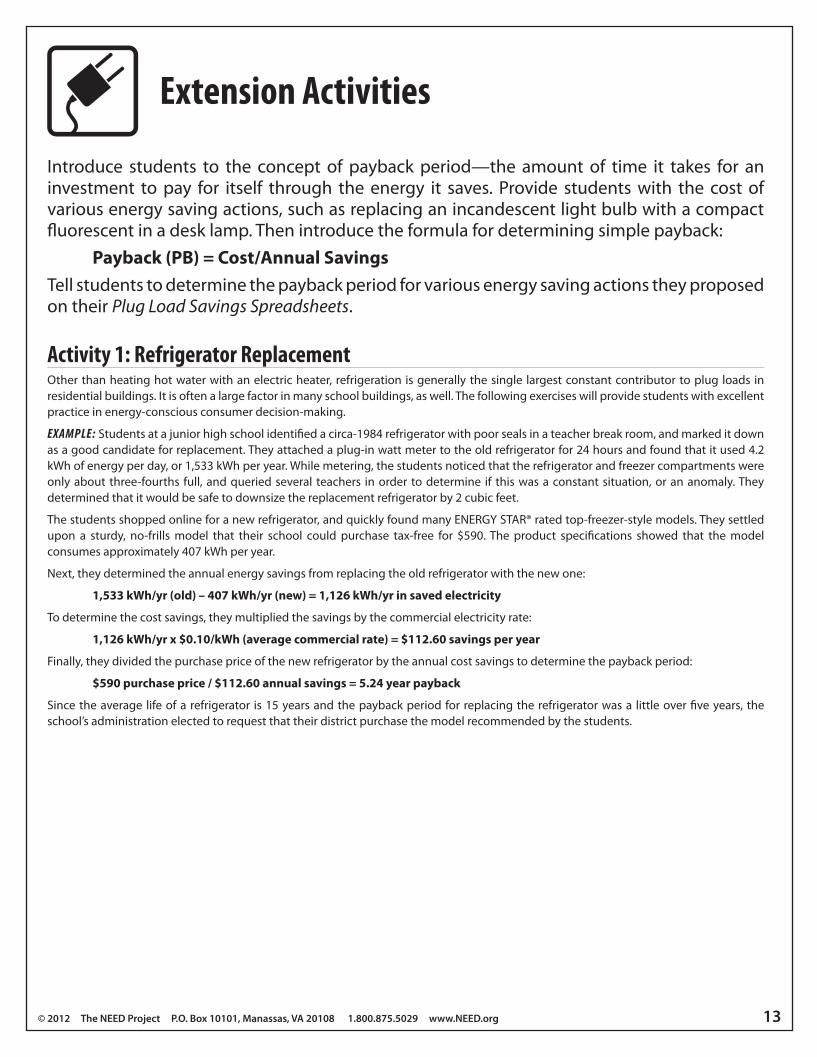
Introduce students to the concept of payback period—the amount of time it takes for an investment to pay for itself through the energy it saves. Provide students with the cost of various energy saving actions, such as replacing an incandescent light bulb with a compact fluorescent in a desk lamp. Then introduce the formula for determining simple payback:
Payback (PB) = Cost/Annual Savings Tell students to determine the payback period for various energy saving actions they proposed on their Plug Load Savings Spreadsheets.
Activity 1: Refrigerator Replacement Other than heating hot water with an electric heater, refrigeration is generally the single largest constant contributor to plug loads in residential buildings. It is often a large factor in many school buildings, as well. The following exercises will provide students with excellent practice in energy-conscious consumer decision-making.
eXaMPle: Students at a junior high school identified a circa-1984 refrigerator with poor seals in a teacher break room, and marked it down as a good candidate for replacement. They attached a plug-in watt meter to the old refrigerator for 24 hours and found that it used 4.2 kWh of energy per day, or 1,533 kWh per year. While metering, the students noticed that the refrigerator and freezer compartments were only about three-fourths full, and queried several teachers in order to determine if this was a constant situation, or an anomaly. They determined that it would be safe to downsize the replacement refrigerator by 2 cubic feet.
The students shopped online for a new refrigerator, and quickly found many ENERGY STAR® rated top-freezer-style models. They settled upon a sturdy, no-frills model that their school could purchase tax-free for $590. The product specifications showed that the model consumes approximately 407 kWh per year.
Next, they determined the annual energy savings from replacing the old refrigerator with the new one:
1,533 kWh/yr (old) – 407 kWh/yr (new) = 1,126 kWh/yr in saved electricity
To determine the cost savings, they multiplied the savings by the commercial electricity rate:
1,126 kWh/yr x $0.10/kWh (average commercial rate) = $112.60 savings per year
Finally, they divided the purchase price of the new refrigerator by the annual cost savings to determine the payback period:
$590 purchase price / $112.60 annual savings = 5.24 year payback
Since the average life of a refrigerator is 15 years and the payback period for replacing the refrigerator was a little over five years, the school’s administration elected to request that their district purchase the model recommended by the students.
Extension Activities
14 Plug Loads
Activity 2: Light Bulb ReplacementLighting is a significant cost to schools and homes. Reducing the cost of lighting can impact energy costs.
eXaMPle: A fifth grade student audit team at an elementary school found that twelve of the school’s teachers and staff had desk lamps either on their desks or at their computer stations. The team observed and logged run-time for the lamps for a week, and found that almost all were left on for the entire workday, or from approximately 8 a.m. to 4 p.m. They discovered that all of the bulbs in the twelve lamps were 60-watt incandescents.
The students researched the light levels (lumens) for compact fluorescent bulbs (CFL)and incandescent bulbs, and found that a 13-watt CFL provides the same light level as a 60-watt incandescent bulb. They then looked through ad sections of the local newspaper, and discovered that a nearby home store was offering a package of three ENERGY STAR® rated compact fluorescent bulbs for just $5.48. In order to replace the 12 bulbs, the students determined they would need four packages of three bulbs each. With guidance, the students set about calculating the annual plug load cost of the old incandescent bulbs. First, they determined that there were 180 school days in their district’s school year, so they multiplied 180 days by 8 hours a day, and got 1,440 hours of on-time per lamp. Then they multiplied 1,440 by twelve, yielding a total of 17,280 hours of 60-watt bulb use.
1,440 hours x 12 lamps = 17,280 total hours
The fifth-graders continued their calculations by determining how many watts were used annually by the old incandescent bulbs.
17,280 hours x 60 watt = 1,036,800 watt-hours
Arriving at that large a number of watts astounded the students. They had been taught that a kilowatt equals 1,000 watts, so the students divided their grand sum of 1,036,800 watt-hours per year by 1,000 and got 1,036.8 kWh.
1,036,800 watt-hours / 1,000 watts/kW = 1,036.8 kWh
They then multiplied that number by $0.10, the national average cost for commercial electricity:
1,036.8 kWh x $.10/kWh = $103.68
For their final factor in determining payback, they figured the total cost of operating the 13-watt CFLs for a year. First, they determined how much energy the CFLs would consume during the year in kWh:
17,280 hours x 13 watt = 224,640 watt-hours /1,000 watts/kW = 224.64 kWh
Next they multiplied the consumption by the commercial electric rate:
224.6 kWh x $0.10/kWh = $22.46
The total cost for four packages of CFLs is:
4 CFL Packages x $5.48 = $21.92
To determine the savings, they subtracted the cost of operating the CFLs from the cost of operating the incandescents:
$103.68 (incandescent bulb consumption) – $22.46 (CFL consumption) = $81.22
Finally, they divided the cost of the CFLs by the annual savings to determine the payback period:
$21.92 / $81.22 = a payback period of 0.27, or less than a third of a year
Impressed, the students went a step further to determine the life-cycle savings of making the bulb conversion. They divided the average 10,000-hour life of a CFL by 1,440 hours and determined that the new bulbs would last almost seven years (6.94). They deducted the payback period, and calculated that 6.67 years of savings would amount to $541.74. Armed with their facts and figures, the fifth grade student audit team had no problem convincing their principal to purchase $22 worth of compact fluorescent light bulbs for the teachers and staff to use in their personal desk lamps!
OptionalRepeat this process using an LED light bulb with similar lumens. The average indoor LED bulb uses 12 watts, sells for $40.00, and lasts 25,000 hours. Would switching to LED bulbs be a good idea? Why or why not?
Extension Activities

© 2012 The NEED Project P.O. Box 10101, Manassas, VA 20108 1.800.875.5029 www.NEED.org 15
Step OneHave students conduct a survey with their family about the plug loads found in their homes. Students should list the appliances and electronics they have, and estimate with their parents or guardians the typical use. Students should bring these lists back to school.
Note: The school may want to consider loaning the Energy Management Kit items to families, allowing families the opportunity to collect data on their home energy use.
Step TwoStudents enter the data from their home survey into the spreadsheet at school. Students may use the average residential rate for electricity of $0.12/kWh or determine what their rate is using a family electric bill. Have students calculate the financial and environmental impact of their home plug load.
Step ThreeStudents bring their calculations home to their families. Students should be encouraged to develop a plan with their families for making efficiency and conservation changes.
Step FourStudents should bring in their family plan to share with the class. Revisit the plans periodically and have students give updates on the changes their families have implemented.
Home Extension
16 Plug Loads
Glossary
120/240-volt service
These are the common voltages used for wall outlets in North America.
Energy Analyst A professional who analyzes the energy use of a building and recommends building improvements or behavior changes that reduce energy consumption.
ENERGY STAR® A federal government-backed program helping businesses and individuals protect the environment through superior energy efficiency.
Federal Energy Management Program (FEMP)
A program of the U.S. Department of Energy that works to reduce the cost and environmental impact of the Federal Government by advancing energy efficiency and water conservation, promoting the use of distributed and renewable energy, and improving utility management decisions at federal sites.
kilowatt-hour (kWh)
A unit of energy equal to the work done by a power of 1,000 watts operating for one hour. Utility companies charge their customers based on how many kilowatt-hours they consume each month.
load Any device that draws power from the electrical system and requires electricity to do work.
outlet A wall-mounted receptacle that is connected to a power supply and equipped with a socket for a plug.
payback period The amount of time that it takes for the annual savings to equal the initial investment.
phantom load The electricity draw created by devices that consume electrical energy even when powered off.
plug load The electricity draw created by any electrical appliance that plugs into an electrical wall outlet.
wall cube A cube-shaped transformer that plugs into the wall outlet to power a lower voltage appliance. This device changes 120 V AC power to low voltage DC power to provide power to many of our electronic devices in schools.
watt meter A device that measures the power consumed by an electrical appliance.

© 2012 The NEED Project P.O. Box 10101, Manassas, VA 20108 1.800.875.5029 www.NEED.org 17
Phantom Load M
odelExisting
0.10$
per kWh
1.6lbs
12
34
56
78
910
11
Equipment
Quantity
In Use
1
Typical H
ours "off" D
ailyW
attageC
ycle Tim
e2
Monthly kW
hM
onths/Year
Yearly kW
h
Annual C
ost Each
Total Annual
Cost
Annual C
O2
Emissions (lbs)
Coffee M
aker25
3-
33%
-
9-
$0.00
$00
Com
puter/Monitor
1827
3
100%76.4
9
688
$0.38$69
1,101Fan
103
-
100%-
9
-
$0.00$0
0D
esk Lamp
305
-
100%-
9
-
$0.00$0
0M
icrowave
150.5
3
100%0.5
9
4
$0.03$0
6Tabletop Fridge (<2.5 cu.ft.)
50
-
33%-
9
-
$0.00$0
0
Small Fridge (2.5-
6.4 cu.ft.)20
0-
33%
-
9-
$0.00
$00
Television25
15
100%
2.5
923
$0.09
$236
VCR
251
6
100%3.0
9
27
$0.11$3
43Space H
eater20
7-
20%
-
4-
$0.00
$00
Window
AC (9,000
Btu/hr)
38
-
50%-
4
-
$0.00$0
0
Window
AC (12,000
Btu/hr)
38
-
50%-
4
-
$0.00$0
0
Cold D
rink Vending M
achine6
0-
50%
-
12-
$0.00
$00
Other?
-
-
TOTAL
82
742
$741,186
Notes:
1. Quantities show
n are for a typical, 25-classroom, 100,000 sq.ft., K-12 school.
2. Amount of tim
e the appliance actually runs (e.g. a coffee maker burner is only on ~33%
of the time).
3. If Necessary, change input in yellow
for equipment you are analyzing. You can change other num
bers if needed.
Average CO₂ Em
itted per kWh =
May 2004
TRC
Energy S
ervices is under contract to NYS
ER
DA
to manage its E
nergy Sm
art Schols P
rogram
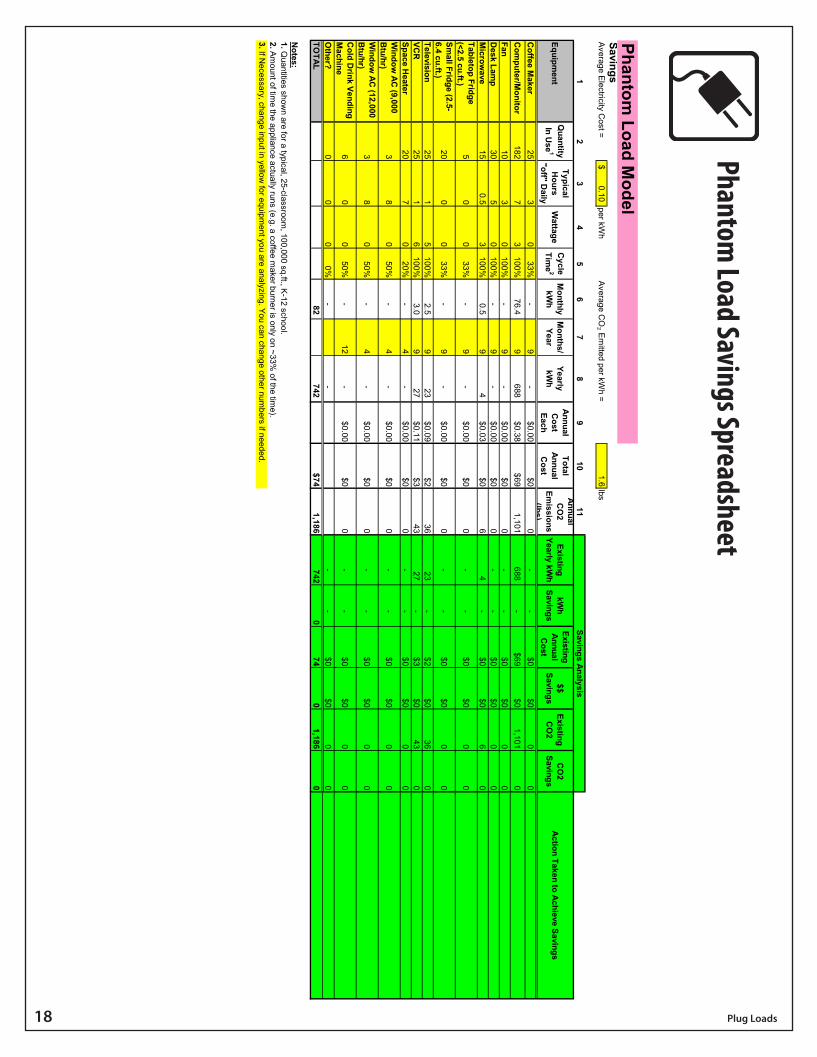
Plug Load Savings Spreadsheet
In addition to the School Plug Load Model and Phantom
Load Excel worksheets, tw
o additional spreadsheets calculating savings area also available. Dow
nload the spreadsheets online at w
ww
.NEED
.org/curriculum-guides.
18 Plug Loads
Phantom Load M
odelSavingsA
verage Electricity C
ost =0.10
$ per kW
h1.6
lbs
12
34
56
78
910
11
Equipment
Quantity
In Use
1
Typical H
ours "off" D
ailyW
attageC
ycle Tim
e2
Monthly kW
hM
onths/Year
Yearly kW
h
Annual C
ost Each
Total Annual C
ost
Annual C
O2
Emissions (lbs)
Existing Yearly kW
hkW
h Savings
Existing Annual C
ost
$$ Savings
Existing C
O2
CO
2 Savings
Coffee M
aker25
30
33%-
9
-
$0.00$0
0-
-
$0
$00
0C
omputer/M
onitor182
73
100%76.4
9
688
$0.38$69
1,101688
-
$69
$01,101
0Fan
103
0100%
-
9-
$0.00
$00
-
-
$0$0
00
Desk Lam
p30
50
100%-
9
-
$0.00$0
0-
-
$0
$00
0M
icrowave
150.5
3100%
0.5
94
$0.03
$06
4
-
$0$0
60
Tabletop Fridge (<2.5 cu.ft.)
50
033%
-
9-
$0.00
$00
-
-
$0$0
00
Small Fridge (2.5-
6.4 cu.ft.)20
00
33%-
9
-
$0.00$0
0-
-
$0
$00
0
Television25
15
100%2.5
9
23
$0.09$2
3623
-
$2
$036
0VC
R25
16
100%3.0
9
27
$0.11$3
4327
-
$3
$043
0Space H
eater20
70
20%-
4
-
$0.00$0
0-
-
$0
$00
0W
indow AC
(9,000 B
tu/hr)3
80
50%-
4
-
$0.00$0
0-
-
$0
$00
0
Window
AC (12,000
Btu/hr)
38
050%
-
4-
$0.00
$00
-
-
$0$0
00
Cold D
rink Vending M
achine6
00
50%-
12
-
$0.00$0
0-
-
$0
$00
0
Other?
00
00%
-
-
-
-
$0$0
00
TOTAL
82
742
$741,186
7420
740
1,1860
Notes:
1. Quantities show
n are for a typical, 25-classroom, 100,000 sq.ft., K
-12 school.2. A
mount of tim
e the appliance actually runs (e.g. a coffee maker burner is only on ~33%
of the time).
3. If Necessary, change input in yellow
for equipment you are analyzing. You can change other num
bers if needed.
Average C
O₂ E
mitted per kW
h =
Savings Analysis
Action Taken to Achieve Savings
May 2004
TRC
Energy S
ervices is under contract to NYS
ER
DA
to manage its E
nergy Sm
art Schols P
rogram
Phantom Load Savings Spreadsheet

© 2012 The NEED Project P.O. Box 10101, Manassas, VA 20108 1.800.875.5029 www.NEED.org 19
Plug LoadsEvaluation Form
State: ___________ Grade Level: ___________ Number of Students: __________
1. Did you conduct the entire unit? Yes No
2. Were the instructions clear and easy to follow? Yes No
3. Did the activities meet your academic objectives? Yes No
4. Were the activities age appropriate? Yes No
5. Were the allotted times sufficient to conduct the activities? Yes No
6. Were the activities easy to use? Yes No
7. Was the preparation required acceptable for the activities? Yes No
8. Were the students interested and motivated? Yes No
9. Was the energy knowledge content age appropriate? Yes No
10. Would you teach this unit again? Yes No Please explain any ‘no’ statement below.
How would you rate the unit overall? excellent good fair poor
How would your students rate the unit overall? excellent good fair poor
What would make the unit more useful to you?
Other Comments:
Please fax or mail to: The NEED Project P.O. Box 10101 Manassas, VA 20108 FAX: 1-800-847-1820

NEED National Sponsors and PartnersAmerican Association of Blacks in EnergyAmerican Chemistry CouncilAmerican Electric PowerAmerican Electric Power FoundationAmerican Solar Energy SocietyAmerican Wind Energy AssociationAppalachian Regional CommissionArevaArkansas Energy OfficeArmstrong Energy CorporationAssociation of Desk & Derrick ClubsRobert L. Bayless, Producer, LLCBPBP AlaskaC&E OperatorsCape and Islands Self RelianceCape Cod Cooperative ExtensionCape Light Compact–MassachusettsL.J. and Wilma CarrCentral Virginia Community CollegeChevronChevron Energy SolutionsComEdConEdison SolutionsConocoPhillipsCouncil on Foreign RelationsCPS EnergyDart FoundationDavid Petroleum CorporationDesk and Derrick of Roswell, NMDominionDominion FoundationDTE Energy FoundationDuke EnergyEast Kentucky PowerEl Paso FoundationE.M.G. Oil PropertiesEncanaEncana Cares FoundationEnergy Education for MichiganEnergy Training SolutionsEnergy Solutions FoundationEntergyEquitable ResourcesFirst Roswell CompanyFoundation for Environmental EducationFPLThe Franklin InstituteGenOn Energy–CaliforniaGeorgia Environmental Facilities AuthorityGovernment of Thailand–Energy MinistryGuam Energy OfficeGulf PowerHalliburton FoundationHawaii EnergyGerald Harrington, GeologistHouston Museum of Natural Science
Hydro Research FoundationIdaho Department of EducationIdaho National LaboratoryIllinois Clean Energy Community FoundationIndependent Petroleum Association of AmericaIndependent Petroleum Association of New MexicoIndiana Michigan PowerInterstate Renewable Energy CounciliStem–Idaho STEM EducationKansas City Power and LightKBRKentucky Clean Fuels CoalitionKentucky Department of EducationKentucky Department of EnergyDevelopment and IndependenceKentucky Oil and Gas AssociationKentucky Propane Education and Research CouncilKentucky River Properties LLCKentucky Utilities CompanyLenfest FoundationLittler MendelsonLlano Land and ExplorationLos Alamos National LaboratoryLouisville Gas and Electric CompanyMaine Energy Education ProjectMaine Public Service CompanyMarianas Islands Energy OfficeMassachusetts Division of Energy ResourcesLee Matherne Family FoundationMichigan Oil and Gas Producers EducationFoundationMidwest Energy CooperativeMississippi Development Authority–Energy DivisionMontana Energy Education CouncilThe Mosaic CompanyNADA ScientificNASANational Association of State Energy OfficialsNational FuelNational GridNational Hydropower AssociationNational Ocean Industries AssociationNational Renewable Energy LaboratoryNebraska Public Power DistrictNew Mexico Oil CorporationNew Mexico Landman’s AssociationNew Orleans Solar Schools InitiativeNew York Power AuthorityNSTAROCI EnterprisesOffshore Energy CenterOffshore Technology ConferenceOhio Energy ProjectPacific Gas and Electric Company
PECOPetroleum Equipment Suppliers AssociationPhillips 66PNMPuerto Rico Energy Affairs AdministrationPuget Sound EnergyRhode Island Office of Energy ResourcesRiverWorks DiscoveryRoswell Climate Change CommitteeRoswell Geological SocietySacramento Municipal Utility DistrictSaudi AramcoSchneider ElectricScience Museum of VirginiaC.T. Seaver TrustShellSnohomish County Public Utility District–WASociety of Petroleum EngineersSolarWorld USADavid SorensonSouthern CompanySouthern LNGSouthwest GasSpace Sciences Laboratory–University of California BerkeleyTennessee Department of Economic and Community Development–Energy DivisionTennessee Valley AuthorityToyotaTXU EnergyUnited States Energy AssociationUniversity of Nevada–Las Vegas, NVU.S. Department of EnergyU.S. Department of Energy–Hydrogen ProgramU.S. Department of Energy–Office of Energy Efficiency and Renewable EnergyU.S. Department of Energy–Office of Fossil EnergyU.S. Department of Energy–Wind for SchoolsU.S. Department of Energy–Wind Powering AmericaU.S. Department of the Interior–Bureau of Land ManagementU.S. Department of the Interior–Bureau of Ocean Energy Management, Regulation and EnforcementU.S. Energy Information AdministrationU.S. Environmental Protection AgencyVan Ness FeldmanVirgin Islands Energy OfficeVirginia Department of EducationVirginia Department of Mines, Minerals and EnergyWalmart FoundationWashington and Lee UniversityWestern Kentucky Science AllianceW. Plack Carr CompanyYates Petroleum Corporation
©2012 The NEED Project P.O. Box 10101, Manassas, VA 20108 1.800.875.5029 www.NEED.org