plug and process loads capacity and power requirements ... · pdf filecapacity and power...
TRANSCRIPT

Plug and Process Loads Capacity and Power Requirements Analysis Michael Sheppy and Luigi Gentile-Polese National Renewable Energy Laboratory
Scott Gould Stanford University
September 2014

NOTICE
This report was prepared as an account of work sponsored by an agency of the United States government. Neither the United States government nor any agency thereof, nor any of their employees, subcontractors, or affiliated partners makes any warranty, express or implied, or assumes any legal liability or responsibility for the accuracy, completeness, or usefulness of any information, apparatus, product, or process disclosed, or represents that its use would not infringe privately owned rights. Reference herein to any specific commercial product, process, or service by trade name, trademark, manufacturer, or otherwise does not necessarily constitute or imply its endorsement, recommendation, or favoring by the United States government or any agency thereof. The views and opinions of authors expressed herein do not necessarily state or reflect those of the United States government or any agency thereof.
Available electronically at http://www.osti.gov/scitech
Available for a processing fee to U.S. Department of Energy and its contractors, in paper, from:
U.S. Department of Energy Office of Scientific and Technical Information
P.O. Box 62 Oak Ridge, TN 37831-0062
phone: 865.576.8401 fax: 865.576.5728
email: mailto:[email protected]
Available for sale to the public, in paper, from: U.S. Department of Commerce
National Technical Information Service 5285 Port Royal Road Springfield, VA 22161 phone: 800.553.6847
fax: 703.605.6900 email: [email protected]
online ordering: http://www.ntis.gov/ordering.htm

ii
Acknowledgments The authors would like to thank the U.S. Department of Energy Building Technologies Office for its support. This report was prepared by the National Renewable Energy Laboratory Center for Electricity, Resources, and Building Systems Integration under Task Numbers BEC8.1118 and BE4C.6201.
The authors would also like to thank Hines1, the U.S. General Services Administration1, Stanford University1, and SmarteBuilding for contributing measured plug and process load data from their buildings. We also acknowledge the input of Feitau Kung during project planning, and we thank Michael Deru, Ron Judkoff, Paul Holliday, and Stefanie Woodward for reviewing this report. Thanks to Alfred Hicks and Marjorie Schott for creating the graphics in this report.
1 Member of the Better Buildings Alliance

iii
Executive Summary This report addresses gaps in actionable knowledge that would help reduce the plug load capacities designed into buildings. Prospective building occupants and real estate brokers lack accurate references for plug and process load (PPL) capacity requirements, so they often request 5–10 W/ft2 in their lease agreements. Limited initial data, however, suggest that actual PPL densities in leased buildings are substantially lower. Overestimating PPL capacity leads designers to oversize electrical infrastructure and cooling systems. Better guidance will enable improved sizing and design of these systems, decrease upfront capital costs, and allow systems to operate more energy efficiently. The main focus of this report is to provide industry with reliable, objective third-party guidance to address the information gap in typical PPL densities for commercial building tenants. This could drive changes in negotiations about PPL energy demands.
Based on discussions and feedback received from Better Building Alliance collaborators and industry partners on the scope and focus of the project, the primary target building type for this report is office buildings, which included about 824,000 buildings (12 billion ft2) in 2003 (CBECS 2003, Table A2). A secondary target is higher education buildings. Buildings were selected based on whether they had spaces that reflect typical office setups and equipment. The findings in this report can be extrapolated for other facilities.
This report includes PPL data from the 14 office buildings and seven higher education buildings that were monitored in this study. Analysis of the measured data show that actual PPL densities are significantly lower (by a factor of 5 to 10) than what is typically requested, negotiated, or required in leases. On average, the peak PPL energy use intensities for offices (without laboratories or data centers) is 0.50 W/ft2, and 0.64 W/ft2 for higher education buildings; the peak PPL energy use intensity for offices with data centers is 0.88 W/ft2. On average, the average PPL energy use intensity for offices (without laboratories or data centers) is around 0.28 W/ft2, and 0.27 W/ft2 for higher education buildings. Offices with data centers or laboratories do exhibit higher average PPL energy use intensities.

iv
Nomenclature
DOD U.S. Department of Defense
GSA U.S. General Services Administration
HVAC Heating, ventilation, and air conditioning
NREL National Renewable Energy Laboratory
NZE Net Zero Energy
PPL Plug and process load
v
Contents
Acknowledgments........................................................................................................................... ii
Executive Summary ....................................................................................................................... iii
Nomenclature ................................................................................................................................. iv
1.0 Introduction .......................................................................................................................... 1
1.1 Motivation ........................................................................................................................ 1
1.2 Plug and Process Load Densities Reported in the Literature ........................................... 1
1.2.1 Case Study: Empire State Building ............................................................................... 2
1.2.2 Case Study: U.S. Environmental Protection Agency Region 8 Headquarters .............. 3
1.3 Review of Current Leasing Practices and Cost Structures ............................................... 3
2.0 Methods................................................................................................................................ 5
2.1 Selection Criteria for Spaces Included in This Study ...................................................... 5
2.2 Final Selections ................................................................................................................ 5
2.3 Metering Plans.................................................................................................................. 6
2.3.1 U.S. Department of Defense Office Building ............................................................... 6
2.3.2 U.S. General Services Administration-Occupied/ Hines-Managed Office Building .... 8
2.4 Data Validation ................................................................................................................ 9
3.0 Findings.............................................................................................................................. 10
4.0 Conclusions ........................................................................................................................ 12
References ..................................................................................................................................... 13
1
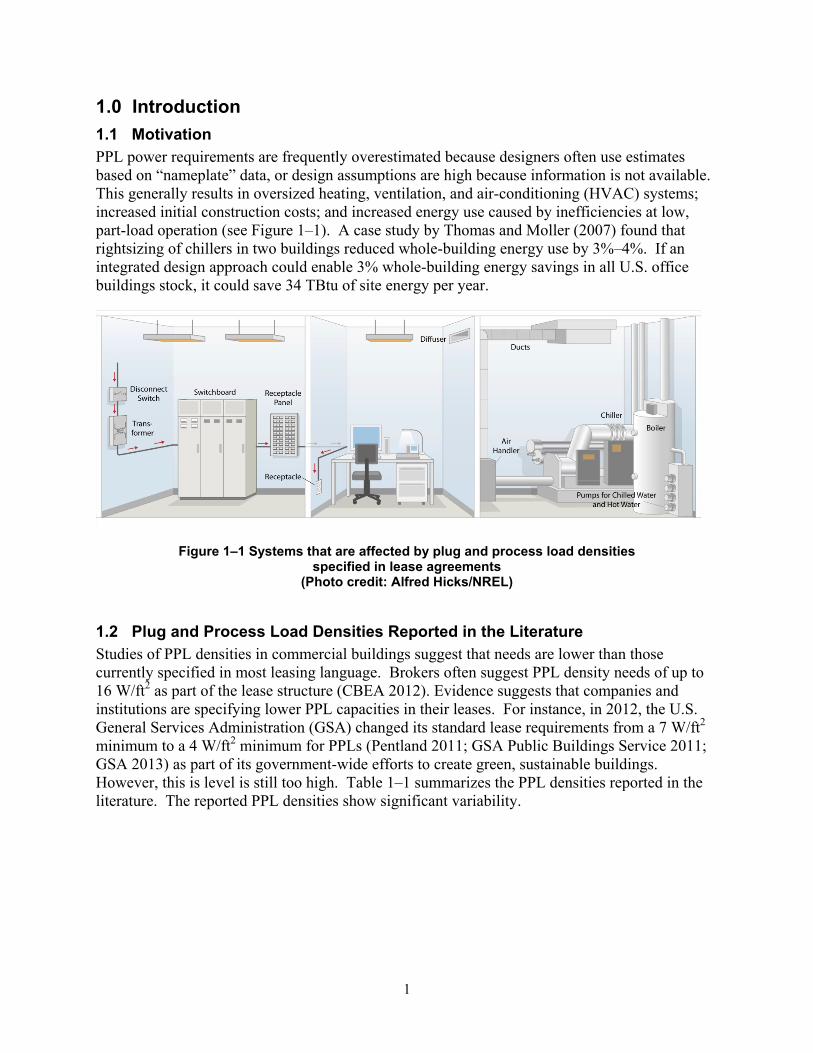
1.0 Introduction 1.1 Motivation PPL power requirements are frequently overestimated because designers often use estimates based on “nameplate” data, or design assumptions are high because information is not available. This generally results in oversized heating, ventilation, and air-conditioning (HVAC) systems; increased initial construction costs; and increased energy use caused by inefficiencies at low, part-load operation (see Figure 1–1). A case study by Thomas and Moller (2007) found that rightsizing of chillers in two buildings reduced whole-building energy use by 3%–4%. If an integrated design approach could enable 3% whole-building energy savings in all U.S. office buildings stock, it could save 34 TBtu of site energy per year.
Figure 1–1 Systems that are affected by plug and process load densities specified in lease agreements
(Photo credit: Alfred Hicks/NREL)
1.2 Plug and Process Load Densities Reported in the Literature Studies of PPL densities in commercial buildings suggest that needs are lower than those currently specified in most leasing language. Brokers often suggest PPL density needs of up to 16 W/ft2 as part of the lease structure (CBEA 2012). Evidence suggests that companies and institutions are specifying lower PPL capacities in their leases. For instance, in 2012, the U.S. General Services Administration (GSA) changed its standard lease requirements from a 7 W/ft2 minimum to a 4 W/ft2 minimum for PPLs (Pentland 2011; GSA Public Buildings Service 2011; GSA 2013) as part of its government-wide efforts to create green, sustainable buildings. However, this is level is still too high. Table 1–1 summarizes the PPL densities reported in the literature. The reported PPL densities show significant variability.

2
Table 1-1 PPL Power Densities Reported in the Literature
A plug load design factors study (Wilkins et al. 2011) indicates that, for office buildings, plug load peaks could realistically be lower than the traditional 1 W/ft2 presented by ASHRAE (2009), and up to 2 W/ft2 in the most extreme cases if very dense office equipment use and no diversity are assumed. A downward trend in plug load sizing has steadily evolved since the late 1980s, when loads were assessed from nameplate data and HVAC systems were sized for typical plug load densities of 3–5 W/ft2. At five GSA office buildings, Wilkins and McGaffin (1994) included individual loads and panel measurements and provided evidence of the discrepancy between density estimates from nameplate data and actual use. The analysis of PPL densities mentioned by Srinivasan et al. (2011) suggests that even 1 W/ft2 is a high estimate. Because of advances in energy efficiency and requirements in electronic office equipment, realistic peak PPL densities can be 0.25 W/ft2 (Wilkins and Hosni 2011), or lower. Over time, however, a building tenant’s level of commitment to energy efficiency can vary, so more conservative PPL load sizing estimates are often advised (ASHRAE 2009).
Uncertainties in PPL density assessment stem from guidelines in commercial building models and simulations, and from limited availability of benchmarks and case studies that confirm simulations. Srinivasan et al. (2011) stress the importance of benchmarking as an essential tool to inform and avoid arbitrary or incorrect inputs used in building energy analysis. The study compares results from PPL densities with four established assessment approaches: The National Renewable Energy Laboratory (NREL), COMNET, ASHRAE 90.1-1989, and California Title 24 for classrooms with and without computers. Results show that all four approaches over- or underestimate PPL densities over actual measured values. In particular, PPL densities of 1.06 W/ft2 and 0.33 W/ft2 were needed for classrooms with and without computers, respectively.
1.2.1 Case Study: Empire State Building A 2011 case study on sustainability and energy efficiency retrofit for the Empire State Building in New York City (Empire State Building LLC 2013), and in particular for one of its tenants, Skanska (NRDC 2011), highlights lower PPL densities than current leasing energy allowance practices. Skanska U.S.A. relocated its New York headquarters to the 32nd floor of the Empire State Building, which it designed and retrofitted to Leadership in Energy and Environmental Design (LEED) for Commercial Interiors Platinum. The investments in energy efficiency were based on the 15-year lease period, and are expected to save around $300,000 over that time. One outcome of the case study relates to tenant incentives. Lease terms can influence tenants to make energy-efficient choices. Conventional leases in New York City call for electrical capacity of 7.5 W/ft2, but Skanska’s project team calculated that the office would need 2 W/ft2. As the lease was negotiated, Skanska was cautious about adjusting its terms to such a low capacity, seeing no benefit (and potential risks) in doing so. Skanska’s landlord helped address these concerns by
Reference Building Type PPL Power Density (W/ft2) Wilkins and Hosni (2011) Office 0.25 to 2.0 (minimum capacity) ASHRAE (2009) Office 1 (minimum capacity) Srinivasan et al. (2011) K-12 education 0.33 to 1.06 (average density) Metzger et al. (2011) Office 0.9 (average density—cubicle only) NRDC (2011) Office 7.5 (requested minimum capacity) (GSA (2011); Haun (2013); GSA (2013) Office 4 (requested minimum capacity)

3
deploying a new “use it or lose it” clause. Tenants are not prevented from using the full electrical capacity in their leases, but if they do not consume the electricity after a period of time, they must either pay to keep it in reserve or lose the right to excess Watts per square foot.
1.2.2 Case Study: U.S. Environmental Protection Agency Region 8 Headquarters A plug load behavioral change demonstration project (Metzger et al. 2011) for the U.S. Environmental Protection Agency’s Region 8 Headquarters (which are sited in a LEED Gold-certified building in Denver, Colorado) included a benchmark study of PPL densities. Fully occupied in January 2007, the 420,000-ft2, nine-story building houses approximately 775 employees. The building participated in a research study quantifying the effects of various mechanical and behavioral change approaches on PPL energy reduction. An inventory of plug load equipment for all participants was taken at the beginning and end of the study. A walk-through of the pods was conducted in January and July of 2011, preceding and following the experimental phase. Equipment wattages were estimated, because interaction with the occupants was restricted, and diversity factors were applied based on ASHRAE recommendations (ASHRAE 2005). Diversity factors take into account that all pieces of equipment that are plugged into the outlets are not always in use at the same time, and provide a more accurate representation of actual operating loads. Average cubicle sizes were 80 ft2 with an average total connected equipment load of 145 W without diversity and 71 W with diversity. Average cubicle equipment power densities were 0.9 W/ft2 with diversity factors.
The scopes of these studies were limited. Early studies were based on equipment nameplate data only. More recent studies have either: (1) focused on an isolated building (limiting the broad applicability of the data); or (2) employed meters at the cubicle level only (missing many PPLs distributed throughout the building). This report aims to fill in the gaps that previous studies missed and thereby improve leasing practices.
1.3 Review of Current Leasing Practices and Cost Structures During the 2012 Commercial Building Energy Alliances (now called the Better Buildings Alliances) Efficiency Forum industry members from the commercial real estate sector stated: “We are putting far more capacity in buildings and creating a lot less efficient systems than we could because brokers are telling tenants they need 12, 14, 16 watts per square foot. That becomes part of the lease structure…” (CBEA 2012). To further corroborate this statement and highlight this practice by brokers, this report provides evidence that shows W/ft2 requests for plug and process loads.
Clayton Ulrich (senior vice president of Engineering Services at Hines) noted that Hines’ HVAC designers are fairly comfortable with their current assumptions of 2.5 W/ft2 for plug loads and 1 W/ft2 for lighting for sizing cooling systems. The combination is used as part of the basis for sizing cooling systems. Ulrich (2013) added that the sizing of a building’s electrical infrastructure varies from market to market; tenants in different regions expect different Watts per square foot for plug loads from the distribution transformers; 8 W/ft2 is typically the default if Hines does not know the market. Furthermore, Tony Malkin and Duane Desiderio (Skanska) mentioned a retrofit project in which they achieved less than 2 W/ft2 foot in their tenant buildout when the original request was for 7 W/ft2.

4
Industry collaborators were interviewed to document cost structures for sizing electrical infrastructure and HVAC systems. During an interview with Rick Haun (GHT Limited Consulting Engineers) (Haun 2013), he was asked “Is the sizing of electrical infrastructure and HVAC systems based on W/ft2 requested by tenants?” His response was that better equipment design maintains good part load efficiency and that there was a capital cost penalty for oversizing.

5
2.0 Methods In order to fill the gaps in knowledge about actual PPL power requirements in buildings, several buildings were monitored to determine the peak and average power demands. Although many sets of building data were available, only a few buildings had the requisite level of PPL disaggregation (through submetering) from other building loads. Section 2.1 outlines how spaces were selected for inclusion in this study.
2.1 Selection Criteria for Spaces Included in This Study The following criteria were used to make the final building selections:
• Separate metering of PPL energy. Strong candidates included those where “total” PPL energy was separately metered from other end uses (e.g., lighting and HVAC).
• Separation by space use type. Strong candidates had metering where any single measured value of total PPL energy was associated with just one major space type or business type (e.g., law enforcement space is metered separately from medical offices).
• Space use type applicability to others. Strong candidates included spaces that are of interest to a large audience. Different types of office space, for example, are a primary target because they apply to many users. In higher education, spaces of interest could include office, laboratory, and housing.
• Knowledge of conditions on site. Strong candidates were able to document the loads and space use types associated with their meters.
• Resource requirements. Stronger candidates were those with less need for on-site visits or those where on-site actions could be conducted by members.
2.2 Final Selections Table 2–1 lists the data sources that were selected. Large office, small office, higher education (office and classroom), municipal office, and single- and multitenant office spaces are all represented.

6
Table 2-1 Finalized Data Sources
* Data from a commercial office building with net-zero energy goals.
2.3 Metering Plans Two buildings in which new metering was deployed are included in the finalized data sources listed above.
2.3.1 U.S. Department of Defense Office Building This 18,818-ft2 facility has approximately 90 occupants and contains a typical DOD office environment that is representative of the larger building stock. The typical office building is composed of several space types such as cubicles, offices, kitchens, print rooms, and conference rooms. Table 2–2 describes the total number of space types throughout the building.
Table 2–2 Total Space Types Present in U.S. Navy Office Building Space Type Total
Libraries 1 Cubicles 57 Offices 30 Kitchens 3 Open Areas (Hallways) 12 Print Rooms 1 Conference Rooms 2 Mail Rooms 1 Reception Areas 1
Data Source
Number of
Buildings
Existing or New
Metering Building Types Represented Level of Data Being
Monitored
NREL 2 Existing Office – Single Government Tenant* Office – Single Government Tenant w/ Data Center*
Whole panel
U.S. Department of Defense (DOD)
1 New Office – Single Government Tenant Branch circuit Receptacle
Stanford University 7 Existing Higher Education – Classrooms, Meeting
Areas, and Faculty Offices Whole panel
SmarteBuilding 10 Existing
Office – Multi-Tenant w/ Data Center Office – Multitenant Office – Municipal Office – Single Tenant w/ Warehouse Office – Single Corporate Tenant w/ Data Center Office – Single Corporate Tenant w/ Kitchen Office – Single Corporate Tenant w/ Laboratories
Branch circuit
GSA/Hines 1 New Office - Single Government Tenant Branch circuit
7
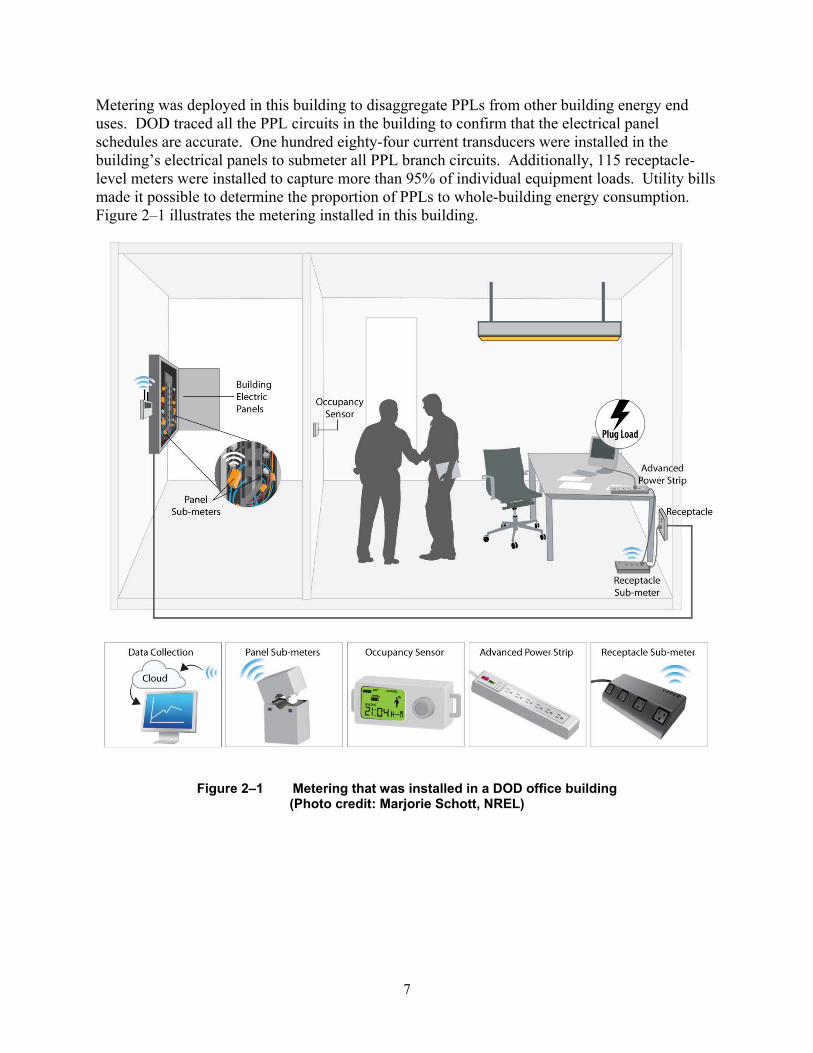
Metering was deployed in this building to disaggregate PPLs from other building energy end uses. DOD traced all the PPL circuits in the building to confirm that the electrical panel schedules are accurate. One hundred eighty-four current transducers were installed in the building’s electrical panels to submeter all PPL branch circuits. Additionally, 115 receptacle-level meters were installed to capture more than 95% of individual equipment loads. Utility bills made it possible to determine the proportion of PPLs to whole-building energy consumption. Figure 2–1 illustrates the metering installed in this building.
Figure 2–1 Metering that was installed in a DOD office building (Photo credit: Marjorie Schott, NREL)

8
2.3.2 U.S. General Services Administration-Occupied/ Hines-Managed Office Building
This 18,755-ft2 facility has approximately 60 occupants and contains a typical GSA office environment that is representative of the larger building stock. This typical office building is composed of several space types such as cubicles, offices, kitchens, print rooms, and hearing rooms. Table 2–3 describes the total number of space types throughout the building.
Table 2–3 Total Space Types Present in U.S. GSA Office Building Space Type Total
Cubicles 34 Offices 29 Kitchens 1 Open Areas (Hallways) 5 Print Rooms 1 Hearing Rooms 4
Metering was deployed in this building to disaggregate PPLs from other building energy end uses. Nine current transducers were installed in the building’s electrical panels to submeter all PPL branch circuits (see Figure 2–2).
Figure 2–2 Metering that was installed in a GSA-occupied office building (Photo credit: Marjorie Schott, NREL)
9
2.4 Data Validation The datasets collected were analyzed using the data validation approach developed by Sheppy et al. (2013). The key elements of this approach are summarized below:
• If less than one hour of data were missing, simple, linear interpolation was used to fill in data.
• If more than one hour of data were missing, data from a typical hour during that same time of day or day of week were used to fill in the gap.
• Data that were out of bounds (including negative values) were replaced with valid data.
• Extreme meter spikes were flagged based on whether they were three standard deviations (or more) above or below the average value for that meter. Simple, linear interpolation was used to fill extreme meter spikes.
After the data were validated, meters were aggregated resulting in key building performance parameters, such as PPL energy use intensity (W/ft2).
10
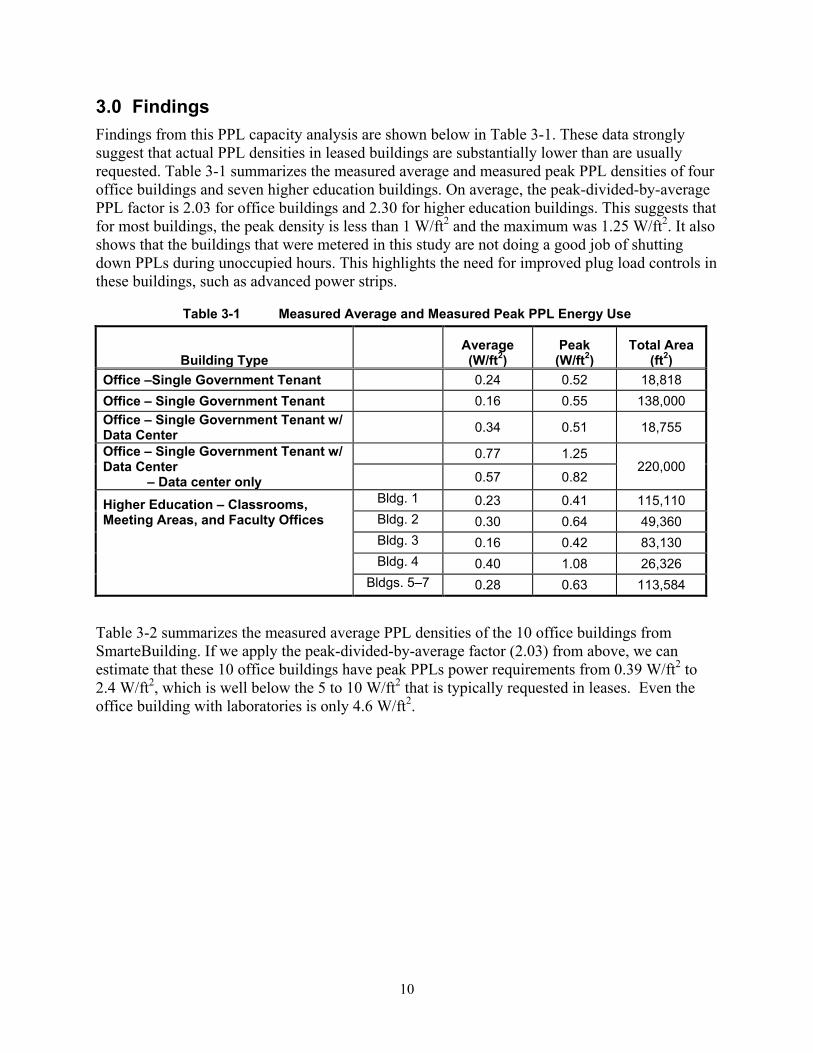
3.0 Findings Findings from this PPL capacity analysis are shown below in Table 3-1. These data strongly suggest that actual PPL densities in leased buildings are substantially lower than are usually requested. Table 3-1 summarizes the measured average and measured peak PPL densities of four office buildings and seven higher education buildings. On average, the peak-divided-by-average PPL factor is 2.03 for office buildings and 2.30 for higher education buildings. This suggests that for most buildings, the peak density is less than 1 W/ft2 and the maximum was 1.25 W/ft2. It also shows that the buildings that were metered in this study are not doing a good job of shutting down PPLs during unoccupied hours. This highlights the need for improved plug load controls in these buildings, such as advanced power strips.
Table 3-1 Measured Average and Measured Peak PPL Energy Use
Building Type Average (W/ft2)
Peak (W/ft2)
Total Area (ft2)
Office –Single Government Tenant 0.24 0.52 18,818 Office – Single Government Tenant 0.16 0.55 138,000 Office – Single Government Tenant w/ Data Center
0.34 0.51 18,755
Office – Single Government Tenant w/ Data Center – Data center only
0.77 1.25 220,000 0.57 0.82
Higher Education – Classrooms, Meeting Areas, and Faculty Offices
Bldg. 1 0.23 0.41 115,110 Bldg. 2 0.30 0.64 49,360 Bldg. 3 0.16 0.42 83,130 Bldg. 4 0.40 1.08 26,326
Bldgs. 5–7 0.28 0.63 113,584
Table 3-2 summarizes the measured average PPL densities of the 10 office buildings from SmarteBuilding. If we apply the peak-divided-by-average factor (2.03) from above, we can estimate that these 10 office buildings have peak PPLs power requirements from 0.39 W/ft2 to 2.4 W/ft2, which is well below the 5 to 10 W/ft2 that is typically requested in leases. Even the office building with laboratories is only 4.6 W/ft2.

11
Table 3-2 Measured Average Annual PPL Energy Use Intensity
Building Type Average (W/ft2)
Total Area (ft2)
Office – Multitenant w/ Data Center 1.17 50,725 Office – Multitenant w/ Data Center 0.19 365,000 Office – Multitenant w/ Data Center 0.37 191,799 Office – Multitenant 0.49 173,302 Office – Municipal 0.40 172,000 Office – Single Tenant w/ Warehouse 0.19 94,621 Office – Single Corporate Tenant w/ Data Center 0.58 97,500 Office – Single Corporate Tenant w/ Data Center 0.36 195,721 Office – Single Corporate Tenant w/ Kitchen 0.64 91,980 Office – Single Corporate Tenant w/ Laboratories 2.27 222,616

12
4.0 Conclusions Through our measurement and analysis of actual PPL densities over a range of commercial building types, we have documented significantly lower (by a factor of 5 to 10) peak PPL densities than what is typically requested, negotiated, or required in leases. On average, the peak PPL energy use intensities for offices (without laboratories or data centers) is 0.50 W/ft2, and 0.64 W/ft2 for higher education buildings; the peak PPL energy use intensity for offices with data centers is 0.88 W/ft2. On average, the average PPL energy use intensity for offices (without laboratories or data centers) is around 0.28 W/ft2, and 0.27 W/ft2 for higher education buildings. Offices with data centers or laboratories do exhibit higher average PPL energy use intensities.
With this evidence in hand, building owners, leasing brokers, and energy managers can work toward setting realistic PPL power capacities that are commensurate with actual use. This should lead to the right-sizing of HVAC and electrical systems. Case studies of two buildings have shown that right-sizing HVAC system components led to an average 14% reduction in upfront capital costs and a 3%–4% reduction in energy costs.
During construction or in deep retrofits, it is advisable to design flexibility into HVAC and electrical systems, allowing for unknown future tenants. For example, rather than oversizing the entire system, HVAC distribution pipework and main ductwork can be generously sized to provide an engineer with options for future expansion.

13
References ASHRAE. 2005. 2005 ASHRAE Handbook-Fundamentals, Chapter 18.
ASHRAE. (2009). 2009 ASHRAE Handbook-Fundamentals, Chapter 18.
CBEA (Commercial Buildings Energy Alliance). (2012). CBEA Efficiency Forum Report. Accessed September 20, 2013: http://www1.eere.energy.gov/buildings/alliances/pdfs/cbea_efficiency_forum_report.pdf
Commercial Buildings Energy Consumption Survey. (2003). Table A2: Energy consumption by sector and source. Accessed September 20, 2013: http://www.eia.gov/forecasts/aeo/pdf/tbla2.pdf.
Empire State Building LLC. (2013). Sustainability and Energy Efficiency at the Empire State Building. Accessed September 20, 2013: www.esbnyc.com/sustainability_energy_efficiency.asp#4.
GSA. Standard Lease. GSA Form L201C. Section 3.35: Electrical. Accessed September 10, 2013: www.gsa.gov/graphics/pbs/Standard_Lease_L201C_6-1-12_final_508c.pdf.
GSA Public Buildings Service. (2011). Memorandum for Regional Commissioners, PBS Regional Realty Services Officers. Subject: Update of Sustainability Lease Provisions and Revised Toilet Room Fixture Schedule. Accessed September 10, 2013: www.gsa.gov/graphics/pbs/LAC-2011-13_Sustainability_Update_final_9-30-11_508c.pdf.
Haun, R. (2013). Telephone Interview. GHT Limited Consulting Engineers. Interview date: January 9, 2013.
Metzger, I.; Kandt, A.; VanGeet, O. (2011). Plug Load Behavioral Change Demonstration Project. NREL/TP-7A40-52248. Accessed December 11, 2012: www.nrel.gov/docs/fy11osti/52248.pdf.
NRDC. (2011). Integrated Building and Tenant Space Case Study: Skanska and the Empire State Building. Accessed December 11, 2012: http://www.nrdc.org/business/casestudies/files/skanskacasestudy.pdf.
Pentland, W. (2011). “GSA Goes Deep Green With Next-Gen Green Leasing Standards.” Forbes Magazine. Accessed September 10, 2013: www.forbes.com/sites/williampentland/ 2011/11/07/gsa-goes-deep-green-with-next-gen-green-leasing-standards/.
Sheppy, M.; Beach, A.; Pless, S. (2013). Metering Best Practices Applied in the National Renewable Energy Laboratory’s Research Support Facility: A Primer to the 2011 Measured and Modeled Energy Consumption Datasets. Golden, CO: National Renewable Energy Laboratory. NREL/TP-5500-57785.
Srinivasan, R.S.; Lakshmanan, J.; Srivastav, D.; Santosa, E. (2011). “Benchmarking Plug-Load Densities for K-12 Schools.” Proceedings of Building Simulation 2011, 12th Conference of International Building Performance Simulation Association, November 2011, pp. 2746–2752.

14
Thomas, P.C.; Moller, S. (2007). HVAC System Size: Getting It Right—Right-Sizing HVAC Systems in Commercial Systems, 2007, Cooperative Research Centre for Construction Innovation, p. 11.
Ulrich, C. (2013). Telephone Interview. Hines. Interview date: Januaray 9, 2013.
Wilkins, C.K.; Hosni, M.H. (2011). “Plug Loads Design Factors.” ASHRAE Journal May, pp. 30–34.
Wilkins, C.K.; McGaffin, N. (1994). “Measuring Computer Equipment Loads in Office Buildings. ASHRAE Journal 36(8):21–24.
`
Learn more at betterbuildings.energy.gov
DOE/GO-102014-4277 • September 2014 Printed with a renewable-source ink on paper containing at least 50% wastepaper, including 10% post-consumer waste.